Progreso, TX Map & Demographics
Progreso Map
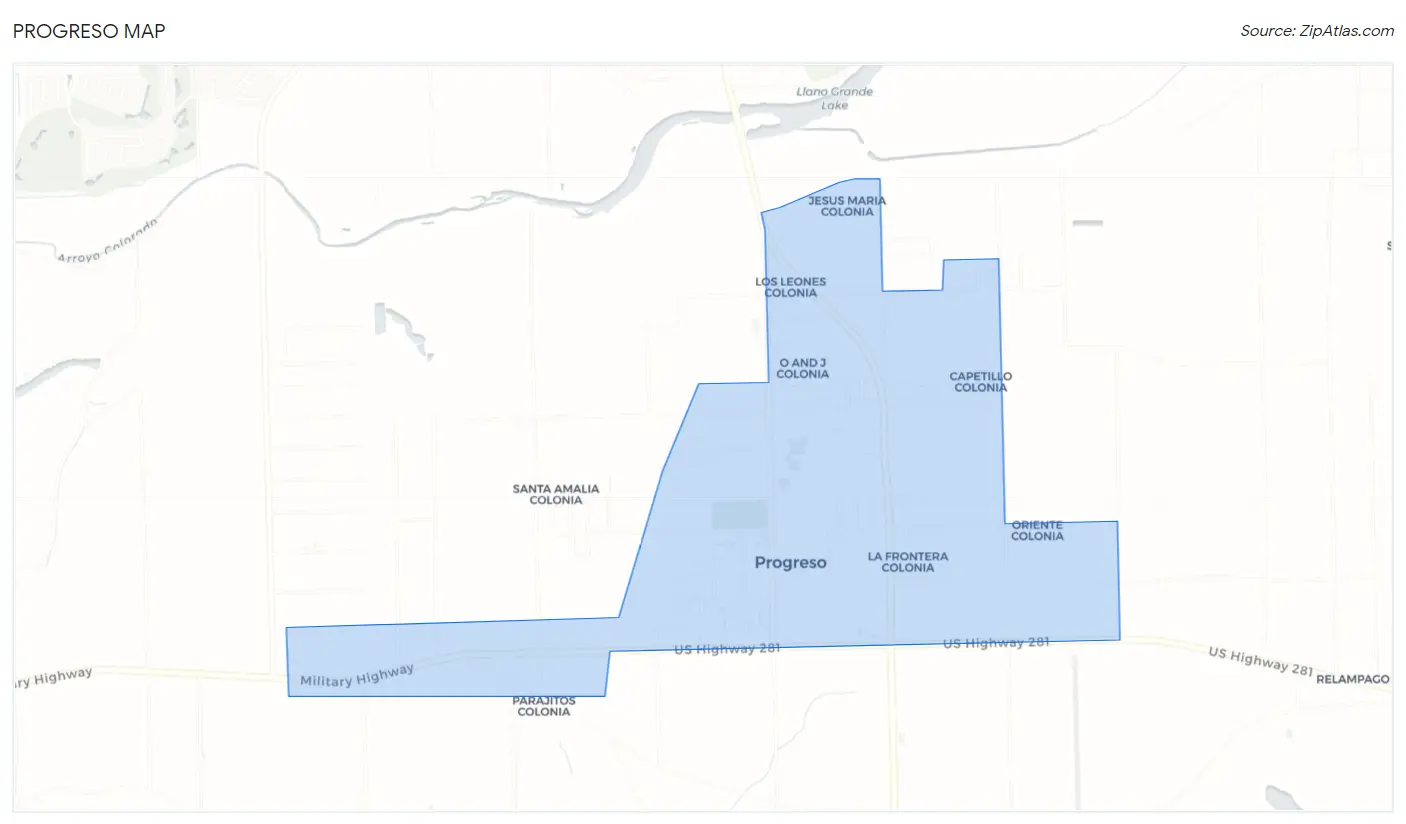
Progreso Overview
$12,156
PER CAPITA INCOME
$39,247
AVG FAMILY INCOME
$38,686
AVG HOUSEHOLD INCOME
50.9%
WAGE / INCOME GAP [ % ]
49.1¢/ $1
WAGE / INCOME GAP [ $ ]
0.38
INEQUALITY / GINI INDEX
4,914
TOTAL POPULATION
2,463
MALE POPULATION
2,451
FEMALE POPULATION
100.49
MALES / 100 FEMALES
99.51
FEMALES / 100 MALES
28.6
MEDIAN AGE
4.4
AVG FAMILY SIZE
4.4
AVG HOUSEHOLD SIZE
2,008
LABOR FORCE [ PEOPLE ]
62.5%
PERCENT IN LABOR FORCE
6.2%
UNEMPLOYMENT RATE
Progreso Zip Codes
Progreso Area Codes
Income in Progreso
Income Overview in Progreso
Per Capita Income in Progreso is $12,156, while median incomes of families and households are $39,247 and $38,686 respectively.
| Characteristic | Number | Measure |
| Per Capita Income | 4,914 | $12,156 |
| Median Family Income | 1,085 | $39,247 |
| Mean Family Income | 1,085 | $48,997 |
| Median Household Income | 1,120 | $38,686 |
| Mean Household Income | 1,120 | $47,466 |
| Income Deficit | 1,085 | $0 |
| Wage / Income Gap (%) | 4,914 | 50.88% |
| Wage / Income Gap ($) | 4,914 | 49.12¢ per $1 |
| Gini / Inequality Index | 4,914 | 0.38 |
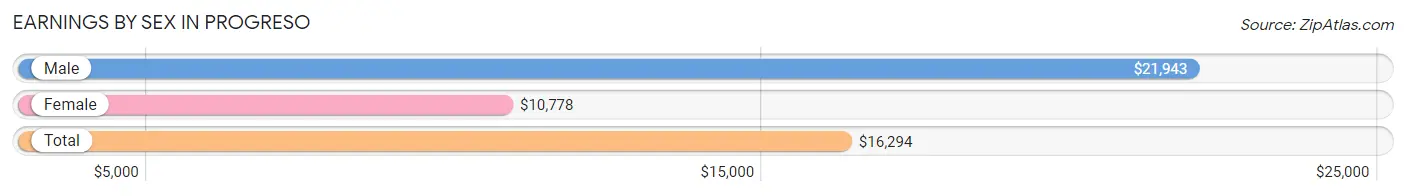
Earnings by Sex in Progreso
Average Earnings in Progreso are $16,294, $21,943 for men and $10,778 for women, a difference of 50.9%.
| Sex | Number | Average Earnings |
| Male | 1,102 (47.6%) | $21,943 |
| Female | 1,214 (52.4%) | $10,778 |
| Total | 2,316 (100.0%) | $16,294 |
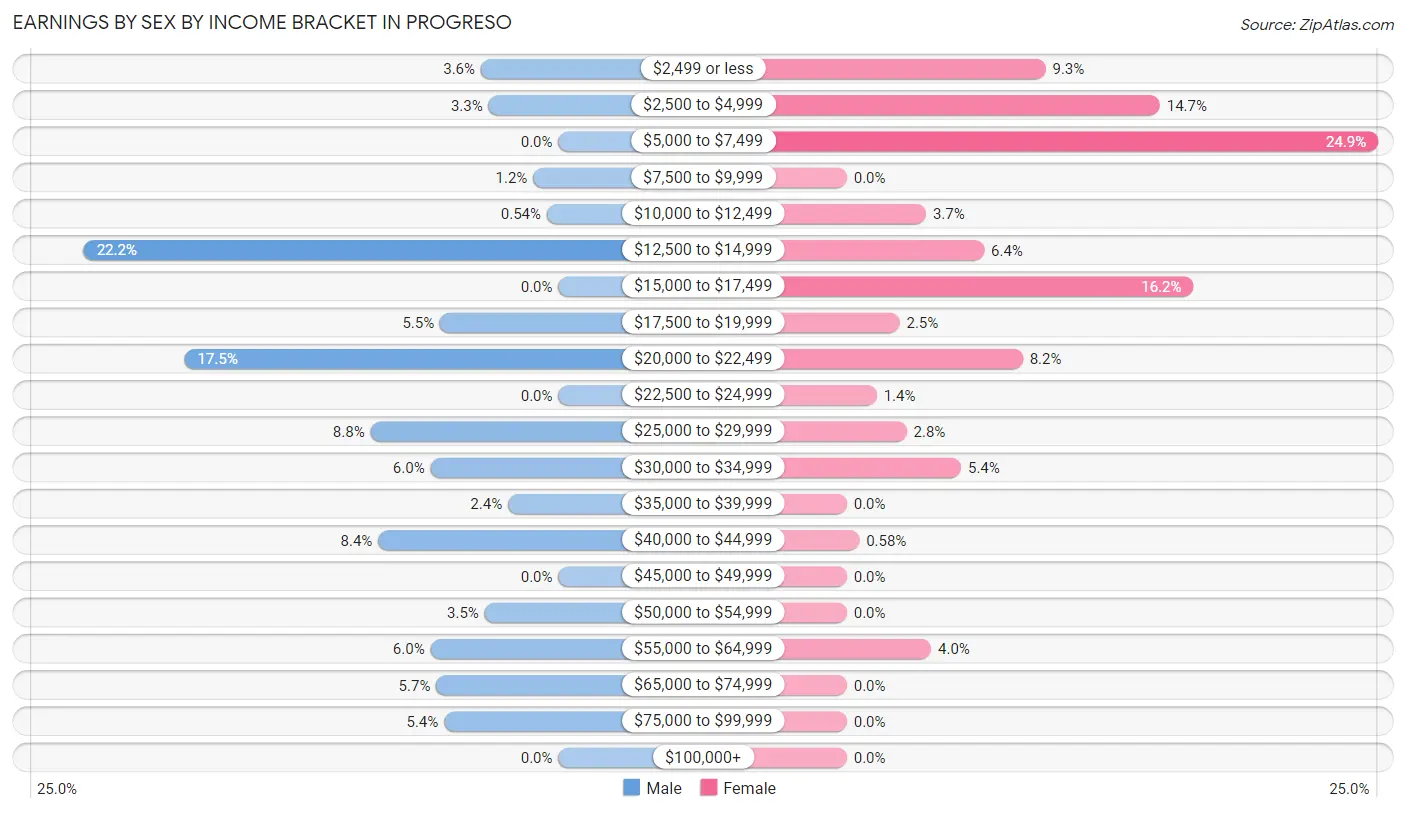
Earnings by Sex by Income Bracket in Progreso
The most common earnings brackets in Progreso are $12,500 to $14,999 for men (245 | 22.2%) and $5,000 to $7,499 for women (302 | 24.9%).
| Income | Male | Female |
| $2,499 or less | 40 (3.6%) | 113 (9.3%) |
| $2,500 to $4,999 | 36 (3.3%) | 178 (14.7%) |
| $5,000 to $7,499 | 0 (0.0%) | 302 (24.9%) |
| $7,500 to $9,999 | 13 (1.2%) | 0 (0.0%) |
| $10,000 to $12,499 | 6 (0.5%) | 45 (3.7%) |
| $12,500 to $14,999 | 245 (22.2%) | 78 (6.4%) |
| $15,000 to $17,499 | 0 (0.0%) | 197 (16.2%) |
| $17,500 to $19,999 | 61 (5.5%) | 30 (2.5%) |
| $20,000 to $22,499 | 193 (17.5%) | 100 (8.2%) |
| $22,500 to $24,999 | 0 (0.0%) | 17 (1.4%) |
| $25,000 to $29,999 | 97 (8.8%) | 34 (2.8%) |
| $30,000 to $34,999 | 66 (6.0%) | 65 (5.3%) |
| $35,000 to $39,999 | 26 (2.4%) | 0 (0.0%) |
| $40,000 to $44,999 | 93 (8.4%) | 7 (0.6%) |
| $45,000 to $49,999 | 0 (0.0%) | 0 (0.0%) |
| $50,000 to $54,999 | 38 (3.5%) | 0 (0.0%) |
| $55,000 to $64,999 | 66 (6.0%) | 48 (4.0%) |
| $65,000 to $74,999 | 63 (5.7%) | 0 (0.0%) |
| $75,000 to $99,999 | 59 (5.3%) | 0 (0.0%) |
| $100,000+ | 0 (0.0%) | 0 (0.0%) |
| Total | 1,102 (100.0%) | 1,214 (100.0%) |
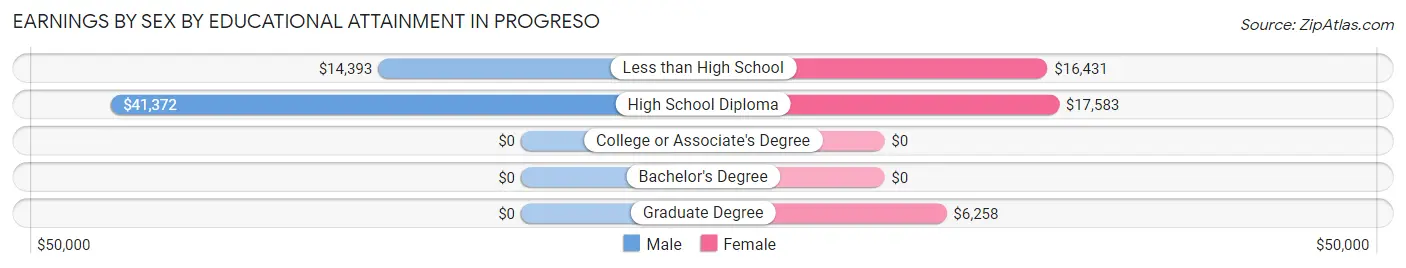
Earnings by Sex by Educational Attainment in Progreso
Average earnings in Progreso are $21,269 for men and $12,708 for women, a difference of 40.3%. Men with an educational attainment of high school diploma enjoy the highest average annual earnings of $41,372, while those with less than high school education earn the least with $14,393. Women with an educational attainment of high school diploma earn the most with the average annual earnings of $17,583, while those with graduate degree education have the smallest earnings of $6,258.
| Educational Attainment | Male Income | Female Income |
| Less than High School | $14,393 | $16,431 |
| High School Diploma | $41,372 | $17,583 |
| College or Associate's Degree | - | - |
| Bachelor's Degree | - | - |
| Graduate Degree | - | - |
| Total | $21,269 | $12,708 |
Family Income in Progreso
Family Income Brackets in Progreso
According to the Progreso family income data, there are 230 families falling into the $15,000 to $24,999 income range, which is the most common income bracket and makes up 21.2% of all families.
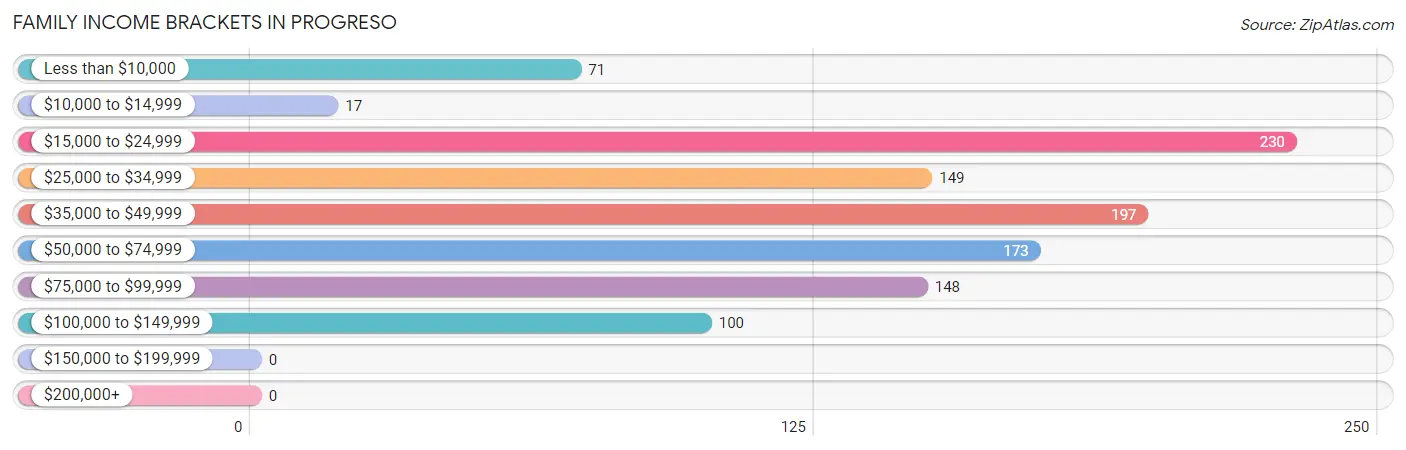
| Income Bracket | # Families | % Families |
| Less than $10,000 | 71 | 6.5% |
| $10,000 to $14,999 | 17 | 1.6% |
| $15,000 to $24,999 | 230 | 21.2% |
| $25,000 to $34,999 | 149 | 13.7% |
| $35,000 to $49,999 | 197 | 18.2% |
| $50,000 to $74,999 | 173 | 15.9% |
| $75,000 to $99,999 | 148 | 13.6% |
| $100,000 to $149,999 | 100 | 9.2% |
| $150,000 to $199,999 | 0 | 0.0% |
| $200,000+ | 0 | 0.0% |
Family Income by Famaliy Size in Progreso
2-person families (413 | 38.1%) account for the highest median family income in Progreso with $40,197 per family, while 2-person families (413 | 38.1%) have the highest median income of $20,098 per family member.
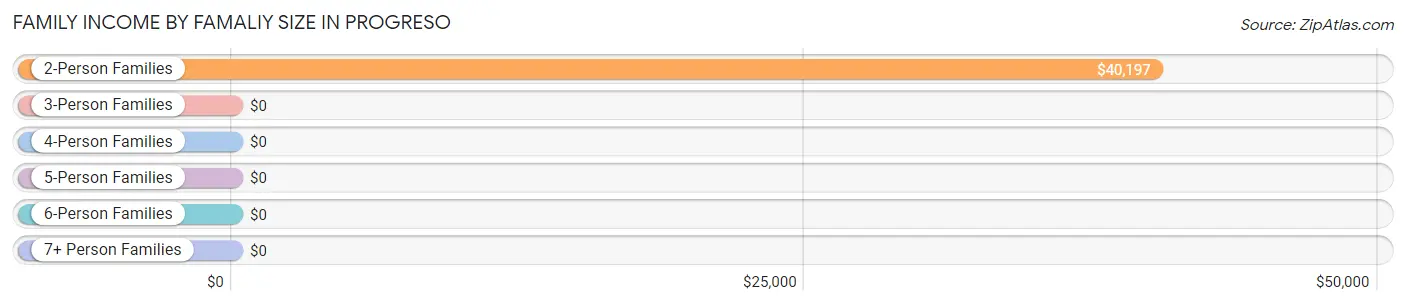
| Income Bracket | # Families | Median Income |
| 2-Person Families | 413 (38.1%) | $40,197 |
| 3-Person Families | 215 (19.8%) | $0 |
| 4-Person Families | 169 (15.6%) | $0 |
| 5-Person Families | 82 (7.6%) | $0 |
| 6-Person Families | 109 (10.1%) | $0 |
| 7+ Person Families | 97 (8.9%) | $0 |
| Total | 1,085 (100.0%) | $39,247 |
Family Income by Number of Earners in Progreso
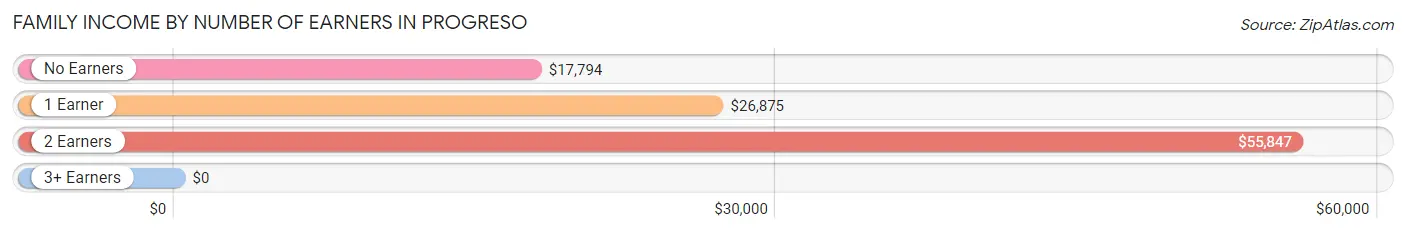
| Number of Earners | # Families | Median Income |
| No Earners | 74 (6.8%) | $17,794 |
| 1 Earner | 248 (22.9%) | $26,875 |
| 2 Earners | 619 (57.1%) | $55,847 |
| 3+ Earners | 144 (13.3%) | $0 |
| Total | 1,085 (100.0%) | $39,247 |
Household Income in Progreso
Household Income Brackets in Progreso
With 230 households falling in the category, the $15,000 to $24,999 income range is the most frequent in Progreso, accounting for 20.5% of all households.
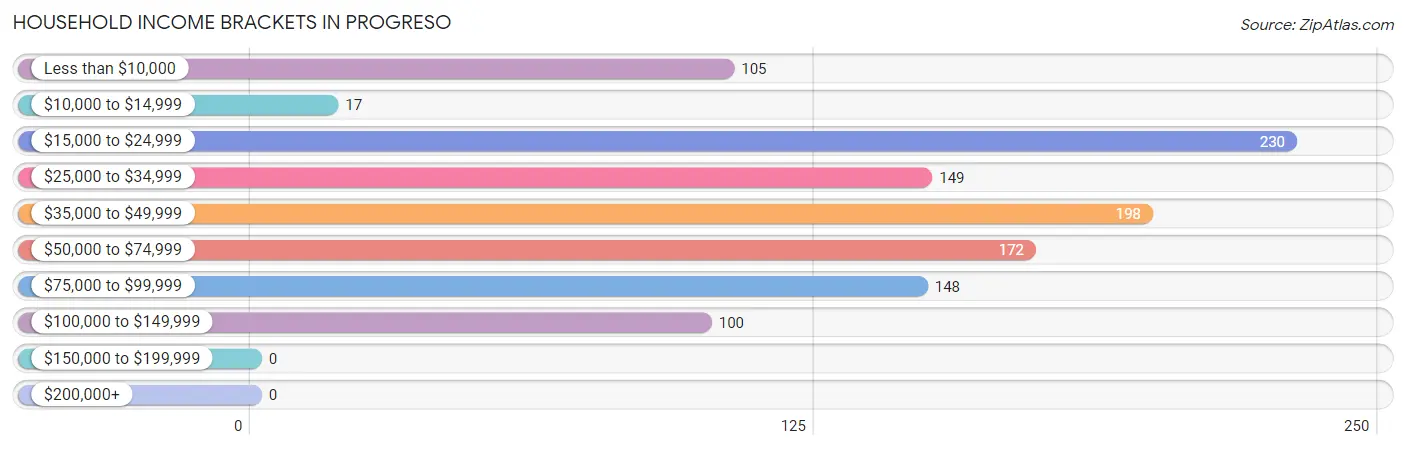
| Income Bracket | # Households | % Households |
| Less than $10,000 | 105 | 9.4% |
| $10,000 to $14,999 | 17 | 1.5% |
| $15,000 to $24,999 | 230 | 20.5% |
| $25,000 to $34,999 | 149 | 13.3% |
| $35,000 to $49,999 | 198 | 17.7% |
| $50,000 to $74,999 | 172 | 15.4% |
| $75,000 to $99,999 | 148 | 13.2% |
| $100,000 to $149,999 | 100 | 8.9% |
| $150,000 to $199,999 | 0 | 0.0% |
| $200,000+ | 0 | 0.0% |
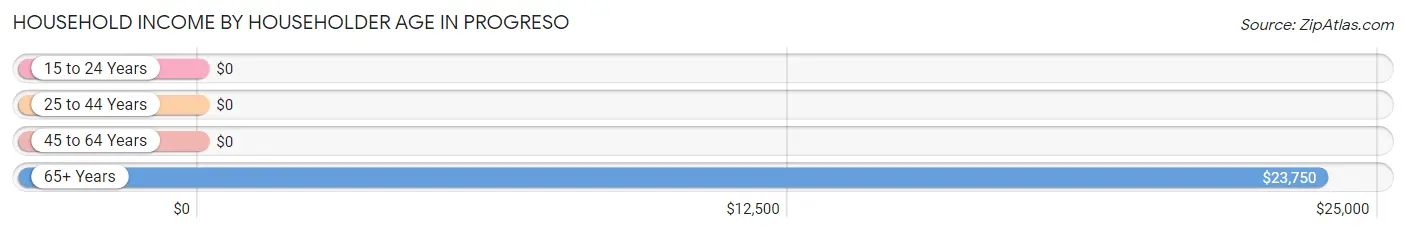
Household Income by Householder Age in Progreso
The median household income in Progreso is $38,686, with the highest median household income of $23,750 found in the 65+ years age bracket for the primary householder. A total of 218 households (19.5%) fall into this category. Meanwhile, the 15 to 24 years age bracket for the primary householder has the lowest median household income of $0, with 70 households (6.2%) in this group.
| Income Bracket | # Households | Median Income |
| 15 to 24 Years | 70 (6.2%) | $0 |
| 25 to 44 Years | 422 (37.7%) | $0 |
| 45 to 64 Years | 410 (36.6%) | $0 |
| 65+ Years | 218 (19.5%) | $23,750 |
| Total | 1,120 (100.0%) | $38,686 |
Poverty in Progreso
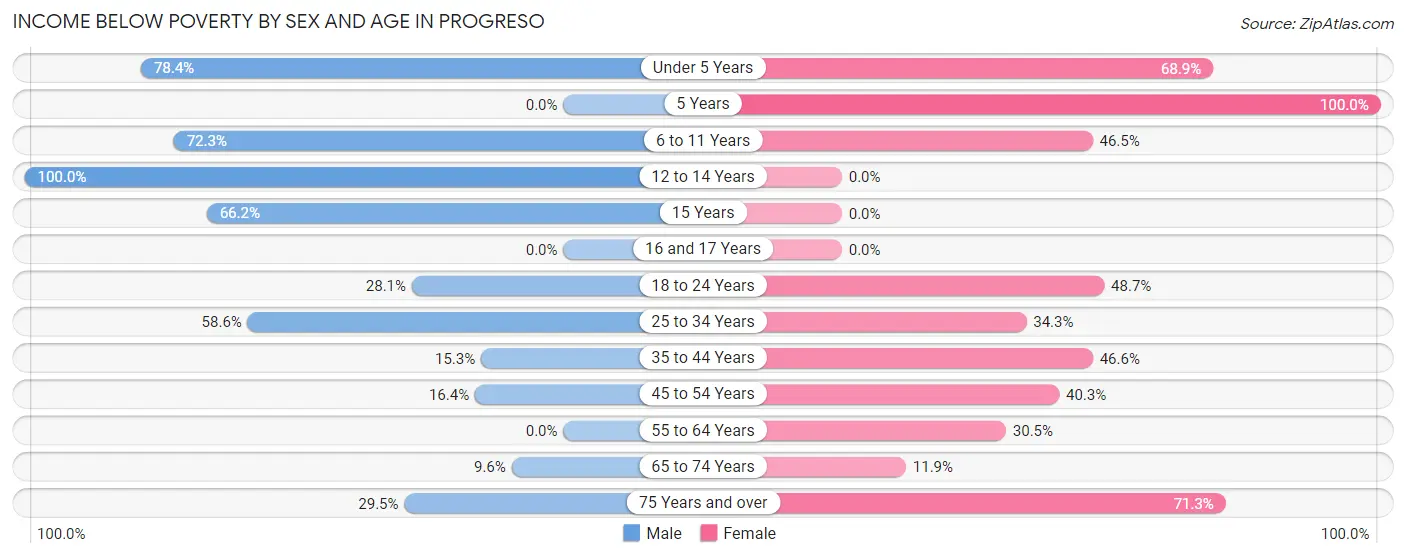
Income Below Poverty by Sex and Age in Progreso
With 38.2% poverty level for males and 38.4% for females among the residents of Progreso, 12 to 14 year old males and 5 year old females are the most vulnerable to poverty, with 83 males (100.0%) and 77 females (100.0%) in their respective age groups living below the poverty level.
| Age Bracket | Male | Female |
| Under 5 Years | 196 (78.4%) | 102 (68.9%) |
| 5 Years | 0 (0.0%) | 77 (100.0%) |
| 6 to 11 Years | 209 (72.3%) | 121 (46.5%) |
| 12 to 14 Years | 83 (100.0%) | 0 (0.0%) |
| 15 Years | 139 (66.2%) | 0 (0.0%) |
| 16 and 17 Years | 0 (0.0%) | 0 (0.0%) |
| 18 to 24 Years | 72 (28.1%) | 75 (48.7%) |
| 25 to 34 Years | 92 (58.6%) | 112 (34.3%) |
| 35 to 44 Years | 40 (15.3%) | 150 (46.6%) |
| 45 to 54 Years | 72 (16.4%) | 148 (40.3%) |
| 55 to 64 Years | 0 (0.0%) | 81 (30.4%) |
| 65 to 74 Years | 19 (9.6%) | 17 (11.9%) |
| 75 Years and over | 18 (29.5%) | 57 (71.3%) |
| Total | 940 (38.2%) | 940 (38.4%) |
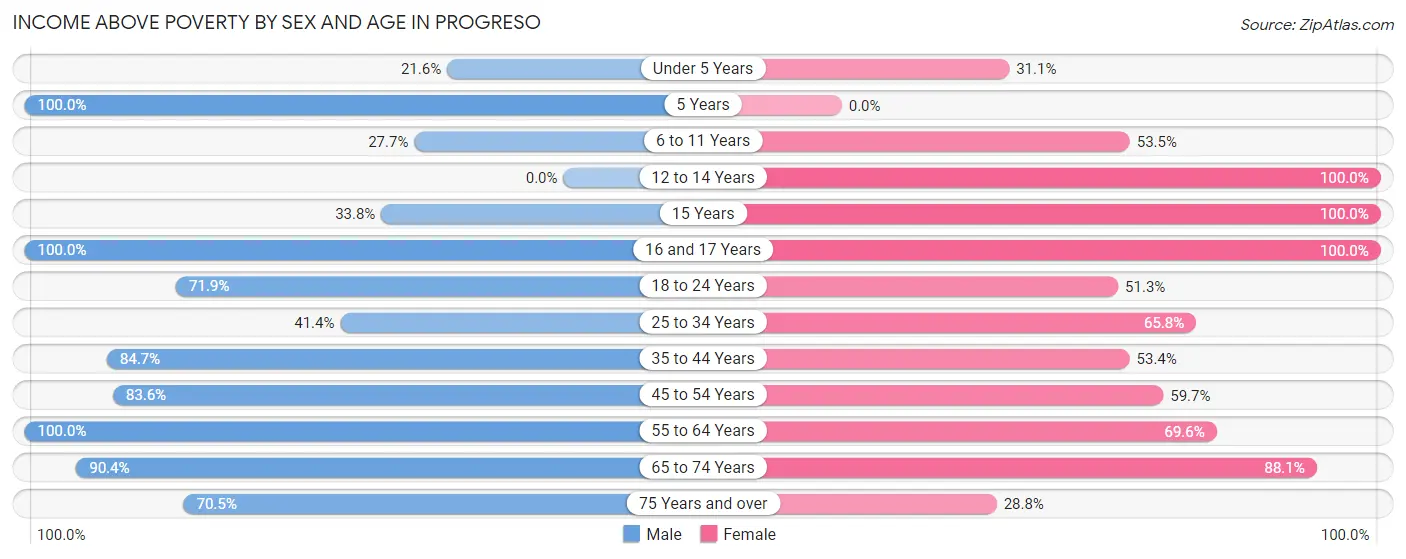
Income Above Poverty by Sex and Age in Progreso
According to the poverty statistics in Progreso, males aged 5 years and females aged 12 to 14 years are the age groups that are most secure financially, with 100.0% of males and 100.0% of females in these age groups living above the poverty line.
| Age Bracket | Male | Female |
| Under 5 Years | 54 (21.6%) | 46 (31.1%) |
| 5 Years | 171 (100.0%) | 0 (0.0%) |
| 6 to 11 Years | 80 (27.7%) | 139 (53.5%) |
| 12 to 14 Years | 0 (0.0%) | 139 (100.0%) |
| 15 Years | 71 (33.8%) | 74 (100.0%) |
| 16 and 17 Years | 26 (100.0%) | 94 (100.0%) |
| 18 to 24 Years | 184 (71.9%) | 79 (51.3%) |
| 25 to 34 Years | 65 (41.4%) | 215 (65.7%) |
| 35 to 44 Years | 222 (84.7%) | 172 (53.4%) |
| 45 to 54 Years | 367 (83.6%) | 219 (59.7%) |
| 55 to 64 Years | 61 (100.0%) | 185 (69.6%) |
| 65 to 74 Years | 179 (90.4%) | 126 (88.1%) |
| 75 Years and over | 43 (70.5%) | 23 (28.7%) |
| Total | 1,523 (61.8%) | 1,511 (61.7%) |
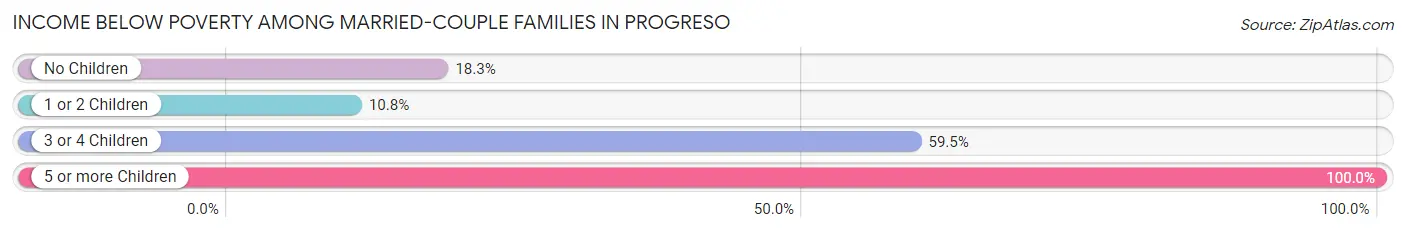
Income Below Poverty Among Married-Couple Families in Progreso
The poverty statistics for married-couple families in Progreso show that 31.1% or 219 of the total 705 families live below the poverty line. Families with 5 or more children have the highest poverty rate of 100.0%, comprising of 78 families. On the other hand, families with 1 or 2 children have the lowest poverty rate of 10.8%, which includes 34 families.
| Children | Above Poverty | Below Poverty |
| No Children | 156 (81.7%) | 35 (18.3%) |
| 1 or 2 Children | 281 (89.2%) | 34 (10.8%) |
| 3 or 4 Children | 49 (40.5%) | 72 (59.5%) |
| 5 or more Children | 0 (0.0%) | 78 (100.0%) |
| Total | 486 (68.9%) | 219 (31.1%) |
Income Below Poverty Among Single-Parent Households in Progreso
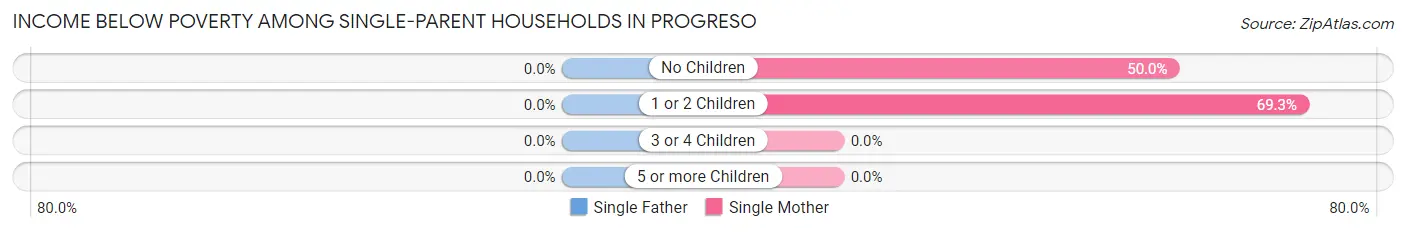
| Children | Single Father | Single Mother |
| No Children | 0 (0.0%) | 79 (50.0%) |
| 1 or 2 Children | 0 (0.0%) | 70 (69.3%) |
| 3 or 4 Children | 0 (0.0%) | 0 (0.0%) |
| 5 or more Children | 0 (0.0%) | 0 (0.0%) |
| Total | 0 (0.0%) | 149 (54.0%) |
Income Below Poverty Among Married-Couple vs Single-Parent Households in Progreso
The poverty data for Progreso shows that 219 of the married-couple family households (31.1%) and 149 of the single-parent households (39.2%) are living below the poverty level. Within the married-couple family households, those with 5 or more children have the highest poverty rate, with 78 households (100.0%) falling below the poverty line. Among the single-parent households, those with 1 or 2 children have the highest poverty rate, with 70 household (69.3%) living below poverty.
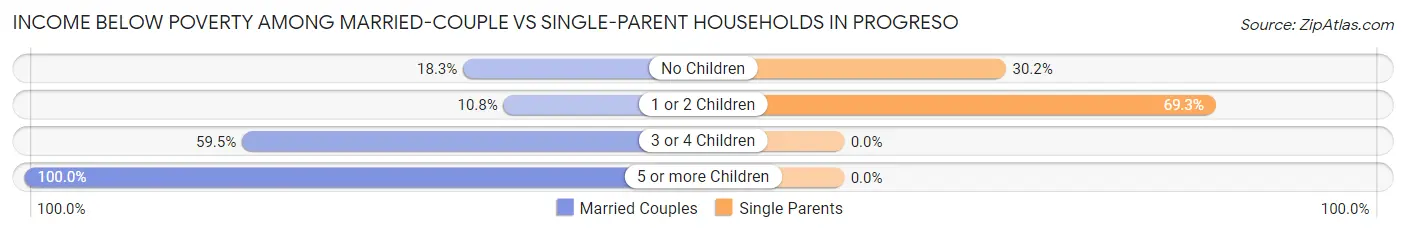
| Children | Married-Couple Families | Single-Parent Households |
| No Children | 35 (18.3%) | 79 (30.1%) |
| 1 or 2 Children | 34 (10.8%) | 70 (69.3%) |
| 3 or 4 Children | 72 (59.5%) | 0 (0.0%) |
| 5 or more Children | 78 (100.0%) | 0 (0.0%) |
| Total | 219 (31.1%) | 149 (39.2%) |
Race in Progreso
The most populous races in Progreso are Hispanic or Latino (4,911 | 99.9%), White / Caucasian (1,947 | 39.6%), and Two or more Races (1,779 | 36.2%).
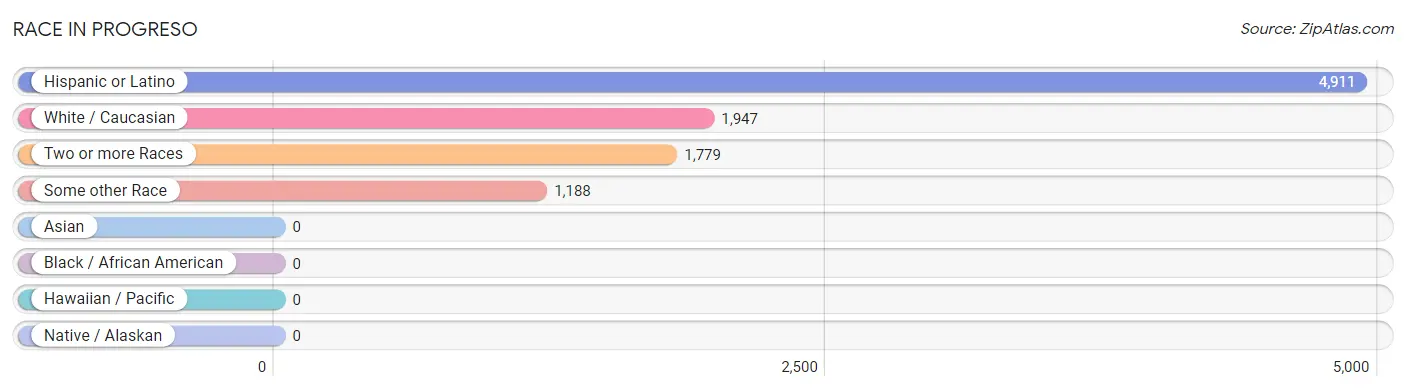
| Race | # Population | % Population |
| Asian | 0 | 0.0% |
| Black / African American | 0 | 0.0% |
| Hawaiian / Pacific | 0 | 0.0% |
| Hispanic or Latino | 4,911 | 99.9% |
| Native / Alaskan | 0 | 0.0% |
| White / Caucasian | 1,947 | 39.6% |
| Two or more Races | 1,779 | 36.2% |
| Some other Race | 1,188 | 24.2% |
| Total | 4,914 | 100.0% |
Ancestry in Progreso
The most populous ancestries reported in Progreso are Mexican (4,841 | 98.5%), American (28 | 0.6%), Ecuadorian (5 | 0.1%), South American (5 | 0.1%), and Irish (2 | 0.0%), together accounting for 99.3% of all Progreso residents.
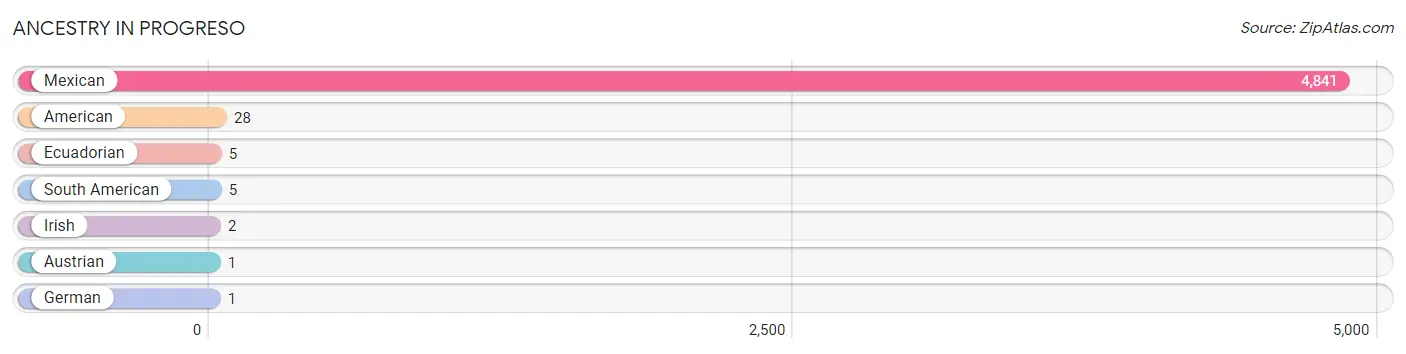
| Ancestry | # Population | % Population |
| American | 28 | 0.6% |
| Austrian | 1 | 0.0% |
| Ecuadorian | 5 | 0.1% |
| German | 1 | 0.0% |
| Irish | 2 | 0.0% |
| Mexican | 4,841 | 98.5% |
| South American | 5 | 0.1% | View All 7 Rows |
Immigrants in Progreso
The most numerous immigrant groups reported in Progreso came from Latin America (1,220 | 24.8%), Central America (1,215 | 24.7%), Mexico (1,215 | 24.7%), Ecuador (5 | 0.1%), and South America (5 | 0.1%), together accounting for 74.5% of all Progreso residents.
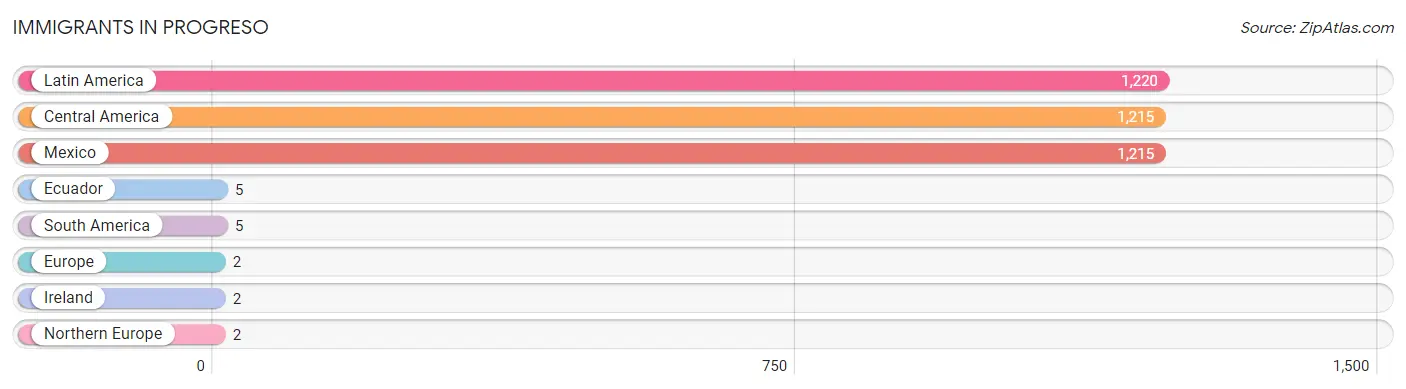
| Immigration Origin | # Population | % Population |
| Central America | 1,215 | 24.7% |
| Ecuador | 5 | 0.1% |
| Europe | 2 | 0.0% |
| Ireland | 2 | 0.0% |
| Latin America | 1,220 | 24.8% |
| Mexico | 1,215 | 24.7% |
| Northern Europe | 2 | 0.0% |
| South America | 5 | 0.1% | View All 8 Rows |
Sex and Age in Progreso
Sex and Age in Progreso
The most populous age groups in Progreso are 5 to 9 Years (421 | 17.1%) for men and 15 to 19 Years (320 | 13.1%) for women.
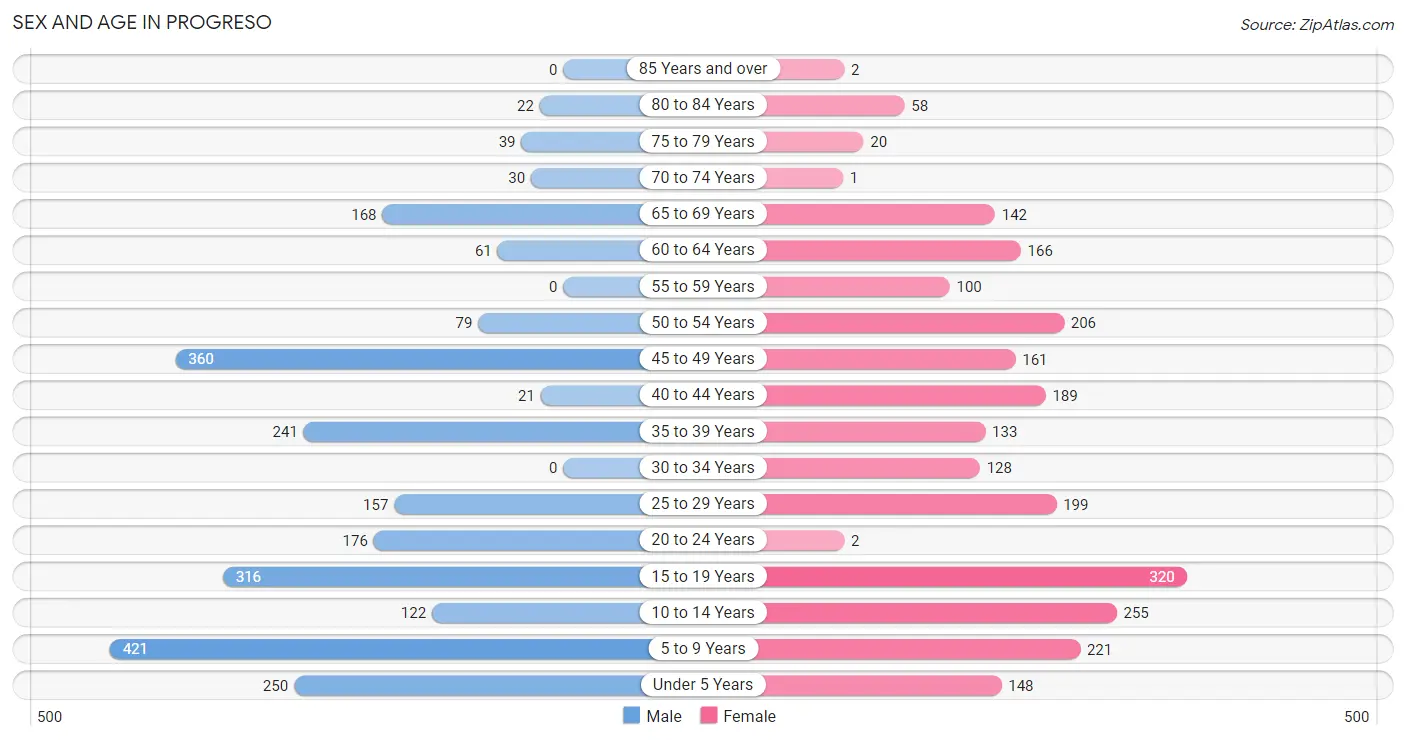
| Age Bracket | Male | Female |
| Under 5 Years | 250 (10.2%) | 148 (6.0%) |
| 5 to 9 Years | 421 (17.1%) | 221 (9.0%) |
| 10 to 14 Years | 122 (5.0%) | 255 (10.4%) |
| 15 to 19 Years | 316 (12.8%) | 320 (13.1%) |
| 20 to 24 Years | 176 (7.1%) | 2 (0.1%) |
| 25 to 29 Years | 157 (6.4%) | 199 (8.1%) |
| 30 to 34 Years | 0 (0.0%) | 128 (5.2%) |
| 35 to 39 Years | 241 (9.8%) | 133 (5.4%) |
| 40 to 44 Years | 21 (0.9%) | 189 (7.7%) |
| 45 to 49 Years | 360 (14.6%) | 161 (6.6%) |
| 50 to 54 Years | 79 (3.2%) | 206 (8.4%) |
| 55 to 59 Years | 0 (0.0%) | 100 (4.1%) |
| 60 to 64 Years | 61 (2.5%) | 166 (6.8%) |
| 65 to 69 Years | 168 (6.8%) | 142 (5.8%) |
| 70 to 74 Years | 30 (1.2%) | 1 (0.0%) |
| 75 to 79 Years | 39 (1.6%) | 20 (0.8%) |
| 80 to 84 Years | 22 (0.9%) | 58 (2.4%) |
| 85 Years and over | 0 (0.0%) | 2 (0.1%) |
| Total | 2,463 (100.0%) | 2,451 (100.0%) |
Families and Households in Progreso
Median Family Size in Progreso
The median family size in Progreso is 4.42 persons per family, with married-couple families (705 | 65.0%) accounting for the largest median family size of 5.32 persons per family. On the other hand, single male/father families (104 | 9.6%) represent the smallest median family size with 2.04 persons per family.
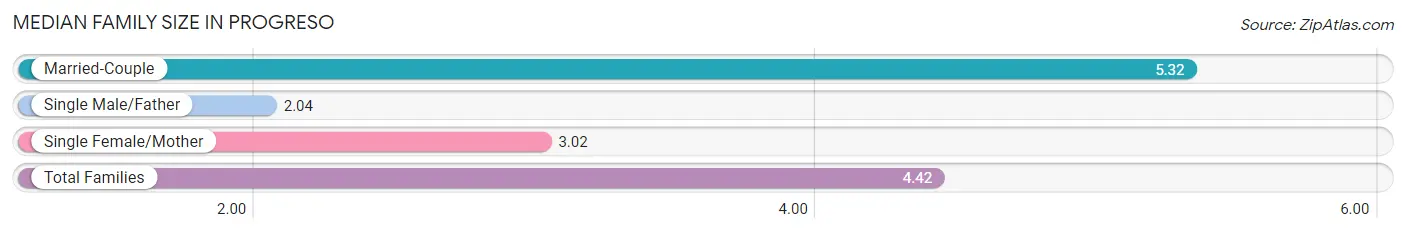
| Family Type | # Families | Family Size |
| Married-Couple | 705 (65.0%) | 5.32 |
| Single Male/Father | 104 (9.6%) | 2.04 |
| Single Female/Mother | 276 (25.4%) | 3.02 |
| Total Families | 1,085 (100.0%) | 4.42 |
Median Household Size in Progreso
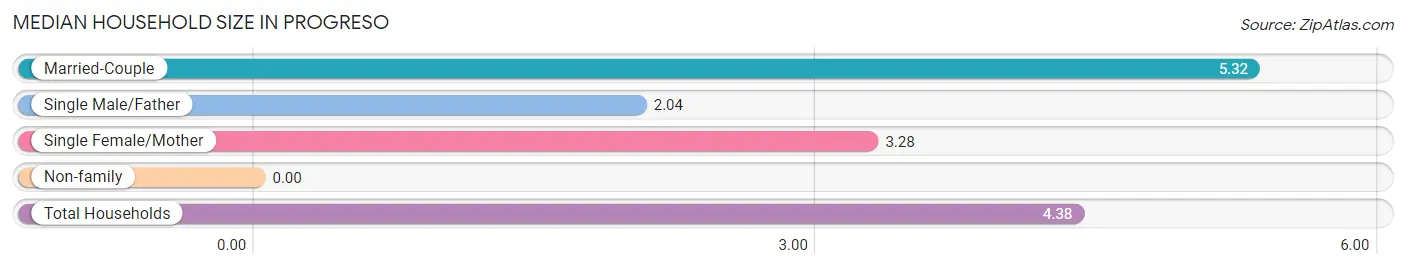
| Household Type | # Households | Household Size |
| Married-Couple | 705 (62.9%) | 5.32 |
| Single Male/Father | 104 (9.3%) | 2.04 |
| Single Female/Mother | 276 (24.6%) | 3.28 |
| Non-family | 35 (3.1%) | - |
| Total Households | 1,120 (100.0%) | 4.38 |
Household Size by Marriage Status in Progreso
Out of a total of 1,120 households in Progreso, 1,085 (96.9%) are family households, while 35 (3.1%) are nonfamily households. The most numerous type of family households are 2-person households, comprising 343, and the most common type of nonfamily households are 1-person households, comprising 35.
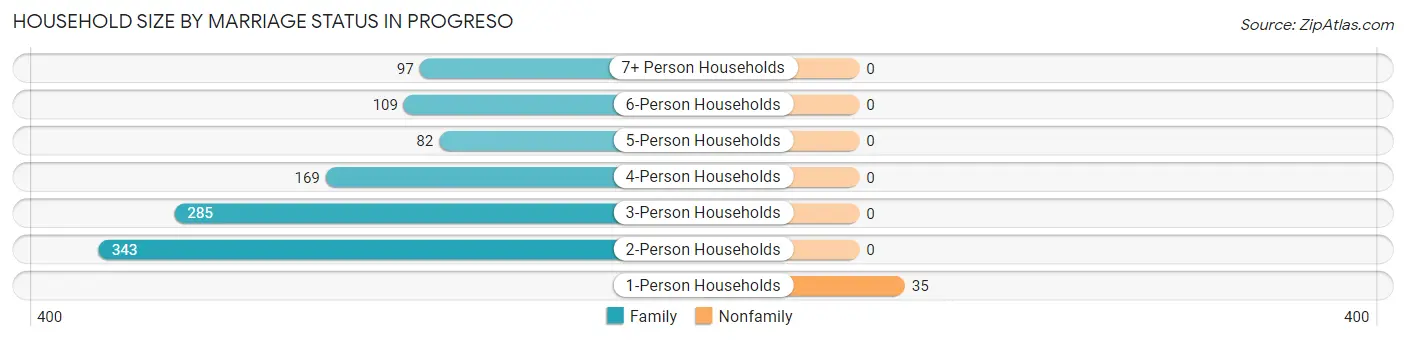
| Household Size | Family Households | Nonfamily Households |
| 1-Person Households | - | 35 (3.1%) |
| 2-Person Households | 343 (30.6%) | 0 (0.0%) |
| 3-Person Households | 285 (25.5%) | 0 (0.0%) |
| 4-Person Households | 169 (15.1%) | 0 (0.0%) |
| 5-Person Households | 82 (7.3%) | 0 (0.0%) |
| 6-Person Households | 109 (9.7%) | 0 (0.0%) |
| 7+ Person Households | 97 (8.7%) | 0 (0.0%) |
| Total | 1,085 (96.9%) | 35 (3.1%) |
Female Fertility in Progreso
Fertility by Age in Progreso
Average fertility rate in Progreso is 58.0 births per 1,000 women. Women in the age bracket of 15 to 19 years have the highest fertility rate with 219.0 births per 1,000 women. Women in the age bracket of 15 to 19 years acount for 100.0% of all women with births.
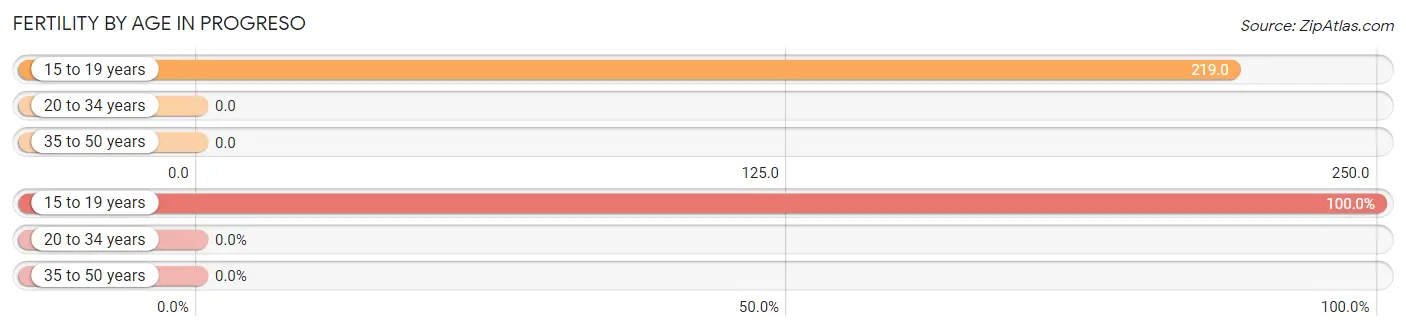
| Age Bracket | Women with Births | Births / 1,000 Women |
| 15 to 19 years | 70 (100.0%) | 219.0 |
| 20 to 34 years | 0 (0.0%) | 0.0 |
| 35 to 50 years | 0 (0.0%) | 0.0 |
| Total | 70 (100.0%) | 58.0 |
Fertility by Age by Marriage Status in Progreso
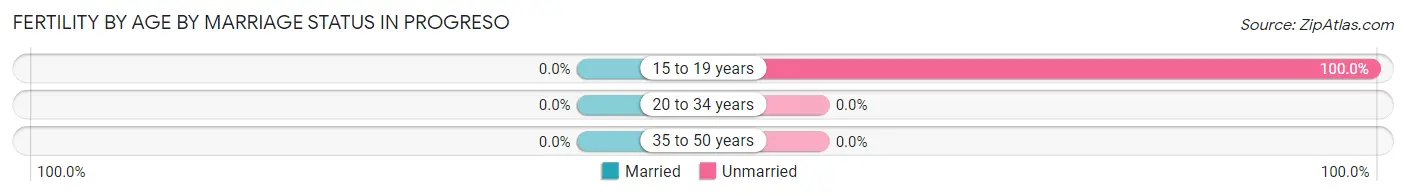
| Age Bracket | Married | Unmarried |
| 15 to 19 years | 0 (0.0%) | 70 (100.0%) |
| 20 to 34 years | 0 (0.0%) | 0 (0.0%) |
| 35 to 50 years | 0 (0.0%) | 0 (0.0%) |
| Total | 0 (0.0%) | 70 (100.0%) |
Fertility by Education in Progreso
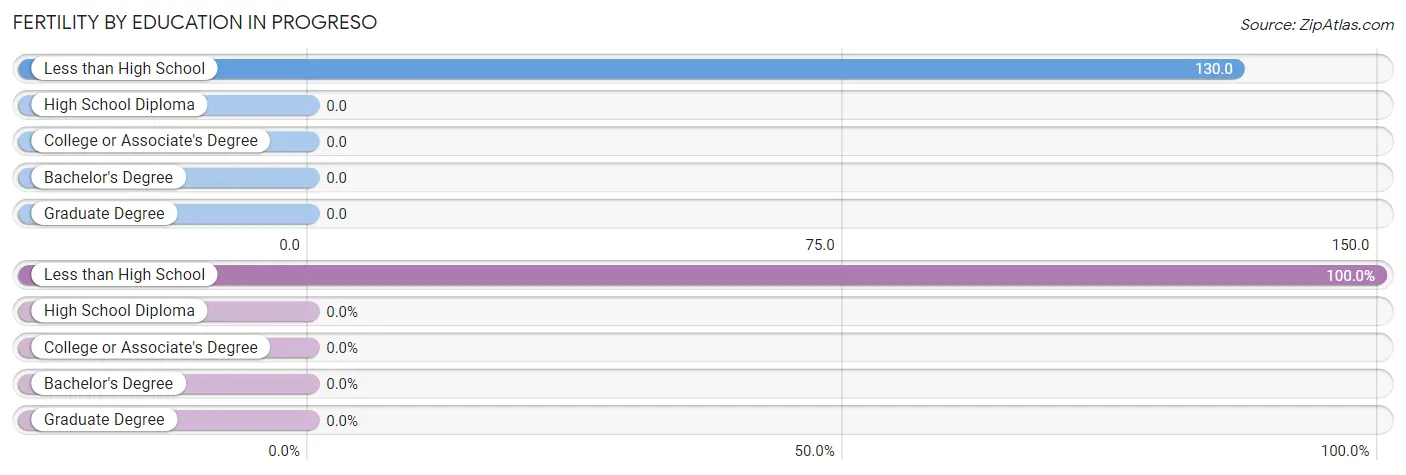
| Educational Attainment | Women with Births | Births / 1,000 Women |
| Less than High School | 70 (100.0%) | 130.0 |
| High School Diploma | 0 (0.0%) | 0.0 |
| College or Associate's Degree | 0 (0.0%) | 0.0 |
| Bachelor's Degree | 0 (0.0%) | 0.0 |
| Graduate Degree | 0 (0.0%) | 0.0 |
| Total | 70 (100.0%) | 58.0 |
Fertility by Education by Marriage Status in Progreso
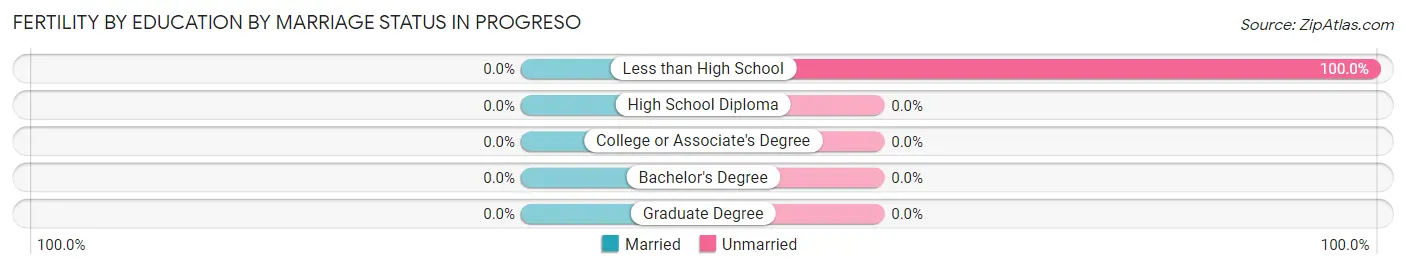
| Educational Attainment | Married | Unmarried |
| Less than High School | 0 (0.0%) | 70 (100.0%) |
| High School Diploma | 0 (0.0%) | 0 (0.0%) |
| College or Associate's Degree | 0 (0.0%) | 0 (0.0%) |
| Bachelor's Degree | 0 (0.0%) | 0 (0.0%) |
| Graduate Degree | 0 (0.0%) | 0 (0.0%) |
| Total | 0 (0.0%) | 70 (100.0%) |
Employment Characteristics in Progreso
Employment by Class of Employer in Progreso
Among the 1,883 employed individuals in Progreso, private company employees (1,045 | 55.5%), local government employees (368 | 19.5%), and state government employees (161 | 8.6%) make up the most common classes of employment.
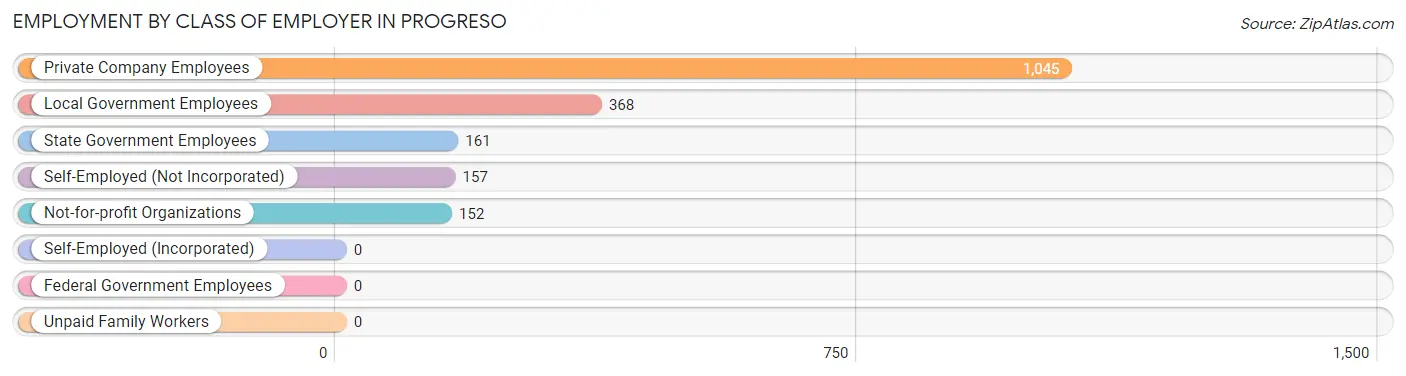
| Employer Class | # Employees | % Employees |
| Private Company Employees | 1,045 | 55.5% |
| Self-Employed (Incorporated) | 0 | 0.0% |
| Self-Employed (Not Incorporated) | 157 | 8.3% |
| Not-for-profit Organizations | 152 | 8.1% |
| Local Government Employees | 368 | 19.5% |
| State Government Employees | 161 | 8.6% |
| Federal Government Employees | 0 | 0.0% |
| Unpaid Family Workers | 0 | 0.0% |
| Total | 1,883 | 100.0% |
Employment Status by Age in Progreso
According to the labor force statistics for Progreso, out of the total population over 16 years of age (3,213), 62.5% or 2,008 individuals are in the labor force, with 6.2% or 124 of them unemployed. The age group with the highest labor force participation rate is 35 to 44 years, with 89.7% or 524 individuals in the labor force. Within the labor force, the 20 to 24 years age range has the highest percentage of unemployed individuals, with 18.9% or 20 of them being unemployed.
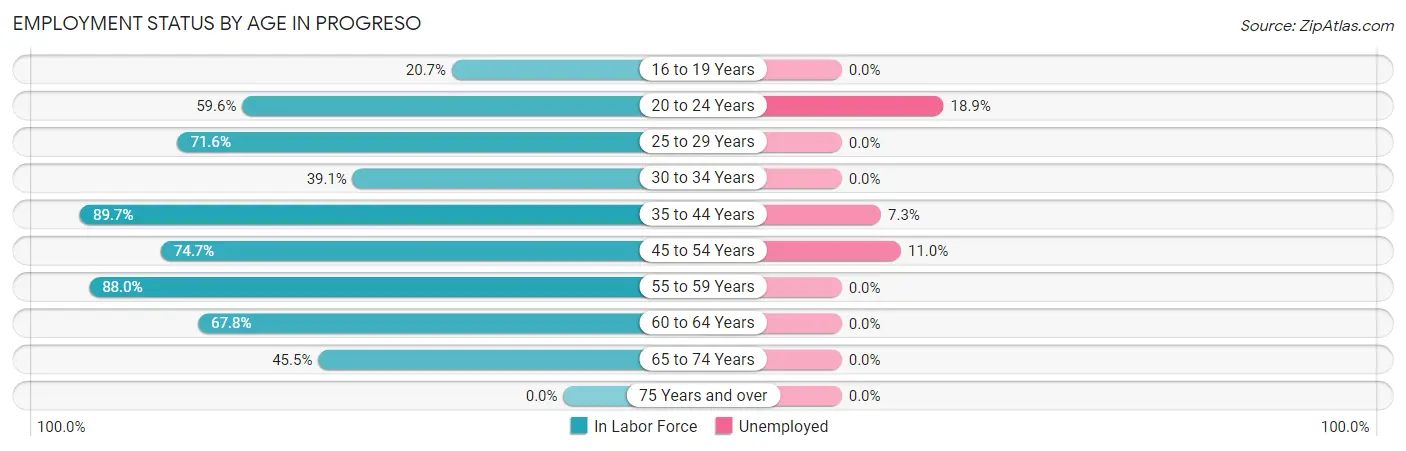
| Age Bracket | In Labor Force | Unemployed |
| 16 to 19 Years | 73 (20.7%) | 0 (0.0%) |
| 20 to 24 Years | 106 (59.6%) | 20 (18.9%) |
| 25 to 29 Years | 255 (71.6%) | 0 (0.0%) |
| 30 to 34 Years | 50 (39.1%) | 0 (0.0%) |
| 35 to 44 Years | 524 (89.7%) | 38 (7.3%) |
| 45 to 54 Years | 602 (74.7%) | 66 (11.0%) |
| 55 to 59 Years | 88 (88.0%) | 0 (0.0%) |
| 60 to 64 Years | 154 (67.8%) | 0 (0.0%) |
| 65 to 74 Years | 155 (45.5%) | 0 (0.0%) |
| 75 Years and over | 0 (0.0%) | 0 (0.0%) |
| Total | 2,008 (62.5%) | 124 (6.2%) |
Employment Status by Educational Attainment in Progreso
According to labor force statistics for Progreso, 76.0% of individuals (1,673) out of the total population between 25 and 64 years of age (2,201) are in the labor force, with 6.2% or 104 of them being unemployed. The group with the highest labor force participation rate are those with the educational attainment of bachelor's degree or higher, with 100.0% or 236 individuals in the labor force. Within the labor force, individuals with less than high school education have the highest percentage of unemployment, with 11.4% or 59 of them being unemployed.
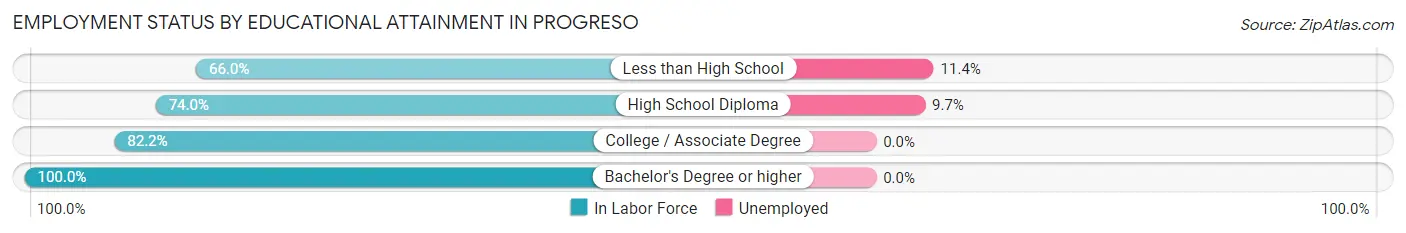
| Educational Attainment | In Labor Force | Unemployed |
| Less than High School | 519 (66.0%) | 90 (11.4%) |
| High School Diploma | 465 (74.0%) | 61 (9.7%) |
| College / Associate Degree | 453 (82.2%) | 0 (0.0%) |
| Bachelor's Degree or higher | 236 (100.0%) | 0 (0.0%) |
| Total | 1,673 (76.0%) | 136 (6.2%) |
Employment Occupations by Sex in Progreso
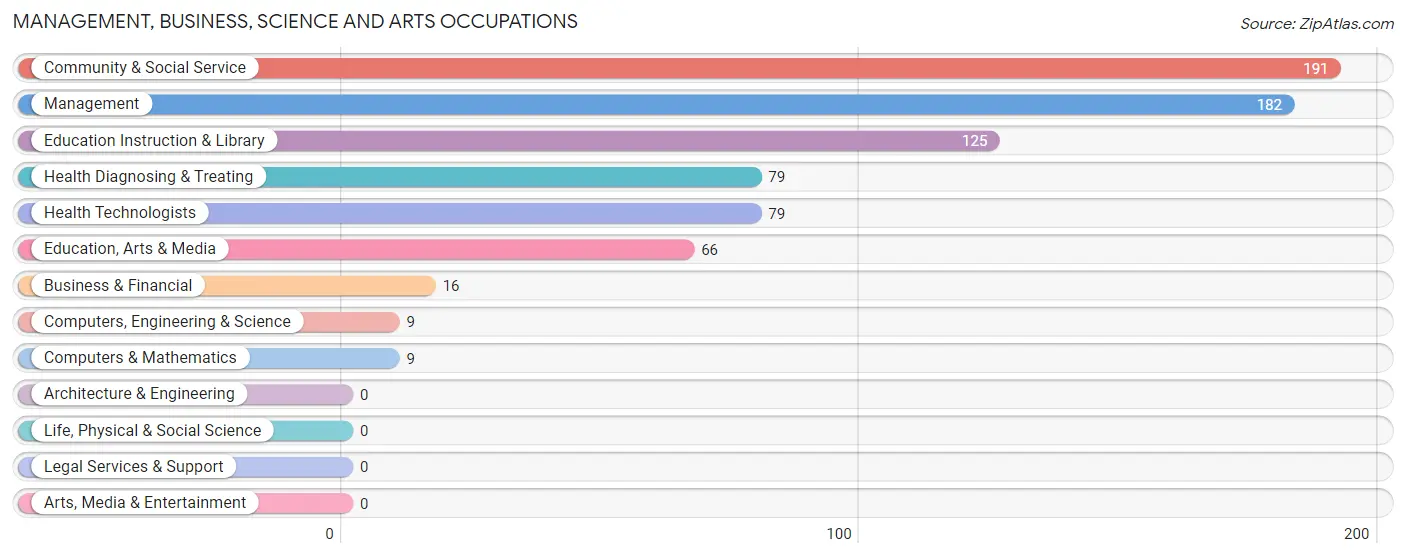
Management, Business, Science and Arts Occupations
The most common Management, Business, Science and Arts occupations in Progreso are Community & Social Service (191 | 10.1%), Management (182 | 9.7%), Education Instruction & Library (125 | 6.6%), Health Diagnosing & Treating (79 | 4.2%), and Health Technologists (79 | 4.2%).
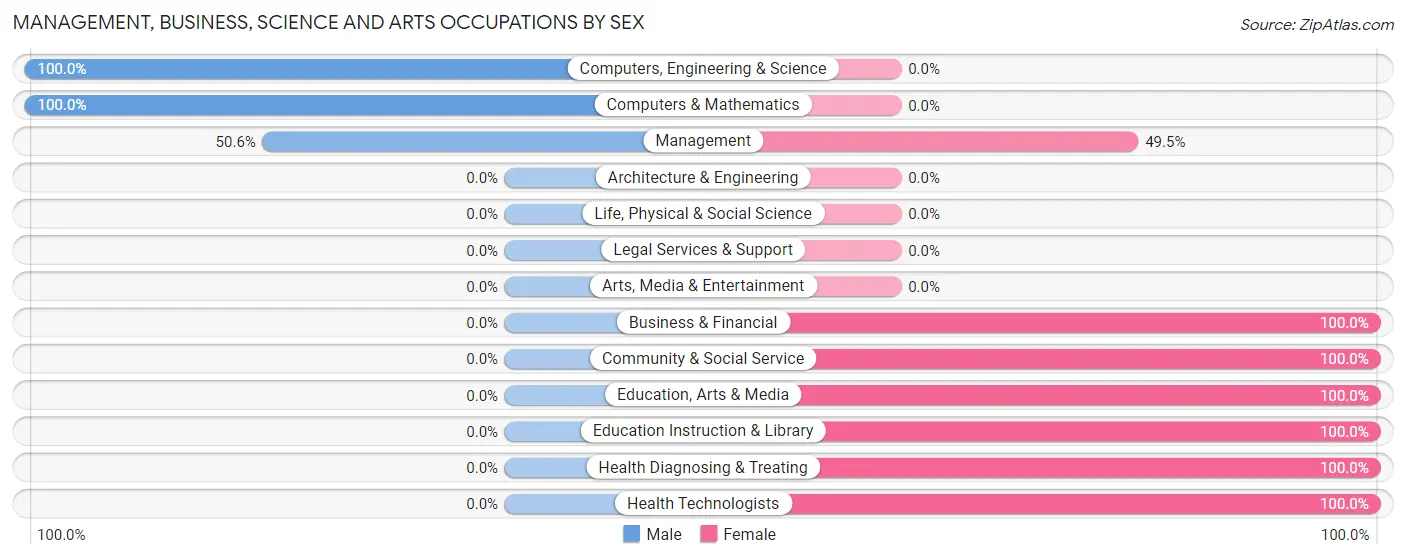
Management, Business, Science and Arts Occupations by Sex
Within the Management, Business, Science and Arts occupations in Progreso, the most male-oriented occupations are Computers, Engineering & Science (100.0%), Computers & Mathematics (100.0%), and Management (50.5%), while the most female-oriented occupations are Business & Financial (100.0%), Community & Social Service (100.0%), and Education, Arts & Media (100.0%).
| Occupation | Male | Female |
| Management | 92 (50.5%) | 90 (49.4%) |
| Business & Financial | 0 (0.0%) | 16 (100.0%) |
| Computers, Engineering & Science | 9 (100.0%) | 0 (0.0%) |
| Computers & Mathematics | 9 (100.0%) | 0 (0.0%) |
| Architecture & Engineering | 0 (0.0%) | 0 (0.0%) |
| Life, Physical & Social Science | 0 (0.0%) | 0 (0.0%) |
| Community & Social Service | 0 (0.0%) | 191 (100.0%) |
| Education, Arts & Media | 0 (0.0%) | 66 (100.0%) |
| Legal Services & Support | 0 (0.0%) | 0 (0.0%) |
| Education Instruction & Library | 0 (0.0%) | 125 (100.0%) |
| Arts, Media & Entertainment | 0 (0.0%) | 0 (0.0%) |
| Health Diagnosing & Treating | 0 (0.0%) | 79 (100.0%) |
| Health Technologists | 0 (0.0%) | 79 (100.0%) |
| Total (Category) | 101 (21.2%) | 376 (78.8%) |
| Total (Overall) | 797 (42.3%) | 1,086 (57.7%) |
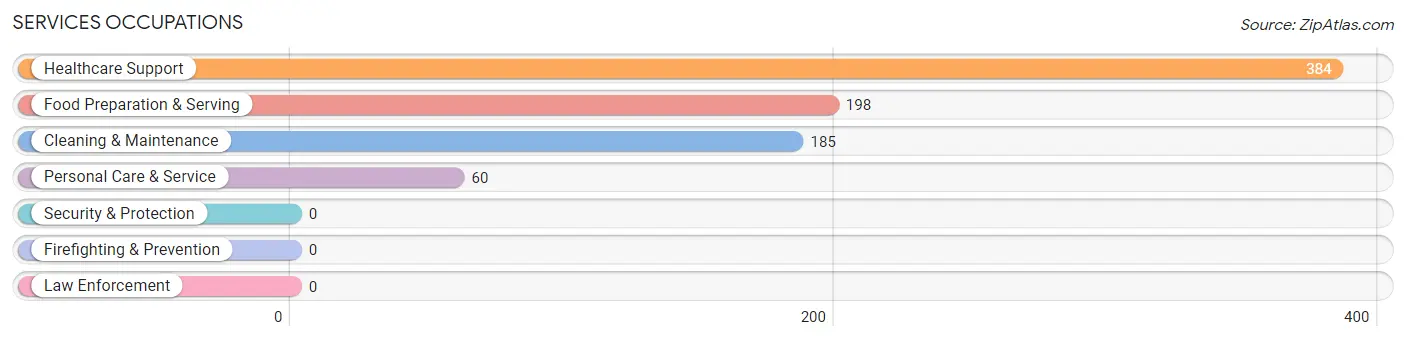
Services Occupations
The most common Services occupations in Progreso are Healthcare Support (384 | 20.4%), Food Preparation & Serving (198 | 10.5%), Cleaning & Maintenance (185 | 9.8%), and Personal Care & Service (60 | 3.2%).
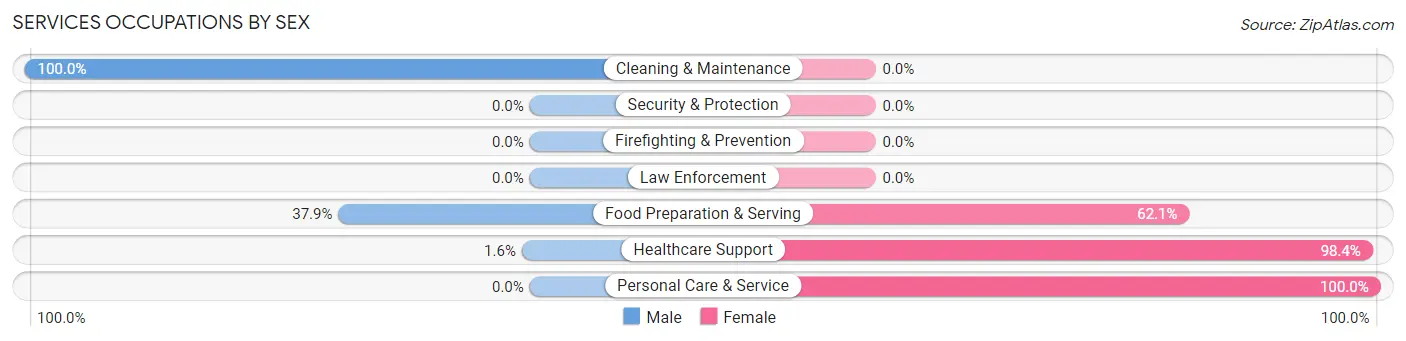
Services Occupations by Sex
Within the Services occupations in Progreso, the most male-oriented occupations are Cleaning & Maintenance (100.0%), Food Preparation & Serving (37.9%), and Healthcare Support (1.6%), while the most female-oriented occupations are Personal Care & Service (100.0%), Healthcare Support (98.4%), and Food Preparation & Serving (62.1%).
| Occupation | Male | Female |
| Healthcare Support | 6 (1.6%) | 378 (98.4%) |
| Security & Protection | 0 (0.0%) | 0 (0.0%) |
| Firefighting & Prevention | 0 (0.0%) | 0 (0.0%) |
| Law Enforcement | 0 (0.0%) | 0 (0.0%) |
| Food Preparation & Serving | 75 (37.9%) | 123 (62.1%) |
| Cleaning & Maintenance | 185 (100.0%) | 0 (0.0%) |
| Personal Care & Service | 0 (0.0%) | 60 (100.0%) |
| Total (Category) | 266 (32.2%) | 561 (67.8%) |
| Total (Overall) | 797 (42.3%) | 1,086 (57.7%) |
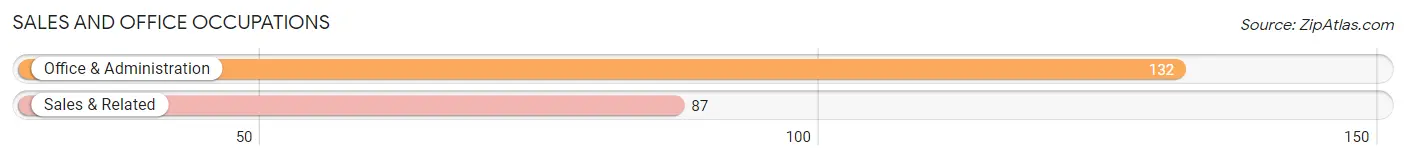
Sales and Office Occupations
The most common Sales and Office occupations in Progreso are Office & Administration (132 | 7.0%), and Sales & Related (87 | 4.6%).
Sales and Office Occupations by Sex
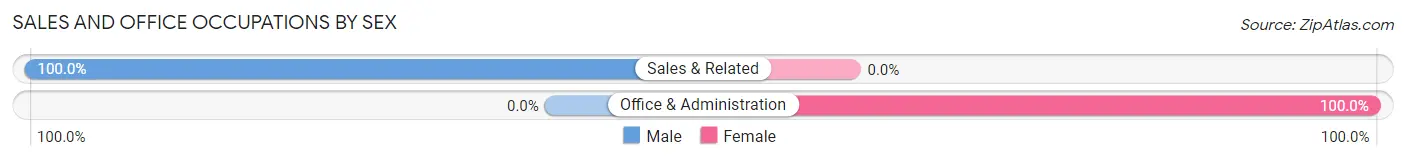
| Occupation | Male | Female |
| Sales & Related | 87 (100.0%) | 0 (0.0%) |
| Office & Administration | 0 (0.0%) | 132 (100.0%) |
| Total (Category) | 87 (39.7%) | 132 (60.3%) |
| Total (Overall) | 797 (42.3%) | 1,086 (57.7%) |
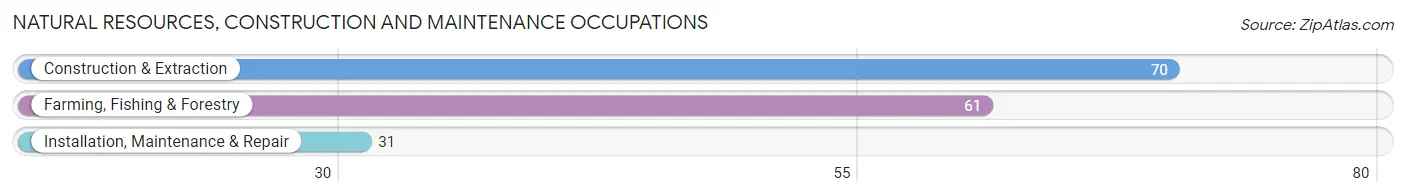
Natural Resources, Construction and Maintenance Occupations
The most common Natural Resources, Construction and Maintenance occupations in Progreso are Construction & Extraction (70 | 3.7%), Farming, Fishing & Forestry (61 | 3.2%), and Installation, Maintenance & Repair (31 | 1.7%).
Natural Resources, Construction and Maintenance Occupations by Sex
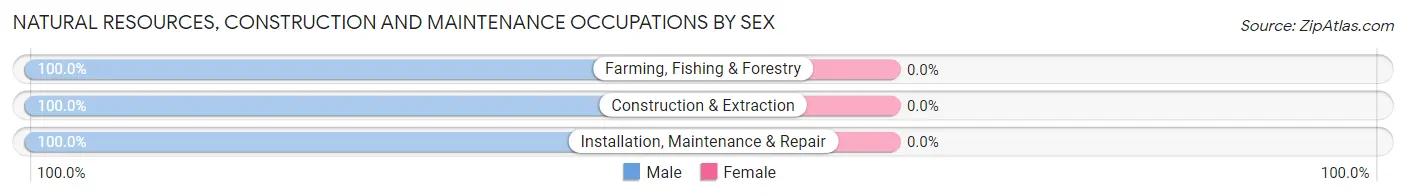
| Occupation | Male | Female |
| Farming, Fishing & Forestry | 61 (100.0%) | 0 (0.0%) |
| Construction & Extraction | 70 (100.0%) | 0 (0.0%) |
| Installation, Maintenance & Repair | 31 (100.0%) | 0 (0.0%) |
| Total (Category) | 162 (100.0%) | 0 (0.0%) |
| Total (Overall) | 797 (42.3%) | 1,086 (57.7%) |
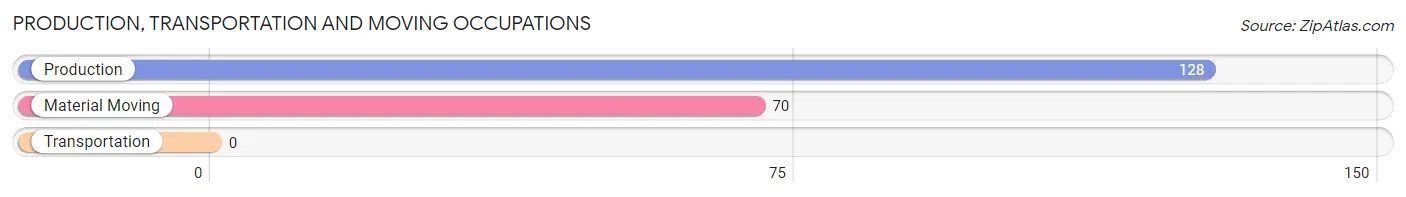
Production, Transportation and Moving Occupations
The most common Production, Transportation and Moving occupations in Progreso are Production (128 | 6.8%), and Material Moving (70 | 3.7%).
Production, Transportation and Moving Occupations by Sex
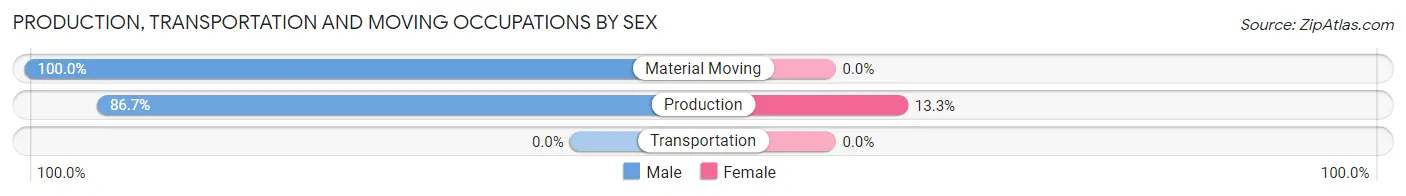
| Occupation | Male | Female |
| Production | 111 (86.7%) | 17 (13.3%) |
| Transportation | 0 (0.0%) | 0 (0.0%) |
| Material Moving | 70 (100.0%) | 0 (0.0%) |
| Total (Category) | 181 (91.4%) | 17 (8.6%) |
| Total (Overall) | 797 (42.3%) | 1,086 (57.7%) |
Employment Industries by Sex in Progreso
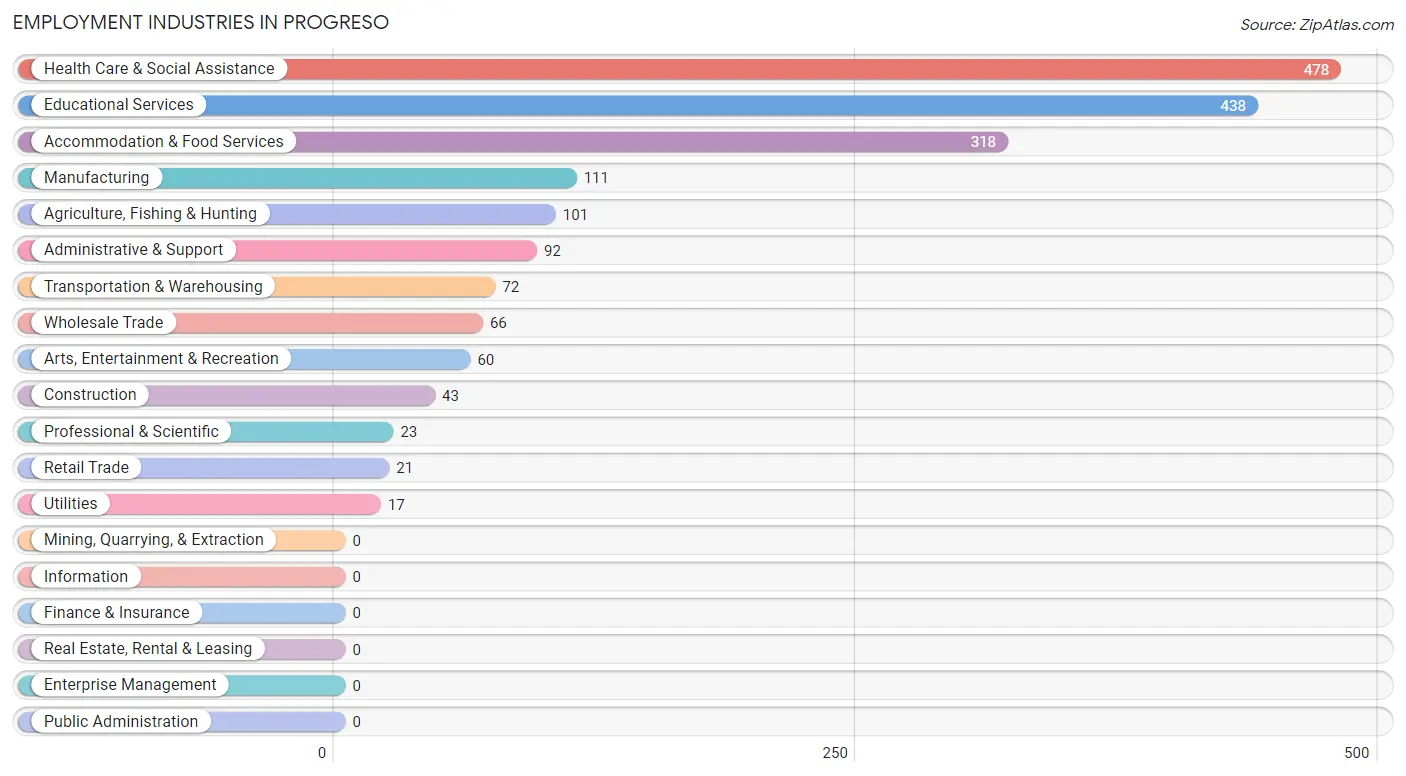
Employment Industries in Progreso
The major employment industries in Progreso include Health Care & Social Assistance (478 | 25.4%), Educational Services (438 | 23.3%), Accommodation & Food Services (318 | 16.9%), Manufacturing (111 | 5.9%), and Agriculture, Fishing & Hunting (101 | 5.4%).
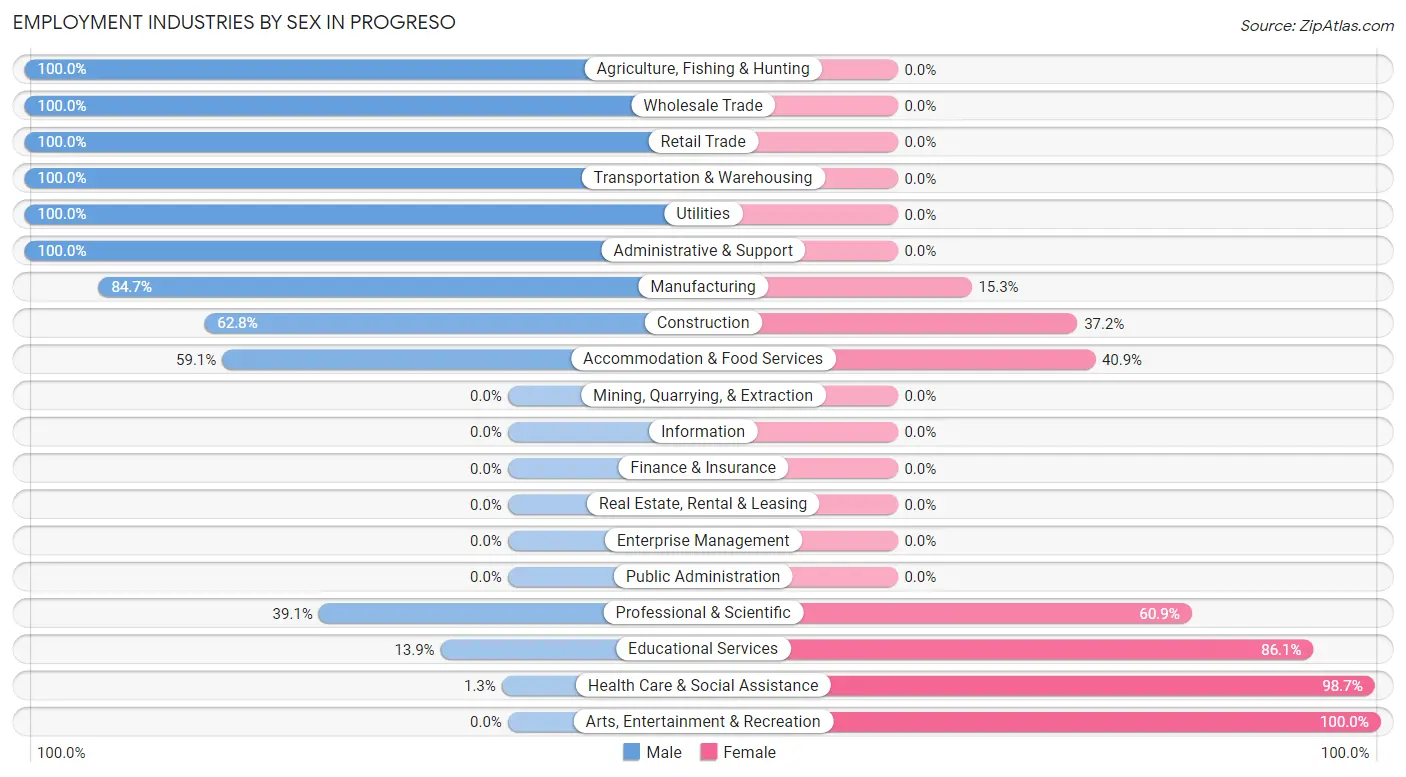
Employment Industries by Sex in Progreso
The Progreso industries that see more men than women are Agriculture, Fishing & Hunting (100.0%), Wholesale Trade (100.0%), and Retail Trade (100.0%), whereas the industries that tend to have a higher number of women are Arts, Entertainment & Recreation (100.0%), Health Care & Social Assistance (98.7%), and Educational Services (86.1%).
| Industry | Male | Female |
| Agriculture, Fishing & Hunting | 101 (100.0%) | 0 (0.0%) |
| Mining, Quarrying, & Extraction | 0 (0.0%) | 0 (0.0%) |
| Construction | 27 (62.8%) | 16 (37.2%) |
| Manufacturing | 94 (84.7%) | 17 (15.3%) |
| Wholesale Trade | 66 (100.0%) | 0 (0.0%) |
| Retail Trade | 21 (100.0%) | 0 (0.0%) |
| Transportation & Warehousing | 72 (100.0%) | 0 (0.0%) |
| Utilities | 17 (100.0%) | 0 (0.0%) |
| Information | 0 (0.0%) | 0 (0.0%) |
| Finance & Insurance | 0 (0.0%) | 0 (0.0%) |
| Real Estate, Rental & Leasing | 0 (0.0%) | 0 (0.0%) |
| Professional & Scientific | 9 (39.1%) | 14 (60.9%) |
| Enterprise Management | 0 (0.0%) | 0 (0.0%) |
| Administrative & Support | 92 (100.0%) | 0 (0.0%) |
| Educational Services | 61 (13.9%) | 377 (86.1%) |
| Health Care & Social Assistance | 6 (1.3%) | 472 (98.7%) |
| Arts, Entertainment & Recreation | 0 (0.0%) | 60 (100.0%) |
| Accommodation & Food Services | 188 (59.1%) | 130 (40.9%) |
| Public Administration | 0 (0.0%) | 0 (0.0%) |
| Total | 797 (42.3%) | 1,086 (57.7%) |
Education in Progreso
School Enrollment in Progreso
The most common levels of schooling among the 1,647 students in Progreso are elementary school (510 | 31.0%), high school (502 | 30.5%), and middle school (296 | 18.0%).
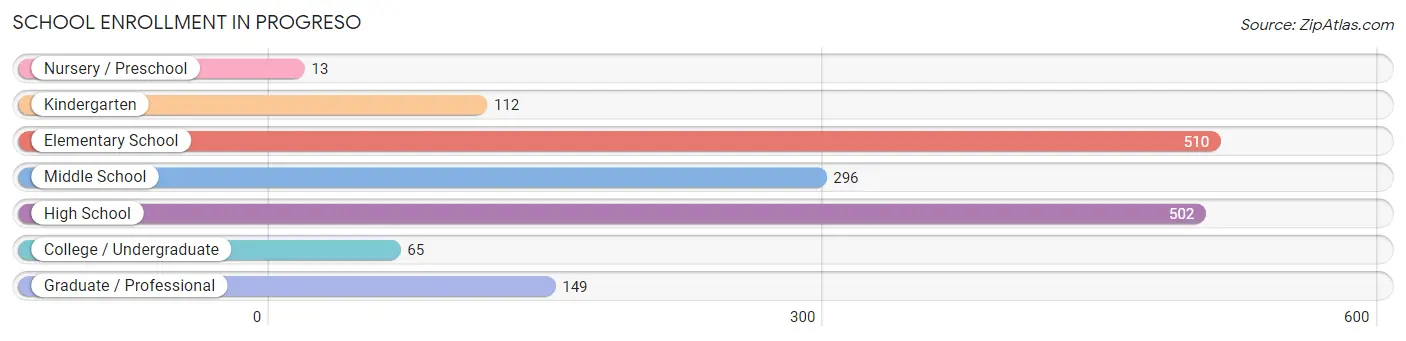
| School Level | # Students | % Students |
| Nursery / Preschool | 13 | 0.8% |
| Kindergarten | 112 | 6.8% |
| Elementary School | 510 | 31.0% |
| Middle School | 296 | 18.0% |
| High School | 502 | 30.5% |
| College / Undergraduate | 65 | 4.0% |
| Graduate / Professional | 149 | 9.0% |
| Total | 1,647 | 100.0% |
School Enrollment by Age by Funding Source in Progreso
Out of a total of 1,647 students who are enrolled in schools in Progreso, 66 (4.0%) attend a private institution, while the remaining 1,581 (96.0%) are enrolled in public schools. The age group of 20 to 24 year olds has the highest likelihood of being enrolled in private schools, with 2 (100.0% in the age bracket) enrolled. Conversely, the age group of 5 to 9 year old has the lowest likelihood of being enrolled in a private school, with 519 (100.0% in the age bracket) attending a public institution.
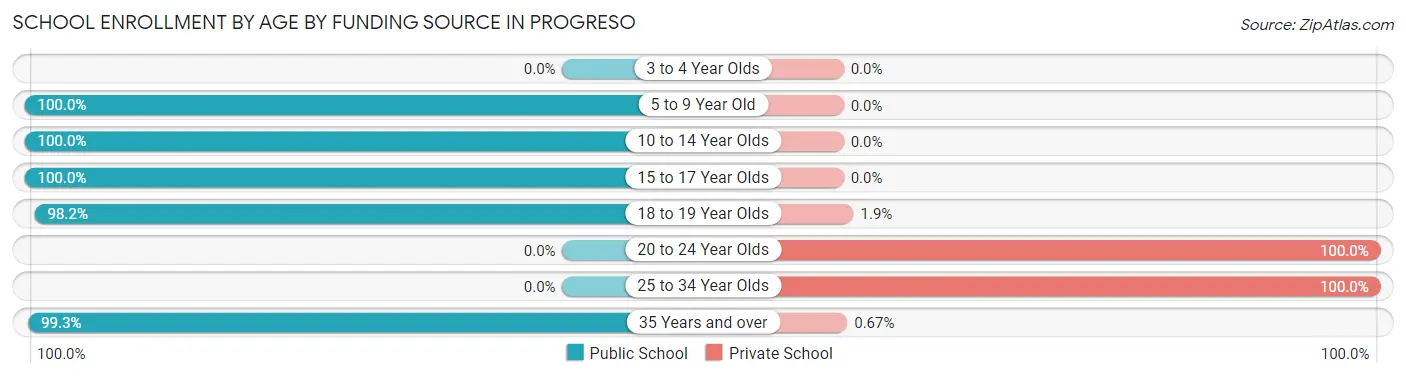
| Age Bracket | Public School | Private School |
| 3 to 4 Year Olds | 0 (0.0%) | 0 (0.0%) |
| 5 to 9 Year Old | 519 (100.0%) | 0 (0.0%) |
| 10 to 14 Year Olds | 377 (100.0%) | 0 (0.0%) |
| 15 to 17 Year Olds | 378 (100.0%) | 0 (0.0%) |
| 18 to 19 Year Olds | 159 (98.2%) | 3 (1.8%) |
| 20 to 24 Year Olds | 0 (0.0%) | 2 (100.0%) |
| 25 to 34 Year Olds | 0 (0.0%) | 60 (100.0%) |
| 35 Years and over | 148 (99.3%) | 1 (0.7%) |
| Total | 1,581 (96.0%) | 66 (4.0%) |
Educational Attainment by Field of Study in Progreso
Education (85 | 33.3%), science & technology (80 | 31.4%), psychology (65 | 25.5%), bio, nature & agricultural (13 | 5.1%), and computers & mathematics (10 | 3.9%) are the most common fields of study among 255 individuals in Progreso who have obtained a bachelor's degree or higher.
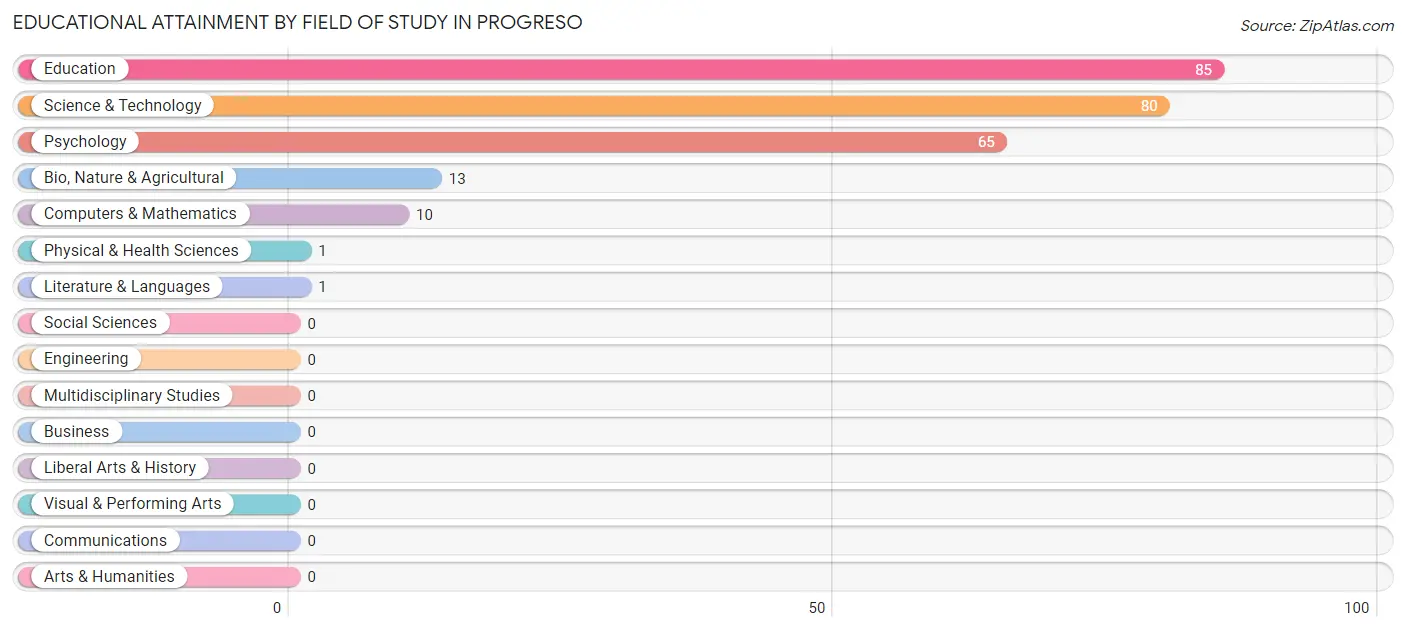
| Field of Study | # Graduates | % Graduates |
| Computers & Mathematics | 10 | 3.9% |
| Bio, Nature & Agricultural | 13 | 5.1% |
| Physical & Health Sciences | 1 | 0.4% |
| Psychology | 65 | 25.5% |
| Social Sciences | 0 | 0.0% |
| Engineering | 0 | 0.0% |
| Multidisciplinary Studies | 0 | 0.0% |
| Science & Technology | 80 | 31.4% |
| Business | 0 | 0.0% |
| Education | 85 | 33.3% |
| Literature & Languages | 1 | 0.4% |
| Liberal Arts & History | 0 | 0.0% |
| Visual & Performing Arts | 0 | 0.0% |
| Communications | 0 | 0.0% |
| Arts & Humanities | 0 | 0.0% |
| Total | 255 | 100.0% |
Transportation & Commute in Progreso
Vehicle Availability by Sex in Progreso
The most prevalent vehicle ownership categories in Progreso are males with 2 vehicles (608, accounting for 76.3%) and females with 2 vehicles (538, making up 56.3%).
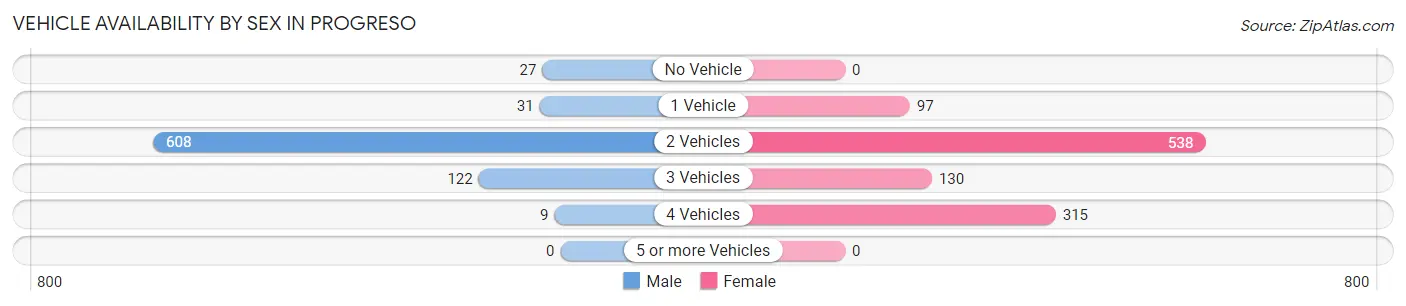
| Vehicles Available | Male | Female |
| No Vehicle | 27 (3.4%) | 0 (0.0%) |
| 1 Vehicle | 31 (3.9%) | 97 (9.0%) |
| 2 Vehicles | 608 (76.3%) | 538 (49.8%) |
| 3 Vehicles | 122 (15.3%) | 130 (12.0%) |
| 4 Vehicles | 9 (1.1%) | 315 (29.2%) |
| 5 or more Vehicles | 0 (0.0%) | 0 (0.0%) |
| Total | 797 (100.0%) | 1,080 (100.0%) |
Commute Time in Progreso
The most frequently occuring commute durations in Progreso are 15 to 19 minutes (443 commuters, 23.9%), 5 to 9 minutes (338 commuters, 18.2%), and 20 to 24 minutes (245 commuters, 13.2%).
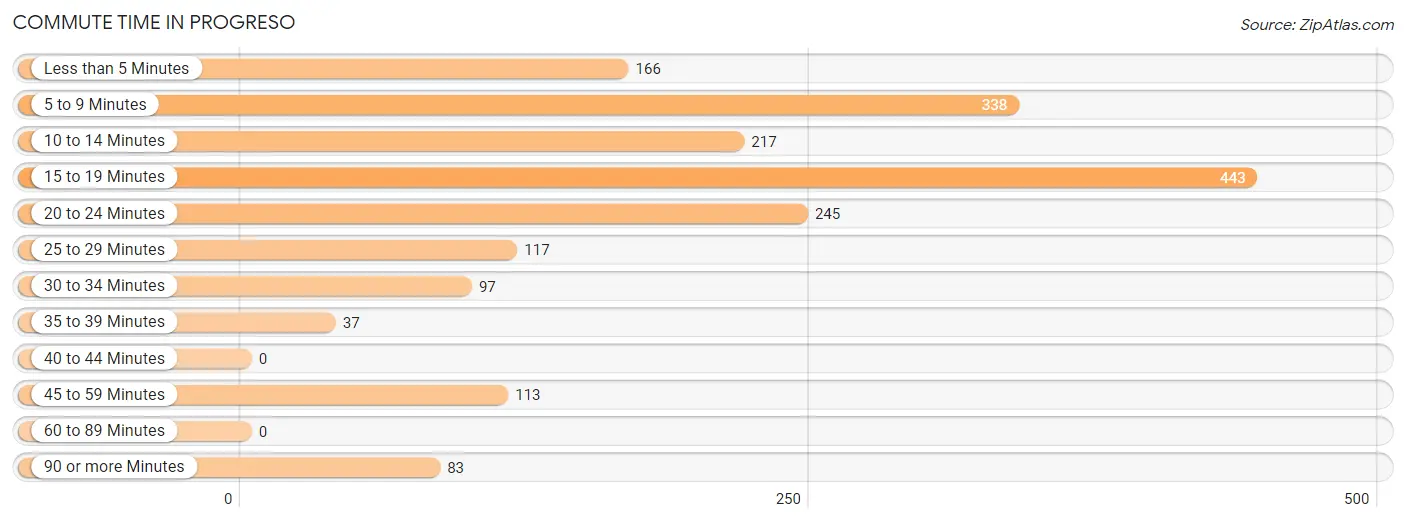
| Commute Time | # Commuters | % Commuters |
| Less than 5 Minutes | 166 | 8.9% |
| 5 to 9 Minutes | 338 | 18.2% |
| 10 to 14 Minutes | 217 | 11.7% |
| 15 to 19 Minutes | 443 | 23.9% |
| 20 to 24 Minutes | 245 | 13.2% |
| 25 to 29 Minutes | 117 | 6.3% |
| 30 to 34 Minutes | 97 | 5.2% |
| 35 to 39 Minutes | 37 | 2.0% |
| 40 to 44 Minutes | 0 | 0.0% |
| 45 to 59 Minutes | 113 | 6.1% |
| 60 to 89 Minutes | 0 | 0.0% |
| 90 or more Minutes | 83 | 4.5% |
Commute Time by Sex in Progreso
The most common commute times in Progreso are 15 to 19 minutes (154 commuters, 19.3%) for males and 5 to 9 minutes (321 commuters, 30.3%) for females.
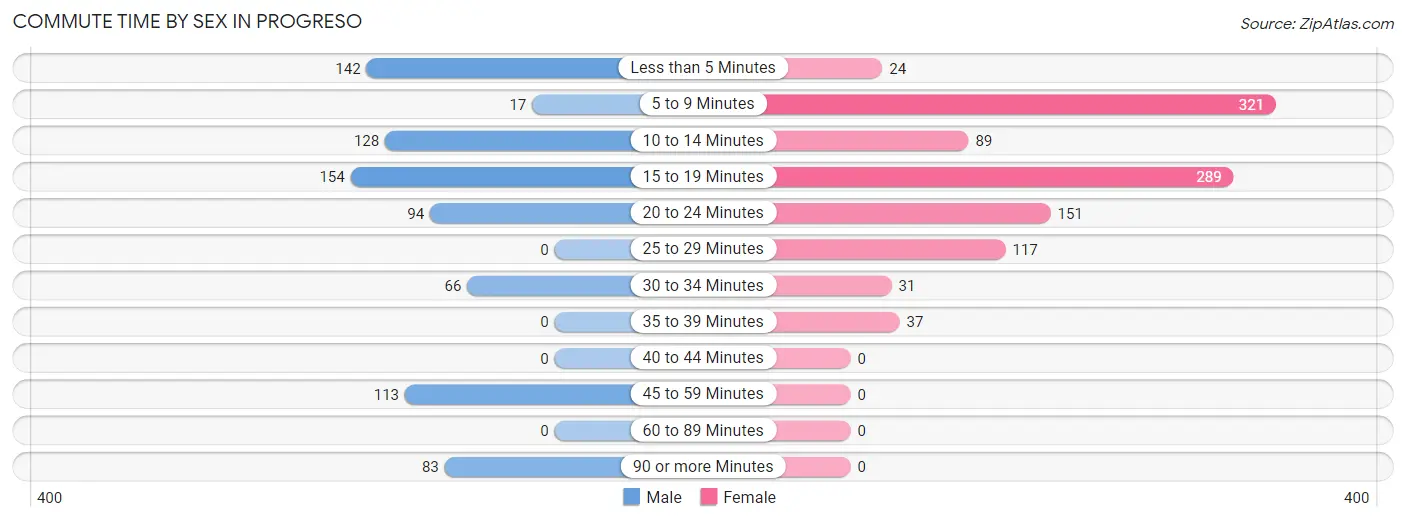
| Commute Time | Male | Female |
| Less than 5 Minutes | 142 (17.8%) | 24 (2.3%) |
| 5 to 9 Minutes | 17 (2.1%) | 321 (30.3%) |
| 10 to 14 Minutes | 128 (16.1%) | 89 (8.4%) |
| 15 to 19 Minutes | 154 (19.3%) | 289 (27.3%) |
| 20 to 24 Minutes | 94 (11.8%) | 151 (14.3%) |
| 25 to 29 Minutes | 0 (0.0%) | 117 (11.1%) |
| 30 to 34 Minutes | 66 (8.3%) | 31 (2.9%) |
| 35 to 39 Minutes | 0 (0.0%) | 37 (3.5%) |
| 40 to 44 Minutes | 0 (0.0%) | 0 (0.0%) |
| 45 to 59 Minutes | 113 (14.2%) | 0 (0.0%) |
| 60 to 89 Minutes | 0 (0.0%) | 0 (0.0%) |
| 90 or more Minutes | 83 (10.4%) | 0 (0.0%) |
Time of Departure to Work by Sex in Progreso
The most frequent times of departure to work in Progreso are 8:00 AM to 8:29 AM (183, 23.0%) for males and 7:30 AM to 7:59 AM (232, 21.9%) for females.
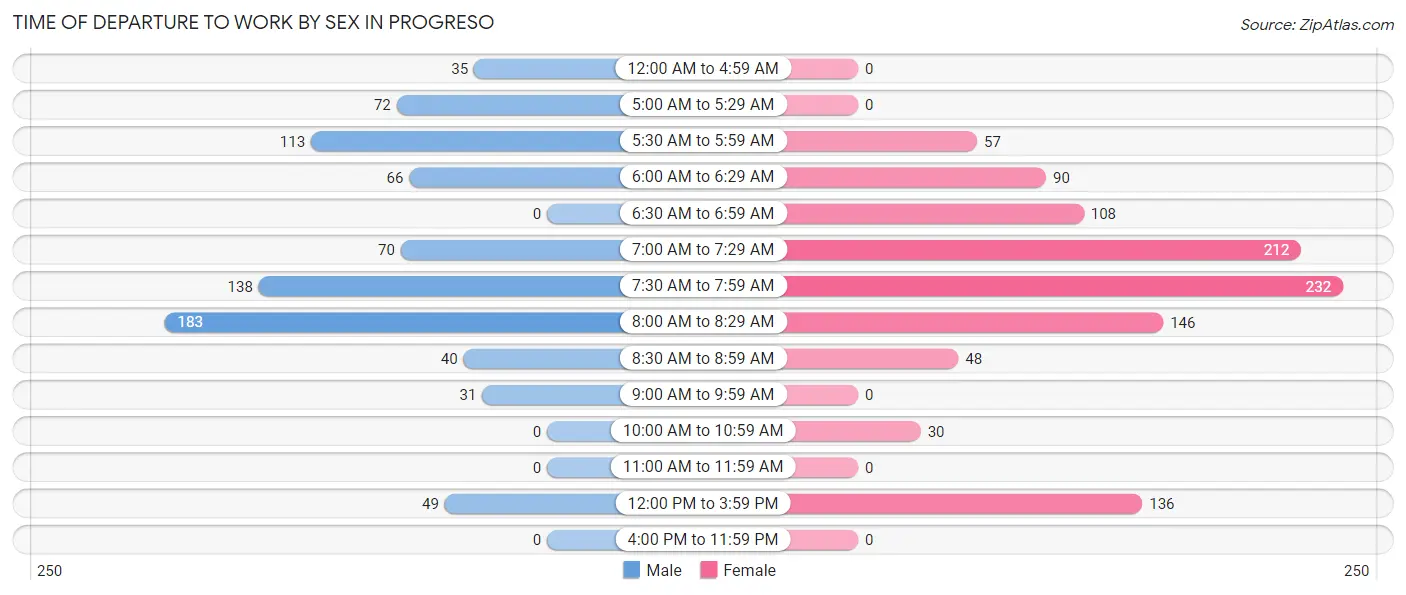
| Time of Departure | Male | Female |
| 12:00 AM to 4:59 AM | 35 (4.4%) | 0 (0.0%) |
| 5:00 AM to 5:29 AM | 72 (9.0%) | 0 (0.0%) |
| 5:30 AM to 5:59 AM | 113 (14.2%) | 57 (5.4%) |
| 6:00 AM to 6:29 AM | 66 (8.3%) | 90 (8.5%) |
| 6:30 AM to 6:59 AM | 0 (0.0%) | 108 (10.2%) |
| 7:00 AM to 7:29 AM | 70 (8.8%) | 212 (20.0%) |
| 7:30 AM to 7:59 AM | 138 (17.3%) | 232 (21.9%) |
| 8:00 AM to 8:29 AM | 183 (23.0%) | 146 (13.8%) |
| 8:30 AM to 8:59 AM | 40 (5.0%) | 48 (4.5%) |
| 9:00 AM to 9:59 AM | 31 (3.9%) | 0 (0.0%) |
| 10:00 AM to 10:59 AM | 0 (0.0%) | 30 (2.8%) |
| 11:00 AM to 11:59 AM | 0 (0.0%) | 0 (0.0%) |
| 12:00 PM to 3:59 PM | 49 (6.1%) | 136 (12.8%) |
| 4:00 PM to 11:59 PM | 0 (0.0%) | 0 (0.0%) |
| Total | 797 (100.0%) | 1,059 (100.0%) |
Housing Occupancy in Progreso
Occupancy by Ownership in Progreso
Of the total 1,120 dwellings in Progreso, owner-occupied units account for 958 (85.5%), while renter-occupied units make up 162 (14.5%).
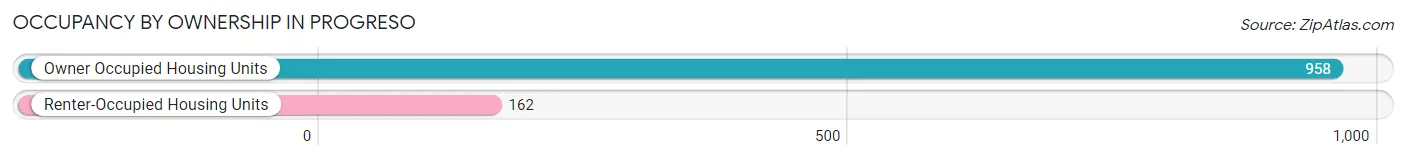
| Occupancy | # Housing Units | % Housing Units |
| Owner Occupied Housing Units | 958 | 85.5% |
| Renter-Occupied Housing Units | 162 | 14.5% |
| Total Occupied Housing Units | 1,120 | 100.0% |
Occupancy by Household Size in Progreso
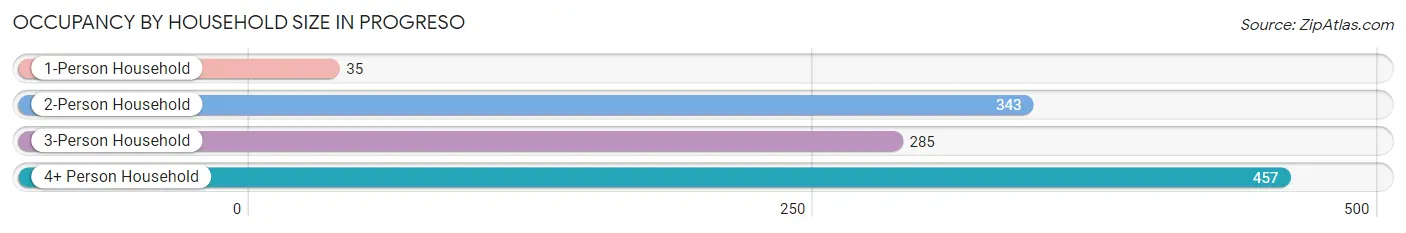
| Household Size | # Housing Units | % Housing Units |
| 1-Person Household | 35 | 3.1% |
| 2-Person Household | 343 | 30.6% |
| 3-Person Household | 285 | 25.5% |
| 4+ Person Household | 457 | 40.8% |
| Total Housing Units | 1,120 | 100.0% |
Occupancy by Ownership by Household Size in Progreso
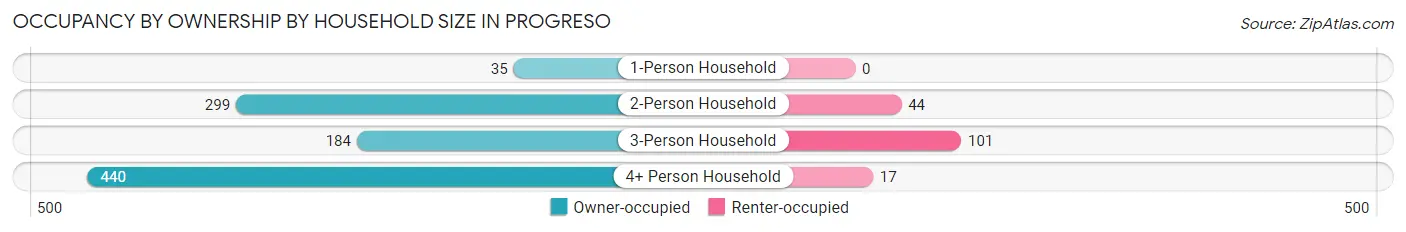
| Household Size | Owner-occupied | Renter-occupied |
| 1-Person Household | 35 (100.0%) | 0 (0.0%) |
| 2-Person Household | 299 (87.2%) | 44 (12.8%) |
| 3-Person Household | 184 (64.6%) | 101 (35.4%) |
| 4+ Person Household | 440 (96.3%) | 17 (3.7%) |
| Total Housing Units | 958 (85.5%) | 162 (14.5%) |
Occupancy by Educational Attainment in Progreso
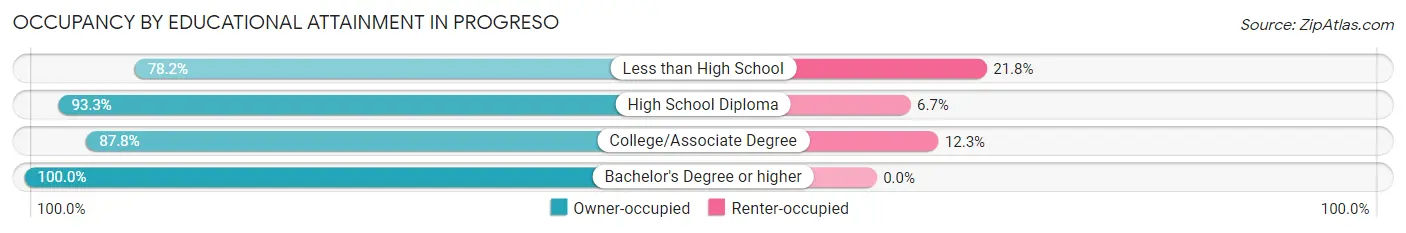
| Household Size | Owner-occupied | Renter-occupied |
| Less than High School | 408 (78.2%) | 114 (21.8%) |
| High School Diploma | 236 (93.3%) | 17 (6.7%) |
| College/Associate Degree | 222 (87.7%) | 31 (12.2%) |
| Bachelor's Degree or higher | 92 (100.0%) | 0 (0.0%) |
Occupancy by Age of Householder in Progreso
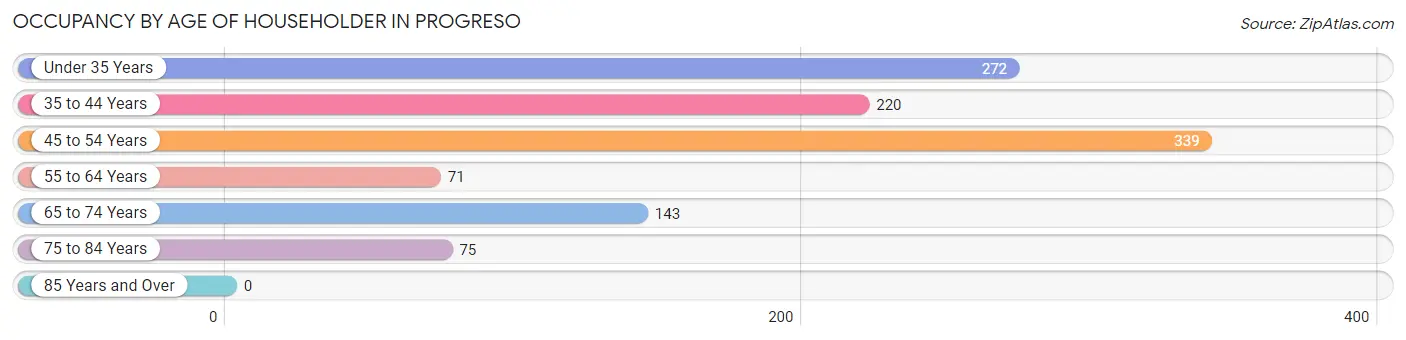
| Age Bracket | # Households | % Households |
| Under 35 Years | 272 | 24.3% |
| 35 to 44 Years | 220 | 19.6% |
| 45 to 54 Years | 339 | 30.3% |
| 55 to 64 Years | 71 | 6.3% |
| 65 to 74 Years | 143 | 12.8% |
| 75 to 84 Years | 75 | 6.7% |
| 85 Years and Over | 0 | 0.0% |
| Total | 1,120 | 100.0% |
Housing Finances in Progreso
Median Income by Occupancy in Progreso
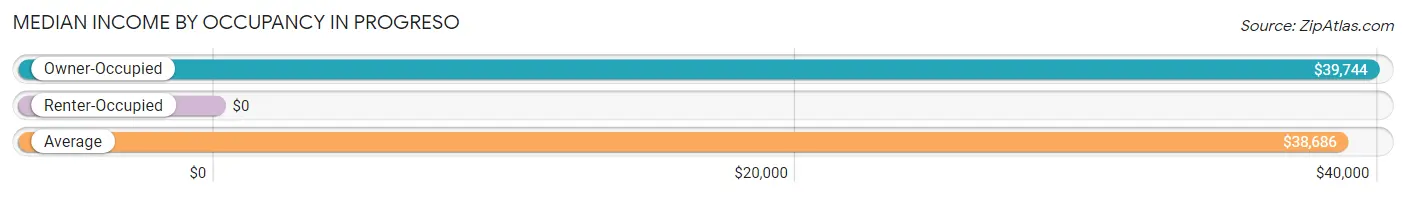
| Occupancy Type | # Households | Median Income |
| Owner-Occupied | 958 (85.5%) | $39,744 |
| Renter-Occupied | 162 (14.5%) | $0 |
| Average | 1,120 (100.0%) | $38,686 |
Occupancy by Householder Income Bracket in Progreso
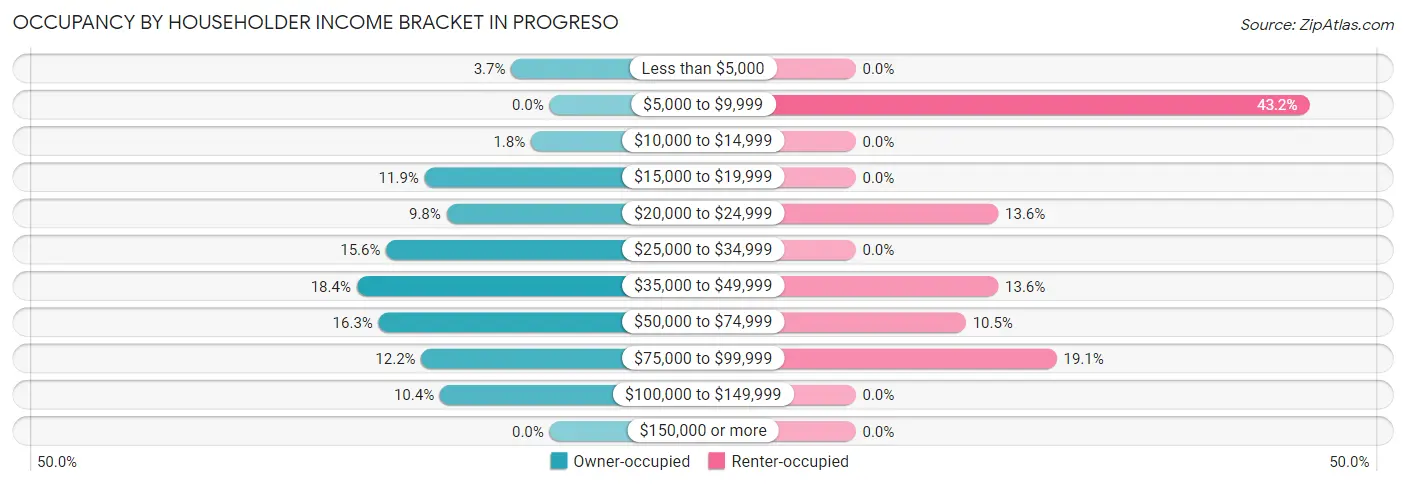
| Income Bracket | Owner-occupied | Renter-occupied |
| Less than $5,000 | 35 (3.6%) | 0 (0.0%) |
| $5,000 to $9,999 | 0 (0.0%) | 70 (43.2%) |
| $10,000 to $14,999 | 17 (1.8%) | 0 (0.0%) |
| $15,000 to $19,999 | 114 (11.9%) | 0 (0.0%) |
| $20,000 to $24,999 | 94 (9.8%) | 22 (13.6%) |
| $25,000 to $34,999 | 149 (15.5%) | 0 (0.0%) |
| $35,000 to $49,999 | 176 (18.4%) | 22 (13.6%) |
| $50,000 to $74,999 | 156 (16.3%) | 17 (10.5%) |
| $75,000 to $99,999 | 117 (12.2%) | 31 (19.1%) |
| $100,000 to $149,999 | 100 (10.4%) | 0 (0.0%) |
| $150,000 or more | 0 (0.0%) | 0 (0.0%) |
| Total | 958 (100.0%) | 162 (100.0%) |
Monthly Housing Cost Tiers in Progreso
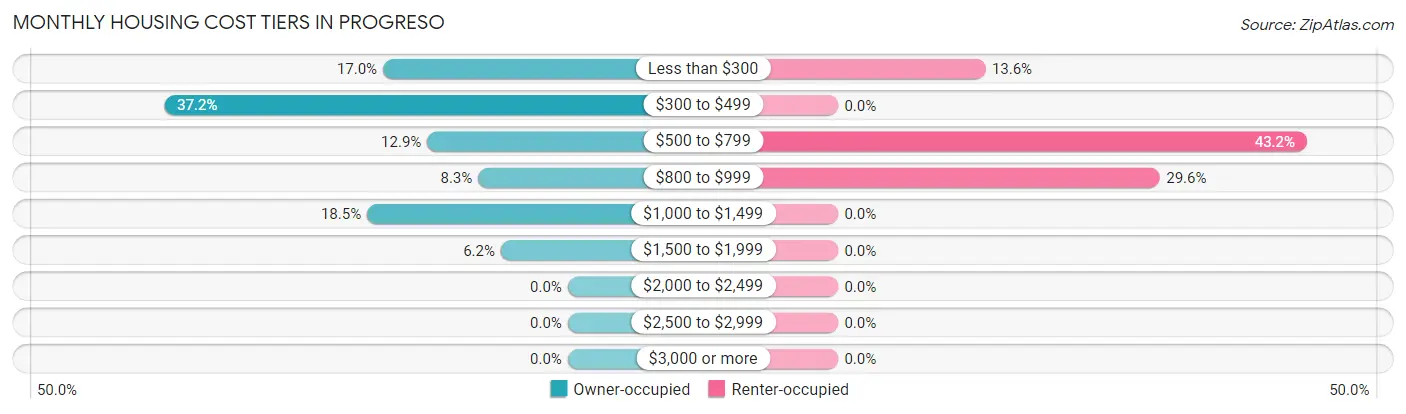
| Monthly Cost | Owner-occupied | Renter-occupied |
| Less than $300 | 163 (17.0%) | 22 (13.6%) |
| $300 to $499 | 356 (37.2%) | 0 (0.0%) |
| $500 to $799 | 124 (12.9%) | 70 (43.2%) |
| $800 to $999 | 79 (8.3%) | 48 (29.6%) |
| $1,000 to $1,499 | 177 (18.5%) | 0 (0.0%) |
| $1,500 to $1,999 | 59 (6.2%) | 0 (0.0%) |
| $2,000 to $2,499 | 0 (0.0%) | 0 (0.0%) |
| $2,500 to $2,999 | 0 (0.0%) | 0 (0.0%) |
| $3,000 or more | 0 (0.0%) | 0 (0.0%) |
| Total | 958 (100.0%) | 162 (100.0%) |
Physical Housing Characteristics in Progreso
Housing Structures in Progreso
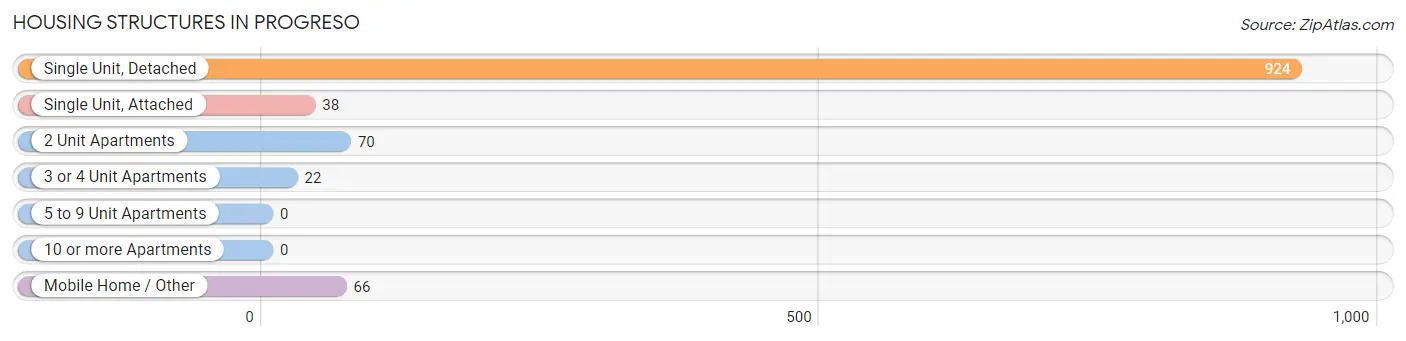
| Structure Type | # Housing Units | % Housing Units |
| Single Unit, Detached | 924 | 82.5% |
| Single Unit, Attached | 38 | 3.4% |
| 2 Unit Apartments | 70 | 6.2% |
| 3 or 4 Unit Apartments | 22 | 2.0% |
| 5 to 9 Unit Apartments | 0 | 0.0% |
| 10 or more Apartments | 0 | 0.0% |
| Mobile Home / Other | 66 | 5.9% |
| Total | 1,120 | 100.0% |
Housing Structures by Occupancy in Progreso
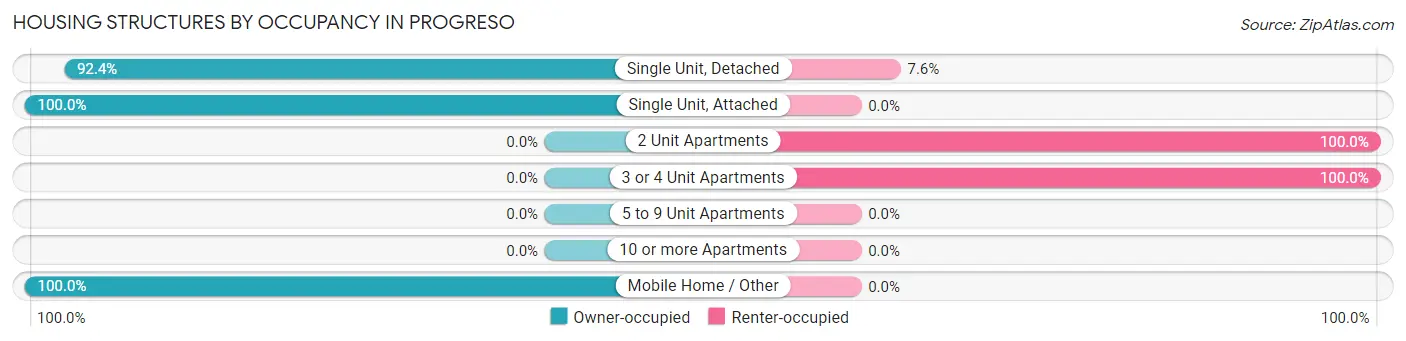
| Structure Type | Owner-occupied | Renter-occupied |
| Single Unit, Detached | 854 (92.4%) | 70 (7.6%) |
| Single Unit, Attached | 38 (100.0%) | 0 (0.0%) |
| 2 Unit Apartments | 0 (0.0%) | 70 (100.0%) |
| 3 or 4 Unit Apartments | 0 (0.0%) | 22 (100.0%) |
| 5 to 9 Unit Apartments | 0 (0.0%) | 0 (0.0%) |
| 10 or more Apartments | 0 (0.0%) | 0 (0.0%) |
| Mobile Home / Other | 66 (100.0%) | 0 (0.0%) |
| Total | 958 (85.5%) | 162 (14.5%) |
Housing Structures by Number of Rooms in Progreso
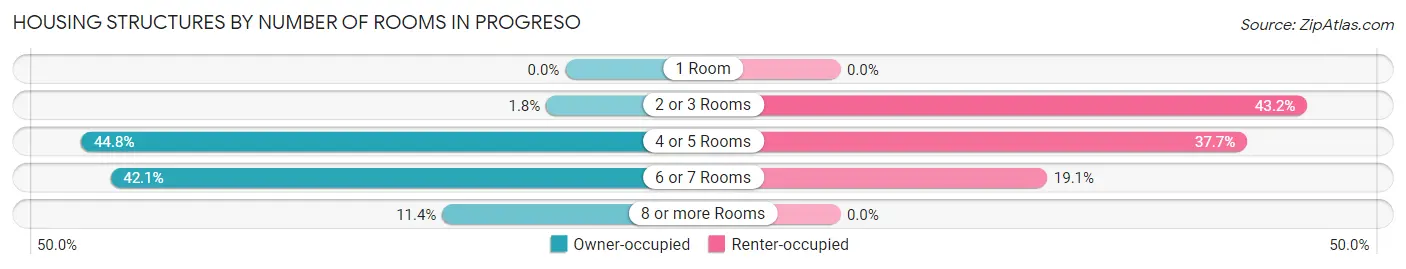
| Number of Rooms | Owner-occupied | Renter-occupied |
| 1 Room | 0 (0.0%) | 0 (0.0%) |
| 2 or 3 Rooms | 17 (1.8%) | 70 (43.2%) |
| 4 or 5 Rooms | 429 (44.8%) | 61 (37.7%) |
| 6 or 7 Rooms | 403 (42.1%) | 31 (19.1%) |
| 8 or more Rooms | 109 (11.4%) | 0 (0.0%) |
| Total | 958 (100.0%) | 162 (100.0%) |
Housing Structure by Heating Type in Progreso
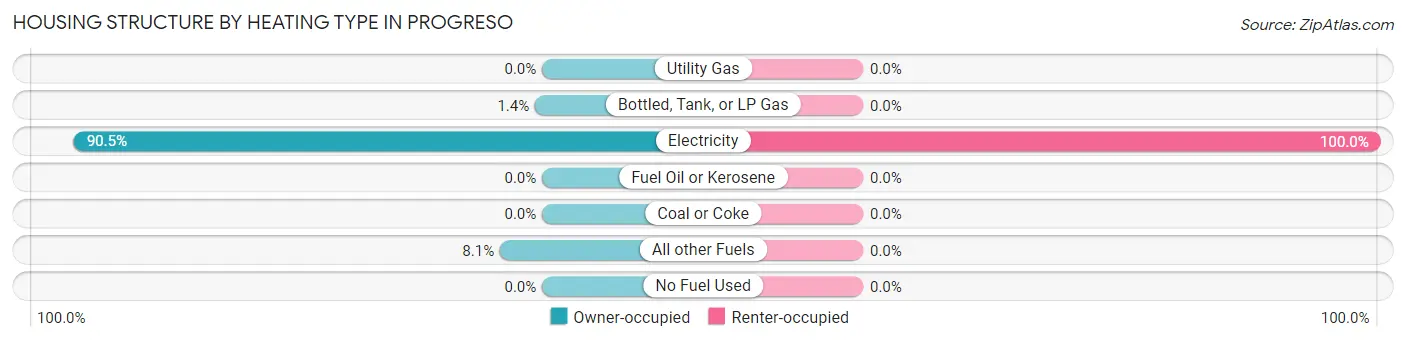
| Heating Type | Owner-occupied | Renter-occupied |
| Utility Gas | 0 (0.0%) | 0 (0.0%) |
| Bottled, Tank, or LP Gas | 13 (1.4%) | 0 (0.0%) |
| Electricity | 867 (90.5%) | 162 (100.0%) |
| Fuel Oil or Kerosene | 0 (0.0%) | 0 (0.0%) |
| Coal or Coke | 0 (0.0%) | 0 (0.0%) |
| All other Fuels | 78 (8.1%) | 0 (0.0%) |
| No Fuel Used | 0 (0.0%) | 0 (0.0%) |
| Total | 958 (100.0%) | 162 (100.0%) |
Household Vehicle Usage in Progreso
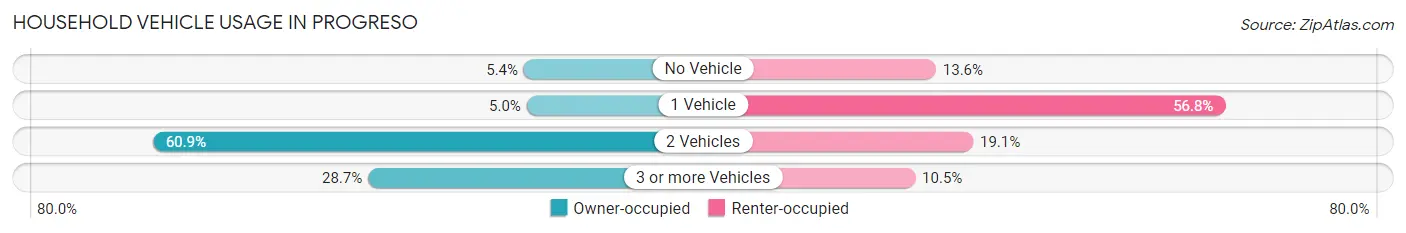
| Vehicles per Household | Owner-occupied | Renter-occupied |
| No Vehicle | 52 (5.4%) | 22 (13.6%) |
| 1 Vehicle | 48 (5.0%) | 92 (56.8%) |
| 2 Vehicles | 583 (60.9%) | 31 (19.1%) |
| 3 or more Vehicles | 275 (28.7%) | 17 (10.5%) |
| Total | 958 (100.0%) | 162 (100.0%) |
Real Estate & Mortgages in Progreso
Real Estate and Mortgage Overview in Progreso
| Characteristic | Without Mortgage | With Mortgage |
| Housing Units | 694 | 264 |
| Median Property Value | $48,200 | $151,600 |
| Median Household Income | $27,014 | $0 |
| Monthly Housing Costs | $440 | $0 |
| Real Estate Taxes | $887 | $0 |
Property Value by Mortgage Status in Progreso
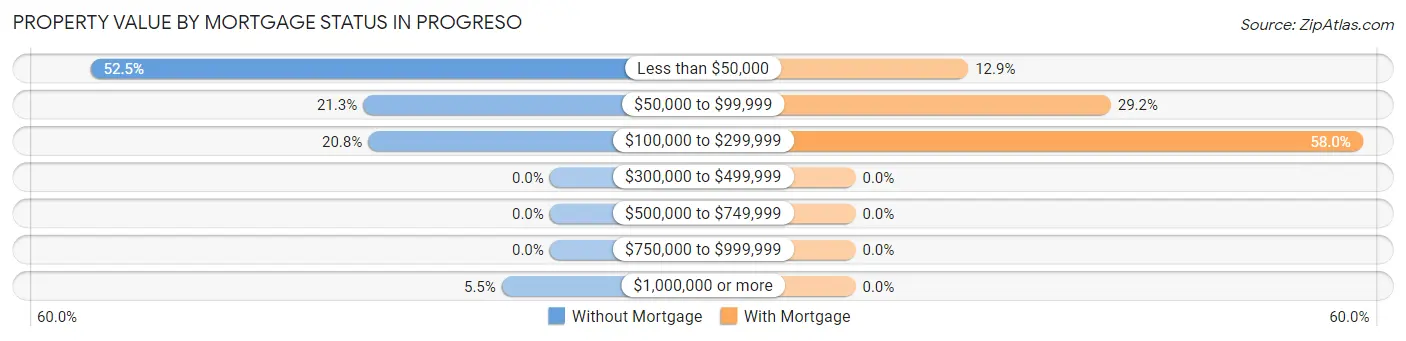
| Property Value | Without Mortgage | With Mortgage |
| Less than $50,000 | 364 (52.4%) | 34 (12.9%) |
| $50,000 to $99,999 | 148 (21.3%) | 77 (29.2%) |
| $100,000 to $299,999 | 144 (20.7%) | 153 (58.0%) |
| $300,000 to $499,999 | 0 (0.0%) | 0 (0.0%) |
| $500,000 to $749,999 | 0 (0.0%) | 0 (0.0%) |
| $750,000 to $999,999 | 0 (0.0%) | 0 (0.0%) |
| $1,000,000 or more | 38 (5.5%) | 0 (0.0%) |
| Total | 694 (100.0%) | 264 (100.0%) |
Household Income by Mortgage Status in Progreso
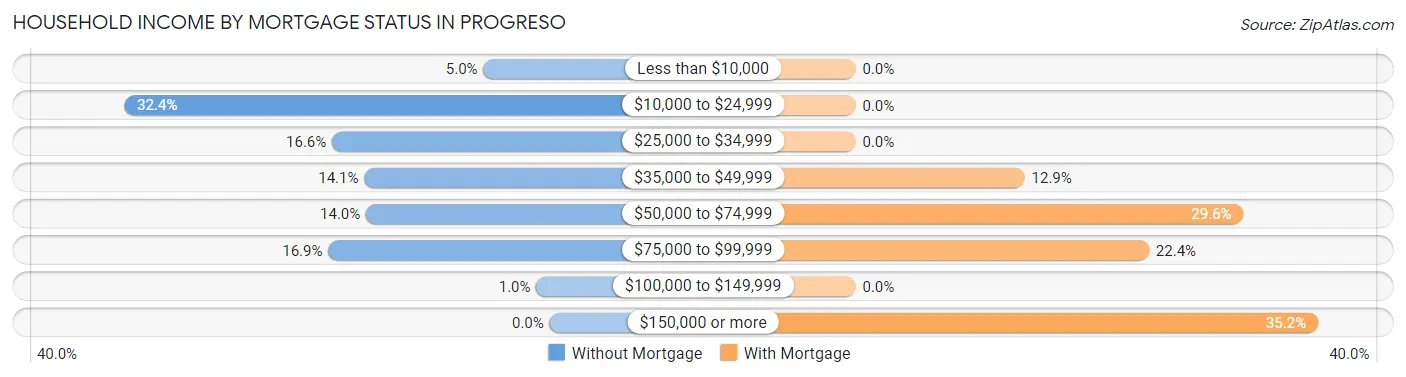
| Household Income | Without Mortgage | With Mortgage |
| Less than $10,000 | 35 (5.0%) | 0 (0.0%) |
| $10,000 to $24,999 | 225 (32.4%) | 0 (0.0%) |
| $25,000 to $34,999 | 115 (16.6%) | 0 (0.0%) |
| $35,000 to $49,999 | 98 (14.1%) | 34 (12.9%) |
| $50,000 to $74,999 | 97 (14.0%) | 78 (29.5%) |
| $75,000 to $99,999 | 117 (16.9%) | 59 (22.4%) |
| $100,000 to $149,999 | 7 (1.0%) | 0 (0.0%) |
| $150,000 or more | 0 (0.0%) | 93 (35.2%) |
| Total | 694 (100.0%) | 264 (100.0%) |
Property Value to Household Income Ratio in Progreso
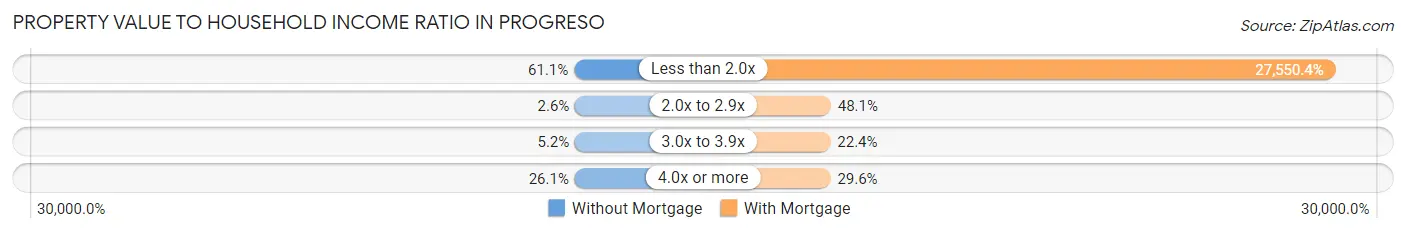
| Value-to-Income Ratio | Without Mortgage | With Mortgage |
| Less than 2.0x | 424 (61.1%) | 72,733 (27,550.4%) |
| 2.0x to 2.9x | 18 (2.6%) | 127 (48.1%) |
| 3.0x to 3.9x | 36 (5.2%) | 59 (22.4%) |
| 4.0x or more | 181 (26.1%) | 78 (29.5%) |
| Total | 694 (100.0%) | 264 (100.0%) |
Real Estate Taxes by Mortgage Status in Progreso
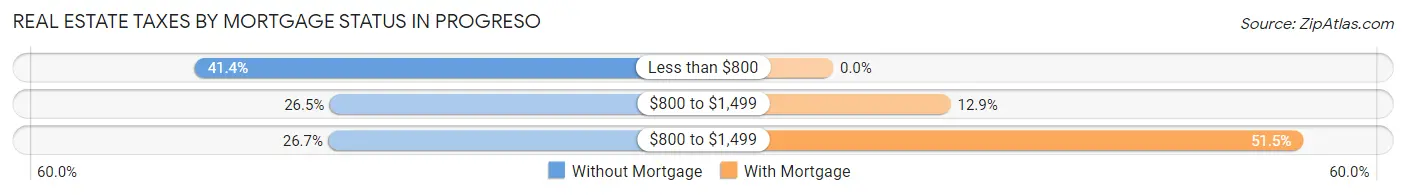
| Property Taxes | Without Mortgage | With Mortgage |
| Less than $800 | 287 (41.3%) | 0 (0.0%) |
| $800 to $1,499 | 184 (26.5%) | 34 (12.9%) |
| $800 to $1,499 | 185 (26.7%) | 136 (51.5%) |
| Total | 694 (100.0%) | 264 (100.0%) |
Health & Disability in Progreso
Health Insurance Coverage by Age in Progreso
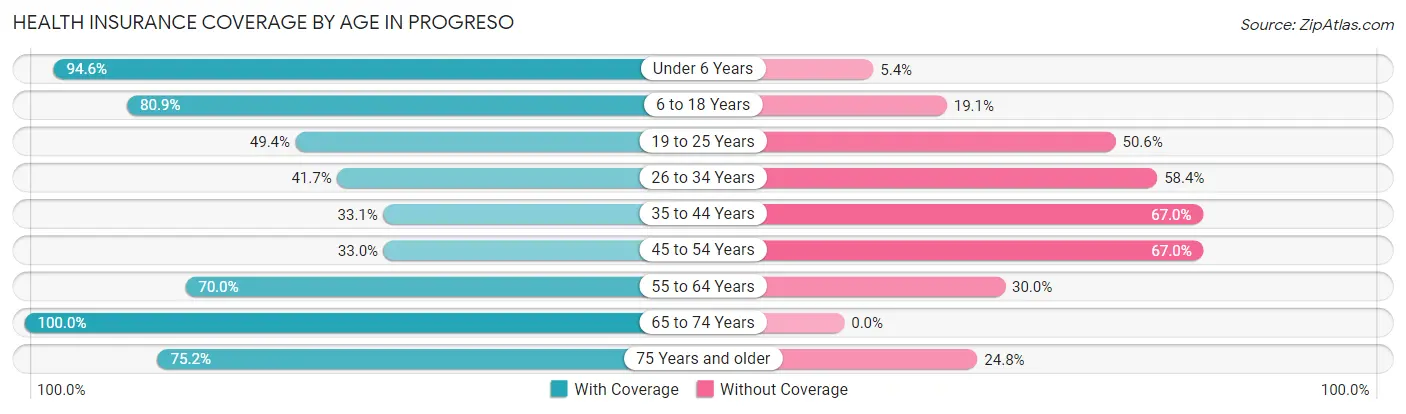
| Age Bracket | With Coverage | Without Coverage |
| Under 6 Years | 611 (94.6%) | 35 (5.4%) |
| 6 to 18 Years | 1,015 (80.9%) | 240 (19.1%) |
| 19 to 25 Years | 210 (49.4%) | 215 (50.6%) |
| 26 to 34 Years | 162 (41.6%) | 227 (58.4%) |
| 35 to 44 Years | 193 (33.1%) | 391 (66.9%) |
| 45 to 54 Years | 266 (33.0%) | 540 (67.0%) |
| 55 to 64 Years | 229 (70.0%) | 98 (30.0%) |
| 65 to 74 Years | 341 (100.0%) | 0 (0.0%) |
| 75 Years and older | 106 (75.2%) | 35 (24.8%) |
| Total | 3,133 (63.8%) | 1,781 (36.2%) |
Health Insurance Coverage by Citizenship Status in Progreso
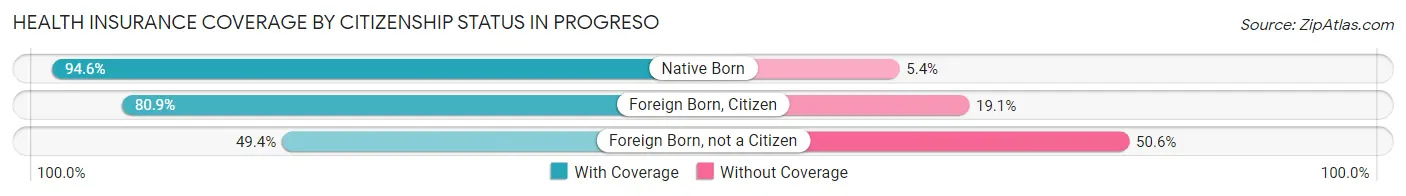
| Citizenship Status | With Coverage | Without Coverage |
| Native Born | 611 (94.6%) | 35 (5.4%) |
| Foreign Born, Citizen | 1,015 (80.9%) | 240 (19.1%) |
| Foreign Born, not a Citizen | 210 (49.4%) | 215 (50.6%) |
Health Insurance Coverage by Household Income in Progreso
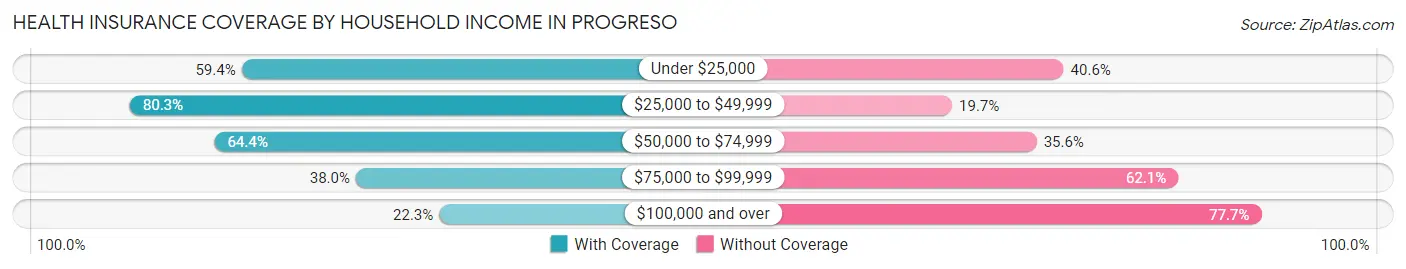
| Household Income | With Coverage | Without Coverage |
| Under $25,000 | 624 (59.4%) | 427 (40.6%) |
| $25,000 to $49,999 | 1,371 (80.3%) | 337 (19.7%) |
| $50,000 to $74,999 | 907 (64.4%) | 501 (35.6%) |
| $75,000 to $99,999 | 137 (38.0%) | 224 (62.1%) |
| $100,000 and over | 84 (22.3%) | 292 (77.7%) |
Public vs Private Health Insurance Coverage by Age in Progreso
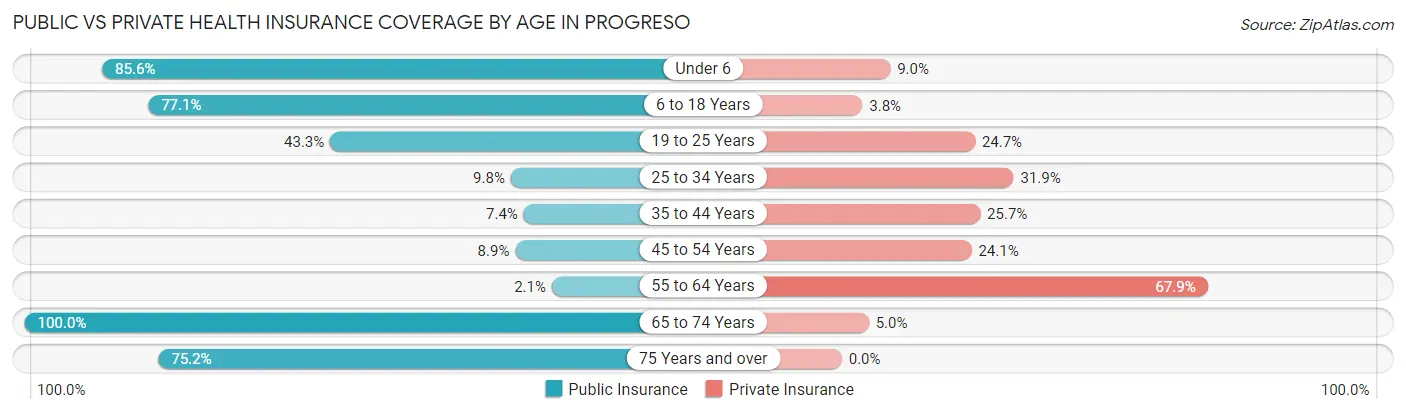
| Age Bracket | Public Insurance | Private Insurance |
| Under 6 | 553 (85.6%) | 58 (9.0%) |
| 6 to 18 Years | 967 (77.0%) | 48 (3.8%) |
| 19 to 25 Years | 184 (43.3%) | 105 (24.7%) |
| 25 to 34 Years | 38 (9.8%) | 124 (31.9%) |
| 35 to 44 Years | 43 (7.4%) | 150 (25.7%) |
| 45 to 54 Years | 72 (8.9%) | 194 (24.1%) |
| 55 to 64 Years | 7 (2.1%) | 222 (67.9%) |
| 65 to 74 Years | 341 (100.0%) | 17 (5.0%) |
| 75 Years and over | 106 (75.2%) | 0 (0.0%) |
| Total | 2,311 (47.0%) | 918 (18.7%) |
Disability Status by Sex by Age in Progreso
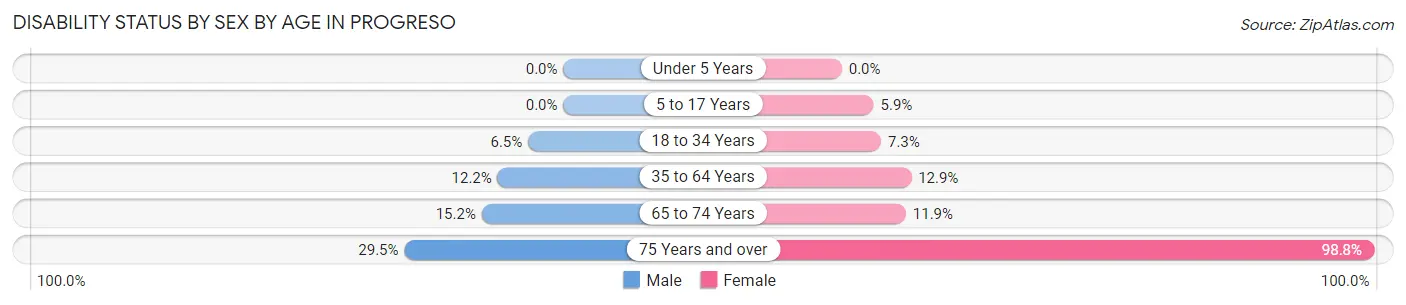
| Age Bracket | Male | Female |
| Under 5 Years | 0 (0.0%) | 0 (0.0%) |
| 5 to 17 Years | 0 (0.0%) | 38 (5.9%) |
| 18 to 34 Years | 27 (6.5%) | 35 (7.3%) |
| 35 to 64 Years | 93 (12.2%) | 123 (12.9%) |
| 65 to 74 Years | 30 (15.1%) | 17 (11.9%) |
| 75 Years and over | 18 (29.5%) | 79 (98.8%) |
Disability Class by Sex by Age in Progreso
Disability Class: Hearing Difficulty
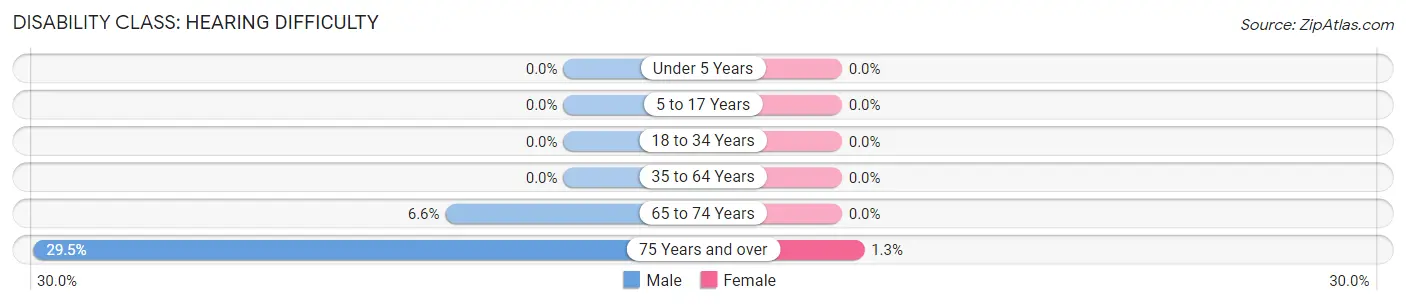
| Age Bracket | Male | Female |
| Under 5 Years | 0 (0.0%) | 0 (0.0%) |
| 5 to 17 Years | 0 (0.0%) | 0 (0.0%) |
| 18 to 34 Years | 0 (0.0%) | 0 (0.0%) |
| 35 to 64 Years | 0 (0.0%) | 0 (0.0%) |
| 65 to 74 Years | 13 (6.6%) | 0 (0.0%) |
| 75 Years and over | 18 (29.5%) | 1 (1.3%) |
Disability Class: Vision Difficulty
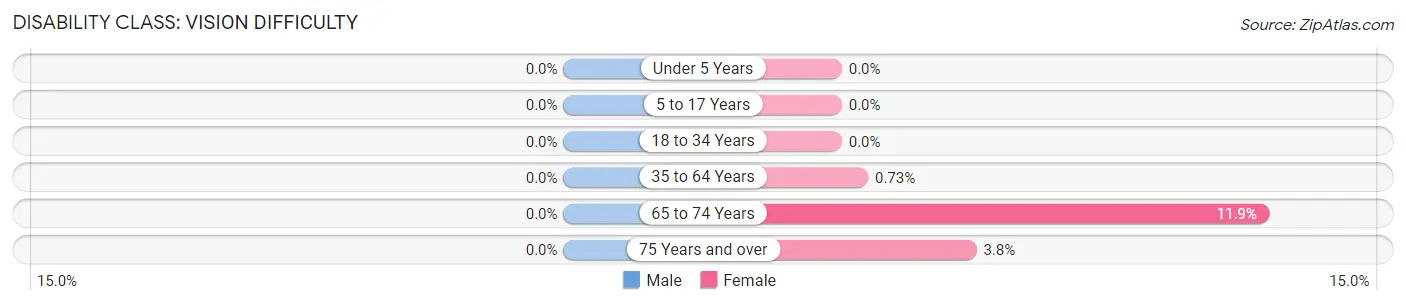
| Age Bracket | Male | Female |
| Under 5 Years | 0 (0.0%) | 0 (0.0%) |
| 5 to 17 Years | 0 (0.0%) | 0 (0.0%) |
| 18 to 34 Years | 0 (0.0%) | 0 (0.0%) |
| 35 to 64 Years | 0 (0.0%) | 7 (0.7%) |
| 65 to 74 Years | 0 (0.0%) | 17 (11.9%) |
| 75 Years and over | 0 (0.0%) | 3 (3.7%) |
Disability Class: Cognitive Difficulty
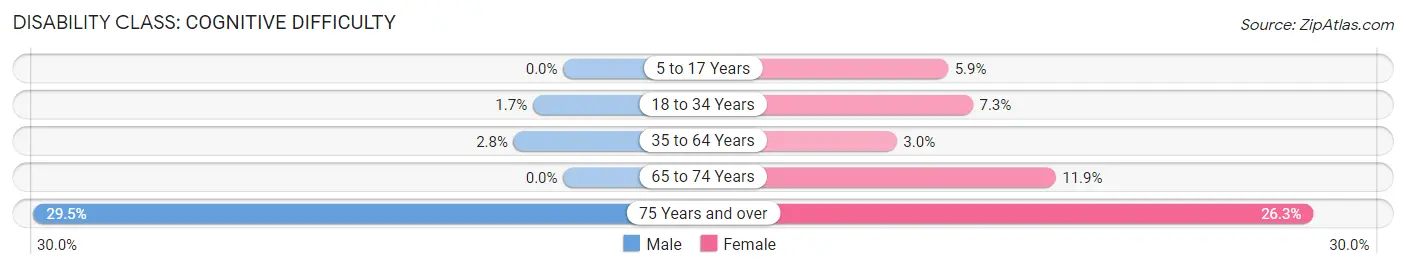
| Age Bracket | Male | Female |
| 5 to 17 Years | 0 (0.0%) | 38 (5.9%) |
| 18 to 34 Years | 7 (1.7%) | 35 (7.3%) |
| 35 to 64 Years | 21 (2.8%) | 29 (3.0%) |
| 65 to 74 Years | 0 (0.0%) | 17 (11.9%) |
| 75 Years and over | 18 (29.5%) | 21 (26.3%) |
Disability Class: Ambulatory Difficulty
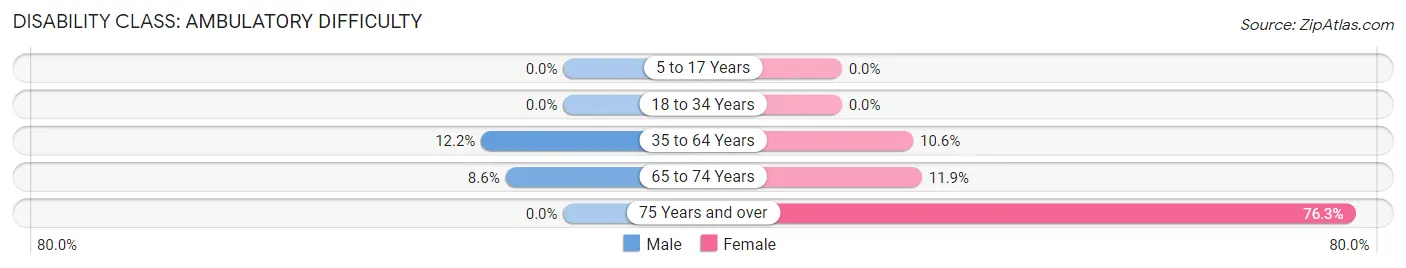
| Age Bracket | Male | Female |
| 5 to 17 Years | 0 (0.0%) | 0 (0.0%) |
| 18 to 34 Years | 0 (0.0%) | 0 (0.0%) |
| 35 to 64 Years | 93 (12.2%) | 101 (10.6%) |
| 65 to 74 Years | 17 (8.6%) | 17 (11.9%) |
| 75 Years and over | 0 (0.0%) | 61 (76.2%) |
Disability Class: Self-Care Difficulty
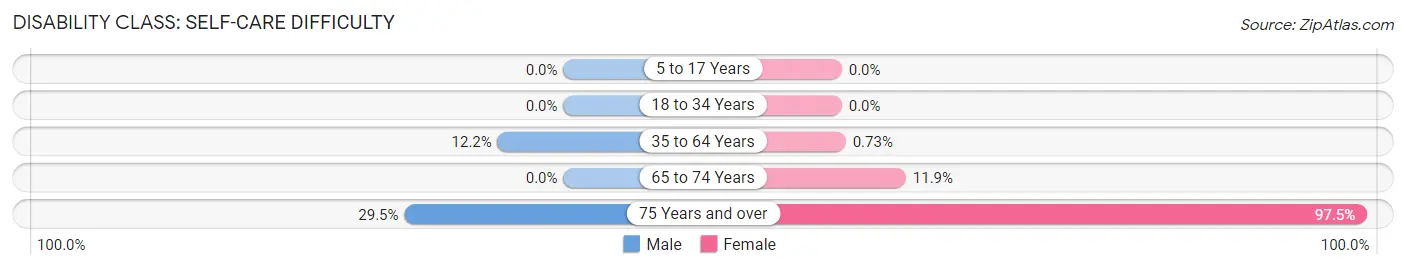
| Age Bracket | Male | Female |
| 5 to 17 Years | 0 (0.0%) | 0 (0.0%) |
| 18 to 34 Years | 0 (0.0%) | 0 (0.0%) |
| 35 to 64 Years | 93 (12.2%) | 7 (0.7%) |
| 65 to 74 Years | 0 (0.0%) | 17 (11.9%) |
| 75 Years and over | 18 (29.5%) | 78 (97.5%) |
Technology Access in Progreso
Computing Device Access in Progreso
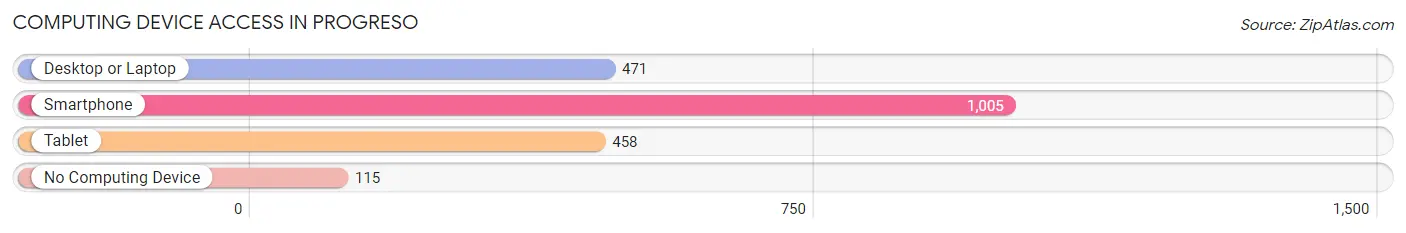
| Device Type | # Households | % Households |
| Desktop or Laptop | 471 | 42.0% |
| Smartphone | 1,005 | 89.7% |
| Tablet | 458 | 40.9% |
| No Computing Device | 115 | 10.3% |
| Total | 1,120 | 100.0% |
Internet Access in Progreso
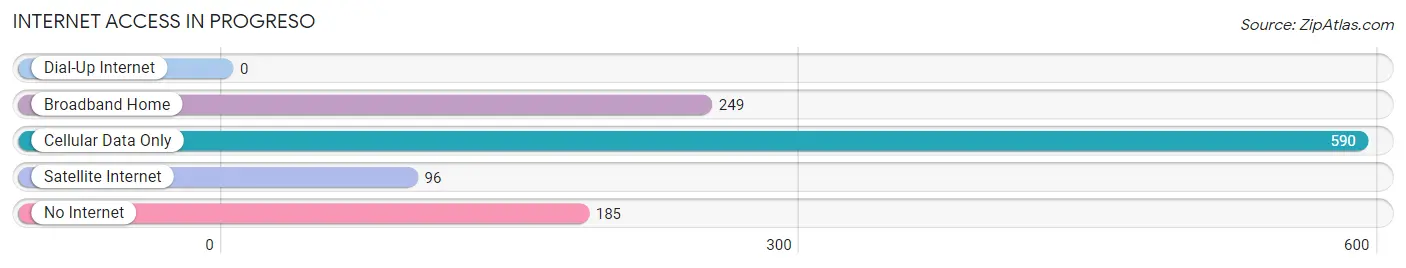
| Internet Type | # Households | % Households |
| Dial-Up Internet | 0 | 0.0% |
| Broadband Home | 249 | 22.2% |
| Cellular Data Only | 590 | 52.7% |
| Satellite Internet | 96 | 8.6% |
| No Internet | 185 | 16.5% |
| Total | 1,120 | 100.0% |
Progreso Summary
Progreso, Texas is a small town located in Hidalgo County, Texas, United States. It is situated on the banks of the Rio Grande, just across the border from Mexico. The town has a population of approximately 8,000 people and is part of the McAllen-Edinburg-Mission Metropolitan Statistical Area.
History
The area that is now Progreso was originally inhabited by the Coahuiltecan Indians. The first European settlers arrived in the area in the late 1700s, and the town was officially founded in 1848. The town was originally named Progreso de la Frontera, which translates to “Progress of the Frontier”. The town was renamed Progreso in 1852.
In the late 1800s, Progreso was a bustling port town, with a large number of ships coming in and out of the harbor. The town was also a major center for the production of cotton and other agricultural products.
In the early 1900s, Progreso experienced a period of rapid growth, as the population increased from 1,000 to over 5,000. This growth was largely due to the influx of Mexican immigrants, who were attracted to the area by the promise of work in the agricultural industry.
In the mid-1900s, Progreso experienced a period of decline, as the population decreased and the economy stagnated. This decline was largely due to the closure of the port and the decline of the agricultural industry.
Geography
Progreso is located in Hidalgo County, Texas, United States. It is situated on the banks of the Rio Grande, just across the border from Mexico. The town has a total area of 1.3 square miles, all of which is land.
The climate in Progreso is classified as humid subtropical, with hot summers and mild winters. The average temperature in the summer is around 90°F, and the average temperature in the winter is around 60°F.
Economy
The economy of Progreso is largely based on agriculture and tourism. The town is home to a number of farms, which produce a variety of crops, including cotton, corn, and sorghum. The town is also home to a number of tourist attractions, including the Progreso International Bridge, which connects the town to Mexico.
In addition to agriculture and tourism, Progreso is home to a number of small businesses, including restaurants, shops, and other services. The town is also home to a number of manufacturing companies, which produce a variety of products, including furniture, clothing, and electronics.
Demographics
As of the 2010 census, Progreso had a population of 8,000 people. The racial makeup of the town was 79.3% Hispanic or Latino, 16.2% White, 1.2% African American, 0.7% Native American, 0.3% Asian, and 2.5% from other races.
The median household income in Progreso was $25,000, and the median family income was $30,000. The per capita income in Progreso was $12,000. Approximately 25.3% of the population was below the poverty line.
Common Questions
What is Per Capita Income in Progreso?
Per Capita income in Progreso is $12,156.
What is the Median Family Income in Progreso?
Median Family Income in Progreso is $39,247.
What is the Median Household income in Progreso?
Median Household Income in Progreso is $38,686.
What is Income or Wage Gap in Progreso?
Income or Wage Gap in Progreso is 50.9%.
Women in Progreso earn 49.1 cents for every dollar earned by a man.
What is Inequality or Gini Index in Progreso?
Inequality or Gini Index in Progreso is 0.38.
What is the Total Population of Progreso?
Total Population of Progreso is 4,914.
What is the Total Male Population of Progreso?
Total Male Population of Progreso is 2,463.
What is the Total Female Population of Progreso?
Total Female Population of Progreso is 2,451.
What is the Ratio of Males per 100 Females in Progreso?
There are 100.49 Males per 100 Females in Progreso.
What is the Ratio of Females per 100 Males in Progreso?
There are 99.51 Females per 100 Males in Progreso.
What is the Median Population Age in Progreso?
Median Population Age in Progreso is 28.6 Years.
What is the Average Family Size in Progreso
Average Family Size in Progreso is 4.4 People.
What is the Average Household Size in Progreso
Average Household Size in Progreso is 4.4 People.
How Large is the Labor Force in Progreso?
There are 2,008 People in the Labor Forcein in Progreso.
What is the Percentage of People in the Labor Force in Progreso?
62.5% of People are in the Labor Force in Progreso.
What is the Unemployment Rate in Progreso?
Unemployment Rate in Progreso is 6.2%.