Port Neches, TX Map & Demographics
Port Neches Map
Port Neches Overview
$44,238
PER CAPITA INCOME
$99,032
AVG FAMILY INCOME
$85,086
AVG HOUSEHOLD INCOME
44.6%
WAGE / INCOME GAP [ % ]
55.4¢/ $1
WAGE / INCOME GAP [ $ ]
0.42
INEQUALITY / GINI INDEX
13,635
TOTAL POPULATION
6,718
MALE POPULATION
6,917
FEMALE POPULATION
97.12
MALES / 100 FEMALES
102.96
FEMALES / 100 MALES
39.0
MEDIAN AGE
3.2
AVG FAMILY SIZE
2.8
AVG HOUSEHOLD SIZE
6,749
LABOR FORCE [ PEOPLE ]
63.6%
PERCENT IN LABOR FORCE
5.3%
UNEMPLOYMENT RATE
Port Neches Zip Codes
Port Neches Area Codes
Income in Port Neches
Income Overview in Port Neches
Per Capita Income in Port Neches is $44,238, while median incomes of families and households are $99,032 and $85,086 respectively.
| Characteristic | Number | Measure |
| Per Capita Income | 13,635 | $44,238 |
| Median Family Income | 3,363 | $99,032 |
| Mean Family Income | 3,363 | $132,931 |
| Median Household Income | 4,936 | $85,086 |
| Mean Household Income | 4,936 | $119,272 |
| Income Deficit | 3,363 | $0 |
| Wage / Income Gap (%) | 13,635 | 44.59% |
| Wage / Income Gap ($) | 13,635 | 55.41¢ per $1 |
| Gini / Inequality Index | 13,635 | 0.42 |
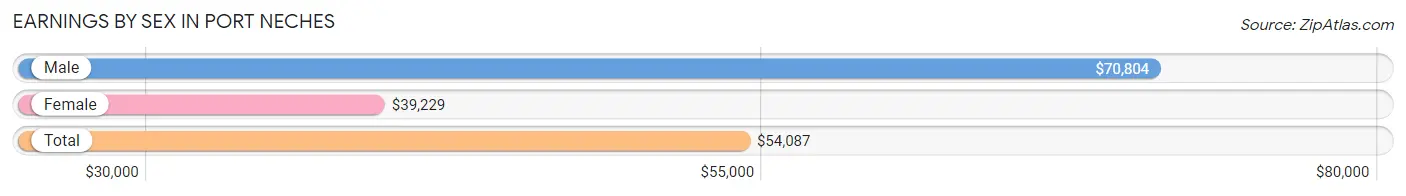
Earnings by Sex in Port Neches
Average Earnings in Port Neches are $54,087, $70,804 for men and $39,229 for women, a difference of 44.6%.
| Sex | Number | Average Earnings |
| Male | 3,711 (54.4%) | $70,804 |
| Female | 3,109 (45.6%) | $39,229 |
| Total | 6,820 (100.0%) | $54,087 |
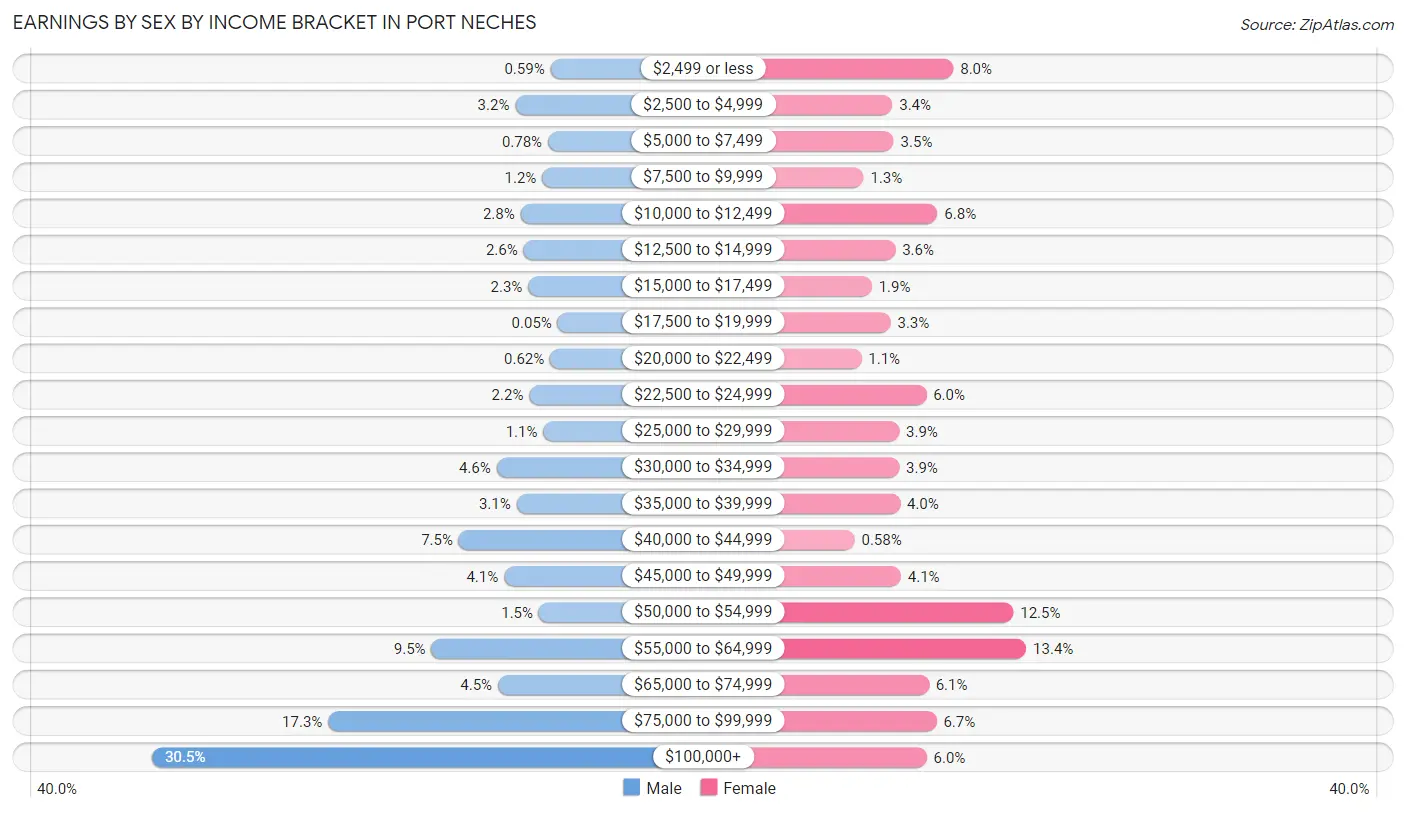
Earnings by Sex by Income Bracket in Port Neches
The most common earnings brackets in Port Neches are $100,000+ for men (1,130 | 30.4%) and $55,000 to $64,999 for women (418 | 13.4%).
| Income | Male | Female |
| $2,499 or less | 22 (0.6%) | 248 (8.0%) |
| $2,500 to $4,999 | 120 (3.2%) | 106 (3.4%) |
| $5,000 to $7,499 | 29 (0.8%) | 109 (3.5%) |
| $7,500 to $9,999 | 45 (1.2%) | 39 (1.3%) |
| $10,000 to $12,499 | 105 (2.8%) | 211 (6.8%) |
| $12,500 to $14,999 | 97 (2.6%) | 113 (3.6%) |
| $15,000 to $17,499 | 84 (2.3%) | 58 (1.9%) |
| $17,500 to $19,999 | 2 (0.1%) | 102 (3.3%) |
| $20,000 to $22,499 | 23 (0.6%) | 34 (1.1%) |
| $22,500 to $24,999 | 81 (2.2%) | 185 (5.9%) |
| $25,000 to $29,999 | 42 (1.1%) | 122 (3.9%) |
| $30,000 to $34,999 | 172 (4.6%) | 122 (3.9%) |
| $35,000 to $39,999 | 116 (3.1%) | 124 (4.0%) |
| $40,000 to $44,999 | 277 (7.5%) | 18 (0.6%) |
| $45,000 to $49,999 | 151 (4.1%) | 126 (4.1%) |
| $50,000 to $54,999 | 54 (1.5%) | 388 (12.5%) |
| $55,000 to $64,999 | 353 (9.5%) | 418 (13.4%) |
| $65,000 to $74,999 | 168 (4.5%) | 191 (6.1%) |
| $75,000 to $99,999 | 640 (17.2%) | 209 (6.7%) |
| $100,000+ | 1,130 (30.4%) | 186 (6.0%) |
| Total | 3,711 (100.0%) | 3,109 (100.0%) |
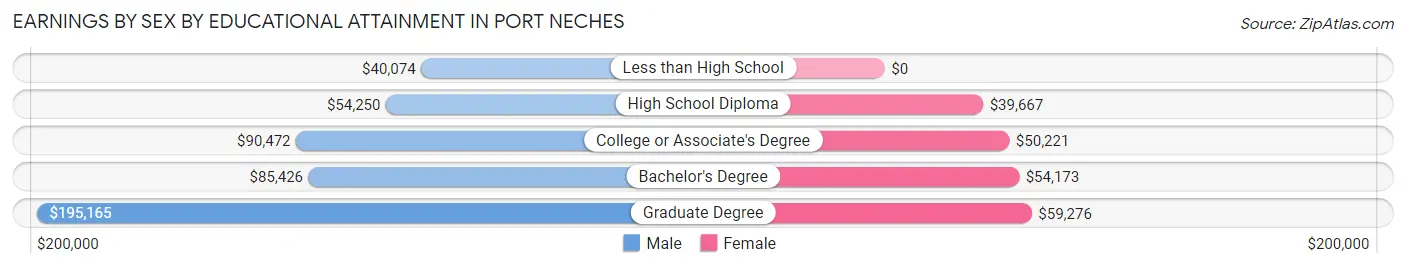
Earnings by Sex by Educational Attainment in Port Neches
Average earnings in Port Neches are $78,615 for men and $50,325 for women, a difference of 36.0%. Men with an educational attainment of graduate degree enjoy the highest average annual earnings of $195,165, while those with less than high school education earn the least with $40,074. Women with an educational attainment of graduate degree earn the most with the average annual earnings of $59,276, while those with high school diploma education have the smallest earnings of $39,667.
| Educational Attainment | Male Income | Female Income |
| Less than High School | $40,074 | $0 |
| High School Diploma | $54,250 | $39,667 |
| College or Associate's Degree | $90,472 | $50,221 |
| Bachelor's Degree | $85,426 | $54,173 |
| Graduate Degree | $195,165 | $59,276 |
| Total | $78,615 | $50,325 |
Family Income in Port Neches
Family Income Brackets in Port Neches
According to the Port Neches family income data, there are 686 families falling into the $200,000+ income range, which is the most common income bracket and makes up 20.4% of all families. Conversely, the $10,000 to $14,999 income bracket is the least frequent group with only 20 families (0.6%) belonging to this category.
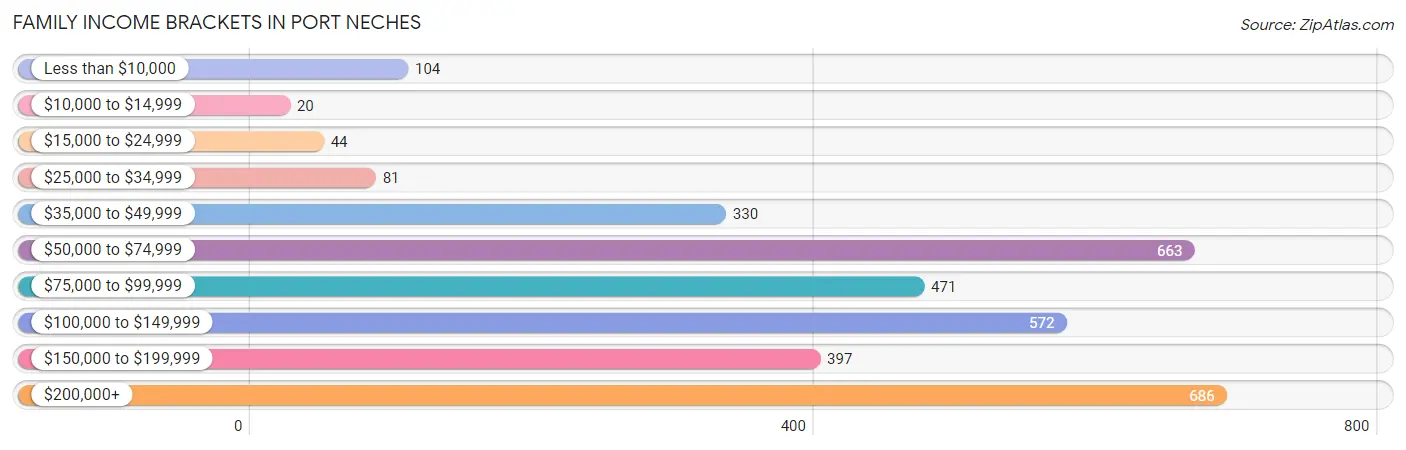
| Income Bracket | # Families | % Families |
| Less than $10,000 | 104 | 3.1% |
| $10,000 to $14,999 | 20 | 0.6% |
| $15,000 to $24,999 | 44 | 1.3% |
| $25,000 to $34,999 | 81 | 2.4% |
| $35,000 to $49,999 | 330 | 9.8% |
| $50,000 to $74,999 | 663 | 19.7% |
| $75,000 to $99,999 | 471 | 14.0% |
| $100,000 to $149,999 | 572 | 17.0% |
| $150,000 to $199,999 | 397 | 11.8% |
| $200,000+ | 686 | 20.4% |
Family Income by Famaliy Size in Port Neches
6-person families (88 | 2.6%) account for the highest median family income in Port Neches with $153,387 per family, while 2-person families (1,491 | 44.3%) have the highest median income of $40,748 per family member.
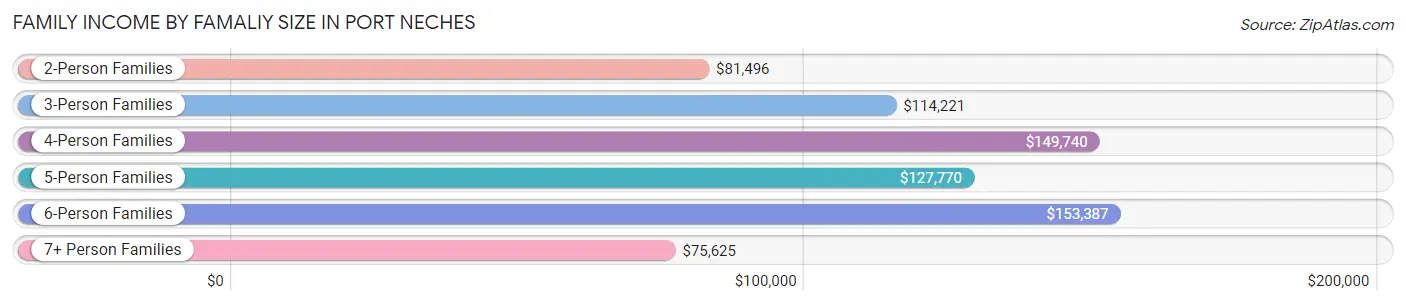
| Income Bracket | # Families | Median Income |
| 2-Person Families | 1,491 (44.3%) | $81,496 |
| 3-Person Families | 862 (25.6%) | $114,221 |
| 4-Person Families | 475 (14.1%) | $149,740 |
| 5-Person Families | 417 (12.4%) | $127,770 |
| 6-Person Families | 88 (2.6%) | $153,387 |
| 7+ Person Families | 30 (0.9%) | $75,625 |
| Total | 3,363 (100.0%) | $99,032 |
Family Income by Number of Earners in Port Neches
The median family income in Port Neches is $99,032, with families comprising 2 earners (1,309) having the highest median family income of $148,516, while families with no earners (679) have the lowest median family income of $54,688, accounting for 38.9% and 20.2% of families, respectively.
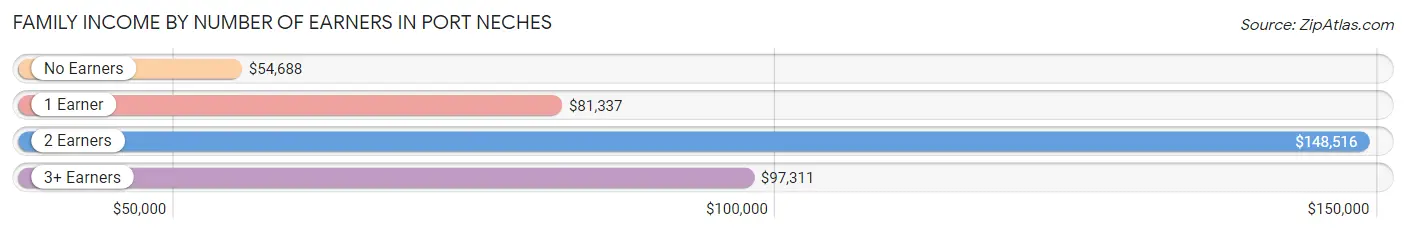
| Number of Earners | # Families | Median Income |
| No Earners | 679 (20.2%) | $54,688 |
| 1 Earner | 1,084 (32.2%) | $81,337 |
| 2 Earners | 1,309 (38.9%) | $148,516 |
| 3+ Earners | 291 (8.6%) | $97,311 |
| Total | 3,363 (100.0%) | $99,032 |
Household Income in Port Neches
Household Income Brackets in Port Neches
With 967 households falling in the category, the $50,000 to $74,999 income range is the most frequent in Port Neches, accounting for 19.6% of all households. In contrast, only 84 households (1.7%) fall into the $10,000 to $14,999 income bracket, making it the least populous group.
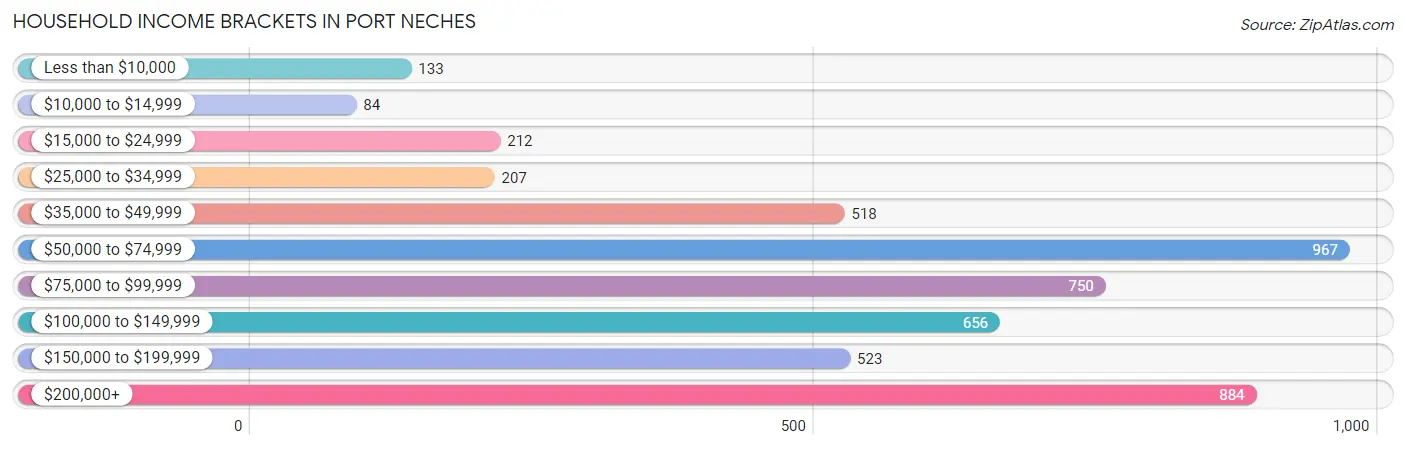
| Income Bracket | # Households | % Households |
| Less than $10,000 | 133 | 2.7% |
| $10,000 to $14,999 | 84 | 1.7% |
| $15,000 to $24,999 | 212 | 4.3% |
| $25,000 to $34,999 | 207 | 4.2% |
| $35,000 to $49,999 | 518 | 10.5% |
| $50,000 to $74,999 | 967 | 19.6% |
| $75,000 to $99,999 | 750 | 15.2% |
| $100,000 to $149,999 | 656 | 13.3% |
| $150,000 to $199,999 | 523 | 10.6% |
| $200,000+ | 884 | 17.9% |
Household Income by Householder Age in Port Neches
The median household income in Port Neches is $85,086, with the highest median household income of $110,750 found in the 45 to 64 years age bracket for the primary householder. A total of 1,679 households (34.0%) fall into this category. Meanwhile, the 15 to 24 years age bracket for the primary householder has the lowest median household income of $0, with 140 households (2.8%) in this group.
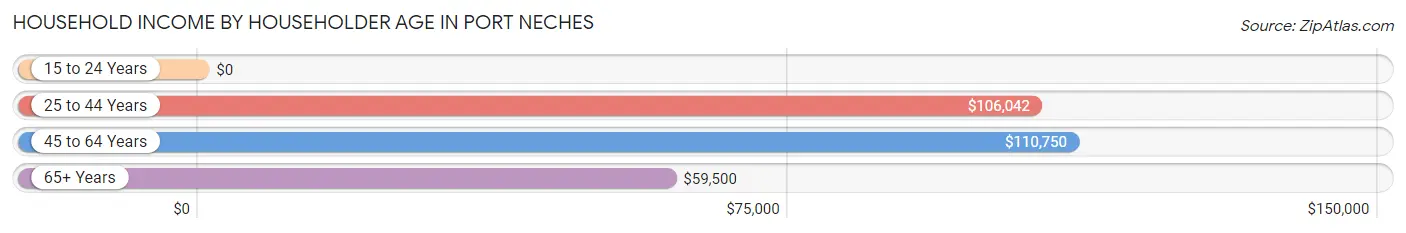
| Income Bracket | # Households | Median Income |
| 15 to 24 Years | 140 (2.8%) | $0 |
| 25 to 44 Years | 1,761 (35.7%) | $106,042 |
| 45 to 64 Years | 1,679 (34.0%) | $110,750 |
| 65+ Years | 1,356 (27.5%) | $59,500 |
| Total | 4,936 (100.0%) | $85,086 |
Poverty in Port Neches
Income Below Poverty by Sex and Age in Port Neches
With 6.0% poverty level for males and 11.1% for females among the residents of Port Neches, 25 to 34 year old males and 25 to 34 year old females are the most vulnerable to poverty, with 125 males (16.9%) and 267 females (35.7%) in their respective age groups living below the poverty level.
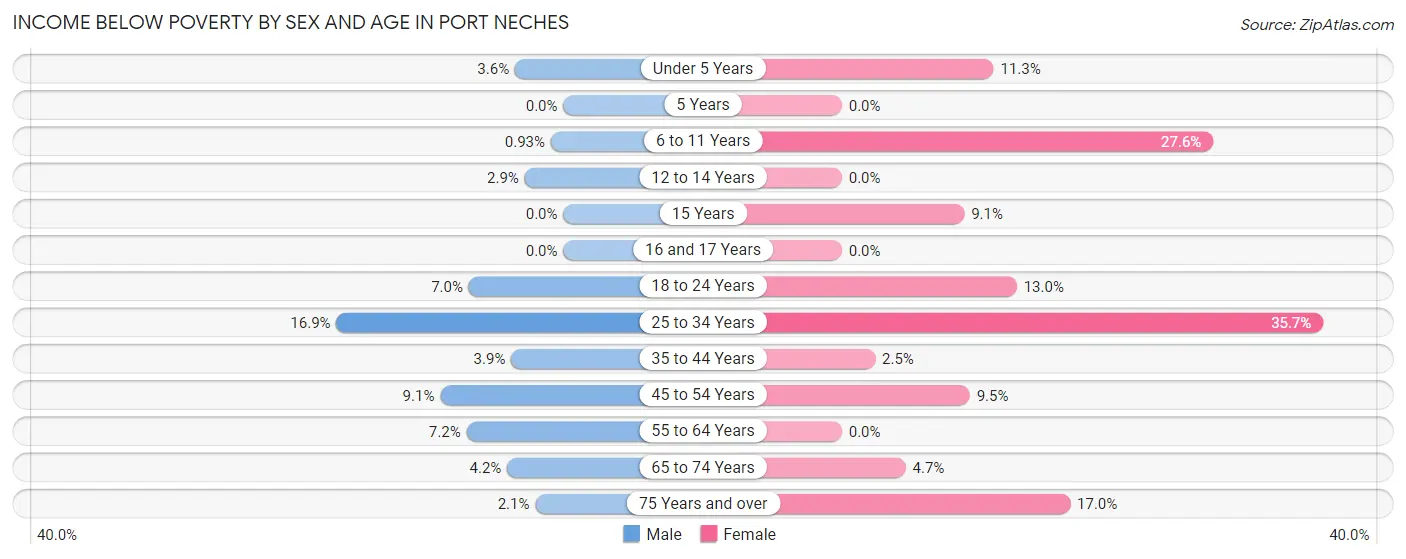
| Age Bracket | Male | Female |
| Under 5 Years | 16 (3.6%) | 54 (11.3%) |
| 5 Years | 0 (0.0%) | 0 (0.0%) |
| 6 to 11 Years | 5 (0.9%) | 158 (27.6%) |
| 12 to 14 Years | 8 (2.9%) | 0 (0.0%) |
| 15 Years | 0 (0.0%) | 11 (9.1%) |
| 16 and 17 Years | 0 (0.0%) | 0 (0.0%) |
| 18 to 24 Years | 34 (7.0%) | 69 (13.0%) |
| 25 to 34 Years | 125 (16.9%) | 267 (35.7%) |
| 35 to 44 Years | 51 (3.9%) | 30 (2.5%) |
| 45 to 54 Years | 69 (9.1%) | 51 (9.5%) |
| 55 to 64 Years | 65 (7.2%) | 0 (0.0%) |
| 65 to 74 Years | 21 (4.2%) | 34 (4.7%) |
| 75 Years and over | 9 (2.1%) | 80 (17.0%) |
| Total | 403 (6.0%) | 754 (11.1%) |
Income Above Poverty by Sex and Age in Port Neches
According to the poverty statistics in Port Neches, males aged 5 years and females aged 5 years are the age groups that are most secure financially, with 100.0% of males and 100.0% of females in these age groups living above the poverty line.
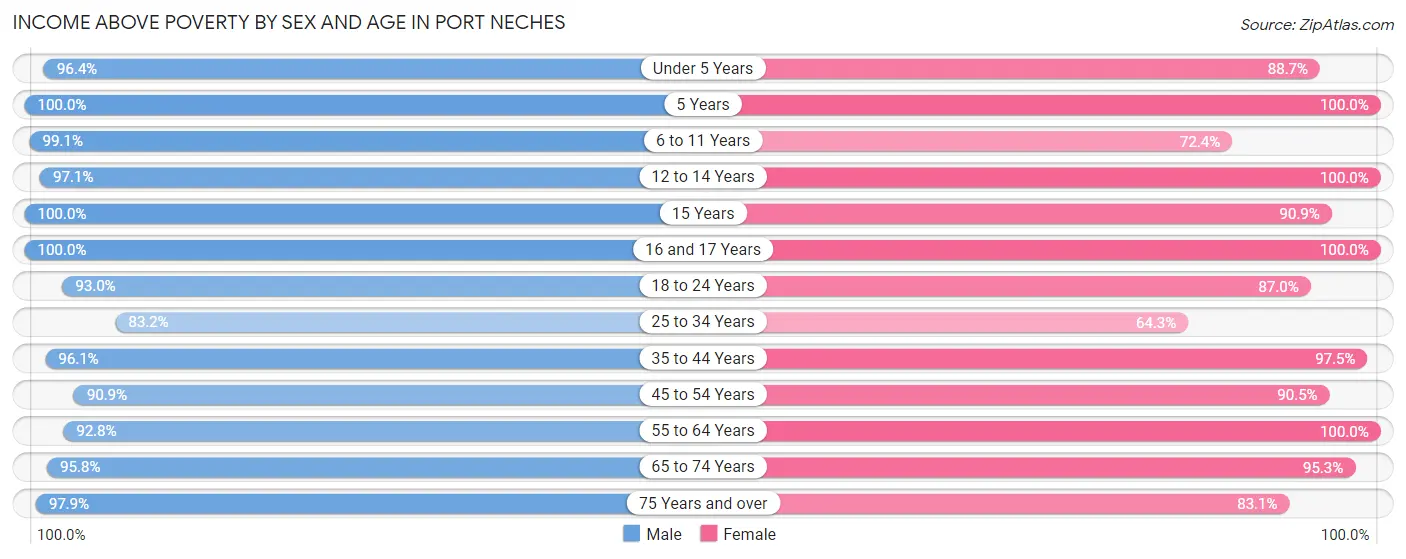
| Age Bracket | Male | Female |
| Under 5 Years | 430 (96.4%) | 425 (88.7%) |
| 5 Years | 49 (100.0%) | 49 (100.0%) |
| 6 to 11 Years | 530 (99.1%) | 415 (72.4%) |
| 12 to 14 Years | 271 (97.1%) | 276 (100.0%) |
| 15 Years | 106 (100.0%) | 110 (90.9%) |
| 16 and 17 Years | 155 (100.0%) | 194 (100.0%) |
| 18 to 24 Years | 450 (93.0%) | 462 (87.0%) |
| 25 to 34 Years | 617 (83.2%) | 480 (64.3%) |
| 35 to 44 Years | 1,266 (96.1%) | 1,183 (97.5%) |
| 45 to 54 Years | 686 (90.9%) | 486 (90.5%) |
| 55 to 64 Years | 839 (92.8%) | 906 (100.0%) |
| 65 to 74 Years | 483 (95.8%) | 683 (95.3%) |
| 75 Years and over | 424 (97.9%) | 392 (83.1%) |
| Total | 6,306 (94.0%) | 6,061 (88.9%) |
Income Below Poverty Among Married-Couple Families in Port Neches
The poverty statistics for married-couple families in Port Neches show that 2.6% or 75 of the total 2,879 families live below the poverty line. Families with 1 or 2 children have the highest poverty rate of 5.4%, comprising of 46 families. On the other hand, families with no children have the lowest poverty rate of 1.1%, which includes 18 families.
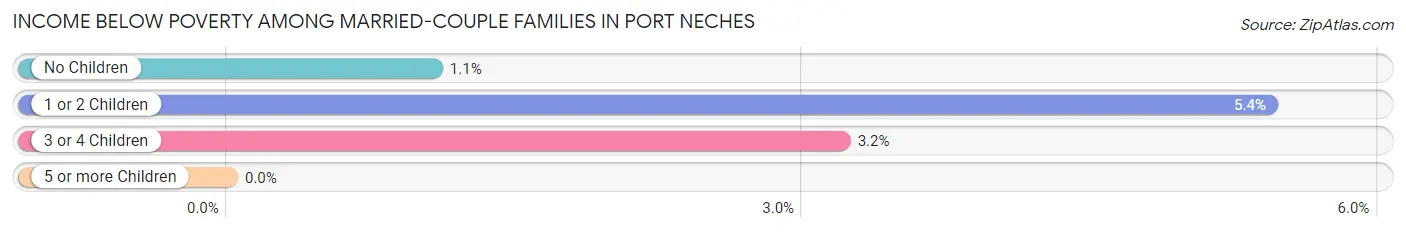
| Children | Above Poverty | Below Poverty |
| No Children | 1,670 (98.9%) | 18 (1.1%) |
| 1 or 2 Children | 801 (94.6%) | 46 (5.4%) |
| 3 or 4 Children | 333 (96.8%) | 11 (3.2%) |
| 5 or more Children | 0 (0.0%) | 0 (0.0%) |
| Total | 2,804 (97.4%) | 75 (2.6%) |
Income Below Poverty Among Single-Parent Households in Port Neches
According to the poverty data in Port Neches, 33.7% or 60 single-father households and 7.8% or 24 single-mother households are living below the poverty line. Among single-father households, those with 3 or 4 children have the highest poverty rate, with 60 households (89.5%) experiencing poverty. Likewise, among single-mother households, those with no children have the highest poverty rate, with 14 households (11.5%) falling below the poverty line.
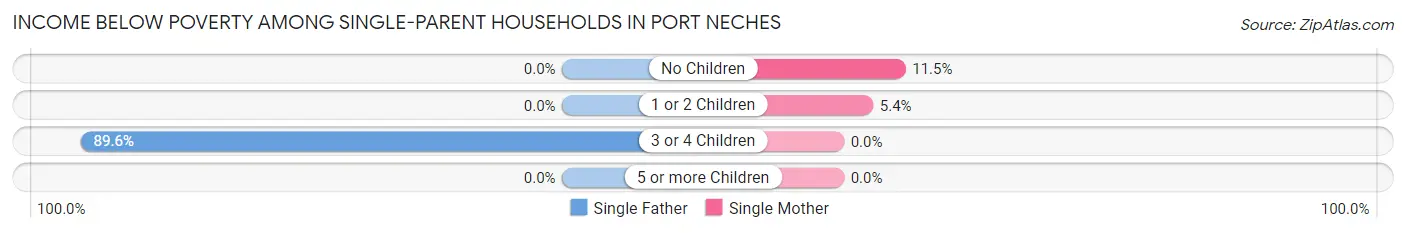
| Children | Single Father | Single Mother |
| No Children | 0 (0.0%) | 14 (11.5%) |
| 1 or 2 Children | 0 (0.0%) | 10 (5.4%) |
| 3 or 4 Children | 60 (89.5%) | 0 (0.0%) |
| 5 or more Children | 0 (0.0%) | 0 (0.0%) |
| Total | 60 (33.7%) | 24 (7.8%) |
Income Below Poverty Among Married-Couple vs Single-Parent Households in Port Neches
The poverty data for Port Neches shows that 75 of the married-couple family households (2.6%) and 84 of the single-parent households (17.4%) are living below the poverty level. Within the married-couple family households, those with 1 or 2 children have the highest poverty rate, with 46 households (5.4%) falling below the poverty line. Among the single-parent households, those with 3 or 4 children have the highest poverty rate, with 60 household (89.5%) living below poverty.
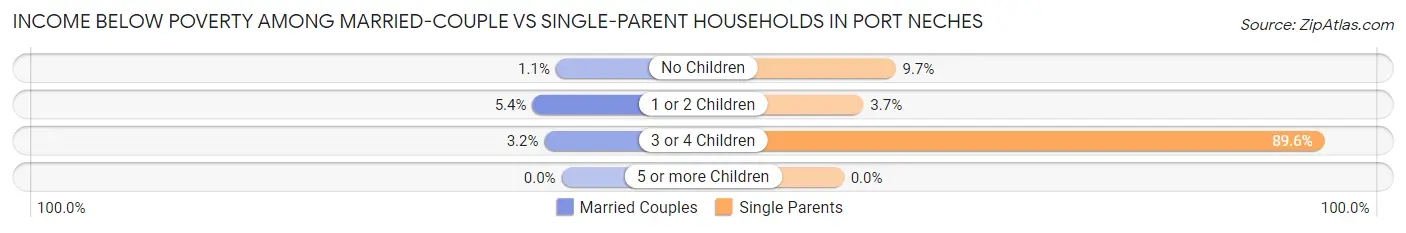
| Children | Married-Couple Families | Single-Parent Households |
| No Children | 18 (1.1%) | 14 (9.7%) |
| 1 or 2 Children | 46 (5.4%) | 10 (3.7%) |
| 3 or 4 Children | 11 (3.2%) | 60 (89.5%) |
| 5 or more Children | 0 (0.0%) | 0 (0.0%) |
| Total | 75 (2.6%) | 84 (17.4%) |
Race in Port Neches
The most populous races in Port Neches are White / Caucasian (11,948 | 87.6%), Hispanic or Latino (1,084 | 8.0%), and Two or more Races (1,008 | 7.4%).
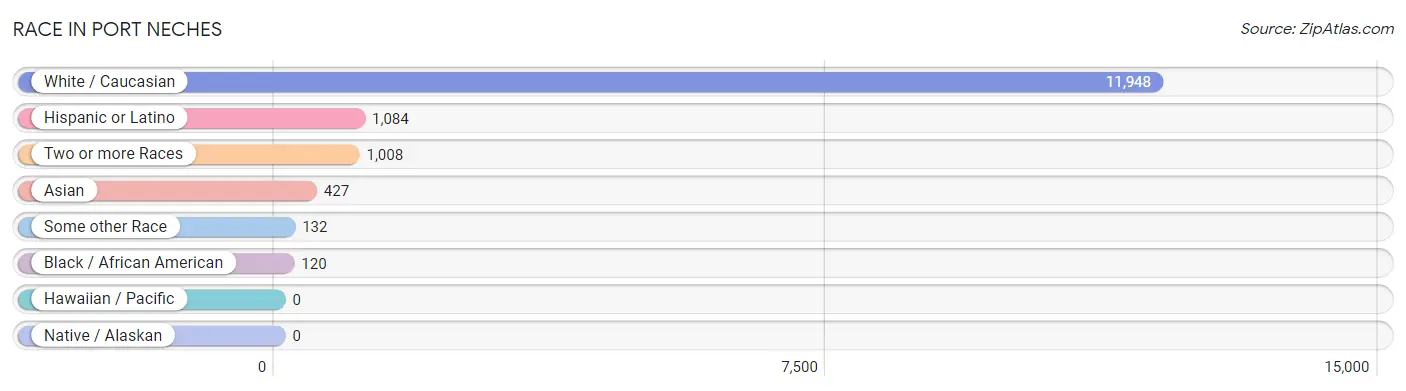
| Race | # Population | % Population |
| Asian | 427 | 3.1% |
| Black / African American | 120 | 0.9% |
| Hawaiian / Pacific | 0 | 0.0% |
| Hispanic or Latino | 1,084 | 8.0% |
| Native / Alaskan | 0 | 0.0% |
| White / Caucasian | 11,948 | 87.6% |
| Two or more Races | 1,008 | 7.4% |
| Some other Race | 132 | 1.0% |
| Total | 13,635 | 100.0% |
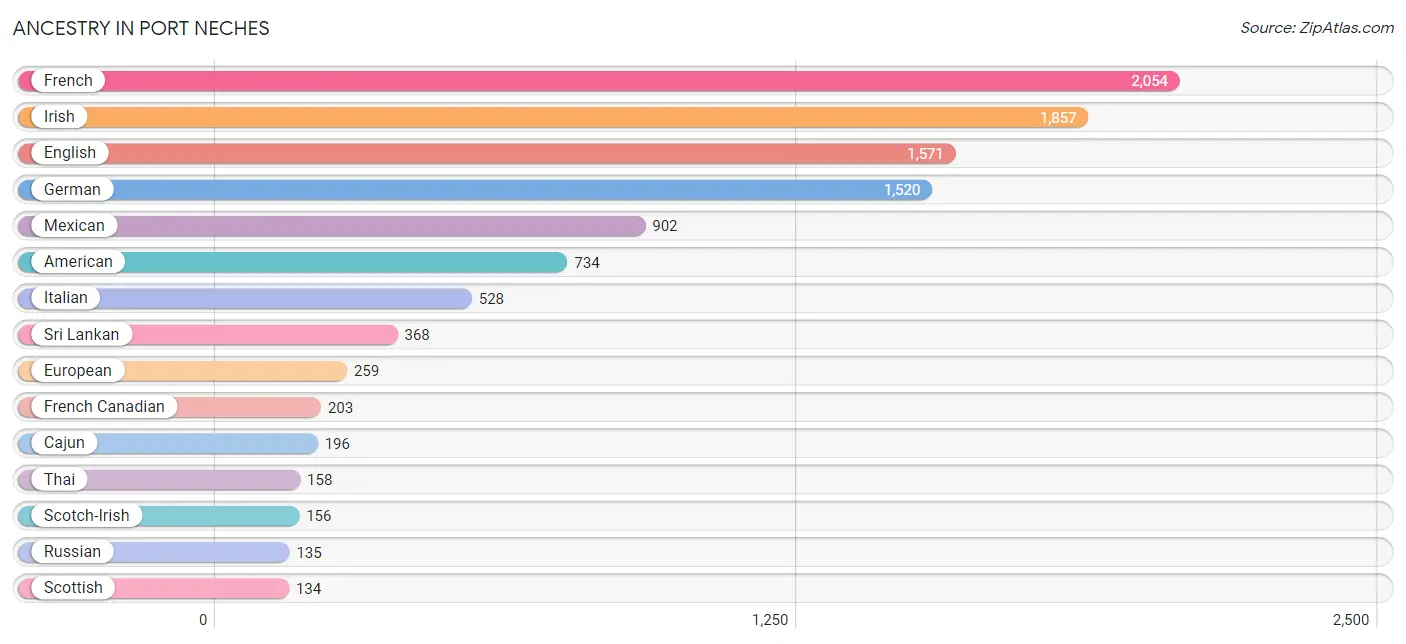
Ancestry in Port Neches
The most populous ancestries reported in Port Neches are French (2,054 | 15.1%), Irish (1,857 | 13.6%), English (1,571 | 11.5%), German (1,520 | 11.2%), and Mexican (902 | 6.6%), together accounting for 58.0% of all Port Neches residents.
| Ancestry | # Population | % Population |
| African | 15 | 0.1% |
| American | 734 | 5.4% |
| Arab | 8 | 0.1% |
| Belgian | 46 | 0.3% |
| Bhutanese | 57 | 0.4% |
| British | 107 | 0.8% |
| Cajun | 196 | 1.4% |
| Canadian | 18 | 0.1% |
| Central American | 33 | 0.2% |
| Central American Indian | 15 | 0.1% |
| Cherokee | 29 | 0.2% |
| Chilean | 8 | 0.1% |
| Costa Rican | 15 | 0.1% |
| Creek | 96 | 0.7% |
| Cuban | 17 | 0.1% |
| Czech | 47 | 0.3% |
| Dominican | 35 | 0.3% |
| Dutch | 119 | 0.9% |
| English | 1,571 | 11.5% |
| European | 259 | 1.9% |
| French | 2,054 | 15.1% |
| French Canadian | 203 | 1.5% |
| German | 1,520 | 11.2% |
| Greek | 21 | 0.2% |
| Guatemalan | 18 | 0.1% |
| Haitian | 34 | 0.3% |
| Hungarian | 13 | 0.1% |
| Irish | 1,857 | 13.6% |
| Italian | 528 | 3.9% |
| Jamaican | 15 | 0.1% |
| Lebanese | 8 | 0.1% |
| Lithuanian | 11 | 0.1% |
| Mexican | 902 | 6.6% |
| Native Hawaiian | 27 | 0.2% |
| Nigerian | 38 | 0.3% |
| Northern European | 26 | 0.2% |
| Norwegian | 11 | 0.1% |
| Polish | 10 | 0.1% |
| Portuguese | 28 | 0.2% |
| Russian | 135 | 1.0% |
| Scandinavian | 10 | 0.1% |
| Scotch-Irish | 156 | 1.1% |
| Scottish | 134 | 1.0% |
| Slovak | 30 | 0.2% |
| South American | 48 | 0.4% |
| Spanish | 10 | 0.1% |
| Sri Lankan | 368 | 2.7% |
| Subsaharan African | 53 | 0.4% |
| Swedish | 121 | 0.9% |
| Thai | 158 | 1.2% |
| Ukrainian | 38 | 0.3% |
| Venezuelan | 40 | 0.3% |
| Welsh | 73 | 0.5% | View All 53 Rows |
Immigrants in Port Neches
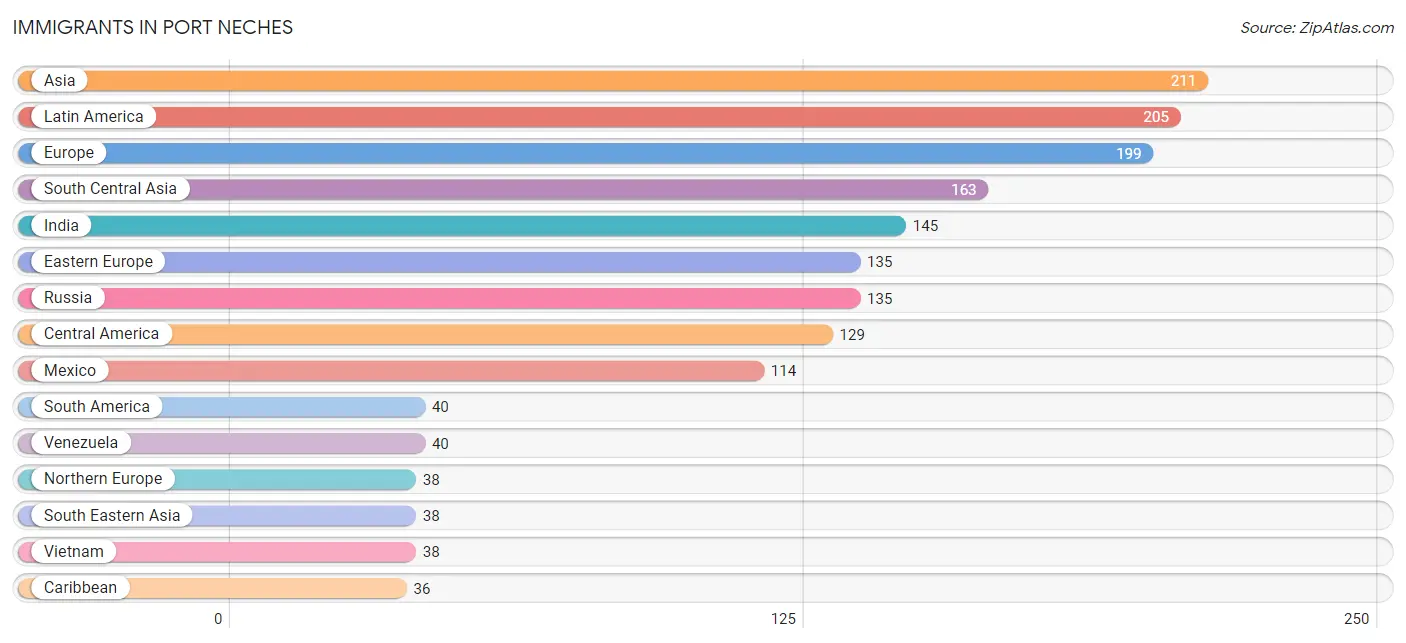
The most numerous immigrant groups reported in Port Neches came from Asia (211 | 1.5%), Latin America (205 | 1.5%), Europe (199 | 1.5%), South Central Asia (163 | 1.2%), and India (145 | 1.1%), together accounting for 6.8% of all Port Neches residents.
| Immigration Origin | # Population | % Population |
| Asia | 211 | 1.5% |
| Caribbean | 36 | 0.3% |
| Central America | 129 | 0.9% |
| Costa Rica | 15 | 0.1% |
| Dominican Republic | 35 | 0.3% |
| Eastern Europe | 135 | 1.0% |
| Europe | 199 | 1.5% |
| Germany | 26 | 0.2% |
| India | 145 | 1.1% |
| Iran | 18 | 0.1% |
| Jamaica | 1 | 0.0% |
| Latin America | 205 | 1.5% |
| Mexico | 114 | 0.8% |
| Northern Europe | 38 | 0.3% |
| Russia | 135 | 1.0% |
| South America | 40 | 0.3% |
| South Central Asia | 163 | 1.2% |
| South Eastern Asia | 38 | 0.3% |
| Venezuela | 40 | 0.3% |
| Vietnam | 38 | 0.3% |
| Western Europe | 26 | 0.2% | View All 21 Rows |
Sex and Age in Port Neches
Sex and Age in Port Neches
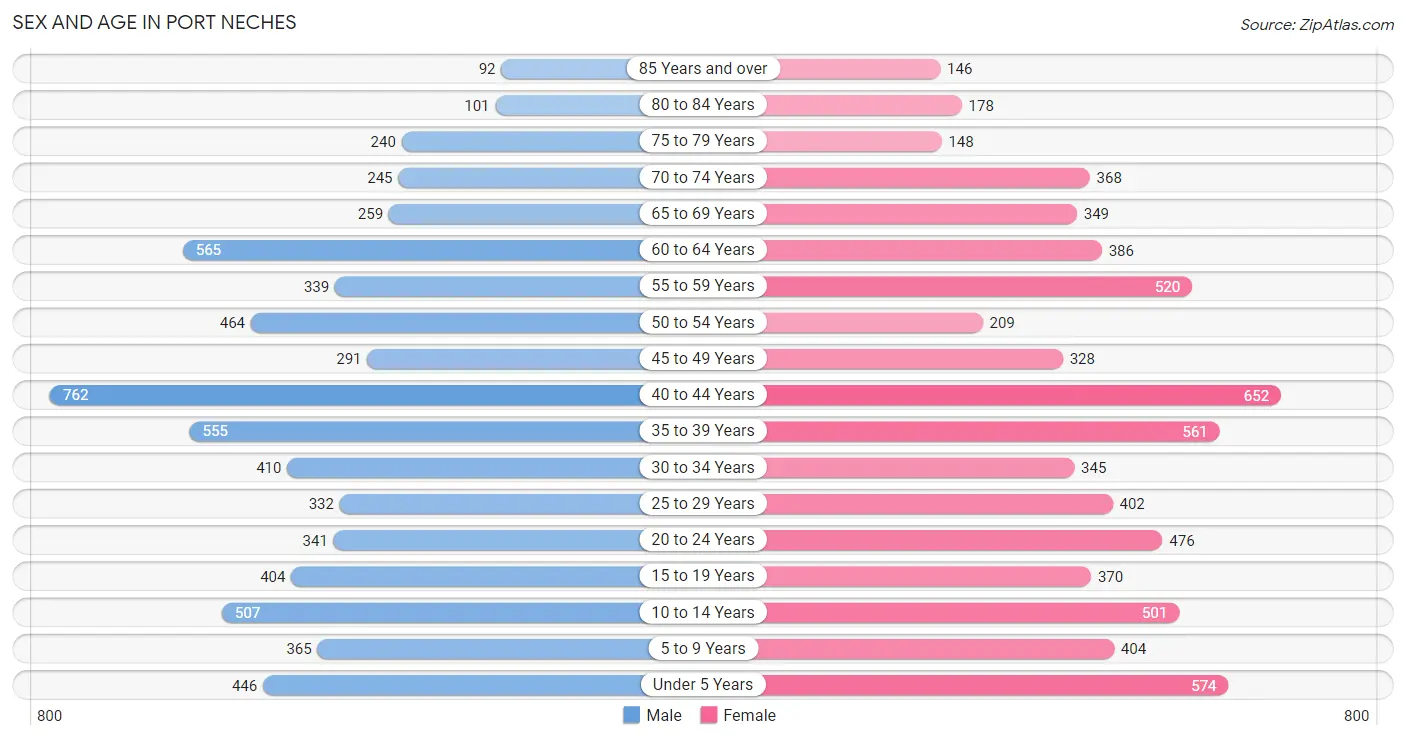
The most populous age groups in Port Neches are 40 to 44 Years (762 | 11.3%) for men and 40 to 44 Years (652 | 9.4%) for women.
| Age Bracket | Male | Female |
| Under 5 Years | 446 (6.6%) | 574 (8.3%) |
| 5 to 9 Years | 365 (5.4%) | 404 (5.8%) |
| 10 to 14 Years | 507 (7.5%) | 501 (7.2%) |
| 15 to 19 Years | 404 (6.0%) | 370 (5.3%) |
| 20 to 24 Years | 341 (5.1%) | 476 (6.9%) |
| 25 to 29 Years | 332 (4.9%) | 402 (5.8%) |
| 30 to 34 Years | 410 (6.1%) | 345 (5.0%) |
| 35 to 39 Years | 555 (8.3%) | 561 (8.1%) |
| 40 to 44 Years | 762 (11.3%) | 652 (9.4%) |
| 45 to 49 Years | 291 (4.3%) | 328 (4.7%) |
| 50 to 54 Years | 464 (6.9%) | 209 (3.0%) |
| 55 to 59 Years | 339 (5.1%) | 520 (7.5%) |
| 60 to 64 Years | 565 (8.4%) | 386 (5.6%) |
| 65 to 69 Years | 259 (3.9%) | 349 (5.1%) |
| 70 to 74 Years | 245 (3.6%) | 368 (5.3%) |
| 75 to 79 Years | 240 (3.6%) | 148 (2.1%) |
| 80 to 84 Years | 101 (1.5%) | 178 (2.6%) |
| 85 Years and over | 92 (1.4%) | 146 (2.1%) |
| Total | 6,718 (100.0%) | 6,917 (100.0%) |
Families and Households in Port Neches
Median Family Size in Port Neches
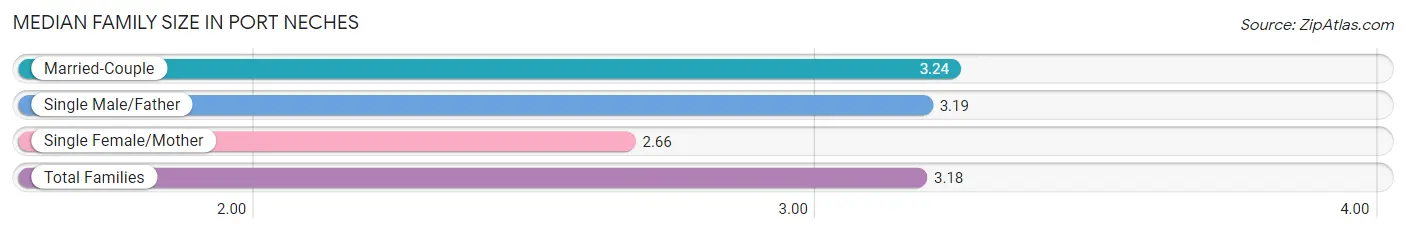
The median family size in Port Neches is 3.18 persons per family, with married-couple families (2,879 | 85.6%) accounting for the largest median family size of 3.24 persons per family. On the other hand, single female/mother families (306 | 9.1%) represent the smallest median family size with 2.66 persons per family.
| Family Type | # Families | Family Size |
| Married-Couple | 2,879 (85.6%) | 3.24 |
| Single Male/Father | 178 (5.3%) | 3.19 |
| Single Female/Mother | 306 (9.1%) | 2.66 |
| Total Families | 3,363 (100.0%) | 3.18 |
Median Household Size in Port Neches
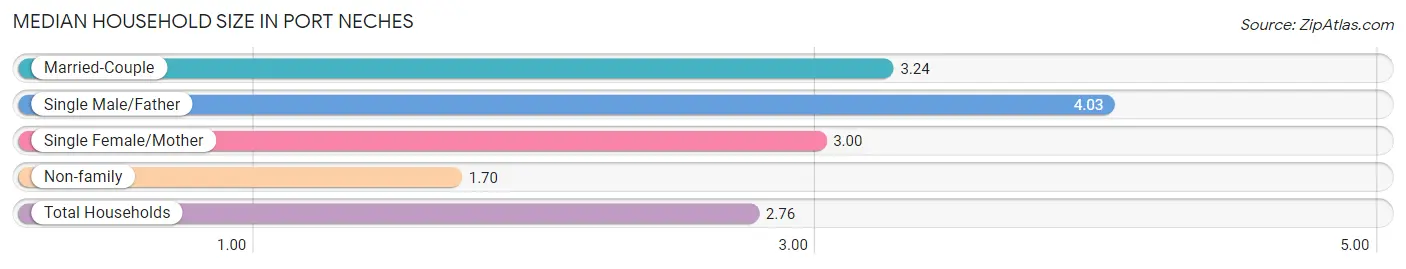
The median household size in Port Neches is 2.76 persons per household, with single male/father households (178 | 3.6%) accounting for the largest median household size of 4.03 persons per household. non-family households (1,573 | 31.9%) represent the smallest median household size with 1.70 persons per household.
| Household Type | # Households | Household Size |
| Married-Couple | 2,879 (58.3%) | 3.24 |
| Single Male/Father | 178 (3.6%) | 4.03 |
| Single Female/Mother | 306 (6.2%) | 3.00 |
| Non-family | 1,573 (31.9%) | 1.70 |
| Total Households | 4,936 (100.0%) | 2.76 |
Household Size by Marriage Status in Port Neches
Out of a total of 4,936 households in Port Neches, 3,363 (68.1%) are family households, while 1,573 (31.9%) are nonfamily households. The most numerous type of family households are 2-person households, comprising 1,401, and the most common type of nonfamily households are 1-person households, comprising 1,011.
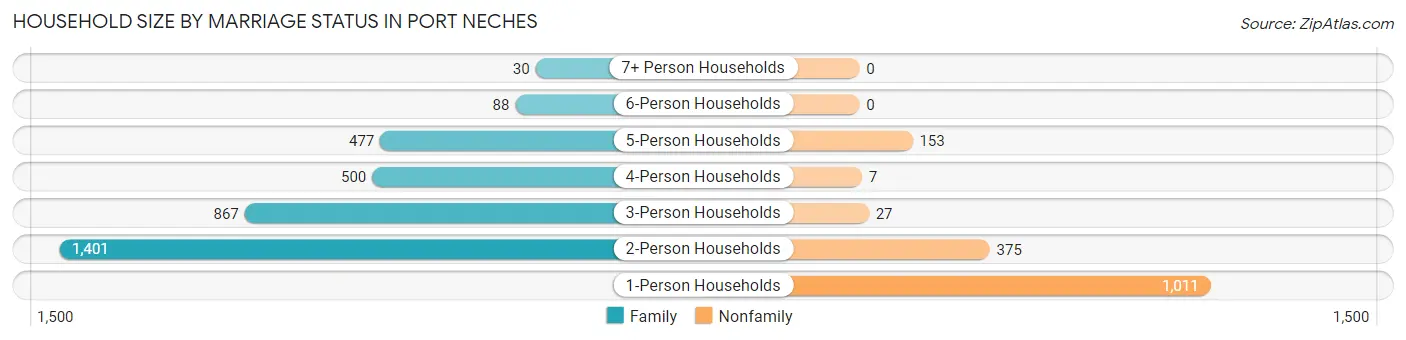
| Household Size | Family Households | Nonfamily Households |
| 1-Person Households | - | 1,011 (20.5%) |
| 2-Person Households | 1,401 (28.4%) | 375 (7.6%) |
| 3-Person Households | 867 (17.6%) | 27 (0.5%) |
| 4-Person Households | 500 (10.1%) | 7 (0.1%) |
| 5-Person Households | 477 (9.7%) | 153 (3.1%) |
| 6-Person Households | 88 (1.8%) | 0 (0.0%) |
| 7+ Person Households | 30 (0.6%) | 0 (0.0%) |
| Total | 3,363 (68.1%) | 1,573 (31.9%) |
Female Fertility in Port Neches
Fertility by Age in Port Neches
Average fertility rate in Port Neches is 129.0 births per 1,000 women. Women in the age bracket of 20 to 34 years have the highest fertility rate with 235.0 births per 1,000 women. Women in the age bracket of 20 to 34 years acount for 70.4% of all women with births.
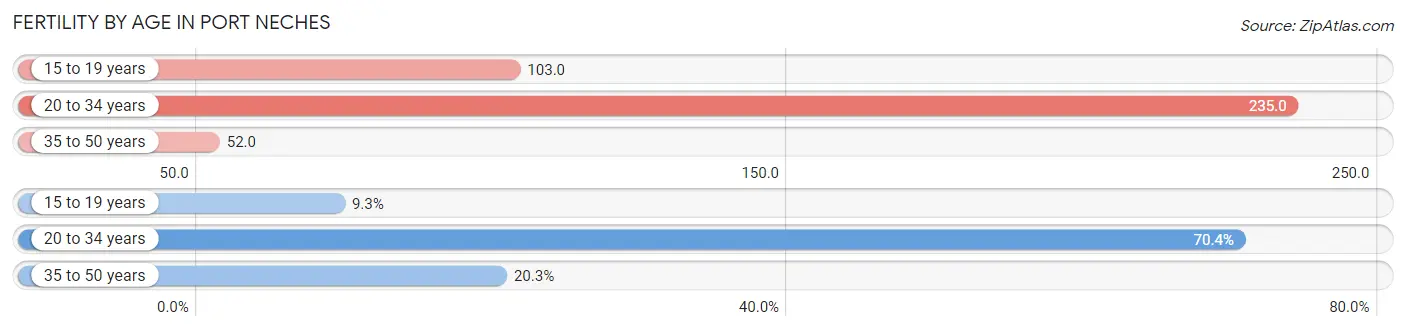
| Age Bracket | Women with Births | Births / 1,000 Women |
| 15 to 19 years | 38 (9.3%) | 103.0 |
| 20 to 34 years | 288 (70.4%) | 235.0 |
| 35 to 50 years | 83 (20.3%) | 52.0 |
| Total | 409 (100.0%) | 129.0 |
Fertility by Age by Marriage Status in Port Neches
86.3% of women with births (409) in Port Neches are married. The highest percentage of unmarried women with births falls into 15 to 19 years age bracket with 100.0% of them unmarried at the time of birth, while the lowest percentage of unmarried women with births belong to 35 to 50 years age bracket with 0.0% of them unmarried.
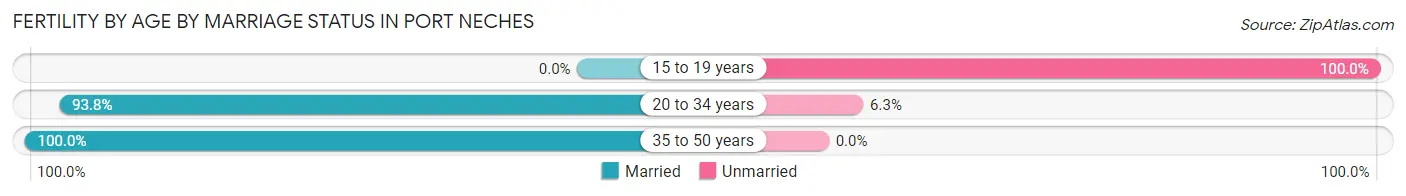
| Age Bracket | Married | Unmarried |
| 15 to 19 years | 0 (0.0%) | 38 (100.0%) |
| 20 to 34 years | 270 (93.8%) | 18 (6.2%) |
| 35 to 50 years | 83 (100.0%) | 0 (0.0%) |
| Total | 353 (86.3%) | 56 (13.7%) |
Fertility by Education in Port Neches
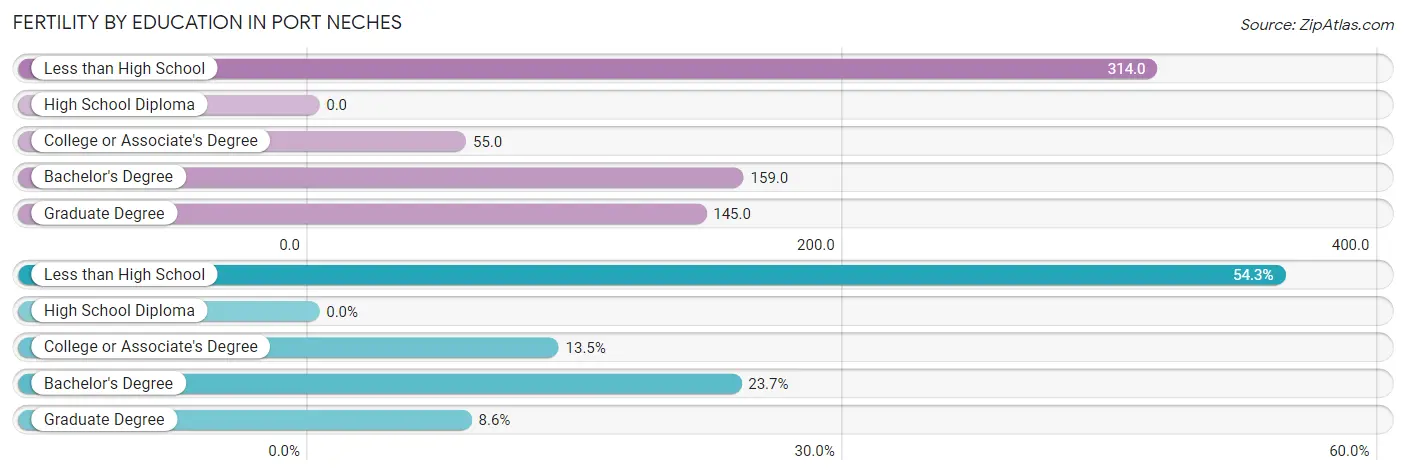
| Educational Attainment | Women with Births | Births / 1,000 Women |
| Less than High School | 222 (54.3%) | 314.0 |
| High School Diploma | 0 (0.0%) | 0.0 |
| College or Associate's Degree | 55 (13.5%) | 55.0 |
| Bachelor's Degree | 97 (23.7%) | 159.0 |
| Graduate Degree | 35 (8.6%) | 145.0 |
| Total | 409 (100.0%) | 129.0 |
Fertility by Education by Marriage Status in Port Neches
13.7% of women with births in Port Neches are unmarried. Women with the educational attainment of graduate degree are most likely to be married with 100.0% of them married at childbirth, while women with the educational attainment of less than high school are least likely to be married with 17.1% of them unmarried at childbirth.
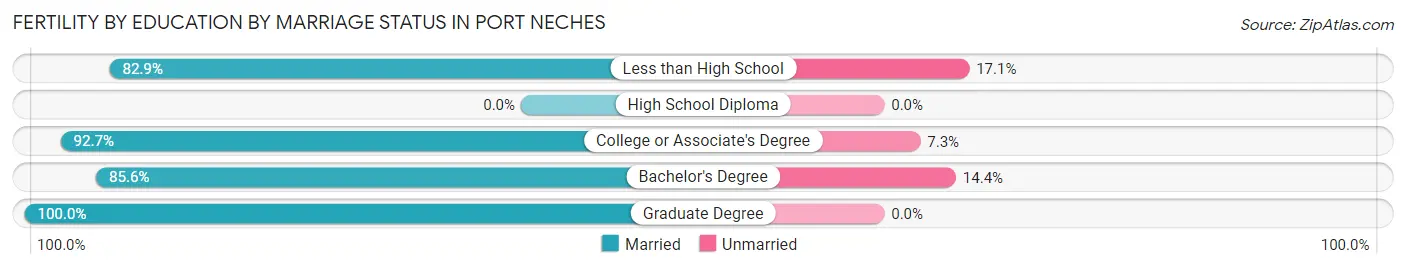
| Educational Attainment | Married | Unmarried |
| Less than High School | 184 (82.9%) | 38 (17.1%) |
| High School Diploma | 0 (0.0%) | 0 (0.0%) |
| College or Associate's Degree | 51 (92.7%) | 4 (7.3%) |
| Bachelor's Degree | 83 (85.6%) | 14 (14.4%) |
| Graduate Degree | 35 (100.0%) | 0 (0.0%) |
| Total | 353 (86.3%) | 56 (13.7%) |
Employment Characteristics in Port Neches
Employment by Class of Employer in Port Neches
Among the 6,217 employed individuals in Port Neches, private company employees (4,231 | 68.1%), local government employees (795 | 12.8%), and state government employees (327 | 5.3%) make up the most common classes of employment.
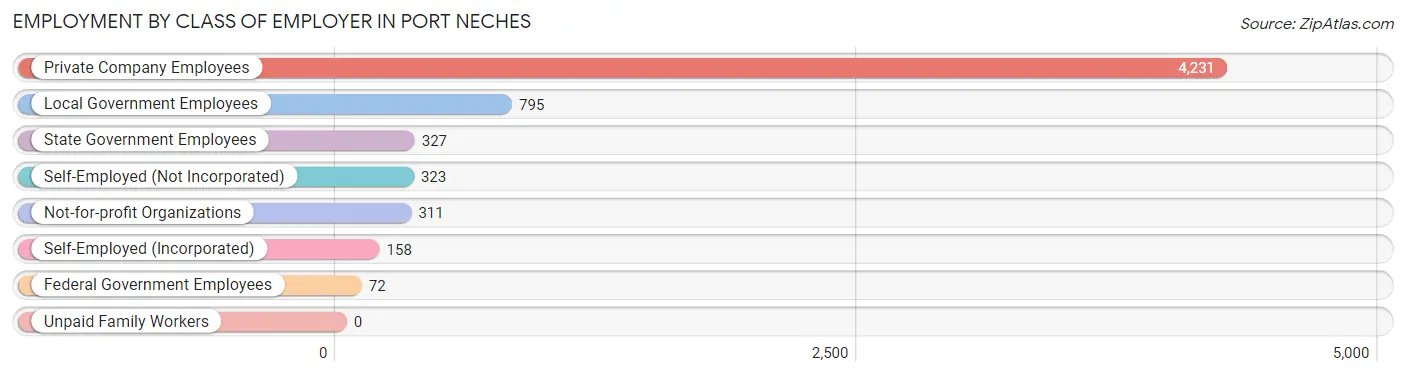
| Employer Class | # Employees | % Employees |
| Private Company Employees | 4,231 | 68.1% |
| Self-Employed (Incorporated) | 158 | 2.5% |
| Self-Employed (Not Incorporated) | 323 | 5.2% |
| Not-for-profit Organizations | 311 | 5.0% |
| Local Government Employees | 795 | 12.8% |
| State Government Employees | 327 | 5.3% |
| Federal Government Employees | 72 | 1.2% |
| Unpaid Family Workers | 0 | 0.0% |
| Total | 6,217 | 100.0% |
Employment Status by Age in Port Neches
According to the labor force statistics for Port Neches, out of the total population over 16 years of age (10,611), 63.6% or 6,749 individuals are in the labor force, with 5.3% or 358 of them unemployed. The age group with the highest labor force participation rate is 25 to 29 years, with 89.6% or 658 individuals in the labor force. Within the labor force, the 75 years and over age range has the highest percentage of unemployed individuals, with 27.8% or 10 of them being unemployed.
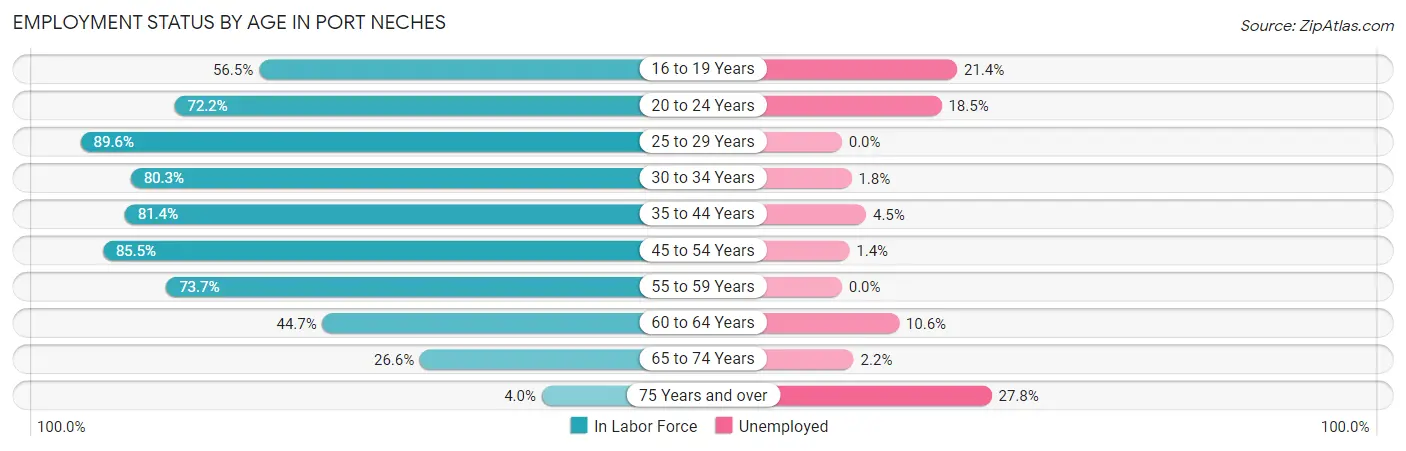
| Age Bracket | In Labor Force | Unemployed |
| 16 to 19 Years | 309 (56.5%) | 66 (21.4%) |
| 20 to 24 Years | 590 (72.2%) | 109 (18.5%) |
| 25 to 29 Years | 658 (89.6%) | 0 (0.0%) |
| 30 to 34 Years | 606 (80.3%) | 11 (1.8%) |
| 35 to 44 Years | 2,059 (81.4%) | 93 (4.5%) |
| 45 to 54 Years | 1,105 (85.5%) | 15 (1.4%) |
| 55 to 59 Years | 633 (73.7%) | 0 (0.0%) |
| 60 to 64 Years | 425 (44.7%) | 45 (10.6%) |
| 65 to 74 Years | 325 (26.6%) | 7 (2.2%) |
| 75 Years and over | 36 (4.0%) | 10 (27.8%) |
| Total | 6,749 (63.6%) | 358 (5.3%) |
Employment Status by Educational Attainment in Port Neches
According to labor force statistics for Port Neches, 77.0% of individuals (5,483) out of the total population between 25 and 64 years of age (7,121) are in the labor force, with 3.0% or 164 of them being unemployed. The group with the highest labor force participation rate are those with the educational attainment of bachelor's degree or higher, with 84.4% or 1,542 individuals in the labor force. Within the labor force, individuals with less than high school education have the highest percentage of unemployment, with 6.7% or 34 of them being unemployed.
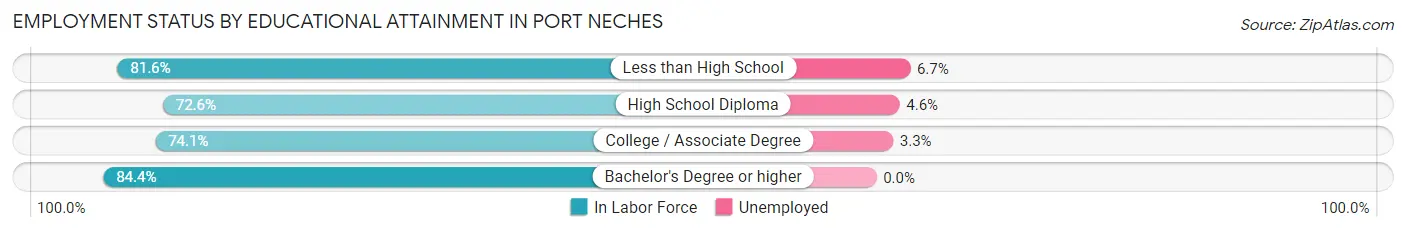
| Educational Attainment | In Labor Force | Unemployed |
| Less than High School | 511 (81.6%) | 42 (6.7%) |
| High School Diploma | 1,321 (72.6%) | 84 (4.6%) |
| College / Associate Degree | 2,110 (74.1%) | 94 (3.3%) |
| Bachelor's Degree or higher | 1,542 (84.4%) | 0 (0.0%) |
| Total | 5,483 (77.0%) | 214 (3.0%) |
Employment Occupations by Sex in Port Neches
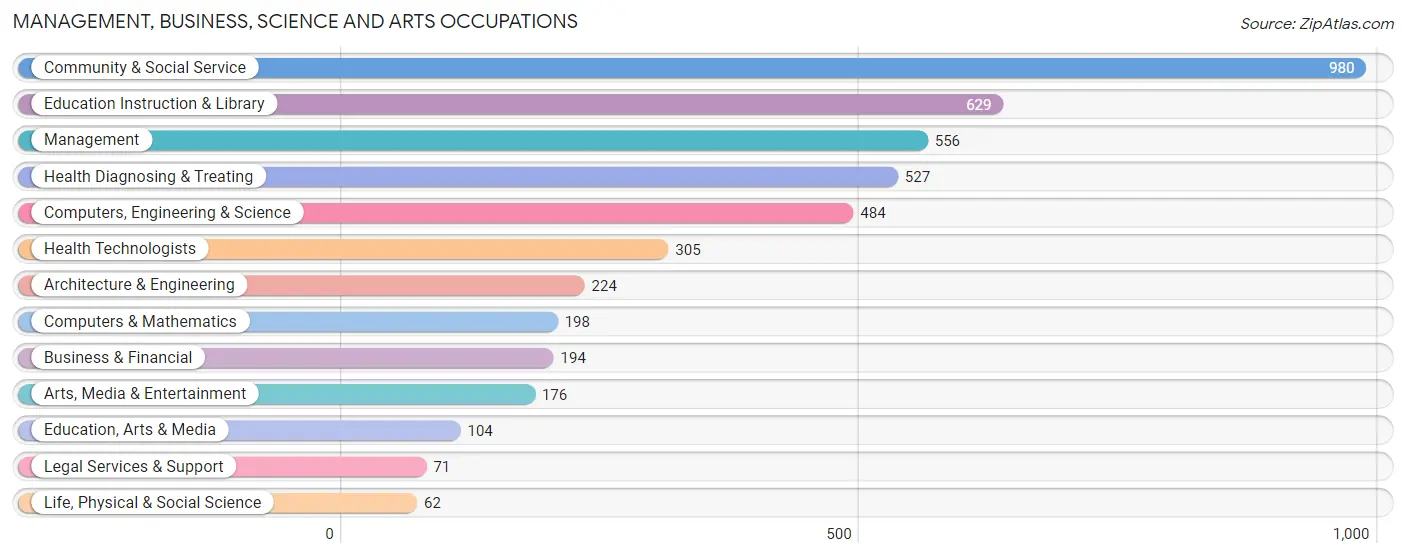
Management, Business, Science and Arts Occupations
The most common Management, Business, Science and Arts occupations in Port Neches are Community & Social Service (980 | 15.3%), Education Instruction & Library (629 | 9.8%), Management (556 | 8.7%), Health Diagnosing & Treating (527 | 8.3%), and Computers, Engineering & Science (484 | 7.6%).
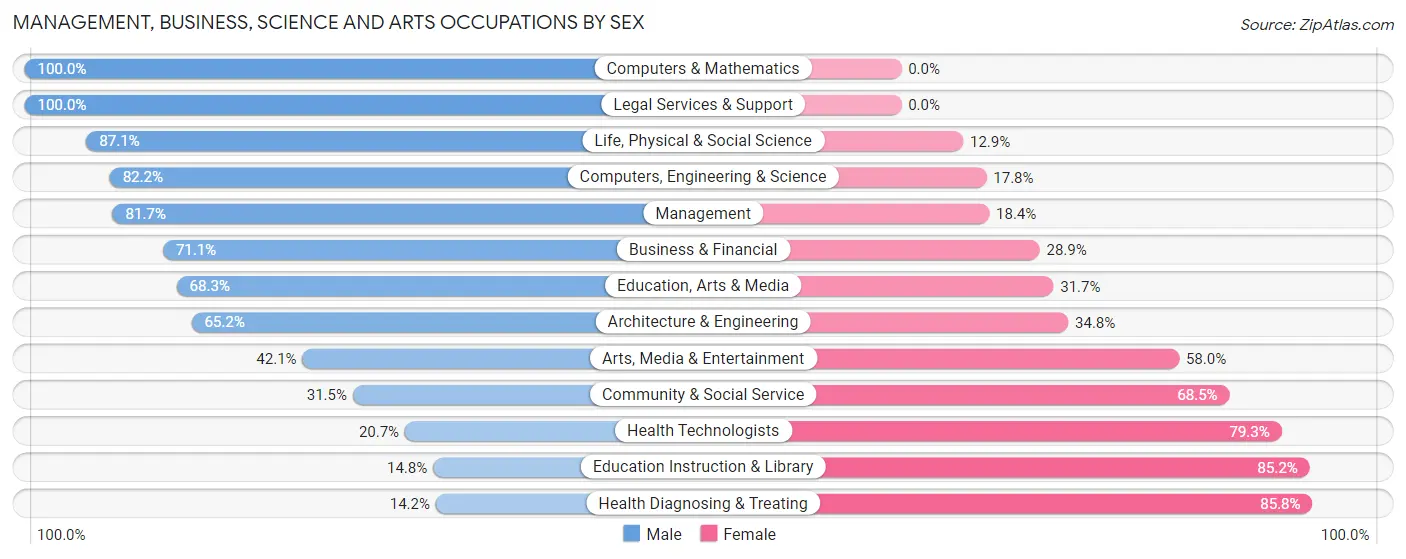
Management, Business, Science and Arts Occupations by Sex
Within the Management, Business, Science and Arts occupations in Port Neches, the most male-oriented occupations are Computers & Mathematics (100.0%), Legal Services & Support (100.0%), and Life, Physical & Social Science (87.1%), while the most female-oriented occupations are Health Diagnosing & Treating (85.8%), Education Instruction & Library (85.2%), and Health Technologists (79.3%).
| Occupation | Male | Female |
| Management | 454 (81.7%) | 102 (18.3%) |
| Business & Financial | 138 (71.1%) | 56 (28.9%) |
| Computers, Engineering & Science | 398 (82.2%) | 86 (17.8%) |
| Computers & Mathematics | 198 (100.0%) | 0 (0.0%) |
| Architecture & Engineering | 146 (65.2%) | 78 (34.8%) |
| Life, Physical & Social Science | 54 (87.1%) | 8 (12.9%) |
| Community & Social Service | 309 (31.5%) | 671 (68.5%) |
| Education, Arts & Media | 71 (68.3%) | 33 (31.7%) |
| Legal Services & Support | 71 (100.0%) | 0 (0.0%) |
| Education Instruction & Library | 93 (14.8%) | 536 (85.2%) |
| Arts, Media & Entertainment | 74 (42.0%) | 102 (58.0%) |
| Health Diagnosing & Treating | 75 (14.2%) | 452 (85.8%) |
| Health Technologists | 63 (20.7%) | 242 (79.3%) |
| Total (Category) | 1,374 (50.1%) | 1,367 (49.9%) |
| Total (Overall) | 3,565 (55.8%) | 2,825 (44.2%) |
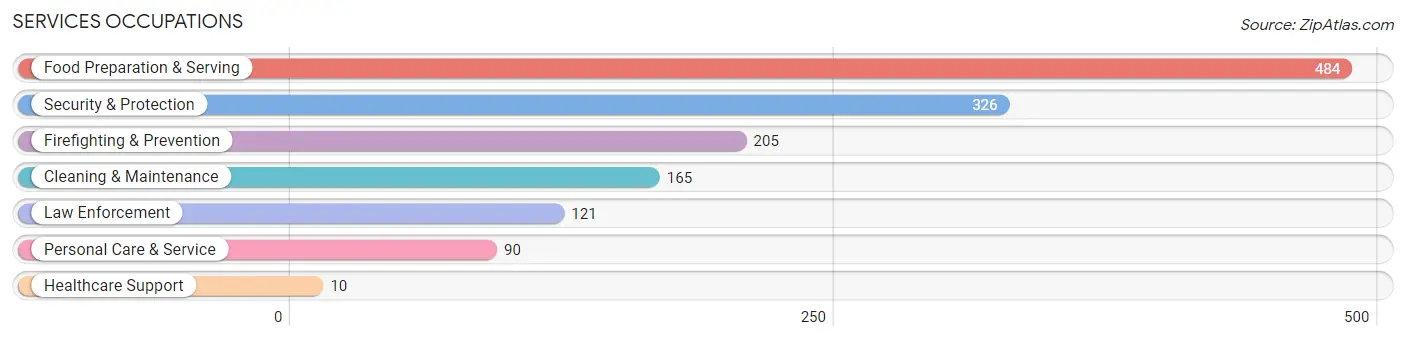
Services Occupations
The most common Services occupations in Port Neches are Food Preparation & Serving (484 | 7.6%), Security & Protection (326 | 5.1%), Firefighting & Prevention (205 | 3.2%), Cleaning & Maintenance (165 | 2.6%), and Law Enforcement (121 | 1.9%).
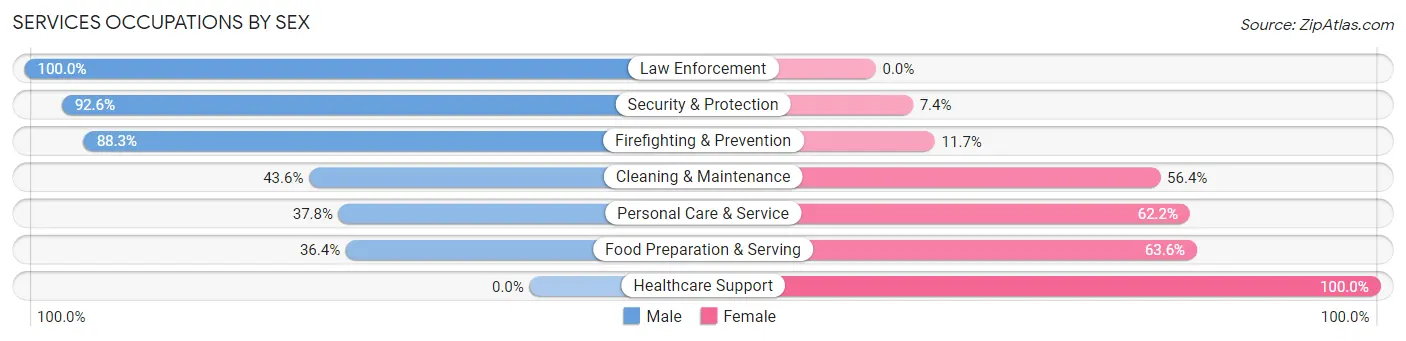
Services Occupations by Sex
Within the Services occupations in Port Neches, the most male-oriented occupations are Law Enforcement (100.0%), Security & Protection (92.6%), and Firefighting & Prevention (88.3%), while the most female-oriented occupations are Healthcare Support (100.0%), Food Preparation & Serving (63.6%), and Personal Care & Service (62.2%).
| Occupation | Male | Female |
| Healthcare Support | 0 (0.0%) | 10 (100.0%) |
| Security & Protection | 302 (92.6%) | 24 (7.4%) |
| Firefighting & Prevention | 181 (88.3%) | 24 (11.7%) |
| Law Enforcement | 121 (100.0%) | 0 (0.0%) |
| Food Preparation & Serving | 176 (36.4%) | 308 (63.6%) |
| Cleaning & Maintenance | 72 (43.6%) | 93 (56.4%) |
| Personal Care & Service | 34 (37.8%) | 56 (62.2%) |
| Total (Category) | 584 (54.3%) | 491 (45.7%) |
| Total (Overall) | 3,565 (55.8%) | 2,825 (44.2%) |
Sales and Office Occupations
The most common Sales and Office occupations in Port Neches are Sales & Related (758 | 11.9%), and Office & Administration (679 | 10.6%).
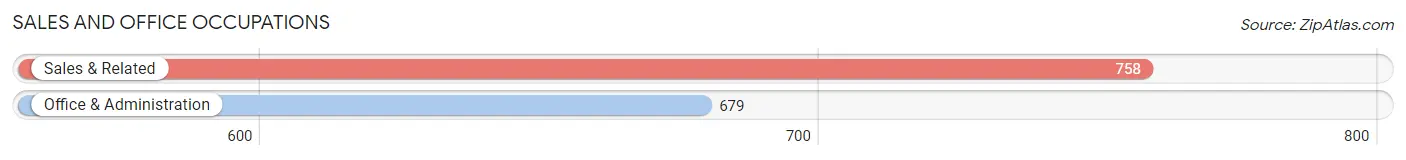
Sales and Office Occupations by Sex
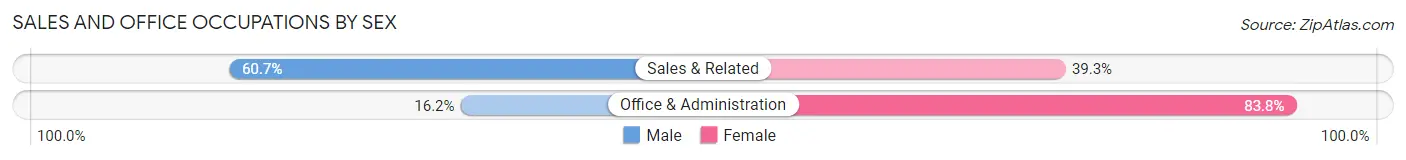
| Occupation | Male | Female |
| Sales & Related | 460 (60.7%) | 298 (39.3%) |
| Office & Administration | 110 (16.2%) | 569 (83.8%) |
| Total (Category) | 570 (39.7%) | 867 (60.3%) |
| Total (Overall) | 3,565 (55.8%) | 2,825 (44.2%) |
Natural Resources, Construction and Maintenance Occupations
The most common Natural Resources, Construction and Maintenance occupations in Port Neches are Construction & Extraction (422 | 6.6%), and Installation, Maintenance & Repair (54 | 0.9%).
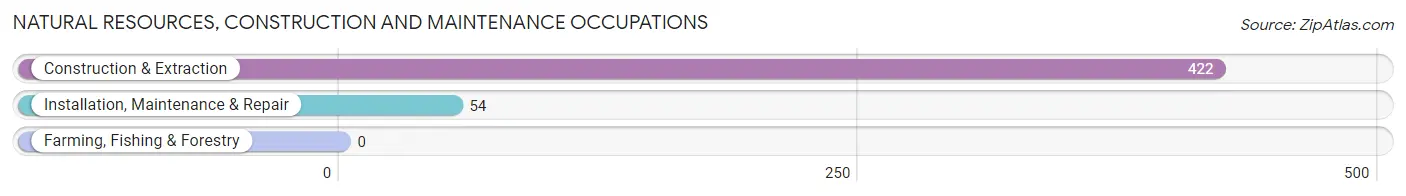
Natural Resources, Construction and Maintenance Occupations by Sex
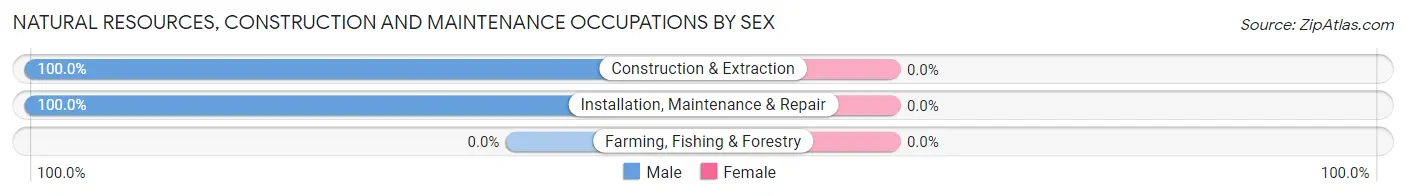
| Occupation | Male | Female |
| Farming, Fishing & Forestry | 0 (0.0%) | 0 (0.0%) |
| Construction & Extraction | 422 (100.0%) | 0 (0.0%) |
| Installation, Maintenance & Repair | 54 (100.0%) | 0 (0.0%) |
| Total (Category) | 476 (100.0%) | 0 (0.0%) |
| Total (Overall) | 3,565 (55.8%) | 2,825 (44.2%) |
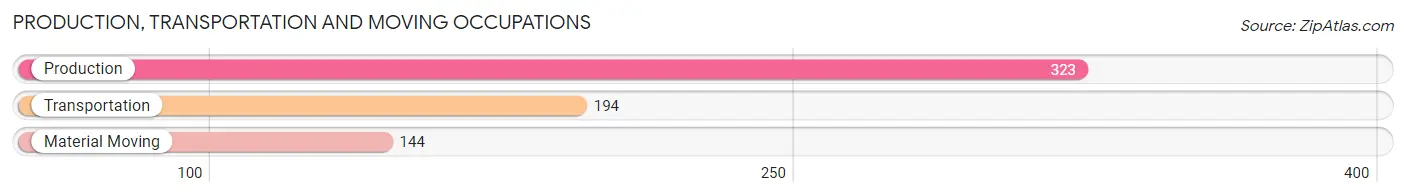
Production, Transportation and Moving Occupations
The most common Production, Transportation and Moving occupations in Port Neches are Production (323 | 5.1%), Transportation (194 | 3.0%), and Material Moving (144 | 2.2%).
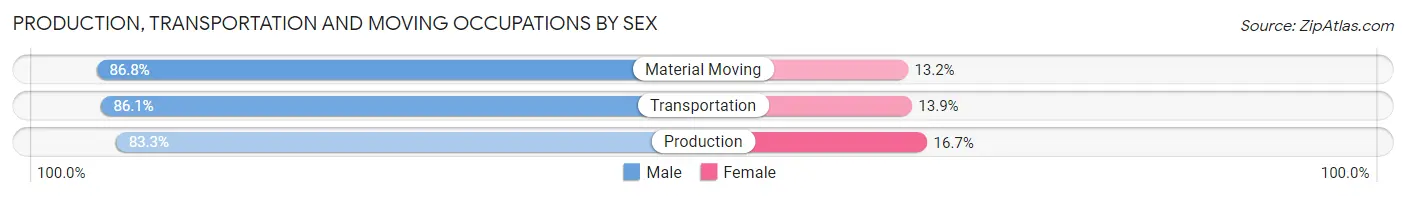
Production, Transportation and Moving Occupations by Sex
| Occupation | Male | Female |
| Production | 269 (83.3%) | 54 (16.7%) |
| Transportation | 167 (86.1%) | 27 (13.9%) |
| Material Moving | 125 (86.8%) | 19 (13.2%) |
| Total (Category) | 561 (84.9%) | 100 (15.1%) |
| Total (Overall) | 3,565 (55.8%) | 2,825 (44.2%) |
Employment Industries by Sex in Port Neches
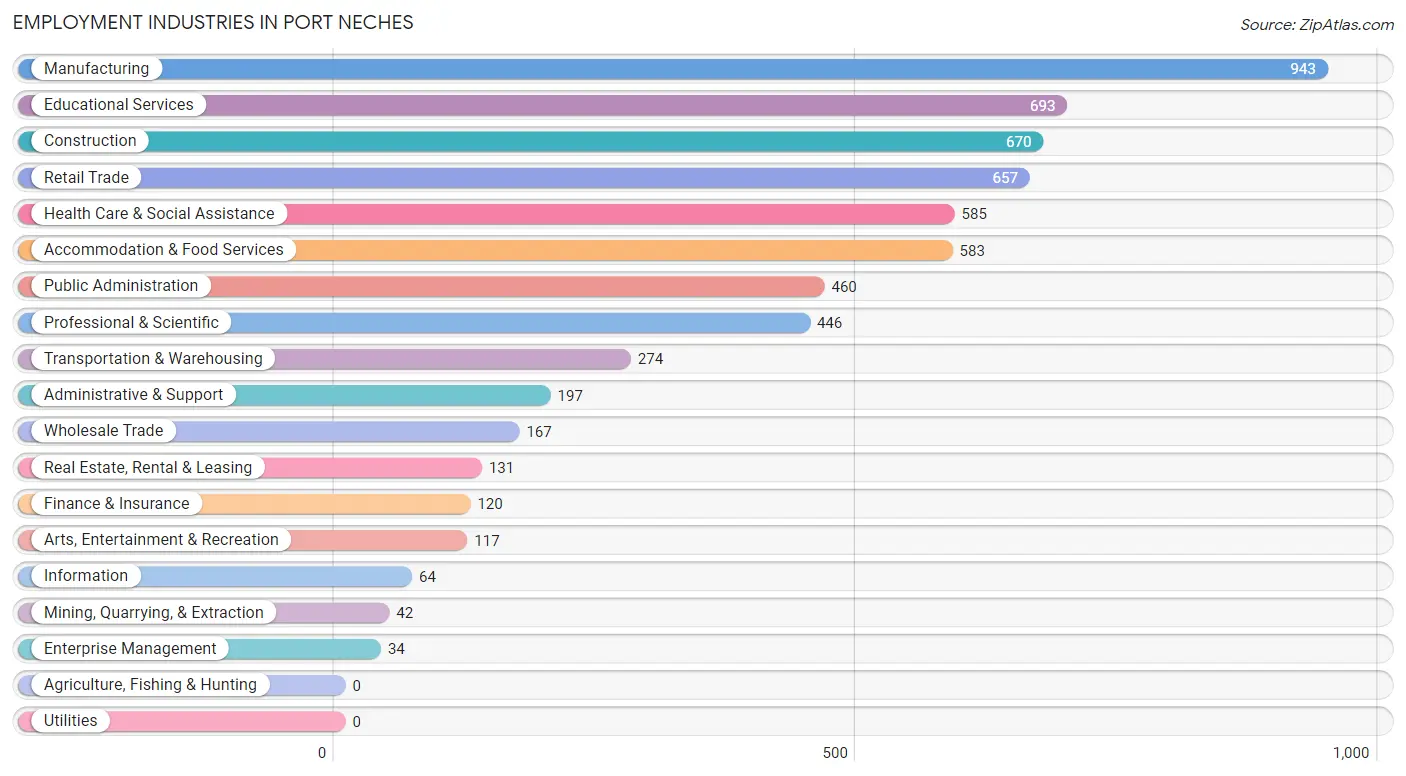
Employment Industries in Port Neches
The major employment industries in Port Neches include Manufacturing (943 | 14.8%), Educational Services (693 | 10.8%), Construction (670 | 10.5%), Retail Trade (657 | 10.3%), and Health Care & Social Assistance (585 | 9.1%).
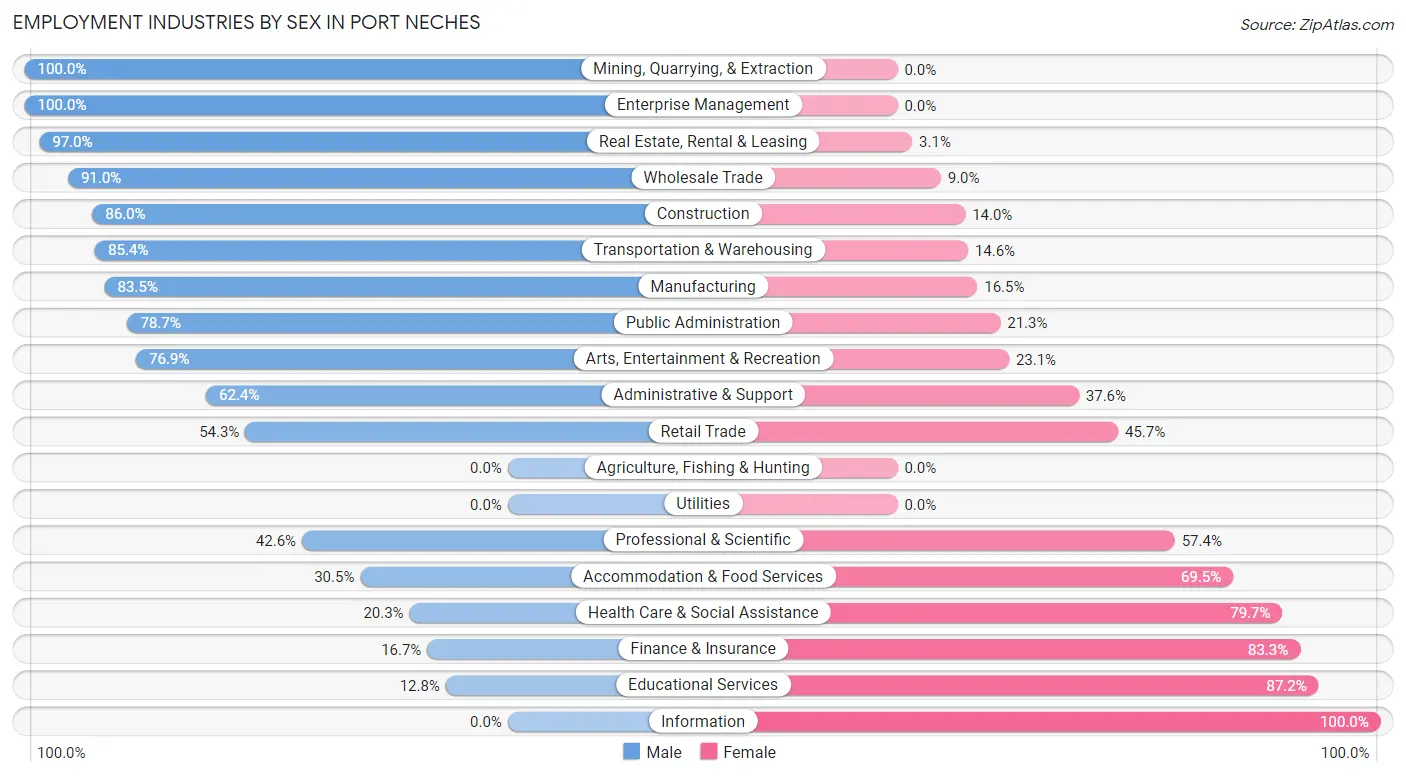
Employment Industries by Sex in Port Neches
The Port Neches industries that see more men than women are Mining, Quarrying, & Extraction (100.0%), Enterprise Management (100.0%), and Real Estate, Rental & Leasing (97.0%), whereas the industries that tend to have a higher number of women are Information (100.0%), Educational Services (87.2%), and Finance & Insurance (83.3%).
| Industry | Male | Female |
| Agriculture, Fishing & Hunting | 0 (0.0%) | 0 (0.0%) |
| Mining, Quarrying, & Extraction | 42 (100.0%) | 0 (0.0%) |
| Construction | 576 (86.0%) | 94 (14.0%) |
| Manufacturing | 787 (83.5%) | 156 (16.5%) |
| Wholesale Trade | 152 (91.0%) | 15 (9.0%) |
| Retail Trade | 357 (54.3%) | 300 (45.7%) |
| Transportation & Warehousing | 234 (85.4%) | 40 (14.6%) |
| Utilities | 0 (0.0%) | 0 (0.0%) |
| Information | 0 (0.0%) | 64 (100.0%) |
| Finance & Insurance | 20 (16.7%) | 100 (83.3%) |
| Real Estate, Rental & Leasing | 127 (97.0%) | 4 (3.0%) |
| Professional & Scientific | 190 (42.6%) | 256 (57.4%) |
| Enterprise Management | 34 (100.0%) | 0 (0.0%) |
| Administrative & Support | 123 (62.4%) | 74 (37.6%) |
| Educational Services | 89 (12.8%) | 604 (87.2%) |
| Health Care & Social Assistance | 119 (20.3%) | 466 (79.7%) |
| Arts, Entertainment & Recreation | 90 (76.9%) | 27 (23.1%) |
| Accommodation & Food Services | 178 (30.5%) | 405 (69.5%) |
| Public Administration | 362 (78.7%) | 98 (21.3%) |
| Total | 3,565 (55.8%) | 2,825 (44.2%) |
Education in Port Neches
School Enrollment in Port Neches
The most common levels of schooling among the 3,257 students in Port Neches are middle school (793 | 24.3%), high school (778 | 23.9%), and college / undergraduate (666 | 20.4%).
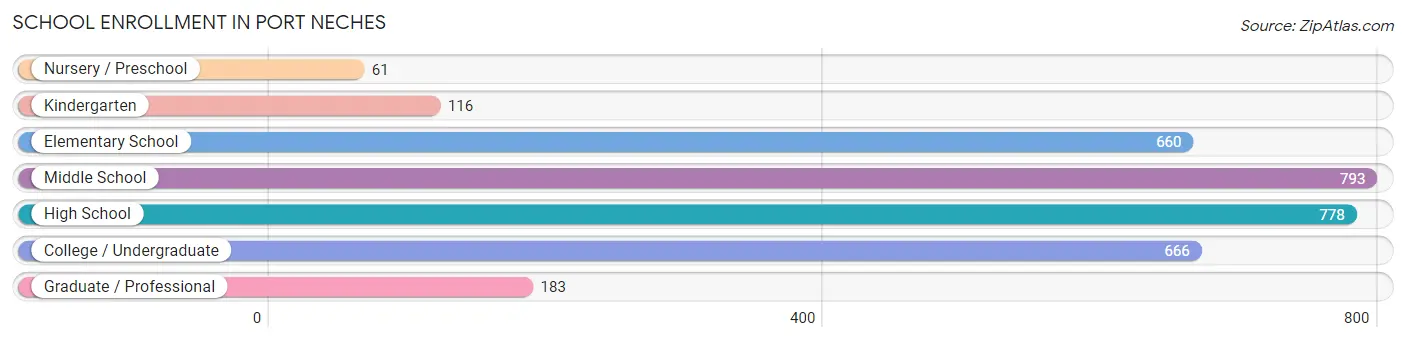
| School Level | # Students | % Students |
| Nursery / Preschool | 61 | 1.9% |
| Kindergarten | 116 | 3.6% |
| Elementary School | 660 | 20.3% |
| Middle School | 793 | 24.3% |
| High School | 778 | 23.9% |
| College / Undergraduate | 666 | 20.4% |
| Graduate / Professional | 183 | 5.6% |
| Total | 3,257 | 100.0% |
School Enrollment by Age by Funding Source in Port Neches
Out of a total of 3,257 students who are enrolled in schools in Port Neches, 306 (9.4%) attend a private institution, while the remaining 2,951 (90.6%) are enrolled in public schools. The age group of 3 to 4 year olds has the highest likelihood of being enrolled in private schools, with 16 (34.0% in the age bracket) enrolled. Conversely, the age group of 18 to 19 year olds has the lowest likelihood of being enrolled in a private school, with 112 (100.0% in the age bracket) attending a public institution.
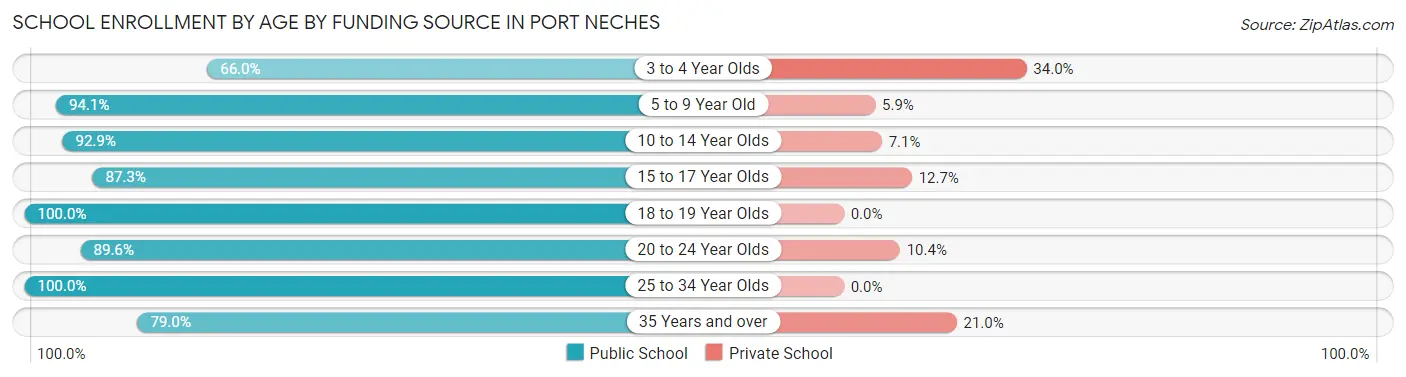
| Age Bracket | Public School | Private School |
| 3 to 4 Year Olds | 31 (66.0%) | 16 (34.0%) |
| 5 to 9 Year Old | 691 (94.1%) | 43 (5.9%) |
| 10 to 14 Year Olds | 905 (92.9%) | 69 (7.1%) |
| 15 to 17 Year Olds | 503 (87.3%) | 73 (12.7%) |
| 18 to 19 Year Olds | 112 (100.0%) | 0 (0.0%) |
| 20 to 24 Year Olds | 386 (89.6%) | 45 (10.4%) |
| 25 to 34 Year Olds | 93 (100.0%) | 0 (0.0%) |
| 35 Years and over | 229 (79.0%) | 61 (21.0%) |
| Total | 2,951 (90.6%) | 306 (9.4%) |
Educational Attainment by Field of Study in Port Neches
Education (600 | 22.8%), business (456 | 17.3%), science & technology (355 | 13.5%), liberal arts & history (249 | 9.5%), and bio, nature & agricultural (243 | 9.2%) are the most common fields of study among 2,634 individuals in Port Neches who have obtained a bachelor's degree or higher.
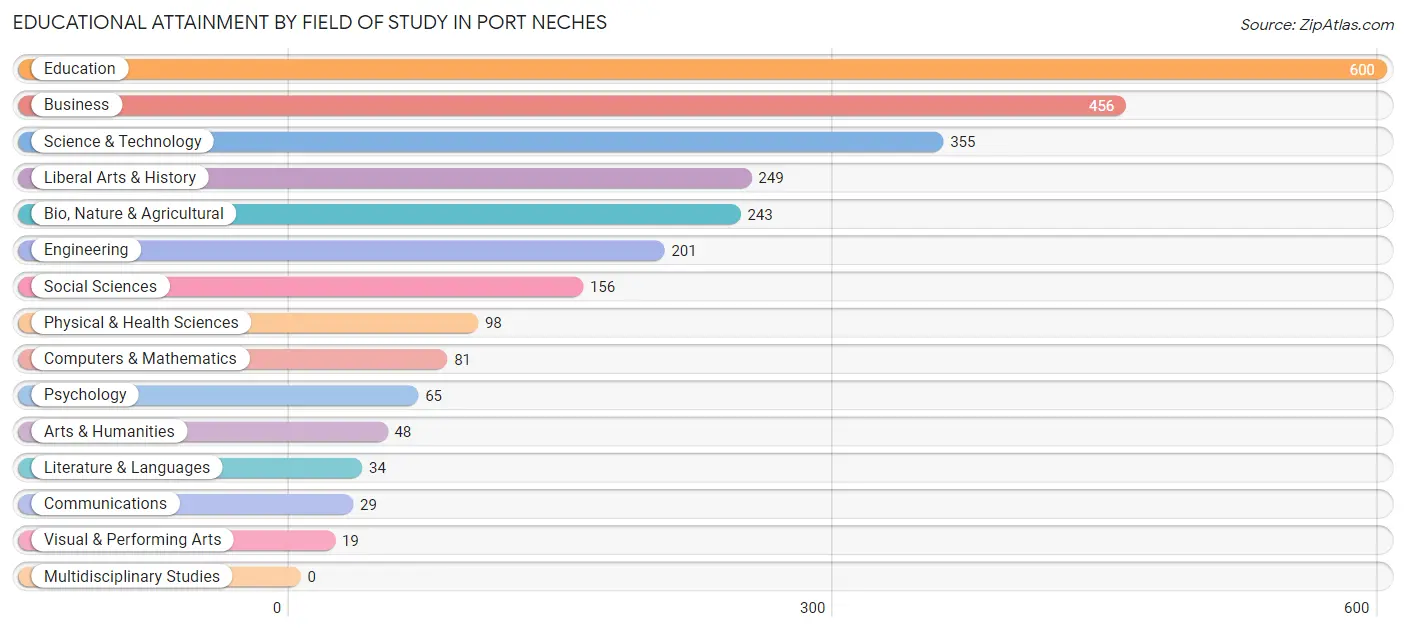
| Field of Study | # Graduates | % Graduates |
| Computers & Mathematics | 81 | 3.1% |
| Bio, Nature & Agricultural | 243 | 9.2% |
| Physical & Health Sciences | 98 | 3.7% |
| Psychology | 65 | 2.5% |
| Social Sciences | 156 | 5.9% |
| Engineering | 201 | 7.6% |
| Multidisciplinary Studies | 0 | 0.0% |
| Science & Technology | 355 | 13.5% |
| Business | 456 | 17.3% |
| Education | 600 | 22.8% |
| Literature & Languages | 34 | 1.3% |
| Liberal Arts & History | 249 | 9.5% |
| Visual & Performing Arts | 19 | 0.7% |
| Communications | 29 | 1.1% |
| Arts & Humanities | 48 | 1.8% |
| Total | 2,634 | 100.0% |
Transportation & Commute in Port Neches
Vehicle Availability by Sex in Port Neches
The most prevalent vehicle ownership categories in Port Neches are males with 2 vehicles (1,635, accounting for 46.3%) and females with 2 vehicles (1,240, making up 61.0%).
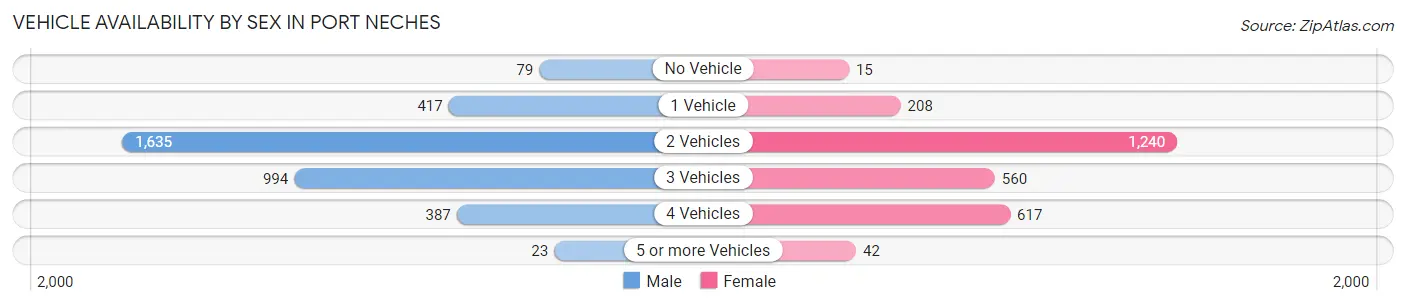
| Vehicles Available | Male | Female |
| No Vehicle | 79 (2.2%) | 15 (0.6%) |
| 1 Vehicle | 417 (11.8%) | 208 (7.8%) |
| 2 Vehicles | 1,635 (46.3%) | 1,240 (46.2%) |
| 3 Vehicles | 994 (28.1%) | 560 (20.9%) |
| 4 Vehicles | 387 (11.0%) | 617 (23.0%) |
| 5 or more Vehicles | 23 (0.6%) | 42 (1.6%) |
| Total | 3,535 (100.0%) | 2,682 (100.0%) |
Commute Time in Port Neches
The most frequently occuring commute durations in Port Neches are 15 to 19 minutes (1,239 commuters, 20.9%), 10 to 14 minutes (1,142 commuters, 19.3%), and 20 to 24 minutes (1,043 commuters, 17.6%).
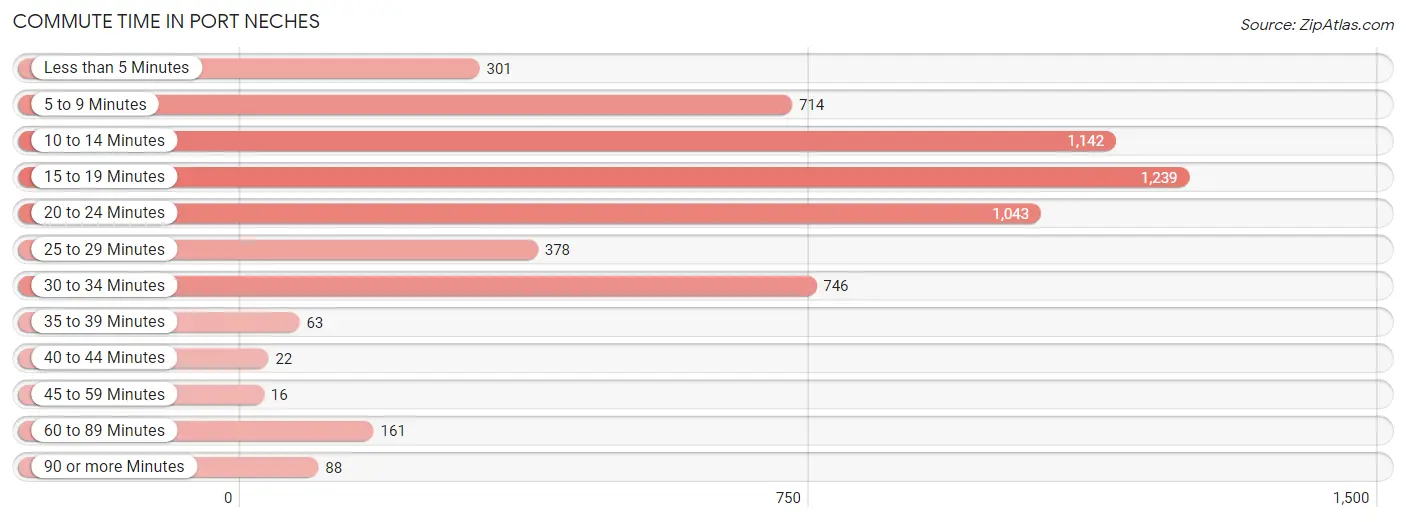
| Commute Time | # Commuters | % Commuters |
| Less than 5 Minutes | 301 | 5.1% |
| 5 to 9 Minutes | 714 | 12.1% |
| 10 to 14 Minutes | 1,142 | 19.3% |
| 15 to 19 Minutes | 1,239 | 20.9% |
| 20 to 24 Minutes | 1,043 | 17.6% |
| 25 to 29 Minutes | 378 | 6.4% |
| 30 to 34 Minutes | 746 | 12.6% |
| 35 to 39 Minutes | 63 | 1.1% |
| 40 to 44 Minutes | 22 | 0.4% |
| 45 to 59 Minutes | 16 | 0.3% |
| 60 to 89 Minutes | 161 | 2.7% |
| 90 or more Minutes | 88 | 1.5% |
Commute Time by Sex in Port Neches
The most common commute times in Port Neches are 15 to 19 minutes (779 commuters, 23.6%) for males and 10 to 14 minutes (646 commuters, 24.7%) for females.
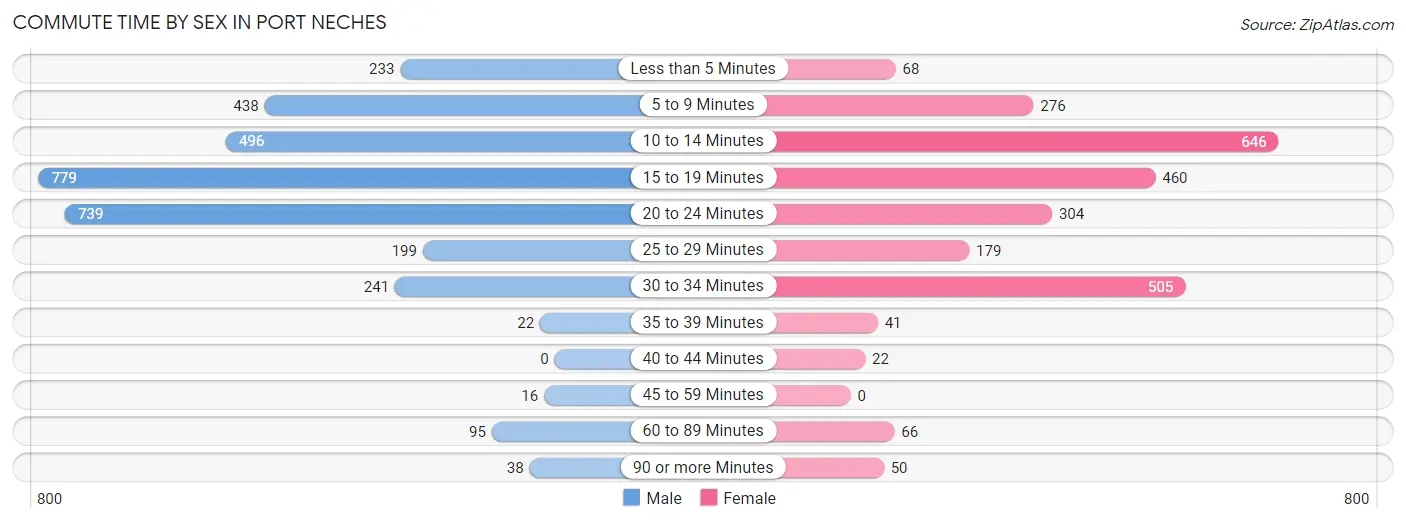
| Commute Time | Male | Female |
| Less than 5 Minutes | 233 (7.1%) | 68 (2.6%) |
| 5 to 9 Minutes | 438 (13.3%) | 276 (10.5%) |
| 10 to 14 Minutes | 496 (15.0%) | 646 (24.7%) |
| 15 to 19 Minutes | 779 (23.6%) | 460 (17.6%) |
| 20 to 24 Minutes | 739 (22.4%) | 304 (11.6%) |
| 25 to 29 Minutes | 199 (6.0%) | 179 (6.8%) |
| 30 to 34 Minutes | 241 (7.3%) | 505 (19.3%) |
| 35 to 39 Minutes | 22 (0.7%) | 41 (1.6%) |
| 40 to 44 Minutes | 0 (0.0%) | 22 (0.8%) |
| 45 to 59 Minutes | 16 (0.5%) | 0 (0.0%) |
| 60 to 89 Minutes | 95 (2.9%) | 66 (2.5%) |
| 90 or more Minutes | 38 (1.1%) | 50 (1.9%) |
Time of Departure to Work by Sex in Port Neches
The most frequent times of departure to work in Port Neches are 6:00 AM to 6:29 AM (599, 18.2%) for males and 7:00 AM to 7:29 AM (680, 26.0%) for females.
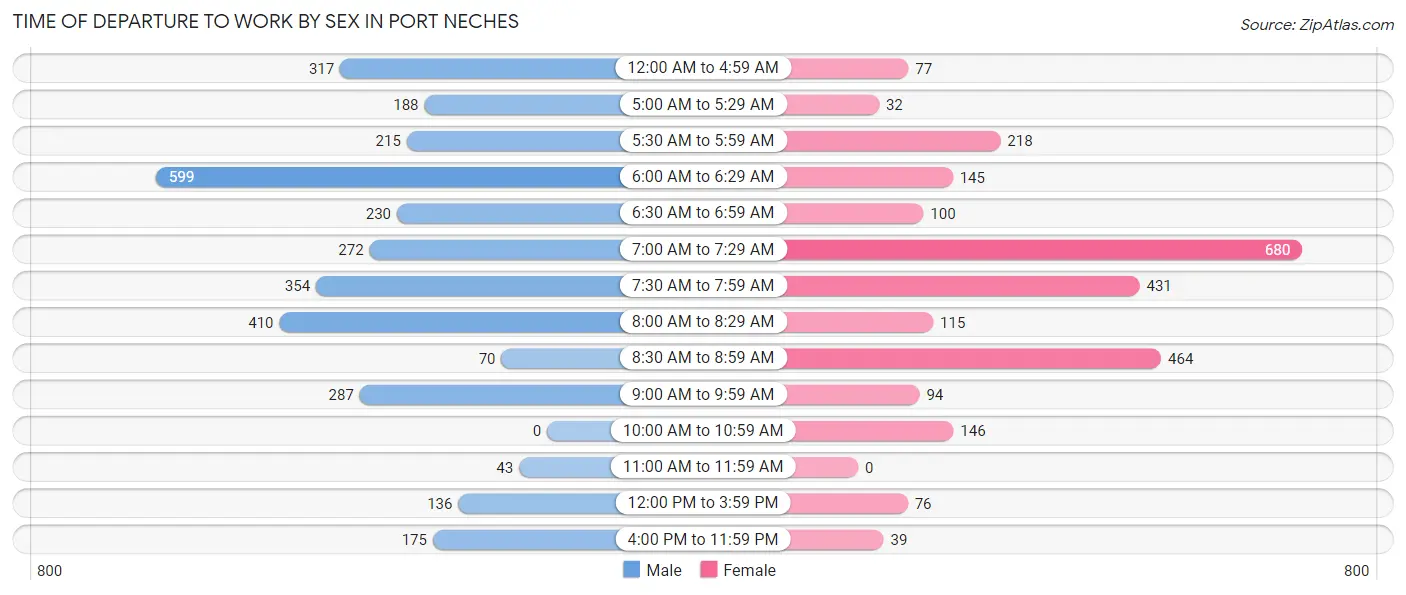
| Time of Departure | Male | Female |
| 12:00 AM to 4:59 AM | 317 (9.6%) | 77 (2.9%) |
| 5:00 AM to 5:29 AM | 188 (5.7%) | 32 (1.2%) |
| 5:30 AM to 5:59 AM | 215 (6.5%) | 218 (8.3%) |
| 6:00 AM to 6:29 AM | 599 (18.2%) | 145 (5.5%) |
| 6:30 AM to 6:59 AM | 230 (7.0%) | 100 (3.8%) |
| 7:00 AM to 7:29 AM | 272 (8.3%) | 680 (26.0%) |
| 7:30 AM to 7:59 AM | 354 (10.7%) | 431 (16.5%) |
| 8:00 AM to 8:29 AM | 410 (12.4%) | 115 (4.4%) |
| 8:30 AM to 8:59 AM | 70 (2.1%) | 464 (17.7%) |
| 9:00 AM to 9:59 AM | 287 (8.7%) | 94 (3.6%) |
| 10:00 AM to 10:59 AM | 0 (0.0%) | 146 (5.6%) |
| 11:00 AM to 11:59 AM | 43 (1.3%) | 0 (0.0%) |
| 12:00 PM to 3:59 PM | 136 (4.1%) | 76 (2.9%) |
| 4:00 PM to 11:59 PM | 175 (5.3%) | 39 (1.5%) |
| Total | 3,296 (100.0%) | 2,617 (100.0%) |
Housing Occupancy in Port Neches
Occupancy by Ownership in Port Neches
Of the total 4,936 dwellings in Port Neches, owner-occupied units account for 3,743 (75.8%), while renter-occupied units make up 1,193 (24.2%).
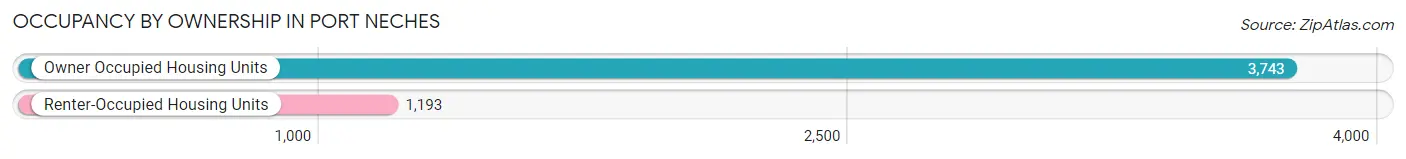
| Occupancy | # Housing Units | % Housing Units |
| Owner Occupied Housing Units | 3,743 | 75.8% |
| Renter-Occupied Housing Units | 1,193 | 24.2% |
| Total Occupied Housing Units | 4,936 | 100.0% |
Occupancy by Household Size in Port Neches
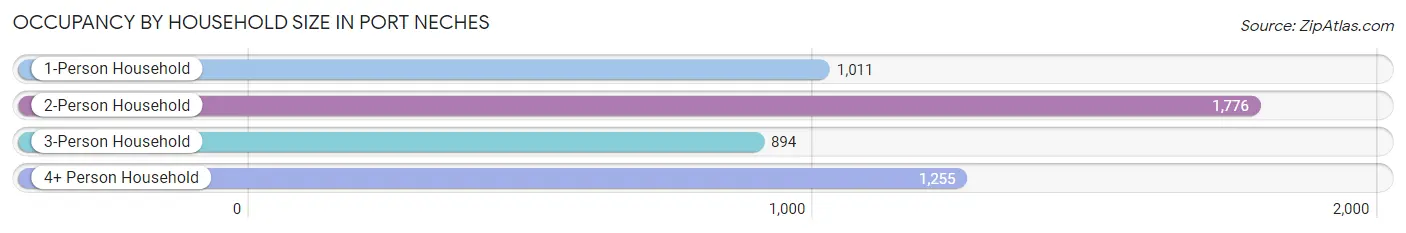
| Household Size | # Housing Units | % Housing Units |
| 1-Person Household | 1,011 | 20.5% |
| 2-Person Household | 1,776 | 36.0% |
| 3-Person Household | 894 | 18.1% |
| 4+ Person Household | 1,255 | 25.4% |
| Total Housing Units | 4,936 | 100.0% |
Occupancy by Ownership by Household Size in Port Neches
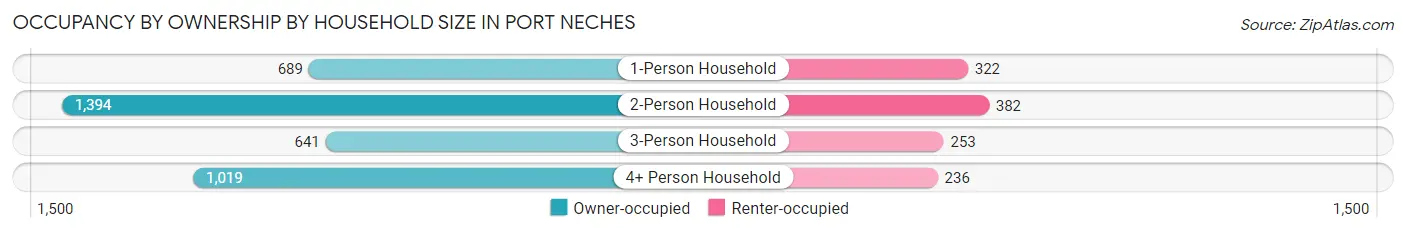
| Household Size | Owner-occupied | Renter-occupied |
| 1-Person Household | 689 (68.1%) | 322 (31.9%) |
| 2-Person Household | 1,394 (78.5%) | 382 (21.5%) |
| 3-Person Household | 641 (71.7%) | 253 (28.3%) |
| 4+ Person Household | 1,019 (81.2%) | 236 (18.8%) |
| Total Housing Units | 3,743 (75.8%) | 1,193 (24.2%) |
Occupancy by Educational Attainment in Port Neches
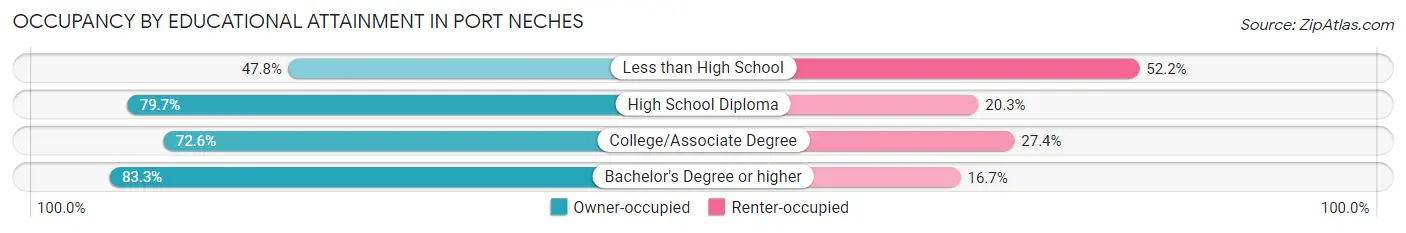
| Household Size | Owner-occupied | Renter-occupied |
| Less than High School | 142 (47.8%) | 155 (52.2%) |
| High School Diploma | 696 (79.7%) | 177 (20.3%) |
| College/Associate Degree | 1,571 (72.6%) | 593 (27.4%) |
| Bachelor's Degree or higher | 1,334 (83.3%) | 268 (16.7%) |
Occupancy by Age of Householder in Port Neches
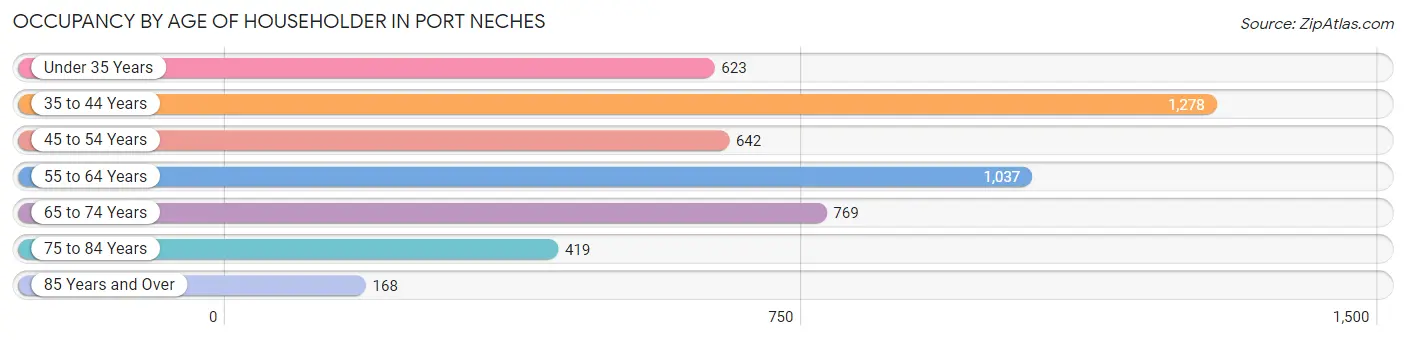
| Age Bracket | # Households | % Households |
| Under 35 Years | 623 | 12.6% |
| 35 to 44 Years | 1,278 | 25.9% |
| 45 to 54 Years | 642 | 13.0% |
| 55 to 64 Years | 1,037 | 21.0% |
| 65 to 74 Years | 769 | 15.6% |
| 75 to 84 Years | 419 | 8.5% |
| 85 Years and Over | 168 | 3.4% |
| Total | 4,936 | 100.0% |
Housing Finances in Port Neches
Median Income by Occupancy in Port Neches

| Occupancy Type | # Households | Median Income |
| Owner-Occupied | 3,743 (75.8%) | $97,157 |
| Renter-Occupied | 1,193 (24.2%) | $55,221 |
| Average | 4,936 (100.0%) | $85,086 |
Occupancy by Householder Income Bracket in Port Neches
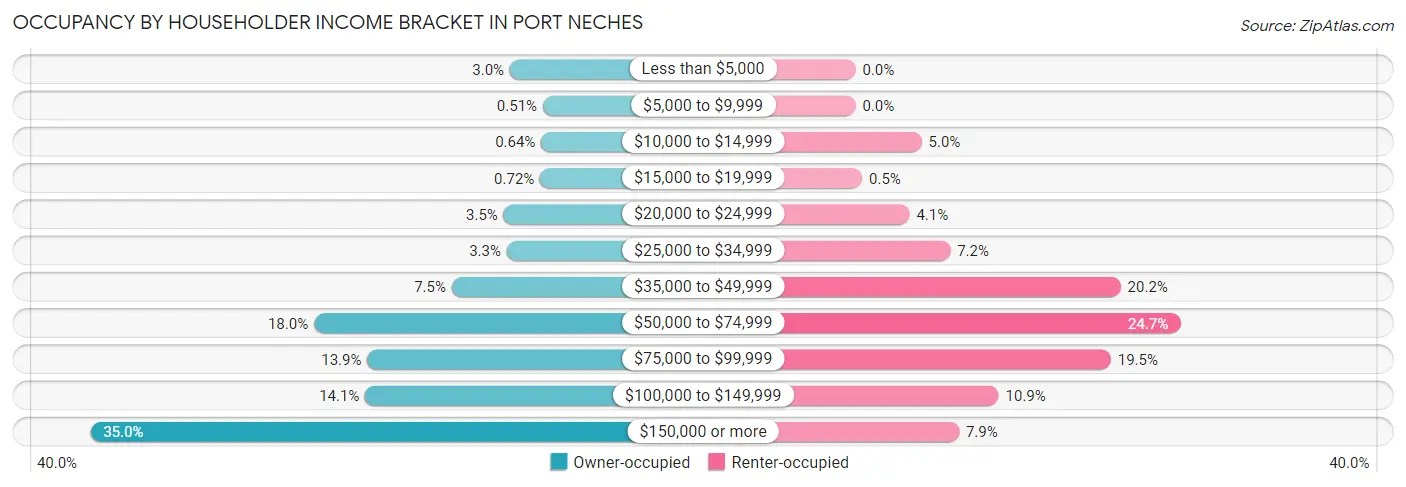
| Income Bracket | Owner-occupied | Renter-occupied |
| Less than $5,000 | 113 (3.0%) | 0 (0.0%) |
| $5,000 to $9,999 | 19 (0.5%) | 0 (0.0%) |
| $10,000 to $14,999 | 24 (0.6%) | 60 (5.0%) |
| $15,000 to $19,999 | 27 (0.7%) | 6 (0.5%) |
| $20,000 to $24,999 | 131 (3.5%) | 49 (4.1%) |
| $25,000 to $34,999 | 122 (3.3%) | 86 (7.2%) |
| $35,000 to $49,999 | 279 (7.4%) | 241 (20.2%) |
| $50,000 to $74,999 | 672 (17.9%) | 295 (24.7%) |
| $75,000 to $99,999 | 520 (13.9%) | 232 (19.5%) |
| $100,000 to $149,999 | 526 (14.1%) | 130 (10.9%) |
| $150,000 or more | 1,310 (35.0%) | 94 (7.9%) |
| Total | 3,743 (100.0%) | 1,193 (100.0%) |
Monthly Housing Cost Tiers in Port Neches
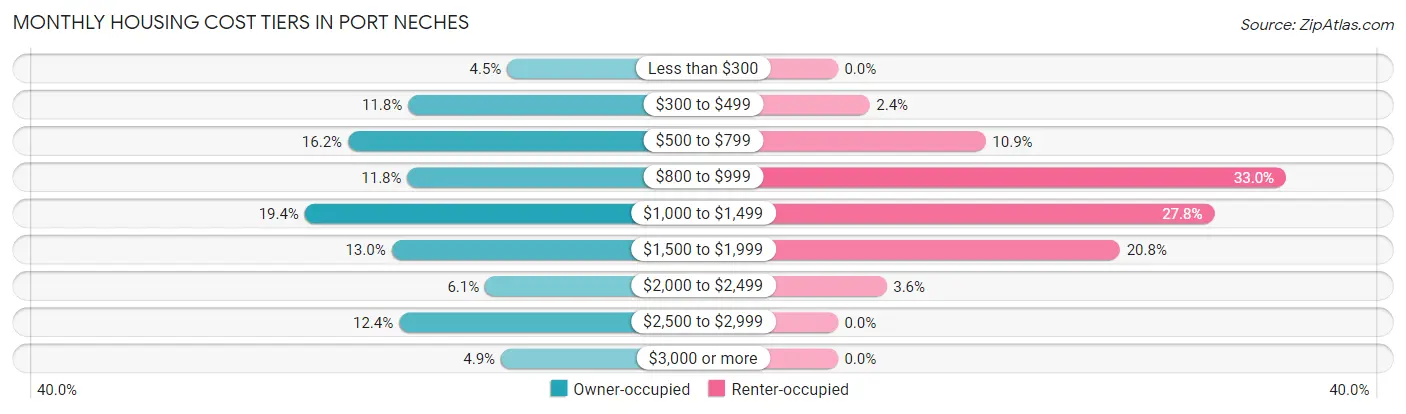
| Monthly Cost | Owner-occupied | Renter-occupied |
| Less than $300 | 167 (4.5%) | 0 (0.0%) |
| $300 to $499 | 440 (11.8%) | 28 (2.4%) |
| $500 to $799 | 606 (16.2%) | 130 (10.9%) |
| $800 to $999 | 442 (11.8%) | 394 (33.0%) |
| $1,000 to $1,499 | 725 (19.4%) | 331 (27.8%) |
| $1,500 to $1,999 | 486 (13.0%) | 248 (20.8%) |
| $2,000 to $2,499 | 228 (6.1%) | 43 (3.6%) |
| $2,500 to $2,999 | 465 (12.4%) | 0 (0.0%) |
| $3,000 or more | 184 (4.9%) | 0 (0.0%) |
| Total | 3,743 (100.0%) | 1,193 (100.0%) |
Physical Housing Characteristics in Port Neches
Housing Structures in Port Neches
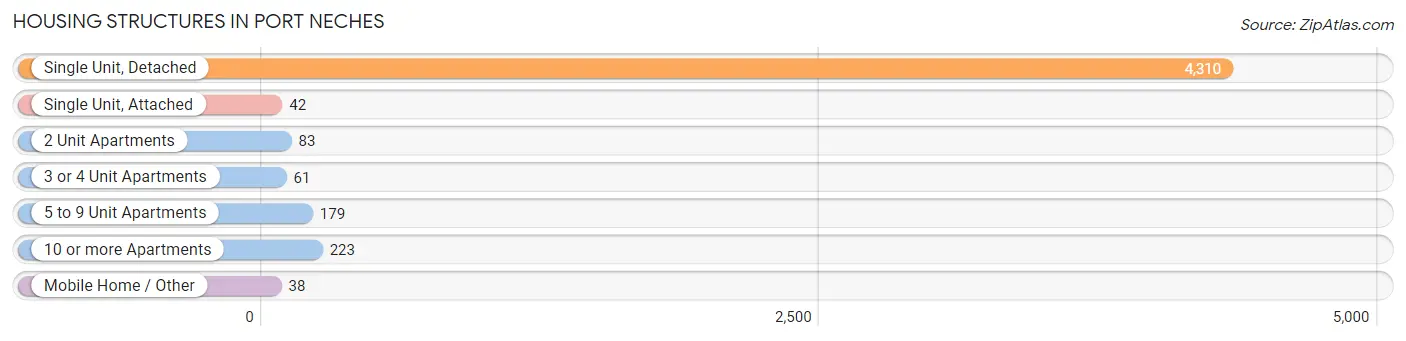
| Structure Type | # Housing Units | % Housing Units |
| Single Unit, Detached | 4,310 | 87.3% |
| Single Unit, Attached | 42 | 0.9% |
| 2 Unit Apartments | 83 | 1.7% |
| 3 or 4 Unit Apartments | 61 | 1.2% |
| 5 to 9 Unit Apartments | 179 | 3.6% |
| 10 or more Apartments | 223 | 4.5% |
| Mobile Home / Other | 38 | 0.8% |
| Total | 4,936 | 100.0% |
Housing Structures by Occupancy in Port Neches
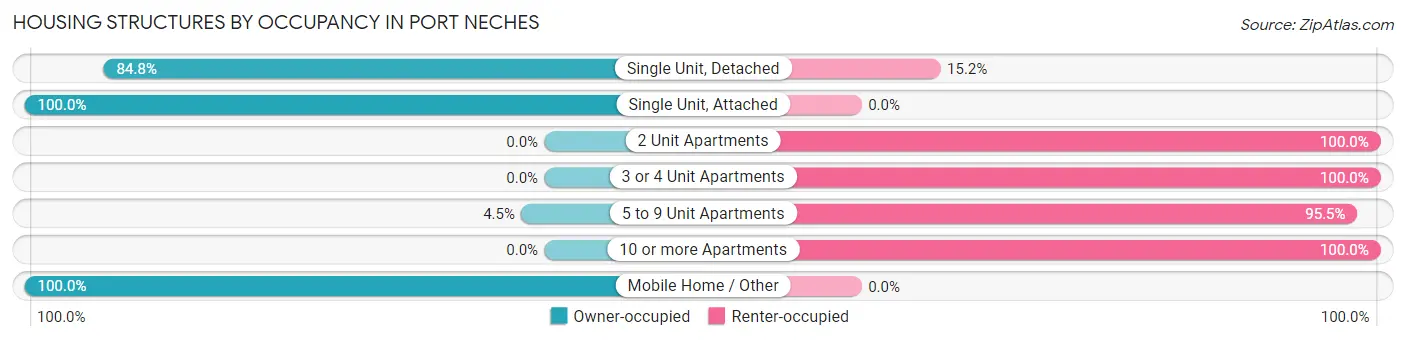
| Structure Type | Owner-occupied | Renter-occupied |
| Single Unit, Detached | 3,655 (84.8%) | 655 (15.2%) |
| Single Unit, Attached | 42 (100.0%) | 0 (0.0%) |
| 2 Unit Apartments | 0 (0.0%) | 83 (100.0%) |
| 3 or 4 Unit Apartments | 0 (0.0%) | 61 (100.0%) |
| 5 to 9 Unit Apartments | 8 (4.5%) | 171 (95.5%) |
| 10 or more Apartments | 0 (0.0%) | 223 (100.0%) |
| Mobile Home / Other | 38 (100.0%) | 0 (0.0%) |
| Total | 3,743 (75.8%) | 1,193 (24.2%) |
Housing Structures by Number of Rooms in Port Neches
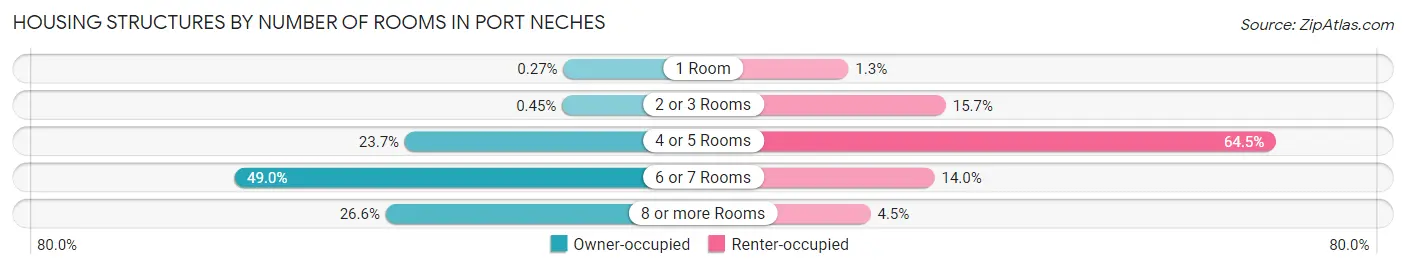
| Number of Rooms | Owner-occupied | Renter-occupied |
| 1 Room | 10 (0.3%) | 15 (1.3%) |
| 2 or 3 Rooms | 17 (0.4%) | 187 (15.7%) |
| 4 or 5 Rooms | 888 (23.7%) | 770 (64.5%) |
| 6 or 7 Rooms | 1,834 (49.0%) | 167 (14.0%) |
| 8 or more Rooms | 994 (26.6%) | 54 (4.5%) |
| Total | 3,743 (100.0%) | 1,193 (100.0%) |
Housing Structure by Heating Type in Port Neches
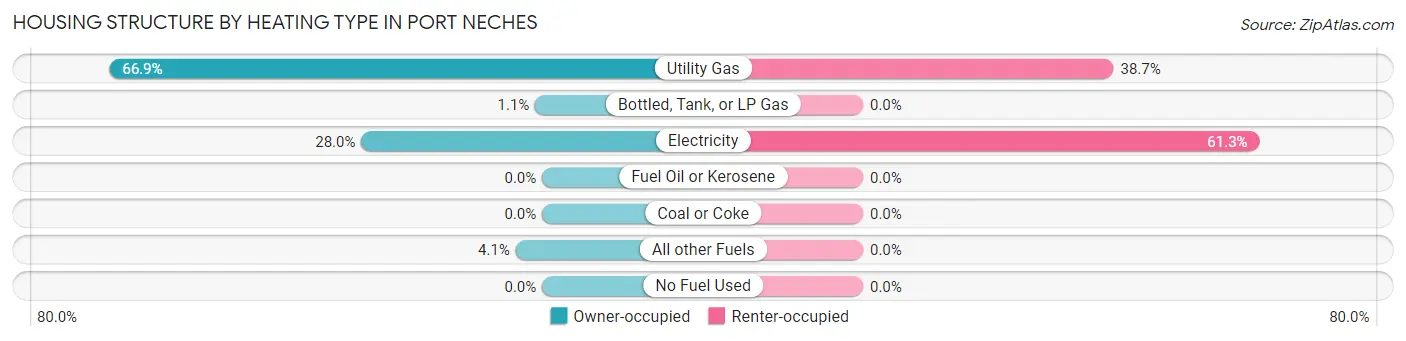
| Heating Type | Owner-occupied | Renter-occupied |
| Utility Gas | 2,504 (66.9%) | 462 (38.7%) |
| Bottled, Tank, or LP Gas | 40 (1.1%) | 0 (0.0%) |
| Electricity | 1,046 (28.0%) | 731 (61.3%) |
| Fuel Oil or Kerosene | 0 (0.0%) | 0 (0.0%) |
| Coal or Coke | 0 (0.0%) | 0 (0.0%) |
| All other Fuels | 153 (4.1%) | 0 (0.0%) |
| No Fuel Used | 0 (0.0%) | 0 (0.0%) |
| Total | 3,743 (100.0%) | 1,193 (100.0%) |
Household Vehicle Usage in Port Neches
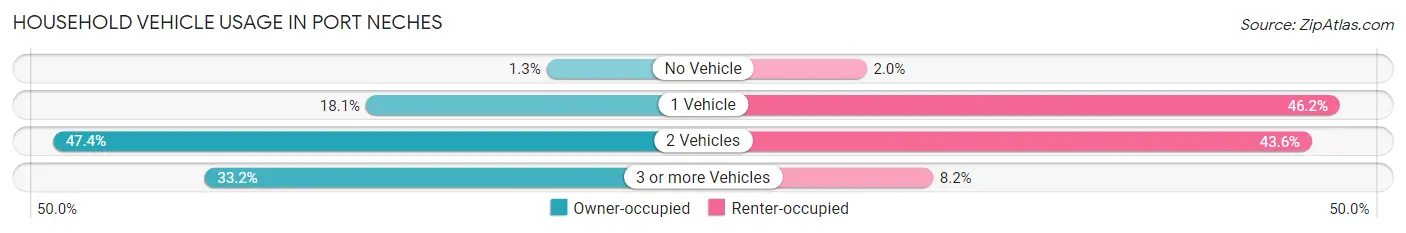
| Vehicles per Household | Owner-occupied | Renter-occupied |
| No Vehicle | 48 (1.3%) | 24 (2.0%) |
| 1 Vehicle | 679 (18.1%) | 551 (46.2%) |
| 2 Vehicles | 1,773 (47.4%) | 520 (43.6%) |
| 3 or more Vehicles | 1,243 (33.2%) | 98 (8.2%) |
| Total | 3,743 (100.0%) | 1,193 (100.0%) |
Real Estate & Mortgages in Port Neches
Real Estate and Mortgage Overview in Port Neches
| Characteristic | Without Mortgage | With Mortgage |
| Housing Units | 1,938 | 1,805 |
| Median Property Value | $205,300 | $245,700 |
| Median Household Income | $69,769 | $953 |
| Monthly Housing Costs | $661 | $184 |
| Real Estate Taxes | $2,928 | $161 |
Property Value by Mortgage Status in Port Neches
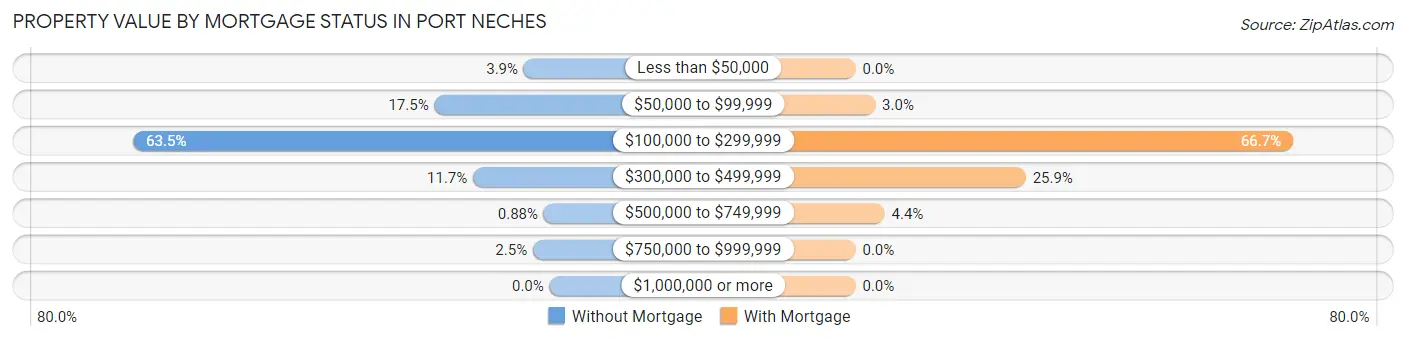
| Property Value | Without Mortgage | With Mortgage |
| Less than $50,000 | 76 (3.9%) | 0 (0.0%) |
| $50,000 to $99,999 | 340 (17.5%) | 54 (3.0%) |
| $100,000 to $299,999 | 1,230 (63.5%) | 1,203 (66.6%) |
| $300,000 to $499,999 | 226 (11.7%) | 468 (25.9%) |
| $500,000 to $749,999 | 17 (0.9%) | 80 (4.4%) |
| $750,000 to $999,999 | 49 (2.5%) | 0 (0.0%) |
| $1,000,000 or more | 0 (0.0%) | 0 (0.0%) |
| Total | 1,938 (100.0%) | 1,805 (100.0%) |
Household Income by Mortgage Status in Port Neches
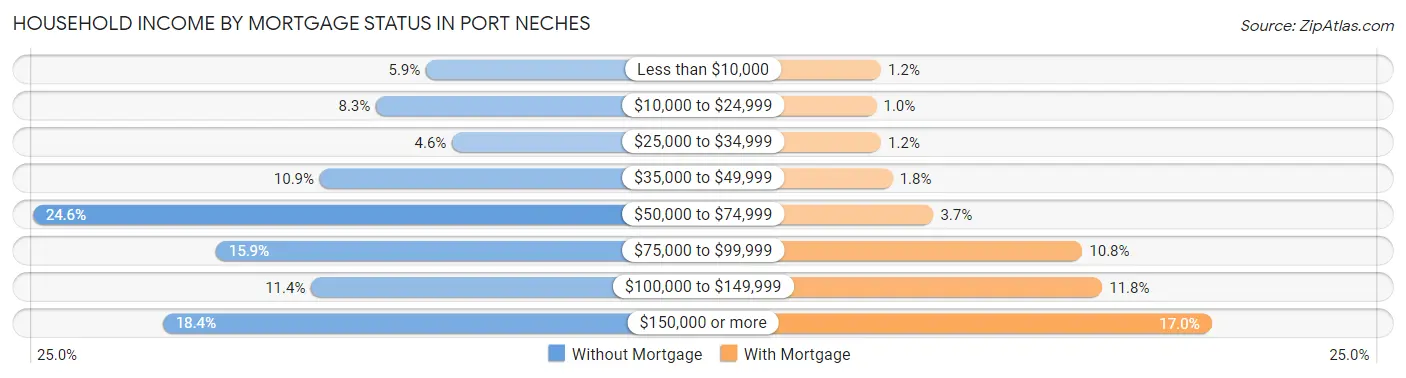
| Household Income | Without Mortgage | With Mortgage |
| Less than $10,000 | 114 (5.9%) | 22 (1.2%) |
| $10,000 to $24,999 | 160 (8.3%) | 18 (1.0%) |
| $25,000 to $34,999 | 90 (4.6%) | 22 (1.2%) |
| $35,000 to $49,999 | 212 (10.9%) | 32 (1.8%) |
| $50,000 to $74,999 | 477 (24.6%) | 67 (3.7%) |
| $75,000 to $99,999 | 308 (15.9%) | 195 (10.8%) |
| $100,000 to $149,999 | 220 (11.4%) | 212 (11.7%) |
| $150,000 or more | 357 (18.4%) | 306 (17.0%) |
| Total | 1,938 (100.0%) | 1,805 (100.0%) |
Property Value to Household Income Ratio in Port Neches
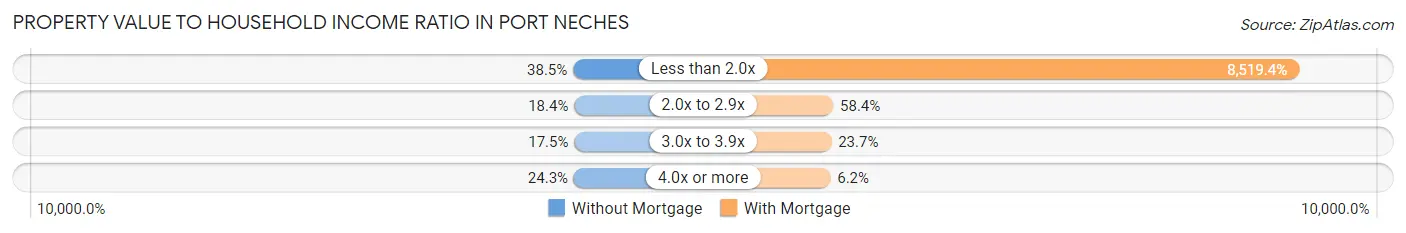
| Value-to-Income Ratio | Without Mortgage | With Mortgage |
| Less than 2.0x | 746 (38.5%) | 153,775 (8,519.4%) |
| 2.0x to 2.9x | 356 (18.4%) | 1,054 (58.4%) |
| 3.0x to 3.9x | 339 (17.5%) | 427 (23.7%) |
| 4.0x or more | 470 (24.2%) | 112 (6.2%) |
| Total | 1,938 (100.0%) | 1,805 (100.0%) |
Real Estate Taxes by Mortgage Status in Port Neches
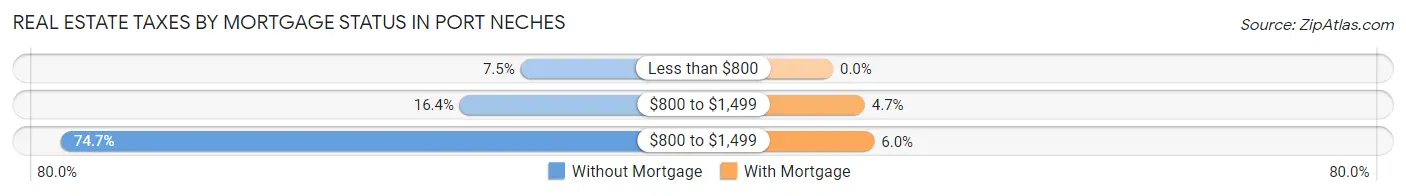
| Property Taxes | Without Mortgage | With Mortgage |
| Less than $800 | 146 (7.5%) | 0 (0.0%) |
| $800 to $1,499 | 318 (16.4%) | 84 (4.6%) |
| $800 to $1,499 | 1,447 (74.7%) | 109 (6.0%) |
| Total | 1,938 (100.0%) | 1,805 (100.0%) |
Health & Disability in Port Neches
Health Insurance Coverage by Age in Port Neches
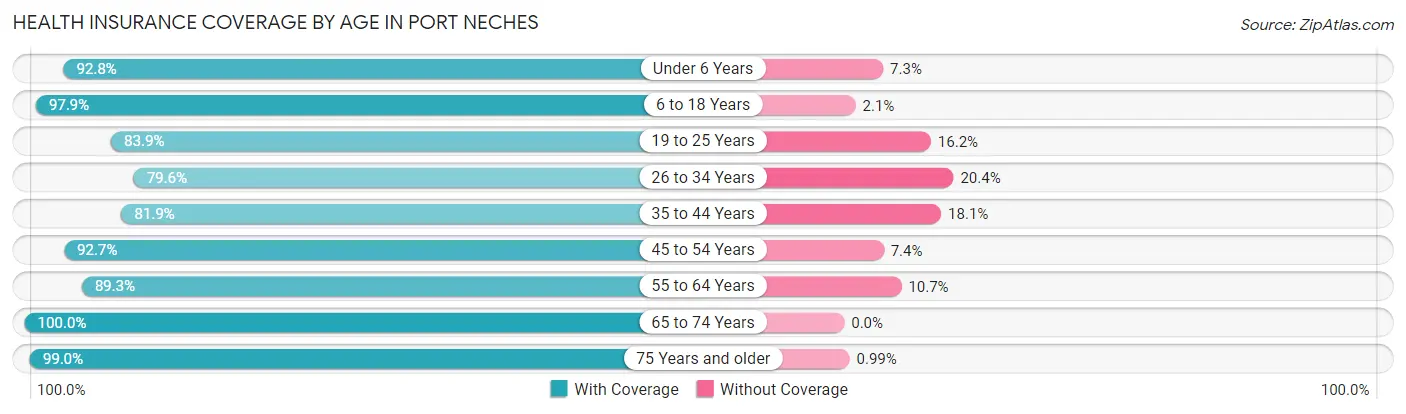
| Age Bracket | With Coverage | Without Coverage |
| Under 6 Years | 1,037 (92.7%) | 81 (7.2%) |
| 6 to 18 Years | 2,323 (97.9%) | 50 (2.1%) |
| 19 to 25 Years | 872 (83.9%) | 168 (16.2%) |
| 26 to 34 Years | 1,072 (79.6%) | 274 (20.4%) |
| 35 to 44 Years | 2,073 (81.9%) | 457 (18.1%) |
| 45 to 54 Years | 1,197 (92.6%) | 95 (7.3%) |
| 55 to 64 Years | 1,617 (89.3%) | 193 (10.7%) |
| 65 to 74 Years | 1,221 (100.0%) | 0 (0.0%) |
| 75 Years and older | 896 (99.0%) | 9 (1.0%) |
| Total | 12,308 (90.3%) | 1,327 (9.7%) |
Health Insurance Coverage by Citizenship Status in Port Neches
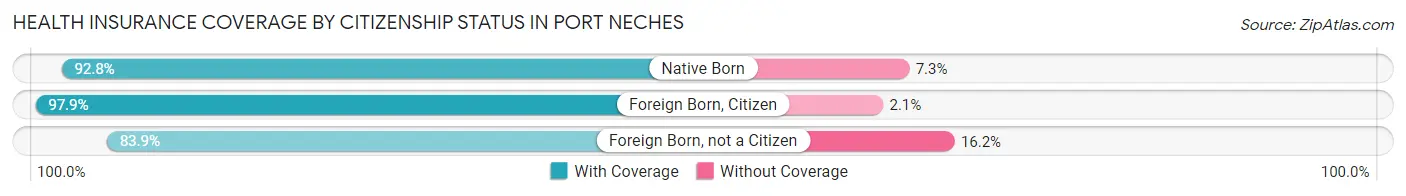
| Citizenship Status | With Coverage | Without Coverage |
| Native Born | 1,037 (92.7%) | 81 (7.2%) |
| Foreign Born, Citizen | 2,323 (97.9%) | 50 (2.1%) |
| Foreign Born, not a Citizen | 872 (83.9%) | 168 (16.2%) |
Health Insurance Coverage by Household Income in Port Neches
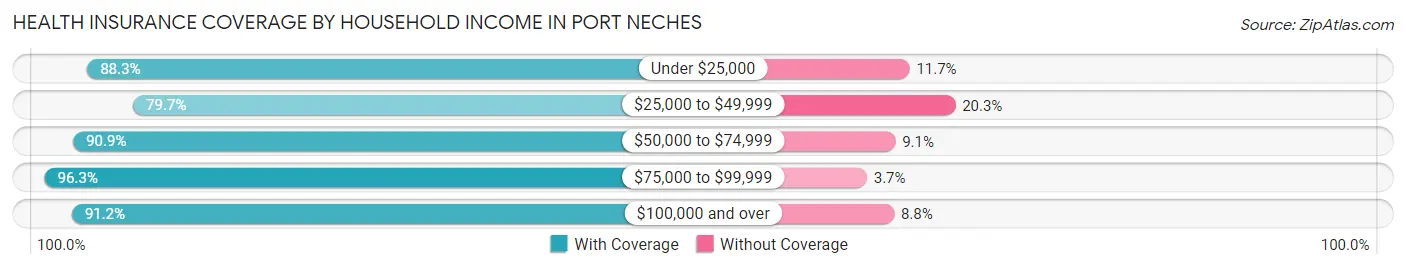
| Household Income | With Coverage | Without Coverage |
| Under $25,000 | 752 (88.3%) | 100 (11.7%) |
| $25,000 to $49,999 | 1,287 (79.7%) | 328 (20.3%) |
| $50,000 to $74,999 | 2,155 (90.9%) | 215 (9.1%) |
| $75,000 to $99,999 | 1,774 (96.3%) | 69 (3.7%) |
| $100,000 and over | 6,340 (91.2%) | 615 (8.8%) |
Public vs Private Health Insurance Coverage by Age in Port Neches
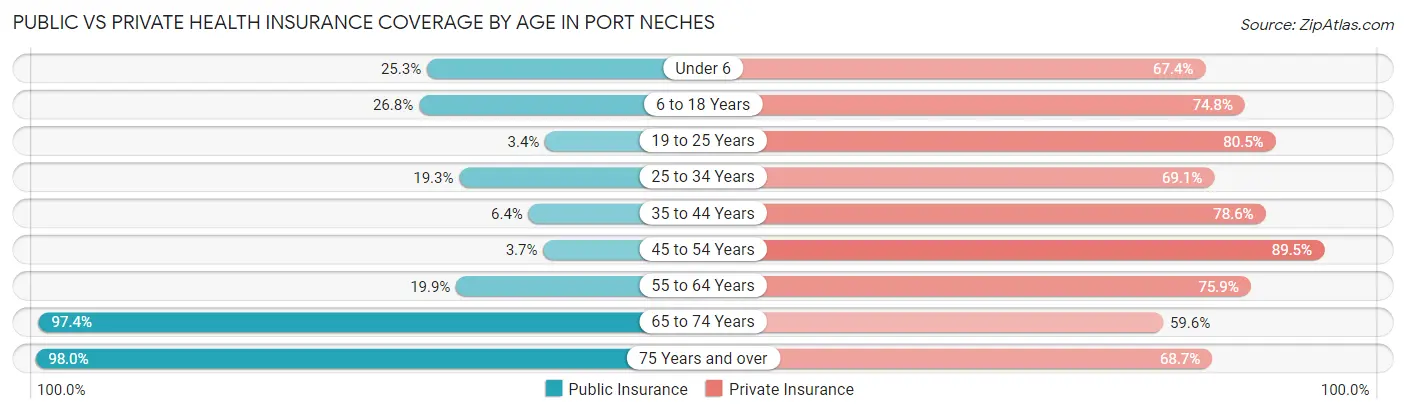
| Age Bracket | Public Insurance | Private Insurance |
| Under 6 | 283 (25.3%) | 754 (67.4%) |
| 6 to 18 Years | 636 (26.8%) | 1,775 (74.8%) |
| 19 to 25 Years | 35 (3.4%) | 837 (80.5%) |
| 25 to 34 Years | 260 (19.3%) | 930 (69.1%) |
| 35 to 44 Years | 163 (6.4%) | 1,989 (78.6%) |
| 45 to 54 Years | 48 (3.7%) | 1,156 (89.5%) |
| 55 to 64 Years | 360 (19.9%) | 1,373 (75.9%) |
| 65 to 74 Years | 1,189 (97.4%) | 728 (59.6%) |
| 75 Years and over | 887 (98.0%) | 622 (68.7%) |
| Total | 3,861 (28.3%) | 10,164 (74.5%) |
Disability Status by Sex by Age in Port Neches
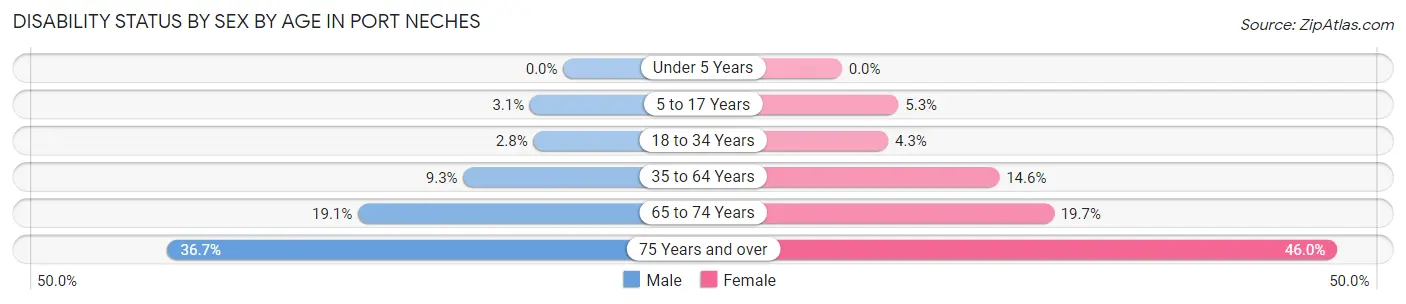
| Age Bracket | Male | Female |
| Under 5 Years | 0 (0.0%) | 0 (0.0%) |
| 5 to 17 Years | 35 (3.1%) | 64 (5.2%) |
| 18 to 34 Years | 34 (2.8%) | 55 (4.3%) |
| 35 to 64 Years | 276 (9.3%) | 388 (14.6%) |
| 65 to 74 Years | 96 (19.1%) | 141 (19.7%) |
| 75 Years and over | 159 (36.7%) | 217 (46.0%) |
Disability Class by Sex by Age in Port Neches
Disability Class: Hearing Difficulty
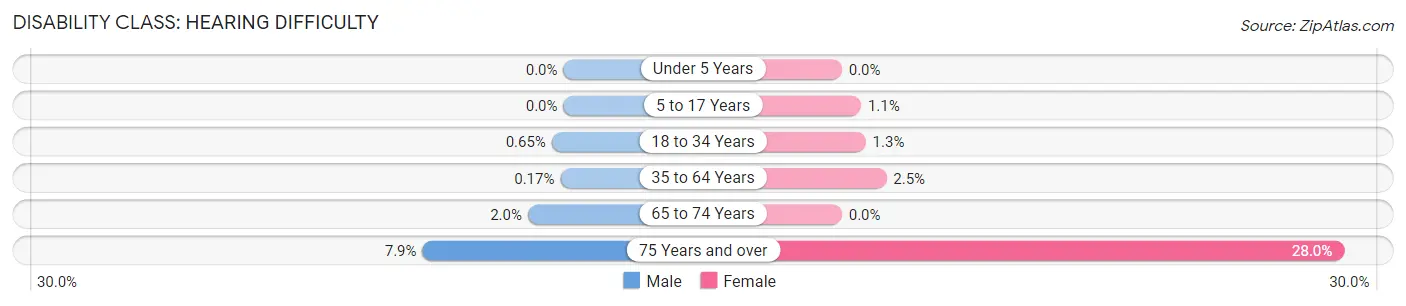
| Age Bracket | Male | Female |
| Under 5 Years | 0 (0.0%) | 0 (0.0%) |
| 5 to 17 Years | 0 (0.0%) | 13 (1.1%) |
| 18 to 34 Years | 8 (0.6%) | 17 (1.3%) |
| 35 to 64 Years | 5 (0.2%) | 66 (2.5%) |
| 65 to 74 Years | 10 (2.0%) | 0 (0.0%) |
| 75 Years and over | 34 (7.9%) | 132 (28.0%) |
Disability Class: Vision Difficulty
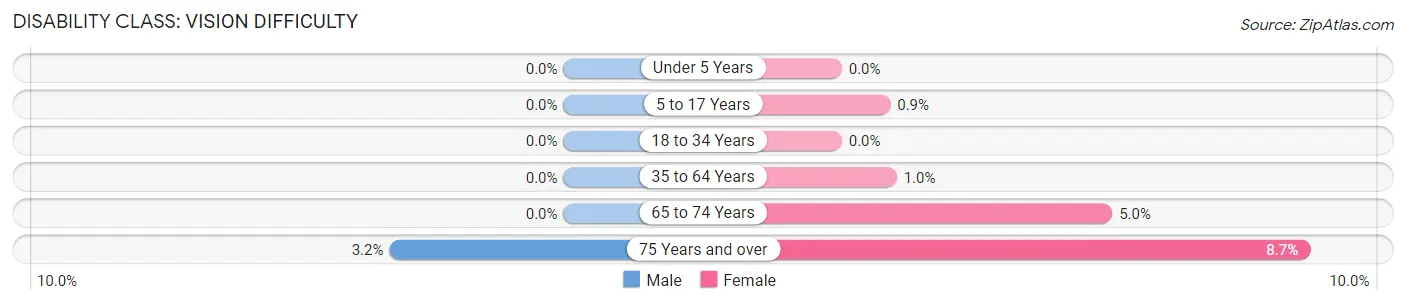
| Age Bracket | Male | Female |
| Under 5 Years | 0 (0.0%) | 0 (0.0%) |
| 5 to 17 Years | 0 (0.0%) | 11 (0.9%) |
| 18 to 34 Years | 0 (0.0%) | 0 (0.0%) |
| 35 to 64 Years | 0 (0.0%) | 27 (1.0%) |
| 65 to 74 Years | 0 (0.0%) | 36 (5.0%) |
| 75 Years and over | 14 (3.2%) | 41 (8.7%) |
Disability Class: Cognitive Difficulty
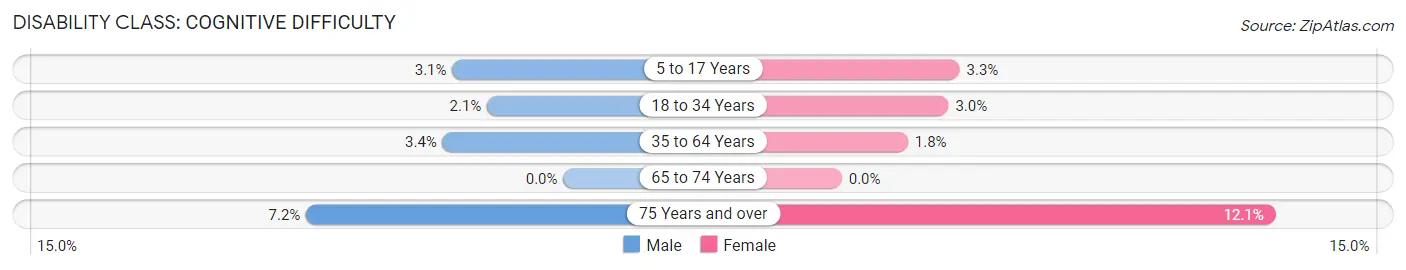
| Age Bracket | Male | Female |
| 5 to 17 Years | 35 (3.1%) | 40 (3.3%) |
| 18 to 34 Years | 26 (2.1%) | 38 (3.0%) |
| 35 to 64 Years | 100 (3.4%) | 49 (1.8%) |
| 65 to 74 Years | 0 (0.0%) | 0 (0.0%) |
| 75 Years and over | 31 (7.2%) | 57 (12.1%) |
Disability Class: Ambulatory Difficulty
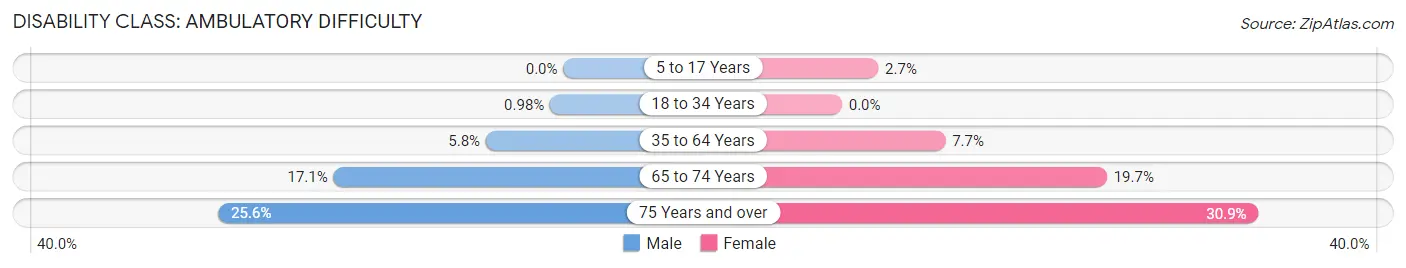
| Age Bracket | Male | Female |
| 5 to 17 Years | 0 (0.0%) | 33 (2.7%) |
| 18 to 34 Years | 12 (1.0%) | 0 (0.0%) |
| 35 to 64 Years | 171 (5.8%) | 204 (7.7%) |
| 65 to 74 Years | 86 (17.1%) | 141 (19.7%) |
| 75 Years and over | 111 (25.6%) | 146 (30.9%) |
Disability Class: Self-Care Difficulty
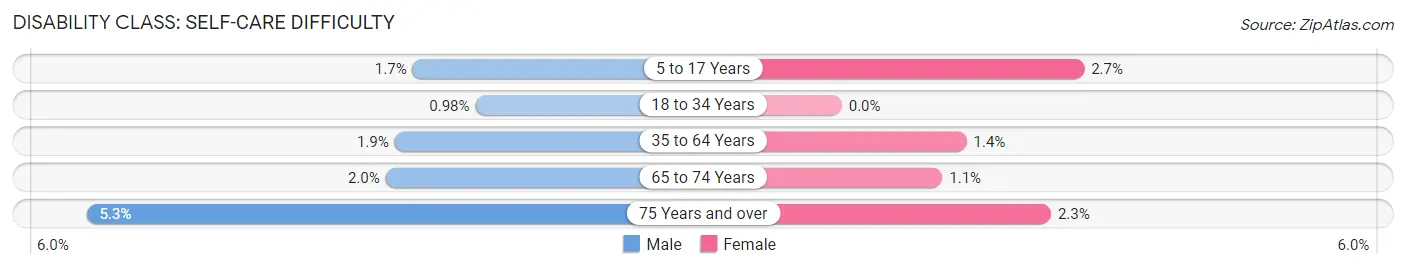
| Age Bracket | Male | Female |
| 5 to 17 Years | 19 (1.7%) | 33 (2.7%) |
| 18 to 34 Years | 12 (1.0%) | 0 (0.0%) |
| 35 to 64 Years | 56 (1.9%) | 37 (1.4%) |
| 65 to 74 Years | 10 (2.0%) | 8 (1.1%) |
| 75 Years and over | 23 (5.3%) | 11 (2.3%) |
Technology Access in Port Neches
Computing Device Access in Port Neches
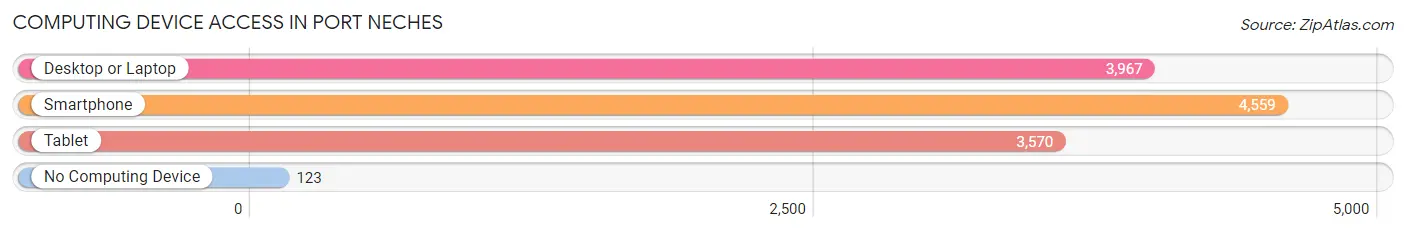
| Device Type | # Households | % Households |
| Desktop or Laptop | 3,967 | 80.4% |
| Smartphone | 4,559 | 92.4% |
| Tablet | 3,570 | 72.3% |
| No Computing Device | 123 | 2.5% |
| Total | 4,936 | 100.0% |
Internet Access in Port Neches
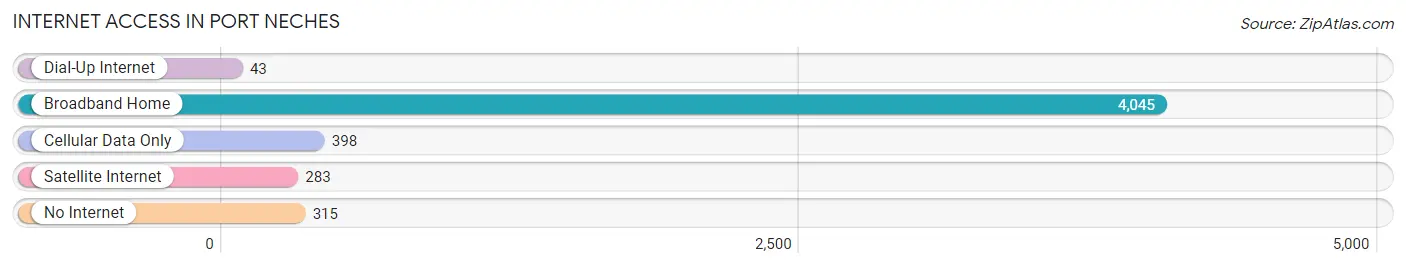
| Internet Type | # Households | % Households |
| Dial-Up Internet | 43 | 0.9% |
| Broadband Home | 4,045 | 82.0% |
| Cellular Data Only | 398 | 8.1% |
| Satellite Internet | 283 | 5.7% |
| No Internet | 315 | 6.4% |
| Total | 4,936 | 100.0% |
Port Neches Summary
Port Neches is a city located in Jefferson County, Texas, United States. It is part of the Beaumont–Port Arthur Metropolitan Statistical Area. The population was 13,040 at the 2010 census.
History
Port Neches was founded in 1895 by the Port Neches Land and Improvement Company. The company was formed by a group of investors from Beaumont, Texas, who wanted to develop a port on the Neches River. The town was named after the river, which was named by Spanish explorers in the 16th century. The town was incorporated in 1903.
In the early 1900s, Port Neches was a thriving port town, with a population of over 1,000. The town was home to several businesses, including a sawmill, a cotton gin, and a lumberyard. The town also had a hotel, a bank, and a post office.
In the 1920s, the town began to decline as the port activity decreased. The Great Depression further hurt the town's economy, and by the 1940s, the population had dropped to just over 500.
In the 1950s, the town began to experience a resurgence. The population grew to over 1,000, and the town was home to several businesses, including a shipyard, a chemical plant, and a paper mill.
Geography
Port Neches is located at 29°58'25" North, 94°3'25" West (29.973611, -94.056944). It is situated on the Neches River, about 10 miles (16 km) east of Beaumont.
The city has a total area of 5.2 square miles (13.4 km2), of which 5.1 square miles (13.2 km2) is land and 0.1 square miles (0.2 km2) is water.
Economy
Port Neches is home to several industries, including a paper mill, a chemical plant, and a shipyard. The city is also home to several retail stores, restaurants, and other businesses.
The city's largest employer is the Port Neches-Groves Independent School District, which employs over 1,000 people. Other major employers include the Port Neches-Groves Hospital, the Port Neches-Groves Public Library, and the Port Neches-Groves Police Department.
Demographics
As of the 2010 census, there were 13,040 people, 4,845 households, and 3,541 families residing in the city. The population density was 2,541.2 people per square mile (982.2/km2). There were 5,093 housing units at an average density of 997.2 per square mile (385.2/km2). The racial makeup of the city was 81.2% White, 11.2% African American, 0.5% Native American, 0.7% Asian, 0.1% Pacific Islander, 4.7% from other races, and 1.7% from two or more races. Hispanic or Latino of any race were 16.2% of the population.
There were 4,845 households, out of which 33.2% had children under the age of 18 living with them, 51.2% were married couples living together, 14.3% had a female householder with no husband present, and 29.2% were non-families. 24.2% of all households were made up of individuals, and 10.2% had someone living alone who was 65 years of age or older. The average household size was 2.63 and the average family size was 3.12.
In the city, the population was spread out, with 25.9% under the age of 18, 8.7% from 18 to 24, 27.2% from 25 to 44, 24.2% from 45 to 64, and 14.0% who were 65 years of age or older. The median age was 36 years. For every 100 females, there were 93.2 males. For every 100 females age 18 and over, there were 89.3 males.
The median income for a household in the city was $41,945, and the median income for a family was $48,945. Males had a median income of $41,945 versus $25,945 for females. The per capita income for the city was $19,945. About 10.2% of families and 12.2% of the population were below the poverty line, including 17.2% of those under age 18 and 8.2% of those age 65 or over.
Common Questions
What is Per Capita Income in Port Neches?
Per Capita income in Port Neches is $44,238.
What is the Median Family Income in Port Neches?
Median Family Income in Port Neches is $99,032.
What is the Median Household income in Port Neches?
Median Household Income in Port Neches is $85,086.
What is Income or Wage Gap in Port Neches?
Income or Wage Gap in Port Neches is 44.6%.
Women in Port Neches earn 55.4 cents for every dollar earned by a man.
What is Inequality or Gini Index in Port Neches?
Inequality or Gini Index in Port Neches is 0.42.
What is the Total Population of Port Neches?
Total Population of Port Neches is 13,635.
What is the Total Male Population of Port Neches?
Total Male Population of Port Neches is 6,718.
What is the Total Female Population of Port Neches?
Total Female Population of Port Neches is 6,917.
What is the Ratio of Males per 100 Females in Port Neches?
There are 97.12 Males per 100 Females in Port Neches.
What is the Ratio of Females per 100 Males in Port Neches?
There are 102.96 Females per 100 Males in Port Neches.
What is the Median Population Age in Port Neches?
Median Population Age in Port Neches is 39.0 Years.
What is the Average Family Size in Port Neches
Average Family Size in Port Neches is 3.2 People.
What is the Average Household Size in Port Neches
Average Household Size in Port Neches is 2.8 People.
How Large is the Labor Force in Port Neches?
There are 6,749 People in the Labor Forcein in Port Neches.
What is the Percentage of People in the Labor Force in Port Neches?
63.6% of People are in the Labor Force in Port Neches.
What is the Unemployment Rate in Port Neches?
Unemployment Rate in Port Neches is 5.3%.