Port Aransas, TX Map & Demographics
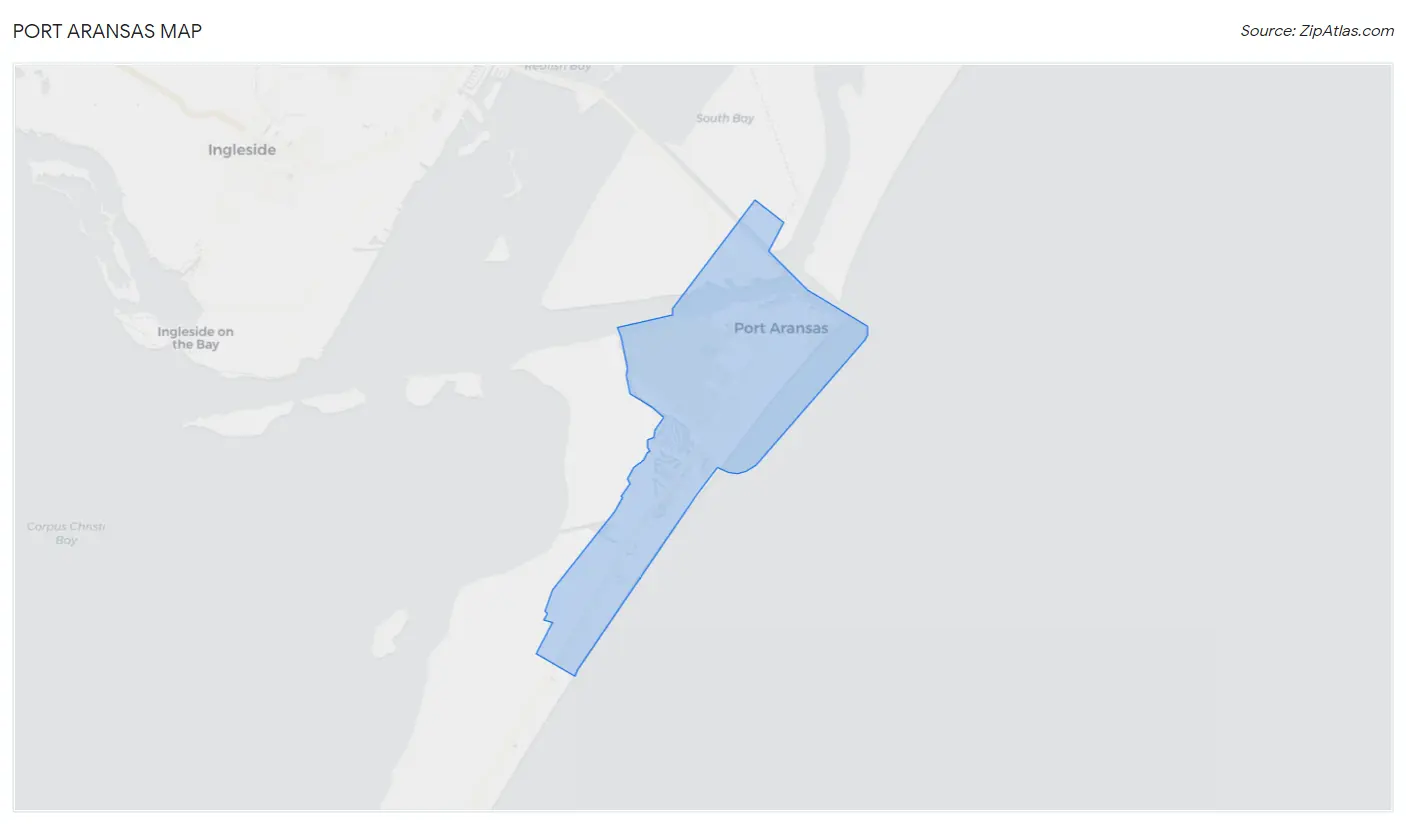
Port Aransas Map
Port Aransas Overview
$53,903
PER CAPITA INCOME
$94,348
AVG FAMILY INCOME
$69,063
AVG HOUSEHOLD INCOME
19.5%
WAGE / INCOME GAP [ % ]
80.5¢/ $1
WAGE / INCOME GAP [ $ ]
0.46
INEQUALITY / GINI INDEX
3,072
TOTAL POPULATION
1,454
MALE POPULATION
1,618
FEMALE POPULATION
89.86
MALES / 100 FEMALES
111.28
FEMALES / 100 MALES
53.8
MEDIAN AGE
2.5
AVG FAMILY SIZE
2.1
AVG HOUSEHOLD SIZE
1,359
LABOR FORCE [ PEOPLE ]
50.7%
PERCENT IN LABOR FORCE
Port Aransas Zip Codes
Port Aransas Area Codes
Income in Port Aransas
Income Overview in Port Aransas
Per Capita Income in Port Aransas is $53,903, while median incomes of families and households are $94,348 and $69,063 respectively.
| Characteristic | Number | Measure |
| Per Capita Income | 3,072 | $53,903 |
| Median Family Income | 948 | $94,348 |
| Mean Family Income | 948 | $126,549 |
| Median Household Income | 1,462 | $69,063 |
| Mean Household Income | 1,462 | $110,052 |
| Income Deficit | 948 | $0 |
| Wage / Income Gap (%) | 3,072 | 19.49% |
| Wage / Income Gap ($) | 3,072 | 80.51¢ per $1 |
| Gini / Inequality Index | 3,072 | 0.46 |
Earnings by Sex in Port Aransas
Average Earnings in Port Aransas are $47,235, $49,833 for men and $40,119 for women, a difference of 19.5%.
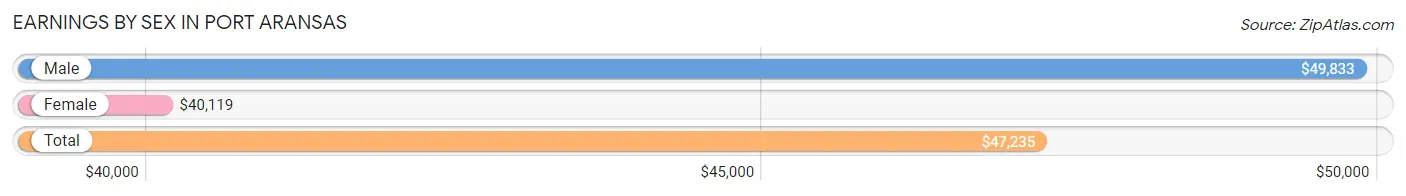
| Sex | Number | Average Earnings |
| Male | 812 (54.6%) | $49,833 |
| Female | 676 (45.4%) | $40,119 |
| Total | 1,488 (100.0%) | $47,235 |
Earnings by Sex by Income Bracket in Port Aransas
The most common earnings brackets in Port Aransas are $100,000+ for men (225 | 27.7%) and $100,000+ for women (134 | 19.8%).
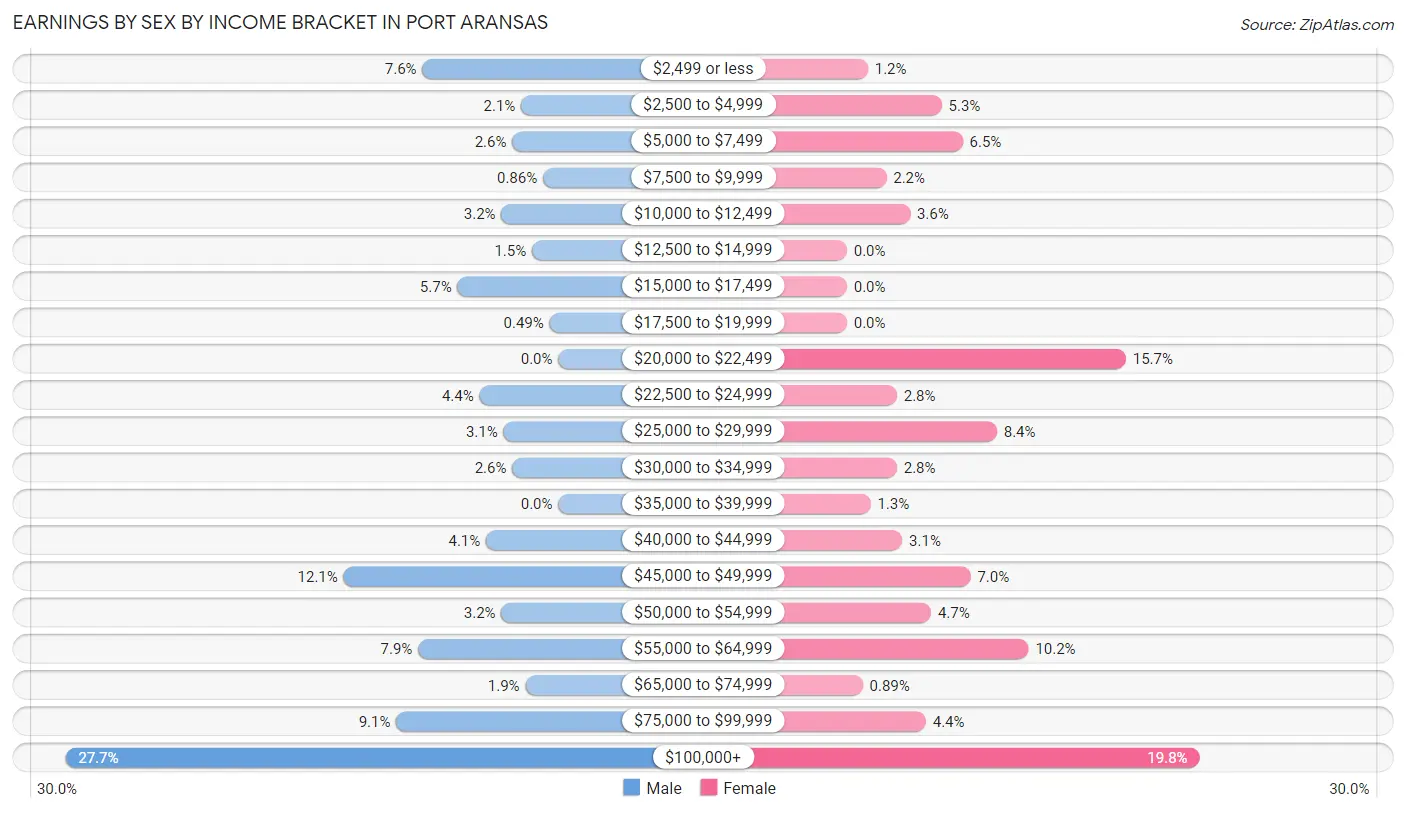
| Income | Male | Female |
| $2,499 or less | 62 (7.6%) | 8 (1.2%) |
| $2,500 to $4,999 | 17 (2.1%) | 36 (5.3%) |
| $5,000 to $7,499 | 21 (2.6%) | 44 (6.5%) |
| $7,500 to $9,999 | 7 (0.9%) | 15 (2.2%) |
| $10,000 to $12,499 | 26 (3.2%) | 24 (3.5%) |
| $12,500 to $14,999 | 12 (1.5%) | 0 (0.0%) |
| $15,000 to $17,499 | 46 (5.7%) | 0 (0.0%) |
| $17,500 to $19,999 | 4 (0.5%) | 0 (0.0%) |
| $20,000 to $22,499 | 0 (0.0%) | 106 (15.7%) |
| $22,500 to $24,999 | 36 (4.4%) | 19 (2.8%) |
| $25,000 to $29,999 | 25 (3.1%) | 57 (8.4%) |
| $30,000 to $34,999 | 21 (2.6%) | 19 (2.8%) |
| $35,000 to $39,999 | 0 (0.0%) | 9 (1.3%) |
| $40,000 to $44,999 | 33 (4.1%) | 21 (3.1%) |
| $45,000 to $49,999 | 98 (12.1%) | 47 (7.0%) |
| $50,000 to $54,999 | 26 (3.2%) | 32 (4.7%) |
| $55,000 to $64,999 | 64 (7.9%) | 69 (10.2%) |
| $65,000 to $74,999 | 15 (1.8%) | 6 (0.9%) |
| $75,000 to $99,999 | 74 (9.1%) | 30 (4.4%) |
| $100,000+ | 225 (27.7%) | 134 (19.8%) |
| Total | 812 (100.0%) | 676 (100.0%) |
Earnings by Sex by Educational Attainment in Port Aransas
Average earnings in Port Aransas are $54,231 for men and $47,708 for women, a difference of 12.0%. Men with an educational attainment of graduate degree enjoy the highest average annual earnings of $84,342, while those with less than high school education earn the least with $11,172. Women with an educational attainment of graduate degree earn the most with the average annual earnings of $94,750, while those with high school diploma education have the smallest earnings of $22,008.
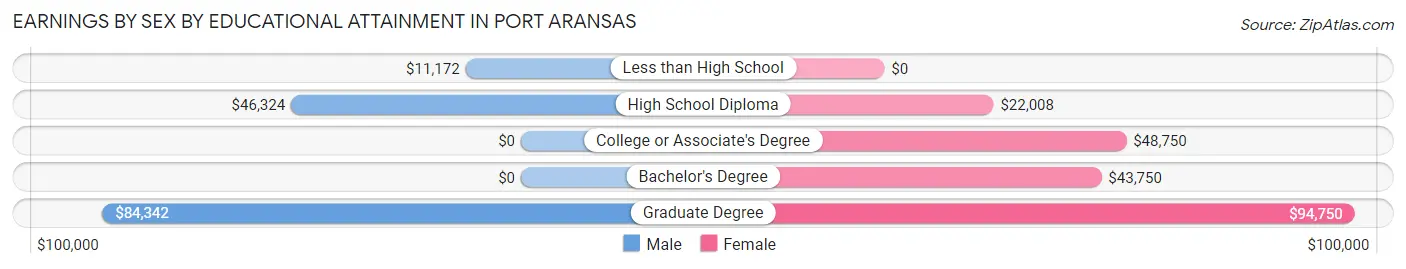
| Educational Attainment | Male Income | Female Income |
| Less than High School | $11,172 | $0 |
| High School Diploma | $46,324 | $22,008 |
| College or Associate's Degree | - | - |
| Bachelor's Degree | - | - |
| Graduate Degree | $84,342 | $94,750 |
| Total | $54,231 | $47,708 |
Family Income in Port Aransas
Family Income Brackets in Port Aransas
According to the Port Aransas family income data, there are 203 families falling into the $100,000 to $149,999 income range, which is the most common income bracket and makes up 21.4% of all families.
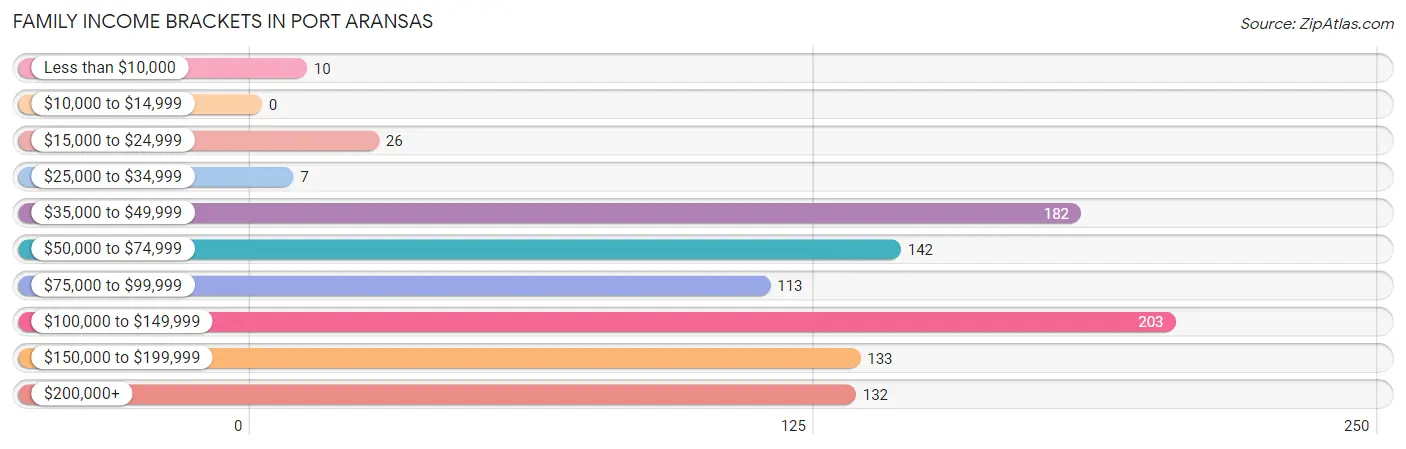
| Income Bracket | # Families | % Families |
| Less than $10,000 | 10 | 1.1% |
| $10,000 to $14,999 | 0 | 0.0% |
| $15,000 to $24,999 | 26 | 2.7% |
| $25,000 to $34,999 | 7 | 0.7% |
| $35,000 to $49,999 | 182 | 19.2% |
| $50,000 to $74,999 | 142 | 15.0% |
| $75,000 to $99,999 | 113 | 11.9% |
| $100,000 to $149,999 | 203 | 21.4% |
| $150,000 to $199,999 | 133 | 14.0% |
| $200,000+ | 132 | 13.9% |
Family Income by Famaliy Size in Port Aransas
4-person families (72 | 7.6%) account for the highest median family income in Port Aransas with $136,250 per family, while 2-person families (683 | 72.1%) have the highest median income of $53,494 per family member.
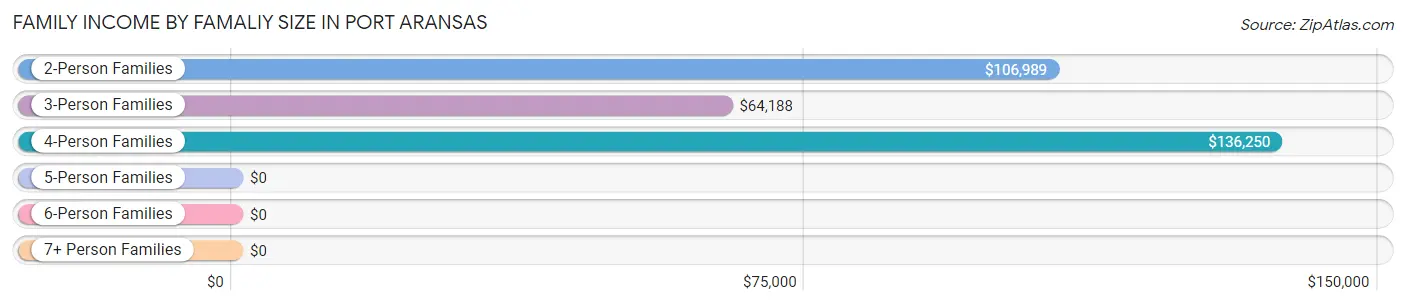
| Income Bracket | # Families | Median Income |
| 2-Person Families | 683 (72.1%) | $106,989 |
| 3-Person Families | 163 (17.2%) | $64,188 |
| 4-Person Families | 72 (7.6%) | $136,250 |
| 5-Person Families | 30 (3.2%) | $0 |
| 6-Person Families | 0 (0.0%) | $0 |
| 7+ Person Families | 0 (0.0%) | $0 |
| Total | 948 (100.0%) | $94,348 |
Family Income by Number of Earners in Port Aransas
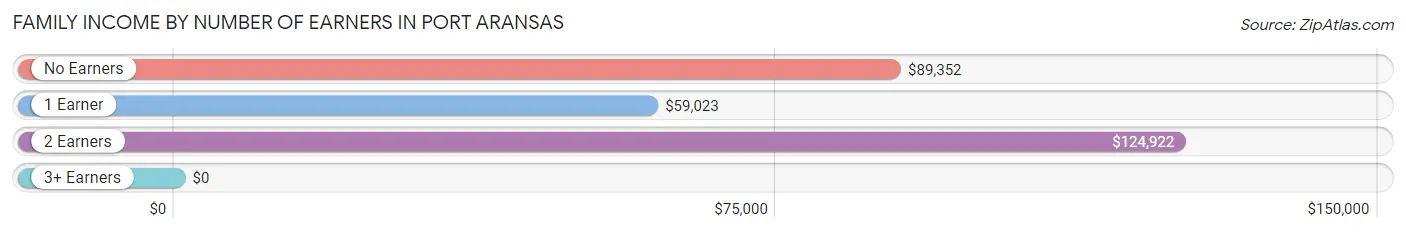
| Number of Earners | # Families | Median Income |
| No Earners | 196 (20.7%) | $89,352 |
| 1 Earner | 451 (47.6%) | $59,023 |
| 2 Earners | 279 (29.4%) | $124,922 |
| 3+ Earners | 22 (2.3%) | $0 |
| Total | 948 (100.0%) | $94,348 |
Household Income in Port Aransas
Household Income Brackets in Port Aransas
With 273 households falling in the category, the $50,000 to $74,999 income range is the most frequent in Port Aransas, accounting for 18.7% of all households.
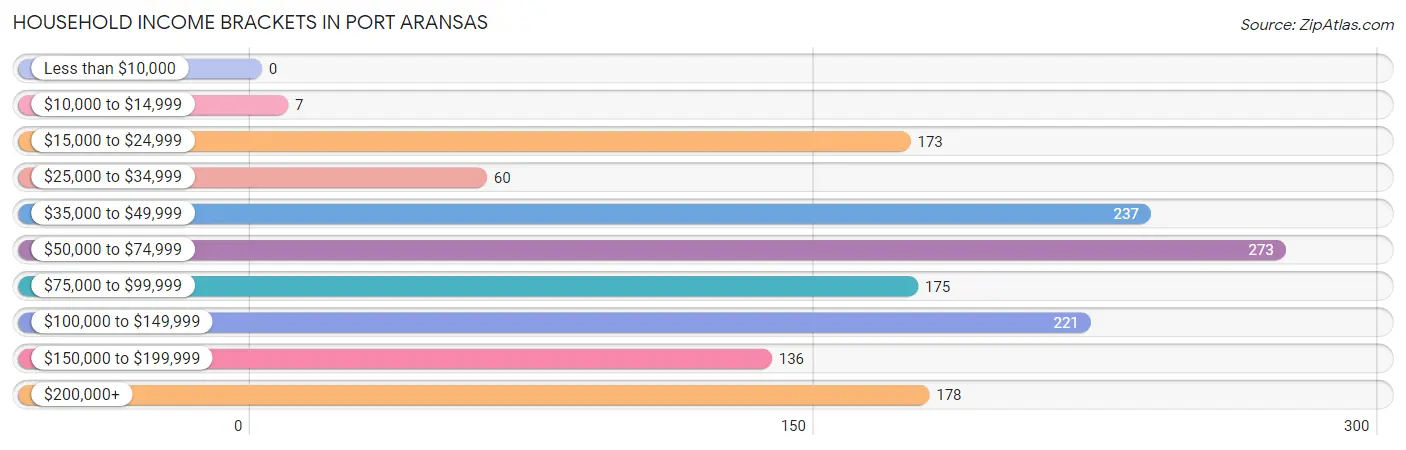
| Income Bracket | # Households | % Households |
| Less than $10,000 | 0 | 0.0% |
| $10,000 to $14,999 | 7 | 0.5% |
| $15,000 to $24,999 | 173 | 11.8% |
| $25,000 to $34,999 | 60 | 4.1% |
| $35,000 to $49,999 | 237 | 16.2% |
| $50,000 to $74,999 | 273 | 18.7% |
| $75,000 to $99,999 | 175 | 12.0% |
| $100,000 to $149,999 | 221 | 15.1% |
| $150,000 to $199,999 | 136 | 9.3% |
| $200,000+ | 178 | 12.2% |
Household Income by Householder Age in Port Aransas
The median household income in Port Aransas is $69,063, with the highest median household income of $90,982 found in the 65+ years age bracket for the primary householder. A total of 576 households (39.4%) fall into this category. Meanwhile, the 15 to 24 years age bracket for the primary householder has the lowest median household income of $0, with 35 households (2.4%) in this group.
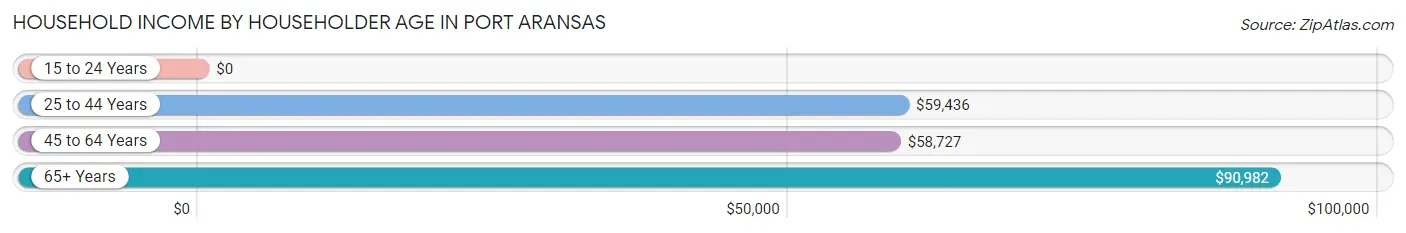
| Income Bracket | # Households | Median Income |
| 15 to 24 Years | 35 (2.4%) | $0 |
| 25 to 44 Years | 275 (18.8%) | $59,436 |
| 45 to 64 Years | 576 (39.4%) | $58,727 |
| 65+ Years | 576 (39.4%) | $90,982 |
| Total | 1,462 (100.0%) | $69,063 |
Poverty in Port Aransas
Income Below Poverty by Sex and Age in Port Aransas
With 8.5% poverty level for males and 4.9% for females among the residents of Port Aransas, 18 to 24 year old males and 55 to 64 year old females are the most vulnerable to poverty, with 25 males (65.8%) and 57 females (19.3%) in their respective age groups living below the poverty level.
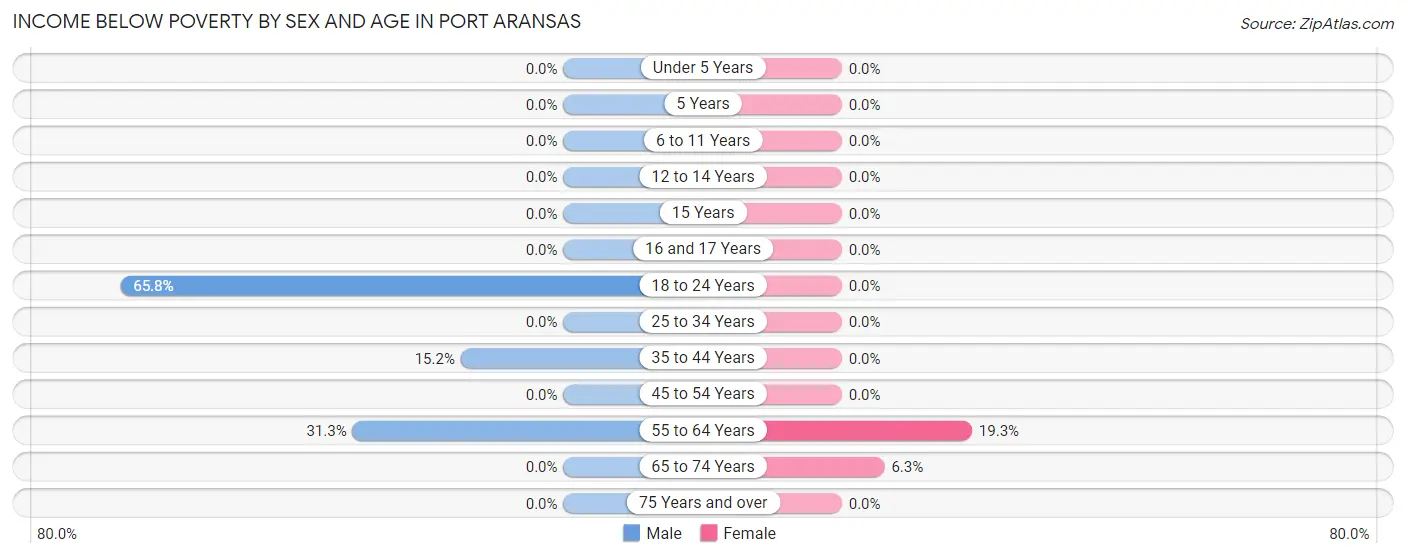
| Age Bracket | Male | Female |
| Under 5 Years | 0 (0.0%) | 0 (0.0%) |
| 5 Years | 0 (0.0%) | 0 (0.0%) |
| 6 to 11 Years | 0 (0.0%) | 0 (0.0%) |
| 12 to 14 Years | 0 (0.0%) | 0 (0.0%) |
| 15 Years | 0 (0.0%) | 0 (0.0%) |
| 16 and 17 Years | 0 (0.0%) | 0 (0.0%) |
| 18 to 24 Years | 25 (65.8%) | 0 (0.0%) |
| 25 to 34 Years | 0 (0.0%) | 0 (0.0%) |
| 35 to 44 Years | 16 (15.2%) | 0 (0.0%) |
| 45 to 54 Years | 0 (0.0%) | 0 (0.0%) |
| 55 to 64 Years | 82 (31.3%) | 57 (19.3%) |
| 65 to 74 Years | 0 (0.0%) | 22 (6.3%) |
| 75 Years and over | 0 (0.0%) | 0 (0.0%) |
| Total | 123 (8.5%) | 79 (4.9%) |
Income Above Poverty by Sex and Age in Port Aransas
According to the poverty statistics in Port Aransas, males aged under 5 years and females aged under 5 years are the age groups that are most secure financially, with 100.0% of males and 100.0% of females in these age groups living above the poverty line.
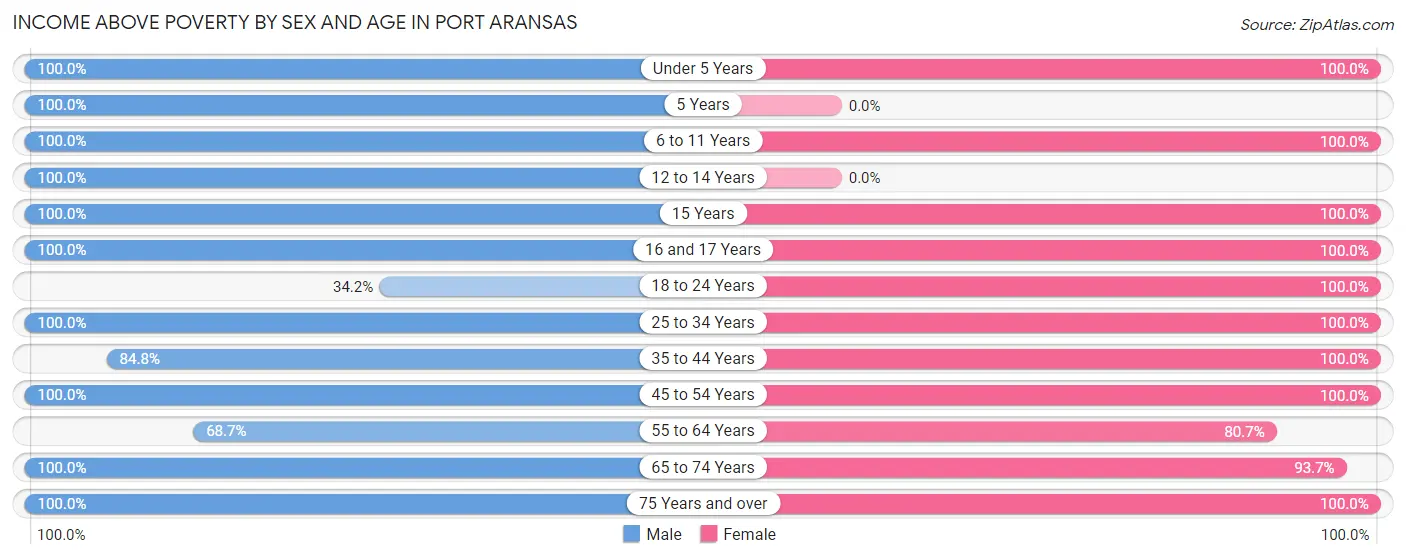
| Age Bracket | Male | Female |
| Under 5 Years | 7 (100.0%) | 89 (100.0%) |
| 5 Years | 57 (100.0%) | 0 (0.0%) |
| 6 to 11 Years | 130 (100.0%) | 12 (100.0%) |
| 12 to 14 Years | 19 (100.0%) | 0 (0.0%) |
| 15 Years | 26 (100.0%) | 52 (100.0%) |
| 16 and 17 Years | 8 (100.0%) | 82 (100.0%) |
| 18 to 24 Years | 13 (34.2%) | 89 (100.0%) |
| 25 to 34 Years | 143 (100.0%) | 69 (100.0%) |
| 35 to 44 Years | 89 (84.8%) | 115 (100.0%) |
| 45 to 54 Years | 221 (100.0%) | 308 (100.0%) |
| 55 to 64 Years | 180 (68.7%) | 238 (80.7%) |
| 65 to 74 Years | 282 (100.0%) | 325 (93.7%) |
| 75 Years and over | 156 (100.0%) | 154 (100.0%) |
| Total | 1,331 (91.5%) | 1,533 (95.1%) |
Income Below Poverty Among Married-Couple Families in Port Aransas
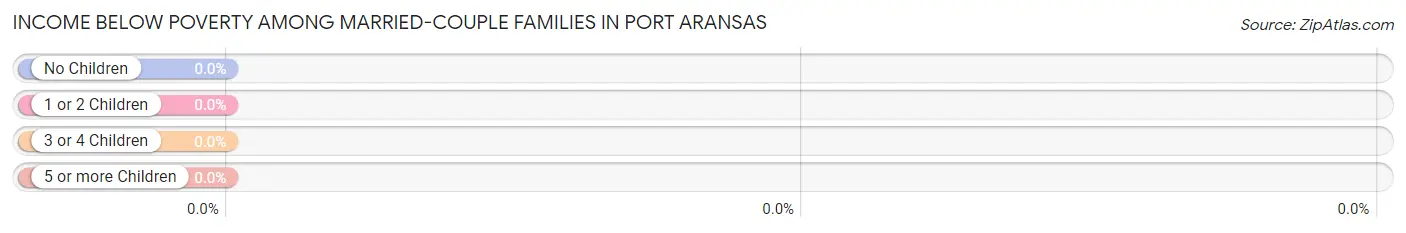
| Children | Above Poverty | Below Poverty |
| No Children | 499 (100.0%) | 0 (0.0%) |
| 1 or 2 Children | 189 (100.0%) | 0 (0.0%) |
| 3 or 4 Children | 30 (100.0%) | 0 (0.0%) |
| 5 or more Children | 0 (0.0%) | 0 (0.0%) |
| Total | 718 (100.0%) | 0 (0.0%) |
Income Below Poverty Among Single-Parent Households in Port Aransas
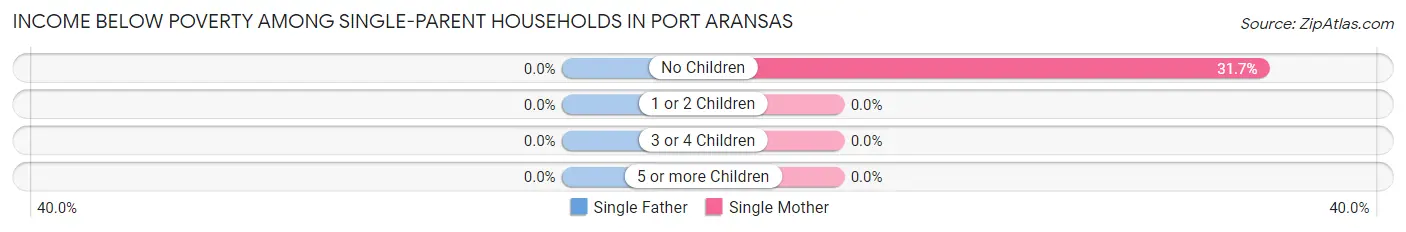
| Children | Single Father | Single Mother |
| No Children | 0 (0.0%) | 26 (31.7%) |
| 1 or 2 Children | 0 (0.0%) | 0 (0.0%) |
| 3 or 4 Children | 0 (0.0%) | 0 (0.0%) |
| 5 or more Children | 0 (0.0%) | 0 (0.0%) |
| Total | 0 (0.0%) | 26 (14.8%) |
Income Below Poverty Among Married-Couple vs Single-Parent Households in Port Aransas
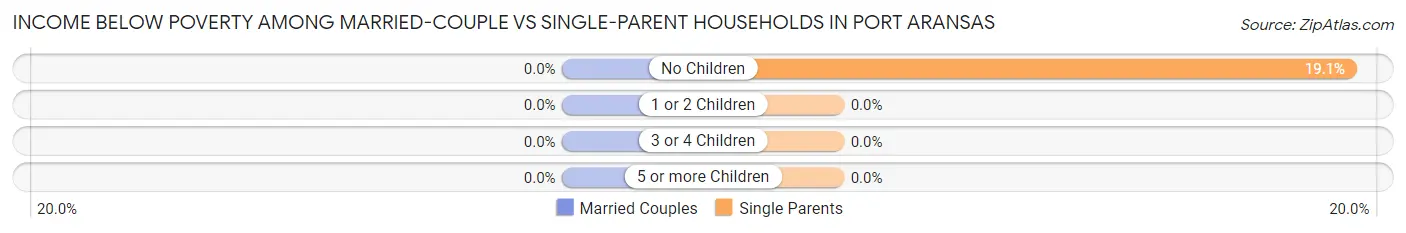
| Children | Married-Couple Families | Single-Parent Households |
| No Children | 0 (0.0%) | 26 (19.1%) |
| 1 or 2 Children | 0 (0.0%) | 0 (0.0%) |
| 3 or 4 Children | 0 (0.0%) | 0 (0.0%) |
| 5 or more Children | 0 (0.0%) | 0 (0.0%) |
| Total | 0 (0.0%) | 26 (11.3%) |
Race in Port Aransas
The most populous races in Port Aransas are White / Caucasian (2,896 | 94.3%), Hispanic or Latino (342 | 11.1%), and Two or more Races (161 | 5.2%).
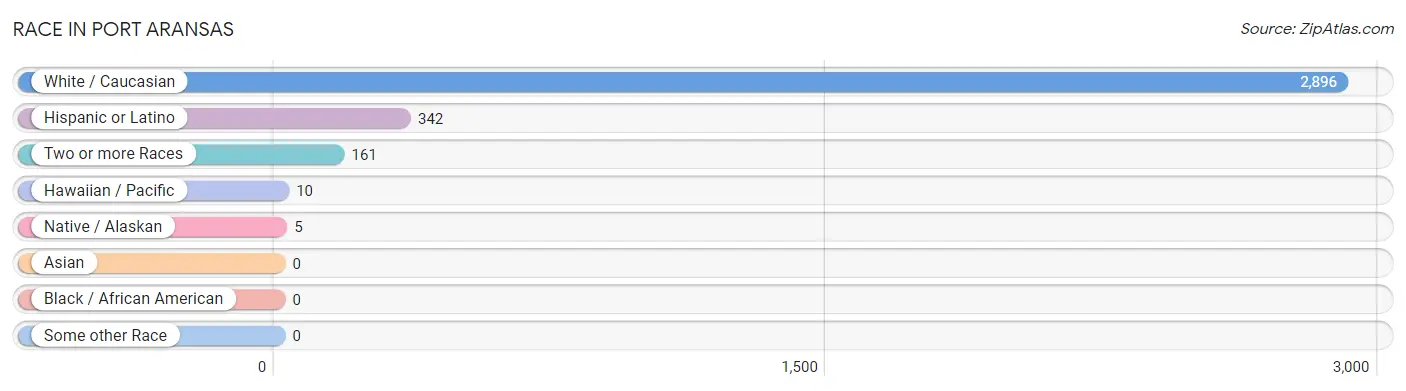
| Race | # Population | % Population |
| Asian | 0 | 0.0% |
| Black / African American | 0 | 0.0% |
| Hawaiian / Pacific | 10 | 0.3% |
| Hispanic or Latino | 342 | 11.1% |
| Native / Alaskan | 5 | 0.2% |
| White / Caucasian | 2,896 | 94.3% |
| Two or more Races | 161 | 5.2% |
| Some other Race | 0 | 0.0% |
| Total | 3,072 | 100.0% |
Ancestry in Port Aransas
The most populous ancestries reported in Port Aransas are German (544 | 17.7%), Irish (333 | 10.8%), English (298 | 9.7%), Mexican (288 | 9.4%), and Czech (144 | 4.7%), together accounting for 52.3% of all Port Aransas residents.
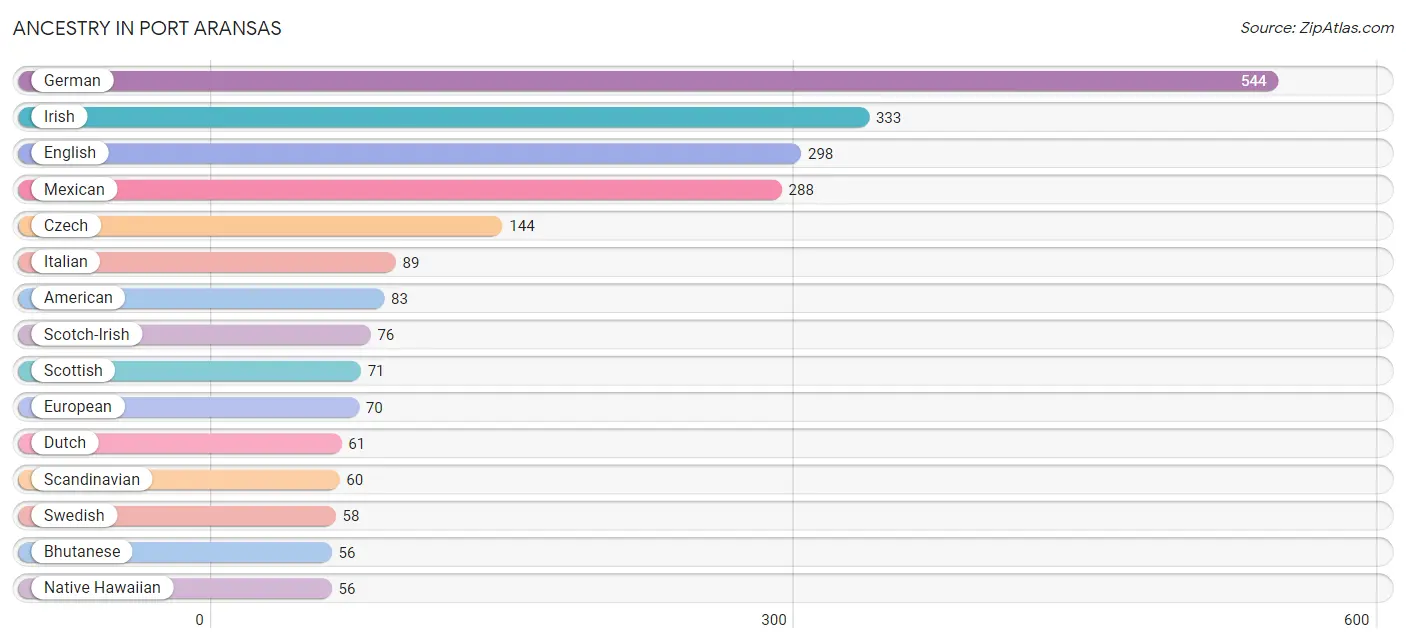
| Ancestry | # Population | % Population |
| American | 83 | 2.7% |
| Austrian | 33 | 1.1% |
| Bhutanese | 56 | 1.8% |
| British | 8 | 0.3% |
| Cherokee | 21 | 0.7% |
| Cree | 5 | 0.2% |
| Czech | 144 | 4.7% |
| Danish | 5 | 0.2% |
| Dutch | 61 | 2.0% |
| English | 298 | 9.7% |
| European | 70 | 2.3% |
| Finnish | 10 | 0.3% |
| French | 35 | 1.1% |
| German | 544 | 17.7% |
| Hungarian | 10 | 0.3% |
| Irish | 333 | 10.8% |
| Italian | 89 | 2.9% |
| Mexican | 288 | 9.4% |
| Native Hawaiian | 56 | 1.8% |
| Northern European | 14 | 0.5% |
| Norwegian | 33 | 1.1% |
| Polish | 34 | 1.1% |
| Puerto Rican | 16 | 0.5% |
| Scandinavian | 60 | 1.9% |
| Scotch-Irish | 76 | 2.5% |
| Scottish | 71 | 2.3% |
| South American | 5 | 0.2% |
| Swedish | 58 | 1.9% |
| Swiss | 9 | 0.3% |
| Venezuelan | 5 | 0.2% |
| Welsh | 30 | 1.0% | View All 31 Rows |
Immigrants in Port Aransas
The most numerous immigrant groups reported in Port Aransas came from Europe (120 | 3.9%), Northern Europe (88 | 2.9%), England (73 | 2.4%), Latin America (33 | 1.1%), and Peru (33 | 1.1%), together accounting for 11.3% of all Port Aransas residents.
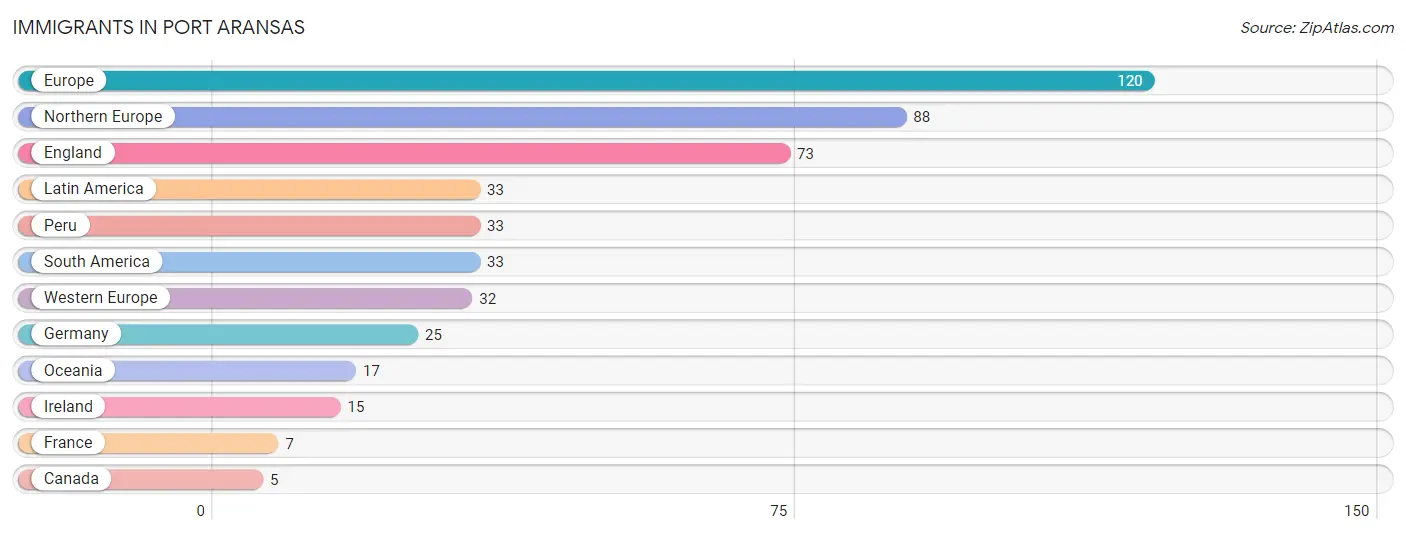
| Immigration Origin | # Population | % Population |
| Canada | 5 | 0.2% |
| England | 73 | 2.4% |
| Europe | 120 | 3.9% |
| France | 7 | 0.2% |
| Germany | 25 | 0.8% |
| Ireland | 15 | 0.5% |
| Latin America | 33 | 1.1% |
| Northern Europe | 88 | 2.9% |
| Oceania | 17 | 0.5% |
| Peru | 33 | 1.1% |
| South America | 33 | 1.1% |
| Western Europe | 32 | 1.0% | View All 12 Rows |
Sex and Age in Port Aransas
Sex and Age in Port Aransas
The most populous age groups in Port Aransas are 65 to 69 Years (212 | 14.6%) for men and 60 to 64 Years (215 | 13.3%) for women.
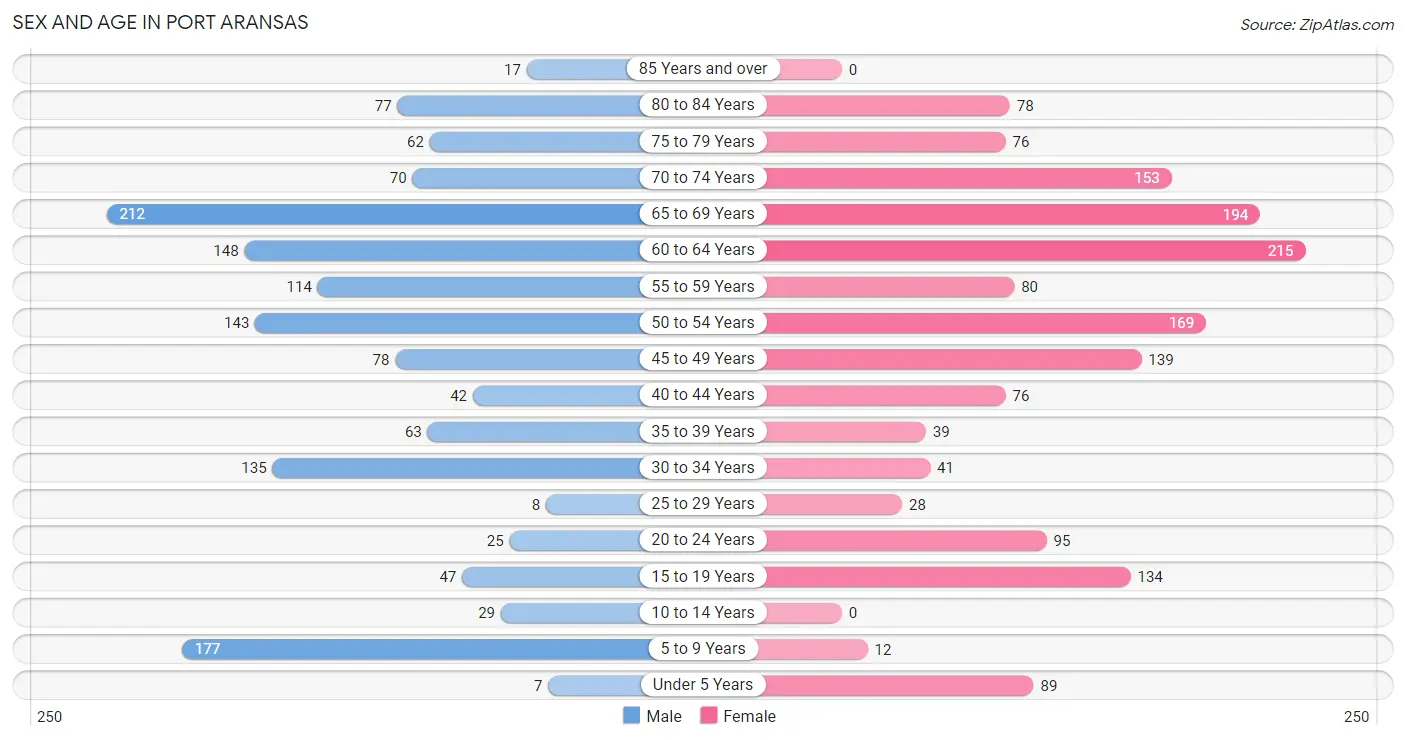
| Age Bracket | Male | Female |
| Under 5 Years | 7 (0.5%) | 89 (5.5%) |
| 5 to 9 Years | 177 (12.2%) | 12 (0.7%) |
| 10 to 14 Years | 29 (2.0%) | 0 (0.0%) |
| 15 to 19 Years | 47 (3.2%) | 134 (8.3%) |
| 20 to 24 Years | 25 (1.7%) | 95 (5.9%) |
| 25 to 29 Years | 8 (0.5%) | 28 (1.7%) |
| 30 to 34 Years | 135 (9.3%) | 41 (2.5%) |
| 35 to 39 Years | 63 (4.3%) | 39 (2.4%) |
| 40 to 44 Years | 42 (2.9%) | 76 (4.7%) |
| 45 to 49 Years | 78 (5.4%) | 139 (8.6%) |
| 50 to 54 Years | 143 (9.8%) | 169 (10.4%) |
| 55 to 59 Years | 114 (7.8%) | 80 (4.9%) |
| 60 to 64 Years | 148 (10.2%) | 215 (13.3%) |
| 65 to 69 Years | 212 (14.6%) | 194 (12.0%) |
| 70 to 74 Years | 70 (4.8%) | 153 (9.5%) |
| 75 to 79 Years | 62 (4.3%) | 76 (4.7%) |
| 80 to 84 Years | 77 (5.3%) | 78 (4.8%) |
| 85 Years and over | 17 (1.2%) | 0 (0.0%) |
| Total | 1,454 (100.0%) | 1,618 (100.0%) |
Families and Households in Port Aransas
Median Family Size in Port Aransas
The median family size in Port Aransas is 2.49 persons per family, with single male/father families (54 | 5.7%) accounting for the largest median family size of 2.54 persons per family. On the other hand, single female/mother families (176 | 18.6%) represent the smallest median family size with 2.35 persons per family.
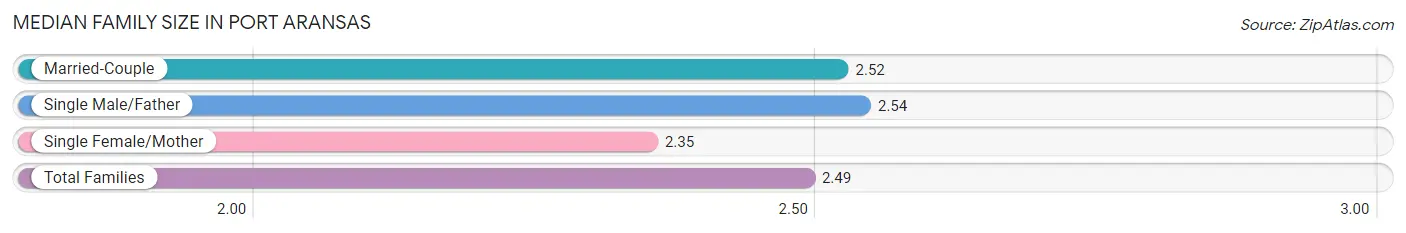
| Family Type | # Families | Family Size |
| Married-Couple | 718 (75.7%) | 2.52 |
| Single Male/Father | 54 (5.7%) | 2.54 |
| Single Female/Mother | 176 (18.6%) | 2.35 |
| Total Families | 948 (100.0%) | 2.49 |
Median Household Size in Port Aransas
The median household size in Port Aransas is 2.10 persons per household, with single female/mother households (176 | 12.0%) accounting for the largest median household size of 2.63 persons per household. non-family households (514 | 35.2%) represent the smallest median household size with 1.26 persons per household.
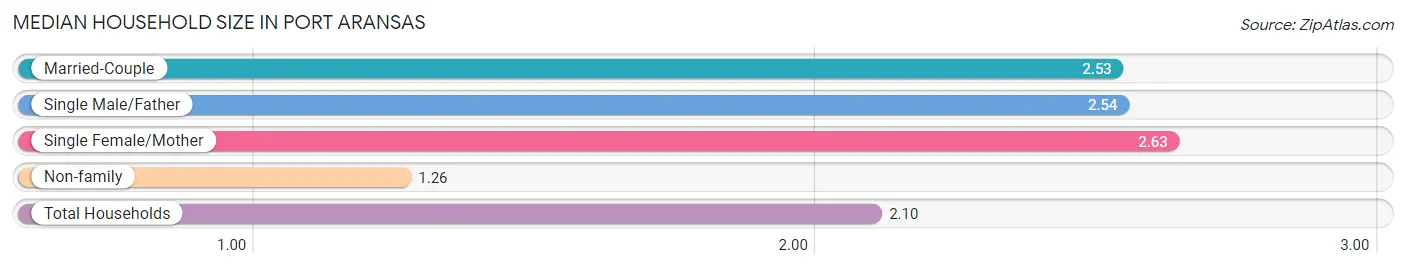
| Household Type | # Households | Household Size |
| Married-Couple | 718 (49.1%) | 2.53 |
| Single Male/Father | 54 (3.7%) | 2.54 |
| Single Female/Mother | 176 (12.0%) | 2.63 |
| Non-family | 514 (35.2%) | 1.26 |
| Total Households | 1,462 (100.0%) | 2.10 |
Household Size by Marriage Status in Port Aransas
Out of a total of 1,462 households in Port Aransas, 948 (64.8%) are family households, while 514 (35.2%) are nonfamily households. The most numerous type of family households are 2-person households, comprising 651, and the most common type of nonfamily households are 1-person households, comprising 382.
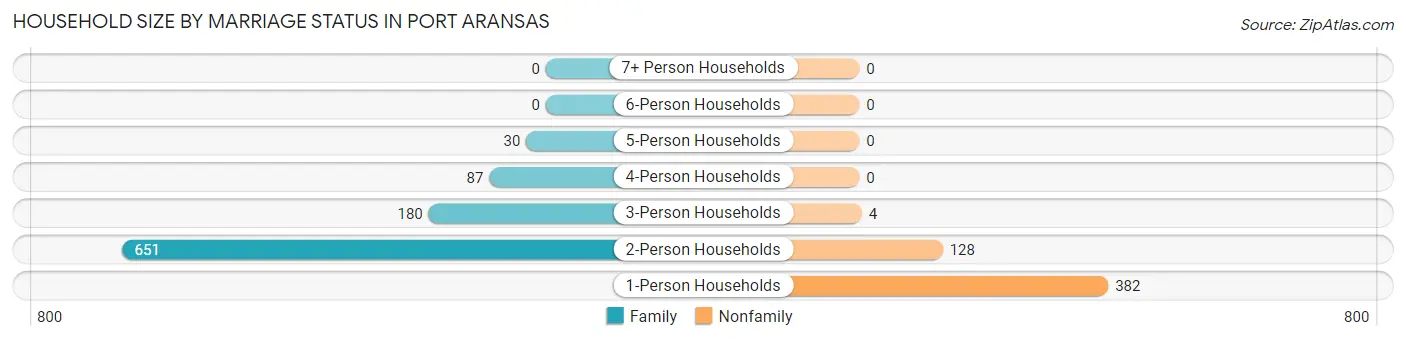
| Household Size | Family Households | Nonfamily Households |
| 1-Person Households | - | 382 (26.1%) |
| 2-Person Households | 651 (44.5%) | 128 (8.8%) |
| 3-Person Households | 180 (12.3%) | 4 (0.3%) |
| 4-Person Households | 87 (5.9%) | 0 (0.0%) |
| 5-Person Households | 30 (2.1%) | 0 (0.0%) |
| 6-Person Households | 0 (0.0%) | 0 (0.0%) |
| 7+ Person Households | 0 (0.0%) | 0 (0.0%) |
| Total | 948 (64.8%) | 514 (35.2%) |
Female Fertility in Port Aransas
Fertility by Age in Port Aransas
Average fertility rate in Port Aransas is 87.0 births per 1,000 women. Women in the age bracket of 20 to 34 years have the highest fertility rate with 329.0 births per 1,000 women. Women in the age bracket of 20 to 34 years acount for 100.0% of all women with births.
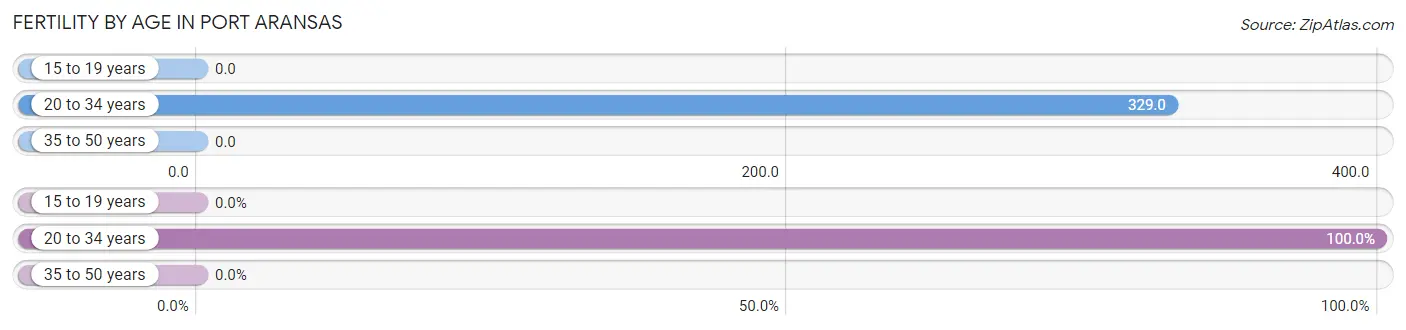
| Age Bracket | Women with Births | Births / 1,000 Women |
| 15 to 19 years | 0 (0.0%) | 0.0 |
| 20 to 34 years | 54 (100.0%) | 329.0 |
| 35 to 50 years | 0 (0.0%) | 0.0 |
| Total | 54 (100.0%) | 87.0 |
Fertility by Age by Marriage Status in Port Aransas
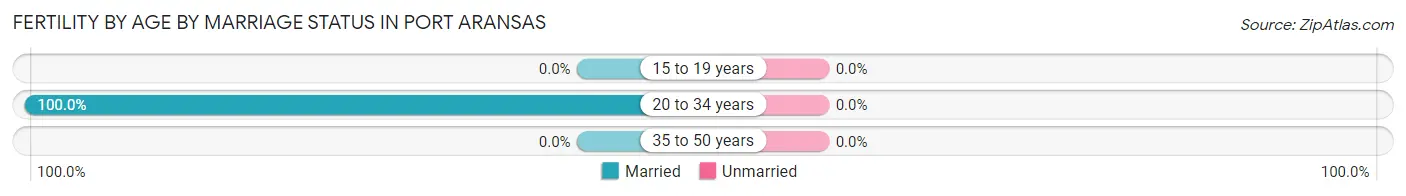
| Age Bracket | Married | Unmarried |
| 15 to 19 years | 0 (0.0%) | 0 (0.0%) |
| 20 to 34 years | 54 (100.0%) | 0 (0.0%) |
| 35 to 50 years | 0 (0.0%) | 0 (0.0%) |
| Total | 54 (100.0%) | 0 (0.0%) |
Fertility by Education in Port Aransas
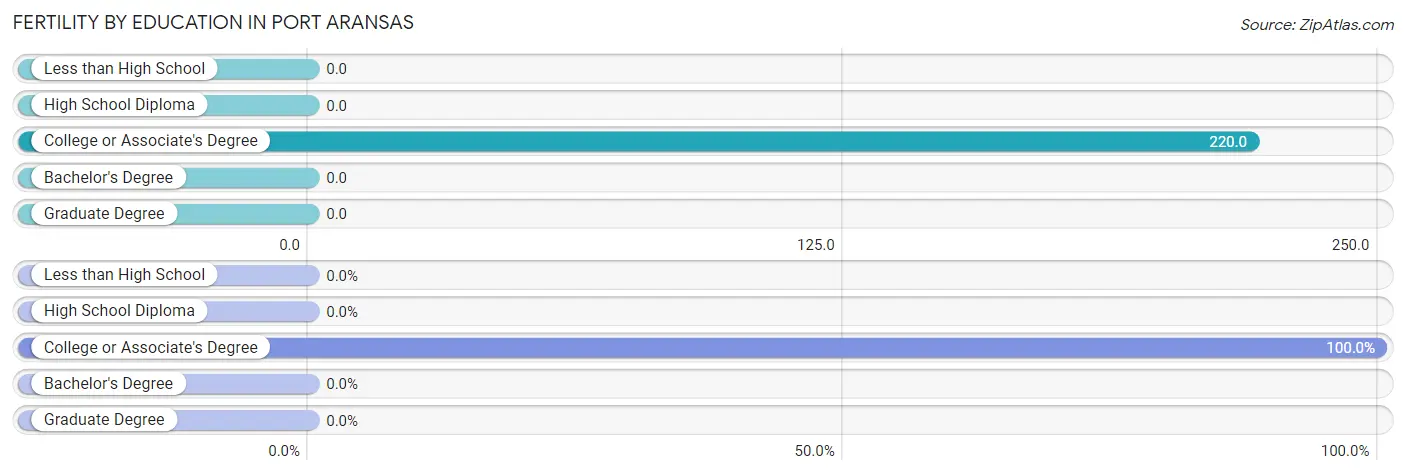
| Educational Attainment | Women with Births | Births / 1,000 Women |
| Less than High School | 0 (0.0%) | 0.0 |
| High School Diploma | 0 (0.0%) | 0.0 |
| College or Associate's Degree | 54 (100.0%) | 220.0 |
| Bachelor's Degree | 0 (0.0%) | 0.0 |
| Graduate Degree | 0 (0.0%) | 0.0 |
| Total | 54 (100.0%) | 87.0 |
Fertility by Education by Marriage Status in Port Aransas
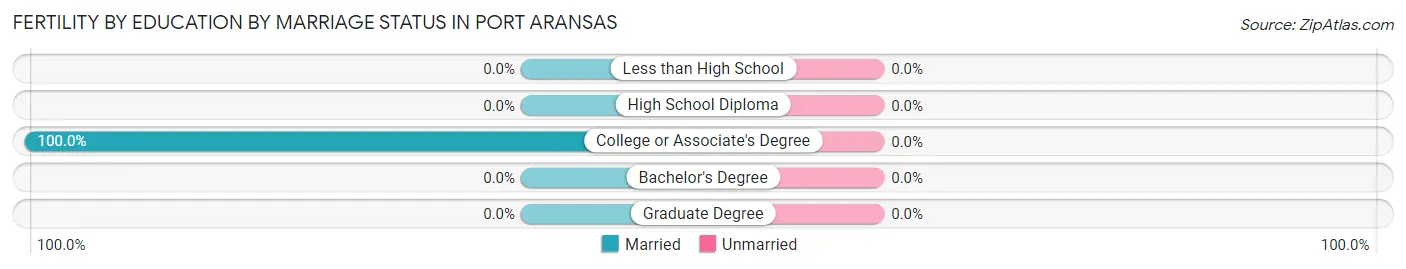
| Educational Attainment | Married | Unmarried |
| Less than High School | 0 (0.0%) | 0 (0.0%) |
| High School Diploma | 0 (0.0%) | 0 (0.0%) |
| College or Associate's Degree | 54 (100.0%) | 0 (0.0%) |
| Bachelor's Degree | 0 (0.0%) | 0 (0.0%) |
| Graduate Degree | 0 (0.0%) | 0 (0.0%) |
| Total | 54 (100.0%) | 0 (0.0%) |
Employment Characteristics in Port Aransas
Employment by Class of Employer in Port Aransas
Among the 1,330 employed individuals in Port Aransas, private company employees (684 | 51.4%), self-employed (not incorporated) (212 | 15.9%), and self-employed (incorporated) (189 | 14.2%) make up the most common classes of employment.
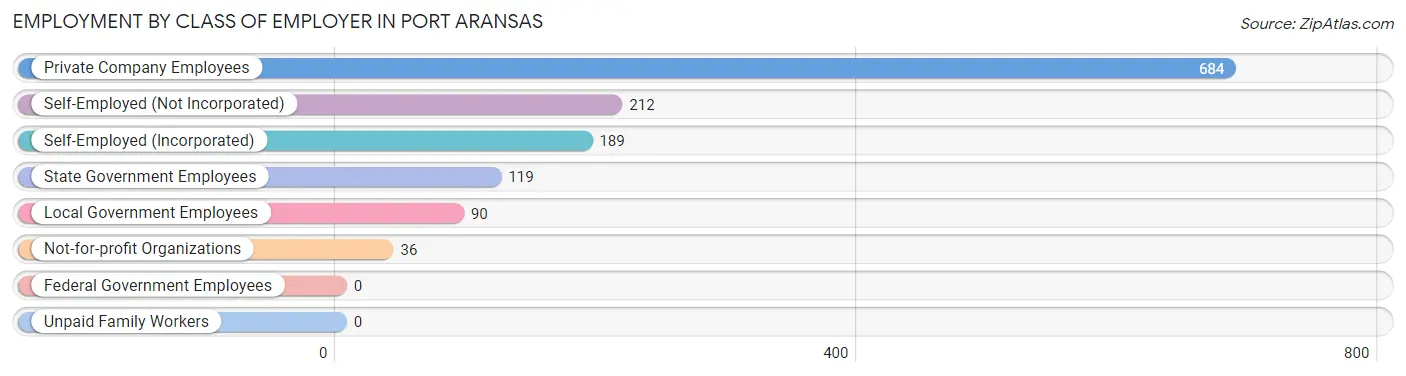
| Employer Class | # Employees | % Employees |
| Private Company Employees | 684 | 51.4% |
| Self-Employed (Incorporated) | 189 | 14.2% |
| Self-Employed (Not Incorporated) | 212 | 15.9% |
| Not-for-profit Organizations | 36 | 2.7% |
| Local Government Employees | 90 | 6.8% |
| State Government Employees | 119 | 8.9% |
| Federal Government Employees | 0 | 0.0% |
| Unpaid Family Workers | 0 | 0.0% |
| Total | 1,330 | 100.0% |
Employment Status by Age in Port Aransas
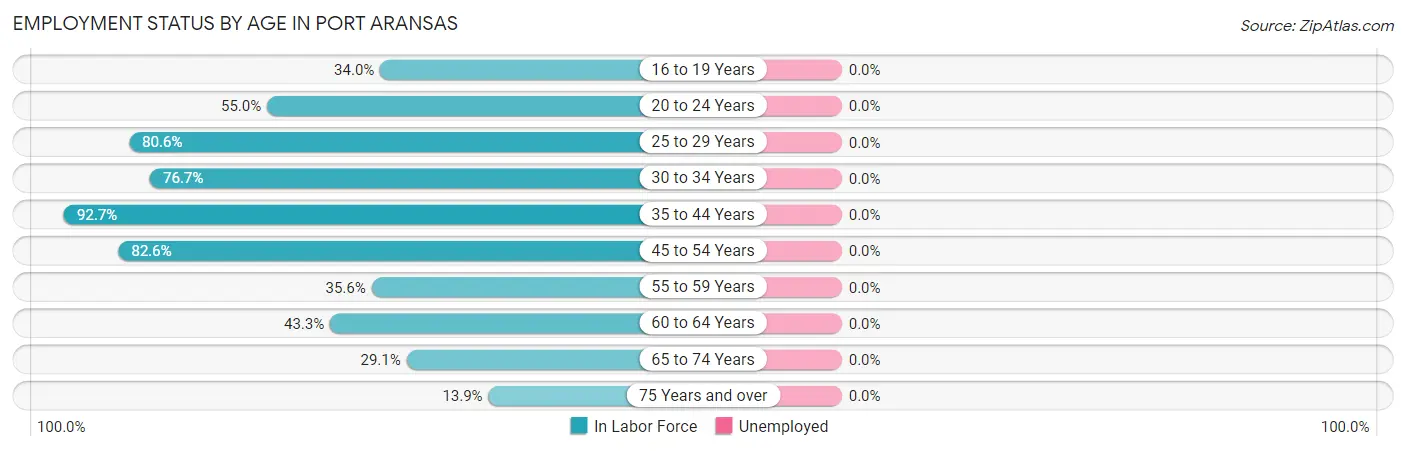
| Age Bracket | In Labor Force | Unemployed |
| 16 to 19 Years | 35 (34.0%) | 0 (0.0%) |
| 20 to 24 Years | 66 (55.0%) | 0 (0.0%) |
| 25 to 29 Years | 29 (80.6%) | 0 (0.0%) |
| 30 to 34 Years | 135 (76.7%) | 0 (0.0%) |
| 35 to 44 Years | 204 (92.7%) | 0 (0.0%) |
| 45 to 54 Years | 437 (82.6%) | 0 (0.0%) |
| 55 to 59 Years | 69 (35.6%) | 0 (0.0%) |
| 60 to 64 Years | 157 (43.3%) | 0 (0.0%) |
| 65 to 74 Years | 183 (29.1%) | 0 (0.0%) |
| 75 Years and over | 43 (13.9%) | 0 (0.0%) |
| Total | 1,359 (50.7%) | 0 (0.0%) |
Employment Status by Educational Attainment in Port Aransas
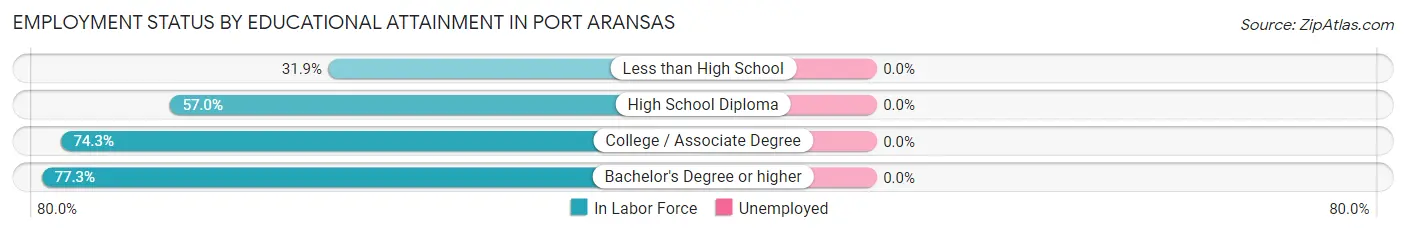
| Educational Attainment | In Labor Force | Unemployed |
| Less than High School | 15 (31.9%) | 0 (0.0%) |
| High School Diploma | 300 (57.0%) | 0 (0.0%) |
| College / Associate Degree | 362 (74.3%) | 0 (0.0%) |
| Bachelor's Degree or higher | 354 (77.3%) | 0 (0.0%) |
| Total | 1,031 (67.9%) | 0 (0.0%) |
Employment Occupations by Sex in Port Aransas
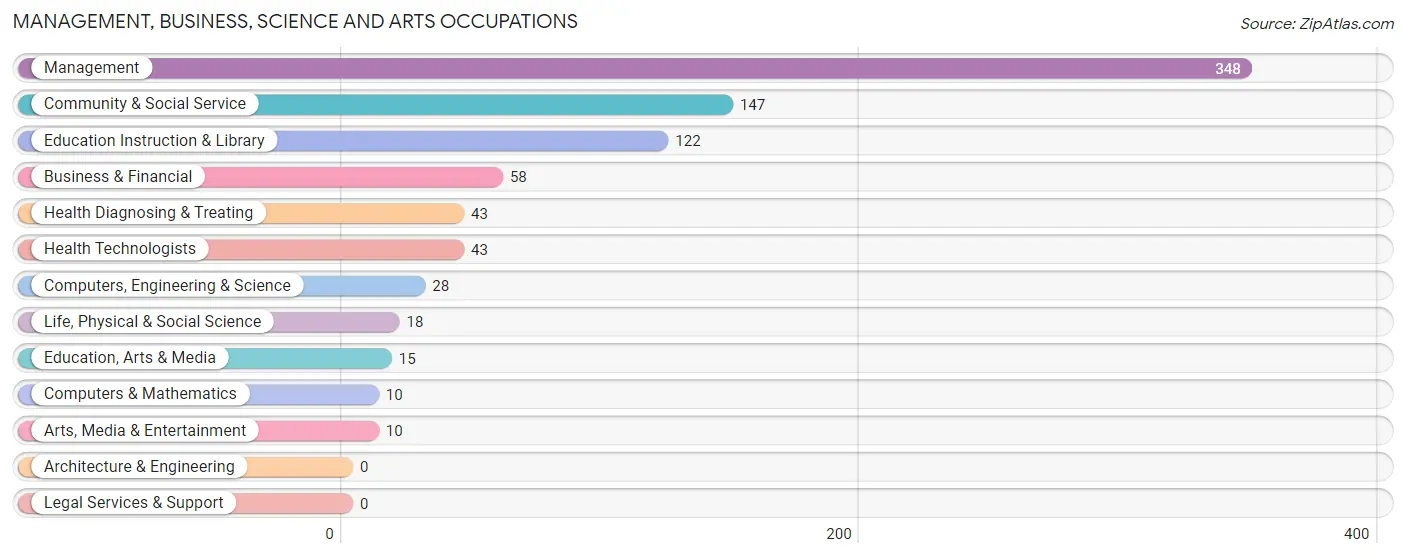
Management, Business, Science and Arts Occupations
The most common Management, Business, Science and Arts occupations in Port Aransas are Management (348 | 25.6%), Community & Social Service (147 | 10.8%), Education Instruction & Library (122 | 9.0%), Business & Financial (58 | 4.3%), and Health Diagnosing & Treating (43 | 3.2%).
Management, Business, Science and Arts Occupations by Sex
Within the Management, Business, Science and Arts occupations in Port Aransas, the most male-oriented occupations are Computers & Mathematics (100.0%), Education, Arts & Media (100.0%), and Management (56.0%), while the most female-oriented occupations are Life, Physical & Social Science (100.0%), Arts, Media & Entertainment (100.0%), and Health Diagnosing & Treating (100.0%).
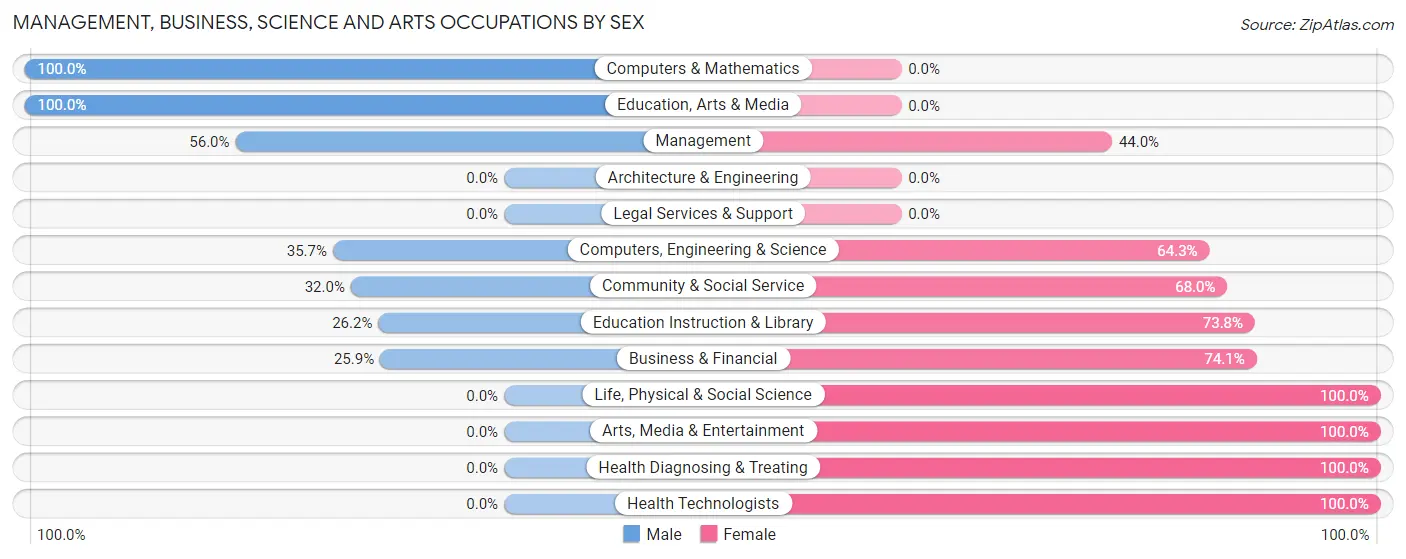
| Occupation | Male | Female |
| Management | 195 (56.0%) | 153 (44.0%) |
| Business & Financial | 15 (25.9%) | 43 (74.1%) |
| Computers, Engineering & Science | 10 (35.7%) | 18 (64.3%) |
| Computers & Mathematics | 10 (100.0%) | 0 (0.0%) |
| Architecture & Engineering | 0 (0.0%) | 0 (0.0%) |
| Life, Physical & Social Science | 0 (0.0%) | 18 (100.0%) |
| Community & Social Service | 47 (32.0%) | 100 (68.0%) |
| Education, Arts & Media | 15 (100.0%) | 0 (0.0%) |
| Legal Services & Support | 0 (0.0%) | 0 (0.0%) |
| Education Instruction & Library | 32 (26.2%) | 90 (73.8%) |
| Arts, Media & Entertainment | 0 (0.0%) | 10 (100.0%) |
| Health Diagnosing & Treating | 0 (0.0%) | 43 (100.0%) |
| Health Technologists | 0 (0.0%) | 43 (100.0%) |
| Total (Category) | 267 (42.8%) | 357 (57.2%) |
| Total (Overall) | 718 (52.9%) | 640 (47.1%) |
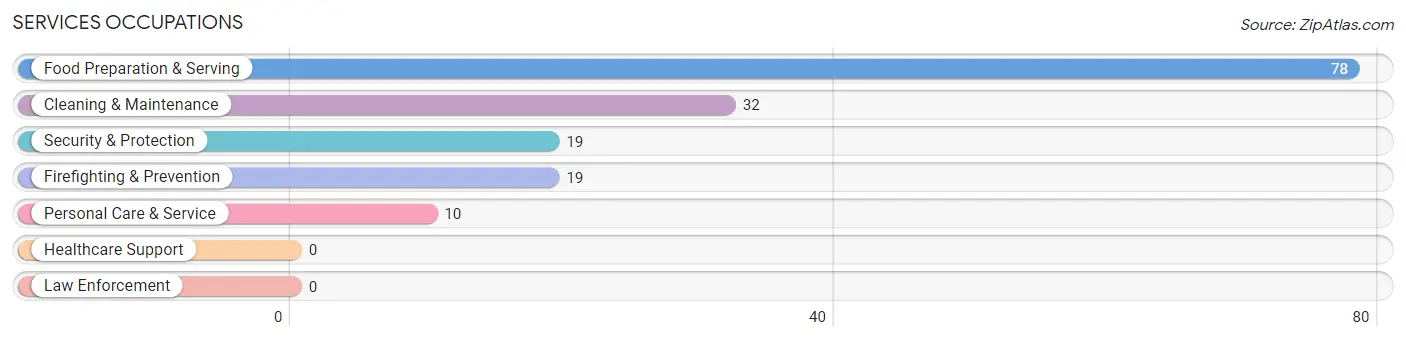
Services Occupations
The most common Services occupations in Port Aransas are Food Preparation & Serving (78 | 5.7%), Cleaning & Maintenance (32 | 2.4%), Security & Protection (19 | 1.4%), Firefighting & Prevention (19 | 1.4%), and Personal Care & Service (10 | 0.7%).
Services Occupations by Sex
Within the Services occupations in Port Aransas, the most male-oriented occupations are Security & Protection (100.0%), Firefighting & Prevention (100.0%), and Cleaning & Maintenance (50.0%), while the most female-oriented occupations are Personal Care & Service (100.0%), Food Preparation & Serving (57.7%), and Cleaning & Maintenance (50.0%).
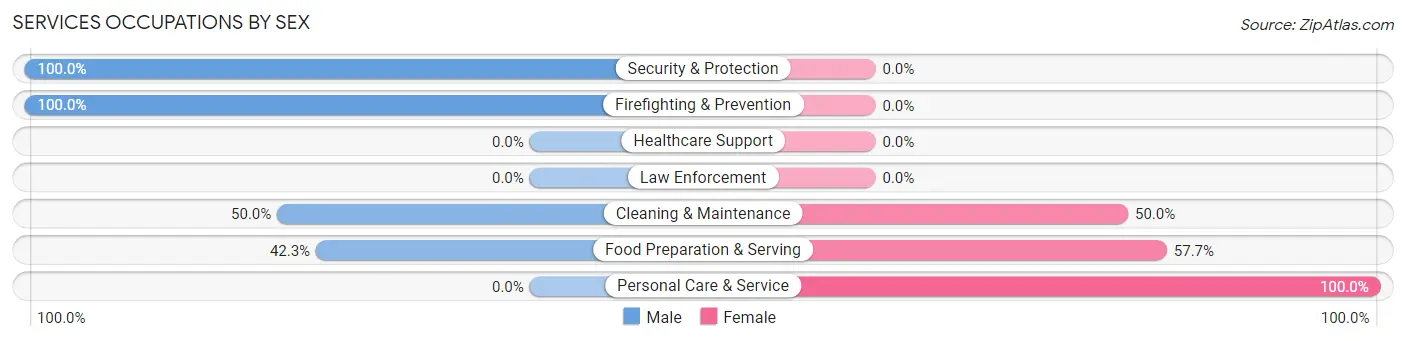
| Occupation | Male | Female |
| Healthcare Support | 0 (0.0%) | 0 (0.0%) |
| Security & Protection | 19 (100.0%) | 0 (0.0%) |
| Firefighting & Prevention | 19 (100.0%) | 0 (0.0%) |
| Law Enforcement | 0 (0.0%) | 0 (0.0%) |
| Food Preparation & Serving | 33 (42.3%) | 45 (57.7%) |
| Cleaning & Maintenance | 16 (50.0%) | 16 (50.0%) |
| Personal Care & Service | 0 (0.0%) | 10 (100.0%) |
| Total (Category) | 68 (48.9%) | 71 (51.1%) |
| Total (Overall) | 718 (52.9%) | 640 (47.1%) |
Sales and Office Occupations
The most common Sales and Office occupations in Port Aransas are Office & Administration (82 | 6.0%), and Sales & Related (80 | 5.9%).
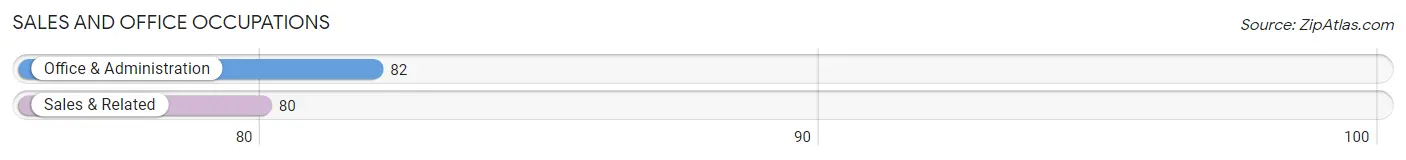
Sales and Office Occupations by Sex
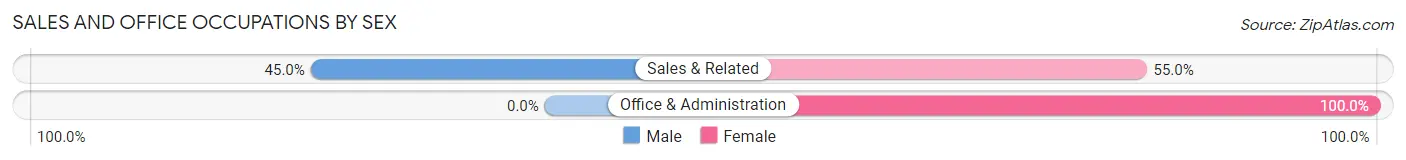
| Occupation | Male | Female |
| Sales & Related | 36 (45.0%) | 44 (55.0%) |
| Office & Administration | 0 (0.0%) | 82 (100.0%) |
| Total (Category) | 36 (22.2%) | 126 (77.8%) |
| Total (Overall) | 718 (52.9%) | 640 (47.1%) |
Natural Resources, Construction and Maintenance Occupations
The most common Natural Resources, Construction and Maintenance occupations in Port Aransas are Construction & Extraction (216 | 15.9%), Installation, Maintenance & Repair (60 | 4.4%), and Farming, Fishing & Forestry (25 | 1.8%).
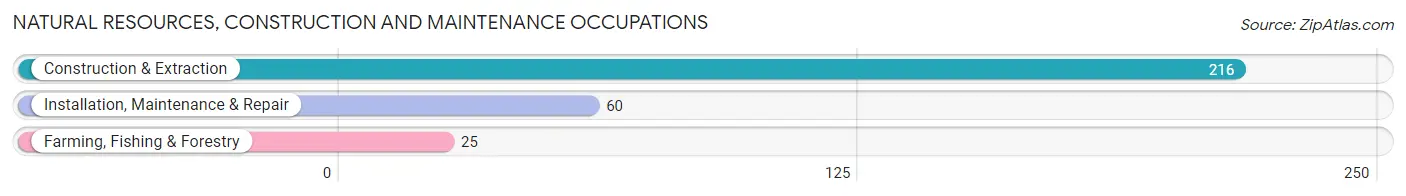
Natural Resources, Construction and Maintenance Occupations by Sex
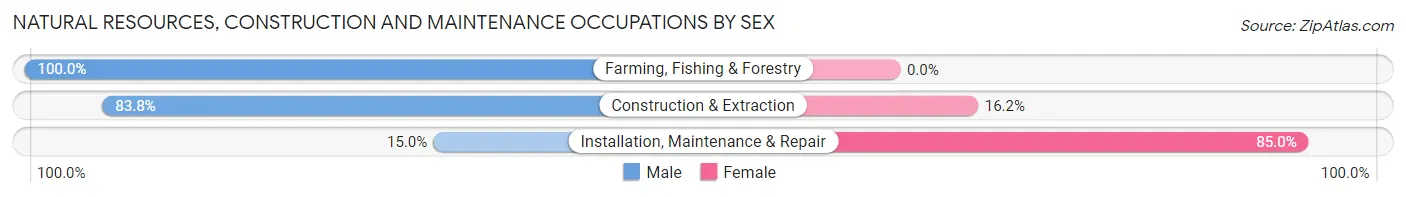
| Occupation | Male | Female |
| Farming, Fishing & Forestry | 25 (100.0%) | 0 (0.0%) |
| Construction & Extraction | 181 (83.8%) | 35 (16.2%) |
| Installation, Maintenance & Repair | 9 (15.0%) | 51 (85.0%) |
| Total (Category) | 215 (71.4%) | 86 (28.6%) |
| Total (Overall) | 718 (52.9%) | 640 (47.1%) |
Production, Transportation and Moving Occupations
The most common Production, Transportation and Moving occupations in Port Aransas are Transportation (105 | 7.7%), and Material Moving (27 | 2.0%).
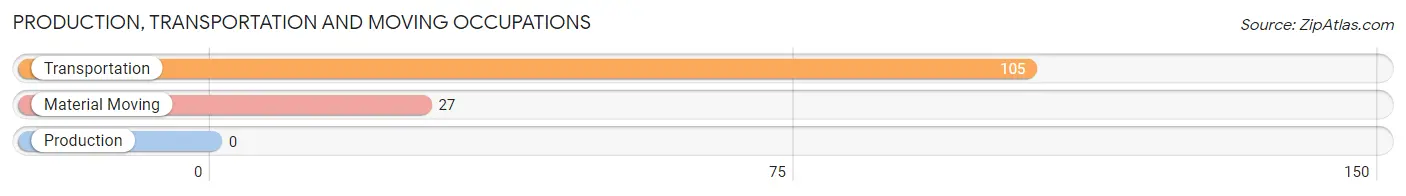
Production, Transportation and Moving Occupations by Sex
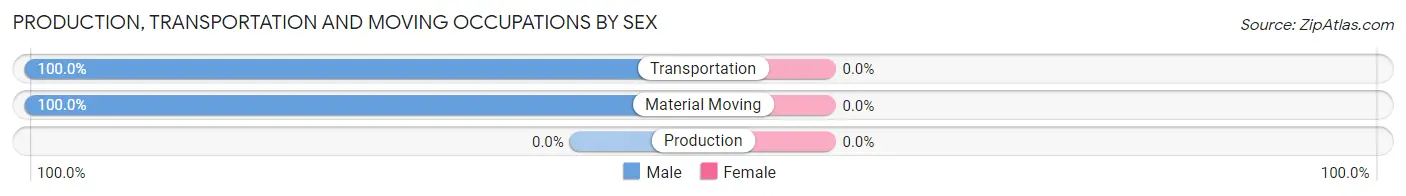
| Occupation | Male | Female |
| Production | 0 (0.0%) | 0 (0.0%) |
| Transportation | 105 (100.0%) | 0 (0.0%) |
| Material Moving | 27 (100.0%) | 0 (0.0%) |
| Total (Category) | 132 (100.0%) | 0 (0.0%) |
| Total (Overall) | 718 (52.9%) | 640 (47.1%) |
Employment Industries by Sex in Port Aransas
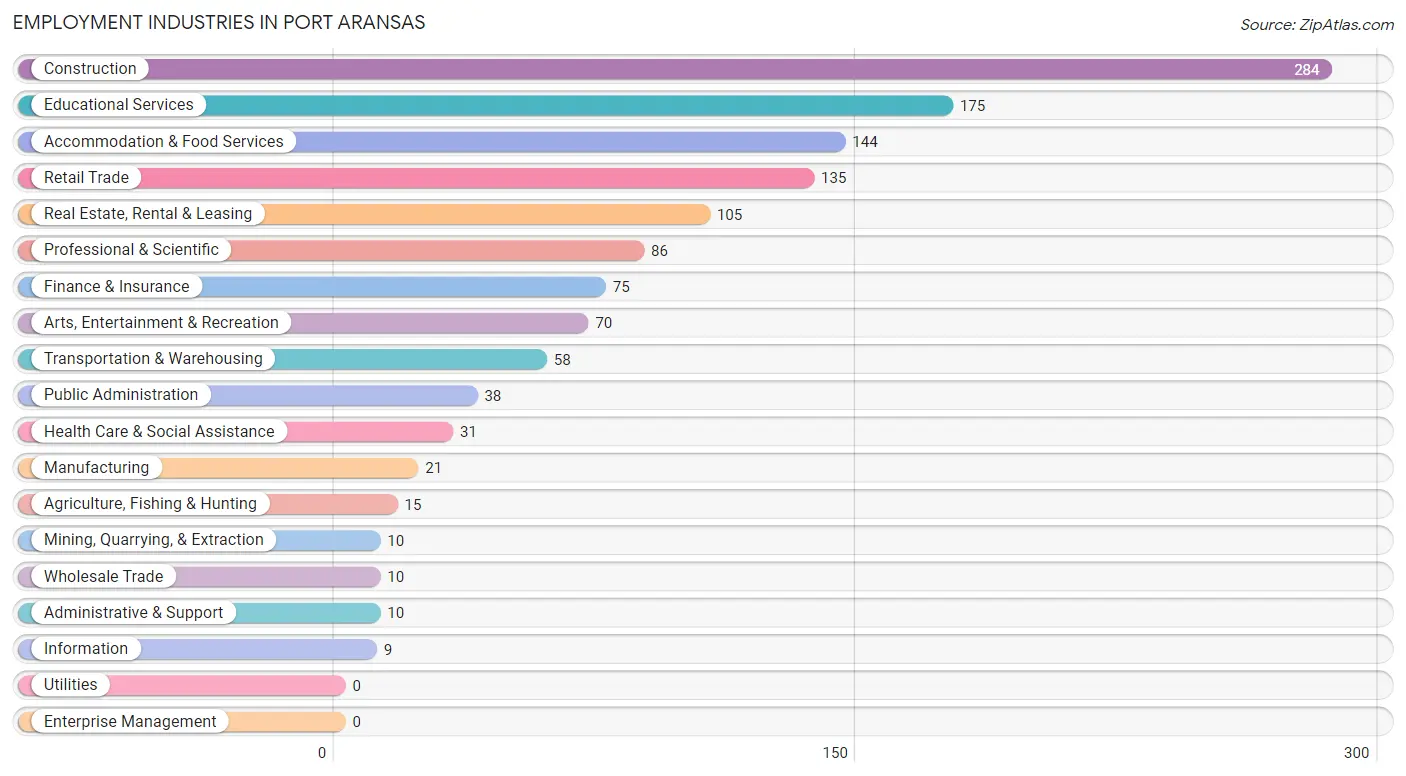
Employment Industries in Port Aransas
The major employment industries in Port Aransas include Construction (284 | 20.9%), Educational Services (175 | 12.9%), Accommodation & Food Services (144 | 10.6%), Retail Trade (135 | 9.9%), and Real Estate, Rental & Leasing (105 | 7.7%).
Employment Industries by Sex in Port Aransas
The Port Aransas industries that see more men than women are Agriculture, Fishing & Hunting (100.0%), Mining, Quarrying, & Extraction (100.0%), and Wholesale Trade (100.0%), whereas the industries that tend to have a higher number of women are Health Care & Social Assistance (100.0%), Professional & Scientific (87.2%), and Accommodation & Food Services (77.1%).
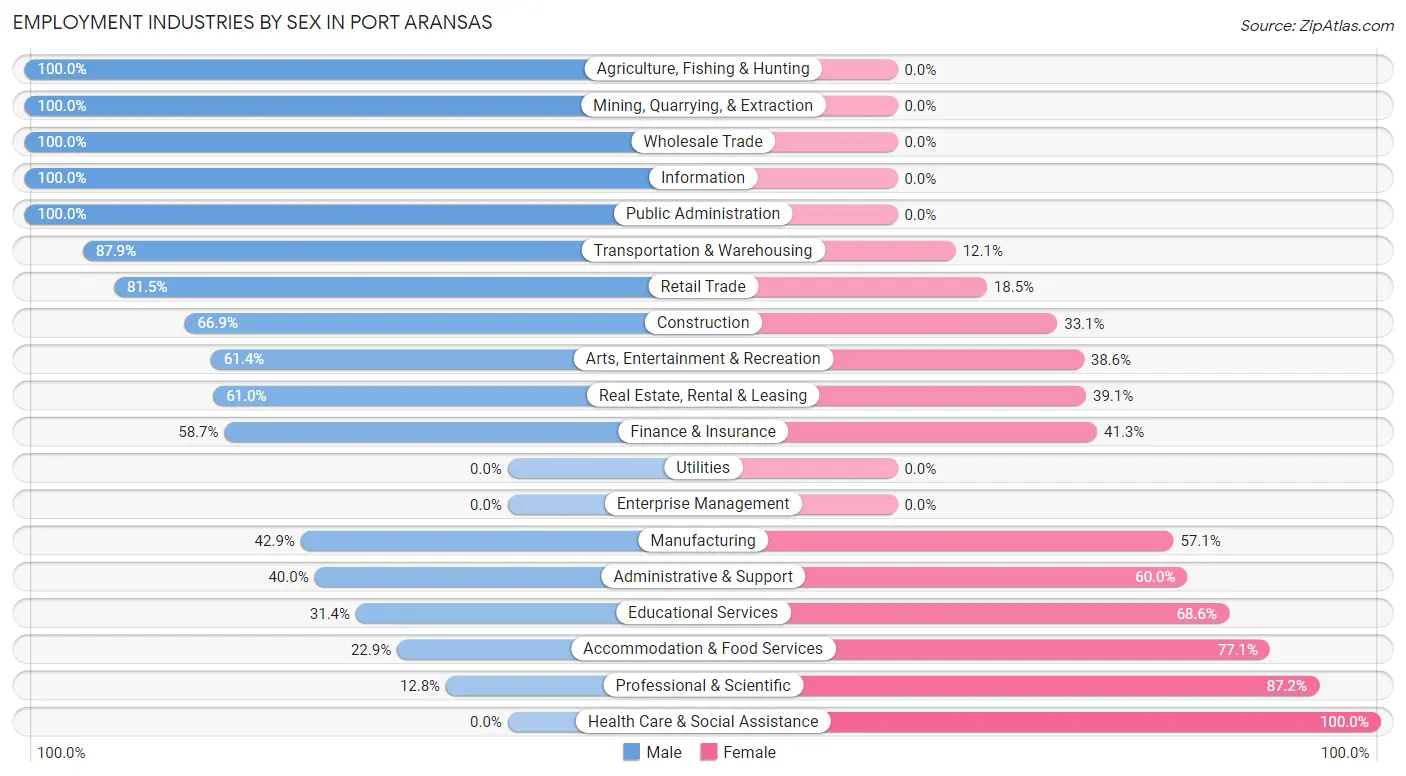
| Industry | Male | Female |
| Agriculture, Fishing & Hunting | 15 (100.0%) | 0 (0.0%) |
| Mining, Quarrying, & Extraction | 10 (100.0%) | 0 (0.0%) |
| Construction | 190 (66.9%) | 94 (33.1%) |
| Manufacturing | 9 (42.9%) | 12 (57.1%) |
| Wholesale Trade | 10 (100.0%) | 0 (0.0%) |
| Retail Trade | 110 (81.5%) | 25 (18.5%) |
| Transportation & Warehousing | 51 (87.9%) | 7 (12.1%) |
| Utilities | 0 (0.0%) | 0 (0.0%) |
| Information | 9 (100.0%) | 0 (0.0%) |
| Finance & Insurance | 44 (58.7%) | 31 (41.3%) |
| Real Estate, Rental & Leasing | 64 (61.0%) | 41 (39.1%) |
| Professional & Scientific | 11 (12.8%) | 75 (87.2%) |
| Enterprise Management | 0 (0.0%) | 0 (0.0%) |
| Administrative & Support | 4 (40.0%) | 6 (60.0%) |
| Educational Services | 55 (31.4%) | 120 (68.6%) |
| Health Care & Social Assistance | 0 (0.0%) | 31 (100.0%) |
| Arts, Entertainment & Recreation | 43 (61.4%) | 27 (38.6%) |
| Accommodation & Food Services | 33 (22.9%) | 111 (77.1%) |
| Public Administration | 38 (100.0%) | 0 (0.0%) |
| Total | 718 (52.9%) | 640 (47.1%) |
Education in Port Aransas
School Enrollment in Port Aransas
The most common levels of schooling among the 407 students in Port Aransas are high school (183 | 45.0%), elementary school (117 | 28.7%), and nursery / preschool (57 | 14.0%).
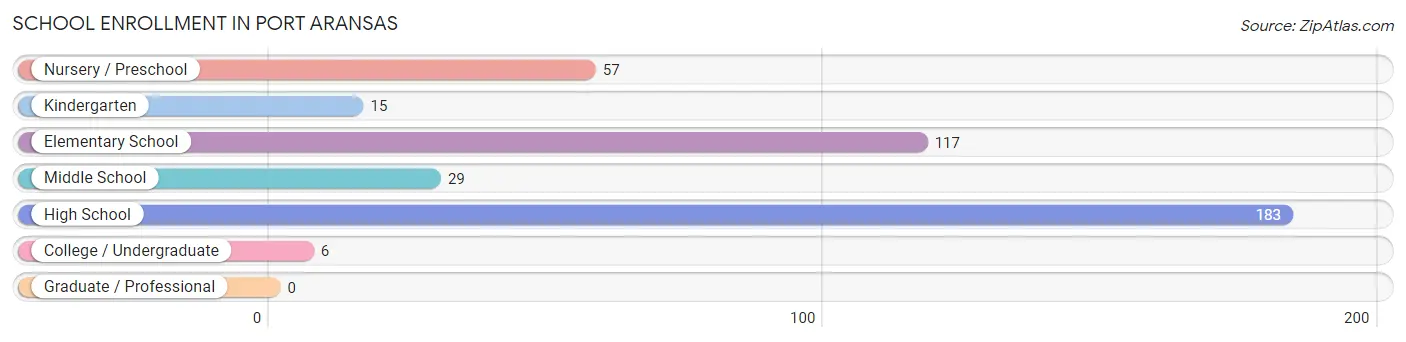
| School Level | # Students | % Students |
| Nursery / Preschool | 57 | 14.0% |
| Kindergarten | 15 | 3.7% |
| Elementary School | 117 | 28.7% |
| Middle School | 29 | 7.1% |
| High School | 183 | 45.0% |
| College / Undergraduate | 6 | 1.5% |
| Graduate / Professional | 0 | 0.0% |
| Total | 407 | 100.0% |
School Enrollment by Age by Funding Source in Port Aransas
Out of a total of 407 students who are enrolled in schools in Port Aransas, 15 (3.7%) attend a private institution, while the remaining 392 (96.3%) are enrolled in public schools. The age group of 5 to 9 year old has the highest likelihood of being enrolled in private schools, with 15 (7.9% in the age bracket) enrolled. Conversely, the age group of 10 to 14 year olds has the lowest likelihood of being enrolled in a private school, with 29 (100.0% in the age bracket) attending a public institution.
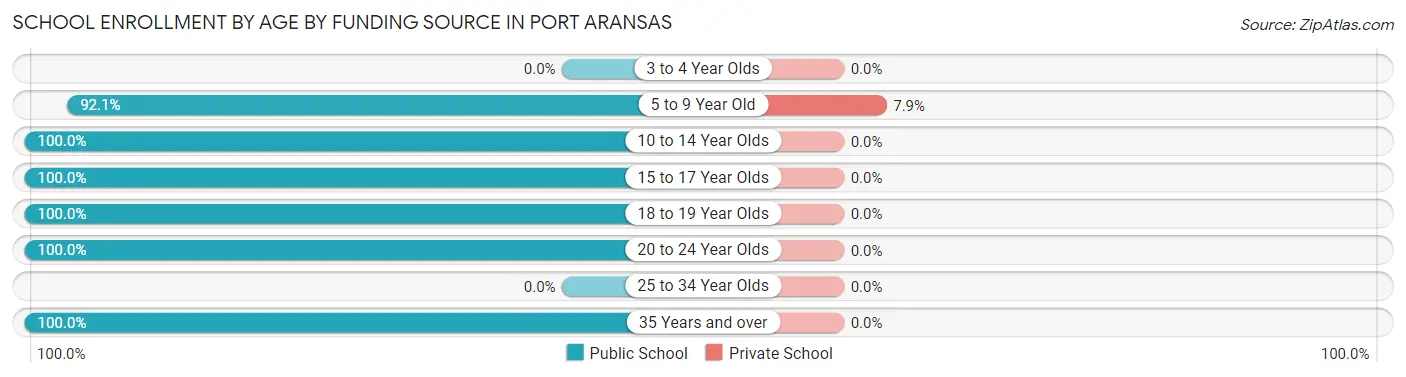
| Age Bracket | Public School | Private School |
| 3 to 4 Year Olds | 0 (0.0%) | 0 (0.0%) |
| 5 to 9 Year Old | 174 (92.1%) | 15 (7.9%) |
| 10 to 14 Year Olds | 29 (100.0%) | 0 (0.0%) |
| 15 to 17 Year Olds | 168 (100.0%) | 0 (0.0%) |
| 18 to 19 Year Olds | 7 (100.0%) | 0 (0.0%) |
| 20 to 24 Year Olds | 6 (100.0%) | 0 (0.0%) |
| 25 to 34 Year Olds | 0 (0.0%) | 0 (0.0%) |
| 35 Years and over | 8 (100.0%) | 0 (0.0%) |
| Total | 392 (96.3%) | 15 (3.7%) |
Educational Attainment by Field of Study in Port Aransas
Business (231 | 25.3%), education (152 | 16.7%), bio, nature & agricultural (133 | 14.6%), social sciences (88 | 9.7%), and visual & performing arts (68 | 7.5%) are the most common fields of study among 912 individuals in Port Aransas who have obtained a bachelor's degree or higher.
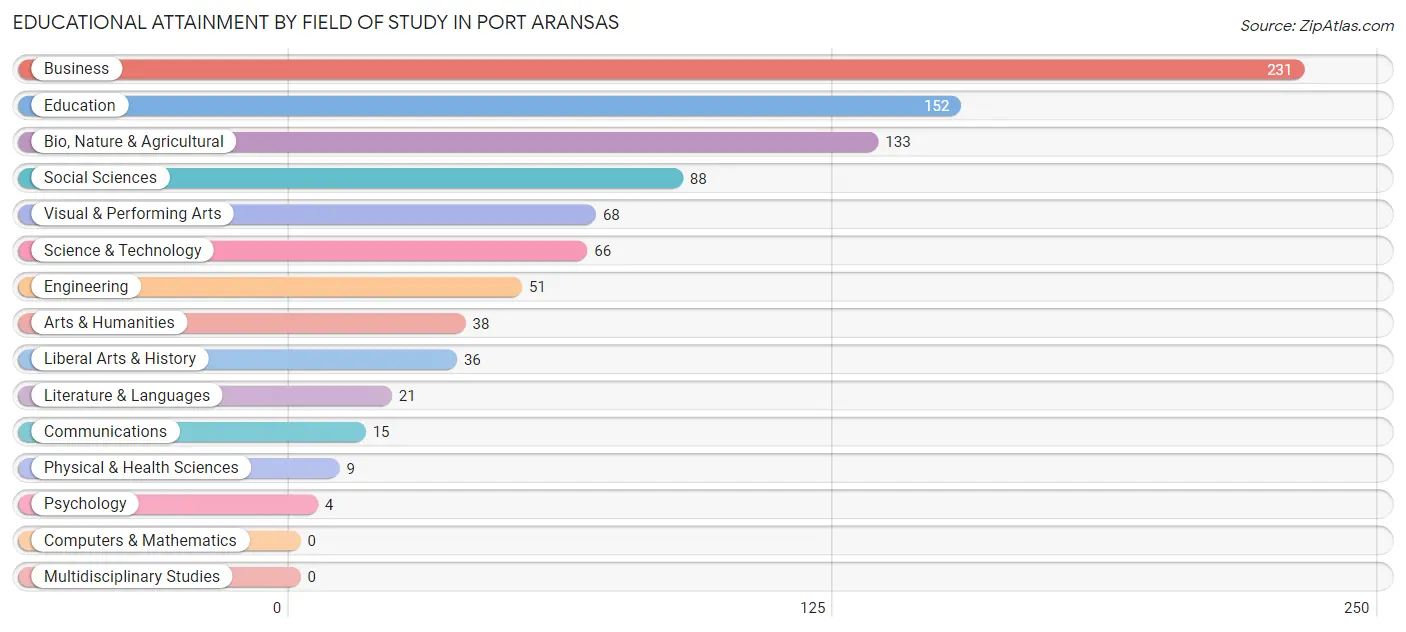
| Field of Study | # Graduates | % Graduates |
| Computers & Mathematics | 0 | 0.0% |
| Bio, Nature & Agricultural | 133 | 14.6% |
| Physical & Health Sciences | 9 | 1.0% |
| Psychology | 4 | 0.4% |
| Social Sciences | 88 | 9.7% |
| Engineering | 51 | 5.6% |
| Multidisciplinary Studies | 0 | 0.0% |
| Science & Technology | 66 | 7.2% |
| Business | 231 | 25.3% |
| Education | 152 | 16.7% |
| Literature & Languages | 21 | 2.3% |
| Liberal Arts & History | 36 | 4.0% |
| Visual & Performing Arts | 68 | 7.5% |
| Communications | 15 | 1.6% |
| Arts & Humanities | 38 | 4.2% |
| Total | 912 | 100.0% |
Transportation & Commute in Port Aransas
Vehicle Availability by Sex in Port Aransas
The most prevalent vehicle ownership categories in Port Aransas are males with 2 vehicles (390, accounting for 55.9%) and females with 2 vehicles (373, making up 62.3%).
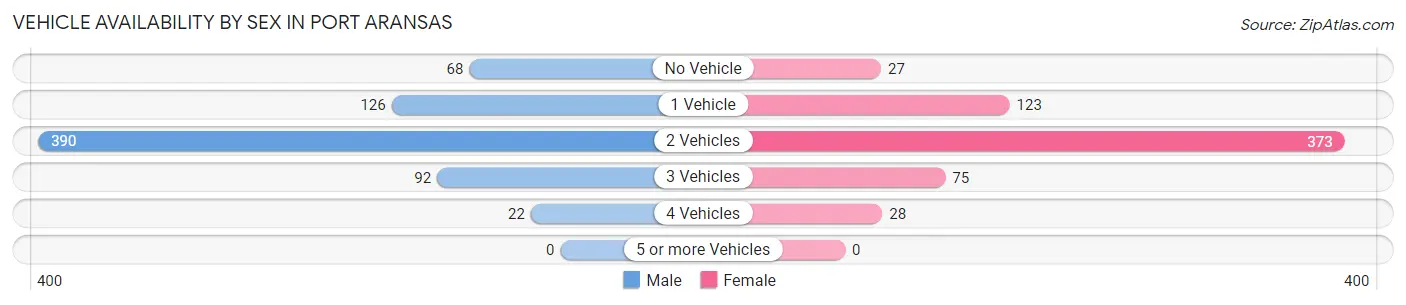
| Vehicles Available | Male | Female |
| No Vehicle | 68 (9.7%) | 27 (4.3%) |
| 1 Vehicle | 126 (18.0%) | 123 (19.7%) |
| 2 Vehicles | 390 (55.9%) | 373 (59.6%) |
| 3 Vehicles | 92 (13.2%) | 75 (12.0%) |
| 4 Vehicles | 22 (3.2%) | 28 (4.5%) |
| 5 or more Vehicles | 0 (0.0%) | 0 (0.0%) |
| Total | 698 (100.0%) | 626 (100.0%) |
Commute Time in Port Aransas
The most frequently occuring commute durations in Port Aransas are 10 to 14 minutes (484 commuters, 39.9%), 5 to 9 minutes (349 commuters, 28.7%), and less than 5 minutes (102 commuters, 8.4%).
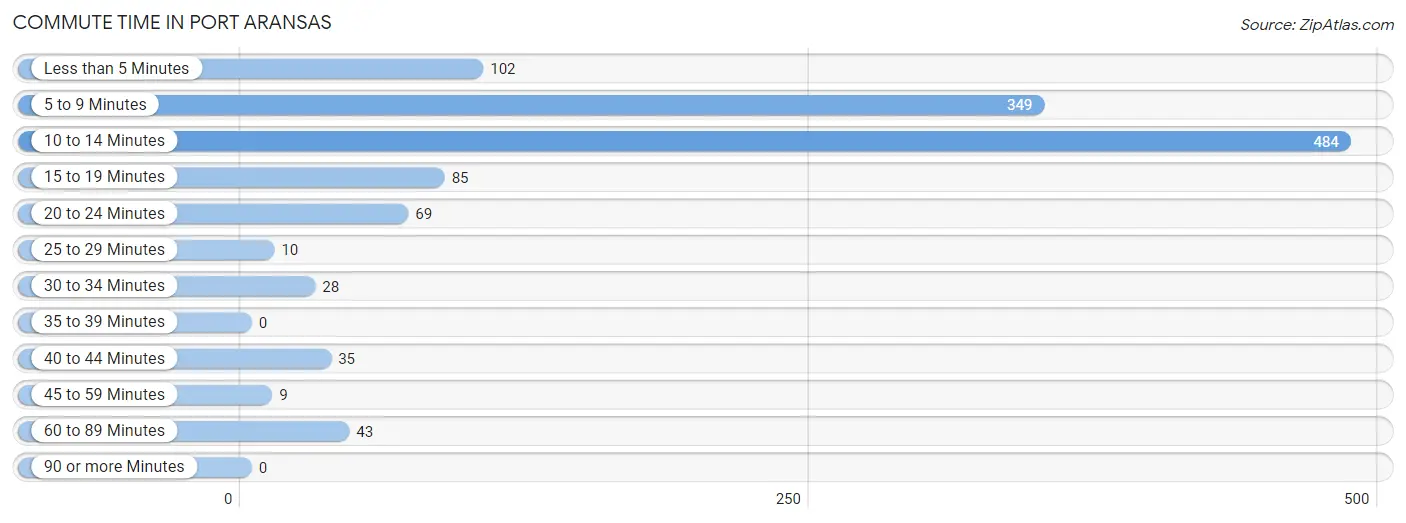
| Commute Time | # Commuters | % Commuters |
| Less than 5 Minutes | 102 | 8.4% |
| 5 to 9 Minutes | 349 | 28.7% |
| 10 to 14 Minutes | 484 | 39.9% |
| 15 to 19 Minutes | 85 | 7.0% |
| 20 to 24 Minutes | 69 | 5.7% |
| 25 to 29 Minutes | 10 | 0.8% |
| 30 to 34 Minutes | 28 | 2.3% |
| 35 to 39 Minutes | 0 | 0.0% |
| 40 to 44 Minutes | 35 | 2.9% |
| 45 to 59 Minutes | 9 | 0.7% |
| 60 to 89 Minutes | 43 | 3.5% |
| 90 or more Minutes | 0 | 0.0% |
Commute Time by Sex in Port Aransas
The most common commute times in Port Aransas are 5 to 9 minutes (228 commuters, 35.8%) for males and 10 to 14 minutes (329 commuters, 56.9%) for females.
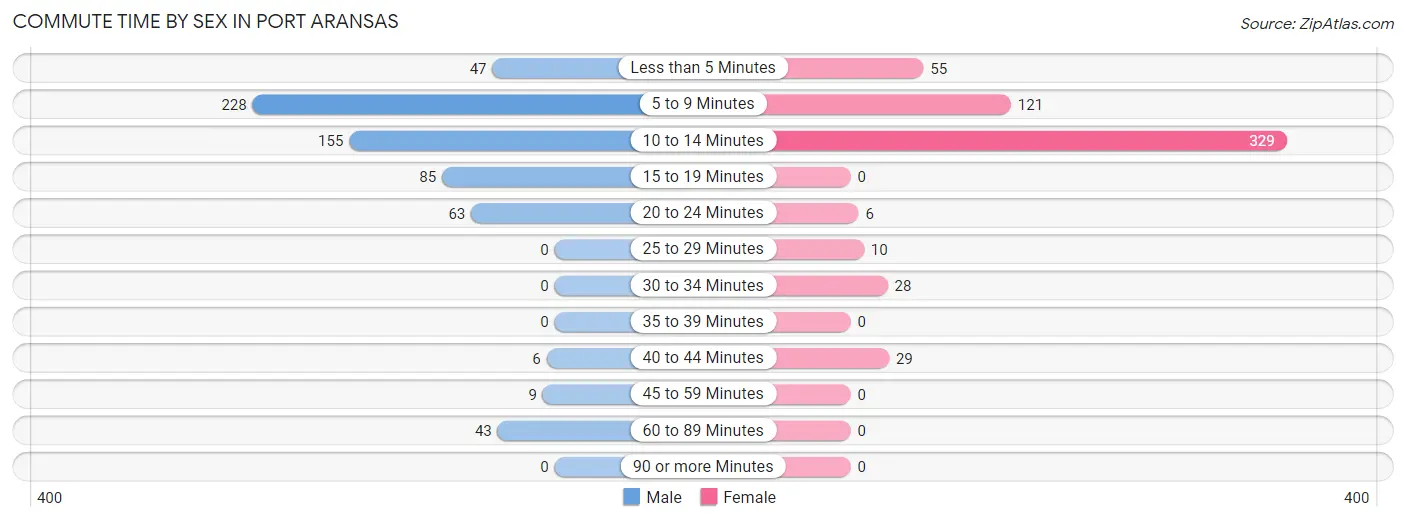
| Commute Time | Male | Female |
| Less than 5 Minutes | 47 (7.4%) | 55 (9.5%) |
| 5 to 9 Minutes | 228 (35.8%) | 121 (20.9%) |
| 10 to 14 Minutes | 155 (24.4%) | 329 (56.9%) |
| 15 to 19 Minutes | 85 (13.4%) | 0 (0.0%) |
| 20 to 24 Minutes | 63 (9.9%) | 6 (1.0%) |
| 25 to 29 Minutes | 0 (0.0%) | 10 (1.7%) |
| 30 to 34 Minutes | 0 (0.0%) | 28 (4.8%) |
| 35 to 39 Minutes | 0 (0.0%) | 0 (0.0%) |
| 40 to 44 Minutes | 6 (0.9%) | 29 (5.0%) |
| 45 to 59 Minutes | 9 (1.4%) | 0 (0.0%) |
| 60 to 89 Minutes | 43 (6.8%) | 0 (0.0%) |
| 90 or more Minutes | 0 (0.0%) | 0 (0.0%) |
Time of Departure to Work by Sex in Port Aransas
The most frequent times of departure to work in Port Aransas are 6:30 AM to 6:59 AM (207, 32.6%) for males and 9:00 AM to 9:59 AM (209, 36.2%) for females.
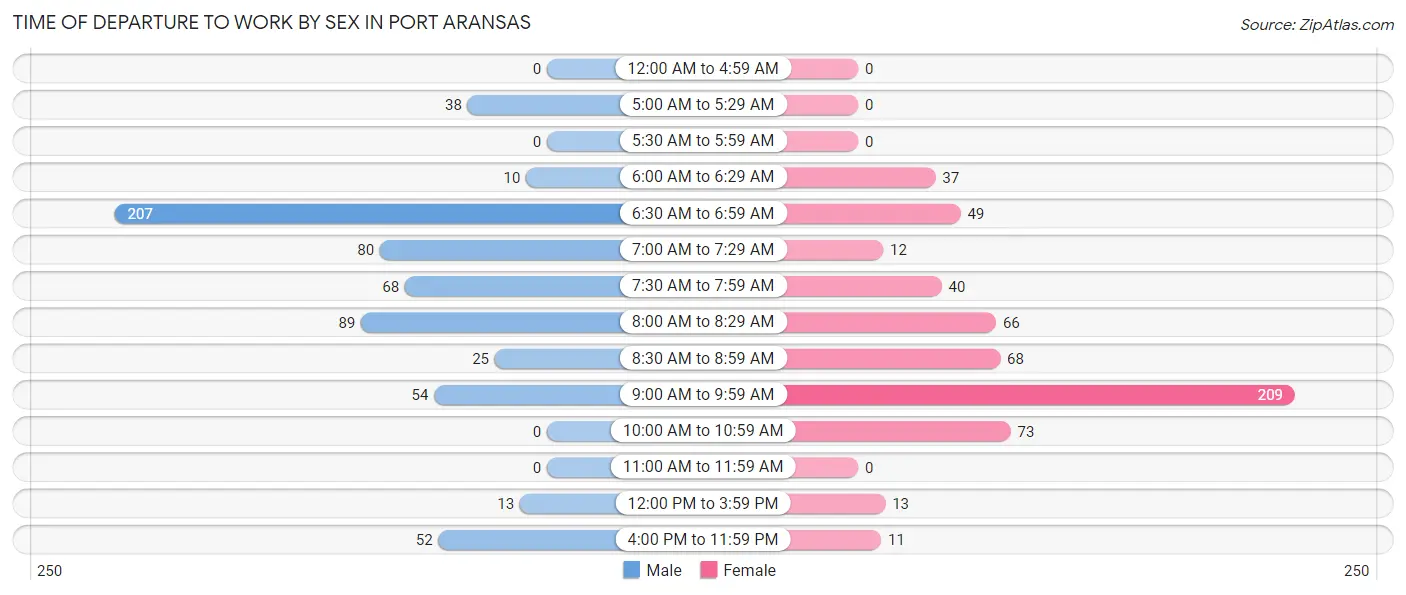
| Time of Departure | Male | Female |
| 12:00 AM to 4:59 AM | 0 (0.0%) | 0 (0.0%) |
| 5:00 AM to 5:29 AM | 38 (6.0%) | 0 (0.0%) |
| 5:30 AM to 5:59 AM | 0 (0.0%) | 0 (0.0%) |
| 6:00 AM to 6:29 AM | 10 (1.6%) | 37 (6.4%) |
| 6:30 AM to 6:59 AM | 207 (32.6%) | 49 (8.5%) |
| 7:00 AM to 7:29 AM | 80 (12.6%) | 12 (2.1%) |
| 7:30 AM to 7:59 AM | 68 (10.7%) | 40 (6.9%) |
| 8:00 AM to 8:29 AM | 89 (14.0%) | 66 (11.4%) |
| 8:30 AM to 8:59 AM | 25 (3.9%) | 68 (11.8%) |
| 9:00 AM to 9:59 AM | 54 (8.5%) | 209 (36.2%) |
| 10:00 AM to 10:59 AM | 0 (0.0%) | 73 (12.6%) |
| 11:00 AM to 11:59 AM | 0 (0.0%) | 0 (0.0%) |
| 12:00 PM to 3:59 PM | 13 (2.0%) | 13 (2.2%) |
| 4:00 PM to 11:59 PM | 52 (8.2%) | 11 (1.9%) |
| Total | 636 (100.0%) | 578 (100.0%) |
Housing Occupancy in Port Aransas
Occupancy by Ownership in Port Aransas
Of the total 1,462 dwellings in Port Aransas, owner-occupied units account for 1,044 (71.4%), while renter-occupied units make up 418 (28.6%).
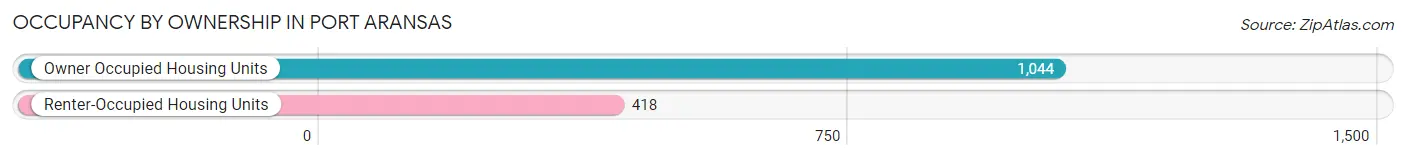
| Occupancy | # Housing Units | % Housing Units |
| Owner Occupied Housing Units | 1,044 | 71.4% |
| Renter-Occupied Housing Units | 418 | 28.6% |
| Total Occupied Housing Units | 1,462 | 100.0% |
Occupancy by Household Size in Port Aransas
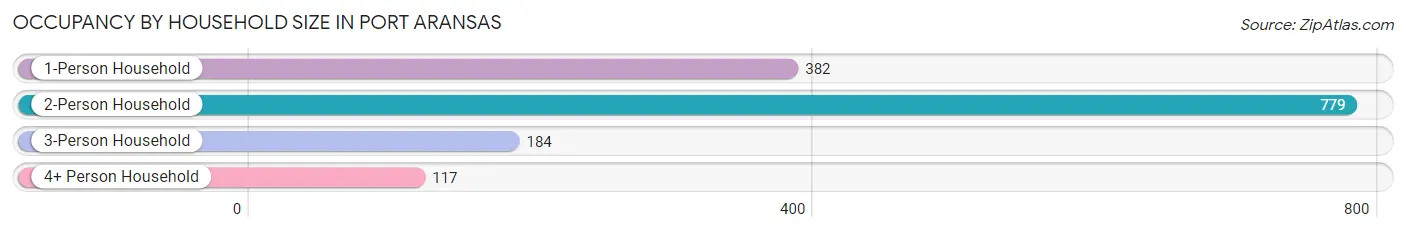
| Household Size | # Housing Units | % Housing Units |
| 1-Person Household | 382 | 26.1% |
| 2-Person Household | 779 | 53.3% |
| 3-Person Household | 184 | 12.6% |
| 4+ Person Household | 117 | 8.0% |
| Total Housing Units | 1,462 | 100.0% |
Occupancy by Ownership by Household Size in Port Aransas
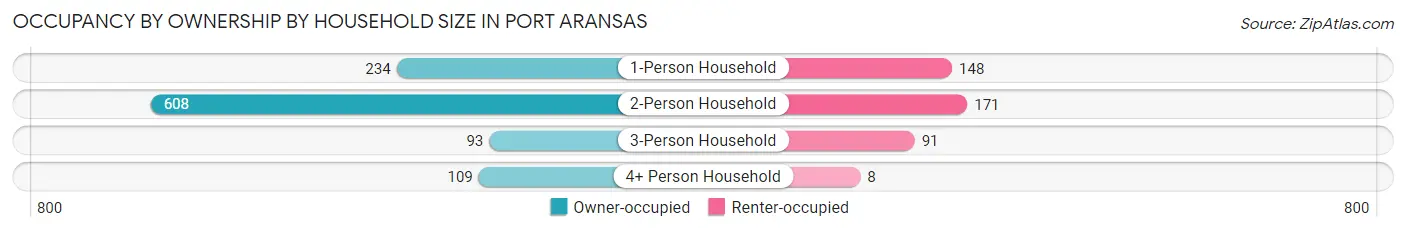
| Household Size | Owner-occupied | Renter-occupied |
| 1-Person Household | 234 (61.3%) | 148 (38.7%) |
| 2-Person Household | 608 (78.0%) | 171 (22.0%) |
| 3-Person Household | 93 (50.5%) | 91 (49.5%) |
| 4+ Person Household | 109 (93.2%) | 8 (6.8%) |
| Total Housing Units | 1,044 (71.4%) | 418 (28.6%) |
Occupancy by Educational Attainment in Port Aransas
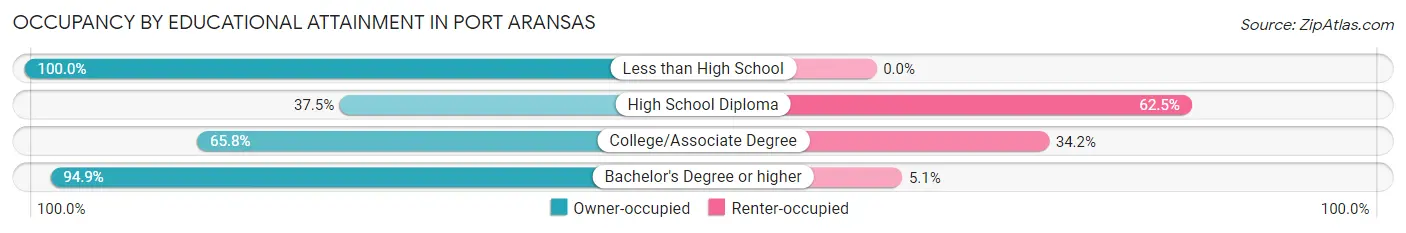
| Household Size | Owner-occupied | Renter-occupied |
| Less than High School | 16 (100.0%) | 0 (0.0%) |
| High School Diploma | 124 (37.5%) | 207 (62.5%) |
| College/Associate Degree | 348 (65.8%) | 181 (34.2%) |
| Bachelor's Degree or higher | 556 (94.9%) | 30 (5.1%) |
Occupancy by Age of Householder in Port Aransas
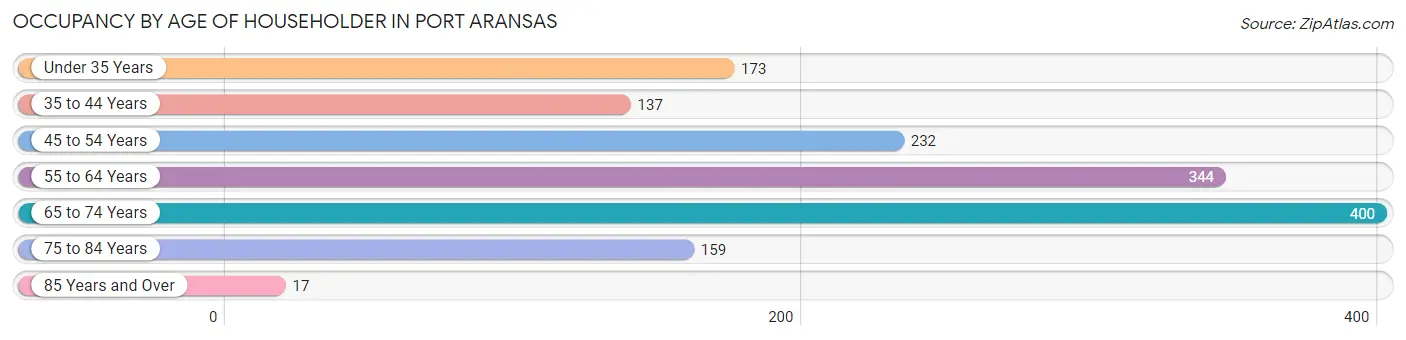
| Age Bracket | # Households | % Households |
| Under 35 Years | 173 | 11.8% |
| 35 to 44 Years | 137 | 9.4% |
| 45 to 54 Years | 232 | 15.9% |
| 55 to 64 Years | 344 | 23.5% |
| 65 to 74 Years | 400 | 27.4% |
| 75 to 84 Years | 159 | 10.9% |
| 85 Years and Over | 17 | 1.2% |
| Total | 1,462 | 100.0% |
Housing Finances in Port Aransas
Median Income by Occupancy in Port Aransas
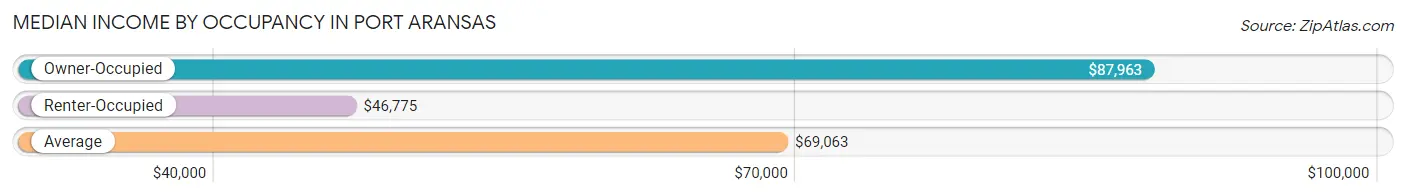
| Occupancy Type | # Households | Median Income |
| Owner-Occupied | 1,044 (71.4%) | $87,963 |
| Renter-Occupied | 418 (28.6%) | $46,775 |
| Average | 1,462 (100.0%) | $69,063 |
Occupancy by Householder Income Bracket in Port Aransas
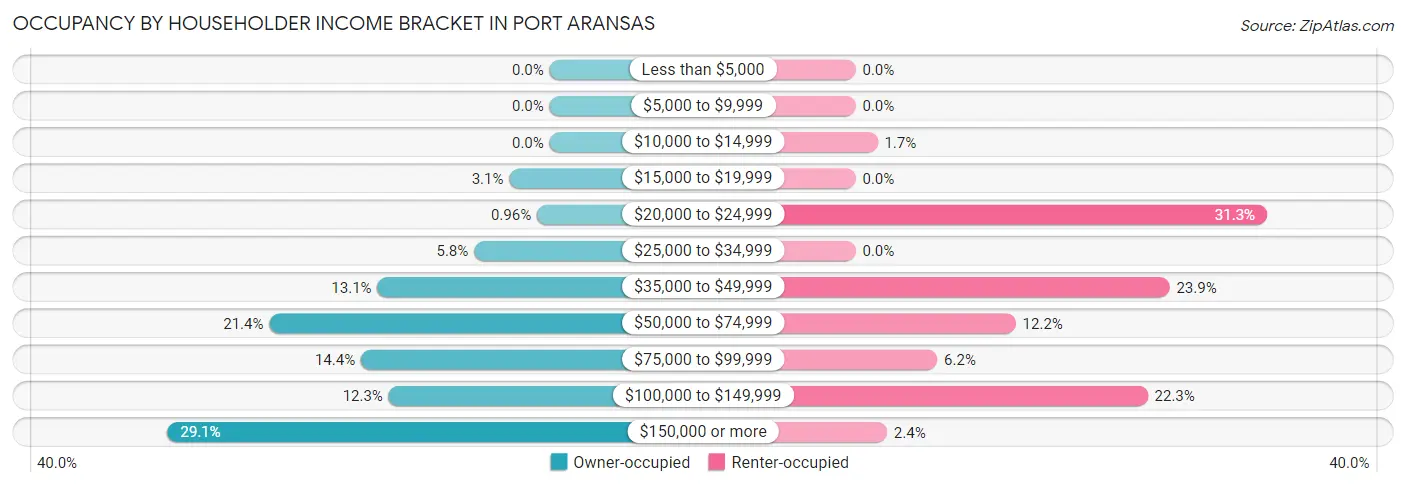
| Income Bracket | Owner-occupied | Renter-occupied |
| Less than $5,000 | 0 (0.0%) | 0 (0.0%) |
| $5,000 to $9,999 | 0 (0.0%) | 0 (0.0%) |
| $10,000 to $14,999 | 0 (0.0%) | 7 (1.7%) |
| $15,000 to $19,999 | 32 (3.1%) | 0 (0.0%) |
| $20,000 to $24,999 | 10 (1.0%) | 131 (31.3%) |
| $25,000 to $34,999 | 60 (5.8%) | 0 (0.0%) |
| $35,000 to $49,999 | 137 (13.1%) | 100 (23.9%) |
| $50,000 to $74,999 | 223 (21.4%) | 51 (12.2%) |
| $75,000 to $99,999 | 150 (14.4%) | 26 (6.2%) |
| $100,000 to $149,999 | 128 (12.3%) | 93 (22.3%) |
| $150,000 or more | 304 (29.1%) | 10 (2.4%) |
| Total | 1,044 (100.0%) | 418 (100.0%) |
Monthly Housing Cost Tiers in Port Aransas
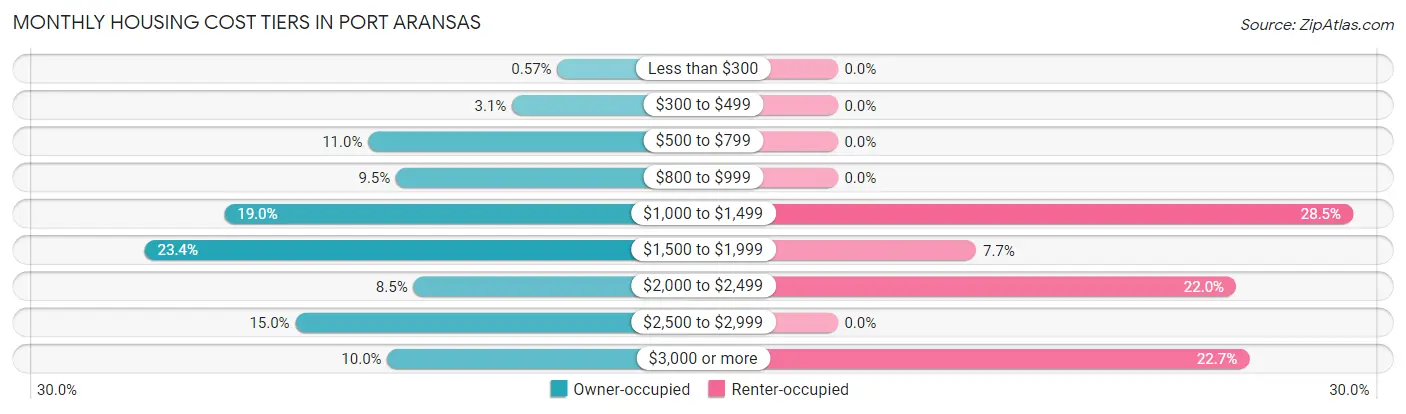
| Monthly Cost | Owner-occupied | Renter-occupied |
| Less than $300 | 6 (0.6%) | 0 (0.0%) |
| $300 to $499 | 32 (3.1%) | 0 (0.0%) |
| $500 to $799 | 115 (11.0%) | 0 (0.0%) |
| $800 to $999 | 99 (9.5%) | 0 (0.0%) |
| $1,000 to $1,499 | 198 (19.0%) | 119 (28.5%) |
| $1,500 to $1,999 | 244 (23.4%) | 32 (7.7%) |
| $2,000 to $2,499 | 89 (8.5%) | 92 (22.0%) |
| $2,500 to $2,999 | 157 (15.0%) | 0 (0.0%) |
| $3,000 or more | 104 (10.0%) | 95 (22.7%) |
| Total | 1,044 (100.0%) | 418 (100.0%) |
Physical Housing Characteristics in Port Aransas
Housing Structures in Port Aransas
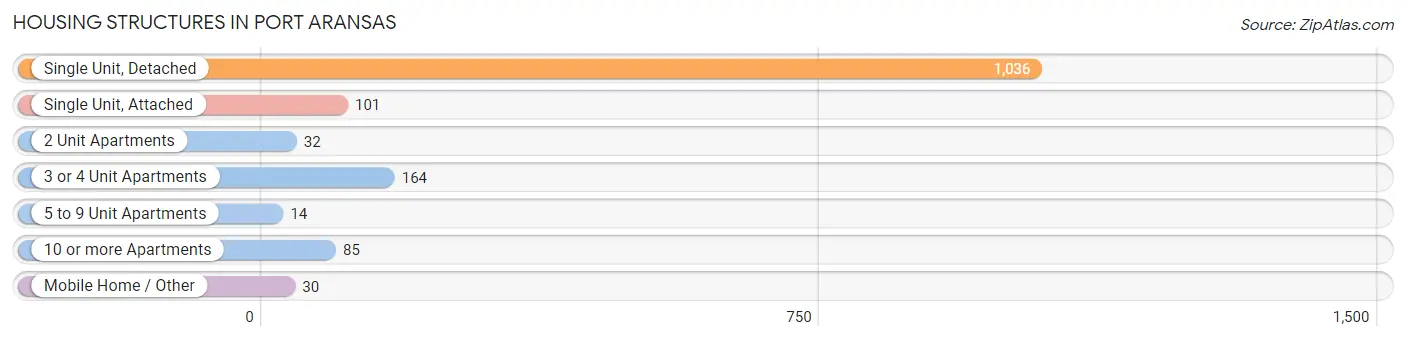
| Structure Type | # Housing Units | % Housing Units |
| Single Unit, Detached | 1,036 | 70.9% |
| Single Unit, Attached | 101 | 6.9% |
| 2 Unit Apartments | 32 | 2.2% |
| 3 or 4 Unit Apartments | 164 | 11.2% |
| 5 to 9 Unit Apartments | 14 | 1.0% |
| 10 or more Apartments | 85 | 5.8% |
| Mobile Home / Other | 30 | 2.1% |
| Total | 1,462 | 100.0% |
Housing Structures by Occupancy in Port Aransas
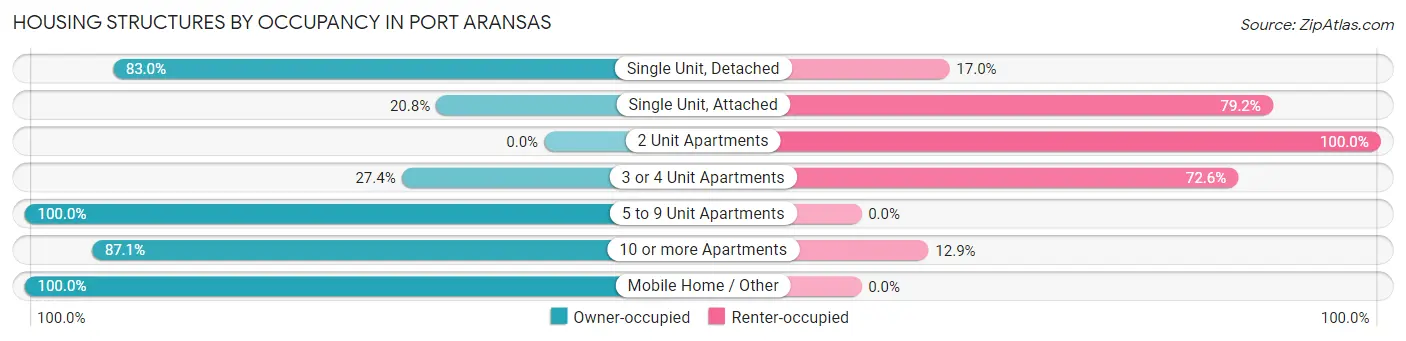
| Structure Type | Owner-occupied | Renter-occupied |
| Single Unit, Detached | 860 (83.0%) | 176 (17.0%) |
| Single Unit, Attached | 21 (20.8%) | 80 (79.2%) |
| 2 Unit Apartments | 0 (0.0%) | 32 (100.0%) |
| 3 or 4 Unit Apartments | 45 (27.4%) | 119 (72.6%) |
| 5 to 9 Unit Apartments | 14 (100.0%) | 0 (0.0%) |
| 10 or more Apartments | 74 (87.1%) | 11 (12.9%) |
| Mobile Home / Other | 30 (100.0%) | 0 (0.0%) |
| Total | 1,044 (71.4%) | 418 (28.6%) |
Housing Structures by Number of Rooms in Port Aransas
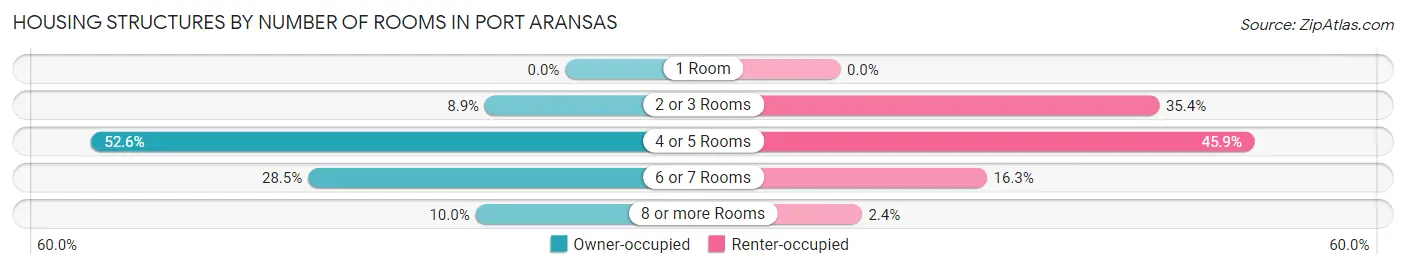
| Number of Rooms | Owner-occupied | Renter-occupied |
| 1 Room | 0 (0.0%) | 0 (0.0%) |
| 2 or 3 Rooms | 93 (8.9%) | 148 (35.4%) |
| 4 or 5 Rooms | 549 (52.6%) | 192 (45.9%) |
| 6 or 7 Rooms | 298 (28.5%) | 68 (16.3%) |
| 8 or more Rooms | 104 (10.0%) | 10 (2.4%) |
| Total | 1,044 (100.0%) | 418 (100.0%) |
Housing Structure by Heating Type in Port Aransas
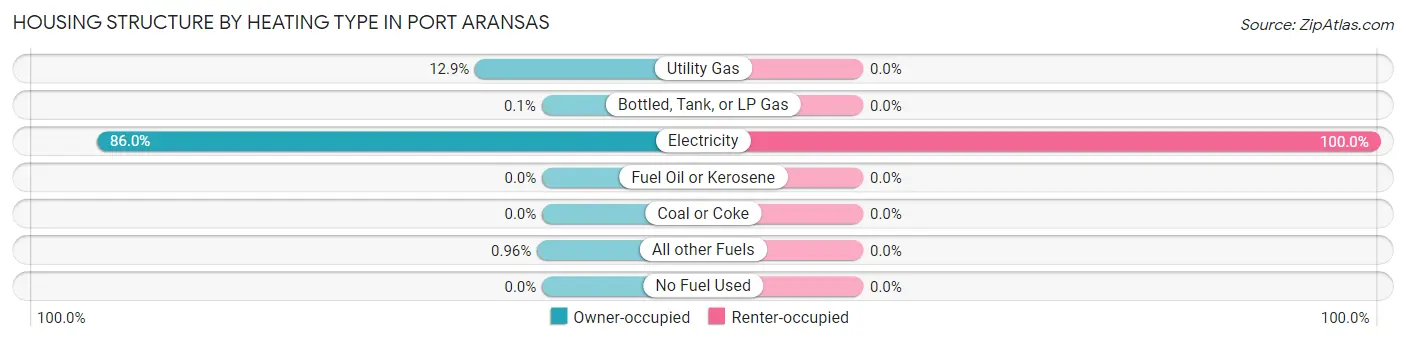
| Heating Type | Owner-occupied | Renter-occupied |
| Utility Gas | 135 (12.9%) | 0 (0.0%) |
| Bottled, Tank, or LP Gas | 1 (0.1%) | 0 (0.0%) |
| Electricity | 898 (86.0%) | 418 (100.0%) |
| Fuel Oil or Kerosene | 0 (0.0%) | 0 (0.0%) |
| Coal or Coke | 0 (0.0%) | 0 (0.0%) |
| All other Fuels | 10 (1.0%) | 0 (0.0%) |
| No Fuel Used | 0 (0.0%) | 0 (0.0%) |
| Total | 1,044 (100.0%) | 418 (100.0%) |
Household Vehicle Usage in Port Aransas
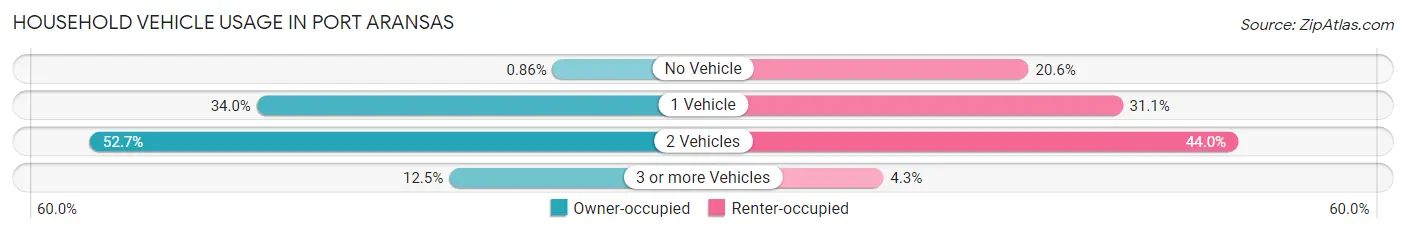
| Vehicles per Household | Owner-occupied | Renter-occupied |
| No Vehicle | 9 (0.9%) | 86 (20.6%) |
| 1 Vehicle | 355 (34.0%) | 130 (31.1%) |
| 2 Vehicles | 550 (52.7%) | 184 (44.0%) |
| 3 or more Vehicles | 130 (12.4%) | 18 (4.3%) |
| Total | 1,044 (100.0%) | 418 (100.0%) |
Real Estate & Mortgages in Port Aransas
Real Estate and Mortgage Overview in Port Aransas
| Characteristic | Without Mortgage | With Mortgage |
| Housing Units | 532 | 512 |
| Median Property Value | $421,800 | $477,900 |
| Median Household Income | $80,313 | $216 |
| Monthly Housing Costs | $1,345 | $95 |
| Real Estate Taxes | $6,415 | $0 |
Property Value by Mortgage Status in Port Aransas
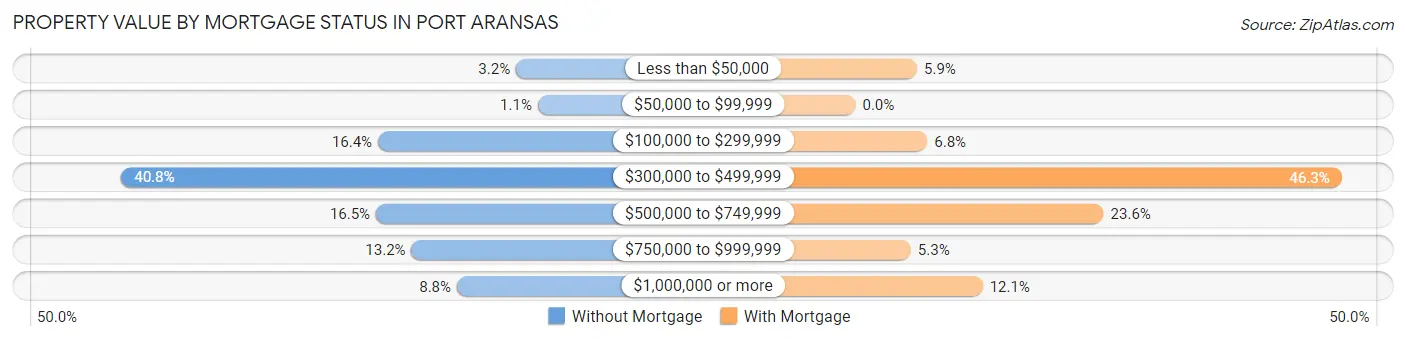
| Property Value | Without Mortgage | With Mortgage |
| Less than $50,000 | 17 (3.2%) | 30 (5.9%) |
| $50,000 to $99,999 | 6 (1.1%) | 0 (0.0%) |
| $100,000 to $299,999 | 87 (16.4%) | 35 (6.8%) |
| $300,000 to $499,999 | 217 (40.8%) | 237 (46.3%) |
| $500,000 to $749,999 | 88 (16.5%) | 121 (23.6%) |
| $750,000 to $999,999 | 70 (13.2%) | 27 (5.3%) |
| $1,000,000 or more | 47 (8.8%) | 62 (12.1%) |
| Total | 532 (100.0%) | 512 (100.0%) |
Household Income by Mortgage Status in Port Aransas
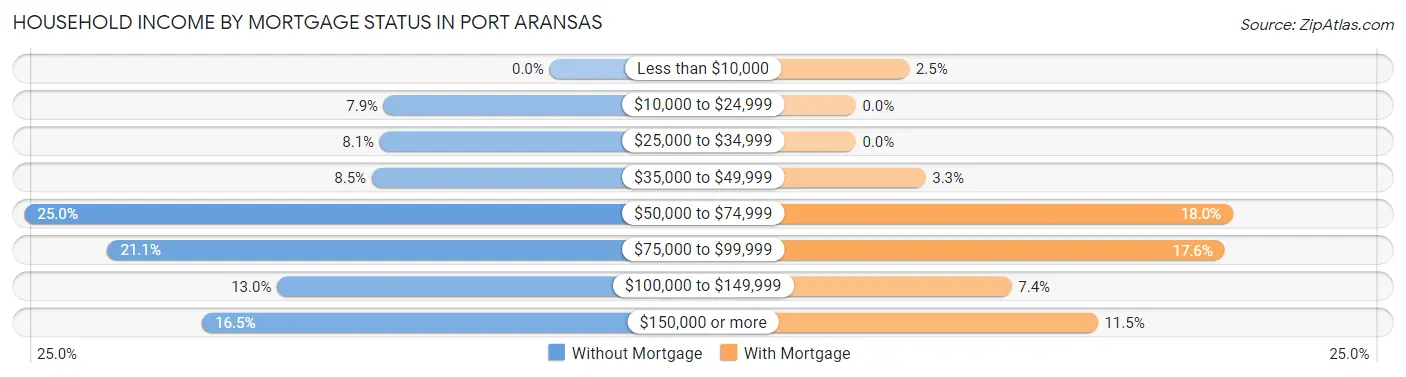
| Household Income | Without Mortgage | With Mortgage |
| Less than $10,000 | 0 (0.0%) | 13 (2.5%) |
| $10,000 to $24,999 | 42 (7.9%) | 0 (0.0%) |
| $25,000 to $34,999 | 43 (8.1%) | 0 (0.0%) |
| $35,000 to $49,999 | 45 (8.5%) | 17 (3.3%) |
| $50,000 to $74,999 | 133 (25.0%) | 92 (18.0%) |
| $75,000 to $99,999 | 112 (21.0%) | 90 (17.6%) |
| $100,000 to $149,999 | 69 (13.0%) | 38 (7.4%) |
| $150,000 or more | 88 (16.5%) | 59 (11.5%) |
| Total | 532 (100.0%) | 512 (100.0%) |
Property Value to Household Income Ratio in Port Aransas
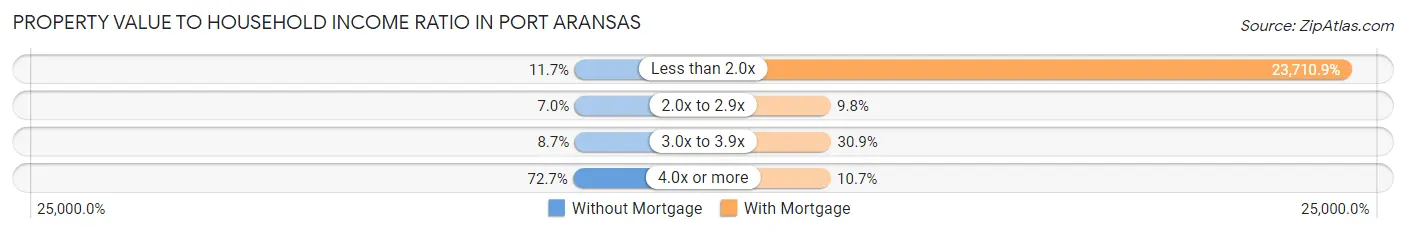
| Value-to-Income Ratio | Without Mortgage | With Mortgage |
| Less than 2.0x | 62 (11.7%) | 121,400 (23,710.9%) |
| 2.0x to 2.9x | 37 (7.0%) | 50 (9.8%) |
| 3.0x to 3.9x | 46 (8.6%) | 158 (30.9%) |
| 4.0x or more | 387 (72.7%) | 55 (10.7%) |
| Total | 532 (100.0%) | 512 (100.0%) |
Real Estate Taxes by Mortgage Status in Port Aransas
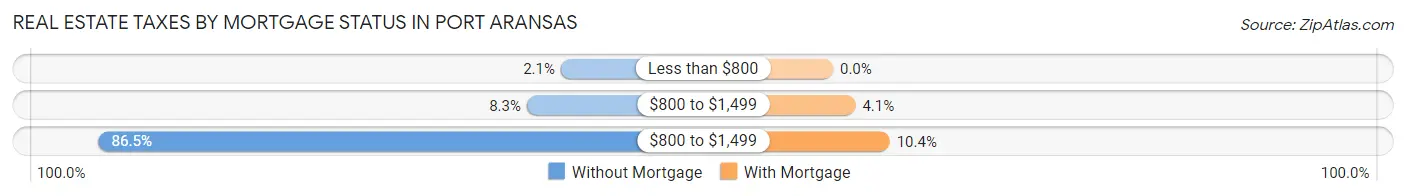
| Property Taxes | Without Mortgage | With Mortgage |
| Less than $800 | 11 (2.1%) | 0 (0.0%) |
| $800 to $1,499 | 44 (8.3%) | 21 (4.1%) |
| $800 to $1,499 | 460 (86.5%) | 53 (10.3%) |
| Total | 532 (100.0%) | 512 (100.0%) |
Health & Disability in Port Aransas
Health Insurance Coverage by Age in Port Aransas
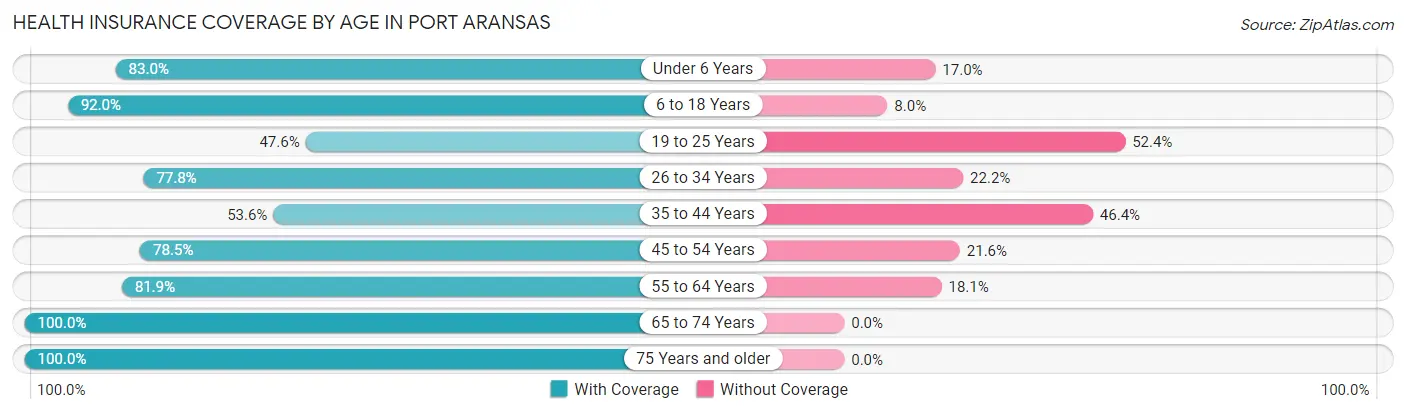
| Age Bracket | With Coverage | Without Coverage |
| Under 6 Years | 127 (83.0%) | 26 (17.0%) |
| 6 to 18 Years | 309 (92.0%) | 27 (8.0%) |
| 19 to 25 Years | 60 (47.6%) | 66 (52.4%) |
| 26 to 34 Years | 165 (77.8%) | 47 (22.2%) |
| 35 to 44 Years | 118 (53.6%) | 102 (46.4%) |
| 45 to 54 Years | 415 (78.4%) | 114 (21.5%) |
| 55 to 64 Years | 456 (81.9%) | 101 (18.1%) |
| 65 to 74 Years | 629 (100.0%) | 0 (0.0%) |
| 75 Years and older | 310 (100.0%) | 0 (0.0%) |
| Total | 2,589 (84.3%) | 483 (15.7%) |
Health Insurance Coverage by Citizenship Status in Port Aransas
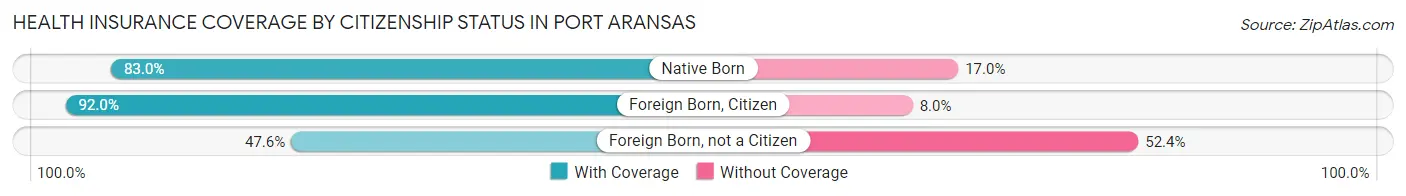
| Citizenship Status | With Coverage | Without Coverage |
| Native Born | 127 (83.0%) | 26 (17.0%) |
| Foreign Born, Citizen | 309 (92.0%) | 27 (8.0%) |
| Foreign Born, not a Citizen | 60 (47.6%) | 66 (52.4%) |
Health Insurance Coverage by Household Income in Port Aransas
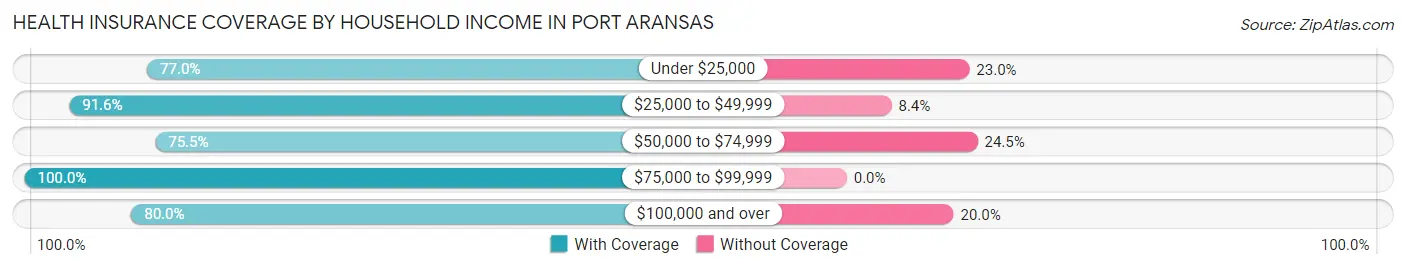
| Household Income | With Coverage | Without Coverage |
| Under $25,000 | 218 (77.0%) | 65 (23.0%) |
| $25,000 to $49,999 | 634 (91.6%) | 58 (8.4%) |
| $50,000 to $74,999 | 370 (75.5%) | 120 (24.5%) |
| $75,000 to $99,999 | 401 (100.0%) | 0 (0.0%) |
| $100,000 and over | 960 (80.0%) | 240 (20.0%) |
Public vs Private Health Insurance Coverage by Age in Port Aransas
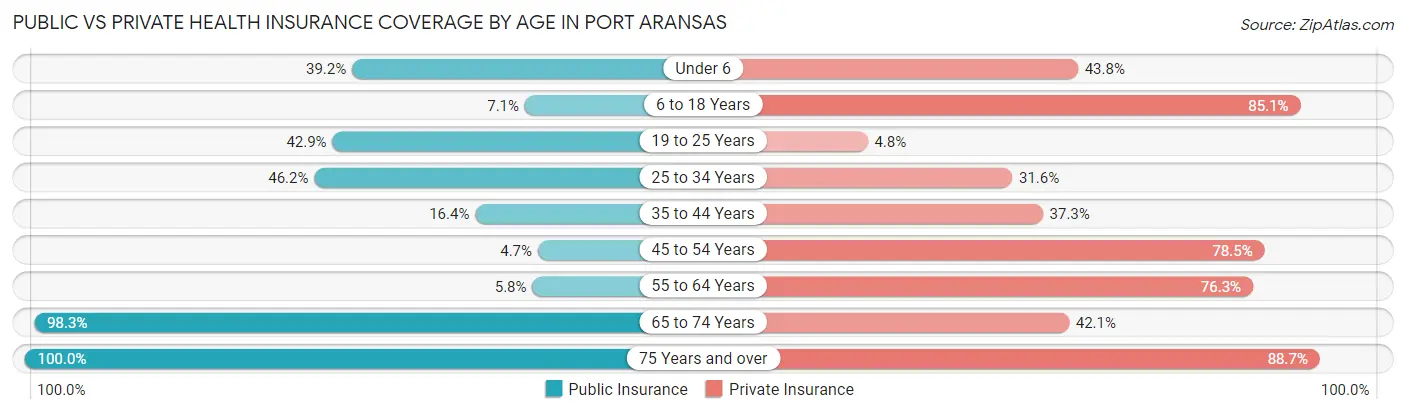
| Age Bracket | Public Insurance | Private Insurance |
| Under 6 | 60 (39.2%) | 67 (43.8%) |
| 6 to 18 Years | 24 (7.1%) | 286 (85.1%) |
| 19 to 25 Years | 54 (42.9%) | 6 (4.8%) |
| 25 to 34 Years | 98 (46.2%) | 67 (31.6%) |
| 35 to 44 Years | 36 (16.4%) | 82 (37.3%) |
| 45 to 54 Years | 25 (4.7%) | 415 (78.4%) |
| 55 to 64 Years | 32 (5.8%) | 425 (76.3%) |
| 65 to 74 Years | 618 (98.3%) | 265 (42.1%) |
| 75 Years and over | 310 (100.0%) | 275 (88.7%) |
| Total | 1,257 (40.9%) | 1,888 (61.5%) |
Disability Status by Sex by Age in Port Aransas
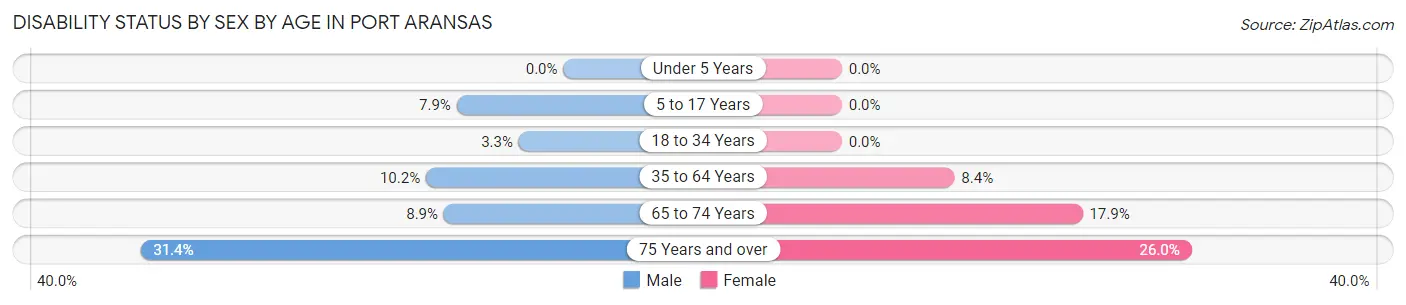
| Age Bracket | Male | Female |
| Under 5 Years | 0 (0.0%) | 0 (0.0%) |
| 5 to 17 Years | 19 (7.9%) | 0 (0.0%) |
| 18 to 34 Years | 6 (3.3%) | 0 (0.0%) |
| 35 to 64 Years | 60 (10.2%) | 60 (8.4%) |
| 65 to 74 Years | 25 (8.9%) | 62 (17.9%) |
| 75 Years and over | 49 (31.4%) | 40 (26.0%) |
Disability Class by Sex by Age in Port Aransas
Disability Class: Hearing Difficulty
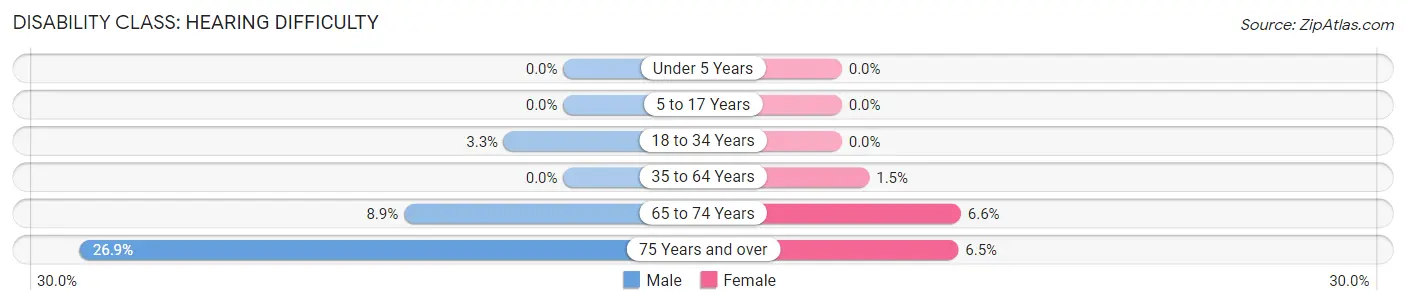
| Age Bracket | Male | Female |
| Under 5 Years | 0 (0.0%) | 0 (0.0%) |
| 5 to 17 Years | 0 (0.0%) | 0 (0.0%) |
| 18 to 34 Years | 6 (3.3%) | 0 (0.0%) |
| 35 to 64 Years | 0 (0.0%) | 11 (1.5%) |
| 65 to 74 Years | 25 (8.9%) | 23 (6.6%) |
| 75 Years and over | 42 (26.9%) | 10 (6.5%) |
Disability Class: Vision Difficulty
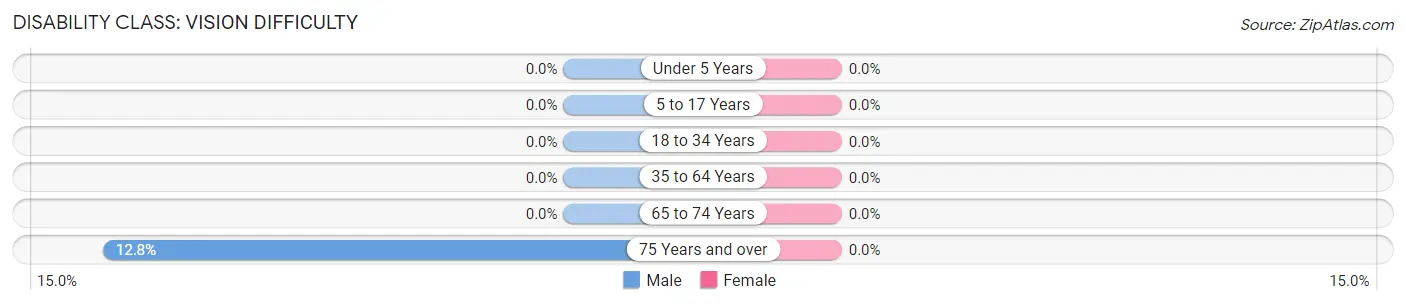
| Age Bracket | Male | Female |
| Under 5 Years | 0 (0.0%) | 0 (0.0%) |
| 5 to 17 Years | 0 (0.0%) | 0 (0.0%) |
| 18 to 34 Years | 0 (0.0%) | 0 (0.0%) |
| 35 to 64 Years | 0 (0.0%) | 0 (0.0%) |
| 65 to 74 Years | 0 (0.0%) | 0 (0.0%) |
| 75 Years and over | 20 (12.8%) | 0 (0.0%) |
Disability Class: Cognitive Difficulty
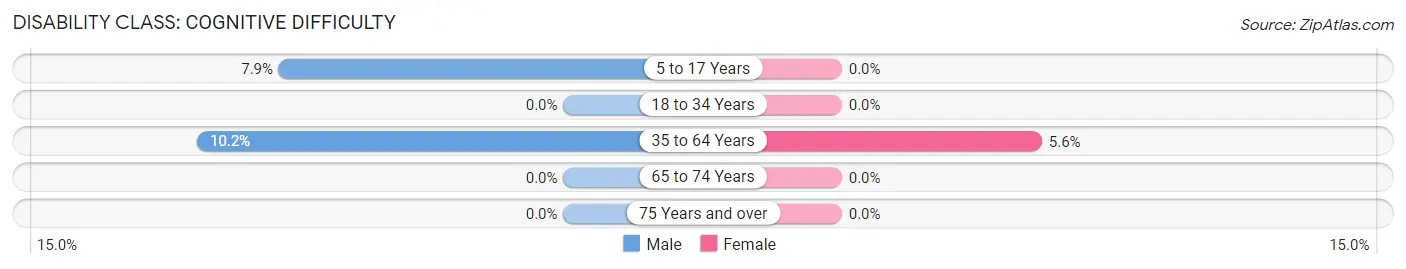
| Age Bracket | Male | Female |
| 5 to 17 Years | 19 (7.9%) | 0 (0.0%) |
| 18 to 34 Years | 0 (0.0%) | 0 (0.0%) |
| 35 to 64 Years | 60 (10.2%) | 40 (5.6%) |
| 65 to 74 Years | 0 (0.0%) | 0 (0.0%) |
| 75 Years and over | 0 (0.0%) | 0 (0.0%) |
Disability Class: Ambulatory Difficulty
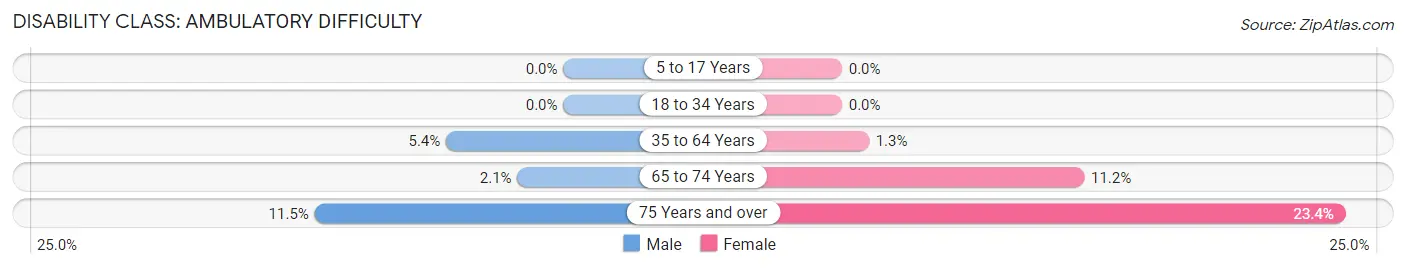
| Age Bracket | Male | Female |
| 5 to 17 Years | 0 (0.0%) | 0 (0.0%) |
| 18 to 34 Years | 0 (0.0%) | 0 (0.0%) |
| 35 to 64 Years | 32 (5.4%) | 9 (1.3%) |
| 65 to 74 Years | 6 (2.1%) | 39 (11.2%) |
| 75 Years and over | 18 (11.5%) | 36 (23.4%) |
Disability Class: Self-Care Difficulty
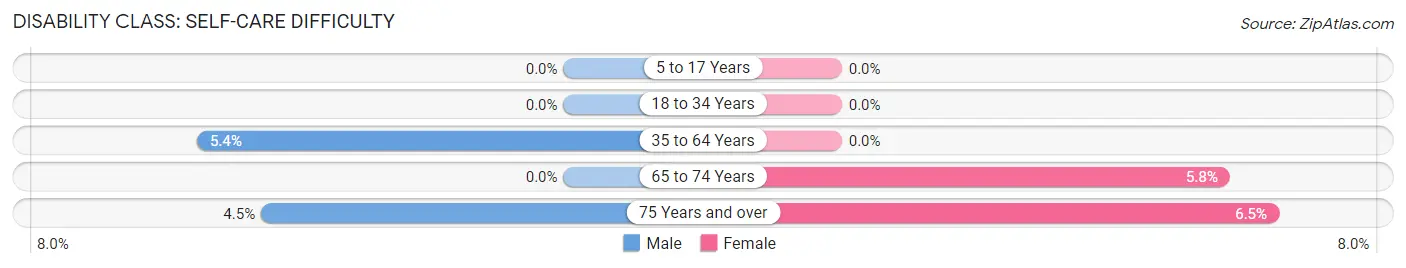
| Age Bracket | Male | Female |
| 5 to 17 Years | 0 (0.0%) | 0 (0.0%) |
| 18 to 34 Years | 0 (0.0%) | 0 (0.0%) |
| 35 to 64 Years | 32 (5.4%) | 0 (0.0%) |
| 65 to 74 Years | 0 (0.0%) | 20 (5.8%) |
| 75 Years and over | 7 (4.5%) | 10 (6.5%) |
Technology Access in Port Aransas
Computing Device Access in Port Aransas
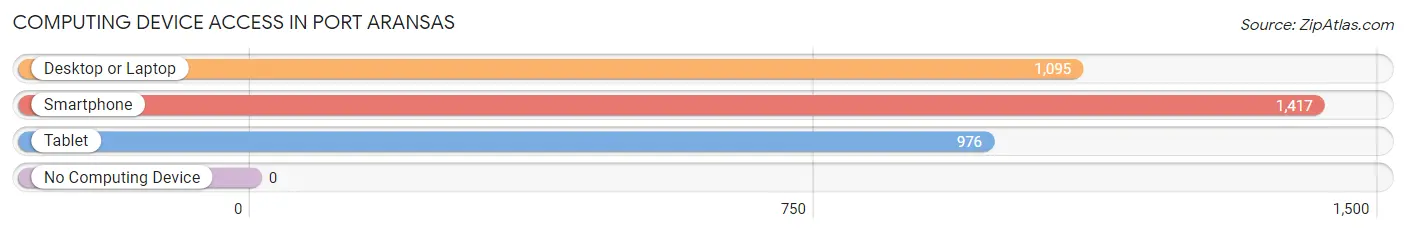
| Device Type | # Households | % Households |
| Desktop or Laptop | 1,095 | 74.9% |
| Smartphone | 1,417 | 96.9% |
| Tablet | 976 | 66.8% |
| No Computing Device | 0 | 0.0% |
| Total | 1,462 | 100.0% |
Internet Access in Port Aransas
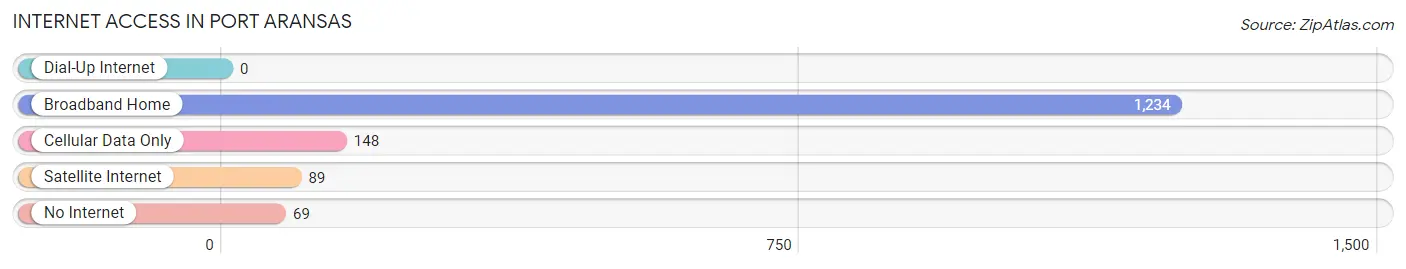
| Internet Type | # Households | % Households |
| Dial-Up Internet | 0 | 0.0% |
| Broadband Home | 1,234 | 84.4% |
| Cellular Data Only | 148 | 10.1% |
| Satellite Internet | 89 | 6.1% |
| No Internet | 69 | 4.7% |
| Total | 1,462 | 100.0% |
Port Aransas Summary
Port Aransas, TX is a small coastal town located on Mustang Island in Nueces County, Texas. It is situated on the northern tip of the Gulf of Mexico, just south of Corpus Christi. The town is known for its beautiful beaches, fishing, and wildlife. It is also a popular tourist destination, with many visitors coming to enjoy the area’s natural beauty and recreational activities.
History
Port Aransas has a long and rich history. The area was first inhabited by the Karankawa Indians, who lived in the area for thousands of years before the arrival of Europeans. The first Europeans to settle in the area were Spanish explorers, who arrived in the late 1500s. The area was then claimed by the Spanish Empire, and the town of Aransas was established in 1722.
In 1846, the town was annexed by the United States and renamed Port Aransas. The town was a major port for the cotton trade, and it was also a popular destination for fishermen. In the late 1800s, the town began to attract tourists, and it soon became a popular vacation spot.
In the early 1900s, the town was devastated by a hurricane, and it was rebuilt in the 1920s. The town continued to grow and develop, and it eventually became a popular tourist destination.
Geography
Port Aransas is located on Mustang Island, which is part of the Texas Coastal Bend. The island is situated on the northern tip of the Gulf of Mexico, just south of Corpus Christi. The island is approximately 18 miles long and 4 miles wide, and it is bordered by the Corpus Christi Bay to the east and the Gulf of Mexico to the south.
The town of Port Aransas is located on the northern end of the island, and it is home to a variety of attractions, including beaches, fishing, and wildlife. The town is also home to a number of restaurants, shops, and other businesses.
Economy
The economy of Port Aransas is largely based on tourism. The town is a popular destination for beachgoers, fishermen, and wildlife enthusiasts. The town is also home to a number of restaurants, shops, and other businesses that cater to tourists.
In addition to tourism, the town is also home to a number of industries, including fishing, oil and gas, and shipbuilding. The town is also home to a number of educational institutions, including Texas A&M University-Corpus Christi and Del Mar College.
Demographics
As of the 2010 census, the population of Port Aransas was 3,480. The town is predominantly white, with approximately 85% of the population identifying as white. The town is also home to a small Hispanic population, with approximately 10% of the population identifying as Hispanic. The town is also home to a small African American population, with approximately 2% of the population identifying as African American.
Conclusion
Port Aransas, TX is a small coastal town located on Mustang Island in Nueces County, Texas. It is situated on the northern tip of the Gulf of Mexico, just south of Corpus Christi. The town is known for its beautiful beaches, fishing, and wildlife. It is also a popular tourist destination, with many visitors coming to enjoy the area’s natural beauty and recreational activities. The economy of Port Aransas is largely based on tourism, and the town is home to a variety of industries, including fishing, oil and gas, and shipbuilding. As of the 2010 census, the population of Port Aransas was 3,480, and the town is predominantly white, with approximately 85% of the population identifying as white.
Common Questions
What is Per Capita Income in Port Aransas?
Per Capita income in Port Aransas is $53,903.
What is the Median Family Income in Port Aransas?
Median Family Income in Port Aransas is $94,348.
What is the Median Household income in Port Aransas?
Median Household Income in Port Aransas is $69,063.
What is Income or Wage Gap in Port Aransas?
Income or Wage Gap in Port Aransas is 19.5%.
Women in Port Aransas earn 80.5 cents for every dollar earned by a man.
What is Inequality or Gini Index in Port Aransas?
Inequality or Gini Index in Port Aransas is 0.46.
What is the Total Population of Port Aransas?
Total Population of Port Aransas is 3,072.
What is the Total Male Population of Port Aransas?
Total Male Population of Port Aransas is 1,454.
What is the Total Female Population of Port Aransas?
Total Female Population of Port Aransas is 1,618.
What is the Ratio of Males per 100 Females in Port Aransas?
There are 89.86 Males per 100 Females in Port Aransas.
What is the Ratio of Females per 100 Males in Port Aransas?
There are 111.28 Females per 100 Males in Port Aransas.
What is the Median Population Age in Port Aransas?
Median Population Age in Port Aransas is 53.8 Years.
What is the Average Family Size in Port Aransas
Average Family Size in Port Aransas is 2.5 People.
What is the Average Household Size in Port Aransas
Average Household Size in Port Aransas is 2.1 People.
How Large is the Labor Force in Port Aransas?
There are 1,359 People in the Labor Forcein in Port Aransas.
What is the Percentage of People in the Labor Force in Port Aransas?
50.7% of People are in the Labor Force in Port Aransas.