Pleasanton, TX Map & Demographics
Pleasanton Map
Pleasanton Overview
$27,046
PER CAPITA INCOME
$83,646
AVG FAMILY INCOME
$70,685
AVG HOUSEHOLD INCOME
33.1%
WAGE / INCOME GAP [ % ]
66.9¢/ $1
WAGE / INCOME GAP [ $ ]
0.42
INEQUALITY / GINI INDEX
10,706
TOTAL POPULATION
5,104
MALE POPULATION
5,602
FEMALE POPULATION
91.11
MALES / 100 FEMALES
109.76
FEMALES / 100 MALES
34.5
MEDIAN AGE
3.6
AVG FAMILY SIZE
2.9
AVG HOUSEHOLD SIZE
4,576
LABOR FORCE [ PEOPLE ]
58.9%
PERCENT IN LABOR FORCE
4.5%
UNEMPLOYMENT RATE
Pleasanton Zip Codes
Pleasanton Area Codes
Income in Pleasanton
Income Overview in Pleasanton
Per Capita Income in Pleasanton is $27,046, while median incomes of families and households are $83,646 and $70,685 respectively.
| Characteristic | Number | Measure |
| Per Capita Income | 10,706 | $27,046 |
| Median Family Income | 2,505 | $83,646 |
| Mean Family Income | 2,505 | $92,976 |
| Median Household Income | 3,585 | $70,685 |
| Mean Household Income | 3,585 | $79,469 |
| Income Deficit | 2,505 | $0 |
| Wage / Income Gap (%) | 10,706 | 33.08% |
| Wage / Income Gap ($) | 10,706 | 66.92¢ per $1 |
| Gini / Inequality Index | 10,706 | 0.42 |
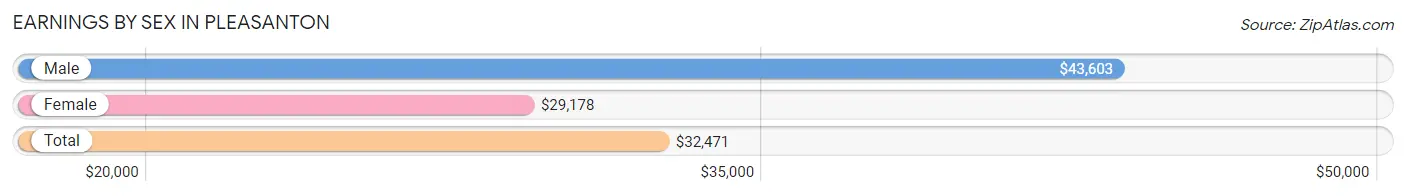
Earnings by Sex in Pleasanton
Average Earnings in Pleasanton are $32,471, $43,603 for men and $29,178 for women, a difference of 33.1%.
| Sex | Number | Average Earnings |
| Male | 2,528 (54.4%) | $43,603 |
| Female | 2,115 (45.6%) | $29,178 |
| Total | 4,643 (100.0%) | $32,471 |
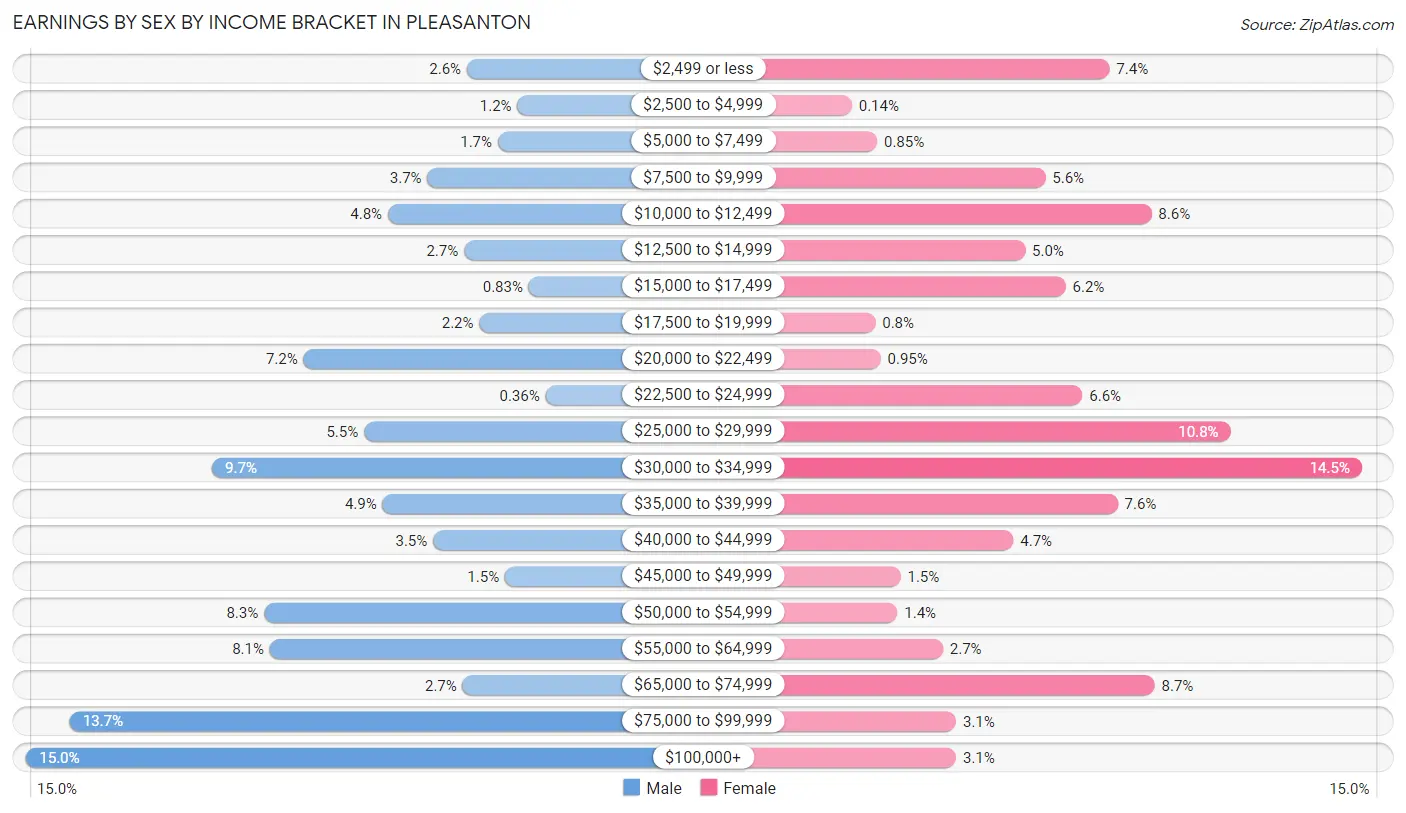
Earnings by Sex by Income Bracket in Pleasanton
The most common earnings brackets in Pleasanton are $100,000+ for men (378 | 14.9%) and $30,000 to $34,999 for women (306 | 14.5%).
| Income | Male | Female |
| $2,499 or less | 65 (2.6%) | 156 (7.4%) |
| $2,500 to $4,999 | 29 (1.1%) | 3 (0.1%) |
| $5,000 to $7,499 | 43 (1.7%) | 18 (0.9%) |
| $7,500 to $9,999 | 93 (3.7%) | 118 (5.6%) |
| $10,000 to $12,499 | 121 (4.8%) | 181 (8.6%) |
| $12,500 to $14,999 | 67 (2.6%) | 106 (5.0%) |
| $15,000 to $17,499 | 21 (0.8%) | 130 (6.1%) |
| $17,500 to $19,999 | 56 (2.2%) | 17 (0.8%) |
| $20,000 to $22,499 | 181 (7.2%) | 20 (0.9%) |
| $22,500 to $24,999 | 9 (0.4%) | 140 (6.6%) |
| $25,000 to $29,999 | 138 (5.5%) | 228 (10.8%) |
| $30,000 to $34,999 | 246 (9.7%) | 306 (14.5%) |
| $35,000 to $39,999 | 125 (4.9%) | 161 (7.6%) |
| $40,000 to $44,999 | 89 (3.5%) | 99 (4.7%) |
| $45,000 to $49,999 | 38 (1.5%) | 32 (1.5%) |
| $50,000 to $54,999 | 209 (8.3%) | 30 (1.4%) |
| $55,000 to $64,999 | 205 (8.1%) | 57 (2.7%) |
| $65,000 to $74,999 | 68 (2.7%) | 183 (8.6%) |
| $75,000 to $99,999 | 347 (13.7%) | 65 (3.1%) |
| $100,000+ | 378 (14.9%) | 65 (3.1%) |
| Total | 2,528 (100.0%) | 2,115 (100.0%) |
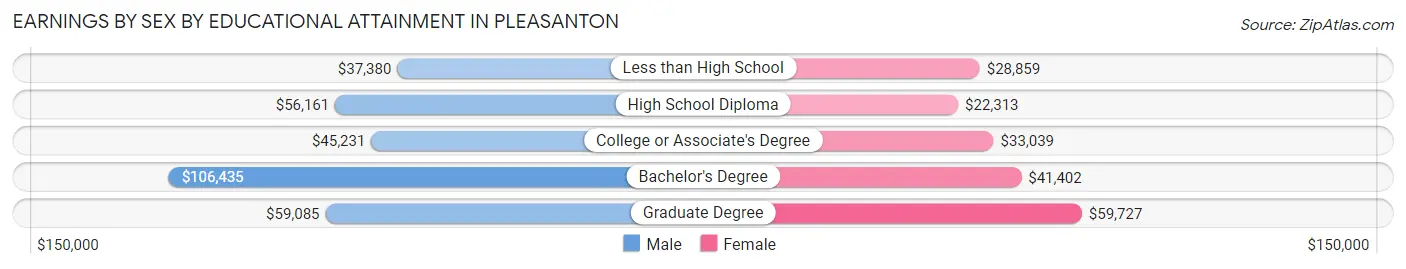
Earnings by Sex by Educational Attainment in Pleasanton
Average earnings in Pleasanton are $52,591 for men and $31,457 for women, a difference of 40.2%. Men with an educational attainment of bachelor's degree enjoy the highest average annual earnings of $106,435, while those with less than high school education earn the least with $37,380. Women with an educational attainment of graduate degree earn the most with the average annual earnings of $59,727, while those with high school diploma education have the smallest earnings of $22,313.
| Educational Attainment | Male Income | Female Income |
| Less than High School | $37,380 | $28,859 |
| High School Diploma | $56,161 | $22,313 |
| College or Associate's Degree | $45,231 | $33,039 |
| Bachelor's Degree | $106,435 | $41,402 |
| Graduate Degree | $59,085 | $59,727 |
| Total | $52,591 | $31,457 |
Family Income in Pleasanton
Family Income Brackets in Pleasanton
According to the Pleasanton family income data, there are 699 families falling into the $100,000 to $149,999 income range, which is the most common income bracket and makes up 27.9% of all families. Conversely, the less than $10,000 income bracket is the least frequent group with only 18 families (0.7%) belonging to this category.
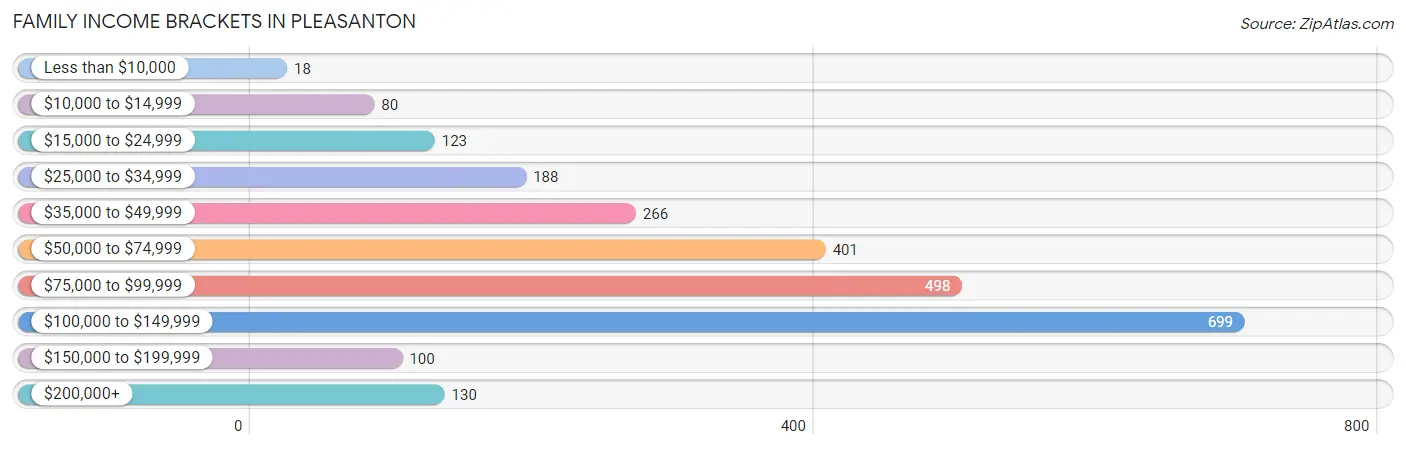
| Income Bracket | # Families | % Families |
| Less than $10,000 | 18 | 0.7% |
| $10,000 to $14,999 | 80 | 3.2% |
| $15,000 to $24,999 | 123 | 4.9% |
| $25,000 to $34,999 | 188 | 7.5% |
| $35,000 to $49,999 | 266 | 10.6% |
| $50,000 to $74,999 | 401 | 16.0% |
| $75,000 to $99,999 | 498 | 19.9% |
| $100,000 to $149,999 | 699 | 27.9% |
| $150,000 to $199,999 | 100 | 4.0% |
| $200,000+ | 130 | 5.2% |
Family Income by Famaliy Size in Pleasanton
7+ person families (160 | 6.4%) account for the highest median family income in Pleasanton with $107,972 per family, while 2-person families (955 | 38.1%) have the highest median income of $31,158 per family member.
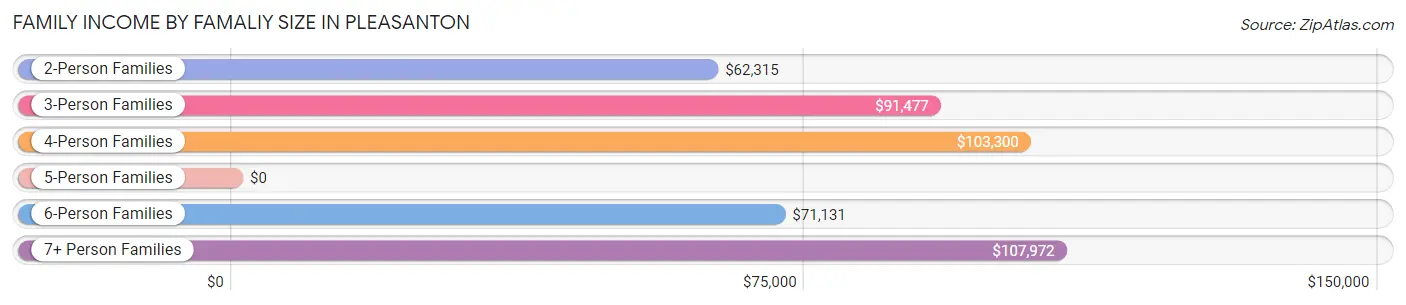
| Income Bracket | # Families | Median Income |
| 2-Person Families | 955 (38.1%) | $62,315 |
| 3-Person Families | 479 (19.1%) | $91,477 |
| 4-Person Families | 560 (22.4%) | $103,300 |
| 5-Person Families | 196 (7.8%) | $0 |
| 6-Person Families | 155 (6.2%) | $71,131 |
| 7+ Person Families | 160 (6.4%) | $107,972 |
| Total | 2,505 (100.0%) | $83,646 |
Family Income by Number of Earners in Pleasanton
The median family income in Pleasanton is $83,646, with families comprising 3+ earners (300) having the highest median family income of $138,170, while families with 1 earner (933) have the lowest median family income of $38,309, accounting for 12.0% and 37.2% of families, respectively.
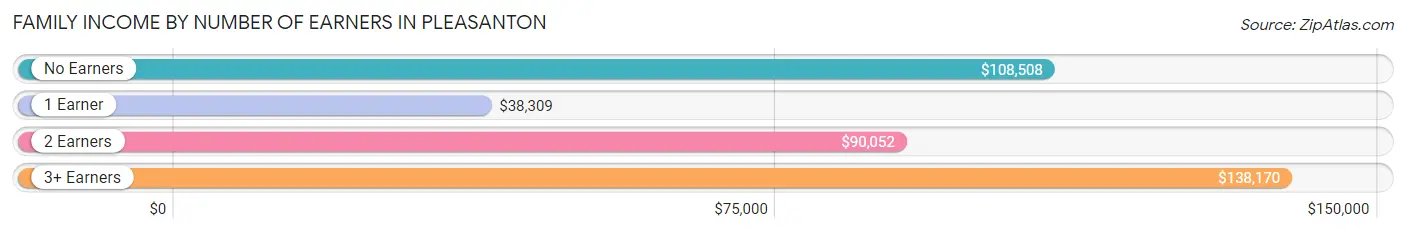
| Number of Earners | # Families | Median Income |
| No Earners | 303 (12.1%) | $108,508 |
| 1 Earner | 933 (37.2%) | $38,309 |
| 2 Earners | 969 (38.7%) | $90,052 |
| 3+ Earners | 300 (12.0%) | $138,170 |
| Total | 2,505 (100.0%) | $83,646 |
Household Income in Pleasanton
Household Income Brackets in Pleasanton
With 893 households falling in the category, the $100,000 to $149,999 income range is the most frequent in Pleasanton, accounting for 24.9% of all households. In contrast, only 108 households (3.0%) fall into the $150,000 to $199,999 income bracket, making it the least populous group.
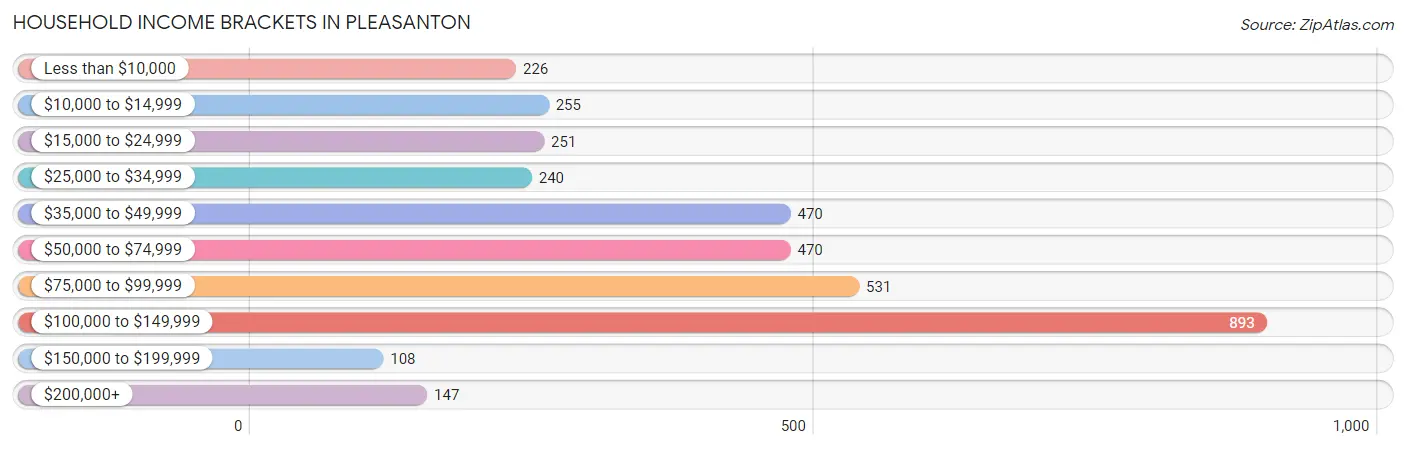
| Income Bracket | # Households | % Households |
| Less than $10,000 | 226 | 6.3% |
| $10,000 to $14,999 | 255 | 7.1% |
| $15,000 to $24,999 | 251 | 7.0% |
| $25,000 to $34,999 | 240 | 6.7% |
| $35,000 to $49,999 | 470 | 13.1% |
| $50,000 to $74,999 | 470 | 13.1% |
| $75,000 to $99,999 | 531 | 14.8% |
| $100,000 to $149,999 | 893 | 24.9% |
| $150,000 to $199,999 | 108 | 3.0% |
| $200,000+ | 147 | 4.1% |
Household Income by Householder Age in Pleasanton
The median household income in Pleasanton is $70,685, with the highest median household income of $83,492 found in the 45 to 64 years age bracket for the primary householder. A total of 985 households (27.5%) fall into this category. Meanwhile, the 15 to 24 years age bracket for the primary householder has the lowest median household income of $0, with 16 households (0.4%) in this group.
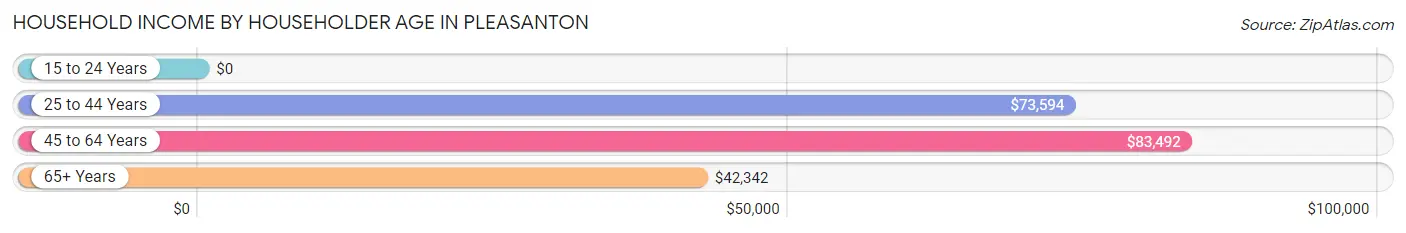
| Income Bracket | # Households | Median Income |
| 15 to 24 Years | 16 (0.4%) | $0 |
| 25 to 44 Years | 1,518 (42.3%) | $73,594 |
| 45 to 64 Years | 985 (27.5%) | $83,492 |
| 65+ Years | 1,066 (29.7%) | $42,342 |
| Total | 3,585 (100.0%) | $70,685 |
Poverty in Pleasanton
Income Below Poverty by Sex and Age in Pleasanton
With 12.4% poverty level for males and 12.5% for females among the residents of Pleasanton, under 5 year old males and 25 to 34 year old females are the most vulnerable to poverty, with 99 males (33.6%) and 158 females (22.5%) in their respective age groups living below the poverty level.
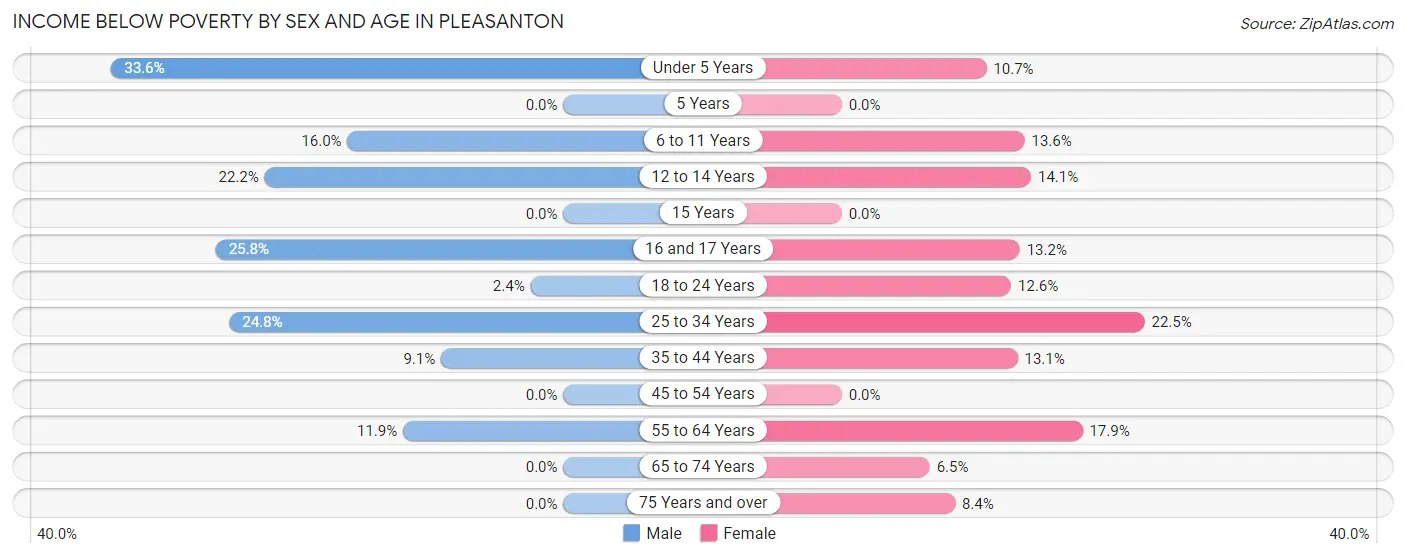
| Age Bracket | Male | Female |
| Under 5 Years | 99 (33.6%) | 61 (10.7%) |
| 5 Years | 0 (0.0%) | 0 (0.0%) |
| 6 to 11 Years | 110 (16.0%) | 62 (13.6%) |
| 12 to 14 Years | 59 (22.2%) | 43 (14.1%) |
| 15 Years | 0 (0.0%) | 0 (0.0%) |
| 16 and 17 Years | 56 (25.8%) | 28 (13.2%) |
| 18 to 24 Years | 10 (2.4%) | 43 (12.6%) |
| 25 to 34 Years | 157 (24.8%) | 158 (22.5%) |
| 35 to 44 Years | 80 (9.1%) | 109 (13.1%) |
| 45 to 54 Years | 0 (0.0%) | 0 (0.0%) |
| 55 to 64 Years | 50 (11.9%) | 94 (17.9%) |
| 65 to 74 Years | 0 (0.0%) | 42 (6.5%) |
| 75 Years and over | 0 (0.0%) | 31 (8.4%) |
| Total | 621 (12.4%) | 671 (12.5%) |
Income Above Poverty by Sex and Age in Pleasanton
According to the poverty statistics in Pleasanton, males aged 5 years and females aged 5 years are the age groups that are most secure financially, with 100.0% of males and 100.0% of females in these age groups living above the poverty line.
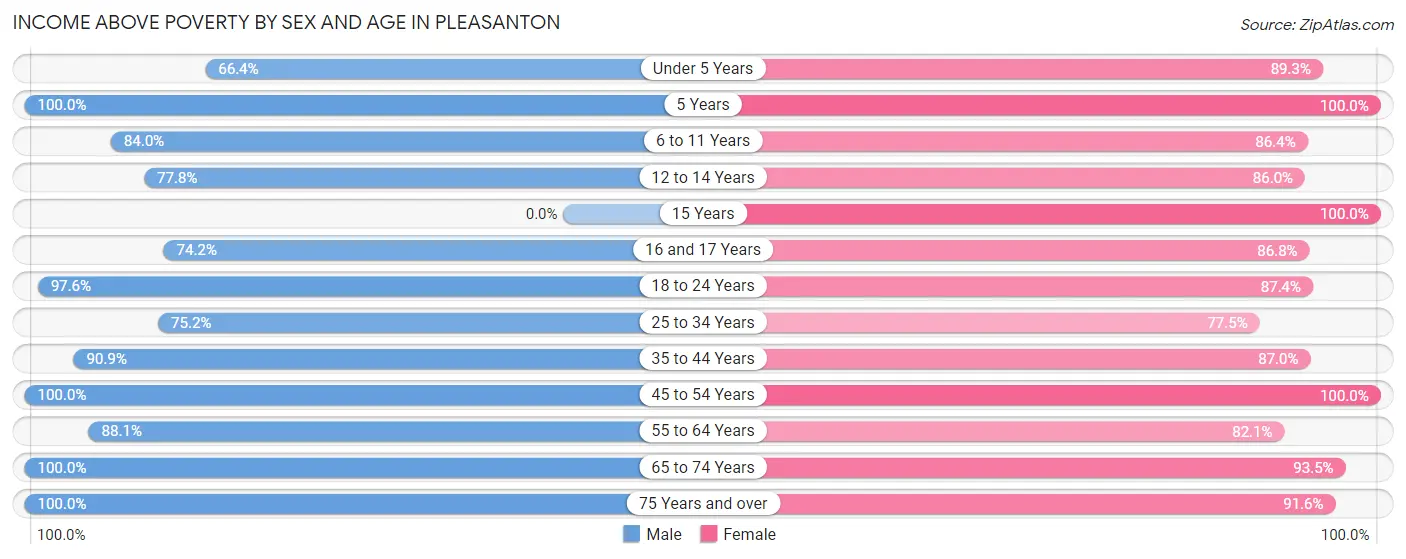
| Age Bracket | Male | Female |
| Under 5 Years | 196 (66.4%) | 507 (89.3%) |
| 5 Years | 199 (100.0%) | 43 (100.0%) |
| 6 to 11 Years | 576 (84.0%) | 395 (86.4%) |
| 12 to 14 Years | 207 (77.8%) | 263 (86.0%) |
| 15 Years | 0 (0.0%) | 33 (100.0%) |
| 16 and 17 Years | 161 (74.2%) | 184 (86.8%) |
| 18 to 24 Years | 399 (97.6%) | 299 (87.4%) |
| 25 to 34 Years | 476 (75.2%) | 545 (77.5%) |
| 35 to 44 Years | 801 (90.9%) | 726 (87.0%) |
| 45 to 54 Years | 387 (100.0%) | 350 (100.0%) |
| 55 to 64 Years | 370 (88.1%) | 432 (82.1%) |
| 65 to 74 Years | 332 (100.0%) | 601 (93.5%) |
| 75 Years and over | 292 (100.0%) | 338 (91.6%) |
| Total | 4,396 (87.6%) | 4,716 (87.5%) |
Income Below Poverty Among Married-Couple Families in Pleasanton
The poverty statistics for married-couple families in Pleasanton show that 5.6% or 99 of the total 1,776 families live below the poverty line. Families with 3 or 4 children have the highest poverty rate of 13.4%, comprising of 25 families. On the other hand, families with no children have the lowest poverty rate of 0.0%, which includes 0 families.
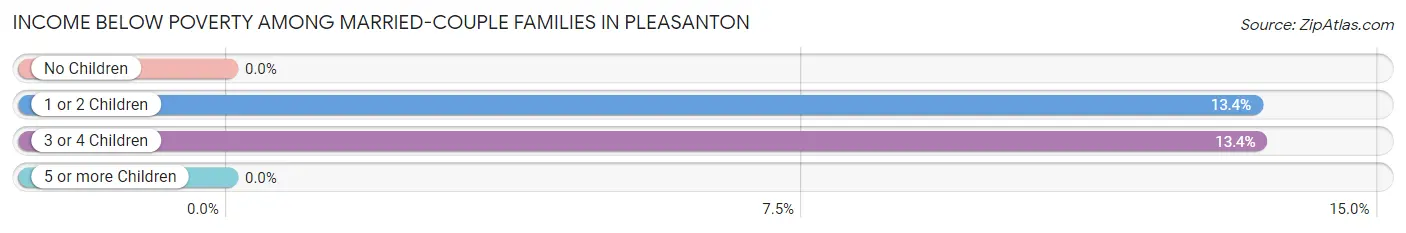
| Children | Above Poverty | Below Poverty |
| No Children | 877 (100.0%) | 0 (0.0%) |
| 1 or 2 Children | 479 (86.6%) | 74 (13.4%) |
| 3 or 4 Children | 161 (86.6%) | 25 (13.4%) |
| 5 or more Children | 160 (100.0%) | 0 (0.0%) |
| Total | 1,677 (94.4%) | 99 (5.6%) |
Income Below Poverty Among Single-Parent Households in Pleasanton
According to the poverty data in Pleasanton, 4.5% or 8 single-father households and 22.3% or 123 single-mother households are living below the poverty line. Among single-father households, those with no children have the highest poverty rate, with 8 households (17.0%) experiencing poverty. Likewise, among single-mother households, those with 3 or 4 children have the highest poverty rate, with 40 households (100.0%) falling below the poverty line.
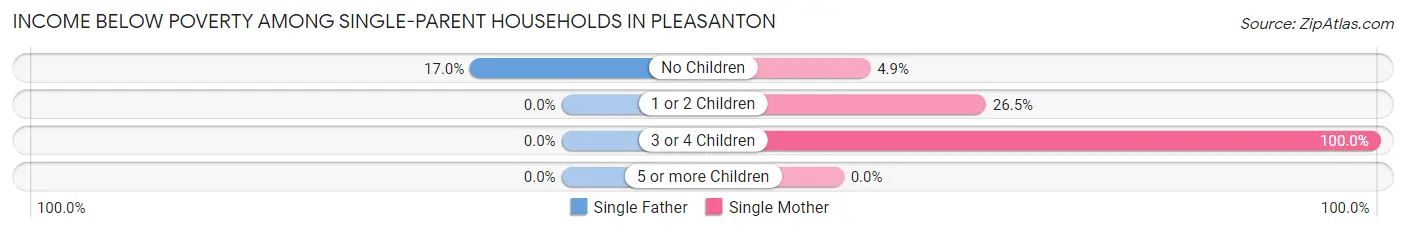
| Children | Single Father | Single Mother |
| No Children | 8 (17.0%) | 12 (4.9%) |
| 1 or 2 Children | 0 (0.0%) | 71 (26.5%) |
| 3 or 4 Children | 0 (0.0%) | 40 (100.0%) |
| 5 or more Children | 0 (0.0%) | 0 (0.0%) |
| Total | 8 (4.5%) | 123 (22.3%) |
Income Below Poverty Among Married-Couple vs Single-Parent Households in Pleasanton
The poverty data for Pleasanton shows that 99 of the married-couple family households (5.6%) and 131 of the single-parent households (18.0%) are living below the poverty level. Within the married-couple family households, those with 3 or 4 children have the highest poverty rate, with 25 households (13.4%) falling below the poverty line. Among the single-parent households, those with 3 or 4 children have the highest poverty rate, with 40 household (38.5%) living below poverty.
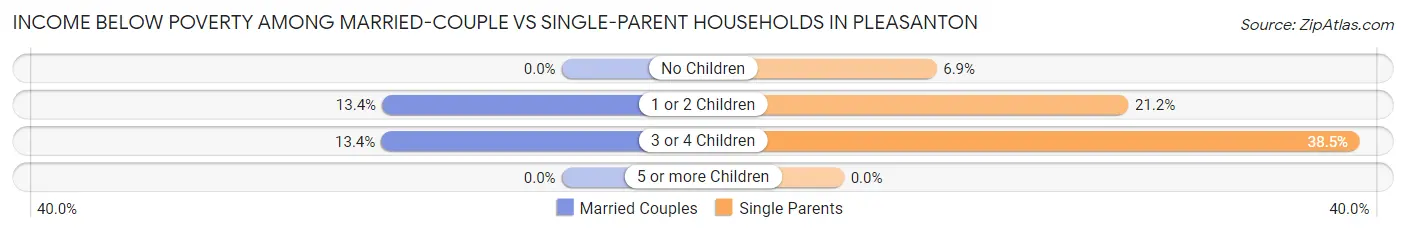
| Children | Married-Couple Families | Single-Parent Households |
| No Children | 0 (0.0%) | 20 (6.9%) |
| 1 or 2 Children | 74 (13.4%) | 71 (21.2%) |
| 3 or 4 Children | 25 (13.4%) | 40 (38.5%) |
| 5 or more Children | 0 (0.0%) | 0 (0.0%) |
| Total | 99 (5.6%) | 131 (18.0%) |
Race in Pleasanton
The most populous races in Pleasanton are White / Caucasian (7,433 | 69.4%), Hispanic or Latino (6,302 | 58.9%), and Two or more Races (2,499 | 23.3%).
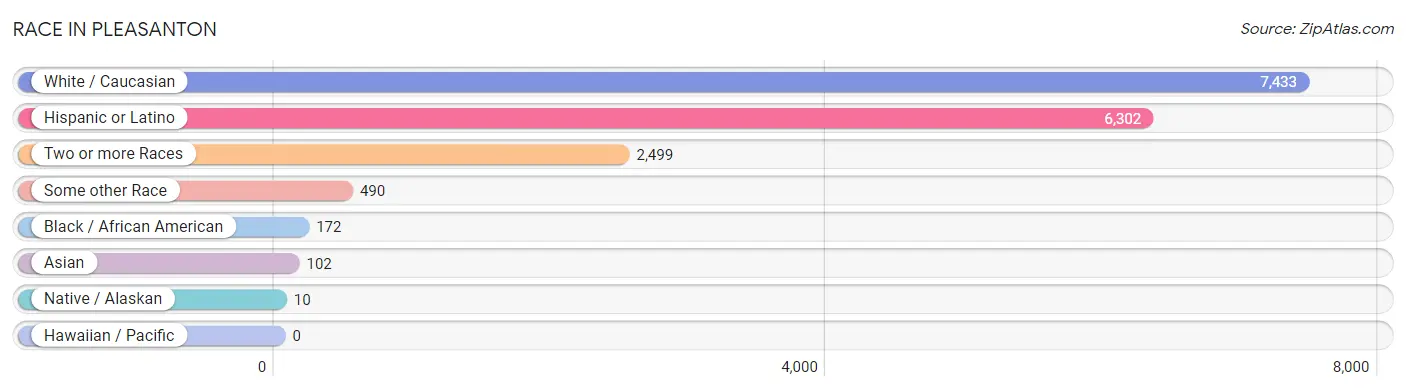
| Race | # Population | % Population |
| Asian | 102 | 0.9% |
| Black / African American | 172 | 1.6% |
| Hawaiian / Pacific | 0 | 0.0% |
| Hispanic or Latino | 6,302 | 58.9% |
| Native / Alaskan | 10 | 0.1% |
| White / Caucasian | 7,433 | 69.4% |
| Two or more Races | 2,499 | 23.3% |
| Some other Race | 490 | 4.6% |
| Total | 10,706 | 100.0% |
Ancestry in Pleasanton
The most populous ancestries reported in Pleasanton are Mexican (5,589 | 52.2%), German (918 | 8.6%), English (696 | 6.5%), Irish (560 | 5.2%), and American (310 | 2.9%), together accounting for 75.4% of all Pleasanton residents.
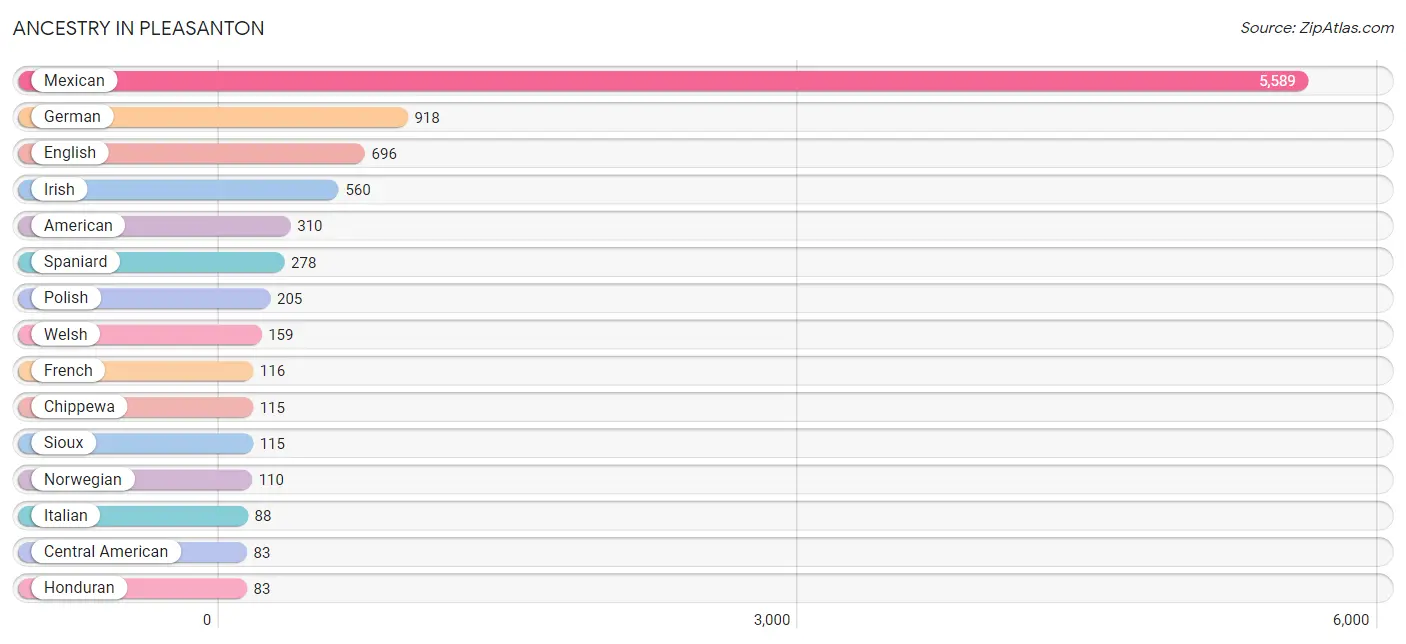
| Ancestry | # Population | % Population |
| American | 310 | 2.9% |
| Arab | 6 | 0.1% |
| British | 9 | 0.1% |
| Burmese | 13 | 0.1% |
| Central American | 83 | 0.8% |
| Cherokee | 28 | 0.3% |
| Chippewa | 115 | 1.1% |
| Comanche | 31 | 0.3% |
| Cuban | 45 | 0.4% |
| Czech | 72 | 0.7% |
| Czechoslovakian | 53 | 0.5% |
| Danish | 5 | 0.1% |
| Dutch | 19 | 0.2% |
| English | 696 | 6.5% |
| French | 116 | 1.1% |
| French Canadian | 49 | 0.5% |
| German | 918 | 8.6% |
| Honduran | 83 | 0.8% |
| Hungarian | 9 | 0.1% |
| Indian (Asian) | 14 | 0.1% |
| Irish | 560 | 5.2% |
| Italian | 88 | 0.8% |
| Korean | 24 | 0.2% |
| Lebanese | 6 | 0.1% |
| Mexican | 5,589 | 52.2% |
| Navajo | 29 | 0.3% |
| Norwegian | 110 | 1.0% |
| Polish | 205 | 1.9% |
| Puerto Rican | 4 | 0.0% |
| Russian | 31 | 0.3% |
| Scandinavian | 9 | 0.1% |
| Scotch-Irish | 25 | 0.2% |
| Scottish | 52 | 0.5% |
| Sioux | 115 | 1.1% |
| Spaniard | 278 | 2.6% |
| Swedish | 9 | 0.1% |
| Thai | 13 | 0.1% |
| U.S. Virgin Islander | 5 | 0.1% |
| Welsh | 159 | 1.5% | View All 39 Rows |
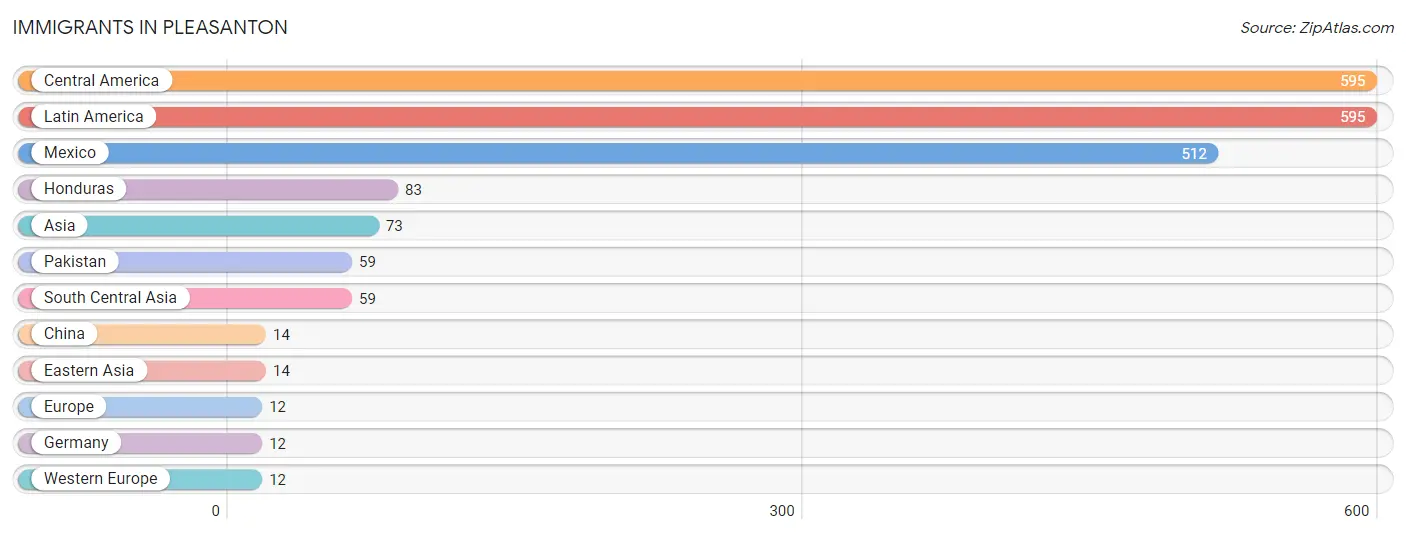
Immigrants in Pleasanton
The most numerous immigrant groups reported in Pleasanton came from Central America (595 | 5.6%), Latin America (595 | 5.6%), Mexico (512 | 4.8%), Honduras (83 | 0.8%), and Asia (73 | 0.7%), together accounting for 17.4% of all Pleasanton residents.
| Immigration Origin | # Population | % Population |
| Asia | 73 | 0.7% |
| Central America | 595 | 5.6% |
| China | 14 | 0.1% |
| Eastern Asia | 14 | 0.1% |
| Europe | 12 | 0.1% |
| Germany | 12 | 0.1% |
| Honduras | 83 | 0.8% |
| Latin America | 595 | 5.6% |
| Mexico | 512 | 4.8% |
| Pakistan | 59 | 0.5% |
| South Central Asia | 59 | 0.5% |
| Western Europe | 12 | 0.1% | View All 12 Rows |
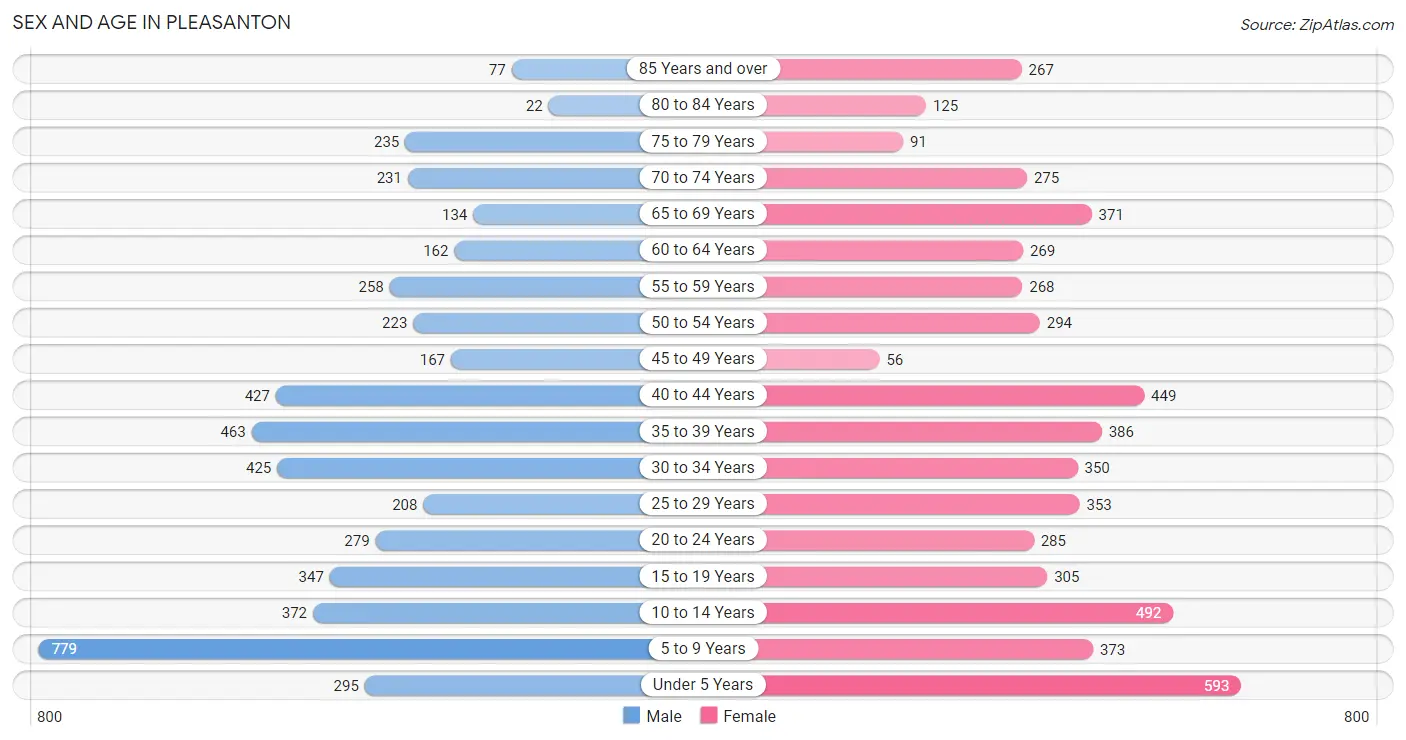
Sex and Age in Pleasanton
Sex and Age in Pleasanton
The most populous age groups in Pleasanton are 5 to 9 Years (779 | 15.3%) for men and Under 5 Years (593 | 10.6%) for women.
| Age Bracket | Male | Female |
| Under 5 Years | 295 (5.8%) | 593 (10.6%) |
| 5 to 9 Years | 779 (15.3%) | 373 (6.7%) |
| 10 to 14 Years | 372 (7.3%) | 492 (8.8%) |
| 15 to 19 Years | 347 (6.8%) | 305 (5.4%) |
| 20 to 24 Years | 279 (5.5%) | 285 (5.1%) |
| 25 to 29 Years | 208 (4.1%) | 353 (6.3%) |
| 30 to 34 Years | 425 (8.3%) | 350 (6.2%) |
| 35 to 39 Years | 463 (9.1%) | 386 (6.9%) |
| 40 to 44 Years | 427 (8.4%) | 449 (8.0%) |
| 45 to 49 Years | 167 (3.3%) | 56 (1.0%) |
| 50 to 54 Years | 223 (4.4%) | 294 (5.2%) |
| 55 to 59 Years | 258 (5.1%) | 268 (4.8%) |
| 60 to 64 Years | 162 (3.2%) | 269 (4.8%) |
| 65 to 69 Years | 134 (2.6%) | 371 (6.6%) |
| 70 to 74 Years | 231 (4.5%) | 275 (4.9%) |
| 75 to 79 Years | 235 (4.6%) | 91 (1.6%) |
| 80 to 84 Years | 22 (0.4%) | 125 (2.2%) |
| 85 Years and over | 77 (1.5%) | 267 (4.8%) |
| Total | 5,104 (100.0%) | 5,602 (100.0%) |
Families and Households in Pleasanton
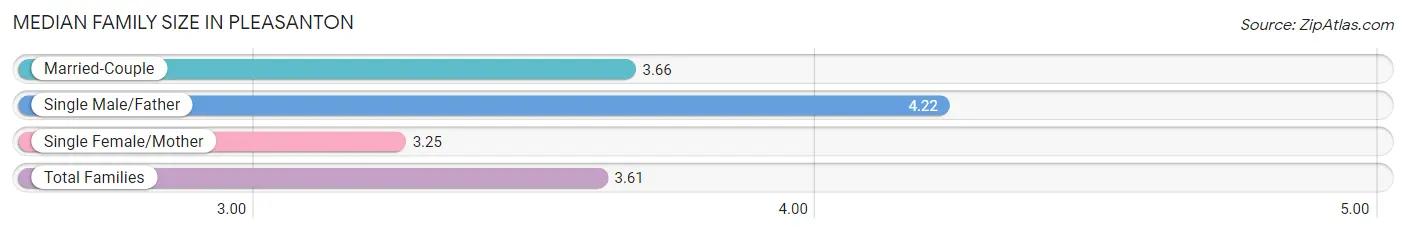
Median Family Size in Pleasanton
The median family size in Pleasanton is 3.61 persons per family, with single male/father families (178 | 7.1%) accounting for the largest median family size of 4.22 persons per family. On the other hand, single female/mother families (551 | 22.0%) represent the smallest median family size with 3.25 persons per family.
| Family Type | # Families | Family Size |
| Married-Couple | 1,776 (70.9%) | 3.66 |
| Single Male/Father | 178 (7.1%) | 4.22 |
| Single Female/Mother | 551 (22.0%) | 3.25 |
| Total Families | 2,505 (100.0%) | 3.61 |
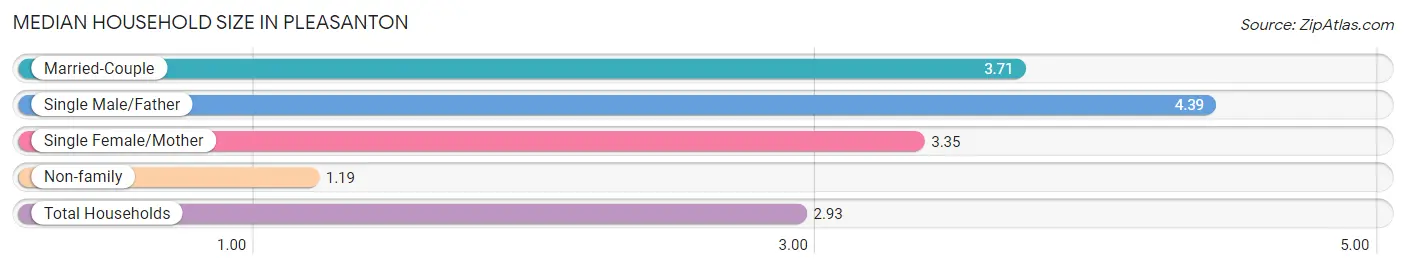
Median Household Size in Pleasanton
The median household size in Pleasanton is 2.93 persons per household, with single male/father households (178 | 5.0%) accounting for the largest median household size of 4.39 persons per household. non-family households (1,080 | 30.1%) represent the smallest median household size with 1.19 persons per household.
| Household Type | # Households | Household Size |
| Married-Couple | 1,776 (49.5%) | 3.71 |
| Single Male/Father | 178 (5.0%) | 4.39 |
| Single Female/Mother | 551 (15.4%) | 3.35 |
| Non-family | 1,080 (30.1%) | 1.19 |
| Total Households | 3,585 (100.0%) | 2.93 |
Household Size by Marriage Status in Pleasanton
Out of a total of 3,585 households in Pleasanton, 2,505 (69.9%) are family households, while 1,080 (30.1%) are nonfamily households. The most numerous type of family households are 2-person households, comprising 917, and the most common type of nonfamily households are 1-person households, comprising 1,004.
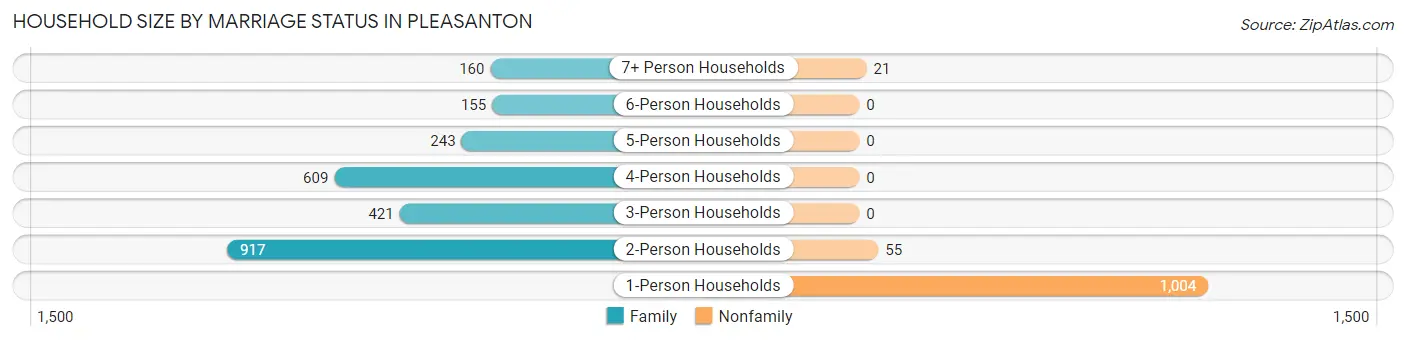
| Household Size | Family Households | Nonfamily Households |
| 1-Person Households | - | 1,004 (28.0%) |
| 2-Person Households | 917 (25.6%) | 55 (1.5%) |
| 3-Person Households | 421 (11.7%) | 0 (0.0%) |
| 4-Person Households | 609 (17.0%) | 0 (0.0%) |
| 5-Person Households | 243 (6.8%) | 0 (0.0%) |
| 6-Person Households | 155 (4.3%) | 0 (0.0%) |
| 7+ Person Households | 160 (4.5%) | 21 (0.6%) |
| Total | 2,505 (69.9%) | 1,080 (30.1%) |
Female Fertility in Pleasanton
Fertility by Age in Pleasanton
Average fertility rate in Pleasanton is 74.0 births per 1,000 women. Women in the age bracket of 15 to 19 years have the highest fertility rate with 157.0 births per 1,000 women. Women in the age bracket of 20 to 34 years acount for 70.7% of all women with births.
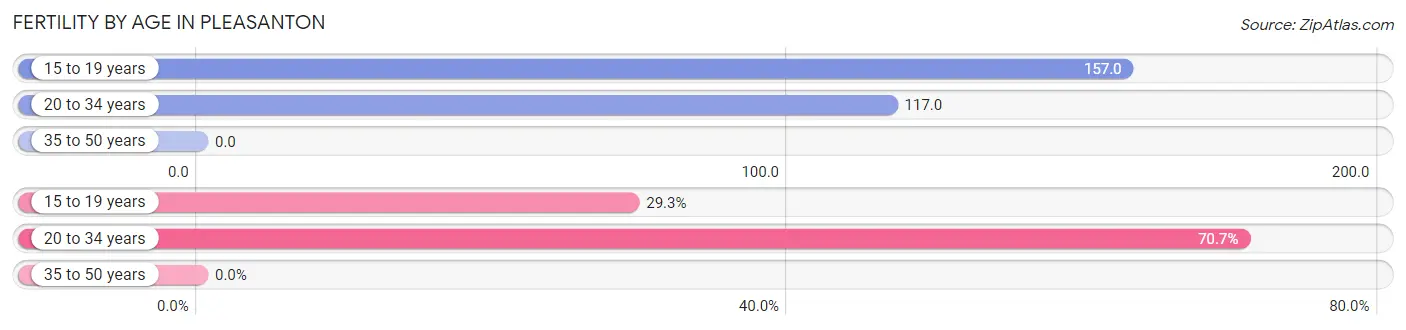
| Age Bracket | Women with Births | Births / 1,000 Women |
| 15 to 19 years | 48 (29.3%) | 157.0 |
| 20 to 34 years | 116 (70.7%) | 117.0 |
| 35 to 50 years | 0 (0.0%) | 0.0 |
| Total | 164 (100.0%) | 74.0 |
Fertility by Age by Marriage Status in Pleasanton
52.4% of women with births (164) in Pleasanton are married. The highest percentage of unmarried women with births falls into 15 to 19 years age bracket with 100.0% of them unmarried at the time of birth, while the lowest percentage of unmarried women with births belong to 20 to 34 years age bracket with 25.9% of them unmarried.
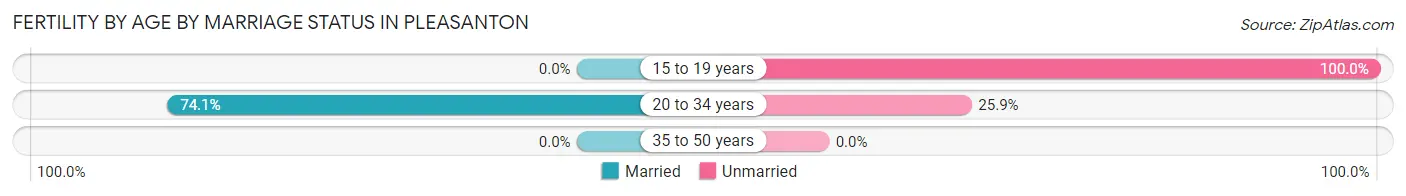
| Age Bracket | Married | Unmarried |
| 15 to 19 years | 0 (0.0%) | 48 (100.0%) |
| 20 to 34 years | 86 (74.1%) | 30 (25.9%) |
| 35 to 50 years | 0 (0.0%) | 0 (0.0%) |
| Total | 86 (52.4%) | 78 (47.6%) |
Fertility by Education in Pleasanton
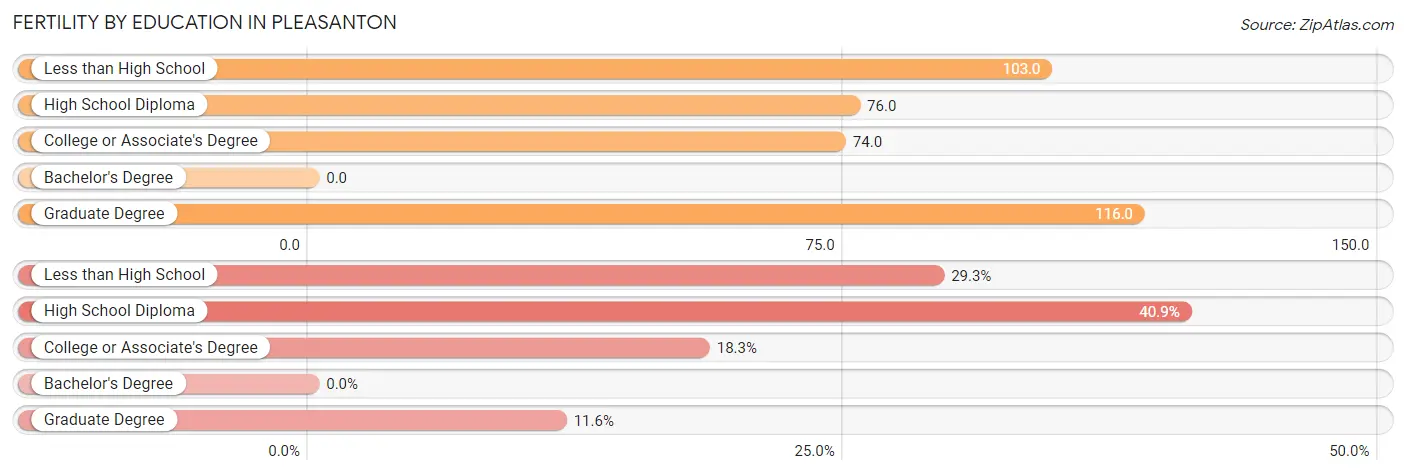
| Educational Attainment | Women with Births | Births / 1,000 Women |
| Less than High School | 48 (29.3%) | 103.0 |
| High School Diploma | 67 (40.8%) | 76.0 |
| College or Associate's Degree | 30 (18.3%) | 74.0 |
| Bachelor's Degree | 0 (0.0%) | 0.0 |
| Graduate Degree | 19 (11.6%) | 116.0 |
| Total | 164 (100.0%) | 74.0 |
Fertility by Education by Marriage Status in Pleasanton
47.6% of women with births in Pleasanton are unmarried. Women with the educational attainment of high school diploma are most likely to be married with 100.0% of them married at childbirth, while women with the educational attainment of less than high school are least likely to be married with 100.0% of them unmarried at childbirth.
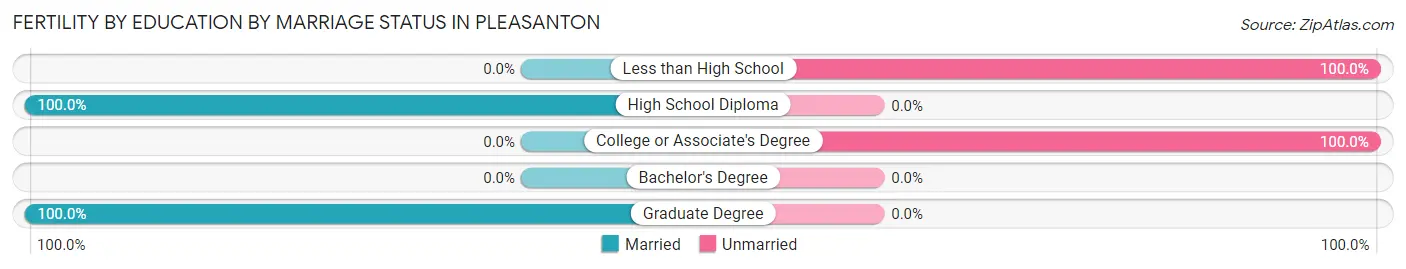
| Educational Attainment | Married | Unmarried |
| Less than High School | 0 (0.0%) | 48 (100.0%) |
| High School Diploma | 67 (100.0%) | 0 (0.0%) |
| College or Associate's Degree | 0 (0.0%) | 30 (100.0%) |
| Bachelor's Degree | 0 (0.0%) | 0 (0.0%) |
| Graduate Degree | 19 (100.0%) | 0 (0.0%) |
| Total | 86 (52.4%) | 78 (47.6%) |
Employment Characteristics in Pleasanton
Employment by Class of Employer in Pleasanton
Among the 4,248 employed individuals in Pleasanton, private company employees (3,451 | 81.2%), self-employed (not incorporated) (277 | 6.5%), and not-for-profit organizations (192 | 4.5%) make up the most common classes of employment.
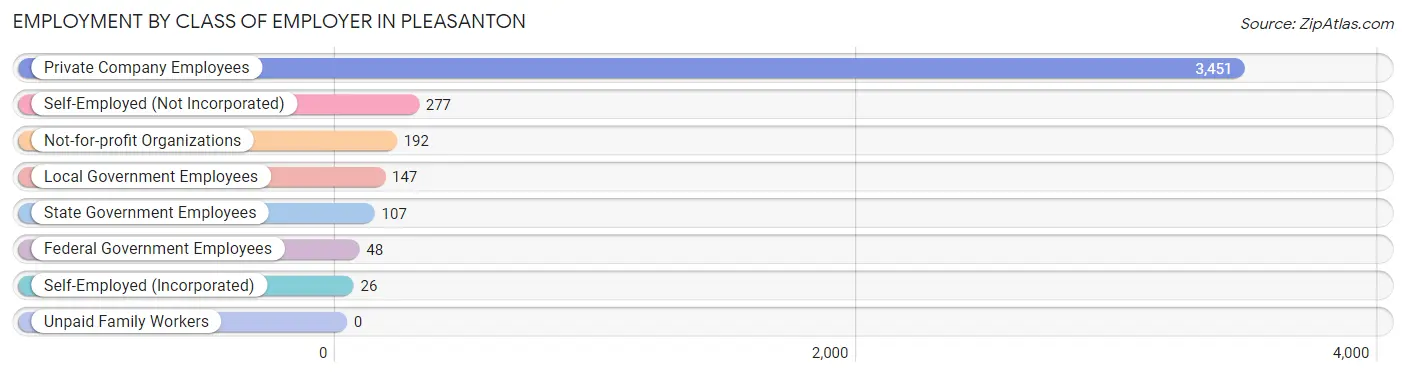
| Employer Class | # Employees | % Employees |
| Private Company Employees | 3,451 | 81.2% |
| Self-Employed (Incorporated) | 26 | 0.6% |
| Self-Employed (Not Incorporated) | 277 | 6.5% |
| Not-for-profit Organizations | 192 | 4.5% |
| Local Government Employees | 147 | 3.5% |
| State Government Employees | 107 | 2.5% |
| Federal Government Employees | 48 | 1.1% |
| Unpaid Family Workers | 0 | 0.0% |
| Total | 4,248 | 100.0% |
Employment Status by Age in Pleasanton
According to the labor force statistics for Pleasanton, out of the total population over 16 years of age (7,769), 58.9% or 4,576 individuals are in the labor force, with 4.5% or 206 of them unemployed. The age group with the highest labor force participation rate is 45 to 54 years, with 90.9% or 673 individuals in the labor force. Within the labor force, the 20 to 24 years age range has the highest percentage of unemployed individuals, with 11.6% or 58 of them being unemployed.
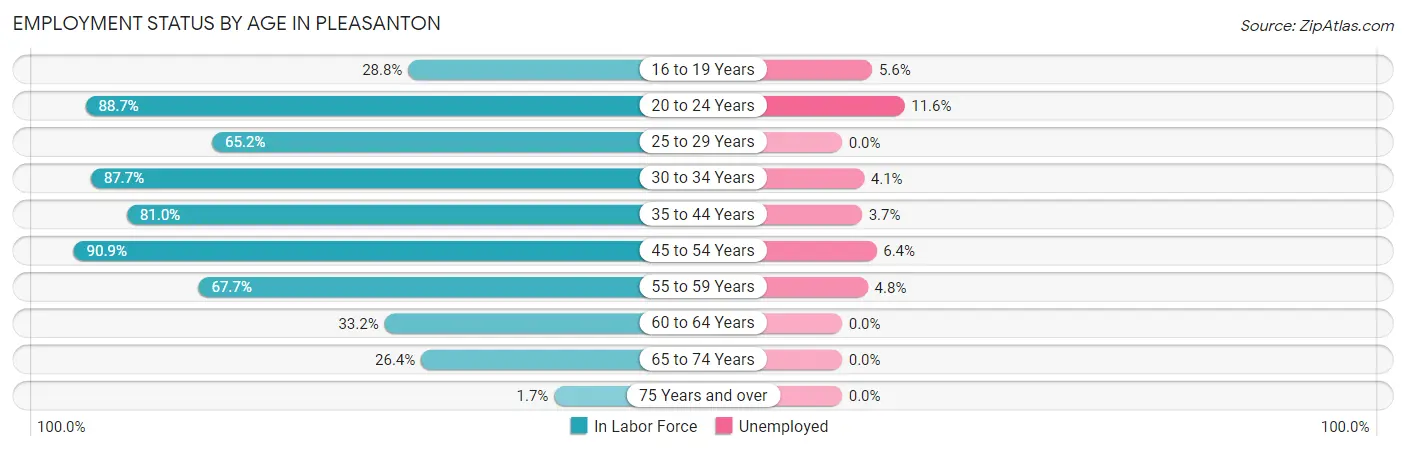
| Age Bracket | In Labor Force | Unemployed |
| 16 to 19 Years | 178 (28.8%) | 10 (5.6%) |
| 20 to 24 Years | 500 (88.7%) | 58 (11.6%) |
| 25 to 29 Years | 366 (65.2%) | 0 (0.0%) |
| 30 to 34 Years | 680 (87.7%) | 28 (4.1%) |
| 35 to 44 Years | 1,397 (81.0%) | 52 (3.7%) |
| 45 to 54 Years | 673 (90.9%) | 43 (6.4%) |
| 55 to 59 Years | 356 (67.7%) | 17 (4.8%) |
| 60 to 64 Years | 143 (33.2%) | 0 (0.0%) |
| 65 to 74 Years | 267 (26.4%) | 0 (0.0%) |
| 75 Years and over | 14 (1.7%) | 0 (0.0%) |
| Total | 4,576 (58.9%) | 206 (4.5%) |
Employment Status by Educational Attainment in Pleasanton
According to labor force statistics for Pleasanton, 76.0% of individuals (3,616) out of the total population between 25 and 64 years of age (4,758) are in the labor force, with 3.9% or 141 of them being unemployed. The group with the highest labor force participation rate are those with the educational attainment of college / associate degree, with 81.0% or 1,022 individuals in the labor force. Within the labor force, individuals with less than high school education have the highest percentage of unemployment, with 5.8% or 33 of them being unemployed.
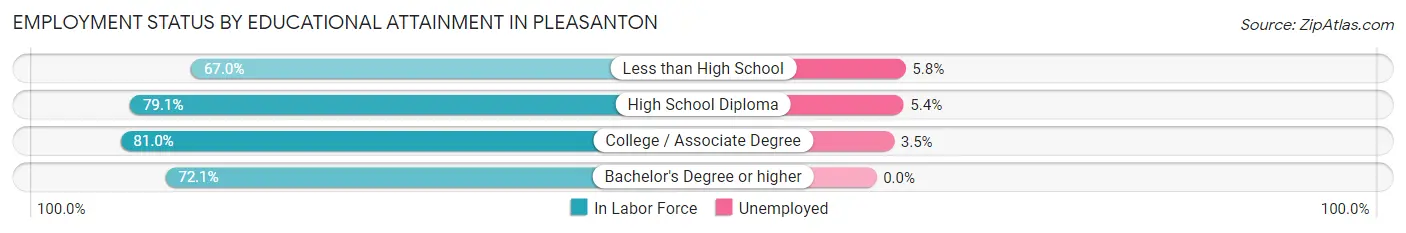
| Educational Attainment | In Labor Force | Unemployed |
| Less than High School | 570 (67.0%) | 49 (5.8%) |
| High School Diploma | 1,322 (79.1%) | 90 (5.4%) |
| College / Associate Degree | 1,022 (81.0%) | 44 (3.5%) |
| Bachelor's Degree or higher | 702 (72.1%) | 0 (0.0%) |
| Total | 3,616 (76.0%) | 186 (3.9%) |
Employment Occupations by Sex in Pleasanton
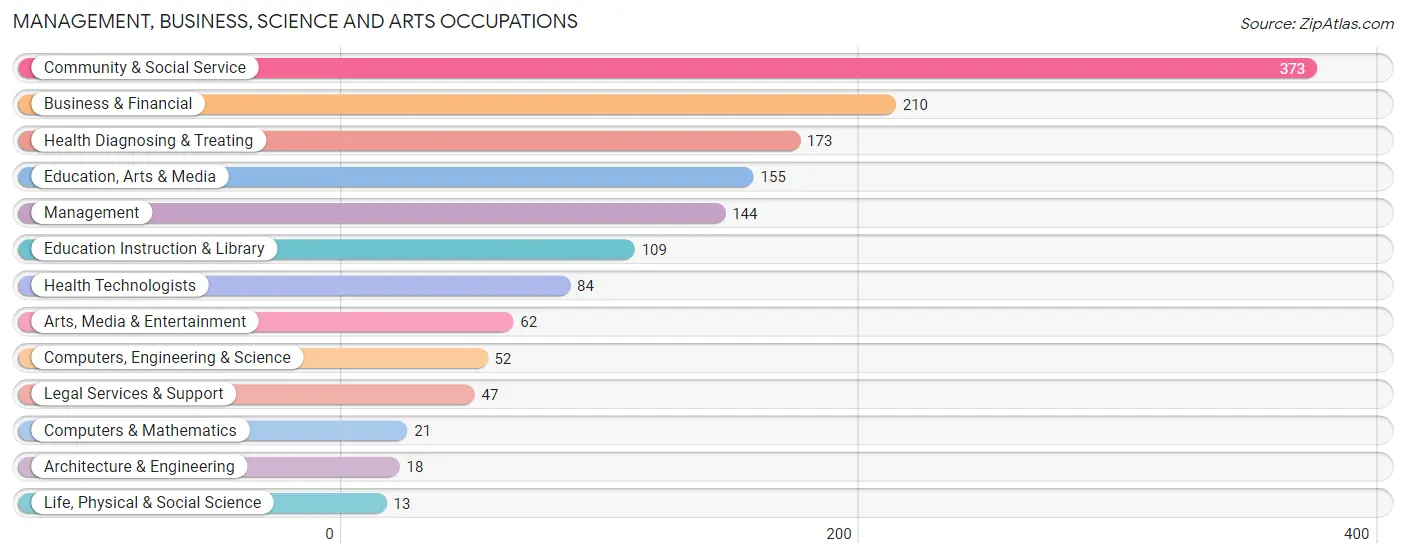
Management, Business, Science and Arts Occupations
The most common Management, Business, Science and Arts occupations in Pleasanton are Community & Social Service (373 | 8.5%), Business & Financial (210 | 4.8%), Health Diagnosing & Treating (173 | 4.0%), Education, Arts & Media (155 | 3.5%), and Management (144 | 3.3%).
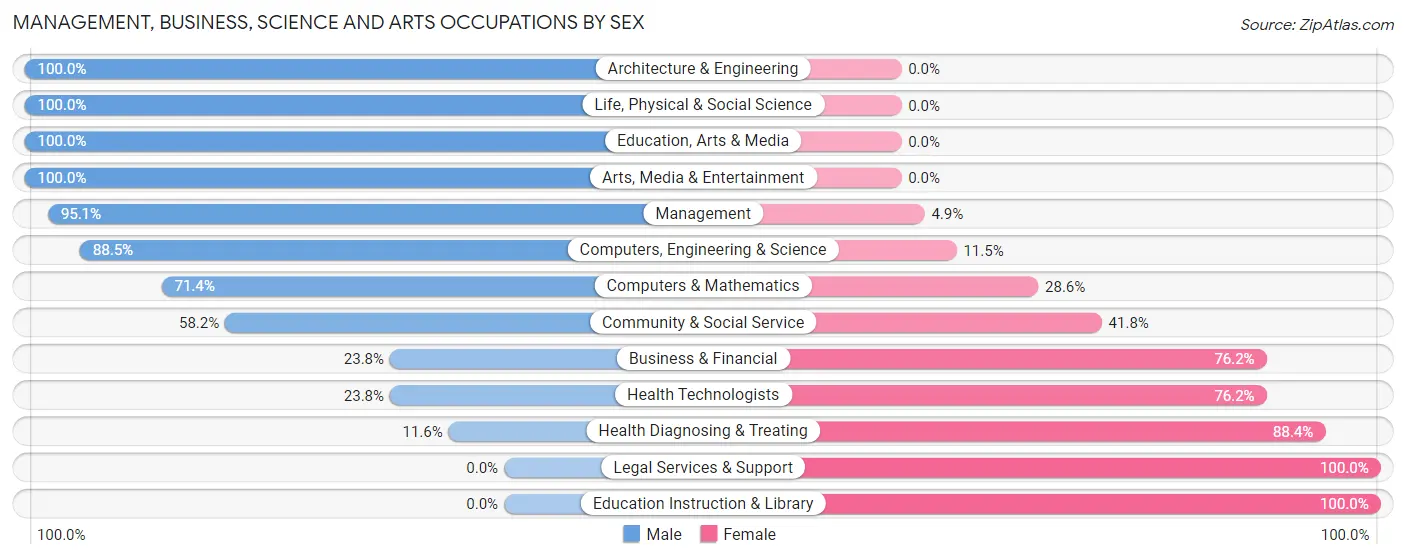
Management, Business, Science and Arts Occupations by Sex
Within the Management, Business, Science and Arts occupations in Pleasanton, the most male-oriented occupations are Architecture & Engineering (100.0%), Life, Physical & Social Science (100.0%), and Education, Arts & Media (100.0%), while the most female-oriented occupations are Legal Services & Support (100.0%), Education Instruction & Library (100.0%), and Health Diagnosing & Treating (88.4%).
| Occupation | Male | Female |
| Management | 137 (95.1%) | 7 (4.9%) |
| Business & Financial | 50 (23.8%) | 160 (76.2%) |
| Computers, Engineering & Science | 46 (88.5%) | 6 (11.5%) |
| Computers & Mathematics | 15 (71.4%) | 6 (28.6%) |
| Architecture & Engineering | 18 (100.0%) | 0 (0.0%) |
| Life, Physical & Social Science | 13 (100.0%) | 0 (0.0%) |
| Community & Social Service | 217 (58.2%) | 156 (41.8%) |
| Education, Arts & Media | 155 (100.0%) | 0 (0.0%) |
| Legal Services & Support | 0 (0.0%) | 47 (100.0%) |
| Education Instruction & Library | 0 (0.0%) | 109 (100.0%) |
| Arts, Media & Entertainment | 62 (100.0%) | 0 (0.0%) |
| Health Diagnosing & Treating | 20 (11.6%) | 153 (88.4%) |
| Health Technologists | 20 (23.8%) | 64 (76.2%) |
| Total (Category) | 470 (49.4%) | 482 (50.6%) |
| Total (Overall) | 2,406 (55.1%) | 1,961 (44.9%) |
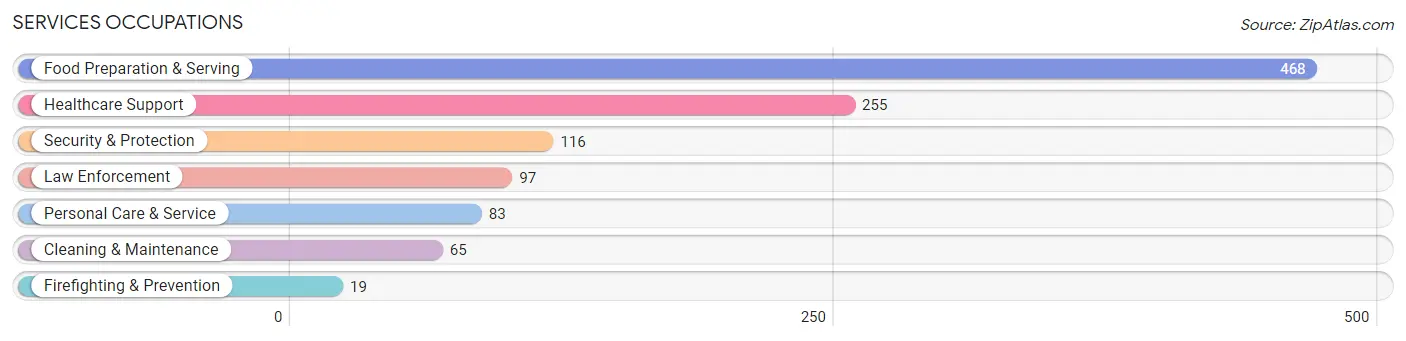
Services Occupations
The most common Services occupations in Pleasanton are Food Preparation & Serving (468 | 10.7%), Healthcare Support (255 | 5.8%), Security & Protection (116 | 2.7%), Law Enforcement (97 | 2.2%), and Personal Care & Service (83 | 1.9%).
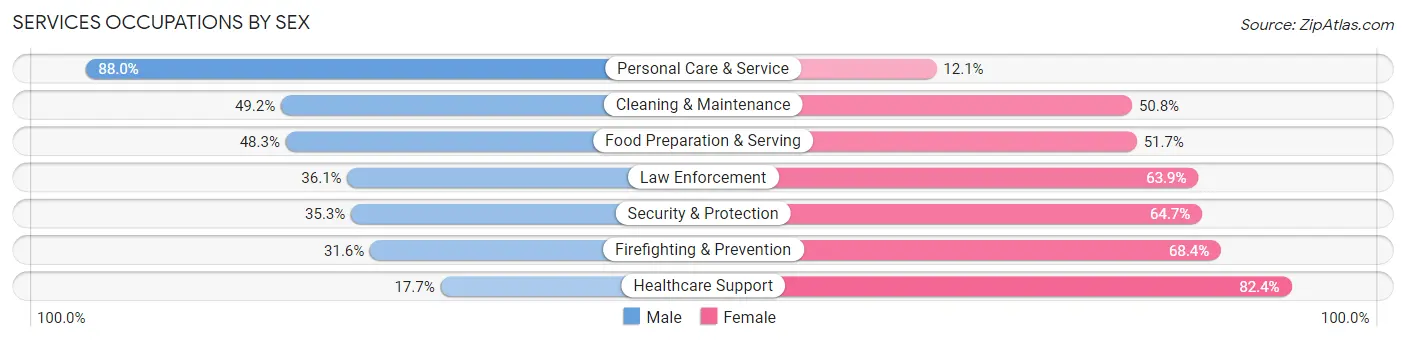
Services Occupations by Sex
Within the Services occupations in Pleasanton, the most male-oriented occupations are Personal Care & Service (87.9%), Cleaning & Maintenance (49.2%), and Food Preparation & Serving (48.3%), while the most female-oriented occupations are Healthcare Support (82.4%), Firefighting & Prevention (68.4%), and Security & Protection (64.7%).
| Occupation | Male | Female |
| Healthcare Support | 45 (17.6%) | 210 (82.4%) |
| Security & Protection | 41 (35.3%) | 75 (64.7%) |
| Firefighting & Prevention | 6 (31.6%) | 13 (68.4%) |
| Law Enforcement | 35 (36.1%) | 62 (63.9%) |
| Food Preparation & Serving | 226 (48.3%) | 242 (51.7%) |
| Cleaning & Maintenance | 32 (49.2%) | 33 (50.8%) |
| Personal Care & Service | 73 (87.9%) | 10 (12.0%) |
| Total (Category) | 417 (42.2%) | 570 (57.8%) |
| Total (Overall) | 2,406 (55.1%) | 1,961 (44.9%) |
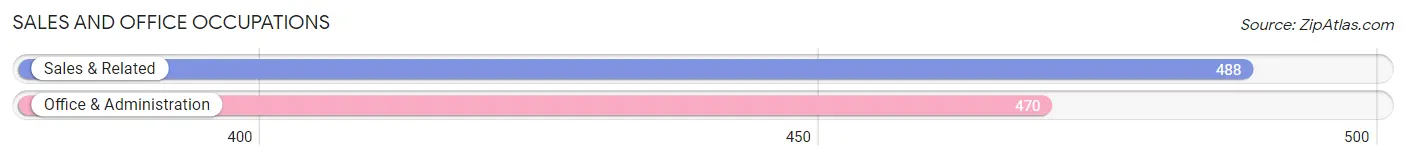
Sales and Office Occupations
The most common Sales and Office occupations in Pleasanton are Sales & Related (488 | 11.2%), and Office & Administration (470 | 10.8%).
Sales and Office Occupations by Sex
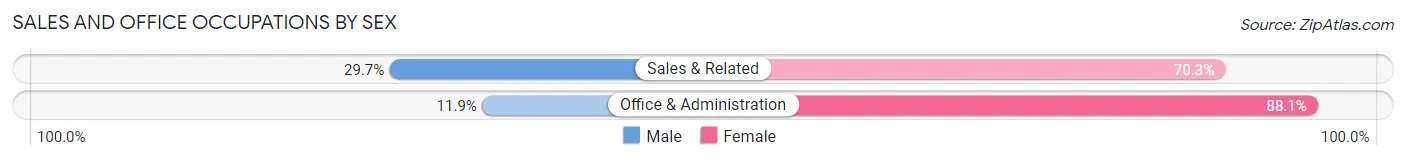
| Occupation | Male | Female |
| Sales & Related | 145 (29.7%) | 343 (70.3%) |
| Office & Administration | 56 (11.9%) | 414 (88.1%) |
| Total (Category) | 201 (21.0%) | 757 (79.0%) |
| Total (Overall) | 2,406 (55.1%) | 1,961 (44.9%) |
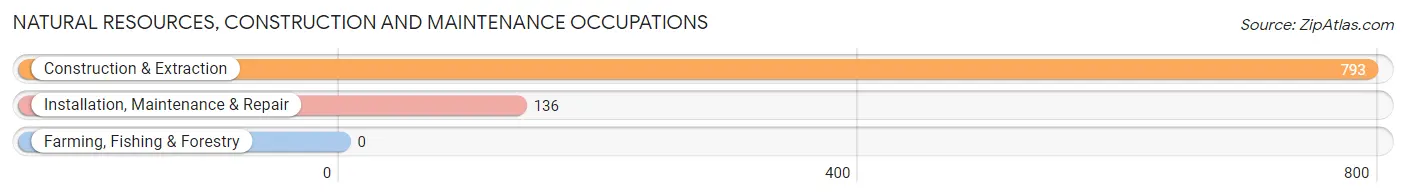
Natural Resources, Construction and Maintenance Occupations
The most common Natural Resources, Construction and Maintenance occupations in Pleasanton are Construction & Extraction (793 | 18.2%), and Installation, Maintenance & Repair (136 | 3.1%).
Natural Resources, Construction and Maintenance Occupations by Sex
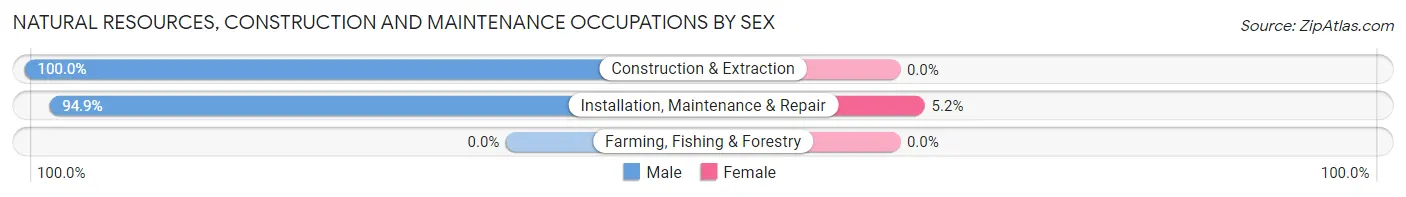
| Occupation | Male | Female |
| Farming, Fishing & Forestry | 0 (0.0%) | 0 (0.0%) |
| Construction & Extraction | 793 (100.0%) | 0 (0.0%) |
| Installation, Maintenance & Repair | 129 (94.9%) | 7 (5.1%) |
| Total (Category) | 922 (99.3%) | 7 (0.7%) |
| Total (Overall) | 2,406 (55.1%) | 1,961 (44.9%) |
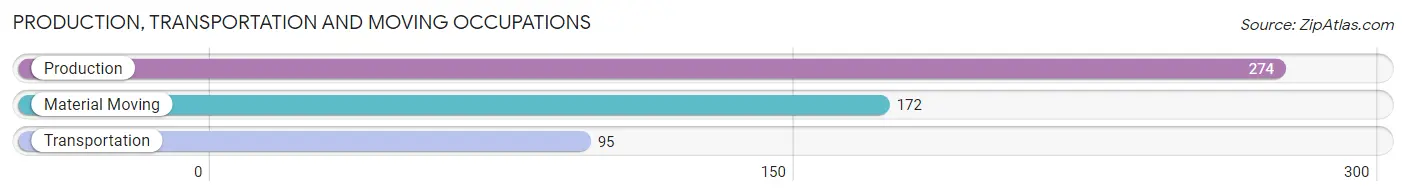
Production, Transportation and Moving Occupations
The most common Production, Transportation and Moving occupations in Pleasanton are Production (274 | 6.3%), Material Moving (172 | 3.9%), and Transportation (95 | 2.2%).
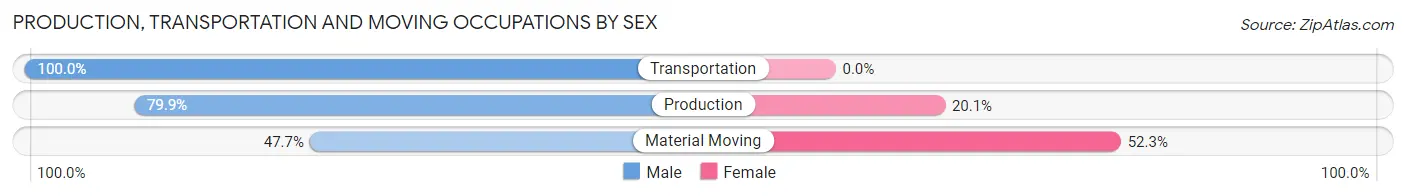
Production, Transportation and Moving Occupations by Sex
| Occupation | Male | Female |
| Production | 219 (79.9%) | 55 (20.1%) |
| Transportation | 95 (100.0%) | 0 (0.0%) |
| Material Moving | 82 (47.7%) | 90 (52.3%) |
| Total (Category) | 396 (73.2%) | 145 (26.8%) |
| Total (Overall) | 2,406 (55.1%) | 1,961 (44.9%) |
Employment Industries by Sex in Pleasanton
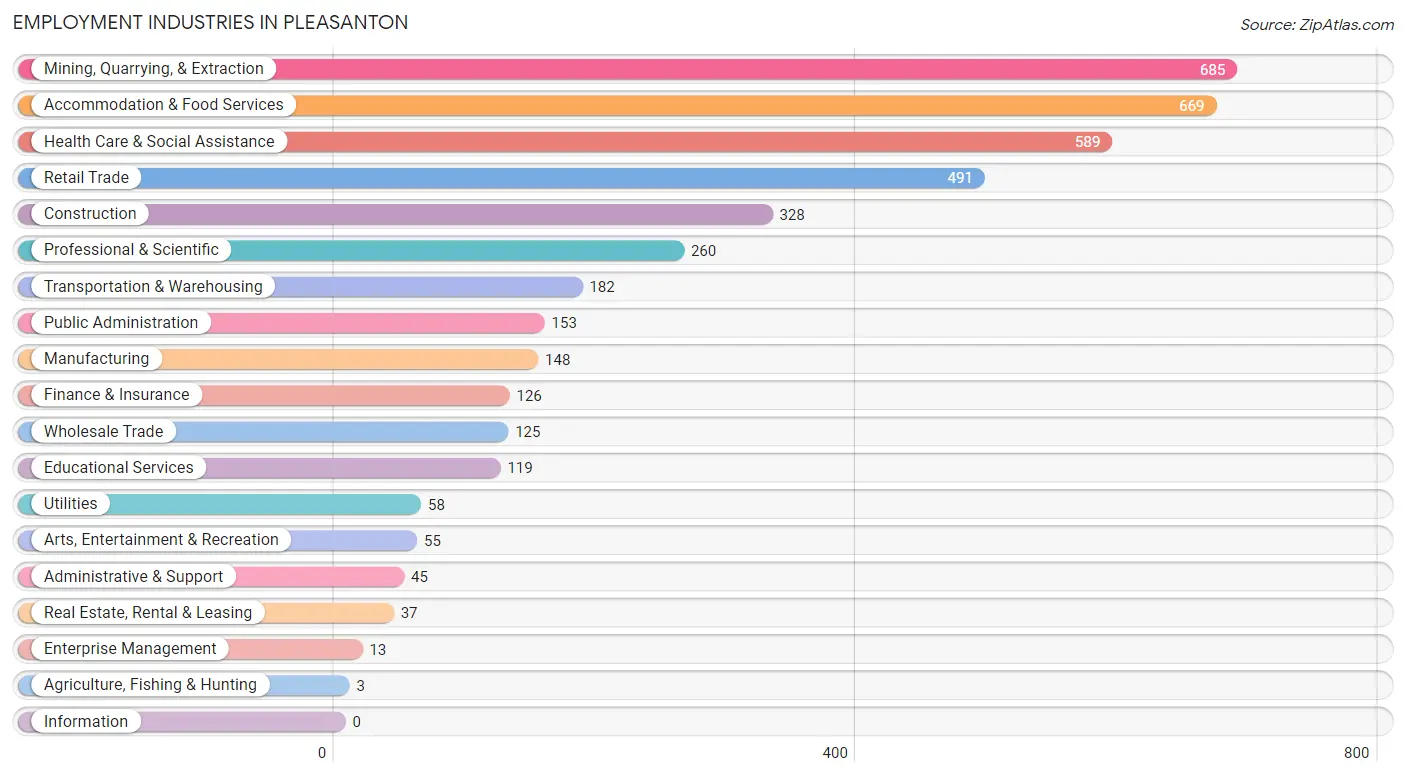
Employment Industries in Pleasanton
The major employment industries in Pleasanton include Mining, Quarrying, & Extraction (685 | 15.7%), Accommodation & Food Services (669 | 15.3%), Health Care & Social Assistance (589 | 13.5%), Retail Trade (491 | 11.2%), and Construction (328 | 7.5%).
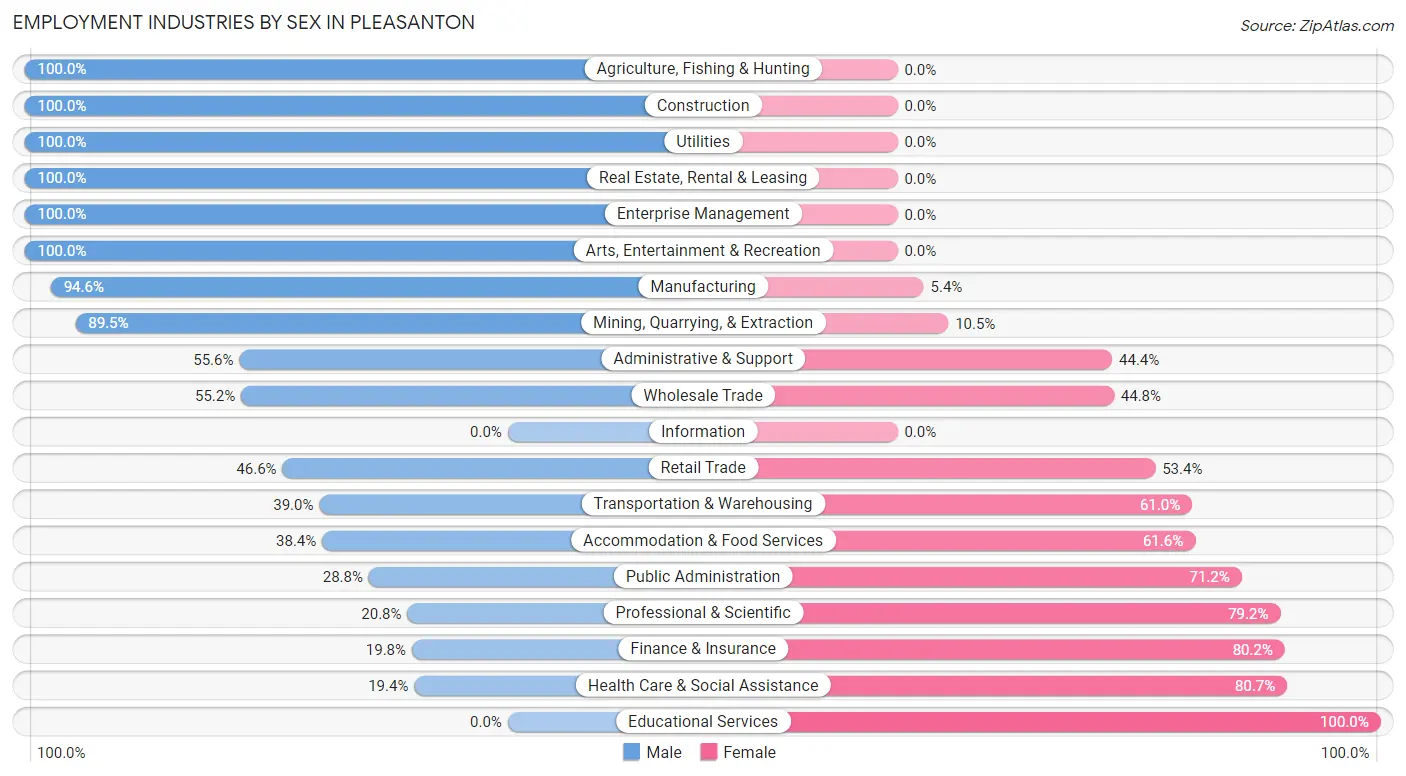
Employment Industries by Sex in Pleasanton
The Pleasanton industries that see more men than women are Agriculture, Fishing & Hunting (100.0%), Construction (100.0%), and Utilities (100.0%), whereas the industries that tend to have a higher number of women are Educational Services (100.0%), Health Care & Social Assistance (80.6%), and Finance & Insurance (80.2%).
| Industry | Male | Female |
| Agriculture, Fishing & Hunting | 3 (100.0%) | 0 (0.0%) |
| Mining, Quarrying, & Extraction | 613 (89.5%) | 72 (10.5%) |
| Construction | 328 (100.0%) | 0 (0.0%) |
| Manufacturing | 140 (94.6%) | 8 (5.4%) |
| Wholesale Trade | 69 (55.2%) | 56 (44.8%) |
| Retail Trade | 229 (46.6%) | 262 (53.4%) |
| Transportation & Warehousing | 71 (39.0%) | 111 (61.0%) |
| Utilities | 58 (100.0%) | 0 (0.0%) |
| Information | 0 (0.0%) | 0 (0.0%) |
| Finance & Insurance | 25 (19.8%) | 101 (80.2%) |
| Real Estate, Rental & Leasing | 37 (100.0%) | 0 (0.0%) |
| Professional & Scientific | 54 (20.8%) | 206 (79.2%) |
| Enterprise Management | 13 (100.0%) | 0 (0.0%) |
| Administrative & Support | 25 (55.6%) | 20 (44.4%) |
| Educational Services | 0 (0.0%) | 119 (100.0%) |
| Health Care & Social Assistance | 114 (19.4%) | 475 (80.6%) |
| Arts, Entertainment & Recreation | 55 (100.0%) | 0 (0.0%) |
| Accommodation & Food Services | 257 (38.4%) | 412 (61.6%) |
| Public Administration | 44 (28.8%) | 109 (71.2%) |
| Total | 2,406 (55.1%) | 1,961 (44.9%) |
Education in Pleasanton
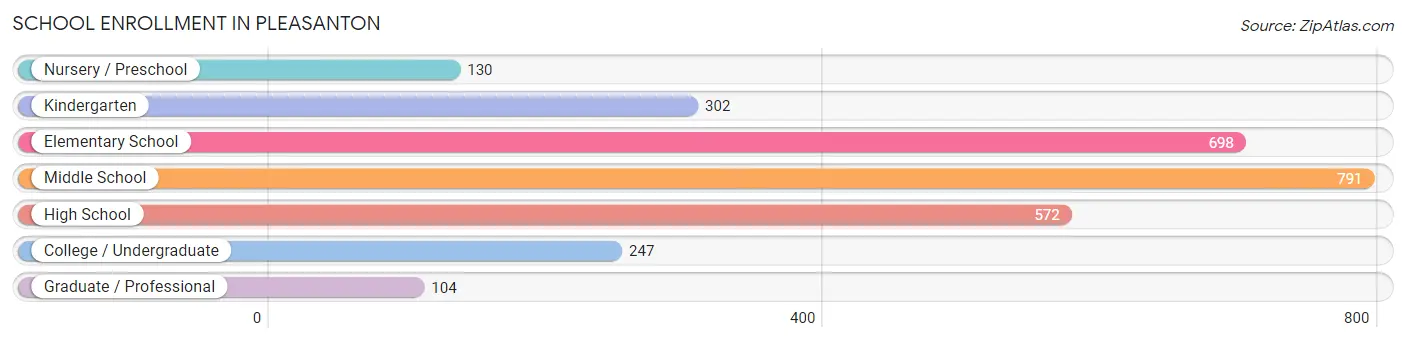
School Enrollment in Pleasanton
The most common levels of schooling among the 2,844 students in Pleasanton are middle school (791 | 27.8%), elementary school (698 | 24.5%), and high school (572 | 20.1%).
| School Level | # Students | % Students |
| Nursery / Preschool | 130 | 4.6% |
| Kindergarten | 302 | 10.6% |
| Elementary School | 698 | 24.5% |
| Middle School | 791 | 27.8% |
| High School | 572 | 20.1% |
| College / Undergraduate | 247 | 8.7% |
| Graduate / Professional | 104 | 3.7% |
| Total | 2,844 | 100.0% |
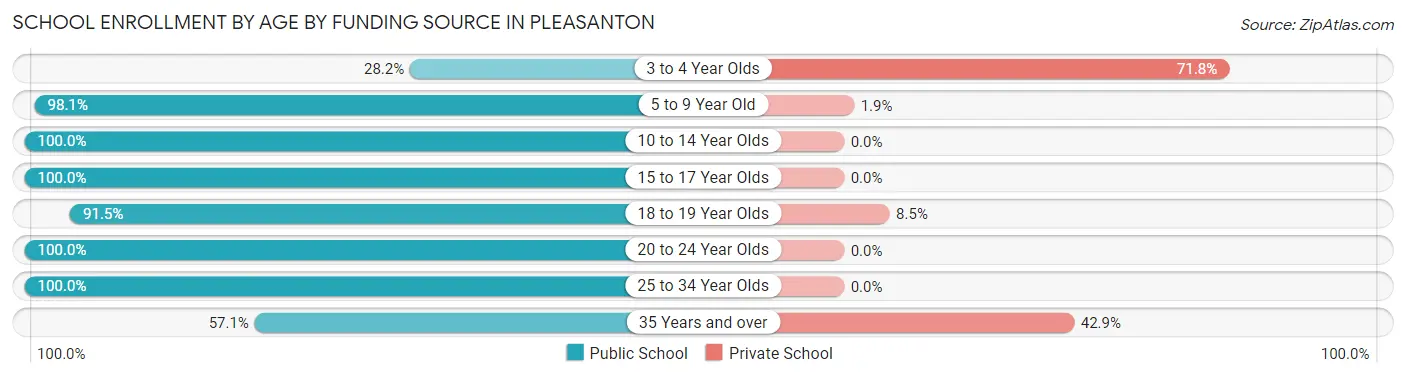
School Enrollment by Age by Funding Source in Pleasanton
Out of a total of 2,844 students who are enrolled in schools in Pleasanton, 105 (3.7%) attend a private institution, while the remaining 2,739 (96.3%) are enrolled in public schools. The age group of 3 to 4 year olds has the highest likelihood of being enrolled in private schools, with 28 (71.8% in the age bracket) enrolled. Conversely, the age group of 10 to 14 year olds has the lowest likelihood of being enrolled in a private school, with 864 (100.0% in the age bracket) attending a public institution.
| Age Bracket | Public School | Private School |
| 3 to 4 Year Olds | 11 (28.2%) | 28 (71.8%) |
| 5 to 9 Year Old | 999 (98.1%) | 19 (1.9%) |
| 10 to 14 Year Olds | 864 (100.0%) | 0 (0.0%) |
| 15 to 17 Year Olds | 462 (100.0%) | 0 (0.0%) |
| 18 to 19 Year Olds | 108 (91.5%) | 10 (8.5%) |
| 20 to 24 Year Olds | 119 (100.0%) | 0 (0.0%) |
| 25 to 34 Year Olds | 112 (100.0%) | 0 (0.0%) |
| 35 Years and over | 64 (57.1%) | 48 (42.9%) |
| Total | 2,739 (96.3%) | 105 (3.7%) |
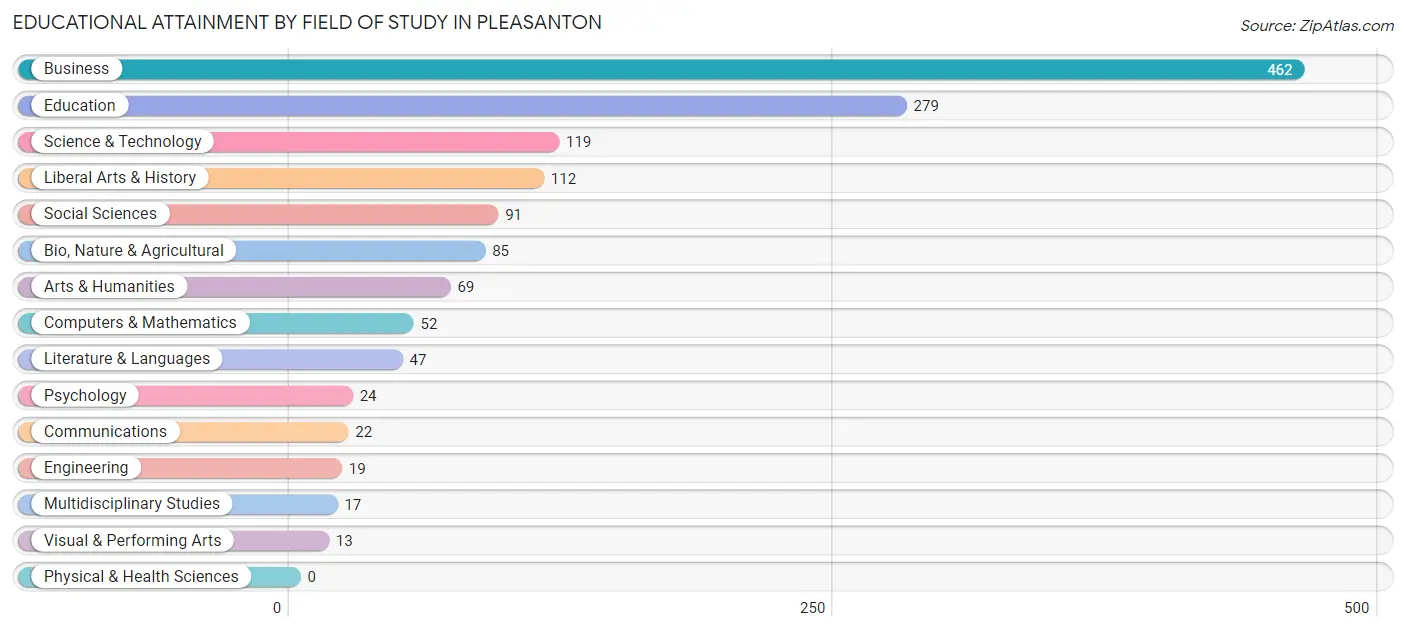
Educational Attainment by Field of Study in Pleasanton
Business (462 | 32.7%), education (279 | 19.8%), science & technology (119 | 8.4%), liberal arts & history (112 | 7.9%), and social sciences (91 | 6.5%) are the most common fields of study among 1,411 individuals in Pleasanton who have obtained a bachelor's degree or higher.
| Field of Study | # Graduates | % Graduates |
| Computers & Mathematics | 52 | 3.7% |
| Bio, Nature & Agricultural | 85 | 6.0% |
| Physical & Health Sciences | 0 | 0.0% |
| Psychology | 24 | 1.7% |
| Social Sciences | 91 | 6.5% |
| Engineering | 19 | 1.3% |
| Multidisciplinary Studies | 17 | 1.2% |
| Science & Technology | 119 | 8.4% |
| Business | 462 | 32.7% |
| Education | 279 | 19.8% |
| Literature & Languages | 47 | 3.3% |
| Liberal Arts & History | 112 | 7.9% |
| Visual & Performing Arts | 13 | 0.9% |
| Communications | 22 | 1.6% |
| Arts & Humanities | 69 | 4.9% |
| Total | 1,411 | 100.0% |
Transportation & Commute in Pleasanton
Vehicle Availability by Sex in Pleasanton
The most prevalent vehicle ownership categories in Pleasanton are males with 2 vehicles (1,021, accounting for 42.4%) and females with 2 vehicles (670, making up 55.4%).
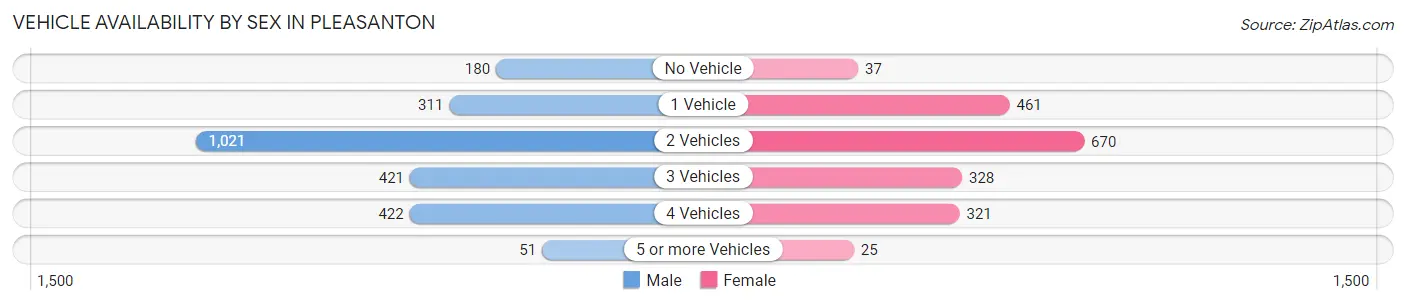
| Vehicles Available | Male | Female |
| No Vehicle | 180 (7.5%) | 37 (2.0%) |
| 1 Vehicle | 311 (12.9%) | 461 (25.0%) |
| 2 Vehicles | 1,021 (42.4%) | 670 (36.4%) |
| 3 Vehicles | 421 (17.5%) | 328 (17.8%) |
| 4 Vehicles | 422 (17.5%) | 321 (17.4%) |
| 5 or more Vehicles | 51 (2.1%) | 25 (1.4%) |
| Total | 2,406 (100.0%) | 1,842 (100.0%) |
Commute Time in Pleasanton
The most frequently occuring commute durations in Pleasanton are 10 to 14 minutes (990 commuters, 24.1%), 15 to 19 minutes (693 commuters, 16.9%), and 5 to 9 minutes (589 commuters, 14.3%).
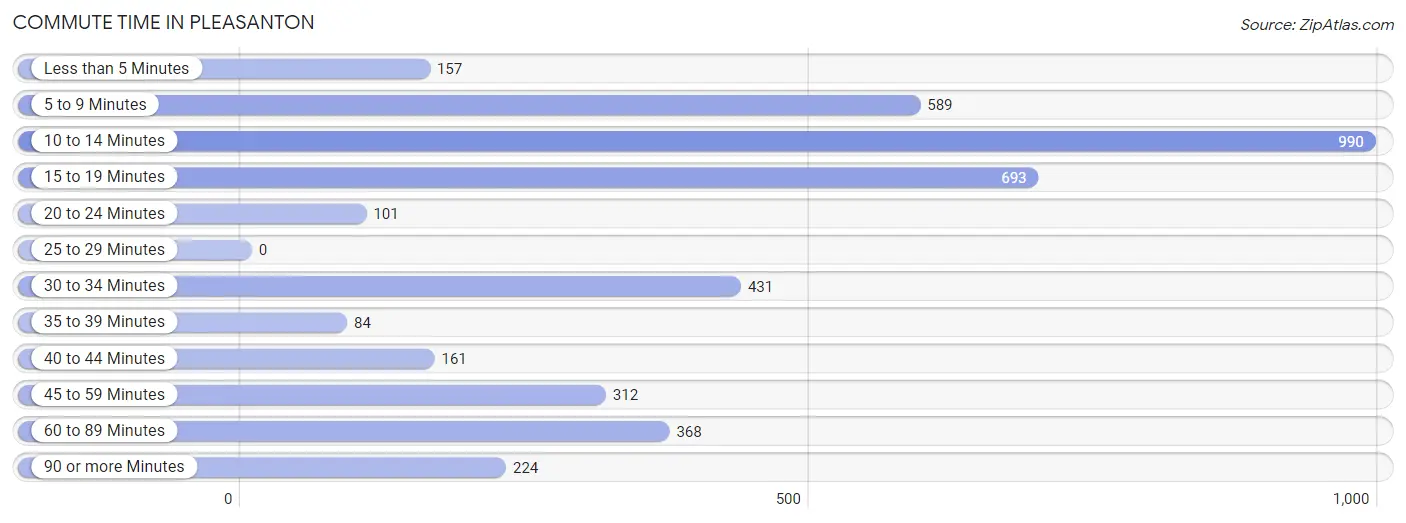
| Commute Time | # Commuters | % Commuters |
| Less than 5 Minutes | 157 | 3.8% |
| 5 to 9 Minutes | 589 | 14.3% |
| 10 to 14 Minutes | 990 | 24.1% |
| 15 to 19 Minutes | 693 | 16.9% |
| 20 to 24 Minutes | 101 | 2.5% |
| 25 to 29 Minutes | 0 | 0.0% |
| 30 to 34 Minutes | 431 | 10.5% |
| 35 to 39 Minutes | 84 | 2.0% |
| 40 to 44 Minutes | 161 | 3.9% |
| 45 to 59 Minutes | 312 | 7.6% |
| 60 to 89 Minutes | 368 | 8.9% |
| 90 or more Minutes | 224 | 5.4% |
Commute Time by Sex in Pleasanton
The most common commute times in Pleasanton are 15 to 19 minutes (559 commuters, 24.0%) for males and 10 to 14 minutes (603 commuters, 33.8%) for females.
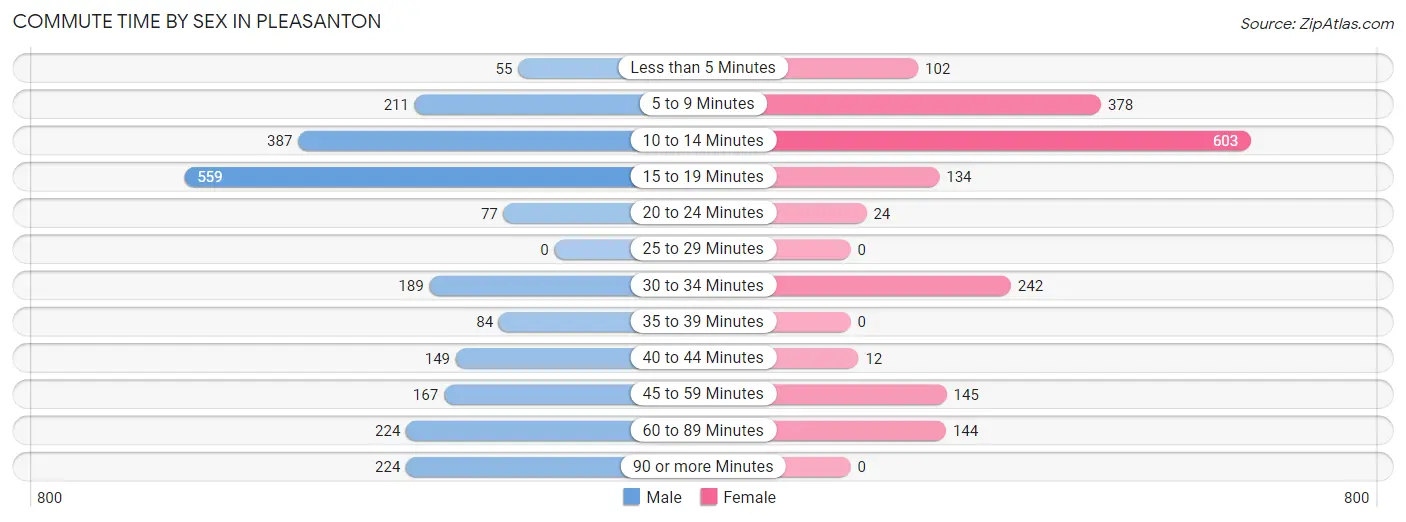
| Commute Time | Male | Female |
| Less than 5 Minutes | 55 (2.4%) | 102 (5.7%) |
| 5 to 9 Minutes | 211 (9.1%) | 378 (21.2%) |
| 10 to 14 Minutes | 387 (16.6%) | 603 (33.8%) |
| 15 to 19 Minutes | 559 (24.0%) | 134 (7.5%) |
| 20 to 24 Minutes | 77 (3.3%) | 24 (1.3%) |
| 25 to 29 Minutes | 0 (0.0%) | 0 (0.0%) |
| 30 to 34 Minutes | 189 (8.1%) | 242 (13.6%) |
| 35 to 39 Minutes | 84 (3.6%) | 0 (0.0%) |
| 40 to 44 Minutes | 149 (6.4%) | 12 (0.7%) |
| 45 to 59 Minutes | 167 (7.2%) | 145 (8.1%) |
| 60 to 89 Minutes | 224 (9.6%) | 144 (8.1%) |
| 90 or more Minutes | 224 (9.6%) | 0 (0.0%) |
Time of Departure to Work by Sex in Pleasanton
The most frequent times of departure to work in Pleasanton are 7:00 AM to 7:29 AM (426, 18.3%) for males and 7:30 AM to 7:59 AM (312, 17.5%) for females.
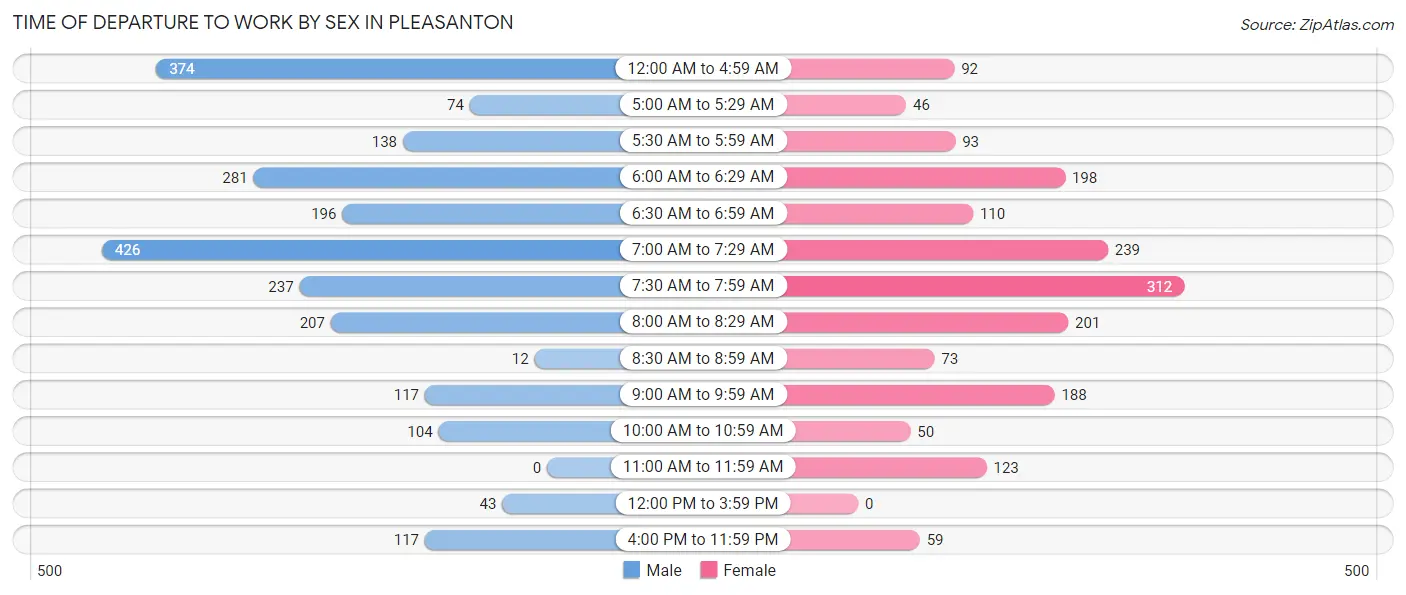
| Time of Departure | Male | Female |
| 12:00 AM to 4:59 AM | 374 (16.1%) | 92 (5.2%) |
| 5:00 AM to 5:29 AM | 74 (3.2%) | 46 (2.6%) |
| 5:30 AM to 5:59 AM | 138 (5.9%) | 93 (5.2%) |
| 6:00 AM to 6:29 AM | 281 (12.1%) | 198 (11.1%) |
| 6:30 AM to 6:59 AM | 196 (8.4%) | 110 (6.2%) |
| 7:00 AM to 7:29 AM | 426 (18.3%) | 239 (13.4%) |
| 7:30 AM to 7:59 AM | 237 (10.2%) | 312 (17.5%) |
| 8:00 AM to 8:29 AM | 207 (8.9%) | 201 (11.3%) |
| 8:30 AM to 8:59 AM | 12 (0.5%) | 73 (4.1%) |
| 9:00 AM to 9:59 AM | 117 (5.0%) | 188 (10.5%) |
| 10:00 AM to 10:59 AM | 104 (4.5%) | 50 (2.8%) |
| 11:00 AM to 11:59 AM | 0 (0.0%) | 123 (6.9%) |
| 12:00 PM to 3:59 PM | 43 (1.8%) | 0 (0.0%) |
| 4:00 PM to 11:59 PM | 117 (5.0%) | 59 (3.3%) |
| Total | 2,326 (100.0%) | 1,784 (100.0%) |
Housing Occupancy in Pleasanton
Occupancy by Ownership in Pleasanton
Of the total 3,585 dwellings in Pleasanton, owner-occupied units account for 2,404 (67.1%), while renter-occupied units make up 1,181 (32.9%).
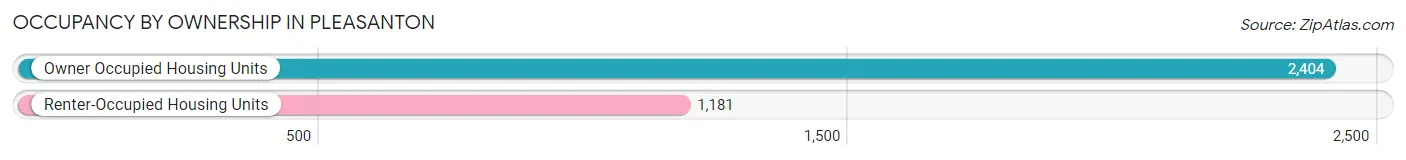
| Occupancy | # Housing Units | % Housing Units |
| Owner Occupied Housing Units | 2,404 | 67.1% |
| Renter-Occupied Housing Units | 1,181 | 32.9% |
| Total Occupied Housing Units | 3,585 | 100.0% |
Occupancy by Household Size in Pleasanton
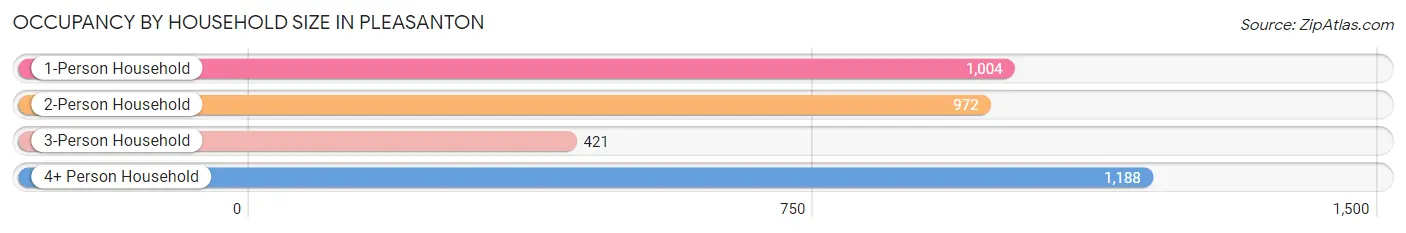
| Household Size | # Housing Units | % Housing Units |
| 1-Person Household | 1,004 | 28.0% |
| 2-Person Household | 972 | 27.1% |
| 3-Person Household | 421 | 11.7% |
| 4+ Person Household | 1,188 | 33.1% |
| Total Housing Units | 3,585 | 100.0% |
Occupancy by Ownership by Household Size in Pleasanton
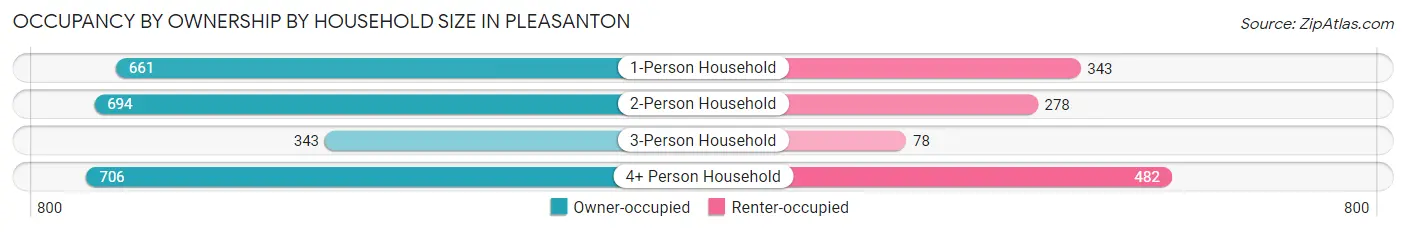
| Household Size | Owner-occupied | Renter-occupied |
| 1-Person Household | 661 (65.8%) | 343 (34.2%) |
| 2-Person Household | 694 (71.4%) | 278 (28.6%) |
| 3-Person Household | 343 (81.5%) | 78 (18.5%) |
| 4+ Person Household | 706 (59.4%) | 482 (40.6%) |
| Total Housing Units | 2,404 (67.1%) | 1,181 (32.9%) |
Occupancy by Educational Attainment in Pleasanton
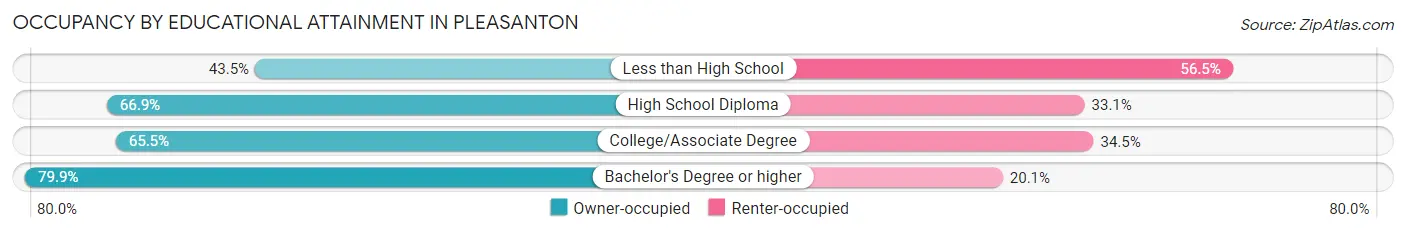
| Household Size | Owner-occupied | Renter-occupied |
| Less than High School | 173 (43.5%) | 225 (56.5%) |
| High School Diploma | 895 (66.9%) | 442 (33.1%) |
| College/Associate Degree | 648 (65.5%) | 341 (34.5%) |
| Bachelor's Degree or higher | 688 (79.9%) | 173 (20.1%) |
Occupancy by Age of Householder in Pleasanton
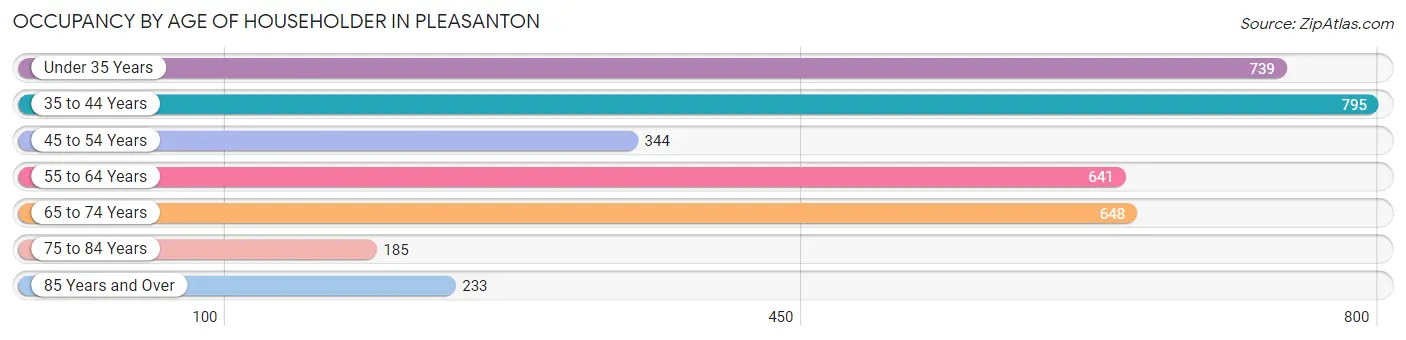
| Age Bracket | # Households | % Households |
| Under 35 Years | 739 | 20.6% |
| 35 to 44 Years | 795 | 22.2% |
| 45 to 54 Years | 344 | 9.6% |
| 55 to 64 Years | 641 | 17.9% |
| 65 to 74 Years | 648 | 18.1% |
| 75 to 84 Years | 185 | 5.2% |
| 85 Years and Over | 233 | 6.5% |
| Total | 3,585 | 100.0% |
Housing Finances in Pleasanton
Median Income by Occupancy in Pleasanton
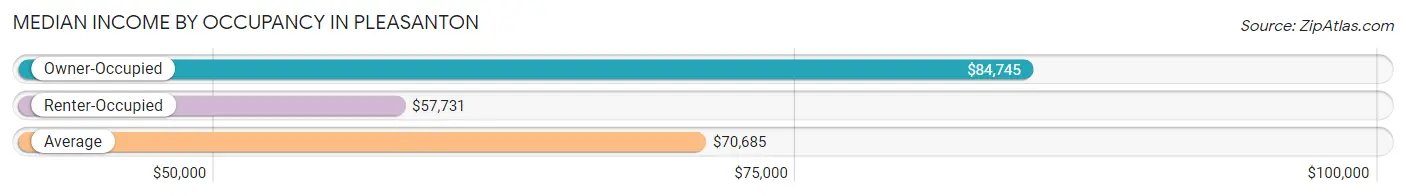
| Occupancy Type | # Households | Median Income |
| Owner-Occupied | 2,404 (67.1%) | $84,745 |
| Renter-Occupied | 1,181 (32.9%) | $57,731 |
| Average | 3,585 (100.0%) | $70,685 |
Occupancy by Householder Income Bracket in Pleasanton
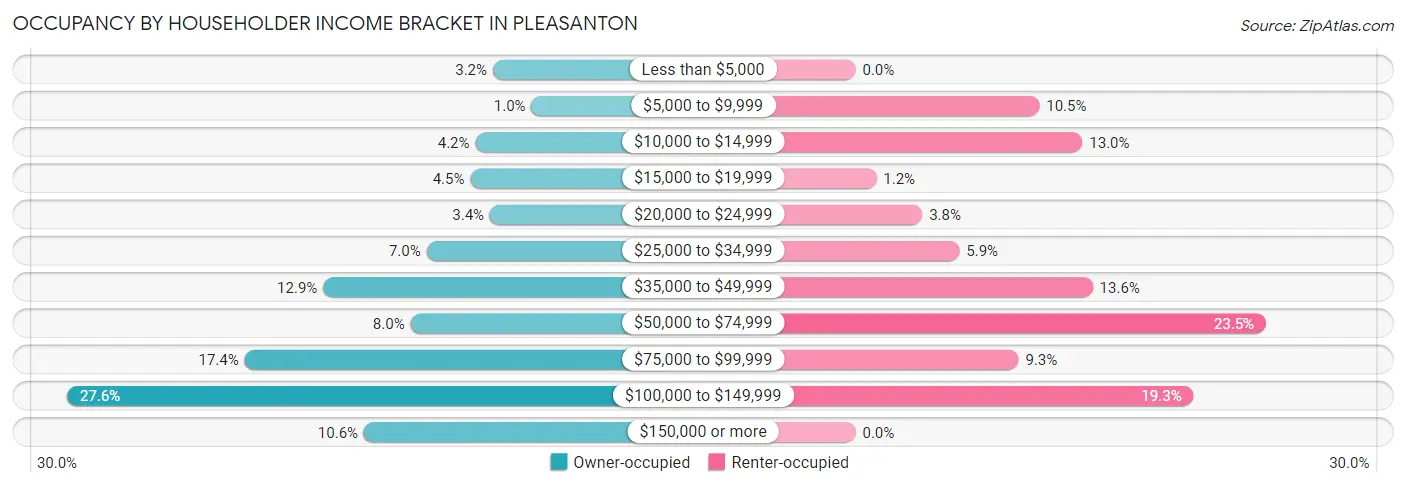
| Income Bracket | Owner-occupied | Renter-occupied |
| Less than $5,000 | 78 (3.2%) | 0 (0.0%) |
| $5,000 to $9,999 | 25 (1.0%) | 124 (10.5%) |
| $10,000 to $14,999 | 102 (4.2%) | 153 (13.0%) |
| $15,000 to $19,999 | 109 (4.5%) | 14 (1.2%) |
| $20,000 to $24,999 | 82 (3.4%) | 45 (3.8%) |
| $25,000 to $34,999 | 169 (7.0%) | 70 (5.9%) |
| $35,000 to $49,999 | 311 (12.9%) | 160 (13.6%) |
| $50,000 to $74,999 | 191 (8.0%) | 277 (23.4%) |
| $75,000 to $99,999 | 419 (17.4%) | 110 (9.3%) |
| $100,000 to $149,999 | 663 (27.6%) | 228 (19.3%) |
| $150,000 or more | 255 (10.6%) | 0 (0.0%) |
| Total | 2,404 (100.0%) | 1,181 (100.0%) |
Monthly Housing Cost Tiers in Pleasanton
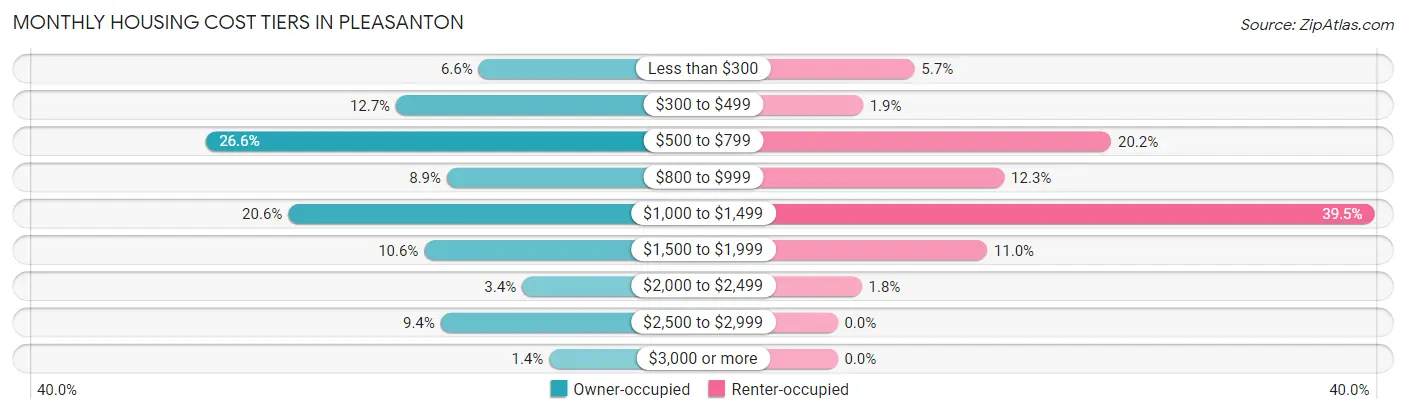
| Monthly Cost | Owner-occupied | Renter-occupied |
| Less than $300 | 158 (6.6%) | 67 (5.7%) |
| $300 to $499 | 304 (12.7%) | 22 (1.9%) |
| $500 to $799 | 640 (26.6%) | 238 (20.2%) |
| $800 to $999 | 214 (8.9%) | 145 (12.3%) |
| $1,000 to $1,499 | 495 (20.6%) | 467 (39.5%) |
| $1,500 to $1,999 | 254 (10.6%) | 130 (11.0%) |
| $2,000 to $2,499 | 81 (3.4%) | 21 (1.8%) |
| $2,500 to $2,999 | 225 (9.4%) | 0 (0.0%) |
| $3,000 or more | 33 (1.4%) | 0 (0.0%) |
| Total | 2,404 (100.0%) | 1,181 (100.0%) |
Physical Housing Characteristics in Pleasanton
Housing Structures in Pleasanton
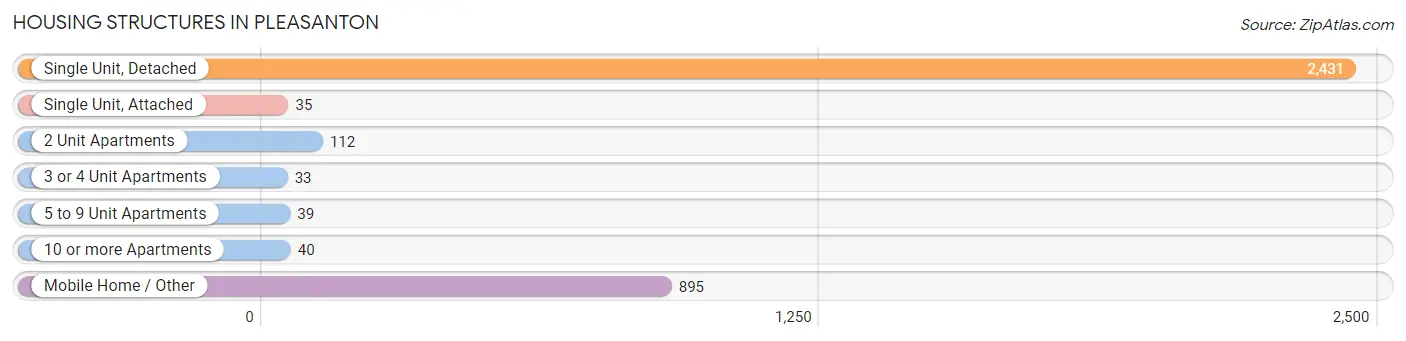
| Structure Type | # Housing Units | % Housing Units |
| Single Unit, Detached | 2,431 | 67.8% |
| Single Unit, Attached | 35 | 1.0% |
| 2 Unit Apartments | 112 | 3.1% |
| 3 or 4 Unit Apartments | 33 | 0.9% |
| 5 to 9 Unit Apartments | 39 | 1.1% |
| 10 or more Apartments | 40 | 1.1% |
| Mobile Home / Other | 895 | 25.0% |
| Total | 3,585 | 100.0% |
Housing Structures by Occupancy in Pleasanton
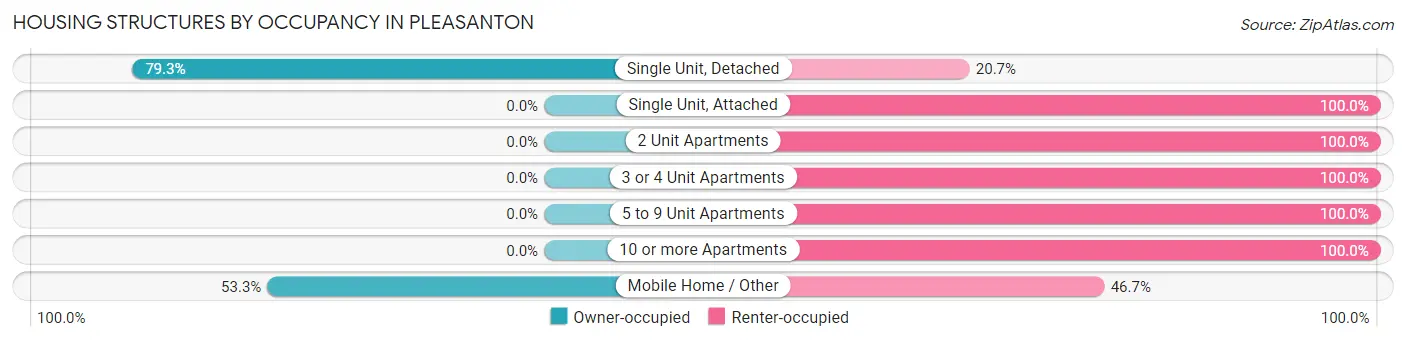
| Structure Type | Owner-occupied | Renter-occupied |
| Single Unit, Detached | 1,927 (79.3%) | 504 (20.7%) |
| Single Unit, Attached | 0 (0.0%) | 35 (100.0%) |
| 2 Unit Apartments | 0 (0.0%) | 112 (100.0%) |
| 3 or 4 Unit Apartments | 0 (0.0%) | 33 (100.0%) |
| 5 to 9 Unit Apartments | 0 (0.0%) | 39 (100.0%) |
| 10 or more Apartments | 0 (0.0%) | 40 (100.0%) |
| Mobile Home / Other | 477 (53.3%) | 418 (46.7%) |
| Total | 2,404 (67.1%) | 1,181 (32.9%) |
Housing Structures by Number of Rooms in Pleasanton
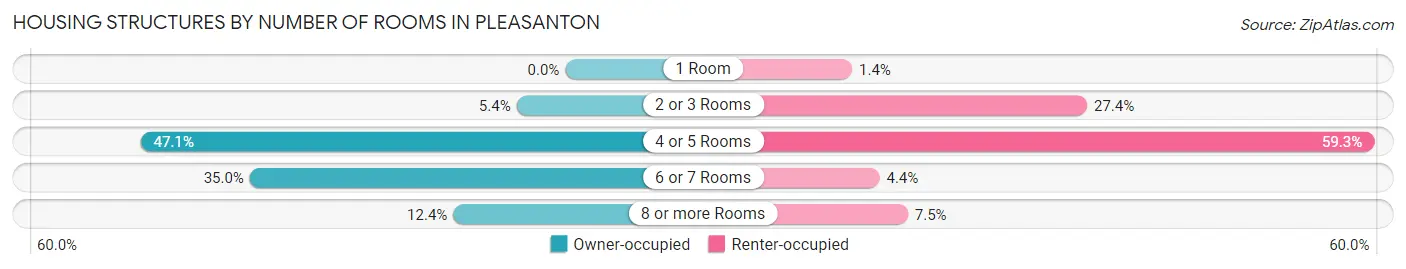
| Number of Rooms | Owner-occupied | Renter-occupied |
| 1 Room | 0 (0.0%) | 16 (1.3%) |
| 2 or 3 Rooms | 130 (5.4%) | 324 (27.4%) |
| 4 or 5 Rooms | 1,133 (47.1%) | 700 (59.3%) |
| 6 or 7 Rooms | 842 (35.0%) | 52 (4.4%) |
| 8 or more Rooms | 299 (12.4%) | 89 (7.5%) |
| Total | 2,404 (100.0%) | 1,181 (100.0%) |
Housing Structure by Heating Type in Pleasanton
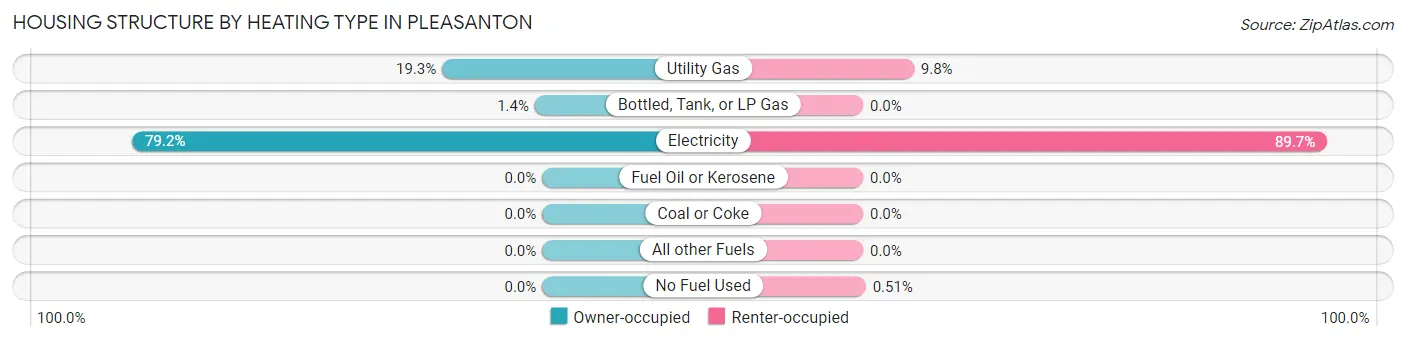
| Heating Type | Owner-occupied | Renter-occupied |
| Utility Gas | 465 (19.3%) | 116 (9.8%) |
| Bottled, Tank, or LP Gas | 34 (1.4%) | 0 (0.0%) |
| Electricity | 1,905 (79.2%) | 1,059 (89.7%) |
| Fuel Oil or Kerosene | 0 (0.0%) | 0 (0.0%) |
| Coal or Coke | 0 (0.0%) | 0 (0.0%) |
| All other Fuels | 0 (0.0%) | 0 (0.0%) |
| No Fuel Used | 0 (0.0%) | 6 (0.5%) |
| Total | 2,404 (100.0%) | 1,181 (100.0%) |
Household Vehicle Usage in Pleasanton
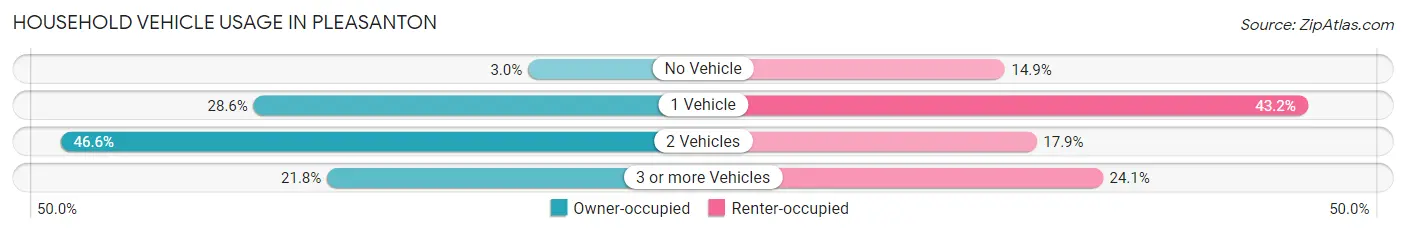
| Vehicles per Household | Owner-occupied | Renter-occupied |
| No Vehicle | 72 (3.0%) | 176 (14.9%) |
| 1 Vehicle | 688 (28.6%) | 510 (43.2%) |
| 2 Vehicles | 1,121 (46.6%) | 211 (17.9%) |
| 3 or more Vehicles | 523 (21.8%) | 284 (24.0%) |
| Total | 2,404 (100.0%) | 1,181 (100.0%) |
Real Estate & Mortgages in Pleasanton
Real Estate and Mortgage Overview in Pleasanton
| Characteristic | Without Mortgage | With Mortgage |
| Housing Units | 1,310 | 1,094 |
| Median Property Value | $160,000 | $194,400 |
| Median Household Income | - | - |
| Monthly Housing Costs | $559 | $13 |
| Real Estate Taxes | $2,463 | $41 |
Property Value by Mortgage Status in Pleasanton
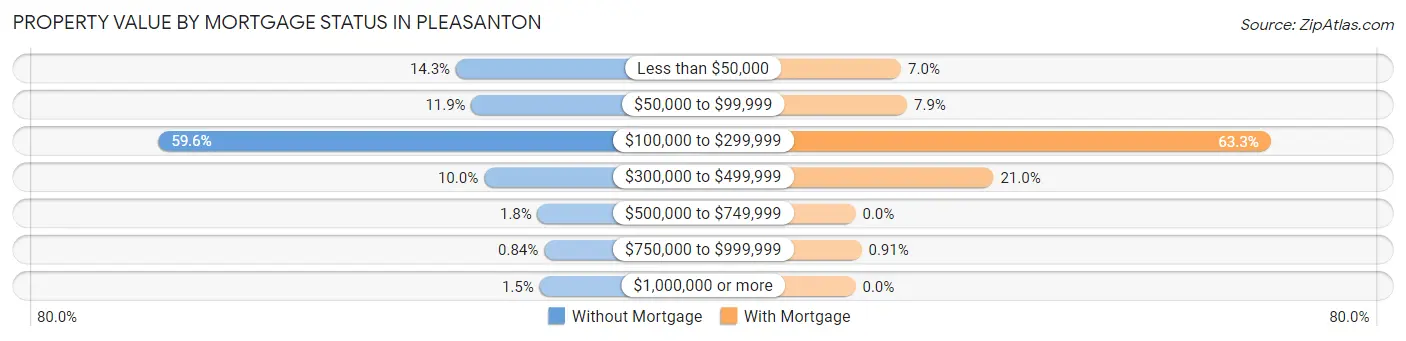
| Property Value | Without Mortgage | With Mortgage |
| Less than $50,000 | 187 (14.3%) | 76 (7.0%) |
| $50,000 to $99,999 | 156 (11.9%) | 86 (7.9%) |
| $100,000 to $299,999 | 781 (59.6%) | 692 (63.2%) |
| $300,000 to $499,999 | 131 (10.0%) | 230 (21.0%) |
| $500,000 to $749,999 | 24 (1.8%) | 0 (0.0%) |
| $750,000 to $999,999 | 11 (0.8%) | 10 (0.9%) |
| $1,000,000 or more | 20 (1.5%) | 0 (0.0%) |
| Total | 1,310 (100.0%) | 1,094 (100.0%) |
Household Income by Mortgage Status in Pleasanton
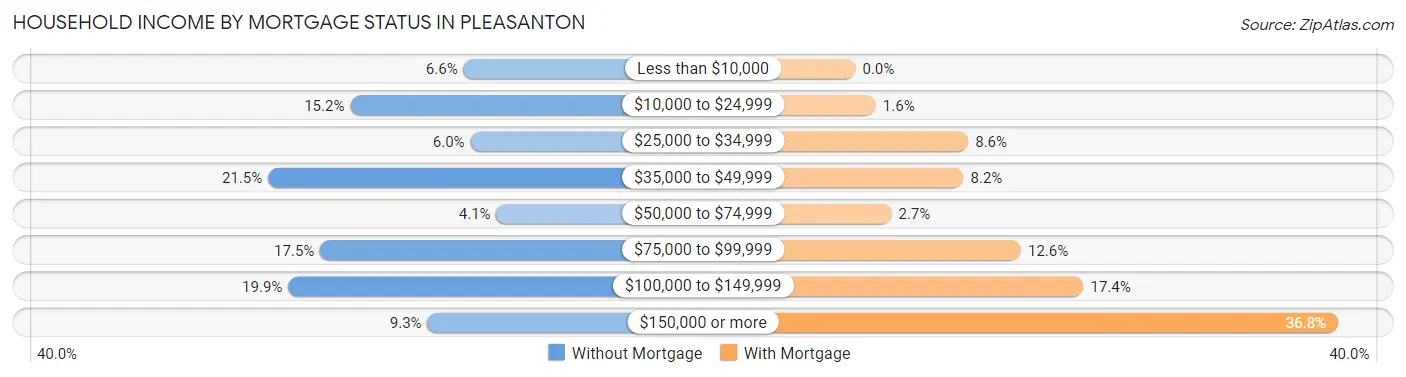
| Household Income | Without Mortgage | With Mortgage |
| Less than $10,000 | 86 (6.6%) | 0 (0.0%) |
| $10,000 to $24,999 | 199 (15.2%) | 17 (1.5%) |
| $25,000 to $34,999 | 79 (6.0%) | 94 (8.6%) |
| $35,000 to $49,999 | 281 (21.4%) | 90 (8.2%) |
| $50,000 to $74,999 | 53 (4.1%) | 30 (2.7%) |
| $75,000 to $99,999 | 229 (17.5%) | 138 (12.6%) |
| $100,000 to $149,999 | 261 (19.9%) | 190 (17.4%) |
| $150,000 or more | 122 (9.3%) | 402 (36.7%) |
| Total | 1,310 (100.0%) | 1,094 (100.0%) |
Property Value to Household Income Ratio in Pleasanton
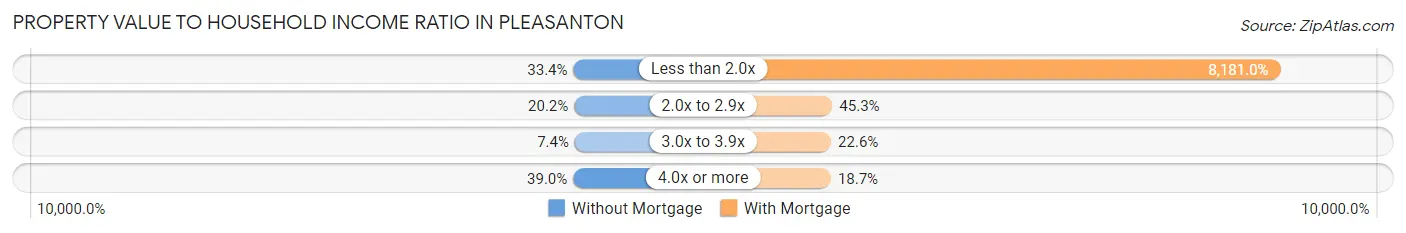
| Value-to-Income Ratio | Without Mortgage | With Mortgage |
| Less than 2.0x | 437 (33.4%) | 89,500 (8,181.0%) |
| 2.0x to 2.9x | 265 (20.2%) | 495 (45.3%) |
| 3.0x to 3.9x | 97 (7.4%) | 247 (22.6%) |
| 4.0x or more | 511 (39.0%) | 205 (18.7%) |
| Total | 1,310 (100.0%) | 1,094 (100.0%) |
Real Estate Taxes by Mortgage Status in Pleasanton
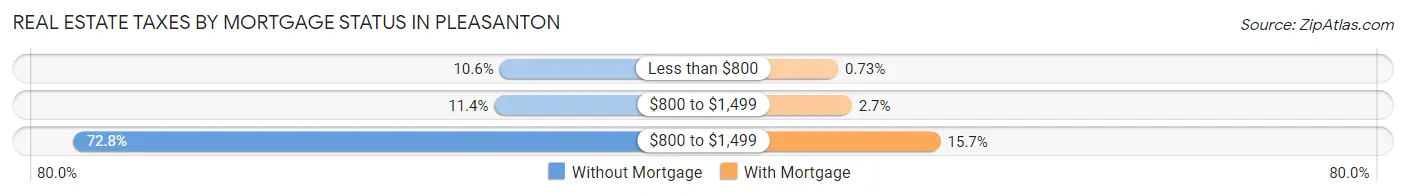
| Property Taxes | Without Mortgage | With Mortgage |
| Less than $800 | 139 (10.6%) | 8 (0.7%) |
| $800 to $1,499 | 149 (11.4%) | 30 (2.7%) |
| $800 to $1,499 | 954 (72.8%) | 172 (15.7%) |
| Total | 1,310 (100.0%) | 1,094 (100.0%) |
Health & Disability in Pleasanton
Health Insurance Coverage by Age in Pleasanton
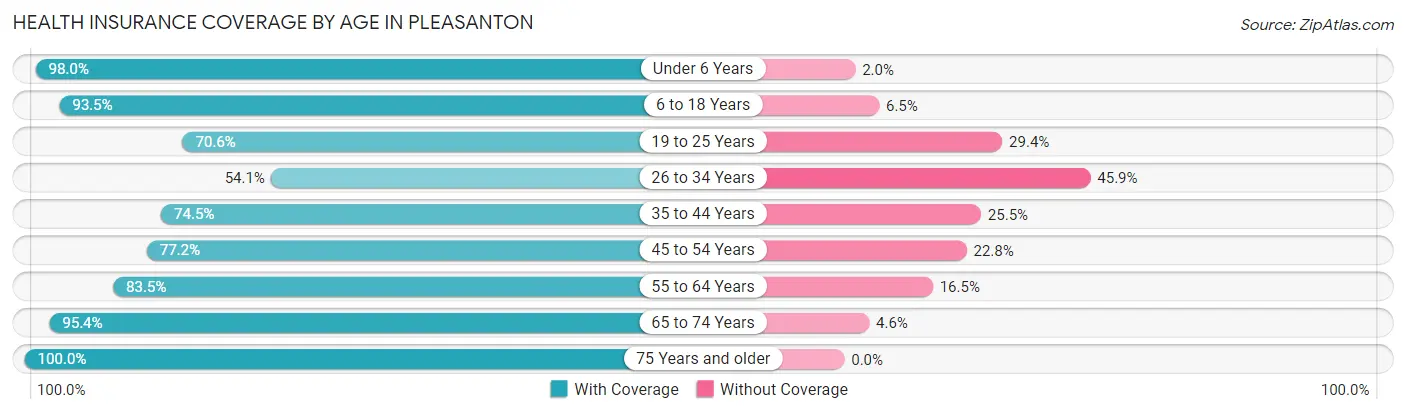
| Age Bracket | With Coverage | Without Coverage |
| Under 6 Years | 1,107 (98.0%) | 23 (2.0%) |
| 6 to 18 Years | 2,194 (93.5%) | 152 (6.5%) |
| 19 to 25 Years | 520 (70.6%) | 217 (29.4%) |
| 26 to 34 Years | 671 (54.1%) | 569 (45.9%) |
| 35 to 44 Years | 1,279 (74.5%) | 437 (25.5%) |
| 45 to 54 Years | 569 (77.2%) | 168 (22.8%) |
| 55 to 64 Years | 790 (83.5%) | 156 (16.5%) |
| 65 to 74 Years | 930 (95.4%) | 45 (4.6%) |
| 75 Years and older | 661 (100.0%) | 0 (0.0%) |
| Total | 8,721 (83.2%) | 1,767 (16.9%) |
Health Insurance Coverage by Citizenship Status in Pleasanton
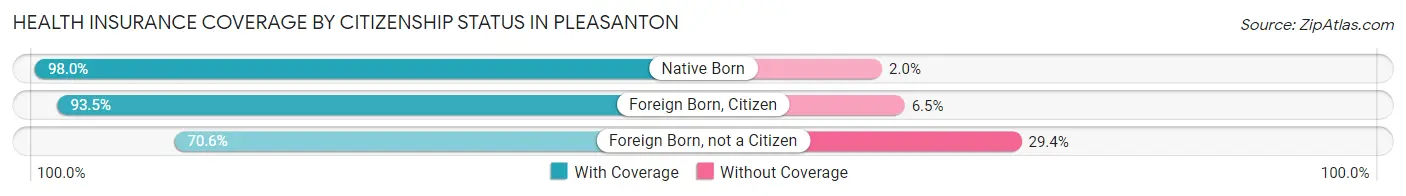
| Citizenship Status | With Coverage | Without Coverage |
| Native Born | 1,107 (98.0%) | 23 (2.0%) |
| Foreign Born, Citizen | 2,194 (93.5%) | 152 (6.5%) |
| Foreign Born, not a Citizen | 520 (70.6%) | 217 (29.4%) |
Health Insurance Coverage by Household Income in Pleasanton
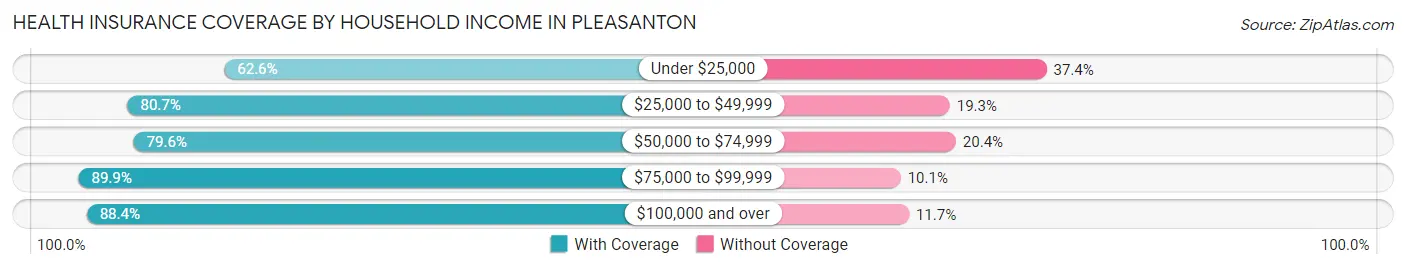
| Household Income | With Coverage | Without Coverage |
| Under $25,000 | 657 (62.6%) | 393 (37.4%) |
| $25,000 to $49,999 | 1,380 (80.7%) | 330 (19.3%) |
| $50,000 to $74,999 | 1,526 (79.6%) | 392 (20.4%) |
| $75,000 to $99,999 | 1,449 (89.9%) | 163 (10.1%) |
| $100,000 and over | 3,709 (88.3%) | 489 (11.7%) |
Public vs Private Health Insurance Coverage by Age in Pleasanton
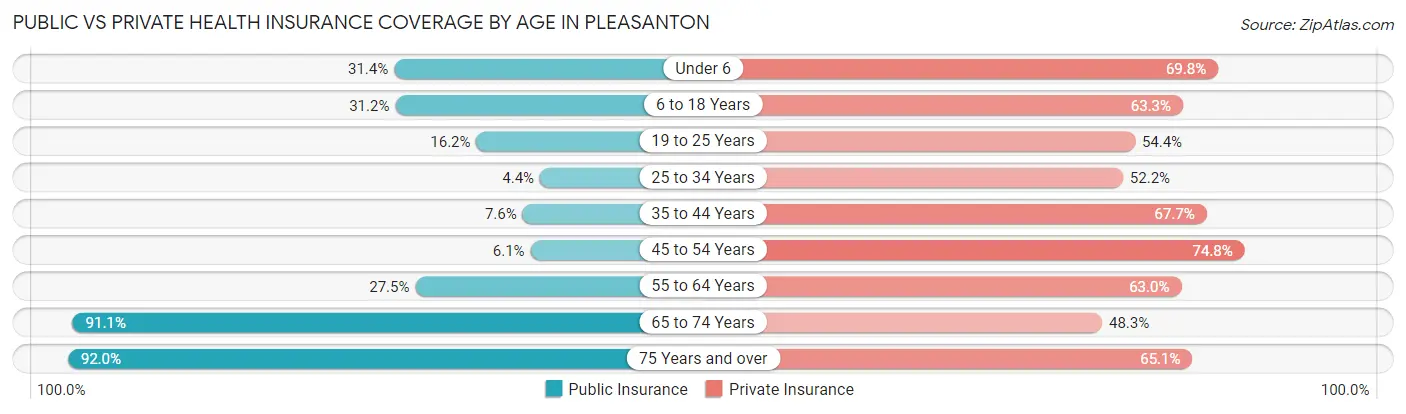
| Age Bracket | Public Insurance | Private Insurance |
| Under 6 | 355 (31.4%) | 789 (69.8%) |
| 6 to 18 Years | 732 (31.2%) | 1,485 (63.3%) |
| 19 to 25 Years | 119 (16.2%) | 401 (54.4%) |
| 25 to 34 Years | 54 (4.3%) | 647 (52.2%) |
| 35 to 44 Years | 130 (7.6%) | 1,162 (67.7%) |
| 45 to 54 Years | 45 (6.1%) | 551 (74.8%) |
| 55 to 64 Years | 260 (27.5%) | 596 (63.0%) |
| 65 to 74 Years | 888 (91.1%) | 471 (48.3%) |
| 75 Years and over | 608 (92.0%) | 430 (65.0%) |
| Total | 3,191 (30.4%) | 6,532 (62.3%) |
Disability Status by Sex by Age in Pleasanton
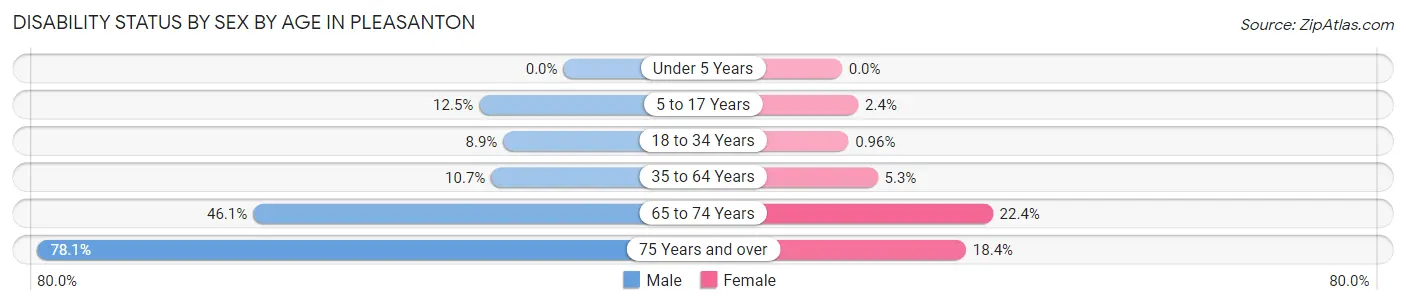
| Age Bracket | Male | Female |
| Under 5 Years | 0 (0.0%) | 0 (0.0%) |
| 5 to 17 Years | 171 (12.5%) | 27 (2.4%) |
| 18 to 34 Years | 93 (8.9%) | 10 (1.0%) |
| 35 to 64 Years | 181 (10.7%) | 91 (5.3%) |
| 65 to 74 Years | 153 (46.1%) | 144 (22.4%) |
| 75 Years and over | 228 (78.1%) | 68 (18.4%) |
Disability Class by Sex by Age in Pleasanton
Disability Class: Hearing Difficulty
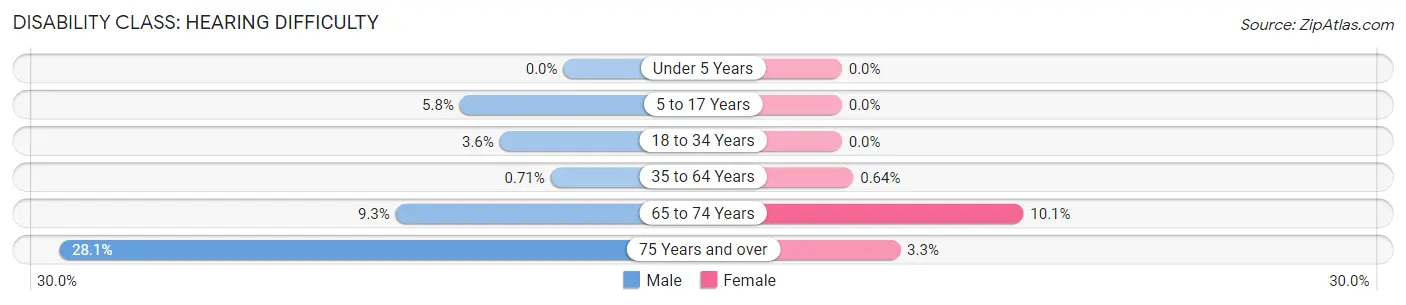
| Age Bracket | Male | Female |
| Under 5 Years | 0 (0.0%) | 0 (0.0%) |
| 5 to 17 Years | 79 (5.8%) | 0 (0.0%) |
| 18 to 34 Years | 37 (3.5%) | 0 (0.0%) |
| 35 to 64 Years | 12 (0.7%) | 11 (0.6%) |
| 65 to 74 Years | 31 (9.3%) | 65 (10.1%) |
| 75 Years and over | 82 (28.1%) | 12 (3.3%) |
Disability Class: Vision Difficulty
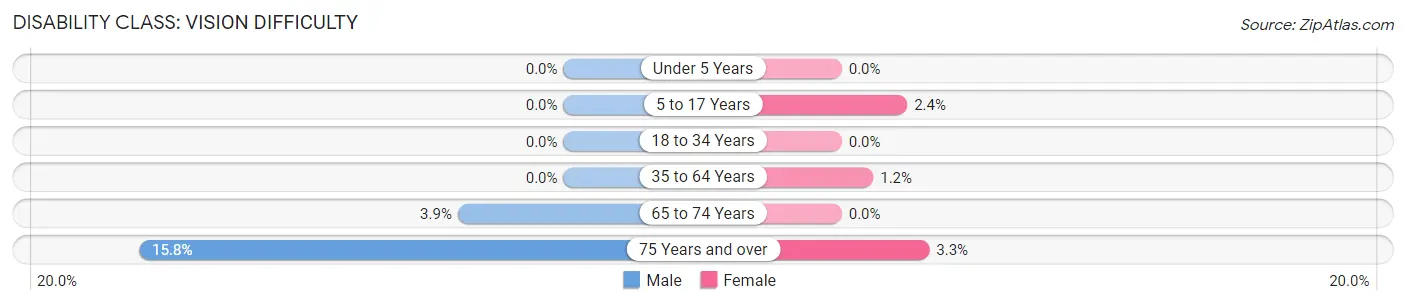
| Age Bracket | Male | Female |
| Under 5 Years | 0 (0.0%) | 0 (0.0%) |
| 5 to 17 Years | 0 (0.0%) | 27 (2.4%) |
| 18 to 34 Years | 0 (0.0%) | 0 (0.0%) |
| 35 to 64 Years | 0 (0.0%) | 20 (1.2%) |
| 65 to 74 Years | 13 (3.9%) | 0 (0.0%) |
| 75 Years and over | 46 (15.8%) | 12 (3.3%) |
Disability Class: Cognitive Difficulty
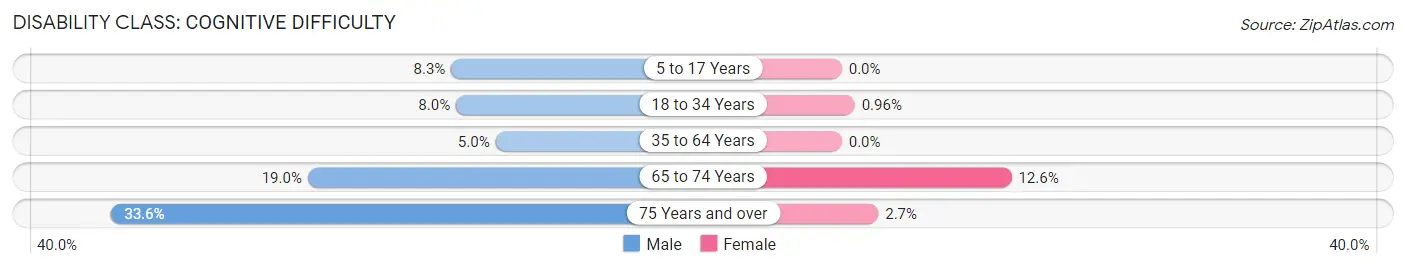
| Age Bracket | Male | Female |
| 5 to 17 Years | 114 (8.3%) | 0 (0.0%) |
| 18 to 34 Years | 83 (8.0%) | 10 (1.0%) |
| 35 to 64 Years | 85 (5.0%) | 0 (0.0%) |
| 65 to 74 Years | 63 (19.0%) | 81 (12.6%) |
| 75 Years and over | 98 (33.6%) | 10 (2.7%) |
Disability Class: Ambulatory Difficulty
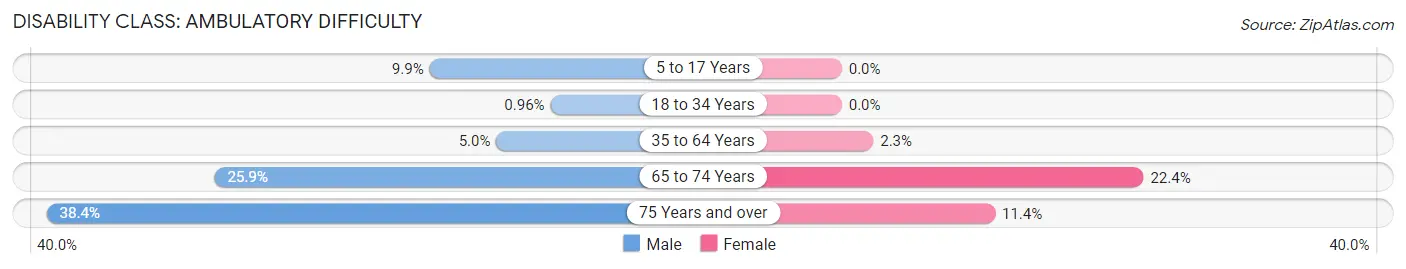
| Age Bracket | Male | Female |
| 5 to 17 Years | 136 (9.9%) | 0 (0.0%) |
| 18 to 34 Years | 10 (1.0%) | 0 (0.0%) |
| 35 to 64 Years | 84 (5.0%) | 40 (2.3%) |
| 65 to 74 Years | 86 (25.9%) | 144 (22.4%) |
| 75 Years and over | 112 (38.4%) | 42 (11.4%) |
Disability Class: Self-Care Difficulty
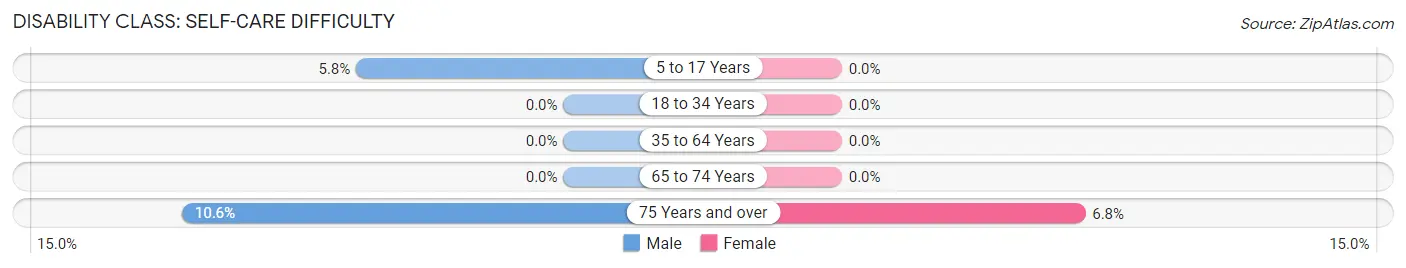
| Age Bracket | Male | Female |
| 5 to 17 Years | 79 (5.8%) | 0 (0.0%) |
| 18 to 34 Years | 0 (0.0%) | 0 (0.0%) |
| 35 to 64 Years | 0 (0.0%) | 0 (0.0%) |
| 65 to 74 Years | 0 (0.0%) | 0 (0.0%) |
| 75 Years and over | 31 (10.6%) | 25 (6.8%) |
Technology Access in Pleasanton
Computing Device Access in Pleasanton
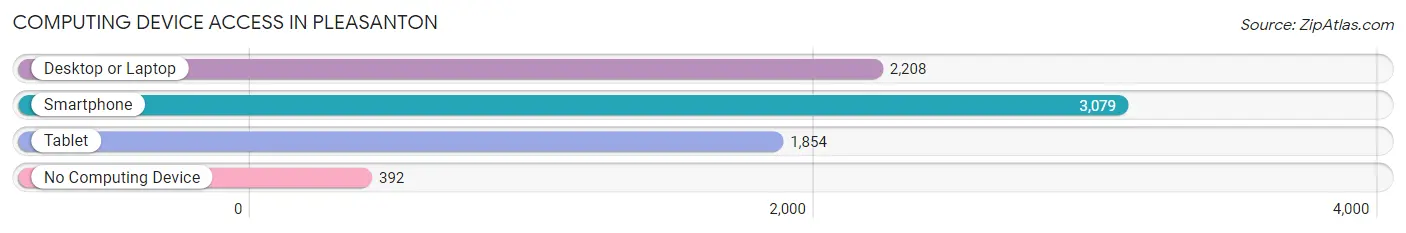
| Device Type | # Households | % Households |
| Desktop or Laptop | 2,208 | 61.6% |
| Smartphone | 3,079 | 85.9% |
| Tablet | 1,854 | 51.7% |
| No Computing Device | 392 | 10.9% |
| Total | 3,585 | 100.0% |
Internet Access in Pleasanton
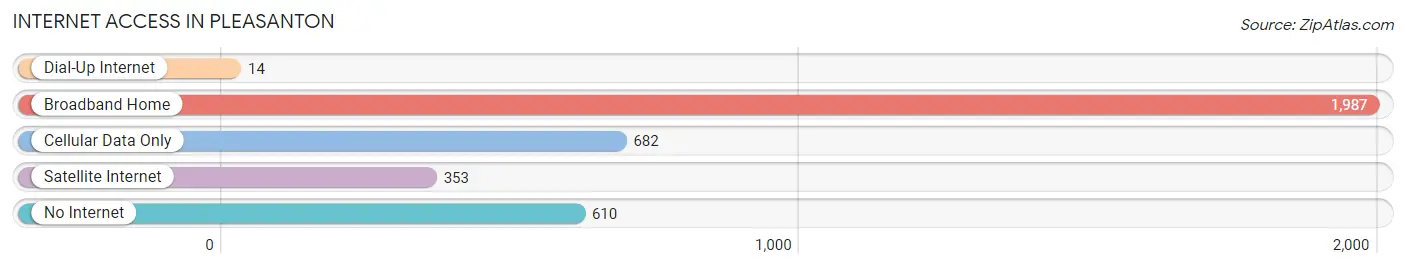
| Internet Type | # Households | % Households |
| Dial-Up Internet | 14 | 0.4% |
| Broadband Home | 1,987 | 55.4% |
| Cellular Data Only | 682 | 19.0% |
| Satellite Internet | 353 | 9.9% |
| No Internet | 610 | 17.0% |
| Total | 3,585 | 100.0% |
Pleasanton Summary
Pleasanton, Texas is a small city located in Atascosa County, Texas, United States. It is situated about 30 miles south of San Antonio and is part of the San Antonio–New Braunfels Metropolitan Statistical Area. The city has a population of 8,934 as of the 2010 census.
History
Pleasanton was founded in 1858 by a group of settlers from Pleasanton, Iowa. The town was named after the Iowa town, and the settlers brought with them the same name. The town was originally located on the banks of the Atascosa River, but was moved to its current location in 1872 due to flooding.
The town was incorporated in 1891 and has since grown to become the largest city in Atascosa County. The city has a rich history and is home to many historic sites, including the Pleasanton Heritage Museum, which houses artifacts from the town’s past.
Geography
Pleasanton is located at 28°59'25"N 98°25'17"W (28.990278, -98.421389). The city is situated in the South Texas Plains region of Texas, and is surrounded by rolling hills and prairies. The city is located about 30 miles south of San Antonio and is part of the San Antonio–New Braunfels Metropolitan Statistical Area.
The city has a total area of 5.2 square miles, all of which is land. The climate in Pleasanton is hot and humid in the summer and mild in the winter. The average temperature in the summer is around 90°F and the average temperature in the winter is around 60°F.
Economy
Pleasanton’s economy is largely based on agriculture and oil and gas production. The city is home to several large oil and gas companies, including Valero Energy Corporation, which is the largest employer in the city. Other major employers in the city include the Atascosa County Hospital, the Atascosa County Sheriff’s Office, and the Pleasanton Independent School District.
The city also has a thriving retail sector, with several large shopping centers and retail stores. The city is also home to several restaurants, bars, and other entertainment venues.
Demographics
As of the 2010 census, the population of Pleasanton was 8,934. The racial makeup of the city was 79.3% White, 0.7% African American, 0.4% Native American, 0.3% Asian, 0.1% Pacific Islander, 16.7% from other races, and 2.5% from two or more races. Hispanic or Latino of any race were 44.2% of the population.
The median income for a household in the city was $37,917, and the median income for a family was $45,917. The per capita income for the city was $17,917. About 17.3% of families and 21.2% of the population were below the poverty line, including 28.3% of those under age 18 and 16.2% of those age 65 or over.
Pleasanton is a small city with a rich history and a diverse population. The city’s economy is largely based on agriculture and oil and gas production, and the city is home to several large employers. The city also has a thriving retail sector and is home to several restaurants, bars, and other entertainment venues.
Common Questions
What is Per Capita Income in Pleasanton?
Per Capita income in Pleasanton is $27,046.
What is the Median Family Income in Pleasanton?
Median Family Income in Pleasanton is $83,646.
What is the Median Household income in Pleasanton?
Median Household Income in Pleasanton is $70,685.
What is Income or Wage Gap in Pleasanton?
Income or Wage Gap in Pleasanton is 33.1%.
Women in Pleasanton earn 66.9 cents for every dollar earned by a man.
What is Inequality or Gini Index in Pleasanton?
Inequality or Gini Index in Pleasanton is 0.42.
What is the Total Population of Pleasanton?
Total Population of Pleasanton is 10,706.
What is the Total Male Population of Pleasanton?
Total Male Population of Pleasanton is 5,104.
What is the Total Female Population of Pleasanton?
Total Female Population of Pleasanton is 5,602.
What is the Ratio of Males per 100 Females in Pleasanton?
There are 91.11 Males per 100 Females in Pleasanton.
What is the Ratio of Females per 100 Males in Pleasanton?
There are 109.76 Females per 100 Males in Pleasanton.
What is the Median Population Age in Pleasanton?
Median Population Age in Pleasanton is 34.5 Years.
What is the Average Family Size in Pleasanton
Average Family Size in Pleasanton is 3.6 People.
What is the Average Household Size in Pleasanton
Average Household Size in Pleasanton is 2.9 People.
How Large is the Labor Force in Pleasanton?
There are 4,576 People in the Labor Forcein in Pleasanton.
What is the Percentage of People in the Labor Force in Pleasanton?
58.9% of People are in the Labor Force in Pleasanton.
What is the Unemployment Rate in Pleasanton?
Unemployment Rate in Pleasanton is 4.5%.