Plains, TX Map & Demographics
Plains Map
Plains Overview
$30,864
PER CAPITA INCOME
$75,000
AVG FAMILY INCOME
$71,776
AVG HOUSEHOLD INCOME
57.8%
WAGE / INCOME GAP [ % ]
42.2¢/ $1
WAGE / INCOME GAP [ $ ]
0.33
INEQUALITY / GINI INDEX
1,066
TOTAL POPULATION
505
MALE POPULATION
561
FEMALE POPULATION
90.02
MALES / 100 FEMALES
111.09
FEMALES / 100 MALES
31.3
MEDIAN AGE
3.0
AVG FAMILY SIZE
2.8
AVG HOUSEHOLD SIZE
533
LABOR FORCE [ PEOPLE ]
71.1%
PERCENT IN LABOR FORCE
5.8%
UNEMPLOYMENT RATE
Plains Zip Codes
Plains Area Codes
Income in Plains
Income Overview in Plains
Per Capita Income in Plains is $30,864, while median incomes of families and households are $75,000 and $71,776 respectively.
| Characteristic | Number | Measure |
| Per Capita Income | 1,066 | $30,864 |
| Median Family Income | 318 | $75,000 |
| Mean Family Income | 318 | $88,647 |
| Median Household Income | 387 | $71,776 |
| Mean Household Income | 387 | $84,117 |
| Income Deficit | 318 | $0 |
| Wage / Income Gap (%) | 1,066 | 57.81% |
| Wage / Income Gap ($) | 1,066 | 42.19¢ per $1 |
| Gini / Inequality Index | 1,066 | 0.33 |
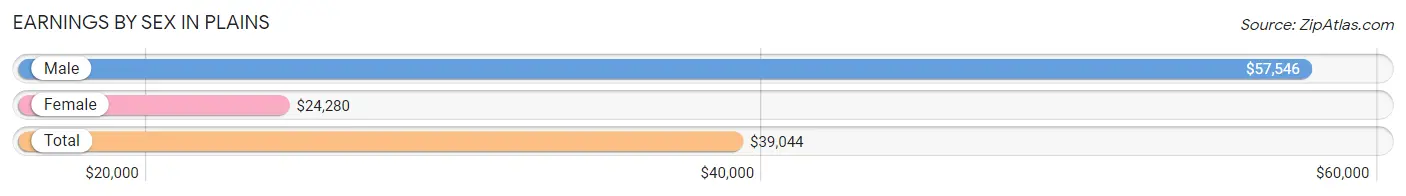
Earnings by Sex in Plains
Average Earnings in Plains are $39,044, $57,546 for men and $24,280 for women, a difference of 57.8%.
| Sex | Number | Average Earnings |
| Male | 327 (59.9%) | $57,546 |
| Female | 219 (40.1%) | $24,280 |
| Total | 546 (100.0%) | $39,044 |
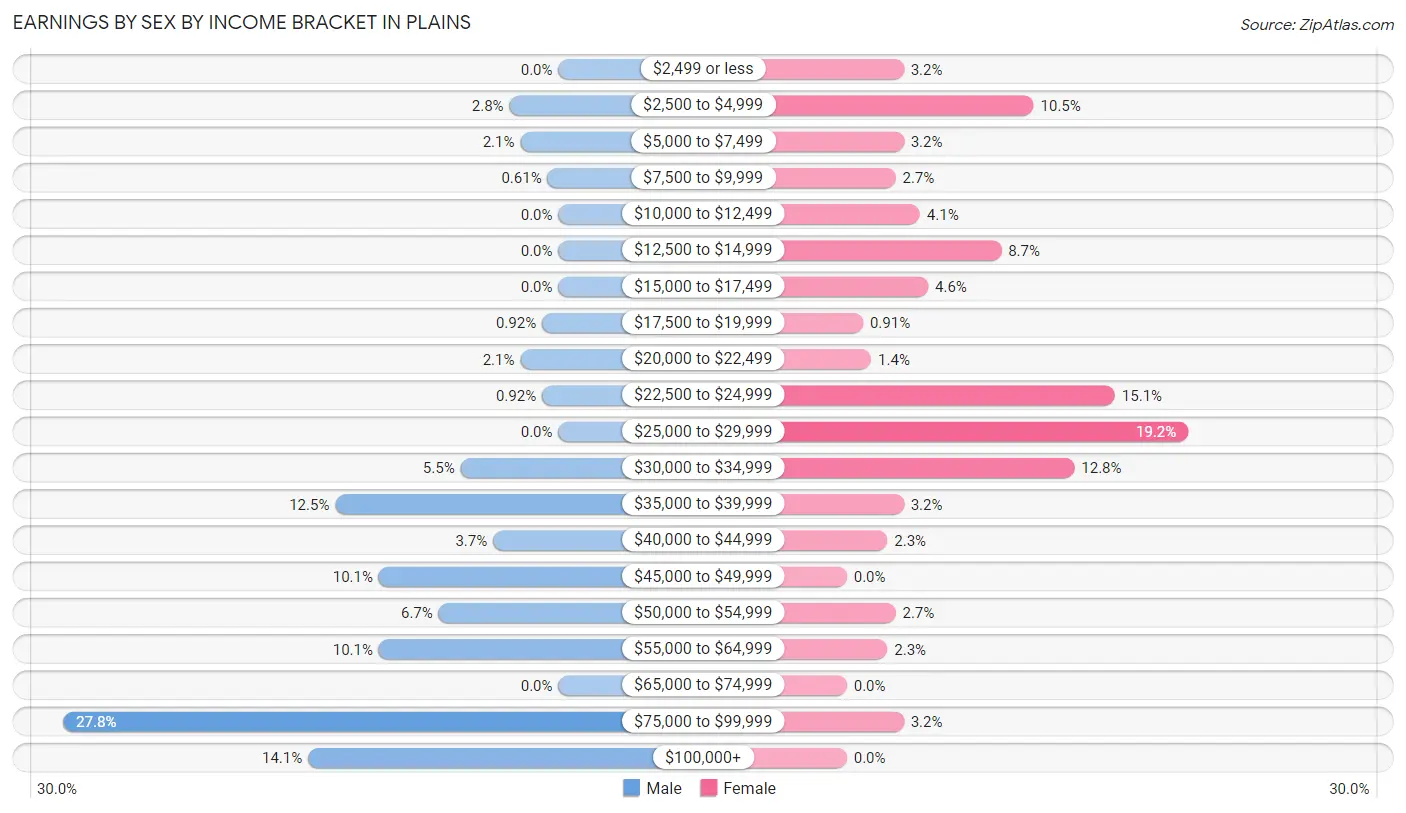
Earnings by Sex by Income Bracket in Plains
The most common earnings brackets in Plains are $75,000 to $99,999 for men (91 | 27.8%) and $25,000 to $29,999 for women (42 | 19.2%).
| Income | Male | Female |
| $2,499 or less | 0 (0.0%) | 7 (3.2%) |
| $2,500 to $4,999 | 9 (2.8%) | 23 (10.5%) |
| $5,000 to $7,499 | 7 (2.1%) | 7 (3.2%) |
| $7,500 to $9,999 | 2 (0.6%) | 6 (2.7%) |
| $10,000 to $12,499 | 0 (0.0%) | 9 (4.1%) |
| $12,500 to $14,999 | 0 (0.0%) | 19 (8.7%) |
| $15,000 to $17,499 | 0 (0.0%) | 10 (4.6%) |
| $17,500 to $19,999 | 3 (0.9%) | 2 (0.9%) |
| $20,000 to $22,499 | 7 (2.1%) | 3 (1.4%) |
| $22,500 to $24,999 | 3 (0.9%) | 33 (15.1%) |
| $25,000 to $29,999 | 0 (0.0%) | 42 (19.2%) |
| $30,000 to $34,999 | 18 (5.5%) | 28 (12.8%) |
| $35,000 to $39,999 | 41 (12.5%) | 7 (3.2%) |
| $40,000 to $44,999 | 12 (3.7%) | 5 (2.3%) |
| $45,000 to $49,999 | 33 (10.1%) | 0 (0.0%) |
| $50,000 to $54,999 | 22 (6.7%) | 6 (2.7%) |
| $55,000 to $64,999 | 33 (10.1%) | 5 (2.3%) |
| $65,000 to $74,999 | 0 (0.0%) | 0 (0.0%) |
| $75,000 to $99,999 | 91 (27.8%) | 7 (3.2%) |
| $100,000+ | 46 (14.1%) | 0 (0.0%) |
| Total | 327 (100.0%) | 219 (100.0%) |
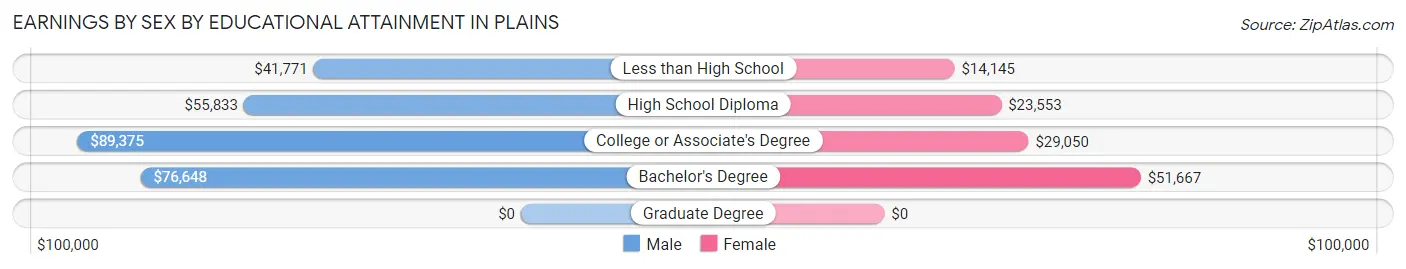
Earnings by Sex by Educational Attainment in Plains
Average earnings in Plains are $58,519 for men and $25,000 for women, a difference of 57.3%. Men with an educational attainment of college or associate's degree enjoy the highest average annual earnings of $89,375, while those with less than high school education earn the least with $41,771. Women with an educational attainment of bachelor's degree earn the most with the average annual earnings of $51,667, while those with less than high school education have the smallest earnings of $14,145.
| Educational Attainment | Male Income | Female Income |
| Less than High School | $41,771 | $14,145 |
| High School Diploma | $55,833 | $23,553 |
| College or Associate's Degree | $89,375 | $29,050 |
| Bachelor's Degree | $76,648 | $51,667 |
| Graduate Degree | - | - |
| Total | $58,519 | $25,000 |
Family Income in Plains
Family Income Brackets in Plains
According to the Plains family income data, there are 85 families falling into the $50,000 to $74,999 income range, which is the most common income bracket and makes up 26.7% of all families.
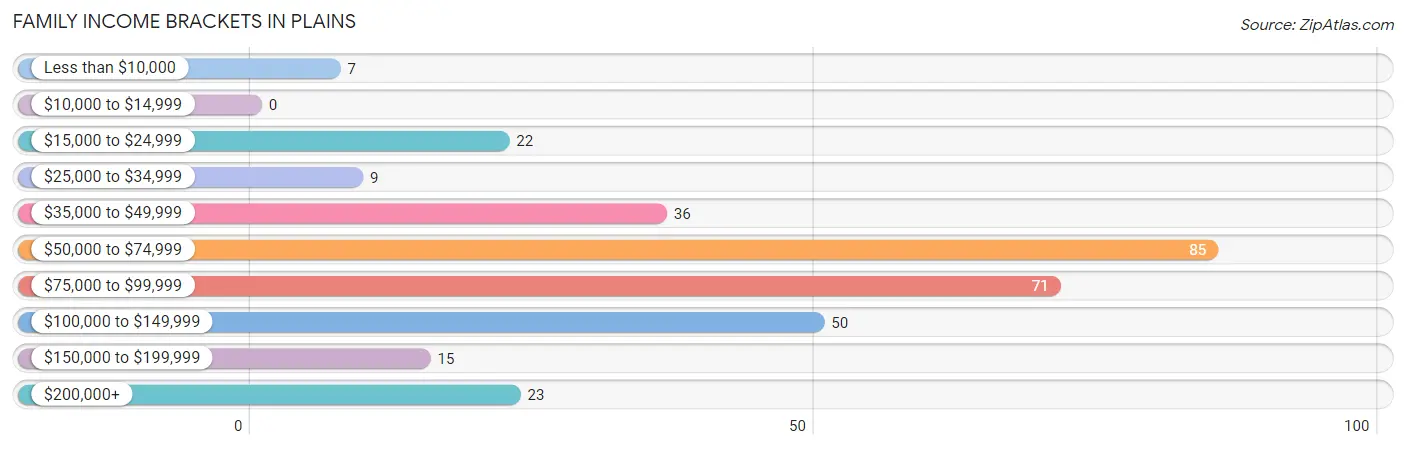
| Income Bracket | # Families | % Families |
| Less than $10,000 | 7 | 2.2% |
| $10,000 to $14,999 | 0 | 0.0% |
| $15,000 to $24,999 | 22 | 6.9% |
| $25,000 to $34,999 | 9 | 2.8% |
| $35,000 to $49,999 | 36 | 11.3% |
| $50,000 to $74,999 | 85 | 26.7% |
| $75,000 to $99,999 | 71 | 22.3% |
| $100,000 to $149,999 | 50 | 15.7% |
| $150,000 to $199,999 | 15 | 4.7% |
| $200,000+ | 23 | 7.2% |
Family Income by Famaliy Size in Plains
3-person families (65 | 20.4%) account for the highest median family income in Plains with $78,958 per family, while 2-person families (127 | 39.9%) have the highest median income of $39,271 per family member.
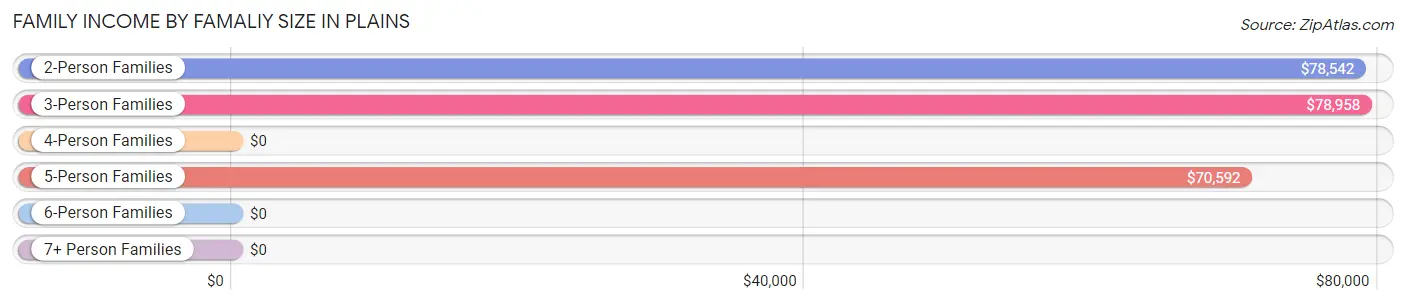
| Income Bracket | # Families | Median Income |
| 2-Person Families | 127 (39.9%) | $78,542 |
| 3-Person Families | 65 (20.4%) | $78,958 |
| 4-Person Families | 65 (20.4%) | $0 |
| 5-Person Families | 47 (14.8%) | $70,592 |
| 6-Person Families | 14 (4.4%) | $0 |
| 7+ Person Families | 0 (0.0%) | $0 |
| Total | 318 (100.0%) | $75,000 |
Family Income by Number of Earners in Plains
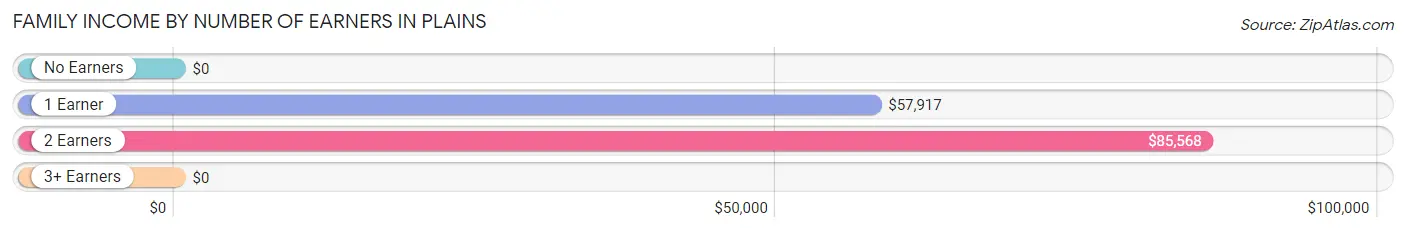
| Number of Earners | # Families | Median Income |
| No Earners | 6 (1.9%) | $0 |
| 1 Earner | 162 (50.9%) | $57,917 |
| 2 Earners | 109 (34.3%) | $85,568 |
| 3+ Earners | 41 (12.9%) | $0 |
| Total | 318 (100.0%) | $75,000 |
Household Income in Plains
Household Income Brackets in Plains
With 120 households falling in the category, the $50,000 to $74,999 income range is the most frequent in Plains, accounting for 31.0% of all households. In contrast, only 4 households (1.0%) fall into the $25,000 to $34,999 income bracket, making it the least populous group.
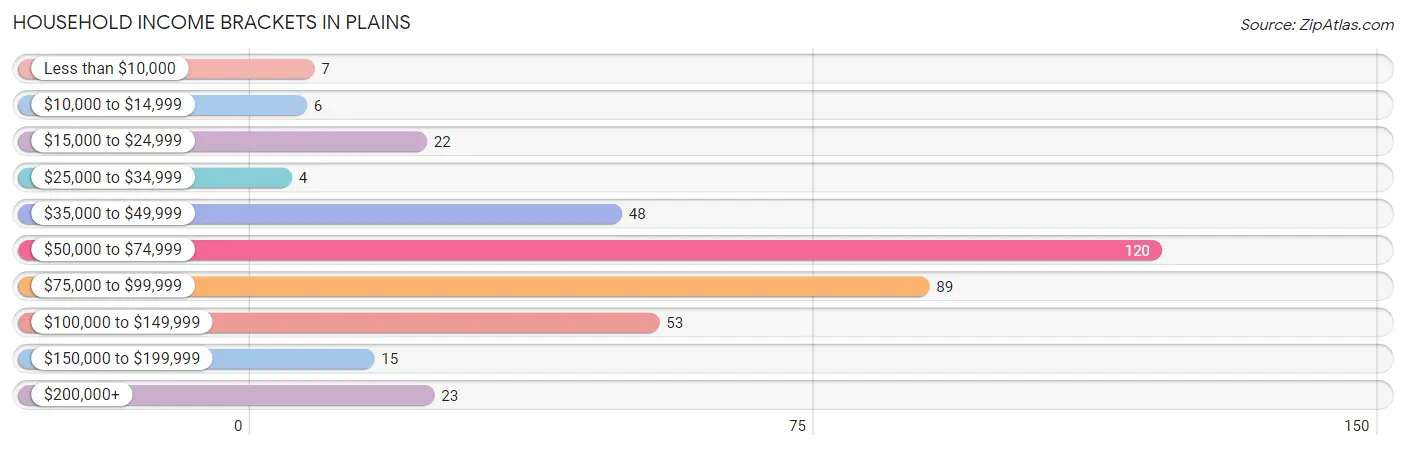
| Income Bracket | # Households | % Households |
| Less than $10,000 | 7 | 1.8% |
| $10,000 to $14,999 | 6 | 1.6% |
| $15,000 to $24,999 | 22 | 5.7% |
| $25,000 to $34,999 | 4 | 1.0% |
| $35,000 to $49,999 | 48 | 12.4% |
| $50,000 to $74,999 | 120 | 31.0% |
| $75,000 to $99,999 | 89 | 23.0% |
| $100,000 to $149,999 | 53 | 13.7% |
| $150,000 to $199,999 | 15 | 3.9% |
| $200,000+ | 23 | 5.9% |
Household Income by Householder Age in Plains
The median household income in Plains is $71,776, with the highest median household income of $79,545 found in the 45 to 64 years age bracket for the primary householder. A total of 120 households (31.0%) fall into this category. Meanwhile, the 15 to 24 years age bracket for the primary householder has the lowest median household income of $0, with 7 households (1.8%) in this group.
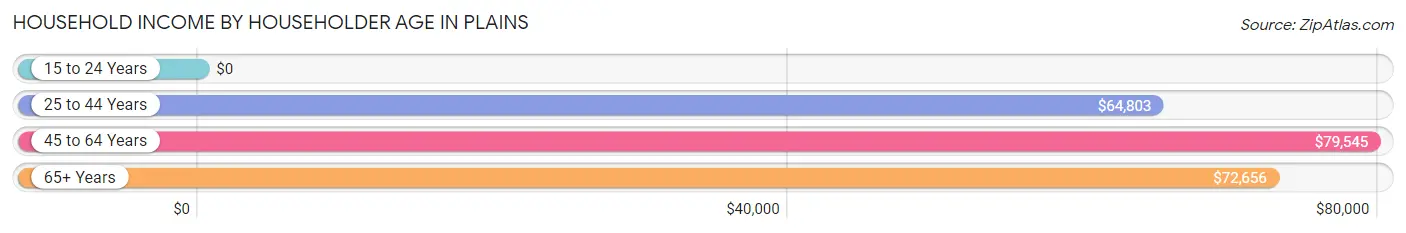
| Income Bracket | # Households | Median Income |
| 15 to 24 Years | 7 (1.8%) | $0 |
| 25 to 44 Years | 161 (41.6%) | $64,803 |
| 45 to 64 Years | 120 (31.0%) | $79,545 |
| 65+ Years | 99 (25.6%) | $72,656 |
| Total | 387 (100.0%) | $71,776 |
Poverty in Plains
Income Below Poverty by Sex and Age in Plains
With 13.3% poverty level for males and 14.4% for females among the residents of Plains, 6 to 11 year old males and under 5 year old females are the most vulnerable to poverty, with 12 males (100.0%) and 25 females (32.9%) in their respective age groups living below the poverty level.
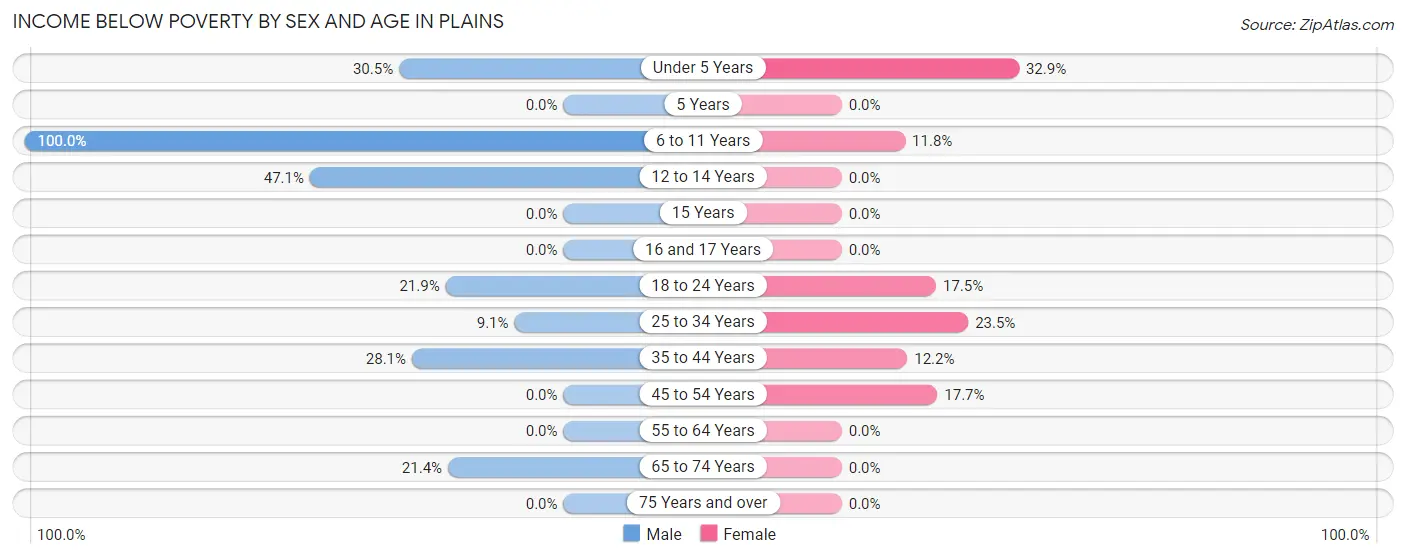
| Age Bracket | Male | Female |
| Under 5 Years | 18 (30.5%) | 25 (32.9%) |
| 5 Years | 0 (0.0%) | 0 (0.0%) |
| 6 to 11 Years | 12 (100.0%) | 10 (11.8%) |
| 12 to 14 Years | 8 (47.1%) | 0 (0.0%) |
| 15 Years | 0 (0.0%) | 0 (0.0%) |
| 16 and 17 Years | 0 (0.0%) | 0 (0.0%) |
| 18 to 24 Years | 7 (21.9%) | 7 (17.5%) |
| 25 to 34 Years | 7 (9.1%) | 19 (23.5%) |
| 35 to 44 Years | 9 (28.1%) | 9 (12.2%) |
| 45 to 54 Years | 0 (0.0%) | 11 (17.7%) |
| 55 to 64 Years | 0 (0.0%) | 0 (0.0%) |
| 65 to 74 Years | 6 (21.4%) | 0 (0.0%) |
| 75 Years and over | 0 (0.0%) | 0 (0.0%) |
| Total | 67 (13.3%) | 81 (14.4%) |
Income Above Poverty by Sex and Age in Plains
According to the poverty statistics in Plains, males aged 5 years and females aged 5 years are the age groups that are most secure financially, with 100.0% of males and 100.0% of females in these age groups living above the poverty line.
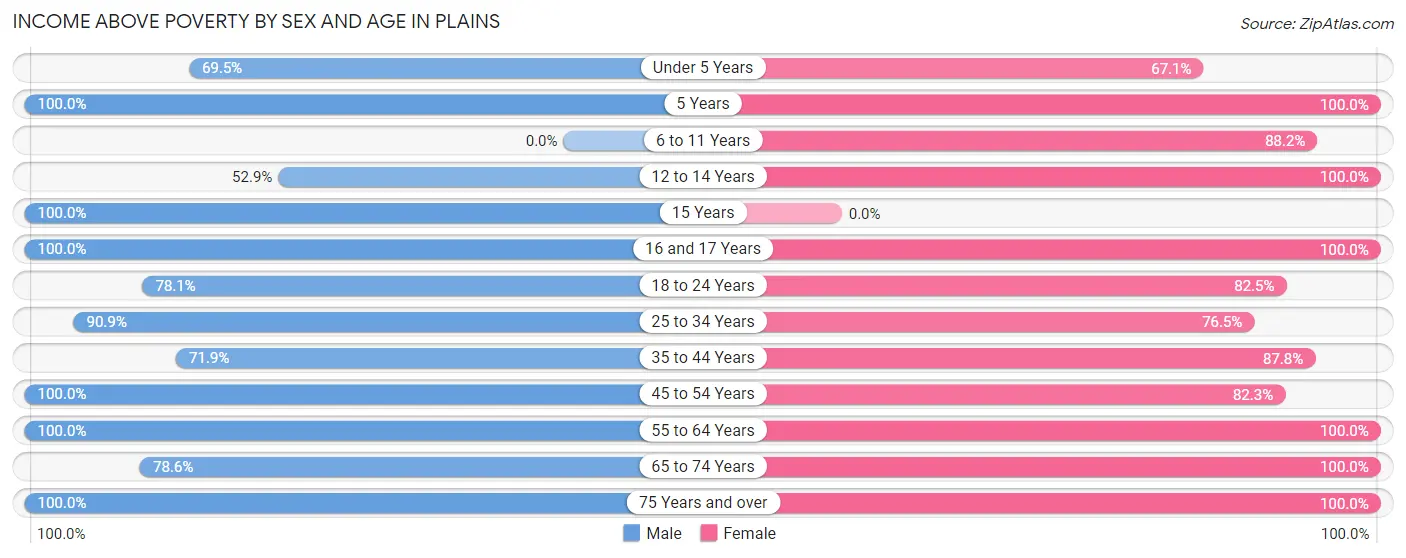
| Age Bracket | Male | Female |
| Under 5 Years | 41 (69.5%) | 51 (67.1%) |
| 5 Years | 8 (100.0%) | 16 (100.0%) |
| 6 to 11 Years | 0 (0.0%) | 75 (88.2%) |
| 12 to 14 Years | 9 (52.9%) | 23 (100.0%) |
| 15 Years | 20 (100.0%) | 0 (0.0%) |
| 16 and 17 Years | 16 (100.0%) | 8 (100.0%) |
| 18 to 24 Years | 25 (78.1%) | 33 (82.5%) |
| 25 to 34 Years | 70 (90.9%) | 62 (76.5%) |
| 35 to 44 Years | 23 (71.9%) | 65 (87.8%) |
| 45 to 54 Years | 93 (100.0%) | 51 (82.3%) |
| 55 to 64 Years | 86 (100.0%) | 17 (100.0%) |
| 65 to 74 Years | 22 (78.6%) | 48 (100.0%) |
| 75 Years and over | 25 (100.0%) | 31 (100.0%) |
| Total | 438 (86.7%) | 480 (85.6%) |
Income Below Poverty Among Married-Couple Families in Plains
The poverty statistics for married-couple families in Plains show that 6.6% or 16 of the total 242 families live below the poverty line. Families with 1 or 2 children have the highest poverty rate of 18.2%, comprising of 16 families. On the other hand, families with no children have the lowest poverty rate of 0.0%, which includes 0 families.
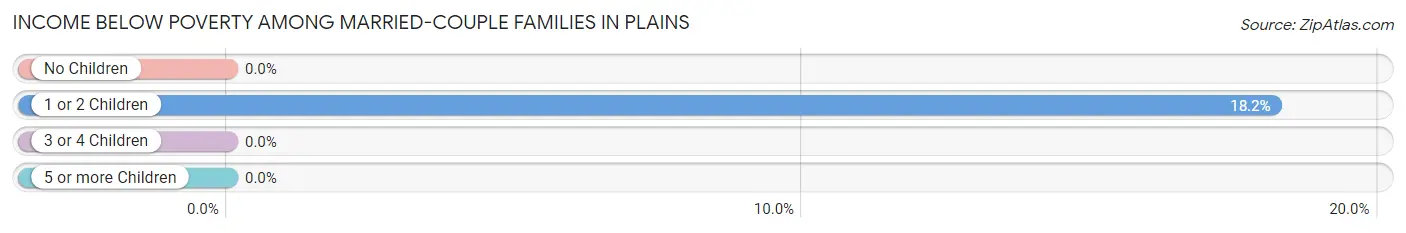
| Children | Above Poverty | Below Poverty |
| No Children | 126 (100.0%) | 0 (0.0%) |
| 1 or 2 Children | 72 (81.8%) | 16 (18.2%) |
| 3 or 4 Children | 28 (100.0%) | 0 (0.0%) |
| 5 or more Children | 0 (0.0%) | 0 (0.0%) |
| Total | 226 (93.4%) | 16 (6.6%) |
Income Below Poverty Among Single-Parent Households in Plains
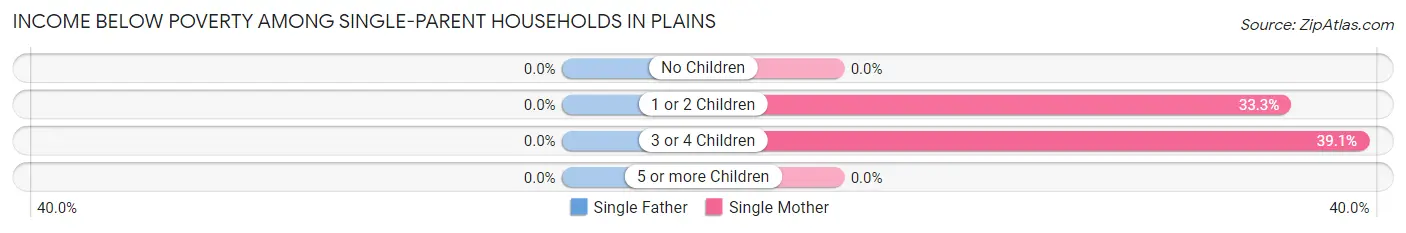
| Children | Single Father | Single Mother |
| No Children | 0 (0.0%) | 0 (0.0%) |
| 1 or 2 Children | 0 (0.0%) | 10 (33.3%) |
| 3 or 4 Children | 0 (0.0%) | 9 (39.1%) |
| 5 or more Children | 0 (0.0%) | 0 (0.0%) |
| Total | 0 (0.0%) | 19 (32.8%) |
Income Below Poverty Among Married-Couple vs Single-Parent Households in Plains
The poverty data for Plains shows that 16 of the married-couple family households (6.6%) and 19 of the single-parent households (25.0%) are living below the poverty level. Within the married-couple family households, those with 1 or 2 children have the highest poverty rate, with 16 households (18.2%) falling below the poverty line. Among the single-parent households, those with 3 or 4 children have the highest poverty rate, with 9 household (39.1%) living below poverty.
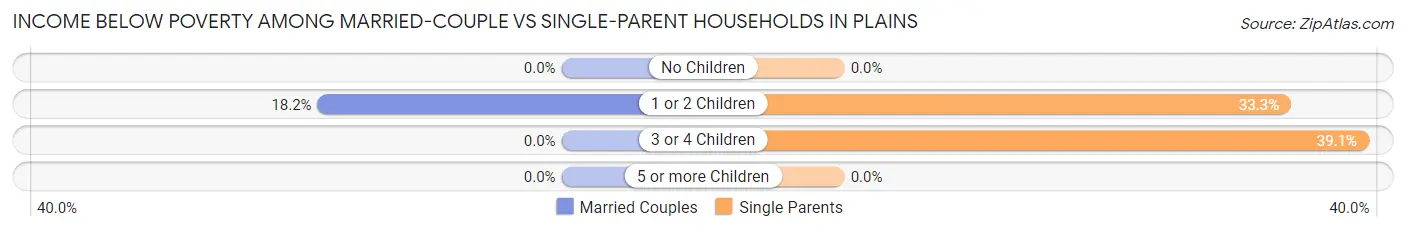
| Children | Married-Couple Families | Single-Parent Households |
| No Children | 0 (0.0%) | 0 (0.0%) |
| 1 or 2 Children | 16 (18.2%) | 10 (33.3%) |
| 3 or 4 Children | 0 (0.0%) | 9 (39.1%) |
| 5 or more Children | 0 (0.0%) | 0 (0.0%) |
| Total | 16 (6.6%) | 19 (25.0%) |
Race in Plains
The most populous races in Plains are White / Caucasian (652 | 61.2%), Hispanic or Latino (625 | 58.6%), and Two or more Races (323 | 30.3%).
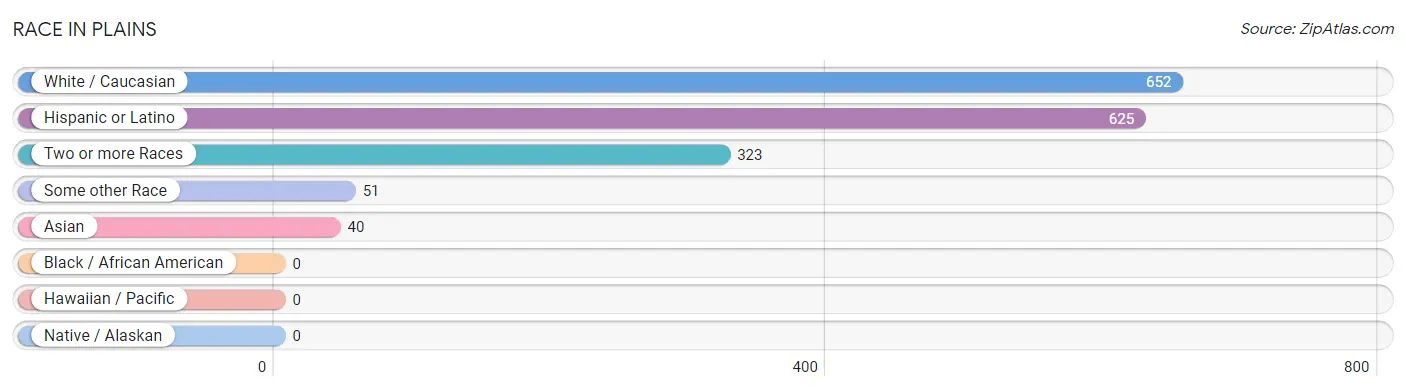
| Race | # Population | % Population |
| Asian | 40 | 3.7% |
| Black / African American | 0 | 0.0% |
| Hawaiian / Pacific | 0 | 0.0% |
| Hispanic or Latino | 625 | 58.6% |
| Native / Alaskan | 0 | 0.0% |
| White / Caucasian | 652 | 61.2% |
| Two or more Races | 323 | 30.3% |
| Some other Race | 51 | 4.8% |
| Total | 1,066 | 100.0% |
Ancestry in Plains
The most populous ancestries reported in Plains are Mexican (625 | 58.6%), English (102 | 9.6%), German (37 | 3.5%), American (34 | 3.2%), and African (33 | 3.1%), together accounting for 78.0% of all Plains residents.
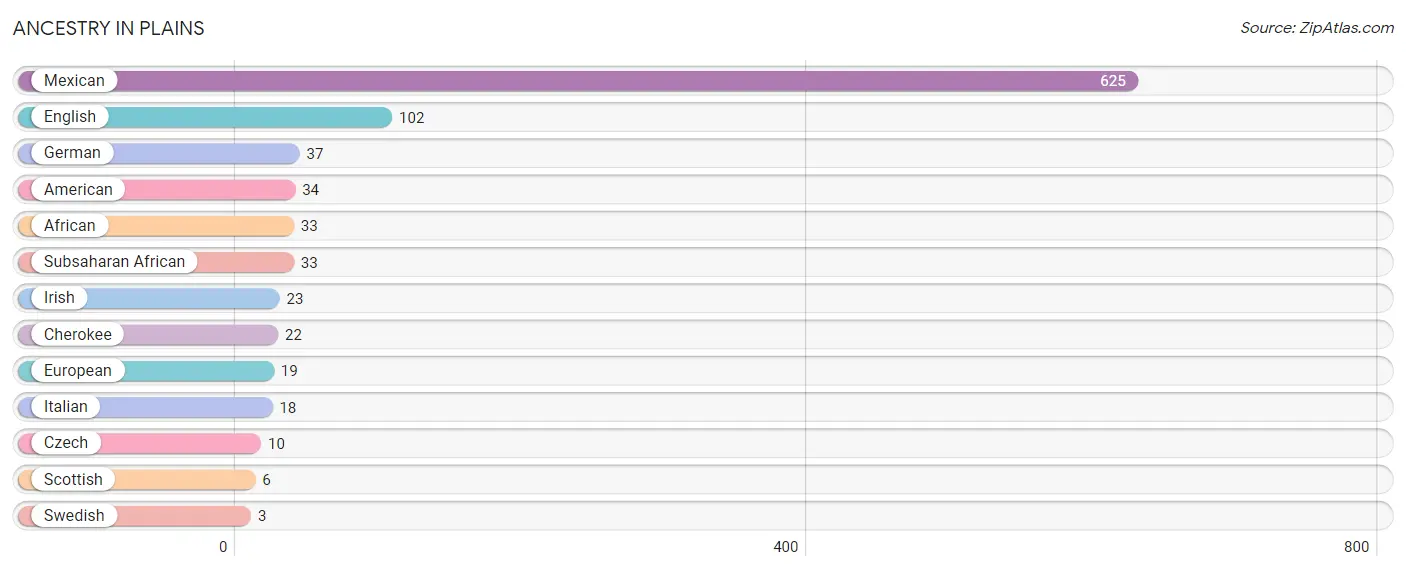
| Ancestry | # Population | % Population |
| African | 33 | 3.1% |
| American | 34 | 3.2% |
| Cherokee | 22 | 2.1% |
| Czech | 10 | 0.9% |
| English | 102 | 9.6% |
| European | 19 | 1.8% |
| German | 37 | 3.5% |
| Irish | 23 | 2.2% |
| Italian | 18 | 1.7% |
| Mexican | 625 | 58.6% |
| Scottish | 6 | 0.6% |
| Subsaharan African | 33 | 3.1% |
| Swedish | 3 | 0.3% | View All 13 Rows |
Immigrants in Plains
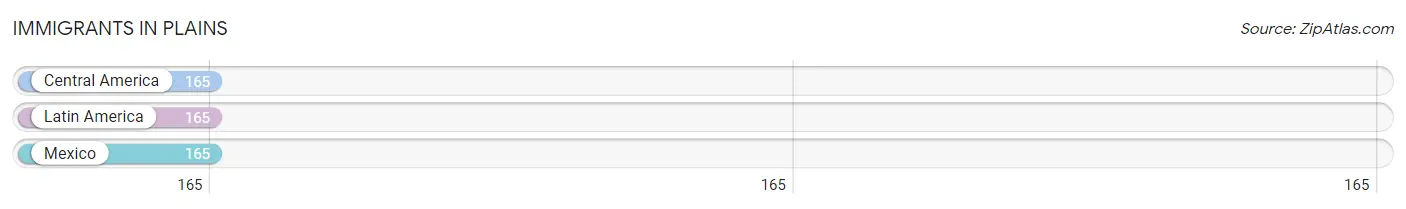
The most numerous immigrant groups reported in Plains came from Central America (165 | 15.5%), Latin America (165 | 15.5%), and Mexico (165 | 15.5%), together accounting for 46.4% of all Plains residents.
| Immigration Origin | # Population | % Population |
| Central America | 165 | 15.5% |
| Latin America | 165 | 15.5% |
| Mexico | 165 | 15.5% | View All 3 Rows |
Sex and Age in Plains
Sex and Age in Plains
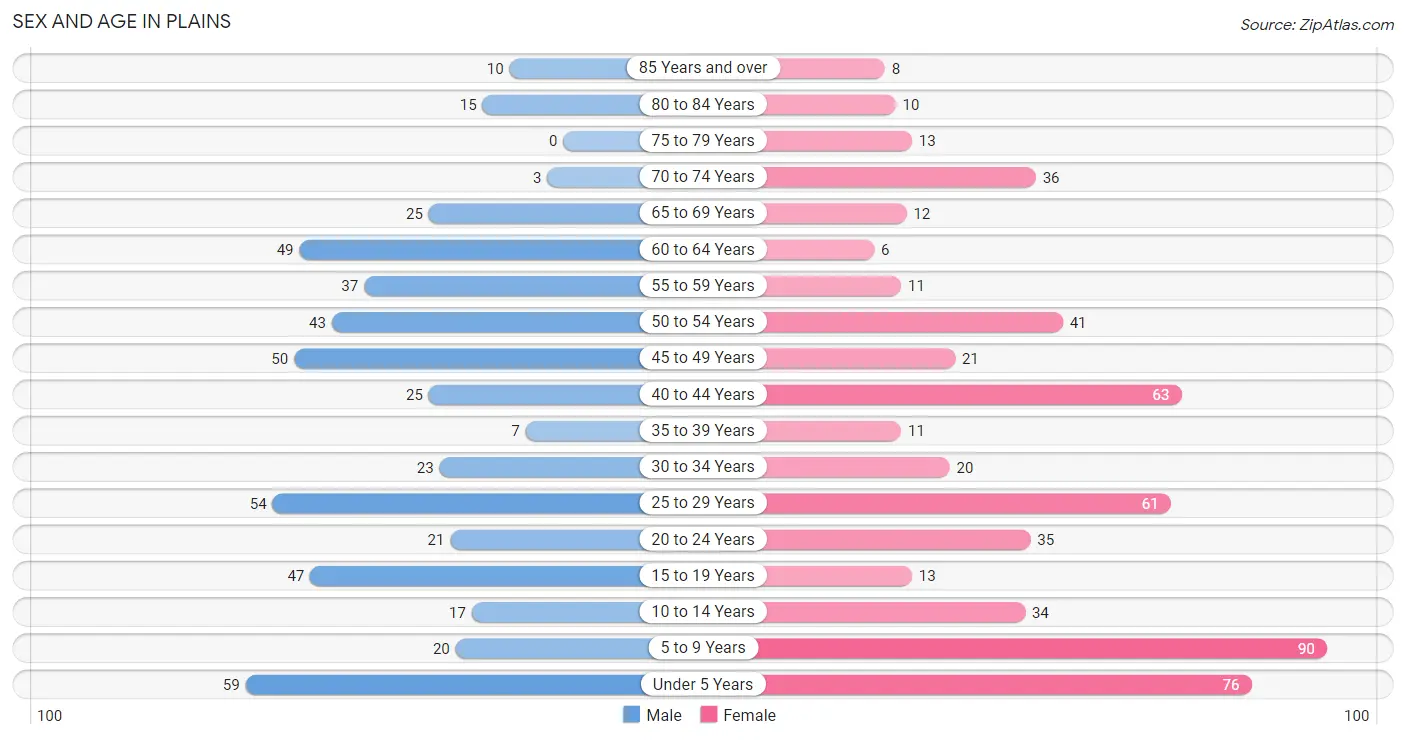
The most populous age groups in Plains are Under 5 Years (59 | 11.7%) for men and 5 to 9 Years (90 | 16.0%) for women.
| Age Bracket | Male | Female |
| Under 5 Years | 59 (11.7%) | 76 (13.6%) |
| 5 to 9 Years | 20 (4.0%) | 90 (16.0%) |
| 10 to 14 Years | 17 (3.4%) | 34 (6.1%) |
| 15 to 19 Years | 47 (9.3%) | 13 (2.3%) |
| 20 to 24 Years | 21 (4.2%) | 35 (6.2%) |
| 25 to 29 Years | 54 (10.7%) | 61 (10.9%) |
| 30 to 34 Years | 23 (4.5%) | 20 (3.6%) |
| 35 to 39 Years | 7 (1.4%) | 11 (2.0%) |
| 40 to 44 Years | 25 (5.0%) | 63 (11.2%) |
| 45 to 49 Years | 50 (9.9%) | 21 (3.7%) |
| 50 to 54 Years | 43 (8.5%) | 41 (7.3%) |
| 55 to 59 Years | 37 (7.3%) | 11 (2.0%) |
| 60 to 64 Years | 49 (9.7%) | 6 (1.1%) |
| 65 to 69 Years | 25 (5.0%) | 12 (2.1%) |
| 70 to 74 Years | 3 (0.6%) | 36 (6.4%) |
| 75 to 79 Years | 0 (0.0%) | 13 (2.3%) |
| 80 to 84 Years | 15 (3.0%) | 10 (1.8%) |
| 85 Years and over | 10 (2.0%) | 8 (1.4%) |
| Total | 505 (100.0%) | 561 (100.0%) |
Families and Households in Plains
Median Family Size in Plains
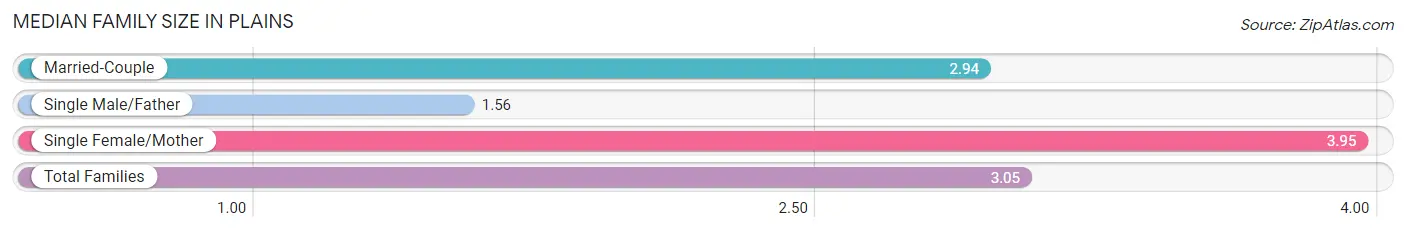
The median family size in Plains is 3.05 persons per family, with single female/mother families (58 | 18.2%) accounting for the largest median family size of 3.95 persons per family. On the other hand, single male/father families (18 | 5.7%) represent the smallest median family size with 1.56 persons per family.
| Family Type | # Families | Family Size |
| Married-Couple | 242 (76.1%) | 2.94 |
| Single Male/Father | 18 (5.7%) | 1.56 |
| Single Female/Mother | 58 (18.2%) | 3.95 |
| Total Families | 318 (100.0%) | 3.05 |
Median Household Size in Plains
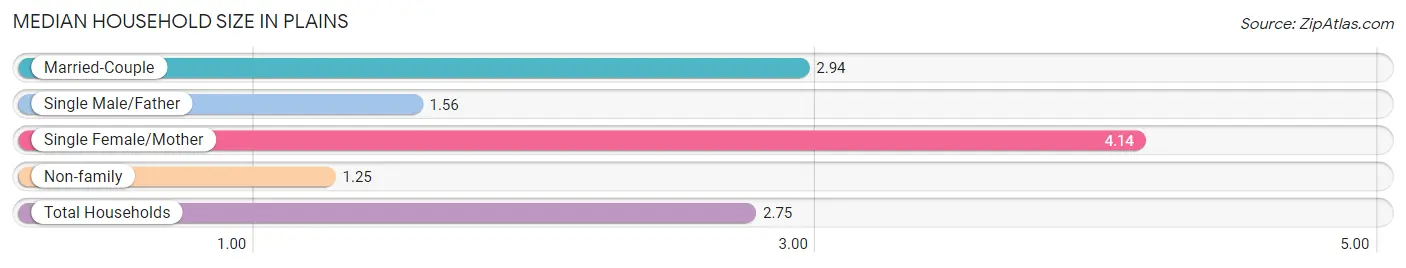
The median household size in Plains is 2.75 persons per household, with single female/mother households (58 | 15.0%) accounting for the largest median household size of 4.14 persons per household. non-family households (69 | 17.8%) represent the smallest median household size with 1.25 persons per household.
| Household Type | # Households | Household Size |
| Married-Couple | 242 (62.5%) | 2.94 |
| Single Male/Father | 18 (4.6%) | 1.56 |
| Single Female/Mother | 58 (15.0%) | 4.14 |
| Non-family | 69 (17.8%) | 1.25 |
| Total Households | 387 (100.0%) | 2.75 |
Household Size by Marriage Status in Plains
Out of a total of 387 households in Plains, 318 (82.2%) are family households, while 69 (17.8%) are nonfamily households. The most numerous type of family households are 2-person households, comprising 127, and the most common type of nonfamily households are 1-person households, comprising 63.
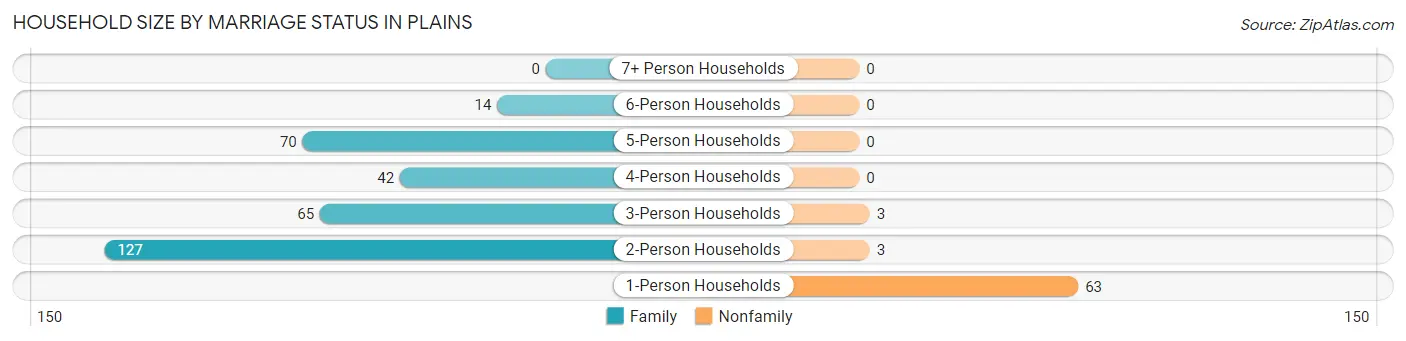
| Household Size | Family Households | Nonfamily Households |
| 1-Person Households | - | 63 (16.3%) |
| 2-Person Households | 127 (32.8%) | 3 (0.8%) |
| 3-Person Households | 65 (16.8%) | 3 (0.8%) |
| 4-Person Households | 42 (10.8%) | 0 (0.0%) |
| 5-Person Households | 70 (18.1%) | 0 (0.0%) |
| 6-Person Households | 14 (3.6%) | 0 (0.0%) |
| 7+ Person Households | 0 (0.0%) | 0 (0.0%) |
| Total | 318 (82.2%) | 69 (17.8%) |
Female Fertility in Plains
Fertility by Age in Plains
Average fertility rate in Plains is 35.0 births per 1,000 women. Women in the age bracket of 20 to 34 years have the highest fertility rate with 69.0 births per 1,000 women. Women in the age bracket of 20 to 34 years acount for 100.0% of all women with births.
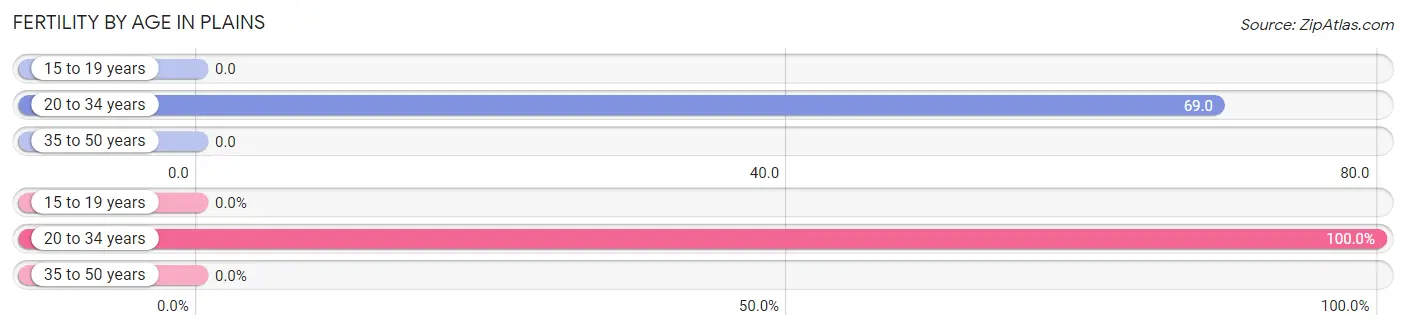
| Age Bracket | Women with Births | Births / 1,000 Women |
| 15 to 19 years | 0 (0.0%) | 0.0 |
| 20 to 34 years | 8 (100.0%) | 69.0 |
| 35 to 50 years | 0 (0.0%) | 0.0 |
| Total | 8 (100.0%) | 35.0 |
Fertility by Age by Marriage Status in Plains
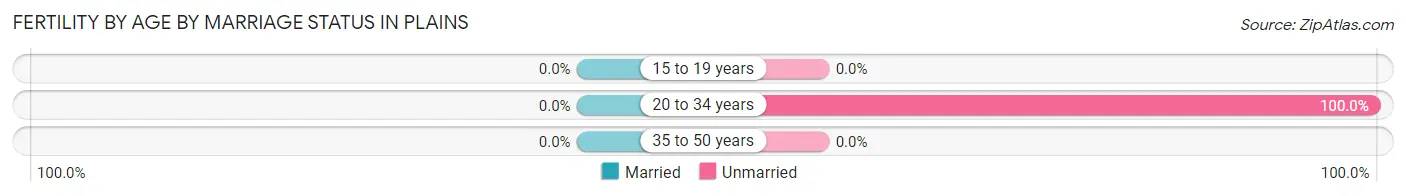
| Age Bracket | Married | Unmarried |
| 15 to 19 years | 0 (0.0%) | 0 (0.0%) |
| 20 to 34 years | 0 (0.0%) | 8 (100.0%) |
| 35 to 50 years | 0 (0.0%) | 0 (0.0%) |
| Total | 0 (0.0%) | 8 (100.0%) |
Fertility by Education in Plains
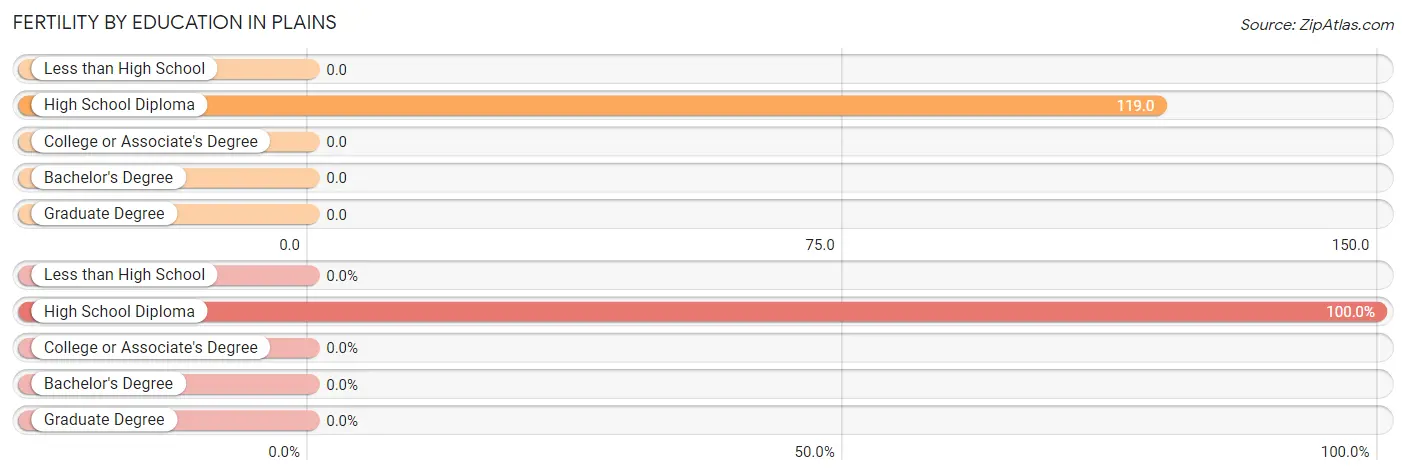
| Educational Attainment | Women with Births | Births / 1,000 Women |
| Less than High School | 0 (0.0%) | 0.0 |
| High School Diploma | 8 (100.0%) | 119.0 |
| College or Associate's Degree | 0 (0.0%) | 0.0 |
| Bachelor's Degree | 0 (0.0%) | 0.0 |
| Graduate Degree | 0 (0.0%) | 0.0 |
| Total | 8 (100.0%) | 35.0 |
Fertility by Education by Marriage Status in Plains
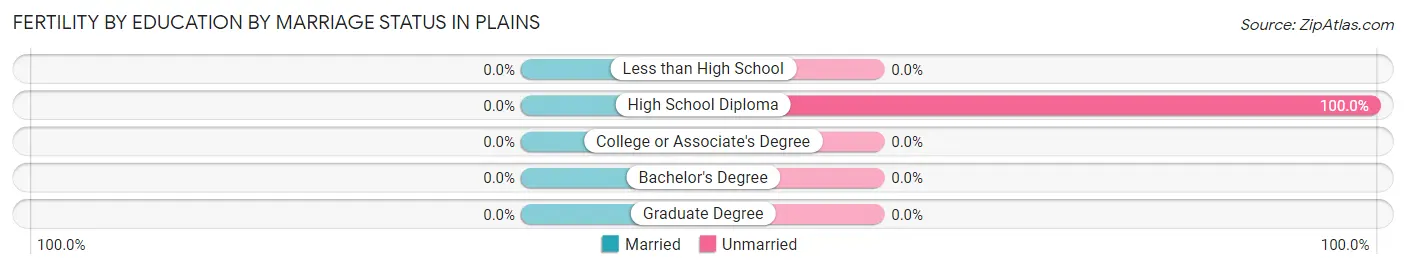
| Educational Attainment | Married | Unmarried |
| Less than High School | 0 (0.0%) | 0 (0.0%) |
| High School Diploma | 0 (0.0%) | 8 (100.0%) |
| College or Associate's Degree | 0 (0.0%) | 0 (0.0%) |
| Bachelor's Degree | 0 (0.0%) | 0 (0.0%) |
| Graduate Degree | 0 (0.0%) | 0 (0.0%) |
| Total | 0 (0.0%) | 8 (100.0%) |
Employment Characteristics in Plains
Employment by Class of Employer in Plains
Among the 489 employed individuals in Plains, private company employees (329 | 67.3%), state government employees (79 | 16.2%), and local government employees (62 | 12.7%) make up the most common classes of employment.
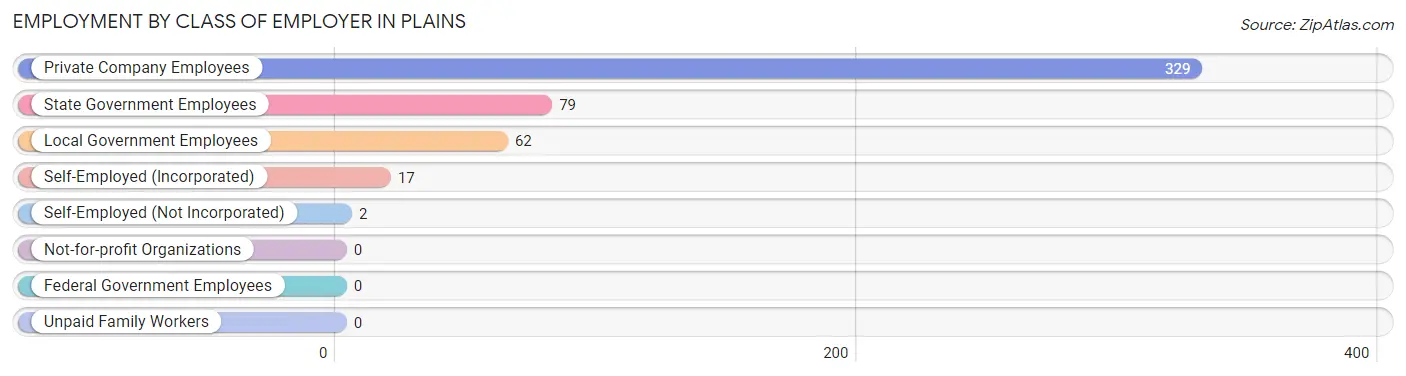
| Employer Class | # Employees | % Employees |
| Private Company Employees | 329 | 67.3% |
| Self-Employed (Incorporated) | 17 | 3.5% |
| Self-Employed (Not Incorporated) | 2 | 0.4% |
| Not-for-profit Organizations | 0 | 0.0% |
| Local Government Employees | 62 | 12.7% |
| State Government Employees | 79 | 16.2% |
| Federal Government Employees | 0 | 0.0% |
| Unpaid Family Workers | 0 | 0.0% |
| Total | 489 | 100.0% |
Employment Status by Age in Plains
According to the labor force statistics for Plains, out of the total population over 16 years of age (750), 71.1% or 533 individuals are in the labor force, with 5.8% or 31 of them unemployed. The age group with the highest labor force participation rate is 35 to 44 years, with 100.0% or 106 individuals in the labor force. Within the labor force, the 25 to 29 years age range has the highest percentage of unemployed individuals, with 24.1% or 20 of them being unemployed.
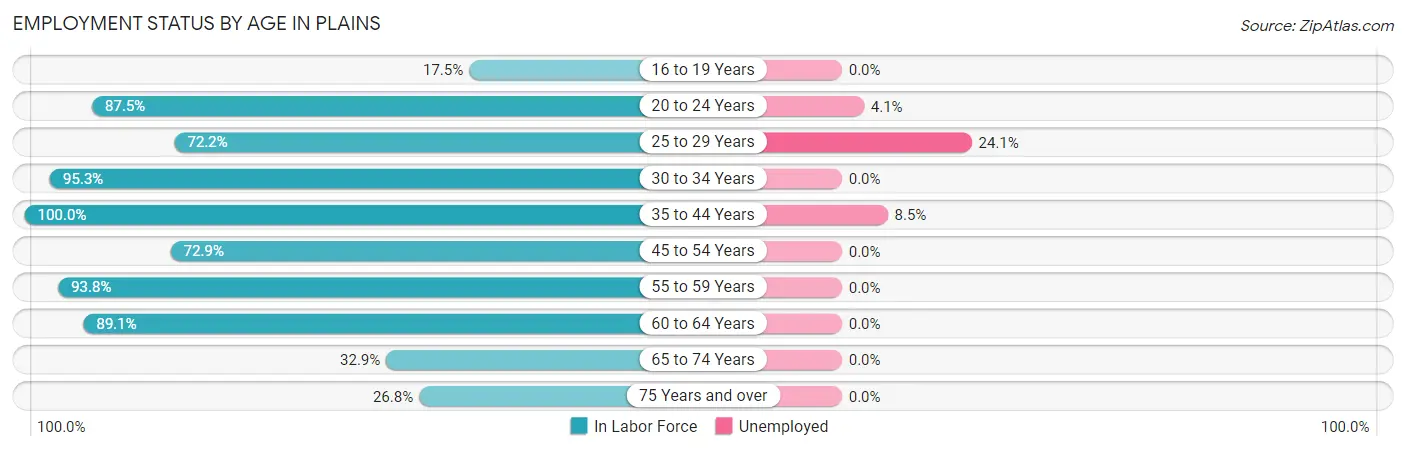
| Age Bracket | In Labor Force | Unemployed |
| 16 to 19 Years | 7 (17.5%) | 0 (0.0%) |
| 20 to 24 Years | 49 (87.5%) | 2 (4.1%) |
| 25 to 29 Years | 83 (72.2%) | 20 (24.1%) |
| 30 to 34 Years | 41 (95.3%) | 0 (0.0%) |
| 35 to 44 Years | 106 (100.0%) | 9 (8.5%) |
| 45 to 54 Years | 113 (72.9%) | 0 (0.0%) |
| 55 to 59 Years | 45 (93.8%) | 0 (0.0%) |
| 60 to 64 Years | 49 (89.1%) | 0 (0.0%) |
| 65 to 74 Years | 25 (32.9%) | 0 (0.0%) |
| 75 Years and over | 15 (26.8%) | 0 (0.0%) |
| Total | 533 (71.1%) | 31 (5.8%) |
Employment Status by Educational Attainment in Plains
According to labor force statistics for Plains, 83.7% of individuals (437) out of the total population between 25 and 64 years of age (522) are in the labor force, with 6.6% or 29 of them being unemployed. The group with the highest labor force participation rate are those with the educational attainment of college / associate degree, with 85.2% or 155 individuals in the labor force. Within the labor force, individuals with college / associate degree education have the highest percentage of unemployment, with 12.9% or 20 of them being unemployed.
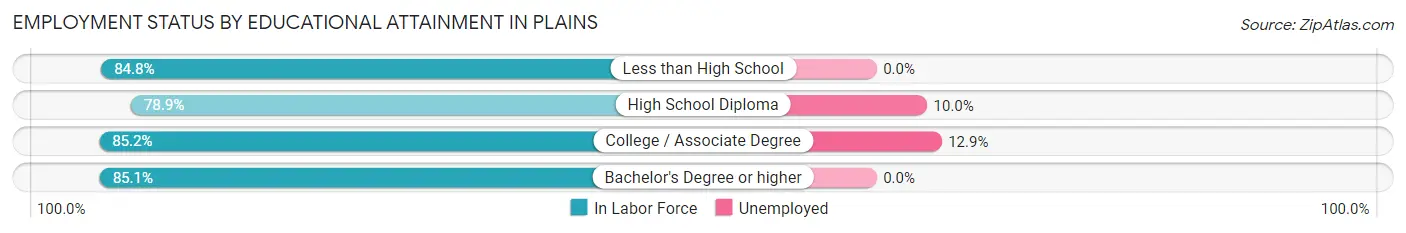
| Educational Attainment | In Labor Force | Unemployed |
| Less than High School | 95 (84.8%) | 0 (0.0%) |
| High School Diploma | 90 (78.9%) | 11 (10.0%) |
| College / Associate Degree | 155 (85.2%) | 23 (12.9%) |
| Bachelor's Degree or higher | 97 (85.1%) | 0 (0.0%) |
| Total | 437 (83.7%) | 34 (6.6%) |
Employment Occupations by Sex in Plains
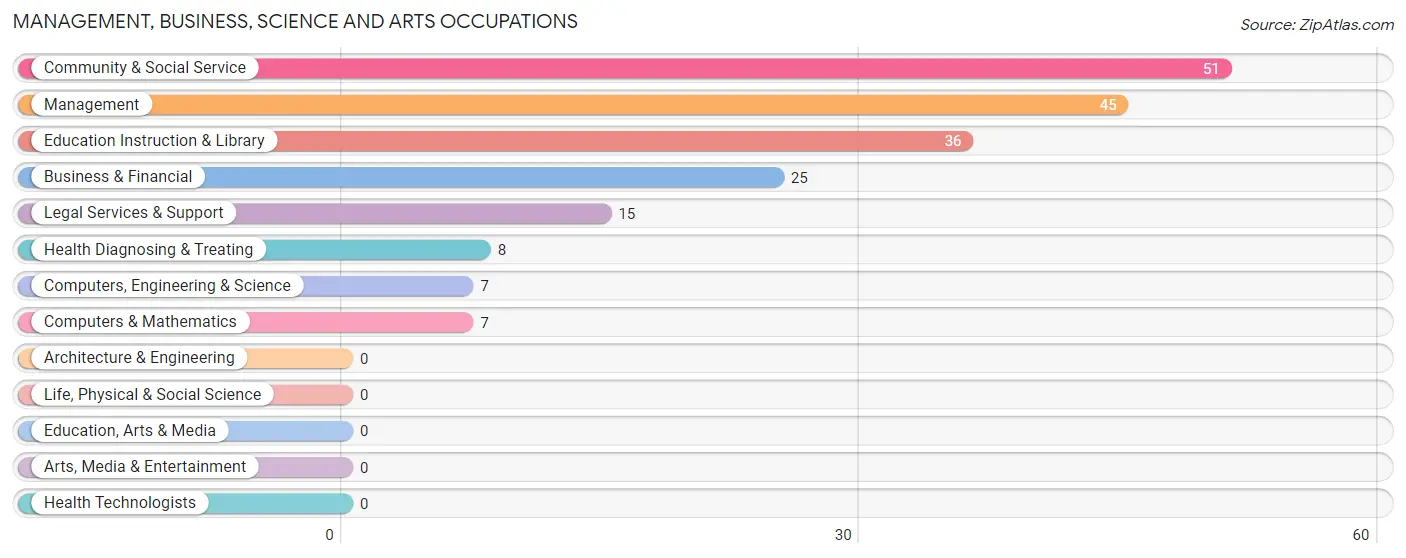
Management, Business, Science and Arts Occupations
The most common Management, Business, Science and Arts occupations in Plains are Community & Social Service (51 | 10.2%), Management (45 | 9.0%), Education Instruction & Library (36 | 7.2%), Business & Financial (25 | 5.0%), and Legal Services & Support (15 | 3.0%).
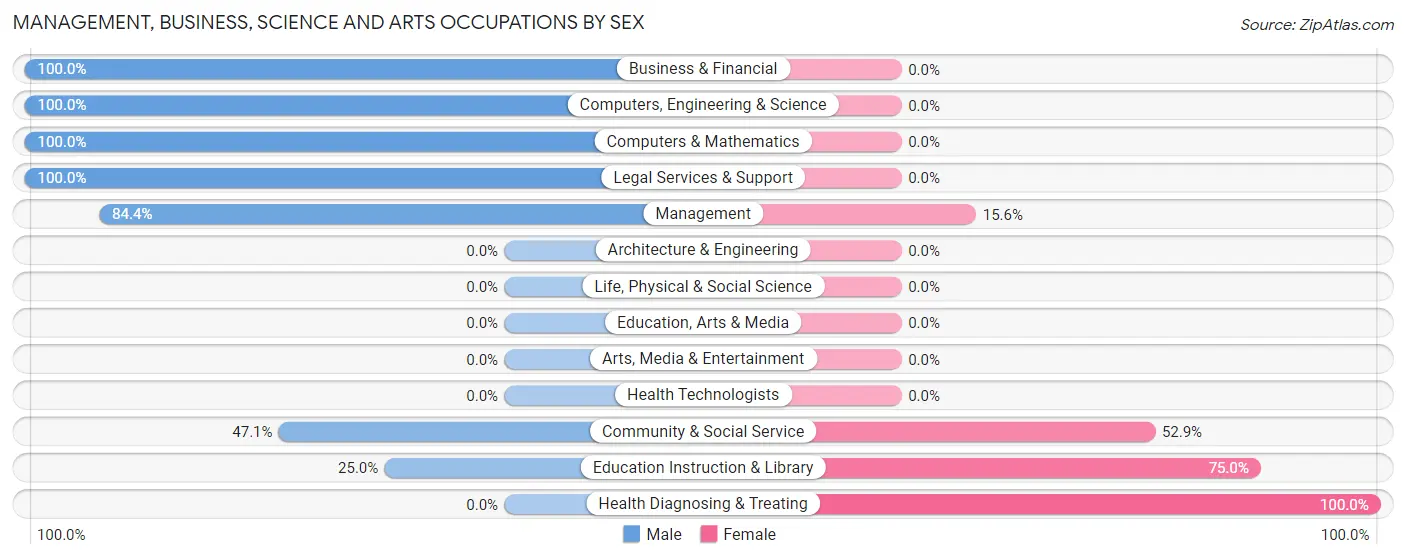
Management, Business, Science and Arts Occupations by Sex
Within the Management, Business, Science and Arts occupations in Plains, the most male-oriented occupations are Business & Financial (100.0%), Computers, Engineering & Science (100.0%), and Computers & Mathematics (100.0%), while the most female-oriented occupations are Health Diagnosing & Treating (100.0%), Education Instruction & Library (75.0%), and Community & Social Service (52.9%).
| Occupation | Male | Female |
| Management | 38 (84.4%) | 7 (15.6%) |
| Business & Financial | 25 (100.0%) | 0 (0.0%) |
| Computers, Engineering & Science | 7 (100.0%) | 0 (0.0%) |
| Computers & Mathematics | 7 (100.0%) | 0 (0.0%) |
| Architecture & Engineering | 0 (0.0%) | 0 (0.0%) |
| Life, Physical & Social Science | 0 (0.0%) | 0 (0.0%) |
| Community & Social Service | 24 (47.1%) | 27 (52.9%) |
| Education, Arts & Media | 0 (0.0%) | 0 (0.0%) |
| Legal Services & Support | 15 (100.0%) | 0 (0.0%) |
| Education Instruction & Library | 9 (25.0%) | 27 (75.0%) |
| Arts, Media & Entertainment | 0 (0.0%) | 0 (0.0%) |
| Health Diagnosing & Treating | 0 (0.0%) | 8 (100.0%) |
| Health Technologists | 0 (0.0%) | 0 (0.0%) |
| Total (Category) | 94 (69.1%) | 42 (30.9%) |
| Total (Overall) | 294 (58.6%) | 208 (41.4%) |
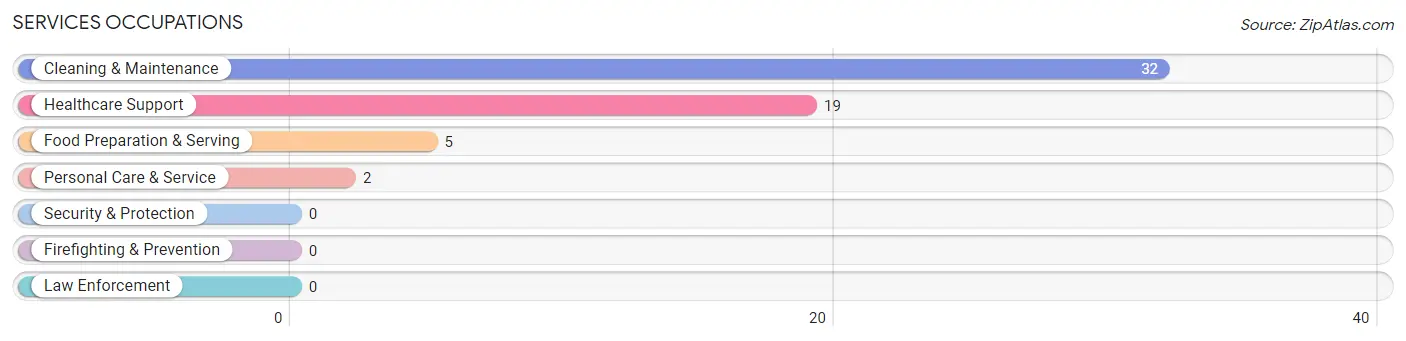
Services Occupations
The most common Services occupations in Plains are Cleaning & Maintenance (32 | 6.4%), Healthcare Support (19 | 3.8%), Food Preparation & Serving (5 | 1.0%), and Personal Care & Service (2 | 0.4%).
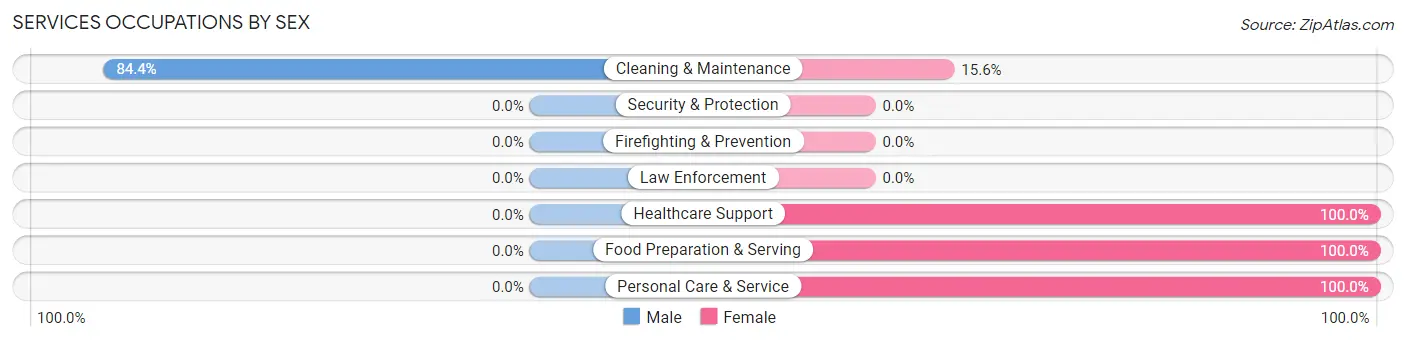
Services Occupations by Sex
| Occupation | Male | Female |
| Healthcare Support | 0 (0.0%) | 19 (100.0%) |
| Security & Protection | 0 (0.0%) | 0 (0.0%) |
| Firefighting & Prevention | 0 (0.0%) | 0 (0.0%) |
| Law Enforcement | 0 (0.0%) | 0 (0.0%) |
| Food Preparation & Serving | 0 (0.0%) | 5 (100.0%) |
| Cleaning & Maintenance | 27 (84.4%) | 5 (15.6%) |
| Personal Care & Service | 0 (0.0%) | 2 (100.0%) |
| Total (Category) | 27 (46.6%) | 31 (53.4%) |
| Total (Overall) | 294 (58.6%) | 208 (41.4%) |
Sales and Office Occupations
The most common Sales and Office occupations in Plains are Office & Administration (55 | 11.0%), and Sales & Related (45 | 9.0%).
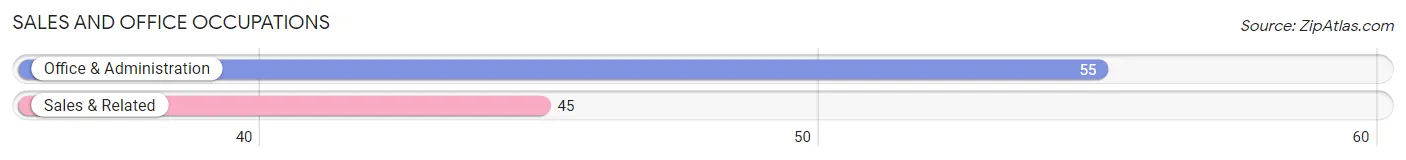
Sales and Office Occupations by Sex
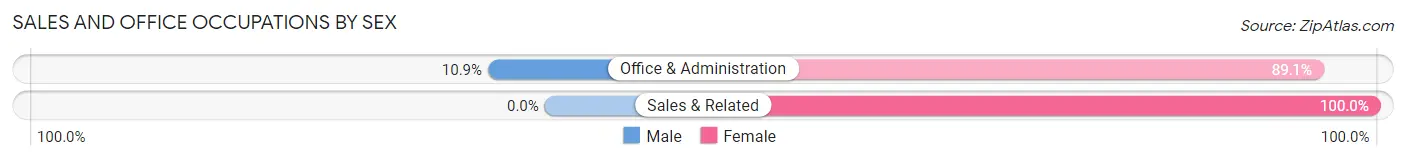
| Occupation | Male | Female |
| Sales & Related | 0 (0.0%) | 45 (100.0%) |
| Office & Administration | 6 (10.9%) | 49 (89.1%) |
| Total (Category) | 6 (6.0%) | 94 (94.0%) |
| Total (Overall) | 294 (58.6%) | 208 (41.4%) |
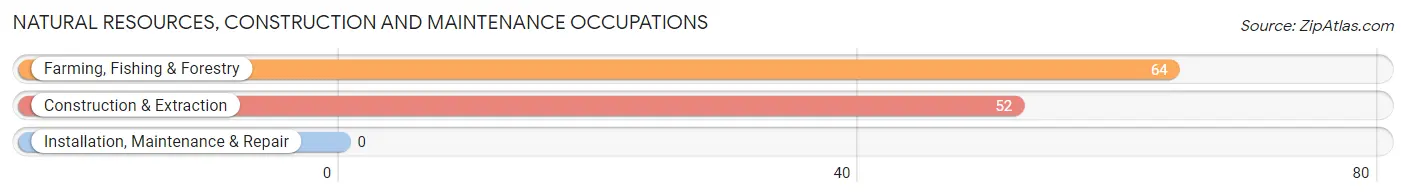
Natural Resources, Construction and Maintenance Occupations
The most common Natural Resources, Construction and Maintenance occupations in Plains are Farming, Fishing & Forestry (64 | 12.8%), and Construction & Extraction (52 | 10.4%).
Natural Resources, Construction and Maintenance Occupations by Sex
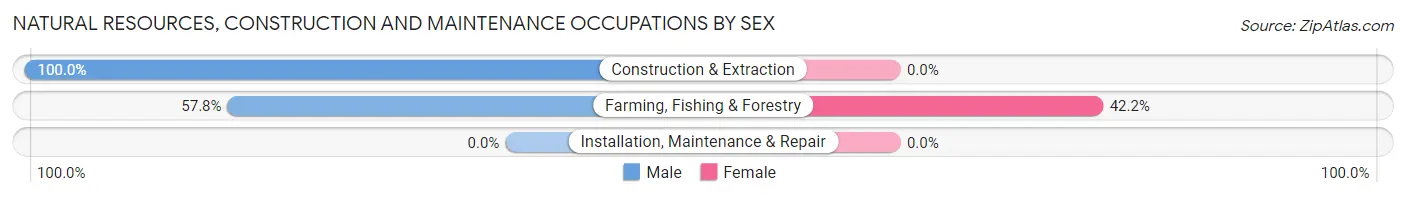
| Occupation | Male | Female |
| Farming, Fishing & Forestry | 37 (57.8%) | 27 (42.2%) |
| Construction & Extraction | 52 (100.0%) | 0 (0.0%) |
| Installation, Maintenance & Repair | 0 (0.0%) | 0 (0.0%) |
| Total (Category) | 89 (76.7%) | 27 (23.3%) |
| Total (Overall) | 294 (58.6%) | 208 (41.4%) |
Production, Transportation and Moving Occupations
The most common Production, Transportation and Moving occupations in Plains are Transportation (69 | 13.8%), and Material Moving (23 | 4.6%).
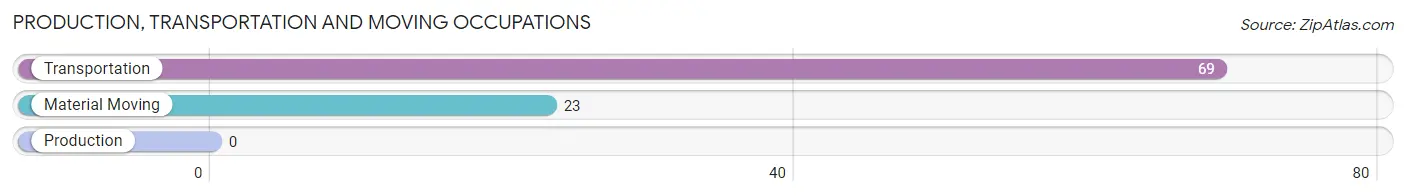
Production, Transportation and Moving Occupations by Sex
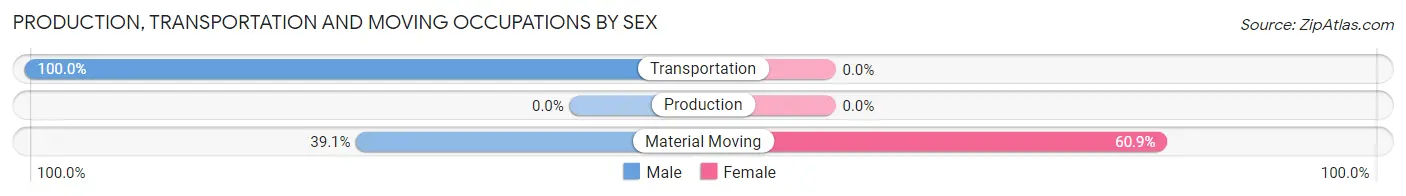
| Occupation | Male | Female |
| Production | 0 (0.0%) | 0 (0.0%) |
| Transportation | 69 (100.0%) | 0 (0.0%) |
| Material Moving | 9 (39.1%) | 14 (60.9%) |
| Total (Category) | 78 (84.8%) | 14 (15.2%) |
| Total (Overall) | 294 (58.6%) | 208 (41.4%) |
Employment Industries by Sex in Plains
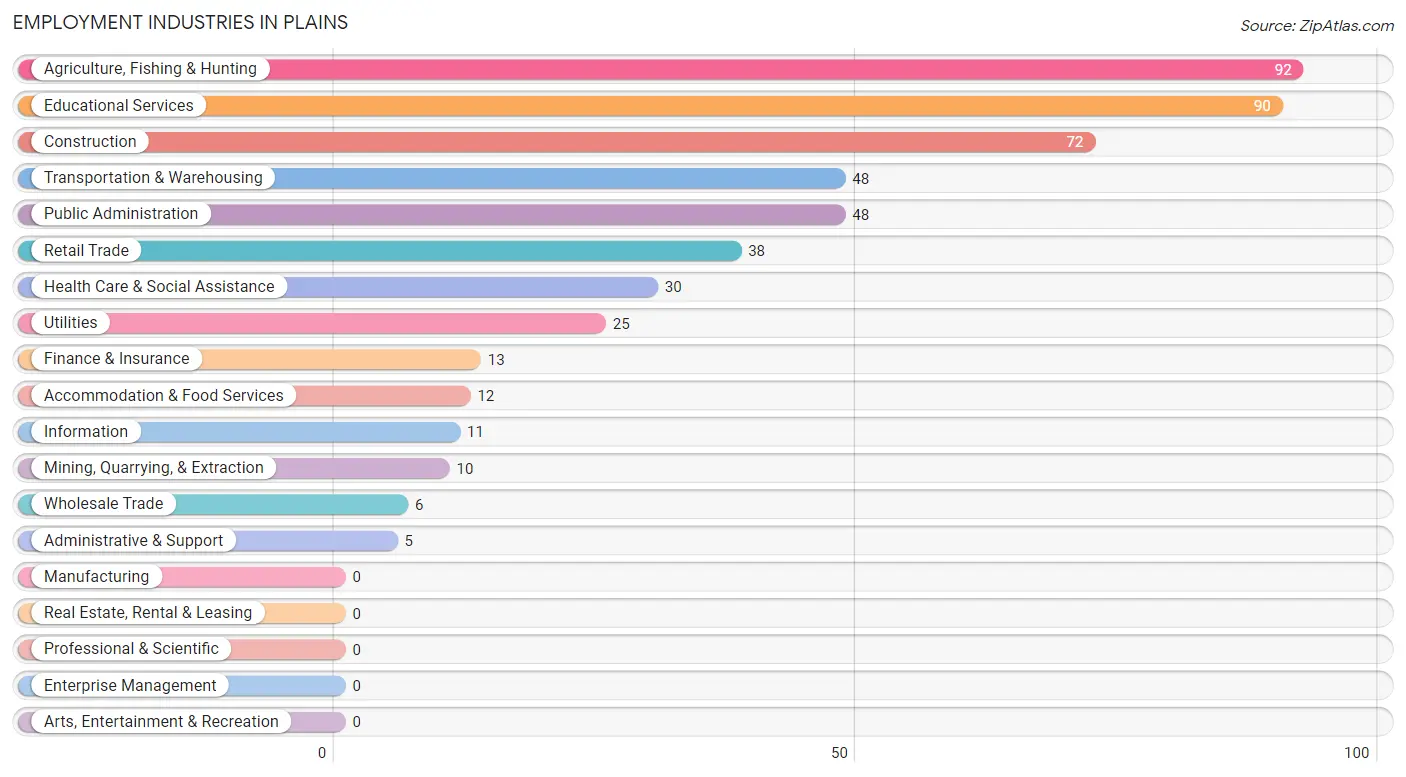
Employment Industries in Plains
The major employment industries in Plains include Agriculture, Fishing & Hunting (92 | 18.3%), Educational Services (90 | 17.9%), Construction (72 | 14.3%), Transportation & Warehousing (48 | 9.6%), and Public Administration (48 | 9.6%).
Employment Industries by Sex in Plains
The Plains industries that see more men than women are Mining, Quarrying, & Extraction (100.0%), Wholesale Trade (100.0%), and Transportation & Warehousing (100.0%), whereas the industries that tend to have a higher number of women are Retail Trade (100.0%), Finance & Insurance (100.0%), and Administrative & Support (100.0%).
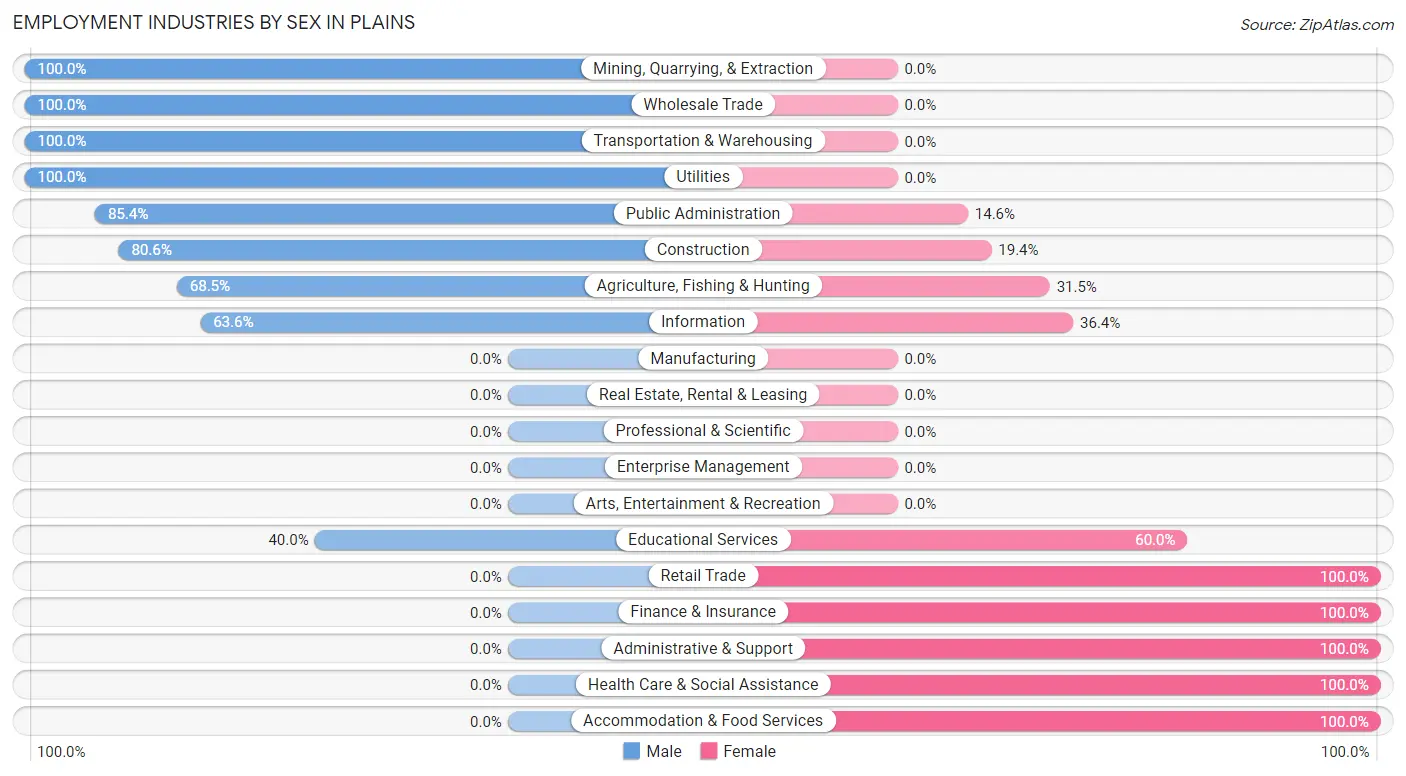
| Industry | Male | Female |
| Agriculture, Fishing & Hunting | 63 (68.5%) | 29 (31.5%) |
| Mining, Quarrying, & Extraction | 10 (100.0%) | 0 (0.0%) |
| Construction | 58 (80.6%) | 14 (19.4%) |
| Manufacturing | 0 (0.0%) | 0 (0.0%) |
| Wholesale Trade | 6 (100.0%) | 0 (0.0%) |
| Retail Trade | 0 (0.0%) | 38 (100.0%) |
| Transportation & Warehousing | 48 (100.0%) | 0 (0.0%) |
| Utilities | 25 (100.0%) | 0 (0.0%) |
| Information | 7 (63.6%) | 4 (36.4%) |
| Finance & Insurance | 0 (0.0%) | 13 (100.0%) |
| Real Estate, Rental & Leasing | 0 (0.0%) | 0 (0.0%) |
| Professional & Scientific | 0 (0.0%) | 0 (0.0%) |
| Enterprise Management | 0 (0.0%) | 0 (0.0%) |
| Administrative & Support | 0 (0.0%) | 5 (100.0%) |
| Educational Services | 36 (40.0%) | 54 (60.0%) |
| Health Care & Social Assistance | 0 (0.0%) | 30 (100.0%) |
| Arts, Entertainment & Recreation | 0 (0.0%) | 0 (0.0%) |
| Accommodation & Food Services | 0 (0.0%) | 12 (100.0%) |
| Public Administration | 41 (85.4%) | 7 (14.6%) |
| Total | 294 (58.6%) | 208 (41.4%) |
Education in Plains
School Enrollment in Plains
The most common levels of schooling among the 224 students in Plains are elementary school (84 | 37.5%), high school (49 | 21.9%), and middle school (45 | 20.1%).
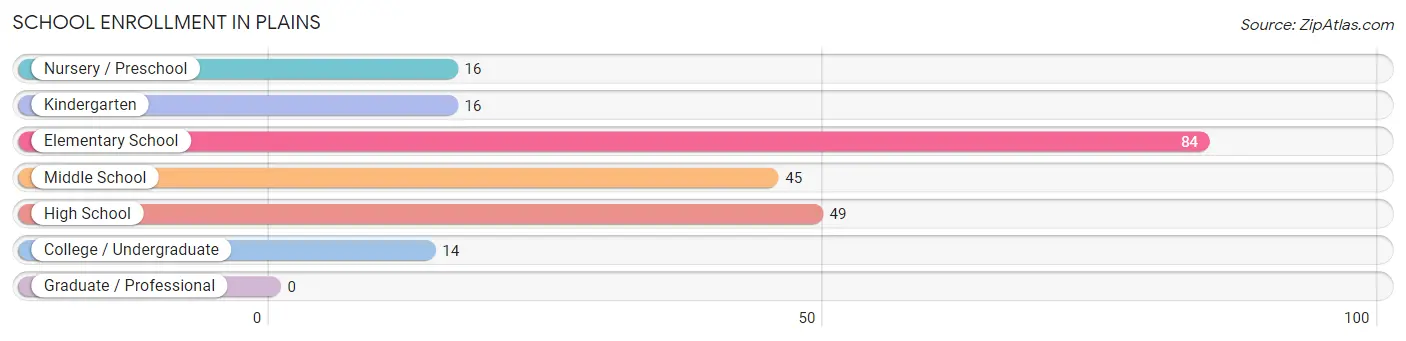
| School Level | # Students | % Students |
| Nursery / Preschool | 16 | 7.1% |
| Kindergarten | 16 | 7.1% |
| Elementary School | 84 | 37.5% |
| Middle School | 45 | 20.1% |
| High School | 49 | 21.9% |
| College / Undergraduate | 14 | 6.2% |
| Graduate / Professional | 0 | 0.0% |
| Total | 224 | 100.0% |
School Enrollment by Age by Funding Source in Plains
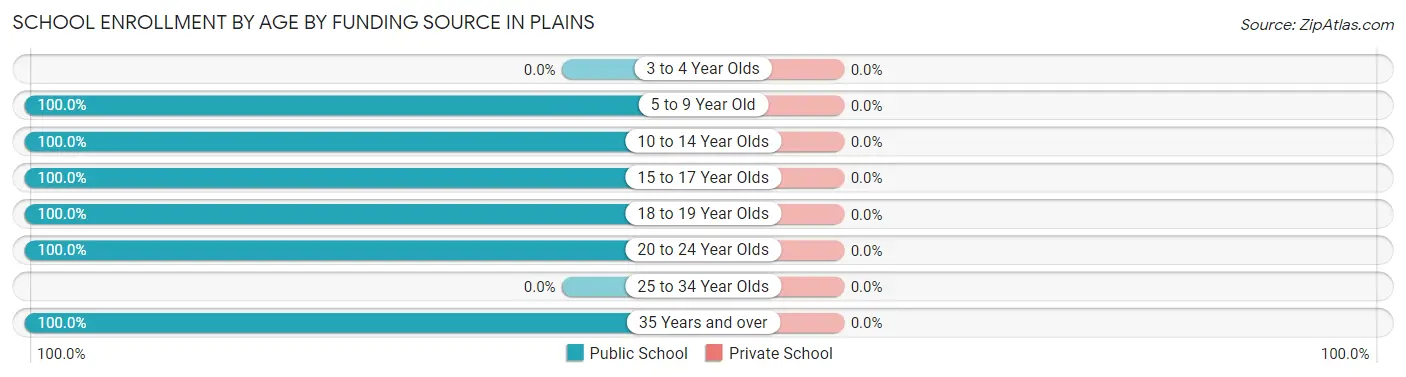
| Age Bracket | Public School | Private School |
| 3 to 4 Year Olds | 0 (0.0%) | 0 (0.0%) |
| 5 to 9 Year Old | 110 (100.0%) | 0 (0.0%) |
| 10 to 14 Year Olds | 51 (100.0%) | 0 (0.0%) |
| 15 to 17 Year Olds | 44 (100.0%) | 0 (0.0%) |
| 18 to 19 Year Olds | 5 (100.0%) | 0 (0.0%) |
| 20 to 24 Year Olds | 4 (100.0%) | 0 (0.0%) |
| 25 to 34 Year Olds | 0 (0.0%) | 0 (0.0%) |
| 35 Years and over | 10 (100.0%) | 0 (0.0%) |
| Total | 224 (100.0%) | 0 (0.0%) |
Educational Attainment by Field of Study in Plains
Business (69 | 60.5%), engineering (22 | 19.3%), literature & languages (9 | 7.9%), physical & health sciences (6 | 5.3%), and psychology (5 | 4.4%) are the most common fields of study among 114 individuals in Plains who have obtained a bachelor's degree or higher.
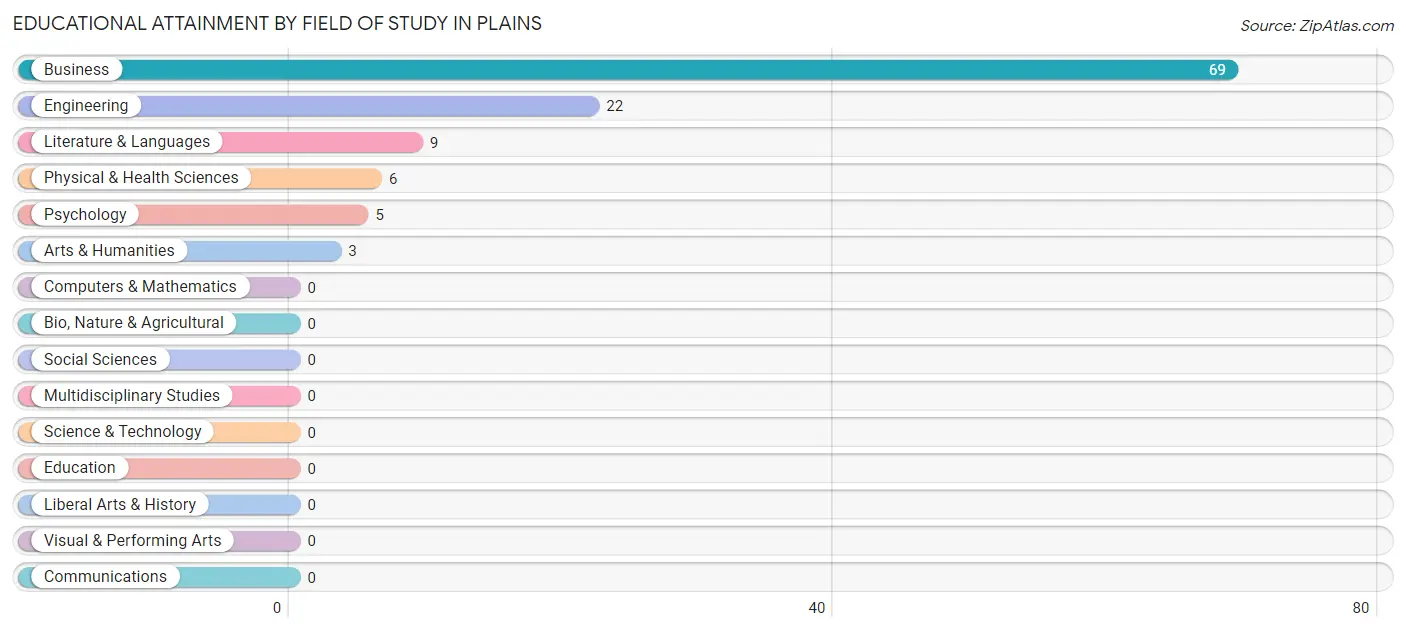
| Field of Study | # Graduates | % Graduates |
| Computers & Mathematics | 0 | 0.0% |
| Bio, Nature & Agricultural | 0 | 0.0% |
| Physical & Health Sciences | 6 | 5.3% |
| Psychology | 5 | 4.4% |
| Social Sciences | 0 | 0.0% |
| Engineering | 22 | 19.3% |
| Multidisciplinary Studies | 0 | 0.0% |
| Science & Technology | 0 | 0.0% |
| Business | 69 | 60.5% |
| Education | 0 | 0.0% |
| Literature & Languages | 9 | 7.9% |
| Liberal Arts & History | 0 | 0.0% |
| Visual & Performing Arts | 0 | 0.0% |
| Communications | 0 | 0.0% |
| Arts & Humanities | 3 | 2.6% |
| Total | 114 | 100.0% |
Transportation & Commute in Plains
Vehicle Availability by Sex in Plains
The most prevalent vehicle ownership categories in Plains are males with 3 vehicles (96, accounting for 33.1%) and females with 3 vehicles (92, making up 48.2%).
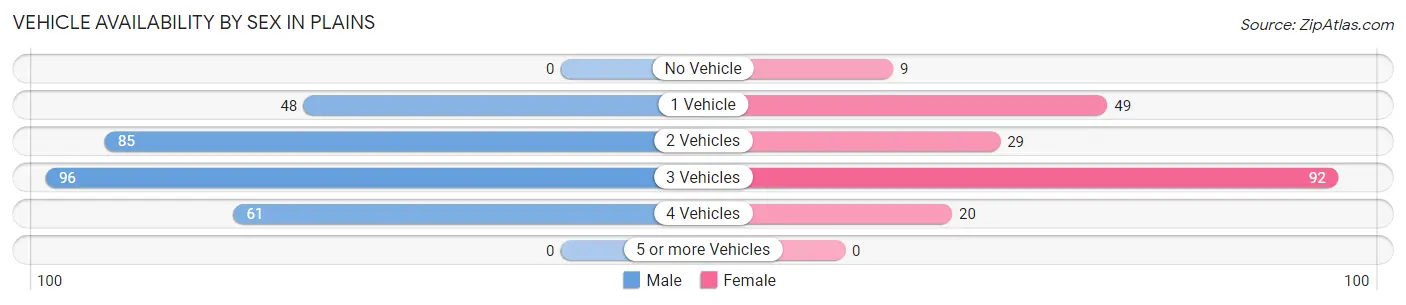
| Vehicles Available | Male | Female |
| No Vehicle | 0 (0.0%) | 9 (4.5%) |
| 1 Vehicle | 48 (16.6%) | 49 (24.6%) |
| 2 Vehicles | 85 (29.3%) | 29 (14.6%) |
| 3 Vehicles | 96 (33.1%) | 92 (46.2%) |
| 4 Vehicles | 61 (21.0%) | 20 (10.1%) |
| 5 or more Vehicles | 0 (0.0%) | 0 (0.0%) |
| Total | 290 (100.0%) | 199 (100.0%) |
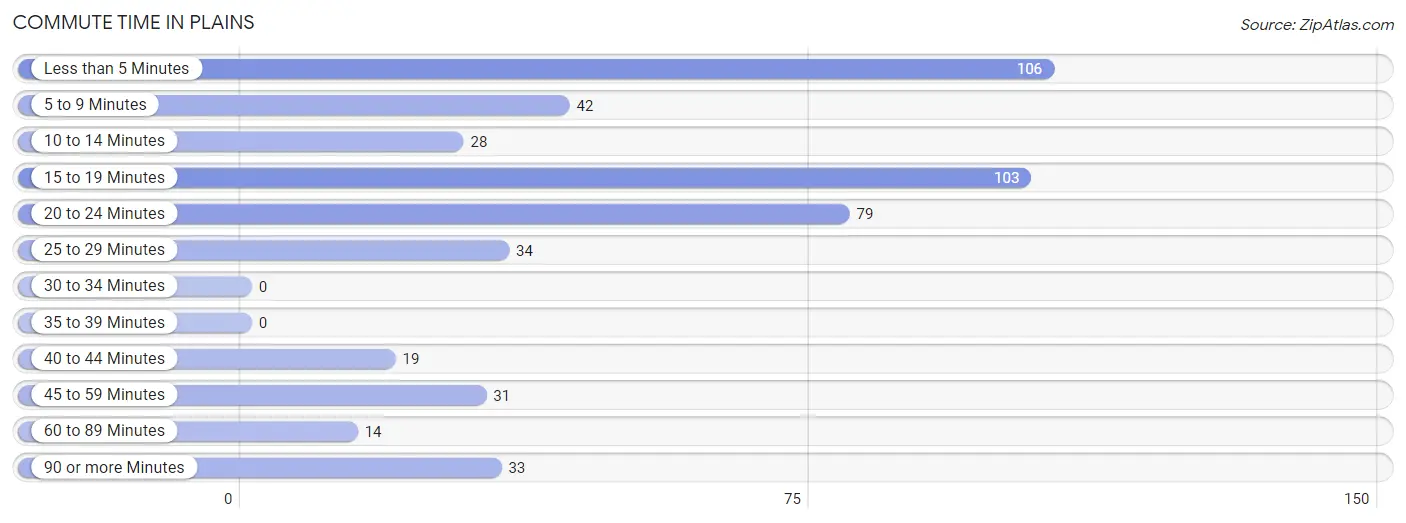
Commute Time in Plains
The most frequently occuring commute durations in Plains are less than 5 minutes (106 commuters, 21.7%), 15 to 19 minutes (103 commuters, 21.1%), and 20 to 24 minutes (79 commuters, 16.2%).
| Commute Time | # Commuters | % Commuters |
| Less than 5 Minutes | 106 | 21.7% |
| 5 to 9 Minutes | 42 | 8.6% |
| 10 to 14 Minutes | 28 | 5.7% |
| 15 to 19 Minutes | 103 | 21.1% |
| 20 to 24 Minutes | 79 | 16.2% |
| 25 to 29 Minutes | 34 | 7.0% |
| 30 to 34 Minutes | 0 | 0.0% |
| 35 to 39 Minutes | 0 | 0.0% |
| 40 to 44 Minutes | 19 | 3.9% |
| 45 to 59 Minutes | 31 | 6.3% |
| 60 to 89 Minutes | 14 | 2.9% |
| 90 or more Minutes | 33 | 6.8% |
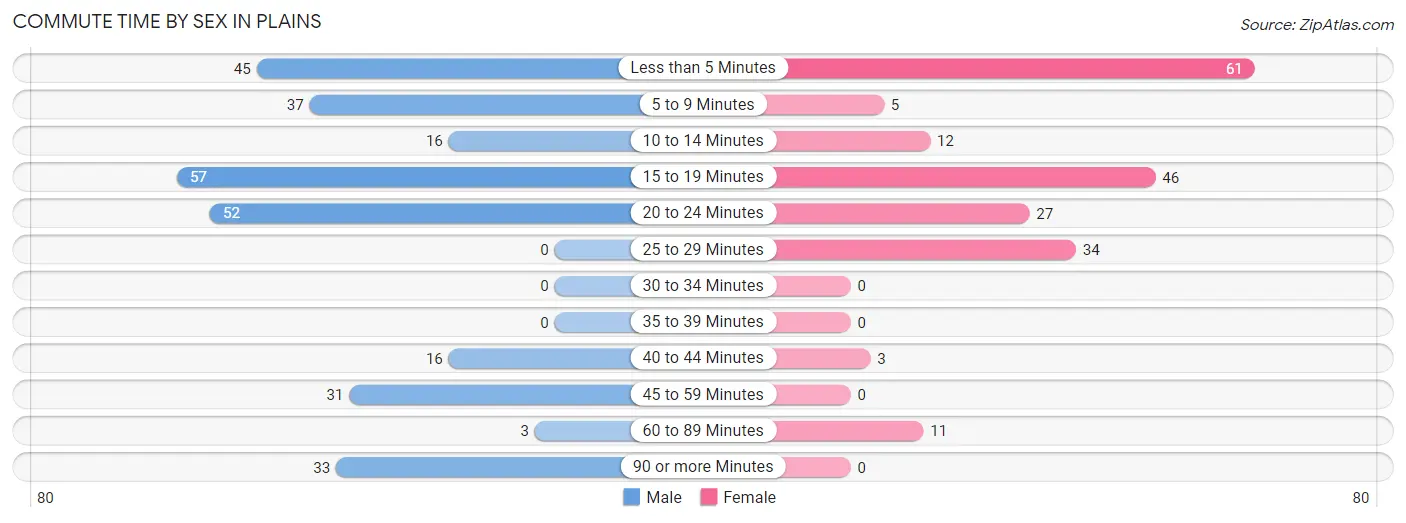
Commute Time by Sex in Plains
The most common commute times in Plains are 15 to 19 minutes (57 commuters, 19.7%) for males and less than 5 minutes (61 commuters, 30.6%) for females.
| Commute Time | Male | Female |
| Less than 5 Minutes | 45 (15.5%) | 61 (30.6%) |
| 5 to 9 Minutes | 37 (12.8%) | 5 (2.5%) |
| 10 to 14 Minutes | 16 (5.5%) | 12 (6.0%) |
| 15 to 19 Minutes | 57 (19.7%) | 46 (23.1%) |
| 20 to 24 Minutes | 52 (17.9%) | 27 (13.6%) |
| 25 to 29 Minutes | 0 (0.0%) | 34 (17.1%) |
| 30 to 34 Minutes | 0 (0.0%) | 0 (0.0%) |
| 35 to 39 Minutes | 0 (0.0%) | 0 (0.0%) |
| 40 to 44 Minutes | 16 (5.5%) | 3 (1.5%) |
| 45 to 59 Minutes | 31 (10.7%) | 0 (0.0%) |
| 60 to 89 Minutes | 3 (1.0%) | 11 (5.5%) |
| 90 or more Minutes | 33 (11.4%) | 0 (0.0%) |
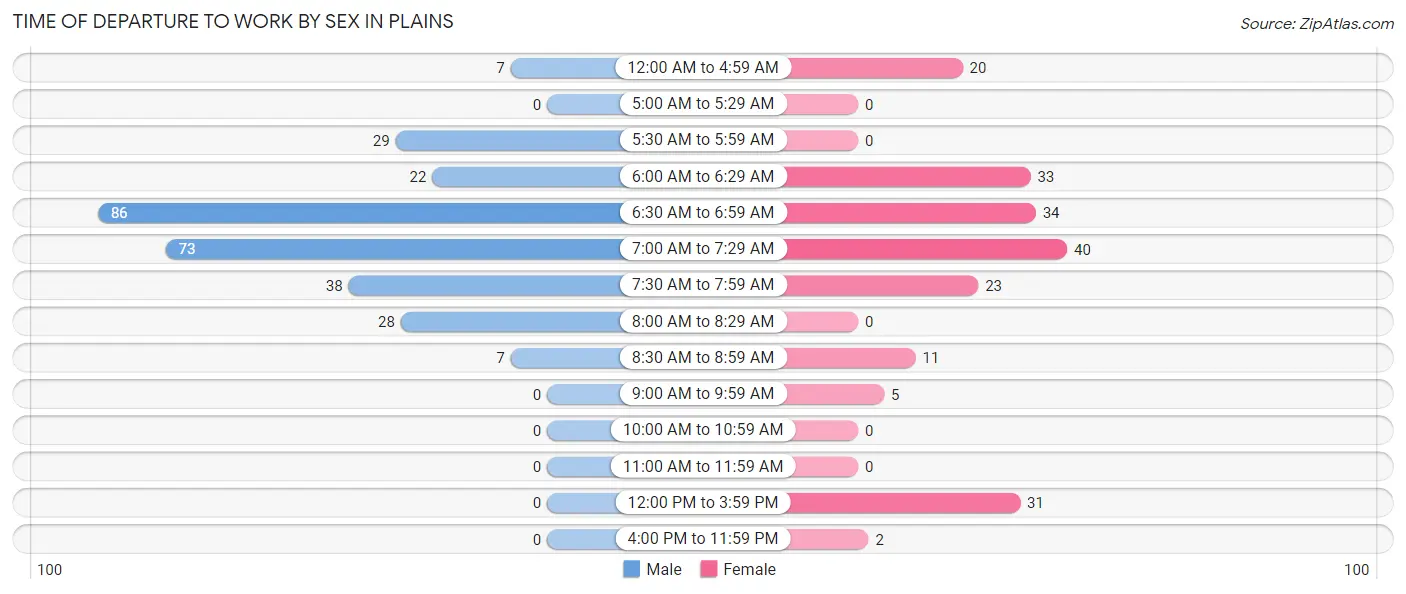
Time of Departure to Work by Sex in Plains
The most frequent times of departure to work in Plains are 6:30 AM to 6:59 AM (86, 29.7%) for males and 7:00 AM to 7:29 AM (40, 20.1%) for females.
| Time of Departure | Male | Female |
| 12:00 AM to 4:59 AM | 7 (2.4%) | 20 (10.1%) |
| 5:00 AM to 5:29 AM | 0 (0.0%) | 0 (0.0%) |
| 5:30 AM to 5:59 AM | 29 (10.0%) | 0 (0.0%) |
| 6:00 AM to 6:29 AM | 22 (7.6%) | 33 (16.6%) |
| 6:30 AM to 6:59 AM | 86 (29.7%) | 34 (17.1%) |
| 7:00 AM to 7:29 AM | 73 (25.2%) | 40 (20.1%) |
| 7:30 AM to 7:59 AM | 38 (13.1%) | 23 (11.6%) |
| 8:00 AM to 8:29 AM | 28 (9.7%) | 0 (0.0%) |
| 8:30 AM to 8:59 AM | 7 (2.4%) | 11 (5.5%) |
| 9:00 AM to 9:59 AM | 0 (0.0%) | 5 (2.5%) |
| 10:00 AM to 10:59 AM | 0 (0.0%) | 0 (0.0%) |
| 11:00 AM to 11:59 AM | 0 (0.0%) | 0 (0.0%) |
| 12:00 PM to 3:59 PM | 0 (0.0%) | 31 (15.6%) |
| 4:00 PM to 11:59 PM | 0 (0.0%) | 2 (1.0%) |
| Total | 290 (100.0%) | 199 (100.0%) |
Housing Occupancy in Plains
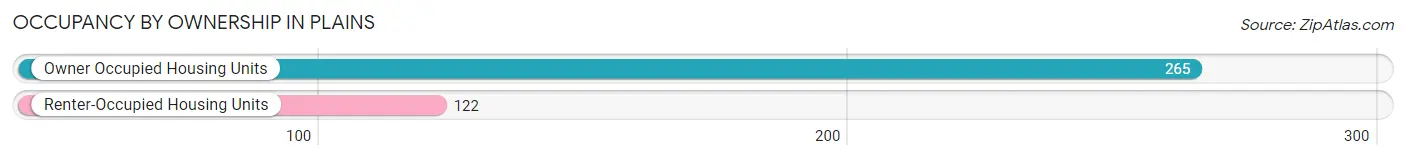
Occupancy by Ownership in Plains
Of the total 387 dwellings in Plains, owner-occupied units account for 265 (68.5%), while renter-occupied units make up 122 (31.5%).
| Occupancy | # Housing Units | % Housing Units |
| Owner Occupied Housing Units | 265 | 68.5% |
| Renter-Occupied Housing Units | 122 | 31.5% |
| Total Occupied Housing Units | 387 | 100.0% |
Occupancy by Household Size in Plains
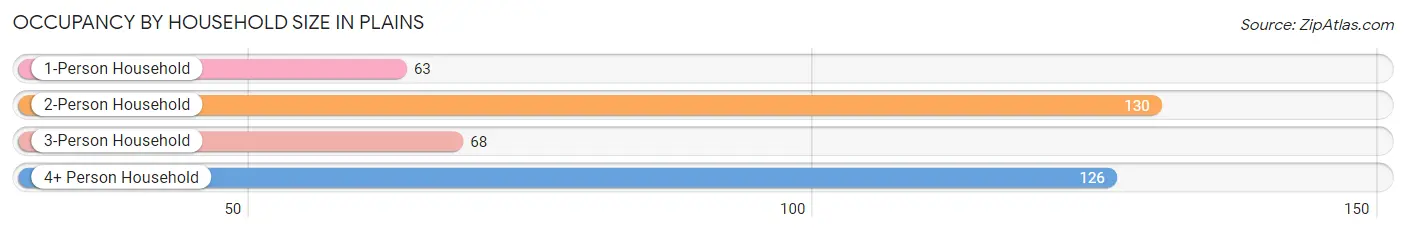
| Household Size | # Housing Units | % Housing Units |
| 1-Person Household | 63 | 16.3% |
| 2-Person Household | 130 | 33.6% |
| 3-Person Household | 68 | 17.6% |
| 4+ Person Household | 126 | 32.6% |
| Total Housing Units | 387 | 100.0% |
Occupancy by Ownership by Household Size in Plains
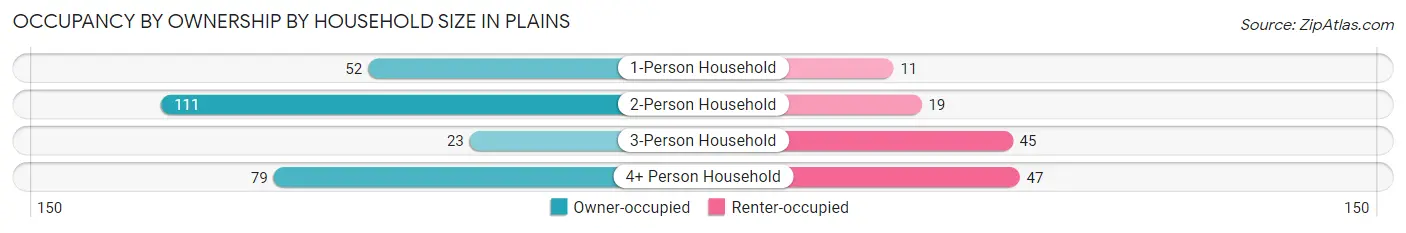
| Household Size | Owner-occupied | Renter-occupied |
| 1-Person Household | 52 (82.5%) | 11 (17.5%) |
| 2-Person Household | 111 (85.4%) | 19 (14.6%) |
| 3-Person Household | 23 (33.8%) | 45 (66.2%) |
| 4+ Person Household | 79 (62.7%) | 47 (37.3%) |
| Total Housing Units | 265 (68.5%) | 122 (31.5%) |
Occupancy by Educational Attainment in Plains
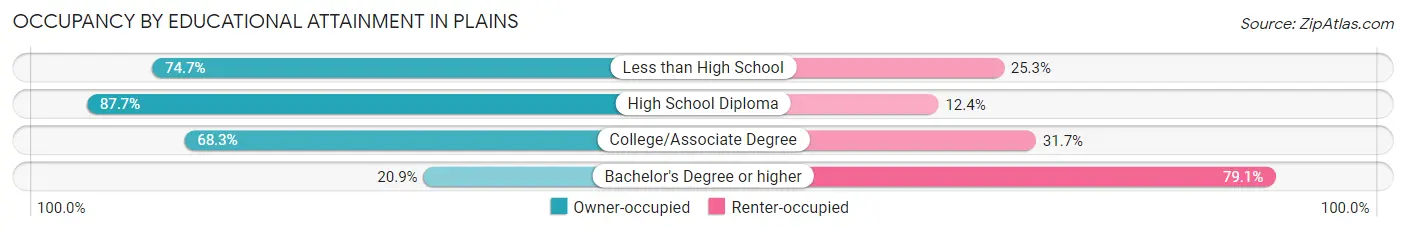
| Household Size | Owner-occupied | Renter-occupied |
| Less than High School | 62 (74.7%) | 21 (25.3%) |
| High School Diploma | 71 (87.6%) | 10 (12.3%) |
| College/Associate Degree | 123 (68.3%) | 57 (31.7%) |
| Bachelor's Degree or higher | 9 (20.9%) | 34 (79.1%) |
Occupancy by Age of Householder in Plains
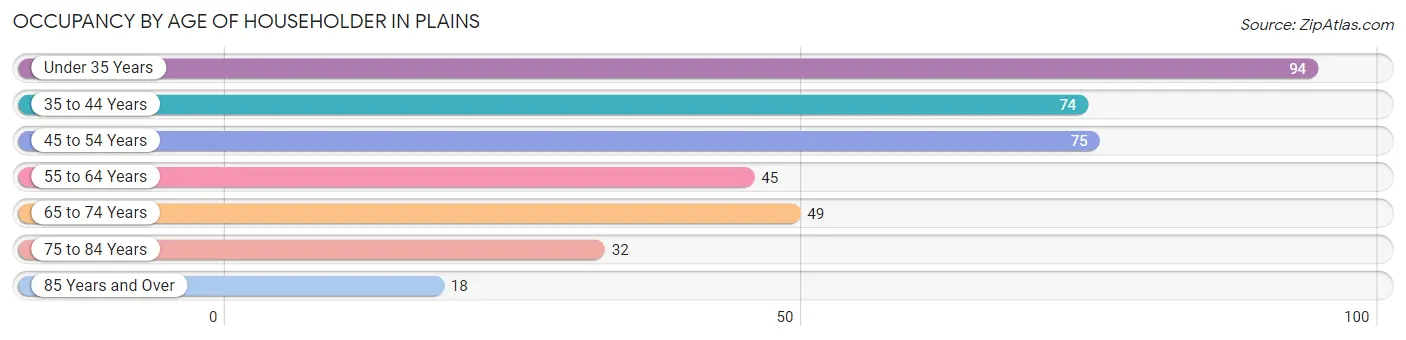
| Age Bracket | # Households | % Households |
| Under 35 Years | 94 | 24.3% |
| 35 to 44 Years | 74 | 19.1% |
| 45 to 54 Years | 75 | 19.4% |
| 55 to 64 Years | 45 | 11.6% |
| 65 to 74 Years | 49 | 12.7% |
| 75 to 84 Years | 32 | 8.3% |
| 85 Years and Over | 18 | 4.6% |
| Total | 387 | 100.0% |
Housing Finances in Plains
Median Income by Occupancy in Plains
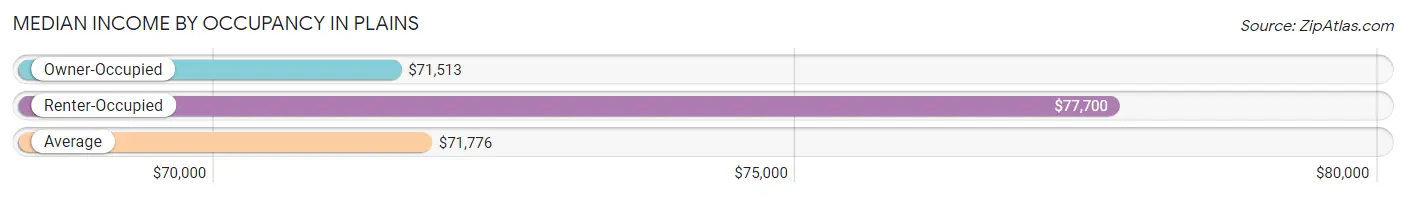
| Occupancy Type | # Households | Median Income |
| Owner-Occupied | 265 (68.5%) | $71,513 |
| Renter-Occupied | 122 (31.5%) | $77,700 |
| Average | 387 (100.0%) | $71,776 |
Occupancy by Householder Income Bracket in Plains
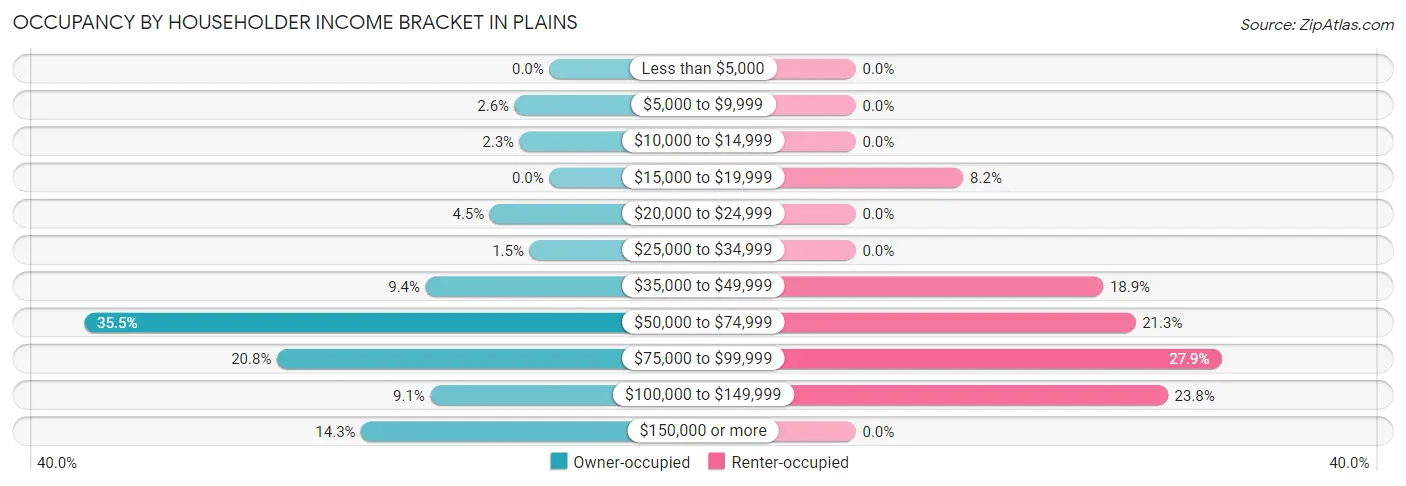
| Income Bracket | Owner-occupied | Renter-occupied |
| Less than $5,000 | 0 (0.0%) | 0 (0.0%) |
| $5,000 to $9,999 | 7 (2.6%) | 0 (0.0%) |
| $10,000 to $14,999 | 6 (2.3%) | 0 (0.0%) |
| $15,000 to $19,999 | 0 (0.0%) | 10 (8.2%) |
| $20,000 to $24,999 | 12 (4.5%) | 0 (0.0%) |
| $25,000 to $34,999 | 4 (1.5%) | 0 (0.0%) |
| $35,000 to $49,999 | 25 (9.4%) | 23 (18.9%) |
| $50,000 to $74,999 | 94 (35.5%) | 26 (21.3%) |
| $75,000 to $99,999 | 55 (20.7%) | 34 (27.9%) |
| $100,000 to $149,999 | 24 (9.1%) | 29 (23.8%) |
| $150,000 or more | 38 (14.3%) | 0 (0.0%) |
| Total | 265 (100.0%) | 122 (100.0%) |
Monthly Housing Cost Tiers in Plains
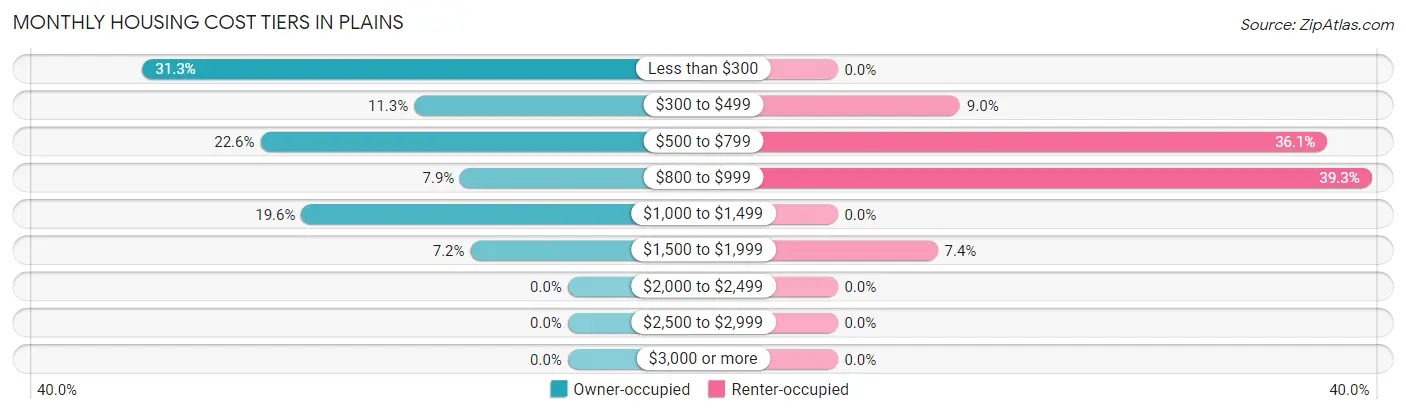
| Monthly Cost | Owner-occupied | Renter-occupied |
| Less than $300 | 83 (31.3%) | 0 (0.0%) |
| $300 to $499 | 30 (11.3%) | 11 (9.0%) |
| $500 to $799 | 60 (22.6%) | 44 (36.1%) |
| $800 to $999 | 21 (7.9%) | 48 (39.3%) |
| $1,000 to $1,499 | 52 (19.6%) | 0 (0.0%) |
| $1,500 to $1,999 | 19 (7.2%) | 9 (7.4%) |
| $2,000 to $2,499 | 0 (0.0%) | 0 (0.0%) |
| $2,500 to $2,999 | 0 (0.0%) | 0 (0.0%) |
| $3,000 or more | 0 (0.0%) | 0 (0.0%) |
| Total | 265 (100.0%) | 122 (100.0%) |
Physical Housing Characteristics in Plains
Housing Structures in Plains
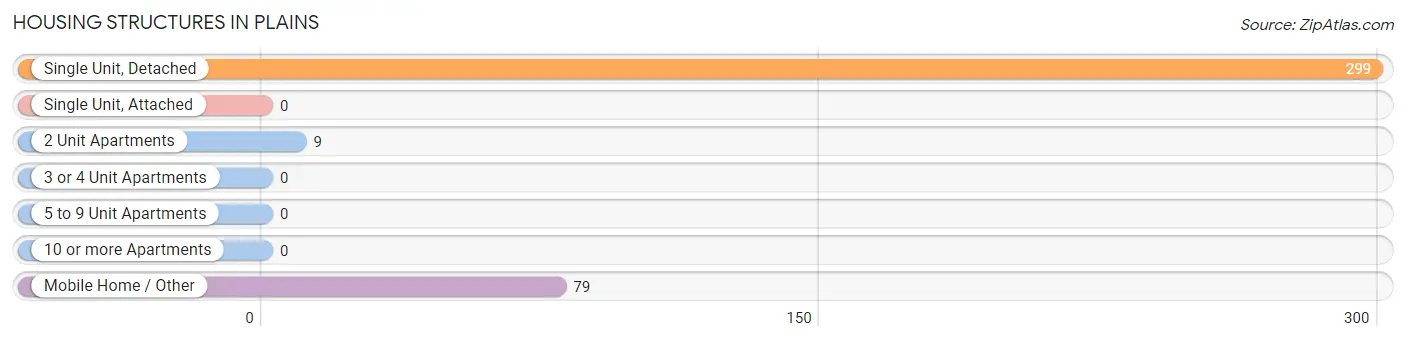
| Structure Type | # Housing Units | % Housing Units |
| Single Unit, Detached | 299 | 77.3% |
| Single Unit, Attached | 0 | 0.0% |
| 2 Unit Apartments | 9 | 2.3% |
| 3 or 4 Unit Apartments | 0 | 0.0% |
| 5 to 9 Unit Apartments | 0 | 0.0% |
| 10 or more Apartments | 0 | 0.0% |
| Mobile Home / Other | 79 | 20.4% |
| Total | 387 | 100.0% |
Housing Structures by Occupancy in Plains
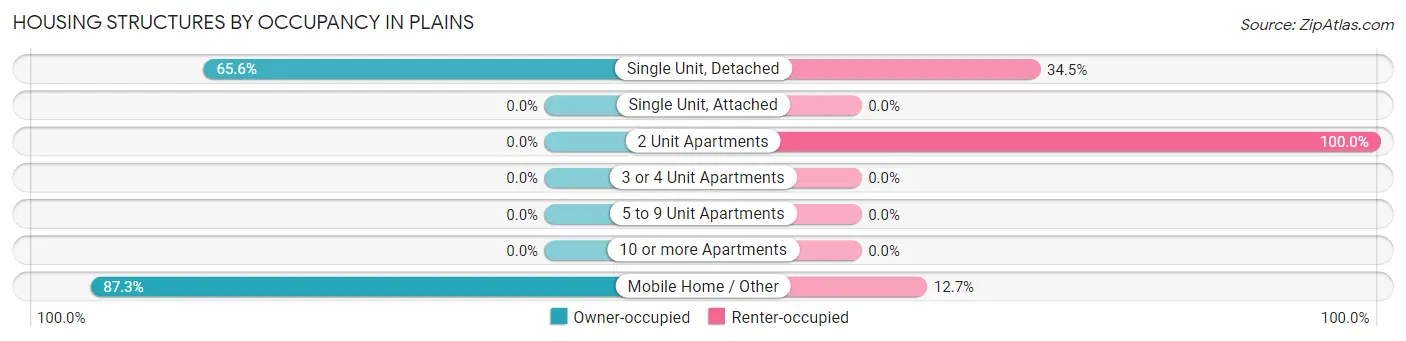
| Structure Type | Owner-occupied | Renter-occupied |
| Single Unit, Detached | 196 (65.5%) | 103 (34.4%) |
| Single Unit, Attached | 0 (0.0%) | 0 (0.0%) |
| 2 Unit Apartments | 0 (0.0%) | 9 (100.0%) |
| 3 or 4 Unit Apartments | 0 (0.0%) | 0 (0.0%) |
| 5 to 9 Unit Apartments | 0 (0.0%) | 0 (0.0%) |
| 10 or more Apartments | 0 (0.0%) | 0 (0.0%) |
| Mobile Home / Other | 69 (87.3%) | 10 (12.7%) |
| Total | 265 (68.5%) | 122 (31.5%) |
Housing Structures by Number of Rooms in Plains
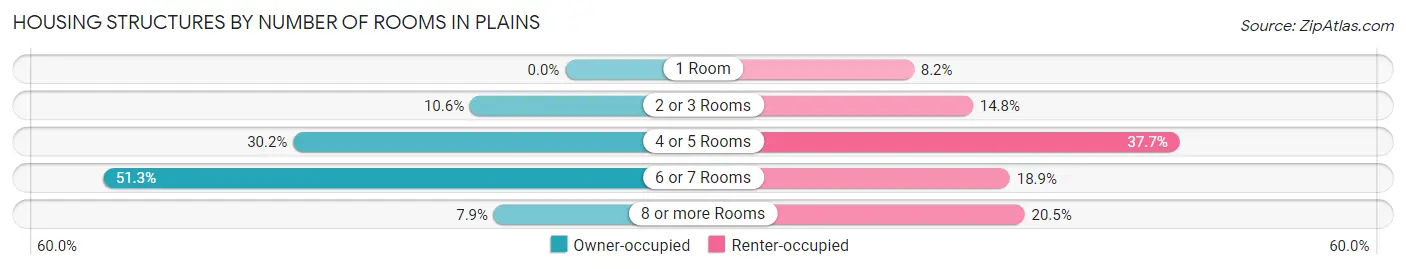
| Number of Rooms | Owner-occupied | Renter-occupied |
| 1 Room | 0 (0.0%) | 10 (8.2%) |
| 2 or 3 Rooms | 28 (10.6%) | 18 (14.7%) |
| 4 or 5 Rooms | 80 (30.2%) | 46 (37.7%) |
| 6 or 7 Rooms | 136 (51.3%) | 23 (18.9%) |
| 8 or more Rooms | 21 (7.9%) | 25 (20.5%) |
| Total | 265 (100.0%) | 122 (100.0%) |
Housing Structure by Heating Type in Plains
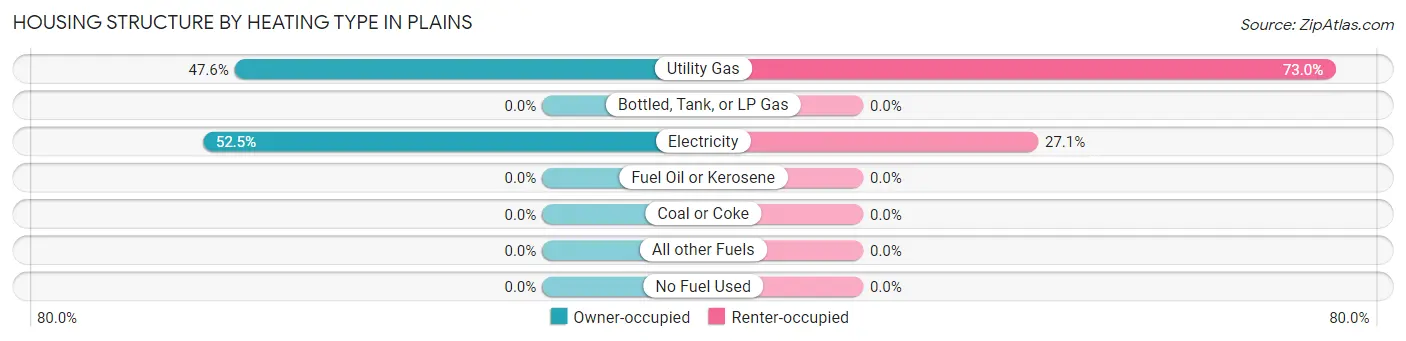
| Heating Type | Owner-occupied | Renter-occupied |
| Utility Gas | 126 (47.5%) | 89 (73.0%) |
| Bottled, Tank, or LP Gas | 0 (0.0%) | 0 (0.0%) |
| Electricity | 139 (52.4%) | 33 (27.1%) |
| Fuel Oil or Kerosene | 0 (0.0%) | 0 (0.0%) |
| Coal or Coke | 0 (0.0%) | 0 (0.0%) |
| All other Fuels | 0 (0.0%) | 0 (0.0%) |
| No Fuel Used | 0 (0.0%) | 0 (0.0%) |
| Total | 265 (100.0%) | 122 (100.0%) |
Household Vehicle Usage in Plains
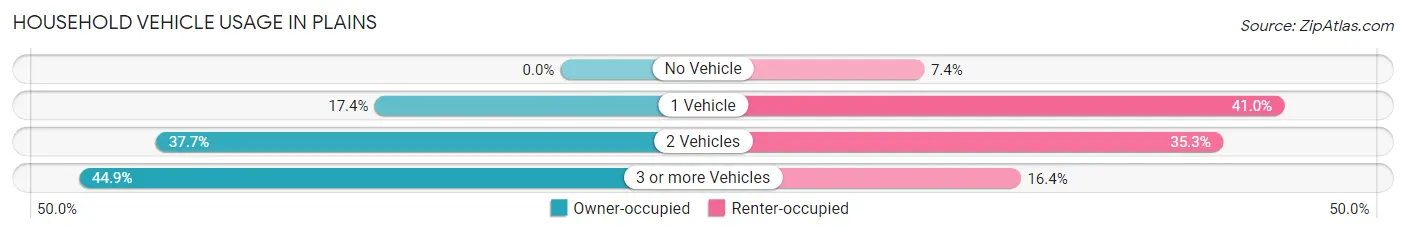
| Vehicles per Household | Owner-occupied | Renter-occupied |
| No Vehicle | 0 (0.0%) | 9 (7.4%) |
| 1 Vehicle | 46 (17.4%) | 50 (41.0%) |
| 2 Vehicles | 100 (37.7%) | 43 (35.2%) |
| 3 or more Vehicles | 119 (44.9%) | 20 (16.4%) |
| Total | 265 (100.0%) | 122 (100.0%) |
Real Estate & Mortgages in Plains
Real Estate and Mortgage Overview in Plains
| Characteristic | Without Mortgage | With Mortgage |
| Housing Units | 167 | 98 |
| Median Property Value | $74,200 | $156,300 |
| Median Household Income | $64,671 | $15 |
| Monthly Housing Costs | $301 | $0 |
| Real Estate Taxes | $390 | $0 |
Property Value by Mortgage Status in Plains
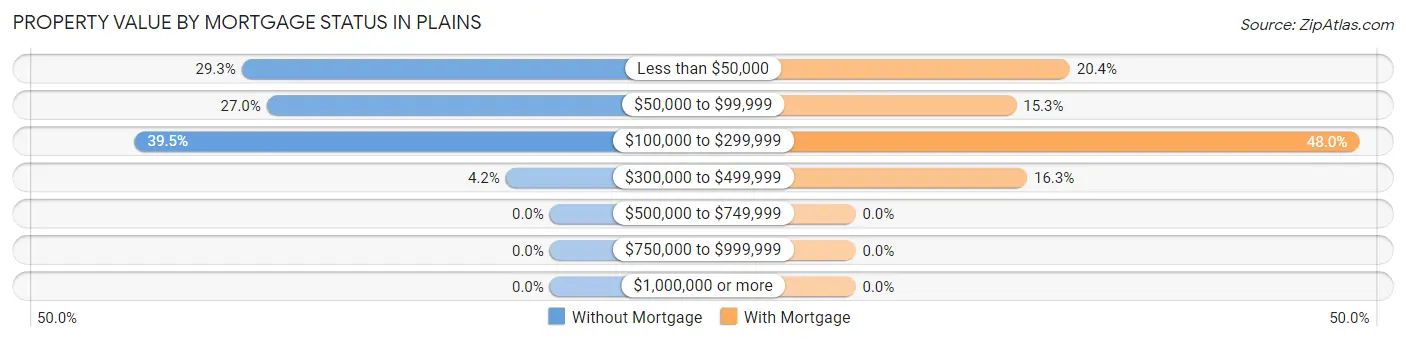
| Property Value | Without Mortgage | With Mortgage |
| Less than $50,000 | 49 (29.3%) | 20 (20.4%) |
| $50,000 to $99,999 | 45 (27.0%) | 15 (15.3%) |
| $100,000 to $299,999 | 66 (39.5%) | 47 (48.0%) |
| $300,000 to $499,999 | 7 (4.2%) | 16 (16.3%) |
| $500,000 to $749,999 | 0 (0.0%) | 0 (0.0%) |
| $750,000 to $999,999 | 0 (0.0%) | 0 (0.0%) |
| $1,000,000 or more | 0 (0.0%) | 0 (0.0%) |
| Total | 167 (100.0%) | 98 (100.0%) |
Household Income by Mortgage Status in Plains
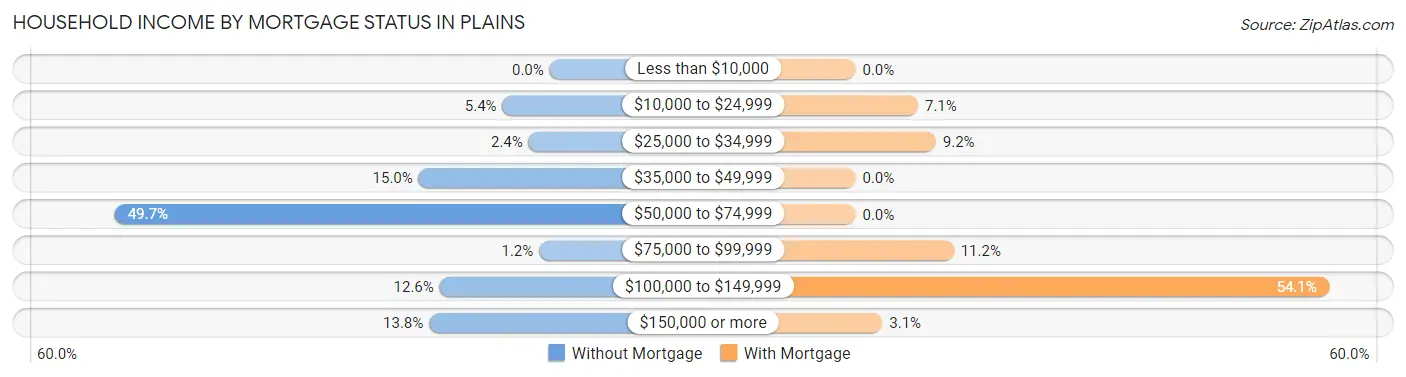
| Household Income | Without Mortgage | With Mortgage |
| Less than $10,000 | 0 (0.0%) | 0 (0.0%) |
| $10,000 to $24,999 | 9 (5.4%) | 7 (7.1%) |
| $25,000 to $34,999 | 4 (2.4%) | 9 (9.2%) |
| $35,000 to $49,999 | 25 (15.0%) | 0 (0.0%) |
| $50,000 to $74,999 | 83 (49.7%) | 0 (0.0%) |
| $75,000 to $99,999 | 2 (1.2%) | 11 (11.2%) |
| $100,000 to $149,999 | 21 (12.6%) | 53 (54.1%) |
| $150,000 or more | 23 (13.8%) | 3 (3.1%) |
| Total | 167 (100.0%) | 98 (100.0%) |
Property Value to Household Income Ratio in Plains
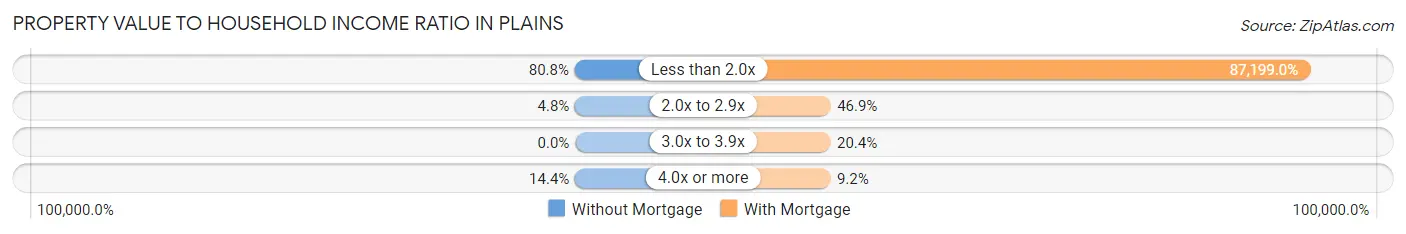
| Value-to-Income Ratio | Without Mortgage | With Mortgage |
| Less than 2.0x | 135 (80.8%) | 85,455 (87,199.0%) |
| 2.0x to 2.9x | 8 (4.8%) | 46 (46.9%) |
| 3.0x to 3.9x | 0 (0.0%) | 20 (20.4%) |
| 4.0x or more | 24 (14.4%) | 9 (9.2%) |
| Total | 167 (100.0%) | 98 (100.0%) |
Real Estate Taxes by Mortgage Status in Plains
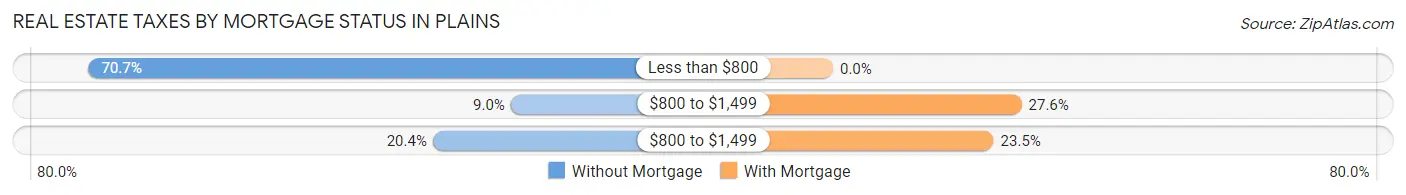
| Property Taxes | Without Mortgage | With Mortgage |
| Less than $800 | 118 (70.7%) | 0 (0.0%) |
| $800 to $1,499 | 15 (9.0%) | 27 (27.6%) |
| $800 to $1,499 | 34 (20.4%) | 23 (23.5%) |
| Total | 167 (100.0%) | 98 (100.0%) |
Health & Disability in Plains
Health Insurance Coverage by Age in Plains
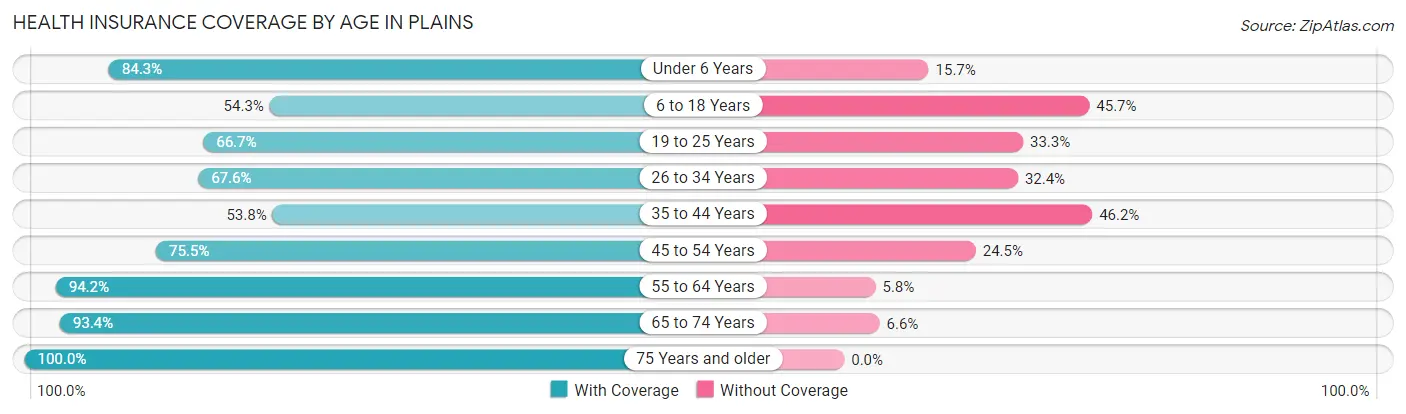
| Age Bracket | With Coverage | Without Coverage |
| Under 6 Years | 134 (84.3%) | 25 (15.7%) |
| 6 to 18 Years | 101 (54.3%) | 85 (45.7%) |
| 19 to 25 Years | 80 (66.7%) | 40 (33.3%) |
| 26 to 34 Years | 71 (67.6%) | 34 (32.4%) |
| 35 to 44 Years | 57 (53.8%) | 49 (46.2%) |
| 45 to 54 Years | 117 (75.5%) | 38 (24.5%) |
| 55 to 64 Years | 97 (94.2%) | 6 (5.8%) |
| 65 to 74 Years | 71 (93.4%) | 5 (6.6%) |
| 75 Years and older | 56 (100.0%) | 0 (0.0%) |
| Total | 784 (73.6%) | 282 (26.5%) |
Health Insurance Coverage by Citizenship Status in Plains
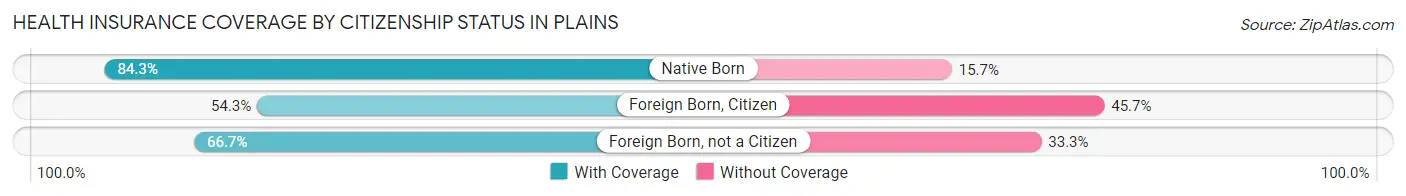
| Citizenship Status | With Coverage | Without Coverage |
| Native Born | 134 (84.3%) | 25 (15.7%) |
| Foreign Born, Citizen | 101 (54.3%) | 85 (45.7%) |
| Foreign Born, not a Citizen | 80 (66.7%) | 40 (33.3%) |
Health Insurance Coverage by Household Income in Plains
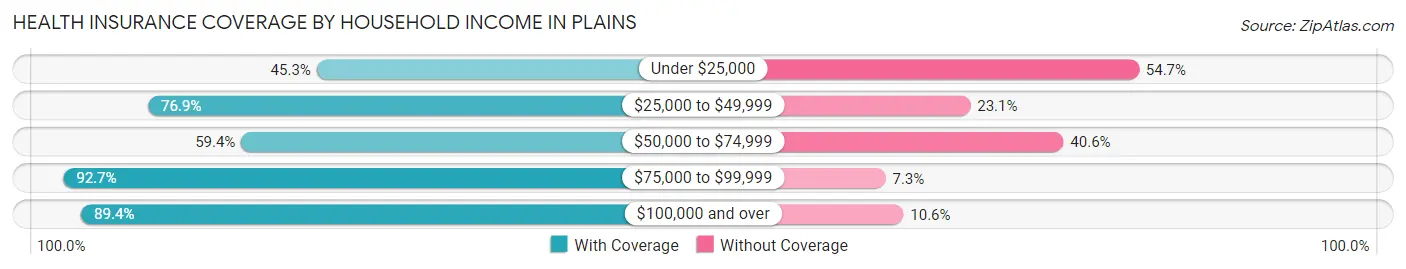
| Household Income | With Coverage | Without Coverage |
| Under $25,000 | 48 (45.3%) | 58 (54.7%) |
| $25,000 to $49,999 | 93 (76.9%) | 28 (23.1%) |
| $50,000 to $74,999 | 224 (59.4%) | 153 (40.6%) |
| $75,000 to $99,999 | 166 (92.7%) | 13 (7.3%) |
| $100,000 and over | 253 (89.4%) | 30 (10.6%) |
Public vs Private Health Insurance Coverage by Age in Plains
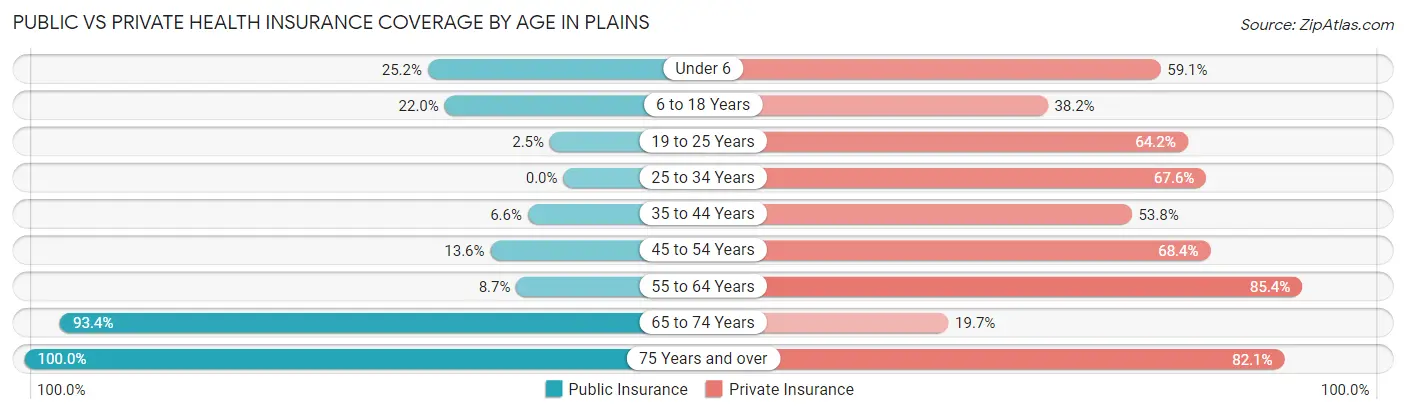
| Age Bracket | Public Insurance | Private Insurance |
| Under 6 | 40 (25.2%) | 94 (59.1%) |
| 6 to 18 Years | 41 (22.0%) | 71 (38.2%) |
| 19 to 25 Years | 3 (2.5%) | 77 (64.2%) |
| 25 to 34 Years | 0 (0.0%) | 71 (67.6%) |
| 35 to 44 Years | 7 (6.6%) | 57 (53.8%) |
| 45 to 54 Years | 21 (13.6%) | 106 (68.4%) |
| 55 to 64 Years | 9 (8.7%) | 88 (85.4%) |
| 65 to 74 Years | 71 (93.4%) | 15 (19.7%) |
| 75 Years and over | 56 (100.0%) | 46 (82.1%) |
| Total | 248 (23.3%) | 625 (58.6%) |
Disability Status by Sex by Age in Plains
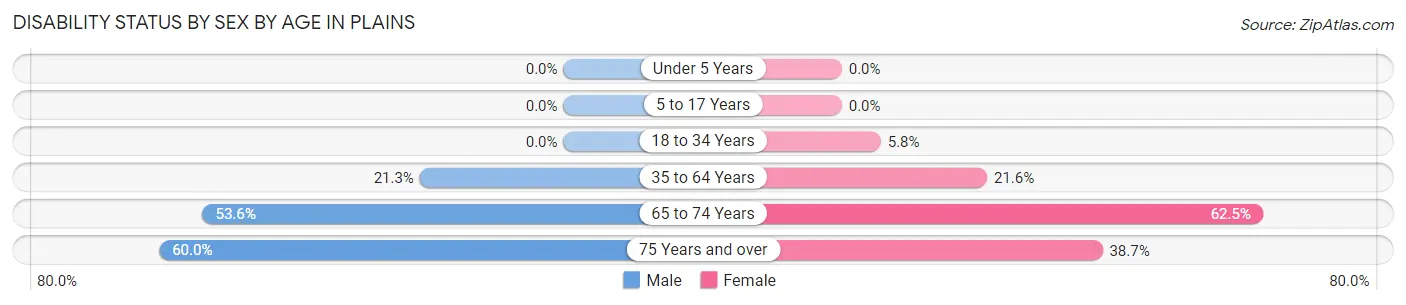
| Age Bracket | Male | Female |
| Under 5 Years | 0 (0.0%) | 0 (0.0%) |
| 5 to 17 Years | 0 (0.0%) | 0 (0.0%) |
| 18 to 34 Years | 0 (0.0%) | 7 (5.8%) |
| 35 to 64 Years | 45 (21.3%) | 33 (21.6%) |
| 65 to 74 Years | 15 (53.6%) | 30 (62.5%) |
| 75 Years and over | 15 (60.0%) | 12 (38.7%) |
Disability Class by Sex by Age in Plains
Disability Class: Hearing Difficulty
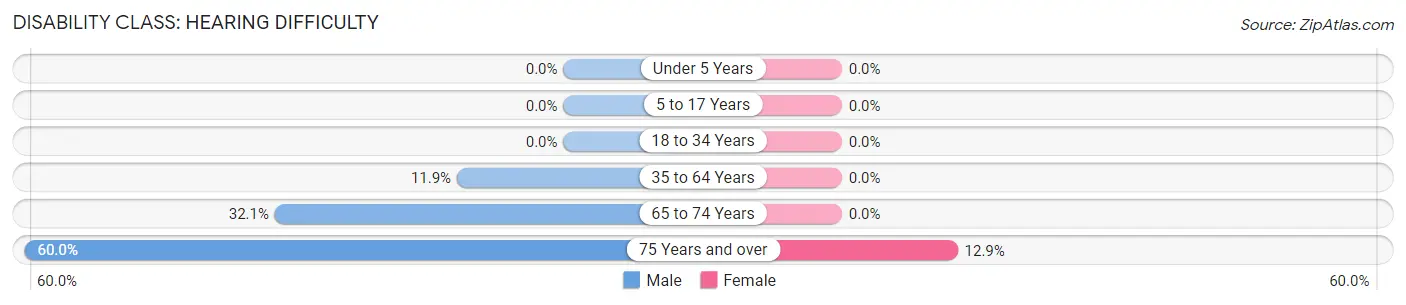
| Age Bracket | Male | Female |
| Under 5 Years | 0 (0.0%) | 0 (0.0%) |
| 5 to 17 Years | 0 (0.0%) | 0 (0.0%) |
| 18 to 34 Years | 0 (0.0%) | 0 (0.0%) |
| 35 to 64 Years | 25 (11.8%) | 0 (0.0%) |
| 65 to 74 Years | 9 (32.1%) | 0 (0.0%) |
| 75 Years and over | 15 (60.0%) | 4 (12.9%) |
Disability Class: Vision Difficulty
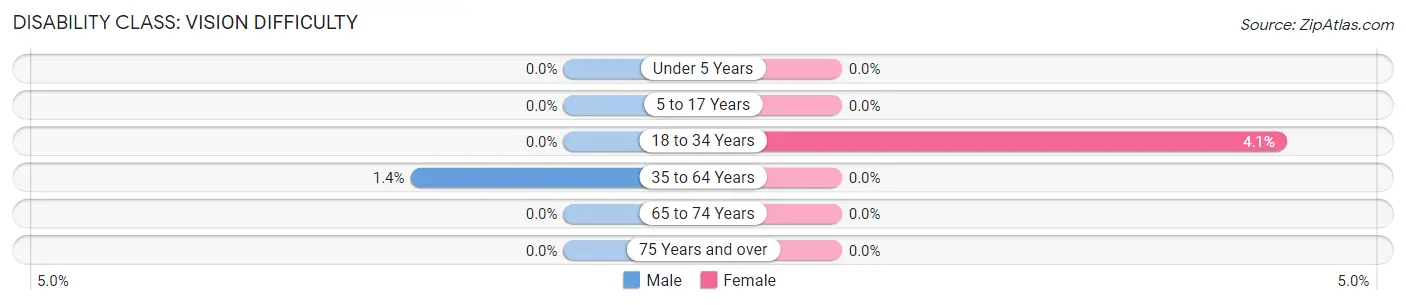
| Age Bracket | Male | Female |
| Under 5 Years | 0 (0.0%) | 0 (0.0%) |
| 5 to 17 Years | 0 (0.0%) | 0 (0.0%) |
| 18 to 34 Years | 0 (0.0%) | 5 (4.1%) |
| 35 to 64 Years | 3 (1.4%) | 0 (0.0%) |
| 65 to 74 Years | 0 (0.0%) | 0 (0.0%) |
| 75 Years and over | 0 (0.0%) | 0 (0.0%) |
Disability Class: Cognitive Difficulty
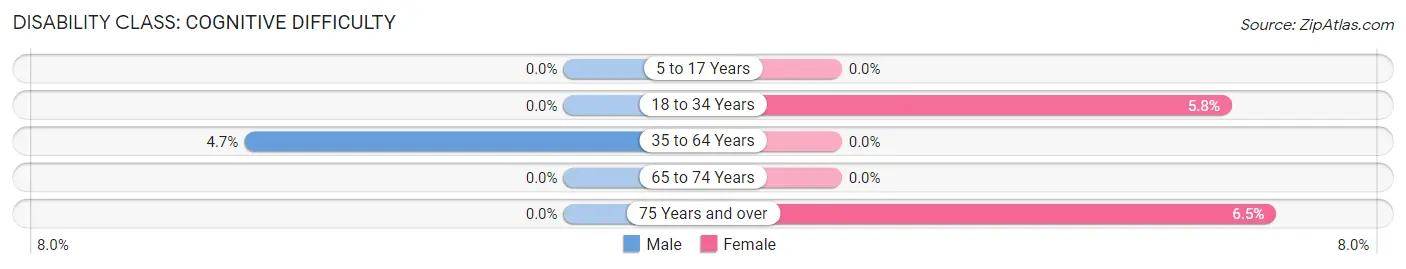
| Age Bracket | Male | Female |
| 5 to 17 Years | 0 (0.0%) | 0 (0.0%) |
| 18 to 34 Years | 0 (0.0%) | 7 (5.8%) |
| 35 to 64 Years | 10 (4.7%) | 0 (0.0%) |
| 65 to 74 Years | 0 (0.0%) | 0 (0.0%) |
| 75 Years and over | 0 (0.0%) | 2 (6.5%) |
Disability Class: Ambulatory Difficulty
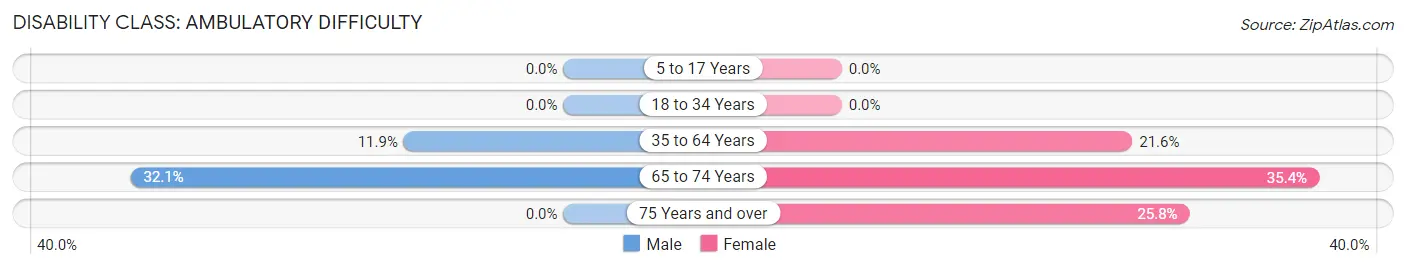
| Age Bracket | Male | Female |
| 5 to 17 Years | 0 (0.0%) | 0 (0.0%) |
| 18 to 34 Years | 0 (0.0%) | 0 (0.0%) |
| 35 to 64 Years | 25 (11.8%) | 33 (21.6%) |
| 65 to 74 Years | 9 (32.1%) | 17 (35.4%) |
| 75 Years and over | 0 (0.0%) | 8 (25.8%) |
Disability Class: Self-Care Difficulty
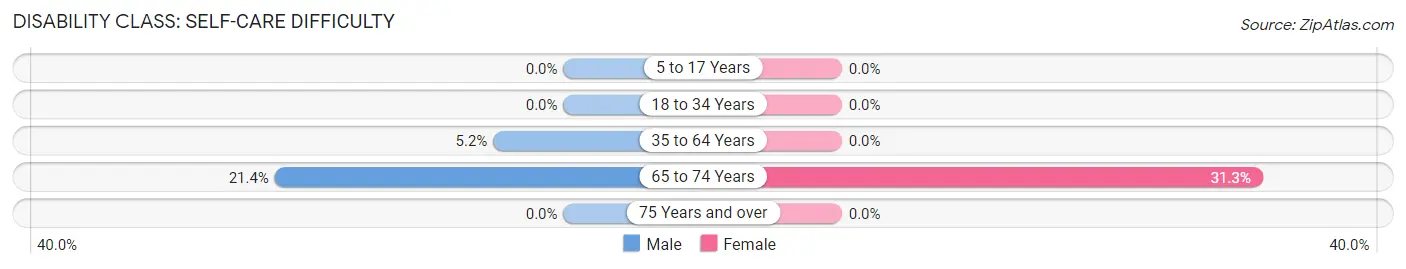
| Age Bracket | Male | Female |
| 5 to 17 Years | 0 (0.0%) | 0 (0.0%) |
| 18 to 34 Years | 0 (0.0%) | 0 (0.0%) |
| 35 to 64 Years | 11 (5.2%) | 0 (0.0%) |
| 65 to 74 Years | 6 (21.4%) | 15 (31.2%) |
| 75 Years and over | 0 (0.0%) | 0 (0.0%) |
Technology Access in Plains
Computing Device Access in Plains
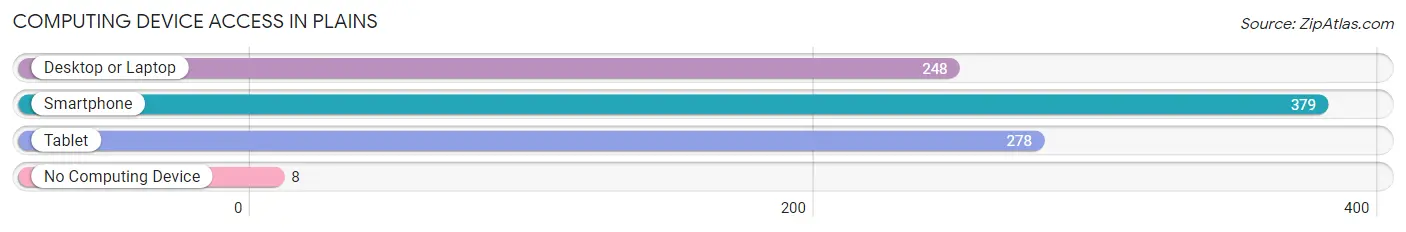
| Device Type | # Households | % Households |
| Desktop or Laptop | 248 | 64.1% |
| Smartphone | 379 | 97.9% |
| Tablet | 278 | 71.8% |
| No Computing Device | 8 | 2.1% |
| Total | 387 | 100.0% |
Internet Access in Plains
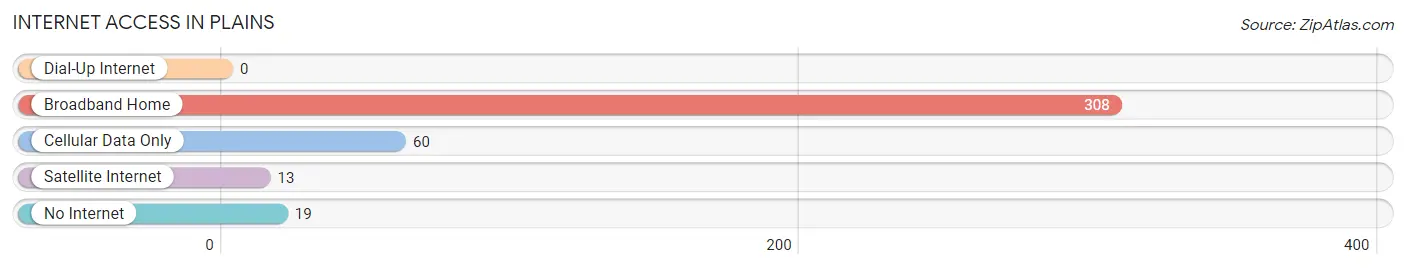
| Internet Type | # Households | % Households |
| Dial-Up Internet | 0 | 0.0% |
| Broadband Home | 308 | 79.6% |
| Cellular Data Only | 60 | 15.5% |
| Satellite Internet | 13 | 3.4% |
| No Internet | 19 | 4.9% |
| Total | 387 | 100.0% |
Plains Summary
Plains, Texas is a small town located in Yoakum County, Texas. It is situated in the South Plains region of the state, approximately 30 miles east of Lubbock. The town was founded in 1891 and has a population of approximately 1,000 people.
History
The town of Plains was founded in 1891 by a group of settlers from the nearby town of Post. The settlers were looking for a place to settle and start a new life. The town was named after the nearby Plains of San Agustin, which were located just to the east of the town. The town was originally a farming community, and the settlers grew cotton, corn, and wheat.
In the early 1900s, the town began to grow and prosper. The town was home to several businesses, including a general store, a blacksmith shop, and a hotel. The town also had a school, a post office, and a bank.
In the 1920s, the town began to experience a decline in population. This was due to the Great Depression and the Dust Bowl. Many of the town's residents moved away in search of better opportunities.
In the 1940s, the town began to experience a resurgence in population. This was due to the discovery of oil in the area. The town was home to several oil companies, and the population began to grow again.
Geography
Plains is located in the South Plains region of Texas. It is situated in Yoakum County, approximately 30 miles east of Lubbock. The town is located on the edge of the Llano Estacado, a large plateau that stretches across the western part of the state. The town is surrounded by flat, open plains, and the terrain is mostly flat and dry.
Economy
The economy of Plains is largely based on agriculture and oil production. The town is home to several farms, which produce cotton, corn, wheat, and other crops. The town is also home to several oil companies, which produce oil and gas from the nearby fields.
The town is also home to several small businesses, including restaurants, stores, and other services. The town is also home to a small airport, which serves the surrounding area.
Demographics
As of the 2010 census, the population of Plains was 1,000 people. The town is predominantly white, with approximately 95% of the population being white. The remaining 5% of the population is made up of African Americans, Hispanics, and other ethnicities.
The median household income in Plains is $35,000, and the median home value is $90,000. The town has a poverty rate of approximately 20%, which is higher than the national average.
Conclusion
Plains, Texas is a small town located in Yoakum County, Texas. It is situated in the South Plains region of the state, approximately 30 miles east of Lubbock. The town was founded in 1891 and has a population of approximately 1,000 people. The town's economy is largely based on agriculture and oil production, and the town is home to several small businesses. The town is predominantly white, with approximately 95% of the population being white. The median household income in Plains is $35,000, and the median home value is $90,000.
Common Questions
What is Per Capita Income in Plains?
Per Capita income in Plains is $30,864.
What is the Median Family Income in Plains?
Median Family Income in Plains is $75,000.
What is the Median Household income in Plains?
Median Household Income in Plains is $71,776.
What is Income or Wage Gap in Plains?
Income or Wage Gap in Plains is 57.8%.
Women in Plains earn 42.2 cents for every dollar earned by a man.
What is Inequality or Gini Index in Plains?
Inequality or Gini Index in Plains is 0.33.
What is the Total Population of Plains?
Total Population of Plains is 1,066.
What is the Total Male Population of Plains?
Total Male Population of Plains is 505.
What is the Total Female Population of Plains?
Total Female Population of Plains is 561.
What is the Ratio of Males per 100 Females in Plains?
There are 90.02 Males per 100 Females in Plains.
What is the Ratio of Females per 100 Males in Plains?
There are 111.09 Females per 100 Males in Plains.
What is the Median Population Age in Plains?
Median Population Age in Plains is 31.3 Years.
What is the Average Family Size in Plains
Average Family Size in Plains is 3.0 People.
What is the Average Household Size in Plains
Average Household Size in Plains is 2.8 People.
How Large is the Labor Force in Plains?
There are 533 People in the Labor Forcein in Plains.
What is the Percentage of People in the Labor Force in Plains?
71.1% of People are in the Labor Force in Plains.
What is the Unemployment Rate in Plains?
Unemployment Rate in Plains is 5.8%.