Pineland, TX Map & Demographics
Pineland Map
Pineland Overview
$21,883
PER CAPITA INCOME
$56,250
AVG FAMILY INCOME
$29,722
AVG HOUSEHOLD INCOME
0.48
INEQUALITY / GINI INDEX
1,192
TOTAL POPULATION
567
MALE POPULATION
625
FEMALE POPULATION
90.72
MALES / 100 FEMALES
110.23
FEMALES / 100 MALES
36.0
MEDIAN AGE
3.1
AVG FAMILY SIZE
2.5
AVG HOUSEHOLD SIZE
503
LABOR FORCE [ PEOPLE ]
55.9%
PERCENT IN LABOR FORCE
11.5%
UNEMPLOYMENT RATE
Pineland Zip Codes
Pineland Area Codes
Income in Pineland
Income Overview in Pineland
Per Capita Income in Pineland is $21,883, while median incomes of families and households are $56,250 and $29,722 respectively.
| Characteristic | Number | Measure |
| Per Capita Income | 1,192 | $21,883 |
| Median Family Income | 276 | $56,250 |
| Mean Family Income | 276 | $65,702 |
| Median Household Income | 468 | $29,722 |
| Mean Household Income | 468 | $48,961 |
| Income Deficit | 276 | $0 |
| Wage / Income Gap (%) | 1,192 | 0.00% |
| Wage / Income Gap ($) | 1,192 | 100.00¢ per $1 |
| Gini / Inequality Index | 1,192 | 0.48 |
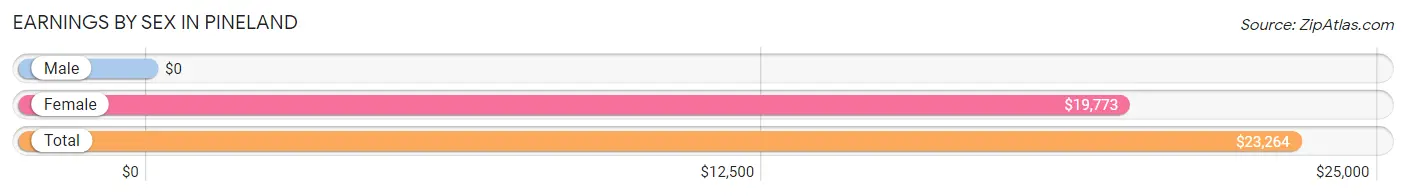
Earnings by Sex in Pineland
| Sex | Number | Average Earnings |
| Male | 212 (43.4%) | $0 |
| Female | 276 (56.6%) | $19,773 |
| Total | 488 (100.0%) | $23,264 |
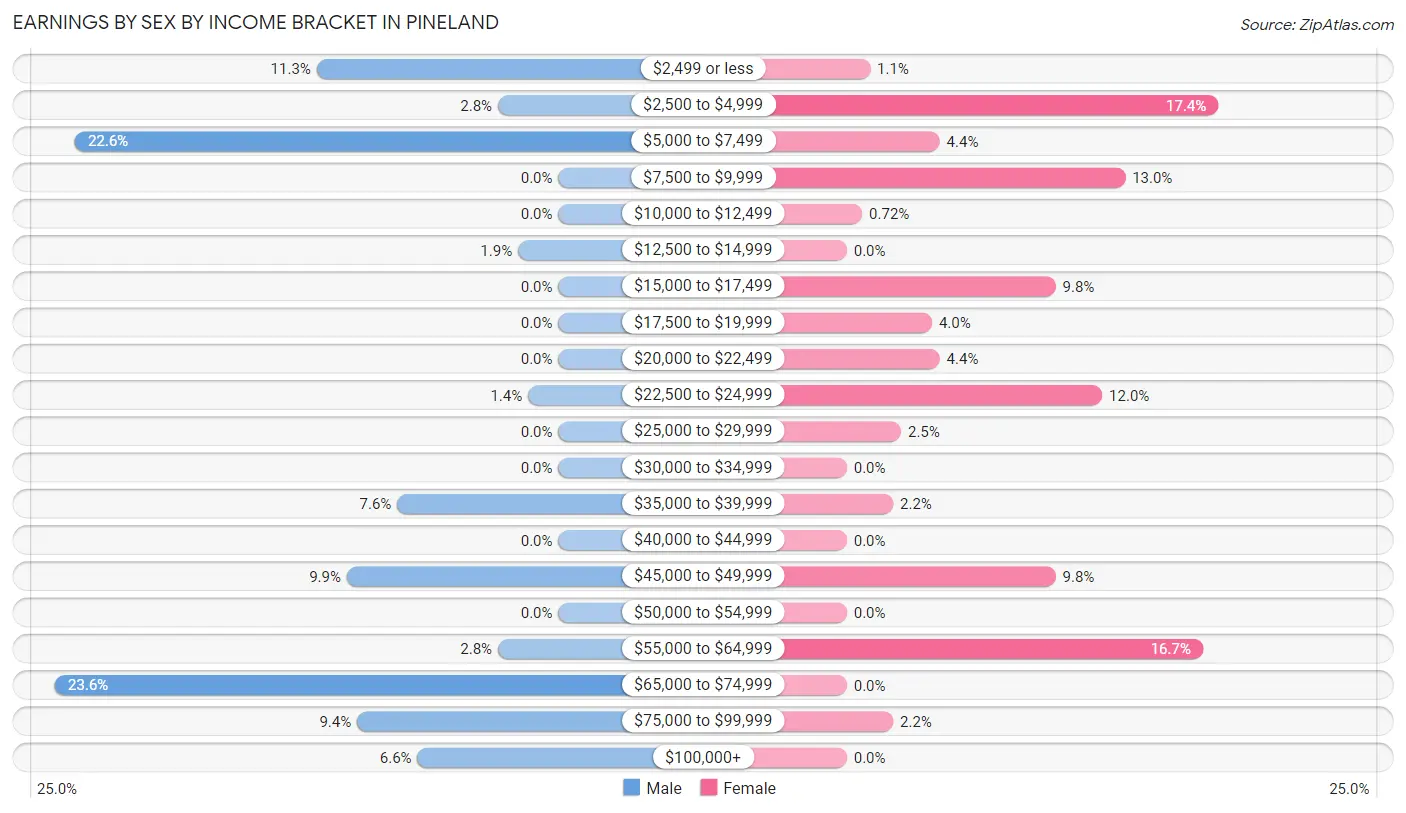
Earnings by Sex by Income Bracket in Pineland
The most common earnings brackets in Pineland are $65,000 to $74,999 for men (50 | 23.6%) and $2,500 to $4,999 for women (48 | 17.4%).
| Income | Male | Female |
| $2,499 or less | 24 (11.3%) | 3 (1.1%) |
| $2,500 to $4,999 | 6 (2.8%) | 48 (17.4%) |
| $5,000 to $7,499 | 48 (22.6%) | 12 (4.3%) |
| $7,500 to $9,999 | 0 (0.0%) | 36 (13.0%) |
| $10,000 to $12,499 | 0 (0.0%) | 2 (0.7%) |
| $12,500 to $14,999 | 4 (1.9%) | 0 (0.0%) |
| $15,000 to $17,499 | 0 (0.0%) | 27 (9.8%) |
| $17,500 to $19,999 | 0 (0.0%) | 11 (4.0%) |
| $20,000 to $22,499 | 0 (0.0%) | 12 (4.3%) |
| $22,500 to $24,999 | 3 (1.4%) | 33 (12.0%) |
| $25,000 to $29,999 | 0 (0.0%) | 7 (2.5%) |
| $30,000 to $34,999 | 0 (0.0%) | 0 (0.0%) |
| $35,000 to $39,999 | 16 (7.5%) | 6 (2.2%) |
| $40,000 to $44,999 | 0 (0.0%) | 0 (0.0%) |
| $45,000 to $49,999 | 21 (9.9%) | 27 (9.8%) |
| $50,000 to $54,999 | 0 (0.0%) | 0 (0.0%) |
| $55,000 to $64,999 | 6 (2.8%) | 46 (16.7%) |
| $65,000 to $74,999 | 50 (23.6%) | 0 (0.0%) |
| $75,000 to $99,999 | 20 (9.4%) | 6 (2.2%) |
| $100,000+ | 14 (6.6%) | 0 (0.0%) |
| Total | 212 (100.0%) | 276 (100.0%) |
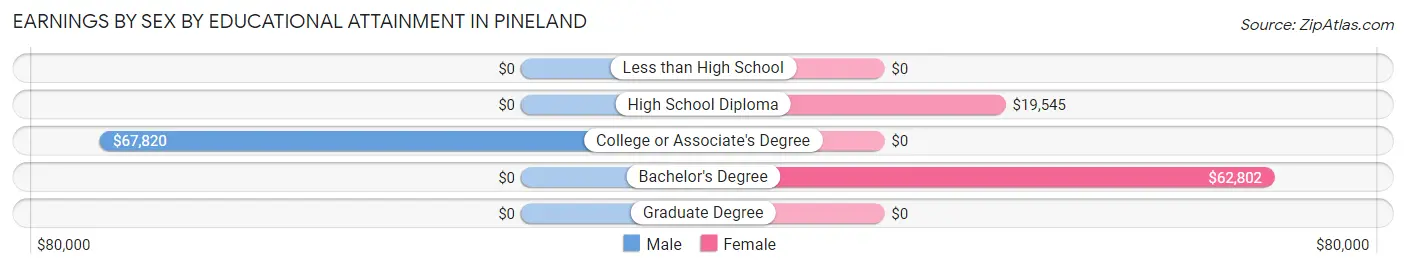
Earnings by Sex by Educational Attainment in Pineland
Average earnings in Pineland are $49,940 for men and $18,295 for women, a difference of 63.4%. Men with an educational attainment of college or associate's degree enjoy the highest average annual earnings of $67,820, while those with college or associate's degree education earn the least with $67,820. Women with an educational attainment of bachelor's degree earn the most with the average annual earnings of $62,802, while those with high school diploma education have the smallest earnings of $19,545.
| Educational Attainment | Male Income | Female Income |
| Less than High School | - | - |
| High School Diploma | - | - |
| College or Associate's Degree | $67,820 | $0 |
| Bachelor's Degree | - | - |
| Graduate Degree | - | - |
| Total | $49,940 | $18,295 |
Family Income in Pineland
Family Income Brackets in Pineland
According to the Pineland family income data, there are 58 families falling into the $75,000 to $99,999 income range, which is the most common income bracket and makes up 21.0% of all families.
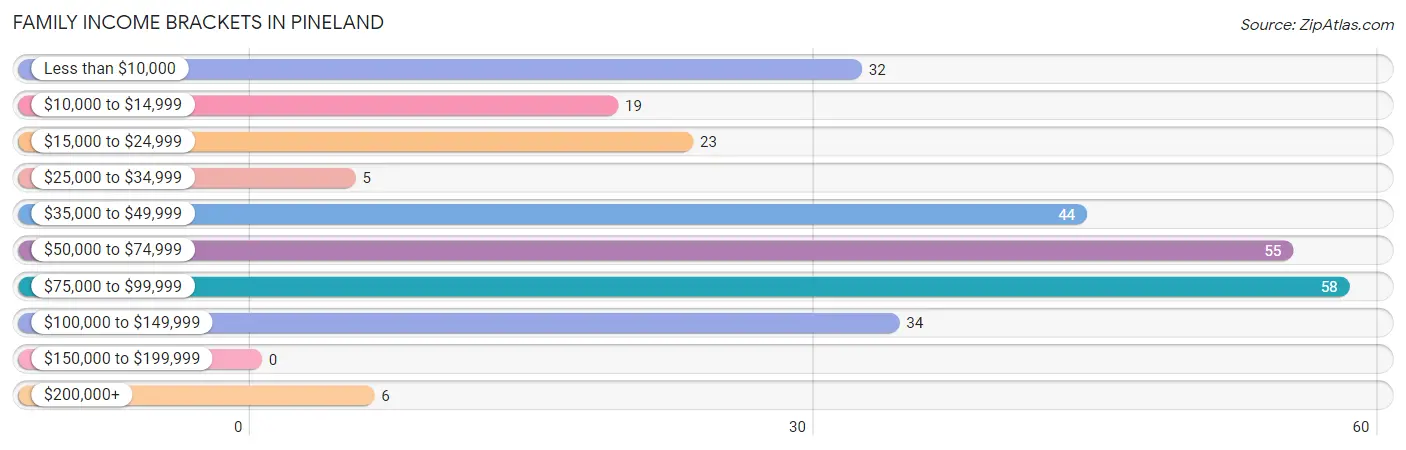
| Income Bracket | # Families | % Families |
| Less than $10,000 | 32 | 11.6% |
| $10,000 to $14,999 | 19 | 6.9% |
| $15,000 to $24,999 | 23 | 8.3% |
| $25,000 to $34,999 | 5 | 1.8% |
| $35,000 to $49,999 | 44 | 15.9% |
| $50,000 to $74,999 | 55 | 19.9% |
| $75,000 to $99,999 | 58 | 21.0% |
| $100,000 to $149,999 | 34 | 12.3% |
| $150,000 to $199,999 | 0 | 0.0% |
| $200,000+ | 6 | 2.2% |
Family Income by Famaliy Size in Pineland
5-person families (41 | 14.9%) account for the highest median family income in Pineland with $110,568 per family, while 2-person families (140 | 50.7%) have the highest median income of $32,370 per family member.
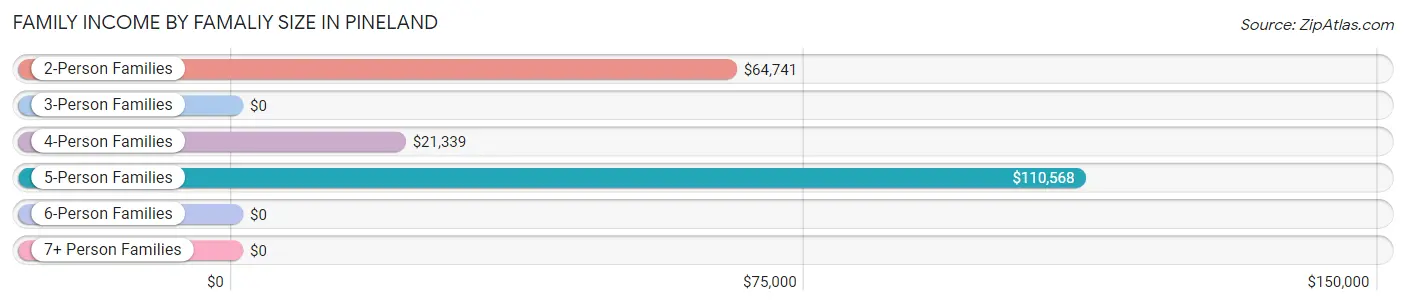
| Income Bracket | # Families | Median Income |
| 2-Person Families | 140 (50.7%) | $64,741 |
| 3-Person Families | 44 (15.9%) | $0 |
| 4-Person Families | 51 (18.5%) | $21,339 |
| 5-Person Families | 41 (14.9%) | $110,568 |
| 6-Person Families | 0 (0.0%) | $0 |
| 7+ Person Families | 0 (0.0%) | $0 |
| Total | 276 (100.0%) | $56,250 |
Family Income by Number of Earners in Pineland
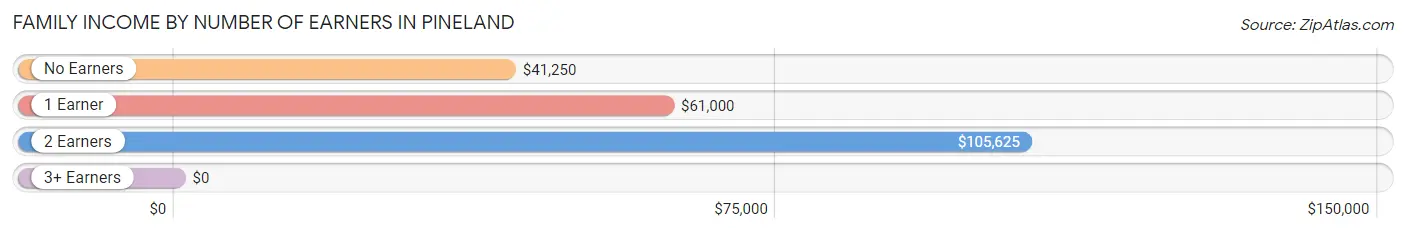
| Number of Earners | # Families | Median Income |
| No Earners | 30 (10.9%) | $41,250 |
| 1 Earner | 174 (63.0%) | $61,000 |
| 2 Earners | 69 (25.0%) | $105,625 |
| 3+ Earners | 3 (1.1%) | $0 |
| Total | 276 (100.0%) | $56,250 |
Household Income in Pineland
Household Income Brackets in Pineland
With 93 households falling in the category, the $15,000 to $24,999 income range is the most frequent in Pineland, accounting for 19.9% of all households.
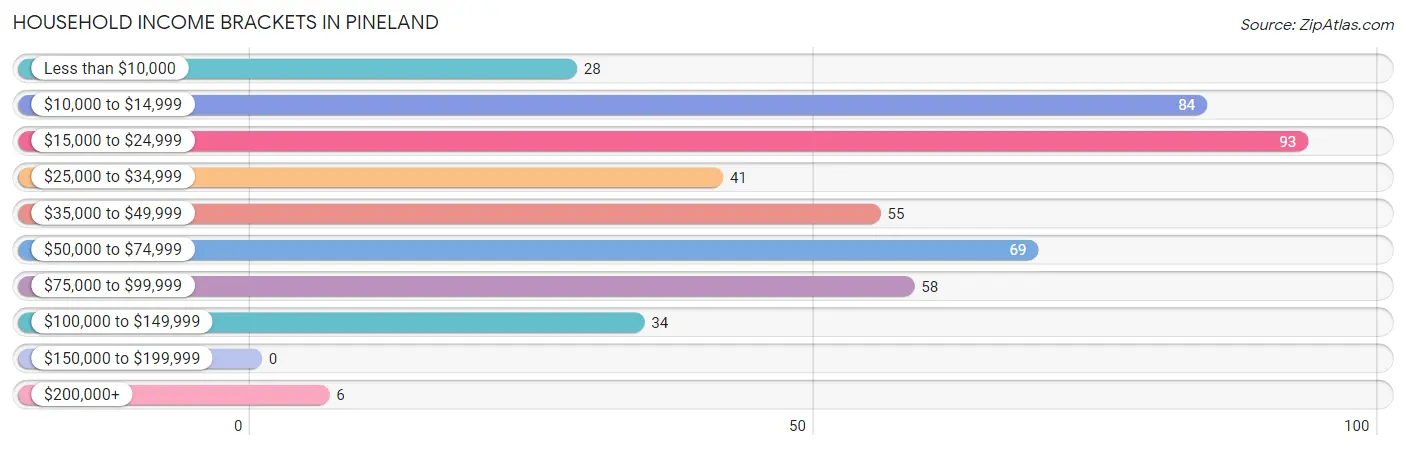
| Income Bracket | # Households | % Households |
| Less than $10,000 | 28 | 6.0% |
| $10,000 to $14,999 | 84 | 17.9% |
| $15,000 to $24,999 | 93 | 19.9% |
| $25,000 to $34,999 | 41 | 8.8% |
| $35,000 to $49,999 | 55 | 11.8% |
| $50,000 to $74,999 | 69 | 14.7% |
| $75,000 to $99,999 | 58 | 12.4% |
| $100,000 to $149,999 | 34 | 7.3% |
| $150,000 to $199,999 | 0 | 0.0% |
| $200,000+ | 6 | 1.3% |
Household Income by Householder Age in Pineland
The median household income in Pineland is $29,722, with the highest median household income of $24,792 found in the 65+ years age bracket for the primary householder. A total of 147 households (31.4%) fall into this category. Meanwhile, the 15 to 24 years age bracket for the primary householder has the lowest median household income of $0, with 13 households (2.8%) in this group.
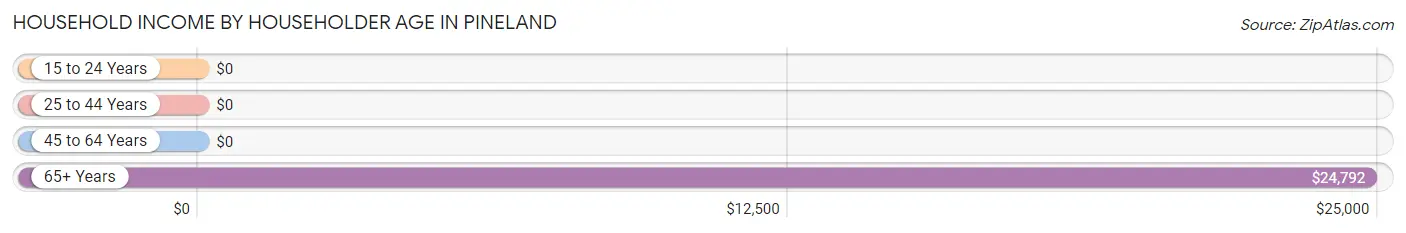
| Income Bracket | # Households | Median Income |
| 15 to 24 Years | 13 (2.8%) | $0 |
| 25 to 44 Years | 147 (31.4%) | $0 |
| 45 to 64 Years | 161 (34.4%) | $0 |
| 65+ Years | 147 (31.4%) | $24,792 |
| Total | 468 (100.0%) | $29,722 |
Poverty in Pineland
Income Below Poverty by Sex and Age in Pineland
With 41.9% poverty level for males and 43.9% for females among the residents of Pineland, 5 year old males and 16 and 17 year old females are the most vulnerable to poverty, with 3 males (100.0%) and 3 females (100.0%) in their respective age groups living below the poverty level.
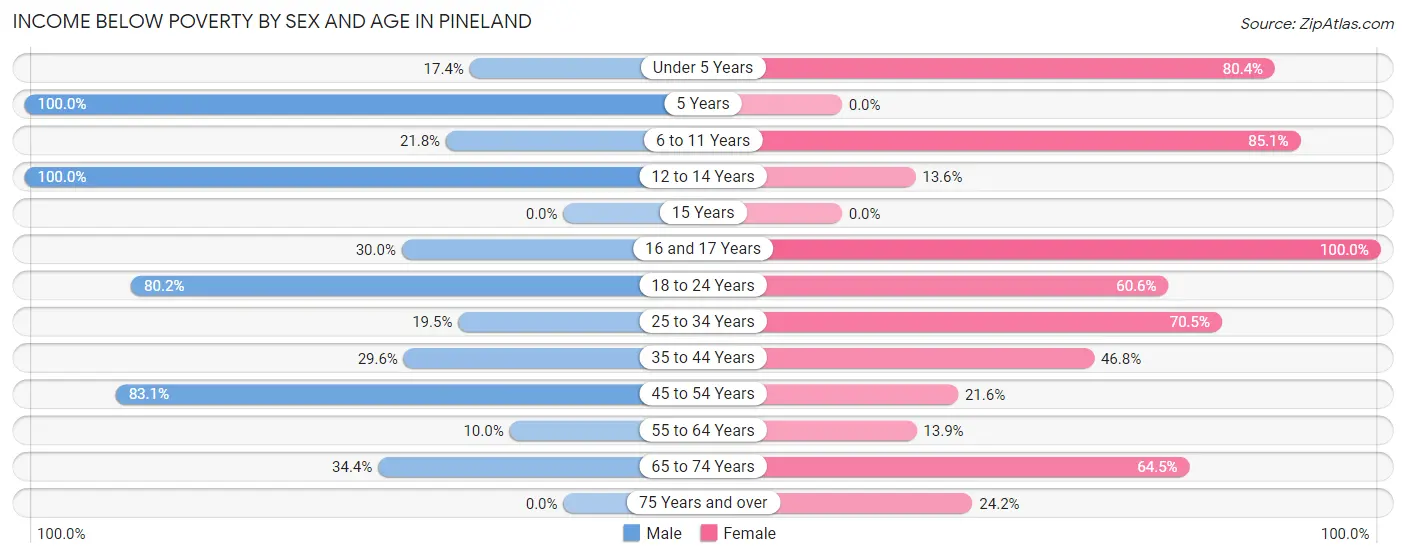
| Age Bracket | Male | Female |
| Under 5 Years | 4 (17.4%) | 41 (80.4%) |
| 5 Years | 3 (100.0%) | 0 (0.0%) |
| 6 to 11 Years | 17 (21.8%) | 40 (85.1%) |
| 12 to 14 Years | 16 (100.0%) | 3 (13.6%) |
| 15 Years | 0 (0.0%) | 0 (0.0%) |
| 16 and 17 Years | 6 (30.0%) | 3 (100.0%) |
| 18 to 24 Years | 77 (80.2%) | 20 (60.6%) |
| 25 to 34 Years | 8 (19.5%) | 67 (70.5%) |
| 35 to 44 Years | 32 (29.6%) | 22 (46.8%) |
| 45 to 54 Years | 54 (83.1%) | 22 (21.6%) |
| 55 to 64 Years | 4 (10.0%) | 9 (13.9%) |
| 65 to 74 Years | 11 (34.4%) | 20 (64.5%) |
| 75 Years and over | 0 (0.0%) | 24 (24.2%) |
| Total | 232 (41.9%) | 271 (43.9%) |
Income Above Poverty by Sex and Age in Pineland
According to the poverty statistics in Pineland, males aged 15 years and females aged 5 years are the age groups that are most secure financially, with 100.0% of males and 100.0% of females in these age groups living above the poverty line.
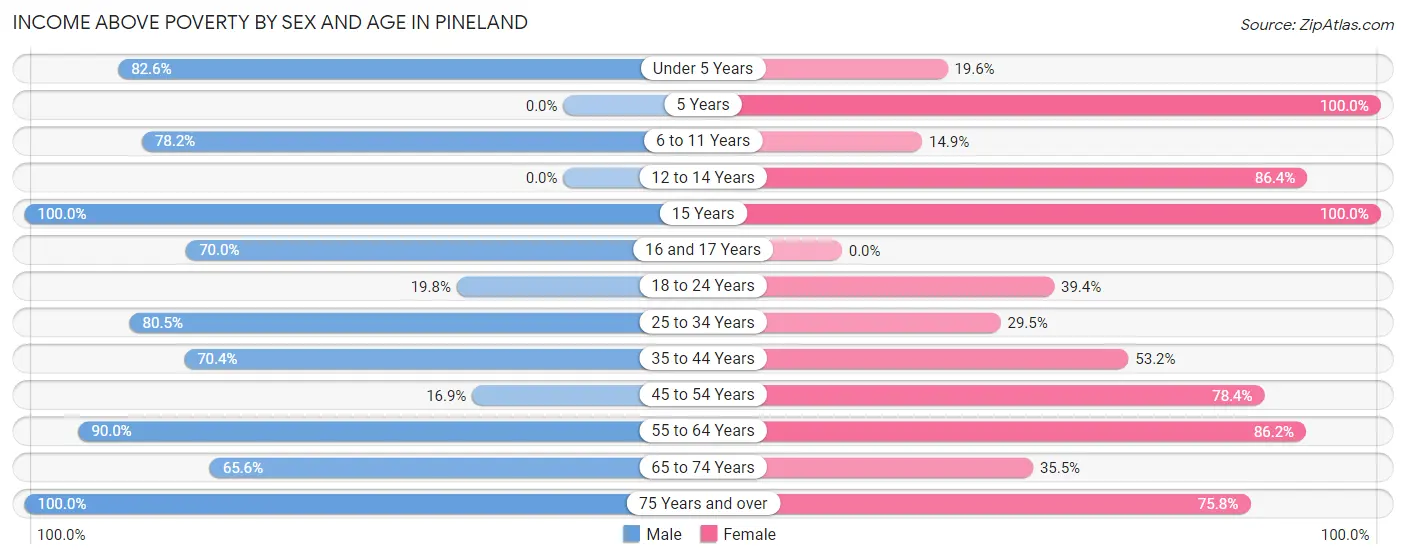
| Age Bracket | Male | Female |
| Under 5 Years | 19 (82.6%) | 10 (19.6%) |
| 5 Years | 0 (0.0%) | 10 (100.0%) |
| 6 to 11 Years | 61 (78.2%) | 7 (14.9%) |
| 12 to 14 Years | 0 (0.0%) | 19 (86.4%) |
| 15 Years | 15 (100.0%) | 12 (100.0%) |
| 16 and 17 Years | 14 (70.0%) | 0 (0.0%) |
| 18 to 24 Years | 19 (19.8%) | 13 (39.4%) |
| 25 to 34 Years | 33 (80.5%) | 28 (29.5%) |
| 35 to 44 Years | 76 (70.4%) | 25 (53.2%) |
| 45 to 54 Years | 11 (16.9%) | 80 (78.4%) |
| 55 to 64 Years | 36 (90.0%) | 56 (86.2%) |
| 65 to 74 Years | 21 (65.6%) | 11 (35.5%) |
| 75 Years and over | 16 (100.0%) | 75 (75.8%) |
| Total | 321 (58.1%) | 346 (56.1%) |
Income Below Poverty Among Married-Couple Families in Pineland
The poverty statistics for married-couple families in Pineland show that 24.6% or 33 of the total 134 families live below the poverty line. Families with 1 or 2 children have the highest poverty rate of 53.8%, comprising of 14 families. On the other hand, families with 3 or 4 children have the lowest poverty rate of 0.0%, which includes 0 families.
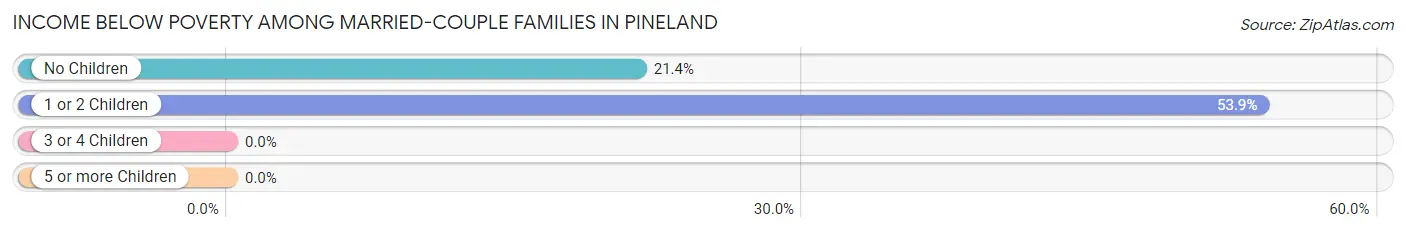
| Children | Above Poverty | Below Poverty |
| No Children | 70 (78.6%) | 19 (21.3%) |
| 1 or 2 Children | 12 (46.2%) | 14 (53.8%) |
| 3 or 4 Children | 19 (100.0%) | 0 (0.0%) |
| 5 or more Children | 0 (0.0%) | 0 (0.0%) |
| Total | 101 (75.4%) | 33 (24.6%) |
Income Below Poverty Among Single-Parent Households in Pineland
According to the poverty data in Pineland, 7.8% or 5 single-father households and 52.6% or 41 single-mother households are living below the poverty line. Among single-father households, those with 3 or 4 children have the highest poverty rate, with 5 households (100.0%) experiencing poverty. Likewise, among single-mother households, those with 3 or 4 children have the highest poverty rate, with 21 households (100.0%) falling below the poverty line.
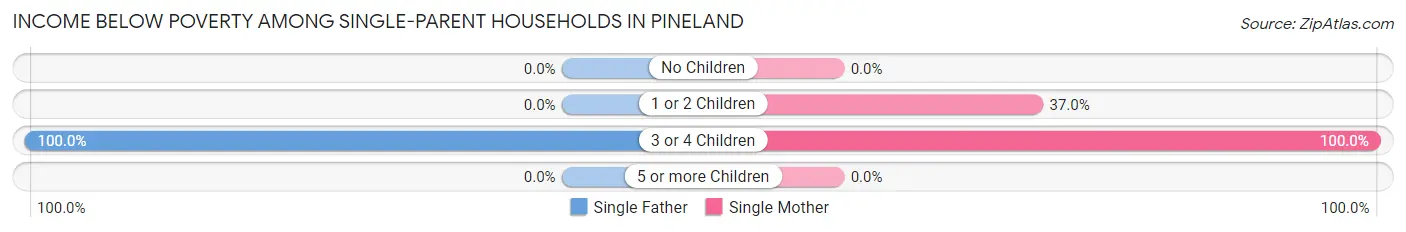
| Children | Single Father | Single Mother |
| No Children | 0 (0.0%) | 0 (0.0%) |
| 1 or 2 Children | 0 (0.0%) | 20 (37.0%) |
| 3 or 4 Children | 5 (100.0%) | 21 (100.0%) |
| 5 or more Children | 0 (0.0%) | 0 (0.0%) |
| Total | 5 (7.8%) | 41 (52.6%) |
Income Below Poverty Among Married-Couple vs Single-Parent Households in Pineland
The poverty data for Pineland shows that 33 of the married-couple family households (24.6%) and 46 of the single-parent households (32.4%) are living below the poverty level. Within the married-couple family households, those with 1 or 2 children have the highest poverty rate, with 14 households (53.8%) falling below the poverty line. Among the single-parent households, those with 3 or 4 children have the highest poverty rate, with 26 household (100.0%) living below poverty.
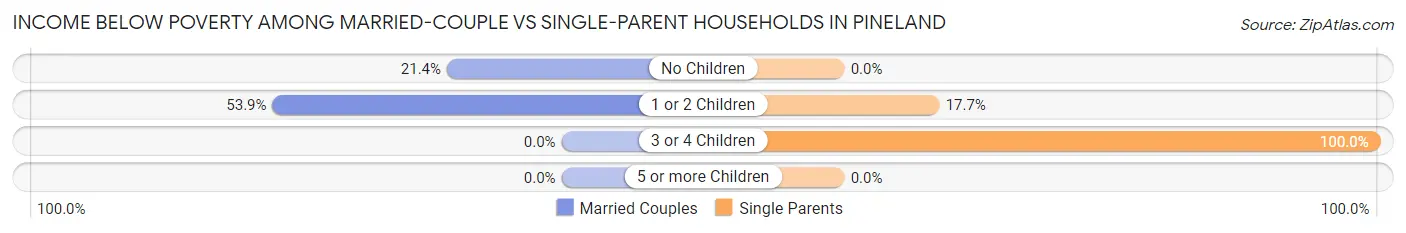
| Children | Married-Couple Families | Single-Parent Households |
| No Children | 19 (21.3%) | 0 (0.0%) |
| 1 or 2 Children | 14 (53.8%) | 20 (17.7%) |
| 3 or 4 Children | 0 (0.0%) | 26 (100.0%) |
| 5 or more Children | 0 (0.0%) | 0 (0.0%) |
| Total | 33 (24.6%) | 46 (32.4%) |
Race in Pineland
The most populous races in Pineland are White / Caucasian (1,000 | 83.9%), Black / African American (181 | 15.2%), and Hispanic or Latino (14 | 1.2%).
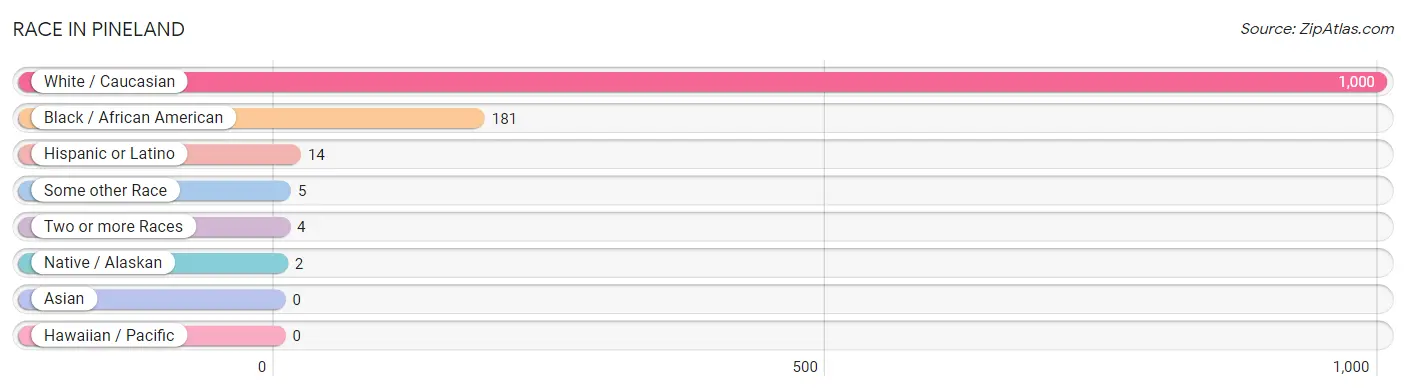
| Race | # Population | % Population |
| Asian | 0 | 0.0% |
| Black / African American | 181 | 15.2% |
| Hawaiian / Pacific | 0 | 0.0% |
| Hispanic or Latino | 14 | 1.2% |
| Native / Alaskan | 2 | 0.2% |
| White / Caucasian | 1,000 | 83.9% |
| Two or more Races | 4 | 0.3% |
| Some other Race | 5 | 0.4% |
| Total | 1,192 | 100.0% |
Ancestry in Pineland
The most populous ancestries reported in Pineland are American (263 | 22.1%), Irish (76 | 6.4%), French Canadian (43 | 3.6%), Welsh (43 | 3.6%), and English (31 | 2.6%), together accounting for 38.3% of all Pineland residents.
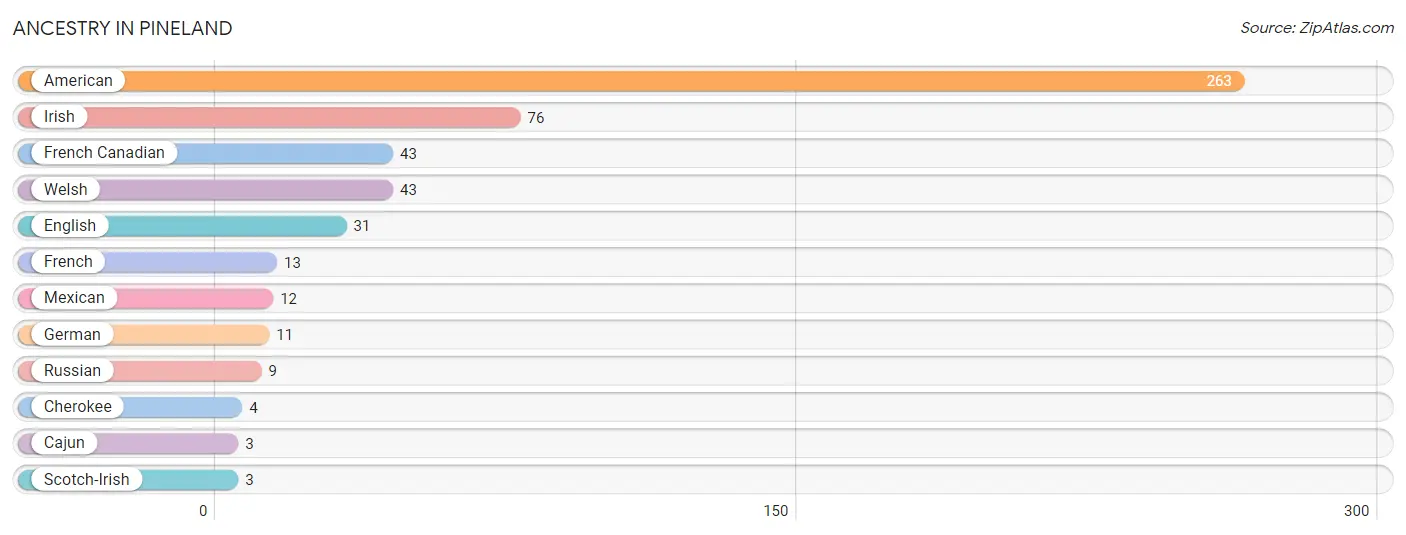
| Ancestry | # Population | % Population |
| American | 263 | 22.1% |
| Cajun | 3 | 0.3% |
| Cherokee | 4 | 0.3% |
| English | 31 | 2.6% |
| French | 13 | 1.1% |
| French Canadian | 43 | 3.6% |
| German | 11 | 0.9% |
| Irish | 76 | 6.4% |
| Mexican | 12 | 1.0% |
| Russian | 9 | 0.8% |
| Scotch-Irish | 3 | 0.3% |
| Welsh | 43 | 3.6% | View All 12 Rows |
Immigrants in Pineland
The most numerous immigrant groups reported in Pineland came from Central America (5 | 0.4%), Latin America (5 | 0.4%), and Mexico (5 | 0.4%), together accounting for 1.3% of all Pineland residents.
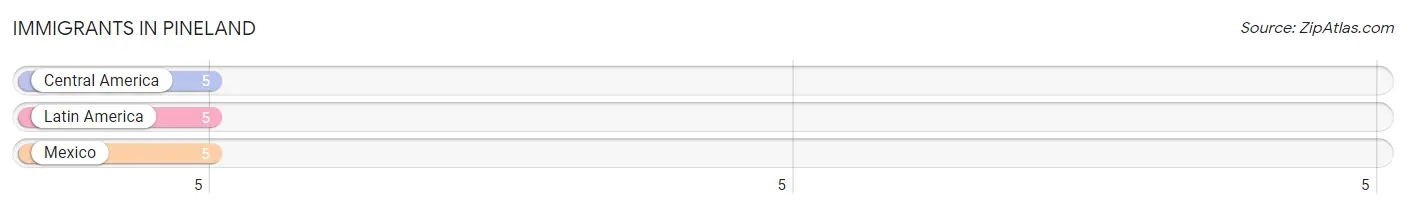
| Immigration Origin | # Population | % Population |
| Central America | 5 | 0.4% |
| Latin America | 5 | 0.4% |
| Mexico | 5 | 0.4% | View All 3 Rows |
Sex and Age in Pineland
Sex and Age in Pineland
The most populous age groups in Pineland are 20 to 24 Years (99 | 17.5%) for men and 30 to 34 Years (71 | 11.4%) for women.
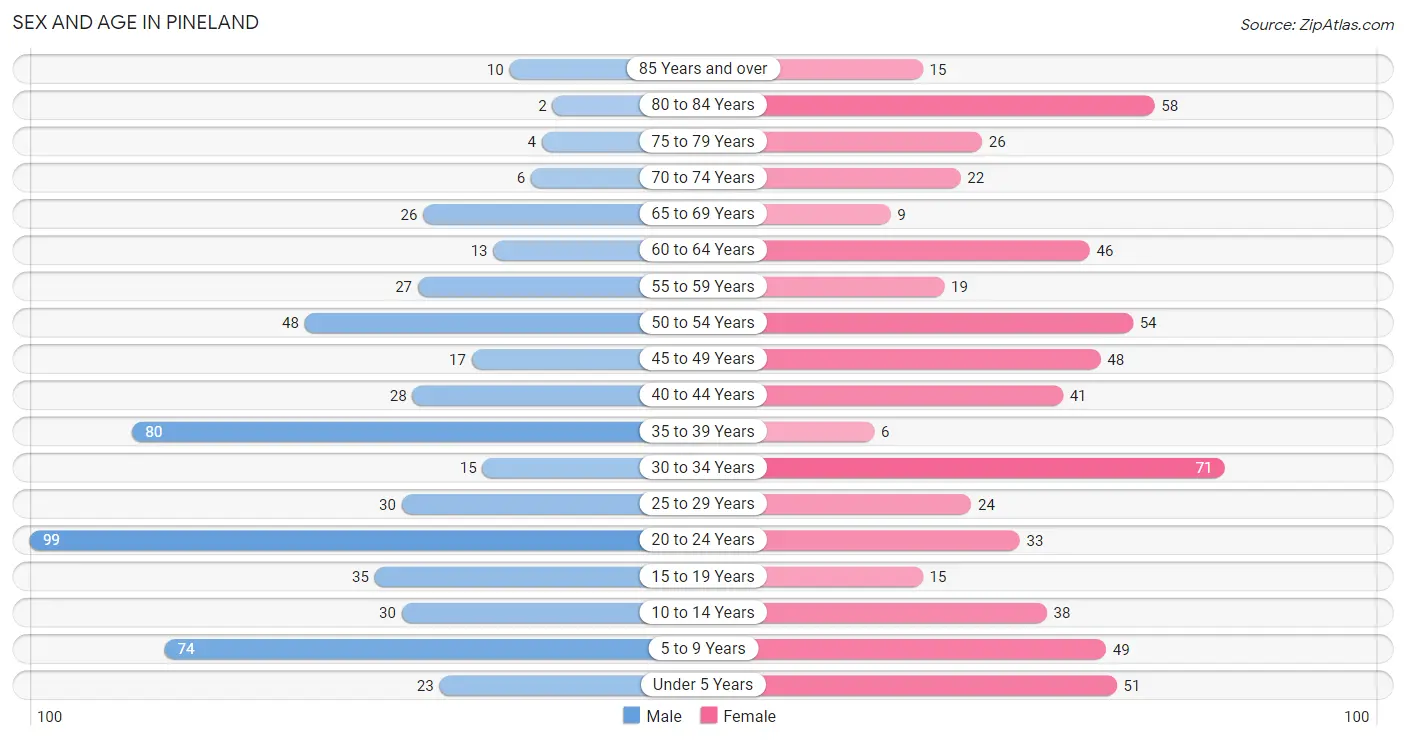
| Age Bracket | Male | Female |
| Under 5 Years | 23 (4.1%) | 51 (8.2%) |
| 5 to 9 Years | 74 (13.1%) | 49 (7.8%) |
| 10 to 14 Years | 30 (5.3%) | 38 (6.1%) |
| 15 to 19 Years | 35 (6.2%) | 15 (2.4%) |
| 20 to 24 Years | 99 (17.5%) | 33 (5.3%) |
| 25 to 29 Years | 30 (5.3%) | 24 (3.8%) |
| 30 to 34 Years | 15 (2.6%) | 71 (11.4%) |
| 35 to 39 Years | 80 (14.1%) | 6 (1.0%) |
| 40 to 44 Years | 28 (4.9%) | 41 (6.6%) |
| 45 to 49 Years | 17 (3.0%) | 48 (7.7%) |
| 50 to 54 Years | 48 (8.5%) | 54 (8.6%) |
| 55 to 59 Years | 27 (4.8%) | 19 (3.0%) |
| 60 to 64 Years | 13 (2.3%) | 46 (7.4%) |
| 65 to 69 Years | 26 (4.6%) | 9 (1.4%) |
| 70 to 74 Years | 6 (1.1%) | 22 (3.5%) |
| 75 to 79 Years | 4 (0.7%) | 26 (4.2%) |
| 80 to 84 Years | 2 (0.4%) | 58 (9.3%) |
| 85 Years and over | 10 (1.8%) | 15 (2.4%) |
| Total | 567 (100.0%) | 625 (100.0%) |
Families and Households in Pineland
Median Family Size in Pineland
The median family size in Pineland is 3.14 persons per family, with married-couple families (134 | 48.5%) accounting for the largest median family size of 3.37 persons per family. On the other hand, single male/father families (64 | 23.2%) represent the smallest median family size with 2.45 persons per family.
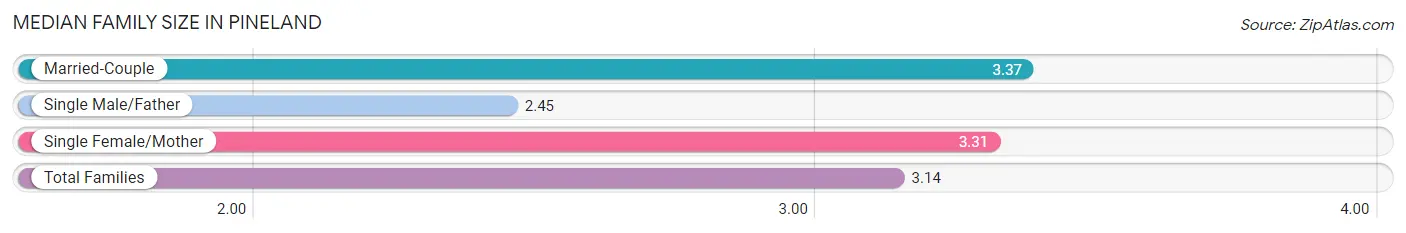
| Family Type | # Families | Family Size |
| Married-Couple | 134 (48.5%) | 3.37 |
| Single Male/Father | 64 (23.2%) | 2.45 |
| Single Female/Mother | 78 (28.3%) | 3.31 |
| Total Families | 276 (100.0%) | 3.14 |
Median Household Size in Pineland
The median household size in Pineland is 2.52 persons per household, with single female/mother households (78 | 16.7%) accounting for the largest median household size of 3.51 persons per household. non-family households (192 | 41.0%) represent the smallest median household size with 1.34 persons per household.
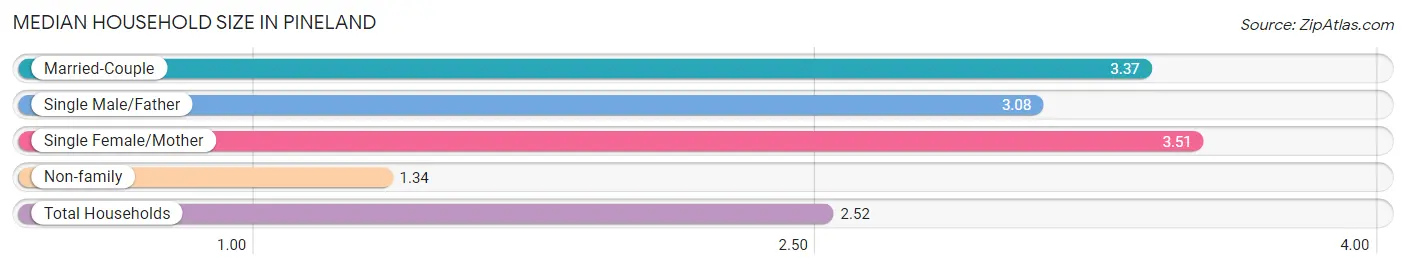
| Household Type | # Households | Household Size |
| Married-Couple | 134 (28.6%) | 3.37 |
| Single Male/Father | 64 (13.7%) | 3.08 |
| Single Female/Mother | 78 (16.7%) | 3.51 |
| Non-family | 192 (41.0%) | 1.34 |
| Total Households | 468 (100.0%) | 2.52 |
Household Size by Marriage Status in Pineland
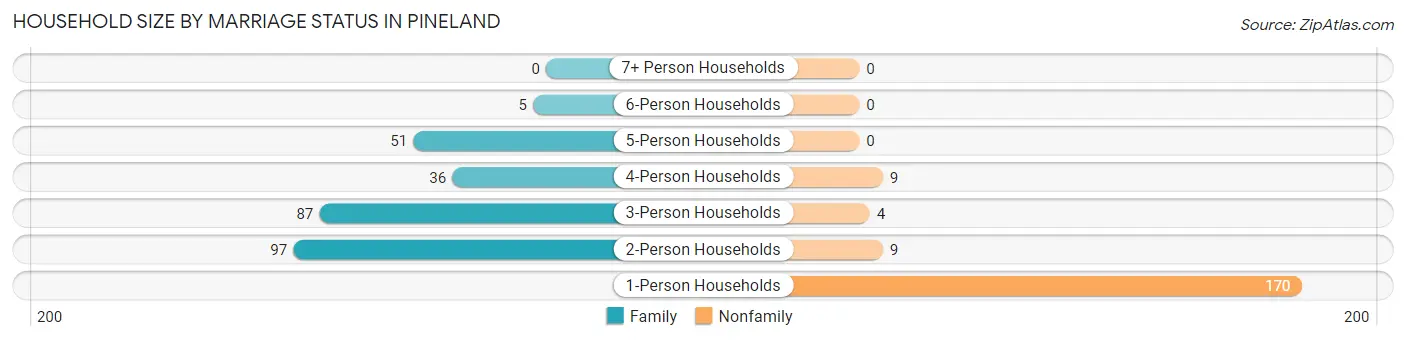
Out of a total of 468 households in Pineland, 276 (59.0%) are family households, while 192 (41.0%) are nonfamily households. The most numerous type of family households are 2-person households, comprising 97, and the most common type of nonfamily households are 1-person households, comprising 170.
| Household Size | Family Households | Nonfamily Households |
| 1-Person Households | - | 170 (36.3%) |
| 2-Person Households | 97 (20.7%) | 9 (1.9%) |
| 3-Person Households | 87 (18.6%) | 4 (0.9%) |
| 4-Person Households | 36 (7.7%) | 9 (1.9%) |
| 5-Person Households | 51 (10.9%) | 0 (0.0%) |
| 6-Person Households | 5 (1.1%) | 0 (0.0%) |
| 7+ Person Households | 0 (0.0%) | 0 (0.0%) |
| Total | 276 (59.0%) | 192 (41.0%) |
Female Fertility in Pineland
Fertility by Age in Pineland
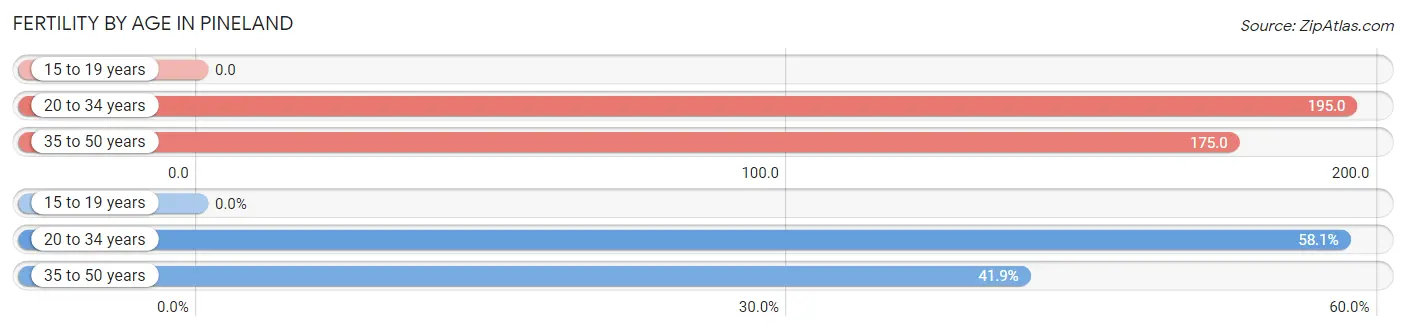
Average fertility rate in Pineland is 175.0 births per 1,000 women. Women in the age bracket of 20 to 34 years have the highest fertility rate with 195.0 births per 1,000 women. Women in the age bracket of 20 to 34 years acount for 58.1% of all women with births.
| Age Bracket | Women with Births | Births / 1,000 Women |
| 15 to 19 years | 0 (0.0%) | 0.0 |
| 20 to 34 years | 25 (58.1%) | 195.0 |
| 35 to 50 years | 18 (41.9%) | 175.0 |
| Total | 43 (100.0%) | 175.0 |
Fertility by Age by Marriage Status in Pineland
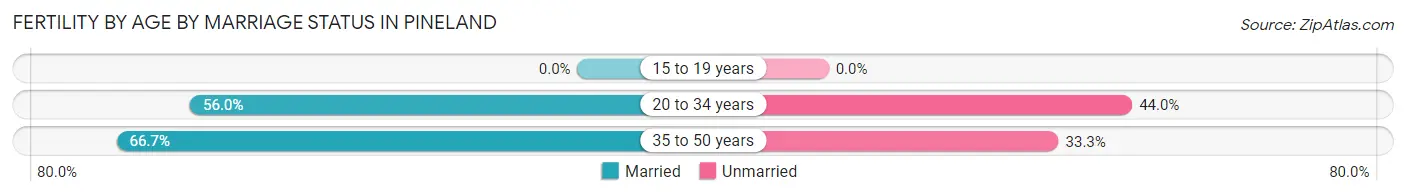
60.5% of women with births (43) in Pineland are married. The highest percentage of unmarried women with births falls into 20 to 34 years age bracket with 44.0% of them unmarried at the time of birth, while the lowest percentage of unmarried women with births belong to 35 to 50 years age bracket with 33.3% of them unmarried.
| Age Bracket | Married | Unmarried |
| 15 to 19 years | 0 (0.0%) | 0 (0.0%) |
| 20 to 34 years | 14 (56.0%) | 11 (44.0%) |
| 35 to 50 years | 12 (66.7%) | 6 (33.3%) |
| Total | 26 (60.5%) | 17 (39.5%) |
Fertility by Education in Pineland
| Educational Attainment | Women with Births | Births / 1,000 Women |
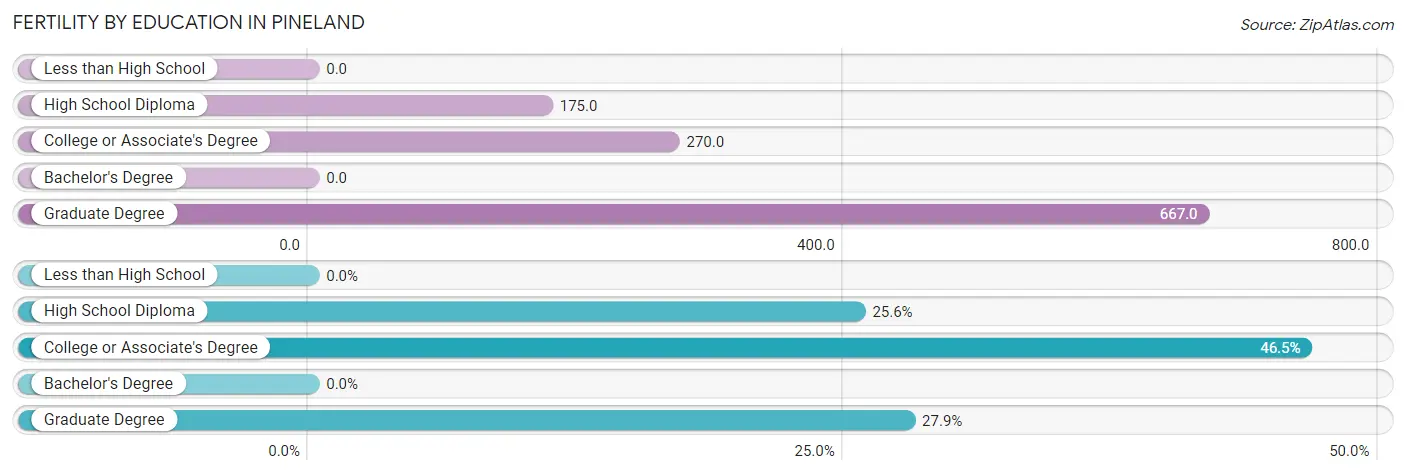
| Less than High School | 0 (0.0%) | 0.0 |
| High School Diploma | 11 (25.6%) | 175.0 |
| College or Associate's Degree | 20 (46.5%) | 270.0 |
| Bachelor's Degree | 0 (0.0%) | 0.0 |
| Graduate Degree | 12 (27.9%) | 667.0 |
| Total | 43 (100.0%) | 175.0 |
Fertility by Education by Marriage Status in Pineland
39.5% of women with births in Pineland are unmarried. Women with the educational attainment of graduate degree are most likely to be married with 100.0% of them married at childbirth, while women with the educational attainment of high school diploma are least likely to be married with 100.0% of them unmarried at childbirth.
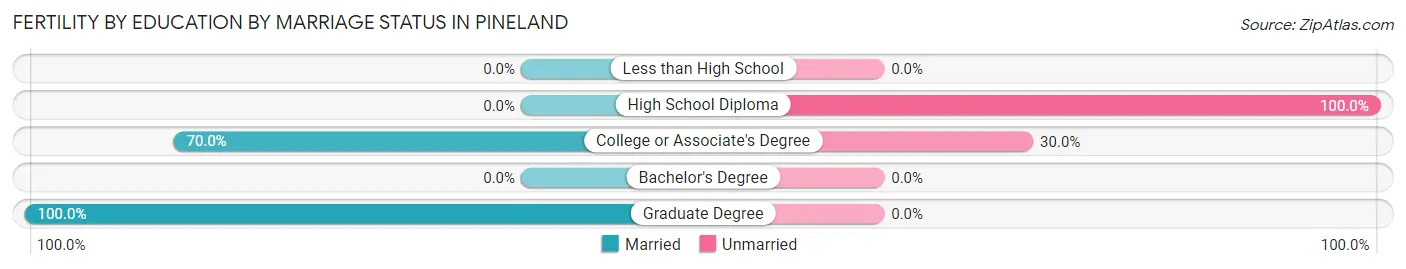
| Educational Attainment | Married | Unmarried |
| Less than High School | 0 (0.0%) | 0 (0.0%) |
| High School Diploma | 0 (0.0%) | 11 (100.0%) |
| College or Associate's Degree | 14 (70.0%) | 6 (30.0%) |
| Bachelor's Degree | 0 (0.0%) | 0 (0.0%) |
| Graduate Degree | 12 (100.0%) | 0 (0.0%) |
| Total | 26 (60.5%) | 17 (39.5%) |
Employment Characteristics in Pineland
Employment by Class of Employer in Pineland
Among the 401 employed individuals in Pineland, private company employees (239 | 59.6%), local government employees (94 | 23.4%), and not-for-profit organizations (31 | 7.7%) make up the most common classes of employment.
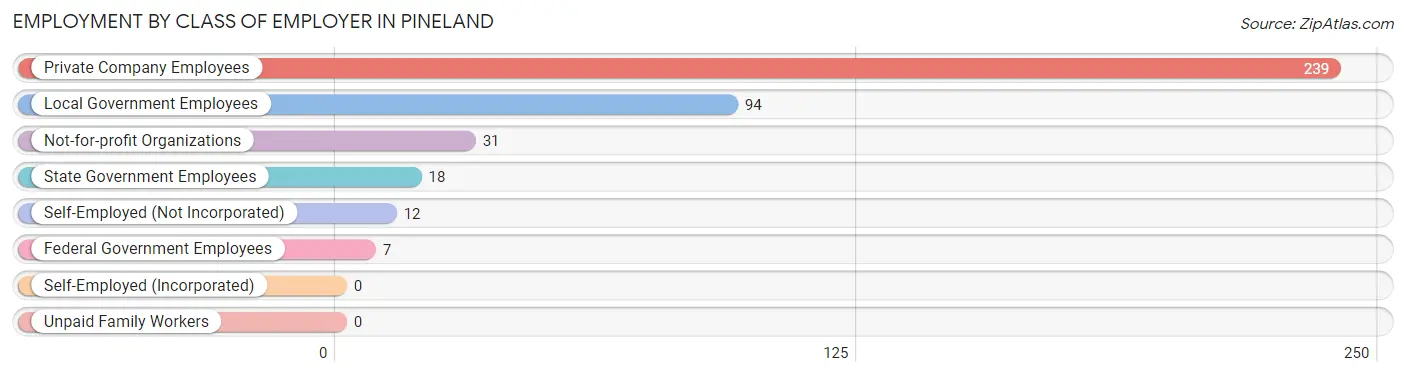
| Employer Class | # Employees | % Employees |
| Private Company Employees | 239 | 59.6% |
| Self-Employed (Incorporated) | 0 | 0.0% |
| Self-Employed (Not Incorporated) | 12 | 3.0% |
| Not-for-profit Organizations | 31 | 7.7% |
| Local Government Employees | 94 | 23.4% |
| State Government Employees | 18 | 4.5% |
| Federal Government Employees | 7 | 1.8% |
| Unpaid Family Workers | 0 | 0.0% |
| Total | 401 | 100.0% |
Employment Status by Age in Pineland
According to the labor force statistics for Pineland, out of the total population over 16 years of age (900), 55.9% or 503 individuals are in the labor force, with 11.5% or 58 of them unemployed. The age group with the highest labor force participation rate is 25 to 29 years, with 92.6% or 50 individuals in the labor force. Within the labor force, the 20 to 24 years age range has the highest percentage of unemployed individuals, with 80.3% or 53 of them being unemployed.
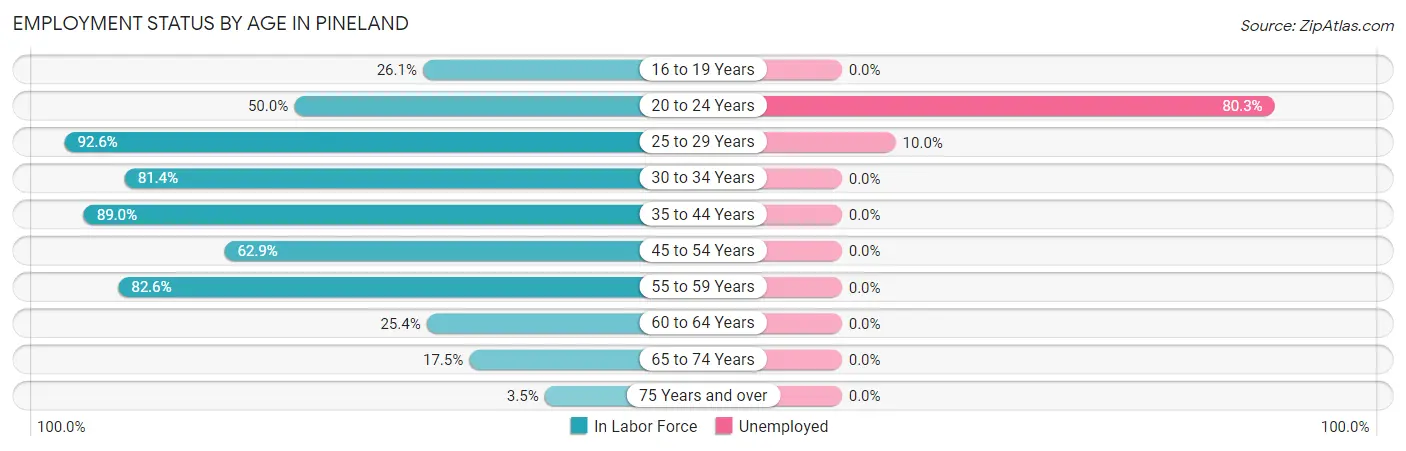
| Age Bracket | In Labor Force | Unemployed |
| 16 to 19 Years | 6 (26.1%) | 0 (0.0%) |
| 20 to 24 Years | 66 (50.0%) | 53 (80.3%) |
| 25 to 29 Years | 50 (92.6%) | 5 (10.0%) |
| 30 to 34 Years | 70 (81.4%) | 0 (0.0%) |
| 35 to 44 Years | 138 (89.0%) | 0 (0.0%) |
| 45 to 54 Years | 105 (62.9%) | 0 (0.0%) |
| 55 to 59 Years | 38 (82.6%) | 0 (0.0%) |
| 60 to 64 Years | 15 (25.4%) | 0 (0.0%) |
| 65 to 74 Years | 11 (17.5%) | 0 (0.0%) |
| 75 Years and over | 4 (3.5%) | 0 (0.0%) |
| Total | 503 (55.9%) | 58 (11.5%) |
Employment Status by Educational Attainment in Pineland
According to labor force statistics for Pineland, 73.4% of individuals (416) out of the total population between 25 and 64 years of age (567) are in the labor force, with 1.2% or 5 of them being unemployed. The group with the highest labor force participation rate are those with the educational attainment of bachelor's degree or higher, with 100.0% or 92 individuals in the labor force. Within the labor force, individuals with less than high school education have the highest percentage of unemployment, with 33.3% or 5 of them being unemployed.
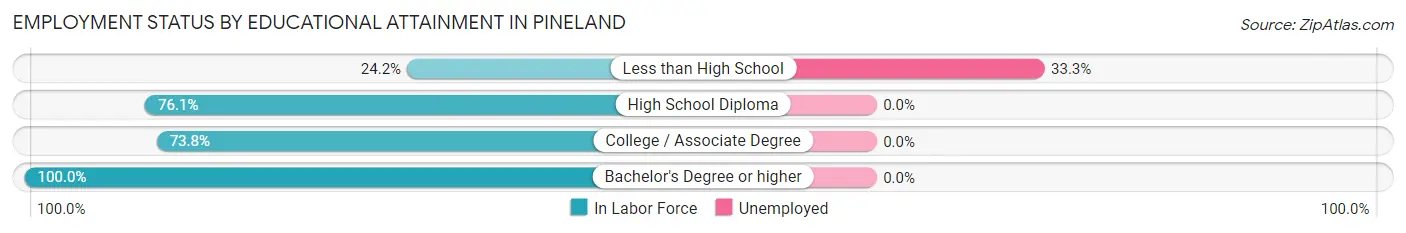
| Educational Attainment | In Labor Force | Unemployed |
| Less than High School | 15 (24.2%) | 21 (33.3%) |
| High School Diploma | 137 (76.1%) | 0 (0.0%) |
| College / Associate Degree | 172 (73.8%) | 0 (0.0%) |
| Bachelor's Degree or higher | 92 (100.0%) | 0 (0.0%) |
| Total | 416 (73.4%) | 7 (1.2%) |
Employment Occupations by Sex in Pineland
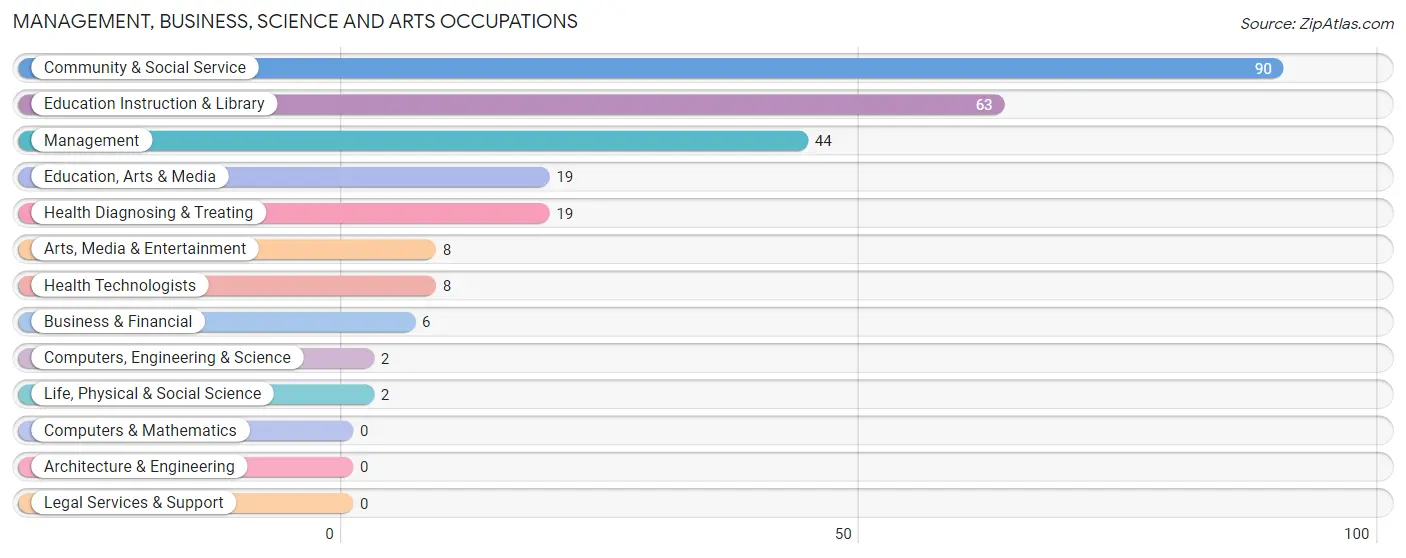
Management, Business, Science and Arts Occupations
The most common Management, Business, Science and Arts occupations in Pineland are Community & Social Service (90 | 20.2%), Education Instruction & Library (63 | 14.2%), Management (44 | 9.9%), Education, Arts & Media (19 | 4.3%), and Health Diagnosing & Treating (19 | 4.3%).
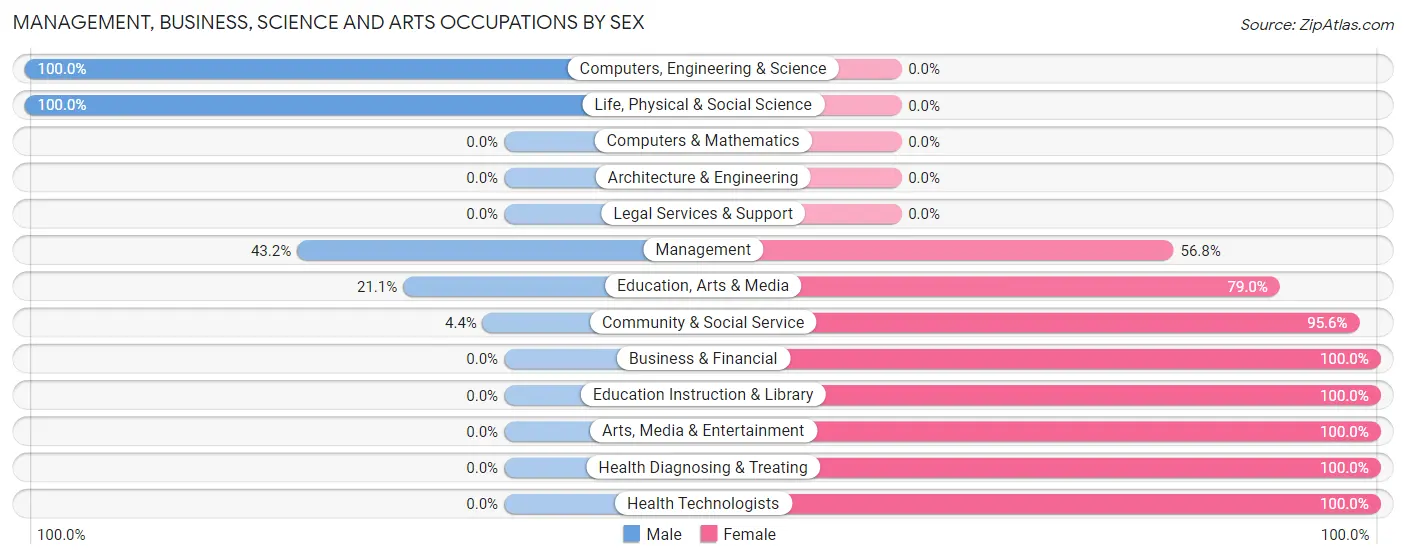
Management, Business, Science and Arts Occupations by Sex
Within the Management, Business, Science and Arts occupations in Pineland, the most male-oriented occupations are Computers, Engineering & Science (100.0%), Life, Physical & Social Science (100.0%), and Management (43.2%), while the most female-oriented occupations are Business & Financial (100.0%), Education Instruction & Library (100.0%), and Arts, Media & Entertainment (100.0%).
| Occupation | Male | Female |
| Management | 19 (43.2%) | 25 (56.8%) |
| Business & Financial | 0 (0.0%) | 6 (100.0%) |
| Computers, Engineering & Science | 2 (100.0%) | 0 (0.0%) |
| Computers & Mathematics | 0 (0.0%) | 0 (0.0%) |
| Architecture & Engineering | 0 (0.0%) | 0 (0.0%) |
| Life, Physical & Social Science | 2 (100.0%) | 0 (0.0%) |
| Community & Social Service | 4 (4.4%) | 86 (95.6%) |
| Education, Arts & Media | 4 (21.0%) | 15 (78.9%) |
| Legal Services & Support | 0 (0.0%) | 0 (0.0%) |
| Education Instruction & Library | 0 (0.0%) | 63 (100.0%) |
| Arts, Media & Entertainment | 0 (0.0%) | 8 (100.0%) |
| Health Diagnosing & Treating | 0 (0.0%) | 19 (100.0%) |
| Health Technologists | 0 (0.0%) | 8 (100.0%) |
| Total (Category) | 25 (15.5%) | 136 (84.5%) |
| Total (Overall) | 181 (40.7%) | 264 (59.3%) |
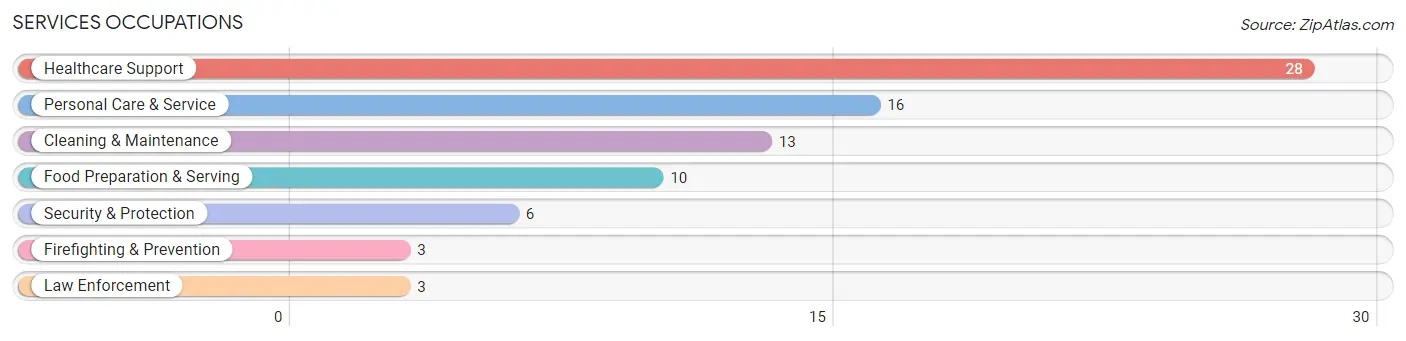
Services Occupations
The most common Services occupations in Pineland are Healthcare Support (28 | 6.3%), Personal Care & Service (16 | 3.6%), Cleaning & Maintenance (13 | 2.9%), Food Preparation & Serving (10 | 2.2%), and Security & Protection (6 | 1.3%).
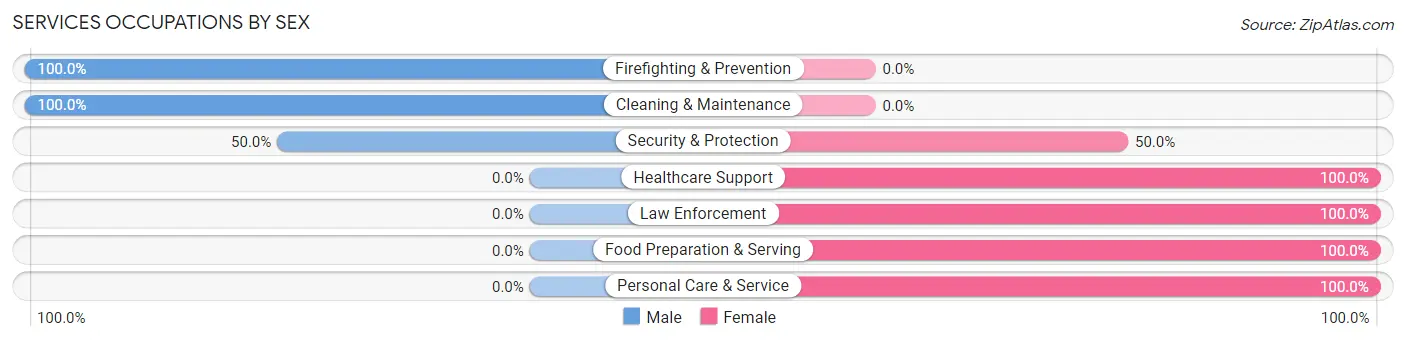
Services Occupations by Sex
Within the Services occupations in Pineland, the most male-oriented occupations are Firefighting & Prevention (100.0%), Cleaning & Maintenance (100.0%), and Security & Protection (50.0%), while the most female-oriented occupations are Healthcare Support (100.0%), Law Enforcement (100.0%), and Food Preparation & Serving (100.0%).
| Occupation | Male | Female |
| Healthcare Support | 0 (0.0%) | 28 (100.0%) |
| Security & Protection | 3 (50.0%) | 3 (50.0%) |
| Firefighting & Prevention | 3 (100.0%) | 0 (0.0%) |
| Law Enforcement | 0 (0.0%) | 3 (100.0%) |
| Food Preparation & Serving | 0 (0.0%) | 10 (100.0%) |
| Cleaning & Maintenance | 13 (100.0%) | 0 (0.0%) |
| Personal Care & Service | 0 (0.0%) | 16 (100.0%) |
| Total (Category) | 16 (21.9%) | 57 (78.1%) |
| Total (Overall) | 181 (40.7%) | 264 (59.3%) |
Sales and Office Occupations
The most common Sales and Office occupations in Pineland are Sales & Related (73 | 16.4%), and Office & Administration (12 | 2.7%).
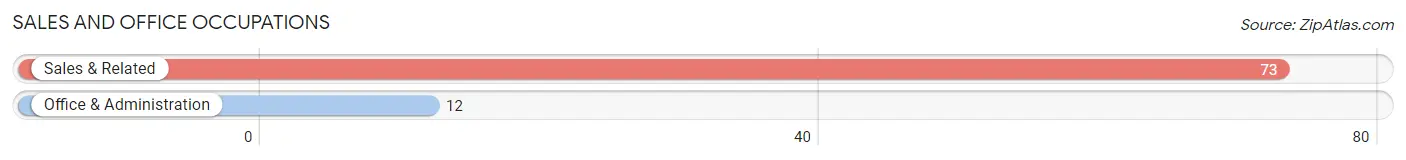
Sales and Office Occupations by Sex
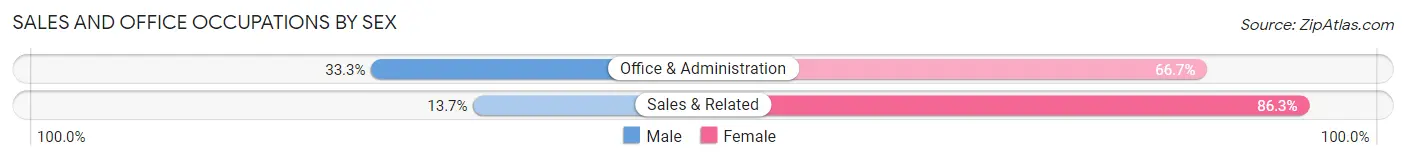
| Occupation | Male | Female |
| Sales & Related | 10 (13.7%) | 63 (86.3%) |
| Office & Administration | 4 (33.3%) | 8 (66.7%) |
| Total (Category) | 14 (16.5%) | 71 (83.5%) |
| Total (Overall) | 181 (40.7%) | 264 (59.3%) |
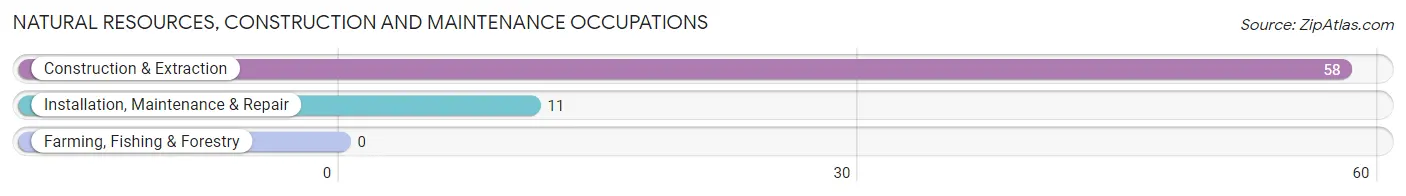
Natural Resources, Construction and Maintenance Occupations
The most common Natural Resources, Construction and Maintenance occupations in Pineland are Construction & Extraction (58 | 13.0%), and Installation, Maintenance & Repair (11 | 2.5%).
Natural Resources, Construction and Maintenance Occupations by Sex
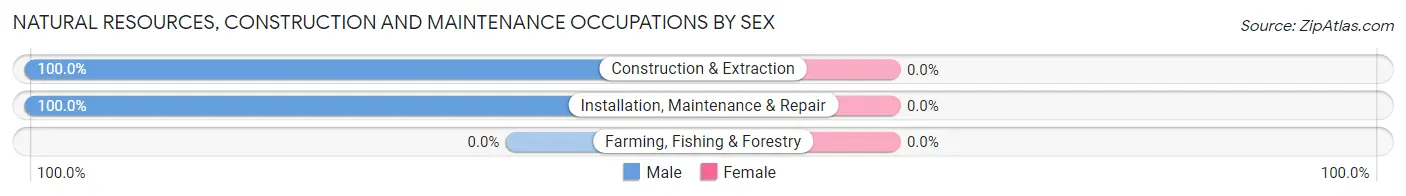
| Occupation | Male | Female |
| Farming, Fishing & Forestry | 0 (0.0%) | 0 (0.0%) |
| Construction & Extraction | 58 (100.0%) | 0 (0.0%) |
| Installation, Maintenance & Repair | 11 (100.0%) | 0 (0.0%) |
| Total (Category) | 69 (100.0%) | 0 (0.0%) |
| Total (Overall) | 181 (40.7%) | 264 (59.3%) |
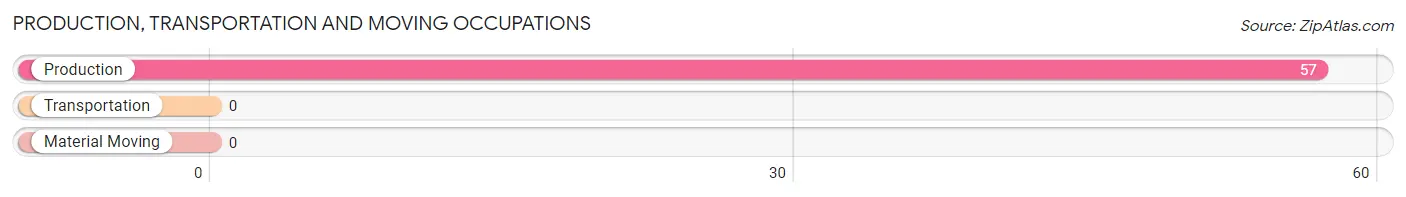
Production, Transportation and Moving Occupations
The most common Production, Transportation and Moving occupations in Pineland are , and Production (57 | 12.8%).
Production, Transportation and Moving Occupations by Sex
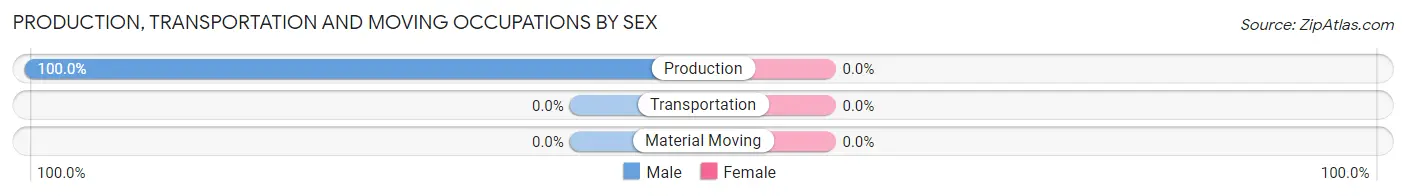
| Occupation | Male | Female |
| Production | 57 (100.0%) | 0 (0.0%) |
| Transportation | 0 (0.0%) | 0 (0.0%) |
| Material Moving | 0 (0.0%) | 0 (0.0%) |
| Total (Category) | 57 (100.0%) | 0 (0.0%) |
| Total (Overall) | 181 (40.7%) | 264 (59.3%) |
Employment Industries by Sex in Pineland
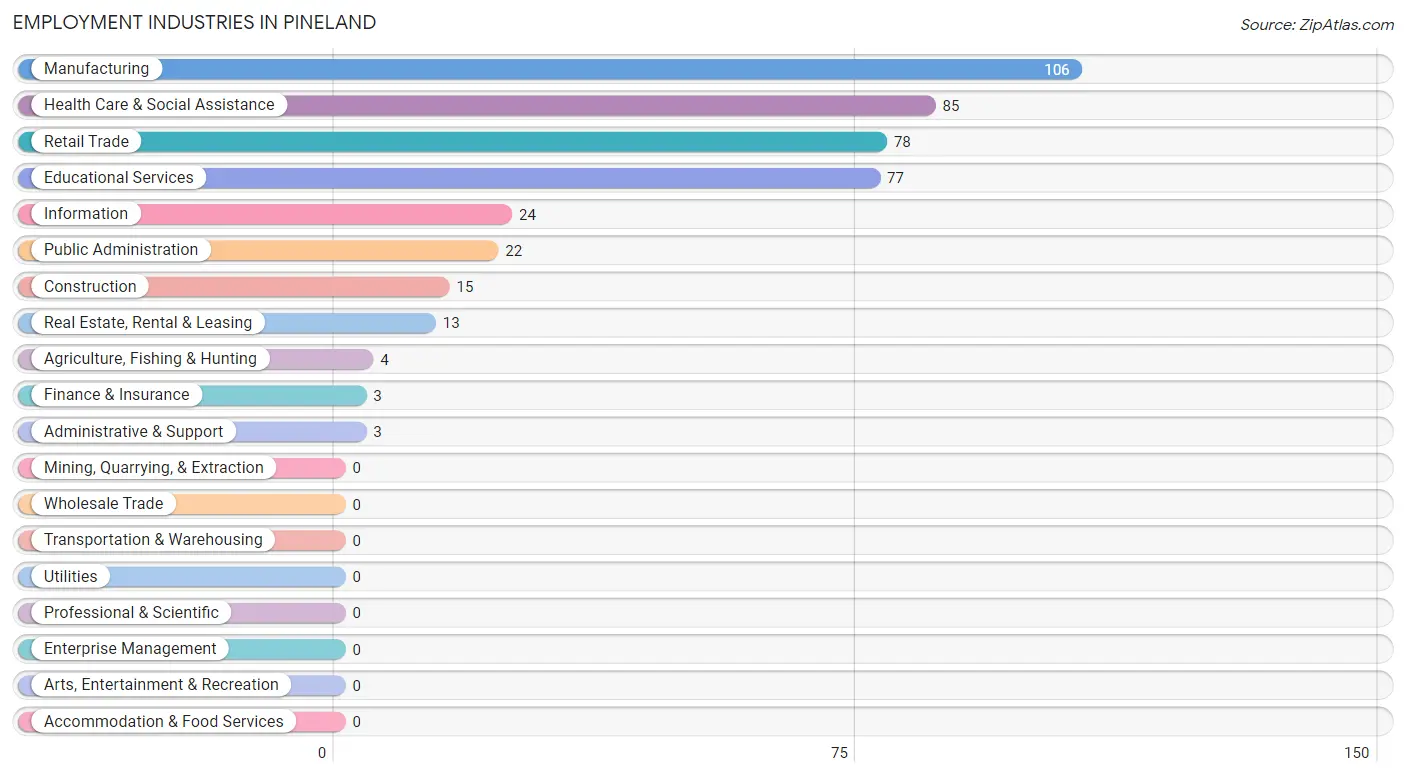
Employment Industries in Pineland
The major employment industries in Pineland include Manufacturing (106 | 23.8%), Health Care & Social Assistance (85 | 19.1%), Retail Trade (78 | 17.5%), Educational Services (77 | 17.3%), and Information (24 | 5.4%).
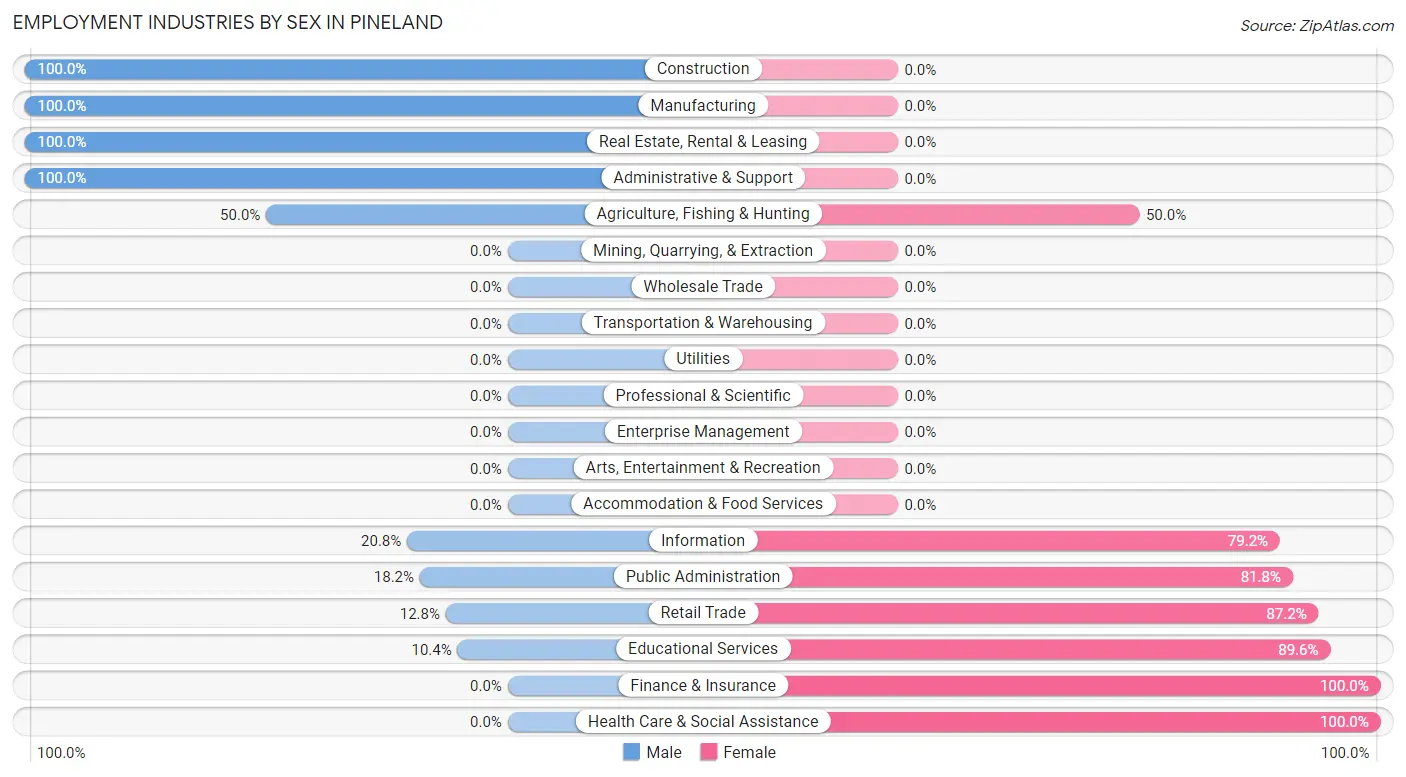
Employment Industries by Sex in Pineland
The Pineland industries that see more men than women are Construction (100.0%), Manufacturing (100.0%), and Real Estate, Rental & Leasing (100.0%), whereas the industries that tend to have a higher number of women are Finance & Insurance (100.0%), Health Care & Social Assistance (100.0%), and Educational Services (89.6%).
| Industry | Male | Female |
| Agriculture, Fishing & Hunting | 2 (50.0%) | 2 (50.0%) |
| Mining, Quarrying, & Extraction | 0 (0.0%) | 0 (0.0%) |
| Construction | 15 (100.0%) | 0 (0.0%) |
| Manufacturing | 106 (100.0%) | 0 (0.0%) |
| Wholesale Trade | 0 (0.0%) | 0 (0.0%) |
| Retail Trade | 10 (12.8%) | 68 (87.2%) |
| Transportation & Warehousing | 0 (0.0%) | 0 (0.0%) |
| Utilities | 0 (0.0%) | 0 (0.0%) |
| Information | 5 (20.8%) | 19 (79.2%) |
| Finance & Insurance | 0 (0.0%) | 3 (100.0%) |
| Real Estate, Rental & Leasing | 13 (100.0%) | 0 (0.0%) |
| Professional & Scientific | 0 (0.0%) | 0 (0.0%) |
| Enterprise Management | 0 (0.0%) | 0 (0.0%) |
| Administrative & Support | 3 (100.0%) | 0 (0.0%) |
| Educational Services | 8 (10.4%) | 69 (89.6%) |
| Health Care & Social Assistance | 0 (0.0%) | 85 (100.0%) |
| Arts, Entertainment & Recreation | 0 (0.0%) | 0 (0.0%) |
| Accommodation & Food Services | 0 (0.0%) | 0 (0.0%) |
| Public Administration | 4 (18.2%) | 18 (81.8%) |
| Total | 181 (40.7%) | 264 (59.3%) |
Education in Pineland
School Enrollment in Pineland
The most common levels of schooling among the 227 students in Pineland are high school (96 | 42.3%), elementary school (61 | 26.9%), and middle school (51 | 22.5%).
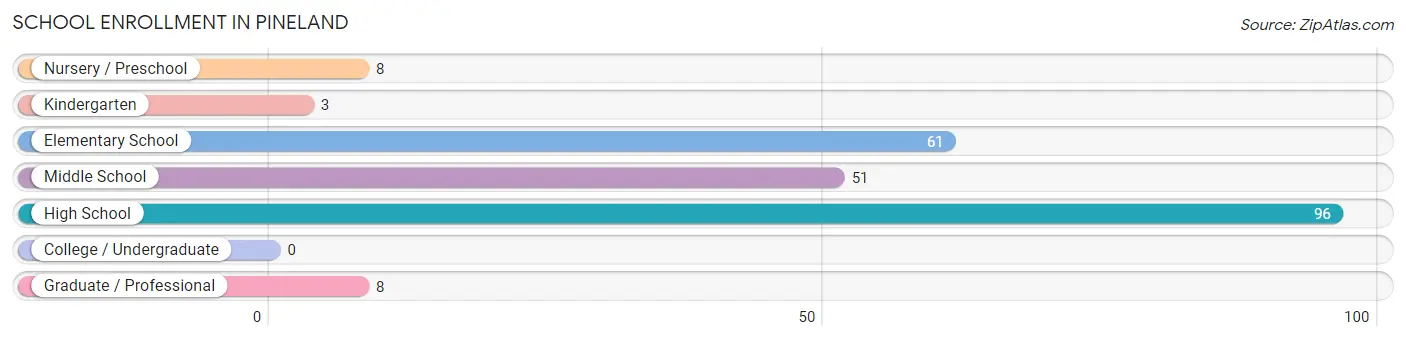
| School Level | # Students | % Students |
| Nursery / Preschool | 8 | 3.5% |
| Kindergarten | 3 | 1.3% |
| Elementary School | 61 | 26.9% |
| Middle School | 51 | 22.5% |
| High School | 96 | 42.3% |
| College / Undergraduate | 0 | 0.0% |
| Graduate / Professional | 8 | 3.5% |
| Total | 227 | 100.0% |
School Enrollment by Age by Funding Source in Pineland
Out of a total of 227 students who are enrolled in schools in Pineland, 43 (18.9%) attend a private institution, while the remaining 184 (81.1%) are enrolled in public schools. The age group of 3 to 4 year olds has the highest likelihood of being enrolled in private schools, with 5 (100.0% in the age bracket) enrolled. Conversely, the age group of 5 to 9 year old has the lowest likelihood of being enrolled in a private school, with 66 (100.0% in the age bracket) attending a public institution.
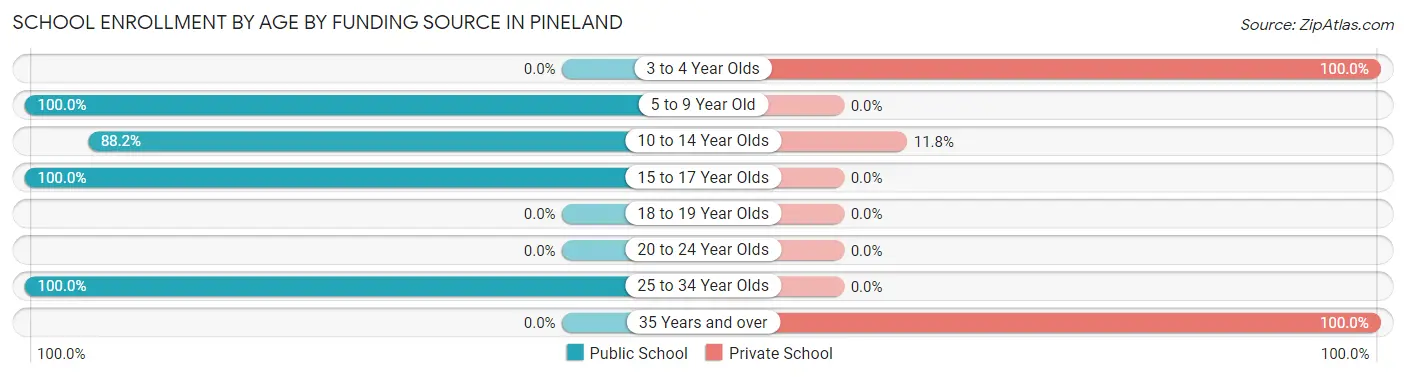
| Age Bracket | Public School | Private School |
| 3 to 4 Year Olds | 0 (0.0%) | 5 (100.0%) |
| 5 to 9 Year Old | 66 (100.0%) | 0 (0.0%) |
| 10 to 14 Year Olds | 60 (88.2%) | 8 (11.8%) |
| 15 to 17 Year Olds | 50 (100.0%) | 0 (0.0%) |
| 18 to 19 Year Olds | 0 (0.0%) | 0 (0.0%) |
| 20 to 24 Year Olds | 0 (0.0%) | 0 (0.0%) |
| 25 to 34 Year Olds | 8 (100.0%) | 0 (0.0%) |
| 35 Years and over | 0 (0.0%) | 30 (100.0%) |
| Total | 184 (81.1%) | 43 (18.9%) |
Educational Attainment by Field of Study in Pineland
Education (63 | 49.6%), bio, nature & agricultural (22 | 17.3%), engineering (17 | 13.4%), business (17 | 13.4%), and communications (8 | 6.3%) are the most common fields of study among 127 individuals in Pineland who have obtained a bachelor's degree or higher.
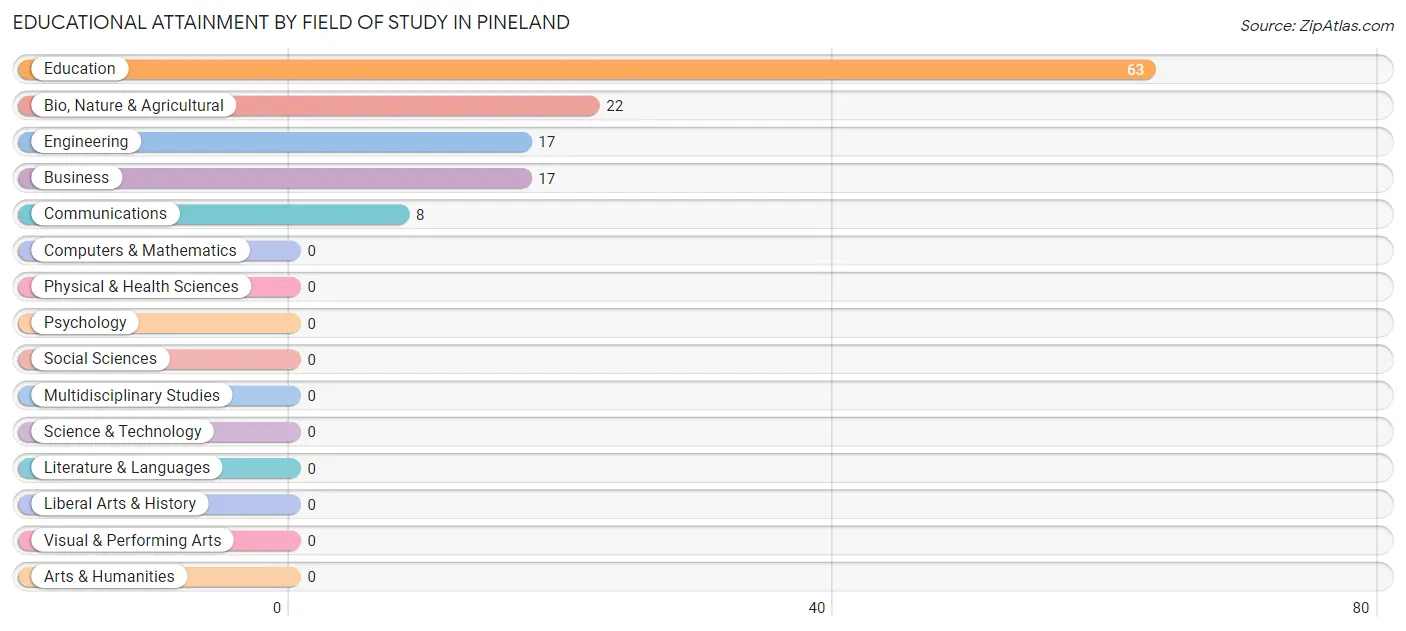
| Field of Study | # Graduates | % Graduates |
| Computers & Mathematics | 0 | 0.0% |
| Bio, Nature & Agricultural | 22 | 17.3% |
| Physical & Health Sciences | 0 | 0.0% |
| Psychology | 0 | 0.0% |
| Social Sciences | 0 | 0.0% |
| Engineering | 17 | 13.4% |
| Multidisciplinary Studies | 0 | 0.0% |
| Science & Technology | 0 | 0.0% |
| Business | 17 | 13.4% |
| Education | 63 | 49.6% |
| Literature & Languages | 0 | 0.0% |
| Liberal Arts & History | 0 | 0.0% |
| Visual & Performing Arts | 0 | 0.0% |
| Communications | 8 | 6.3% |
| Arts & Humanities | 0 | 0.0% |
| Total | 127 | 100.0% |
Transportation & Commute in Pineland
Vehicle Availability by Sex in Pineland
The most prevalent vehicle ownership categories in Pineland are males with 2 vehicles (115, accounting for 63.5%) and females with 2 vehicles (87, making up 52.3%).
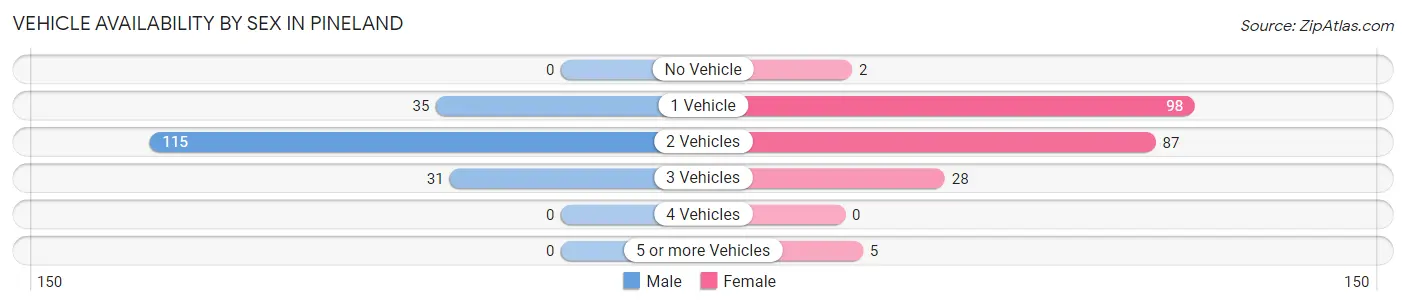
| Vehicles Available | Male | Female |
| No Vehicle | 0 (0.0%) | 2 (0.9%) |
| 1 Vehicle | 35 (19.3%) | 98 (44.6%) |
| 2 Vehicles | 115 (63.5%) | 87 (39.6%) |
| 3 Vehicles | 31 (17.1%) | 28 (12.7%) |
| 4 Vehicles | 0 (0.0%) | 0 (0.0%) |
| 5 or more Vehicles | 0 (0.0%) | 5 (2.3%) |
| Total | 181 (100.0%) | 220 (100.0%) |
Commute Time in Pineland
The most frequently occuring commute durations in Pineland are 5 to 9 minutes (90 commuters, 22.7%), less than 5 minutes (77 commuters, 19.4%), and 30 to 34 minutes (45 commuters, 11.4%).
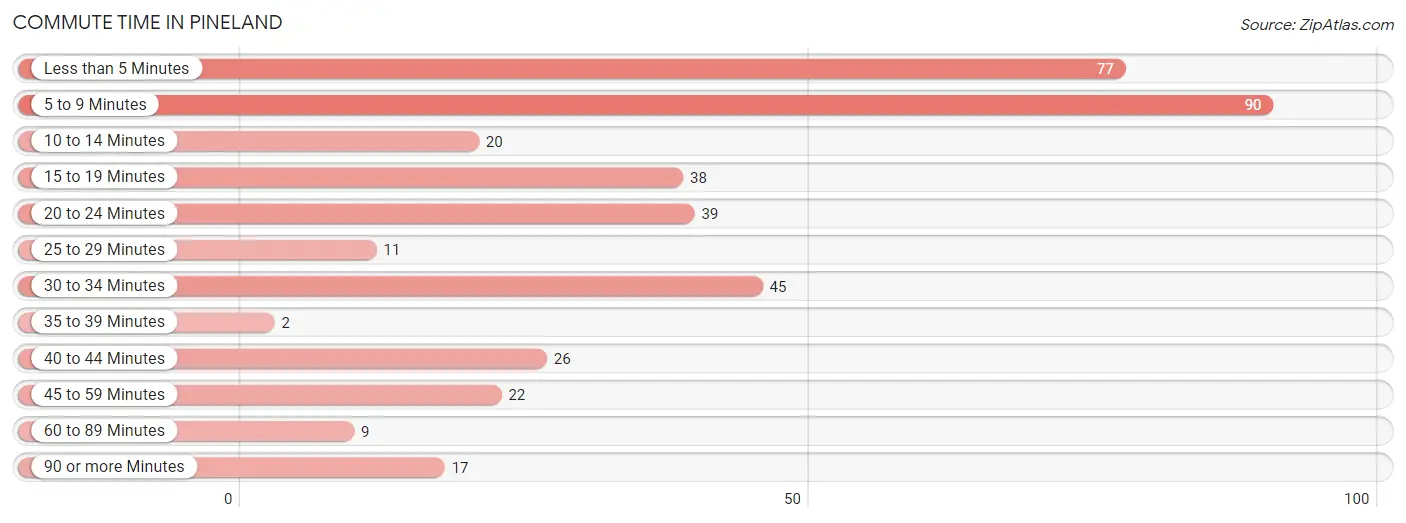
| Commute Time | # Commuters | % Commuters |
| Less than 5 Minutes | 77 | 19.4% |
| 5 to 9 Minutes | 90 | 22.7% |
| 10 to 14 Minutes | 20 | 5.1% |
| 15 to 19 Minutes | 38 | 9.6% |
| 20 to 24 Minutes | 39 | 9.9% |
| 25 to 29 Minutes | 11 | 2.8% |
| 30 to 34 Minutes | 45 | 11.4% |
| 35 to 39 Minutes | 2 | 0.5% |
| 40 to 44 Minutes | 26 | 6.6% |
| 45 to 59 Minutes | 22 | 5.6% |
| 60 to 89 Minutes | 9 | 2.3% |
| 90 or more Minutes | 17 | 4.3% |
Commute Time by Sex in Pineland
The most common commute times in Pineland are less than 5 minutes (47 commuters, 26.7%) for males and 5 to 9 minutes (59 commuters, 26.8%) for females.
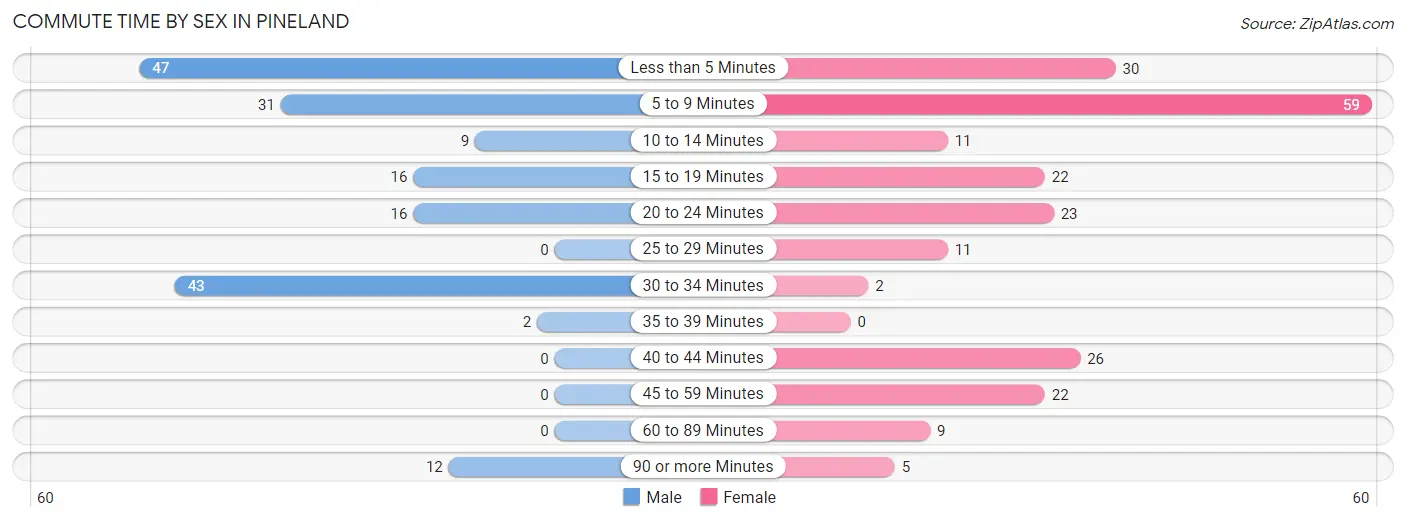
| Commute Time | Male | Female |
| Less than 5 Minutes | 47 (26.7%) | 30 (13.6%) |
| 5 to 9 Minutes | 31 (17.6%) | 59 (26.8%) |
| 10 to 14 Minutes | 9 (5.1%) | 11 (5.0%) |
| 15 to 19 Minutes | 16 (9.1%) | 22 (10.0%) |
| 20 to 24 Minutes | 16 (9.1%) | 23 (10.4%) |
| 25 to 29 Minutes | 0 (0.0%) | 11 (5.0%) |
| 30 to 34 Minutes | 43 (24.4%) | 2 (0.9%) |
| 35 to 39 Minutes | 2 (1.1%) | 0 (0.0%) |
| 40 to 44 Minutes | 0 (0.0%) | 26 (11.8%) |
| 45 to 59 Minutes | 0 (0.0%) | 22 (10.0%) |
| 60 to 89 Minutes | 0 (0.0%) | 9 (4.1%) |
| 90 or more Minutes | 12 (6.8%) | 5 (2.3%) |
Time of Departure to Work by Sex in Pineland
The most frequent times of departure to work in Pineland are 12:00 AM to 4:59 AM (55, 31.2%) for males and 7:00 AM to 7:29 AM (65, 29.5%) for females.
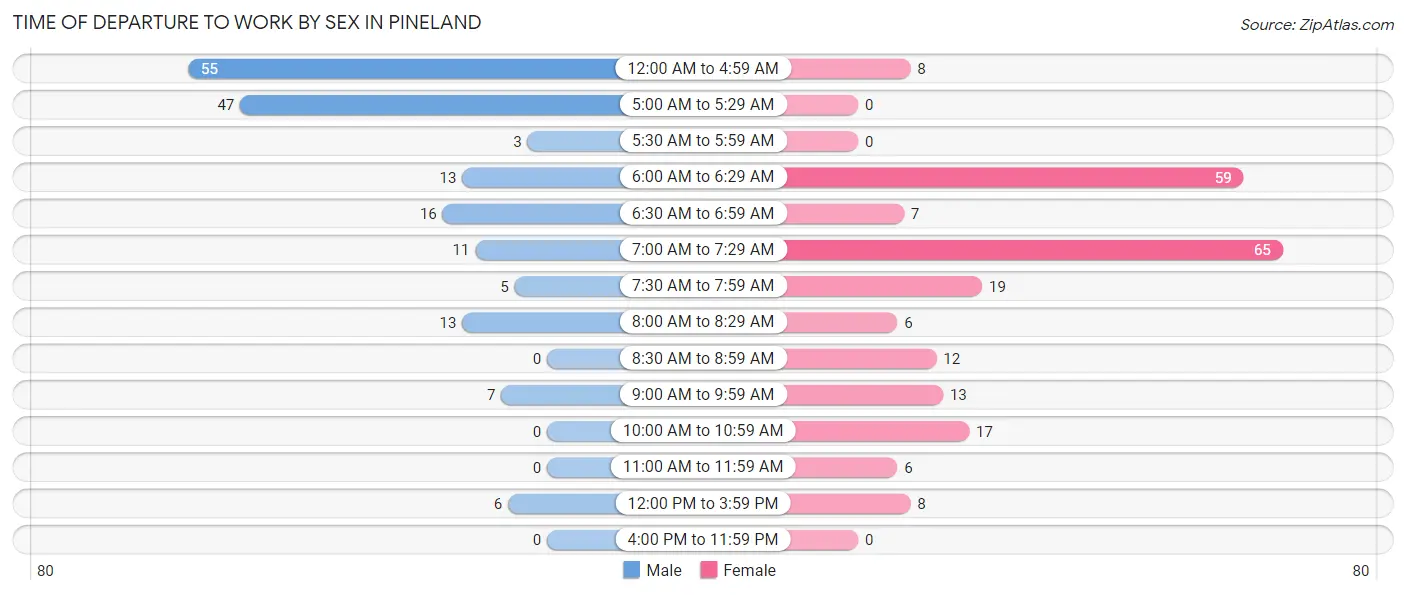
| Time of Departure | Male | Female |
| 12:00 AM to 4:59 AM | 55 (31.2%) | 8 (3.6%) |
| 5:00 AM to 5:29 AM | 47 (26.7%) | 0 (0.0%) |
| 5:30 AM to 5:59 AM | 3 (1.7%) | 0 (0.0%) |
| 6:00 AM to 6:29 AM | 13 (7.4%) | 59 (26.8%) |
| 6:30 AM to 6:59 AM | 16 (9.1%) | 7 (3.2%) |
| 7:00 AM to 7:29 AM | 11 (6.2%) | 65 (29.5%) |
| 7:30 AM to 7:59 AM | 5 (2.8%) | 19 (8.6%) |
| 8:00 AM to 8:29 AM | 13 (7.4%) | 6 (2.7%) |
| 8:30 AM to 8:59 AM | 0 (0.0%) | 12 (5.4%) |
| 9:00 AM to 9:59 AM | 7 (4.0%) | 13 (5.9%) |
| 10:00 AM to 10:59 AM | 0 (0.0%) | 17 (7.7%) |
| 11:00 AM to 11:59 AM | 0 (0.0%) | 6 (2.7%) |
| 12:00 PM to 3:59 PM | 6 (3.4%) | 8 (3.6%) |
| 4:00 PM to 11:59 PM | 0 (0.0%) | 0 (0.0%) |
| Total | 176 (100.0%) | 220 (100.0%) |
Housing Occupancy in Pineland
Occupancy by Ownership in Pineland
Of the total 468 dwellings in Pineland, owner-occupied units account for 324 (69.2%), while renter-occupied units make up 144 (30.8%).
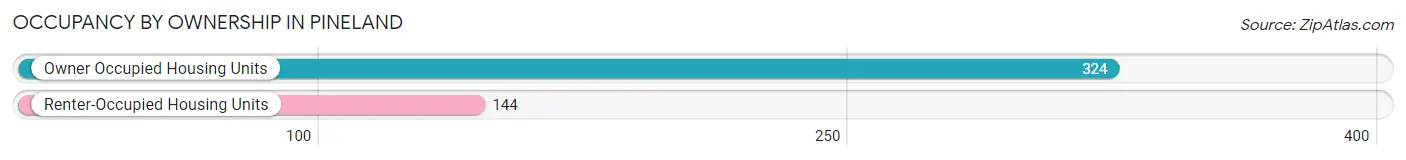
| Occupancy | # Housing Units | % Housing Units |
| Owner Occupied Housing Units | 324 | 69.2% |
| Renter-Occupied Housing Units | 144 | 30.8% |
| Total Occupied Housing Units | 468 | 100.0% |
Occupancy by Household Size in Pineland
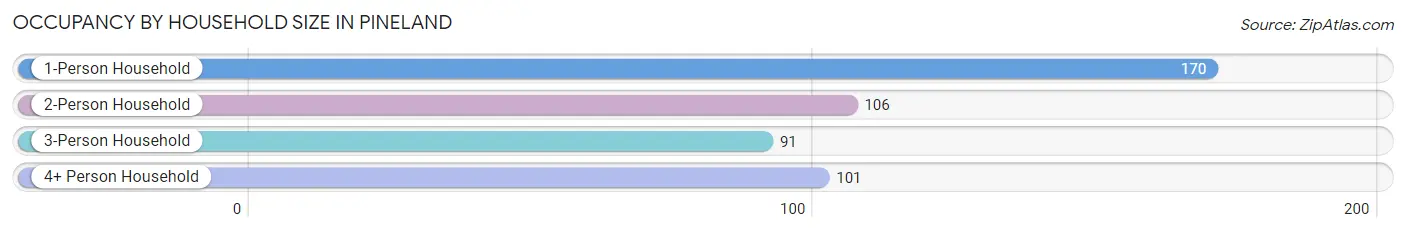
| Household Size | # Housing Units | % Housing Units |
| 1-Person Household | 170 | 36.3% |
| 2-Person Household | 106 | 22.7% |
| 3-Person Household | 91 | 19.4% |
| 4+ Person Household | 101 | 21.6% |
| Total Housing Units | 468 | 100.0% |
Occupancy by Ownership by Household Size in Pineland
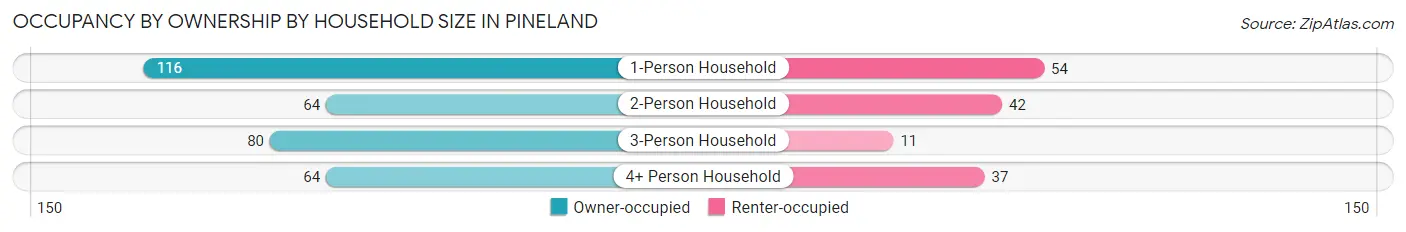
| Household Size | Owner-occupied | Renter-occupied |
| 1-Person Household | 116 (68.2%) | 54 (31.8%) |
| 2-Person Household | 64 (60.4%) | 42 (39.6%) |
| 3-Person Household | 80 (87.9%) | 11 (12.1%) |
| 4+ Person Household | 64 (63.4%) | 37 (36.6%) |
| Total Housing Units | 324 (69.2%) | 144 (30.8%) |
Occupancy by Educational Attainment in Pineland
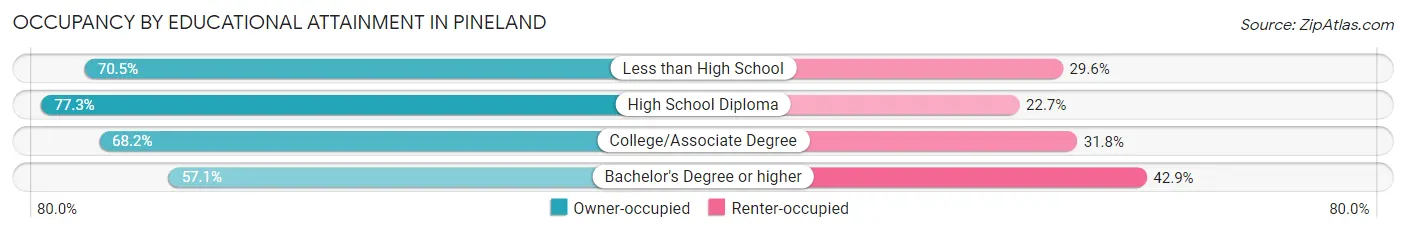
| Household Size | Owner-occupied | Renter-occupied |
| Less than High School | 62 (70.5%) | 26 (29.5%) |
| High School Diploma | 116 (77.3%) | 34 (22.7%) |
| College/Associate Degree | 90 (68.2%) | 42 (31.8%) |
| Bachelor's Degree or higher | 56 (57.1%) | 42 (42.9%) |
Occupancy by Age of Householder in Pineland
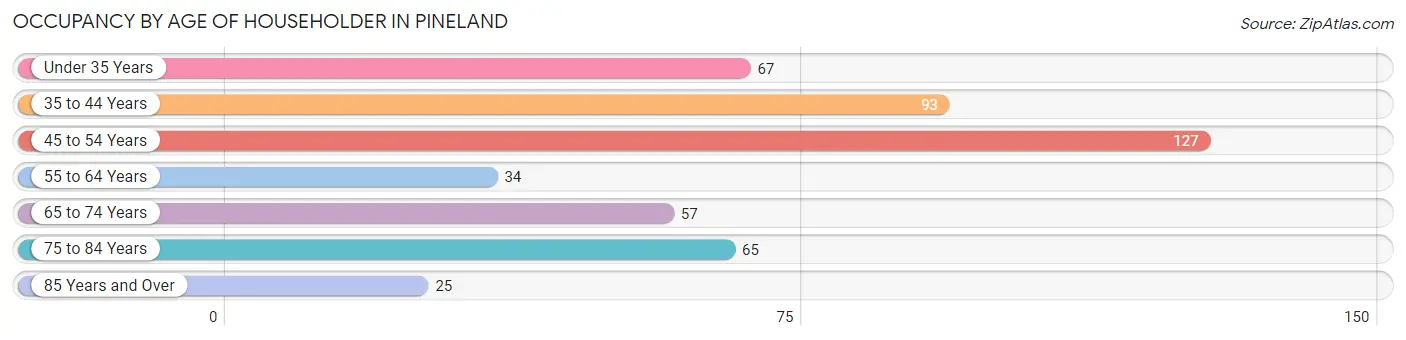
| Age Bracket | # Households | % Households |
| Under 35 Years | 67 | 14.3% |
| 35 to 44 Years | 93 | 19.9% |
| 45 to 54 Years | 127 | 27.1% |
| 55 to 64 Years | 34 | 7.3% |
| 65 to 74 Years | 57 | 12.2% |
| 75 to 84 Years | 65 | 13.9% |
| 85 Years and Over | 25 | 5.3% |
| Total | 468 | 100.0% |
Housing Finances in Pineland
Median Income by Occupancy in Pineland
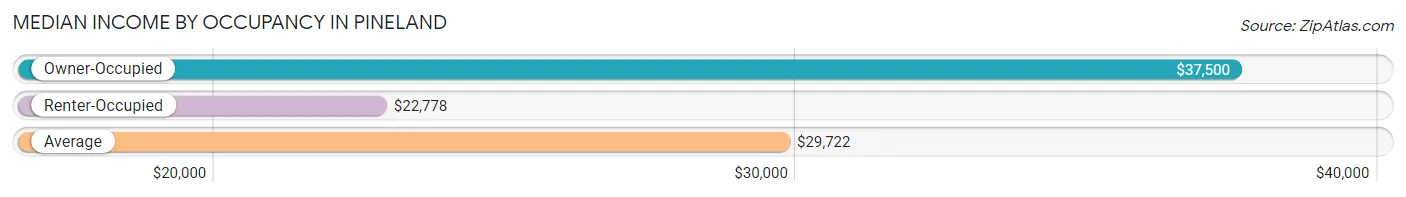
| Occupancy Type | # Households | Median Income |
| Owner-Occupied | 324 (69.2%) | $37,500 |
| Renter-Occupied | 144 (30.8%) | $22,778 |
| Average | 468 (100.0%) | $29,722 |
Occupancy by Householder Income Bracket in Pineland
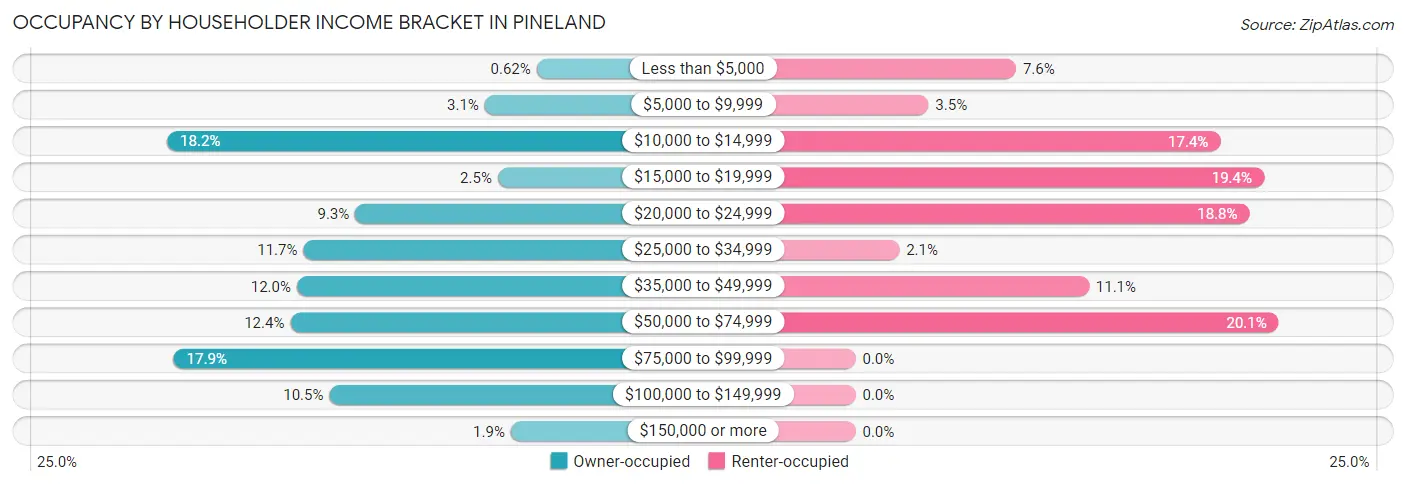
| Income Bracket | Owner-occupied | Renter-occupied |
| Less than $5,000 | 2 (0.6%) | 11 (7.6%) |
| $5,000 to $9,999 | 10 (3.1%) | 5 (3.5%) |
| $10,000 to $14,999 | 59 (18.2%) | 25 (17.4%) |
| $15,000 to $19,999 | 8 (2.5%) | 28 (19.4%) |
| $20,000 to $24,999 | 30 (9.3%) | 27 (18.8%) |
| $25,000 to $34,999 | 38 (11.7%) | 3 (2.1%) |
| $35,000 to $49,999 | 39 (12.0%) | 16 (11.1%) |
| $50,000 to $74,999 | 40 (12.3%) | 29 (20.1%) |
| $75,000 to $99,999 | 58 (17.9%) | 0 (0.0%) |
| $100,000 to $149,999 | 34 (10.5%) | 0 (0.0%) |
| $150,000 or more | 6 (1.8%) | 0 (0.0%) |
| Total | 324 (100.0%) | 144 (100.0%) |
Monthly Housing Cost Tiers in Pineland
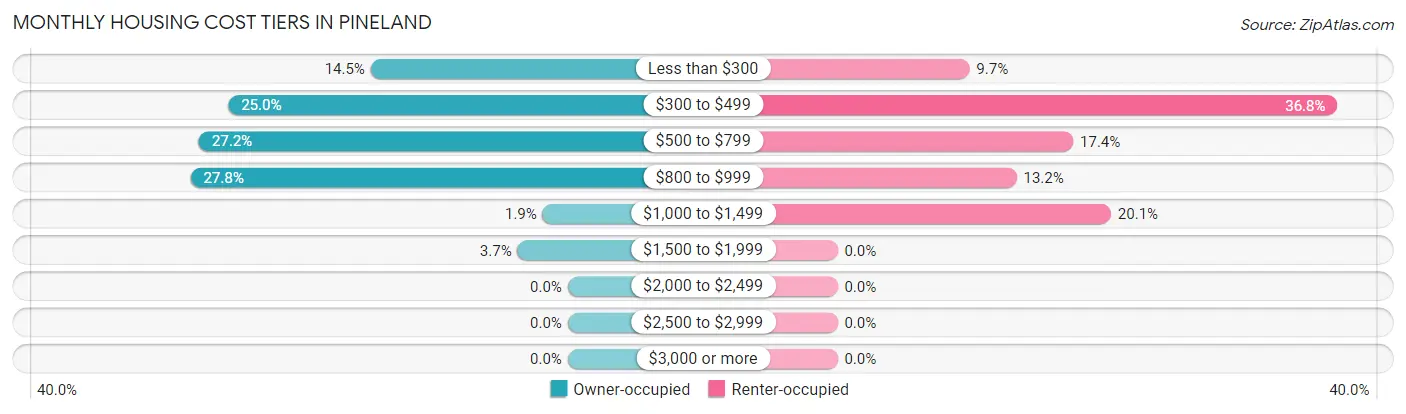
| Monthly Cost | Owner-occupied | Renter-occupied |
| Less than $300 | 47 (14.5%) | 14 (9.7%) |
| $300 to $499 | 81 (25.0%) | 53 (36.8%) |
| $500 to $799 | 88 (27.2%) | 25 (17.4%) |
| $800 to $999 | 90 (27.8%) | 19 (13.2%) |
| $1,000 to $1,499 | 6 (1.8%) | 29 (20.1%) |
| $1,500 to $1,999 | 12 (3.7%) | 0 (0.0%) |
| $2,000 to $2,499 | 0 (0.0%) | 0 (0.0%) |
| $2,500 to $2,999 | 0 (0.0%) | 0 (0.0%) |
| $3,000 or more | 0 (0.0%) | 0 (0.0%) |
| Total | 324 (100.0%) | 144 (100.0%) |
Physical Housing Characteristics in Pineland
Housing Structures in Pineland
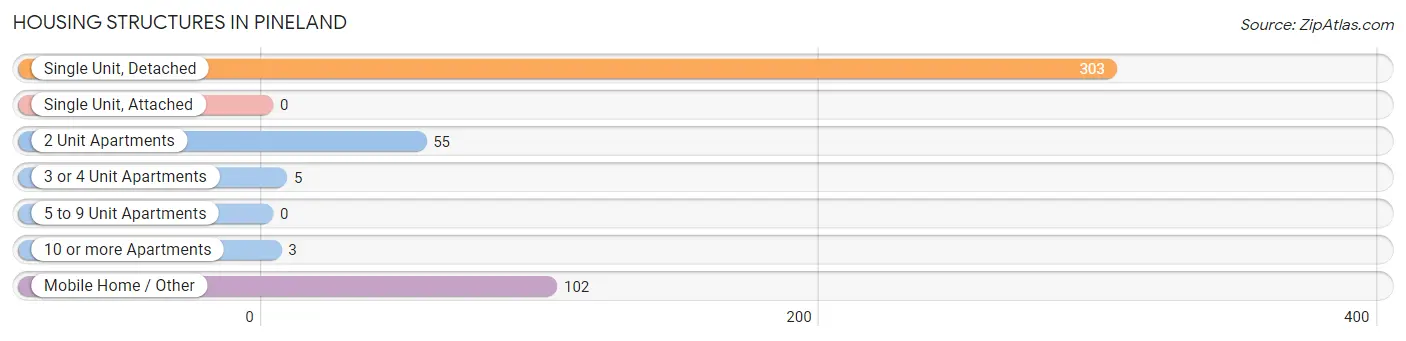
| Structure Type | # Housing Units | % Housing Units |
| Single Unit, Detached | 303 | 64.7% |
| Single Unit, Attached | 0 | 0.0% |
| 2 Unit Apartments | 55 | 11.7% |
| 3 or 4 Unit Apartments | 5 | 1.1% |
| 5 to 9 Unit Apartments | 0 | 0.0% |
| 10 or more Apartments | 3 | 0.6% |
| Mobile Home / Other | 102 | 21.8% |
| Total | 468 | 100.0% |
Housing Structures by Occupancy in Pineland
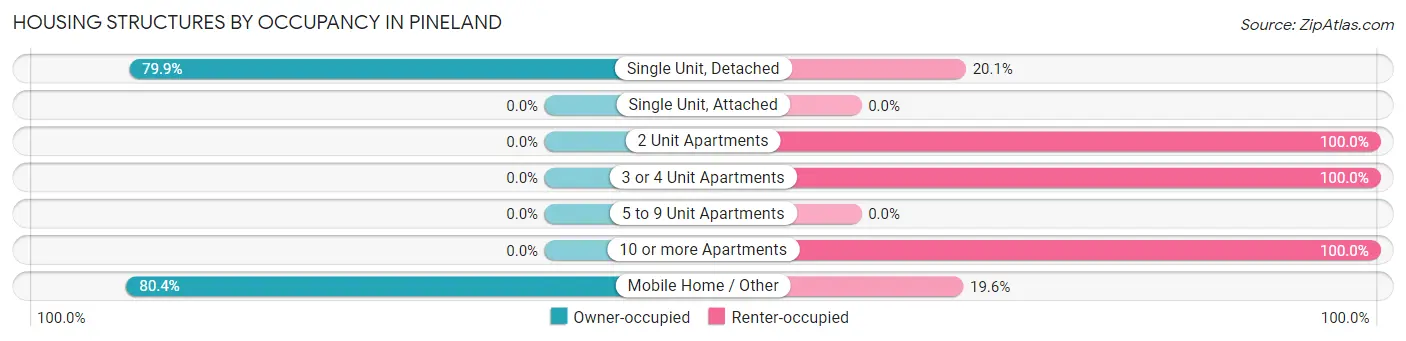
| Structure Type | Owner-occupied | Renter-occupied |
| Single Unit, Detached | 242 (79.9%) | 61 (20.1%) |
| Single Unit, Attached | 0 (0.0%) | 0 (0.0%) |
| 2 Unit Apartments | 0 (0.0%) | 55 (100.0%) |
| 3 or 4 Unit Apartments | 0 (0.0%) | 5 (100.0%) |
| 5 to 9 Unit Apartments | 0 (0.0%) | 0 (0.0%) |
| 10 or more Apartments | 0 (0.0%) | 3 (100.0%) |
| Mobile Home / Other | 82 (80.4%) | 20 (19.6%) |
| Total | 324 (69.2%) | 144 (30.8%) |
Housing Structures by Number of Rooms in Pineland
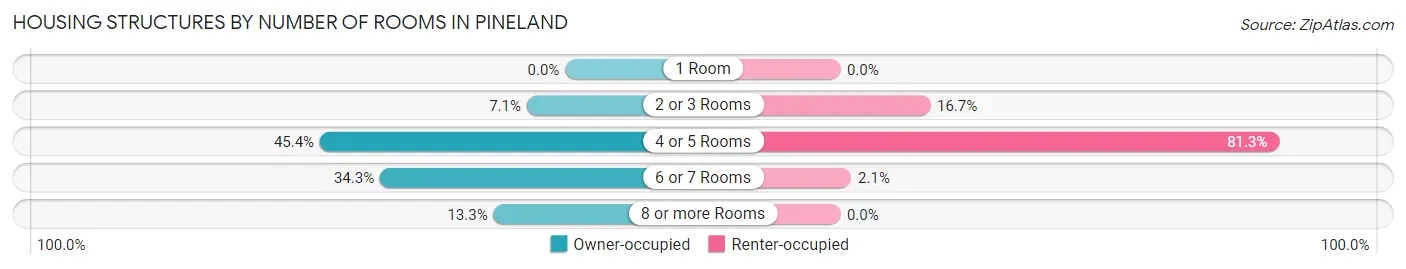
| Number of Rooms | Owner-occupied | Renter-occupied |
| 1 Room | 0 (0.0%) | 0 (0.0%) |
| 2 or 3 Rooms | 23 (7.1%) | 24 (16.7%) |
| 4 or 5 Rooms | 147 (45.4%) | 117 (81.2%) |
| 6 or 7 Rooms | 111 (34.3%) | 3 (2.1%) |
| 8 or more Rooms | 43 (13.3%) | 0 (0.0%) |
| Total | 324 (100.0%) | 144 (100.0%) |
Housing Structure by Heating Type in Pineland
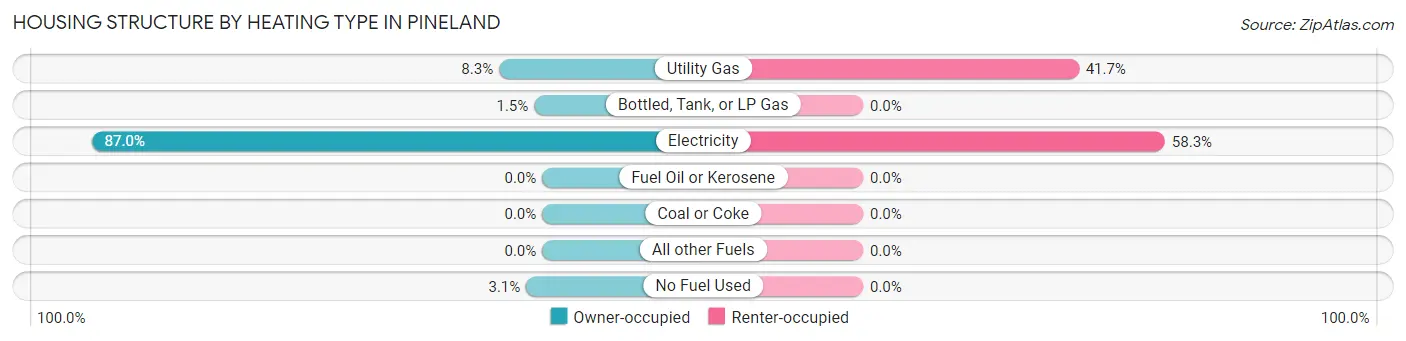
| Heating Type | Owner-occupied | Renter-occupied |
| Utility Gas | 27 (8.3%) | 60 (41.7%) |
| Bottled, Tank, or LP Gas | 5 (1.5%) | 0 (0.0%) |
| Electricity | 282 (87.0%) | 84 (58.3%) |
| Fuel Oil or Kerosene | 0 (0.0%) | 0 (0.0%) |
| Coal or Coke | 0 (0.0%) | 0 (0.0%) |
| All other Fuels | 0 (0.0%) | 0 (0.0%) |
| No Fuel Used | 10 (3.1%) | 0 (0.0%) |
| Total | 324 (100.0%) | 144 (100.0%) |
Household Vehicle Usage in Pineland
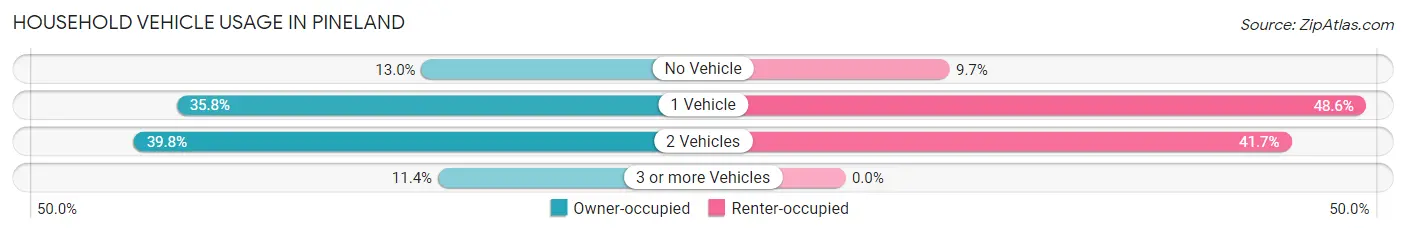
| Vehicles per Household | Owner-occupied | Renter-occupied |
| No Vehicle | 42 (13.0%) | 14 (9.7%) |
| 1 Vehicle | 116 (35.8%) | 70 (48.6%) |
| 2 Vehicles | 129 (39.8%) | 60 (41.7%) |
| 3 or more Vehicles | 37 (11.4%) | 0 (0.0%) |
| Total | 324 (100.0%) | 144 (100.0%) |
Real Estate & Mortgages in Pineland
Real Estate and Mortgage Overview in Pineland
| Characteristic | Without Mortgage | With Mortgage |
| Housing Units | 198 | 126 |
| Median Property Value | $70,500 | $76,000 |
| Median Household Income | $40,357 | $0 |
| Monthly Housing Costs | $440 | $0 |
| Real Estate Taxes | $1,107 | $0 |
Property Value by Mortgage Status in Pineland
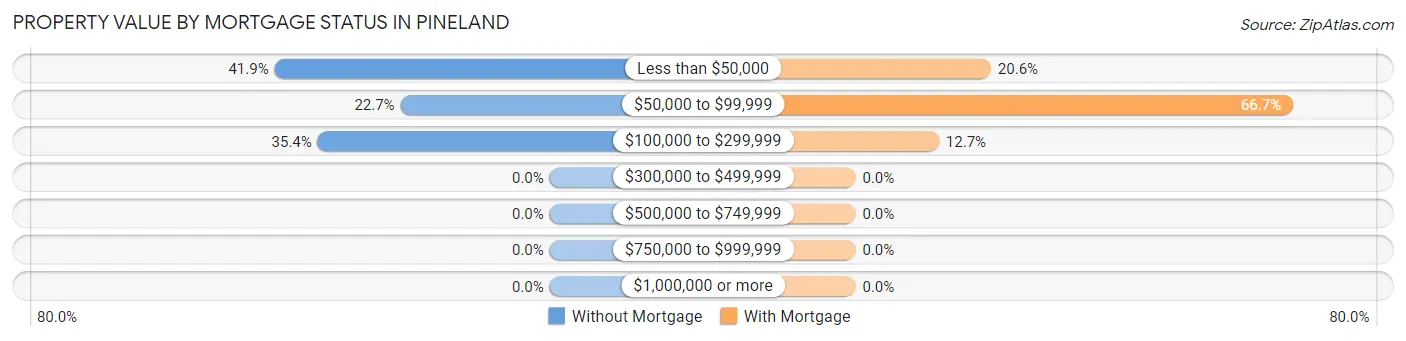
| Property Value | Without Mortgage | With Mortgage |
| Less than $50,000 | 83 (41.9%) | 26 (20.6%) |
| $50,000 to $99,999 | 45 (22.7%) | 84 (66.7%) |
| $100,000 to $299,999 | 70 (35.3%) | 16 (12.7%) |
| $300,000 to $499,999 | 0 (0.0%) | 0 (0.0%) |
| $500,000 to $749,999 | 0 (0.0%) | 0 (0.0%) |
| $750,000 to $999,999 | 0 (0.0%) | 0 (0.0%) |
| $1,000,000 or more | 0 (0.0%) | 0 (0.0%) |
| Total | 198 (100.0%) | 126 (100.0%) |
Household Income by Mortgage Status in Pineland
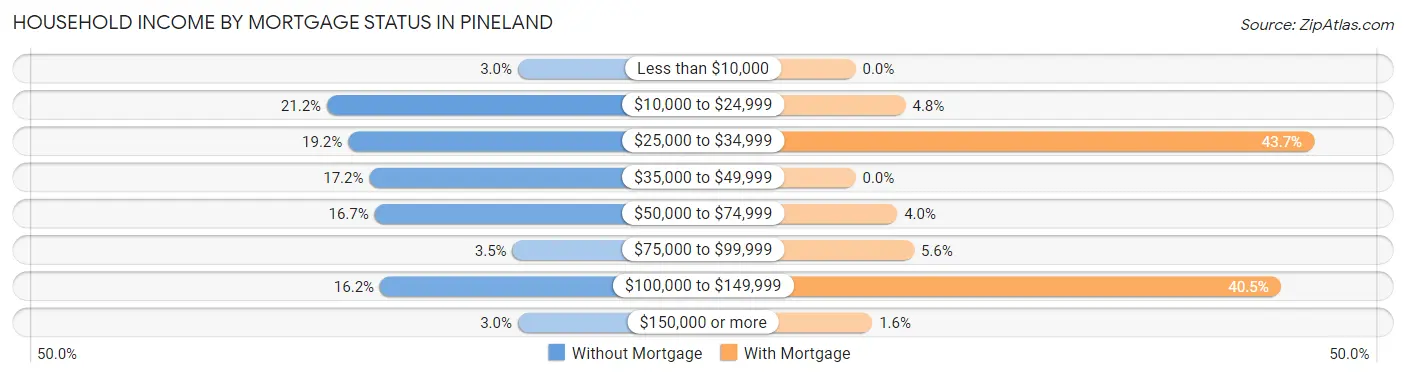
| Household Income | Without Mortgage | With Mortgage |
| Less than $10,000 | 6 (3.0%) | 0 (0.0%) |
| $10,000 to $24,999 | 42 (21.2%) | 6 (4.8%) |
| $25,000 to $34,999 | 38 (19.2%) | 55 (43.6%) |
| $35,000 to $49,999 | 34 (17.2%) | 0 (0.0%) |
| $50,000 to $74,999 | 33 (16.7%) | 5 (4.0%) |
| $75,000 to $99,999 | 7 (3.5%) | 7 (5.6%) |
| $100,000 to $149,999 | 32 (16.2%) | 51 (40.5%) |
| $150,000 or more | 6 (3.0%) | 2 (1.6%) |
| Total | 198 (100.0%) | 126 (100.0%) |
Property Value to Household Income Ratio in Pineland
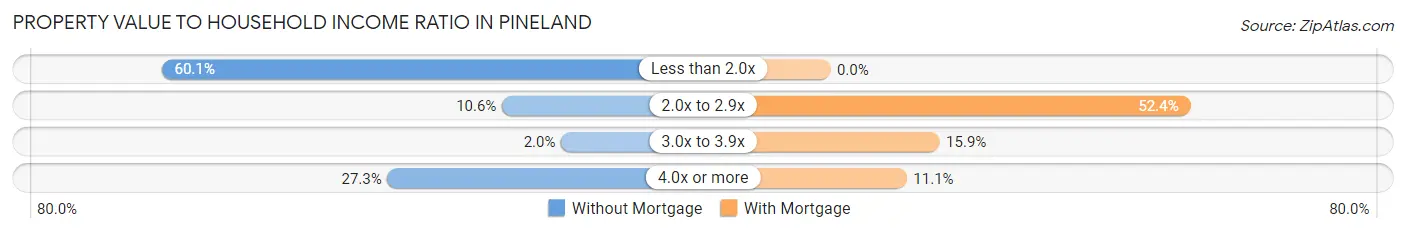
| Value-to-Income Ratio | Without Mortgage | With Mortgage |
| Less than 2.0x | 119 (60.1%) | 0 (0.0%) |
| 2.0x to 2.9x | 21 (10.6%) | 66 (52.4%) |
| 3.0x to 3.9x | 4 (2.0%) | 20 (15.9%) |
| 4.0x or more | 54 (27.3%) | 14 (11.1%) |
| Total | 198 (100.0%) | 126 (100.0%) |
Real Estate Taxes by Mortgage Status in Pineland
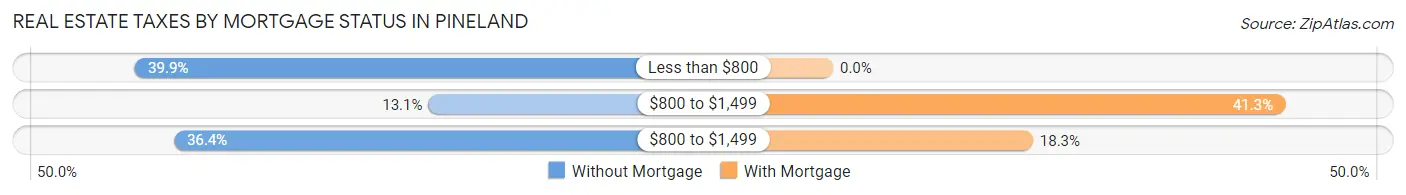
| Property Taxes | Without Mortgage | With Mortgage |
| Less than $800 | 79 (39.9%) | 0 (0.0%) |
| $800 to $1,499 | 26 (13.1%) | 52 (41.3%) |
| $800 to $1,499 | 72 (36.4%) | 23 (18.2%) |
| Total | 198 (100.0%) | 126 (100.0%) |
Health & Disability in Pineland
Health Insurance Coverage by Age in Pineland
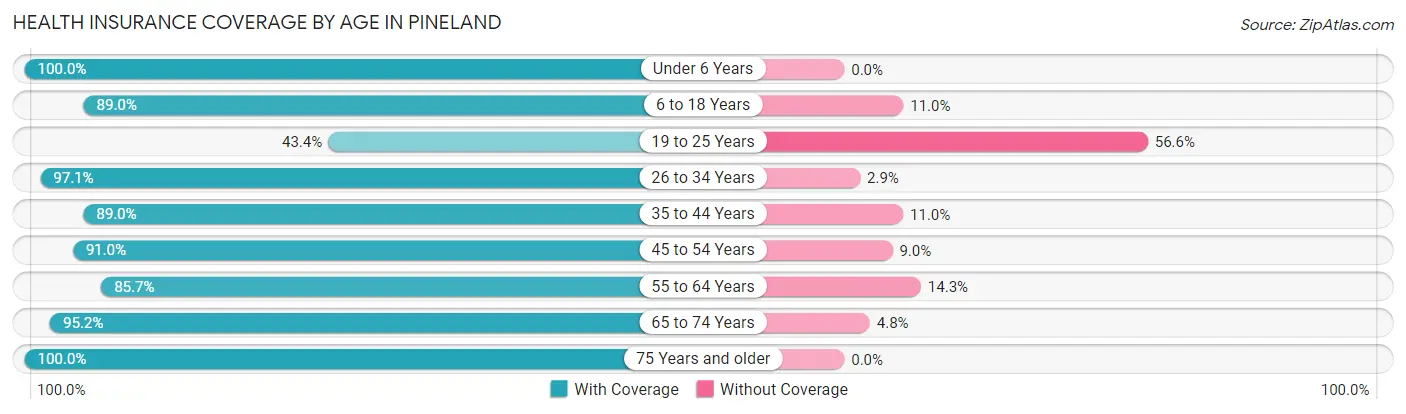
| Age Bracket | With Coverage | Without Coverage |
| Under 6 Years | 87 (100.0%) | 0 (0.0%) |
| 6 to 18 Years | 202 (89.0%) | 25 (11.0%) |
| 19 to 25 Years | 56 (43.4%) | 73 (56.6%) |
| 26 to 34 Years | 132 (97.1%) | 4 (2.9%) |
| 35 to 44 Years | 138 (89.0%) | 17 (11.0%) |
| 45 to 54 Years | 152 (91.0%) | 15 (9.0%) |
| 55 to 64 Years | 90 (85.7%) | 15 (14.3%) |
| 65 to 74 Years | 60 (95.2%) | 3 (4.8%) |
| 75 Years and older | 115 (100.0%) | 0 (0.0%) |
| Total | 1,032 (87.2%) | 152 (12.8%) |
Health Insurance Coverage by Citizenship Status in Pineland
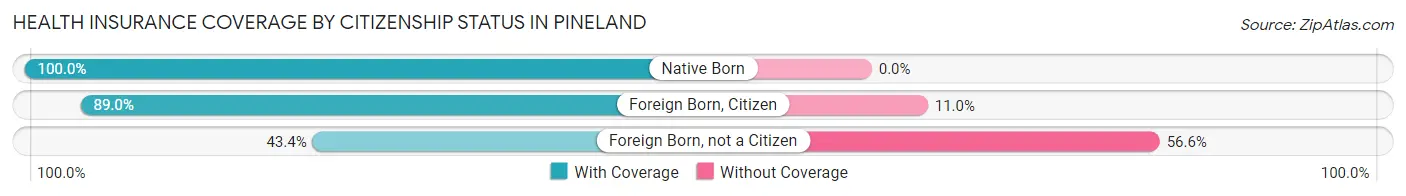
| Citizenship Status | With Coverage | Without Coverage |
| Native Born | 87 (100.0%) | 0 (0.0%) |
| Foreign Born, Citizen | 202 (89.0%) | 25 (11.0%) |
| Foreign Born, not a Citizen | 56 (43.4%) | 73 (56.6%) |
Health Insurance Coverage by Household Income in Pineland
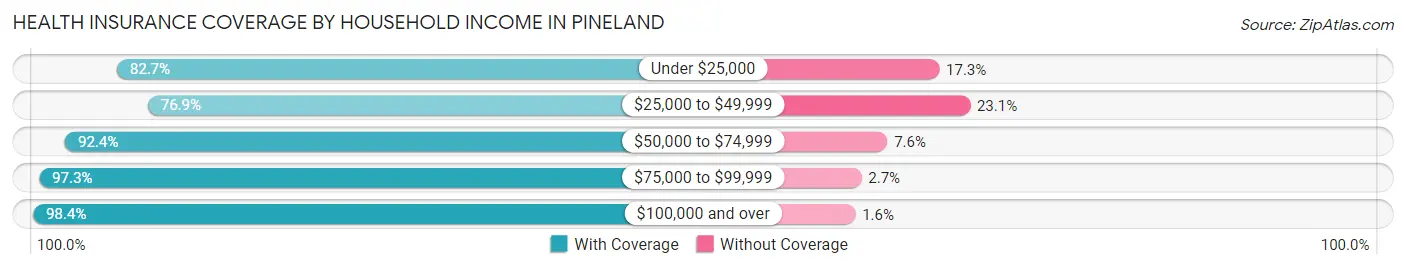
| Household Income | With Coverage | Without Coverage |
| Under $25,000 | 311 (82.7%) | 65 (17.3%) |
| $25,000 to $49,999 | 230 (76.9%) | 69 (23.1%) |
| $50,000 to $74,999 | 122 (92.4%) | 10 (7.6%) |
| $75,000 to $99,999 | 178 (97.3%) | 5 (2.7%) |
| $100,000 and over | 187 (98.4%) | 3 (1.6%) |
Public vs Private Health Insurance Coverage by Age in Pineland
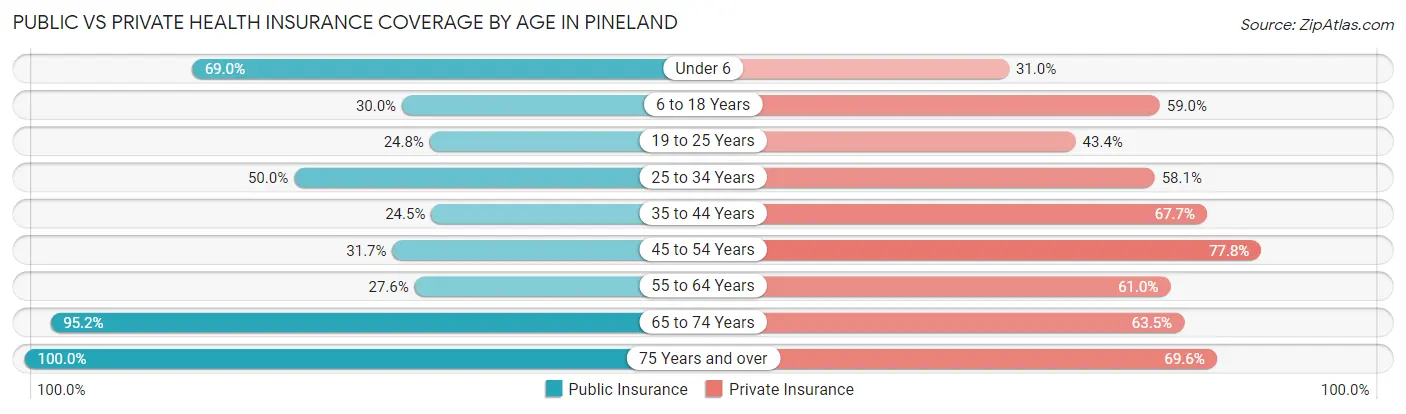
| Age Bracket | Public Insurance | Private Insurance |
| Under 6 | 60 (69.0%) | 27 (31.0%) |
| 6 to 18 Years | 68 (30.0%) | 134 (59.0%) |
| 19 to 25 Years | 32 (24.8%) | 56 (43.4%) |
| 25 to 34 Years | 68 (50.0%) | 79 (58.1%) |
| 35 to 44 Years | 38 (24.5%) | 105 (67.7%) |
| 45 to 54 Years | 53 (31.7%) | 130 (77.8%) |
| 55 to 64 Years | 29 (27.6%) | 64 (61.0%) |
| 65 to 74 Years | 60 (95.2%) | 40 (63.5%) |
| 75 Years and over | 115 (100.0%) | 80 (69.6%) |
| Total | 523 (44.2%) | 715 (60.4%) |
Disability Status by Sex by Age in Pineland
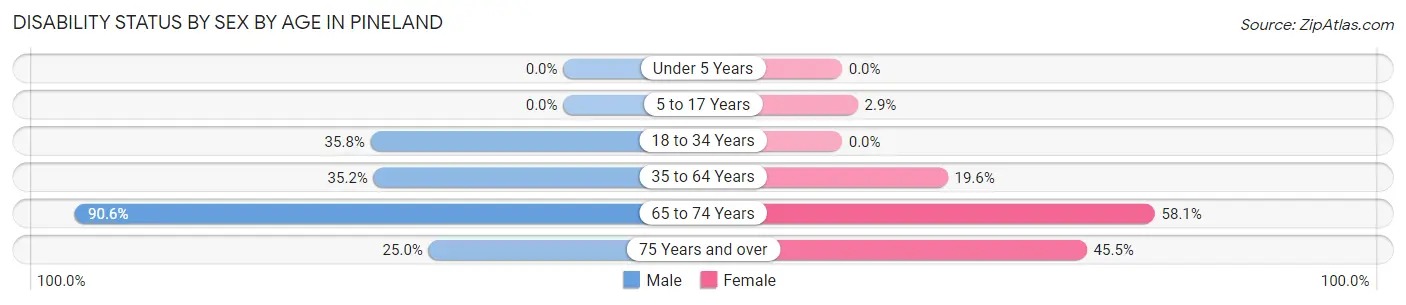
| Age Bracket | Male | Female |
| Under 5 Years | 0 (0.0%) | 0 (0.0%) |
| 5 to 17 Years | 0 (0.0%) | 3 (2.9%) |
| 18 to 34 Years | 49 (35.8%) | 0 (0.0%) |
| 35 to 64 Years | 75 (35.2%) | 42 (19.6%) |
| 65 to 74 Years | 29 (90.6%) | 18 (58.1%) |
| 75 Years and over | 4 (25.0%) | 45 (45.5%) |
Disability Class by Sex by Age in Pineland
Disability Class: Hearing Difficulty
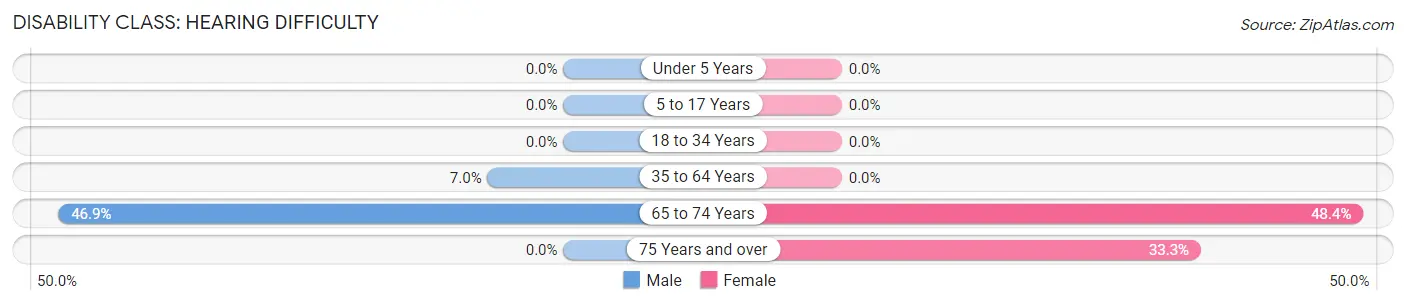
| Age Bracket | Male | Female |
| Under 5 Years | 0 (0.0%) | 0 (0.0%) |
| 5 to 17 Years | 0 (0.0%) | 0 (0.0%) |
| 18 to 34 Years | 0 (0.0%) | 0 (0.0%) |
| 35 to 64 Years | 15 (7.0%) | 0 (0.0%) |
| 65 to 74 Years | 15 (46.9%) | 15 (48.4%) |
| 75 Years and over | 0 (0.0%) | 33 (33.3%) |
Disability Class: Vision Difficulty
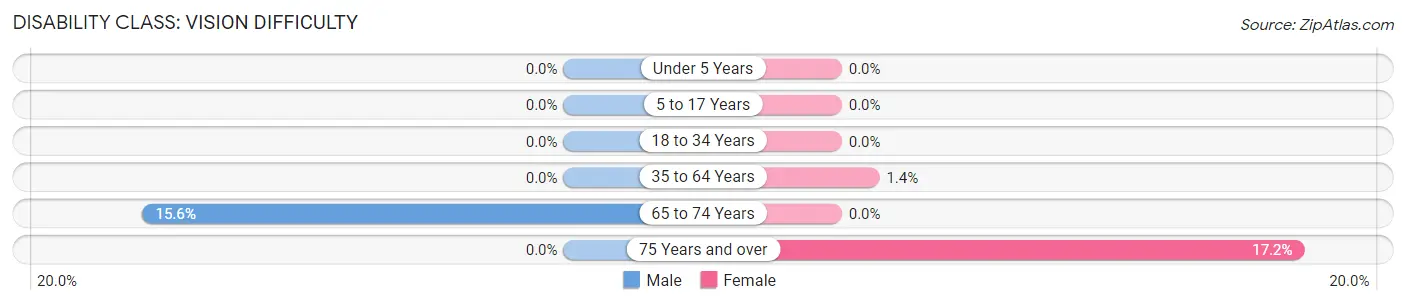
| Age Bracket | Male | Female |
| Under 5 Years | 0 (0.0%) | 0 (0.0%) |
| 5 to 17 Years | 0 (0.0%) | 0 (0.0%) |
| 18 to 34 Years | 0 (0.0%) | 0 (0.0%) |
| 35 to 64 Years | 0 (0.0%) | 3 (1.4%) |
| 65 to 74 Years | 5 (15.6%) | 0 (0.0%) |
| 75 Years and over | 0 (0.0%) | 17 (17.2%) |
Disability Class: Cognitive Difficulty
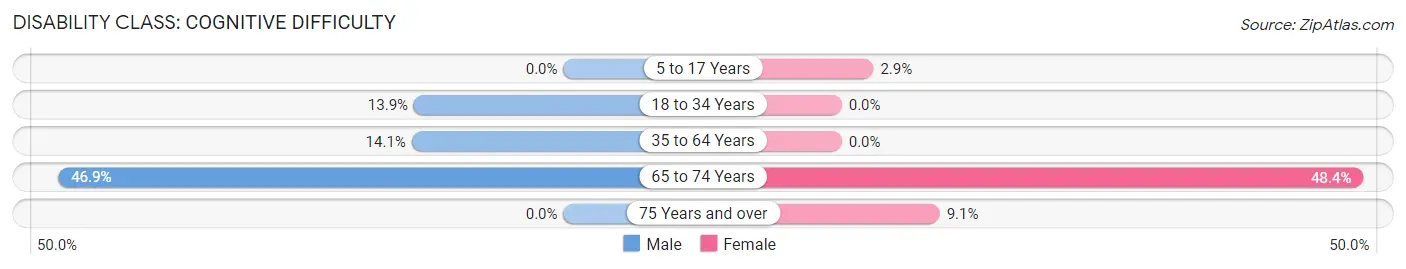
| Age Bracket | Male | Female |
| 5 to 17 Years | 0 (0.0%) | 3 (2.9%) |
| 18 to 34 Years | 19 (13.9%) | 0 (0.0%) |
| 35 to 64 Years | 30 (14.1%) | 0 (0.0%) |
| 65 to 74 Years | 15 (46.9%) | 15 (48.4%) |
| 75 Years and over | 0 (0.0%) | 9 (9.1%) |
Disability Class: Ambulatory Difficulty
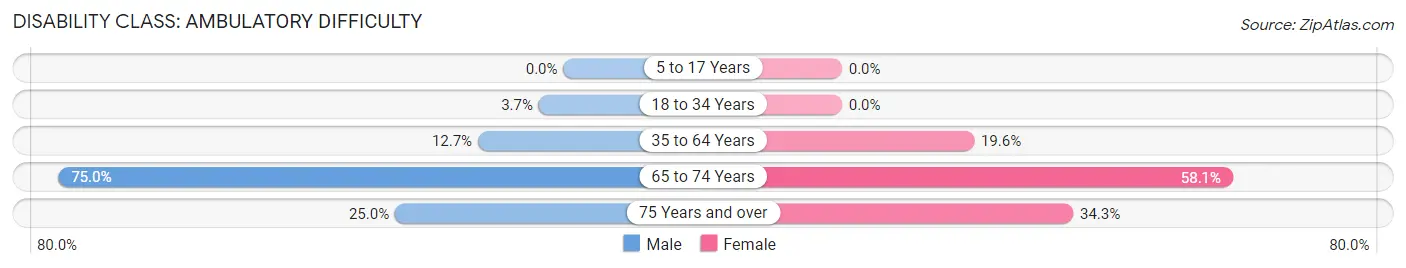
| Age Bracket | Male | Female |
| 5 to 17 Years | 0 (0.0%) | 0 (0.0%) |
| 18 to 34 Years | 5 (3.6%) | 0 (0.0%) |
| 35 to 64 Years | 27 (12.7%) | 42 (19.6%) |
| 65 to 74 Years | 24 (75.0%) | 18 (58.1%) |
| 75 Years and over | 4 (25.0%) | 34 (34.3%) |
Disability Class: Self-Care Difficulty
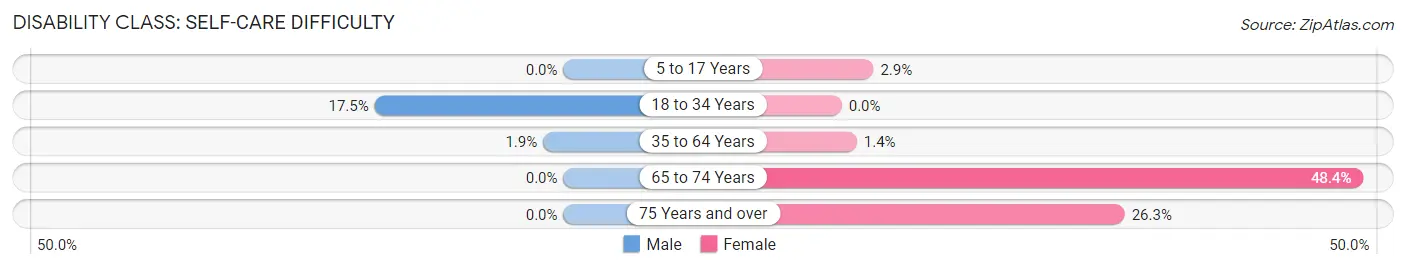
| Age Bracket | Male | Female |
| 5 to 17 Years | 0 (0.0%) | 3 (2.9%) |
| 18 to 34 Years | 24 (17.5%) | 0 (0.0%) |
| 35 to 64 Years | 4 (1.9%) | 3 (1.4%) |
| 65 to 74 Years | 0 (0.0%) | 15 (48.4%) |
| 75 Years and over | 0 (0.0%) | 26 (26.3%) |
Technology Access in Pineland
Computing Device Access in Pineland
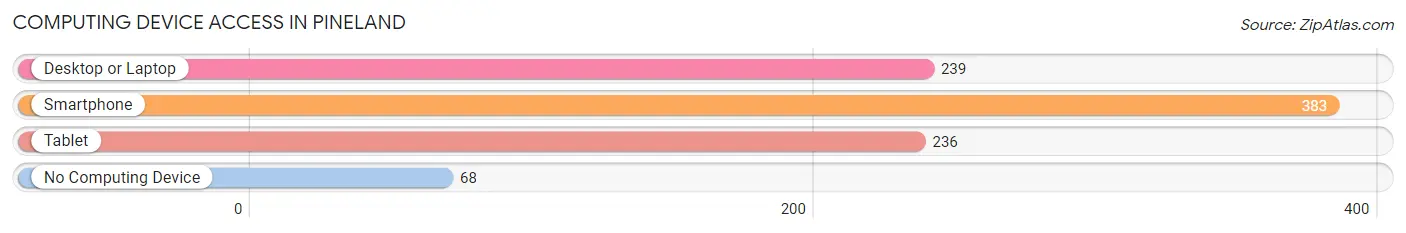
| Device Type | # Households | % Households |
| Desktop or Laptop | 239 | 51.1% |
| Smartphone | 383 | 81.8% |
| Tablet | 236 | 50.4% |
| No Computing Device | 68 | 14.5% |
| Total | 468 | 100.0% |
Internet Access in Pineland
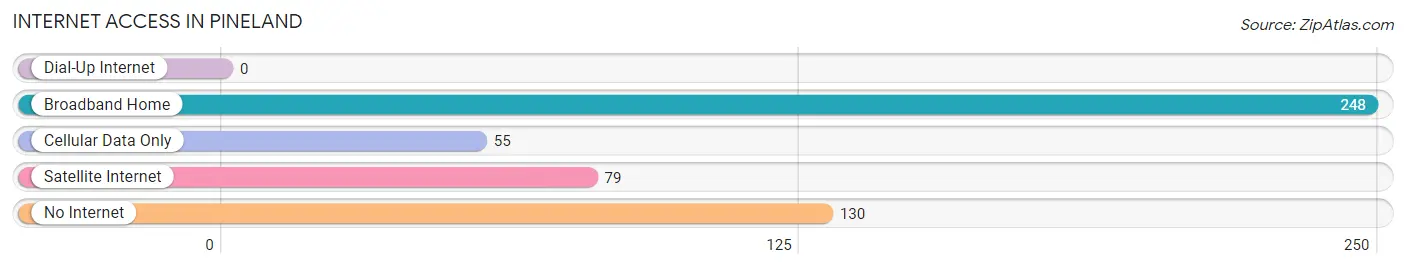
| Internet Type | # Households | % Households |
| Dial-Up Internet | 0 | 0.0% |
| Broadband Home | 248 | 53.0% |
| Cellular Data Only | 55 | 11.7% |
| Satellite Internet | 79 | 16.9% |
| No Internet | 130 | 27.8% |
| Total | 468 | 100.0% |
Pineland Summary
History
The small town of Pineland, Texas is located in the southeastern corner of the state, in the heart of the Piney Woods region. The town was founded in 1845 by a group of settlers from Alabama, who were looking for a place to settle and start a new life. The town was named after the abundance of pine trees in the area, and the settlers quickly began to build homes and businesses.
The town grew slowly but steadily over the years, and by the turn of the 20th century, it had become a thriving community. The town was home to several businesses, including a sawmill, a cotton gin, and a general store. The town also had a school, a post office, and a church.
In the early 1900s, the town began to experience a period of growth and prosperity. The population increased, and new businesses opened up. The town also became a popular tourist destination, as people from all over the country came to visit the beautiful Piney Woods region.
In the 1950s, the town experienced a period of decline. Many of the businesses closed, and the population began to decline. However, in the late 1970s, the town began to experience a resurgence. New businesses opened up, and the population began to increase.
Today, Pineland is a small but vibrant town. It is home to a variety of businesses, including restaurants, shops, and a movie theater. The town also has a museum, a library, and a community center.
Geography
Pineland is located in the southeastern corner of Texas, in the heart of the Piney Woods region. The town is situated on the banks of the Neches River, and is surrounded by dense forests of pine trees. The town is located about 50 miles east of Beaumont, and about 100 miles north of Houston.
The town has a humid subtropical climate, with hot summers and mild winters. The average temperature in the summer is around 90 degrees Fahrenheit, and the average temperature in the winter is around 50 degrees Fahrenheit.
Economy
The economy of Pineland is largely based on tourism and agriculture. The town is home to several tourist attractions, including the Piney Woods Museum, the Neches River Wildlife Refuge, and the Pineland National Wildlife Refuge. The town also has several restaurants, shops, and a movie theater.
The town is also home to several agricultural businesses, including a cotton gin, a sawmill, and a general store. The town also has a variety of small businesses, including a hardware store, a bakery, and a barber shop.
Demographics
As of the 2010 census, the population of Pineland was 1,845. The town has a population density of about 5.5 people per square mile. The median age of the population is 37.7 years, and the median household income is $37,945.
The racial makeup of the town is 79.3% White, 16.2% Hispanic or Latino, 1.7% African American, 0.7% Native American, 0.2% Asian, and 2.1% other. The town has a high rate of poverty, with 24.3% of the population living below the poverty line.
Conclusion
Pineland, Texas is a small but vibrant town located in the southeastern corner of the state. The town was founded in 1845 by a group of settlers from Alabama, and has since grown into a thriving community. The town is home to a variety of businesses, including restaurants, shops, and a movie theater. The town also has a museum, a library, and a community center. The economy of Pineland is largely based on tourism and agriculture, and the town has a population of 1,845 as of the 2010 census.
Common Questions
What is Per Capita Income in Pineland?
Per Capita income in Pineland is $21,883.
What is the Median Family Income in Pineland?
Median Family Income in Pineland is $56,250.
What is the Median Household income in Pineland?
Median Household Income in Pineland is $29,722.
What is Inequality or Gini Index in Pineland?
Inequality or Gini Index in Pineland is 0.48.
What is the Total Population of Pineland?
Total Population of Pineland is 1,192.
What is the Total Male Population of Pineland?
Total Male Population of Pineland is 567.
What is the Total Female Population of Pineland?
Total Female Population of Pineland is 625.
What is the Ratio of Males per 100 Females in Pineland?
There are 90.72 Males per 100 Females in Pineland.
What is the Ratio of Females per 100 Males in Pineland?
There are 110.23 Females per 100 Males in Pineland.
What is the Median Population Age in Pineland?
Median Population Age in Pineland is 36.0 Years.
What is the Average Family Size in Pineland
Average Family Size in Pineland is 3.1 People.
What is the Average Household Size in Pineland
Average Household Size in Pineland is 2.5 People.
How Large is the Labor Force in Pineland?
There are 503 People in the Labor Forcein in Pineland.
What is the Percentage of People in the Labor Force in Pineland?
55.9% of People are in the Labor Force in Pineland.
What is the Unemployment Rate in Pineland?
Unemployment Rate in Pineland is 11.5%.