Pinehurst, TX Map & Demographics
Pinehurst Map
Pinehurst Overview
$30,010
PER CAPITA INCOME
$58,558
AVG FAMILY INCOME
$49,125
AVG HOUSEHOLD INCOME
69.8%
WAGE / INCOME GAP [ % ]
30.2¢/ $1
WAGE / INCOME GAP [ $ ]
0.48
INEQUALITY / GINI INDEX
2,237
TOTAL POPULATION
1,143
MALE POPULATION
1,094
FEMALE POPULATION
104.48
MALES / 100 FEMALES
95.71
FEMALES / 100 MALES
42.7
MEDIAN AGE
3.2
AVG FAMILY SIZE
2.5
AVG HOUSEHOLD SIZE
947
LABOR FORCE [ PEOPLE ]
52.6%
PERCENT IN LABOR FORCE
2.7%
UNEMPLOYMENT RATE
Pinehurst Zip Codes
Income in Pinehurst
Income Overview in Pinehurst
Per Capita Income in Pinehurst is $30,010, while median incomes of families and households are $58,558 and $49,125 respectively.
| Characteristic | Number | Measure |
| Per Capita Income | 2,237 | $30,010 |
| Median Family Income | 535 | $58,558 |
| Mean Family Income | 535 | $90,533 |
| Median Household Income | 879 | $49,125 |
| Mean Household Income | 879 | $71,825 |
| Income Deficit | 535 | $0 |
| Wage / Income Gap (%) | 2,237 | 69.84% |
| Wage / Income Gap ($) | 2,237 | 30.16¢ per $1 |
| Gini / Inequality Index | 2,237 | 0.48 |
Earnings by Sex in Pinehurst
Average Earnings in Pinehurst are $29,324, $37,476 for men and $11,302 for women, a difference of 69.8%.
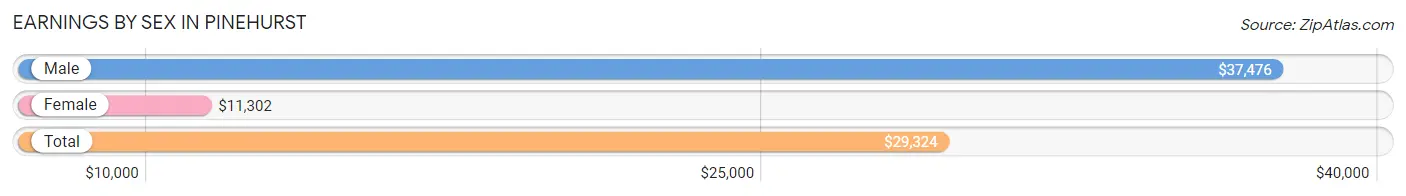
| Sex | Number | Average Earnings |
| Male | 548 (56.0%) | $37,476 |
| Female | 430 (44.0%) | $11,302 |
| Total | 978 (100.0%) | $29,324 |
Earnings by Sex by Income Bracket in Pinehurst
The most common earnings brackets in Pinehurst are $100,000+ for men (81 | 14.8%) and $15,000 to $17,499 for women (64 | 14.9%).
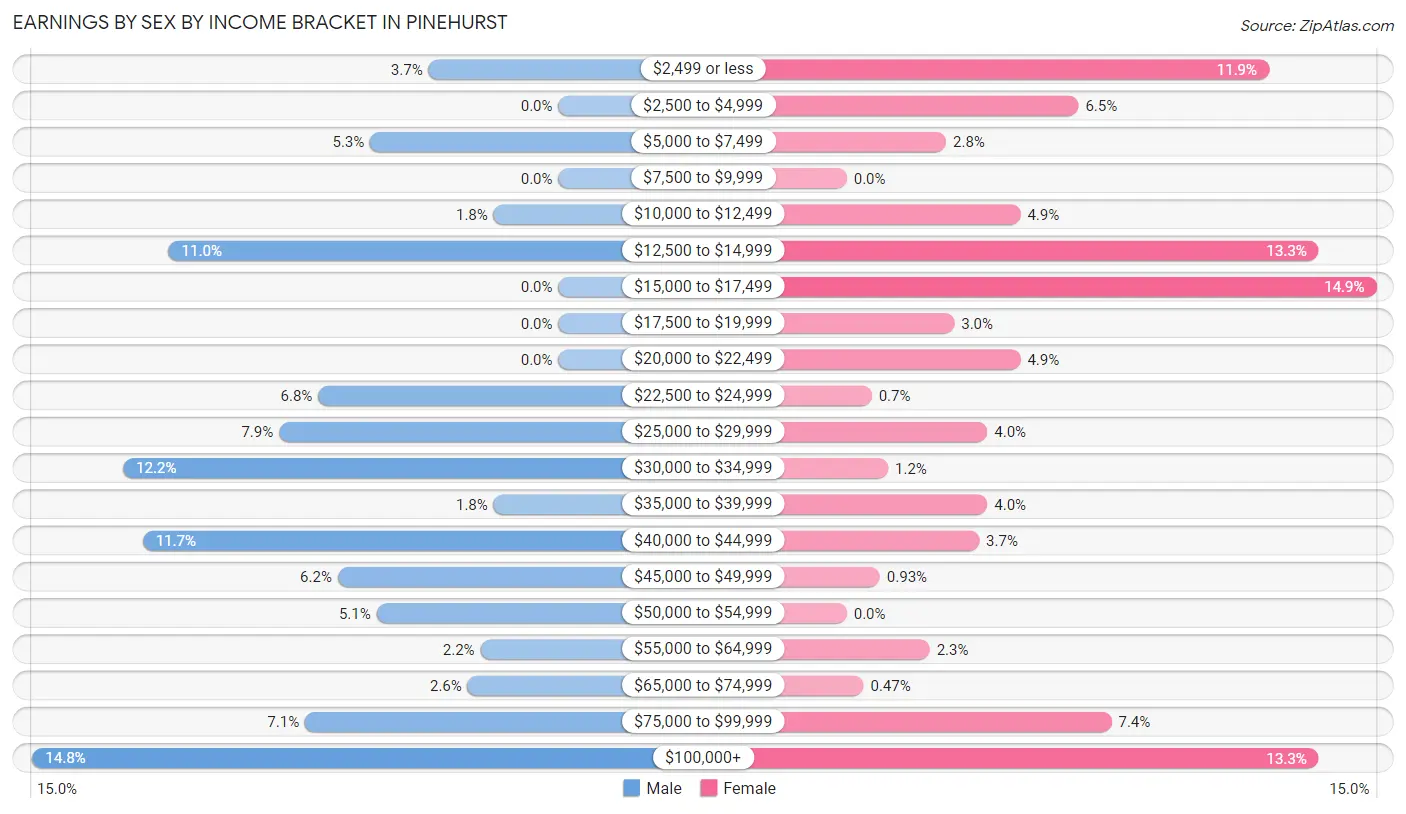
| Income | Male | Female |
| $2,499 or less | 20 (3.6%) | 51 (11.9%) |
| $2,500 to $4,999 | 0 (0.0%) | 28 (6.5%) |
| $5,000 to $7,499 | 29 (5.3%) | 12 (2.8%) |
| $7,500 to $9,999 | 0 (0.0%) | 0 (0.0%) |
| $10,000 to $12,499 | 10 (1.8%) | 21 (4.9%) |
| $12,500 to $14,999 | 60 (11.0%) | 57 (13.3%) |
| $15,000 to $17,499 | 0 (0.0%) | 64 (14.9%) |
| $17,500 to $19,999 | 0 (0.0%) | 13 (3.0%) |
| $20,000 to $22,499 | 0 (0.0%) | 21 (4.9%) |
| $22,500 to $24,999 | 37 (6.8%) | 3 (0.7%) |
| $25,000 to $29,999 | 43 (7.9%) | 17 (4.0%) |
| $30,000 to $34,999 | 67 (12.2%) | 5 (1.2%) |
| $35,000 to $39,999 | 10 (1.8%) | 17 (4.0%) |
| $40,000 to $44,999 | 64 (11.7%) | 16 (3.7%) |
| $45,000 to $49,999 | 34 (6.2%) | 4 (0.9%) |
| $50,000 to $54,999 | 28 (5.1%) | 0 (0.0%) |
| $55,000 to $64,999 | 12 (2.2%) | 10 (2.3%) |
| $65,000 to $74,999 | 14 (2.5%) | 2 (0.5%) |
| $75,000 to $99,999 | 39 (7.1%) | 32 (7.4%) |
| $100,000+ | 81 (14.8%) | 57 (13.3%) |
| Total | 548 (100.0%) | 430 (100.0%) |
Earnings by Sex by Educational Attainment in Pinehurst
Average earnings in Pinehurst are $42,314 for men and $17,420 for women, a difference of 58.8%. Men with an educational attainment of college or associate's degree enjoy the highest average annual earnings of $50,833, while those with high school diploma education earn the least with $43,304. Women with an educational attainment of college or associate's degree earn the most with the average annual earnings of $16,818, while those with less than high school education have the smallest earnings of $13,274.
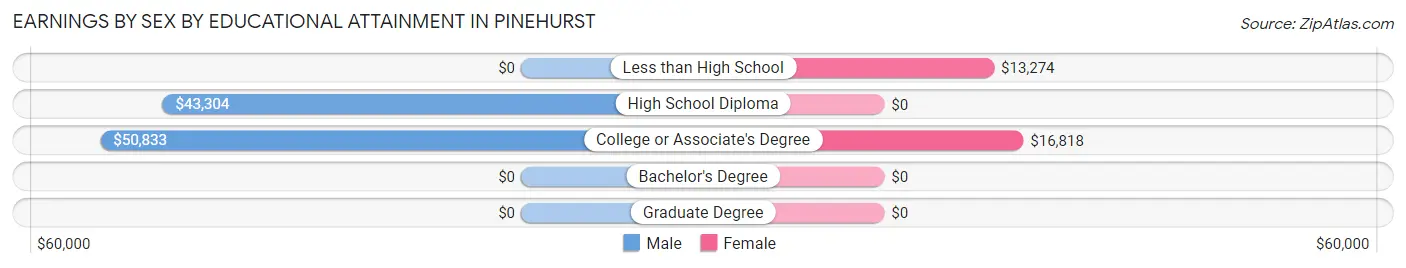
| Educational Attainment | Male Income | Female Income |
| Less than High School | - | - |
| High School Diploma | $43,304 | $0 |
| College or Associate's Degree | $50,833 | $16,818 |
| Bachelor's Degree | - | - |
| Graduate Degree | - | - |
| Total | $42,314 | $17,420 |
Family Income in Pinehurst
Family Income Brackets in Pinehurst
According to the Pinehurst family income data, there are 135 families falling into the $100,000 to $149,999 income range, which is the most common income bracket and makes up 25.2% of all families.
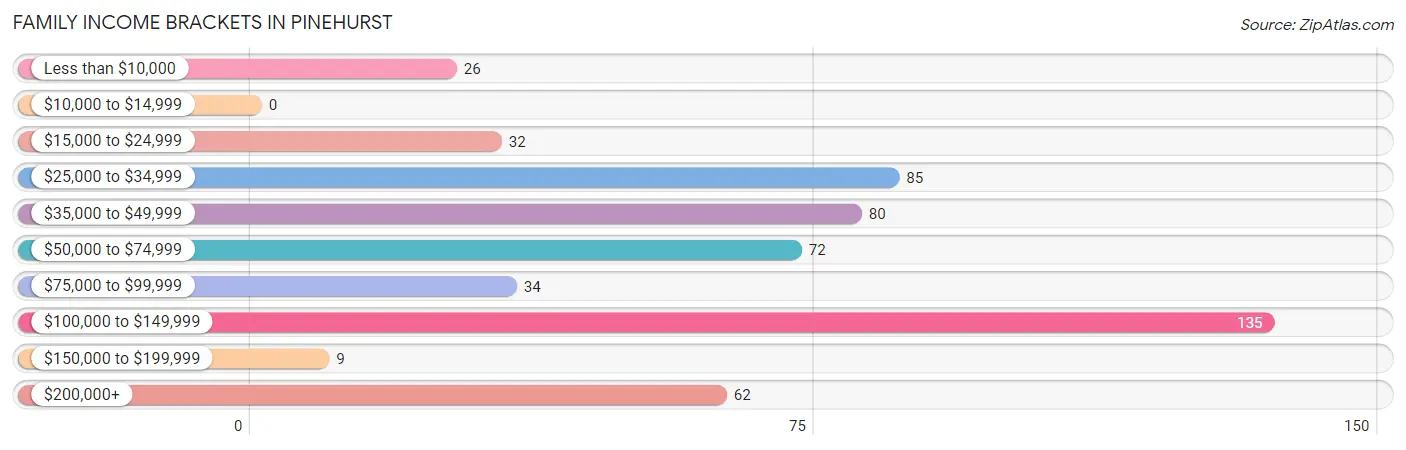
| Income Bracket | # Families | % Families |
| Less than $10,000 | 26 | 4.9% |
| $10,000 to $14,999 | 0 | 0.0% |
| $15,000 to $24,999 | 32 | 6.0% |
| $25,000 to $34,999 | 85 | 15.9% |
| $35,000 to $49,999 | 80 | 15.0% |
| $50,000 to $74,999 | 72 | 13.5% |
| $75,000 to $99,999 | 34 | 6.4% |
| $100,000 to $149,999 | 135 | 25.2% |
| $150,000 to $199,999 | 9 | 1.7% |
| $200,000+ | 62 | 11.6% |
Family Income by Famaliy Size in Pinehurst
2-person families (300 | 56.1%) account for the highest median family income in Pinehurst with $55,000 per family, while 2-person families (300 | 56.1%) have the highest median income of $27,500 per family member.
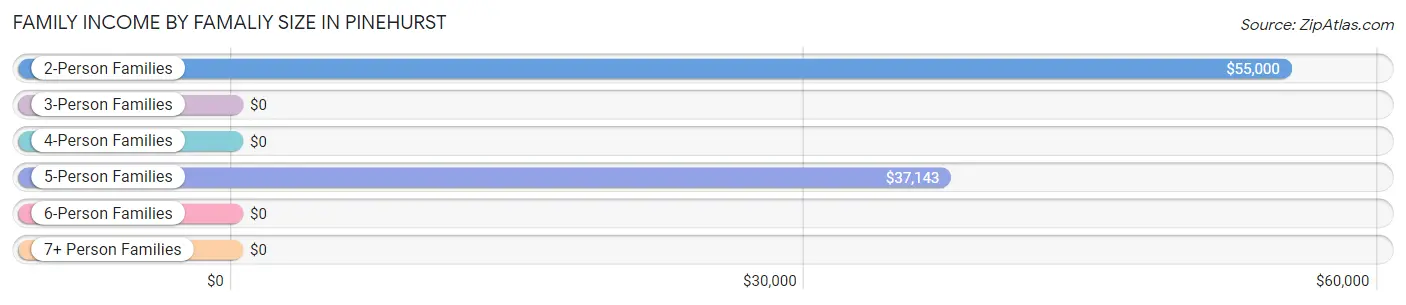
| Income Bracket | # Families | Median Income |
| 2-Person Families | 300 (56.1%) | $55,000 |
| 3-Person Families | 115 (21.5%) | $0 |
| 4-Person Families | 70 (13.1%) | $0 |
| 5-Person Families | 40 (7.5%) | $37,143 |
| 6-Person Families | 0 (0.0%) | $0 |
| 7+ Person Families | 10 (1.9%) | $0 |
| Total | 535 (100.0%) | $58,558 |
Family Income by Number of Earners in Pinehurst
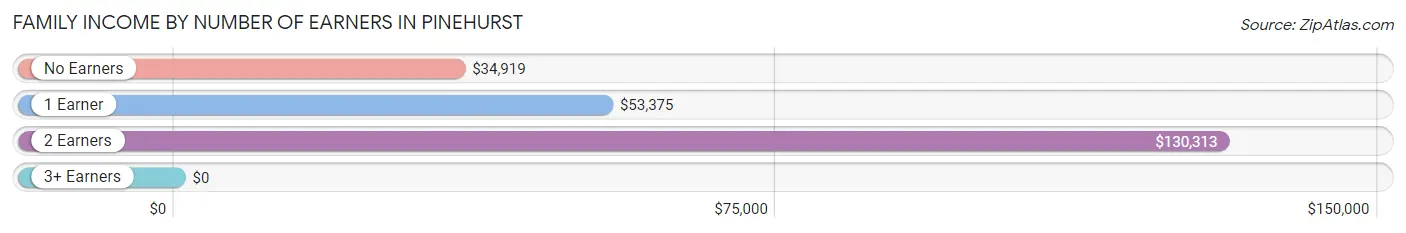
| Number of Earners | # Families | Median Income |
| No Earners | 148 (27.7%) | $34,919 |
| 1 Earner | 205 (38.3%) | $53,375 |
| 2 Earners | 138 (25.8%) | $130,313 |
| 3+ Earners | 44 (8.2%) | $0 |
| Total | 535 (100.0%) | $58,558 |
Household Income in Pinehurst
Household Income Brackets in Pinehurst
With 167 households falling in the category, the $25,000 to $34,999 income range is the most frequent in Pinehurst, accounting for 19.0% of all households. In contrast, only 29 households (3.3%) fall into the $10,000 to $14,999 income bracket, making it the least populous group.
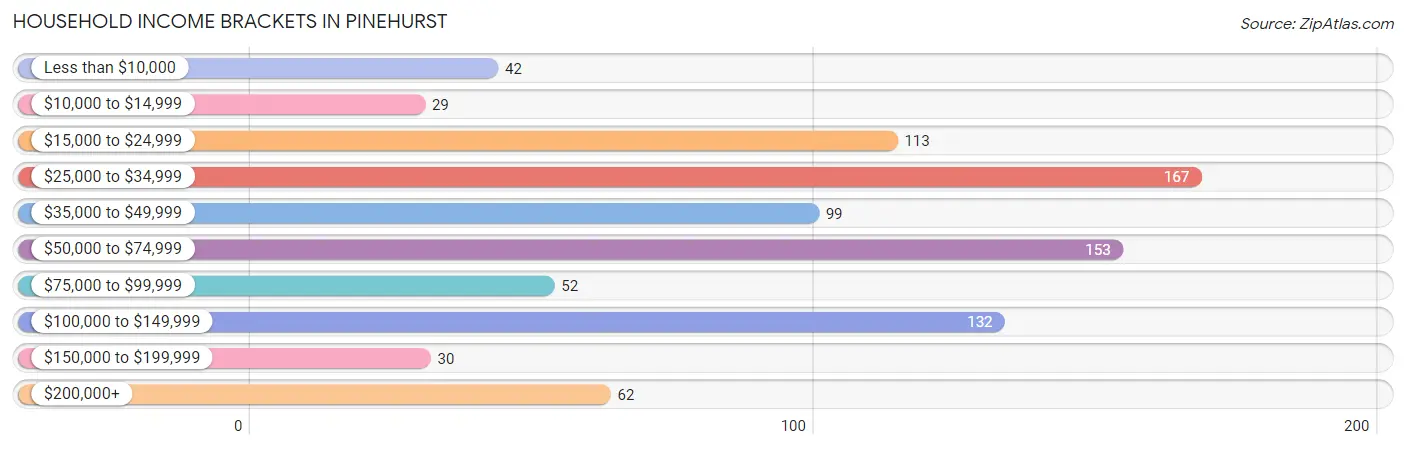
| Income Bracket | # Households | % Households |
| Less than $10,000 | 42 | 4.8% |
| $10,000 to $14,999 | 29 | 3.3% |
| $15,000 to $24,999 | 113 | 12.9% |
| $25,000 to $34,999 | 167 | 19.0% |
| $35,000 to $49,999 | 99 | 11.3% |
| $50,000 to $74,999 | 153 | 17.4% |
| $75,000 to $99,999 | 52 | 5.9% |
| $100,000 to $149,999 | 132 | 15.0% |
| $150,000 to $199,999 | 30 | 3.4% |
| $200,000+ | 62 | 7.1% |
Household Income by Householder Age in Pinehurst
The median household income in Pinehurst is $49,125, with the highest median household income of $61,422 found in the 25 to 44 years age bracket for the primary householder. A total of 233 households (26.5%) fall into this category. Meanwhile, the 15 to 24 years age bracket for the primary householder has the lowest median household income of $0, with 47 households (5.3%) in this group.
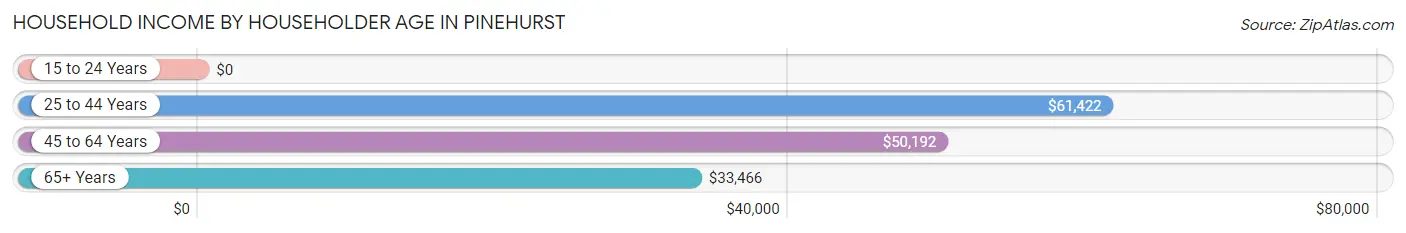
| Income Bracket | # Households | Median Income |
| 15 to 24 Years | 47 (5.3%) | $0 |
| 25 to 44 Years | 233 (26.5%) | $61,422 |
| 45 to 64 Years | 340 (38.7%) | $50,192 |
| 65+ Years | 259 (29.5%) | $33,466 |
| Total | 879 (100.0%) | $49,125 |
Poverty in Pinehurst
Income Below Poverty by Sex and Age in Pinehurst
With 14.0% poverty level for males and 15.5% for females among the residents of Pinehurst, 5 year old males and 18 to 24 year old females are the most vulnerable to poverty, with 5 males (100.0%) and 27 females (39.7%) in their respective age groups living below the poverty level.
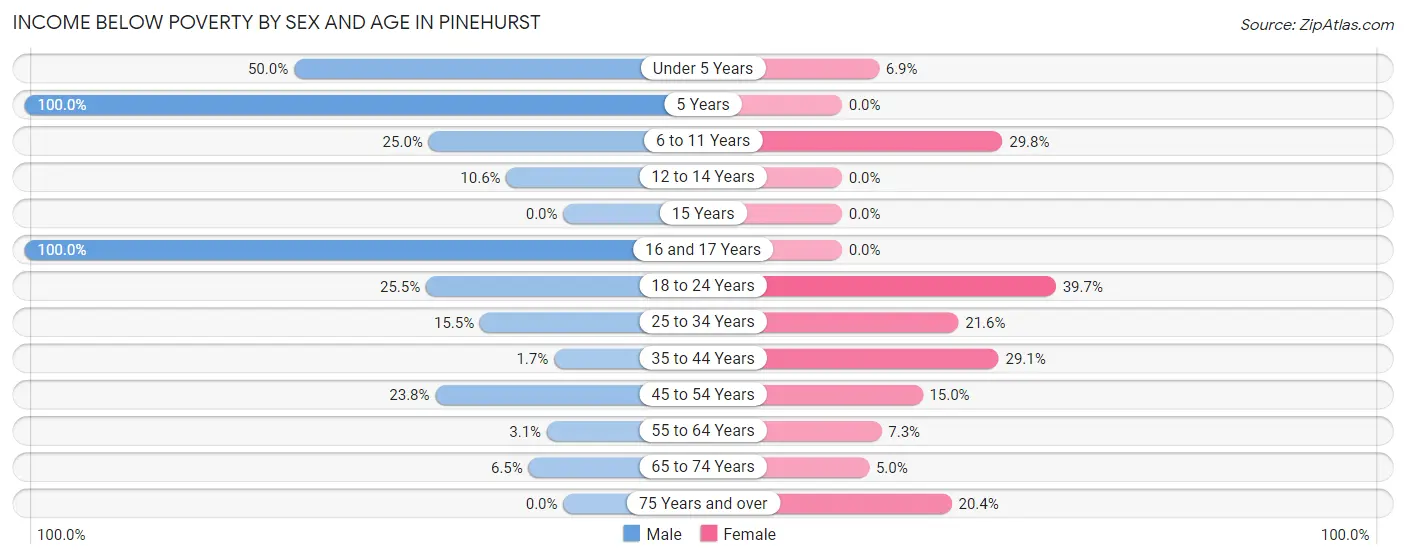
| Age Bracket | Male | Female |
| Under 5 Years | 27 (50.0%) | 7 (6.9%) |
| 5 Years | 5 (100.0%) | 0 (0.0%) |
| 6 to 11 Years | 5 (25.0%) | 14 (29.8%) |
| 12 to 14 Years | 13 (10.6%) | 0 (0.0%) |
| 15 Years | 0 (0.0%) | 0 (0.0%) |
| 16 and 17 Years | 15 (100.0%) | 0 (0.0%) |
| 18 to 24 Years | 39 (25.5%) | 27 (39.7%) |
| 25 to 34 Years | 15 (15.5%) | 16 (21.6%) |
| 35 to 44 Years | 4 (1.7%) | 32 (29.1%) |
| 45 to 54 Years | 24 (23.8%) | 25 (15.0%) |
| 55 to 64 Years | 4 (3.0%) | 13 (7.3%) |
| 65 to 74 Years | 6 (6.5%) | 6 (5.0%) |
| 75 Years and over | 0 (0.0%) | 22 (20.4%) |
| Total | 157 (14.0%) | 162 (15.5%) |
Income Above Poverty by Sex and Age in Pinehurst
According to the poverty statistics in Pinehurst, males aged 15 years and females aged 5 years are the age groups that are most secure financially, with 100.0% of males and 100.0% of females in these age groups living above the poverty line.
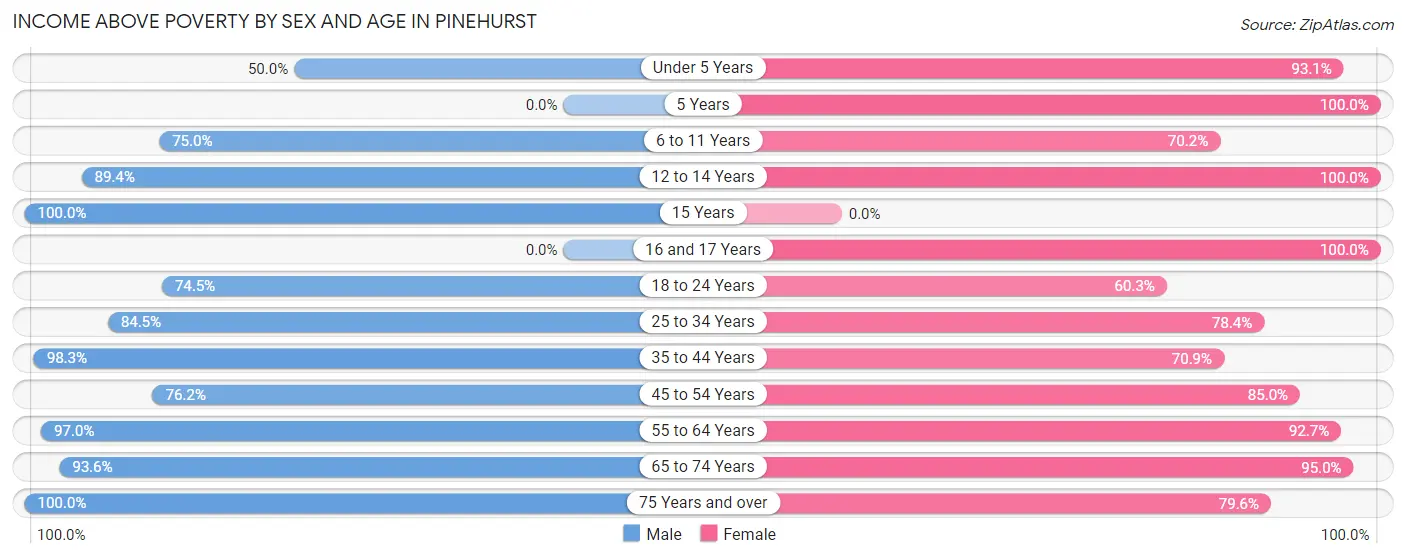
| Age Bracket | Male | Female |
| Under 5 Years | 27 (50.0%) | 95 (93.1%) |
| 5 Years | 0 (0.0%) | 13 (100.0%) |
| 6 to 11 Years | 15 (75.0%) | 33 (70.2%) |
| 12 to 14 Years | 110 (89.4%) | 37 (100.0%) |
| 15 Years | 26 (100.0%) | 0 (0.0%) |
| 16 and 17 Years | 0 (0.0%) | 23 (100.0%) |
| 18 to 24 Years | 114 (74.5%) | 41 (60.3%) |
| 25 to 34 Years | 82 (84.5%) | 58 (78.4%) |
| 35 to 44 Years | 228 (98.3%) | 78 (70.9%) |
| 45 to 54 Years | 77 (76.2%) | 142 (85.0%) |
| 55 to 64 Years | 127 (97.0%) | 164 (92.7%) |
| 65 to 74 Years | 87 (93.5%) | 113 (95.0%) |
| 75 Years and over | 71 (100.0%) | 86 (79.6%) |
| Total | 964 (86.0%) | 883 (84.5%) |
Income Below Poverty Among Married-Couple Families in Pinehurst
The poverty statistics for married-couple families in Pinehurst show that 9.5% or 29 of the total 306 families live below the poverty line. Families with 3 or 4 children have the highest poverty rate of 25.0%, comprising of 8 families. On the other hand, families with 1 or 2 children have the lowest poverty rate of 0.0%, which includes 0 families.
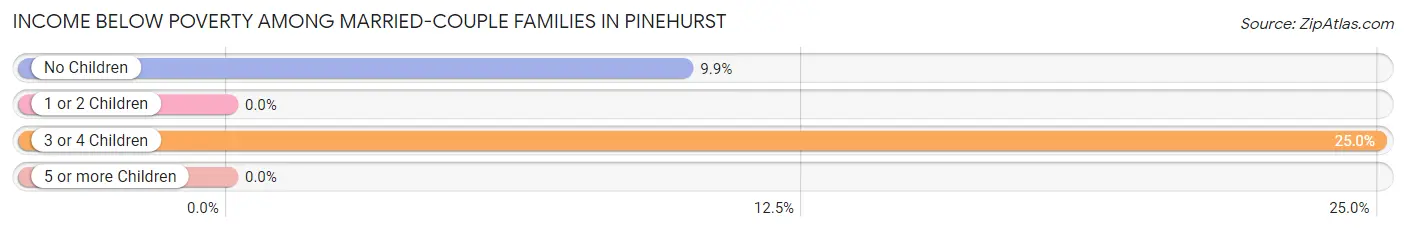
| Children | Above Poverty | Below Poverty |
| No Children | 191 (90.1%) | 21 (9.9%) |
| 1 or 2 Children | 62 (100.0%) | 0 (0.0%) |
| 3 or 4 Children | 24 (75.0%) | 8 (25.0%) |
| 5 or more Children | 0 (0.0%) | 0 (0.0%) |
| Total | 277 (90.5%) | 29 (9.5%) |
Income Below Poverty Among Single-Parent Households in Pinehurst
According to the poverty data in Pinehurst, 5.6% or 4 single-father households and 18.3% or 29 single-mother households are living below the poverty line. Among single-father households, those with 3 or 4 children have the highest poverty rate, with 4 households (100.0%) experiencing poverty. Likewise, among single-mother households, those with 1 or 2 children have the highest poverty rate, with 16 households (40.0%) falling below the poverty line.
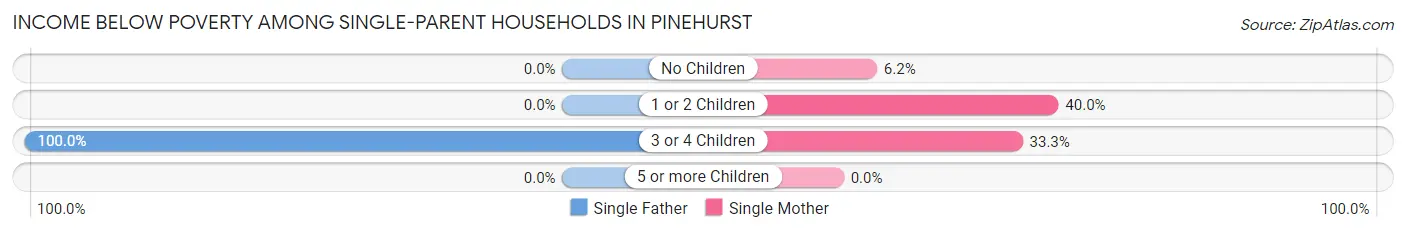
| Children | Single Father | Single Mother |
| No Children | 0 (0.0%) | 6 (6.2%) |
| 1 or 2 Children | 0 (0.0%) | 16 (40.0%) |
| 3 or 4 Children | 4 (100.0%) | 7 (33.3%) |
| 5 or more Children | 0 (0.0%) | 0 (0.0%) |
| Total | 4 (5.6%) | 29 (18.3%) |
Income Below Poverty Among Married-Couple vs Single-Parent Households in Pinehurst
The poverty data for Pinehurst shows that 29 of the married-couple family households (9.5%) and 33 of the single-parent households (14.4%) are living below the poverty level. Within the married-couple family households, those with 3 or 4 children have the highest poverty rate, with 8 households (25.0%) falling below the poverty line. Among the single-parent households, those with 3 or 4 children have the highest poverty rate, with 11 household (44.0%) living below poverty.
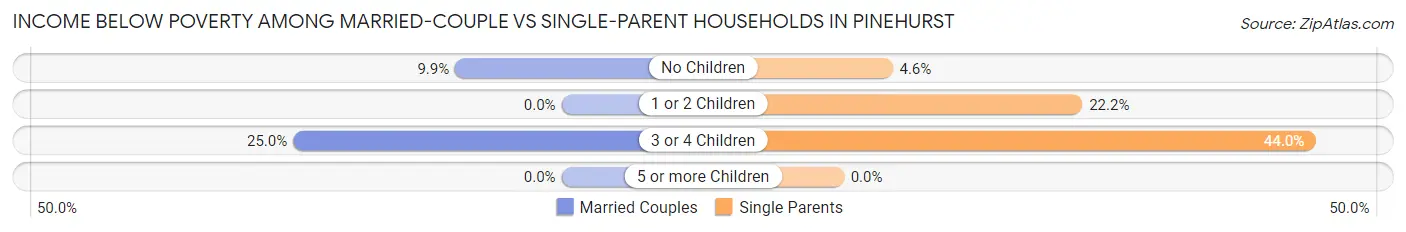
| Children | Married-Couple Families | Single-Parent Households |
| No Children | 21 (9.9%) | 6 (4.5%) |
| 1 or 2 Children | 0 (0.0%) | 16 (22.2%) |
| 3 or 4 Children | 8 (25.0%) | 11 (44.0%) |
| 5 or more Children | 0 (0.0%) | 0 (0.0%) |
| Total | 29 (9.5%) | 33 (14.4%) |
Race in Pinehurst
The most populous races in Pinehurst are White / Caucasian (1,721 | 76.9%), Black / African American (364 | 16.3%), and Hispanic or Latino (327 | 14.6%).
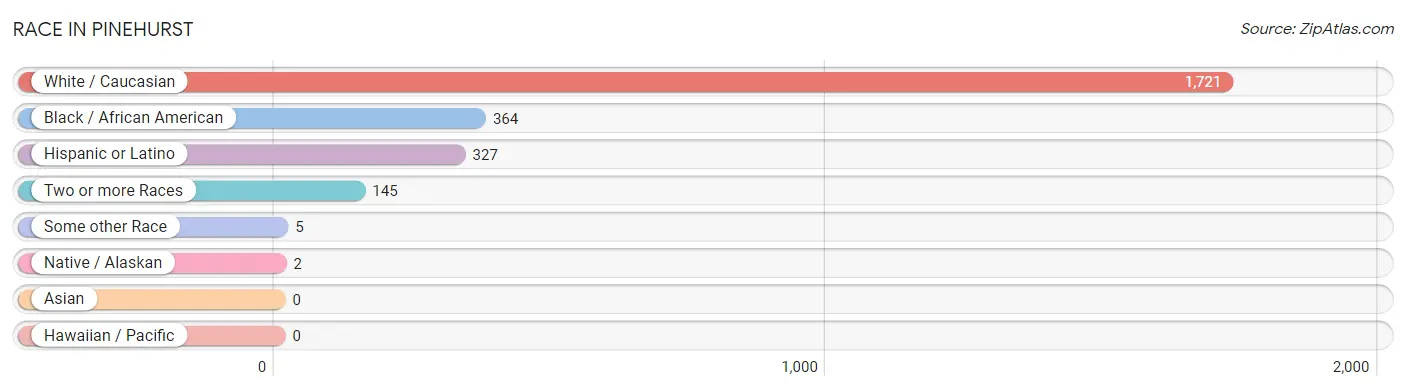
| Race | # Population | % Population |
| Asian | 0 | 0.0% |
| Black / African American | 364 | 16.3% |
| Hawaiian / Pacific | 0 | 0.0% |
| Hispanic or Latino | 327 | 14.6% |
| Native / Alaskan | 2 | 0.1% |
| White / Caucasian | 1,721 | 76.9% |
| Two or more Races | 145 | 6.5% |
| Some other Race | 5 | 0.2% |
| Total | 2,237 | 100.0% |
Ancestry in Pinehurst
The most populous ancestries reported in Pinehurst are Mexican (312 | 14.0%), English (216 | 9.7%), German (207 | 9.2%), French (150 | 6.7%), and Irish (148 | 6.6%), together accounting for 46.2% of all Pinehurst residents.
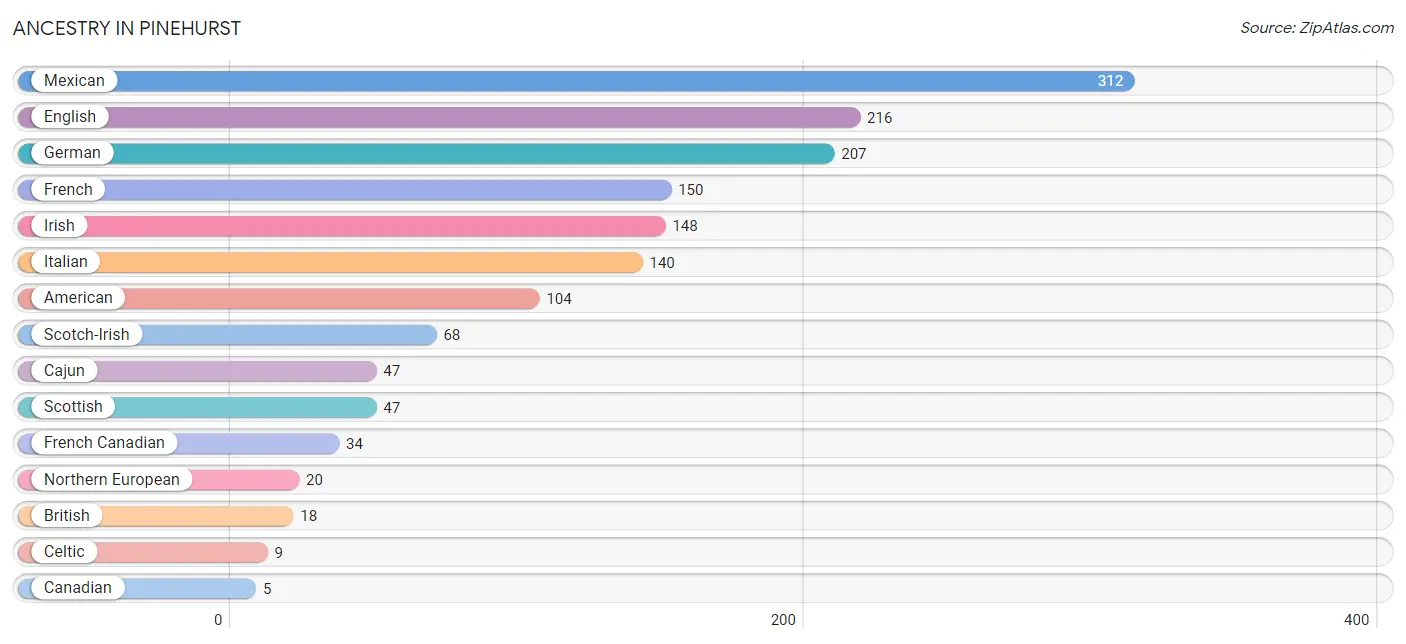
| Ancestry | # Population | % Population |
| American | 104 | 4.6% |
| British | 18 | 0.8% |
| Cajun | 47 | 2.1% |
| Canadian | 5 | 0.2% |
| Celtic | 9 | 0.4% |
| English | 216 | 9.7% |
| French | 150 | 6.7% |
| French Canadian | 34 | 1.5% |
| German | 207 | 9.2% |
| Irish | 148 | 6.6% |
| Italian | 140 | 6.3% |
| Mexican | 312 | 14.0% |
| Northern European | 20 | 0.9% |
| Scotch-Irish | 68 | 3.0% |
| Scottish | 47 | 2.1% |
| Swedish | 4 | 0.2% |
| Welsh | 5 | 0.2% | View All 17 Rows |
Immigrants in Pinehurst
The most numerous immigrant groups reported in Pinehurst came from Central America (27 | 1.2%), Latin America (27 | 1.2%), Mexico (27 | 1.2%), Asia (24 | 1.1%), and China (24 | 1.1%), together accounting for 5.8% of all Pinehurst residents.
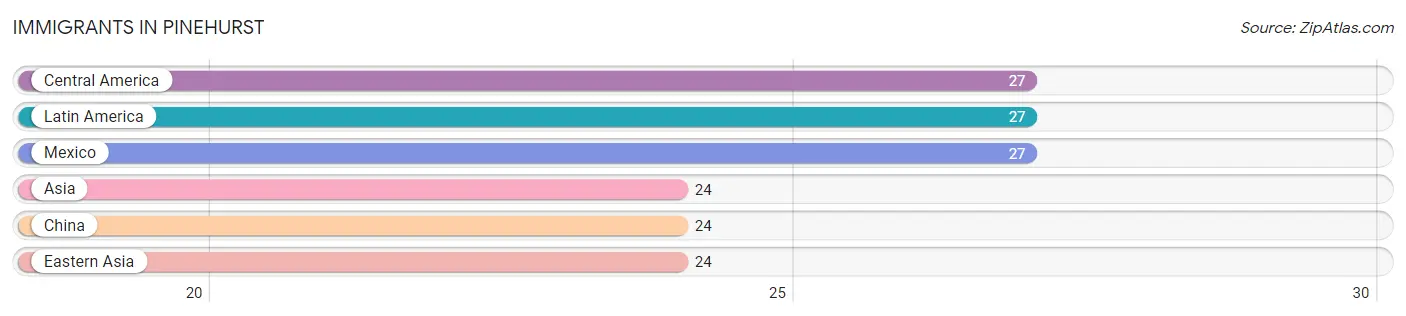
| Immigration Origin | # Population | % Population |
| Asia | 24 | 1.1% |
| Central America | 27 | 1.2% |
| China | 24 | 1.1% |
| Eastern Asia | 24 | 1.1% |
| Latin America | 27 | 1.2% |
| Mexico | 27 | 1.2% | View All 6 Rows |
Sex and Age in Pinehurst
Sex and Age in Pinehurst
The most populous age groups in Pinehurst are 40 to 44 Years (160 | 14.0%) for men and 70 to 74 Years (123 | 11.2%) for women.
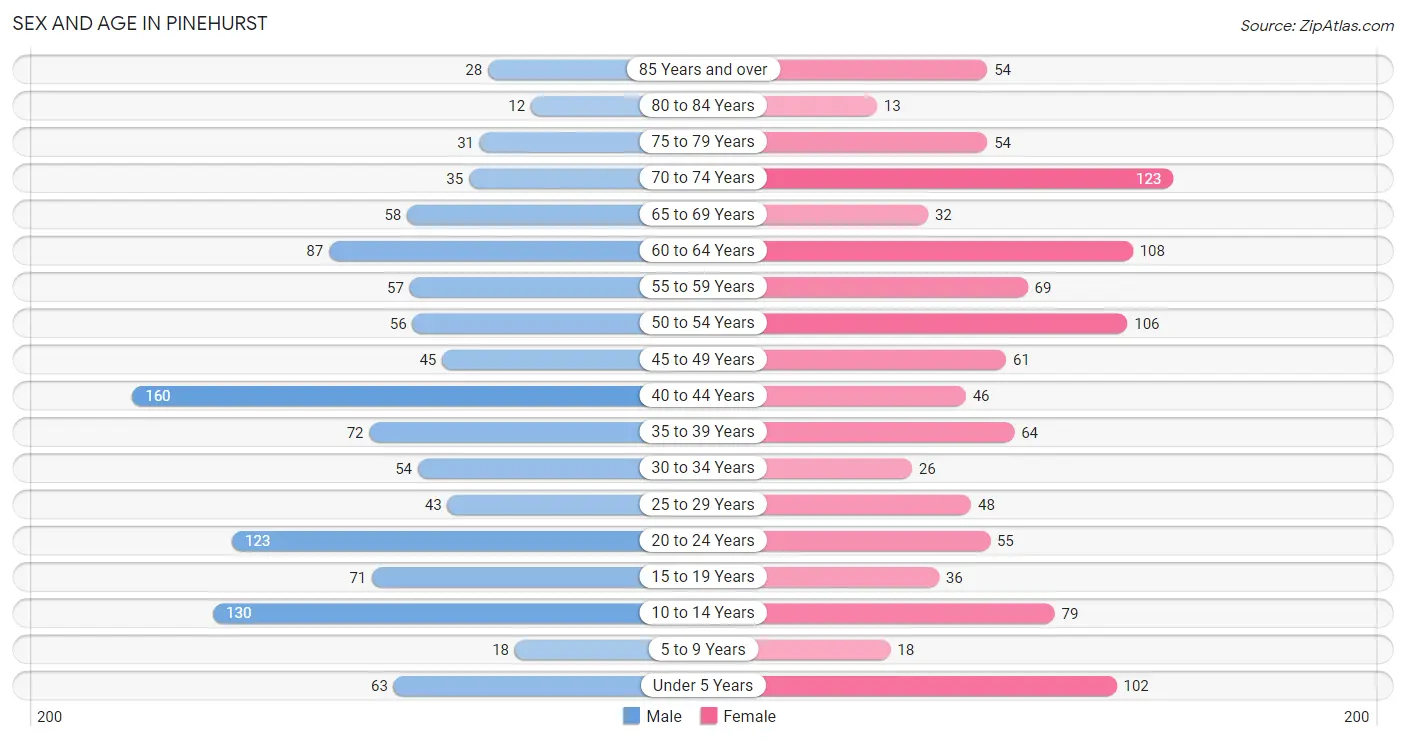
| Age Bracket | Male | Female |
| Under 5 Years | 63 (5.5%) | 102 (9.3%) |
| 5 to 9 Years | 18 (1.6%) | 18 (1.7%) |
| 10 to 14 Years | 130 (11.4%) | 79 (7.2%) |
| 15 to 19 Years | 71 (6.2%) | 36 (3.3%) |
| 20 to 24 Years | 123 (10.8%) | 55 (5.0%) |
| 25 to 29 Years | 43 (3.8%) | 48 (4.4%) |
| 30 to 34 Years | 54 (4.7%) | 26 (2.4%) |
| 35 to 39 Years | 72 (6.3%) | 64 (5.9%) |
| 40 to 44 Years | 160 (14.0%) | 46 (4.2%) |
| 45 to 49 Years | 45 (3.9%) | 61 (5.6%) |
| 50 to 54 Years | 56 (4.9%) | 106 (9.7%) |
| 55 to 59 Years | 57 (5.0%) | 69 (6.3%) |
| 60 to 64 Years | 87 (7.6%) | 108 (9.9%) |
| 65 to 69 Years | 58 (5.1%) | 32 (2.9%) |
| 70 to 74 Years | 35 (3.1%) | 123 (11.2%) |
| 75 to 79 Years | 31 (2.7%) | 54 (4.9%) |
| 80 to 84 Years | 12 (1.1%) | 13 (1.2%) |
| 85 Years and over | 28 (2.5%) | 54 (4.9%) |
| Total | 1,143 (100.0%) | 1,094 (100.0%) |
Families and Households in Pinehurst
Median Family Size in Pinehurst
The median family size in Pinehurst is 3.21 persons per family, with single female/mother families (158 | 29.5%) accounting for the largest median family size of 3.44 persons per family. On the other hand, married-couple families (306 | 57.2%) represent the smallest median family size with 3.11 persons per family.
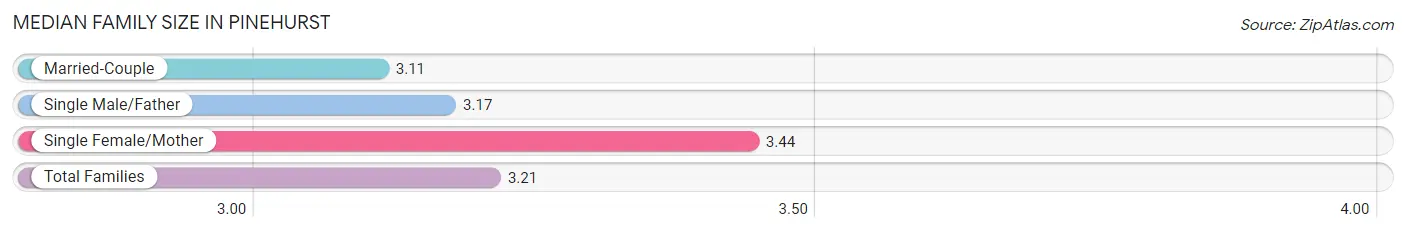
| Family Type | # Families | Family Size |
| Married-Couple | 306 (57.2%) | 3.11 |
| Single Male/Father | 71 (13.3%) | 3.17 |
| Single Female/Mother | 158 (29.5%) | 3.44 |
| Total Families | 535 (100.0%) | 3.21 |
Median Household Size in Pinehurst
The median household size in Pinehurst is 2.47 persons per household, with single male/father households (71 | 8.1%) accounting for the largest median household size of 3.79 persons per household. non-family households (344 | 39.1%) represent the smallest median household size with 1.09 persons per household.
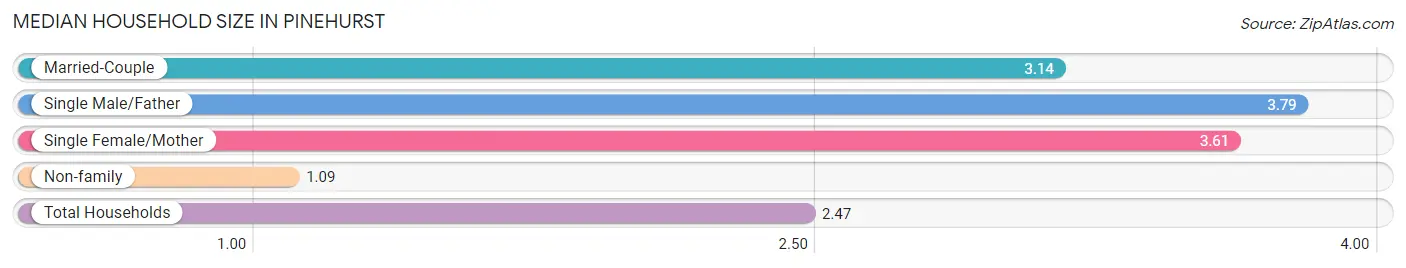
| Household Type | # Households | Household Size |
| Married-Couple | 306 (34.8%) | 3.14 |
| Single Male/Father | 71 (8.1%) | 3.79 |
| Single Female/Mother | 158 (18.0%) | 3.61 |
| Non-family | 344 (39.1%) | 1.09 |
| Total Households | 879 (100.0%) | 2.47 |
Household Size by Marriage Status in Pinehurst
Out of a total of 879 households in Pinehurst, 535 (60.9%) are family households, while 344 (39.1%) are nonfamily households. The most numerous type of family households are 2-person households, comprising 300, and the most common type of nonfamily households are 1-person households, comprising 299.
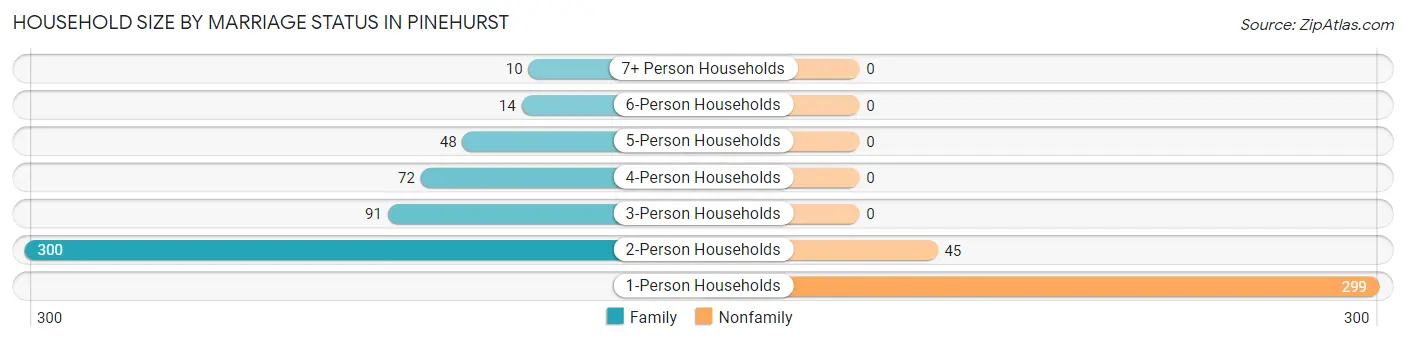
| Household Size | Family Households | Nonfamily Households |
| 1-Person Households | - | 299 (34.0%) |
| 2-Person Households | 300 (34.1%) | 45 (5.1%) |
| 3-Person Households | 91 (10.3%) | 0 (0.0%) |
| 4-Person Households | 72 (8.2%) | 0 (0.0%) |
| 5-Person Households | 48 (5.5%) | 0 (0.0%) |
| 6-Person Households | 14 (1.6%) | 0 (0.0%) |
| 7+ Person Households | 10 (1.1%) | 0 (0.0%) |
| Total | 535 (60.9%) | 344 (39.1%) |
Female Fertility in Pinehurst
Fertility by Age in Pinehurst
Average fertility rate in Pinehurst is 81.0 births per 1,000 women. Women in the age bracket of 20 to 34 years have the highest fertility rate with 171.0 births per 1,000 women. Women in the age bracket of 20 to 34 years acount for 78.6% of all women with births.
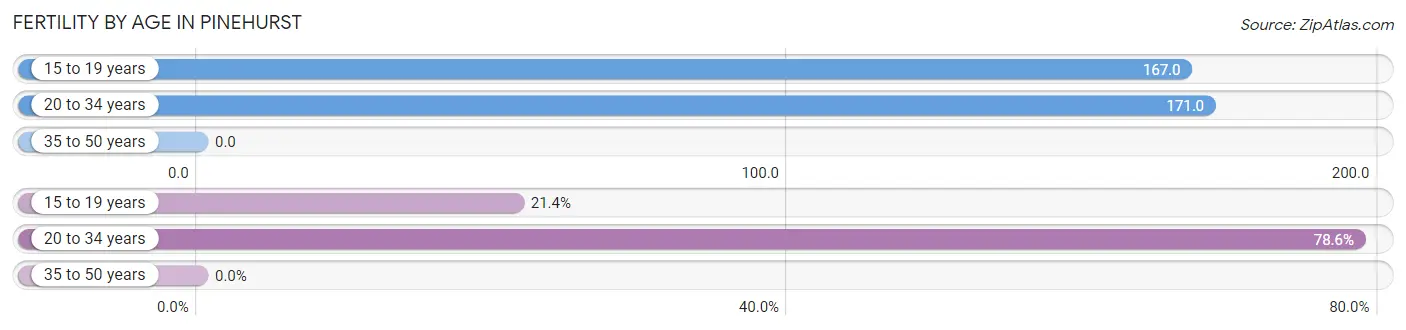
| Age Bracket | Women with Births | Births / 1,000 Women |
| 15 to 19 years | 6 (21.4%) | 167.0 |
| 20 to 34 years | 22 (78.6%) | 171.0 |
| 35 to 50 years | 0 (0.0%) | 0.0 |
| Total | 28 (100.0%) | 81.0 |
Fertility by Age by Marriage Status in Pinehurst
50.0% of women with births (28) in Pinehurst are married. The highest percentage of unmarried women with births falls into 20 to 34 years age bracket with 63.6% of them unmarried at the time of birth, while the lowest percentage of unmarried women with births belong to 15 to 19 years age bracket with 0.0% of them unmarried.
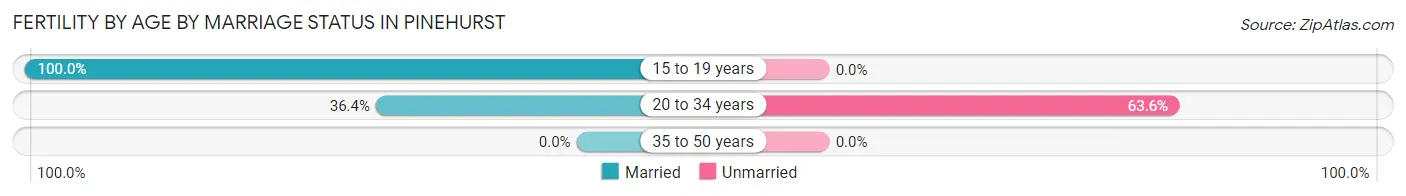
| Age Bracket | Married | Unmarried |
| 15 to 19 years | 6 (100.0%) | 0 (0.0%) |
| 20 to 34 years | 8 (36.4%) | 14 (63.6%) |
| 35 to 50 years | 0 (0.0%) | 0 (0.0%) |
| Total | 14 (50.0%) | 14 (50.0%) |
Fertility by Education in Pinehurst
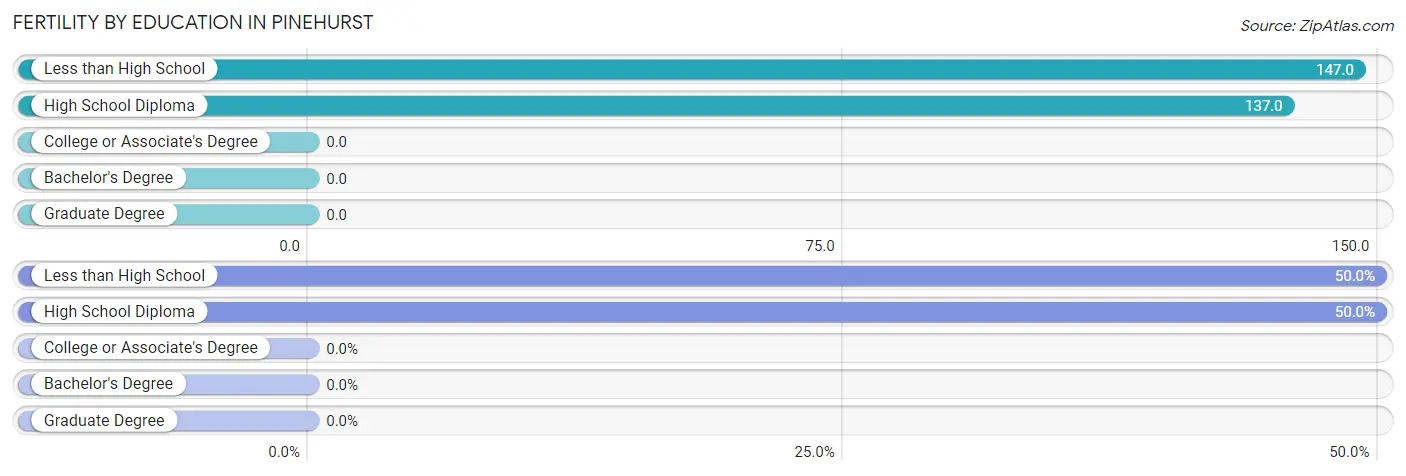
| Educational Attainment | Women with Births | Births / 1,000 Women |
| Less than High School | 14 (50.0%) | 147.0 |
| High School Diploma | 14 (50.0%) | 137.0 |
| College or Associate's Degree | 0 (0.0%) | 0.0 |
| Bachelor's Degree | 0 (0.0%) | 0.0 |
| Graduate Degree | 0 (0.0%) | 0.0 |
| Total | 28 (100.0%) | 81.0 |
Fertility by Education by Marriage Status in Pinehurst
50.0% of women with births in Pinehurst are unmarried. Women with the educational attainment of high school diploma are most likely to be married with 100.0% of them married at childbirth, while women with the educational attainment of less than high school are least likely to be married with 100.0% of them unmarried at childbirth.
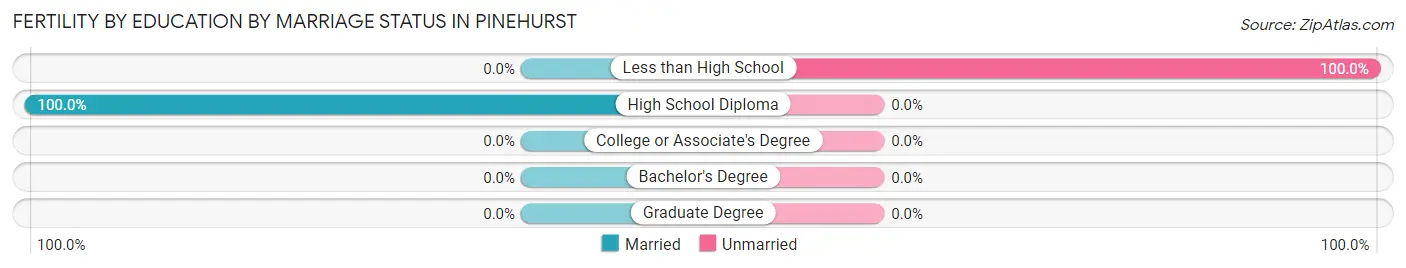
| Educational Attainment | Married | Unmarried |
| Less than High School | 0 (0.0%) | 14 (100.0%) |
| High School Diploma | 14 (100.0%) | 0 (0.0%) |
| College or Associate's Degree | 0 (0.0%) | 0 (0.0%) |
| Bachelor's Degree | 0 (0.0%) | 0 (0.0%) |
| Graduate Degree | 0 (0.0%) | 0 (0.0%) |
| Total | 14 (50.0%) | 14 (50.0%) |
Employment Characteristics in Pinehurst
Employment by Class of Employer in Pinehurst
Among the 901 employed individuals in Pinehurst, private company employees (704 | 78.1%), local government employees (71 | 7.9%), and state government employees (56 | 6.2%) make up the most common classes of employment.
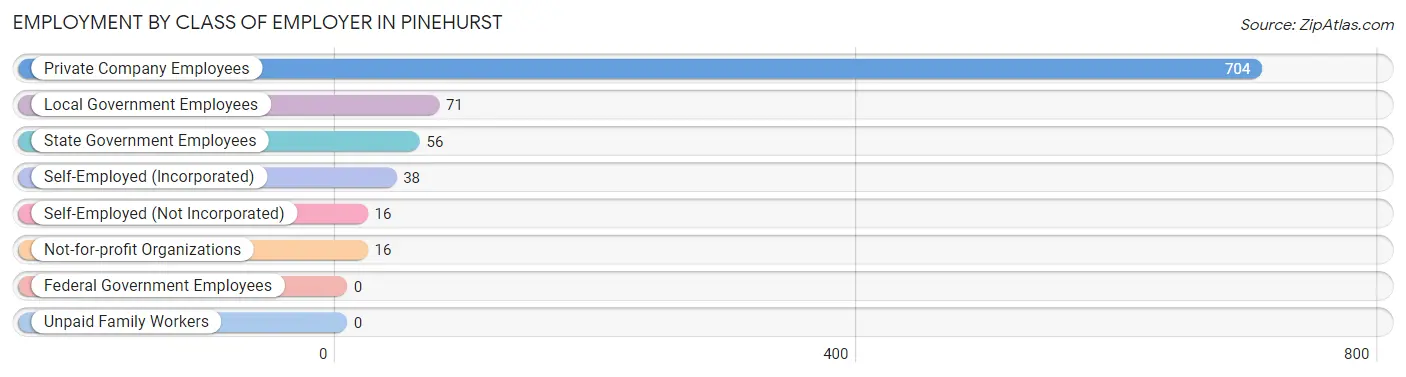
| Employer Class | # Employees | % Employees |
| Private Company Employees | 704 | 78.1% |
| Self-Employed (Incorporated) | 38 | 4.2% |
| Self-Employed (Not Incorporated) | 16 | 1.8% |
| Not-for-profit Organizations | 16 | 1.8% |
| Local Government Employees | 71 | 7.9% |
| State Government Employees | 56 | 6.2% |
| Federal Government Employees | 0 | 0.0% |
| Unpaid Family Workers | 0 | 0.0% |
| Total | 901 | 100.0% |
Employment Status by Age in Pinehurst
According to the labor force statistics for Pinehurst, out of the total population over 16 years of age (1,801), 52.6% or 947 individuals are in the labor force, with 2.7% or 26 of them unemployed. The age group with the highest labor force participation rate is 35 to 44 years, with 86.0% or 294 individuals in the labor force. Within the labor force, the 30 to 34 years age range has the highest percentage of unemployed individuals, with 11.5% or 7 of them being unemployed.
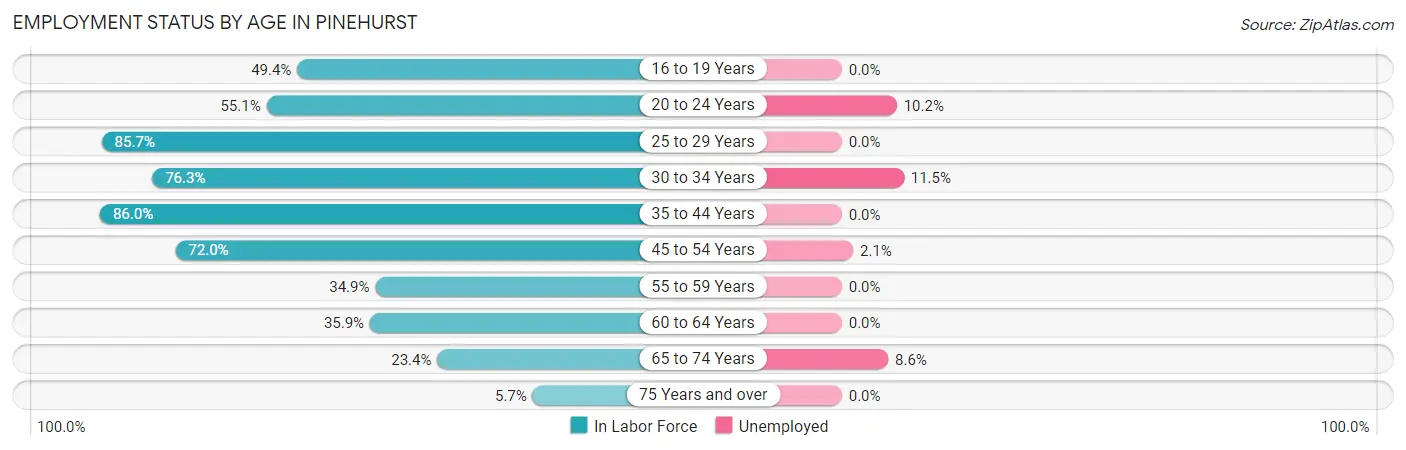
| Age Bracket | In Labor Force | Unemployed |
| 16 to 19 Years | 40 (49.4%) | 0 (0.0%) |
| 20 to 24 Years | 98 (55.1%) | 10 (10.2%) |
| 25 to 29 Years | 78 (85.7%) | 0 (0.0%) |
| 30 to 34 Years | 61 (76.3%) | 7 (11.5%) |
| 35 to 44 Years | 294 (86.0%) | 0 (0.0%) |
| 45 to 54 Years | 193 (72.0%) | 4 (2.1%) |
| 55 to 59 Years | 44 (34.9%) | 0 (0.0%) |
| 60 to 64 Years | 70 (35.9%) | 0 (0.0%) |
| 65 to 74 Years | 58 (23.4%) | 5 (8.6%) |
| 75 Years and over | 11 (5.7%) | 0 (0.0%) |
| Total | 947 (52.6%) | 26 (2.7%) |
Employment Status by Educational Attainment in Pinehurst
According to labor force statistics for Pinehurst, 67.2% of individuals (741) out of the total population between 25 and 64 years of age (1,102) are in the labor force, with 1.5% or 11 of them being unemployed. The group with the highest labor force participation rate are those with the educational attainment of bachelor's degree or higher, with 81.9% or 104 individuals in the labor force. Within the labor force, individuals with college / associate degree education have the highest percentage of unemployment, with 2.6% or 7 of them being unemployed.
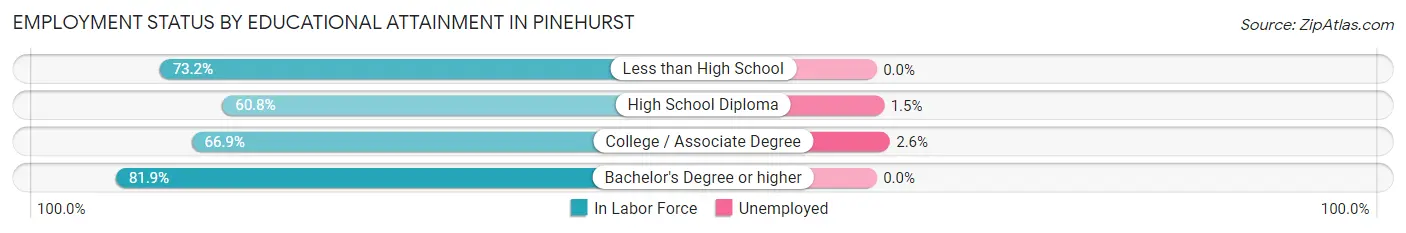
| Educational Attainment | In Labor Force | Unemployed |
| Less than High School | 112 (73.2%) | 0 (0.0%) |
| High School Diploma | 259 (60.8%) | 6 (1.5%) |
| College / Associate Degree | 265 (66.9%) | 10 (2.6%) |
| Bachelor's Degree or higher | 104 (81.9%) | 0 (0.0%) |
| Total | 741 (67.2%) | 17 (1.5%) |
Employment Occupations by Sex in Pinehurst
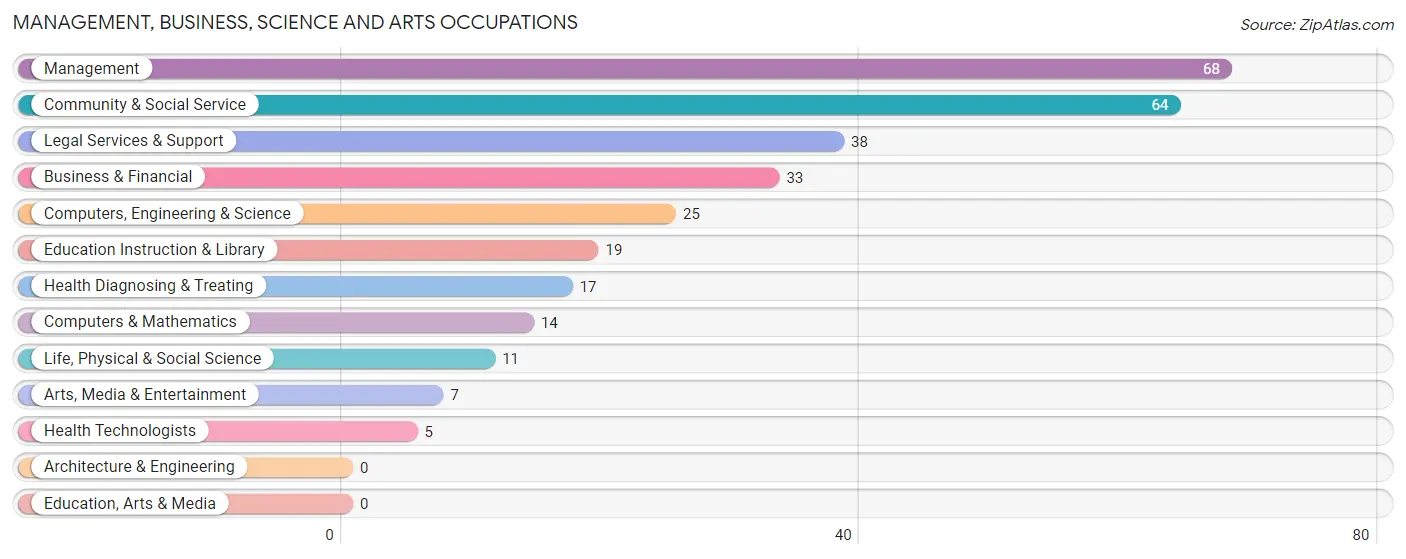
Management, Business, Science and Arts Occupations
The most common Management, Business, Science and Arts occupations in Pinehurst are Management (68 | 7.4%), Community & Social Service (64 | 7.0%), Legal Services & Support (38 | 4.1%), Business & Financial (33 | 3.6%), and Computers, Engineering & Science (25 | 2.7%).
Management, Business, Science and Arts Occupations by Sex
Within the Management, Business, Science and Arts occupations in Pinehurst, the most male-oriented occupations are Computers, Engineering & Science (100.0%), Computers & Mathematics (100.0%), and Life, Physical & Social Science (100.0%), while the most female-oriented occupations are Legal Services & Support (100.0%), Health Diagnosing & Treating (100.0%), and Health Technologists (100.0%).
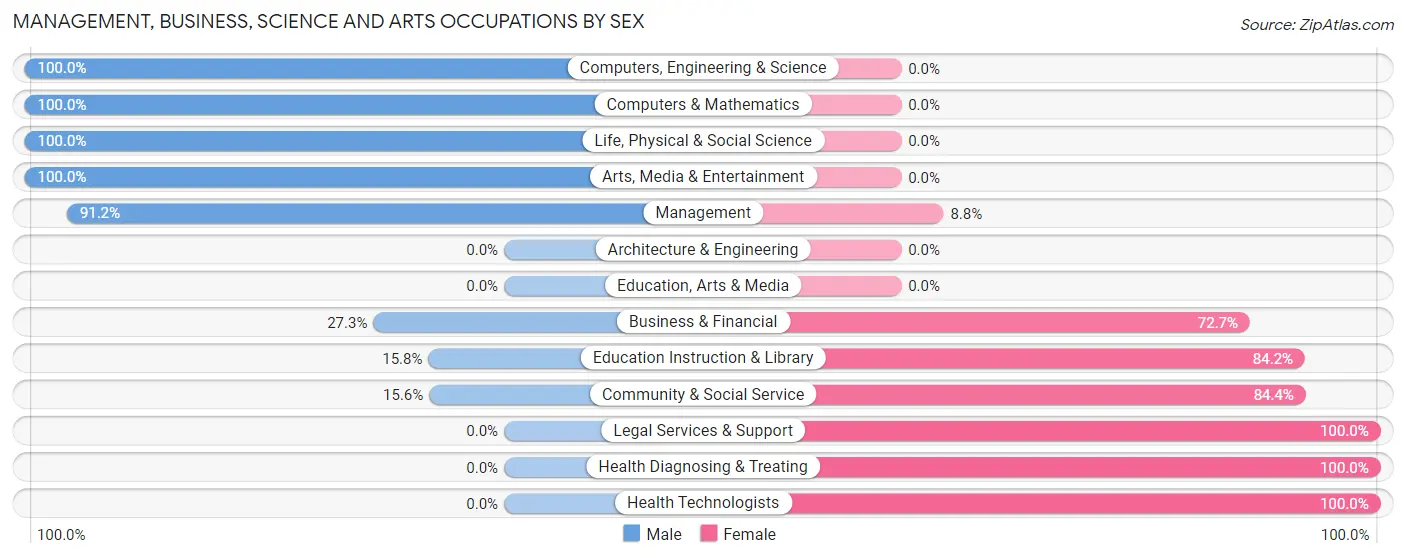
| Occupation | Male | Female |
| Management | 62 (91.2%) | 6 (8.8%) |
| Business & Financial | 9 (27.3%) | 24 (72.7%) |
| Computers, Engineering & Science | 25 (100.0%) | 0 (0.0%) |
| Computers & Mathematics | 14 (100.0%) | 0 (0.0%) |
| Architecture & Engineering | 0 (0.0%) | 0 (0.0%) |
| Life, Physical & Social Science | 11 (100.0%) | 0 (0.0%) |
| Community & Social Service | 10 (15.6%) | 54 (84.4%) |
| Education, Arts & Media | 0 (0.0%) | 0 (0.0%) |
| Legal Services & Support | 0 (0.0%) | 38 (100.0%) |
| Education Instruction & Library | 3 (15.8%) | 16 (84.2%) |
| Arts, Media & Entertainment | 7 (100.0%) | 0 (0.0%) |
| Health Diagnosing & Treating | 0 (0.0%) | 17 (100.0%) |
| Health Technologists | 0 (0.0%) | 5 (100.0%) |
| Total (Category) | 106 (51.2%) | 101 (48.8%) |
| Total (Overall) | 516 (56.0%) | 405 (44.0%) |
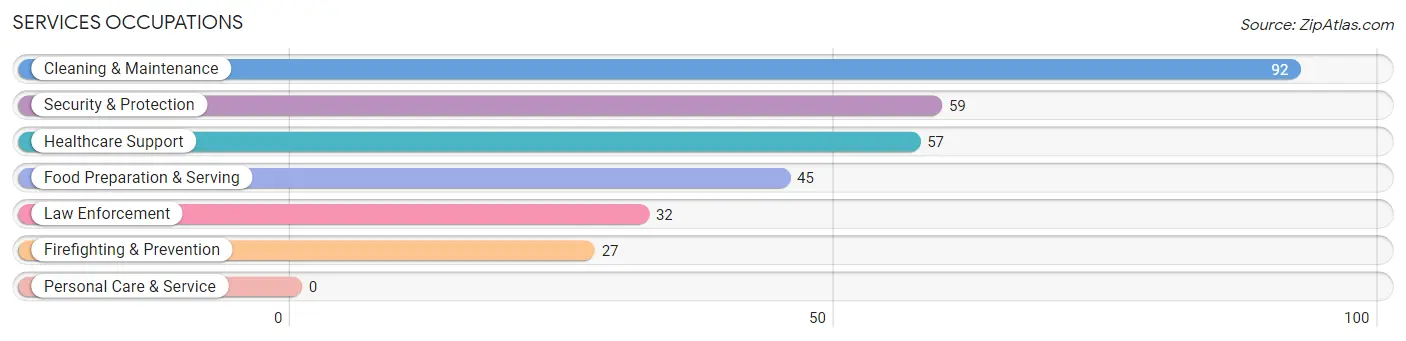
Services Occupations
The most common Services occupations in Pinehurst are Cleaning & Maintenance (92 | 10.0%), Security & Protection (59 | 6.4%), Healthcare Support (57 | 6.2%), Food Preparation & Serving (45 | 4.9%), and Law Enforcement (32 | 3.5%).
Services Occupations by Sex
Within the Services occupations in Pinehurst, the most male-oriented occupations are Firefighting & Prevention (100.0%), Cleaning & Maintenance (65.2%), and Security & Protection (45.8%), while the most female-oriented occupations are Healthcare Support (100.0%), Law Enforcement (100.0%), and Food Preparation & Serving (77.8%).
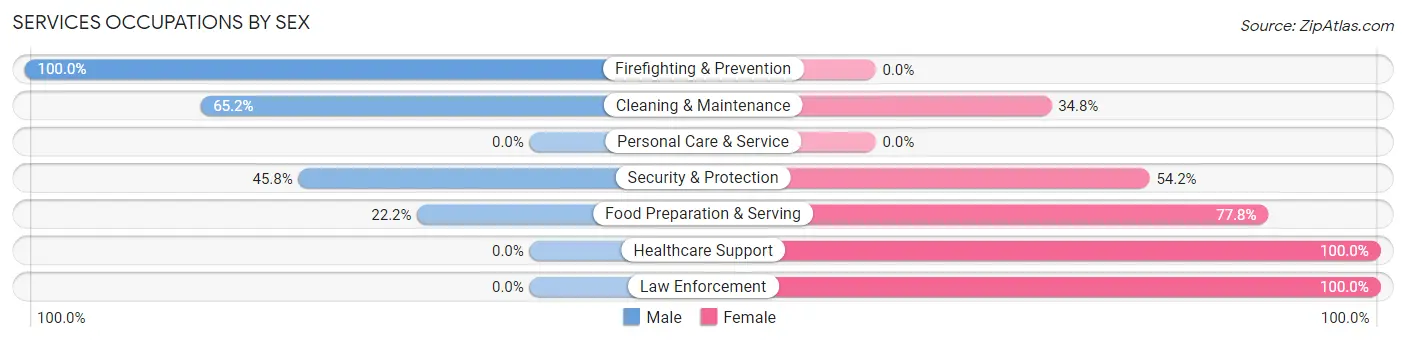
| Occupation | Male | Female |
| Healthcare Support | 0 (0.0%) | 57 (100.0%) |
| Security & Protection | 27 (45.8%) | 32 (54.2%) |
| Firefighting & Prevention | 27 (100.0%) | 0 (0.0%) |
| Law Enforcement | 0 (0.0%) | 32 (100.0%) |
| Food Preparation & Serving | 10 (22.2%) | 35 (77.8%) |
| Cleaning & Maintenance | 60 (65.2%) | 32 (34.8%) |
| Personal Care & Service | 0 (0.0%) | 0 (0.0%) |
| Total (Category) | 97 (38.3%) | 156 (61.7%) |
| Total (Overall) | 516 (56.0%) | 405 (44.0%) |
Sales and Office Occupations
The most common Sales and Office occupations in Pinehurst are Office & Administration (107 | 11.6%), and Sales & Related (79 | 8.6%).
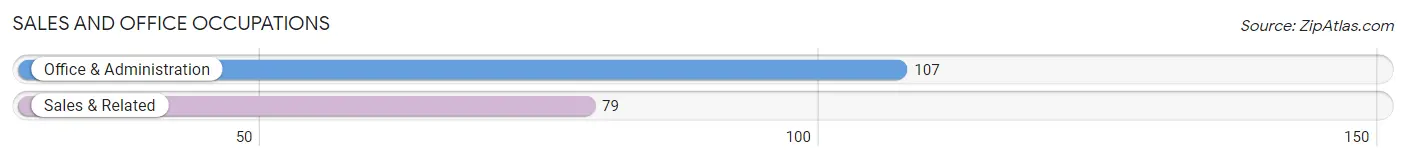
Sales and Office Occupations by Sex
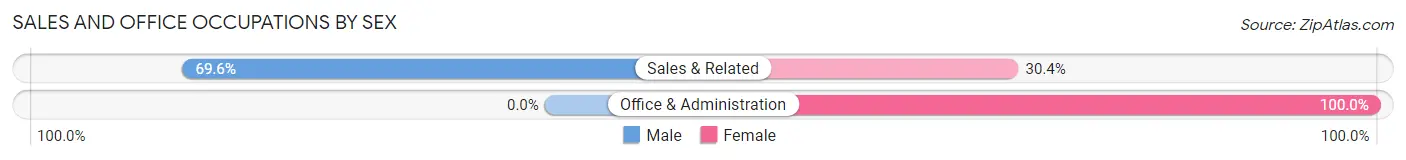
| Occupation | Male | Female |
| Sales & Related | 55 (69.6%) | 24 (30.4%) |
| Office & Administration | 0 (0.0%) | 107 (100.0%) |
| Total (Category) | 55 (29.6%) | 131 (70.4%) |
| Total (Overall) | 516 (56.0%) | 405 (44.0%) |
Natural Resources, Construction and Maintenance Occupations
The most common Natural Resources, Construction and Maintenance occupations in Pinehurst are Installation, Maintenance & Repair (57 | 6.2%), Construction & Extraction (51 | 5.5%), and Farming, Fishing & Forestry (24 | 2.6%).
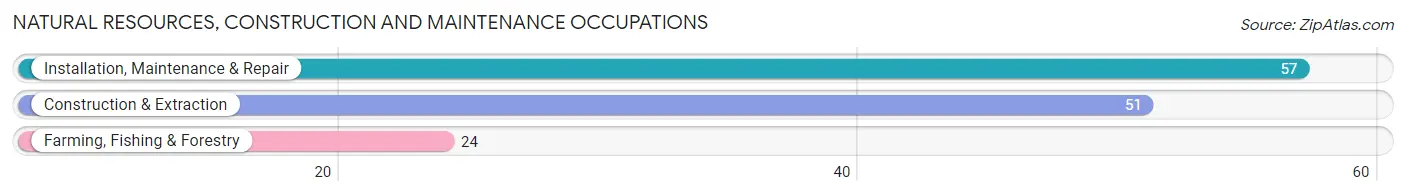
Natural Resources, Construction and Maintenance Occupations by Sex
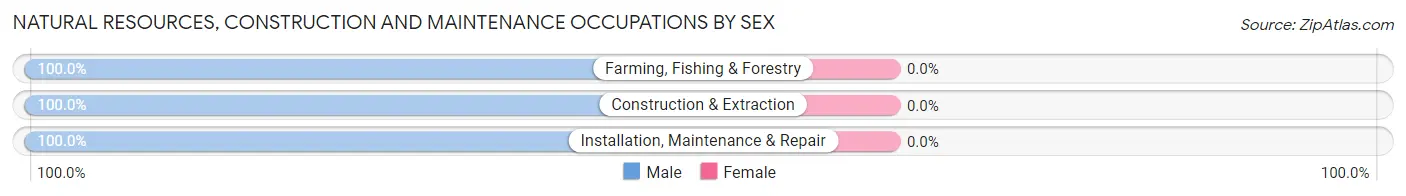
| Occupation | Male | Female |
| Farming, Fishing & Forestry | 24 (100.0%) | 0 (0.0%) |
| Construction & Extraction | 51 (100.0%) | 0 (0.0%) |
| Installation, Maintenance & Repair | 57 (100.0%) | 0 (0.0%) |
| Total (Category) | 132 (100.0%) | 0 (0.0%) |
| Total (Overall) | 516 (56.0%) | 405 (44.0%) |
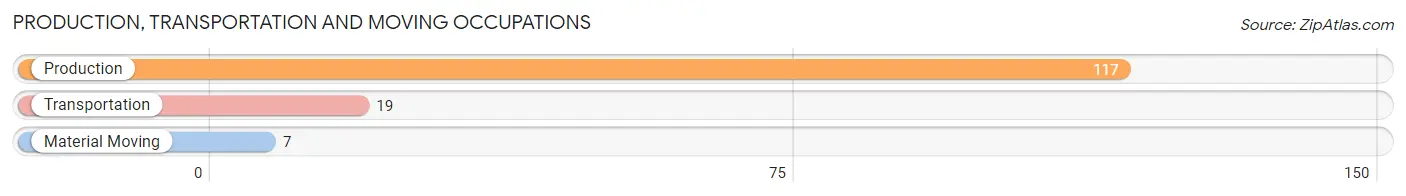
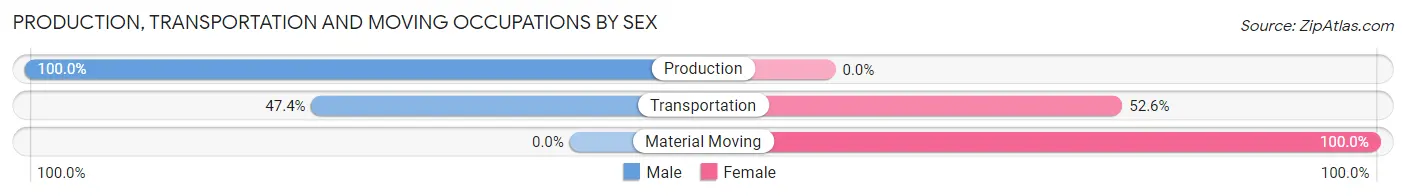
Production, Transportation and Moving Occupations
The most common Production, Transportation and Moving occupations in Pinehurst are Production (117 | 12.7%), Transportation (19 | 2.1%), and Material Moving (7 | 0.8%).
Production, Transportation and Moving Occupations by Sex
| Occupation | Male | Female |
| Production | 117 (100.0%) | 0 (0.0%) |
| Transportation | 9 (47.4%) | 10 (52.6%) |
| Material Moving | 0 (0.0%) | 7 (100.0%) |
| Total (Category) | 126 (88.1%) | 17 (11.9%) |
| Total (Overall) | 516 (56.0%) | 405 (44.0%) |
Employment Industries by Sex in Pinehurst
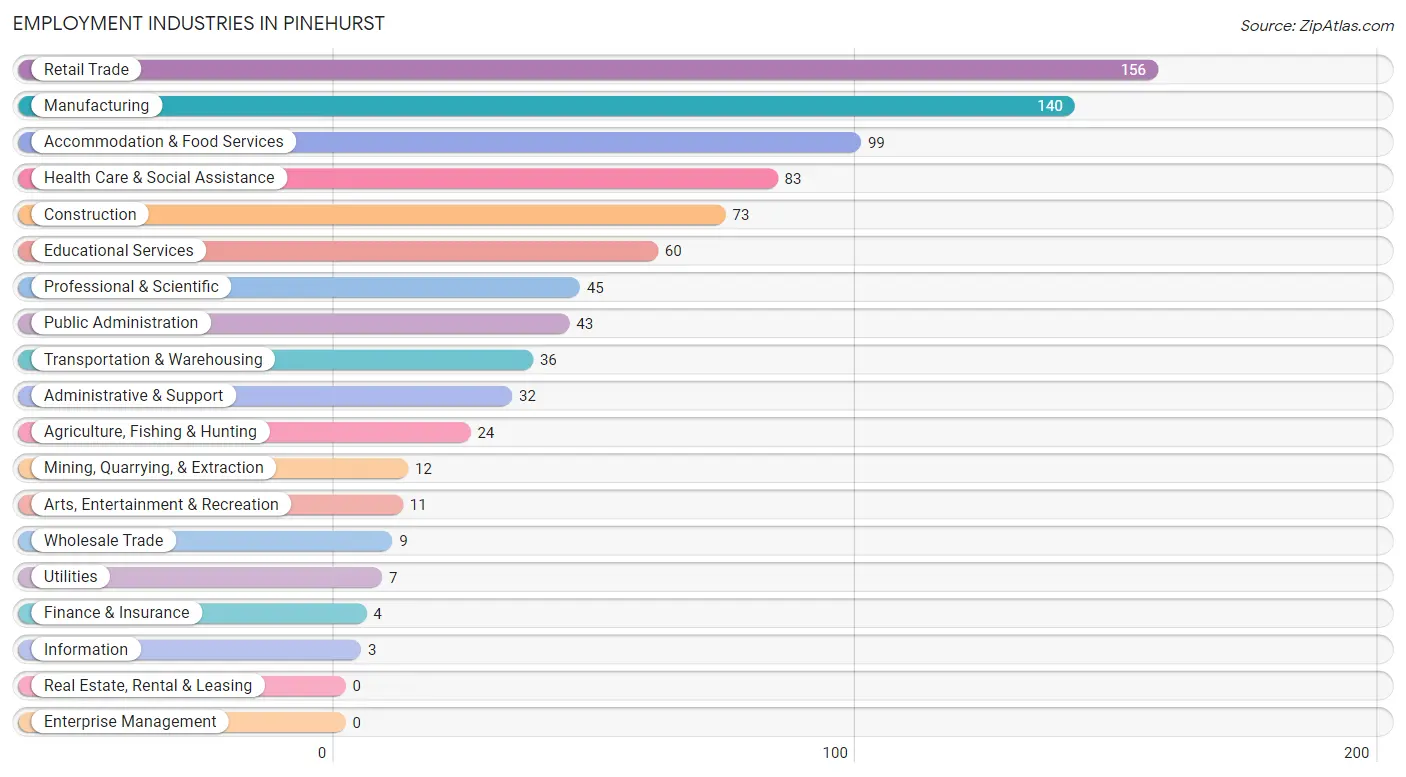
Employment Industries in Pinehurst
The major employment industries in Pinehurst include Retail Trade (156 | 16.9%), Manufacturing (140 | 15.2%), Accommodation & Food Services (99 | 10.7%), Health Care & Social Assistance (83 | 9.0%), and Construction (73 | 7.9%).
Employment Industries by Sex in Pinehurst
The Pinehurst industries that see more men than women are Agriculture, Fishing & Hunting (100.0%), Mining, Quarrying, & Extraction (100.0%), and Construction (100.0%), whereas the industries that tend to have a higher number of women are Wholesale Trade (100.0%), Utilities (100.0%), and Information (100.0%).
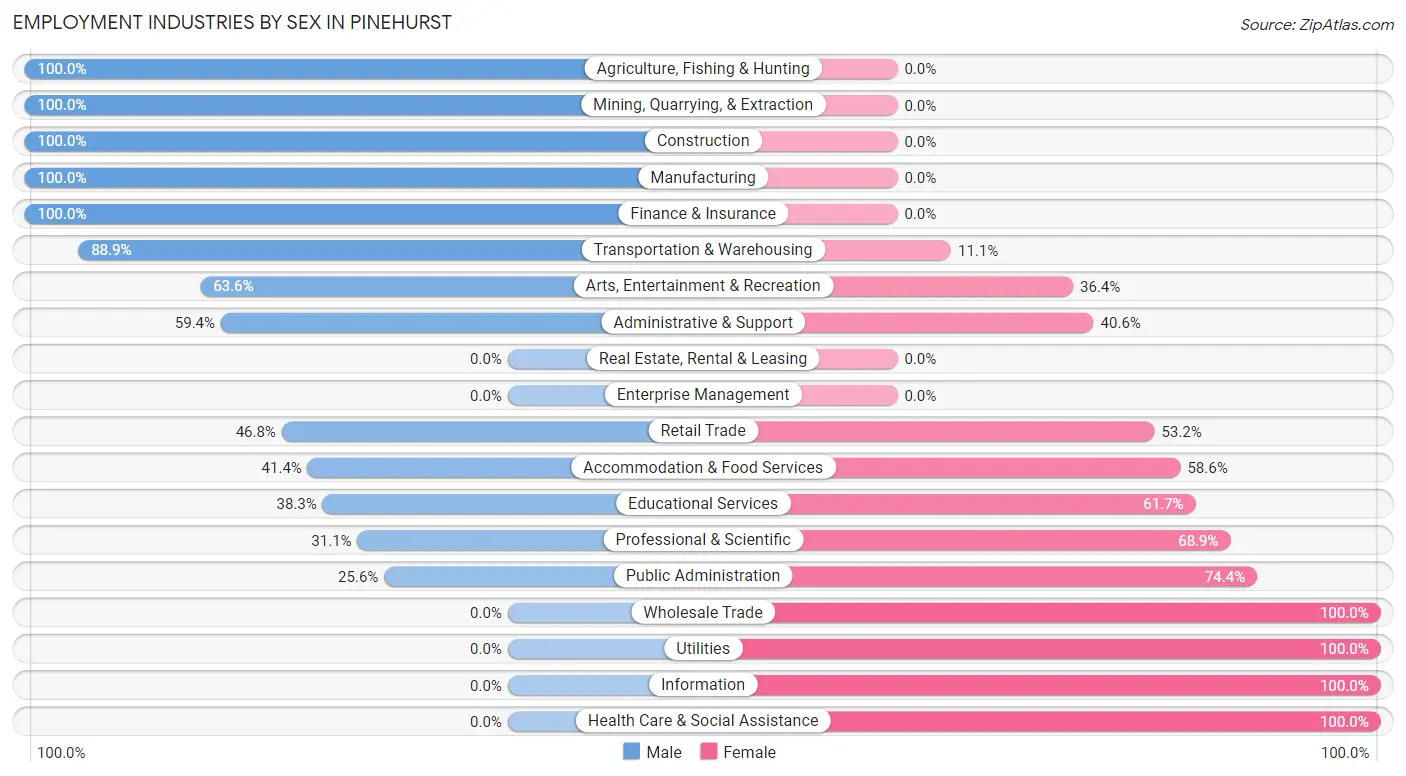
| Industry | Male | Female |
| Agriculture, Fishing & Hunting | 24 (100.0%) | 0 (0.0%) |
| Mining, Quarrying, & Extraction | 12 (100.0%) | 0 (0.0%) |
| Construction | 73 (100.0%) | 0 (0.0%) |
| Manufacturing | 140 (100.0%) | 0 (0.0%) |
| Wholesale Trade | 0 (0.0%) | 9 (100.0%) |
| Retail Trade | 73 (46.8%) | 83 (53.2%) |
| Transportation & Warehousing | 32 (88.9%) | 4 (11.1%) |
| Utilities | 0 (0.0%) | 7 (100.0%) |
| Information | 0 (0.0%) | 3 (100.0%) |
| Finance & Insurance | 4 (100.0%) | 0 (0.0%) |
| Real Estate, Rental & Leasing | 0 (0.0%) | 0 (0.0%) |
| Professional & Scientific | 14 (31.1%) | 31 (68.9%) |
| Enterprise Management | 0 (0.0%) | 0 (0.0%) |
| Administrative & Support | 19 (59.4%) | 13 (40.6%) |
| Educational Services | 23 (38.3%) | 37 (61.7%) |
| Health Care & Social Assistance | 0 (0.0%) | 83 (100.0%) |
| Arts, Entertainment & Recreation | 7 (63.6%) | 4 (36.4%) |
| Accommodation & Food Services | 41 (41.4%) | 58 (58.6%) |
| Public Administration | 11 (25.6%) | 32 (74.4%) |
| Total | 516 (56.0%) | 405 (44.0%) |
Education in Pinehurst
School Enrollment in Pinehurst
The most common levels of schooling among the 340 students in Pinehurst are middle school (162 | 47.6%), high school (80 | 23.5%), and elementary school (44 | 12.9%).
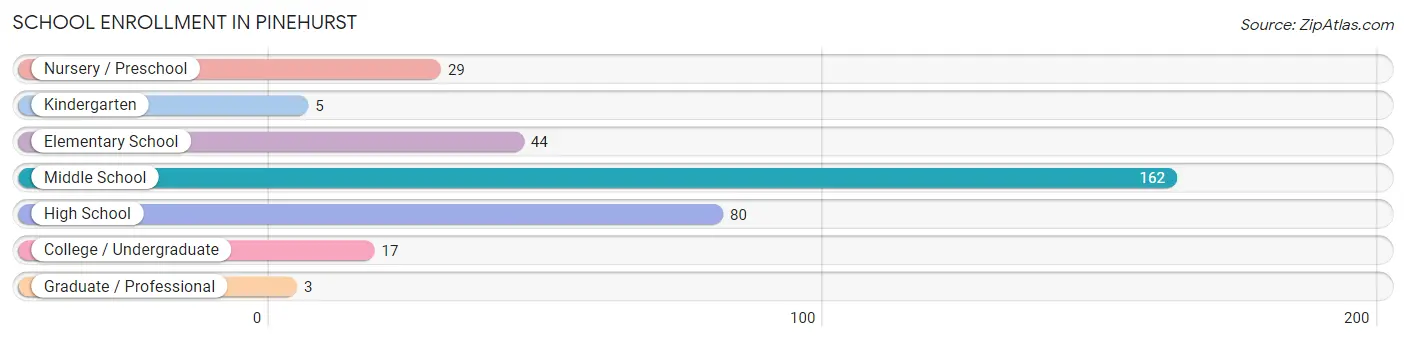
| School Level | # Students | % Students |
| Nursery / Preschool | 29 | 8.5% |
| Kindergarten | 5 | 1.5% |
| Elementary School | 44 | 12.9% |
| Middle School | 162 | 47.6% |
| High School | 80 | 23.5% |
| College / Undergraduate | 17 | 5.0% |
| Graduate / Professional | 3 | 0.9% |
| Total | 340 | 100.0% |
School Enrollment by Age by Funding Source in Pinehurst
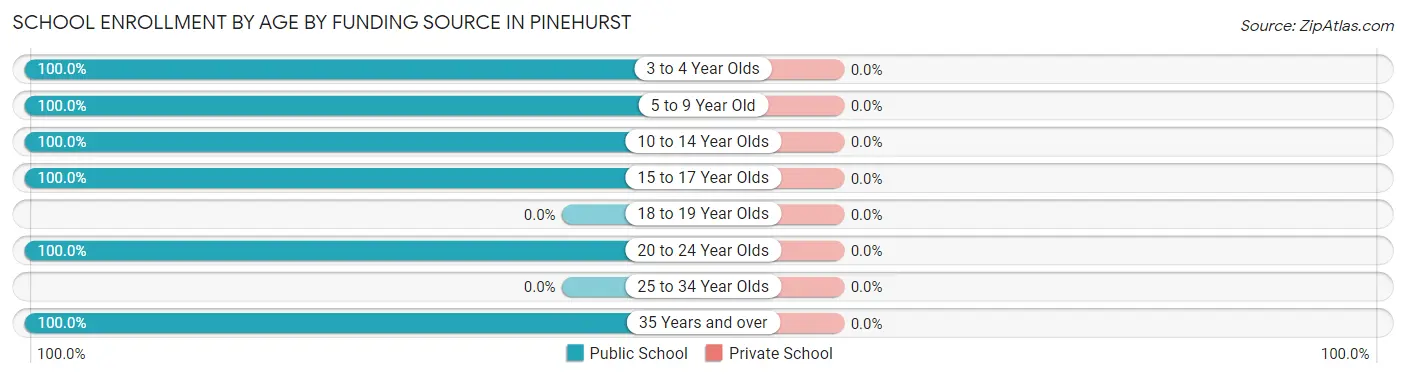
| Age Bracket | Public School | Private School |
| 3 to 4 Year Olds | 11 (100.0%) | 0 (0.0%) |
| 5 to 9 Year Old | 36 (100.0%) | 0 (0.0%) |
| 10 to 14 Year Olds | 209 (100.0%) | 0 (0.0%) |
| 15 to 17 Year Olds | 64 (100.0%) | 0 (0.0%) |
| 18 to 19 Year Olds | 0 (0.0%) | 0 (0.0%) |
| 20 to 24 Year Olds | 17 (100.0%) | 0 (0.0%) |
| 25 to 34 Year Olds | 0 (0.0%) | 0 (0.0%) |
| 35 Years and over | 3 (100.0%) | 0 (0.0%) |
| Total | 340 (100.0%) | 0 (0.0%) |
Educational Attainment by Field of Study in Pinehurst
Business (56 | 24.1%), social sciences (38 | 16.4%), science & technology (32 | 13.8%), education (26 | 11.2%), and bio, nature & agricultural (21 | 9.0%) are the most common fields of study among 232 individuals in Pinehurst who have obtained a bachelor's degree or higher.
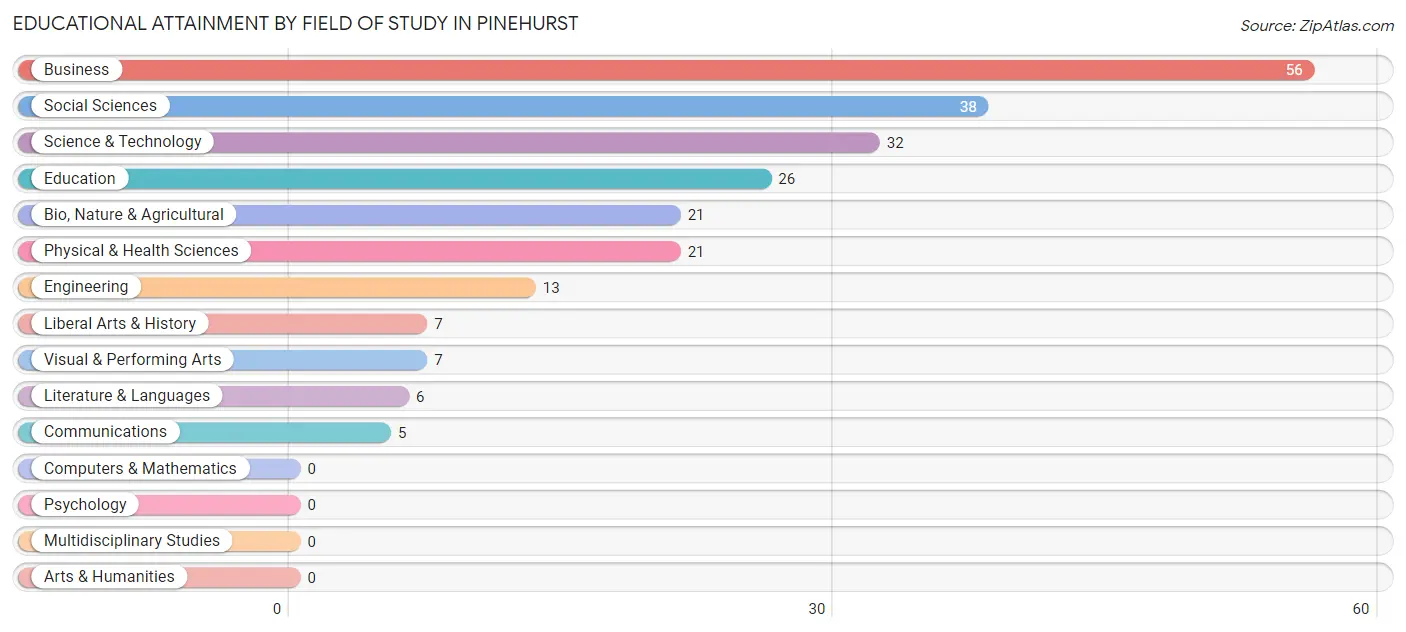
| Field of Study | # Graduates | % Graduates |
| Computers & Mathematics | 0 | 0.0% |
| Bio, Nature & Agricultural | 21 | 9.0% |
| Physical & Health Sciences | 21 | 9.0% |
| Psychology | 0 | 0.0% |
| Social Sciences | 38 | 16.4% |
| Engineering | 13 | 5.6% |
| Multidisciplinary Studies | 0 | 0.0% |
| Science & Technology | 32 | 13.8% |
| Business | 56 | 24.1% |
| Education | 26 | 11.2% |
| Literature & Languages | 6 | 2.6% |
| Liberal Arts & History | 7 | 3.0% |
| Visual & Performing Arts | 7 | 3.0% |
| Communications | 5 | 2.2% |
| Arts & Humanities | 0 | 0.0% |
| Total | 232 | 100.0% |
Transportation & Commute in Pinehurst
Vehicle Availability by Sex in Pinehurst
The most prevalent vehicle ownership categories in Pinehurst are males with 2 vehicles (202, accounting for 39.6%) and females with 2 vehicles (184, making up 51.7%).
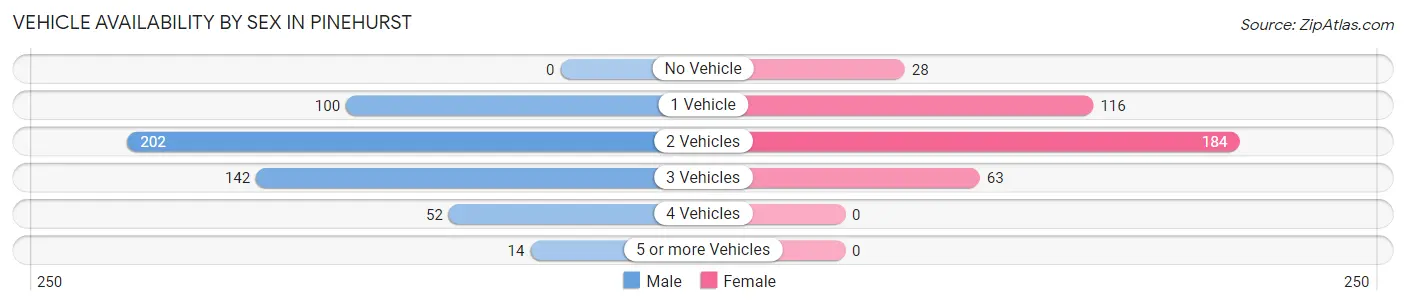
| Vehicles Available | Male | Female |
| No Vehicle | 0 (0.0%) | 28 (7.2%) |
| 1 Vehicle | 100 (19.6%) | 116 (29.7%) |
| 2 Vehicles | 202 (39.6%) | 184 (47.1%) |
| 3 Vehicles | 142 (27.8%) | 63 (16.1%) |
| 4 Vehicles | 52 (10.2%) | 0 (0.0%) |
| 5 or more Vehicles | 14 (2.8%) | 0 (0.0%) |
| Total | 510 (100.0%) | 391 (100.0%) |
Commute Time in Pinehurst
The most frequently occuring commute durations in Pinehurst are 30 to 34 minutes (196 commuters, 23.0%), 10 to 14 minutes (189 commuters, 22.1%), and 5 to 9 minutes (135 commuters, 15.8%).
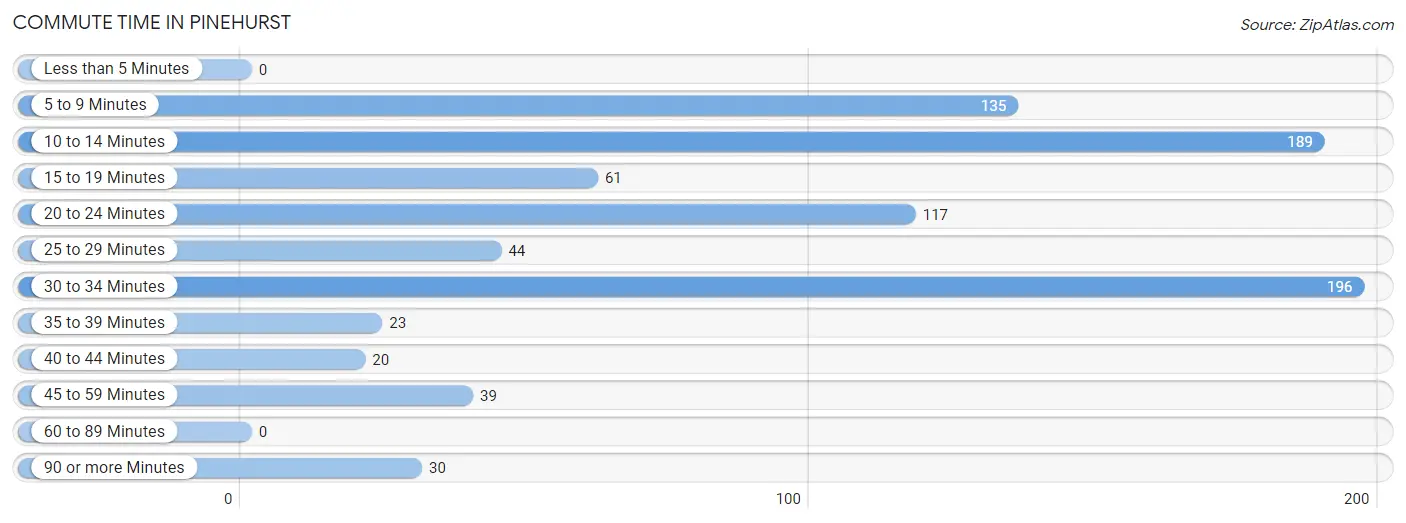
| Commute Time | # Commuters | % Commuters |
| Less than 5 Minutes | 0 | 0.0% |
| 5 to 9 Minutes | 135 | 15.8% |
| 10 to 14 Minutes | 189 | 22.1% |
| 15 to 19 Minutes | 61 | 7.1% |
| 20 to 24 Minutes | 117 | 13.7% |
| 25 to 29 Minutes | 44 | 5.1% |
| 30 to 34 Minutes | 196 | 23.0% |
| 35 to 39 Minutes | 23 | 2.7% |
| 40 to 44 Minutes | 20 | 2.3% |
| 45 to 59 Minutes | 39 | 4.6% |
| 60 to 89 Minutes | 0 | 0.0% |
| 90 or more Minutes | 30 | 3.5% |
Commute Time by Sex in Pinehurst
The most common commute times in Pinehurst are 30 to 34 minutes (155 commuters, 33.0%) for males and 5 to 9 minutes (100 commuters, 26.0%) for females.
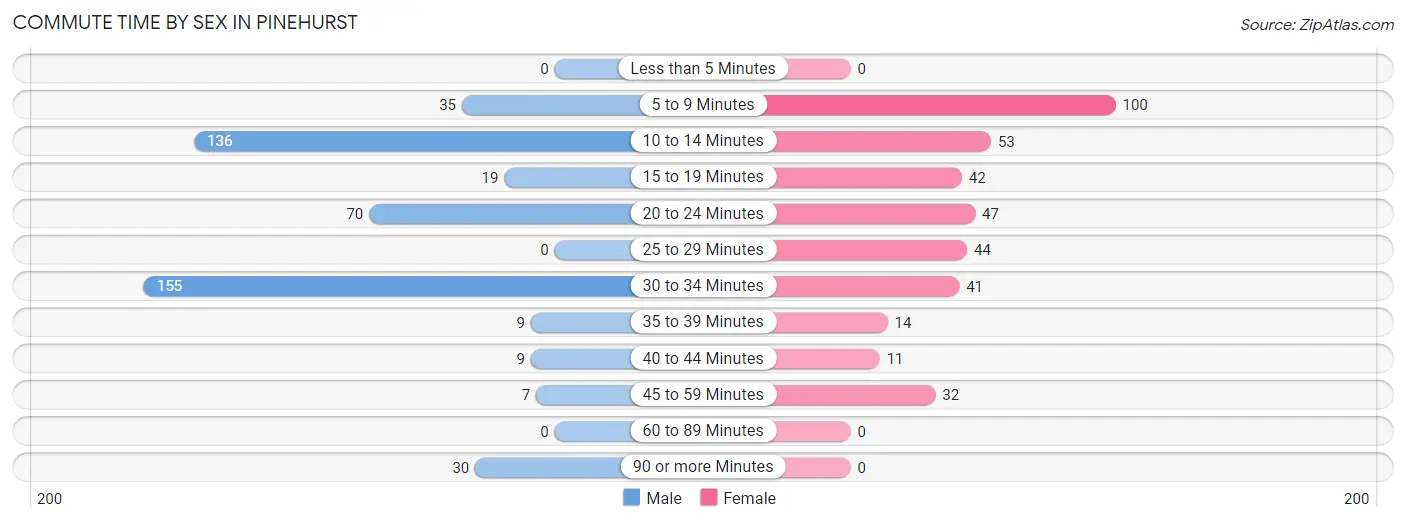
| Commute Time | Male | Female |
| Less than 5 Minutes | 0 (0.0%) | 0 (0.0%) |
| 5 to 9 Minutes | 35 (7.4%) | 100 (26.0%) |
| 10 to 14 Minutes | 136 (28.9%) | 53 (13.8%) |
| 15 to 19 Minutes | 19 (4.0%) | 42 (10.9%) |
| 20 to 24 Minutes | 70 (14.9%) | 47 (12.2%) |
| 25 to 29 Minutes | 0 (0.0%) | 44 (11.5%) |
| 30 to 34 Minutes | 155 (33.0%) | 41 (10.7%) |
| 35 to 39 Minutes | 9 (1.9%) | 14 (3.6%) |
| 40 to 44 Minutes | 9 (1.9%) | 11 (2.9%) |
| 45 to 59 Minutes | 7 (1.5%) | 32 (8.3%) |
| 60 to 89 Minutes | 0 (0.0%) | 0 (0.0%) |
| 90 or more Minutes | 30 (6.4%) | 0 (0.0%) |
Time of Departure to Work by Sex in Pinehurst
The most frequent times of departure to work in Pinehurst are 6:00 AM to 6:29 AM (106, 22.6%) for males and 7:30 AM to 7:59 AM (100, 26.0%) for females.
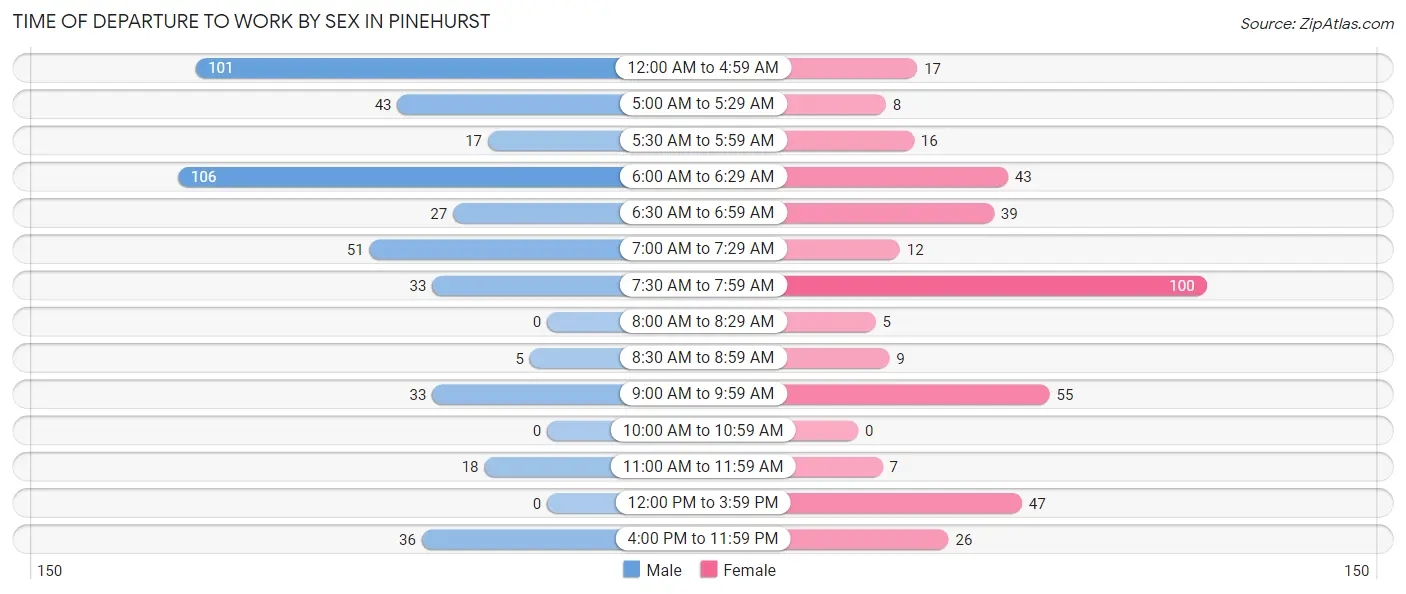
| Time of Departure | Male | Female |
| 12:00 AM to 4:59 AM | 101 (21.5%) | 17 (4.4%) |
| 5:00 AM to 5:29 AM | 43 (9.1%) | 8 (2.1%) |
| 5:30 AM to 5:59 AM | 17 (3.6%) | 16 (4.2%) |
| 6:00 AM to 6:29 AM | 106 (22.6%) | 43 (11.2%) |
| 6:30 AM to 6:59 AM | 27 (5.7%) | 39 (10.2%) |
| 7:00 AM to 7:29 AM | 51 (10.8%) | 12 (3.1%) |
| 7:30 AM to 7:59 AM | 33 (7.0%) | 100 (26.0%) |
| 8:00 AM to 8:29 AM | 0 (0.0%) | 5 (1.3%) |
| 8:30 AM to 8:59 AM | 5 (1.1%) | 9 (2.3%) |
| 9:00 AM to 9:59 AM | 33 (7.0%) | 55 (14.3%) |
| 10:00 AM to 10:59 AM | 0 (0.0%) | 0 (0.0%) |
| 11:00 AM to 11:59 AM | 18 (3.8%) | 7 (1.8%) |
| 12:00 PM to 3:59 PM | 0 (0.0%) | 47 (12.2%) |
| 4:00 PM to 11:59 PM | 36 (7.7%) | 26 (6.8%) |
| Total | 470 (100.0%) | 384 (100.0%) |
Housing Occupancy in Pinehurst
Occupancy by Ownership in Pinehurst
Of the total 1,350 dwellings in Pinehurst, owner-occupied units account for 1,059 (78.4%), while renter-occupied units make up 291 (21.6%).
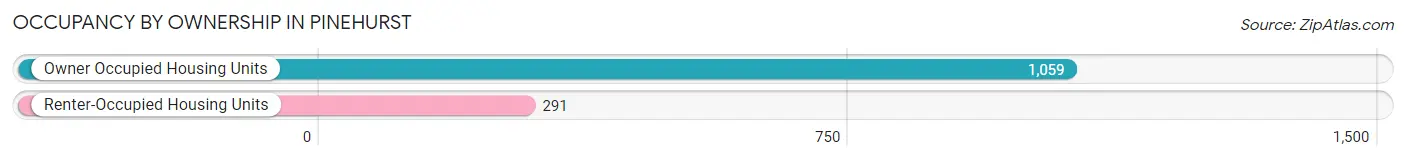
| Occupancy | # Housing Units | % Housing Units |
| Owner Occupied Housing Units | 1,059 | 78.4% |
| Renter-Occupied Housing Units | 291 | 21.6% |
| Total Occupied Housing Units | 1,350 | 100.0% |
Occupancy by Household Size in Pinehurst
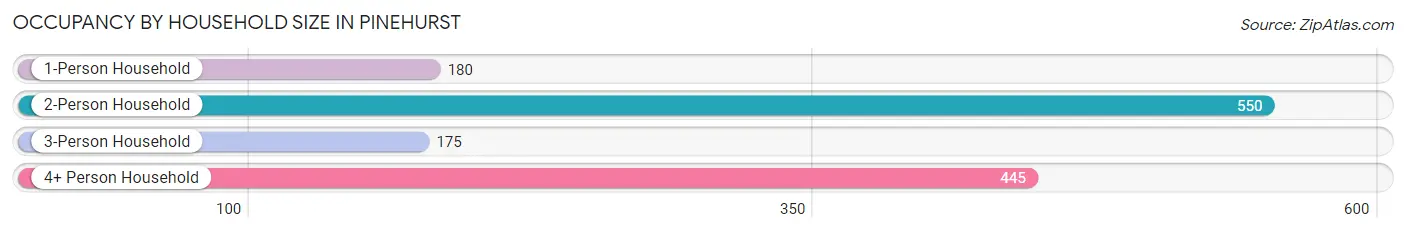
| Household Size | # Housing Units | % Housing Units |
| 1-Person Household | 180 | 13.3% |
| 2-Person Household | 550 | 40.7% |
| 3-Person Household | 175 | 13.0% |
| 4+ Person Household | 445 | 33.0% |
| Total Housing Units | 1,350 | 100.0% |
Occupancy by Ownership by Household Size in Pinehurst
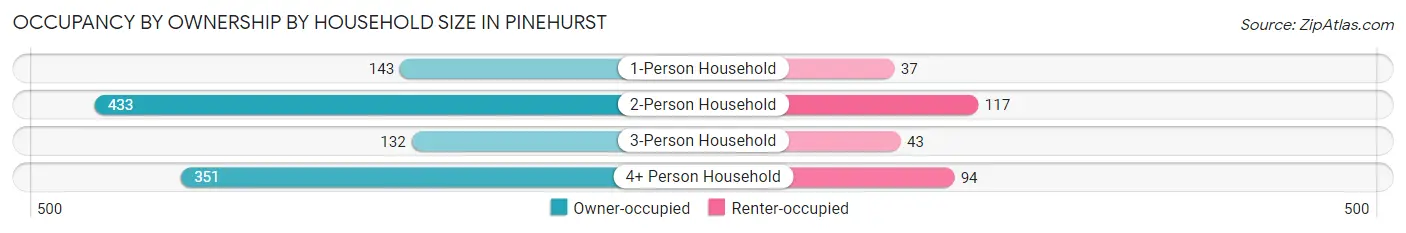
| Household Size | Owner-occupied | Renter-occupied |
| 1-Person Household | 143 (79.4%) | 37 (20.6%) |
| 2-Person Household | 433 (78.7%) | 117 (21.3%) |
| 3-Person Household | 132 (75.4%) | 43 (24.6%) |
| 4+ Person Household | 351 (78.9%) | 94 (21.1%) |
| Total Housing Units | 1,059 (78.4%) | 291 (21.6%) |
Occupancy by Educational Attainment in Pinehurst
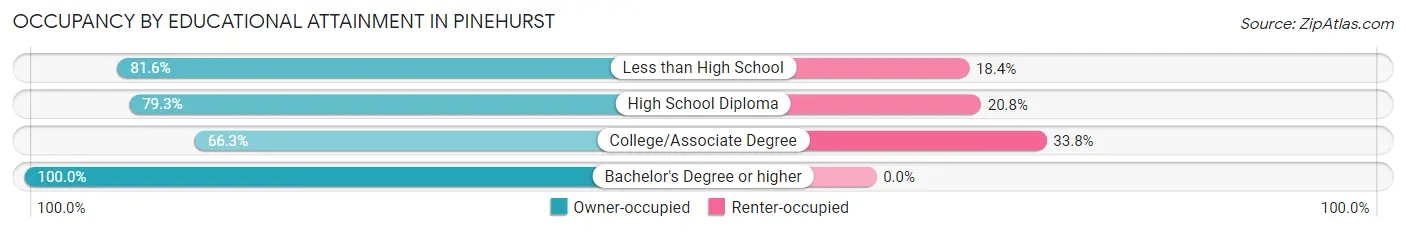
| Household Size | Owner-occupied | Renter-occupied |
| Less than High School | 133 (81.6%) | 30 (18.4%) |
| High School Diploma | 378 (79.2%) | 99 (20.7%) |
| College/Associate Degree | 318 (66.2%) | 162 (33.8%) |
| Bachelor's Degree or higher | 230 (100.0%) | 0 (0.0%) |
Occupancy by Age of Householder in Pinehurst
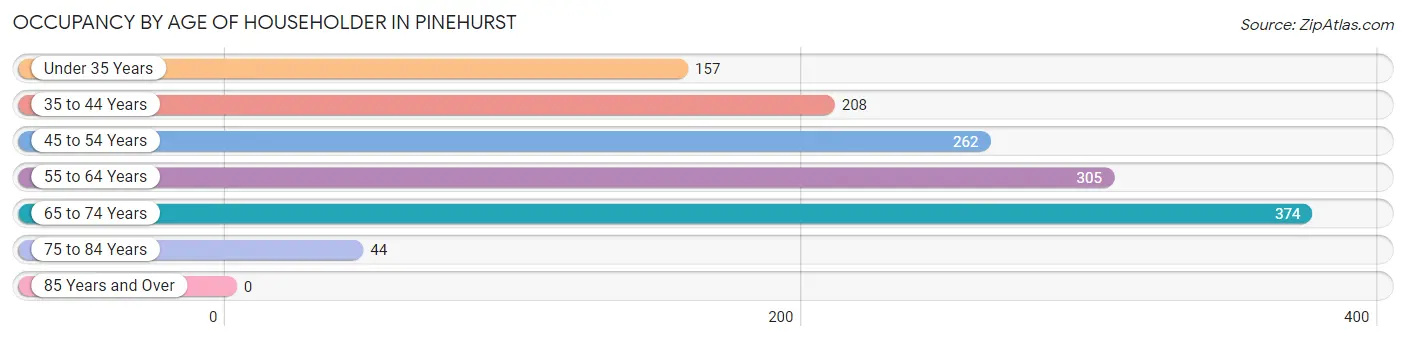
| Age Bracket | # Households | % Households |
| Under 35 Years | 157 | 11.6% |
| 35 to 44 Years | 208 | 15.4% |
| 45 to 54 Years | 262 | 19.4% |
| 55 to 64 Years | 305 | 22.6% |
| 65 to 74 Years | 374 | 27.7% |
| 75 to 84 Years | 44 | 3.3% |
| 85 Years and Over | 0 | 0.0% |
| Total | 1,350 | 100.0% |
Housing Finances in Pinehurst
Median Income by Occupancy in Pinehurst
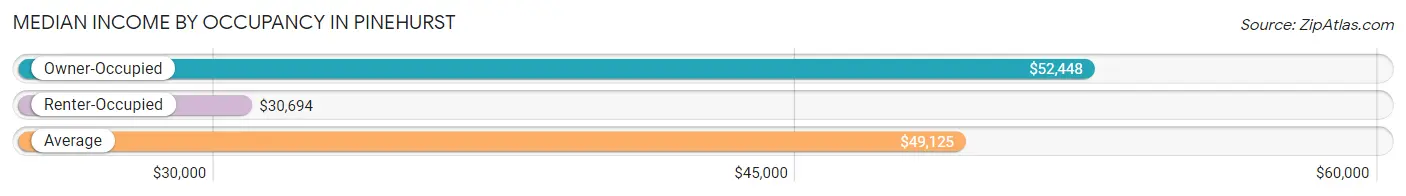
| Occupancy Type | # Households | Median Income |
| Owner-Occupied | 591 (67.2%) | $52,448 |
| Renter-Occupied | 288 (32.8%) | $30,694 |
| Average | 879 (100.0%) | $49,125 |
Occupancy by Householder Income Bracket in Pinehurst
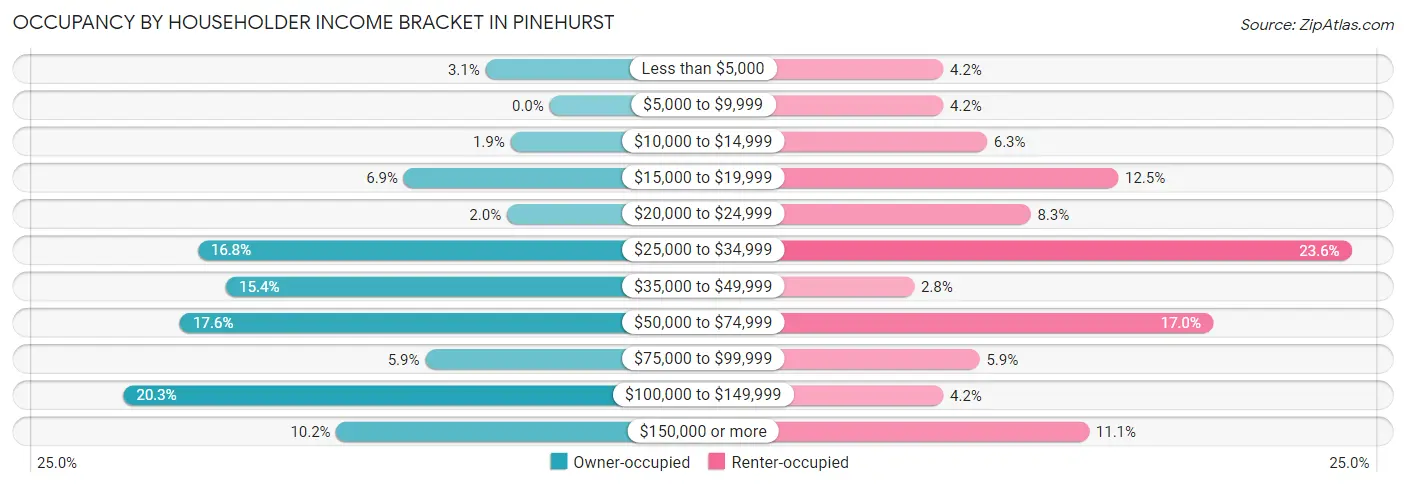
| Income Bracket | Owner-occupied | Renter-occupied |
| Less than $5,000 | 18 (3.0%) | 12 (4.2%) |
| $5,000 to $9,999 | 0 (0.0%) | 12 (4.2%) |
| $10,000 to $14,999 | 11 (1.9%) | 18 (6.2%) |
| $15,000 to $19,999 | 41 (6.9%) | 36 (12.5%) |
| $20,000 to $24,999 | 12 (2.0%) | 24 (8.3%) |
| $25,000 to $34,999 | 99 (16.8%) | 68 (23.6%) |
| $35,000 to $49,999 | 91 (15.4%) | 8 (2.8%) |
| $50,000 to $74,999 | 104 (17.6%) | 49 (17.0%) |
| $75,000 to $99,999 | 35 (5.9%) | 17 (5.9%) |
| $100,000 to $149,999 | 120 (20.3%) | 12 (4.2%) |
| $150,000 or more | 60 (10.2%) | 32 (11.1%) |
| Total | 591 (100.0%) | 288 (100.0%) |
Monthly Housing Cost Tiers in Pinehurst
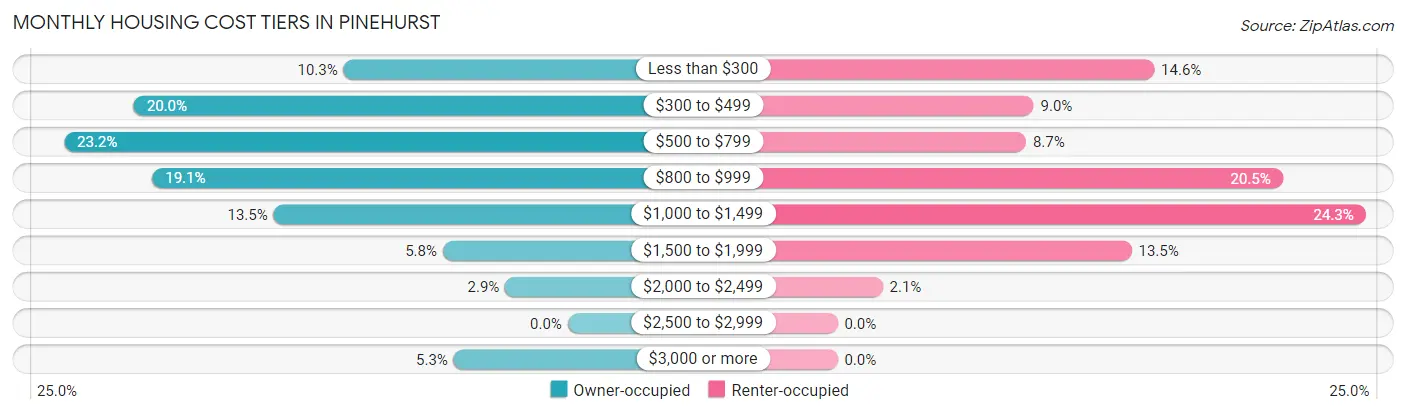
| Monthly Cost | Owner-occupied | Renter-occupied |
| Less than $300 | 61 (10.3%) | 42 (14.6%) |
| $300 to $499 | 118 (20.0%) | 26 (9.0%) |
| $500 to $799 | 137 (23.2%) | 25 (8.7%) |
| $800 to $999 | 113 (19.1%) | 59 (20.5%) |
| $1,000 to $1,499 | 80 (13.5%) | 70 (24.3%) |
| $1,500 to $1,999 | 34 (5.8%) | 39 (13.5%) |
| $2,000 to $2,499 | 17 (2.9%) | 6 (2.1%) |
| $2,500 to $2,999 | 0 (0.0%) | 0 (0.0%) |
| $3,000 or more | 31 (5.2%) | 0 (0.0%) |
| Total | 591 (100.0%) | 288 (100.0%) |
Physical Housing Characteristics in Pinehurst
Housing Structures in Pinehurst
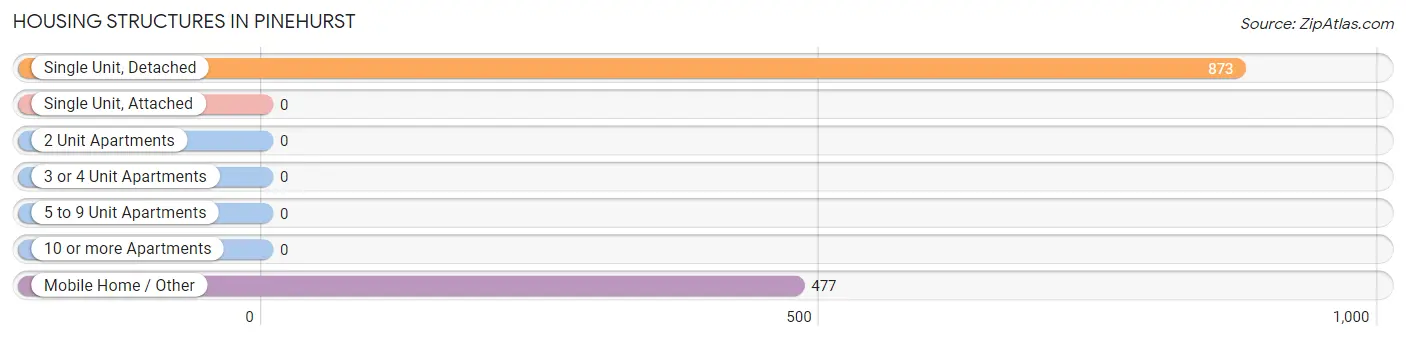
| Structure Type | # Housing Units | % Housing Units |
| Single Unit, Detached | 873 | 64.7% |
| Single Unit, Attached | 0 | 0.0% |
| 2 Unit Apartments | 0 | 0.0% |
| 3 or 4 Unit Apartments | 0 | 0.0% |
| 5 to 9 Unit Apartments | 0 | 0.0% |
| 10 or more Apartments | 0 | 0.0% |
| Mobile Home / Other | 477 | 35.3% |
| Total | 1,350 | 100.0% |
Housing Structures by Occupancy in Pinehurst
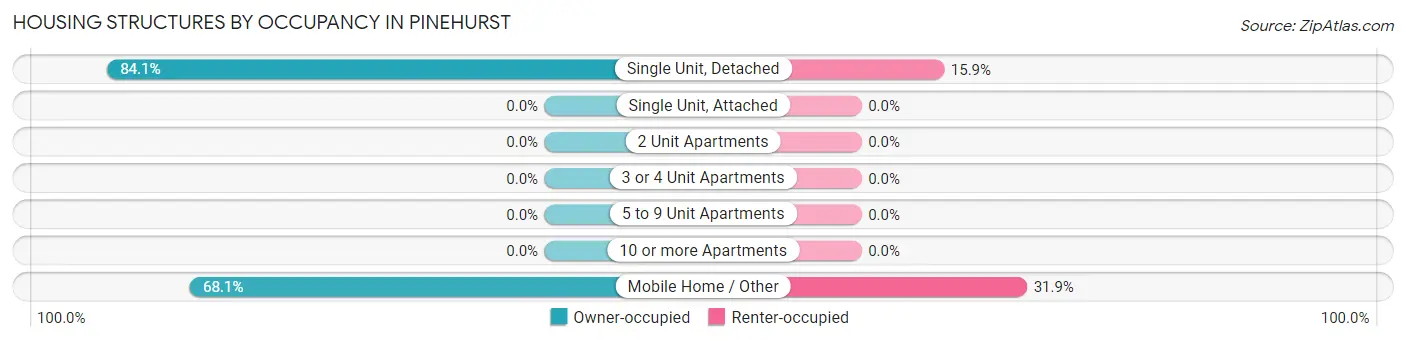
| Structure Type | Owner-occupied | Renter-occupied |
| Single Unit, Detached | 734 (84.1%) | 139 (15.9%) |
| Single Unit, Attached | 0 (0.0%) | 0 (0.0%) |
| 2 Unit Apartments | 0 (0.0%) | 0 (0.0%) |
| 3 or 4 Unit Apartments | 0 (0.0%) | 0 (0.0%) |
| 5 to 9 Unit Apartments | 0 (0.0%) | 0 (0.0%) |
| 10 or more Apartments | 0 (0.0%) | 0 (0.0%) |
| Mobile Home / Other | 325 (68.1%) | 152 (31.9%) |
| Total | 1,059 (78.4%) | 291 (21.6%) |
Housing Structures by Number of Rooms in Pinehurst
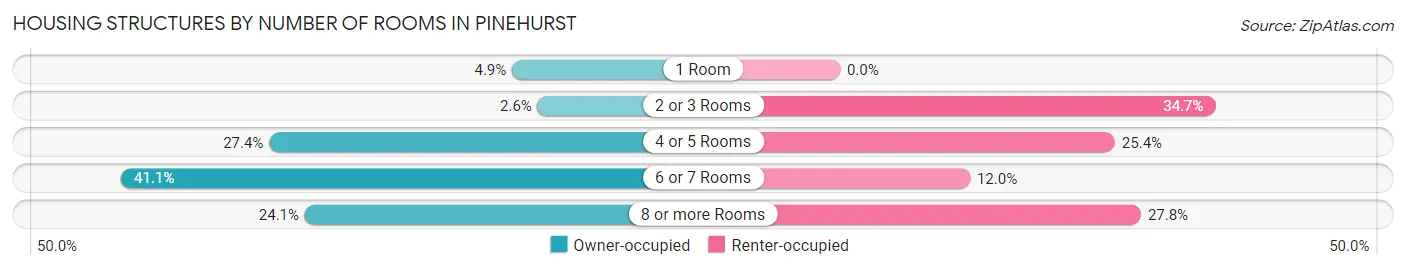
| Number of Rooms | Owner-occupied | Renter-occupied |
| 1 Room | 52 (4.9%) | 0 (0.0%) |
| 2 or 3 Rooms | 27 (2.5%) | 101 (34.7%) |
| 4 or 5 Rooms | 290 (27.4%) | 74 (25.4%) |
| 6 or 7 Rooms | 435 (41.1%) | 35 (12.0%) |
| 8 or more Rooms | 255 (24.1%) | 81 (27.8%) |
| Total | 1,059 (100.0%) | 291 (100.0%) |
Housing Structure by Heating Type in Pinehurst
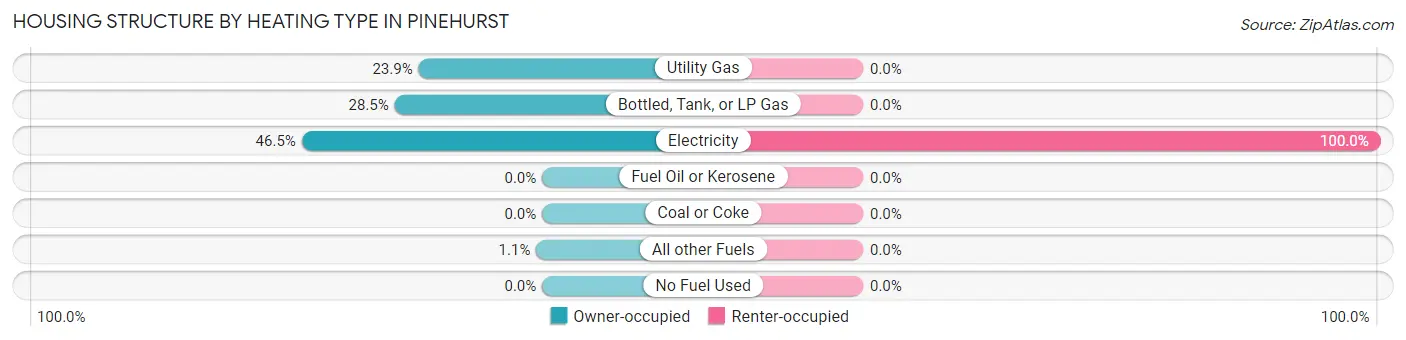
| Heating Type | Owner-occupied | Renter-occupied |
| Utility Gas | 253 (23.9%) | 0 (0.0%) |
| Bottled, Tank, or LP Gas | 302 (28.5%) | 0 (0.0%) |
| Electricity | 492 (46.5%) | 291 (100.0%) |
| Fuel Oil or Kerosene | 0 (0.0%) | 0 (0.0%) |
| Coal or Coke | 0 (0.0%) | 0 (0.0%) |
| All other Fuels | 12 (1.1%) | 0 (0.0%) |
| No Fuel Used | 0 (0.0%) | 0 (0.0%) |
| Total | 1,059 (100.0%) | 291 (100.0%) |
Household Vehicle Usage in Pinehurst
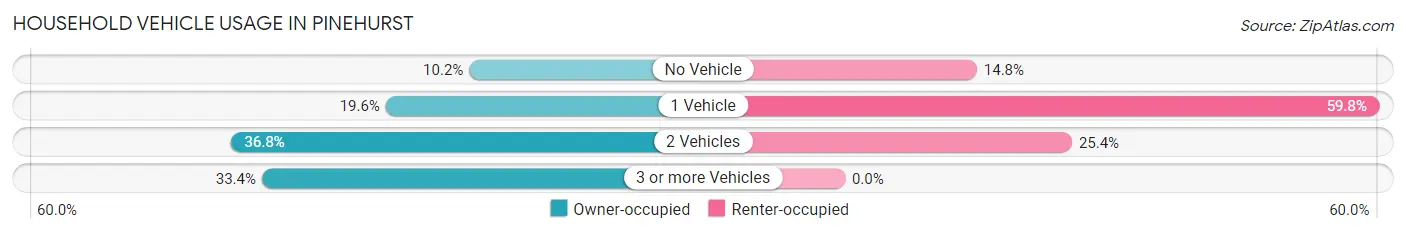
| Vehicles per Household | Owner-occupied | Renter-occupied |
| No Vehicle | 108 (10.2%) | 43 (14.8%) |
| 1 Vehicle | 207 (19.6%) | 174 (59.8%) |
| 2 Vehicles | 390 (36.8%) | 74 (25.4%) |
| 3 or more Vehicles | 354 (33.4%) | 0 (0.0%) |
| Total | 1,059 (100.0%) | 291 (100.0%) |
Real Estate & Mortgages in Pinehurst
Real Estate and Mortgage Overview in Pinehurst
| Characteristic | Without Mortgage | With Mortgage |
| Housing Units | 672 | 239 |
| Median Property Value | $122,100 | $163,800 |
| Median Household Income | $57,458 | $42 |
| Monthly Housing Costs | $507 | $31 |
| Real Estate Taxes | $1,591 | $25 |
Property Value by Mortgage Status in Pinehurst
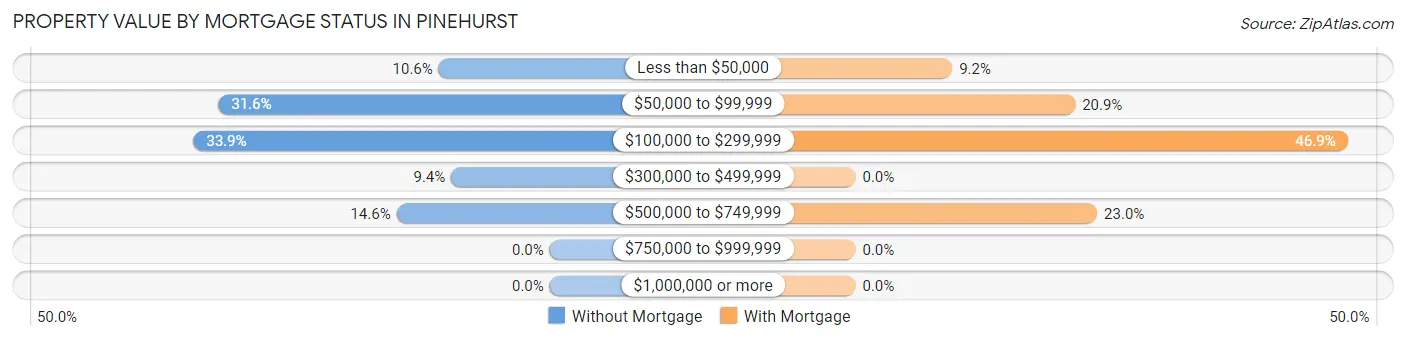
| Property Value | Without Mortgage | With Mortgage |
| Less than $50,000 | 71 (10.6%) | 22 (9.2%) |
| $50,000 to $99,999 | 212 (31.6%) | 50 (20.9%) |
| $100,000 to $299,999 | 228 (33.9%) | 112 (46.9%) |
| $300,000 to $499,999 | 63 (9.4%) | 0 (0.0%) |
| $500,000 to $749,999 | 98 (14.6%) | 55 (23.0%) |
| $750,000 to $999,999 | 0 (0.0%) | 0 (0.0%) |
| $1,000,000 or more | 0 (0.0%) | 0 (0.0%) |
| Total | 672 (100.0%) | 239 (100.0%) |
Household Income by Mortgage Status in Pinehurst
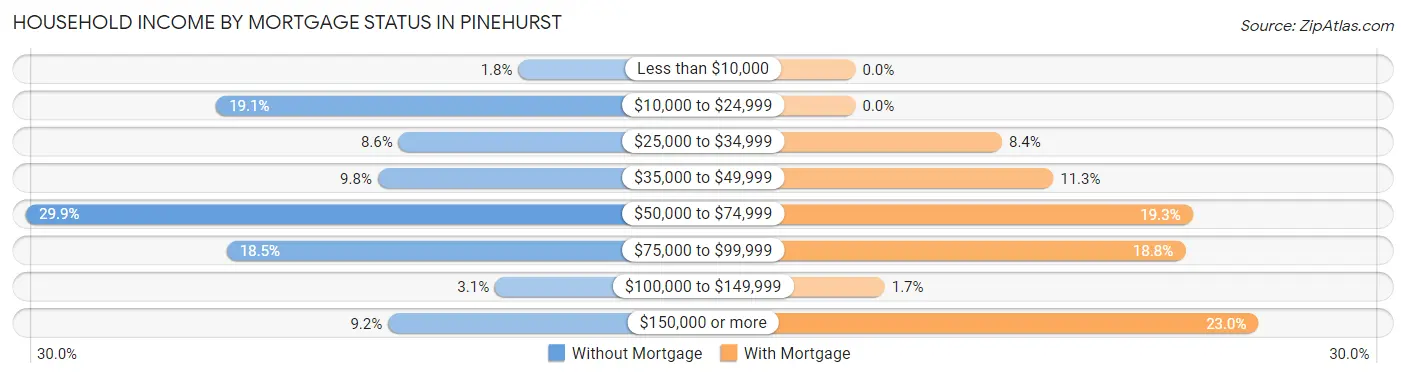
| Household Income | Without Mortgage | With Mortgage |
| Less than $10,000 | 12 (1.8%) | 0 (0.0%) |
| $10,000 to $24,999 | 128 (19.1%) | 0 (0.0%) |
| $25,000 to $34,999 | 58 (8.6%) | 20 (8.4%) |
| $35,000 to $49,999 | 66 (9.8%) | 27 (11.3%) |
| $50,000 to $74,999 | 201 (29.9%) | 46 (19.3%) |
| $75,000 to $99,999 | 124 (18.4%) | 45 (18.8%) |
| $100,000 to $149,999 | 21 (3.1%) | 4 (1.7%) |
| $150,000 or more | 62 (9.2%) | 55 (23.0%) |
| Total | 672 (100.0%) | 239 (100.0%) |
Property Value to Household Income Ratio in Pinehurst
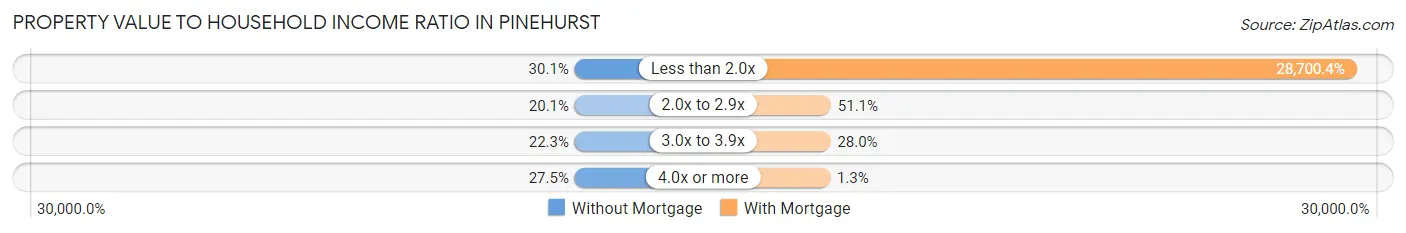
| Value-to-Income Ratio | Without Mortgage | With Mortgage |
| Less than 2.0x | 202 (30.1%) | 68,594 (28,700.4%) |
| 2.0x to 2.9x | 135 (20.1%) | 122 (51.0%) |
| 3.0x to 3.9x | 150 (22.3%) | 67 (28.0%) |
| 4.0x or more | 185 (27.5%) | 3 (1.3%) |
| Total | 672 (100.0%) | 239 (100.0%) |
Real Estate Taxes by Mortgage Status in Pinehurst
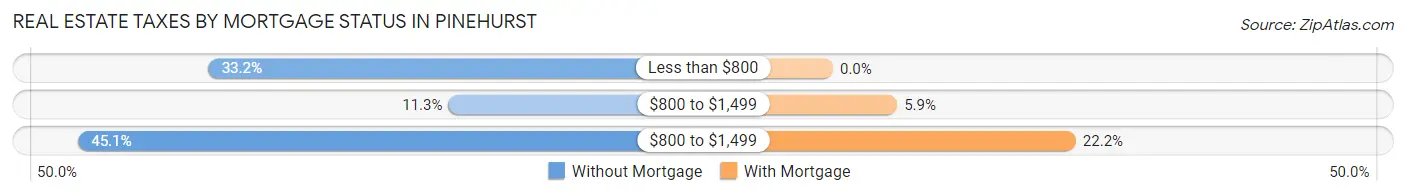
| Property Taxes | Without Mortgage | With Mortgage |
| Less than $800 | 223 (33.2%) | 0 (0.0%) |
| $800 to $1,499 | 76 (11.3%) | 14 (5.9%) |
| $800 to $1,499 | 303 (45.1%) | 53 (22.2%) |
| Total | 672 (100.0%) | 239 (100.0%) |
Health & Disability in Pinehurst
Health Insurance Coverage by Age in Pinehurst
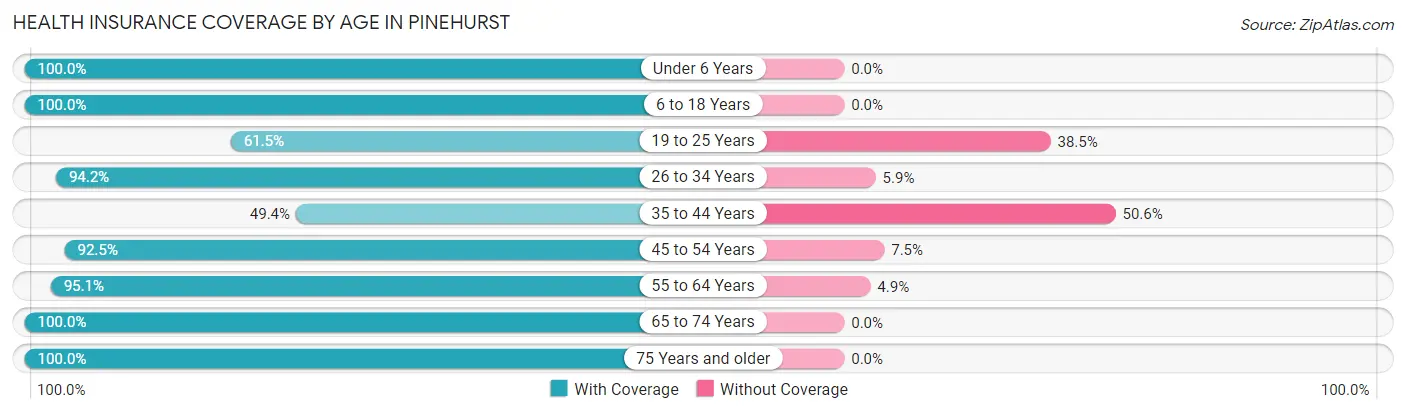
| Age Bracket | With Coverage | Without Coverage |
| Under 6 Years | 183 (100.0%) | 0 (0.0%) |
| 6 to 18 Years | 291 (100.0%) | 0 (0.0%) |
| 19 to 25 Years | 136 (61.5%) | 85 (38.5%) |
| 26 to 34 Years | 161 (94.2%) | 10 (5.9%) |
| 35 to 44 Years | 169 (49.4%) | 173 (50.6%) |
| 45 to 54 Years | 248 (92.5%) | 20 (7.5%) |
| 55 to 64 Years | 293 (95.1%) | 15 (4.9%) |
| 65 to 74 Years | 212 (100.0%) | 0 (0.0%) |
| 75 Years and older | 179 (100.0%) | 0 (0.0%) |
| Total | 1,872 (86.1%) | 303 (13.9%) |
Health Insurance Coverage by Citizenship Status in Pinehurst

| Citizenship Status | With Coverage | Without Coverage |
| Native Born | 183 (100.0%) | 0 (0.0%) |
| Foreign Born, Citizen | 291 (100.0%) | 0 (0.0%) |
| Foreign Born, not a Citizen | 136 (61.5%) | 85 (38.5%) |
Health Insurance Coverage by Household Income in Pinehurst
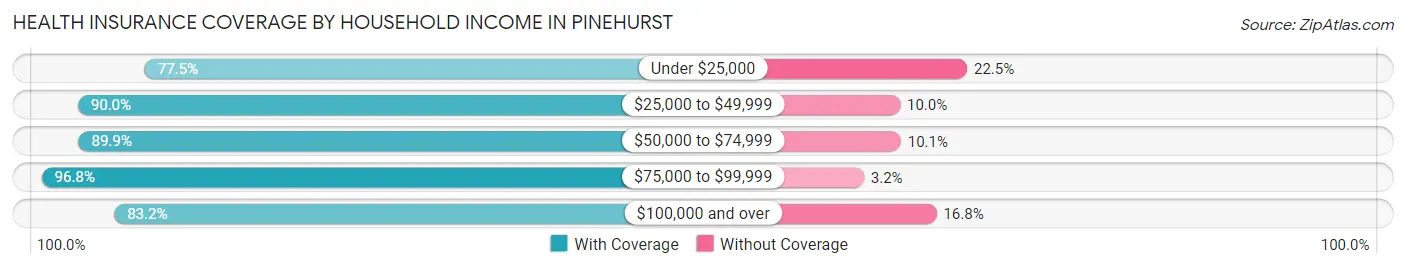
| Household Income | With Coverage | Without Coverage |
| Under $25,000 | 251 (77.5%) | 73 (22.5%) |
| $25,000 to $49,999 | 514 (90.0%) | 57 (10.0%) |
| $50,000 to $74,999 | 222 (89.9%) | 25 (10.1%) |
| $75,000 to $99,999 | 182 (96.8%) | 6 (3.2%) |
| $100,000 and over | 703 (83.2%) | 142 (16.8%) |
Public vs Private Health Insurance Coverage by Age in Pinehurst
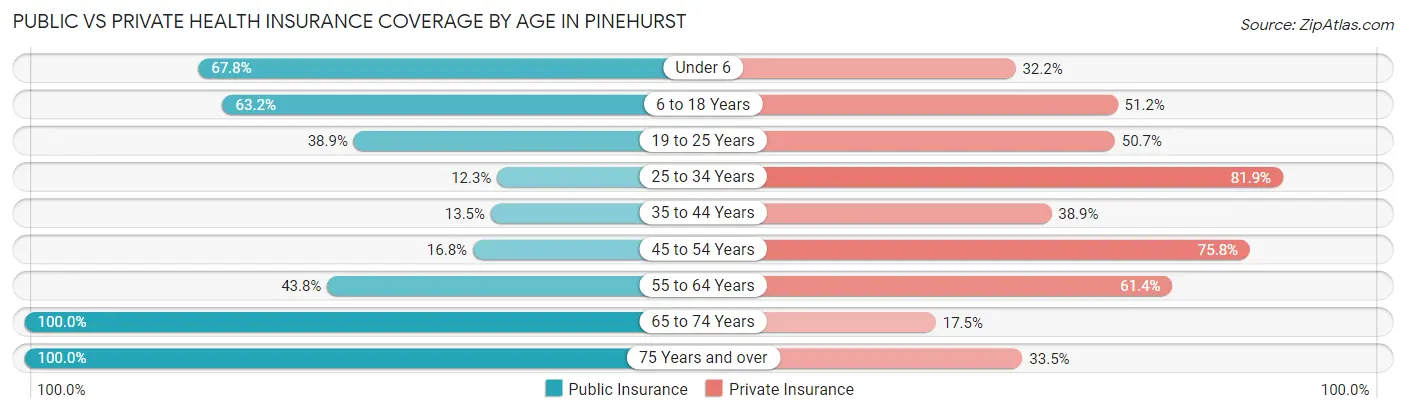
| Age Bracket | Public Insurance | Private Insurance |
| Under 6 | 124 (67.8%) | 59 (32.2%) |
| 6 to 18 Years | 184 (63.2%) | 149 (51.2%) |
| 19 to 25 Years | 86 (38.9%) | 112 (50.7%) |
| 25 to 34 Years | 21 (12.3%) | 140 (81.9%) |
| 35 to 44 Years | 46 (13.5%) | 133 (38.9%) |
| 45 to 54 Years | 45 (16.8%) | 203 (75.7%) |
| 55 to 64 Years | 135 (43.8%) | 189 (61.4%) |
| 65 to 74 Years | 212 (100.0%) | 37 (17.4%) |
| 75 Years and over | 179 (100.0%) | 60 (33.5%) |
| Total | 1,032 (47.4%) | 1,082 (49.7%) |
Disability Status by Sex by Age in Pinehurst

| Age Bracket | Male | Female |
| Under 5 Years | 0 (0.0%) | 27 (26.5%) |
| 5 to 17 Years | 51 (27.0%) | 13 (10.8%) |
| 18 to 34 Years | 77 (30.8%) | 17 (12.0%) |
| 35 to 64 Years | 136 (29.3%) | 137 (30.2%) |
| 65 to 74 Years | 34 (36.6%) | 56 (47.1%) |
| 75 Years and over | 33 (46.5%) | 90 (83.3%) |
Disability Class by Sex by Age in Pinehurst
Disability Class: Hearing Difficulty
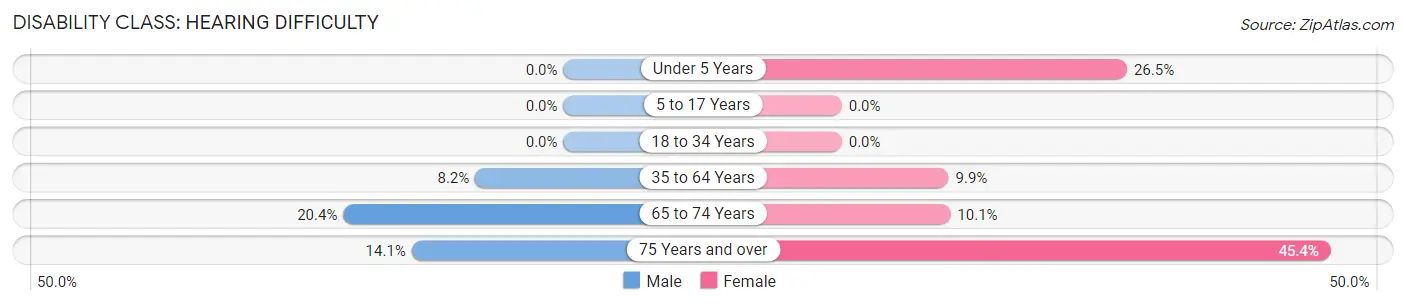
| Age Bracket | Male | Female |
| Under 5 Years | 0 (0.0%) | 27 (26.5%) |
| 5 to 17 Years | 0 (0.0%) | 0 (0.0%) |
| 18 to 34 Years | 0 (0.0%) | 0 (0.0%) |
| 35 to 64 Years | 38 (8.2%) | 45 (9.9%) |
| 65 to 74 Years | 19 (20.4%) | 12 (10.1%) |
| 75 Years and over | 10 (14.1%) | 49 (45.4%) |
Disability Class: Vision Difficulty
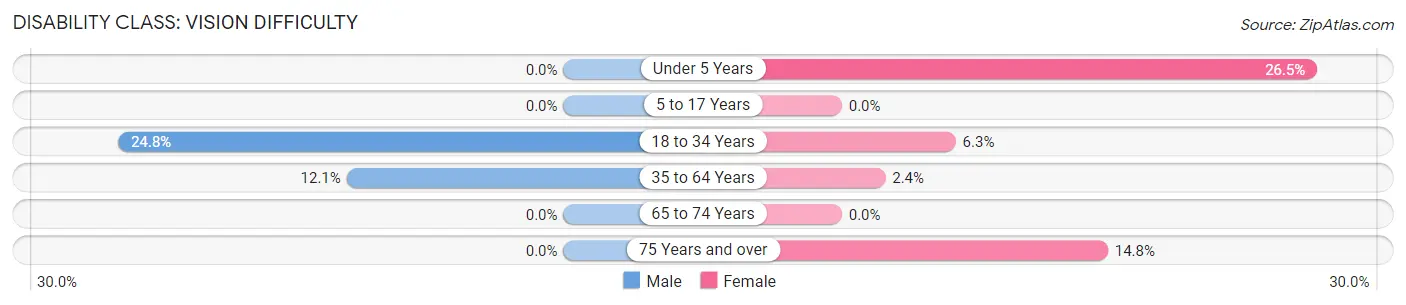
| Age Bracket | Male | Female |
| Under 5 Years | 0 (0.0%) | 27 (26.5%) |
| 5 to 17 Years | 0 (0.0%) | 0 (0.0%) |
| 18 to 34 Years | 62 (24.8%) | 9 (6.3%) |
| 35 to 64 Years | 56 (12.1%) | 11 (2.4%) |
| 65 to 74 Years | 0 (0.0%) | 0 (0.0%) |
| 75 Years and over | 0 (0.0%) | 16 (14.8%) |
Disability Class: Cognitive Difficulty
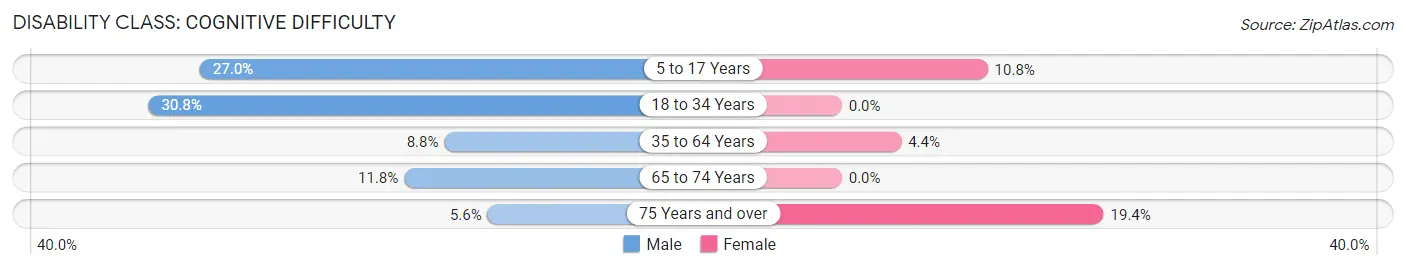
| Age Bracket | Male | Female |
| 5 to 17 Years | 51 (27.0%) | 13 (10.8%) |
| 18 to 34 Years | 77 (30.8%) | 0 (0.0%) |
| 35 to 64 Years | 41 (8.8%) | 20 (4.4%) |
| 65 to 74 Years | 11 (11.8%) | 0 (0.0%) |
| 75 Years and over | 4 (5.6%) | 21 (19.4%) |
Disability Class: Ambulatory Difficulty
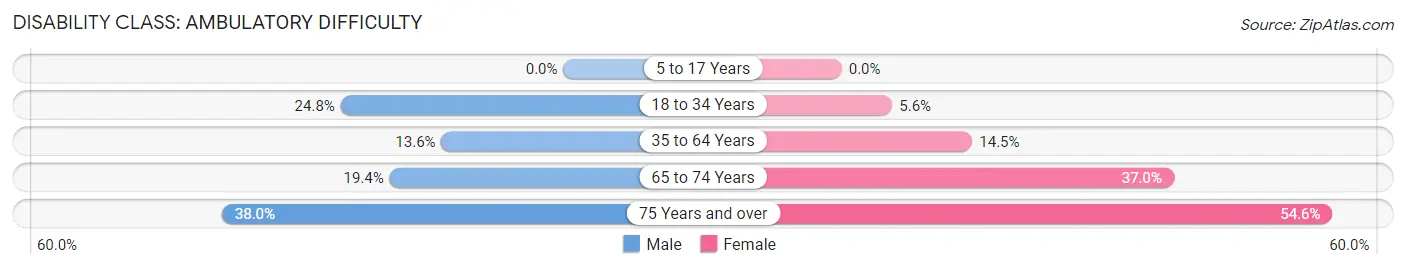
| Age Bracket | Male | Female |
| 5 to 17 Years | 0 (0.0%) | 0 (0.0%) |
| 18 to 34 Years | 62 (24.8%) | 8 (5.6%) |
| 35 to 64 Years | 63 (13.6%) | 66 (14.5%) |
| 65 to 74 Years | 18 (19.4%) | 44 (37.0%) |
| 75 Years and over | 27 (38.0%) | 59 (54.6%) |
Disability Class: Self-Care Difficulty
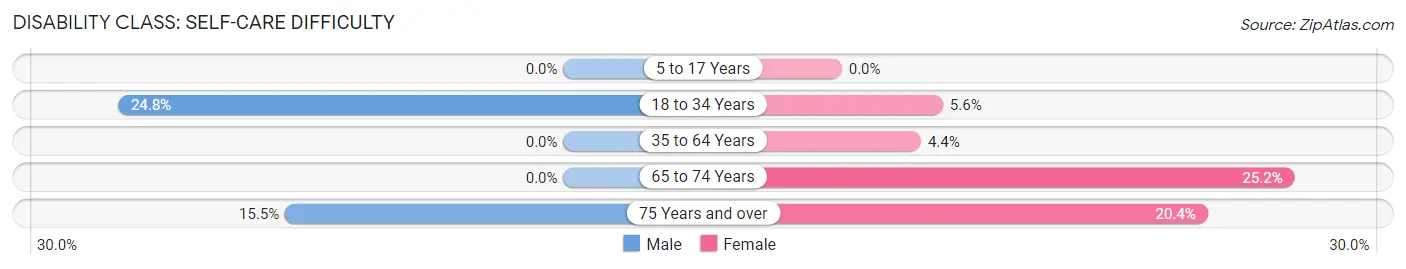
| Age Bracket | Male | Female |
| 5 to 17 Years | 0 (0.0%) | 0 (0.0%) |
| 18 to 34 Years | 62 (24.8%) | 8 (5.6%) |
| 35 to 64 Years | 0 (0.0%) | 20 (4.4%) |
| 65 to 74 Years | 0 (0.0%) | 30 (25.2%) |
| 75 Years and over | 11 (15.5%) | 22 (20.4%) |
Technology Access in Pinehurst
Computing Device Access in Pinehurst
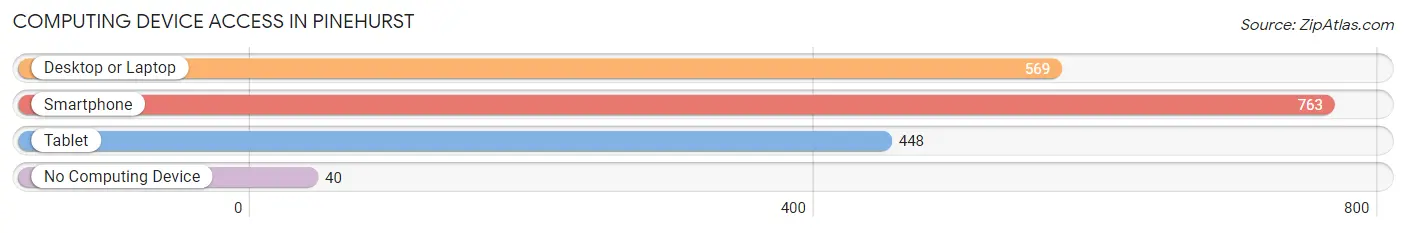
| Device Type | # Households | % Households |
| Desktop or Laptop | 569 | 64.7% |
| Smartphone | 763 | 86.8% |
| Tablet | 448 | 51.0% |
| No Computing Device | 40 | 4.5% |
| Total | 879 | 100.0% |
Internet Access in Pinehurst
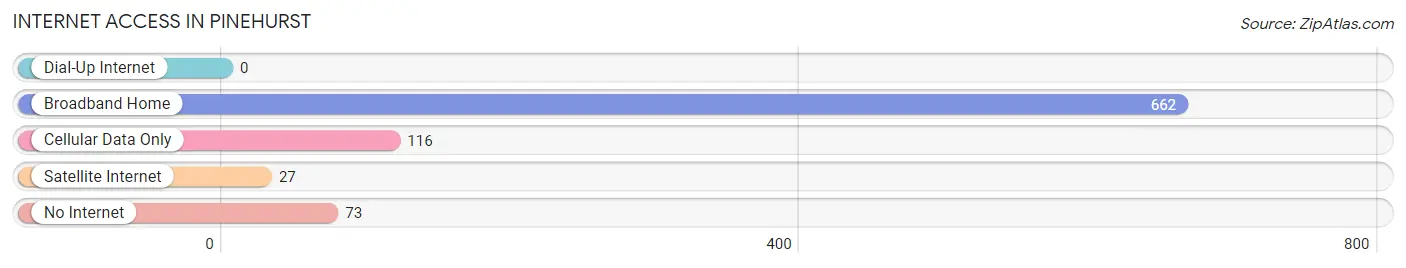
| Internet Type | # Households | % Households |
| Dial-Up Internet | 0 | 0.0% |
| Broadband Home | 662 | 75.3% |
| Cellular Data Only | 116 | 13.2% |
| Satellite Internet | 27 | 3.1% |
| No Internet | 73 | 8.3% |
| Total | 879 | 100.0% |
Pinehurst Summary
Pinehurst, Texas is a small town located in Montgomery County, Texas. It is situated about 40 miles north of Houston and is part of the Houston–The Woodlands–Sugar Land metropolitan area. The town was founded in 1881 and has a population of approximately 1,500 people.
History
Pinehurst was founded in 1881 by a group of settlers from the nearby town of Conroe. The settlers were looking for a place to settle and start a new life. The town was named after the abundance of pine trees in the area. The first post office was established in 1883 and the town was officially incorporated in 1884.
The town grew slowly but steadily over the years. In the early 1900s, the town was home to several businesses, including a general store, a blacksmith shop, a cotton gin, and a sawmill. The town also had a school, a church, and a few other businesses.
In the 1920s, the town began to experience a period of growth. The population increased from around 500 to over 1,000. This growth was due to the discovery of oil in the area. The oil boom brought new businesses and jobs to the town.
In the 1950s, the town experienced another period of growth. This was due to the construction of Interstate 45, which connected Pinehurst to Houston. The town also benefited from the growth of the Houston metropolitan area.
Geography
Pinehurst is located in Montgomery County, Texas. It is situated about 40 miles north of Houston and is part of the Houston–The Woodlands–Sugar Land metropolitan area. The town is located in the East Texas Piney Woods region. The terrain is mostly flat with some rolling hills. The town is surrounded by forests of pine trees.
The climate in Pinehurst is humid subtropical. The summers are hot and humid with temperatures reaching up to 95 degrees Fahrenheit. The winters are mild with temperatures rarely dropping below freezing.
Economy
The economy of Pinehurst is largely based on the oil and gas industry. The town is home to several oil and gas companies, including Chevron, ExxonMobil, and Shell. The town also has several small businesses, including restaurants, retail stores, and auto repair shops.
The town is also home to several manufacturing companies, including a paper mill and a plastics factory. The town also has a few farms that produce hay, corn, and other crops.
Demographics
As of the 2010 census, the population of Pinehurst was 1,521. The racial makeup of the town was 94.3% White, 1.2% African American, 0.3% Native American, 0.7% Asian, 0.1% Pacific Islander, 1.7% from other races, and 1.9% from two or more races. Hispanic or Latino of any race were 4.3% of the population.
The median household income in Pinehurst was $45,938. The per capita income was $20,945. About 11.3% of the population was below the poverty line.
Conclusion
Pinehurst, Texas is a small town located in Montgomery County, Texas. It is situated about 40 miles north of Houston and is part of the Houston–The Woodlands–Sugar Land metropolitan area. The town was founded in 1881 and has a population of approximately 1,500 people. The economy of Pinehurst is largely based on the oil and gas industry. The town also has several small businesses, including restaurants, retail stores, and auto repair shops. The racial makeup of the town is 94.3% White, 1.2% African American, 0.3% Native American, 0.7% Asian, 0.1% Pacific Islander, 1.7% from other races, and 1.9% from two or more races. The median household income in Pinehurst was $45,938. The per capita income was $20,945. About 11.3% of the population was below the poverty line.
Common Questions
What is Per Capita Income in Pinehurst?
Per Capita income in Pinehurst is $30,010.
What is the Median Family Income in Pinehurst?
Median Family Income in Pinehurst is $58,558.
What is the Median Household income in Pinehurst?
Median Household Income in Pinehurst is $49,125.
What is Income or Wage Gap in Pinehurst?
Income or Wage Gap in Pinehurst is 69.8%.
Women in Pinehurst earn 30.2 cents for every dollar earned by a man.
What is Inequality or Gini Index in Pinehurst?
Inequality or Gini Index in Pinehurst is 0.48.
What is the Total Population of Pinehurst?
Total Population of Pinehurst is 2,237.
What is the Total Male Population of Pinehurst?
Total Male Population of Pinehurst is 1,143.
What is the Total Female Population of Pinehurst?
Total Female Population of Pinehurst is 1,094.
What is the Ratio of Males per 100 Females in Pinehurst?
There are 104.48 Males per 100 Females in Pinehurst.
What is the Ratio of Females per 100 Males in Pinehurst?
There are 95.71 Females per 100 Males in Pinehurst.
What is the Median Population Age in Pinehurst?
Median Population Age in Pinehurst is 42.7 Years.
What is the Average Family Size in Pinehurst
Average Family Size in Pinehurst is 3.2 People.
What is the Average Household Size in Pinehurst
Average Household Size in Pinehurst is 2.5 People.
How Large is the Labor Force in Pinehurst?
There are 947 People in the Labor Forcein in Pinehurst.
What is the Percentage of People in the Labor Force in Pinehurst?
52.6% of People are in the Labor Force in Pinehurst.
What is the Unemployment Rate in Pinehurst?
Unemployment Rate in Pinehurst is 2.7%.