Pilot Point, TX Map & Demographics
Pilot Point Map
Pilot Point Overview
$33,244
PER CAPITA INCOME
$95,497
AVG FAMILY INCOME
$68,676
AVG HOUSEHOLD INCOME
44.7%
WAGE / INCOME GAP [ % ]
55.3¢/ $1
WAGE / INCOME GAP [ $ ]
0.41
INEQUALITY / GINI INDEX
4,509
TOTAL POPULATION
1,960
MALE POPULATION
2,549
FEMALE POPULATION
76.89
MALES / 100 FEMALES
130.05
FEMALES / 100 MALES
43.1
MEDIAN AGE
3.4
AVG FAMILY SIZE
2.6
AVG HOUSEHOLD SIZE
2,319
LABOR FORCE [ PEOPLE ]
63.7%
PERCENT IN LABOR FORCE
7.9%
UNEMPLOYMENT RATE
Pilot Point Zip Codes
Pilot Point Area Codes
Income in Pilot Point
Income Overview in Pilot Point
Per Capita Income in Pilot Point is $33,244, while median incomes of families and households are $95,497 and $68,676 respectively.
| Characteristic | Number | Measure |
| Per Capita Income | 4,509 | $33,244 |
| Median Family Income | 1,056 | $95,497 |
| Mean Family Income | 1,056 | $112,465 |
| Median Household Income | 1,706 | $68,676 |
| Mean Household Income | 1,706 | $86,199 |
| Income Deficit | 1,056 | $0 |
| Wage / Income Gap (%) | 4,509 | 44.72% |
| Wage / Income Gap ($) | 4,509 | 55.28¢ per $1 |
| Gini / Inequality Index | 4,509 | 0.41 |
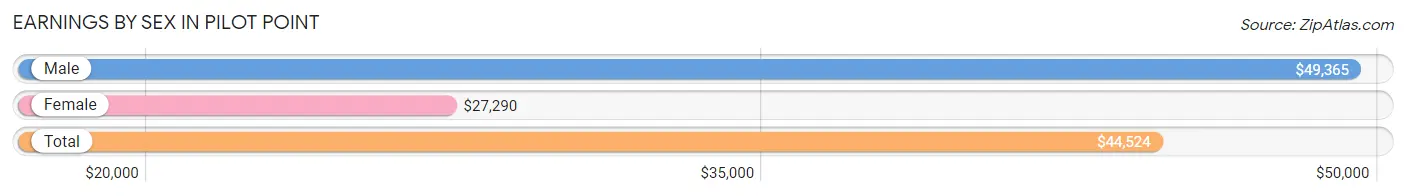
Earnings by Sex in Pilot Point
Average Earnings in Pilot Point are $44,524, $49,365 for men and $27,290 for women, a difference of 44.7%.
| Sex | Number | Average Earnings |
| Male | 1,251 (52.8%) | $49,365 |
| Female | 1,117 (47.2%) | $27,290 |
| Total | 2,368 (100.0%) | $44,524 |
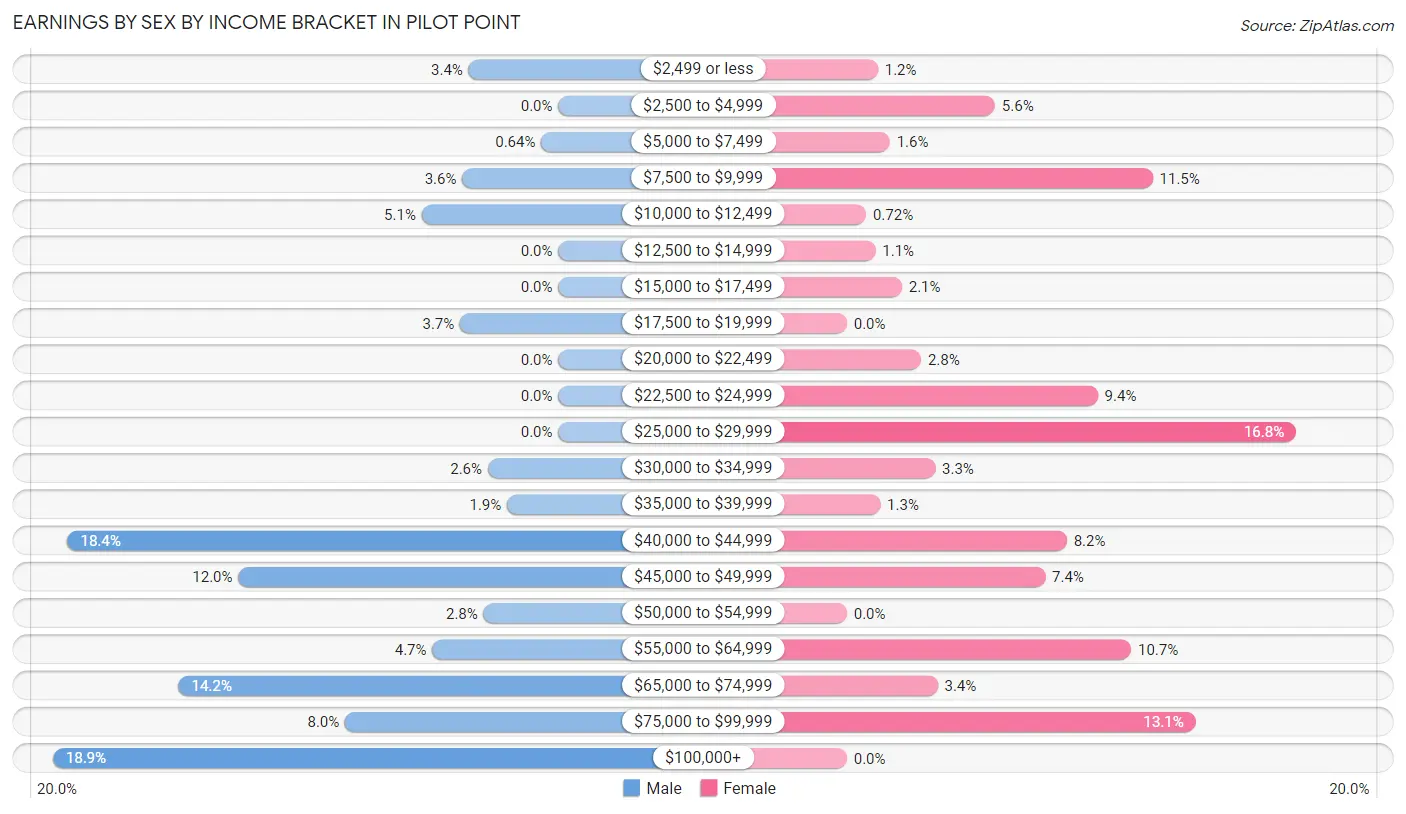
Earnings by Sex by Income Bracket in Pilot Point
The most common earnings brackets in Pilot Point are $100,000+ for men (237 | 18.9%) and $25,000 to $29,999 for women (188 | 16.8%).
| Income | Male | Female |
| $2,499 or less | 42 (3.4%) | 13 (1.2%) |
| $2,500 to $4,999 | 0 (0.0%) | 62 (5.6%) |
| $5,000 to $7,499 | 8 (0.6%) | 18 (1.6%) |
| $7,500 to $9,999 | 45 (3.6%) | 128 (11.5%) |
| $10,000 to $12,499 | 64 (5.1%) | 8 (0.7%) |
| $12,500 to $14,999 | 0 (0.0%) | 12 (1.1%) |
| $15,000 to $17,499 | 0 (0.0%) | 23 (2.1%) |
| $17,500 to $19,999 | 46 (3.7%) | 0 (0.0%) |
| $20,000 to $22,499 | 0 (0.0%) | 31 (2.8%) |
| $22,500 to $24,999 | 0 (0.0%) | 105 (9.4%) |
| $25,000 to $29,999 | 0 (0.0%) | 188 (16.8%) |
| $30,000 to $34,999 | 33 (2.6%) | 37 (3.3%) |
| $35,000 to $39,999 | 24 (1.9%) | 14 (1.3%) |
| $40,000 to $44,999 | 230 (18.4%) | 92 (8.2%) |
| $45,000 to $49,999 | 150 (12.0%) | 83 (7.4%) |
| $50,000 to $54,999 | 35 (2.8%) | 0 (0.0%) |
| $55,000 to $64,999 | 59 (4.7%) | 119 (10.6%) |
| $65,000 to $74,999 | 178 (14.2%) | 38 (3.4%) |
| $75,000 to $99,999 | 100 (8.0%) | 146 (13.1%) |
| $100,000+ | 237 (18.9%) | 0 (0.0%) |
| Total | 1,251 (100.0%) | 1,117 (100.0%) |
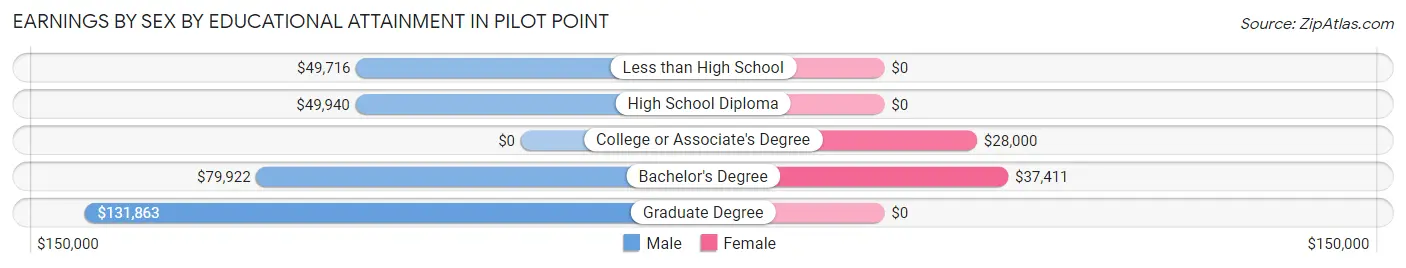
Earnings by Sex by Educational Attainment in Pilot Point
Average earnings in Pilot Point are $63,361 for men and $42,386 for women, a difference of 33.1%. Men with an educational attainment of graduate degree enjoy the highest average annual earnings of $131,863, while those with less than high school education earn the least with $49,716. Women with an educational attainment of bachelor's degree earn the most with the average annual earnings of $37,411, while those with college or associate's degree education have the smallest earnings of $28,000.
| Educational Attainment | Male Income | Female Income |
| Less than High School | $49,716 | $0 |
| High School Diploma | $49,940 | $0 |
| College or Associate's Degree | - | - |
| Bachelor's Degree | $79,922 | $37,411 |
| Graduate Degree | $131,863 | $0 |
| Total | $63,361 | $42,386 |
Family Income in Pilot Point
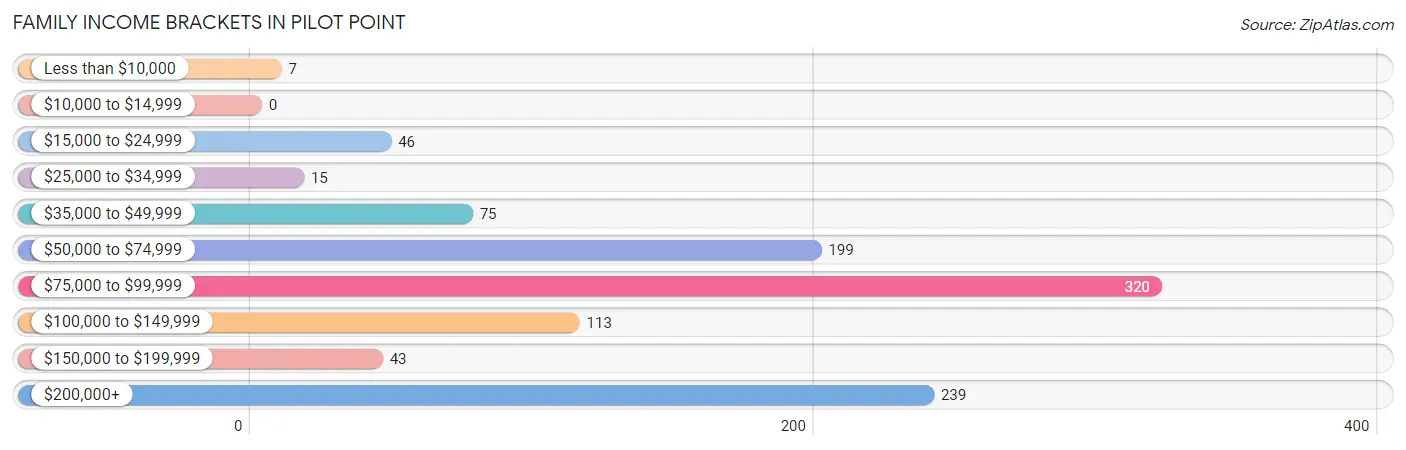
Family Income Brackets in Pilot Point
According to the Pilot Point family income data, there are 320 families falling into the $75,000 to $99,999 income range, which is the most common income bracket and makes up 30.3% of all families.
| Income Bracket | # Families | % Families |
| Less than $10,000 | 7 | 0.7% |
| $10,000 to $14,999 | 0 | 0.0% |
| $15,000 to $24,999 | 46 | 4.4% |
| $25,000 to $34,999 | 15 | 1.4% |
| $35,000 to $49,999 | 75 | 7.1% |
| $50,000 to $74,999 | 199 | 18.8% |
| $75,000 to $99,999 | 320 | 30.3% |
| $100,000 to $149,999 | 113 | 10.7% |
| $150,000 to $199,999 | 43 | 4.1% |
| $200,000+ | 239 | 22.6% |
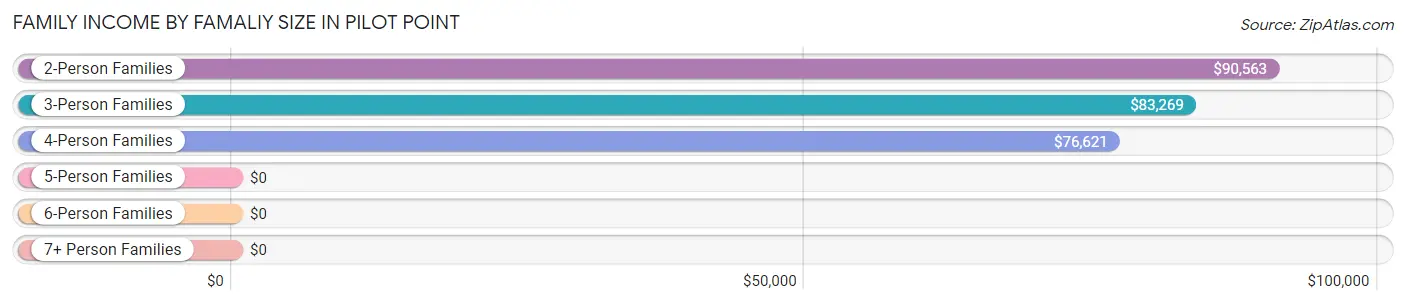
Family Income by Famaliy Size in Pilot Point
2-person families (185 | 17.5%) account for the highest median family income in Pilot Point with $90,563 per family, while 2-person families (185 | 17.5%) have the highest median income of $45,282 per family member.
| Income Bracket | # Families | Median Income |
| 2-Person Families | 185 (17.5%) | $90,563 |
| 3-Person Families | 490 (46.4%) | $83,269 |
| 4-Person Families | 129 (12.2%) | $76,621 |
| 5-Person Families | 201 (19.0%) | $0 |
| 6-Person Families | 51 (4.8%) | $0 |
| 7+ Person Families | 0 (0.0%) | $0 |
| Total | 1,056 (100.0%) | $95,497 |
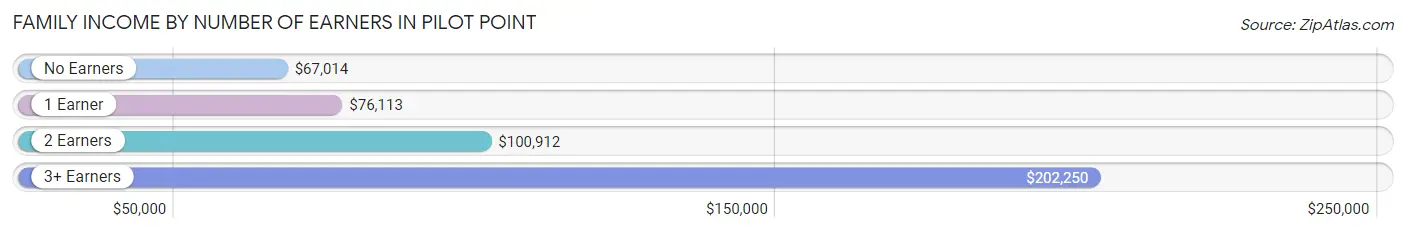
Family Income by Number of Earners in Pilot Point
The median family income in Pilot Point is $95,497, with families comprising 3+ earners (244) having the highest median family income of $202,250, while families with no earners (69) have the lowest median family income of $67,014, accounting for 23.1% and 6.5% of families, respectively.
| Number of Earners | # Families | Median Income |
| No Earners | 69 (6.5%) | $67,014 |
| 1 Earner | 421 (39.9%) | $76,113 |
| 2 Earners | 322 (30.5%) | $100,912 |
| 3+ Earners | 244 (23.1%) | $202,250 |
| Total | 1,056 (100.0%) | $95,497 |
Household Income in Pilot Point
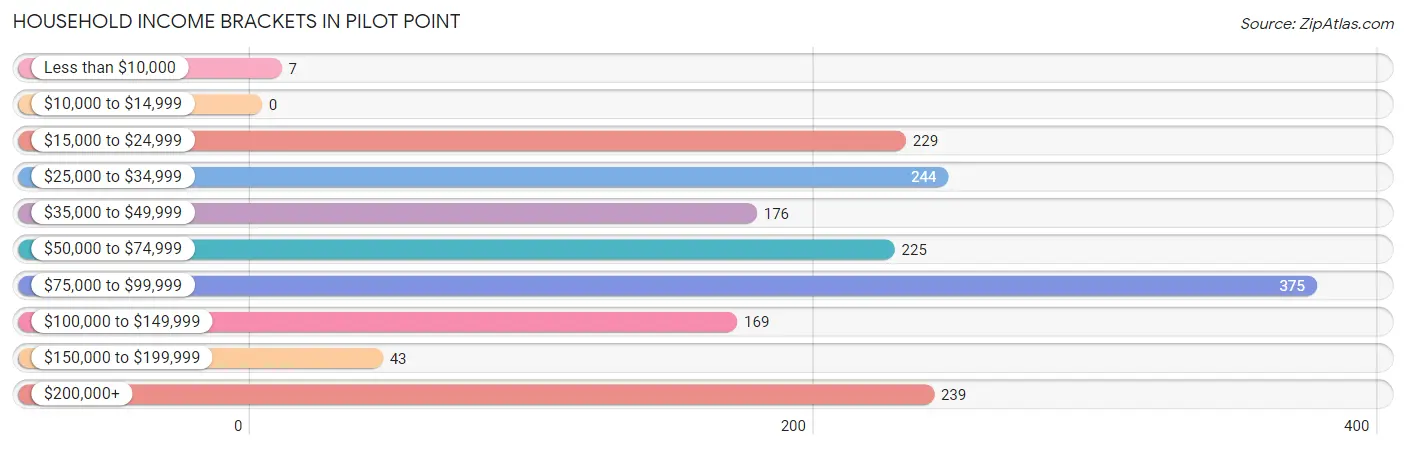
Household Income Brackets in Pilot Point
With 375 households falling in the category, the $75,000 to $99,999 income range is the most frequent in Pilot Point, accounting for 22.0% of all households.
| Income Bracket | # Households | % Households |
| Less than $10,000 | 7 | 0.4% |
| $10,000 to $14,999 | 0 | 0.0% |
| $15,000 to $24,999 | 229 | 13.4% |
| $25,000 to $34,999 | 244 | 14.3% |
| $35,000 to $49,999 | 176 | 10.3% |
| $50,000 to $74,999 | 225 | 13.2% |
| $75,000 to $99,999 | 375 | 22.0% |
| $100,000 to $149,999 | 169 | 9.9% |
| $150,000 to $199,999 | 43 | 2.5% |
| $200,000+ | 239 | 14.0% |
Household Income by Householder Age in Pilot Point
The median household income in Pilot Point is $68,676, with the highest median household income of $95,750 found in the 45 to 64 years age bracket for the primary householder. A total of 689 households (40.4%) fall into this category. Meanwhile, the 15 to 24 years age bracket for the primary householder has the lowest median household income of $0, with 71 households (4.2%) in this group.
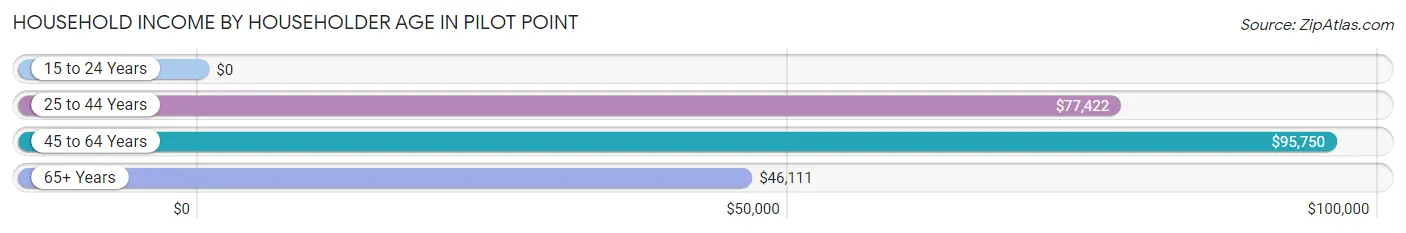
| Income Bracket | # Households | Median Income |
| 15 to 24 Years | 71 (4.2%) | $0 |
| 25 to 44 Years | 424 (24.8%) | $77,422 |
| 45 to 64 Years | 689 (40.4%) | $95,750 |
| 65+ Years | 522 (30.6%) | $46,111 |
| Total | 1,706 (100.0%) | $68,676 |
Poverty in Pilot Point
Income Below Poverty by Sex and Age in Pilot Point
With 9.7% poverty level for males and 8.0% for females among the residents of Pilot Point, under 5 year old males and under 5 year old females are the most vulnerable to poverty, with 67 males (47.2%) and 110 females (47.8%) in their respective age groups living below the poverty level.
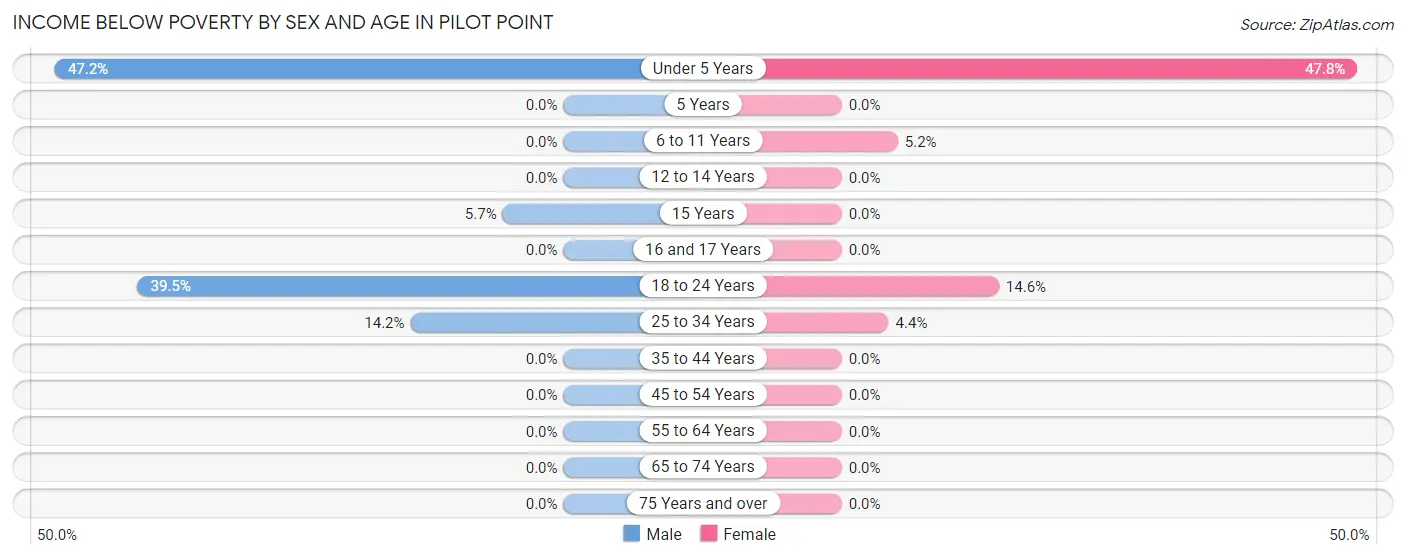
| Age Bracket | Male | Female |
| Under 5 Years | 67 (47.2%) | 110 (47.8%) |
| 5 Years | 0 (0.0%) | 0 (0.0%) |
| 6 to 11 Years | 0 (0.0%) | 9 (5.2%) |
| 12 to 14 Years | 0 (0.0%) | 0 (0.0%) |
| 15 Years | 7 (5.7%) | 0 (0.0%) |
| 16 and 17 Years | 0 (0.0%) | 0 (0.0%) |
| 18 to 24 Years | 64 (39.5%) | 64 (14.6%) |
| 25 to 34 Years | 46 (14.2%) | 13 (4.3%) |
| 35 to 44 Years | 0 (0.0%) | 0 (0.0%) |
| 45 to 54 Years | 0 (0.0%) | 0 (0.0%) |
| 55 to 64 Years | 0 (0.0%) | 0 (0.0%) |
| 65 to 74 Years | 0 (0.0%) | 0 (0.0%) |
| 75 Years and over | 0 (0.0%) | 0 (0.0%) |
| Total | 184 (9.7%) | 196 (8.0%) |
Income Above Poverty by Sex and Age in Pilot Point
According to the poverty statistics in Pilot Point, males aged 6 to 11 years and females aged 5 years are the age groups that are most secure financially, with 100.0% of males and 100.0% of females in these age groups living above the poverty line.
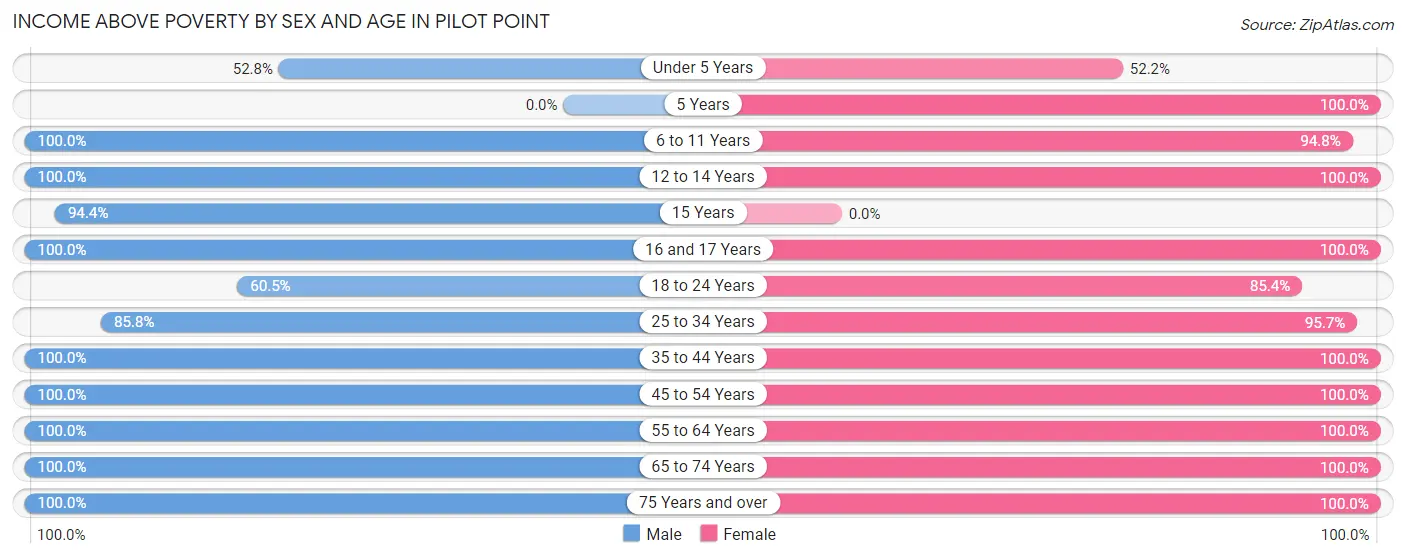
| Age Bracket | Male | Female |
| Under 5 Years | 75 (52.8%) | 120 (52.2%) |
| 5 Years | 0 (0.0%) | 16 (100.0%) |
| 6 to 11 Years | 36 (100.0%) | 164 (94.8%) |
| 12 to 14 Years | 105 (100.0%) | 43 (100.0%) |
| 15 Years | 117 (94.4%) | 0 (0.0%) |
| 16 and 17 Years | 2 (100.0%) | 4 (100.0%) |
| 18 to 24 Years | 98 (60.5%) | 375 (85.4%) |
| 25 to 34 Years | 278 (85.8%) | 286 (95.7%) |
| 35 to 44 Years | 56 (100.0%) | 170 (100.0%) |
| 45 to 54 Years | 556 (100.0%) | 455 (100.0%) |
| 55 to 64 Years | 194 (100.0%) | 128 (100.0%) |
| 65 to 74 Years | 75 (100.0%) | 198 (100.0%) |
| 75 Years and over | 128 (100.0%) | 304 (100.0%) |
| Total | 1,720 (90.3%) | 2,263 (92.0%) |
Income Below Poverty Among Married-Couple Families in Pilot Point
The poverty statistics for married-couple families in Pilot Point show that 4.8% or 46 of the total 962 families live below the poverty line. Families with 3 or 4 children have the highest poverty rate of 47.4%, comprising of 46 families. On the other hand, families with no children have the lowest poverty rate of 0.0%, which includes 0 families.
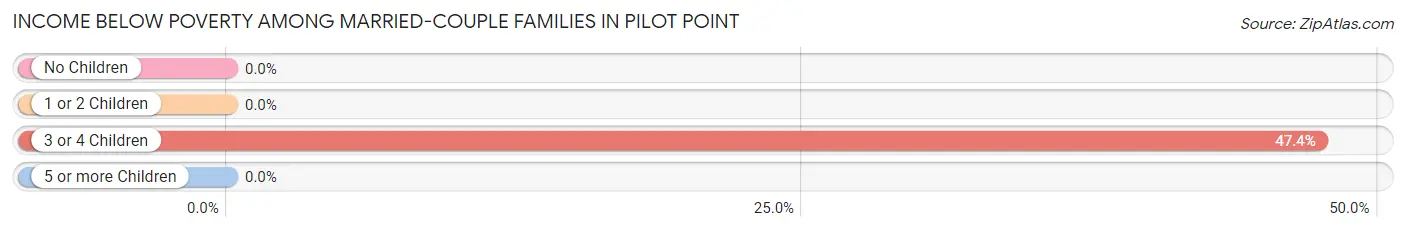
| Children | Above Poverty | Below Poverty |
| No Children | 397 (100.0%) | 0 (0.0%) |
| 1 or 2 Children | 468 (100.0%) | 0 (0.0%) |
| 3 or 4 Children | 51 (52.6%) | 46 (47.4%) |
| 5 or more Children | 0 (0.0%) | 0 (0.0%) |
| Total | 916 (95.2%) | 46 (4.8%) |
Income Below Poverty Among Single-Parent Households in Pilot Point
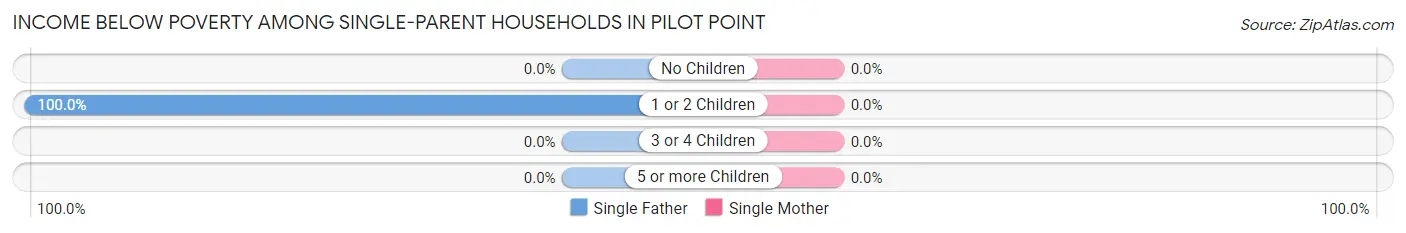
| Children | Single Father | Single Mother |
| No Children | 0 (0.0%) | 0 (0.0%) |
| 1 or 2 Children | 7 (100.0%) | 0 (0.0%) |
| 3 or 4 Children | 0 (0.0%) | 0 (0.0%) |
| 5 or more Children | 0 (0.0%) | 0 (0.0%) |
| Total | 7 (17.5%) | 0 (0.0%) |
Income Below Poverty Among Married-Couple vs Single-Parent Households in Pilot Point
The poverty data for Pilot Point shows that 46 of the married-couple family households (4.8%) and 7 of the single-parent households (7.4%) are living below the poverty level. Within the married-couple family households, those with 3 or 4 children have the highest poverty rate, with 46 households (47.4%) falling below the poverty line. Among the single-parent households, those with 1 or 2 children have the highest poverty rate, with 7 household (31.8%) living below poverty.
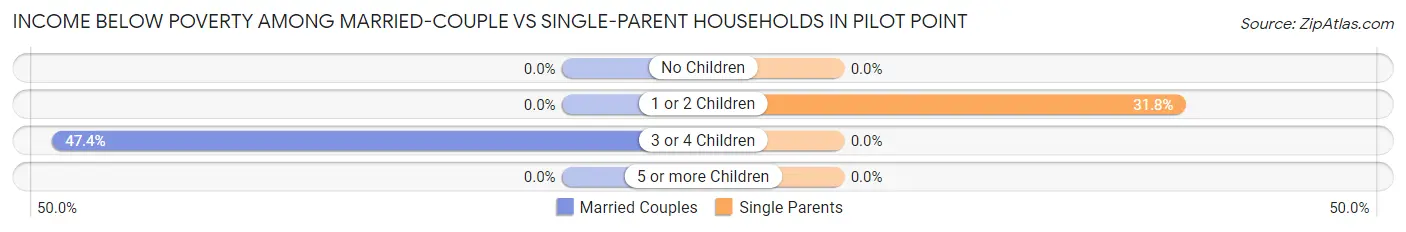
| Children | Married-Couple Families | Single-Parent Households |
| No Children | 0 (0.0%) | 0 (0.0%) |
| 1 or 2 Children | 0 (0.0%) | 7 (31.8%) |
| 3 or 4 Children | 46 (47.4%) | 0 (0.0%) |
| 5 or more Children | 0 (0.0%) | 0 (0.0%) |
| Total | 46 (4.8%) | 7 (7.4%) |
Race in Pilot Point
The most populous races in Pilot Point are White / Caucasian (3,291 | 73.0%), Hispanic or Latino (1,628 | 36.1%), and Two or more Races (981 | 21.8%).
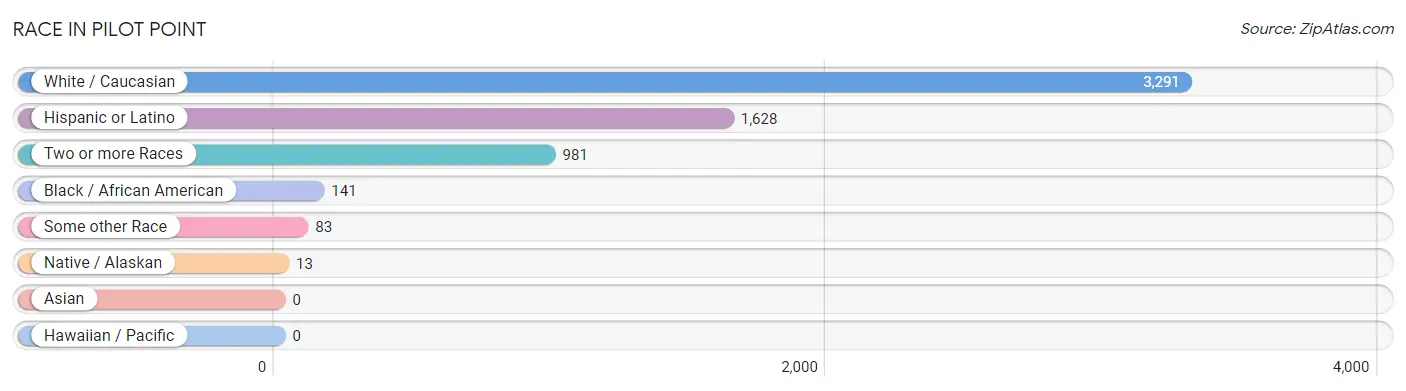
| Race | # Population | % Population |
| Asian | 0 | 0.0% |
| Black / African American | 141 | 3.1% |
| Hawaiian / Pacific | 0 | 0.0% |
| Hispanic or Latino | 1,628 | 36.1% |
| Native / Alaskan | 13 | 0.3% |
| White / Caucasian | 3,291 | 73.0% |
| Two or more Races | 981 | 21.8% |
| Some other Race | 83 | 1.8% |
| Total | 4,509 | 100.0% |
Ancestry in Pilot Point
The most populous ancestries reported in Pilot Point are Mexican (1,604 | 35.6%), German (545 | 12.1%), Irish (485 | 10.8%), English (438 | 9.7%), and French (124 | 2.8%), together accounting for 70.9% of all Pilot Point residents.
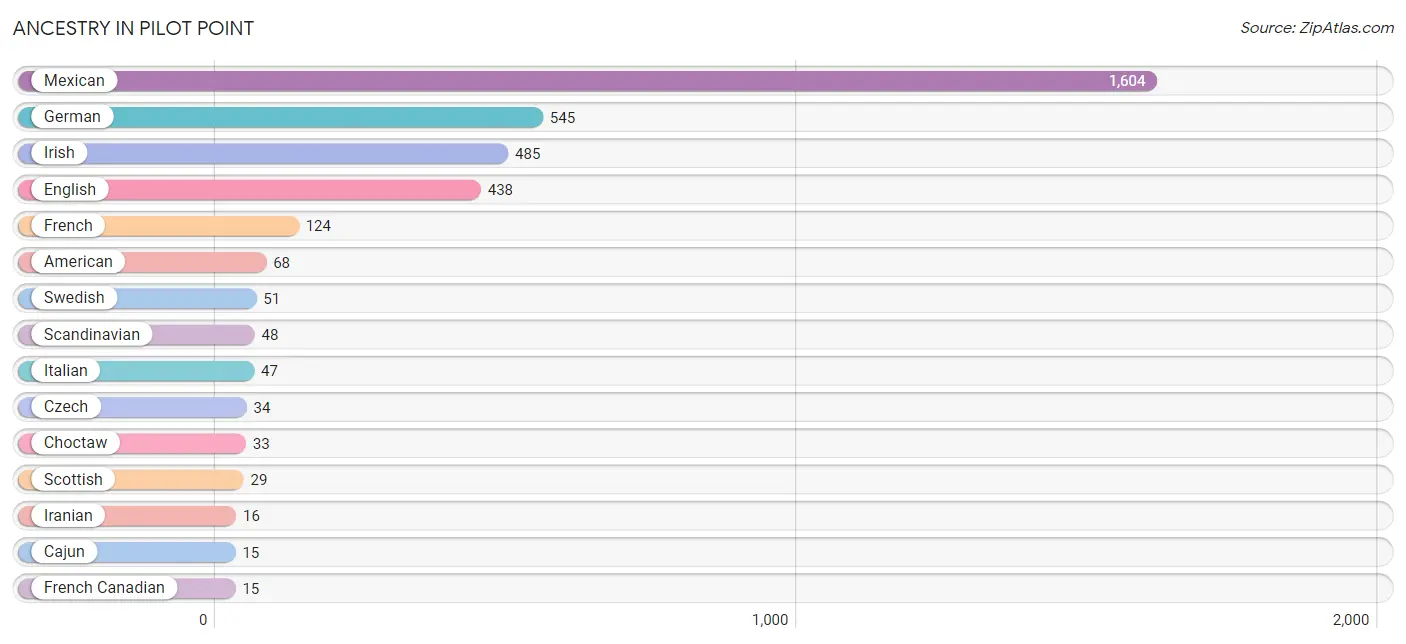
| Ancestry | # Population | % Population |
| American | 68 | 1.5% |
| Austrian | 14 | 0.3% |
| Cajun | 15 | 0.3% |
| Choctaw | 33 | 0.7% |
| Czech | 34 | 0.7% |
| English | 438 | 9.7% |
| European | 4 | 0.1% |
| French | 124 | 2.8% |
| French Canadian | 15 | 0.3% |
| German | 545 | 12.1% |
| Hungarian | 14 | 0.3% |
| Iranian | 16 | 0.4% |
| Irish | 485 | 10.8% |
| Italian | 47 | 1.0% |
| Mexican | 1,604 | 35.6% |
| Norwegian | 11 | 0.2% |
| Scandinavian | 48 | 1.1% |
| Scottish | 29 | 0.6% |
| Swedish | 51 | 1.1% |
| Welsh | 12 | 0.3% | View All 20 Rows |
Immigrants in Pilot Point
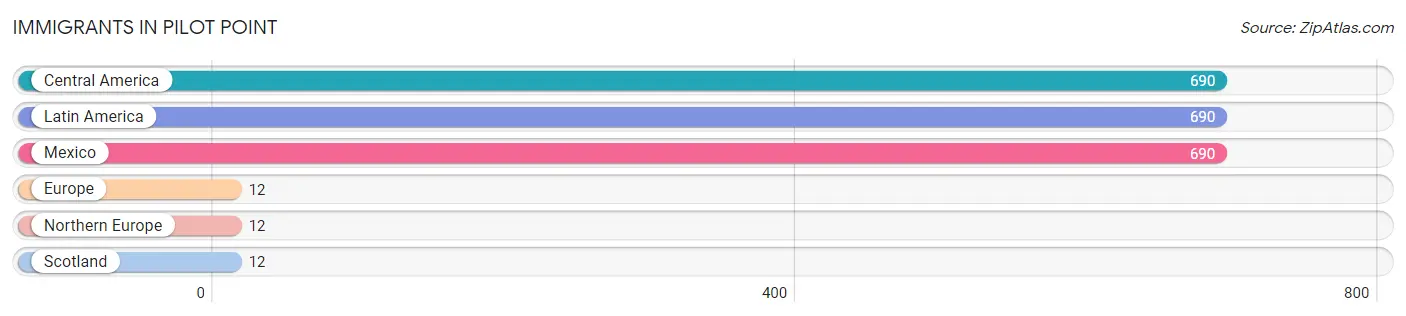
The most numerous immigrant groups reported in Pilot Point came from Central America (690 | 15.3%), Latin America (690 | 15.3%), Mexico (690 | 15.3%), Europe (12 | 0.3%), and Northern Europe (12 | 0.3%), together accounting for 46.4% of all Pilot Point residents.
| Immigration Origin | # Population | % Population |
| Central America | 690 | 15.3% |
| Europe | 12 | 0.3% |
| Latin America | 690 | 15.3% |
| Mexico | 690 | 15.3% |
| Northern Europe | 12 | 0.3% |
| Scotland | 12 | 0.3% | View All 6 Rows |
Sex and Age in Pilot Point
Sex and Age in Pilot Point
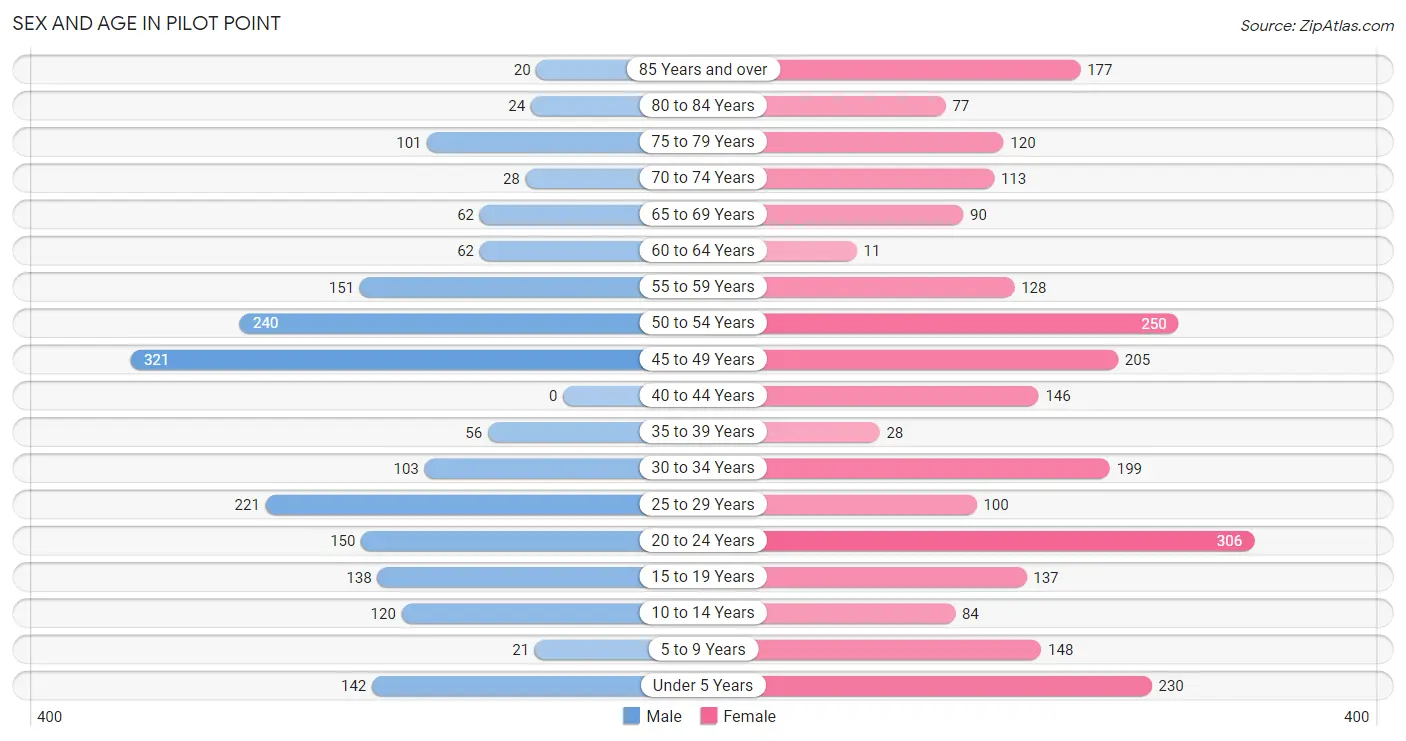
The most populous age groups in Pilot Point are 45 to 49 Years (321 | 16.4%) for men and 20 to 24 Years (306 | 12.0%) for women.
| Age Bracket | Male | Female |
| Under 5 Years | 142 (7.2%) | 230 (9.0%) |
| 5 to 9 Years | 21 (1.1%) | 148 (5.8%) |
| 10 to 14 Years | 120 (6.1%) | 84 (3.3%) |
| 15 to 19 Years | 138 (7.0%) | 137 (5.4%) |
| 20 to 24 Years | 150 (7.6%) | 306 (12.0%) |
| 25 to 29 Years | 221 (11.3%) | 100 (3.9%) |
| 30 to 34 Years | 103 (5.3%) | 199 (7.8%) |
| 35 to 39 Years | 56 (2.9%) | 28 (1.1%) |
| 40 to 44 Years | 0 (0.0%) | 146 (5.7%) |
| 45 to 49 Years | 321 (16.4%) | 205 (8.0%) |
| 50 to 54 Years | 240 (12.2%) | 250 (9.8%) |
| 55 to 59 Years | 151 (7.7%) | 128 (5.0%) |
| 60 to 64 Years | 62 (3.2%) | 11 (0.4%) |
| 65 to 69 Years | 62 (3.2%) | 90 (3.5%) |
| 70 to 74 Years | 28 (1.4%) | 113 (4.4%) |
| 75 to 79 Years | 101 (5.1%) | 120 (4.7%) |
| 80 to 84 Years | 24 (1.2%) | 77 (3.0%) |
| 85 Years and over | 20 (1.0%) | 177 (6.9%) |
| Total | 1,960 (100.0%) | 2,549 (100.0%) |
Families and Households in Pilot Point
Median Family Size in Pilot Point
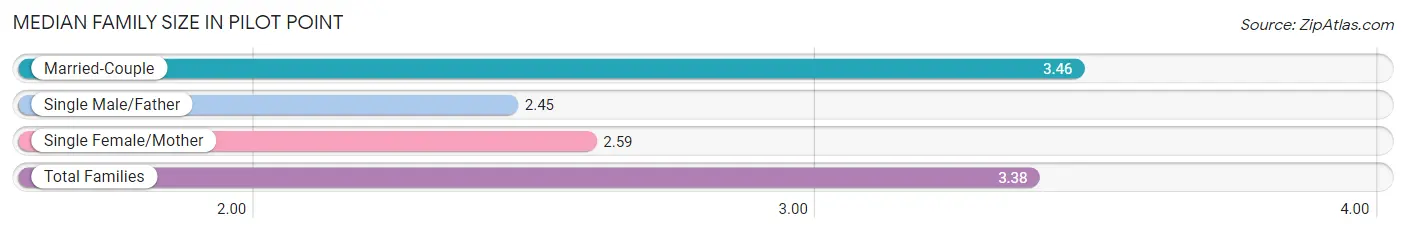
The median family size in Pilot Point is 3.38 persons per family, with married-couple families (962 | 91.1%) accounting for the largest median family size of 3.46 persons per family. On the other hand, single male/father families (40 | 3.8%) represent the smallest median family size with 2.45 persons per family.
| Family Type | # Families | Family Size |
| Married-Couple | 962 (91.1%) | 3.46 |
| Single Male/Father | 40 (3.8%) | 2.45 |
| Single Female/Mother | 54 (5.1%) | 2.59 |
| Total Families | 1,056 (100.0%) | 3.38 |
Median Household Size in Pilot Point
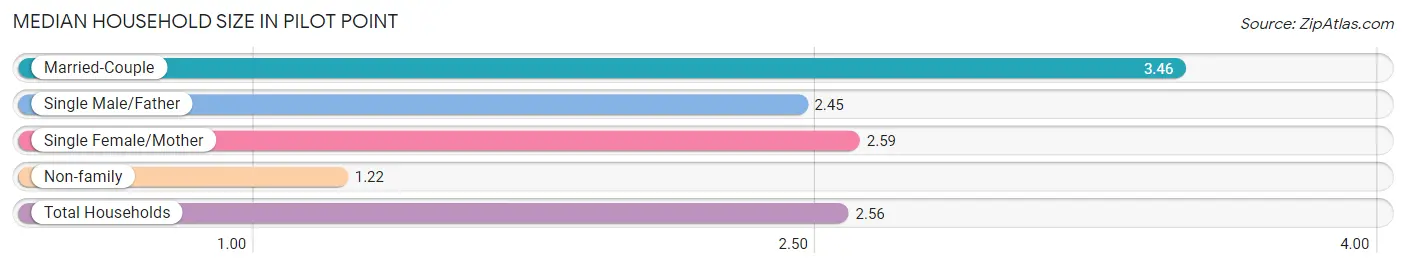
The median household size in Pilot Point is 2.56 persons per household, with married-couple households (962 | 56.4%) accounting for the largest median household size of 3.46 persons per household. non-family households (650 | 38.1%) represent the smallest median household size with 1.22 persons per household.
| Household Type | # Households | Household Size |
| Married-Couple | 962 (56.4%) | 3.46 |
| Single Male/Father | 40 (2.3%) | 2.45 |
| Single Female/Mother | 54 (3.2%) | 2.59 |
| Non-family | 650 (38.1%) | 1.22 |
| Total Households | 1,706 (100.0%) | 2.56 |
Household Size by Marriage Status in Pilot Point
Out of a total of 1,706 households in Pilot Point, 1,056 (61.9%) are family households, while 650 (38.1%) are nonfamily households. The most numerous type of family households are 3-person households, comprising 490, and the most common type of nonfamily households are 1-person households, comprising 513.
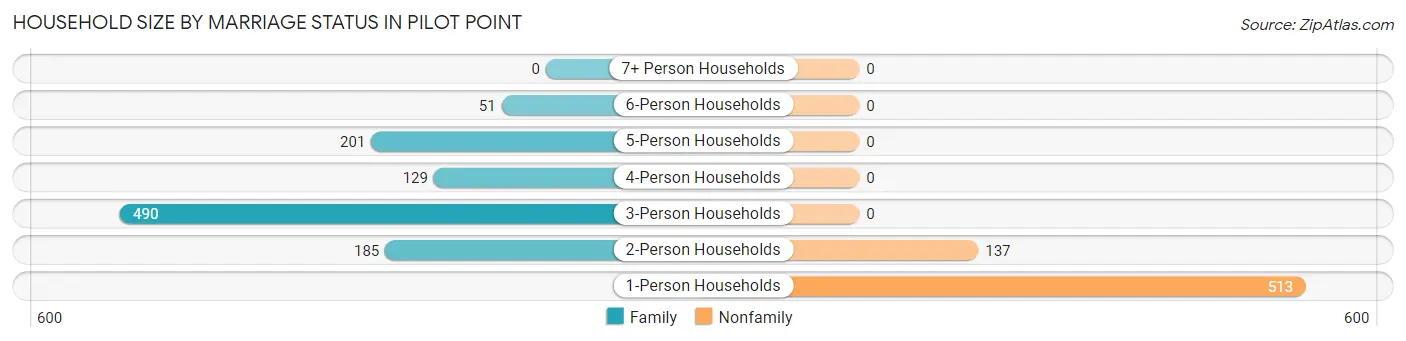
| Household Size | Family Households | Nonfamily Households |
| 1-Person Households | - | 513 (30.1%) |
| 2-Person Households | 185 (10.8%) | 137 (8.0%) |
| 3-Person Households | 490 (28.7%) | 0 (0.0%) |
| 4-Person Households | 129 (7.6%) | 0 (0.0%) |
| 5-Person Households | 201 (11.8%) | 0 (0.0%) |
| 6-Person Households | 51 (3.0%) | 0 (0.0%) |
| 7+ Person Households | 0 (0.0%) | 0 (0.0%) |
| Total | 1,056 (61.9%) | 650 (38.1%) |
Female Fertility in Pilot Point
Fertility by Age in Pilot Point
Average fertility rate in Pilot Point is 30.0 births per 1,000 women. Women in the age bracket of 20 to 34 years have the highest fertility rate with 61.0 births per 1,000 women. Women in the age bracket of 20 to 34 years acount for 100.0% of all women with births.
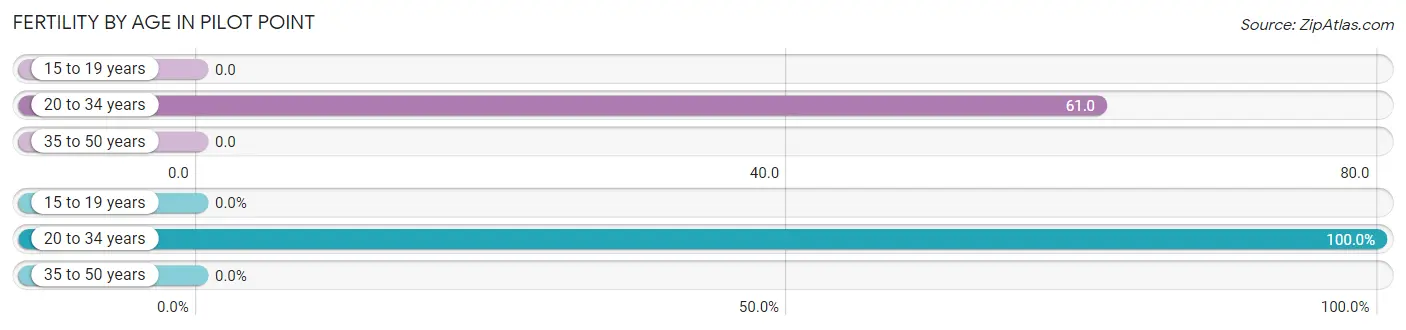
| Age Bracket | Women with Births | Births / 1,000 Women |
| 15 to 19 years | 0 (0.0%) | 0.0 |
| 20 to 34 years | 37 (100.0%) | 61.0 |
| 35 to 50 years | 0 (0.0%) | 0.0 |
| Total | 37 (100.0%) | 30.0 |
Fertility by Age by Marriage Status in Pilot Point
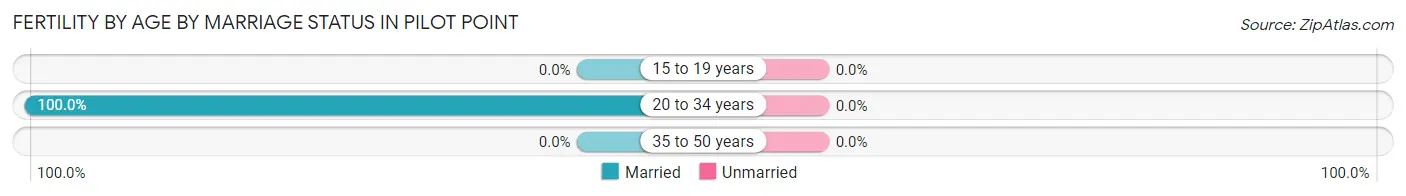
| Age Bracket | Married | Unmarried |
| 15 to 19 years | 0 (0.0%) | 0 (0.0%) |
| 20 to 34 years | 37 (100.0%) | 0 (0.0%) |
| 35 to 50 years | 0 (0.0%) | 0 (0.0%) |
| Total | 37 (100.0%) | 0 (0.0%) |
Fertility by Education in Pilot Point
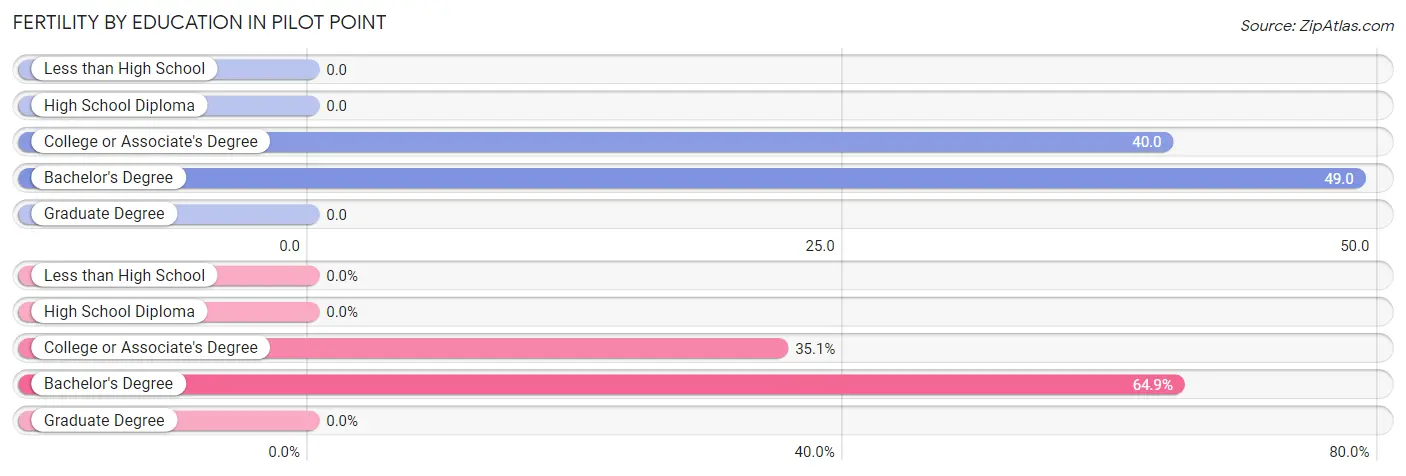
| Educational Attainment | Women with Births | Births / 1,000 Women |
| Less than High School | 0 (0.0%) | 0.0 |
| High School Diploma | 0 (0.0%) | 0.0 |
| College or Associate's Degree | 13 (35.1%) | 40.0 |
| Bachelor's Degree | 24 (64.9%) | 49.0 |
| Graduate Degree | 0 (0.0%) | 0.0 |
| Total | 37 (100.0%) | 30.0 |
Fertility by Education by Marriage Status in Pilot Point
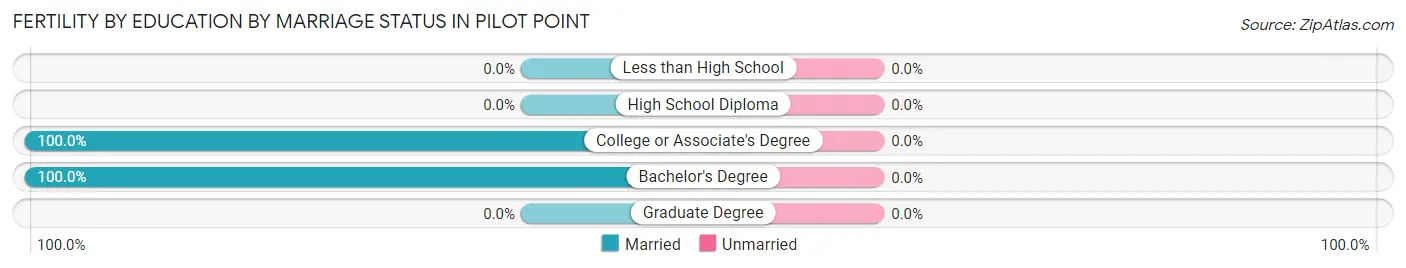
| Educational Attainment | Married | Unmarried |
| Less than High School | 0 (0.0%) | 0 (0.0%) |
| High School Diploma | 0 (0.0%) | 0 (0.0%) |
| College or Associate's Degree | 13 (100.0%) | 0 (0.0%) |
| Bachelor's Degree | 24 (100.0%) | 0 (0.0%) |
| Graduate Degree | 0 (0.0%) | 0 (0.0%) |
| Total | 37 (100.0%) | 0 (0.0%) |
Employment Characteristics in Pilot Point
Employment by Class of Employer in Pilot Point
Among the 2,116 employed individuals in Pilot Point, private company employees (1,557 | 73.6%), local government employees (193 | 9.1%), and self-employed (incorporated) (126 | 5.9%) make up the most common classes of employment.
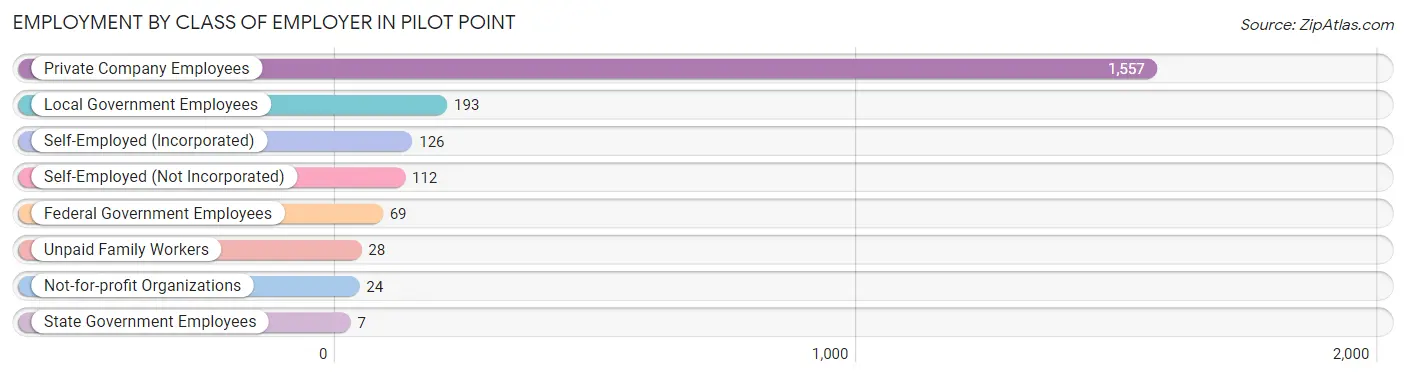
| Employer Class | # Employees | % Employees |
| Private Company Employees | 1,557 | 73.6% |
| Self-Employed (Incorporated) | 126 | 5.9% |
| Self-Employed (Not Incorporated) | 112 | 5.3% |
| Not-for-profit Organizations | 24 | 1.1% |
| Local Government Employees | 193 | 9.1% |
| State Government Employees | 7 | 0.3% |
| Federal Government Employees | 69 | 3.3% |
| Unpaid Family Workers | 28 | 1.3% |
| Total | 2,116 | 100.0% |
Employment Status by Age in Pilot Point
According to the labor force statistics for Pilot Point, out of the total population over 16 years of age (3,640), 63.7% or 2,319 individuals are in the labor force, with 7.9% or 183 of them unemployed. The age group with the highest labor force participation rate is 35 to 44 years, with 98.3% or 226 individuals in the labor force. Within the labor force, the 20 to 24 years age range has the highest percentage of unemployed individuals, with 21.6% or 67 of them being unemployed.
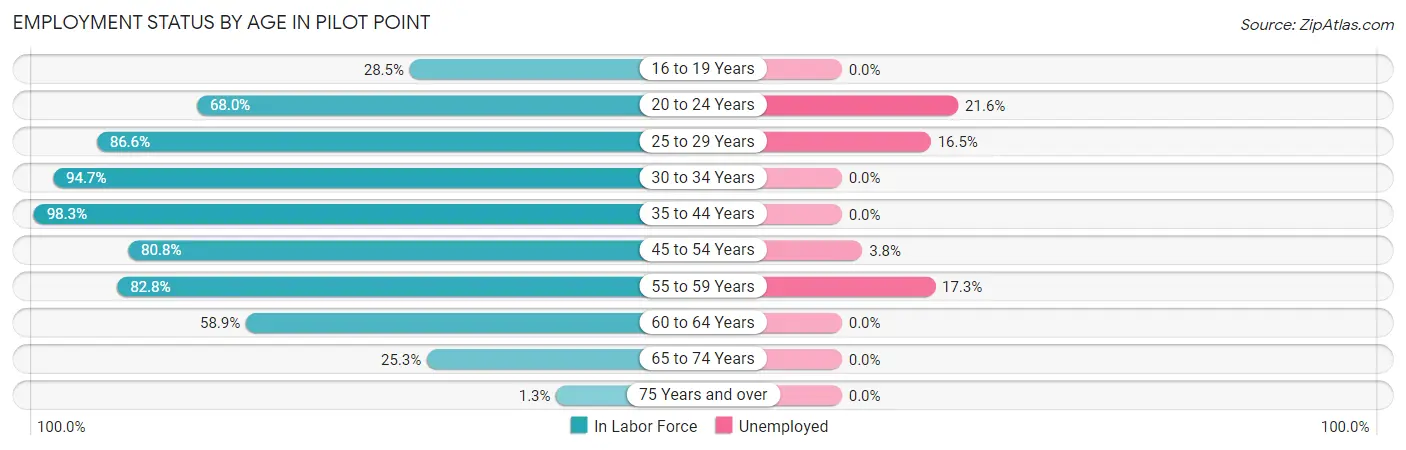
| Age Bracket | In Labor Force | Unemployed |
| 16 to 19 Years | 43 (28.5%) | 0 (0.0%) |
| 20 to 24 Years | 310 (68.0%) | 67 (21.6%) |
| 25 to 29 Years | 278 (86.6%) | 46 (16.5%) |
| 30 to 34 Years | 286 (94.7%) | 0 (0.0%) |
| 35 to 44 Years | 226 (98.3%) | 0 (0.0%) |
| 45 to 54 Years | 821 (80.8%) | 31 (3.8%) |
| 55 to 59 Years | 231 (82.8%) | 40 (17.3%) |
| 60 to 64 Years | 43 (58.9%) | 0 (0.0%) |
| 65 to 74 Years | 74 (25.3%) | 0 (0.0%) |
| 75 Years and over | 7 (1.3%) | 0 (0.0%) |
| Total | 2,319 (63.7%) | 183 (7.9%) |
Employment Status by Educational Attainment in Pilot Point
According to labor force statistics for Pilot Point, 84.9% of individuals (1,886) out of the total population between 25 and 64 years of age (2,221) are in the labor force, with 6.2% or 117 of them being unemployed. The group with the highest labor force participation rate are those with the educational attainment of college / associate degree, with 96.4% or 482 individuals in the labor force. Within the labor force, individuals with bachelor's degree or higher education have the highest percentage of unemployment, with 11.2% or 71 of them being unemployed.
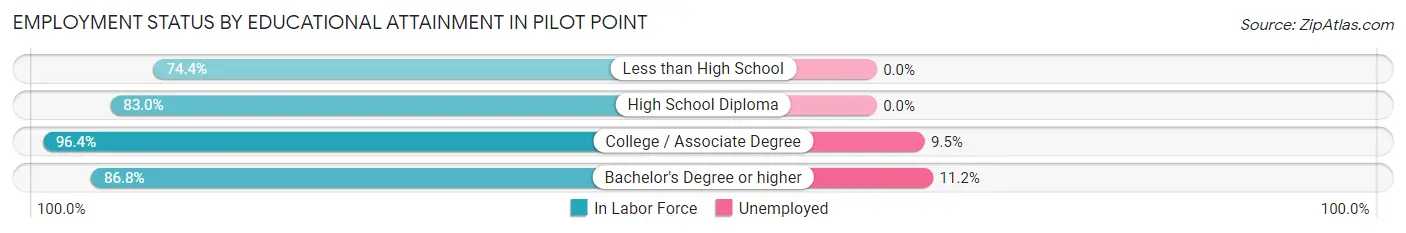
| Educational Attainment | In Labor Force | Unemployed |
| Less than High School | 463 (74.4%) | 0 (0.0%) |
| High School Diploma | 308 (83.0%) | 0 (0.0%) |
| College / Associate Degree | 482 (96.4%) | 48 (9.5%) |
| Bachelor's Degree or higher | 632 (86.8%) | 82 (11.2%) |
| Total | 1,886 (84.9%) | 138 (6.2%) |
Employment Occupations by Sex in Pilot Point
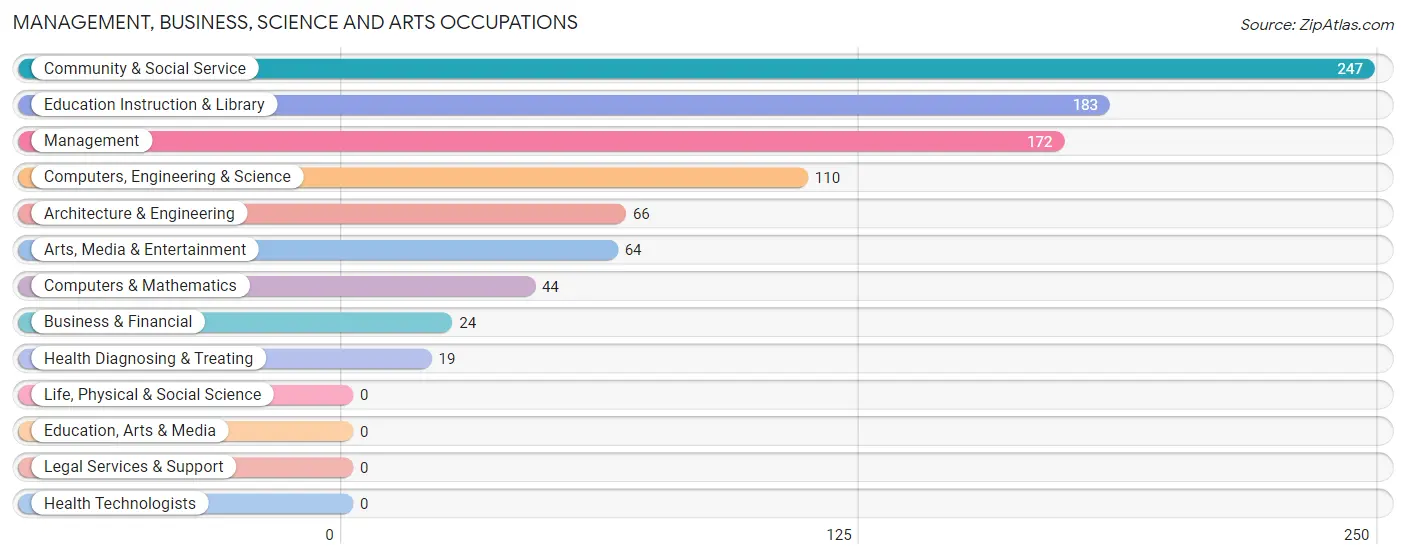
Management, Business, Science and Arts Occupations
The most common Management, Business, Science and Arts occupations in Pilot Point are Community & Social Service (247 | 11.6%), Education Instruction & Library (183 | 8.6%), Management (172 | 8.1%), Computers, Engineering & Science (110 | 5.1%), and Architecture & Engineering (66 | 3.1%).
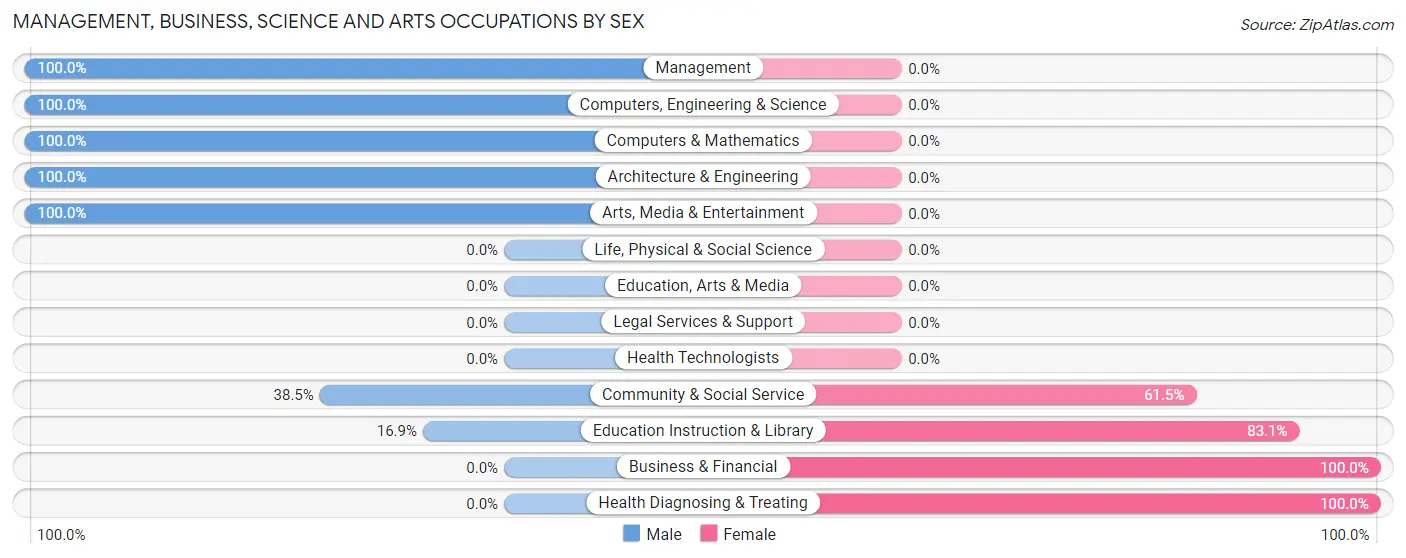
Management, Business, Science and Arts Occupations by Sex
Within the Management, Business, Science and Arts occupations in Pilot Point, the most male-oriented occupations are Management (100.0%), Computers, Engineering & Science (100.0%), and Computers & Mathematics (100.0%), while the most female-oriented occupations are Business & Financial (100.0%), Health Diagnosing & Treating (100.0%), and Education Instruction & Library (83.1%).
| Occupation | Male | Female |
| Management | 172 (100.0%) | 0 (0.0%) |
| Business & Financial | 0 (0.0%) | 24 (100.0%) |
| Computers, Engineering & Science | 110 (100.0%) | 0 (0.0%) |
| Computers & Mathematics | 44 (100.0%) | 0 (0.0%) |
| Architecture & Engineering | 66 (100.0%) | 0 (0.0%) |
| Life, Physical & Social Science | 0 (0.0%) | 0 (0.0%) |
| Community & Social Service | 95 (38.5%) | 152 (61.5%) |
| Education, Arts & Media | 0 (0.0%) | 0 (0.0%) |
| Legal Services & Support | 0 (0.0%) | 0 (0.0%) |
| Education Instruction & Library | 31 (16.9%) | 152 (83.1%) |
| Arts, Media & Entertainment | 64 (100.0%) | 0 (0.0%) |
| Health Diagnosing & Treating | 0 (0.0%) | 19 (100.0%) |
| Health Technologists | 0 (0.0%) | 0 (0.0%) |
| Total (Category) | 377 (65.9%) | 195 (34.1%) |
| Total (Overall) | 1,155 (54.1%) | 980 (45.9%) |
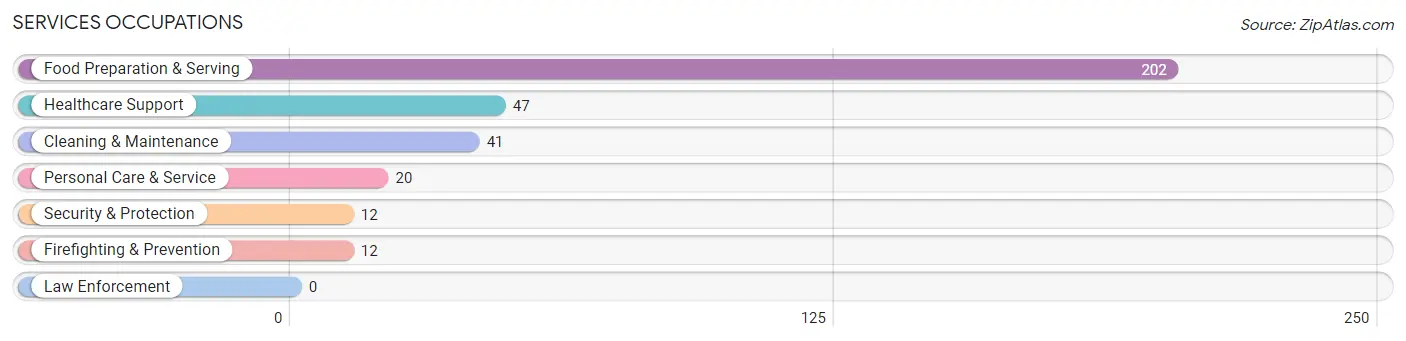
Services Occupations
The most common Services occupations in Pilot Point are Food Preparation & Serving (202 | 9.5%), Healthcare Support (47 | 2.2%), Cleaning & Maintenance (41 | 1.9%), Personal Care & Service (20 | 0.9%), and Security & Protection (12 | 0.6%).
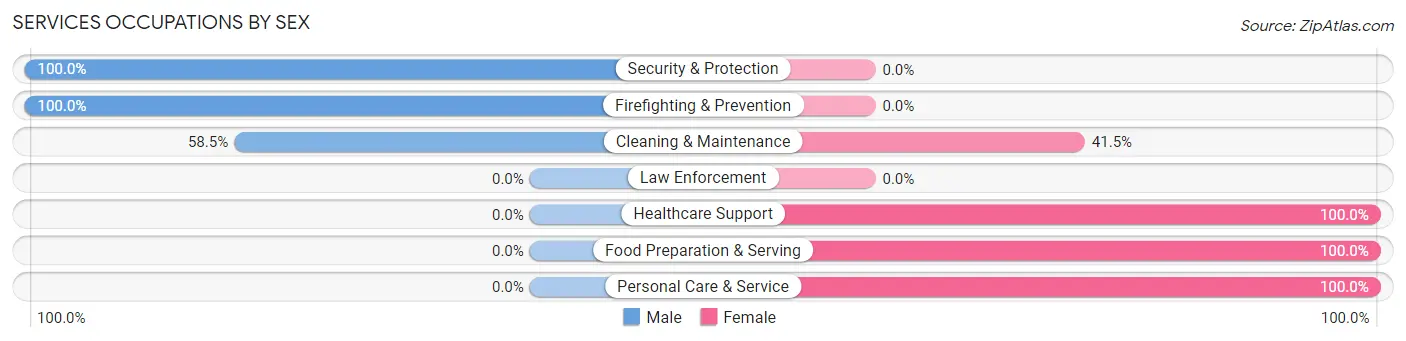
Services Occupations by Sex
Within the Services occupations in Pilot Point, the most male-oriented occupations are Security & Protection (100.0%), Firefighting & Prevention (100.0%), and Cleaning & Maintenance (58.5%), while the most female-oriented occupations are Healthcare Support (100.0%), Food Preparation & Serving (100.0%), and Personal Care & Service (100.0%).
| Occupation | Male | Female |
| Healthcare Support | 0 (0.0%) | 47 (100.0%) |
| Security & Protection | 12 (100.0%) | 0 (0.0%) |
| Firefighting & Prevention | 12 (100.0%) | 0 (0.0%) |
| Law Enforcement | 0 (0.0%) | 0 (0.0%) |
| Food Preparation & Serving | 0 (0.0%) | 202 (100.0%) |
| Cleaning & Maintenance | 24 (58.5%) | 17 (41.5%) |
| Personal Care & Service | 0 (0.0%) | 20 (100.0%) |
| Total (Category) | 36 (11.2%) | 286 (88.8%) |
| Total (Overall) | 1,155 (54.1%) | 980 (45.9%) |
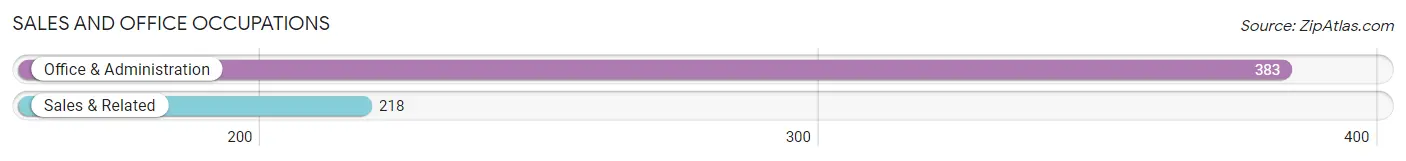
Sales and Office Occupations
The most common Sales and Office occupations in Pilot Point are Office & Administration (383 | 17.9%), and Sales & Related (218 | 10.2%).
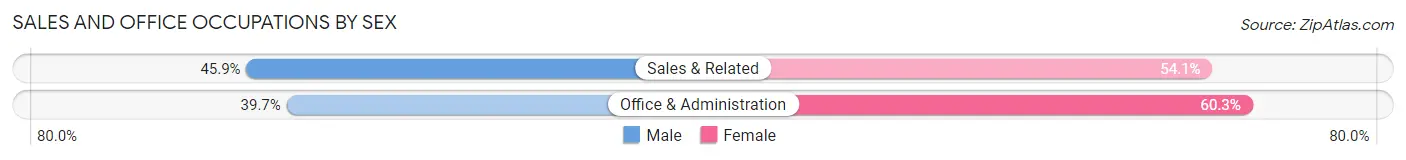
Sales and Office Occupations by Sex
| Occupation | Male | Female |
| Sales & Related | 100 (45.9%) | 118 (54.1%) |
| Office & Administration | 152 (39.7%) | 231 (60.3%) |
| Total (Category) | 252 (41.9%) | 349 (58.1%) |
| Total (Overall) | 1,155 (54.1%) | 980 (45.9%) |
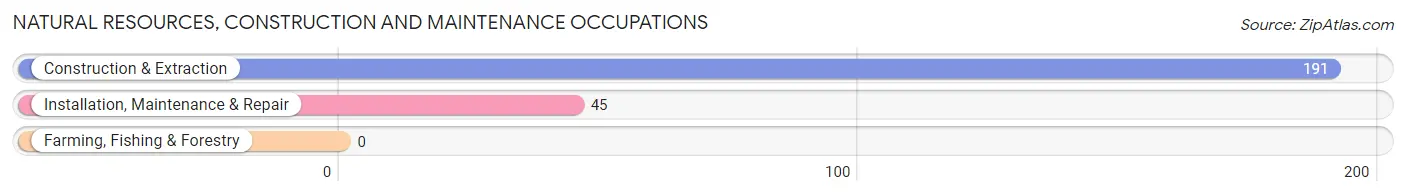
Natural Resources, Construction and Maintenance Occupations
The most common Natural Resources, Construction and Maintenance occupations in Pilot Point are Construction & Extraction (191 | 8.9%), and Installation, Maintenance & Repair (45 | 2.1%).
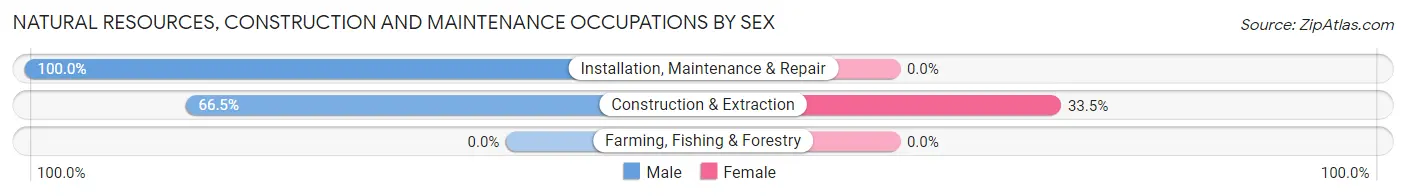
Natural Resources, Construction and Maintenance Occupations by Sex
| Occupation | Male | Female |
| Farming, Fishing & Forestry | 0 (0.0%) | 0 (0.0%) |
| Construction & Extraction | 127 (66.5%) | 64 (33.5%) |
| Installation, Maintenance & Repair | 45 (100.0%) | 0 (0.0%) |
| Total (Category) | 172 (72.9%) | 64 (27.1%) |
| Total (Overall) | 1,155 (54.1%) | 980 (45.9%) |
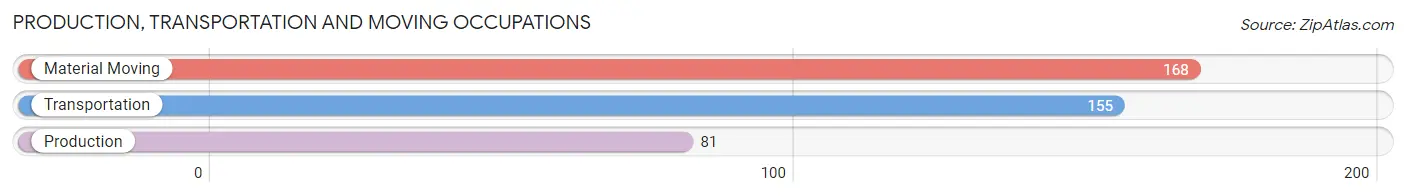
Production, Transportation and Moving Occupations
The most common Production, Transportation and Moving occupations in Pilot Point are Material Moving (168 | 7.9%), Transportation (155 | 7.3%), and Production (81 | 3.8%).
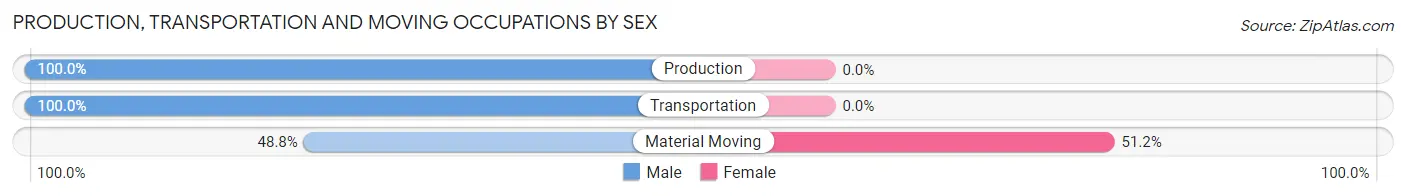
Production, Transportation and Moving Occupations by Sex
| Occupation | Male | Female |
| Production | 81 (100.0%) | 0 (0.0%) |
| Transportation | 155 (100.0%) | 0 (0.0%) |
| Material Moving | 82 (48.8%) | 86 (51.2%) |
| Total (Category) | 318 (78.7%) | 86 (21.3%) |
| Total (Overall) | 1,155 (54.1%) | 980 (45.9%) |
Employment Industries by Sex in Pilot Point
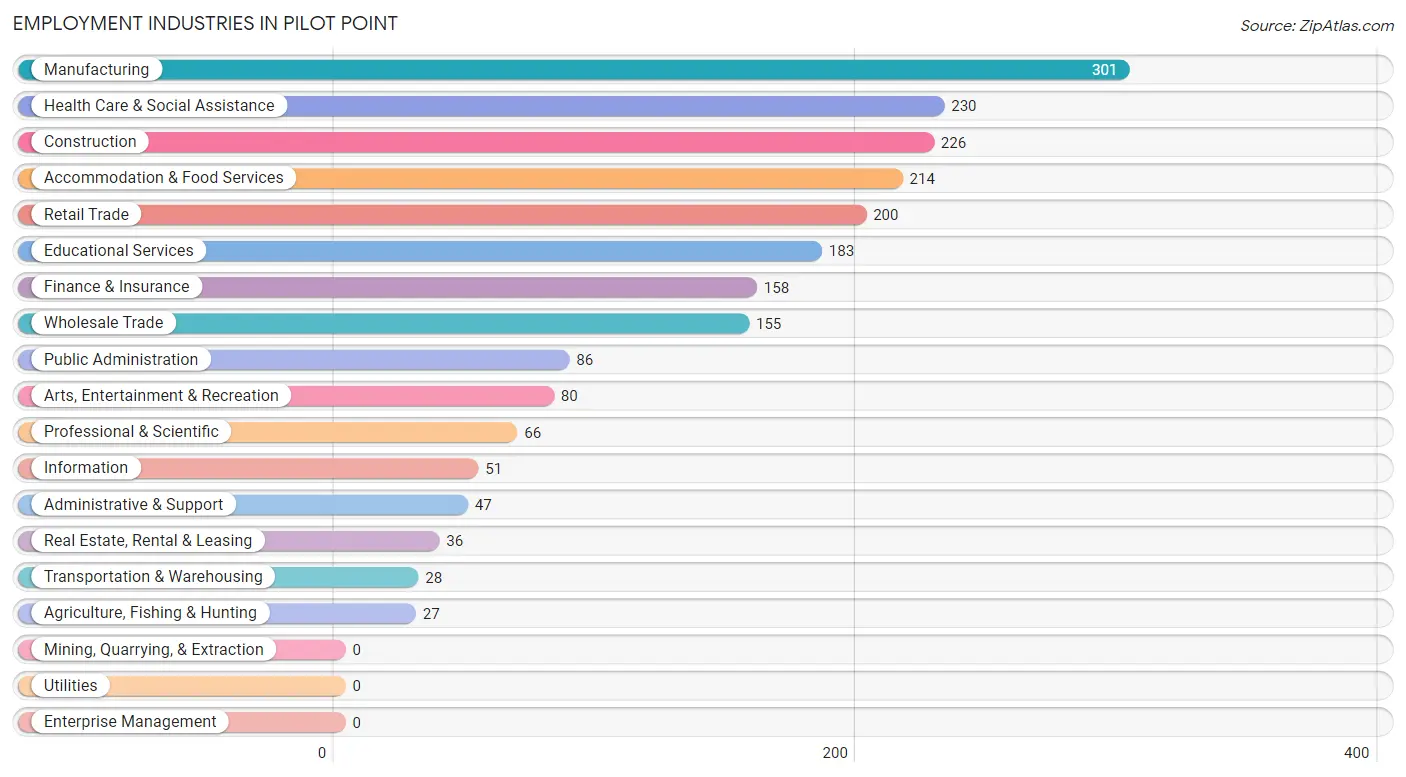
Employment Industries in Pilot Point
The major employment industries in Pilot Point include Manufacturing (301 | 14.1%), Health Care & Social Assistance (230 | 10.8%), Construction (226 | 10.6%), Accommodation & Food Services (214 | 10.0%), and Retail Trade (200 | 9.4%).
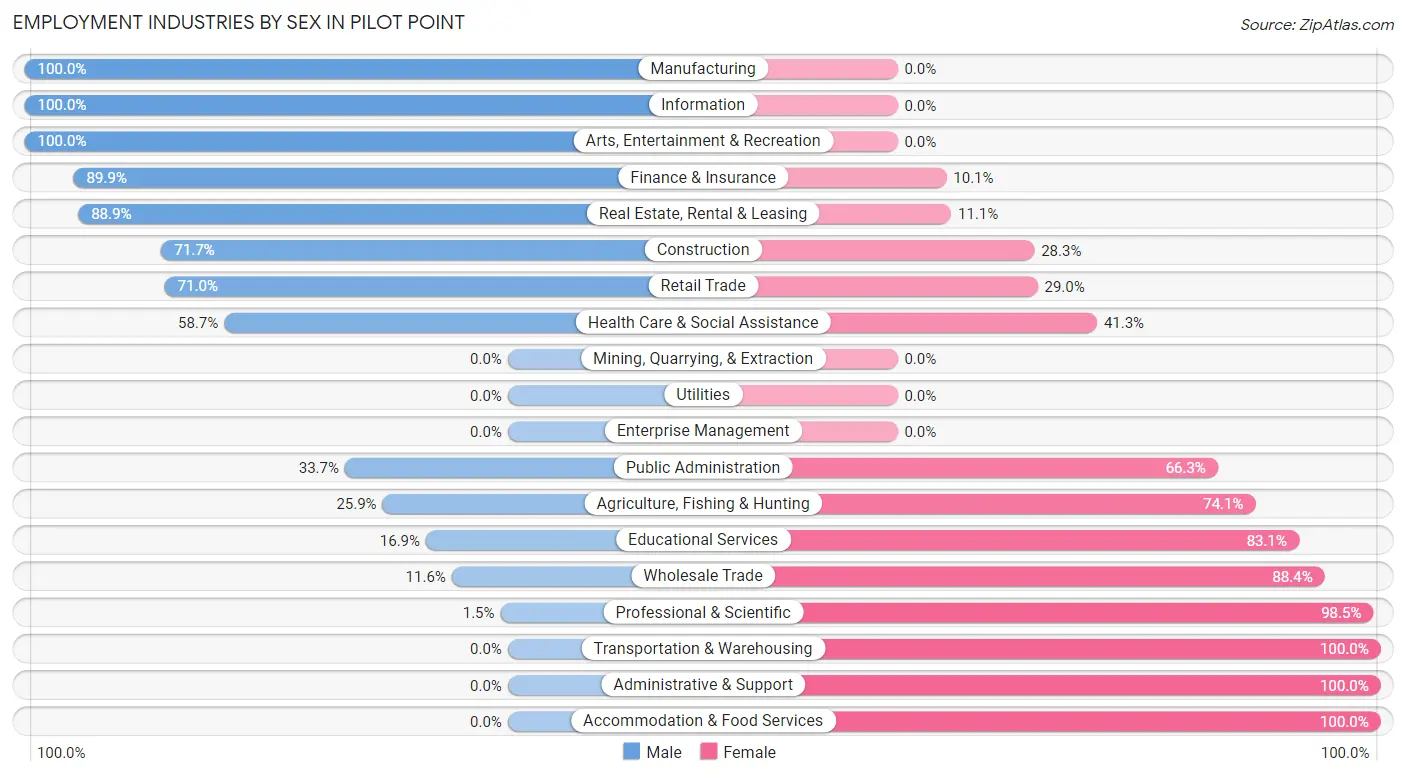
Employment Industries by Sex in Pilot Point
The Pilot Point industries that see more men than women are Manufacturing (100.0%), Information (100.0%), and Arts, Entertainment & Recreation (100.0%), whereas the industries that tend to have a higher number of women are Transportation & Warehousing (100.0%), Administrative & Support (100.0%), and Accommodation & Food Services (100.0%).
| Industry | Male | Female |
| Agriculture, Fishing & Hunting | 7 (25.9%) | 20 (74.1%) |
| Mining, Quarrying, & Extraction | 0 (0.0%) | 0 (0.0%) |
| Construction | 162 (71.7%) | 64 (28.3%) |
| Manufacturing | 301 (100.0%) | 0 (0.0%) |
| Wholesale Trade | 18 (11.6%) | 137 (88.4%) |
| Retail Trade | 142 (71.0%) | 58 (29.0%) |
| Transportation & Warehousing | 0 (0.0%) | 28 (100.0%) |
| Utilities | 0 (0.0%) | 0 (0.0%) |
| Information | 51 (100.0%) | 0 (0.0%) |
| Finance & Insurance | 142 (89.9%) | 16 (10.1%) |
| Real Estate, Rental & Leasing | 32 (88.9%) | 4 (11.1%) |
| Professional & Scientific | 1 (1.5%) | 65 (98.5%) |
| Enterprise Management | 0 (0.0%) | 0 (0.0%) |
| Administrative & Support | 0 (0.0%) | 47 (100.0%) |
| Educational Services | 31 (16.9%) | 152 (83.1%) |
| Health Care & Social Assistance | 135 (58.7%) | 95 (41.3%) |
| Arts, Entertainment & Recreation | 80 (100.0%) | 0 (0.0%) |
| Accommodation & Food Services | 0 (0.0%) | 214 (100.0%) |
| Public Administration | 29 (33.7%) | 57 (66.3%) |
| Total | 1,155 (54.1%) | 980 (45.9%) |
Education in Pilot Point
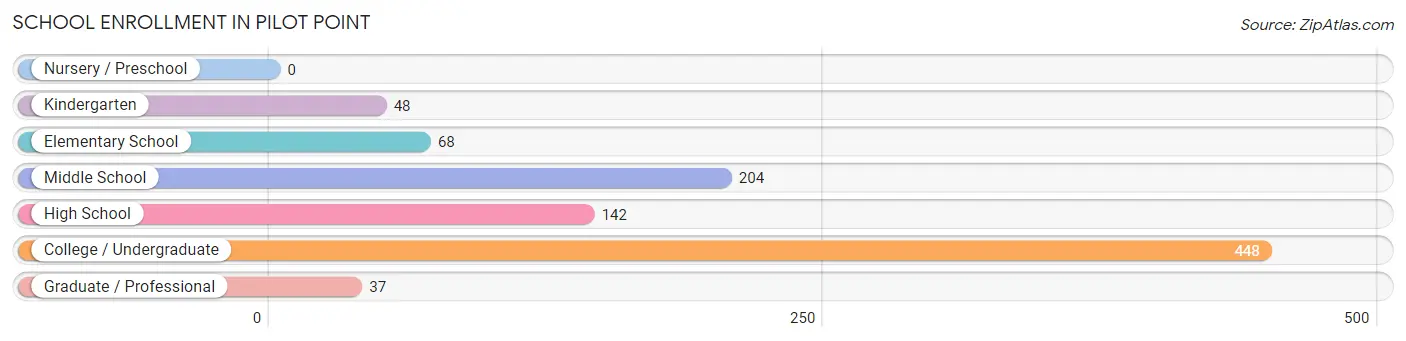
School Enrollment in Pilot Point
The most common levels of schooling among the 947 students in Pilot Point are college / undergraduate (448 | 47.3%), middle school (204 | 21.5%), and high school (142 | 15.0%).
| School Level | # Students | % Students |
| Nursery / Preschool | 0 | 0.0% |
| Kindergarten | 48 | 5.1% |
| Elementary School | 68 | 7.2% |
| Middle School | 204 | 21.5% |
| High School | 142 | 15.0% |
| College / Undergraduate | 448 | 47.3% |
| Graduate / Professional | 37 | 3.9% |
| Total | 947 | 100.0% |
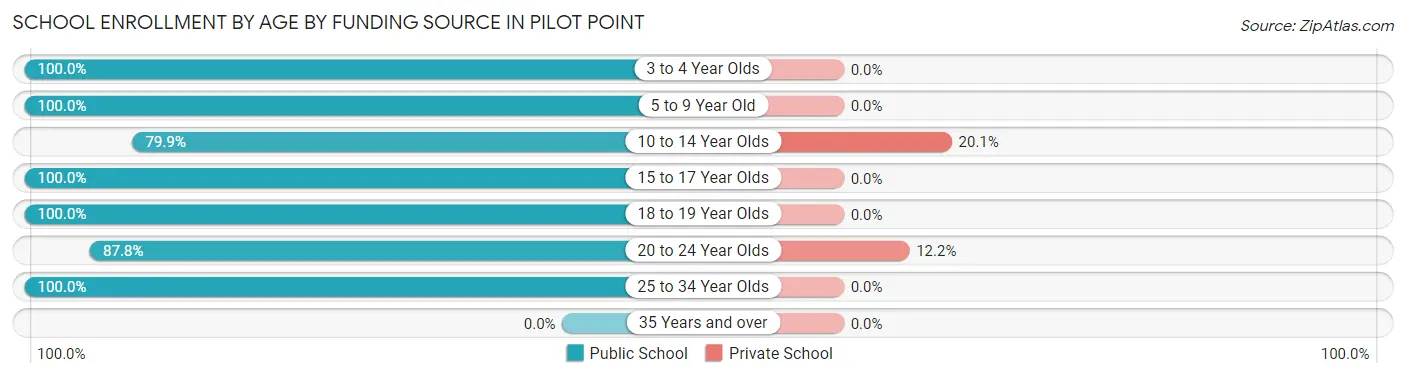
School Enrollment by Age by Funding Source in Pilot Point
Out of a total of 947 students who are enrolled in schools in Pilot Point, 78 (8.2%) attend a private institution, while the remaining 869 (91.8%) are enrolled in public schools. The age group of 10 to 14 year olds has the highest likelihood of being enrolled in private schools, with 41 (20.1% in the age bracket) enrolled. Conversely, the age group of 3 to 4 year olds has the lowest likelihood of being enrolled in a private school, with 10 (100.0% in the age bracket) attending a public institution.
| Age Bracket | Public School | Private School |
| 3 to 4 Year Olds | 10 (100.0%) | 0 (0.0%) |
| 5 to 9 Year Old | 106 (100.0%) | 0 (0.0%) |
| 10 to 14 Year Olds | 163 (79.9%) | 41 (20.1%) |
| 15 to 17 Year Olds | 130 (100.0%) | 0 (0.0%) |
| 18 to 19 Year Olds | 133 (100.0%) | 0 (0.0%) |
| 20 to 24 Year Olds | 266 (87.8%) | 37 (12.2%) |
| 25 to 34 Year Olds | 61 (100.0%) | 0 (0.0%) |
| 35 Years and over | 0 (0.0%) | 0 (0.0%) |
| Total | 869 (91.8%) | 78 (8.2%) |
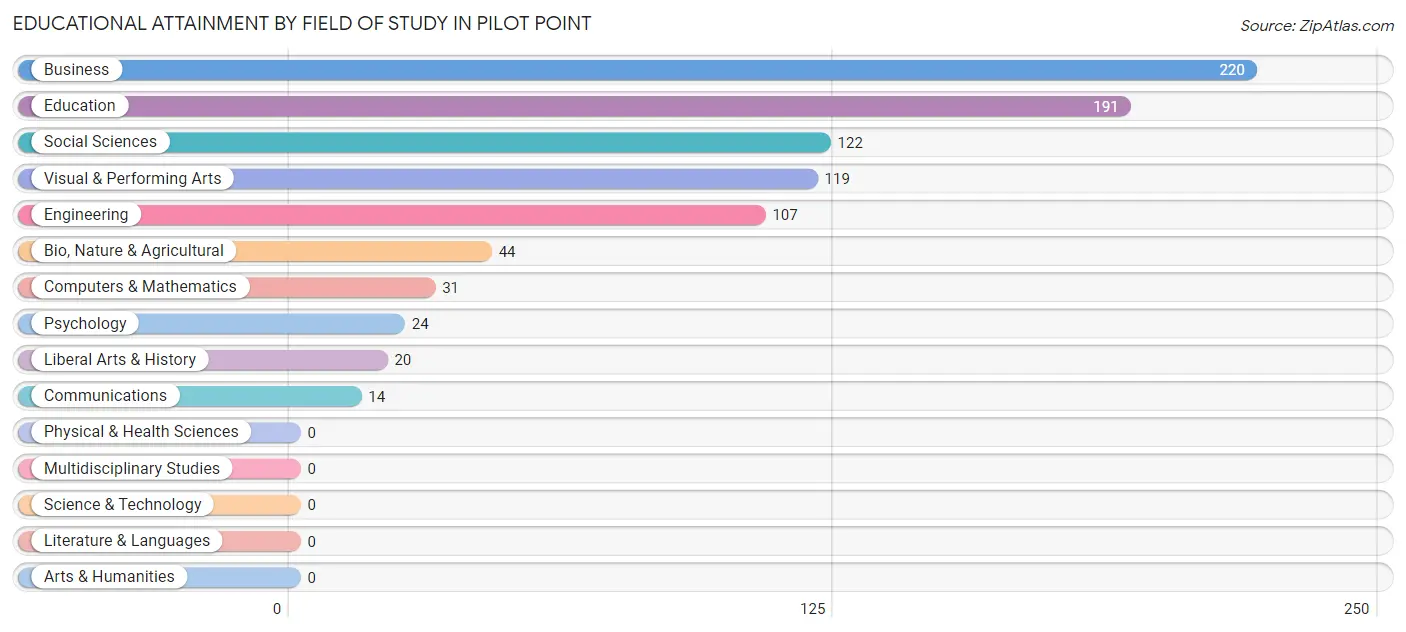
Educational Attainment by Field of Study in Pilot Point
Business (220 | 24.7%), education (191 | 21.4%), social sciences (122 | 13.7%), visual & performing arts (119 | 13.3%), and engineering (107 | 12.0%) are the most common fields of study among 892 individuals in Pilot Point who have obtained a bachelor's degree or higher.
| Field of Study | # Graduates | % Graduates |
| Computers & Mathematics | 31 | 3.5% |
| Bio, Nature & Agricultural | 44 | 4.9% |
| Physical & Health Sciences | 0 | 0.0% |
| Psychology | 24 | 2.7% |
| Social Sciences | 122 | 13.7% |
| Engineering | 107 | 12.0% |
| Multidisciplinary Studies | 0 | 0.0% |
| Science & Technology | 0 | 0.0% |
| Business | 220 | 24.7% |
| Education | 191 | 21.4% |
| Literature & Languages | 0 | 0.0% |
| Liberal Arts & History | 20 | 2.2% |
| Visual & Performing Arts | 119 | 13.3% |
| Communications | 14 | 1.6% |
| Arts & Humanities | 0 | 0.0% |
| Total | 892 | 100.0% |
Transportation & Commute in Pilot Point
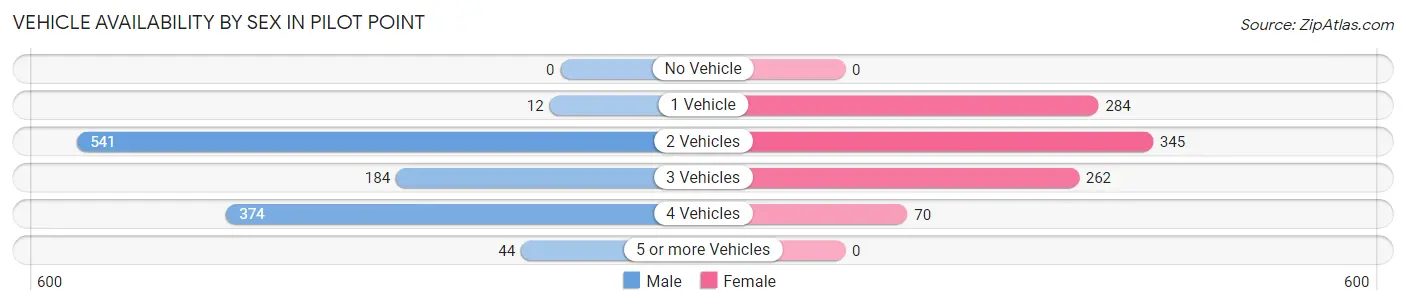
Vehicle Availability by Sex in Pilot Point
The most prevalent vehicle ownership categories in Pilot Point are males with 2 vehicles (541, accounting for 46.8%) and females with 2 vehicles (345, making up 56.3%).
| Vehicles Available | Male | Female |
| No Vehicle | 0 (0.0%) | 0 (0.0%) |
| 1 Vehicle | 12 (1.0%) | 284 (29.5%) |
| 2 Vehicles | 541 (46.8%) | 345 (35.9%) |
| 3 Vehicles | 184 (15.9%) | 262 (27.3%) |
| 4 Vehicles | 374 (32.4%) | 70 (7.3%) |
| 5 or more Vehicles | 44 (3.8%) | 0 (0.0%) |
| Total | 1,155 (100.0%) | 961 (100.0%) |
Commute Time in Pilot Point
The most frequently occuring commute durations in Pilot Point are 5 to 9 minutes (510 commuters, 27.7%), 30 to 34 minutes (304 commuters, 16.5%), and 20 to 24 minutes (278 commuters, 15.1%).
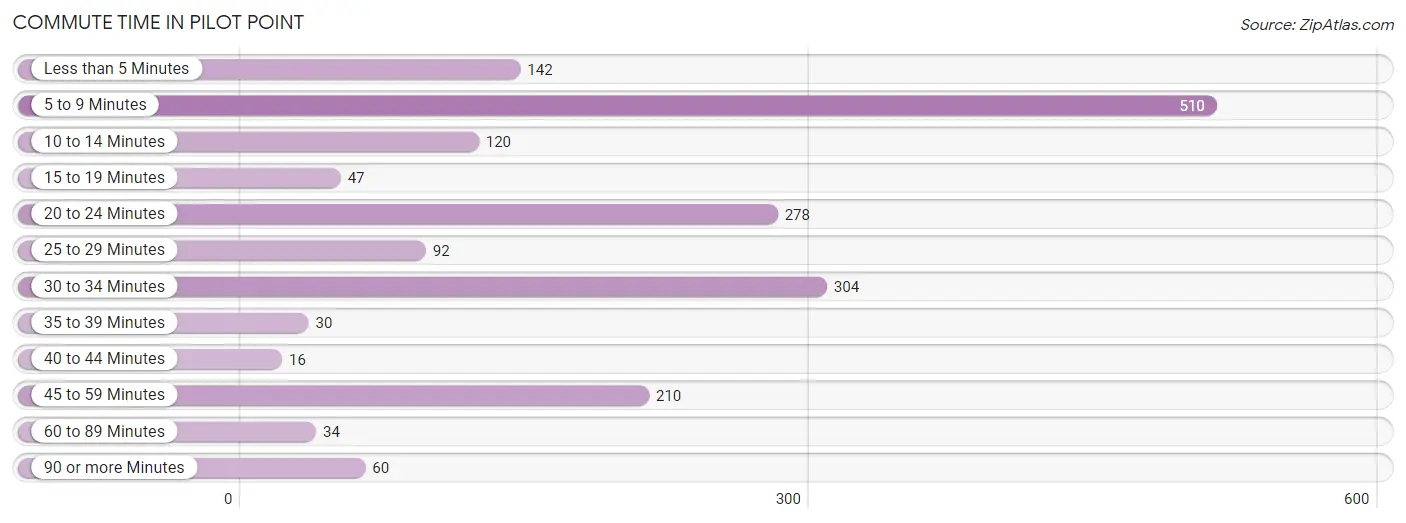
| Commute Time | # Commuters | % Commuters |
| Less than 5 Minutes | 142 | 7.7% |
| 5 to 9 Minutes | 510 | 27.7% |
| 10 to 14 Minutes | 120 | 6.5% |
| 15 to 19 Minutes | 47 | 2.5% |
| 20 to 24 Minutes | 278 | 15.1% |
| 25 to 29 Minutes | 92 | 5.0% |
| 30 to 34 Minutes | 304 | 16.5% |
| 35 to 39 Minutes | 30 | 1.6% |
| 40 to 44 Minutes | 16 | 0.9% |
| 45 to 59 Minutes | 210 | 11.4% |
| 60 to 89 Minutes | 34 | 1.8% |
| 90 or more Minutes | 60 | 3.3% |
Commute Time by Sex in Pilot Point
The most common commute times in Pilot Point are 5 to 9 minutes (179 commuters, 19.3%) for males and 5 to 9 minutes (331 commuters, 36.1%) for females.
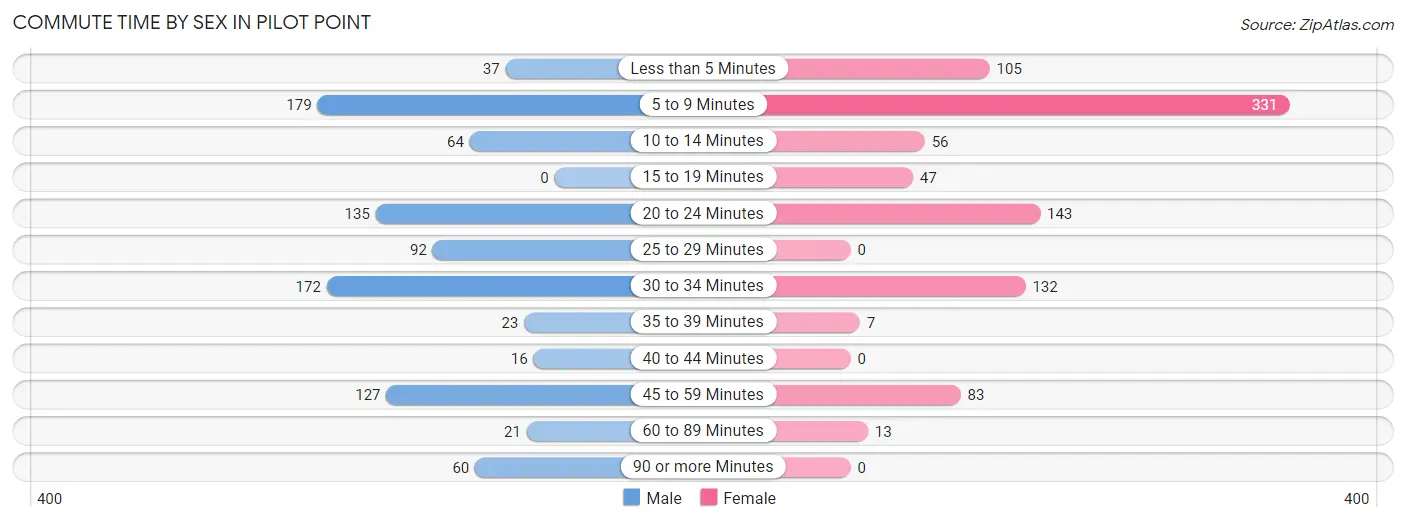
| Commute Time | Male | Female |
| Less than 5 Minutes | 37 (4.0%) | 105 (11.5%) |
| 5 to 9 Minutes | 179 (19.3%) | 331 (36.1%) |
| 10 to 14 Minutes | 64 (6.9%) | 56 (6.1%) |
| 15 to 19 Minutes | 0 (0.0%) | 47 (5.1%) |
| 20 to 24 Minutes | 135 (14.6%) | 143 (15.6%) |
| 25 to 29 Minutes | 92 (9.9%) | 0 (0.0%) |
| 30 to 34 Minutes | 172 (18.6%) | 132 (14.4%) |
| 35 to 39 Minutes | 23 (2.5%) | 7 (0.8%) |
| 40 to 44 Minutes | 16 (1.7%) | 0 (0.0%) |
| 45 to 59 Minutes | 127 (13.7%) | 83 (9.0%) |
| 60 to 89 Minutes | 21 (2.3%) | 13 (1.4%) |
| 90 or more Minutes | 60 (6.5%) | 0 (0.0%) |
Time of Departure to Work by Sex in Pilot Point
The most frequent times of departure to work in Pilot Point are 8:00 AM to 8:29 AM (207, 22.4%) for males and 7:00 AM to 7:29 AM (311, 33.9%) for females.
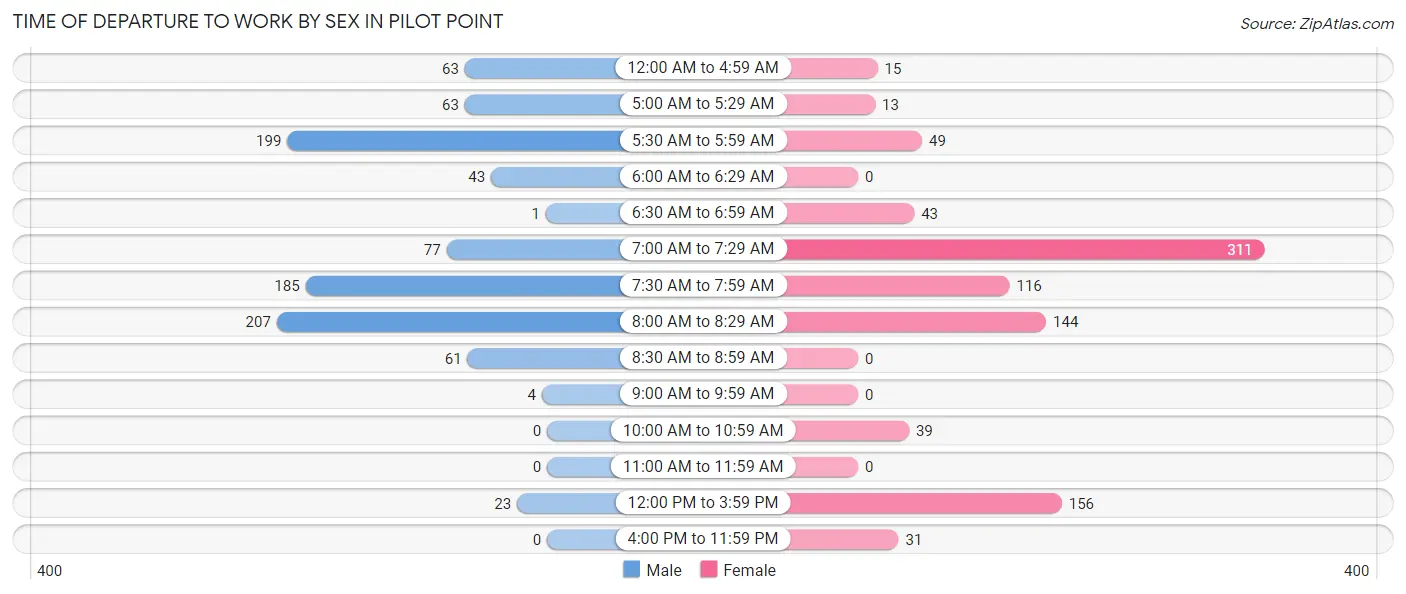
| Time of Departure | Male | Female |
| 12:00 AM to 4:59 AM | 63 (6.8%) | 15 (1.6%) |
| 5:00 AM to 5:29 AM | 63 (6.8%) | 13 (1.4%) |
| 5:30 AM to 5:59 AM | 199 (21.5%) | 49 (5.3%) |
| 6:00 AM to 6:29 AM | 43 (4.6%) | 0 (0.0%) |
| 6:30 AM to 6:59 AM | 1 (0.1%) | 43 (4.7%) |
| 7:00 AM to 7:29 AM | 77 (8.3%) | 311 (33.9%) |
| 7:30 AM to 7:59 AM | 185 (20.0%) | 116 (12.7%) |
| 8:00 AM to 8:29 AM | 207 (22.4%) | 144 (15.7%) |
| 8:30 AM to 8:59 AM | 61 (6.6%) | 0 (0.0%) |
| 9:00 AM to 9:59 AM | 4 (0.4%) | 0 (0.0%) |
| 10:00 AM to 10:59 AM | 0 (0.0%) | 39 (4.3%) |
| 11:00 AM to 11:59 AM | 0 (0.0%) | 0 (0.0%) |
| 12:00 PM to 3:59 PM | 23 (2.5%) | 156 (17.0%) |
| 4:00 PM to 11:59 PM | 0 (0.0%) | 31 (3.4%) |
| Total | 926 (100.0%) | 917 (100.0%) |
Housing Occupancy in Pilot Point
Occupancy by Ownership in Pilot Point
Of the total 1,706 dwellings in Pilot Point, owner-occupied units account for 1,032 (60.5%), while renter-occupied units make up 674 (39.5%).
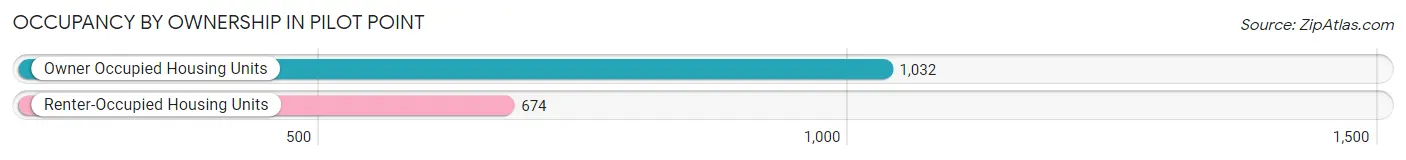
| Occupancy | # Housing Units | % Housing Units |
| Owner Occupied Housing Units | 1,032 | 60.5% |
| Renter-Occupied Housing Units | 674 | 39.5% |
| Total Occupied Housing Units | 1,706 | 100.0% |
Occupancy by Household Size in Pilot Point
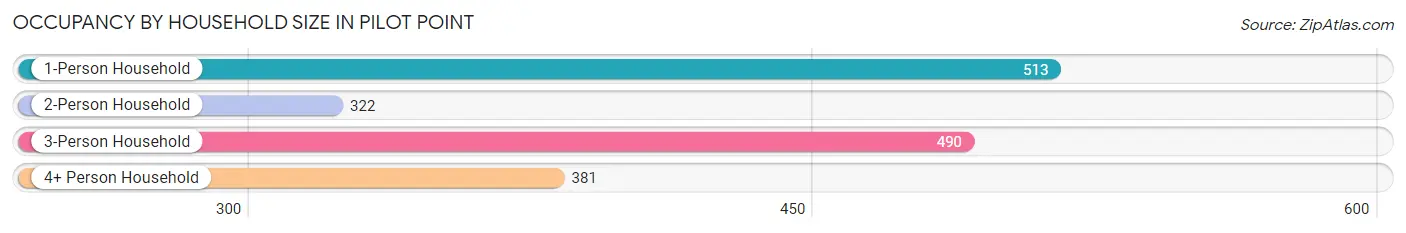
| Household Size | # Housing Units | % Housing Units |
| 1-Person Household | 513 | 30.1% |
| 2-Person Household | 322 | 18.9% |
| 3-Person Household | 490 | 28.7% |
| 4+ Person Household | 381 | 22.3% |
| Total Housing Units | 1,706 | 100.0% |
Occupancy by Ownership by Household Size in Pilot Point
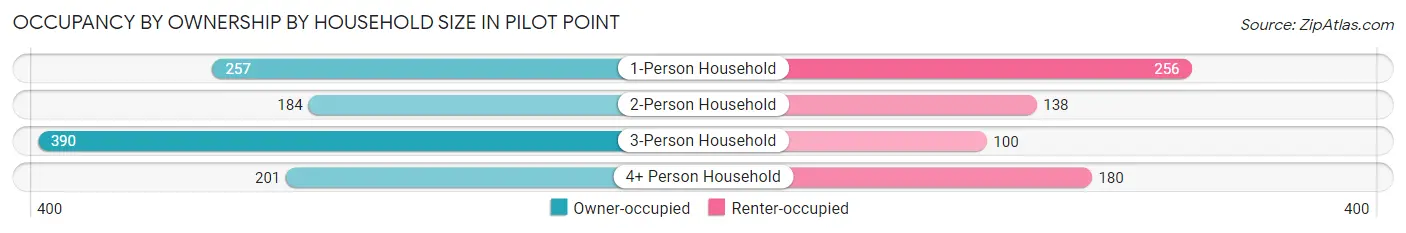
| Household Size | Owner-occupied | Renter-occupied |
| 1-Person Household | 257 (50.1%) | 256 (49.9%) |
| 2-Person Household | 184 (57.1%) | 138 (42.9%) |
| 3-Person Household | 390 (79.6%) | 100 (20.4%) |
| 4+ Person Household | 201 (52.8%) | 180 (47.2%) |
| Total Housing Units | 1,032 (60.5%) | 674 (39.5%) |
Occupancy by Educational Attainment in Pilot Point
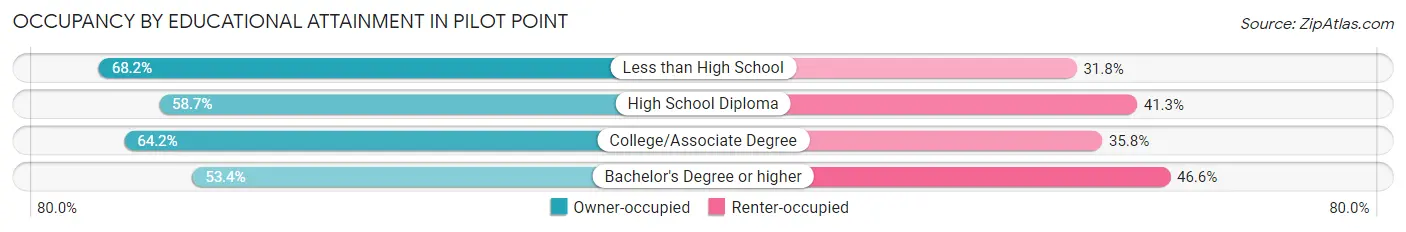
| Household Size | Owner-occupied | Renter-occupied |
| Less than High School | 189 (68.2%) | 88 (31.8%) |
| High School Diploma | 281 (58.7%) | 198 (41.3%) |
| College/Associate Degree | 326 (64.2%) | 182 (35.8%) |
| Bachelor's Degree or higher | 236 (53.4%) | 206 (46.6%) |
Occupancy by Age of Householder in Pilot Point
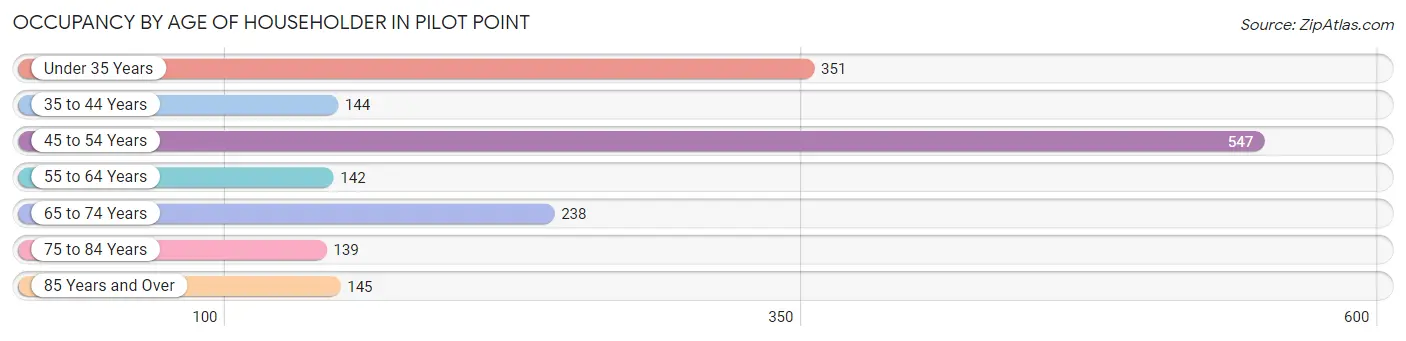
| Age Bracket | # Households | % Households |
| Under 35 Years | 351 | 20.6% |
| 35 to 44 Years | 144 | 8.4% |
| 45 to 54 Years | 547 | 32.1% |
| 55 to 64 Years | 142 | 8.3% |
| 65 to 74 Years | 238 | 14.0% |
| 75 to 84 Years | 139 | 8.2% |
| 85 Years and Over | 145 | 8.5% |
| Total | 1,706 | 100.0% |
Housing Finances in Pilot Point
Median Income by Occupancy in Pilot Point
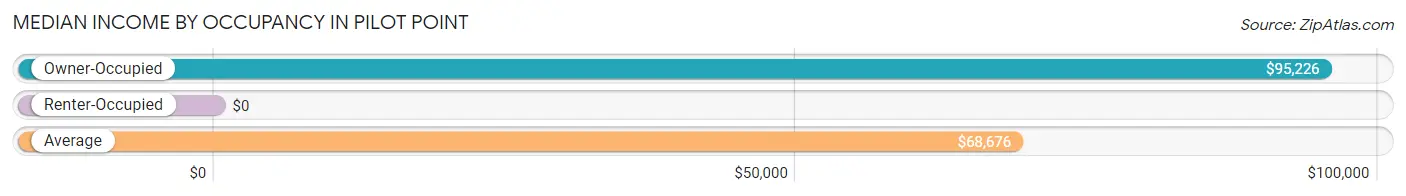
| Occupancy Type | # Households | Median Income |
| Owner-Occupied | 1,032 (60.5%) | $95,226 |
| Renter-Occupied | 674 (39.5%) | $0 |
| Average | 1,706 (100.0%) | $68,676 |
Occupancy by Householder Income Bracket in Pilot Point
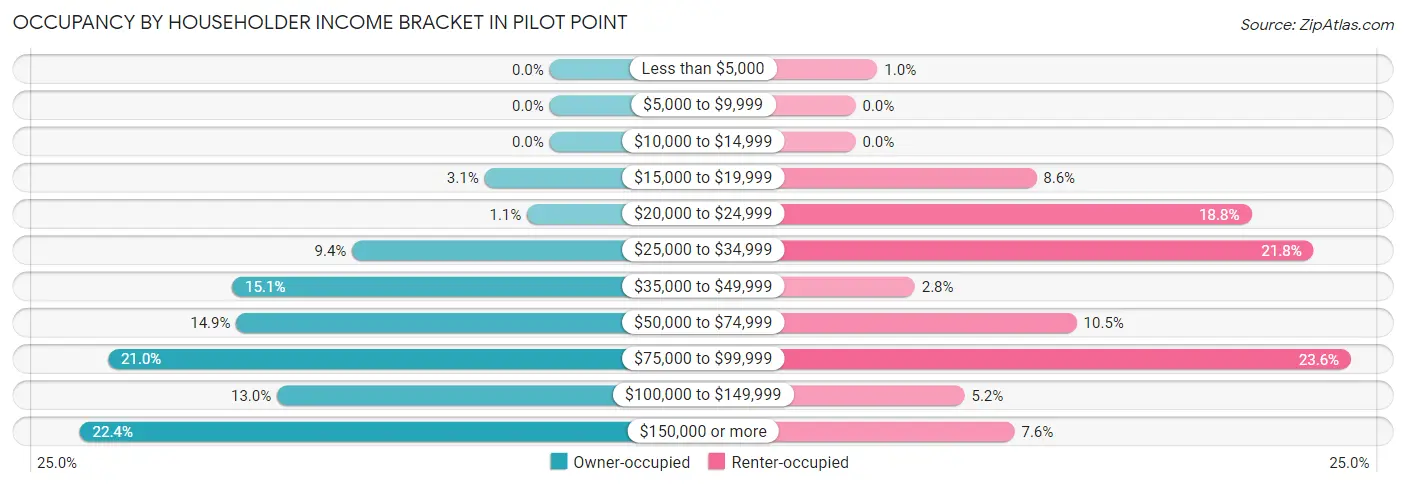
| Income Bracket | Owner-occupied | Renter-occupied |
| Less than $5,000 | 0 (0.0%) | 7 (1.0%) |
| $5,000 to $9,999 | 0 (0.0%) | 0 (0.0%) |
| $10,000 to $14,999 | 0 (0.0%) | 0 (0.0%) |
| $15,000 to $19,999 | 32 (3.1%) | 58 (8.6%) |
| $20,000 to $24,999 | 11 (1.1%) | 127 (18.8%) |
| $25,000 to $34,999 | 97 (9.4%) | 147 (21.8%) |
| $35,000 to $49,999 | 156 (15.1%) | 19 (2.8%) |
| $50,000 to $74,999 | 154 (14.9%) | 71 (10.5%) |
| $75,000 to $99,999 | 217 (21.0%) | 159 (23.6%) |
| $100,000 to $149,999 | 134 (13.0%) | 35 (5.2%) |
| $150,000 or more | 231 (22.4%) | 51 (7.6%) |
| Total | 1,032 (100.0%) | 674 (100.0%) |
Monthly Housing Cost Tiers in Pilot Point
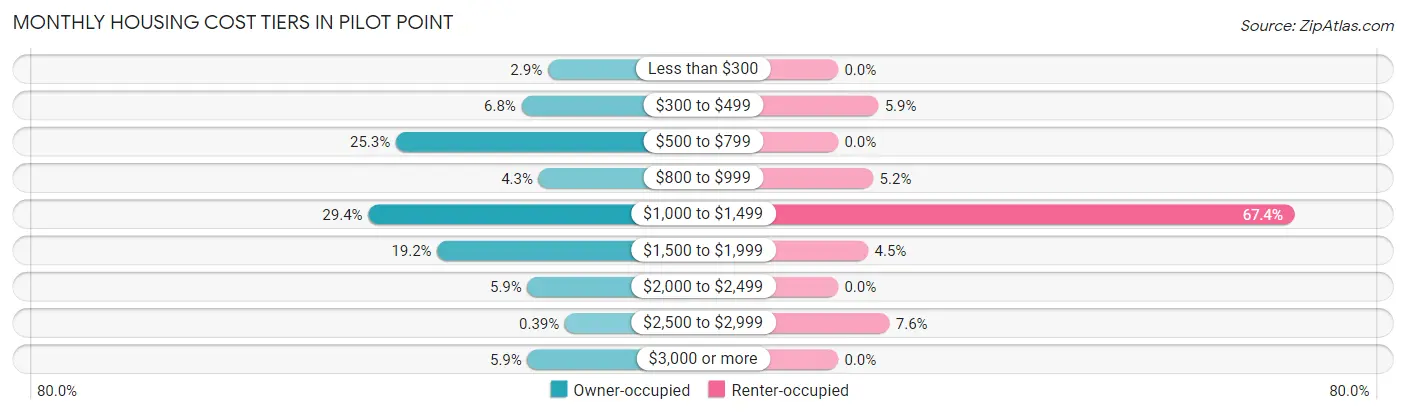
| Monthly Cost | Owner-occupied | Renter-occupied |
| Less than $300 | 30 (2.9%) | 0 (0.0%) |
| $300 to $499 | 70 (6.8%) | 40 (5.9%) |
| $500 to $799 | 261 (25.3%) | 0 (0.0%) |
| $800 to $999 | 44 (4.3%) | 35 (5.2%) |
| $1,000 to $1,499 | 303 (29.4%) | 454 (67.4%) |
| $1,500 to $1,999 | 198 (19.2%) | 30 (4.4%) |
| $2,000 to $2,499 | 61 (5.9%) | 0 (0.0%) |
| $2,500 to $2,999 | 4 (0.4%) | 51 (7.6%) |
| $3,000 or more | 61 (5.9%) | 0 (0.0%) |
| Total | 1,032 (100.0%) | 674 (100.0%) |
Physical Housing Characteristics in Pilot Point
Housing Structures in Pilot Point
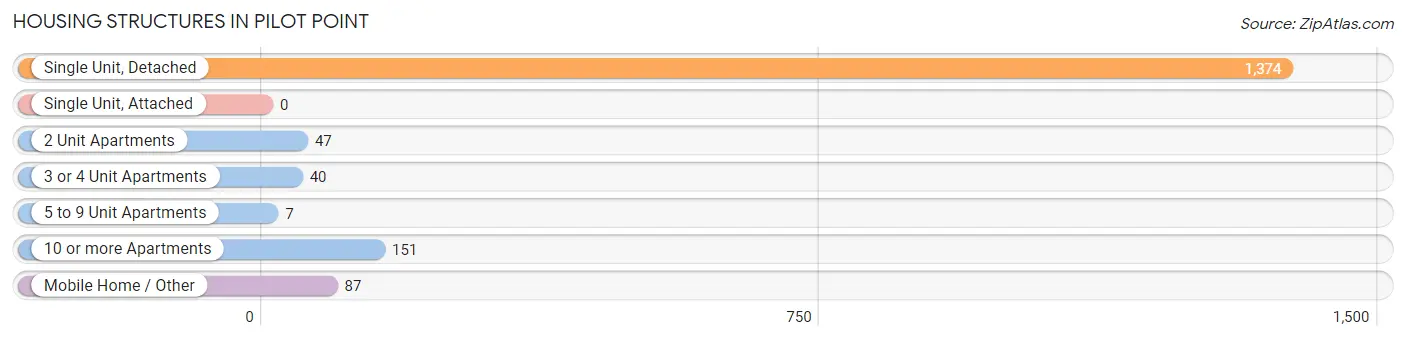
| Structure Type | # Housing Units | % Housing Units |
| Single Unit, Detached | 1,374 | 80.5% |
| Single Unit, Attached | 0 | 0.0% |
| 2 Unit Apartments | 47 | 2.8% |
| 3 or 4 Unit Apartments | 40 | 2.3% |
| 5 to 9 Unit Apartments | 7 | 0.4% |
| 10 or more Apartments | 151 | 8.8% |
| Mobile Home / Other | 87 | 5.1% |
| Total | 1,706 | 100.0% |
Housing Structures by Occupancy in Pilot Point
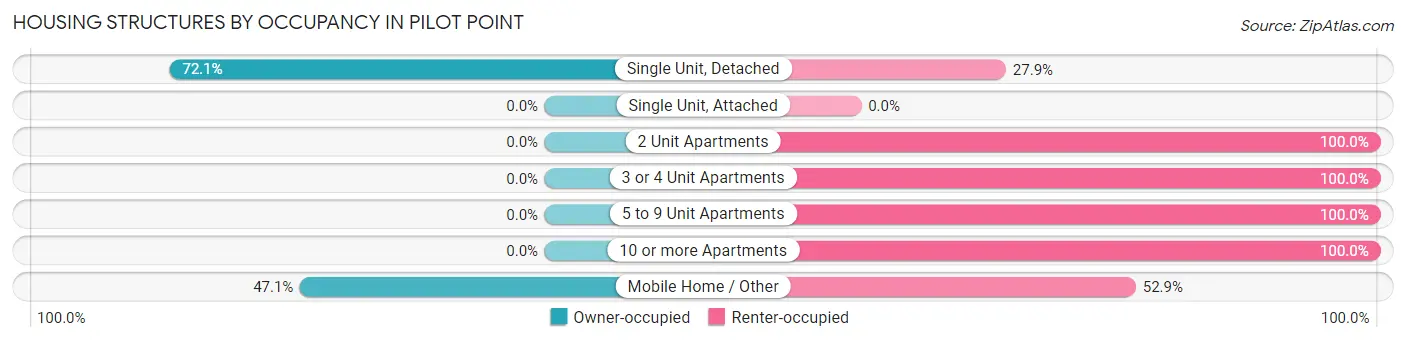
| Structure Type | Owner-occupied | Renter-occupied |
| Single Unit, Detached | 991 (72.1%) | 383 (27.9%) |
| Single Unit, Attached | 0 (0.0%) | 0 (0.0%) |
| 2 Unit Apartments | 0 (0.0%) | 47 (100.0%) |
| 3 or 4 Unit Apartments | 0 (0.0%) | 40 (100.0%) |
| 5 to 9 Unit Apartments | 0 (0.0%) | 7 (100.0%) |
| 10 or more Apartments | 0 (0.0%) | 151 (100.0%) |
| Mobile Home / Other | 41 (47.1%) | 46 (52.9%) |
| Total | 1,032 (60.5%) | 674 (39.5%) |
Housing Structures by Number of Rooms in Pilot Point
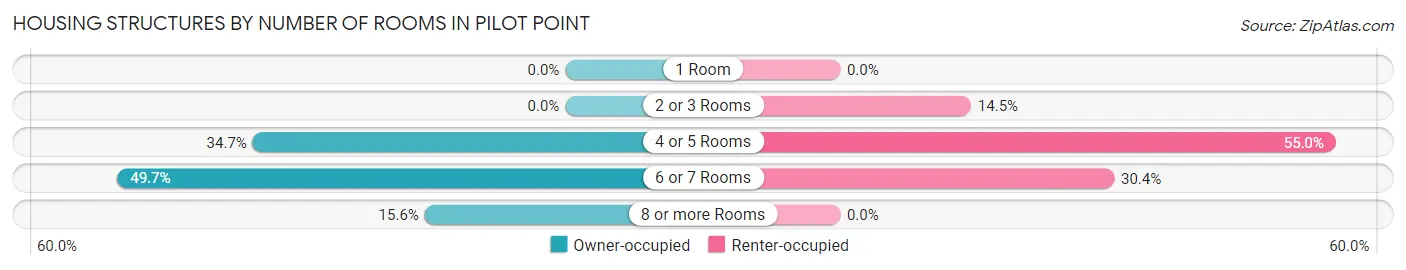
| Number of Rooms | Owner-occupied | Renter-occupied |
| 1 Room | 0 (0.0%) | 0 (0.0%) |
| 2 or 3 Rooms | 0 (0.0%) | 98 (14.5%) |
| 4 or 5 Rooms | 358 (34.7%) | 371 (55.0%) |
| 6 or 7 Rooms | 513 (49.7%) | 205 (30.4%) |
| 8 or more Rooms | 161 (15.6%) | 0 (0.0%) |
| Total | 1,032 (100.0%) | 674 (100.0%) |
Housing Structure by Heating Type in Pilot Point
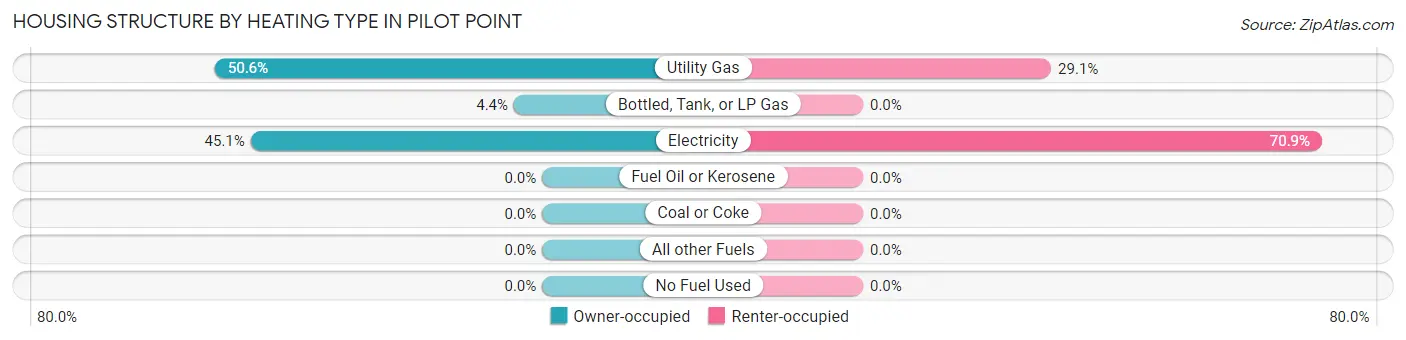
| Heating Type | Owner-occupied | Renter-occupied |
| Utility Gas | 522 (50.6%) | 196 (29.1%) |
| Bottled, Tank, or LP Gas | 45 (4.4%) | 0 (0.0%) |
| Electricity | 465 (45.1%) | 478 (70.9%) |
| Fuel Oil or Kerosene | 0 (0.0%) | 0 (0.0%) |
| Coal or Coke | 0 (0.0%) | 0 (0.0%) |
| All other Fuels | 0 (0.0%) | 0 (0.0%) |
| No Fuel Used | 0 (0.0%) | 0 (0.0%) |
| Total | 1,032 (100.0%) | 674 (100.0%) |
Household Vehicle Usage in Pilot Point
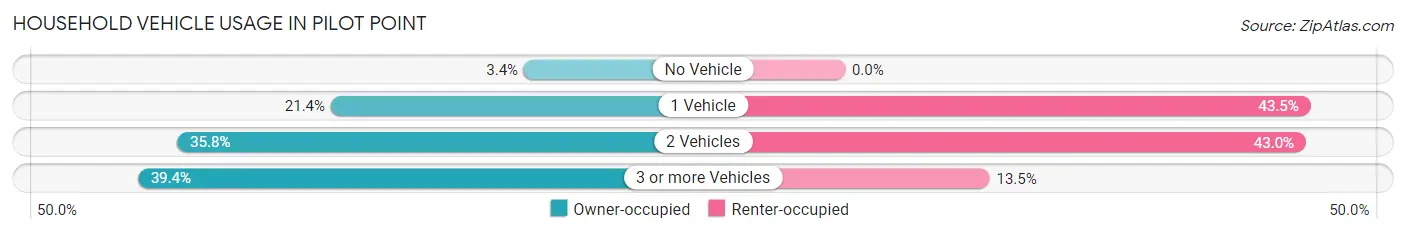
| Vehicles per Household | Owner-occupied | Renter-occupied |
| No Vehicle | 35 (3.4%) | 0 (0.0%) |
| 1 Vehicle | 221 (21.4%) | 293 (43.5%) |
| 2 Vehicles | 369 (35.8%) | 290 (43.0%) |
| 3 or more Vehicles | 407 (39.4%) | 91 (13.5%) |
| Total | 1,032 (100.0%) | 674 (100.0%) |
Real Estate & Mortgages in Pilot Point
Real Estate and Mortgage Overview in Pilot Point
| Characteristic | Without Mortgage | With Mortgage |
| Housing Units | 430 | 602 |
| Median Property Value | $234,400 | $198,400 |
| Median Household Income | $65,551 | $197 |
| Monthly Housing Costs | $586 | $61 |
| Real Estate Taxes | $1,825 | $0 |
Property Value by Mortgage Status in Pilot Point
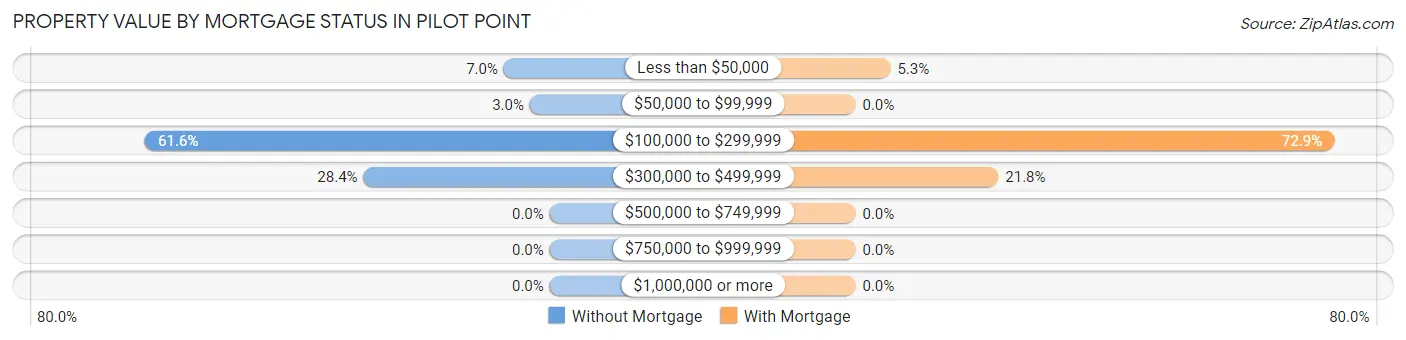
| Property Value | Without Mortgage | With Mortgage |
| Less than $50,000 | 30 (7.0%) | 32 (5.3%) |
| $50,000 to $99,999 | 13 (3.0%) | 0 (0.0%) |
| $100,000 to $299,999 | 265 (61.6%) | 439 (72.9%) |
| $300,000 to $499,999 | 122 (28.4%) | 131 (21.8%) |
| $500,000 to $749,999 | 0 (0.0%) | 0 (0.0%) |
| $750,000 to $999,999 | 0 (0.0%) | 0 (0.0%) |
| $1,000,000 or more | 0 (0.0%) | 0 (0.0%) |
| Total | 430 (100.0%) | 602 (100.0%) |
Household Income by Mortgage Status in Pilot Point
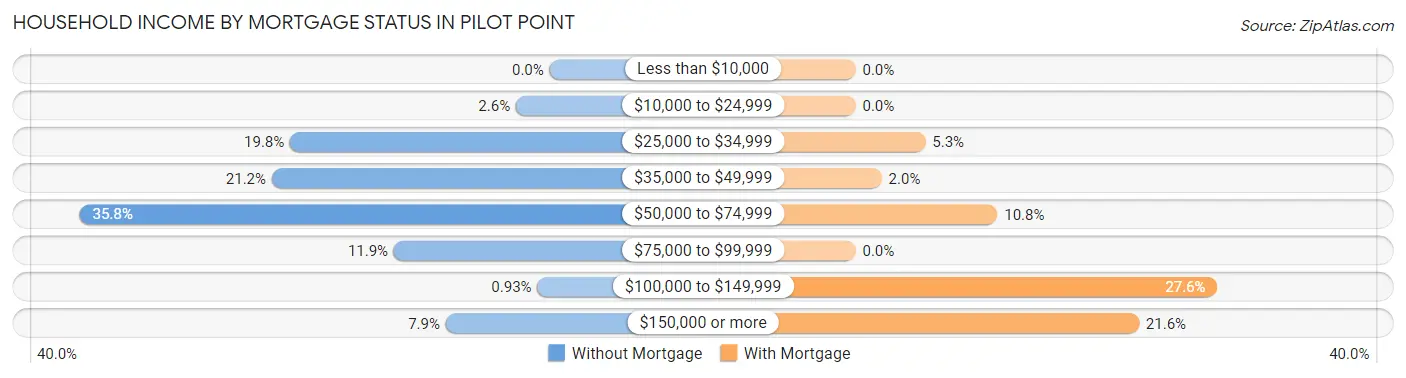
| Household Income | Without Mortgage | With Mortgage |
| Less than $10,000 | 0 (0.0%) | 0 (0.0%) |
| $10,000 to $24,999 | 11 (2.6%) | 0 (0.0%) |
| $25,000 to $34,999 | 85 (19.8%) | 32 (5.3%) |
| $35,000 to $49,999 | 91 (21.2%) | 12 (2.0%) |
| $50,000 to $74,999 | 154 (35.8%) | 65 (10.8%) |
| $75,000 to $99,999 | 51 (11.9%) | 0 (0.0%) |
| $100,000 to $149,999 | 4 (0.9%) | 166 (27.6%) |
| $150,000 or more | 34 (7.9%) | 130 (21.6%) |
| Total | 430 (100.0%) | 602 (100.0%) |
Property Value to Household Income Ratio in Pilot Point
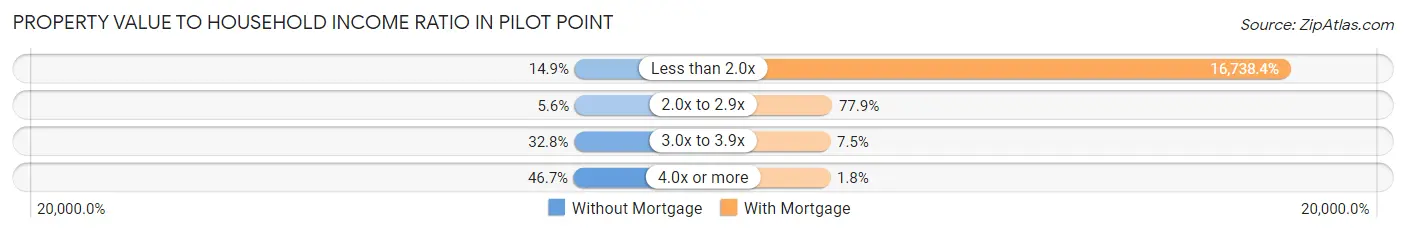
| Value-to-Income Ratio | Without Mortgage | With Mortgage |
| Less than 2.0x | 64 (14.9%) | 100,765 (16,738.4%) |
| 2.0x to 2.9x | 24 (5.6%) | 469 (77.9%) |
| 3.0x to 3.9x | 141 (32.8%) | 45 (7.5%) |
| 4.0x or more | 201 (46.7%) | 11 (1.8%) |
| Total | 430 (100.0%) | 602 (100.0%) |
Real Estate Taxes by Mortgage Status in Pilot Point
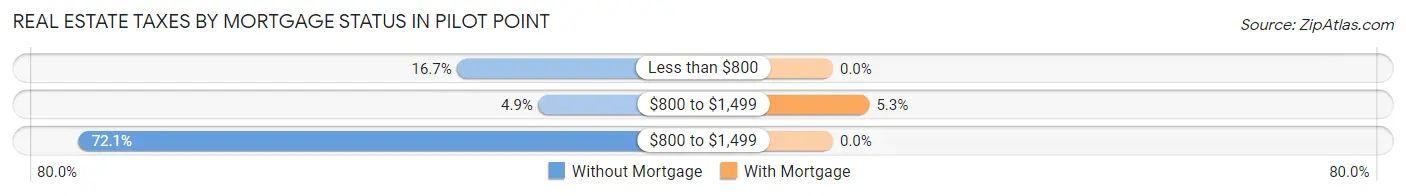
| Property Taxes | Without Mortgage | With Mortgage |
| Less than $800 | 72 (16.7%) | 0 (0.0%) |
| $800 to $1,499 | 21 (4.9%) | 32 (5.3%) |
| $800 to $1,499 | 310 (72.1%) | 0 (0.0%) |
| Total | 430 (100.0%) | 602 (100.0%) |
Health & Disability in Pilot Point
Health Insurance Coverage by Age in Pilot Point
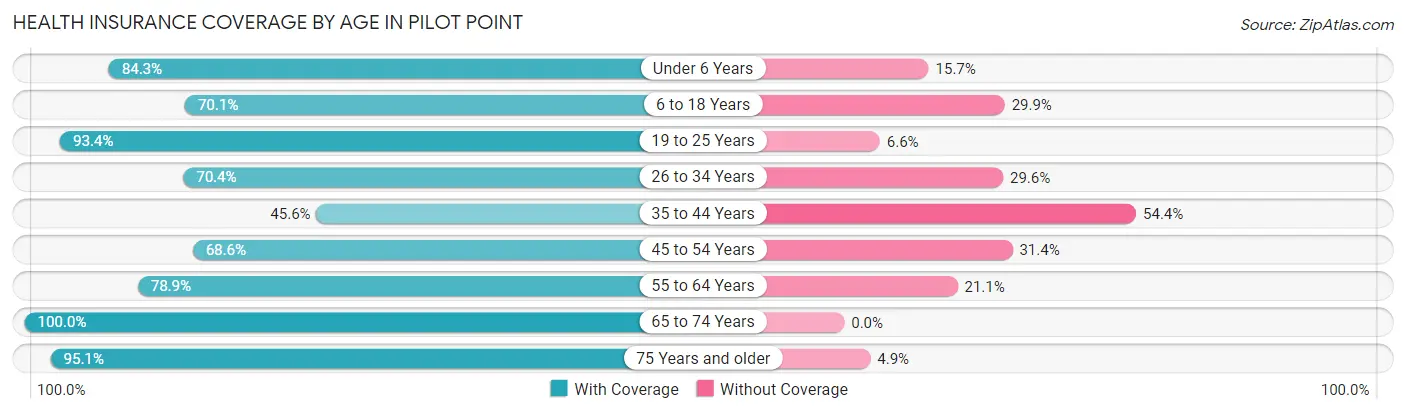
| Age Bracket | With Coverage | Without Coverage |
| Under 6 Years | 327 (84.3%) | 61 (15.7%) |
| 6 to 18 Years | 443 (70.1%) | 189 (29.9%) |
| 19 to 25 Years | 465 (93.4%) | 33 (6.6%) |
| 26 to 34 Years | 409 (70.4%) | 172 (29.6%) |
| 35 to 44 Years | 103 (45.6%) | 123 (54.4%) |
| 45 to 54 Years | 694 (68.6%) | 317 (31.4%) |
| 55 to 64 Years | 254 (78.9%) | 68 (21.1%) |
| 65 to 74 Years | 273 (100.0%) | 0 (0.0%) |
| 75 Years and older | 411 (95.1%) | 21 (4.9%) |
| Total | 3,379 (77.4%) | 984 (22.6%) |
Health Insurance Coverage by Citizenship Status in Pilot Point
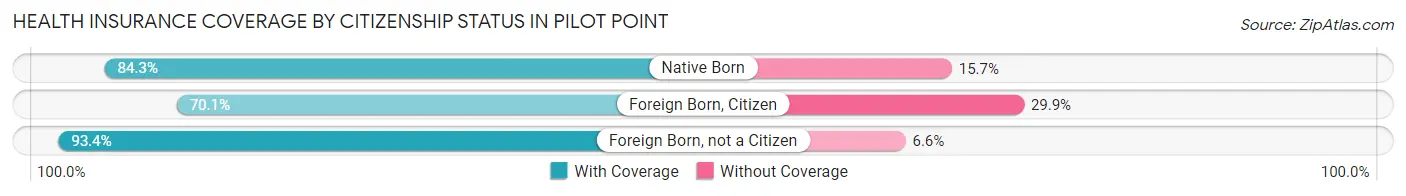
| Citizenship Status | With Coverage | Without Coverage |
| Native Born | 327 (84.3%) | 61 (15.7%) |
| Foreign Born, Citizen | 443 (70.1%) | 189 (29.9%) |
| Foreign Born, not a Citizen | 465 (93.4%) | 33 (6.6%) |
Health Insurance Coverage by Household Income in Pilot Point
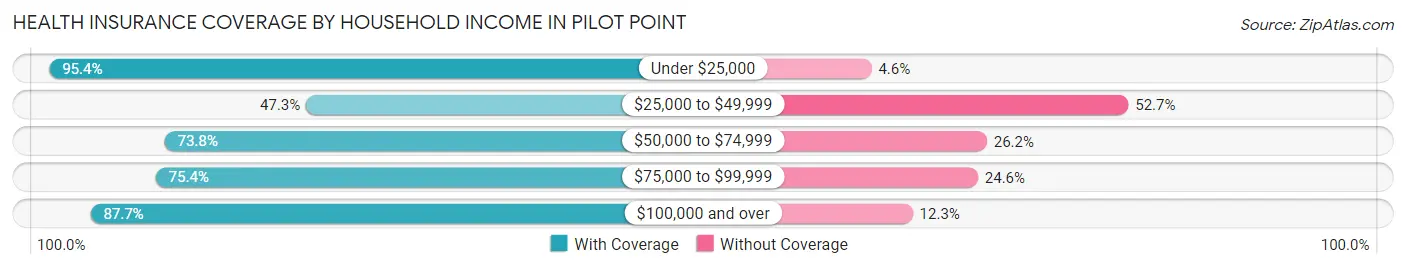
| Household Income | With Coverage | Without Coverage |
| Under $25,000 | 475 (95.4%) | 23 (4.6%) |
| $25,000 to $49,999 | 285 (47.3%) | 318 (52.7%) |
| $50,000 to $74,999 | 495 (73.8%) | 176 (26.2%) |
| $75,000 to $99,999 | 909 (75.4%) | 296 (24.6%) |
| $100,000 and over | 1,215 (87.7%) | 171 (12.3%) |
Public vs Private Health Insurance Coverage by Age in Pilot Point
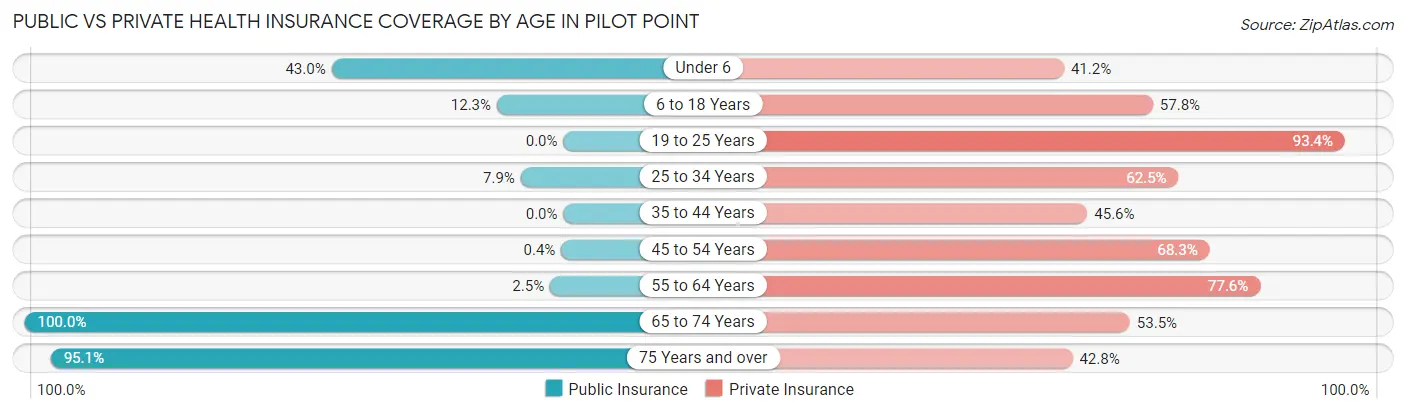
| Age Bracket | Public Insurance | Private Insurance |
| Under 6 | 167 (43.0%) | 160 (41.2%) |
| 6 to 18 Years | 78 (12.3%) | 365 (57.8%) |
| 19 to 25 Years | 0 (0.0%) | 465 (93.4%) |
| 25 to 34 Years | 46 (7.9%) | 363 (62.5%) |
| 35 to 44 Years | 0 (0.0%) | 103 (45.6%) |
| 45 to 54 Years | 4 (0.4%) | 690 (68.2%) |
| 55 to 64 Years | 8 (2.5%) | 250 (77.6%) |
| 65 to 74 Years | 273 (100.0%) | 146 (53.5%) |
| 75 Years and over | 411 (95.1%) | 185 (42.8%) |
| Total | 987 (22.6%) | 2,727 (62.5%) |
Disability Status by Sex by Age in Pilot Point
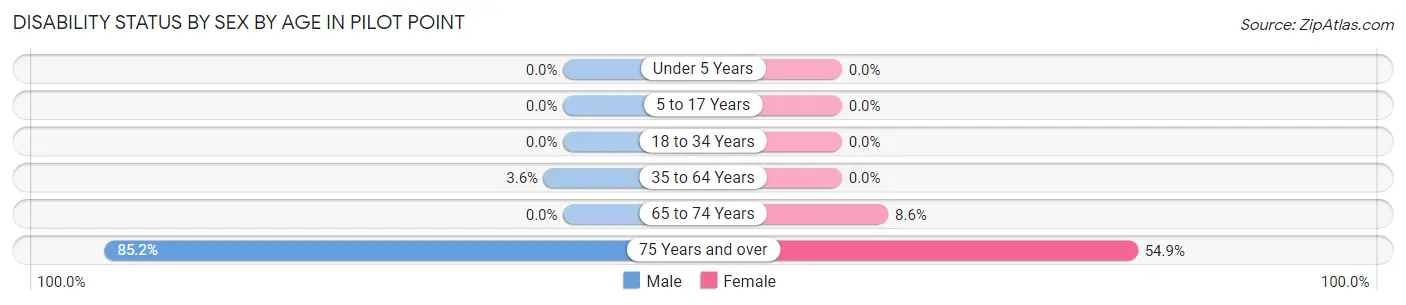
| Age Bracket | Male | Female |
| Under 5 Years | 0 (0.0%) | 0 (0.0%) |
| 5 to 17 Years | 0 (0.0%) | 0 (0.0%) |
| 18 to 34 Years | 0 (0.0%) | 0 (0.0%) |
| 35 to 64 Years | 29 (3.6%) | 0 (0.0%) |
| 65 to 74 Years | 0 (0.0%) | 17 (8.6%) |
| 75 Years and over | 109 (85.2%) | 167 (54.9%) |
Disability Class by Sex by Age in Pilot Point
Disability Class: Hearing Difficulty
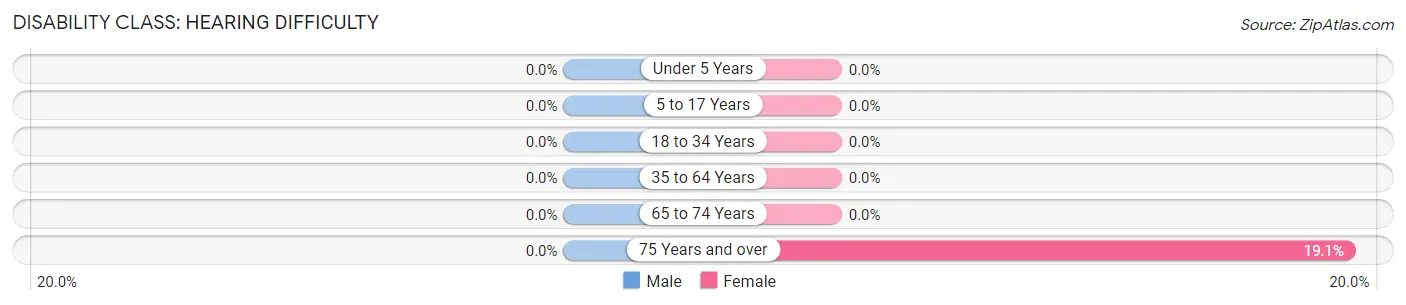
| Age Bracket | Male | Female |
| Under 5 Years | 0 (0.0%) | 0 (0.0%) |
| 5 to 17 Years | 0 (0.0%) | 0 (0.0%) |
| 18 to 34 Years | 0 (0.0%) | 0 (0.0%) |
| 35 to 64 Years | 0 (0.0%) | 0 (0.0%) |
| 65 to 74 Years | 0 (0.0%) | 0 (0.0%) |
| 75 Years and over | 0 (0.0%) | 58 (19.1%) |
Disability Class: Vision Difficulty
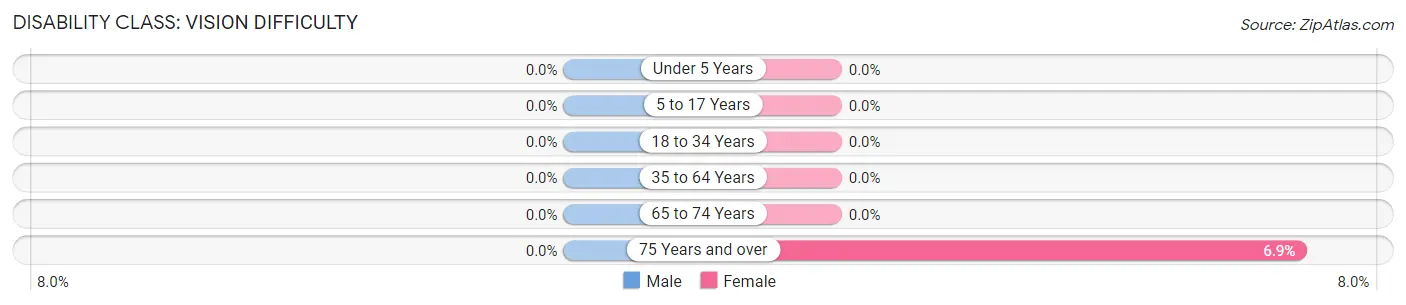
| Age Bracket | Male | Female |
| Under 5 Years | 0 (0.0%) | 0 (0.0%) |
| 5 to 17 Years | 0 (0.0%) | 0 (0.0%) |
| 18 to 34 Years | 0 (0.0%) | 0 (0.0%) |
| 35 to 64 Years | 0 (0.0%) | 0 (0.0%) |
| 65 to 74 Years | 0 (0.0%) | 0 (0.0%) |
| 75 Years and over | 0 (0.0%) | 21 (6.9%) |
Disability Class: Cognitive Difficulty
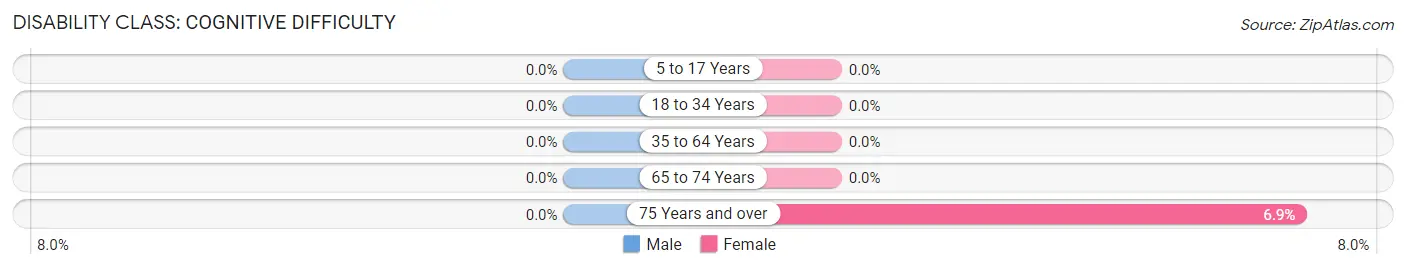
| Age Bracket | Male | Female |
| 5 to 17 Years | 0 (0.0%) | 0 (0.0%) |
| 18 to 34 Years | 0 (0.0%) | 0 (0.0%) |
| 35 to 64 Years | 0 (0.0%) | 0 (0.0%) |
| 65 to 74 Years | 0 (0.0%) | 0 (0.0%) |
| 75 Years and over | 0 (0.0%) | 21 (6.9%) |
Disability Class: Ambulatory Difficulty
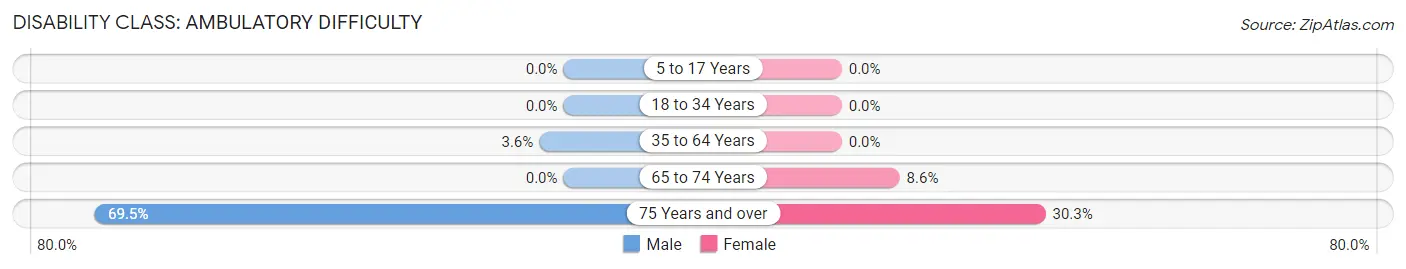
| Age Bracket | Male | Female |
| 5 to 17 Years | 0 (0.0%) | 0 (0.0%) |
| 18 to 34 Years | 0 (0.0%) | 0 (0.0%) |
| 35 to 64 Years | 29 (3.6%) | 0 (0.0%) |
| 65 to 74 Years | 0 (0.0%) | 17 (8.6%) |
| 75 Years and over | 89 (69.5%) | 92 (30.3%) |
Disability Class: Self-Care Difficulty
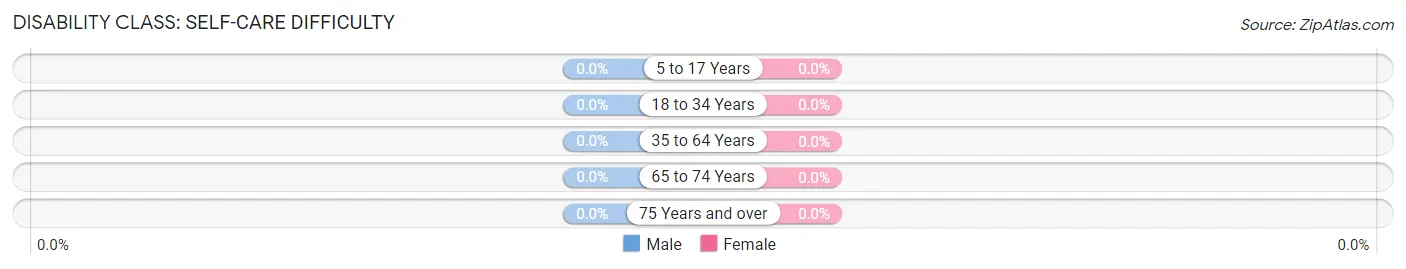
| Age Bracket | Male | Female |
| 5 to 17 Years | 0 (0.0%) | 0 (0.0%) |
| 18 to 34 Years | 0 (0.0%) | 0 (0.0%) |
| 35 to 64 Years | 0 (0.0%) | 0 (0.0%) |
| 65 to 74 Years | 0 (0.0%) | 0 (0.0%) |
| 75 Years and over | 0 (0.0%) | 0 (0.0%) |
Technology Access in Pilot Point
Computing Device Access in Pilot Point
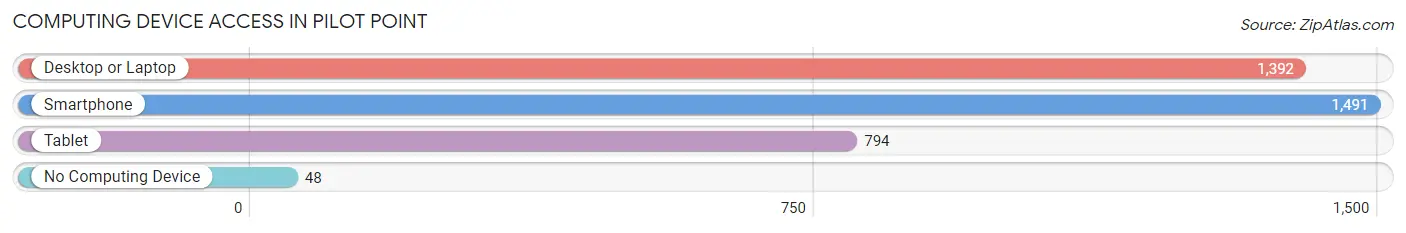
| Device Type | # Households | % Households |
| Desktop or Laptop | 1,392 | 81.6% |
| Smartphone | 1,491 | 87.4% |
| Tablet | 794 | 46.5% |
| No Computing Device | 48 | 2.8% |
| Total | 1,706 | 100.0% |
Internet Access in Pilot Point
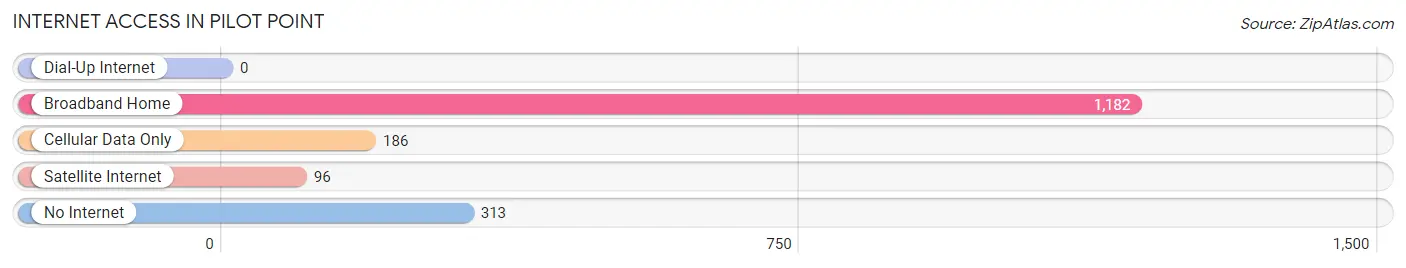
| Internet Type | # Households | % Households |
| Dial-Up Internet | 0 | 0.0% |
| Broadband Home | 1,182 | 69.3% |
| Cellular Data Only | 186 | 10.9% |
| Satellite Internet | 96 | 5.6% |
| No Internet | 313 | 18.3% |
| Total | 1,706 | 100.0% |
Pilot Point Summary
Pilot Point, Texas is a small town located in Denton County, Texas, United States. It is situated about 40 miles north of Dallas and is part of the Dallas-Fort Worth metropolitan area. The town was founded in 1853 and has a population of approximately 3,000 people.
History
Pilot Point was founded in 1853 by a group of settlers from Kentucky and Tennessee. The town was named after a nearby hill that was used as a navigational landmark by early settlers. The hill was known as Pilot Point because it was used as a reference point for pilots navigating the area.
The town was originally a farming community, but in the late 19th century, it became a center for the cattle industry. The town was also home to a number of businesses, including a cotton gin, a blacksmith shop, and a general store.
In the early 20th century, Pilot Point began to experience a period of growth. The town was incorporated in 1912 and the population grew to over 1,000 people by 1920. The town continued to grow throughout the 20th century and by 2000, the population had reached 3,000 people.
Geography
Pilot Point is located in Denton County, Texas, United States. It is situated about 40 miles north of Dallas and is part of the Dallas-Fort Worth metropolitan area. The town is situated on the banks of the Trinity River and is surrounded by rolling hills and prairies.
The climate in Pilot Point is generally mild and humid. The average temperature in the summer is around 90 degrees Fahrenheit and the average temperature in the winter is around 50 degrees Fahrenheit.
Economy
Pilot Point’s economy is largely based on agriculture and tourism. The town is home to a number of farms and ranches, which produce a variety of crops, including cotton, corn, and hay. The town is also home to a number of tourist attractions, including the Pilot Point Historical Museum and the Pilot Point Nature Preserve.
The town is also home to a number of businesses, including restaurants, retail stores, and auto repair shops. The town is also home to a number of manufacturing companies, including a furniture factory and a plastics factory.
Demographics
As of the 2010 census, the population of Pilot Point was 3,068. The racial makeup of the town was 94.3% White, 0.7% African American, 0.3% Native American, 0.3% Asian, 0.1% Pacific Islander, 2.7% from other races, and 1.9% from two or more races. Hispanic or Latino of any race were 5.3% of the population.
The median income for a household in Pilot Point was $41,250 and the median income for a family was $50,000. The per capita income for the town was $20,845. About 11.2% of families and 14.2% of the population were below the poverty line, including 18.2% of those under age 18 and 8.3% of those age 65 or over.
Common Questions
What is Per Capita Income in Pilot Point?
Per Capita income in Pilot Point is $33,244.
What is the Median Family Income in Pilot Point?
Median Family Income in Pilot Point is $95,497.
What is the Median Household income in Pilot Point?
Median Household Income in Pilot Point is $68,676.
What is Income or Wage Gap in Pilot Point?
Income or Wage Gap in Pilot Point is 44.7%.
Women in Pilot Point earn 55.3 cents for every dollar earned by a man.
What is Inequality or Gini Index in Pilot Point?
Inequality or Gini Index in Pilot Point is 0.41.
What is the Total Population of Pilot Point?
Total Population of Pilot Point is 4,509.
What is the Total Male Population of Pilot Point?
Total Male Population of Pilot Point is 1,960.
What is the Total Female Population of Pilot Point?
Total Female Population of Pilot Point is 2,549.
What is the Ratio of Males per 100 Females in Pilot Point?
There are 76.89 Males per 100 Females in Pilot Point.
What is the Ratio of Females per 100 Males in Pilot Point?
There are 130.05 Females per 100 Males in Pilot Point.
What is the Median Population Age in Pilot Point?
Median Population Age in Pilot Point is 43.1 Years.
What is the Average Family Size in Pilot Point
Average Family Size in Pilot Point is 3.4 People.
What is the Average Household Size in Pilot Point
Average Household Size in Pilot Point is 2.6 People.
How Large is the Labor Force in Pilot Point?
There are 2,319 People in the Labor Forcein in Pilot Point.
What is the Percentage of People in the Labor Force in Pilot Point?
63.7% of People are in the Labor Force in Pilot Point.
What is the Unemployment Rate in Pilot Point?
Unemployment Rate in Pilot Point is 7.9%.