Perryton, TX Map & Demographics
Perryton Map
Perryton Overview
$28,589
PER CAPITA INCOME
$74,375
AVG FAMILY INCOME
$61,067
AVG HOUSEHOLD INCOME
45.8%
WAGE / INCOME GAP [ % ]
54.2¢/ $1
WAGE / INCOME GAP [ $ ]
$12,112
FAMILY INCOME DEFICIT
0.39
INEQUALITY / GINI INDEX
8,664
TOTAL POPULATION
4,314
MALE POPULATION
4,350
FEMALE POPULATION
99.17
MALES / 100 FEMALES
100.83
FEMALES / 100 MALES
33.1
MEDIAN AGE
3.1
AVG FAMILY SIZE
2.7
AVG HOUSEHOLD SIZE
4,333
LABOR FORCE [ PEOPLE ]
66.9%
PERCENT IN LABOR FORCE
1.6%
UNEMPLOYMENT RATE
Perryton Zip Codes
Perryton Area Codes
Income in Perryton
Income Overview in Perryton
Per Capita Income in Perryton is $28,589, while median incomes of families and households are $74,375 and $61,067 respectively.
| Characteristic | Number | Measure |
| Per Capita Income | 8,664 | $28,589 |
| Median Family Income | 2,277 | $74,375 |
| Mean Family Income | 2,277 | $78,266 |
| Median Household Income | 3,206 | $61,067 |
| Mean Household Income | 3,206 | $74,923 |
| Income Deficit | 2,277 | $12,112 |
| Wage / Income Gap (%) | 8,664 | 45.79% |
| Wage / Income Gap ($) | 8,664 | 54.21¢ per $1 |
| Gini / Inequality Index | 8,664 | 0.39 |
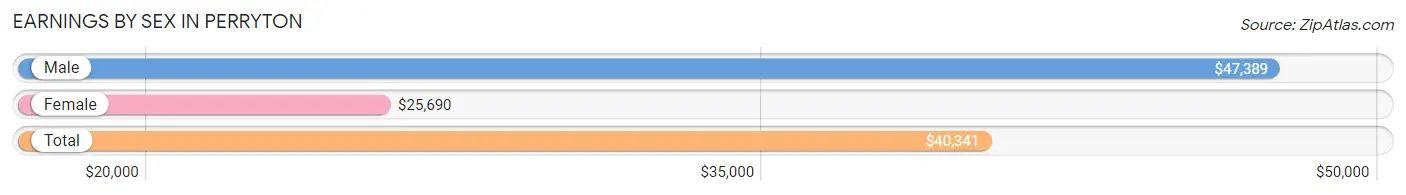
Earnings by Sex in Perryton
Average Earnings in Perryton are $40,341, $47,389 for men and $25,690 for women, a difference of 45.8%.
| Sex | Number | Average Earnings |
| Male | 2,694 (60.1%) | $47,389 |
| Female | 1,786 (39.9%) | $25,690 |
| Total | 4,480 (100.0%) | $40,341 |
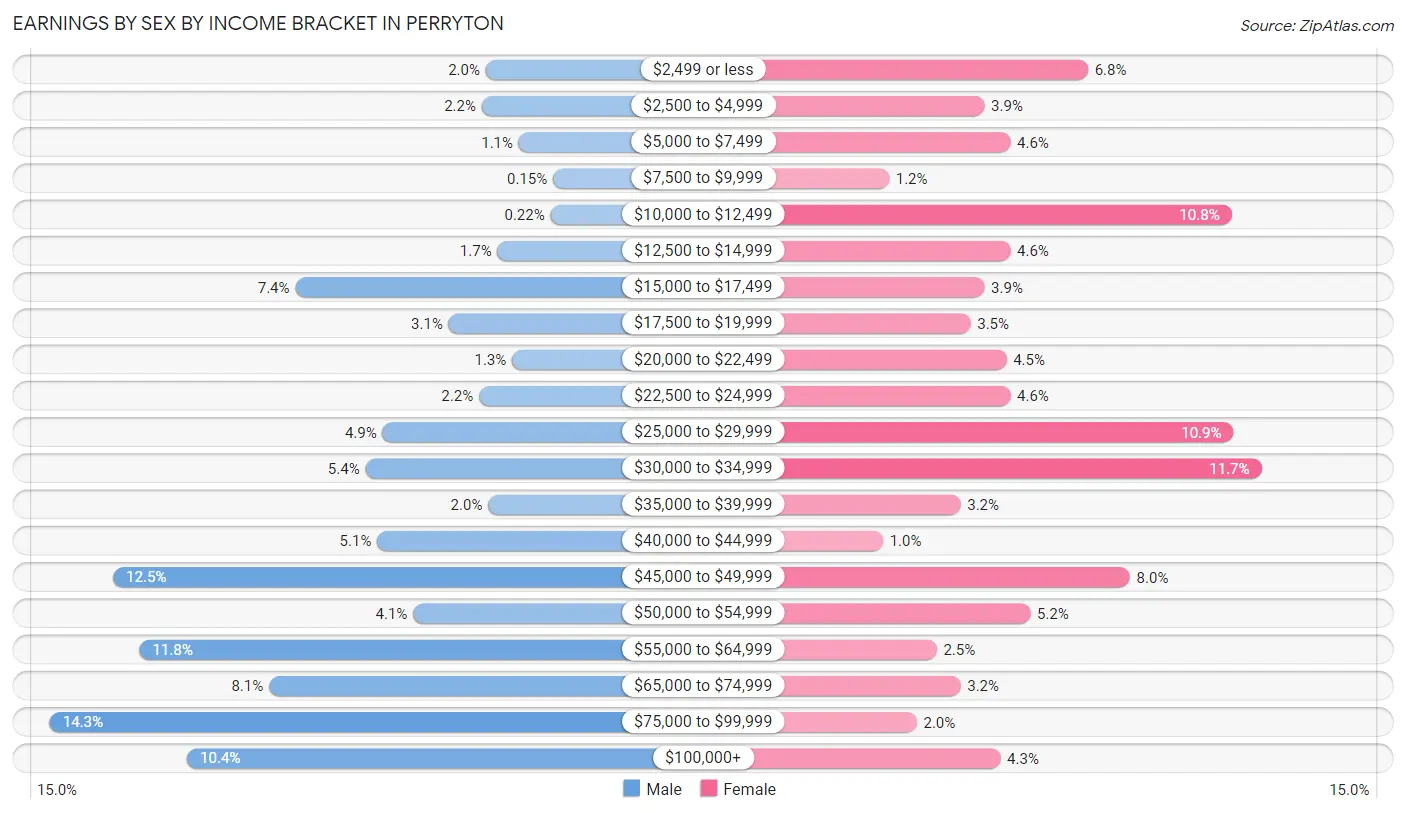
Earnings by Sex by Income Bracket in Perryton
The most common earnings brackets in Perryton are $75,000 to $99,999 for men (385 | 14.3%) and $30,000 to $34,999 for women (208 | 11.7%).
| Income | Male | Female |
| $2,499 or less | 55 (2.0%) | 121 (6.8%) |
| $2,500 to $4,999 | 58 (2.1%) | 69 (3.9%) |
| $5,000 to $7,499 | 30 (1.1%) | 82 (4.6%) |
| $7,500 to $9,999 | 4 (0.2%) | 21 (1.2%) |
| $10,000 to $12,499 | 6 (0.2%) | 193 (10.8%) |
| $12,500 to $14,999 | 46 (1.7%) | 82 (4.6%) |
| $15,000 to $17,499 | 199 (7.4%) | 69 (3.9%) |
| $17,500 to $19,999 | 83 (3.1%) | 62 (3.5%) |
| $20,000 to $22,499 | 35 (1.3%) | 80 (4.5%) |
| $22,500 to $24,999 | 60 (2.2%) | 82 (4.6%) |
| $25,000 to $29,999 | 133 (4.9%) | 194 (10.9%) |
| $30,000 to $34,999 | 146 (5.4%) | 208 (11.7%) |
| $35,000 to $39,999 | 53 (2.0%) | 57 (3.2%) |
| $40,000 to $44,999 | 137 (5.1%) | 18 (1.0%) |
| $45,000 to $49,999 | 337 (12.5%) | 142 (8.0%) |
| $50,000 to $54,999 | 110 (4.1%) | 92 (5.1%) |
| $55,000 to $64,999 | 317 (11.8%) | 45 (2.5%) |
| $65,000 to $74,999 | 219 (8.1%) | 57 (3.2%) |
| $75,000 to $99,999 | 385 (14.3%) | 35 (2.0%) |
| $100,000+ | 281 (10.4%) | 77 (4.3%) |
| Total | 2,694 (100.0%) | 1,786 (100.0%) |
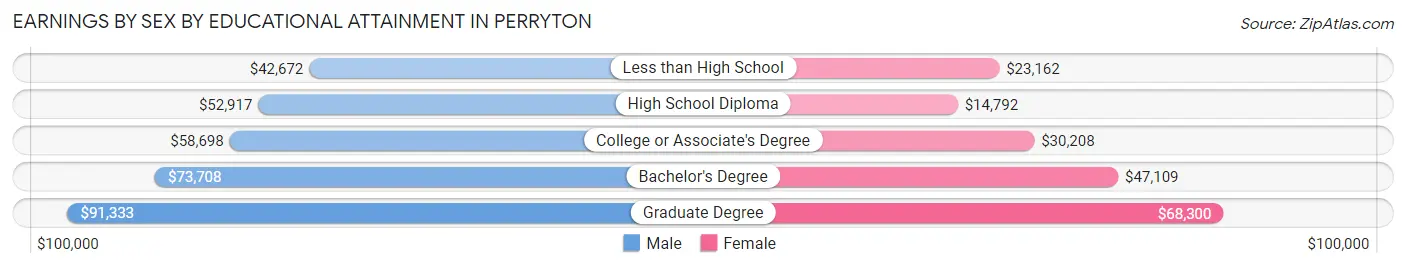
Earnings by Sex by Educational Attainment in Perryton
Average earnings in Perryton are $54,957 for men and $25,740 for women, a difference of 53.2%. Men with an educational attainment of graduate degree enjoy the highest average annual earnings of $91,333, while those with less than high school education earn the least with $42,672. Women with an educational attainment of graduate degree earn the most with the average annual earnings of $68,300, while those with high school diploma education have the smallest earnings of $14,792.
| Educational Attainment | Male Income | Female Income |
| Less than High School | $42,672 | $23,162 |
| High School Diploma | $52,917 | $14,792 |
| College or Associate's Degree | $58,698 | $30,208 |
| Bachelor's Degree | $73,708 | $47,109 |
| Graduate Degree | $91,333 | $68,300 |
| Total | $54,957 | $25,740 |
Family Income in Perryton
Family Income Brackets in Perryton
According to the Perryton family income data, there are 515 families falling into the $75,000 to $99,999 income range, which is the most common income bracket and makes up 22.6% of all families. Conversely, the $10,000 to $14,999 income bracket is the least frequent group with only 34 families (1.5%) belonging to this category.
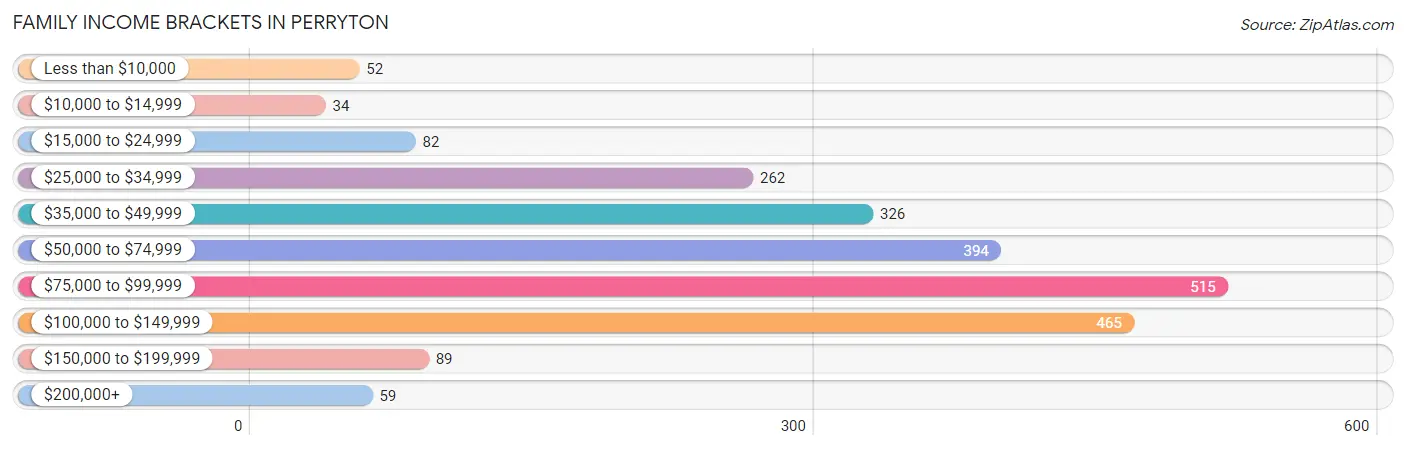
| Income Bracket | # Families | % Families |
| Less than $10,000 | 52 | 2.3% |
| $10,000 to $14,999 | 34 | 1.5% |
| $15,000 to $24,999 | 82 | 3.6% |
| $25,000 to $34,999 | 262 | 11.5% |
| $35,000 to $49,999 | 326 | 14.3% |
| $50,000 to $74,999 | 394 | 17.3% |
| $75,000 to $99,999 | 515 | 22.6% |
| $100,000 to $149,999 | 465 | 20.4% |
| $150,000 to $199,999 | 89 | 3.9% |
| $200,000+ | 59 | 2.6% |
Family Income by Famaliy Size in Perryton
4-person families (511 | 22.4%) account for the highest median family income in Perryton with $83,512 per family, while 2-person families (941 | 41.3%) have the highest median income of $40,087 per family member.
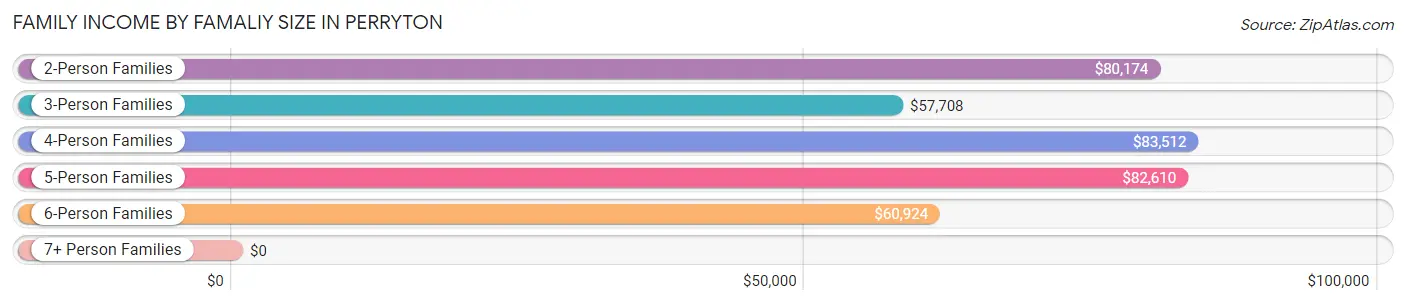
| Income Bracket | # Families | Median Income |
| 2-Person Families | 941 (41.3%) | $80,174 |
| 3-Person Families | 391 (17.2%) | $57,708 |
| 4-Person Families | 511 (22.4%) | $83,512 |
| 5-Person Families | 223 (9.8%) | $82,610 |
| 6-Person Families | 211 (9.3%) | $60,924 |
| 7+ Person Families | 0 (0.0%) | $0 |
| Total | 2,277 (100.0%) | $74,375 |
Family Income by Number of Earners in Perryton
The median family income in Perryton is $74,375, with families comprising 3+ earners (161) having the highest median family income of $103,533, while families with no earners (136) have the lowest median family income of $34,074, accounting for 7.1% and 6.0% of families, respectively.
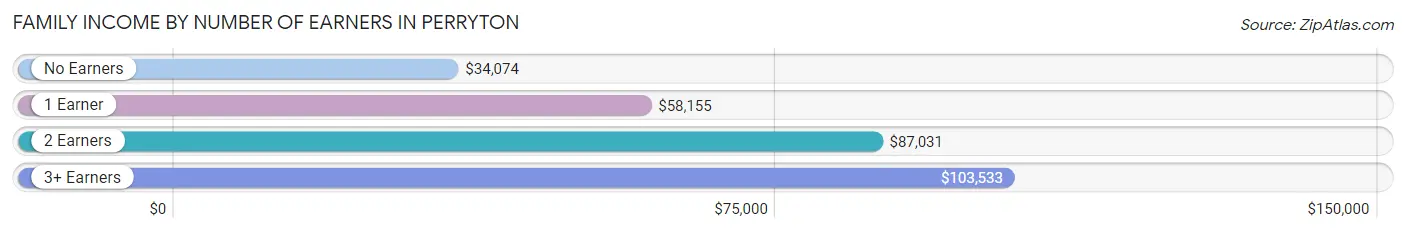
| Number of Earners | # Families | Median Income |
| No Earners | 136 (6.0%) | $34,074 |
| 1 Earner | 1,119 (49.1%) | $58,155 |
| 2 Earners | 861 (37.8%) | $87,031 |
| 3+ Earners | 161 (7.1%) | $103,533 |
| Total | 2,277 (100.0%) | $74,375 |
Household Income in Perryton
Household Income Brackets in Perryton
With 567 households falling in the category, the $50,000 to $74,999 income range is the most frequent in Perryton, accounting for 17.7% of all households. In contrast, only 96 households (3.0%) fall into the $200,000+ income bracket, making it the least populous group.
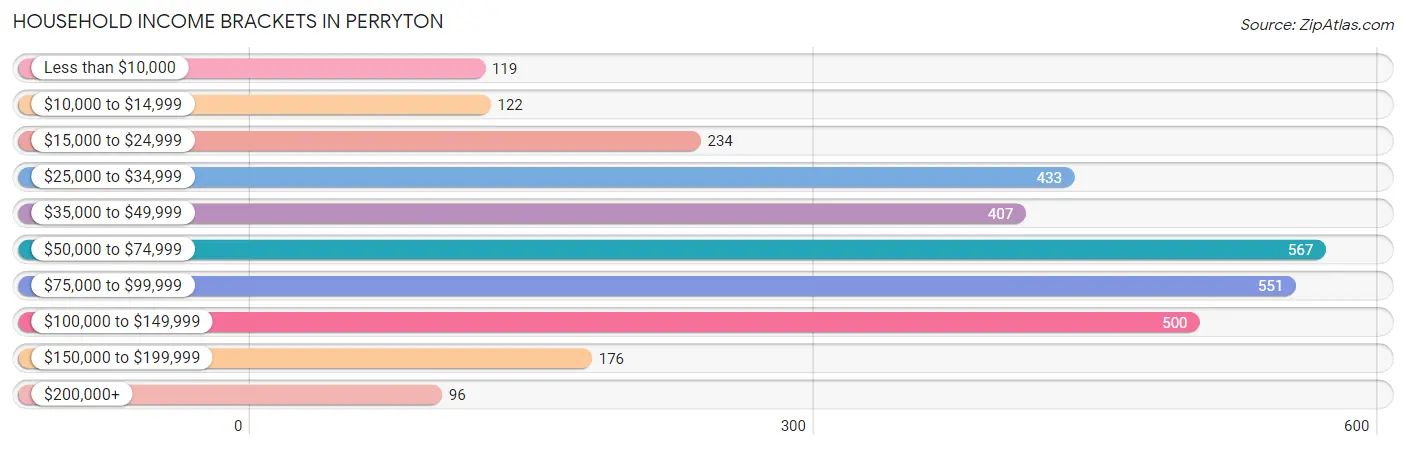
| Income Bracket | # Households | % Households |
| Less than $10,000 | 119 | 3.7% |
| $10,000 to $14,999 | 122 | 3.8% |
| $15,000 to $24,999 | 234 | 7.3% |
| $25,000 to $34,999 | 433 | 13.5% |
| $35,000 to $49,999 | 407 | 12.7% |
| $50,000 to $74,999 | 567 | 17.7% |
| $75,000 to $99,999 | 551 | 17.2% |
| $100,000 to $149,999 | 500 | 15.6% |
| $150,000 to $199,999 | 176 | 5.5% |
| $200,000+ | 96 | 3.0% |
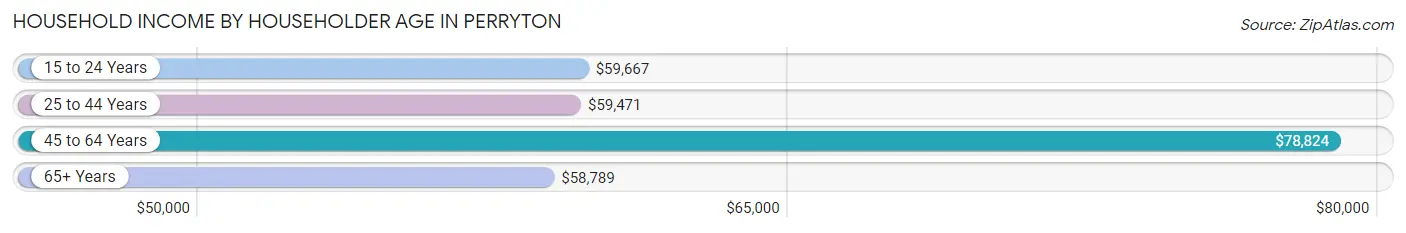
Household Income by Householder Age in Perryton
The median household income in Perryton is $61,067, with the highest median household income of $78,824 found in the 45 to 64 years age bracket for the primary householder. A total of 1,064 households (33.2%) fall into this category. Meanwhile, the 65+ years age bracket for the primary householder has the lowest median household income of $58,789, with 563 households (17.6%) in this group.
| Income Bracket | # Households | Median Income |
| 15 to 24 Years | 260 (8.1%) | $59,667 |
| 25 to 44 Years | 1,319 (41.1%) | $59,471 |
| 45 to 64 Years | 1,064 (33.2%) | $78,824 |
| 65+ Years | 563 (17.6%) | $58,789 |
| Total | 3,206 (100.0%) | $61,067 |
Poverty in Perryton
Income Below Poverty by Sex and Age in Perryton
With 10.0% poverty level for males and 17.0% for females among the residents of Perryton, 12 to 14 year old males and 65 to 74 year old females are the most vulnerable to poverty, with 57 males (28.1%) and 87 females (30.5%) in their respective age groups living below the poverty level.

| Age Bracket | Male | Female |
| Under 5 Years | 27 (9.0%) | 70 (22.4%) |
| 5 Years | 0 (0.0%) | 6 (3.7%) |
| 6 to 11 Years | 67 (15.2%) | 104 (25.9%) |
| 12 to 14 Years | 57 (28.1%) | 63 (28.2%) |
| 15 Years | 3 (6.5%) | 0 (0.0%) |
| 16 and 17 Years | 18 (10.8%) | 7 (3.1%) |
| 18 to 24 Years | 95 (26.2%) | 15 (3.5%) |
| 25 to 34 Years | 15 (2.1%) | 87 (15.8%) |
| 35 to 44 Years | 60 (9.2%) | 130 (21.2%) |
| 45 to 54 Years | 42 (11.3%) | 22 (6.1%) |
| 55 to 64 Years | 0 (0.0%) | 115 (21.4%) |
| 65 to 74 Years | 21 (9.0%) | 87 (30.5%) |
| 75 Years and over | 18 (10.6%) | 27 (14.4%) |
| Total | 423 (10.0%) | 733 (17.0%) |
Income Above Poverty by Sex and Age in Perryton
According to the poverty statistics in Perryton, males aged 5 years and females aged 15 years are the age groups that are most secure financially, with 100.0% of males and 100.0% of females in these age groups living above the poverty line.
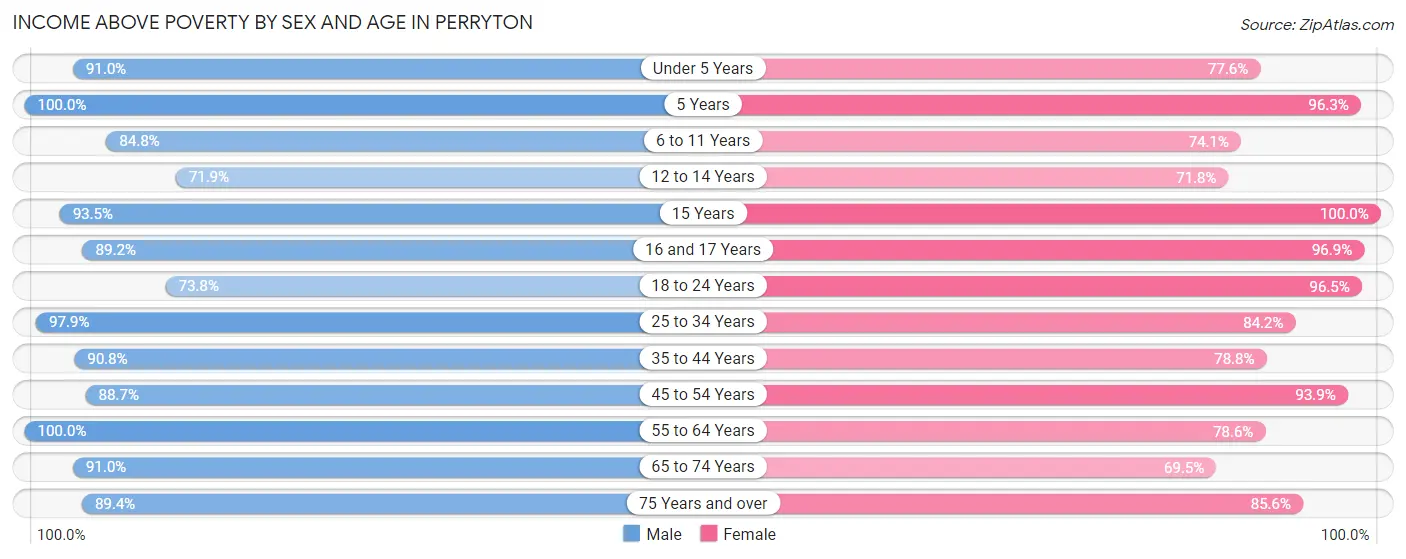
| Age Bracket | Male | Female |
| Under 5 Years | 274 (91.0%) | 243 (77.6%) |
| 5 Years | 37 (100.0%) | 156 (96.3%) |
| 6 to 11 Years | 374 (84.8%) | 297 (74.1%) |
| 12 to 14 Years | 146 (71.9%) | 160 (71.8%) |
| 15 Years | 43 (93.5%) | 33 (100.0%) |
| 16 and 17 Years | 149 (89.2%) | 220 (96.9%) |
| 18 to 24 Years | 268 (73.8%) | 411 (96.5%) |
| 25 to 34 Years | 690 (97.9%) | 463 (84.2%) |
| 35 to 44 Years | 590 (90.8%) | 483 (78.8%) |
| 45 to 54 Years | 329 (88.7%) | 337 (93.9%) |
| 55 to 64 Years | 560 (100.0%) | 422 (78.6%) |
| 65 to 74 Years | 213 (91.0%) | 198 (69.5%) |
| 75 Years and over | 151 (89.3%) | 160 (85.6%) |
| Total | 3,824 (90.0%) | 3,583 (83.0%) |
Income Below Poverty Among Married-Couple Families in Perryton
The poverty statistics for married-couple families in Perryton show that 6.7% or 97 of the total 1,445 families live below the poverty line. Families with 3 or 4 children have the highest poverty rate of 12.2%, comprising of 33 families. On the other hand, families with no children have the lowest poverty rate of 3.4%, which includes 25 families.
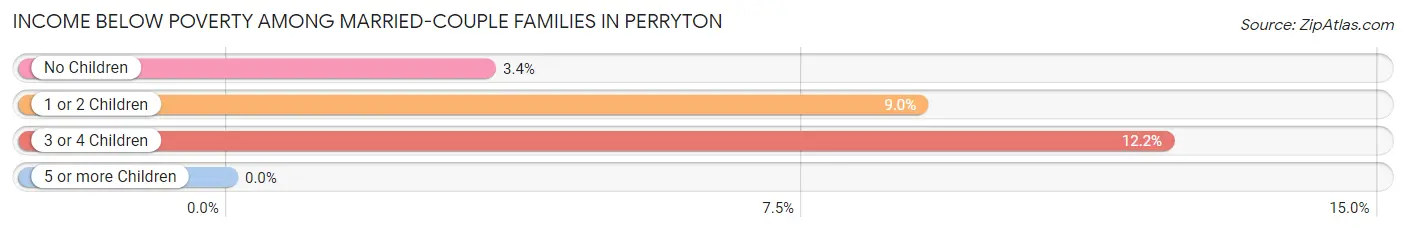
| Children | Above Poverty | Below Poverty |
| No Children | 717 (96.6%) | 25 (3.4%) |
| 1 or 2 Children | 394 (91.0%) | 39 (9.0%) |
| 3 or 4 Children | 237 (87.8%) | 33 (12.2%) |
| 5 or more Children | 0 (0.0%) | 0 (0.0%) |
| Total | 1,348 (93.3%) | 97 (6.7%) |
Income Below Poverty Among Single-Parent Households in Perryton
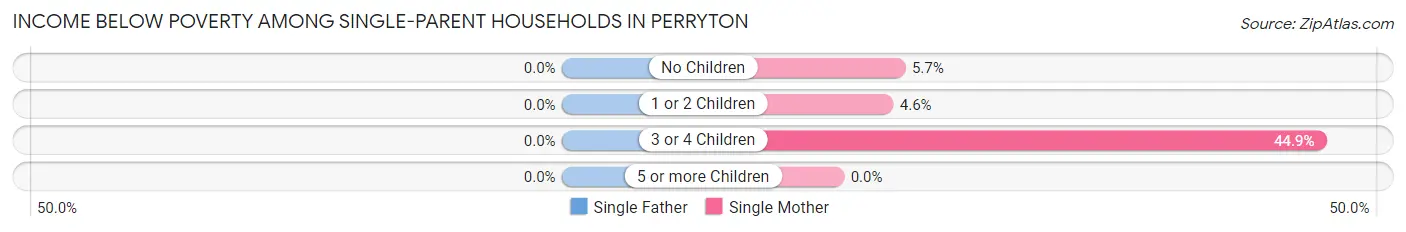
| Children | Single Father | Single Mother |
| No Children | 0 (0.0%) | 4 (5.7%) |
| 1 or 2 Children | 0 (0.0%) | 13 (4.6%) |
| 3 or 4 Children | 0 (0.0%) | 80 (44.9%) |
| 5 or more Children | 0 (0.0%) | 0 (0.0%) |
| Total | 0 (0.0%) | 97 (18.2%) |
Income Below Poverty Among Married-Couple vs Single-Parent Households in Perryton
The poverty data for Perryton shows that 97 of the married-couple family households (6.7%) and 97 of the single-parent households (11.7%) are living below the poverty level. Within the married-couple family households, those with 3 or 4 children have the highest poverty rate, with 33 households (12.2%) falling below the poverty line. Among the single-parent households, those with 3 or 4 children have the highest poverty rate, with 80 household (38.1%) living below poverty.
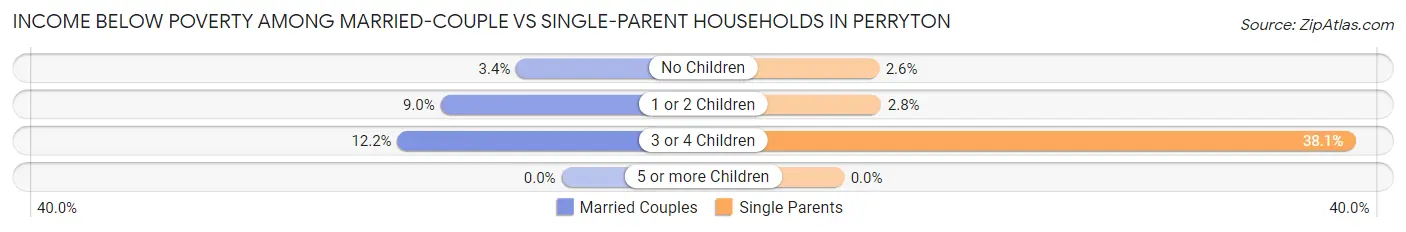
| Children | Married-Couple Families | Single-Parent Households |
| No Children | 25 (3.4%) | 4 (2.6%) |
| 1 or 2 Children | 39 (9.0%) | 13 (2.8%) |
| 3 or 4 Children | 33 (12.2%) | 80 (38.1%) |
| 5 or more Children | 0 (0.0%) | 0 (0.0%) |
| Total | 97 (6.7%) | 97 (11.7%) |
Race in Perryton
The most populous races in Perryton are White / Caucasian (6,180 | 71.3%), Hispanic or Latino (5,342 | 61.7%), and Some other Race (1,275 | 14.7%).
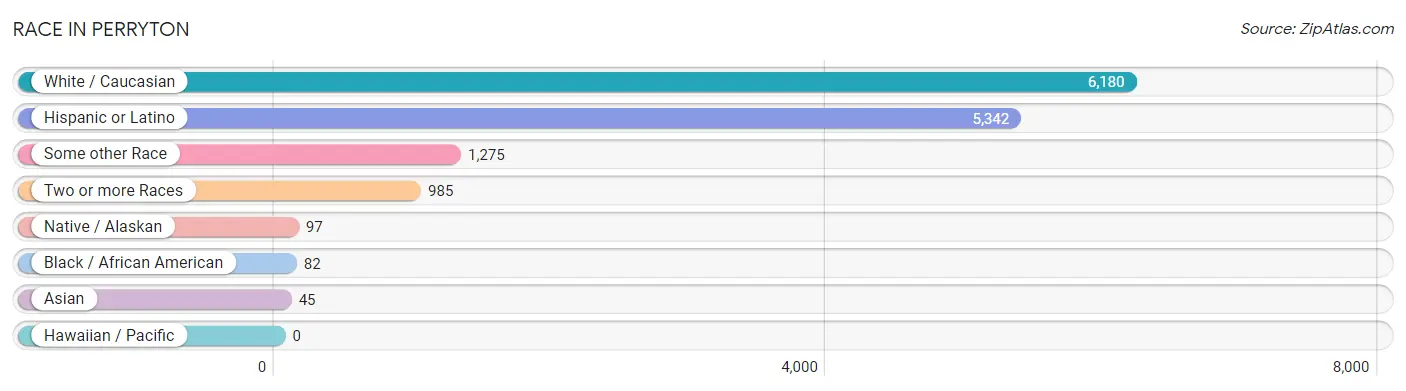
| Race | # Population | % Population |
| Asian | 45 | 0.5% |
| Black / African American | 82 | 0.9% |
| Hawaiian / Pacific | 0 | 0.0% |
| Hispanic or Latino | 5,342 | 61.7% |
| Native / Alaskan | 97 | 1.1% |
| White / Caucasian | 6,180 | 71.3% |
| Two or more Races | 985 | 11.4% |
| Some other Race | 1,275 | 14.7% |
| Total | 8,664 | 100.0% |
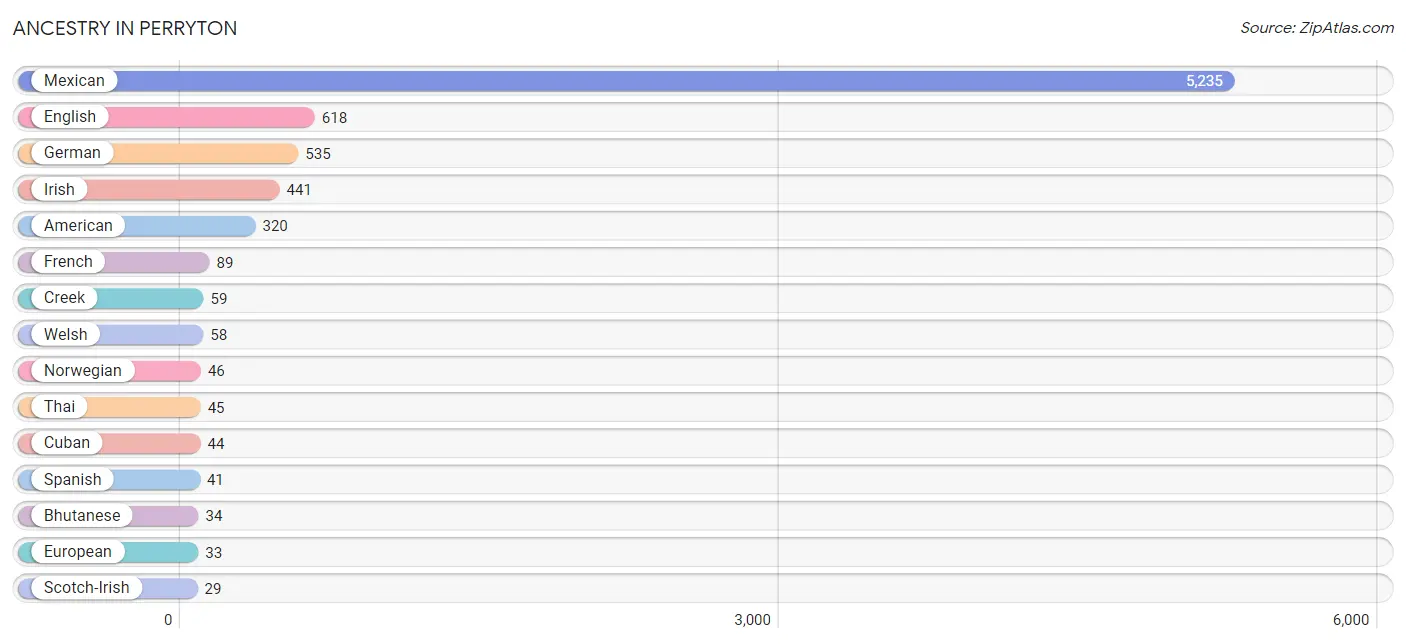
Ancestry in Perryton
The most populous ancestries reported in Perryton are Mexican (5,235 | 60.4%), English (618 | 7.1%), German (535 | 6.2%), Irish (441 | 5.1%), and American (320 | 3.7%), together accounting for 82.5% of all Perryton residents.
| Ancestry | # Population | % Population |
| American | 320 | 3.7% |
| Bhutanese | 34 | 0.4% |
| British | 23 | 0.3% |
| Central American | 3 | 0.0% |
| Central American Indian | 13 | 0.2% |
| Cherokee | 11 | 0.1% |
| Choctaw | 15 | 0.2% |
| Creek | 59 | 0.7% |
| Cuban | 44 | 0.5% |
| Czech | 12 | 0.1% |
| Dutch | 22 | 0.3% |
| Eastern European | 3 | 0.0% |
| English | 618 | 7.1% |
| European | 33 | 0.4% |
| French | 89 | 1.0% |
| French Canadian | 9 | 0.1% |
| German | 535 | 6.2% |
| Guatemalan | 3 | 0.0% |
| Irish | 441 | 5.1% |
| Iroquois | 11 | 0.1% |
| Italian | 25 | 0.3% |
| Mexican | 5,235 | 60.4% |
| Mexican American Indian | 20 | 0.2% |
| Norwegian | 46 | 0.5% |
| Polish | 15 | 0.2% |
| Potawatomi | 11 | 0.1% |
| Russian | 23 | 0.3% |
| Scandinavian | 17 | 0.2% |
| Scotch-Irish | 29 | 0.3% |
| Scottish | 27 | 0.3% |
| Sioux | 23 | 0.3% |
| Spanish | 41 | 0.5% |
| Swedish | 6 | 0.1% |
| Swiss | 7 | 0.1% |
| Thai | 45 | 0.5% |
| Welsh | 58 | 0.7% | View All 36 Rows |
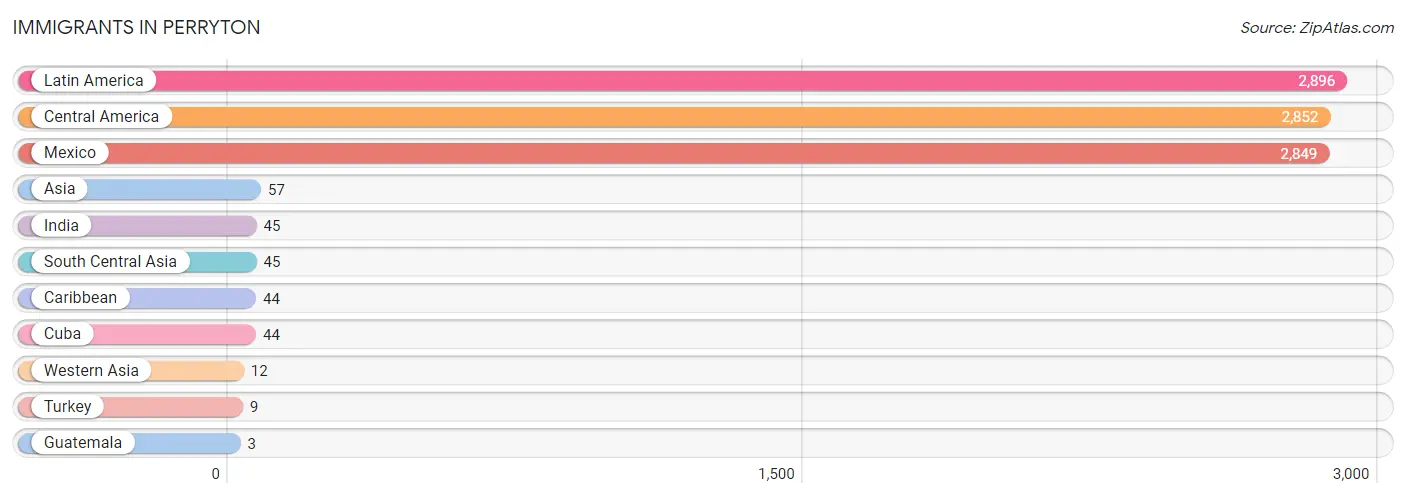
Immigrants in Perryton
The most numerous immigrant groups reported in Perryton came from Latin America (2,896 | 33.4%), Central America (2,852 | 32.9%), Mexico (2,849 | 32.9%), Asia (57 | 0.7%), and India (45 | 0.5%), together accounting for 100.4% of all Perryton residents.
| Immigration Origin | # Population | % Population |
| Asia | 57 | 0.7% |
| Caribbean | 44 | 0.5% |
| Central America | 2,852 | 32.9% |
| Cuba | 44 | 0.5% |
| Guatemala | 3 | 0.0% |
| India | 45 | 0.5% |
| Latin America | 2,896 | 33.4% |
| Mexico | 2,849 | 32.9% |
| South Central Asia | 45 | 0.5% |
| Turkey | 9 | 0.1% |
| Western Asia | 12 | 0.1% | View All 11 Rows |
Sex and Age in Perryton
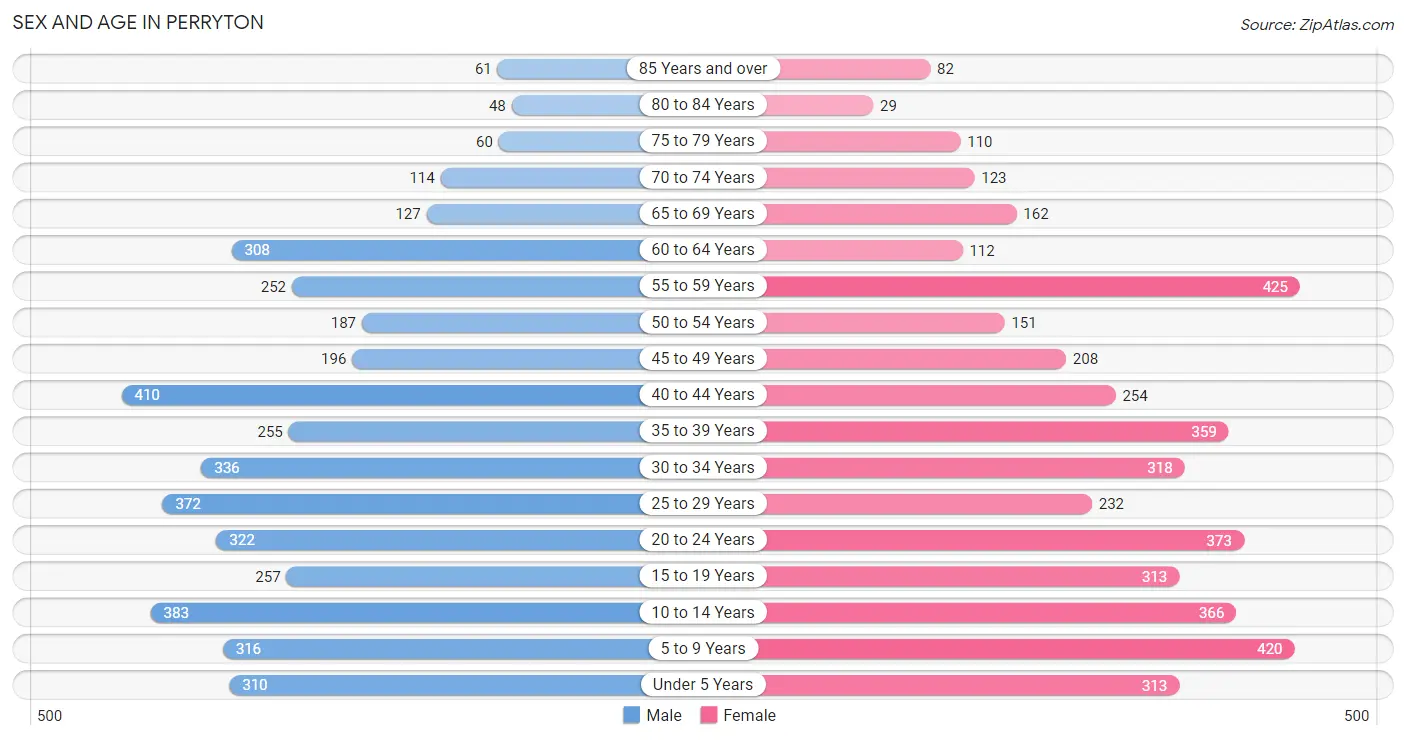
Sex and Age in Perryton
The most populous age groups in Perryton are 40 to 44 Years (410 | 9.5%) for men and 55 to 59 Years (425 | 9.8%) for women.
| Age Bracket | Male | Female |
| Under 5 Years | 310 (7.2%) | 313 (7.2%) |
| 5 to 9 Years | 316 (7.3%) | 420 (9.7%) |
| 10 to 14 Years | 383 (8.9%) | 366 (8.4%) |
| 15 to 19 Years | 257 (6.0%) | 313 (7.2%) |
| 20 to 24 Years | 322 (7.5%) | 373 (8.6%) |
| 25 to 29 Years | 372 (8.6%) | 232 (5.3%) |
| 30 to 34 Years | 336 (7.8%) | 318 (7.3%) |
| 35 to 39 Years | 255 (5.9%) | 359 (8.3%) |
| 40 to 44 Years | 410 (9.5%) | 254 (5.8%) |
| 45 to 49 Years | 196 (4.5%) | 208 (4.8%) |
| 50 to 54 Years | 187 (4.3%) | 151 (3.5%) |
| 55 to 59 Years | 252 (5.8%) | 425 (9.8%) |
| 60 to 64 Years | 308 (7.1%) | 112 (2.6%) |
| 65 to 69 Years | 127 (2.9%) | 162 (3.7%) |
| 70 to 74 Years | 114 (2.6%) | 123 (2.8%) |
| 75 to 79 Years | 60 (1.4%) | 110 (2.5%) |
| 80 to 84 Years | 48 (1.1%) | 29 (0.7%) |
| 85 Years and over | 61 (1.4%) | 82 (1.9%) |
| Total | 4,314 (100.0%) | 4,350 (100.0%) |
Families and Households in Perryton
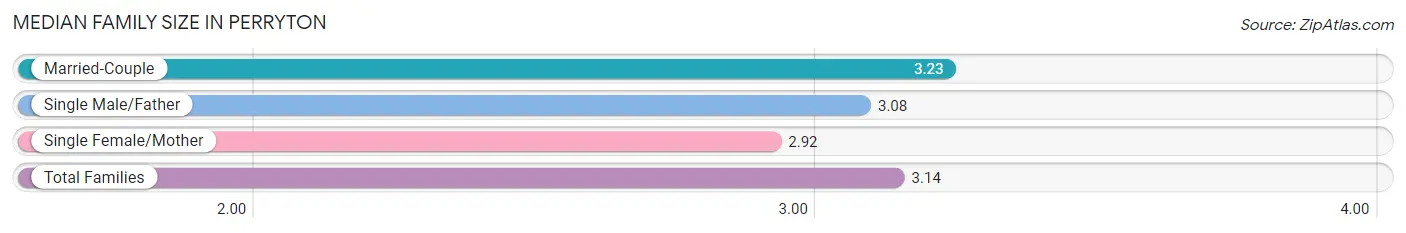
Median Family Size in Perryton
The median family size in Perryton is 3.14 persons per family, with married-couple families (1,445 | 63.5%) accounting for the largest median family size of 3.23 persons per family. On the other hand, single female/mother families (532 | 23.4%) represent the smallest median family size with 2.92 persons per family.
| Family Type | # Families | Family Size |
| Married-Couple | 1,445 (63.5%) | 3.23 |
| Single Male/Father | 300 (13.2%) | 3.08 |
| Single Female/Mother | 532 (23.4%) | 2.92 |
| Total Families | 2,277 (100.0%) | 3.14 |
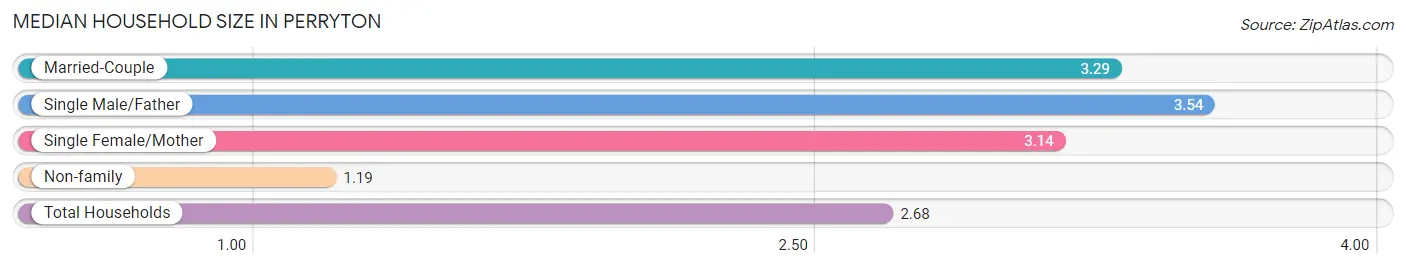
Median Household Size in Perryton
The median household size in Perryton is 2.68 persons per household, with single male/father households (300 | 9.4%) accounting for the largest median household size of 3.54 persons per household. non-family households (929 | 29.0%) represent the smallest median household size with 1.19 persons per household.
| Household Type | # Households | Household Size |
| Married-Couple | 1,445 (45.1%) | 3.29 |
| Single Male/Father | 300 (9.4%) | 3.54 |
| Single Female/Mother | 532 (16.6%) | 3.14 |
| Non-family | 929 (29.0%) | 1.19 |
| Total Households | 3,206 (100.0%) | 2.68 |
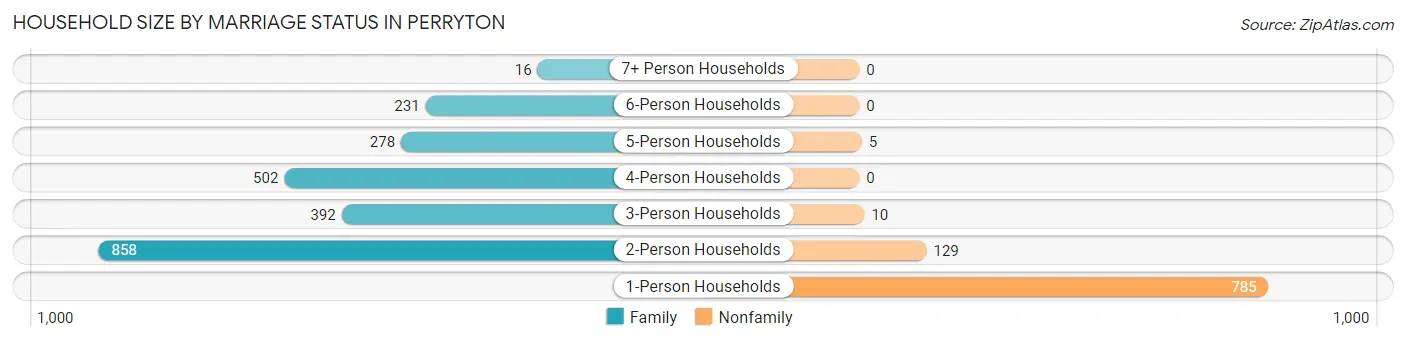
Household Size by Marriage Status in Perryton
Out of a total of 3,206 households in Perryton, 2,277 (71.0%) are family households, while 929 (29.0%) are nonfamily households. The most numerous type of family households are 2-person households, comprising 858, and the most common type of nonfamily households are 1-person households, comprising 785.
| Household Size | Family Households | Nonfamily Households |
| 1-Person Households | - | 785 (24.5%) |
| 2-Person Households | 858 (26.8%) | 129 (4.0%) |
| 3-Person Households | 392 (12.2%) | 10 (0.3%) |
| 4-Person Households | 502 (15.7%) | 0 (0.0%) |
| 5-Person Households | 278 (8.7%) | 5 (0.2%) |
| 6-Person Households | 231 (7.2%) | 0 (0.0%) |
| 7+ Person Households | 16 (0.5%) | 0 (0.0%) |
| Total | 2,277 (71.0%) | 929 (29.0%) |
Female Fertility in Perryton
Fertility by Age in Perryton
Average fertility rate in Perryton is 92.0 births per 1,000 women. Women in the age bracket of 20 to 34 years have the highest fertility rate with 156.0 births per 1,000 women. Women in the age bracket of 20 to 34 years acount for 75.4% of all women with births.
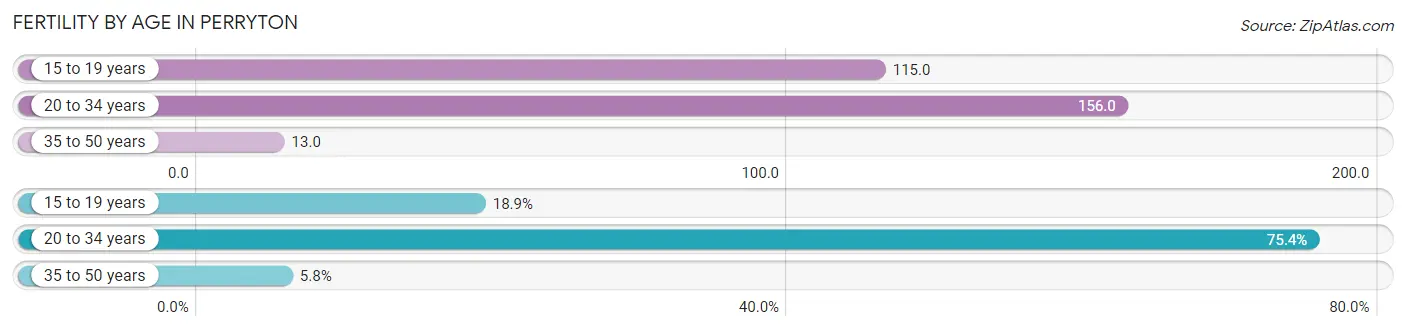
| Age Bracket | Women with Births | Births / 1,000 Women |
| 15 to 19 years | 36 (18.9%) | 115.0 |
| 20 to 34 years | 144 (75.4%) | 156.0 |
| 35 to 50 years | 11 (5.8%) | 13.0 |
| Total | 191 (100.0%) | 92.0 |
Fertility by Age by Marriage Status in Perryton
52.4% of women with births (191) in Perryton are married. The highest percentage of unmarried women with births falls into 15 to 19 years age bracket with 100.0% of them unmarried at the time of birth, while the lowest percentage of unmarried women with births belong to 35 to 50 years age bracket with 18.2% of them unmarried.
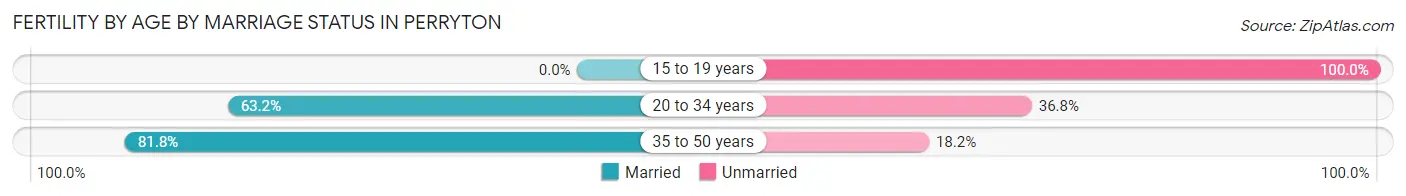
| Age Bracket | Married | Unmarried |
| 15 to 19 years | 0 (0.0%) | 36 (100.0%) |
| 20 to 34 years | 91 (63.2%) | 53 (36.8%) |
| 35 to 50 years | 9 (81.8%) | 2 (18.2%) |
| Total | 100 (52.4%) | 91 (47.6%) |
Fertility by Education in Perryton
Average fertility rate in Perryton is 92.0 births per 1,000 women. Women with the education attainment of high school diploma have the highest fertility rate of 128.0 births per 1,000 women, while women with the education attainment of graduate degree have the lowest fertility at 32.0 births per 1,000 women. Women with the education attainment of high school diploma represent 40.8% of all women with births.
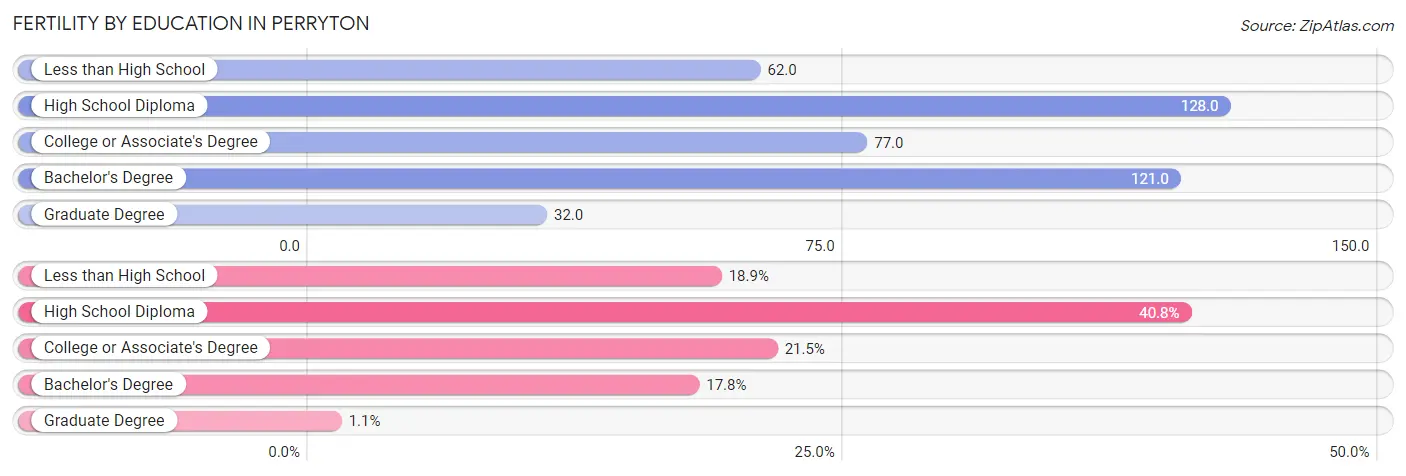
| Educational Attainment | Women with Births | Births / 1,000 Women |
| Less than High School | 36 (18.9%) | 62.0 |
| High School Diploma | 78 (40.8%) | 128.0 |
| College or Associate's Degree | 41 (21.5%) | 77.0 |
| Bachelor's Degree | 34 (17.8%) | 121.0 |
| Graduate Degree | 2 (1.1%) | 32.0 |
| Total | 191 (100.0%) | 92.0 |
Fertility by Education by Marriage Status in Perryton
47.6% of women with births in Perryton are unmarried. Women with the educational attainment of bachelor's degree are most likely to be married with 100.0% of them married at childbirth, while women with the educational attainment of graduate degree are least likely to be married with 100.0% of them unmarried at childbirth.
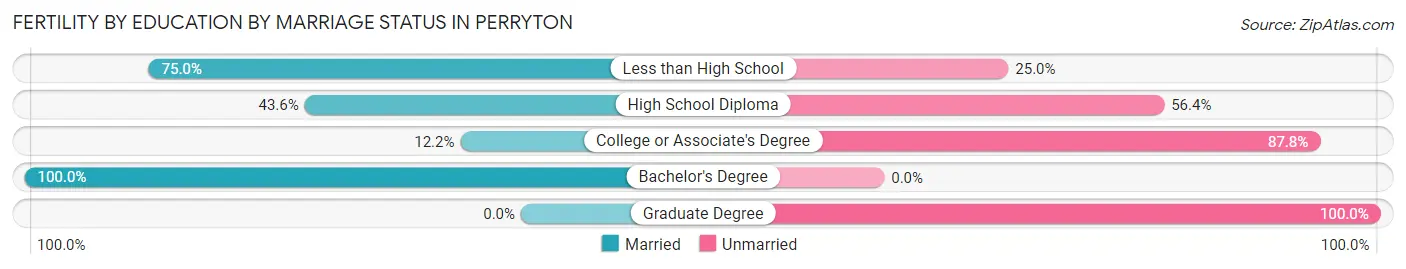
| Educational Attainment | Married | Unmarried |
| Less than High School | 27 (75.0%) | 9 (25.0%) |
| High School Diploma | 34 (43.6%) | 44 (56.4%) |
| College or Associate's Degree | 5 (12.2%) | 36 (87.8%) |
| Bachelor's Degree | 34 (100.0%) | 0 (0.0%) |
| Graduate Degree | 0 (0.0%) | 2 (100.0%) |
| Total | 100 (52.4%) | 91 (47.6%) |
Employment Characteristics in Perryton
Employment by Class of Employer in Perryton
Among the 4,186 employed individuals in Perryton, private company employees (3,127 | 74.7%), local government employees (479 | 11.4%), and self-employed (not incorporated) (262 | 6.3%) make up the most common classes of employment.
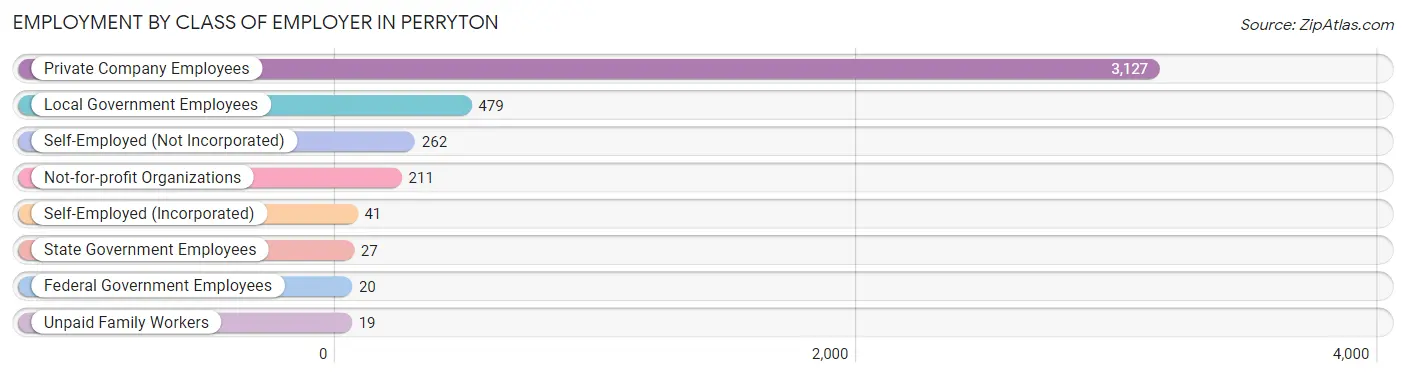
| Employer Class | # Employees | % Employees |
| Private Company Employees | 3,127 | 74.7% |
| Self-Employed (Incorporated) | 41 | 1.0% |
| Self-Employed (Not Incorporated) | 262 | 6.3% |
| Not-for-profit Organizations | 211 | 5.0% |
| Local Government Employees | 479 | 11.4% |
| State Government Employees | 27 | 0.6% |
| Federal Government Employees | 20 | 0.5% |
| Unpaid Family Workers | 19 | 0.4% |
| Total | 4,186 | 100.0% |
Employment Status by Age in Perryton
According to the labor force statistics for Perryton, out of the total population over 16 years of age (6,477), 66.9% or 4,333 individuals are in the labor force, with 1.6% or 69 of them unemployed. The age group with the highest labor force participation rate is 30 to 34 years, with 87.8% or 574 individuals in the labor force. Within the labor force, the 16 to 19 years age range has the highest percentage of unemployed individuals, with 17.8% or 21 of them being unemployed.
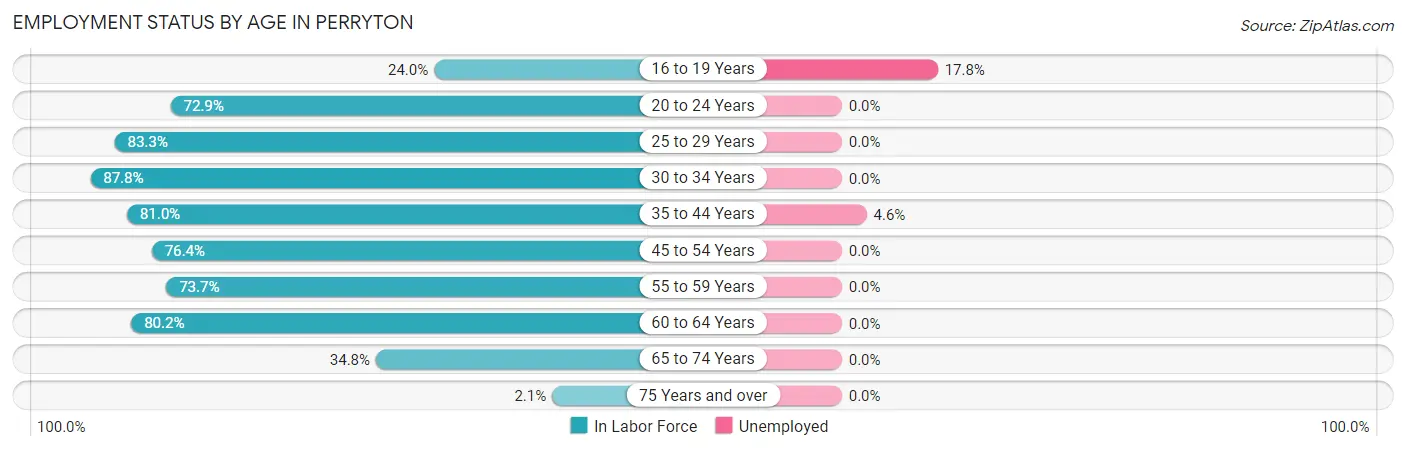
| Age Bracket | In Labor Force | Unemployed |
| 16 to 19 Years | 118 (24.0%) | 21 (17.8%) |
| 20 to 24 Years | 507 (72.9%) | 0 (0.0%) |
| 25 to 29 Years | 503 (83.3%) | 0 (0.0%) |
| 30 to 34 Years | 574 (87.8%) | 0 (0.0%) |
| 35 to 44 Years | 1,035 (81.0%) | 48 (4.6%) |
| 45 to 54 Years | 567 (76.4%) | 0 (0.0%) |
| 55 to 59 Years | 499 (73.7%) | 0 (0.0%) |
| 60 to 64 Years | 337 (80.2%) | 0 (0.0%) |
| 65 to 74 Years | 183 (34.8%) | 0 (0.0%) |
| 75 Years and over | 8 (2.1%) | 0 (0.0%) |
| Total | 4,333 (66.9%) | 69 (1.6%) |
Employment Status by Educational Attainment in Perryton
According to labor force statistics for Perryton, 80.3% of individuals (3,513) out of the total population between 25 and 64 years of age (4,375) are in the labor force, with 1.4% or 49 of them being unemployed. The group with the highest labor force participation rate are those with the educational attainment of bachelor's degree or higher, with 92.2% or 734 individuals in the labor force. Within the labor force, individuals with high school diploma education have the highest percentage of unemployment, with 3.8% or 45 of them being unemployed.
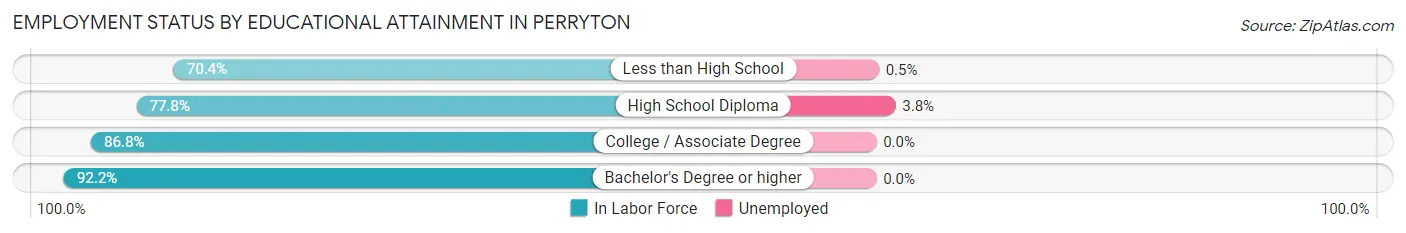
| Educational Attainment | In Labor Force | Unemployed |
| Less than High School | 817 (70.4%) | 6 (0.5%) |
| High School Diploma | 1,173 (77.8%) | 57 (3.8%) |
| College / Associate Degree | 791 (86.8%) | 0 (0.0%) |
| Bachelor's Degree or higher | 734 (92.2%) | 0 (0.0%) |
| Total | 3,513 (80.3%) | 61 (1.4%) |
Employment Occupations by Sex in Perryton
Management, Business, Science and Arts Occupations
The most common Management, Business, Science and Arts occupations in Perryton are Community & Social Service (378 | 8.9%), Education Instruction & Library (241 | 5.7%), Management (233 | 5.5%), Computers, Engineering & Science (149 | 3.5%), and Business & Financial (123 | 2.9%).

Management, Business, Science and Arts Occupations by Sex
Within the Management, Business, Science and Arts occupations in Perryton, the most male-oriented occupations are Architecture & Engineering (100.0%), Management (85.4%), and Business & Financial (48.0%), while the most female-oriented occupations are Computers & Mathematics (100.0%), Legal Services & Support (100.0%), and Arts, Media & Entertainment (100.0%).
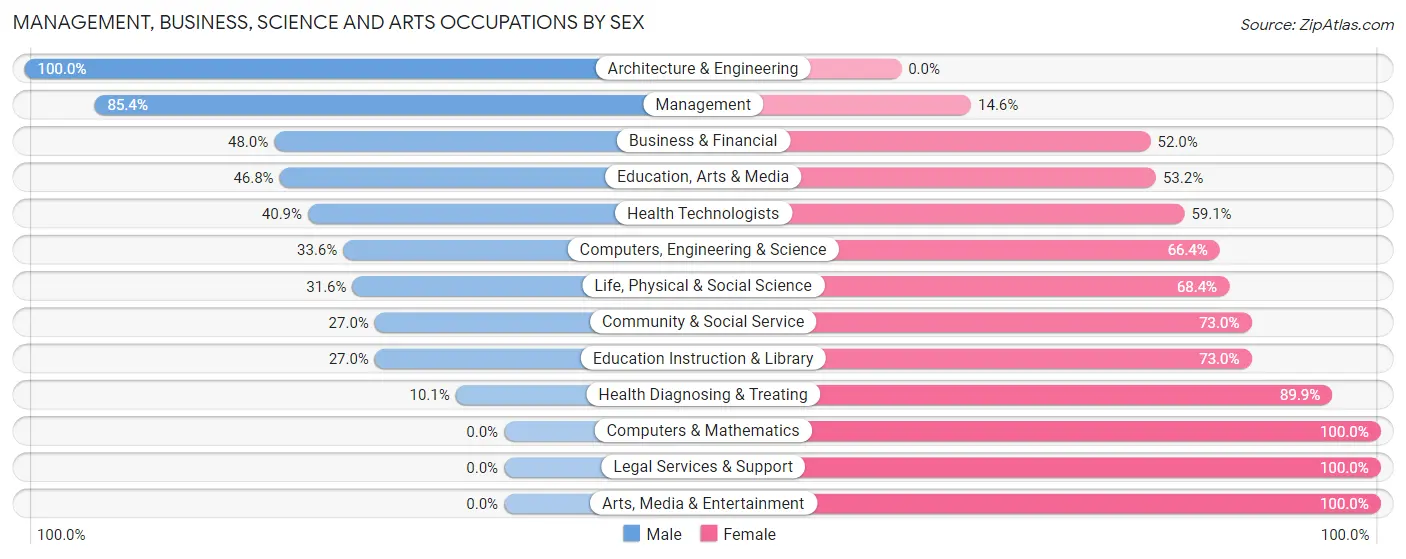
| Occupation | Male | Female |
| Management | 199 (85.4%) | 34 (14.6%) |
| Business & Financial | 59 (48.0%) | 64 (52.0%) |
| Computers, Engineering & Science | 50 (33.6%) | 99 (66.4%) |
| Computers & Mathematics | 0 (0.0%) | 32 (100.0%) |
| Architecture & Engineering | 19 (100.0%) | 0 (0.0%) |
| Life, Physical & Social Science | 31 (31.6%) | 67 (68.4%) |
| Community & Social Service | 102 (27.0%) | 276 (73.0%) |
| Education, Arts & Media | 37 (46.8%) | 42 (53.2%) |
| Legal Services & Support | 0 (0.0%) | 45 (100.0%) |
| Education Instruction & Library | 65 (27.0%) | 176 (73.0%) |
| Arts, Media & Entertainment | 0 (0.0%) | 13 (100.0%) |
| Health Diagnosing & Treating | 9 (10.1%) | 80 (89.9%) |
| Health Technologists | 9 (40.9%) | 13 (59.1%) |
| Total (Category) | 419 (43.1%) | 553 (56.9%) |
| Total (Overall) | 2,557 (60.0%) | 1,705 (40.0%) |
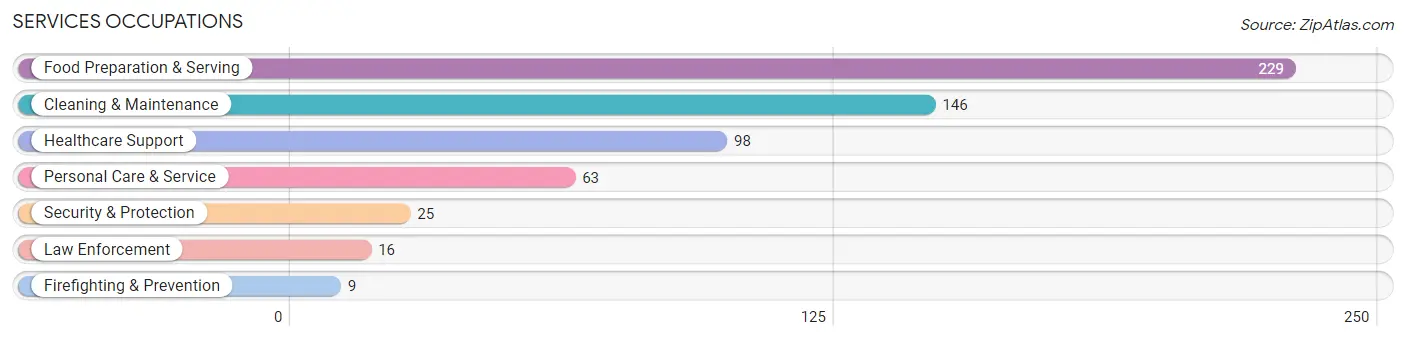
Services Occupations
The most common Services occupations in Perryton are Food Preparation & Serving (229 | 5.4%), Cleaning & Maintenance (146 | 3.4%), Healthcare Support (98 | 2.3%), Personal Care & Service (63 | 1.5%), and Security & Protection (25 | 0.6%).
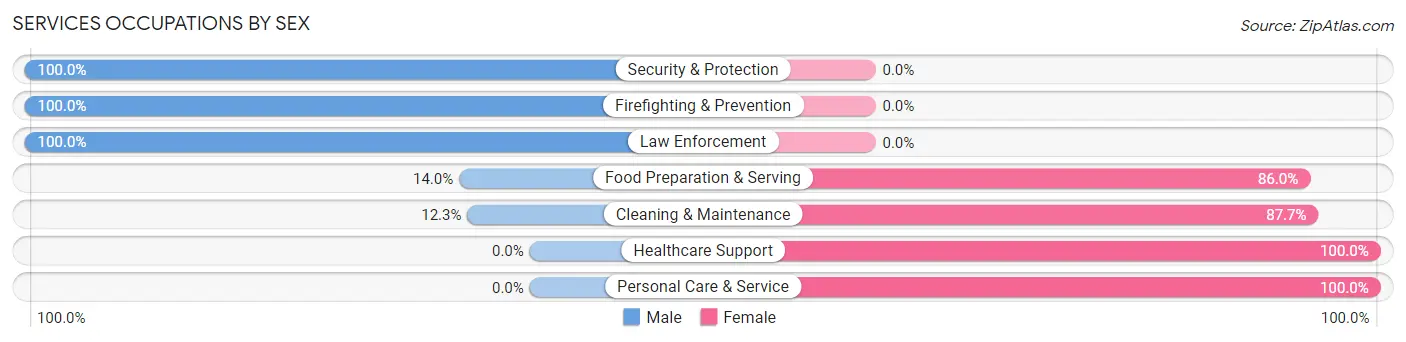
Services Occupations by Sex
Within the Services occupations in Perryton, the most male-oriented occupations are Security & Protection (100.0%), Firefighting & Prevention (100.0%), and Law Enforcement (100.0%), while the most female-oriented occupations are Healthcare Support (100.0%), Personal Care & Service (100.0%), and Cleaning & Maintenance (87.7%).
| Occupation | Male | Female |
| Healthcare Support | 0 (0.0%) | 98 (100.0%) |
| Security & Protection | 25 (100.0%) | 0 (0.0%) |
| Firefighting & Prevention | 9 (100.0%) | 0 (0.0%) |
| Law Enforcement | 16 (100.0%) | 0 (0.0%) |
| Food Preparation & Serving | 32 (14.0%) | 197 (86.0%) |
| Cleaning & Maintenance | 18 (12.3%) | 128 (87.7%) |
| Personal Care & Service | 0 (0.0%) | 63 (100.0%) |
| Total (Category) | 75 (13.4%) | 486 (86.6%) |
| Total (Overall) | 2,557 (60.0%) | 1,705 (40.0%) |
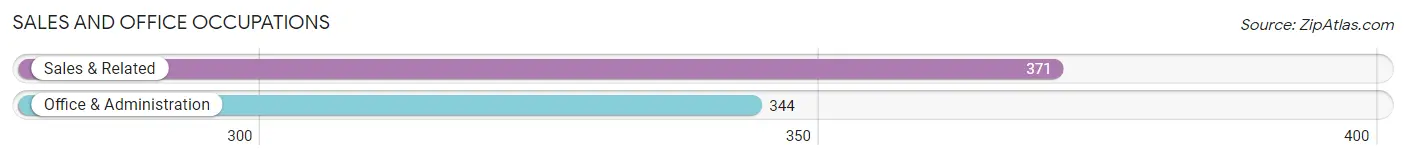
Sales and Office Occupations
The most common Sales and Office occupations in Perryton are Sales & Related (371 | 8.7%), and Office & Administration (344 | 8.1%).
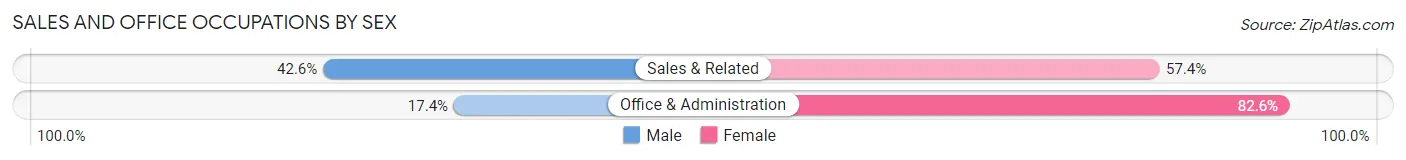
Sales and Office Occupations by Sex
| Occupation | Male | Female |
| Sales & Related | 158 (42.6%) | 213 (57.4%) |
| Office & Administration | 60 (17.4%) | 284 (82.6%) |
| Total (Category) | 218 (30.5%) | 497 (69.5%) |
| Total (Overall) | 2,557 (60.0%) | 1,705 (40.0%) |
Natural Resources, Construction and Maintenance Occupations
The most common Natural Resources, Construction and Maintenance occupations in Perryton are Construction & Extraction (822 | 19.3%), Installation, Maintenance & Repair (270 | 6.3%), and Farming, Fishing & Forestry (106 | 2.5%).
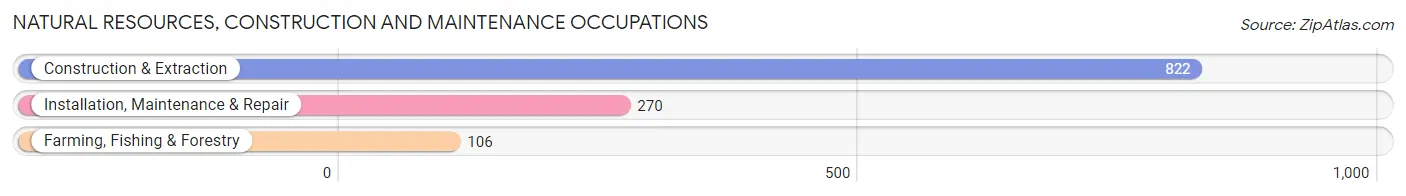
Natural Resources, Construction and Maintenance Occupations by Sex
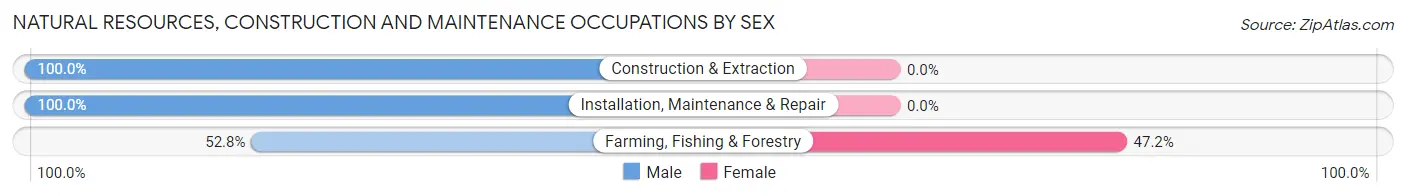
| Occupation | Male | Female |
| Farming, Fishing & Forestry | 56 (52.8%) | 50 (47.2%) |
| Construction & Extraction | 822 (100.0%) | 0 (0.0%) |
| Installation, Maintenance & Repair | 270 (100.0%) | 0 (0.0%) |
| Total (Category) | 1,148 (95.8%) | 50 (4.2%) |
| Total (Overall) | 2,557 (60.0%) | 1,705 (40.0%) |
Production, Transportation and Moving Occupations
The most common Production, Transportation and Moving occupations in Perryton are Transportation (421 | 9.9%), Material Moving (212 | 5.0%), and Production (183 | 4.3%).
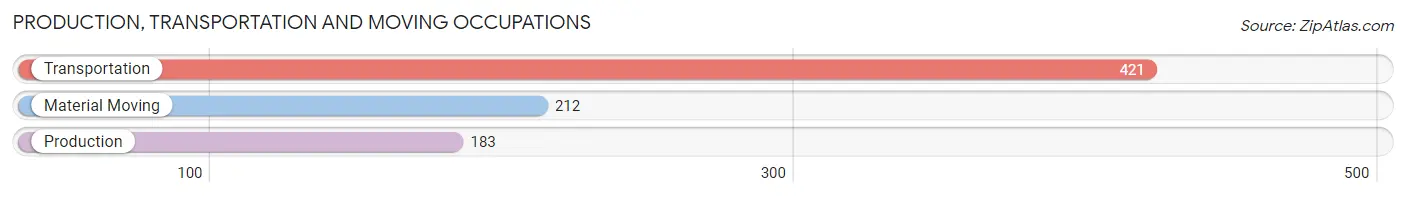
Production, Transportation and Moving Occupations by Sex
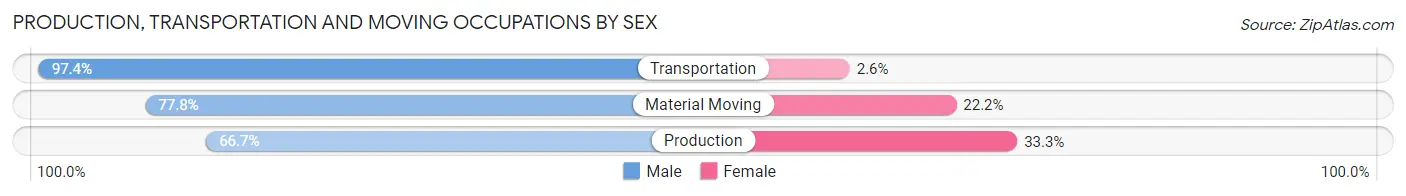
| Occupation | Male | Female |
| Production | 122 (66.7%) | 61 (33.3%) |
| Transportation | 410 (97.4%) | 11 (2.6%) |
| Material Moving | 165 (77.8%) | 47 (22.2%) |
| Total (Category) | 697 (85.4%) | 119 (14.6%) |
| Total (Overall) | 2,557 (60.0%) | 1,705 (40.0%) |
Employment Industries by Sex in Perryton
Employment Industries in Perryton
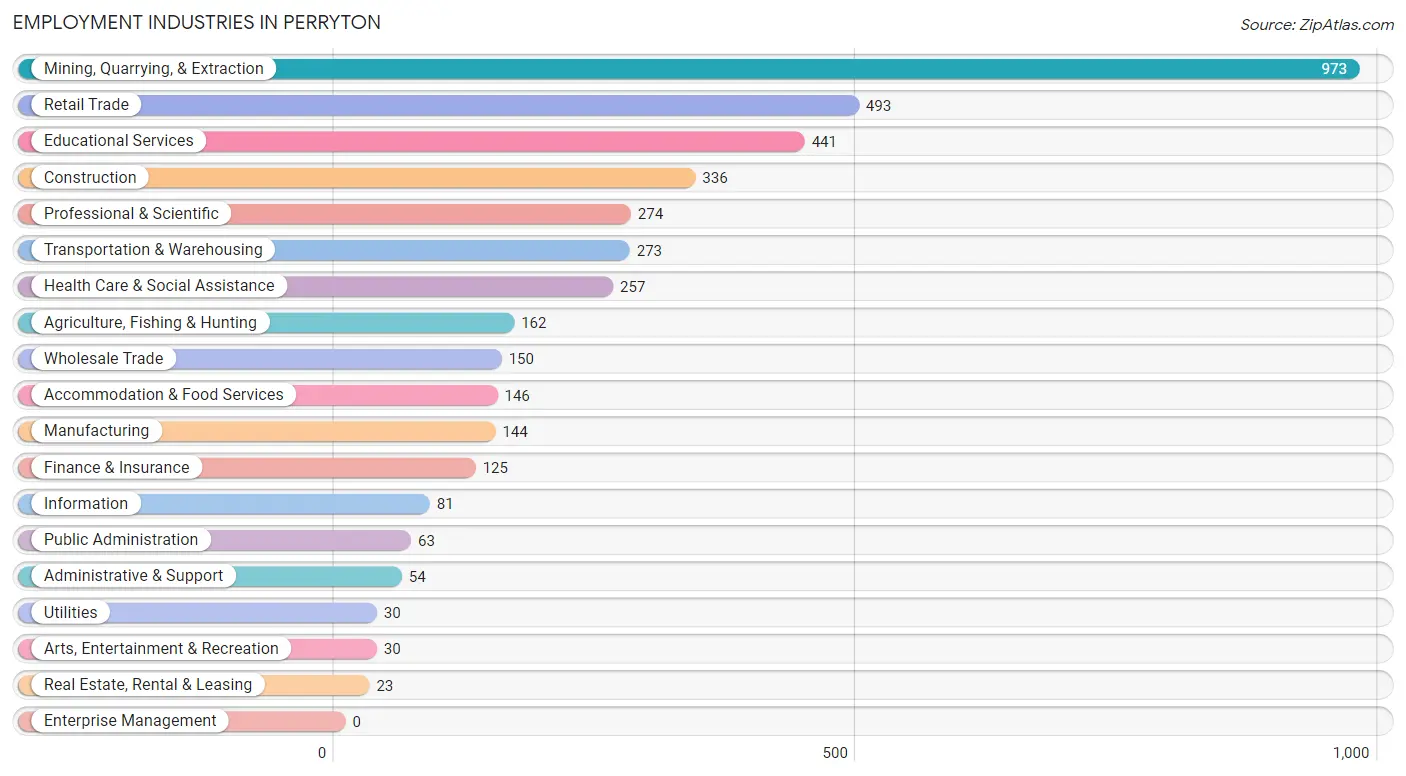
The major employment industries in Perryton include Mining, Quarrying, & Extraction (973 | 22.8%), Retail Trade (493 | 11.6%), Educational Services (441 | 10.3%), Construction (336 | 7.9%), and Professional & Scientific (274 | 6.4%).
Employment Industries by Sex in Perryton
The Perryton industries that see more men than women are Construction (100.0%), Arts, Entertainment & Recreation (100.0%), and Mining, Quarrying, & Extraction (98.3%), whereas the industries that tend to have a higher number of women are Information (100.0%), Health Care & Social Assistance (100.0%), and Educational Services (83.7%).
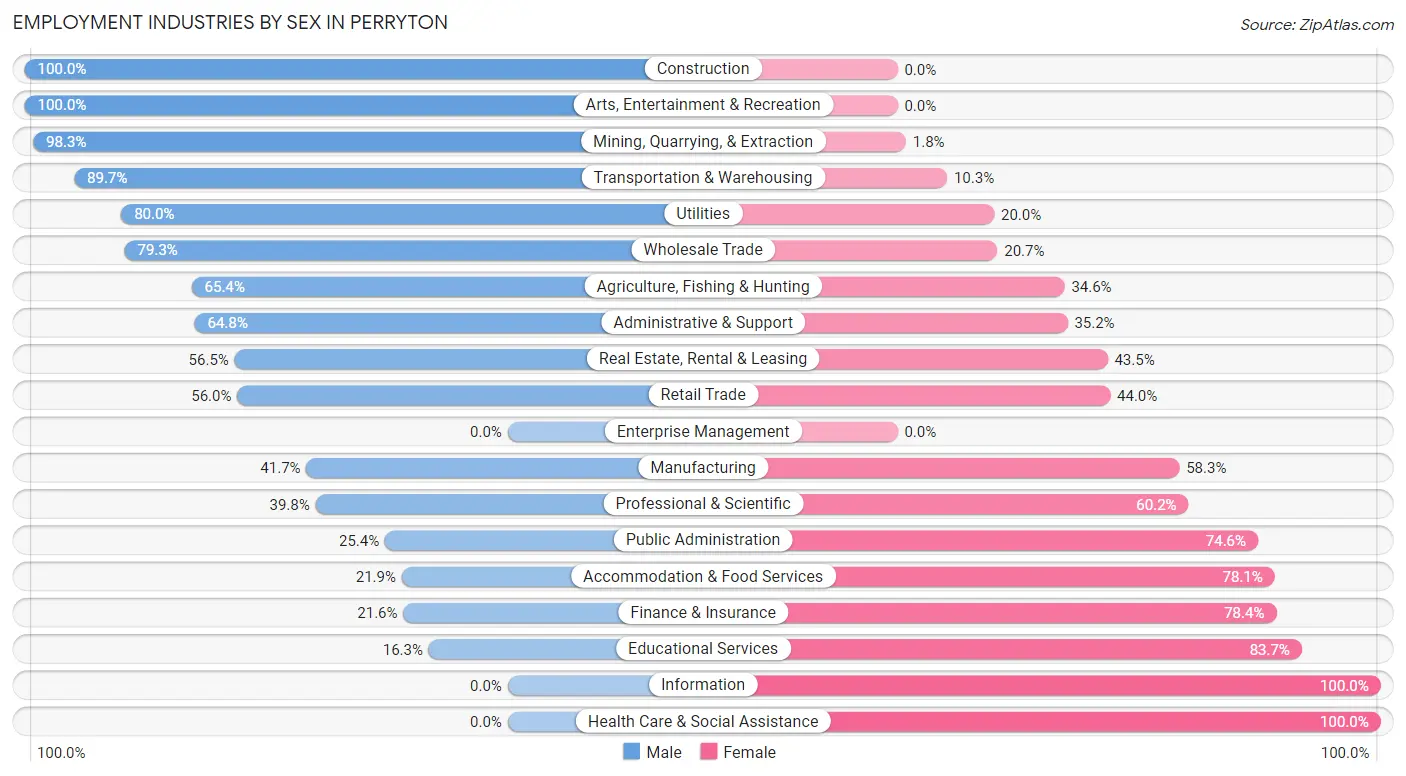
| Industry | Male | Female |
| Agriculture, Fishing & Hunting | 106 (65.4%) | 56 (34.6%) |
| Mining, Quarrying, & Extraction | 956 (98.3%) | 17 (1.8%) |
| Construction | 336 (100.0%) | 0 (0.0%) |
| Manufacturing | 60 (41.7%) | 84 (58.3%) |
| Wholesale Trade | 119 (79.3%) | 31 (20.7%) |
| Retail Trade | 276 (56.0%) | 217 (44.0%) |
| Transportation & Warehousing | 245 (89.7%) | 28 (10.3%) |
| Utilities | 24 (80.0%) | 6 (20.0%) |
| Information | 0 (0.0%) | 81 (100.0%) |
| Finance & Insurance | 27 (21.6%) | 98 (78.4%) |
| Real Estate, Rental & Leasing | 13 (56.5%) | 10 (43.5%) |
| Professional & Scientific | 109 (39.8%) | 165 (60.2%) |
| Enterprise Management | 0 (0.0%) | 0 (0.0%) |
| Administrative & Support | 35 (64.8%) | 19 (35.2%) |
| Educational Services | 72 (16.3%) | 369 (83.7%) |
| Health Care & Social Assistance | 0 (0.0%) | 257 (100.0%) |
| Arts, Entertainment & Recreation | 30 (100.0%) | 0 (0.0%) |
| Accommodation & Food Services | 32 (21.9%) | 114 (78.1%) |
| Public Administration | 16 (25.4%) | 47 (74.6%) |
| Total | 2,557 (60.0%) | 1,705 (40.0%) |
Education in Perryton
School Enrollment in Perryton
The most common levels of schooling among the 2,317 students in Perryton are middle school (600 | 25.9%), high school (542 | 23.4%), and elementary school (441 | 19.0%).
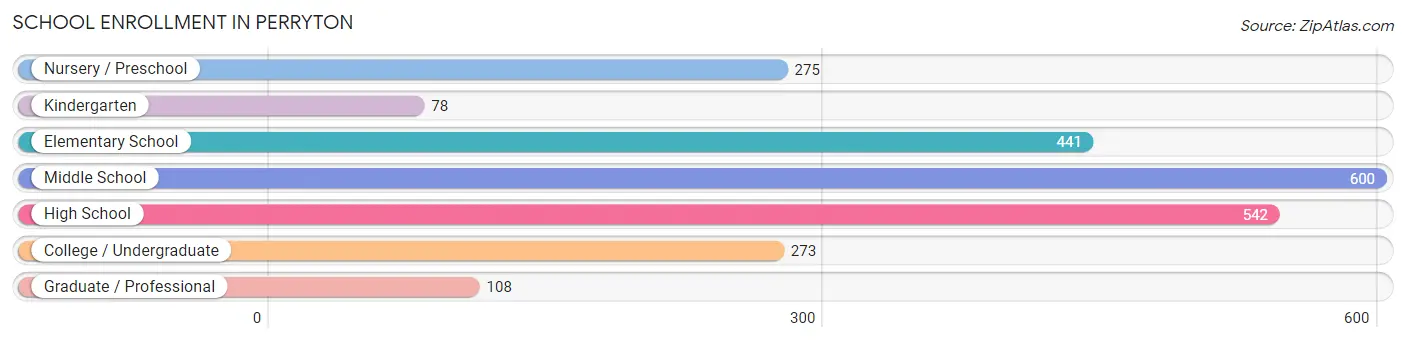
| School Level | # Students | % Students |
| Nursery / Preschool | 275 | 11.9% |
| Kindergarten | 78 | 3.4% |
| Elementary School | 441 | 19.0% |
| Middle School | 600 | 25.9% |
| High School | 542 | 23.4% |
| College / Undergraduate | 273 | 11.8% |
| Graduate / Professional | 108 | 4.7% |
| Total | 2,317 | 100.0% |
School Enrollment by Age by Funding Source in Perryton
Out of a total of 2,317 students who are enrolled in schools in Perryton, 209 (9.0%) attend a private institution, while the remaining 2,108 (91.0%) are enrolled in public schools. The age group of 20 to 24 year olds has the highest likelihood of being enrolled in private schools, with 136 (73.5% in the age bracket) enrolled. Conversely, the age group of 18 to 19 year olds has the lowest likelihood of being enrolled in a private school, with 66 (100.0% in the age bracket) attending a public institution.
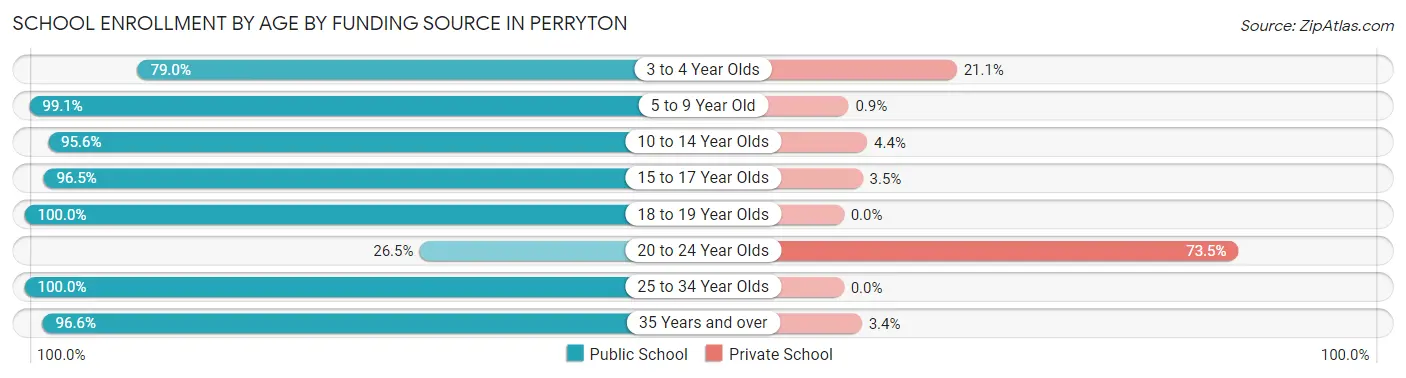
| Age Bracket | Public School | Private School |
| 3 to 4 Year Olds | 60 (78.9%) | 16 (21.0%) |
| 5 to 9 Year Old | 659 (99.1%) | 6 (0.9%) |
| 10 to 14 Year Olds | 676 (95.6%) | 31 (4.4%) |
| 15 to 17 Year Olds | 439 (96.5%) | 16 (3.5%) |
| 18 to 19 Year Olds | 66 (100.0%) | 0 (0.0%) |
| 20 to 24 Year Olds | 49 (26.5%) | 136 (73.5%) |
| 25 to 34 Year Olds | 44 (100.0%) | 0 (0.0%) |
| 35 Years and over | 115 (96.6%) | 4 (3.4%) |
| Total | 2,108 (91.0%) | 209 (9.0%) |
Educational Attainment by Field of Study in Perryton
Business (194 | 18.7%), science & technology (185 | 17.9%), education (132 | 12.7%), arts & humanities (122 | 11.8%), and computers & mathematics (75 | 7.2%) are the most common fields of study among 1,036 individuals in Perryton who have obtained a bachelor's degree or higher.
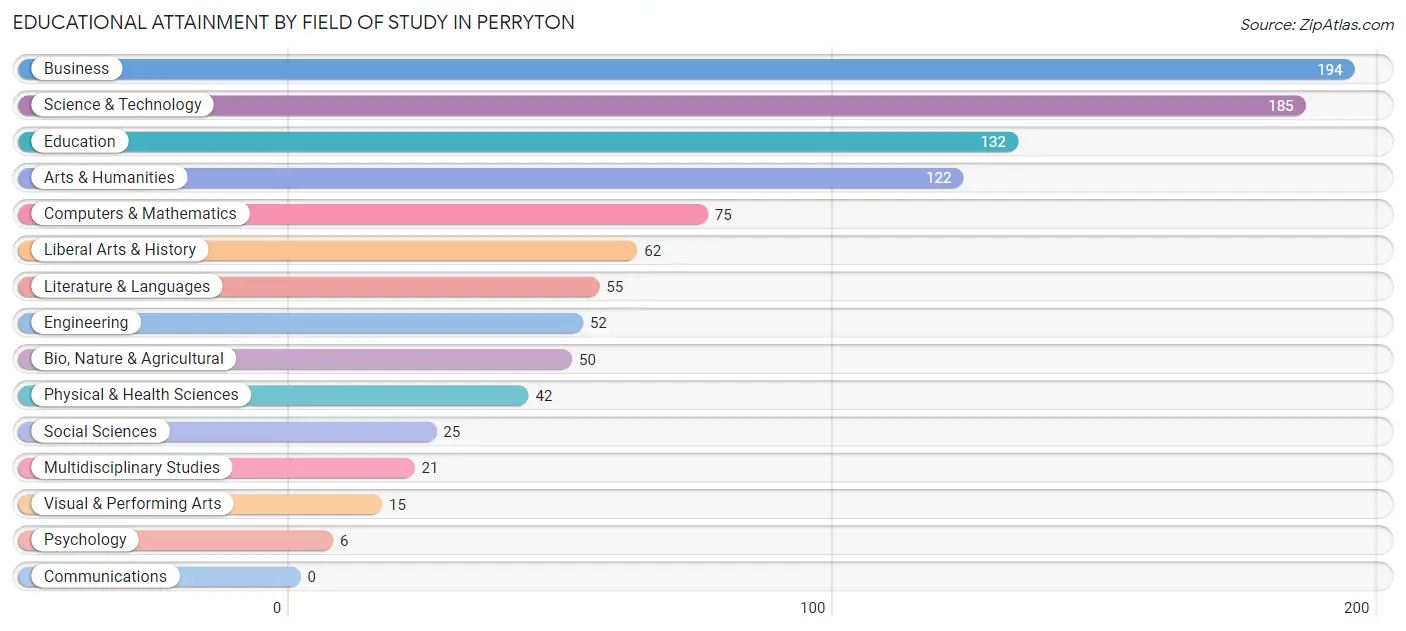
| Field of Study | # Graduates | % Graduates |
| Computers & Mathematics | 75 | 7.2% |
| Bio, Nature & Agricultural | 50 | 4.8% |
| Physical & Health Sciences | 42 | 4.1% |
| Psychology | 6 | 0.6% |
| Social Sciences | 25 | 2.4% |
| Engineering | 52 | 5.0% |
| Multidisciplinary Studies | 21 | 2.0% |
| Science & Technology | 185 | 17.9% |
| Business | 194 | 18.7% |
| Education | 132 | 12.7% |
| Literature & Languages | 55 | 5.3% |
| Liberal Arts & History | 62 | 6.0% |
| Visual & Performing Arts | 15 | 1.5% |
| Communications | 0 | 0.0% |
| Arts & Humanities | 122 | 11.8% |
| Total | 1,036 | 100.0% |
Transportation & Commute in Perryton
Vehicle Availability by Sex in Perryton
The most prevalent vehicle ownership categories in Perryton are males with 2 vehicles (1,402, accounting for 56.1%) and females with 2 vehicles (905, making up 83.1%).
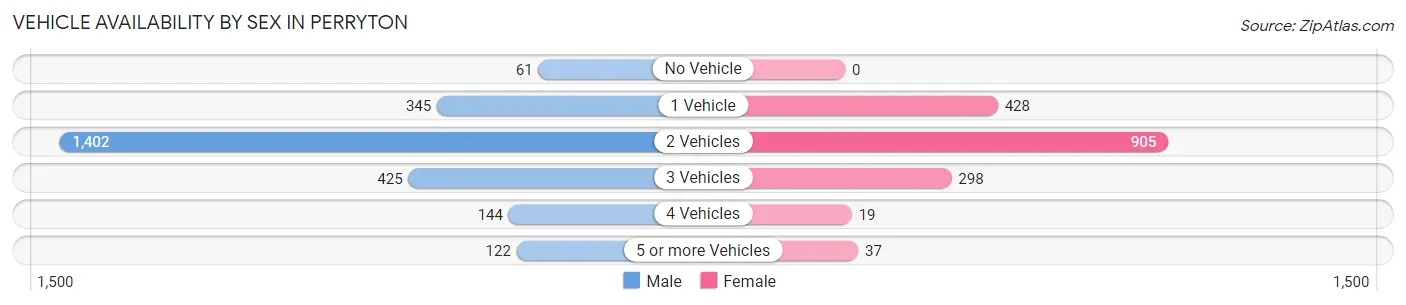
| Vehicles Available | Male | Female |
| No Vehicle | 61 (2.4%) | 0 (0.0%) |
| 1 Vehicle | 345 (13.8%) | 428 (25.4%) |
| 2 Vehicles | 1,402 (56.1%) | 905 (53.6%) |
| 3 Vehicles | 425 (17.0%) | 298 (17.7%) |
| 4 Vehicles | 144 (5.8%) | 19 (1.1%) |
| 5 or more Vehicles | 122 (4.9%) | 37 (2.2%) |
| Total | 2,499 (100.0%) | 1,687 (100.0%) |
Commute Time in Perryton
The most frequently occuring commute durations in Perryton are 5 to 9 minutes (1,404 commuters, 34.1%), less than 5 minutes (699 commuters, 17.0%), and 15 to 19 minutes (491 commuters, 11.9%).
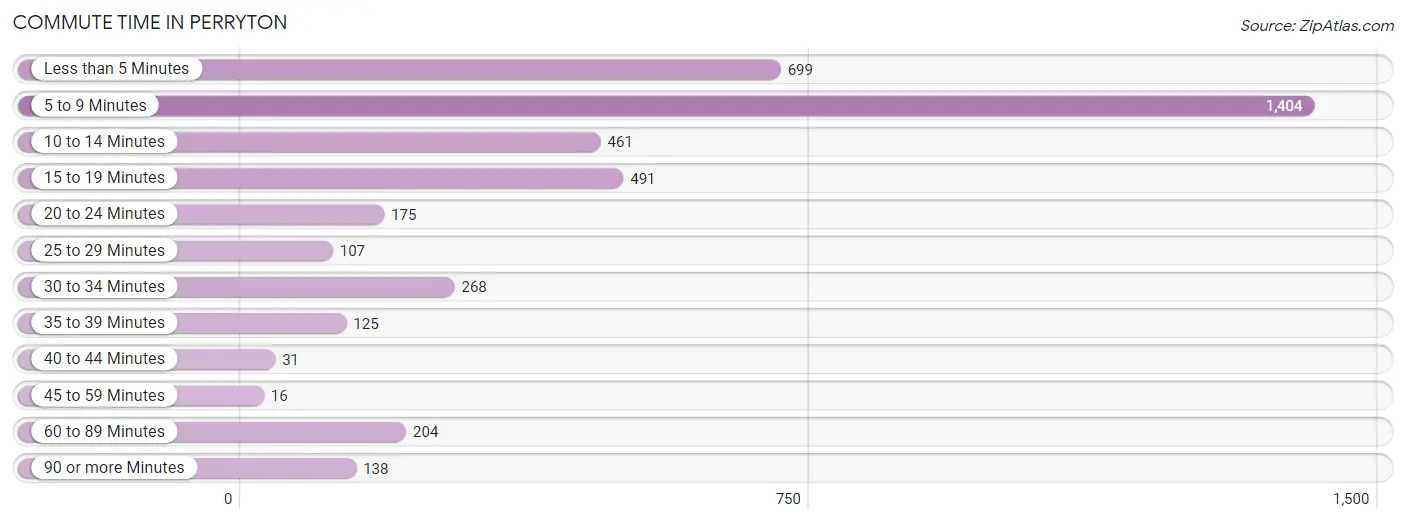
| Commute Time | # Commuters | % Commuters |
| Less than 5 Minutes | 699 | 17.0% |
| 5 to 9 Minutes | 1,404 | 34.1% |
| 10 to 14 Minutes | 461 | 11.2% |
| 15 to 19 Minutes | 491 | 11.9% |
| 20 to 24 Minutes | 175 | 4.3% |
| 25 to 29 Minutes | 107 | 2.6% |
| 30 to 34 Minutes | 268 | 6.5% |
| 35 to 39 Minutes | 125 | 3.0% |
| 40 to 44 Minutes | 31 | 0.7% |
| 45 to 59 Minutes | 16 | 0.4% |
| 60 to 89 Minutes | 204 | 5.0% |
| 90 or more Minutes | 138 | 3.4% |
Commute Time by Sex in Perryton
The most common commute times in Perryton are 5 to 9 minutes (793 commuters, 31.7%) for males and 5 to 9 minutes (611 commuters, 37.7%) for females.
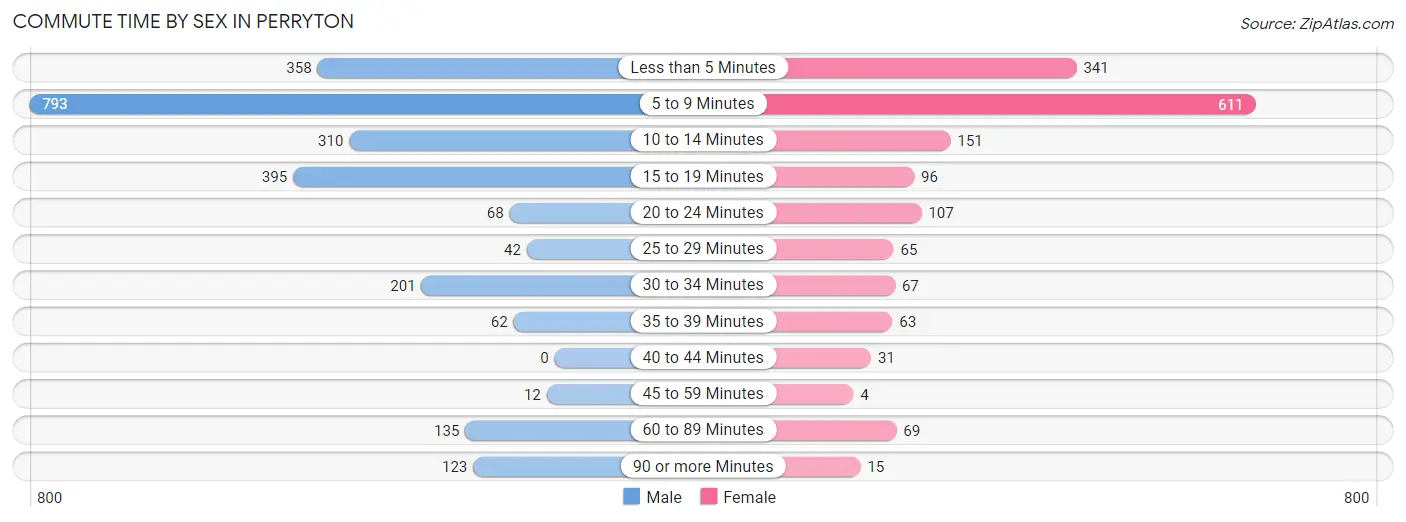
| Commute Time | Male | Female |
| Less than 5 Minutes | 358 (14.3%) | 341 (21.0%) |
| 5 to 9 Minutes | 793 (31.7%) | 611 (37.7%) |
| 10 to 14 Minutes | 310 (12.4%) | 151 (9.3%) |
| 15 to 19 Minutes | 395 (15.8%) | 96 (5.9%) |
| 20 to 24 Minutes | 68 (2.7%) | 107 (6.6%) |
| 25 to 29 Minutes | 42 (1.7%) | 65 (4.0%) |
| 30 to 34 Minutes | 201 (8.0%) | 67 (4.1%) |
| 35 to 39 Minutes | 62 (2.5%) | 63 (3.9%) |
| 40 to 44 Minutes | 0 (0.0%) | 31 (1.9%) |
| 45 to 59 Minutes | 12 (0.5%) | 4 (0.3%) |
| 60 to 89 Minutes | 135 (5.4%) | 69 (4.3%) |
| 90 or more Minutes | 123 (4.9%) | 15 (0.9%) |
Time of Departure to Work by Sex in Perryton
The most frequent times of departure to work in Perryton are 7:30 AM to 7:59 AM (464, 18.6%) for males and 7:00 AM to 7:29 AM (325, 20.1%) for females.
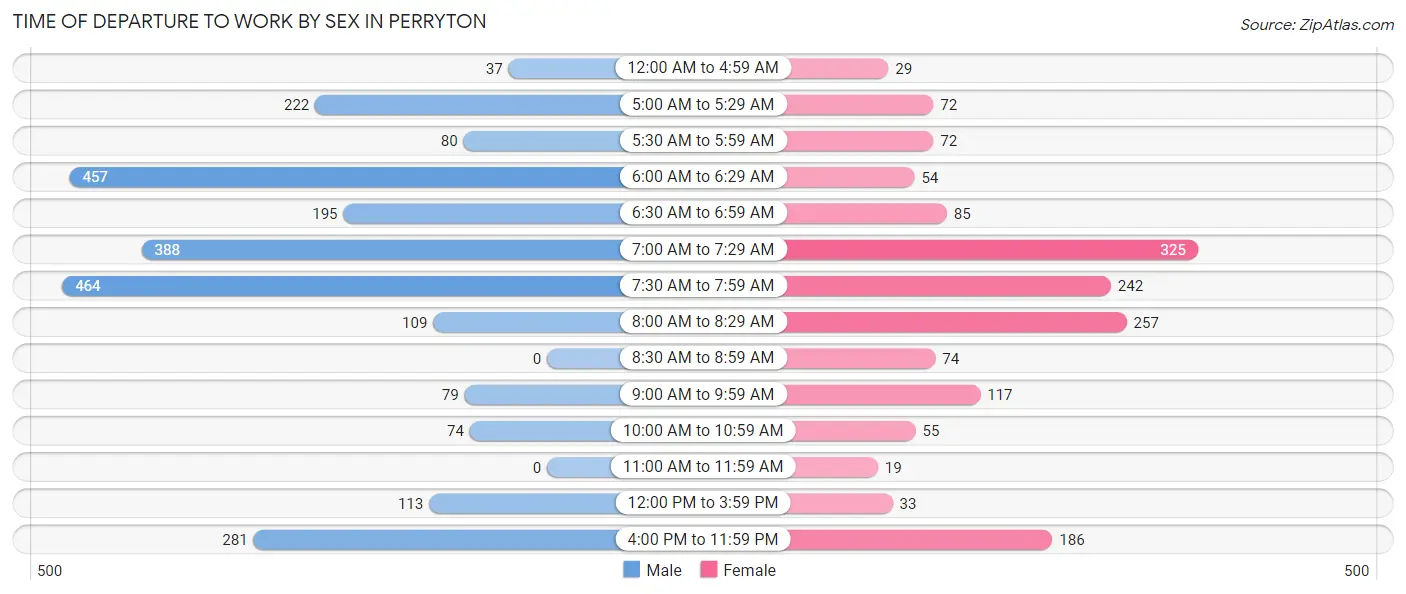
| Time of Departure | Male | Female |
| 12:00 AM to 4:59 AM | 37 (1.5%) | 29 (1.8%) |
| 5:00 AM to 5:29 AM | 222 (8.9%) | 72 (4.4%) |
| 5:30 AM to 5:59 AM | 80 (3.2%) | 72 (4.4%) |
| 6:00 AM to 6:29 AM | 457 (18.3%) | 54 (3.3%) |
| 6:30 AM to 6:59 AM | 195 (7.8%) | 85 (5.2%) |
| 7:00 AM to 7:29 AM | 388 (15.5%) | 325 (20.1%) |
| 7:30 AM to 7:59 AM | 464 (18.6%) | 242 (14.9%) |
| 8:00 AM to 8:29 AM | 109 (4.4%) | 257 (15.9%) |
| 8:30 AM to 8:59 AM | 0 (0.0%) | 74 (4.6%) |
| 9:00 AM to 9:59 AM | 79 (3.2%) | 117 (7.2%) |
| 10:00 AM to 10:59 AM | 74 (3.0%) | 55 (3.4%) |
| 11:00 AM to 11:59 AM | 0 (0.0%) | 19 (1.2%) |
| 12:00 PM to 3:59 PM | 113 (4.5%) | 33 (2.0%) |
| 4:00 PM to 11:59 PM | 281 (11.2%) | 186 (11.5%) |
| Total | 2,499 (100.0%) | 1,620 (100.0%) |
Housing Occupancy in Perryton
Occupancy by Ownership in Perryton
Of the total 3,206 dwellings in Perryton, owner-occupied units account for 2,287 (71.3%), while renter-occupied units make up 919 (28.7%).
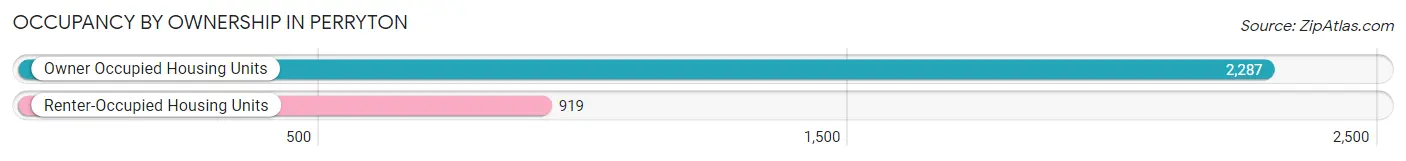
| Occupancy | # Housing Units | % Housing Units |
| Owner Occupied Housing Units | 2,287 | 71.3% |
| Renter-Occupied Housing Units | 919 | 28.7% |
| Total Occupied Housing Units | 3,206 | 100.0% |
Occupancy by Household Size in Perryton
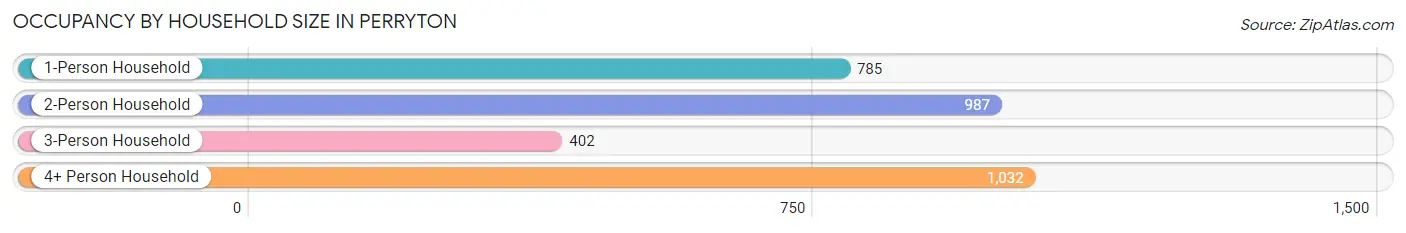
| Household Size | # Housing Units | % Housing Units |
| 1-Person Household | 785 | 24.5% |
| 2-Person Household | 987 | 30.8% |
| 3-Person Household | 402 | 12.5% |
| 4+ Person Household | 1,032 | 32.2% |
| Total Housing Units | 3,206 | 100.0% |
Occupancy by Ownership by Household Size in Perryton
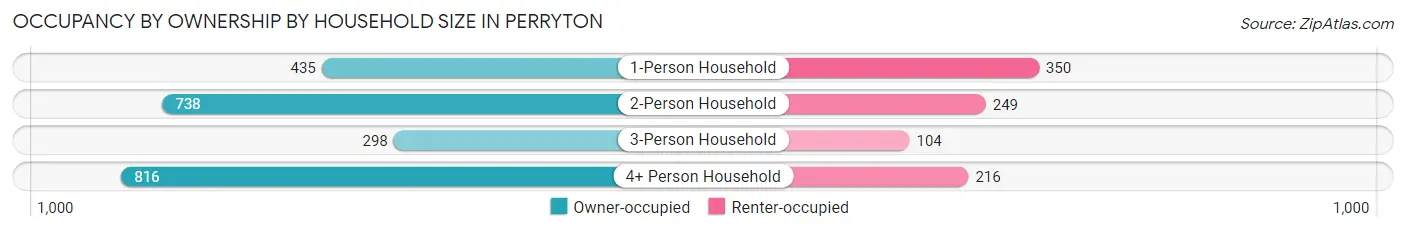
| Household Size | Owner-occupied | Renter-occupied |
| 1-Person Household | 435 (55.4%) | 350 (44.6%) |
| 2-Person Household | 738 (74.8%) | 249 (25.2%) |
| 3-Person Household | 298 (74.1%) | 104 (25.9%) |
| 4+ Person Household | 816 (79.1%) | 216 (20.9%) |
| Total Housing Units | 2,287 (71.3%) | 919 (28.7%) |
Occupancy by Educational Attainment in Perryton
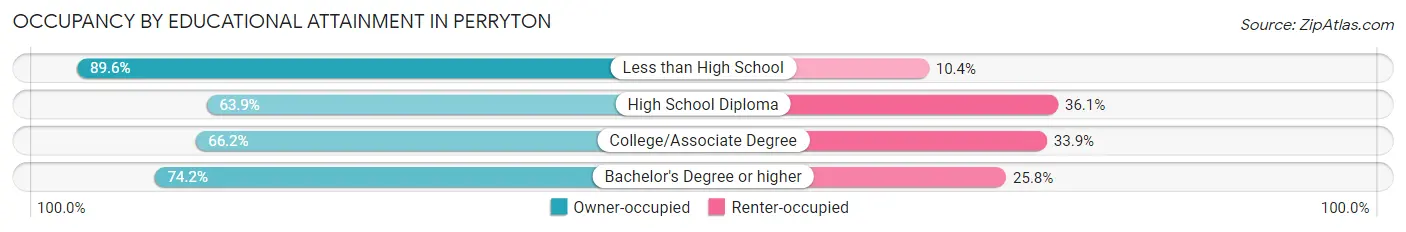
| Household Size | Owner-occupied | Renter-occupied |
| Less than High School | 515 (89.6%) | 60 (10.4%) |
| High School Diploma | 704 (63.9%) | 397 (36.1%) |
| College/Associate Degree | 555 (66.1%) | 284 (33.9%) |
| Bachelor's Degree or higher | 513 (74.2%) | 178 (25.8%) |
Occupancy by Age of Householder in Perryton
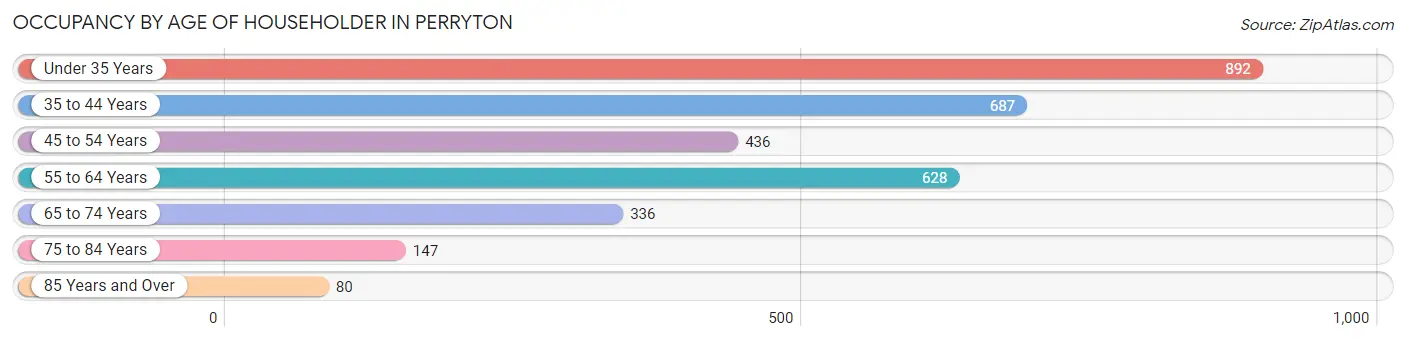
| Age Bracket | # Households | % Households |
| Under 35 Years | 892 | 27.8% |
| 35 to 44 Years | 687 | 21.4% |
| 45 to 54 Years | 436 | 13.6% |
| 55 to 64 Years | 628 | 19.6% |
| 65 to 74 Years | 336 | 10.5% |
| 75 to 84 Years | 147 | 4.6% |
| 85 Years and Over | 80 | 2.5% |
| Total | 3,206 | 100.0% |
Housing Finances in Perryton
Median Income by Occupancy in Perryton
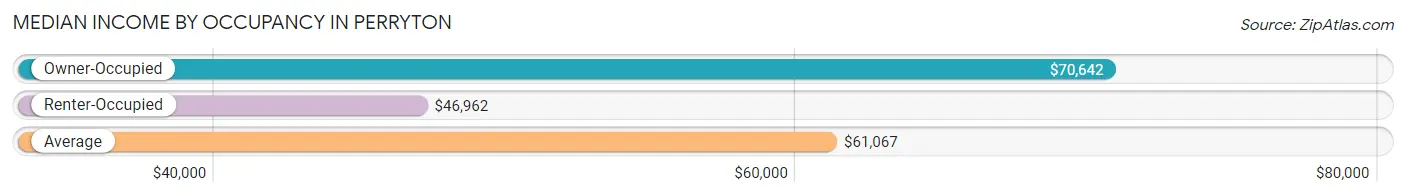
| Occupancy Type | # Households | Median Income |
| Owner-Occupied | 2,287 (71.3%) | $70,642 |
| Renter-Occupied | 919 (28.7%) | $46,962 |
| Average | 3,206 (100.0%) | $61,067 |
Occupancy by Householder Income Bracket in Perryton
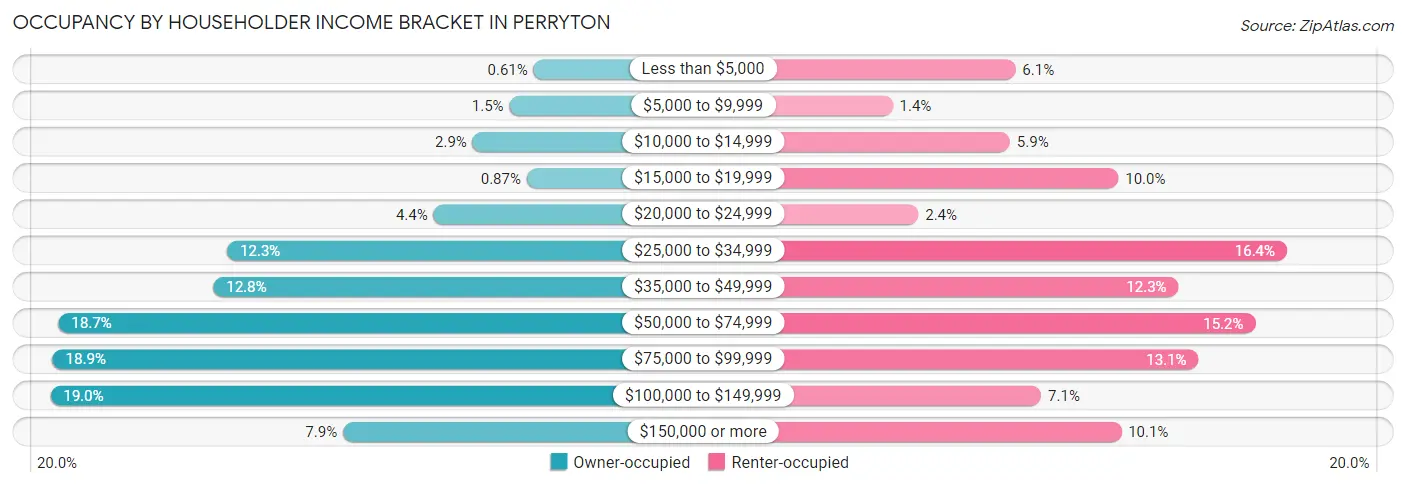
| Income Bracket | Owner-occupied | Renter-occupied |
| Less than $5,000 | 14 (0.6%) | 56 (6.1%) |
| $5,000 to $9,999 | 35 (1.5%) | 13 (1.4%) |
| $10,000 to $14,999 | 67 (2.9%) | 54 (5.9%) |
| $15,000 to $19,999 | 20 (0.9%) | 92 (10.0%) |
| $20,000 to $24,999 | 101 (4.4%) | 22 (2.4%) |
| $25,000 to $34,999 | 281 (12.3%) | 151 (16.4%) |
| $35,000 to $49,999 | 293 (12.8%) | 113 (12.3%) |
| $50,000 to $74,999 | 428 (18.7%) | 140 (15.2%) |
| $75,000 to $99,999 | 433 (18.9%) | 120 (13.1%) |
| $100,000 to $149,999 | 435 (19.0%) | 65 (7.1%) |
| $150,000 or more | 180 (7.9%) | 93 (10.1%) |
| Total | 2,287 (100.0%) | 919 (100.0%) |
Monthly Housing Cost Tiers in Perryton
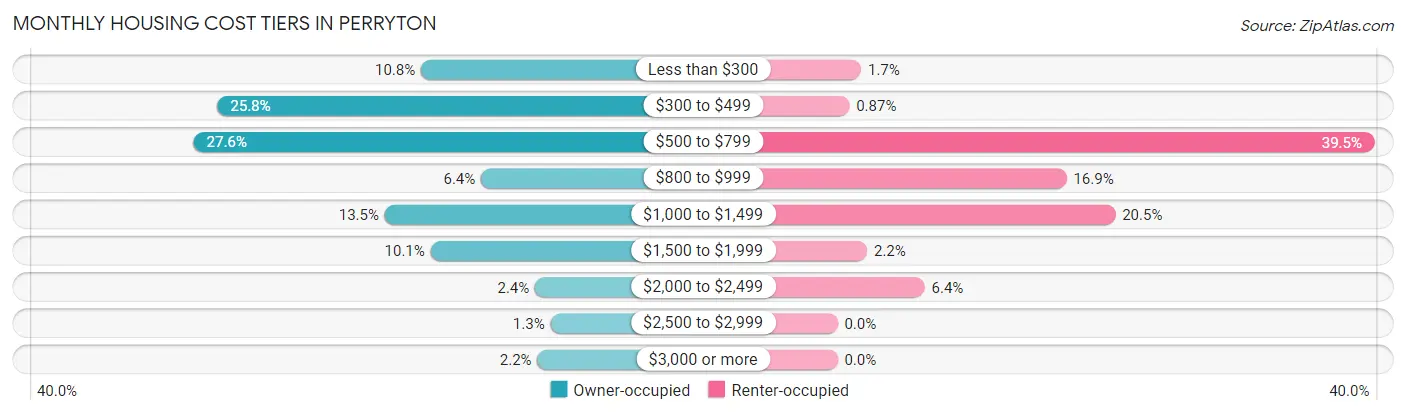
| Monthly Cost | Owner-occupied | Renter-occupied |
| Less than $300 | 247 (10.8%) | 16 (1.7%) |
| $300 to $499 | 590 (25.8%) | 8 (0.9%) |
| $500 to $799 | 630 (27.6%) | 363 (39.5%) |
| $800 to $999 | 146 (6.4%) | 155 (16.9%) |
| $1,000 to $1,499 | 308 (13.5%) | 188 (20.5%) |
| $1,500 to $1,999 | 231 (10.1%) | 20 (2.2%) |
| $2,000 to $2,499 | 55 (2.4%) | 59 (6.4%) |
| $2,500 to $2,999 | 29 (1.3%) | 0 (0.0%) |
| $3,000 or more | 51 (2.2%) | 0 (0.0%) |
| Total | 2,287 (100.0%) | 919 (100.0%) |
Physical Housing Characteristics in Perryton
Housing Structures in Perryton
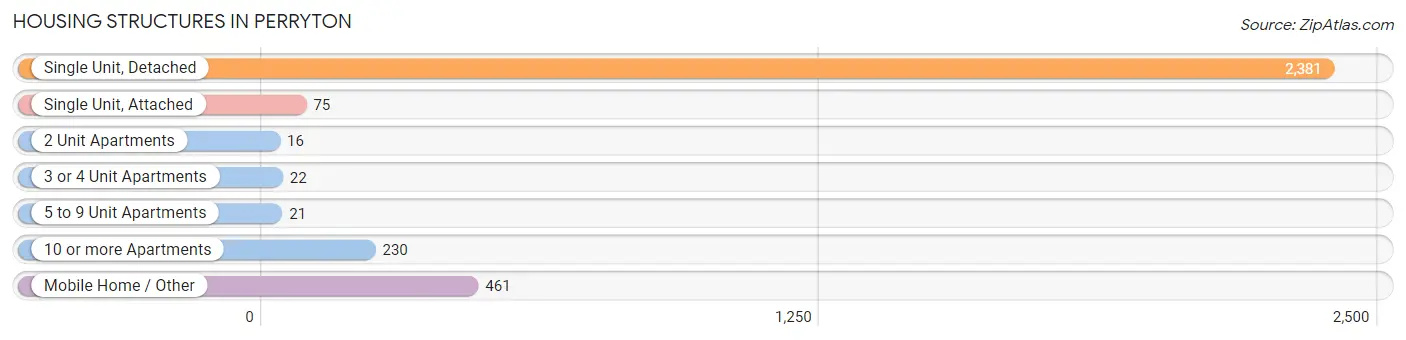
| Structure Type | # Housing Units | % Housing Units |
| Single Unit, Detached | 2,381 | 74.3% |
| Single Unit, Attached | 75 | 2.3% |
| 2 Unit Apartments | 16 | 0.5% |
| 3 or 4 Unit Apartments | 22 | 0.7% |
| 5 to 9 Unit Apartments | 21 | 0.7% |
| 10 or more Apartments | 230 | 7.2% |
| Mobile Home / Other | 461 | 14.4% |
| Total | 3,206 | 100.0% |
Housing Structures by Occupancy in Perryton
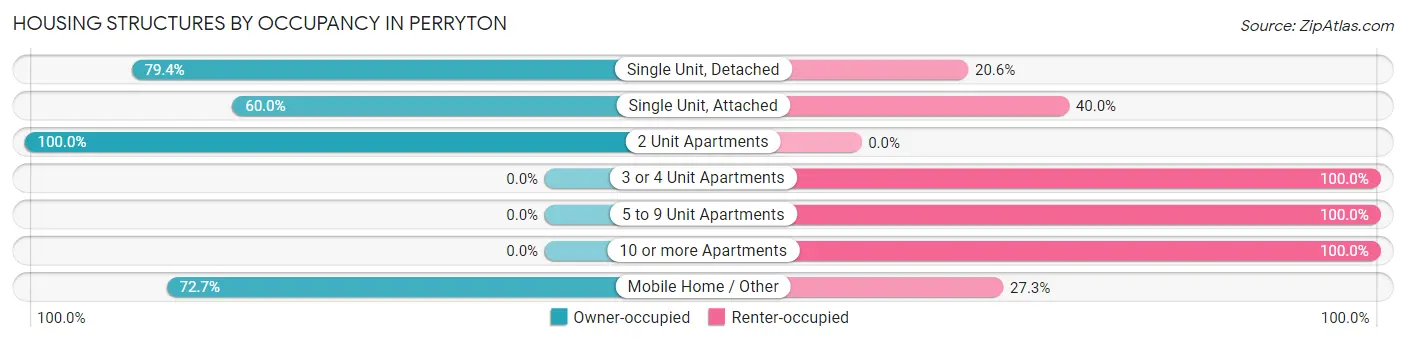
| Structure Type | Owner-occupied | Renter-occupied |
| Single Unit, Detached | 1,891 (79.4%) | 490 (20.6%) |
| Single Unit, Attached | 45 (60.0%) | 30 (40.0%) |
| 2 Unit Apartments | 16 (100.0%) | 0 (0.0%) |
| 3 or 4 Unit Apartments | 0 (0.0%) | 22 (100.0%) |
| 5 to 9 Unit Apartments | 0 (0.0%) | 21 (100.0%) |
| 10 or more Apartments | 0 (0.0%) | 230 (100.0%) |
| Mobile Home / Other | 335 (72.7%) | 126 (27.3%) |
| Total | 2,287 (71.3%) | 919 (28.7%) |
Housing Structures by Number of Rooms in Perryton
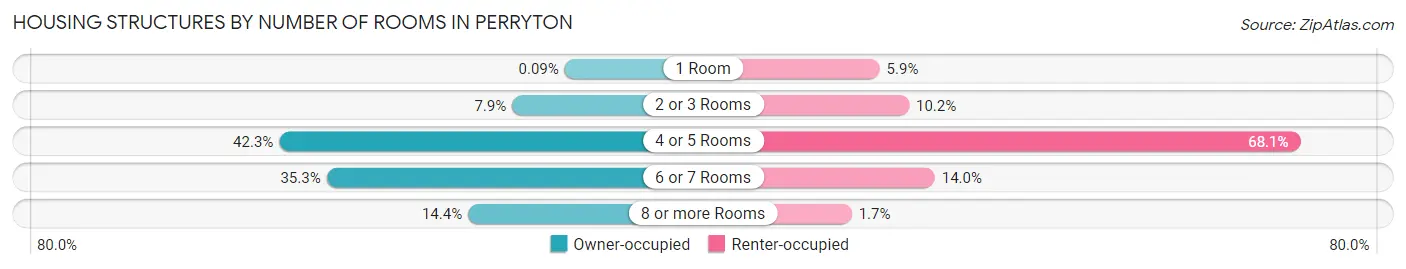
| Number of Rooms | Owner-occupied | Renter-occupied |
| 1 Room | 2 (0.1%) | 54 (5.9%) |
| 2 or 3 Rooms | 180 (7.9%) | 94 (10.2%) |
| 4 or 5 Rooms | 968 (42.3%) | 626 (68.1%) |
| 6 or 7 Rooms | 808 (35.3%) | 129 (14.0%) |
| 8 or more Rooms | 329 (14.4%) | 16 (1.7%) |
| Total | 2,287 (100.0%) | 919 (100.0%) |
Housing Structure by Heating Type in Perryton
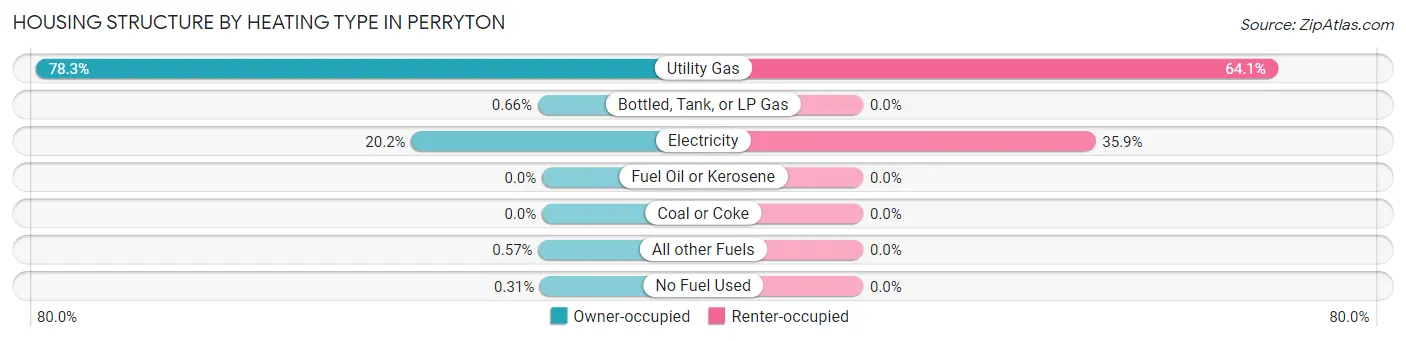
| Heating Type | Owner-occupied | Renter-occupied |
| Utility Gas | 1,790 (78.3%) | 589 (64.1%) |
| Bottled, Tank, or LP Gas | 15 (0.7%) | 0 (0.0%) |
| Electricity | 462 (20.2%) | 330 (35.9%) |
| Fuel Oil or Kerosene | 0 (0.0%) | 0 (0.0%) |
| Coal or Coke | 0 (0.0%) | 0 (0.0%) |
| All other Fuels | 13 (0.6%) | 0 (0.0%) |
| No Fuel Used | 7 (0.3%) | 0 (0.0%) |
| Total | 2,287 (100.0%) | 919 (100.0%) |
Household Vehicle Usage in Perryton
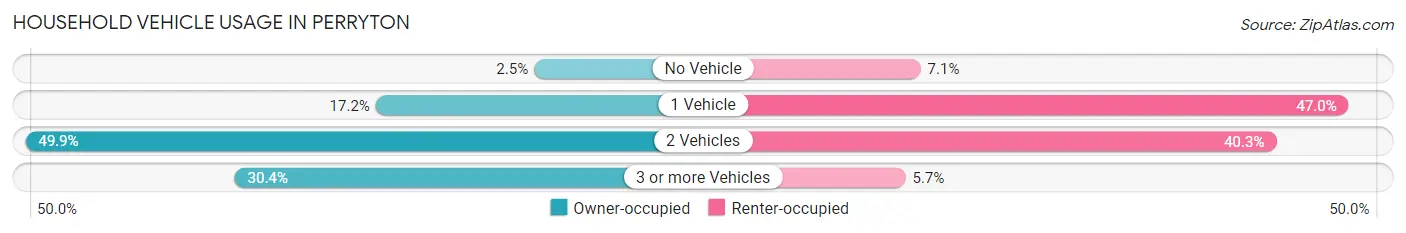
| Vehicles per Household | Owner-occupied | Renter-occupied |
| No Vehicle | 56 (2.5%) | 65 (7.1%) |
| 1 Vehicle | 394 (17.2%) | 432 (47.0%) |
| 2 Vehicles | 1,142 (49.9%) | 370 (40.3%) |
| 3 or more Vehicles | 695 (30.4%) | 52 (5.7%) |
| Total | 2,287 (100.0%) | 919 (100.0%) |
Real Estate & Mortgages in Perryton
Real Estate and Mortgage Overview in Perryton
| Characteristic | Without Mortgage | With Mortgage |
| Housing Units | 1,624 | 663 |
| Median Property Value | $94,400 | $159,800 |
| Median Household Income | $63,167 | $49 |
| Monthly Housing Costs | $493 | $51 |
| Real Estate Taxes | $1,424 | $0 |
Property Value by Mortgage Status in Perryton
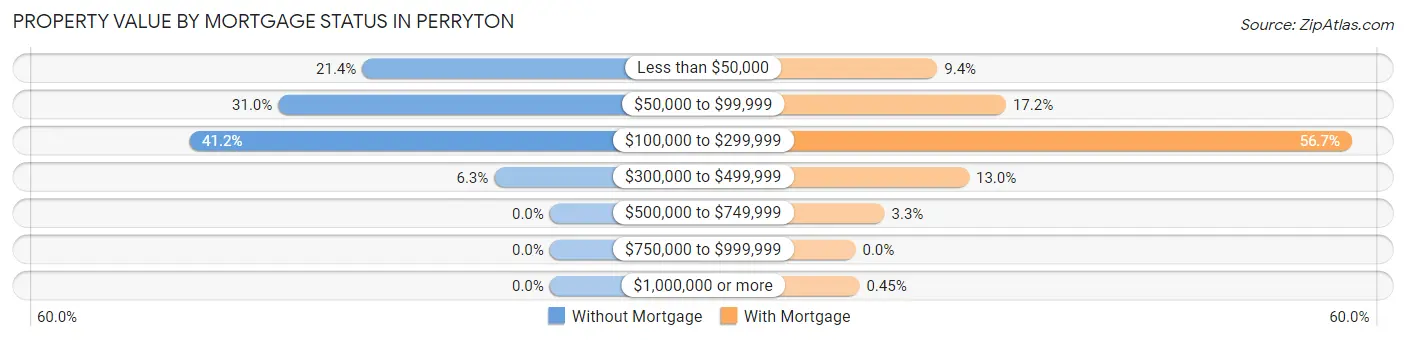
| Property Value | Without Mortgage | With Mortgage |
| Less than $50,000 | 348 (21.4%) | 62 (9.3%) |
| $50,000 to $99,999 | 504 (31.0%) | 114 (17.2%) |
| $100,000 to $299,999 | 669 (41.2%) | 376 (56.7%) |
| $300,000 to $499,999 | 103 (6.3%) | 86 (13.0%) |
| $500,000 to $749,999 | 0 (0.0%) | 22 (3.3%) |
| $750,000 to $999,999 | 0 (0.0%) | 0 (0.0%) |
| $1,000,000 or more | 0 (0.0%) | 3 (0.4%) |
| Total | 1,624 (100.0%) | 663 (100.0%) |
Household Income by Mortgage Status in Perryton
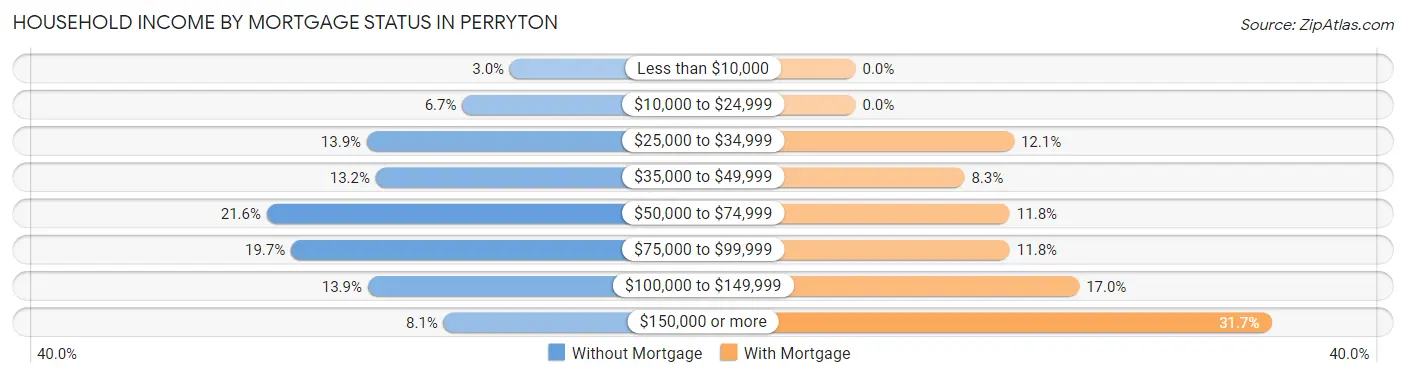
| Household Income | Without Mortgage | With Mortgage |
| Less than $10,000 | 49 (3.0%) | 0 (0.0%) |
| $10,000 to $24,999 | 108 (6.7%) | 0 (0.0%) |
| $25,000 to $34,999 | 226 (13.9%) | 80 (12.1%) |
| $35,000 to $49,999 | 215 (13.2%) | 55 (8.3%) |
| $50,000 to $74,999 | 350 (21.5%) | 78 (11.8%) |
| $75,000 to $99,999 | 320 (19.7%) | 78 (11.8%) |
| $100,000 to $149,999 | 225 (13.9%) | 113 (17.0%) |
| $150,000 or more | 131 (8.1%) | 210 (31.7%) |
| Total | 1,624 (100.0%) | 663 (100.0%) |
Property Value to Household Income Ratio in Perryton
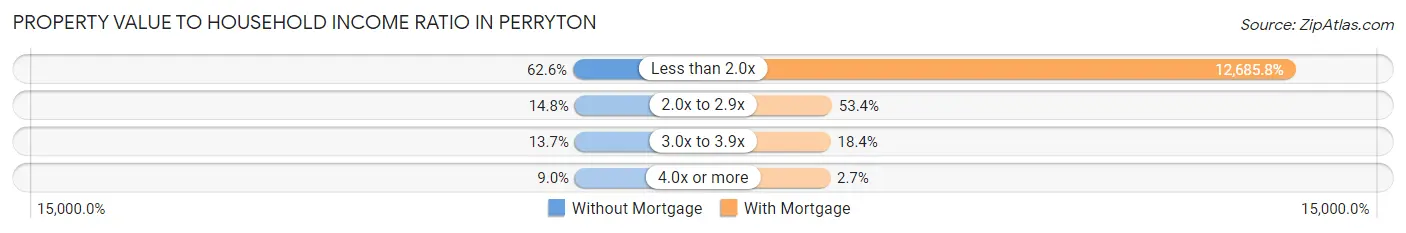
| Value-to-Income Ratio | Without Mortgage | With Mortgage |
| Less than 2.0x | 1,016 (62.6%) | 84,107 (12,685.8%) |
| 2.0x to 2.9x | 240 (14.8%) | 354 (53.4%) |
| 3.0x to 3.9x | 222 (13.7%) | 122 (18.4%) |
| 4.0x or more | 146 (9.0%) | 18 (2.7%) |
| Total | 1,624 (100.0%) | 663 (100.0%) |
Real Estate Taxes by Mortgage Status in Perryton
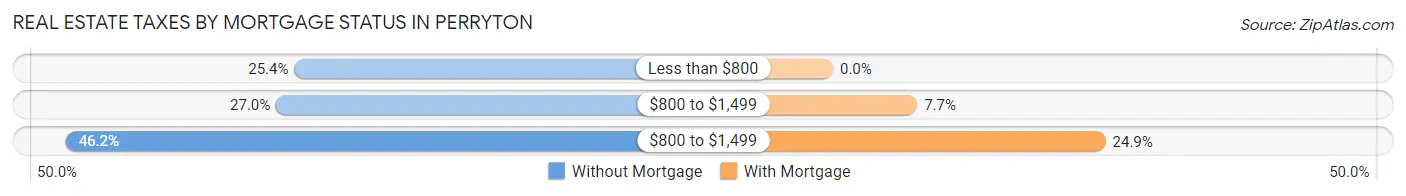
| Property Taxes | Without Mortgage | With Mortgage |
| Less than $800 | 412 (25.4%) | 0 (0.0%) |
| $800 to $1,499 | 439 (27.0%) | 51 (7.7%) |
| $800 to $1,499 | 751 (46.2%) | 165 (24.9%) |
| Total | 1,624 (100.0%) | 663 (100.0%) |
Health & Disability in Perryton
Health Insurance Coverage by Age in Perryton
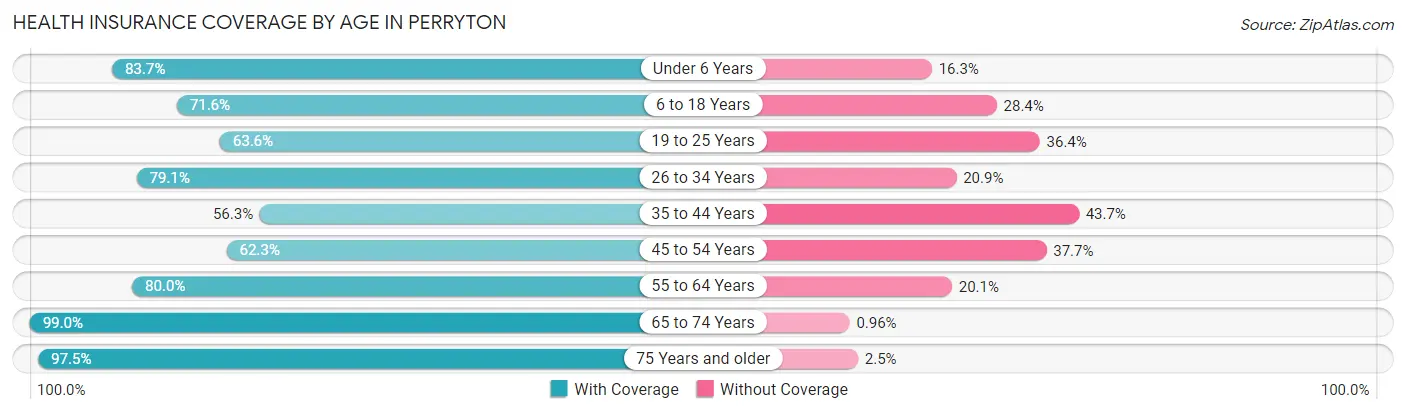
| Age Bracket | With Coverage | Without Coverage |
| Under 6 Years | 688 (83.7%) | 134 (16.3%) |
| 6 to 18 Years | 1,281 (71.6%) | 508 (28.4%) |
| 19 to 25 Years | 522 (63.6%) | 299 (36.4%) |
| 26 to 34 Years | 944 (79.1%) | 249 (20.9%) |
| 35 to 44 Years | 711 (56.3%) | 552 (43.7%) |
| 45 to 54 Years | 455 (62.3%) | 275 (37.7%) |
| 55 to 64 Years | 877 (79.9%) | 220 (20.1%) |
| 65 to 74 Years | 514 (99.0%) | 5 (1.0%) |
| 75 Years and older | 347 (97.5%) | 9 (2.5%) |
| Total | 6,339 (73.8%) | 2,251 (26.2%) |
Health Insurance Coverage by Citizenship Status in Perryton
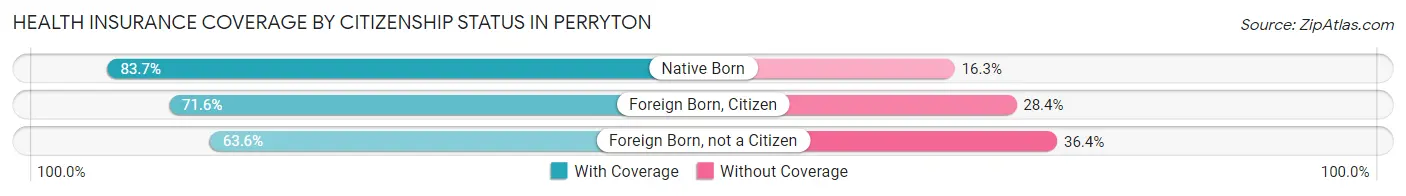
| Citizenship Status | With Coverage | Without Coverage |
| Native Born | 688 (83.7%) | 134 (16.3%) |
| Foreign Born, Citizen | 1,281 (71.6%) | 508 (28.4%) |
| Foreign Born, not a Citizen | 522 (63.6%) | 299 (36.4%) |
Health Insurance Coverage by Household Income in Perryton
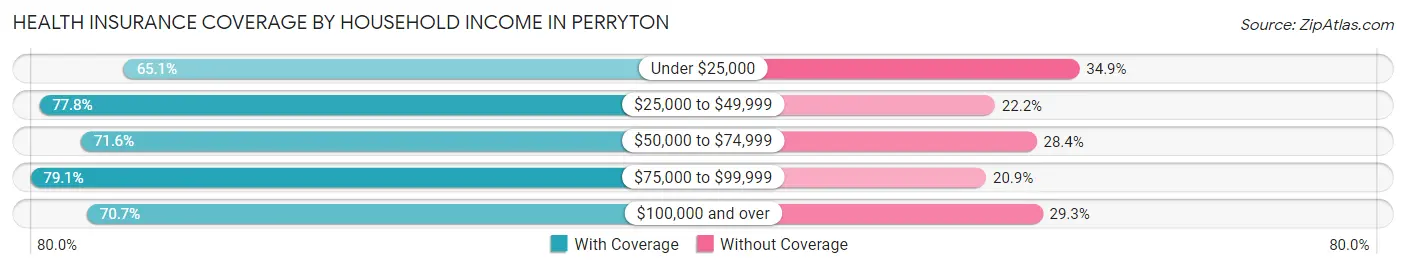
| Household Income | With Coverage | Without Coverage |
| Under $25,000 | 583 (65.1%) | 312 (34.9%) |
| $25,000 to $49,999 | 1,644 (77.8%) | 469 (22.2%) |
| $50,000 to $74,999 | 1,150 (71.6%) | 457 (28.4%) |
| $75,000 to $99,999 | 1,433 (79.1%) | 378 (20.9%) |
| $100,000 and over | 1,529 (70.7%) | 635 (29.3%) |
Public vs Private Health Insurance Coverage by Age in Perryton
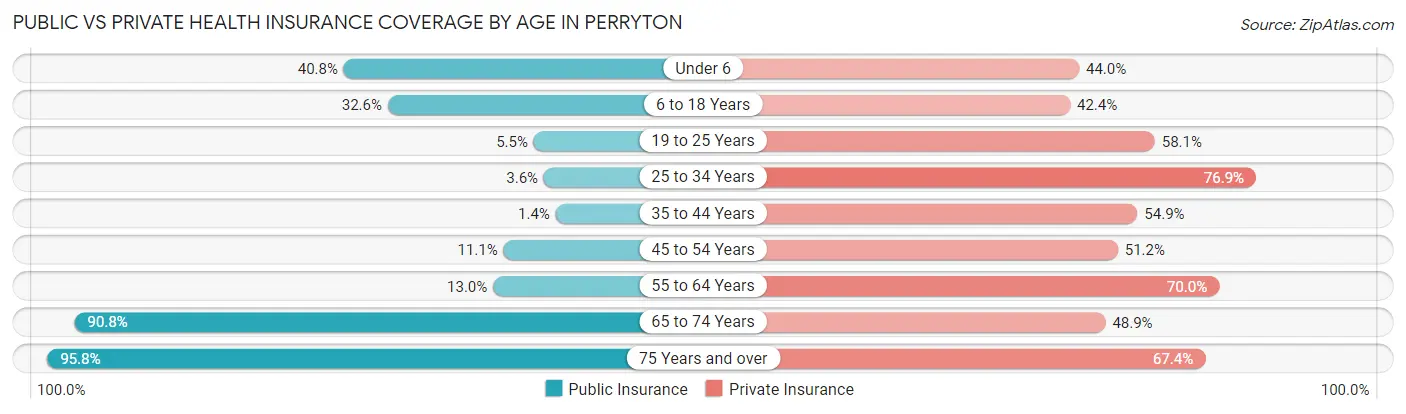
| Age Bracket | Public Insurance | Private Insurance |
| Under 6 | 335 (40.7%) | 362 (44.0%) |
| 6 to 18 Years | 583 (32.6%) | 758 (42.4%) |
| 19 to 25 Years | 45 (5.5%) | 477 (58.1%) |
| 25 to 34 Years | 43 (3.6%) | 917 (76.9%) |
| 35 to 44 Years | 18 (1.4%) | 693 (54.9%) |
| 45 to 54 Years | 81 (11.1%) | 374 (51.2%) |
| 55 to 64 Years | 143 (13.0%) | 768 (70.0%) |
| 65 to 74 Years | 471 (90.7%) | 254 (48.9%) |
| 75 Years and over | 341 (95.8%) | 240 (67.4%) |
| Total | 2,060 (24.0%) | 4,843 (56.4%) |
Disability Status by Sex by Age in Perryton
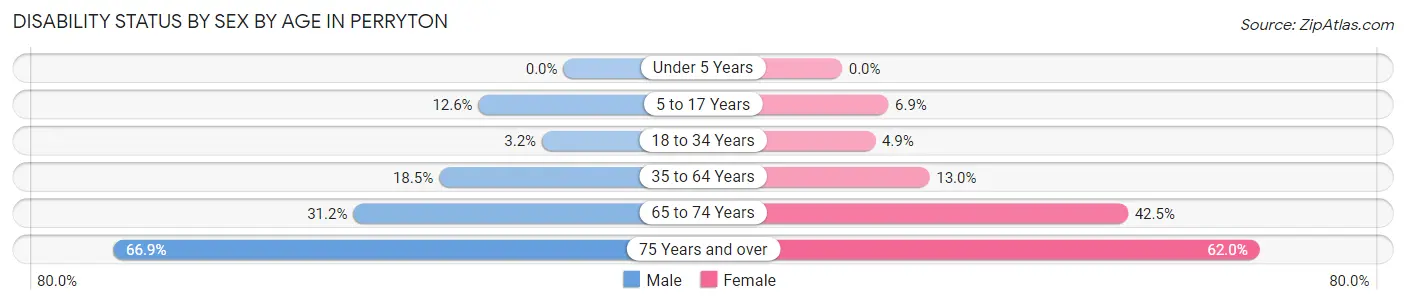
| Age Bracket | Male | Female |
| Under 5 Years | 0 (0.0%) | 0 (0.0%) |
| 5 to 17 Years | 115 (12.6%) | 72 (6.9%) |
| 18 to 34 Years | 34 (3.2%) | 48 (4.9%) |
| 35 to 64 Years | 292 (18.5%) | 196 (13.0%) |
| 65 to 74 Years | 73 (31.2%) | 121 (42.5%) |
| 75 Years and over | 113 (66.9%) | 116 (62.0%) |
Disability Class by Sex by Age in Perryton
Disability Class: Hearing Difficulty
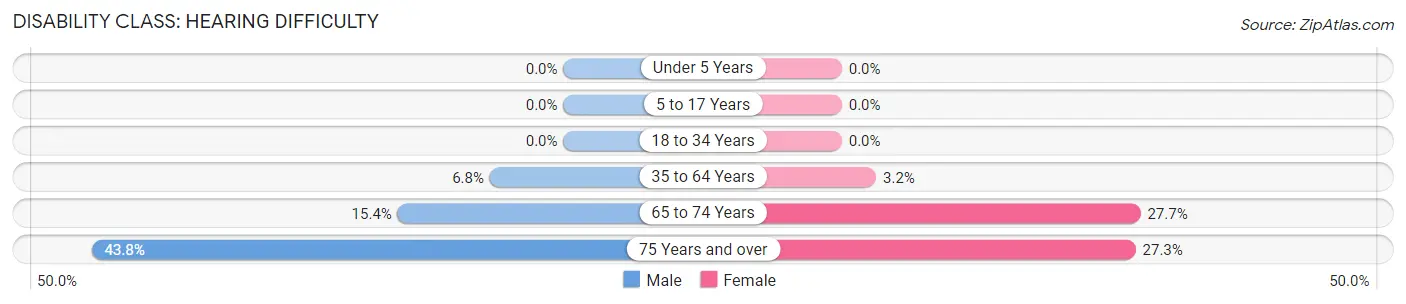
| Age Bracket | Male | Female |
| Under 5 Years | 0 (0.0%) | 0 (0.0%) |
| 5 to 17 Years | 0 (0.0%) | 0 (0.0%) |
| 18 to 34 Years | 0 (0.0%) | 0 (0.0%) |
| 35 to 64 Years | 108 (6.8%) | 48 (3.2%) |
| 65 to 74 Years | 36 (15.4%) | 79 (27.7%) |
| 75 Years and over | 74 (43.8%) | 51 (27.3%) |
Disability Class: Vision Difficulty
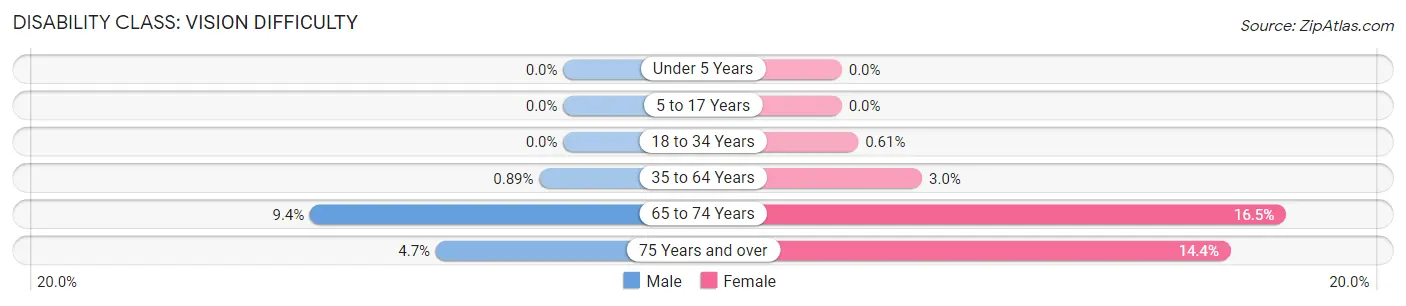
| Age Bracket | Male | Female |
| Under 5 Years | 0 (0.0%) | 0 (0.0%) |
| 5 to 17 Years | 0 (0.0%) | 0 (0.0%) |
| 18 to 34 Years | 0 (0.0%) | 6 (0.6%) |
| 35 to 64 Years | 14 (0.9%) | 45 (3.0%) |
| 65 to 74 Years | 22 (9.4%) | 47 (16.5%) |
| 75 Years and over | 8 (4.7%) | 27 (14.4%) |
Disability Class: Cognitive Difficulty
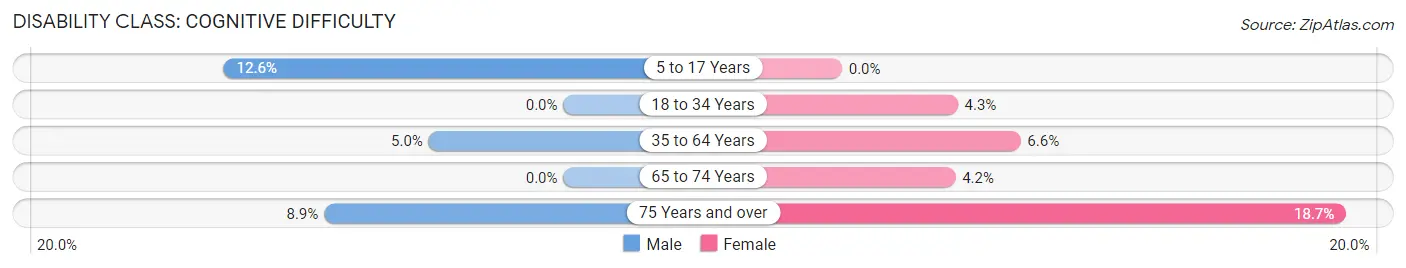
| Age Bracket | Male | Female |
| 5 to 17 Years | 115 (12.6%) | 0 (0.0%) |
| 18 to 34 Years | 0 (0.0%) | 42 (4.3%) |
| 35 to 64 Years | 79 (5.0%) | 100 (6.6%) |
| 65 to 74 Years | 0 (0.0%) | 12 (4.2%) |
| 75 Years and over | 15 (8.9%) | 35 (18.7%) |
Disability Class: Ambulatory Difficulty
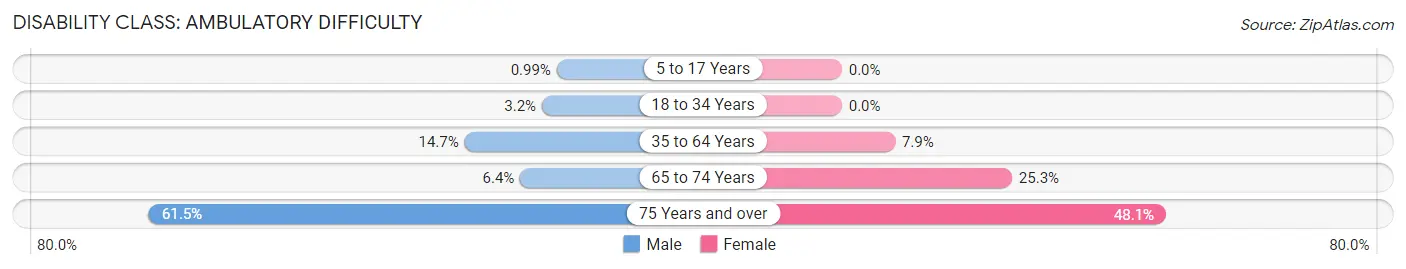
| Age Bracket | Male | Female |
| 5 to 17 Years | 9 (1.0%) | 0 (0.0%) |
| 18 to 34 Years | 34 (3.2%) | 0 (0.0%) |
| 35 to 64 Years | 232 (14.7%) | 119 (7.9%) |
| 65 to 74 Years | 15 (6.4%) | 72 (25.3%) |
| 75 Years and over | 104 (61.5%) | 90 (48.1%) |
Disability Class: Self-Care Difficulty
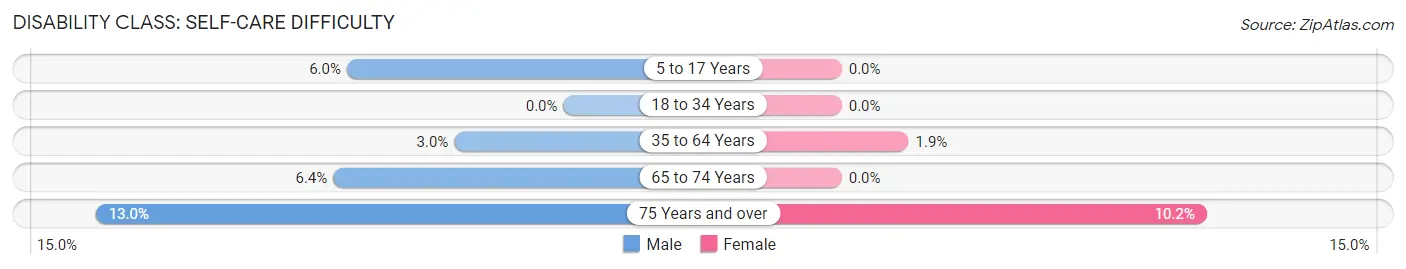
| Age Bracket | Male | Female |
| 5 to 17 Years | 55 (6.0%) | 0 (0.0%) |
| 18 to 34 Years | 0 (0.0%) | 0 (0.0%) |
| 35 to 64 Years | 48 (3.0%) | 28 (1.9%) |
| 65 to 74 Years | 15 (6.4%) | 0 (0.0%) |
| 75 Years and over | 22 (13.0%) | 19 (10.2%) |
Technology Access in Perryton
Computing Device Access in Perryton
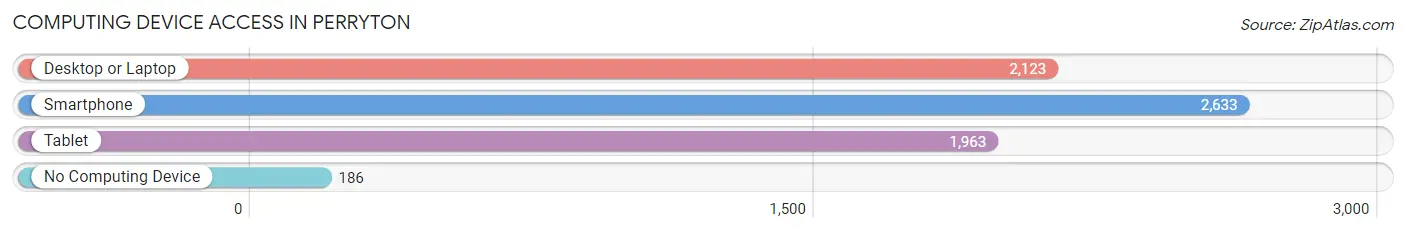
| Device Type | # Households | % Households |
| Desktop or Laptop | 2,123 | 66.2% |
| Smartphone | 2,633 | 82.1% |
| Tablet | 1,963 | 61.2% |
| No Computing Device | 186 | 5.8% |
| Total | 3,206 | 100.0% |
Internet Access in Perryton
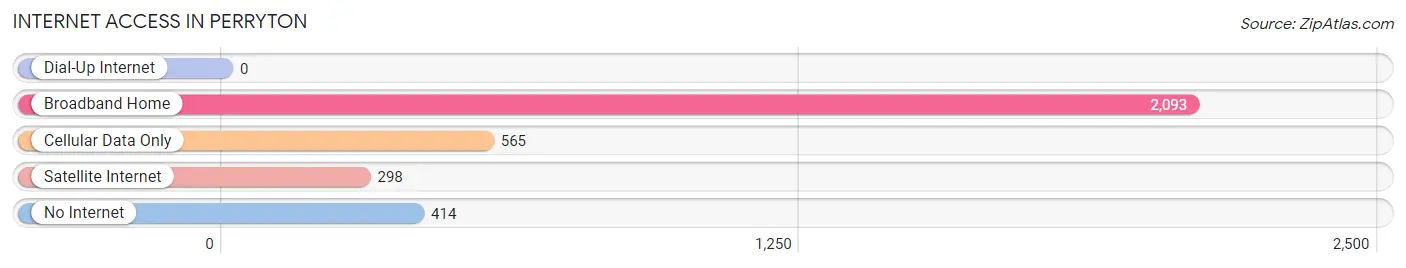
| Internet Type | # Households | % Households |
| Dial-Up Internet | 0 | 0.0% |
| Broadband Home | 2,093 | 65.3% |
| Cellular Data Only | 565 | 17.6% |
| Satellite Internet | 298 | 9.3% |
| No Internet | 414 | 12.9% |
| Total | 3,206 | 100.0% |
Perryton Summary
Perryton, Texas is a small city located in the northern part of the state, in Ochiltree County. It is situated on the Texas Panhandle, near the Oklahoma border. The city was founded in 1909 and has a population of 8,802 as of the 2020 census.
History
Perryton was founded in 1909 by the Perryton Land and Cattle Company. The company was owned by the Perry family, who had previously owned a ranch in the area. The town was named after the family's patriarch, William Perry. The town was originally intended to be a trading post for the ranch, but it quickly grew into a small town.
The first post office was established in 1910, and the town was incorporated in 1911. The first school was built in 1912, and the first church was built in 1913. The town was a major stop on the Santa Fe Railroad, and it quickly became a hub for the surrounding area.
In the 1920s, the town experienced a period of growth, with the opening of several businesses, including a bank, a hotel, and a movie theater. The town also had a newspaper, the Perryton Herald, which was established in 1921.
In the 1930s, the Great Depression hit the town hard, and many businesses closed. However, the town was able to survive, and in the 1940s, the economy began to improve. The town was also home to a large military base during World War II, which provided jobs and economic stability.
In the 1950s, the town experienced a period of growth, with the opening of several new businesses, including a hospital, a library, and a shopping center. The town also had a thriving oil industry, which provided jobs and economic stability.
In the 1960s, the town experienced a period of decline, as the oil industry began to decline. However, the town was able to survive, and in the 1970s, the economy began to improve. The town was also home to a large military base during the Vietnam War, which provided jobs and economic stability.
In the 1980s, the town experienced a period of growth, with the opening of several new businesses, including a hospital, a library, and a shopping center. The town also had a thriving oil industry, which provided jobs and economic stability.
In the 1990s, the town experienced a period of decline, as the oil industry began to decline. However, the town was able to survive, and in the 2000s, the economy began to improve. The town was also home to a large military base during the Iraq War, which provided jobs and economic stability.
Geography
Perryton is located in the northern part of the Texas Panhandle, in Ochiltree County. It is situated on the Oklahoma border, about 90 miles east of Amarillo. The city is located at the intersection of U.S. Highway 83 and State Highway 70.
The city has a total area of 4.3 square miles, all of which is land. The terrain is mostly flat, with some rolling hills. The climate is semi-arid, with hot summers and cold winters.
Economy
The economy of Perryton is largely based on agriculture and oil. The town is home to several large farms, which produce wheat, corn, and other crops. The town is also home to several oil and gas companies, which provide jobs and economic stability.
The town is also home to several manufacturing companies, which produce a variety of products, including furniture, clothing, and electronics. The town is also home to several retail stores, which provide jobs and economic stability.
Demographics
As of the 2020 census, Perryton had a population of 8,802. The racial makeup of the city was 79.2% White, 0.7% African American, 0.3% Native American, 0.2% Asian, 0.1% Pacific Islander, 17.7% from other races, and 2.0% from two or more races. Hispanic or Latino of any race were 33.2% of the population.
The median household income in Perryton was $41,945, and the median family income was $48,945. The per capita income was $19,945. About 17.2% of the population was below the poverty line.
Common Questions
What is Per Capita Income in Perryton?
Per Capita income in Perryton is $28,589.
What is the Median Family Income in Perryton?
Median Family Income in Perryton is $74,375.
What is the Median Household income in Perryton?
Median Household Income in Perryton is $61,067.
What is Income or Wage Gap in Perryton?
Income or Wage Gap in Perryton is 45.8%.
Women in Perryton earn 54.2 cents for every dollar earned by a man.
What is Family Income Deficit in Perryton?
Family Income Deficit in Perryton is $12,112.
Families that are below poverty line in Perryton earn $12,112 less on average than the poverty threshold level.
What is Inequality or Gini Index in Perryton?
Inequality or Gini Index in Perryton is 0.39.
What is the Total Population of Perryton?
Total Population of Perryton is 8,664.
What is the Total Male Population of Perryton?
Total Male Population of Perryton is 4,314.
What is the Total Female Population of Perryton?
Total Female Population of Perryton is 4,350.
What is the Ratio of Males per 100 Females in Perryton?
There are 99.17 Males per 100 Females in Perryton.
What is the Ratio of Females per 100 Males in Perryton?
There are 100.83 Females per 100 Males in Perryton.
What is the Median Population Age in Perryton?
Median Population Age in Perryton is 33.1 Years.
What is the Average Family Size in Perryton
Average Family Size in Perryton is 3.1 People.
What is the Average Household Size in Perryton
Average Household Size in Perryton is 2.7 People.
How Large is the Labor Force in Perryton?
There are 4,333 People in the Labor Forcein in Perryton.
What is the Percentage of People in the Labor Force in Perryton?
66.9% of People are in the Labor Force in Perryton.
What is the Unemployment Rate in Perryton?
Unemployment Rate in Perryton is 1.6%.