Pampa, TX Map & Demographics
Pampa Map
Pampa Overview
$31,426
PER CAPITA INCOME
$60,616
AVG FAMILY INCOME
$52,966
AVG HOUSEHOLD INCOME
41.3%
WAGE / INCOME GAP [ % ]
58.7¢/ $1
WAGE / INCOME GAP [ $ ]
0.49
INEQUALITY / GINI INDEX
16,861
TOTAL POPULATION
8,563
MALE POPULATION
8,298
FEMALE POPULATION
103.19
MALES / 100 FEMALES
96.91
FEMALES / 100 MALES
35.5
MEDIAN AGE
3.0
AVG FAMILY SIZE
2.4
AVG HOUSEHOLD SIZE
8,227
LABOR FORCE [ PEOPLE ]
63.6%
PERCENT IN LABOR FORCE
5.7%
UNEMPLOYMENT RATE
Pampa Area Codes
Income in Pampa
Income Overview in Pampa
Per Capita Income in Pampa is $31,426, while median incomes of families and households are $60,616 and $52,966 respectively.
| Characteristic | Number | Measure |
| Per Capita Income | 16,861 | $31,426 |
| Median Family Income | 4,544 | $60,616 |
| Mean Family Income | 4,544 | $92,006 |
| Median Household Income | 6,935 | $52,966 |
| Mean Household Income | 6,935 | $74,994 |
| Income Deficit | 4,544 | $0 |
| Wage / Income Gap (%) | 16,861 | 41.30% |
| Wage / Income Gap ($) | 16,861 | 58.70¢ per $1 |
| Gini / Inequality Index | 16,861 | 0.49 |
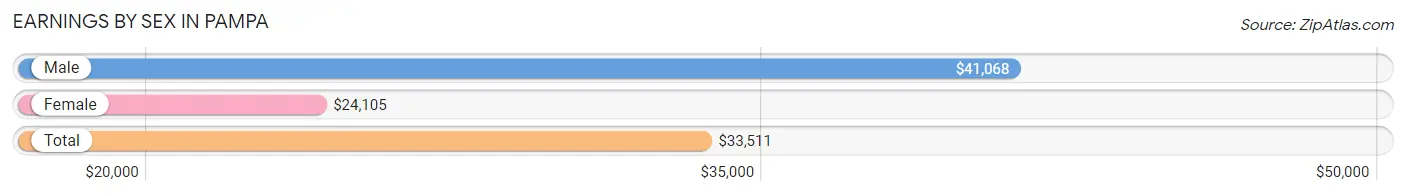
Earnings by Sex in Pampa
Average Earnings in Pampa are $33,511, $41,068 for men and $24,105 for women, a difference of 41.3%.
| Sex | Number | Average Earnings |
| Male | 4,510 (52.9%) | $41,068 |
| Female | 4,020 (47.1%) | $24,105 |
| Total | 8,530 (100.0%) | $33,511 |
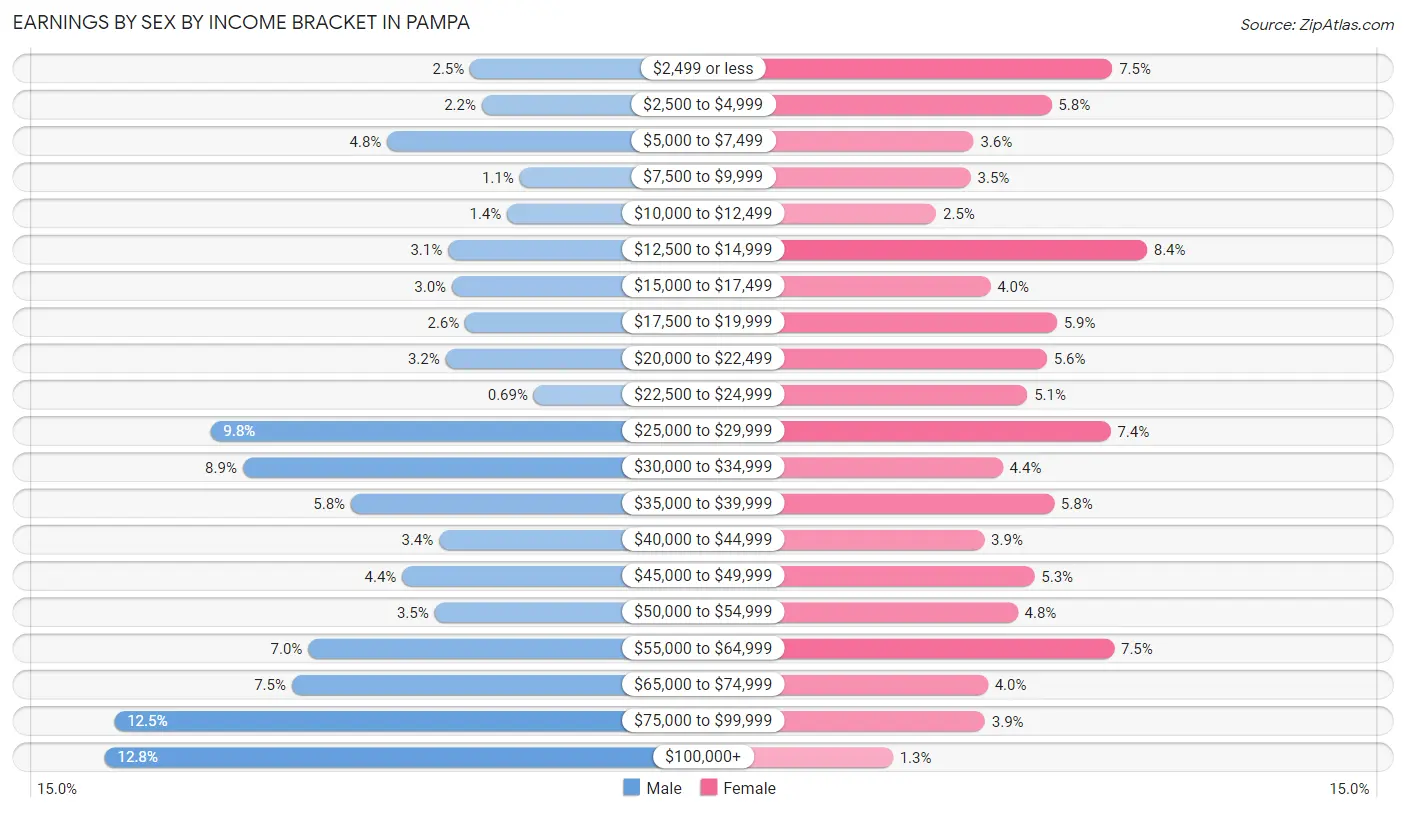
Earnings by Sex by Income Bracket in Pampa
The most common earnings brackets in Pampa are $100,000+ for men (575 | 12.8%) and $12,500 to $14,999 for women (339 | 8.4%).
| Income | Male | Female |
| $2,499 or less | 112 (2.5%) | 300 (7.5%) |
| $2,500 to $4,999 | 97 (2.1%) | 231 (5.8%) |
| $5,000 to $7,499 | 217 (4.8%) | 143 (3.6%) |
| $7,500 to $9,999 | 49 (1.1%) | 140 (3.5%) |
| $10,000 to $12,499 | 65 (1.4%) | 101 (2.5%) |
| $12,500 to $14,999 | 140 (3.1%) | 339 (8.4%) |
| $15,000 to $17,499 | 135 (3.0%) | 162 (4.0%) |
| $17,500 to $19,999 | 118 (2.6%) | 237 (5.9%) |
| $20,000 to $22,499 | 143 (3.2%) | 226 (5.6%) |
| $22,500 to $24,999 | 31 (0.7%) | 204 (5.1%) |
| $25,000 to $29,999 | 441 (9.8%) | 298 (7.4%) |
| $30,000 to $34,999 | 400 (8.9%) | 176 (4.4%) |
| $35,000 to $39,999 | 263 (5.8%) | 234 (5.8%) |
| $40,000 to $44,999 | 151 (3.4%) | 155 (3.9%) |
| $45,000 to $49,999 | 198 (4.4%) | 212 (5.3%) |
| $50,000 to $54,999 | 157 (3.5%) | 193 (4.8%) |
| $55,000 to $64,999 | 317 (7.0%) | 302 (7.5%) |
| $65,000 to $74,999 | 338 (7.5%) | 159 (4.0%) |
| $75,000 to $99,999 | 563 (12.5%) | 156 (3.9%) |
| $100,000+ | 575 (12.8%) | 52 (1.3%) |
| Total | 4,510 (100.0%) | 4,020 (100.0%) |
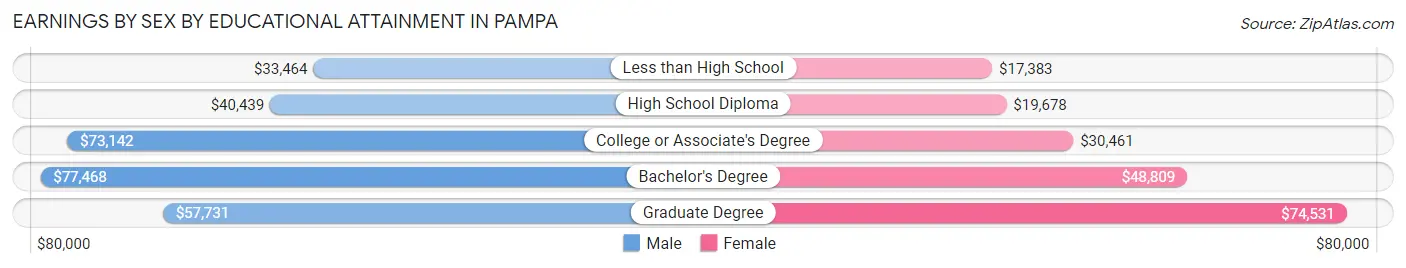
Earnings by Sex by Educational Attainment in Pampa
Average earnings in Pampa are $49,461 for men and $28,331 for women, a difference of 42.7%. Men with an educational attainment of bachelor's degree enjoy the highest average annual earnings of $77,468, while those with less than high school education earn the least with $33,464. Women with an educational attainment of graduate degree earn the most with the average annual earnings of $74,531, while those with less than high school education have the smallest earnings of $17,383.
| Educational Attainment | Male Income | Female Income |
| Less than High School | $33,464 | $17,383 |
| High School Diploma | $40,439 | $19,678 |
| College or Associate's Degree | $73,142 | $30,461 |
| Bachelor's Degree | $77,468 | $48,809 |
| Graduate Degree | $57,731 | $74,531 |
| Total | $49,461 | $28,331 |
Family Income in Pampa
Family Income Brackets in Pampa
According to the Pampa family income data, there are 818 families falling into the $50,000 to $74,999 income range, which is the most common income bracket and makes up 18.0% of all families. Conversely, the less than $10,000 income bracket is the least frequent group with only 105 families (2.3%) belonging to this category.
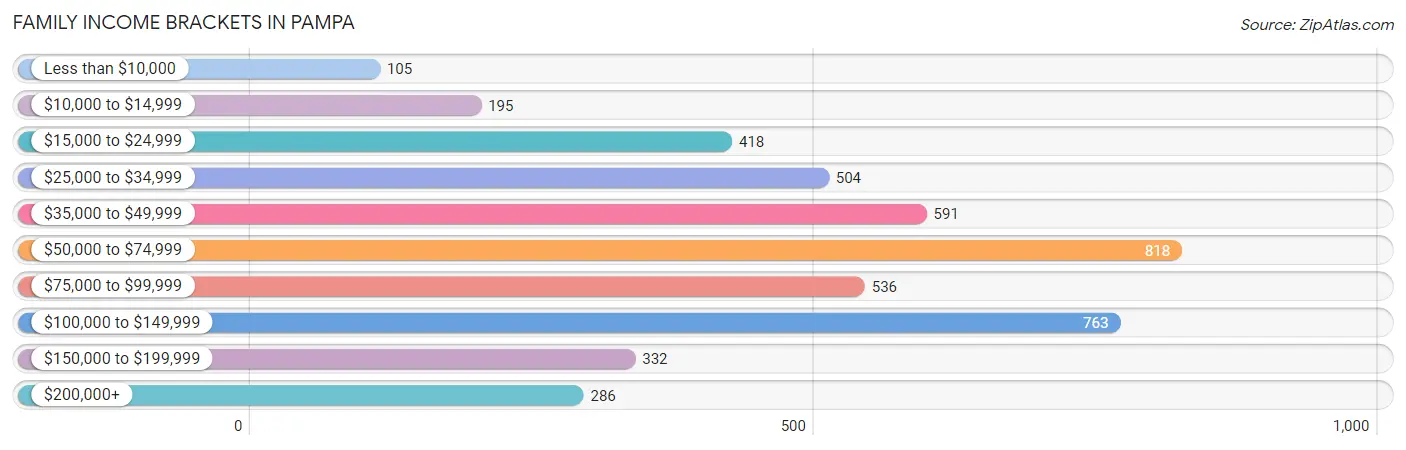
| Income Bracket | # Families | % Families |
| Less than $10,000 | 105 | 2.3% |
| $10,000 to $14,999 | 195 | 4.3% |
| $15,000 to $24,999 | 418 | 9.2% |
| $25,000 to $34,999 | 504 | 11.1% |
| $35,000 to $49,999 | 591 | 13.0% |
| $50,000 to $74,999 | 818 | 18.0% |
| $75,000 to $99,999 | 536 | 11.8% |
| $100,000 to $149,999 | 763 | 16.8% |
| $150,000 to $199,999 | 332 | 7.3% |
| $200,000+ | 286 | 6.3% |
Family Income by Famaliy Size in Pampa
5-person families (462 | 10.2%) account for the highest median family income in Pampa with $85,109 per family, while 2-person families (2,184 | 48.1%) have the highest median income of $27,362 per family member.
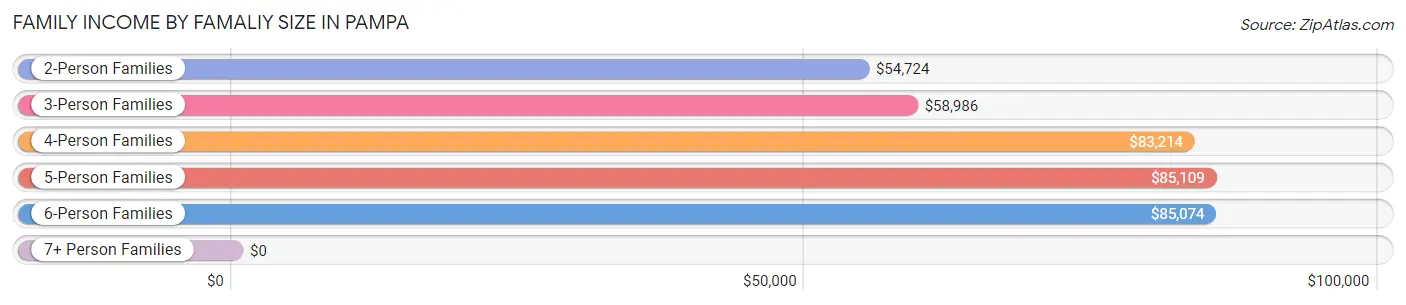
| Income Bracket | # Families | Median Income |
| 2-Person Families | 2,184 (48.1%) | $54,724 |
| 3-Person Families | 969 (21.3%) | $58,986 |
| 4-Person Families | 722 (15.9%) | $83,214 |
| 5-Person Families | 462 (10.2%) | $85,109 |
| 6-Person Families | 194 (4.3%) | $85,074 |
| 7+ Person Families | 13 (0.3%) | $0 |
| Total | 4,544 (100.0%) | $60,616 |
Family Income by Number of Earners in Pampa
The median family income in Pampa is $60,616, with families comprising 3+ earners (377) having the highest median family income of $115,551, while families with 1 earner (1,483) have the lowest median family income of $37,944, accounting for 8.3% and 32.6% of families, respectively.
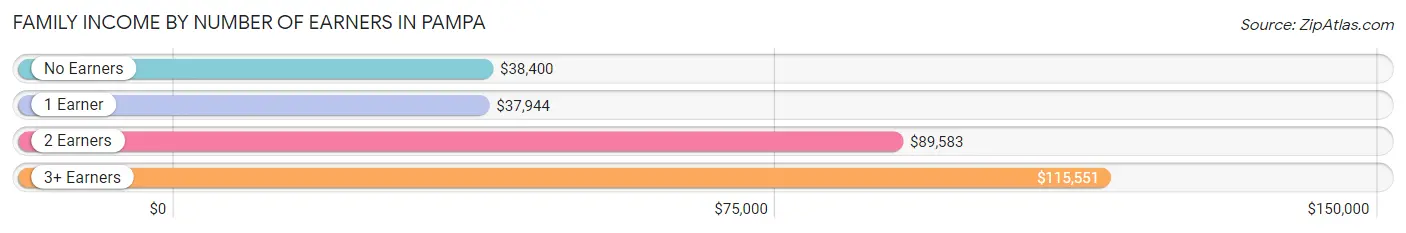
| Number of Earners | # Families | Median Income |
| No Earners | 678 (14.9%) | $38,400 |
| 1 Earner | 1,483 (32.6%) | $37,944 |
| 2 Earners | 2,006 (44.2%) | $89,583 |
| 3+ Earners | 377 (8.3%) | $115,551 |
| Total | 4,544 (100.0%) | $60,616 |
Household Income in Pampa
Household Income Brackets in Pampa
With 1,304 households falling in the category, the $50,000 to $74,999 income range is the most frequent in Pampa, accounting for 18.8% of all households. In contrast, only 284 households (4.1%) fall into the $200,000+ income bracket, making it the least populous group.
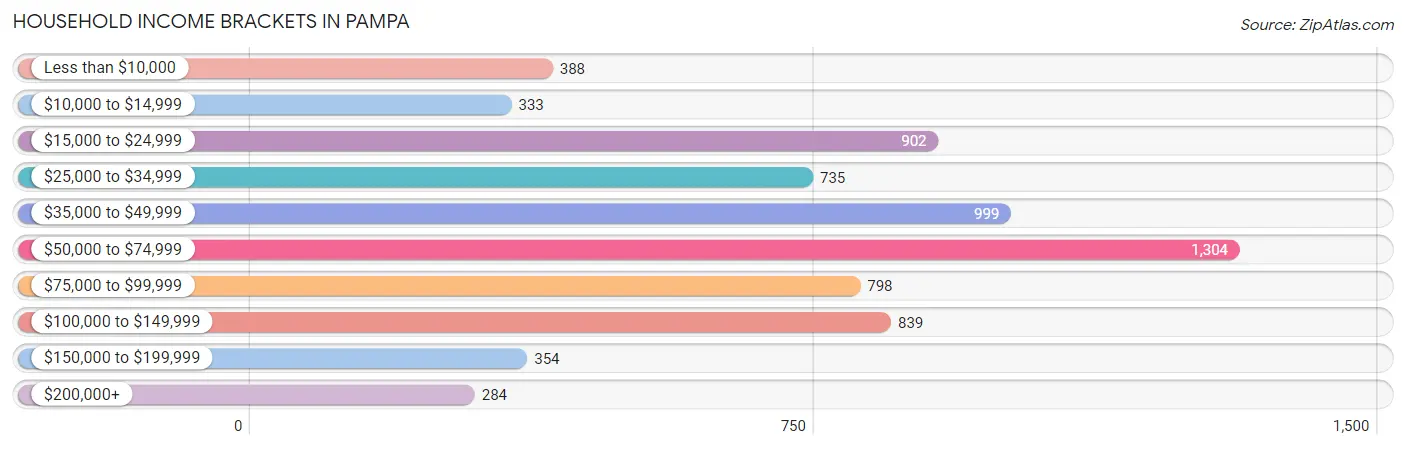
| Income Bracket | # Households | % Households |
| Less than $10,000 | 388 | 5.6% |
| $10,000 to $14,999 | 333 | 4.8% |
| $15,000 to $24,999 | 902 | 13.0% |
| $25,000 to $34,999 | 735 | 10.6% |
| $35,000 to $49,999 | 999 | 14.4% |
| $50,000 to $74,999 | 1,304 | 18.8% |
| $75,000 to $99,999 | 798 | 11.5% |
| $100,000 to $149,999 | 839 | 12.1% |
| $150,000 to $199,999 | 354 | 5.1% |
| $200,000+ | 284 | 4.1% |
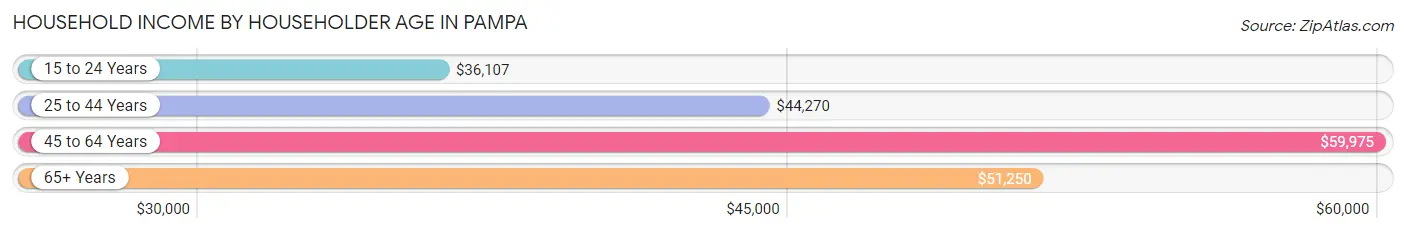
Household Income by Householder Age in Pampa
The median household income in Pampa is $52,966, with the highest median household income of $59,975 found in the 45 to 64 years age bracket for the primary householder. A total of 2,316 households (33.4%) fall into this category. Meanwhile, the 15 to 24 years age bracket for the primary householder has the lowest median household income of $36,107, with 657 households (9.5%) in this group.
| Income Bracket | # Households | Median Income |
| 15 to 24 Years | 657 (9.5%) | $36,107 |
| 25 to 44 Years | 2,111 (30.4%) | $44,270 |
| 45 to 64 Years | 2,316 (33.4%) | $59,975 |
| 65+ Years | 1,851 (26.7%) | $51,250 |
| Total | 6,935 (100.0%) | $52,966 |
Poverty in Pampa
Income Below Poverty by Sex and Age in Pampa
With 16.3% poverty level for males and 19.8% for females among the residents of Pampa, under 5 year old males and 16 and 17 year old females are the most vulnerable to poverty, with 230 males (39.7%) and 108 females (42.9%) in their respective age groups living below the poverty level.
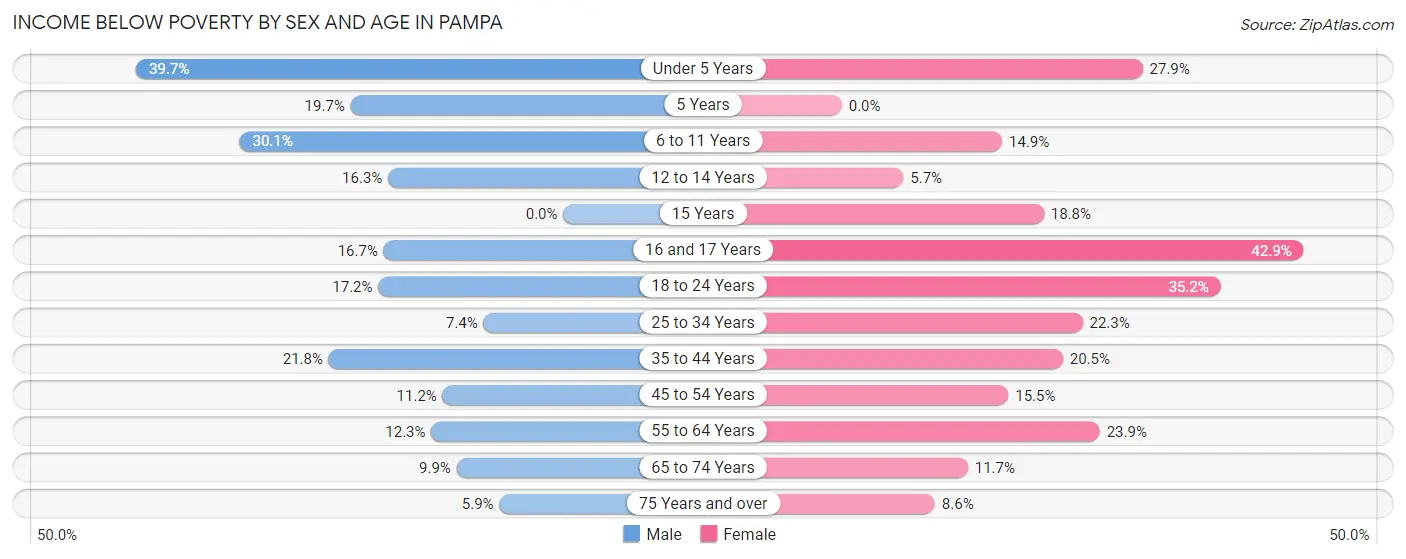
| Age Bracket | Male | Female |
| Under 5 Years | 230 (39.7%) | 139 (27.9%) |
| 5 Years | 15 (19.7%) | 0 (0.0%) |
| 6 to 11 Years | 223 (30.0%) | 120 (14.9%) |
| 12 to 14 Years | 80 (16.3%) | 19 (5.7%) |
| 15 Years | 0 (0.0%) | 6 (18.8%) |
| 16 and 17 Years | 50 (16.7%) | 108 (42.9%) |
| 18 to 24 Years | 159 (17.2%) | 263 (35.2%) |
| 25 to 34 Years | 77 (7.4%) | 235 (22.3%) |
| 35 to 44 Years | 197 (21.8%) | 192 (20.5%) |
| 45 to 54 Years | 115 (11.2%) | 154 (15.4%) |
| 55 to 64 Years | 122 (12.2%) | 231 (23.9%) |
| 65 to 74 Years | 70 (9.9%) | 90 (11.7%) |
| 75 Years and over | 27 (5.9%) | 58 (8.6%) |
| Total | 1,365 (16.3%) | 1,615 (19.8%) |
Income Above Poverty by Sex and Age in Pampa
According to the poverty statistics in Pampa, males aged 15 years and females aged 5 years are the age groups that are most secure financially, with 100.0% of males and 100.0% of females in these age groups living above the poverty line.
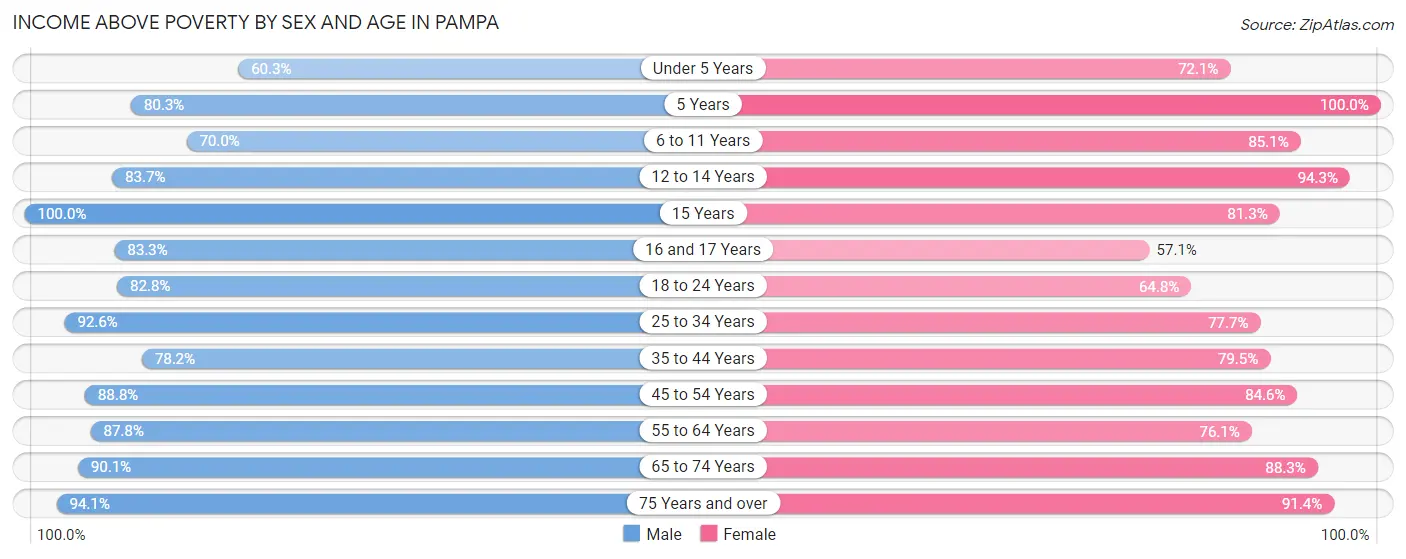
| Age Bracket | Male | Female |
| Under 5 Years | 350 (60.3%) | 359 (72.1%) |
| 5 Years | 61 (80.3%) | 94 (100.0%) |
| 6 to 11 Years | 519 (70.0%) | 687 (85.1%) |
| 12 to 14 Years | 412 (83.7%) | 314 (94.3%) |
| 15 Years | 139 (100.0%) | 26 (81.2%) |
| 16 and 17 Years | 250 (83.3%) | 144 (57.1%) |
| 18 to 24 Years | 767 (82.8%) | 485 (64.8%) |
| 25 to 34 Years | 963 (92.6%) | 817 (77.7%) |
| 35 to 44 Years | 708 (78.2%) | 744 (79.5%) |
| 45 to 54 Years | 912 (88.8%) | 843 (84.6%) |
| 55 to 64 Years | 874 (87.7%) | 734 (76.1%) |
| 65 to 74 Years | 637 (90.1%) | 680 (88.3%) |
| 75 Years and over | 428 (94.1%) | 613 (91.4%) |
| Total | 7,020 (83.7%) | 6,540 (80.2%) |
Income Below Poverty Among Married-Couple Families in Pampa
The poverty statistics for married-couple families in Pampa show that 12.3% or 420 of the total 3,404 families live below the poverty line. Families with 3 or 4 children have the highest poverty rate of 20.2%, comprising of 95 families. On the other hand, families with no children have the lowest poverty rate of 8.9%, which includes 167 families.
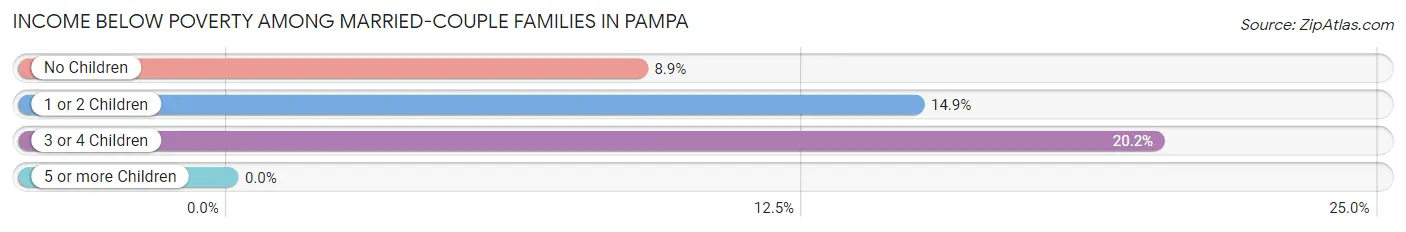
| Children | Above Poverty | Below Poverty |
| No Children | 1,708 (91.1%) | 167 (8.9%) |
| 1 or 2 Children | 900 (85.1%) | 158 (14.9%) |
| 3 or 4 Children | 376 (79.8%) | 95 (20.2%) |
| 5 or more Children | 0 (0.0%) | 0 (0.0%) |
| Total | 2,984 (87.7%) | 420 (12.3%) |
Income Below Poverty Among Single-Parent Households in Pampa
According to the poverty data in Pampa, 7.5% or 28 single-father households and 30.3% or 233 single-mother households are living below the poverty line. Among single-father households, those with 1 or 2 children have the highest poverty rate, with 28 households (19.3%) experiencing poverty. Likewise, among single-mother households, those with 3 or 4 children have the highest poverty rate, with 18 households (78.3%) falling below the poverty line.
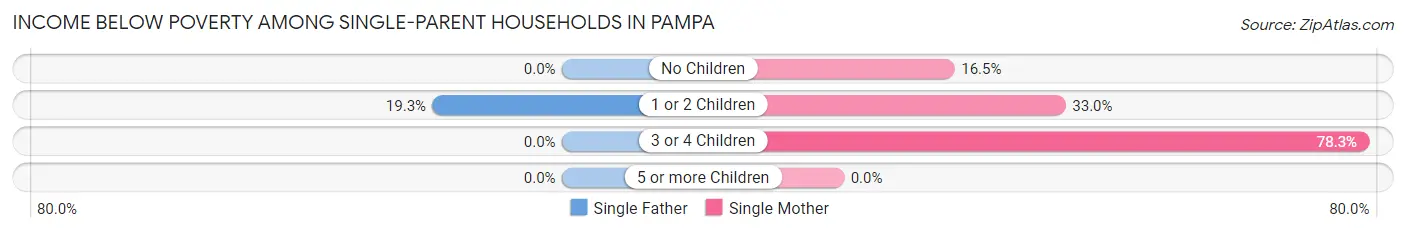
| Children | Single Father | Single Mother |
| No Children | 0 (0.0%) | 31 (16.5%) |
| 1 or 2 Children | 28 (19.3%) | 184 (33.0%) |
| 3 or 4 Children | 0 (0.0%) | 18 (78.3%) |
| 5 or more Children | 0 (0.0%) | 0 (0.0%) |
| Total | 28 (7.5%) | 233 (30.3%) |
Income Below Poverty Among Married-Couple vs Single-Parent Households in Pampa
The poverty data for Pampa shows that 420 of the married-couple family households (12.3%) and 261 of the single-parent households (22.9%) are living below the poverty level. Within the married-couple family households, those with 3 or 4 children have the highest poverty rate, with 95 households (20.2%) falling below the poverty line. Among the single-parent households, those with 3 or 4 children have the highest poverty rate, with 18 household (50.0%) living below poverty.
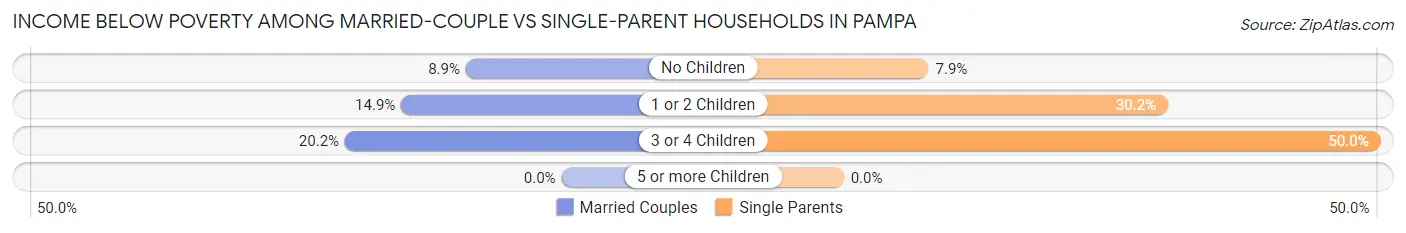
| Children | Married-Couple Families | Single-Parent Households |
| No Children | 167 (8.9%) | 31 (7.9%) |
| 1 or 2 Children | 158 (14.9%) | 212 (30.2%) |
| 3 or 4 Children | 95 (20.2%) | 18 (50.0%) |
| 5 or more Children | 0 (0.0%) | 0 (0.0%) |
| Total | 420 (12.3%) | 261 (22.9%) |
Race in Pampa
The most populous races in Pampa are White / Caucasian (12,978 | 77.0%), Hispanic or Latino (5,624 | 33.4%), and Some other Race (1,627 | 9.7%).
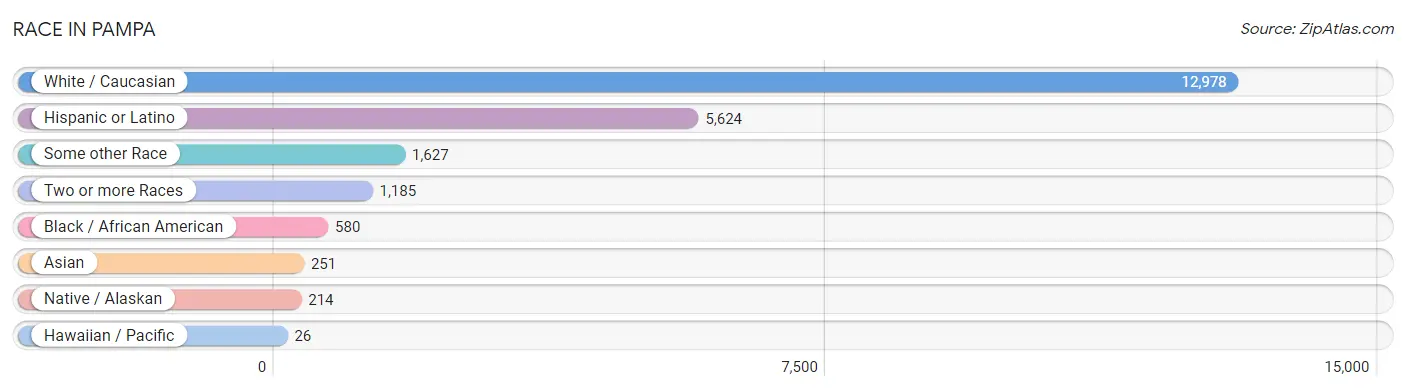
| Race | # Population | % Population |
| Asian | 251 | 1.5% |
| Black / African American | 580 | 3.4% |
| Hawaiian / Pacific | 26 | 0.2% |
| Hispanic or Latino | 5,624 | 33.4% |
| Native / Alaskan | 214 | 1.3% |
| White / Caucasian | 12,978 | 77.0% |
| Two or more Races | 1,185 | 7.0% |
| Some other Race | 1,627 | 9.7% |
| Total | 16,861 | 100.0% |
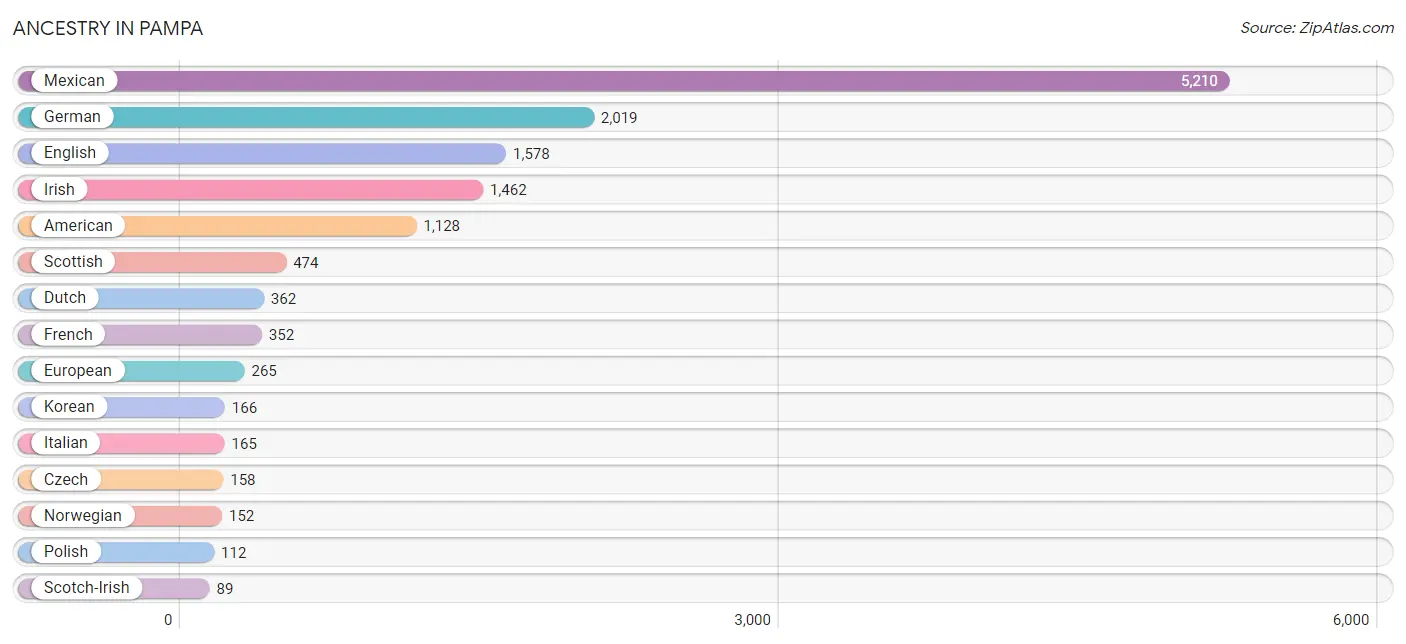
Ancestry in Pampa
The most populous ancestries reported in Pampa are Mexican (5,210 | 30.9%), German (2,019 | 12.0%), English (1,578 | 9.4%), Irish (1,462 | 8.7%), and American (1,128 | 6.7%), together accounting for 67.6% of all Pampa residents.
| Ancestry | # Population | % Population |
| African | 24 | 0.1% |
| American | 1,128 | 6.7% |
| Apache | 4 | 0.0% |
| Arab | 7 | 0.0% |
| Bhutanese | 23 | 0.1% |
| Blackfeet | 65 | 0.4% |
| British | 70 | 0.4% |
| Burmese | 25 | 0.2% |
| Canadian | 18 | 0.1% |
| Central American | 9 | 0.1% |
| Cherokee | 77 | 0.5% |
| Chickasaw | 24 | 0.1% |
| Choctaw | 6 | 0.0% |
| Creek | 26 | 0.2% |
| Czech | 158 | 0.9% |
| Czechoslovakian | 16 | 0.1% |
| Danish | 20 | 0.1% |
| Dutch | 362 | 2.1% |
| Dutch West Indian | 58 | 0.3% |
| Ecuadorian | 12 | 0.1% |
| English | 1,578 | 9.4% |
| European | 265 | 1.6% |
| French | 352 | 2.1% |
| German | 2,019 | 12.0% |
| Guatemalan | 9 | 0.1% |
| Irish | 1,462 | 8.7% |
| Italian | 165 | 1.0% |
| Korean | 166 | 1.0% |
| Mexican | 5,210 | 30.9% |
| Norwegian | 152 | 0.9% |
| Osage | 2 | 0.0% |
| Polish | 112 | 0.7% |
| Potawatomi | 23 | 0.1% |
| Scandinavian | 14 | 0.1% |
| Scotch-Irish | 89 | 0.5% |
| Scottish | 474 | 2.8% |
| South American | 86 | 0.5% |
| South American Indian | 5 | 0.0% |
| Spaniard | 53 | 0.3% |
| Spanish | 72 | 0.4% |
| Sri Lankan | 14 | 0.1% |
| Subsaharan African | 24 | 0.1% |
| Swedish | 60 | 0.4% |
| Thai | 28 | 0.2% |
| Trinidadian and Tobagonian | 12 | 0.1% |
| Venezuelan | 74 | 0.4% |
| Yaqui | 27 | 0.2% |
| Yup'ik | 9 | 0.1% | View All 48 Rows |
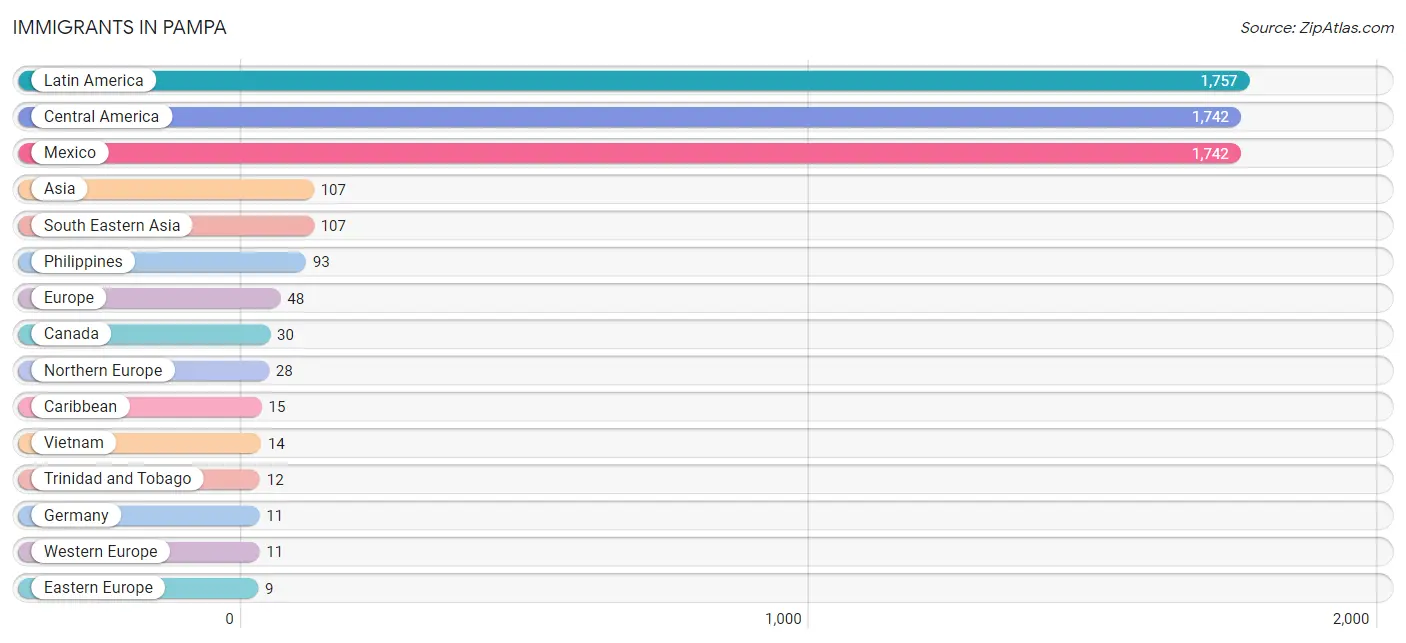
Immigrants in Pampa
The most numerous immigrant groups reported in Pampa came from Latin America (1,757 | 10.4%), Central America (1,742 | 10.3%), Mexico (1,742 | 10.3%), Asia (107 | 0.6%), and South Eastern Asia (107 | 0.6%), together accounting for 32.3% of all Pampa residents.
| Immigration Origin | # Population | % Population |
| Asia | 107 | 0.6% |
| Canada | 30 | 0.2% |
| Caribbean | 15 | 0.1% |
| Central America | 1,742 | 10.3% |
| Cuba | 3 | 0.0% |
| Eastern Europe | 9 | 0.1% |
| Europe | 48 | 0.3% |
| Germany | 11 | 0.1% |
| Latin America | 1,757 | 10.4% |
| Mexico | 1,742 | 10.3% |
| Northern Europe | 28 | 0.2% |
| Philippines | 93 | 0.5% |
| Russia | 9 | 0.1% |
| South Eastern Asia | 107 | 0.6% |
| Trinidad and Tobago | 12 | 0.1% |
| Vietnam | 14 | 0.1% |
| Western Europe | 11 | 0.1% | View All 17 Rows |
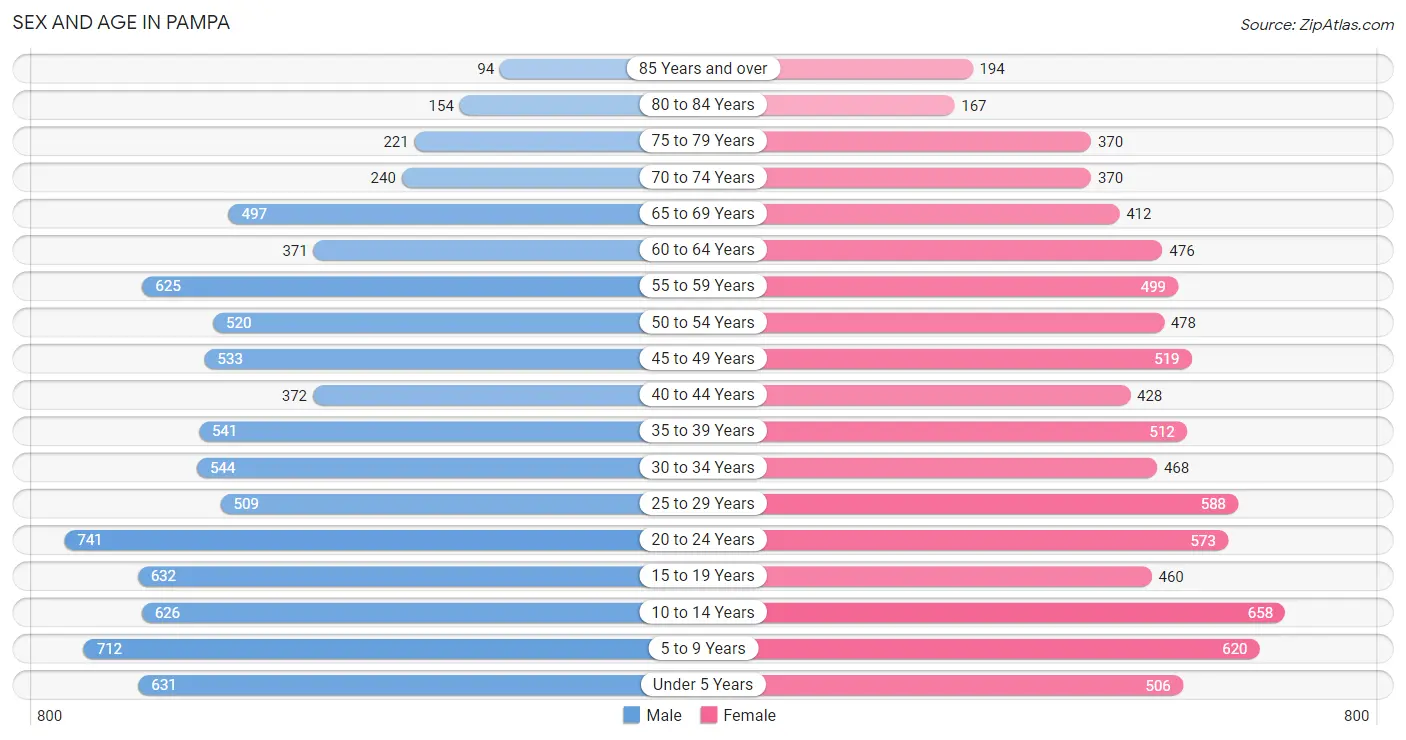
Sex and Age in Pampa
Sex and Age in Pampa
The most populous age groups in Pampa are 20 to 24 Years (741 | 8.6%) for men and 10 to 14 Years (658 | 7.9%) for women.
| Age Bracket | Male | Female |
| Under 5 Years | 631 (7.4%) | 506 (6.1%) |
| 5 to 9 Years | 712 (8.3%) | 620 (7.5%) |
| 10 to 14 Years | 626 (7.3%) | 658 (7.9%) |
| 15 to 19 Years | 632 (7.4%) | 460 (5.5%) |
| 20 to 24 Years | 741 (8.6%) | 573 (6.9%) |
| 25 to 29 Years | 509 (5.9%) | 588 (7.1%) |
| 30 to 34 Years | 544 (6.4%) | 468 (5.6%) |
| 35 to 39 Years | 541 (6.3%) | 512 (6.2%) |
| 40 to 44 Years | 372 (4.3%) | 428 (5.2%) |
| 45 to 49 Years | 533 (6.2%) | 519 (6.2%) |
| 50 to 54 Years | 520 (6.1%) | 478 (5.8%) |
| 55 to 59 Years | 625 (7.3%) | 499 (6.0%) |
| 60 to 64 Years | 371 (4.3%) | 476 (5.7%) |
| 65 to 69 Years | 497 (5.8%) | 412 (5.0%) |
| 70 to 74 Years | 240 (2.8%) | 370 (4.5%) |
| 75 to 79 Years | 221 (2.6%) | 370 (4.5%) |
| 80 to 84 Years | 154 (1.8%) | 167 (2.0%) |
| 85 Years and over | 94 (1.1%) | 194 (2.3%) |
| Total | 8,563 (100.0%) | 8,298 (100.0%) |
Families and Households in Pampa
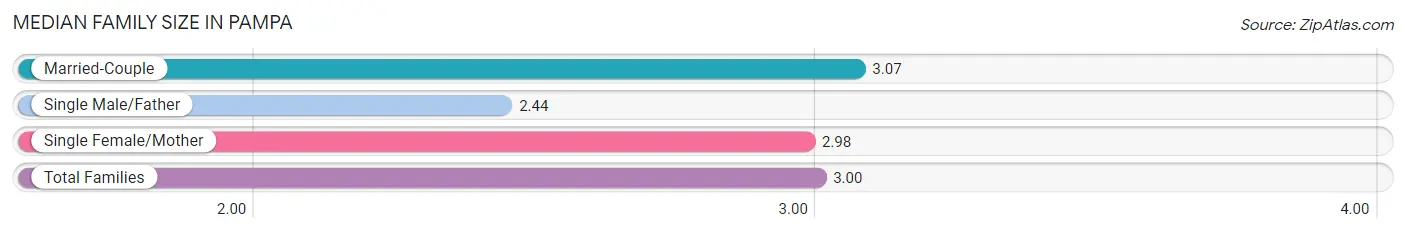
Median Family Size in Pampa
The median family size in Pampa is 3.00 persons per family, with married-couple families (3,404 | 74.9%) accounting for the largest median family size of 3.07 persons per family. On the other hand, single male/father families (372 | 8.2%) represent the smallest median family size with 2.44 persons per family.
| Family Type | # Families | Family Size |
| Married-Couple | 3,404 (74.9%) | 3.07 |
| Single Male/Father | 372 (8.2%) | 2.44 |
| Single Female/Mother | 768 (16.9%) | 2.98 |
| Total Families | 4,544 (100.0%) | 3.00 |
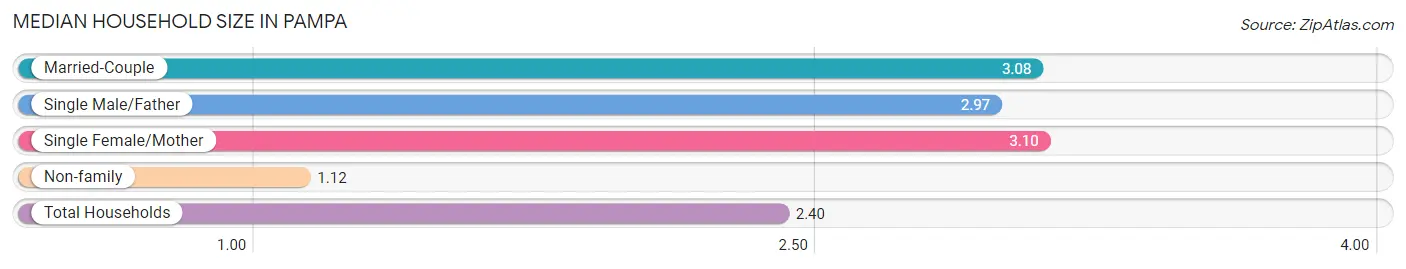
Median Household Size in Pampa
The median household size in Pampa is 2.40 persons per household, with single female/mother households (768 | 11.1%) accounting for the largest median household size of 3.1 persons per household. non-family households (2,391 | 34.5%) represent the smallest median household size with 1.12 persons per household.
| Household Type | # Households | Household Size |
| Married-Couple | 3,404 (49.1%) | 3.08 |
| Single Male/Father | 372 (5.4%) | 2.97 |
| Single Female/Mother | 768 (11.1%) | 3.10 |
| Non-family | 2,391 (34.5%) | 1.12 |
| Total Households | 6,935 (100.0%) | 2.40 |
Household Size by Marriage Status in Pampa
Out of a total of 6,935 households in Pampa, 4,544 (65.5%) are family households, while 2,391 (34.5%) are nonfamily households. The most numerous type of family households are 2-person households, comprising 2,111, and the most common type of nonfamily households are 1-person households, comprising 2,083.
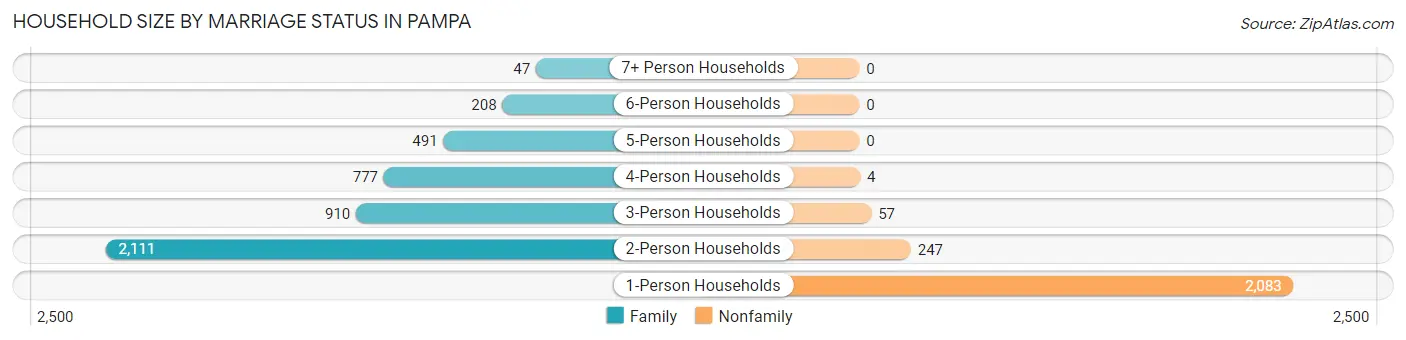
| Household Size | Family Households | Nonfamily Households |
| 1-Person Households | - | 2,083 (30.0%) |
| 2-Person Households | 2,111 (30.4%) | 247 (3.6%) |
| 3-Person Households | 910 (13.1%) | 57 (0.8%) |
| 4-Person Households | 777 (11.2%) | 4 (0.1%) |
| 5-Person Households | 491 (7.1%) | 0 (0.0%) |
| 6-Person Households | 208 (3.0%) | 0 (0.0%) |
| 7+ Person Households | 47 (0.7%) | 0 (0.0%) |
| Total | 4,544 (65.5%) | 2,391 (34.5%) |
Female Fertility in Pampa
Fertility by Age in Pampa
Average fertility rate in Pampa is 64.0 births per 1,000 women. Women in the age bracket of 15 to 19 years have the highest fertility rate with 204.0 births per 1,000 women. Women in the age bracket of 20 to 34 years acount for 52.8% of all women with births.
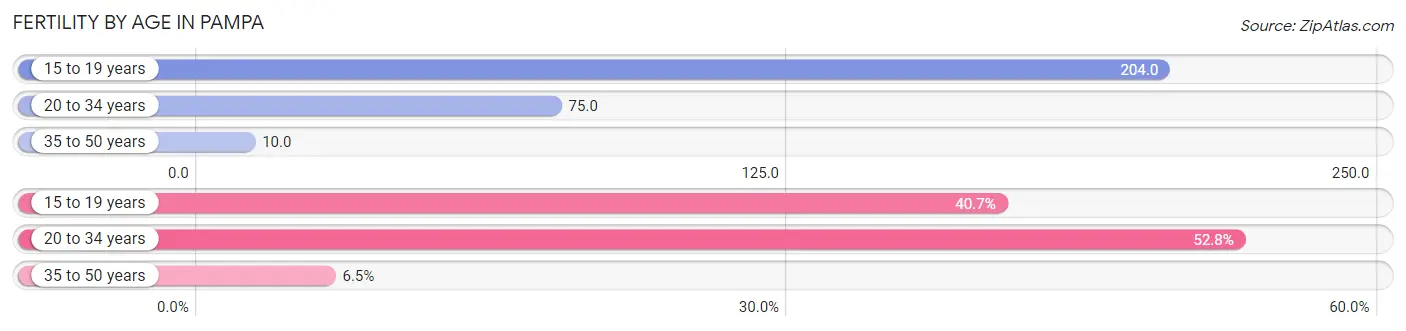
| Age Bracket | Women with Births | Births / 1,000 Women |
| 15 to 19 years | 94 (40.7%) | 204.0 |
| 20 to 34 years | 122 (52.8%) | 75.0 |
| 35 to 50 years | 15 (6.5%) | 10.0 |
| Total | 231 (100.0%) | 64.0 |
Fertility by Age by Marriage Status in Pampa
27.3% of women with births (231) in Pampa are married. The highest percentage of unmarried women with births falls into 15 to 19 years age bracket with 100.0% of them unmarried at the time of birth, while the lowest percentage of unmarried women with births belong to 35 to 50 years age bracket with 0.0% of them unmarried.
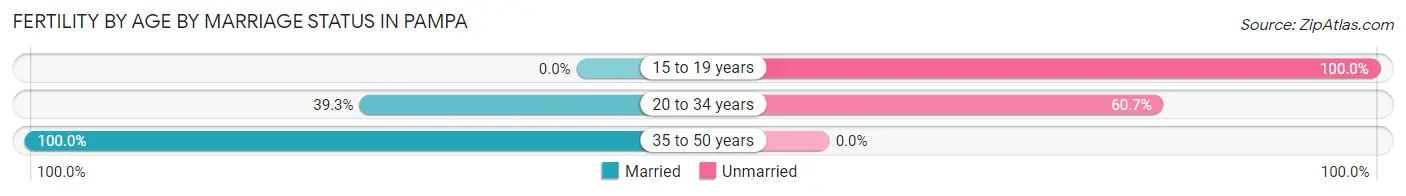
| Age Bracket | Married | Unmarried |
| 15 to 19 years | 0 (0.0%) | 94 (100.0%) |
| 20 to 34 years | 48 (39.3%) | 74 (60.7%) |
| 35 to 50 years | 15 (100.0%) | 0 (0.0%) |
| Total | 63 (27.3%) | 168 (72.7%) |
Fertility by Education in Pampa
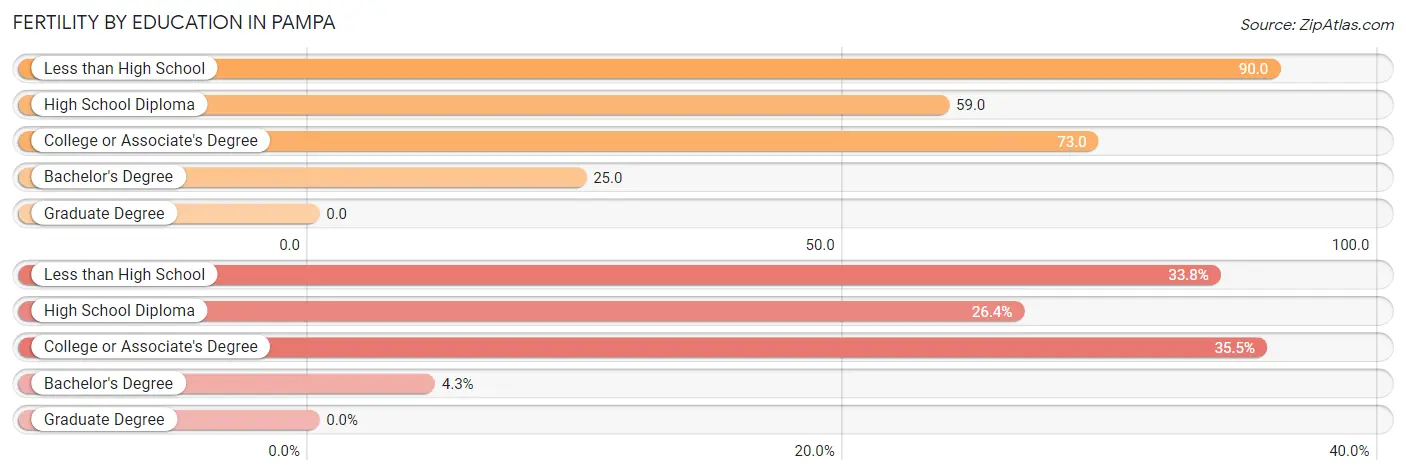
| Educational Attainment | Women with Births | Births / 1,000 Women |
| Less than High School | 78 (33.8%) | 90.0 |
| High School Diploma | 61 (26.4%) | 59.0 |
| College or Associate's Degree | 82 (35.5%) | 73.0 |
| Bachelor's Degree | 10 (4.3%) | 25.0 |
| Graduate Degree | 0 (0.0%) | 0.0 |
| Total | 231 (100.0%) | 64.0 |
Fertility by Education by Marriage Status in Pampa
72.7% of women with births in Pampa are unmarried. Women with the educational attainment of bachelor's degree are most likely to be married with 100.0% of them married at childbirth, while women with the educational attainment of less than high school are least likely to be married with 100.0% of them unmarried at childbirth.
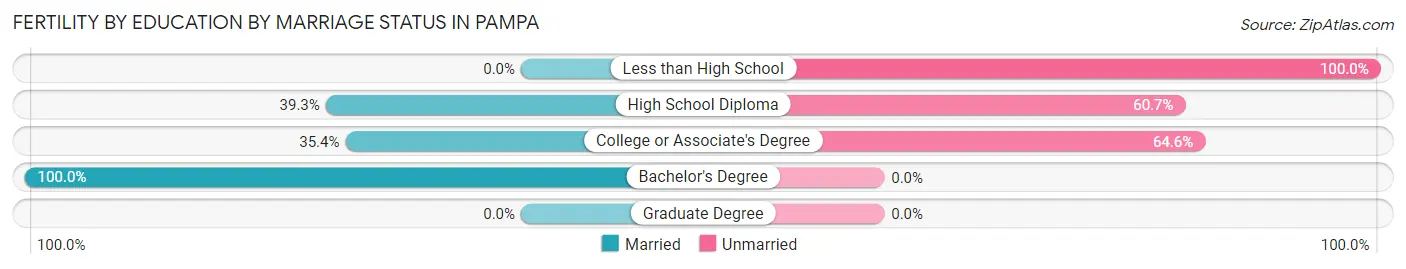
| Educational Attainment | Married | Unmarried |
| Less than High School | 0 (0.0%) | 78 (100.0%) |
| High School Diploma | 24 (39.3%) | 37 (60.7%) |
| College or Associate's Degree | 29 (35.4%) | 53 (64.6%) |
| Bachelor's Degree | 10 (100.0%) | 0 (0.0%) |
| Graduate Degree | 0 (0.0%) | 0 (0.0%) |
| Total | 63 (27.3%) | 168 (72.7%) |
Employment Characteristics in Pampa
Employment by Class of Employer in Pampa
Among the 7,590 employed individuals in Pampa, private company employees (4,846 | 63.8%), local government employees (1,124 | 14.8%), and self-employed (not incorporated) (614 | 8.1%) make up the most common classes of employment.
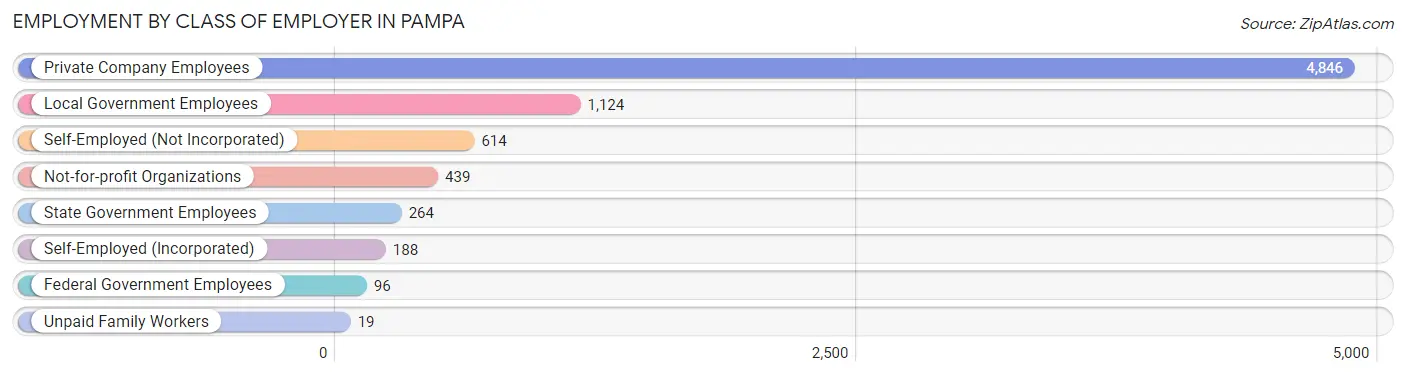
| Employer Class | # Employees | % Employees |
| Private Company Employees | 4,846 | 63.8% |
| Self-Employed (Incorporated) | 188 | 2.5% |
| Self-Employed (Not Incorporated) | 614 | 8.1% |
| Not-for-profit Organizations | 439 | 5.8% |
| Local Government Employees | 1,124 | 14.8% |
| State Government Employees | 264 | 3.5% |
| Federal Government Employees | 96 | 1.3% |
| Unpaid Family Workers | 19 | 0.3% |
| Total | 7,590 | 100.0% |
Employment Status by Age in Pampa
According to the labor force statistics for Pampa, out of the total population over 16 years of age (12,936), 63.6% or 8,227 individuals are in the labor force, with 5.7% or 469 of them unemployed. The age group with the highest labor force participation rate is 20 to 24 years, with 88.8% or 1,167 individuals in the labor force. Within the labor force, the 20 to 24 years age range has the highest percentage of unemployed individuals, with 9.3% or 109 of them being unemployed.
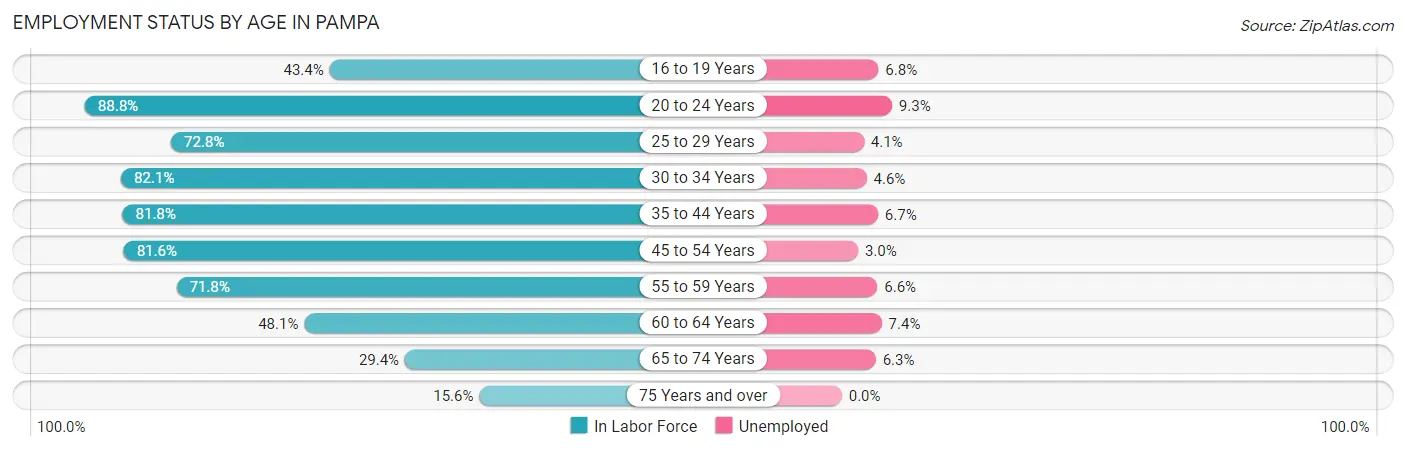
| Age Bracket | In Labor Force | Unemployed |
| 16 to 19 Years | 399 (43.4%) | 27 (6.8%) |
| 20 to 24 Years | 1,167 (88.8%) | 109 (9.3%) |
| 25 to 29 Years | 799 (72.8%) | 33 (4.1%) |
| 30 to 34 Years | 831 (82.1%) | 38 (4.6%) |
| 35 to 44 Years | 1,516 (81.8%) | 102 (6.7%) |
| 45 to 54 Years | 1,673 (81.6%) | 50 (3.0%) |
| 55 to 59 Years | 807 (71.8%) | 53 (6.6%) |
| 60 to 64 Years | 407 (48.1%) | 30 (7.4%) |
| 65 to 74 Years | 447 (29.4%) | 28 (6.3%) |
| 75 Years and over | 187 (15.6%) | 0 (0.0%) |
| Total | 8,227 (63.6%) | 469 (5.7%) |
Employment Status by Educational Attainment in Pampa
According to labor force statistics for Pampa, 75.6% of individuals (6,035) out of the total population between 25 and 64 years of age (7,983) are in the labor force, with 5.1% or 308 of them being unemployed. The group with the highest labor force participation rate are those with the educational attainment of bachelor's degree or higher, with 86.7% or 1,066 individuals in the labor force. Within the labor force, individuals with high school diploma education have the highest percentage of unemployment, with 8.2% or 158 of them being unemployed.
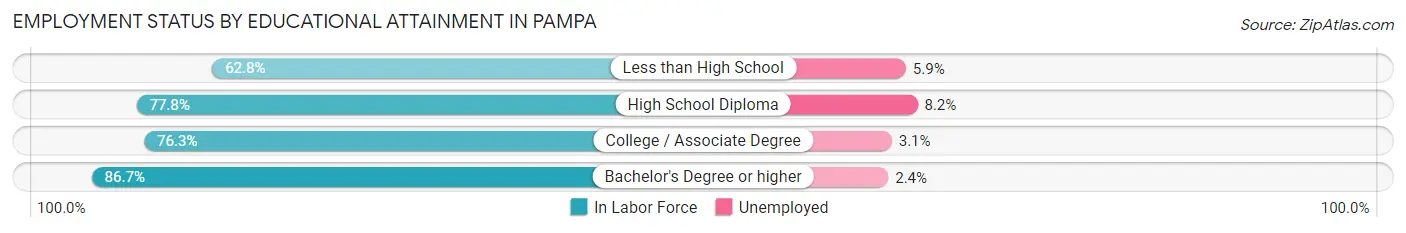
| Educational Attainment | In Labor Force | Unemployed |
| Less than High School | 1,030 (62.8%) | 97 (5.9%) |
| High School Diploma | 1,925 (77.8%) | 203 (8.2%) |
| College / Associate Degree | 2,014 (76.3%) | 82 (3.1%) |
| Bachelor's Degree or higher | 1,066 (86.7%) | 29 (2.4%) |
| Total | 6,035 (75.6%) | 407 (5.1%) |
Employment Occupations by Sex in Pampa
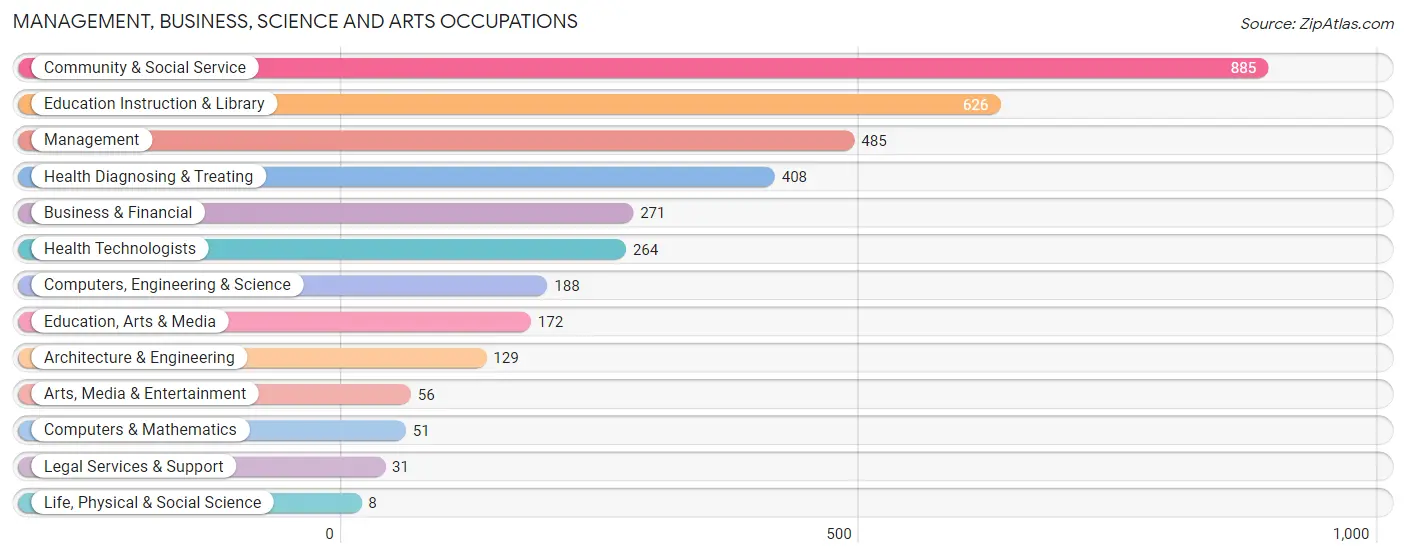
Management, Business, Science and Arts Occupations
The most common Management, Business, Science and Arts occupations in Pampa are Community & Social Service (885 | 11.4%), Education Instruction & Library (626 | 8.1%), Management (485 | 6.2%), Health Diagnosing & Treating (408 | 5.3%), and Business & Financial (271 | 3.5%).
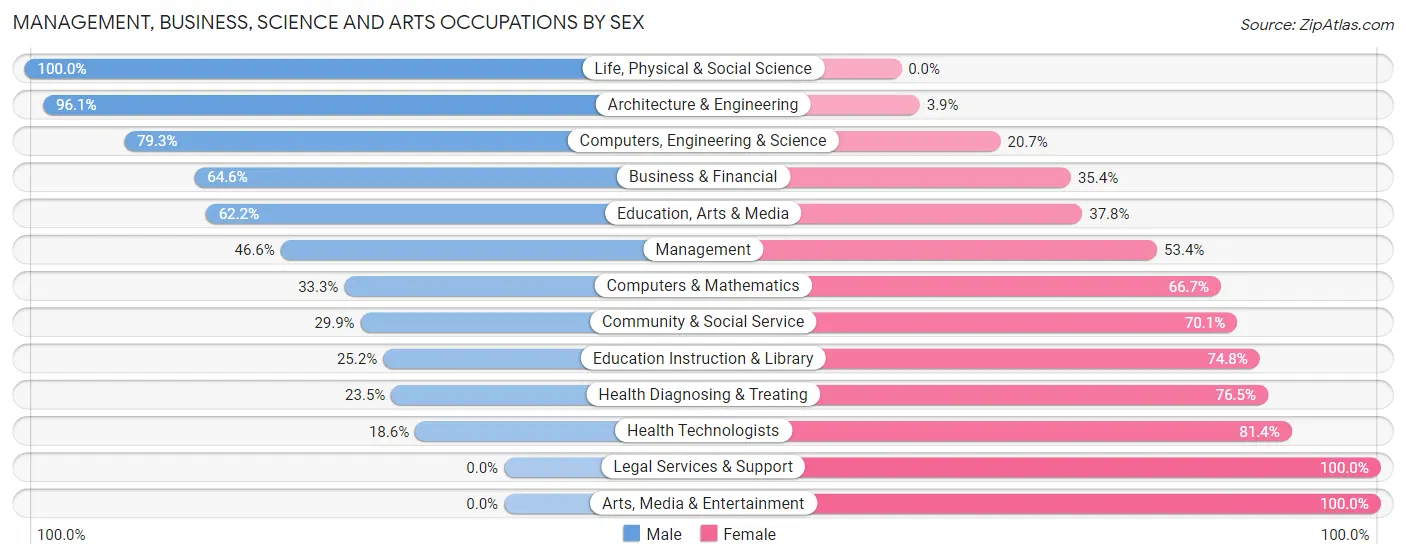
Management, Business, Science and Arts Occupations by Sex
Within the Management, Business, Science and Arts occupations in Pampa, the most male-oriented occupations are Life, Physical & Social Science (100.0%), Architecture & Engineering (96.1%), and Computers, Engineering & Science (79.3%), while the most female-oriented occupations are Legal Services & Support (100.0%), Arts, Media & Entertainment (100.0%), and Health Technologists (81.4%).
| Occupation | Male | Female |
| Management | 226 (46.6%) | 259 (53.4%) |
| Business & Financial | 175 (64.6%) | 96 (35.4%) |
| Computers, Engineering & Science | 149 (79.3%) | 39 (20.7%) |
| Computers & Mathematics | 17 (33.3%) | 34 (66.7%) |
| Architecture & Engineering | 124 (96.1%) | 5 (3.9%) |
| Life, Physical & Social Science | 8 (100.0%) | 0 (0.0%) |
| Community & Social Service | 265 (29.9%) | 620 (70.1%) |
| Education, Arts & Media | 107 (62.2%) | 65 (37.8%) |
| Legal Services & Support | 0 (0.0%) | 31 (100.0%) |
| Education Instruction & Library | 158 (25.2%) | 468 (74.8%) |
| Arts, Media & Entertainment | 0 (0.0%) | 56 (100.0%) |
| Health Diagnosing & Treating | 96 (23.5%) | 312 (76.5%) |
| Health Technologists | 49 (18.6%) | 215 (81.4%) |
| Total (Category) | 911 (40.7%) | 1,326 (59.3%) |
| Total (Overall) | 4,267 (55.0%) | 3,496 (45.0%) |
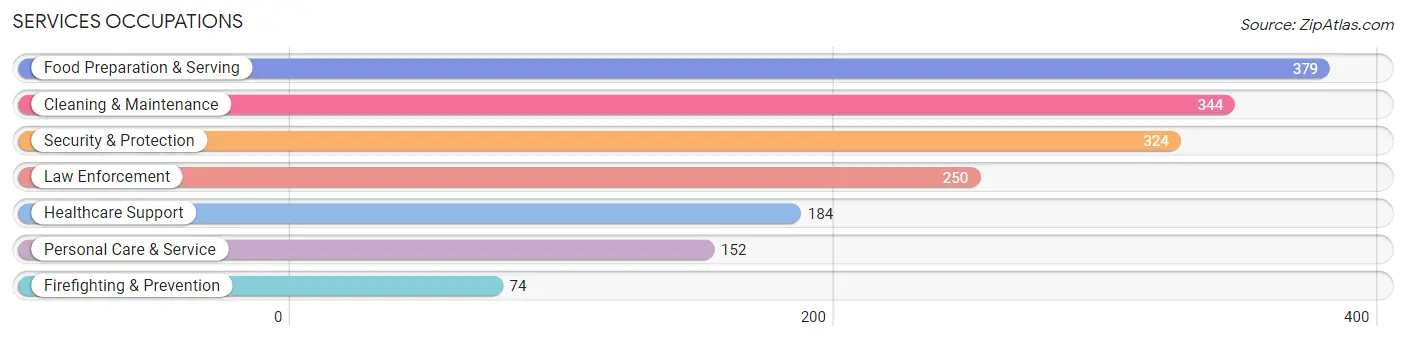
Services Occupations
The most common Services occupations in Pampa are Food Preparation & Serving (379 | 4.9%), Cleaning & Maintenance (344 | 4.4%), Security & Protection (324 | 4.2%), Law Enforcement (250 | 3.2%), and Healthcare Support (184 | 2.4%).
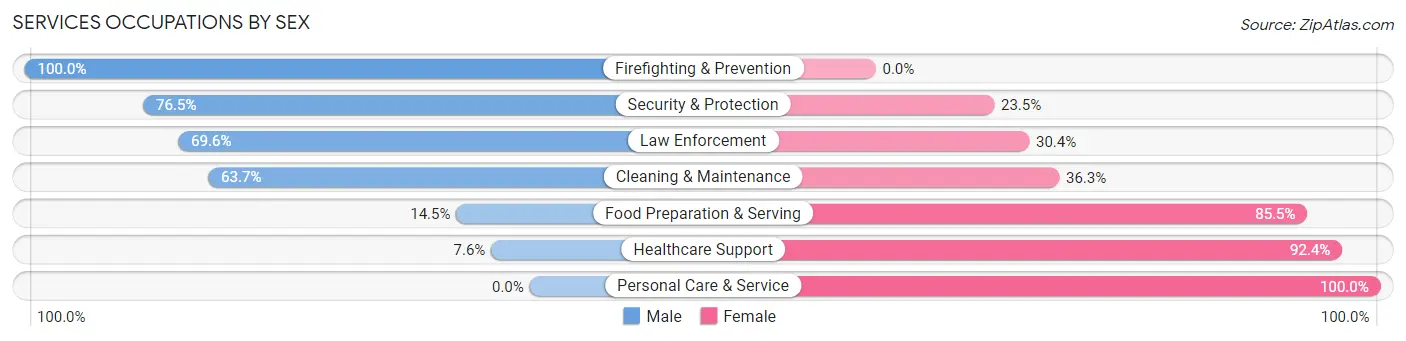
Services Occupations by Sex
Within the Services occupations in Pampa, the most male-oriented occupations are Firefighting & Prevention (100.0%), Security & Protection (76.5%), and Law Enforcement (69.6%), while the most female-oriented occupations are Personal Care & Service (100.0%), Healthcare Support (92.4%), and Food Preparation & Serving (85.5%).
| Occupation | Male | Female |
| Healthcare Support | 14 (7.6%) | 170 (92.4%) |
| Security & Protection | 248 (76.5%) | 76 (23.5%) |
| Firefighting & Prevention | 74 (100.0%) | 0 (0.0%) |
| Law Enforcement | 174 (69.6%) | 76 (30.4%) |
| Food Preparation & Serving | 55 (14.5%) | 324 (85.5%) |
| Cleaning & Maintenance | 219 (63.7%) | 125 (36.3%) |
| Personal Care & Service | 0 (0.0%) | 152 (100.0%) |
| Total (Category) | 536 (38.8%) | 847 (61.2%) |
| Total (Overall) | 4,267 (55.0%) | 3,496 (45.0%) |
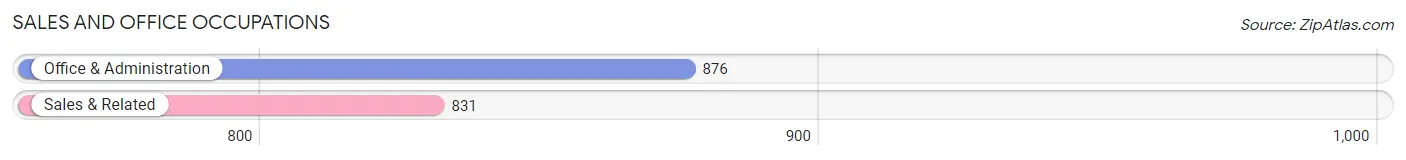
Sales and Office Occupations
The most common Sales and Office occupations in Pampa are Office & Administration (876 | 11.3%), and Sales & Related (831 | 10.7%).
Sales and Office Occupations by Sex
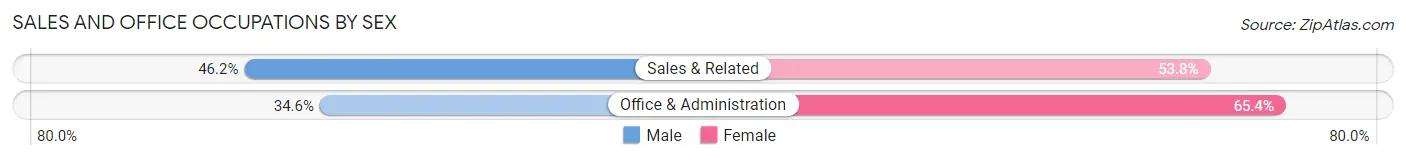
| Occupation | Male | Female |
| Sales & Related | 384 (46.2%) | 447 (53.8%) |
| Office & Administration | 303 (34.6%) | 573 (65.4%) |
| Total (Category) | 687 (40.3%) | 1,020 (59.8%) |
| Total (Overall) | 4,267 (55.0%) | 3,496 (45.0%) |
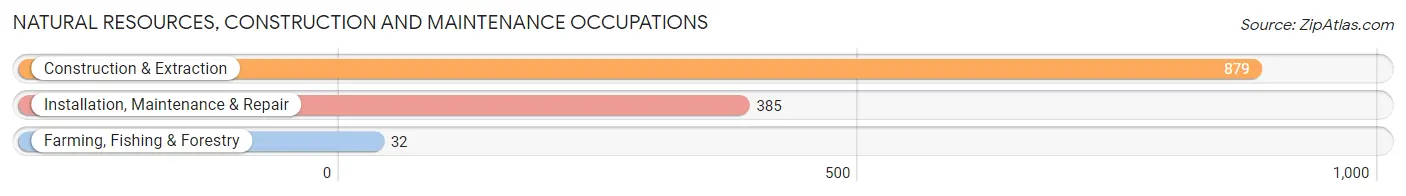
Natural Resources, Construction and Maintenance Occupations
The most common Natural Resources, Construction and Maintenance occupations in Pampa are Construction & Extraction (879 | 11.3%), Installation, Maintenance & Repair (385 | 5.0%), and Farming, Fishing & Forestry (32 | 0.4%).
Natural Resources, Construction and Maintenance Occupations by Sex
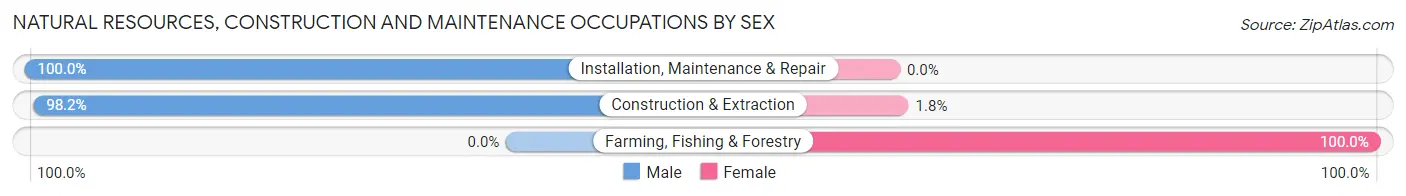
| Occupation | Male | Female |
| Farming, Fishing & Forestry | 0 (0.0%) | 32 (100.0%) |
| Construction & Extraction | 863 (98.2%) | 16 (1.8%) |
| Installation, Maintenance & Repair | 385 (100.0%) | 0 (0.0%) |
| Total (Category) | 1,248 (96.3%) | 48 (3.7%) |
| Total (Overall) | 4,267 (55.0%) | 3,496 (45.0%) |
Production, Transportation and Moving Occupations
The most common Production, Transportation and Moving occupations in Pampa are Production (660 | 8.5%), Material Moving (257 | 3.3%), and Transportation (223 | 2.9%).
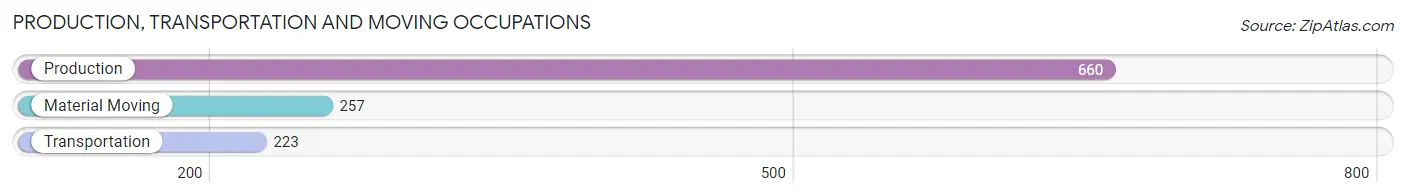
Production, Transportation and Moving Occupations by Sex
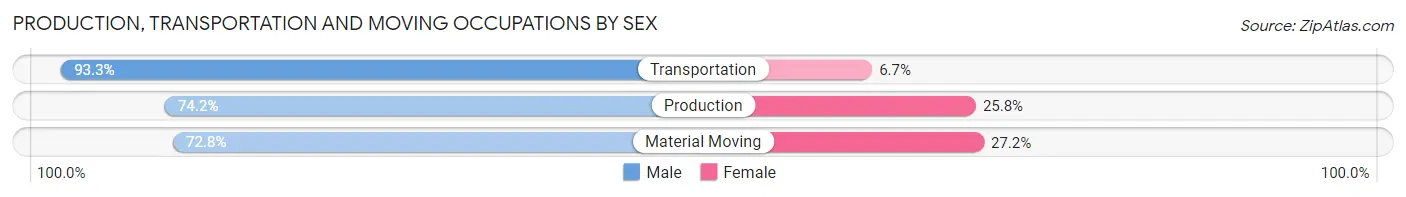
| Occupation | Male | Female |
| Production | 490 (74.2%) | 170 (25.8%) |
| Transportation | 208 (93.3%) | 15 (6.7%) |
| Material Moving | 187 (72.8%) | 70 (27.2%) |
| Total (Category) | 885 (77.6%) | 255 (22.4%) |
| Total (Overall) | 4,267 (55.0%) | 3,496 (45.0%) |
Employment Industries by Sex in Pampa
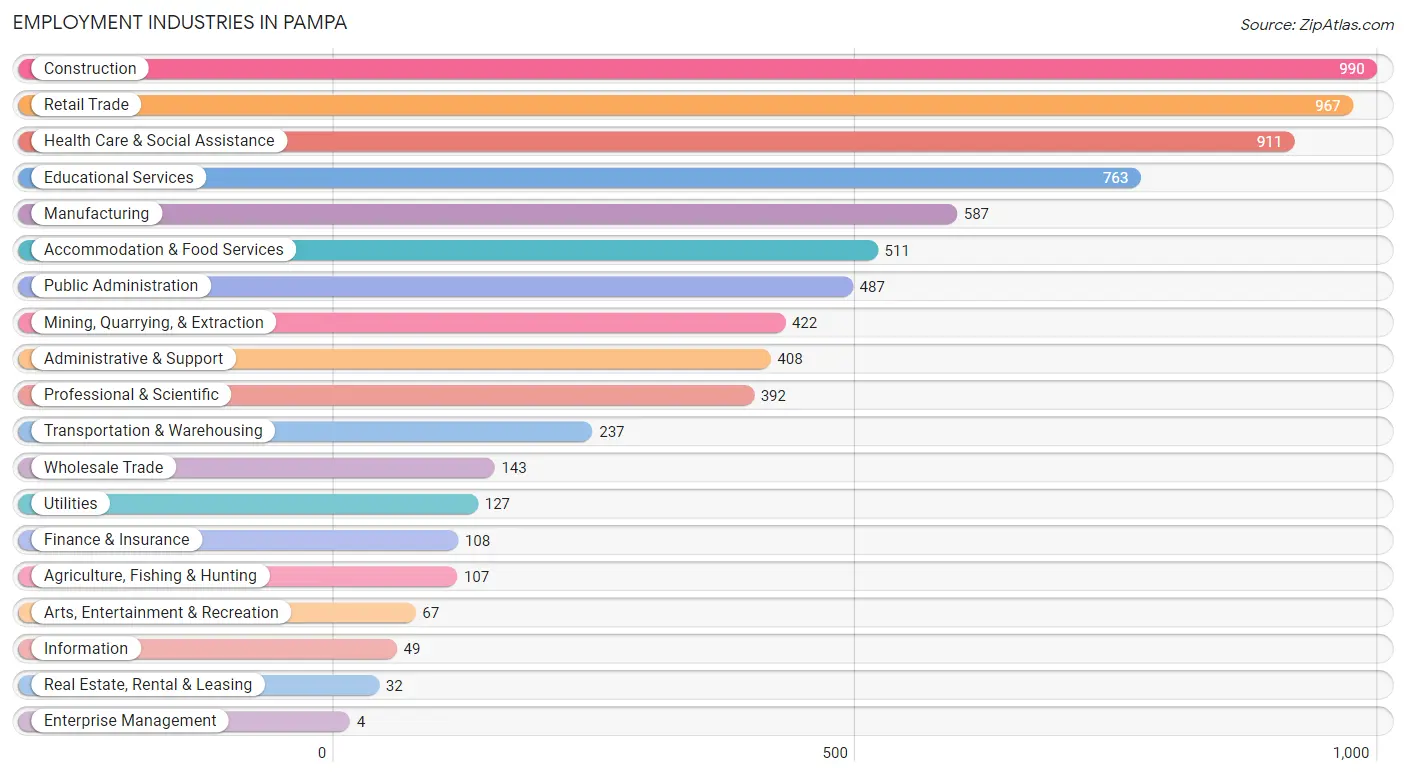
Employment Industries in Pampa
The major employment industries in Pampa include Construction (990 | 12.8%), Retail Trade (967 | 12.5%), Health Care & Social Assistance (911 | 11.7%), Educational Services (763 | 9.8%), and Manufacturing (587 | 7.6%).
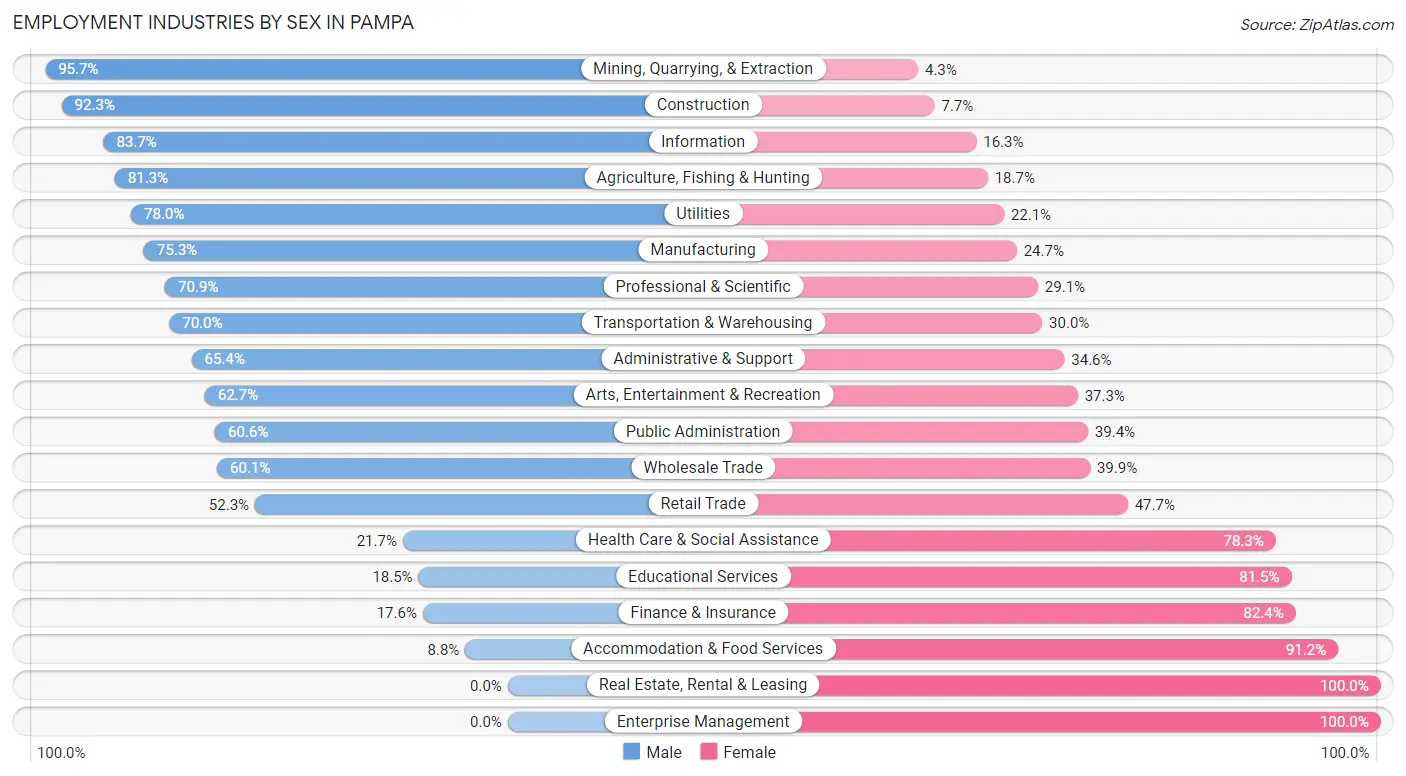
Employment Industries by Sex in Pampa
The Pampa industries that see more men than women are Mining, Quarrying, & Extraction (95.7%), Construction (92.3%), and Information (83.7%), whereas the industries that tend to have a higher number of women are Real Estate, Rental & Leasing (100.0%), Enterprise Management (100.0%), and Accommodation & Food Services (91.2%).
| Industry | Male | Female |
| Agriculture, Fishing & Hunting | 87 (81.3%) | 20 (18.7%) |
| Mining, Quarrying, & Extraction | 404 (95.7%) | 18 (4.3%) |
| Construction | 914 (92.3%) | 76 (7.7%) |
| Manufacturing | 442 (75.3%) | 145 (24.7%) |
| Wholesale Trade | 86 (60.1%) | 57 (39.9%) |
| Retail Trade | 506 (52.3%) | 461 (47.7%) |
| Transportation & Warehousing | 166 (70.0%) | 71 (30.0%) |
| Utilities | 99 (77.9%) | 28 (22.1%) |
| Information | 41 (83.7%) | 8 (16.3%) |
| Finance & Insurance | 19 (17.6%) | 89 (82.4%) |
| Real Estate, Rental & Leasing | 0 (0.0%) | 32 (100.0%) |
| Professional & Scientific | 278 (70.9%) | 114 (29.1%) |
| Enterprise Management | 0 (0.0%) | 4 (100.0%) |
| Administrative & Support | 267 (65.4%) | 141 (34.6%) |
| Educational Services | 141 (18.5%) | 622 (81.5%) |
| Health Care & Social Assistance | 198 (21.7%) | 713 (78.3%) |
| Arts, Entertainment & Recreation | 42 (62.7%) | 25 (37.3%) |
| Accommodation & Food Services | 45 (8.8%) | 466 (91.2%) |
| Public Administration | 295 (60.6%) | 192 (39.4%) |
| Total | 4,267 (55.0%) | 3,496 (45.0%) |
Education in Pampa
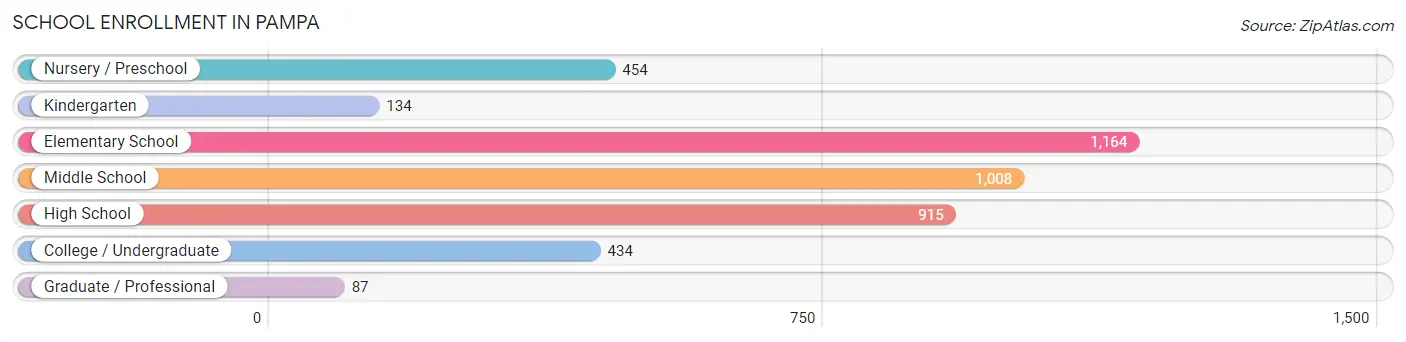
School Enrollment in Pampa
The most common levels of schooling among the 4,196 students in Pampa are elementary school (1,164 | 27.7%), middle school (1,008 | 24.0%), and high school (915 | 21.8%).
| School Level | # Students | % Students |
| Nursery / Preschool | 454 | 10.8% |
| Kindergarten | 134 | 3.2% |
| Elementary School | 1,164 | 27.7% |
| Middle School | 1,008 | 24.0% |
| High School | 915 | 21.8% |
| College / Undergraduate | 434 | 10.3% |
| Graduate / Professional | 87 | 2.1% |
| Total | 4,196 | 100.0% |
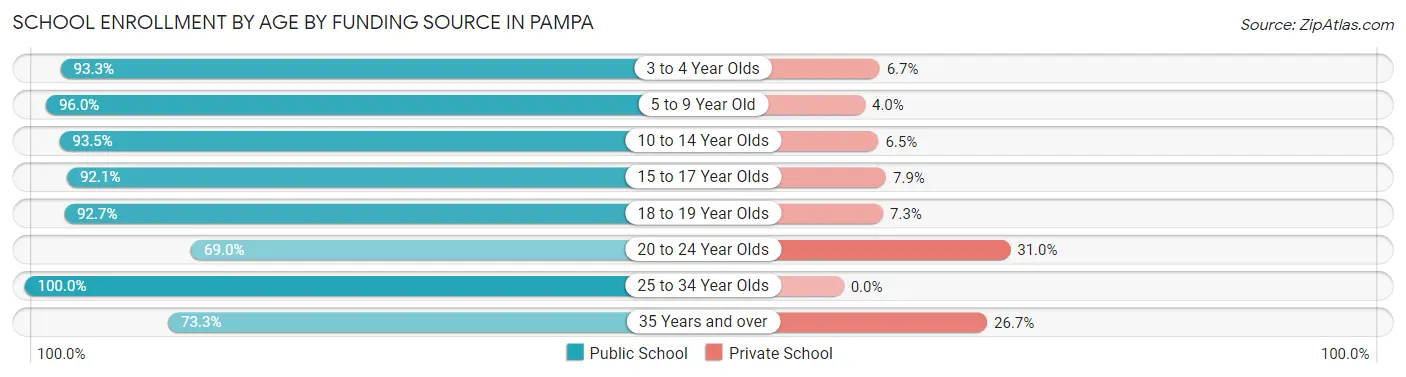
School Enrollment by Age by Funding Source in Pampa
Out of a total of 4,196 students who are enrolled in schools in Pampa, 336 (8.0%) attend a private institution, while the remaining 3,860 (92.0%) are enrolled in public schools. The age group of 20 to 24 year olds has the highest likelihood of being enrolled in private schools, with 81 (31.0% in the age bracket) enrolled. Conversely, the age group of 25 to 34 year olds has the lowest likelihood of being enrolled in a private school, with 57 (100.0% in the age bracket) attending a public institution.
| Age Bracket | Public School | Private School |
| 3 to 4 Year Olds | 347 (93.3%) | 25 (6.7%) |
| 5 to 9 Year Old | 1,232 (96.0%) | 51 (4.0%) |
| 10 to 14 Year Olds | 1,154 (93.5%) | 80 (6.5%) |
| 15 to 17 Year Olds | 641 (92.1%) | 55 (7.9%) |
| 18 to 19 Year Olds | 164 (92.7%) | 13 (7.3%) |
| 20 to 24 Year Olds | 180 (69.0%) | 81 (31.0%) |
| 25 to 34 Year Olds | 57 (100.0%) | 0 (0.0%) |
| 35 Years and over | 85 (73.3%) | 31 (26.7%) |
| Total | 3,860 (92.0%) | 336 (8.0%) |
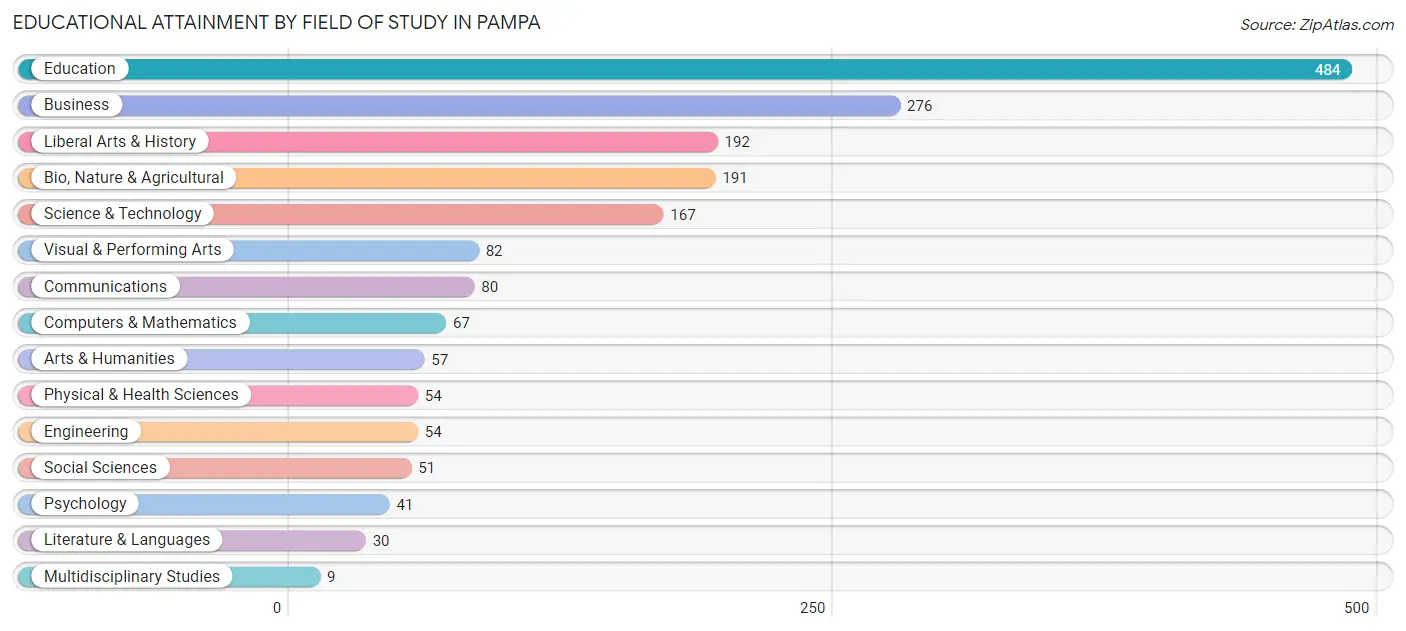
Educational Attainment by Field of Study in Pampa
Education (484 | 26.4%), business (276 | 15.0%), liberal arts & history (192 | 10.5%), bio, nature & agricultural (191 | 10.4%), and science & technology (167 | 9.1%) are the most common fields of study among 1,835 individuals in Pampa who have obtained a bachelor's degree or higher.
| Field of Study | # Graduates | % Graduates |
| Computers & Mathematics | 67 | 3.6% |
| Bio, Nature & Agricultural | 191 | 10.4% |
| Physical & Health Sciences | 54 | 2.9% |
| Psychology | 41 | 2.2% |
| Social Sciences | 51 | 2.8% |
| Engineering | 54 | 2.9% |
| Multidisciplinary Studies | 9 | 0.5% |
| Science & Technology | 167 | 9.1% |
| Business | 276 | 15.0% |
| Education | 484 | 26.4% |
| Literature & Languages | 30 | 1.6% |
| Liberal Arts & History | 192 | 10.5% |
| Visual & Performing Arts | 82 | 4.5% |
| Communications | 80 | 4.4% |
| Arts & Humanities | 57 | 3.1% |
| Total | 1,835 | 100.0% |
Transportation & Commute in Pampa
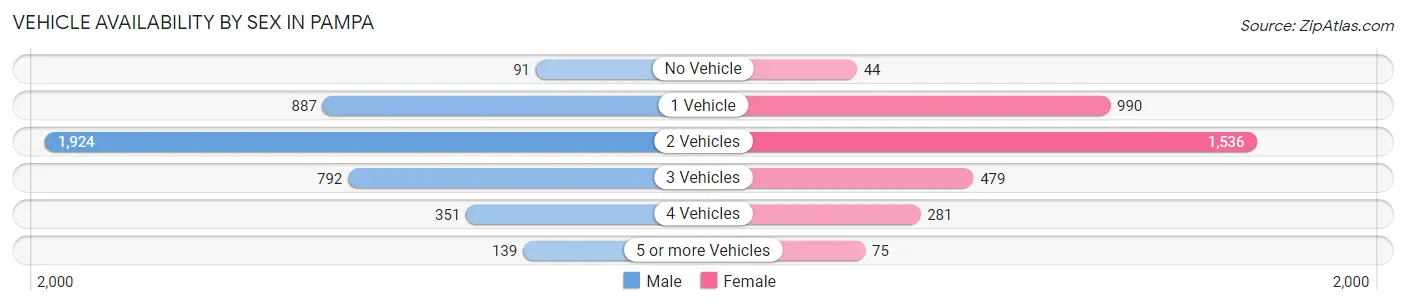
Vehicle Availability by Sex in Pampa
The most prevalent vehicle ownership categories in Pampa are males with 2 vehicles (1,924, accounting for 46.0%) and females with 2 vehicles (1,536, making up 56.5%).
| Vehicles Available | Male | Female |
| No Vehicle | 91 (2.2%) | 44 (1.3%) |
| 1 Vehicle | 887 (21.2%) | 990 (29.1%) |
| 2 Vehicles | 1,924 (46.0%) | 1,536 (45.1%) |
| 3 Vehicles | 792 (18.9%) | 479 (14.1%) |
| 4 Vehicles | 351 (8.4%) | 281 (8.3%) |
| 5 or more Vehicles | 139 (3.3%) | 75 (2.2%) |
| Total | 4,184 (100.0%) | 3,405 (100.0%) |
Commute Time in Pampa
The most frequently occuring commute durations in Pampa are 5 to 9 minutes (2,095 commuters, 28.8%), 10 to 14 minutes (1,450 commuters, 19.9%), and less than 5 minutes (1,173 commuters, 16.1%).
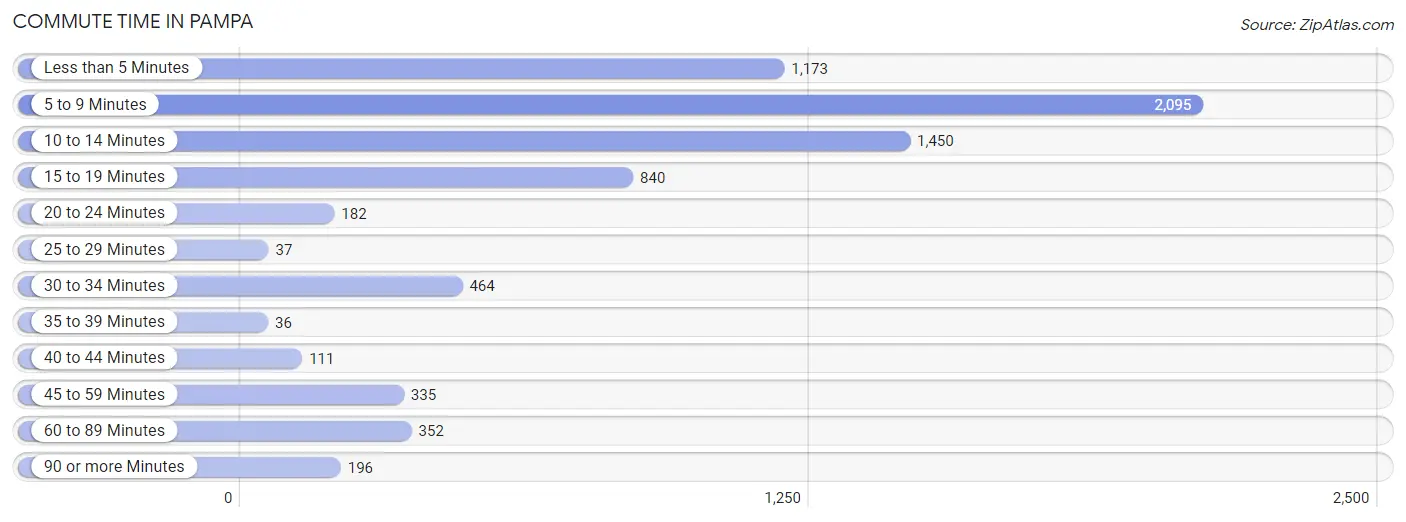
| Commute Time | # Commuters | % Commuters |
| Less than 5 Minutes | 1,173 | 16.1% |
| 5 to 9 Minutes | 2,095 | 28.8% |
| 10 to 14 Minutes | 1,450 | 19.9% |
| 15 to 19 Minutes | 840 | 11.6% |
| 20 to 24 Minutes | 182 | 2.5% |
| 25 to 29 Minutes | 37 | 0.5% |
| 30 to 34 Minutes | 464 | 6.4% |
| 35 to 39 Minutes | 36 | 0.5% |
| 40 to 44 Minutes | 111 | 1.5% |
| 45 to 59 Minutes | 335 | 4.6% |
| 60 to 89 Minutes | 352 | 4.8% |
| 90 or more Minutes | 196 | 2.7% |
Commute Time by Sex in Pampa
The most common commute times in Pampa are 10 to 14 minutes (890 commuters, 22.2%) for males and 5 to 9 minutes (1,236 commuters, 37.9%) for females.
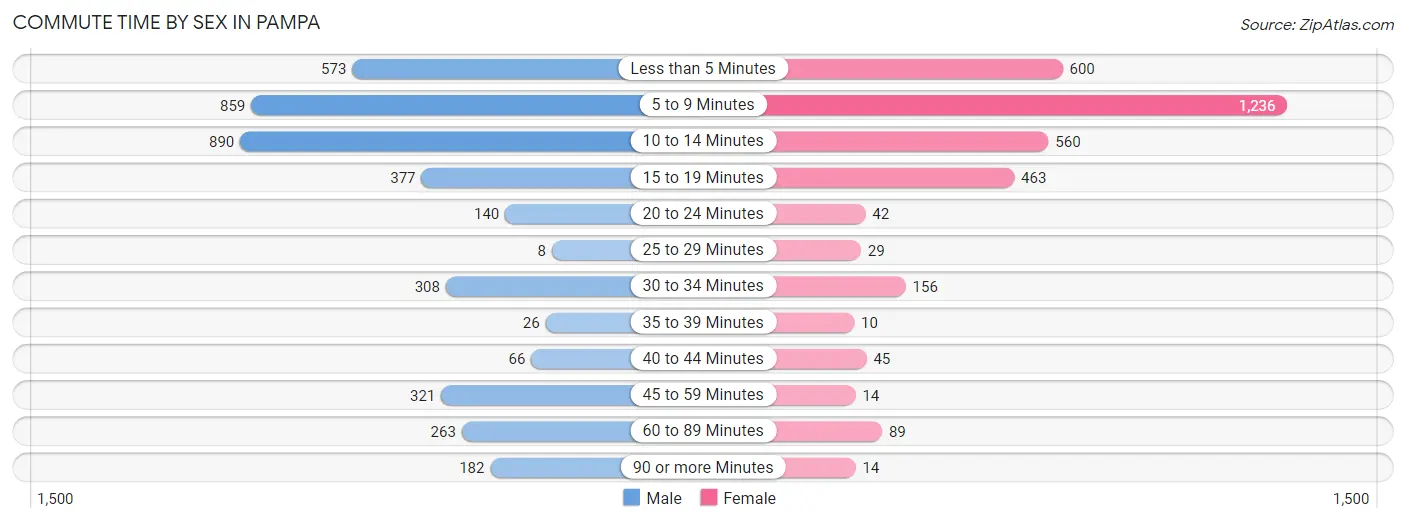
| Commute Time | Male | Female |
| Less than 5 Minutes | 573 (14.3%) | 600 (18.4%) |
| 5 to 9 Minutes | 859 (21.4%) | 1,236 (37.9%) |
| 10 to 14 Minutes | 890 (22.2%) | 560 (17.2%) |
| 15 to 19 Minutes | 377 (9.4%) | 463 (14.2%) |
| 20 to 24 Minutes | 140 (3.5%) | 42 (1.3%) |
| 25 to 29 Minutes | 8 (0.2%) | 29 (0.9%) |
| 30 to 34 Minutes | 308 (7.7%) | 156 (4.8%) |
| 35 to 39 Minutes | 26 (0.6%) | 10 (0.3%) |
| 40 to 44 Minutes | 66 (1.6%) | 45 (1.4%) |
| 45 to 59 Minutes | 321 (8.0%) | 14 (0.4%) |
| 60 to 89 Minutes | 263 (6.6%) | 89 (2.7%) |
| 90 or more Minutes | 182 (4.5%) | 14 (0.4%) |
Time of Departure to Work by Sex in Pampa
The most frequent times of departure to work in Pampa are 7:00 AM to 7:29 AM (650, 16.2%) for males and 7:00 AM to 7:29 AM (728, 22.3%) for females.
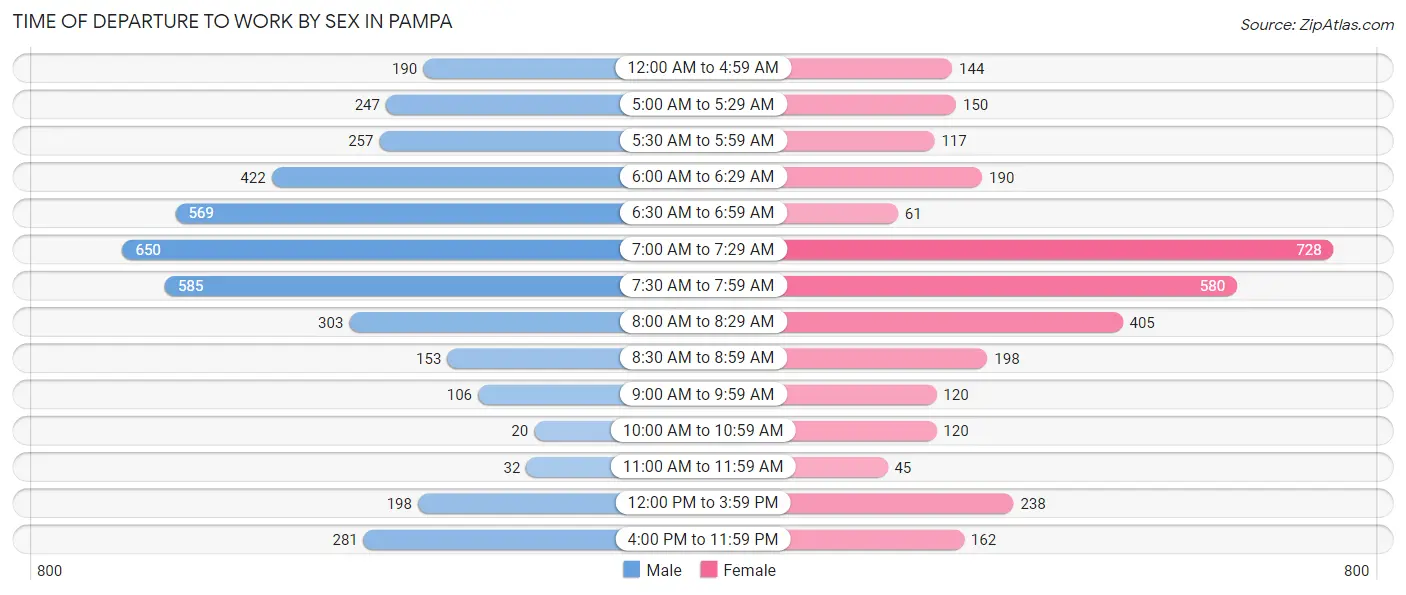
| Time of Departure | Male | Female |
| 12:00 AM to 4:59 AM | 190 (4.7%) | 144 (4.4%) |
| 5:00 AM to 5:29 AM | 247 (6.1%) | 150 (4.6%) |
| 5:30 AM to 5:59 AM | 257 (6.4%) | 117 (3.6%) |
| 6:00 AM to 6:29 AM | 422 (10.5%) | 190 (5.8%) |
| 6:30 AM to 6:59 AM | 569 (14.2%) | 61 (1.9%) |
| 7:00 AM to 7:29 AM | 650 (16.2%) | 728 (22.3%) |
| 7:30 AM to 7:59 AM | 585 (14.6%) | 580 (17.8%) |
| 8:00 AM to 8:29 AM | 303 (7.5%) | 405 (12.4%) |
| 8:30 AM to 8:59 AM | 153 (3.8%) | 198 (6.1%) |
| 9:00 AM to 9:59 AM | 106 (2.6%) | 120 (3.7%) |
| 10:00 AM to 10:59 AM | 20 (0.5%) | 120 (3.7%) |
| 11:00 AM to 11:59 AM | 32 (0.8%) | 45 (1.4%) |
| 12:00 PM to 3:59 PM | 198 (4.9%) | 238 (7.3%) |
| 4:00 PM to 11:59 PM | 281 (7.0%) | 162 (5.0%) |
| Total | 4,013 (100.0%) | 3,258 (100.0%) |
Housing Occupancy in Pampa
Occupancy by Ownership in Pampa
Of the total 6,935 dwellings in Pampa, owner-occupied units account for 4,752 (68.5%), while renter-occupied units make up 2,183 (31.5%).
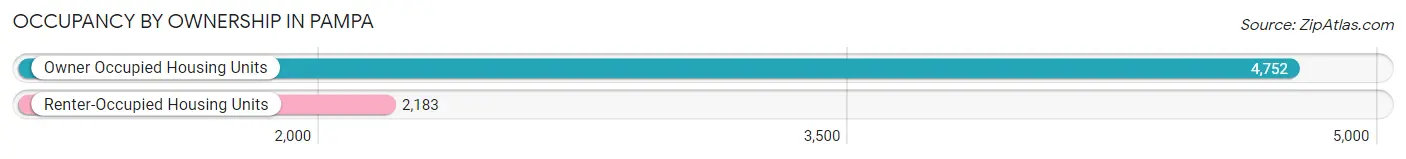
| Occupancy | # Housing Units | % Housing Units |
| Owner Occupied Housing Units | 4,752 | 68.5% |
| Renter-Occupied Housing Units | 2,183 | 31.5% |
| Total Occupied Housing Units | 6,935 | 100.0% |
Occupancy by Household Size in Pampa
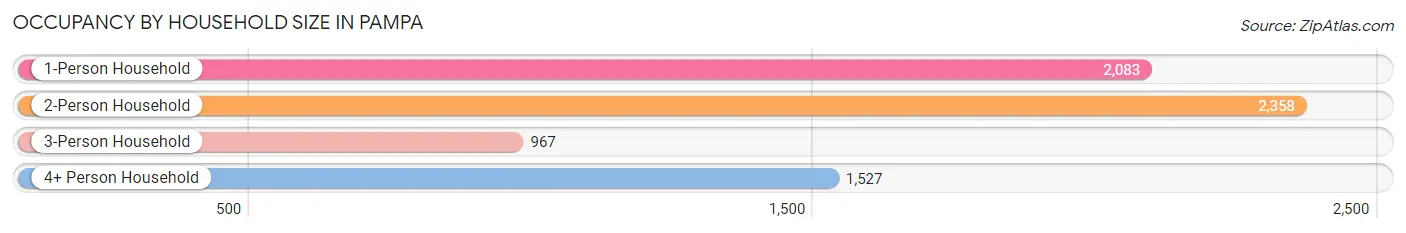
| Household Size | # Housing Units | % Housing Units |
| 1-Person Household | 2,083 | 30.0% |
| 2-Person Household | 2,358 | 34.0% |
| 3-Person Household | 967 | 13.9% |
| 4+ Person Household | 1,527 | 22.0% |
| Total Housing Units | 6,935 | 100.0% |
Occupancy by Ownership by Household Size in Pampa
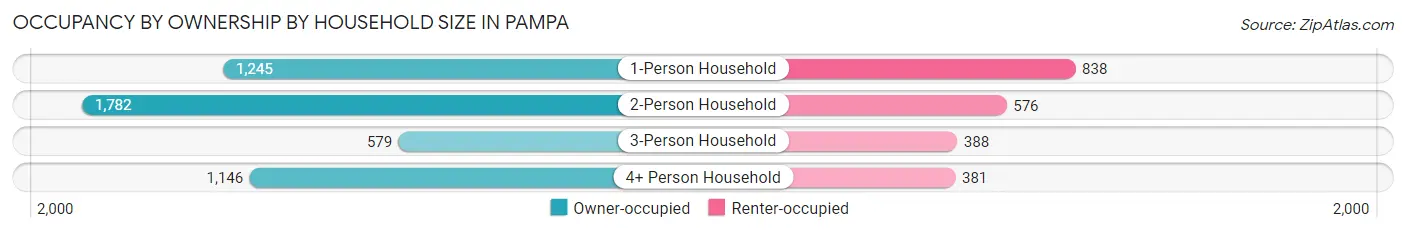
| Household Size | Owner-occupied | Renter-occupied |
| 1-Person Household | 1,245 (59.8%) | 838 (40.2%) |
| 2-Person Household | 1,782 (75.6%) | 576 (24.4%) |
| 3-Person Household | 579 (59.9%) | 388 (40.1%) |
| 4+ Person Household | 1,146 (75.0%) | 381 (24.9%) |
| Total Housing Units | 4,752 (68.5%) | 2,183 (31.5%) |
Occupancy by Educational Attainment in Pampa
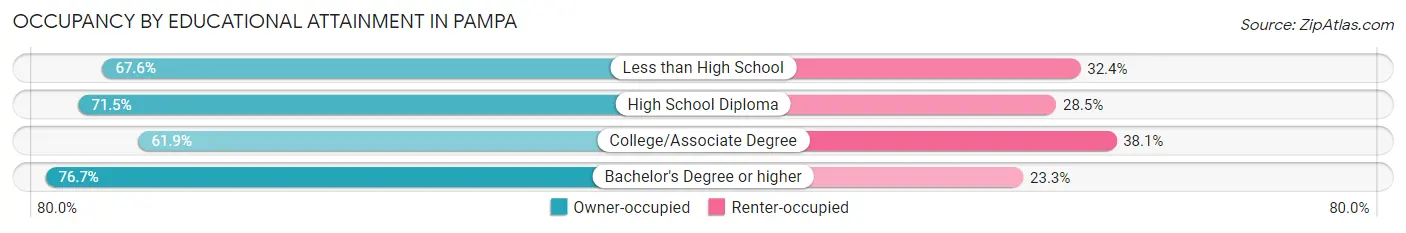
| Household Size | Owner-occupied | Renter-occupied |
| Less than High School | 794 (67.6%) | 380 (32.4%) |
| High School Diploma | 1,596 (71.5%) | 637 (28.5%) |
| College/Associate Degree | 1,441 (61.9%) | 886 (38.1%) |
| Bachelor's Degree or higher | 921 (76.7%) | 280 (23.3%) |
Occupancy by Age of Householder in Pampa
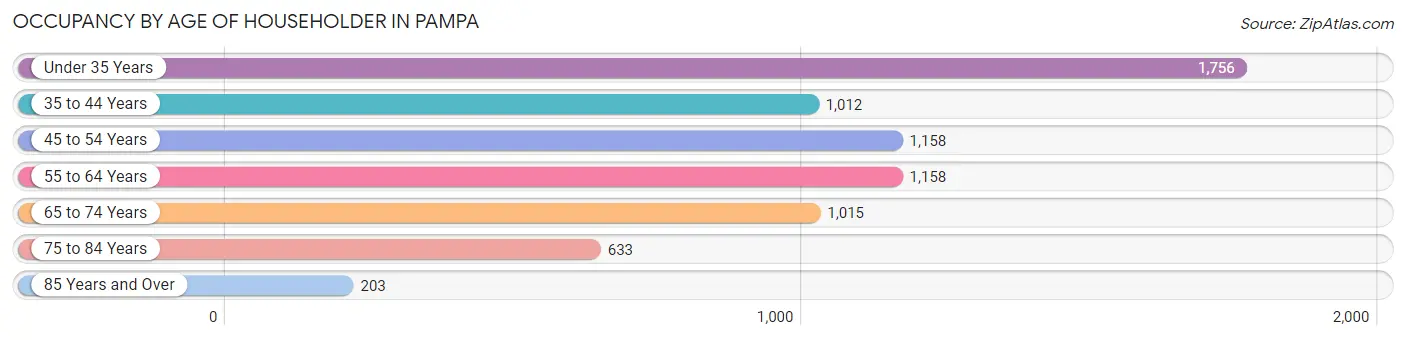
| Age Bracket | # Households | % Households |
| Under 35 Years | 1,756 | 25.3% |
| 35 to 44 Years | 1,012 | 14.6% |
| 45 to 54 Years | 1,158 | 16.7% |
| 55 to 64 Years | 1,158 | 16.7% |
| 65 to 74 Years | 1,015 | 14.6% |
| 75 to 84 Years | 633 | 9.1% |
| 85 Years and Over | 203 | 2.9% |
| Total | 6,935 | 100.0% |
Housing Finances in Pampa
Median Income by Occupancy in Pampa
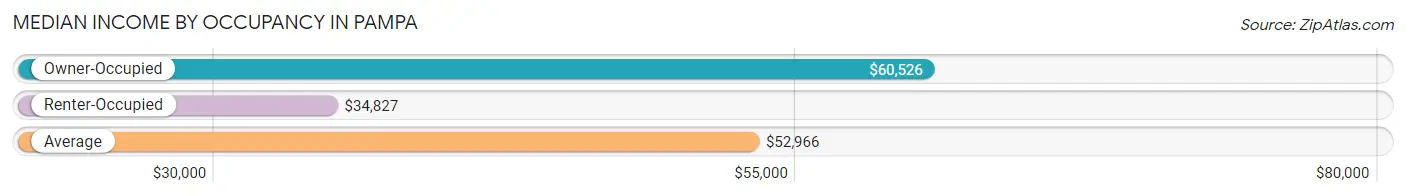
| Occupancy Type | # Households | Median Income |
| Owner-Occupied | 4,752 (68.5%) | $60,526 |
| Renter-Occupied | 2,183 (31.5%) | $34,827 |
| Average | 6,935 (100.0%) | $52,966 |
Occupancy by Householder Income Bracket in Pampa
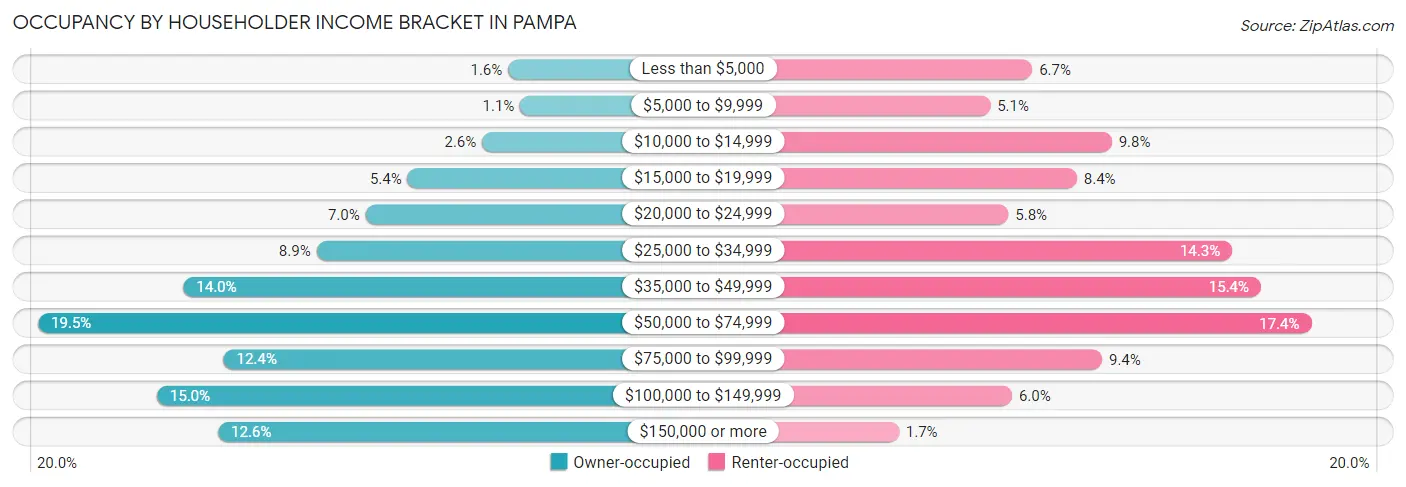
| Income Bracket | Owner-occupied | Renter-occupied |
| Less than $5,000 | 75 (1.6%) | 147 (6.7%) |
| $5,000 to $9,999 | 53 (1.1%) | 112 (5.1%) |
| $10,000 to $14,999 | 122 (2.6%) | 213 (9.8%) |
| $15,000 to $19,999 | 257 (5.4%) | 184 (8.4%) |
| $20,000 to $24,999 | 333 (7.0%) | 127 (5.8%) |
| $25,000 to $34,999 | 422 (8.9%) | 313 (14.3%) |
| $35,000 to $49,999 | 663 (14.0%) | 337 (15.4%) |
| $50,000 to $74,999 | 926 (19.5%) | 379 (17.4%) |
| $75,000 to $99,999 | 590 (12.4%) | 205 (9.4%) |
| $100,000 to $149,999 | 711 (15.0%) | 130 (6.0%) |
| $150,000 or more | 600 (12.6%) | 36 (1.7%) |
| Total | 4,752 (100.0%) | 2,183 (100.0%) |
Monthly Housing Cost Tiers in Pampa
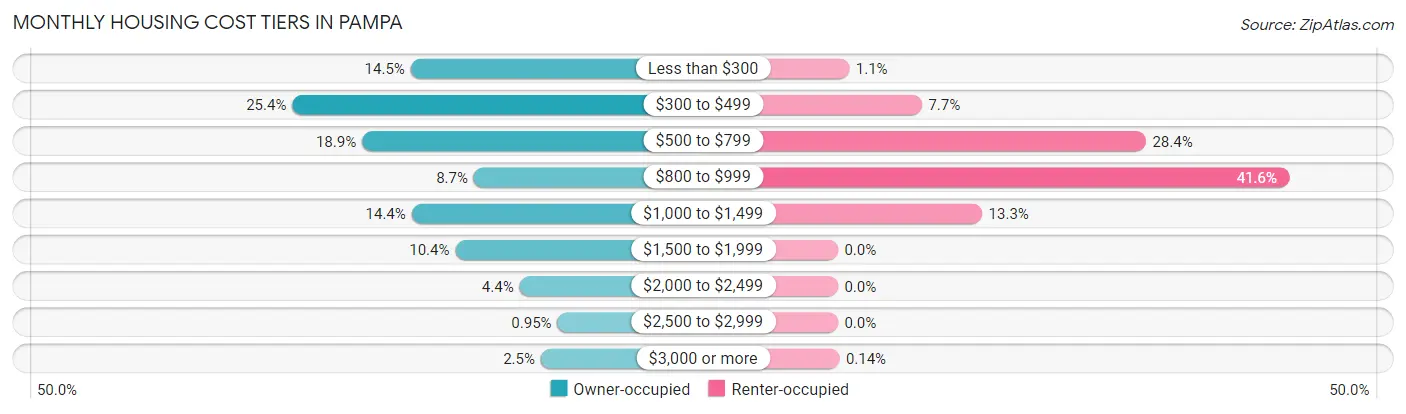
| Monthly Cost | Owner-occupied | Renter-occupied |
| Less than $300 | 687 (14.5%) | 23 (1.1%) |
| $300 to $499 | 1,205 (25.4%) | 169 (7.7%) |
| $500 to $799 | 900 (18.9%) | 619 (28.4%) |
| $800 to $999 | 411 (8.6%) | 907 (41.5%) |
| $1,000 to $1,499 | 683 (14.4%) | 290 (13.3%) |
| $1,500 to $1,999 | 492 (10.3%) | 0 (0.0%) |
| $2,000 to $2,499 | 211 (4.4%) | 0 (0.0%) |
| $2,500 to $2,999 | 45 (0.9%) | 0 (0.0%) |
| $3,000 or more | 118 (2.5%) | 3 (0.1%) |
| Total | 4,752 (100.0%) | 2,183 (100.0%) |
Physical Housing Characteristics in Pampa
Housing Structures in Pampa
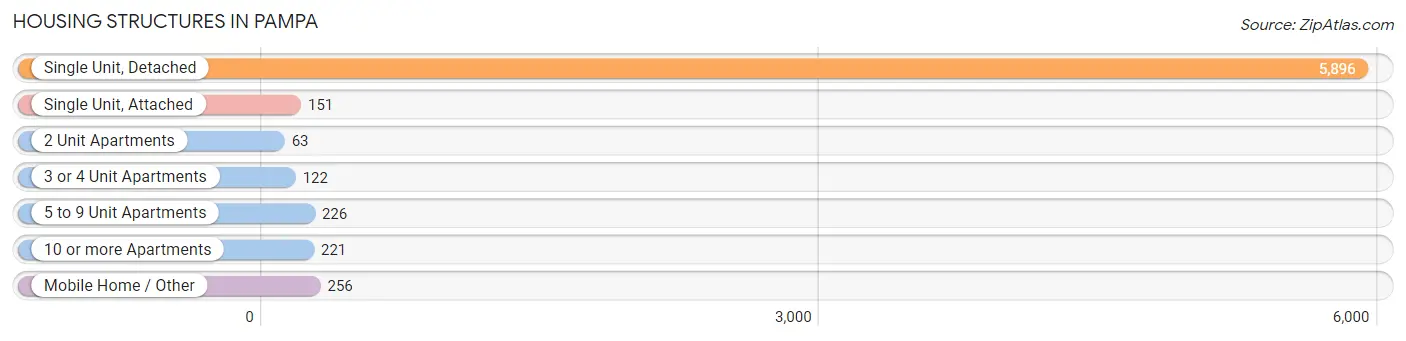
| Structure Type | # Housing Units | % Housing Units |
| Single Unit, Detached | 5,896 | 85.0% |
| Single Unit, Attached | 151 | 2.2% |
| 2 Unit Apartments | 63 | 0.9% |
| 3 or 4 Unit Apartments | 122 | 1.8% |
| 5 to 9 Unit Apartments | 226 | 3.3% |
| 10 or more Apartments | 221 | 3.2% |
| Mobile Home / Other | 256 | 3.7% |
| Total | 6,935 | 100.0% |
Housing Structures by Occupancy in Pampa

| Structure Type | Owner-occupied | Renter-occupied |
| Single Unit, Detached | 4,471 (75.8%) | 1,425 (24.2%) |
| Single Unit, Attached | 76 (50.3%) | 75 (49.7%) |
| 2 Unit Apartments | 28 (44.4%) | 35 (55.6%) |
| 3 or 4 Unit Apartments | 0 (0.0%) | 122 (100.0%) |
| 5 to 9 Unit Apartments | 0 (0.0%) | 226 (100.0%) |
| 10 or more Apartments | 0 (0.0%) | 221 (100.0%) |
| Mobile Home / Other | 177 (69.1%) | 79 (30.9%) |
| Total | 4,752 (68.5%) | 2,183 (31.5%) |
Housing Structures by Number of Rooms in Pampa
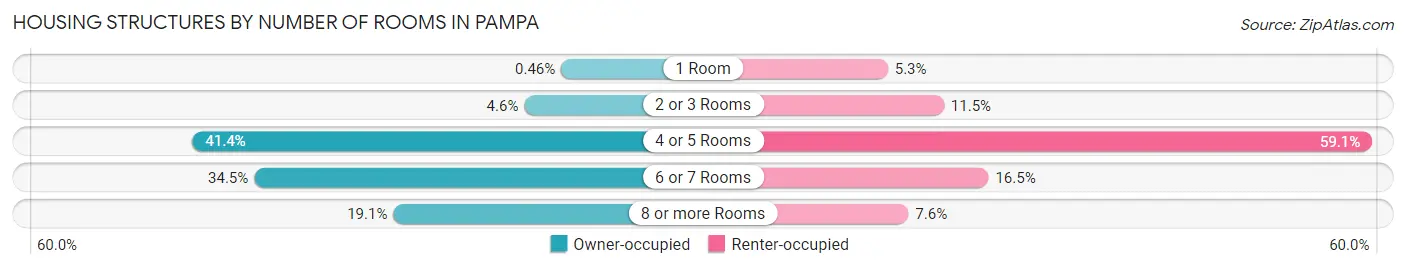
| Number of Rooms | Owner-occupied | Renter-occupied |
| 1 Room | 22 (0.5%) | 116 (5.3%) |
| 2 or 3 Rooms | 216 (4.5%) | 252 (11.5%) |
| 4 or 5 Rooms | 1,966 (41.4%) | 1,289 (59.1%) |
| 6 or 7 Rooms | 1,641 (34.5%) | 360 (16.5%) |
| 8 or more Rooms | 907 (19.1%) | 166 (7.6%) |
| Total | 4,752 (100.0%) | 2,183 (100.0%) |
Housing Structure by Heating Type in Pampa
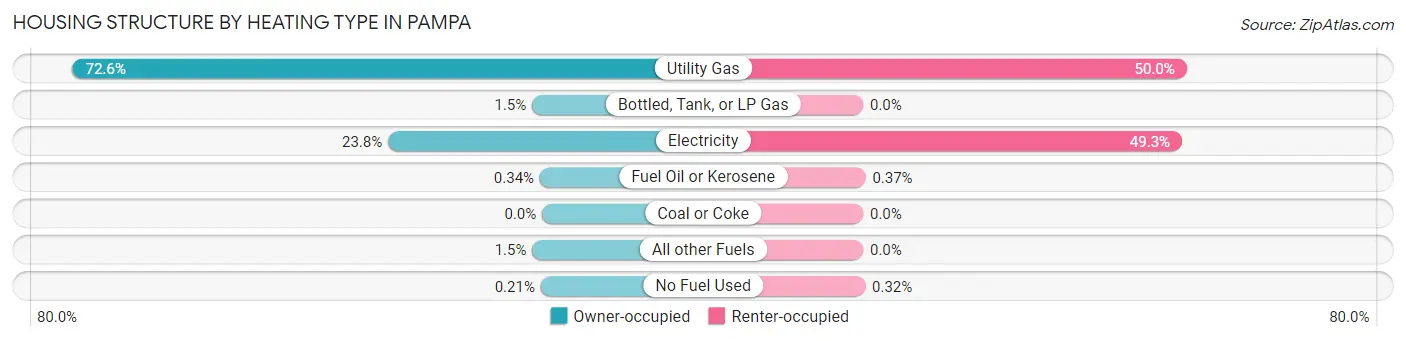
| Heating Type | Owner-occupied | Renter-occupied |
| Utility Gas | 3,449 (72.6%) | 1,092 (50.0%) |
| Bottled, Tank, or LP Gas | 73 (1.5%) | 0 (0.0%) |
| Electricity | 1,132 (23.8%) | 1,076 (49.3%) |
| Fuel Oil or Kerosene | 16 (0.3%) | 8 (0.4%) |
| Coal or Coke | 0 (0.0%) | 0 (0.0%) |
| All other Fuels | 72 (1.5%) | 0 (0.0%) |
| No Fuel Used | 10 (0.2%) | 7 (0.3%) |
| Total | 4,752 (100.0%) | 2,183 (100.0%) |
Household Vehicle Usage in Pampa
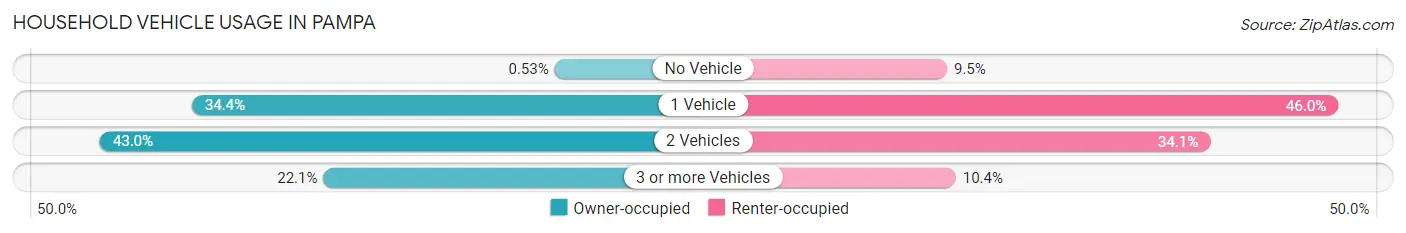
| Vehicles per Household | Owner-occupied | Renter-occupied |
| No Vehicle | 25 (0.5%) | 208 (9.5%) |
| 1 Vehicle | 1,634 (34.4%) | 1,005 (46.0%) |
| 2 Vehicles | 2,042 (43.0%) | 744 (34.1%) |
| 3 or more Vehicles | 1,051 (22.1%) | 226 (10.3%) |
| Total | 4,752 (100.0%) | 2,183 (100.0%) |
Real Estate & Mortgages in Pampa
Real Estate and Mortgage Overview in Pampa
| Characteristic | Without Mortgage | With Mortgage |
| Housing Units | 2,906 | 1,846 |
| Median Property Value | $76,000 | $140,400 |
| Median Household Income | $53,897 | $333 |
| Monthly Housing Costs | $435 | $100 |
| Real Estate Taxes | $694 | $71 |
Property Value by Mortgage Status in Pampa
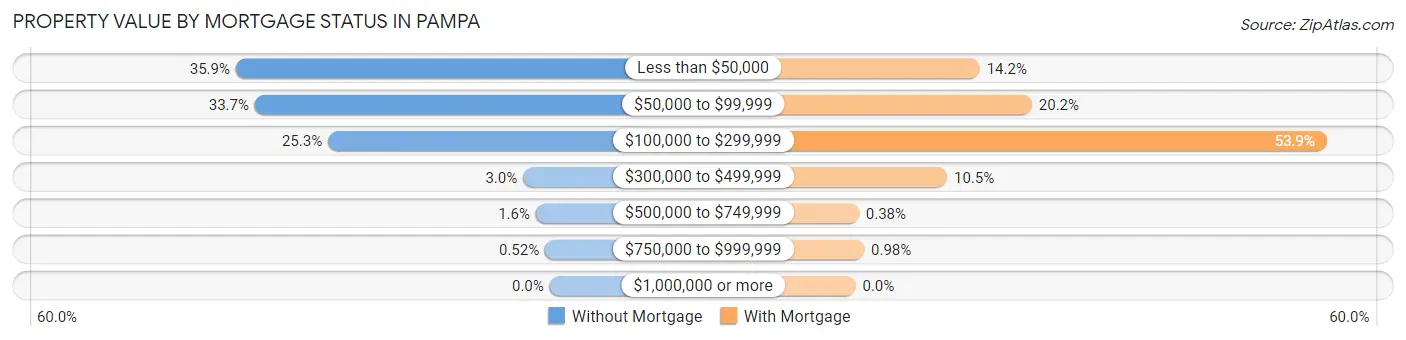
| Property Value | Without Mortgage | With Mortgage |
| Less than $50,000 | 1,042 (35.9%) | 262 (14.2%) |
| $50,000 to $99,999 | 979 (33.7%) | 372 (20.2%) |
| $100,000 to $299,999 | 736 (25.3%) | 994 (53.8%) |
| $300,000 to $499,999 | 88 (3.0%) | 193 (10.5%) |
| $500,000 to $749,999 | 46 (1.6%) | 7 (0.4%) |
| $750,000 to $999,999 | 15 (0.5%) | 18 (1.0%) |
| $1,000,000 or more | 0 (0.0%) | 0 (0.0%) |
| Total | 2,906 (100.0%) | 1,846 (100.0%) |
Household Income by Mortgage Status in Pampa
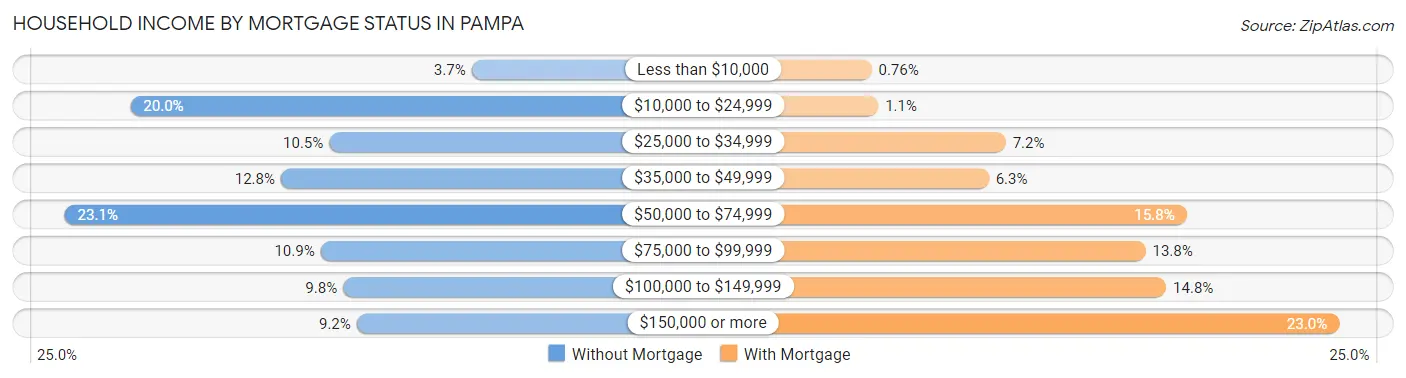
| Household Income | Without Mortgage | With Mortgage |
| Less than $10,000 | 108 (3.7%) | 14 (0.8%) |
| $10,000 to $24,999 | 580 (20.0%) | 20 (1.1%) |
| $25,000 to $34,999 | 305 (10.5%) | 132 (7.1%) |
| $35,000 to $49,999 | 372 (12.8%) | 117 (6.3%) |
| $50,000 to $74,999 | 671 (23.1%) | 291 (15.8%) |
| $75,000 to $99,999 | 317 (10.9%) | 255 (13.8%) |
| $100,000 to $149,999 | 286 (9.8%) | 273 (14.8%) |
| $150,000 or more | 267 (9.2%) | 425 (23.0%) |
| Total | 2,906 (100.0%) | 1,846 (100.0%) |
Property Value to Household Income Ratio in Pampa
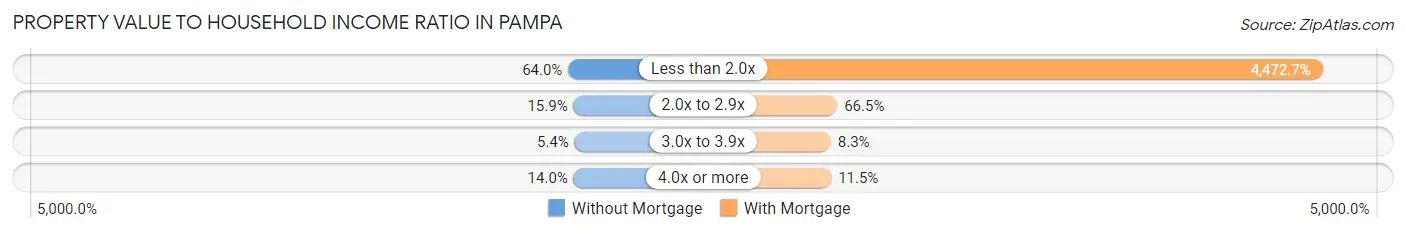
| Value-to-Income Ratio | Without Mortgage | With Mortgage |
| Less than 2.0x | 1,860 (64.0%) | 82,566 (4,472.7%) |
| 2.0x to 2.9x | 461 (15.9%) | 1,228 (66.5%) |
| 3.0x to 3.9x | 156 (5.4%) | 153 (8.3%) |
| 4.0x or more | 408 (14.0%) | 213 (11.5%) |
| Total | 2,906 (100.0%) | 1,846 (100.0%) |
Real Estate Taxes by Mortgage Status in Pampa
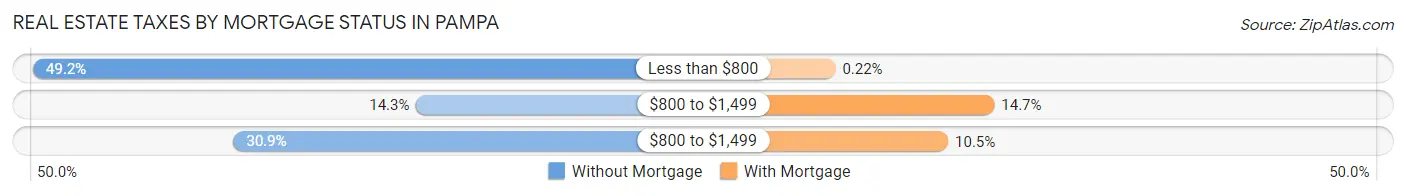
| Property Taxes | Without Mortgage | With Mortgage |
| Less than $800 | 1,431 (49.2%) | 4 (0.2%) |
| $800 to $1,499 | 416 (14.3%) | 272 (14.7%) |
| $800 to $1,499 | 899 (30.9%) | 194 (10.5%) |
| Total | 2,906 (100.0%) | 1,846 (100.0%) |
Health & Disability in Pampa
Health Insurance Coverage by Age in Pampa
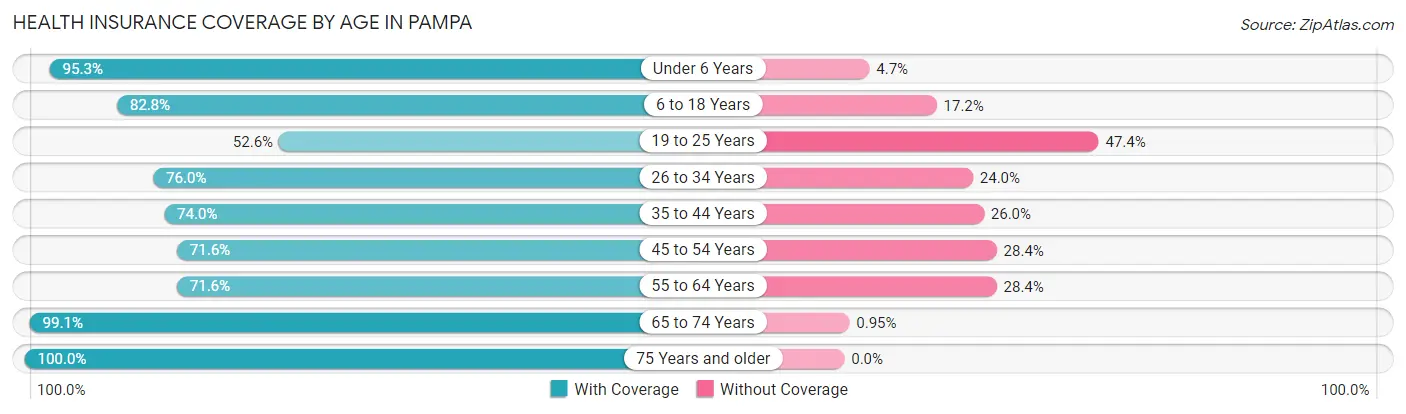
| Age Bracket | With Coverage | Without Coverage |
| Under 6 Years | 1,264 (95.3%) | 62 (4.7%) |
| 6 to 18 Years | 2,714 (82.8%) | 564 (17.2%) |
| 19 to 25 Years | 978 (52.6%) | 882 (47.4%) |
| 26 to 34 Years | 1,351 (76.0%) | 426 (24.0%) |
| 35 to 44 Years | 1,362 (74.0%) | 479 (26.0%) |
| 45 to 54 Years | 1,449 (71.6%) | 575 (28.4%) |
| 55 to 64 Years | 1,404 (71.6%) | 557 (28.4%) |
| 65 to 74 Years | 1,463 (99.1%) | 14 (0.9%) |
| 75 Years and older | 1,126 (100.0%) | 0 (0.0%) |
| Total | 13,111 (78.6%) | 3,559 (21.3%) |
Health Insurance Coverage by Citizenship Status in Pampa
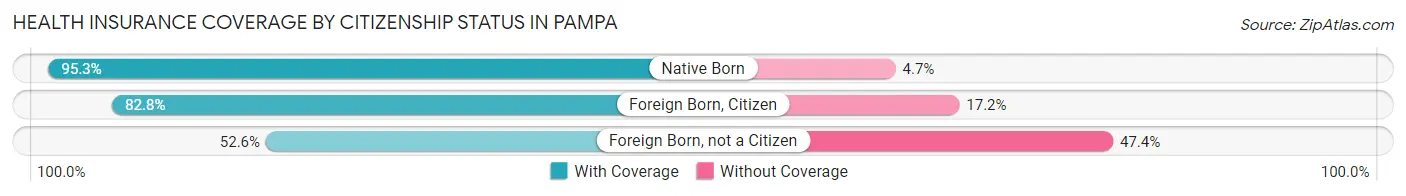
| Citizenship Status | With Coverage | Without Coverage |
| Native Born | 1,264 (95.3%) | 62 (4.7%) |
| Foreign Born, Citizen | 2,714 (82.8%) | 564 (17.2%) |
| Foreign Born, not a Citizen | 978 (52.6%) | 882 (47.4%) |
Health Insurance Coverage by Household Income in Pampa
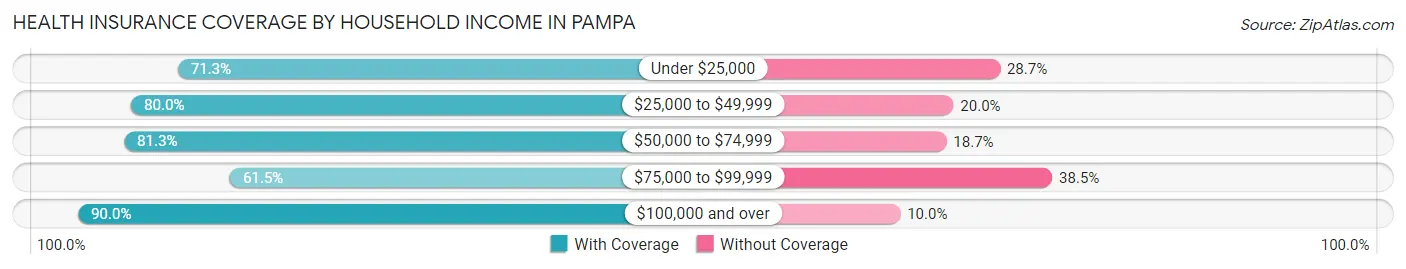
| Household Income | With Coverage | Without Coverage |
| Under $25,000 | 2,141 (71.3%) | 862 (28.7%) |
| $25,000 to $49,999 | 3,193 (80.0%) | 797 (20.0%) |
| $50,000 to $74,999 | 2,371 (81.3%) | 544 (18.7%) |
| $75,000 to $99,999 | 1,461 (61.5%) | 914 (38.5%) |
| $100,000 and over | 3,938 (90.0%) | 438 (10.0%) |
Public vs Private Health Insurance Coverage by Age in Pampa
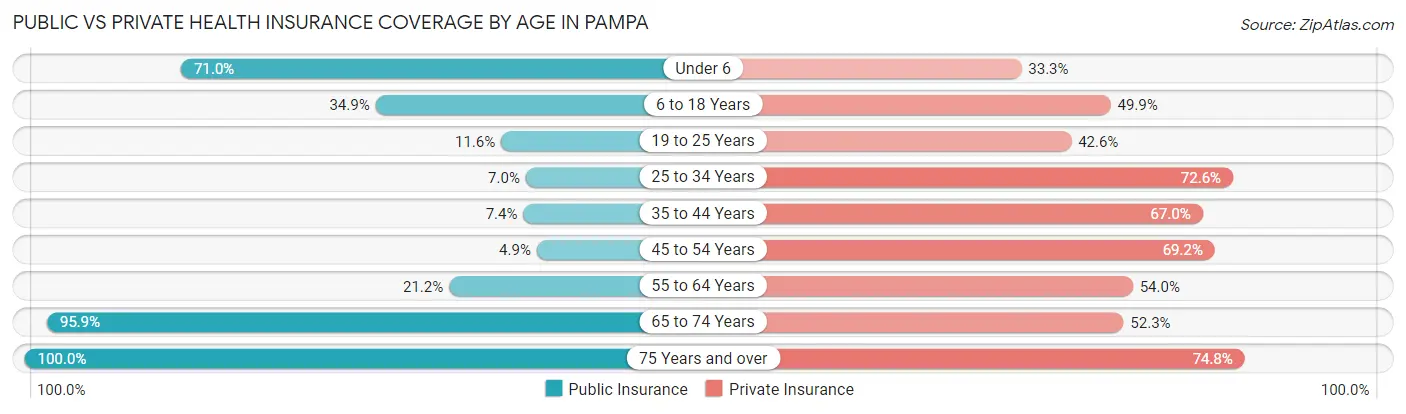
| Age Bracket | Public Insurance | Private Insurance |
| Under 6 | 941 (71.0%) | 442 (33.3%) |
| 6 to 18 Years | 1,143 (34.9%) | 1,635 (49.9%) |
| 19 to 25 Years | 215 (11.6%) | 792 (42.6%) |
| 25 to 34 Years | 124 (7.0%) | 1,290 (72.6%) |
| 35 to 44 Years | 137 (7.4%) | 1,233 (67.0%) |
| 45 to 54 Years | 100 (4.9%) | 1,401 (69.2%) |
| 55 to 64 Years | 416 (21.2%) | 1,059 (54.0%) |
| 65 to 74 Years | 1,416 (95.9%) | 772 (52.3%) |
| 75 Years and over | 1,126 (100.0%) | 842 (74.8%) |
| Total | 5,618 (33.7%) | 9,466 (56.8%) |
Disability Status by Sex by Age in Pampa
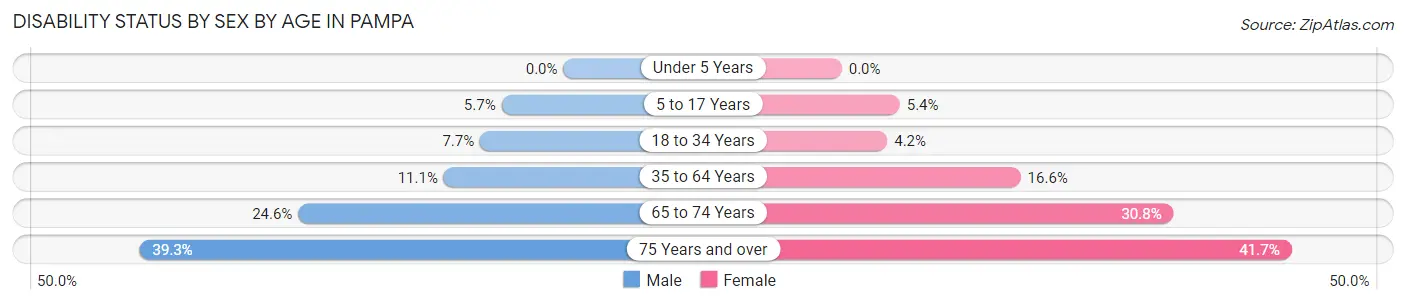
| Age Bracket | Male | Female |
| Under 5 Years | 0 (0.0%) | 0 (0.0%) |
| 5 to 17 Years | 102 (5.7%) | 84 (5.4%) |
| 18 to 34 Years | 152 (7.7%) | 76 (4.2%) |
| 35 to 64 Years | 325 (11.1%) | 481 (16.6%) |
| 65 to 74 Years | 174 (24.6%) | 237 (30.8%) |
| 75 Years and over | 179 (39.3%) | 280 (41.7%) |
Disability Class by Sex by Age in Pampa
Disability Class: Hearing Difficulty
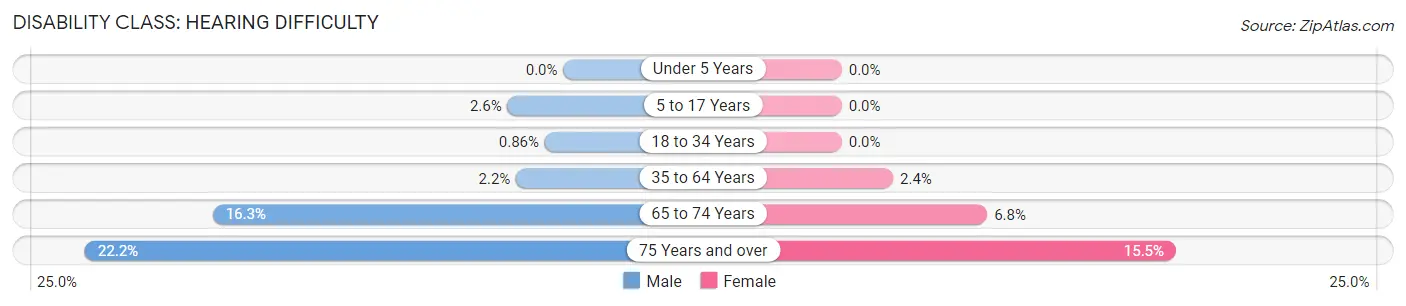
| Age Bracket | Male | Female |
| Under 5 Years | 0 (0.0%) | 0 (0.0%) |
| 5 to 17 Years | 46 (2.6%) | 0 (0.0%) |
| 18 to 34 Years | 17 (0.9%) | 0 (0.0%) |
| 35 to 64 Years | 64 (2.2%) | 69 (2.4%) |
| 65 to 74 Years | 115 (16.3%) | 52 (6.8%) |
| 75 Years and over | 101 (22.2%) | 104 (15.5%) |
Disability Class: Vision Difficulty
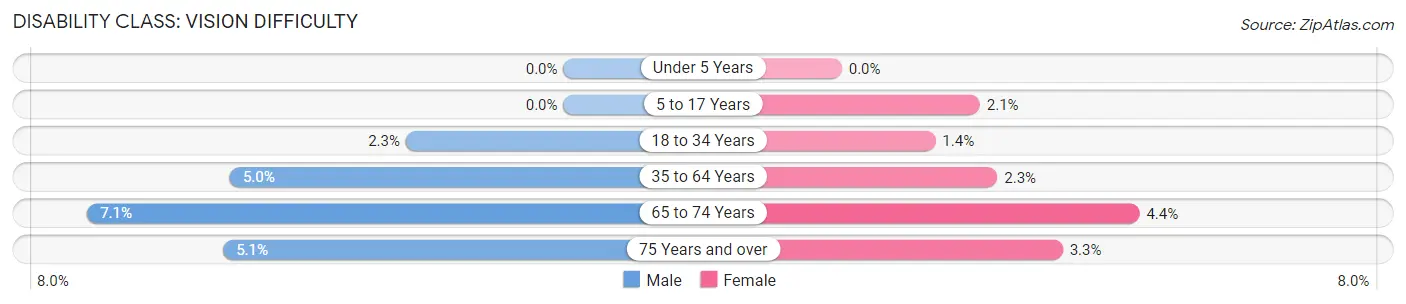
| Age Bracket | Male | Female |
| Under 5 Years | 0 (0.0%) | 0 (0.0%) |
| 5 to 17 Years | 0 (0.0%) | 32 (2.1%) |
| 18 to 34 Years | 46 (2.3%) | 25 (1.4%) |
| 35 to 64 Years | 145 (5.0%) | 67 (2.3%) |
| 65 to 74 Years | 50 (7.1%) | 34 (4.4%) |
| 75 Years and over | 23 (5.1%) | 22 (3.3%) |
Disability Class: Cognitive Difficulty
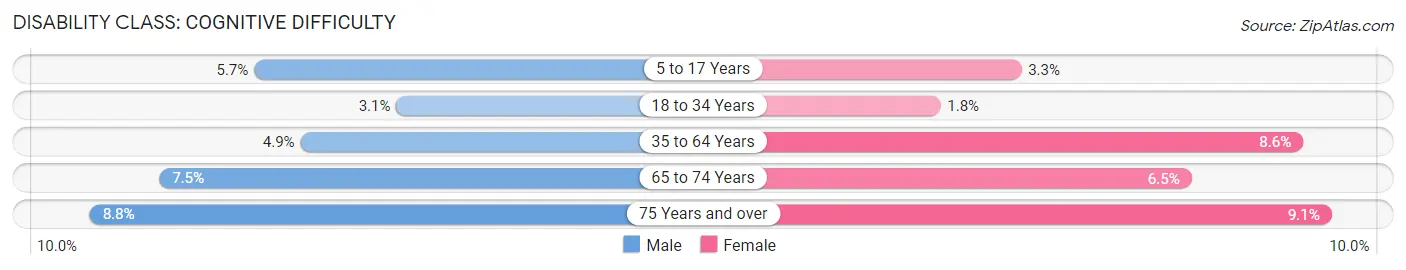
| Age Bracket | Male | Female |
| 5 to 17 Years | 102 (5.7%) | 52 (3.3%) |
| 18 to 34 Years | 61 (3.1%) | 33 (1.8%) |
| 35 to 64 Years | 143 (4.9%) | 248 (8.6%) |
| 65 to 74 Years | 53 (7.5%) | 50 (6.5%) |
| 75 Years and over | 40 (8.8%) | 61 (9.1%) |
Disability Class: Ambulatory Difficulty
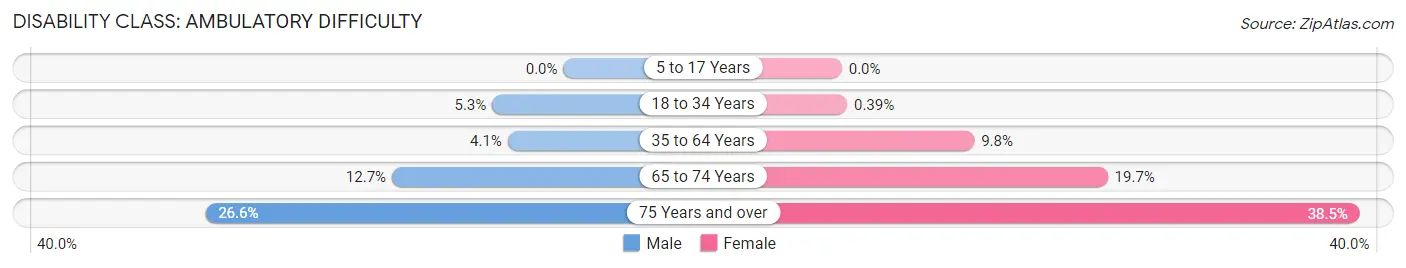
| Age Bracket | Male | Female |
| 5 to 17 Years | 0 (0.0%) | 0 (0.0%) |
| 18 to 34 Years | 104 (5.3%) | 7 (0.4%) |
| 35 to 64 Years | 121 (4.1%) | 285 (9.8%) |
| 65 to 74 Years | 90 (12.7%) | 152 (19.7%) |
| 75 Years and over | 121 (26.6%) | 258 (38.5%) |
Disability Class: Self-Care Difficulty
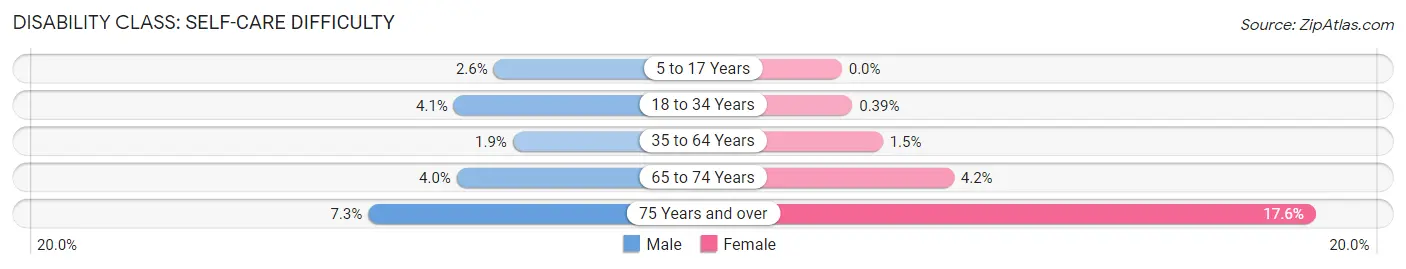
| Age Bracket | Male | Female |
| 5 to 17 Years | 46 (2.6%) | 0 (0.0%) |
| 18 to 34 Years | 80 (4.1%) | 7 (0.4%) |
| 35 to 64 Years | 55 (1.9%) | 44 (1.5%) |
| 65 to 74 Years | 28 (4.0%) | 32 (4.2%) |
| 75 Years and over | 33 (7.2%) | 118 (17.6%) |
Technology Access in Pampa
Computing Device Access in Pampa
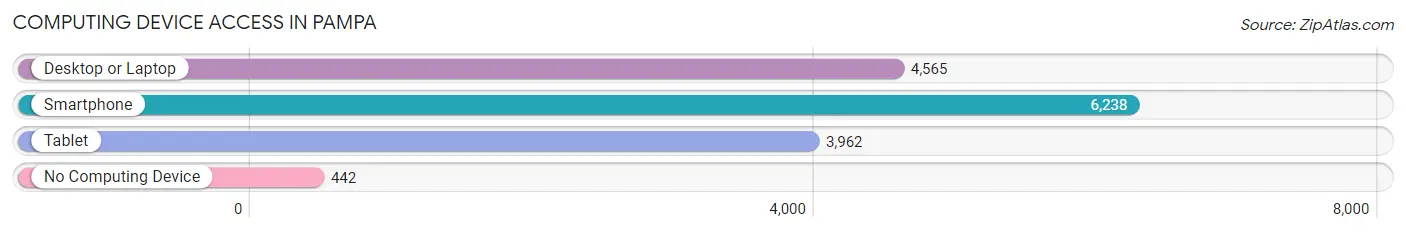
| Device Type | # Households | % Households |
| Desktop or Laptop | 4,565 | 65.8% |
| Smartphone | 6,238 | 89.9% |
| Tablet | 3,962 | 57.1% |
| No Computing Device | 442 | 6.4% |
| Total | 6,935 | 100.0% |
Internet Access in Pampa
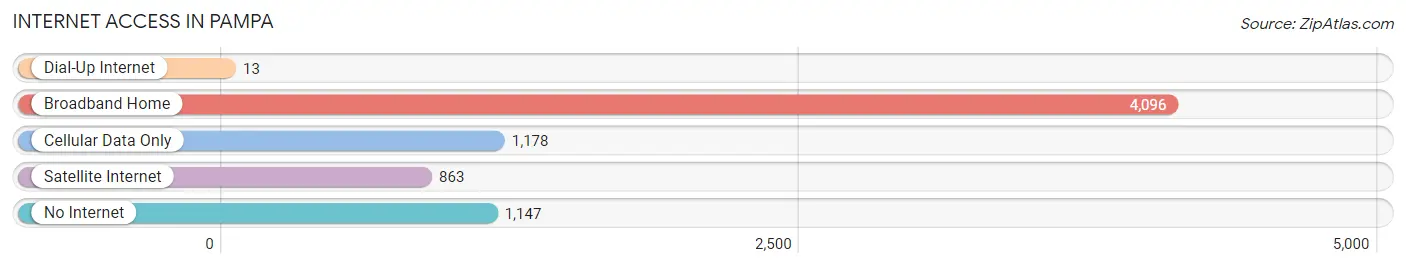
| Internet Type | # Households | % Households |
| Dial-Up Internet | 13 | 0.2% |
| Broadband Home | 4,096 | 59.1% |
| Cellular Data Only | 1,178 | 17.0% |
| Satellite Internet | 863 | 12.4% |
| No Internet | 1,147 | 16.5% |
| Total | 6,935 | 100.0% |
Pampa Summary
Pampa, Texas is a city located in the northern part of the state, in Gray County. It is the county seat of Gray County and is the largest city in the county. The city is located in the Texas Panhandle, and is part of the Amarillo metropolitan area. The population of Pampa was estimated to be 17,890 in 2019.
History
Pampa was founded in 1888 by cattle ranchers, and was named after the Pampas grasslands of South America. The city was incorporated in 1909, and the first mayor was elected in 1910. The city was a major stop on the Santa Fe Railroad, and the economy was largely based on the cattle industry.
In the 1920s, oil was discovered in the area, and the city quickly became a major oil producer. The oil boom brought a large influx of people to the city, and the population grew rapidly. The city was also home to a large number of oil refineries, and the economy was largely based on the oil industry.
In the 1950s, the city began to diversify its economy, and the manufacturing industry began to grow. The city also became a major center for the agricultural industry, and the city is now home to a large number of food processing plants.
Geography
Pampa is located in the northern part of Texas, in Gray County. The city is located in the Texas Panhandle, and is part of the Amarillo metropolitan area. The city is located at the intersection of US Highway 60 and US Highway 70. The city is located in a semi-arid climate, and the average annual precipitation is about 17 inches.
Economy
The economy of Pampa is largely based on the oil and gas industry, as well as the agricultural industry. The city is home to a number of oil refineries, and the city is also a major center for the agricultural industry. The city is also home to a number of food processing plants, and the manufacturing industry is also a major part of the economy.
Demographics
The population of Pampa was estimated to be 17,890 in 2019. The population is largely white, with about 75% of the population being white. The city also has a large Hispanic population, with about 20% of the population being Hispanic. The median household income in the city is about $41,000, and the median home value is about $90,000. The city also has a large number of people living below the poverty line, with about 20% of the population living below the poverty line.
Common Questions
What is Per Capita Income in Pampa?
Per Capita income in Pampa is $31,426.
What is the Median Family Income in Pampa?
Median Family Income in Pampa is $60,616.
What is the Median Household income in Pampa?
Median Household Income in Pampa is $52,966.
What is Income or Wage Gap in Pampa?
Income or Wage Gap in Pampa is 41.3%.
Women in Pampa earn 58.7 cents for every dollar earned by a man.
What is Inequality or Gini Index in Pampa?
Inequality or Gini Index in Pampa is 0.49.
What is the Total Population of Pampa?
Total Population of Pampa is 16,861.
What is the Total Male Population of Pampa?
Total Male Population of Pampa is 8,563.
What is the Total Female Population of Pampa?
Total Female Population of Pampa is 8,298.
What is the Ratio of Males per 100 Females in Pampa?
There are 103.19 Males per 100 Females in Pampa.
What is the Ratio of Females per 100 Males in Pampa?
There are 96.91 Females per 100 Males in Pampa.
What is the Median Population Age in Pampa?
Median Population Age in Pampa is 35.5 Years.
What is the Average Family Size in Pampa
Average Family Size in Pampa is 3.0 People.
What is the Average Household Size in Pampa
Average Household Size in Pampa is 2.4 People.
How Large is the Labor Force in Pampa?
There are 8,227 People in the Labor Forcein in Pampa.
What is the Percentage of People in the Labor Force in Pampa?
63.6% of People are in the Labor Force in Pampa.
What is the Unemployment Rate in Pampa?
Unemployment Rate in Pampa is 5.7%.