Palo Pinto, TX Map & Demographics
Palo Pinto Map
Palo Pinto Overview
$14,091
PER CAPITA INCOME
0.23
INEQUALITY / GINI INDEX
201
TOTAL POPULATION
98
MALE POPULATION
103
FEMALE POPULATION
95.15
MALES / 100 FEMALES
105.10
FEMALES / 100 MALES
28.1
MEDIAN AGE
5.7
AVG FAMILY SIZE
5.3
AVG HOUSEHOLD SIZE
50
LABOR FORCE [ PEOPLE ]
24.9%
PERCENT IN LABOR FORCE
Palo Pinto Zip Codes
Palo Pinto Area Codes
Income in Palo Pinto
Income Overview in Palo Pinto
| Characteristic | Number | Measure |
| Per Capita Income | 201 | $14,091 |
| Median Family Income | 20 | $0 |
| Mean Family Income | 20 | $72,770 |
| Median Household Income | 23 | $0 |
| Mean Household Income | 23 | $75,296 |
| Income Deficit | 20 | $0 |
| Wage / Income Gap (%) | 201 | 0.00% |
| Wage / Income Gap ($) | 201 | 100.00¢ per $1 |
| Gini / Inequality Index | 201 | 0.23 |
Earnings by Sex in Palo Pinto
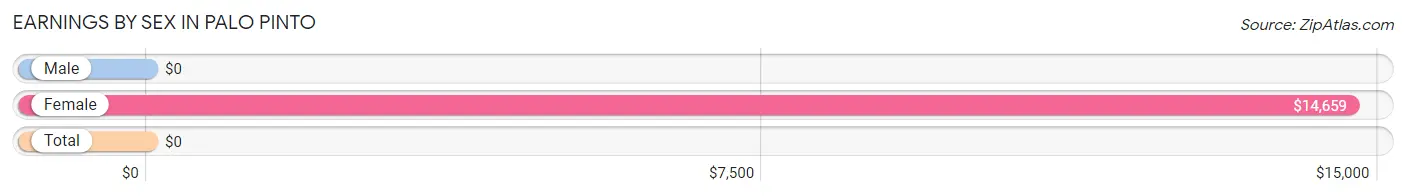
| Sex | Number | Average Earnings |
| Male | 67 (72.8%) | $0 |
| Female | 25 (27.2%) | $14,659 |
| Total | 92 (100.0%) | $0 |
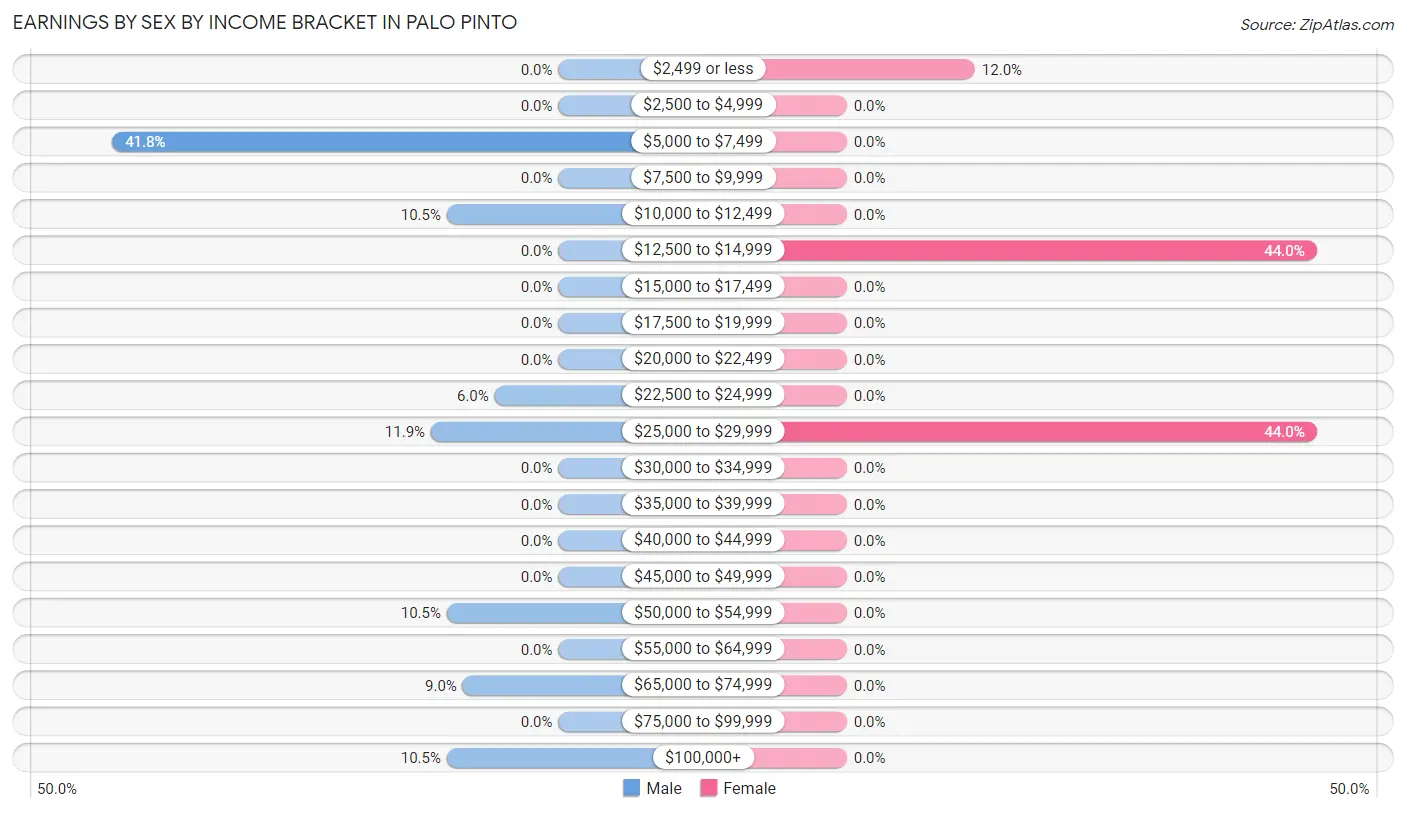
Earnings by Sex by Income Bracket in Palo Pinto
The most common earnings brackets in Palo Pinto are $5,000 to $7,499 for men (28 | 41.8%) and $12,500 to $14,999 for women (11 | 44.0%).
| Income | Male | Female |
| $2,499 or less | 0 (0.0%) | 3 (12.0%) |
| $2,500 to $4,999 | 0 (0.0%) | 0 (0.0%) |
| $5,000 to $7,499 | 28 (41.8%) | 0 (0.0%) |
| $7,500 to $9,999 | 0 (0.0%) | 0 (0.0%) |
| $10,000 to $12,499 | 7 (10.4%) | 0 (0.0%) |
| $12,500 to $14,999 | 0 (0.0%) | 11 (44.0%) |
| $15,000 to $17,499 | 0 (0.0%) | 0 (0.0%) |
| $17,500 to $19,999 | 0 (0.0%) | 0 (0.0%) |
| $20,000 to $22,499 | 0 (0.0%) | 0 (0.0%) |
| $22,500 to $24,999 | 4 (6.0%) | 0 (0.0%) |
| $25,000 to $29,999 | 8 (11.9%) | 11 (44.0%) |
| $30,000 to $34,999 | 0 (0.0%) | 0 (0.0%) |
| $35,000 to $39,999 | 0 (0.0%) | 0 (0.0%) |
| $40,000 to $44,999 | 0 (0.0%) | 0 (0.0%) |
| $45,000 to $49,999 | 0 (0.0%) | 0 (0.0%) |
| $50,000 to $54,999 | 7 (10.4%) | 0 (0.0%) |
| $55,000 to $64,999 | 0 (0.0%) | 0 (0.0%) |
| $65,000 to $74,999 | 6 (9.0%) | 0 (0.0%) |
| $75,000 to $99,999 | 0 (0.0%) | 0 (0.0%) |
| $100,000+ | 7 (10.4%) | 0 (0.0%) |
| Total | 67 (100.0%) | 25 (100.0%) |
Earnings by Sex by Educational Attainment in Palo Pinto
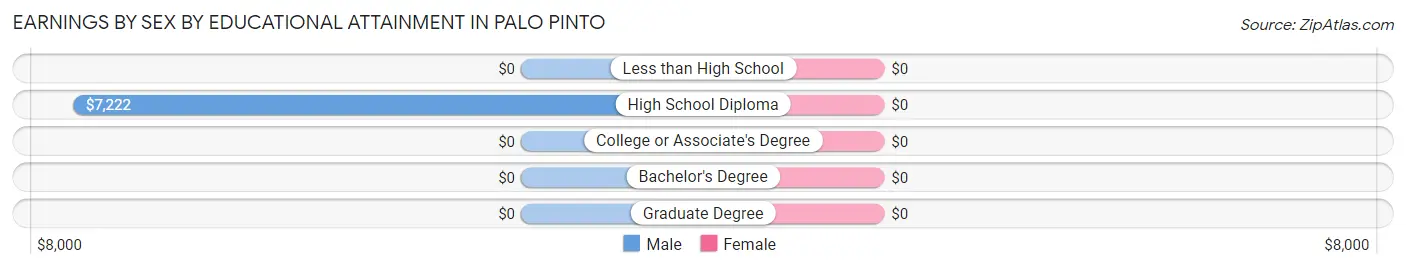
| Educational Attainment | Male Income | Female Income |
| Less than High School | - | - |
| High School Diploma | $7,222 | $0 |
| College or Associate's Degree | - | - |
| Bachelor's Degree | - | - |
| Graduate Degree | - | - |
| Total | - | - |
Family Income in Palo Pinto
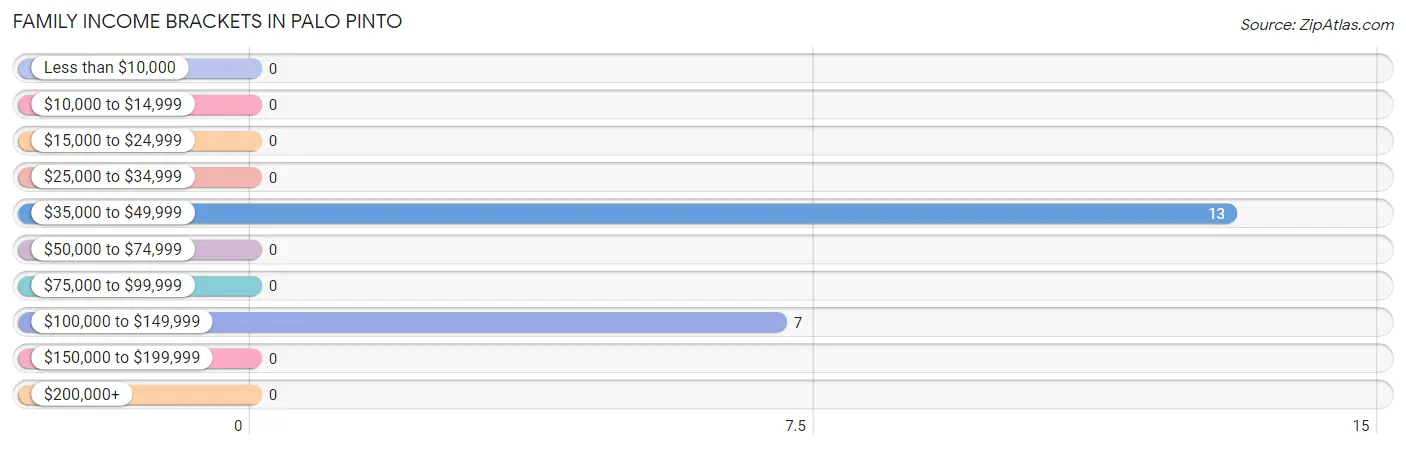
Family Income Brackets in Palo Pinto
According to the Palo Pinto family income data, there are 13 families falling into the $35,000 to $49,999 income range, which is the most common income bracket and makes up 65.0% of all families.
| Income Bracket | # Families | % Families |
| Less than $10,000 | 0 | 0.0% |
| $10,000 to $14,999 | 0 | 0.0% |
| $15,000 to $24,999 | 0 | 0.0% |
| $25,000 to $34,999 | 0 | 0.0% |
| $35,000 to $49,999 | 13 | 65.0% |
| $50,000 to $74,999 | 0 | 0.0% |
| $75,000 to $99,999 | 0 | 0.0% |
| $100,000 to $149,999 | 7 | 35.0% |
| $150,000 to $199,999 | 0 | 0.0% |
| $200,000+ | 0 | 0.0% |
Family Income by Famaliy Size in Palo Pinto
| Income Bracket | # Families | Median Income |
| 2-Person Families | 9 (45.0%) | $0 |
| 3-Person Families | 11 (55.0%) | $0 |
| 4-Person Families | 0 (0.0%) | $0 |
| 5-Person Families | 0 (0.0%) | $0 |
| 6-Person Families | 0 (0.0%) | $0 |
| 7+ Person Families | 0 (0.0%) | $0 |
| Total | 20 (100.0%) | $0 |
Family Income by Number of Earners in Palo Pinto
| Number of Earners | # Families | Median Income |
| No Earners | 0 (0.0%) | $0 |
| 1 Earner | 7 (35.0%) | $0 |
| 2 Earners | 2 (10.0%) | $0 |
| 3+ Earners | 11 (55.0%) | $0 |
| Total | 20 (100.0%) | $0 |
Household Income in Palo Pinto
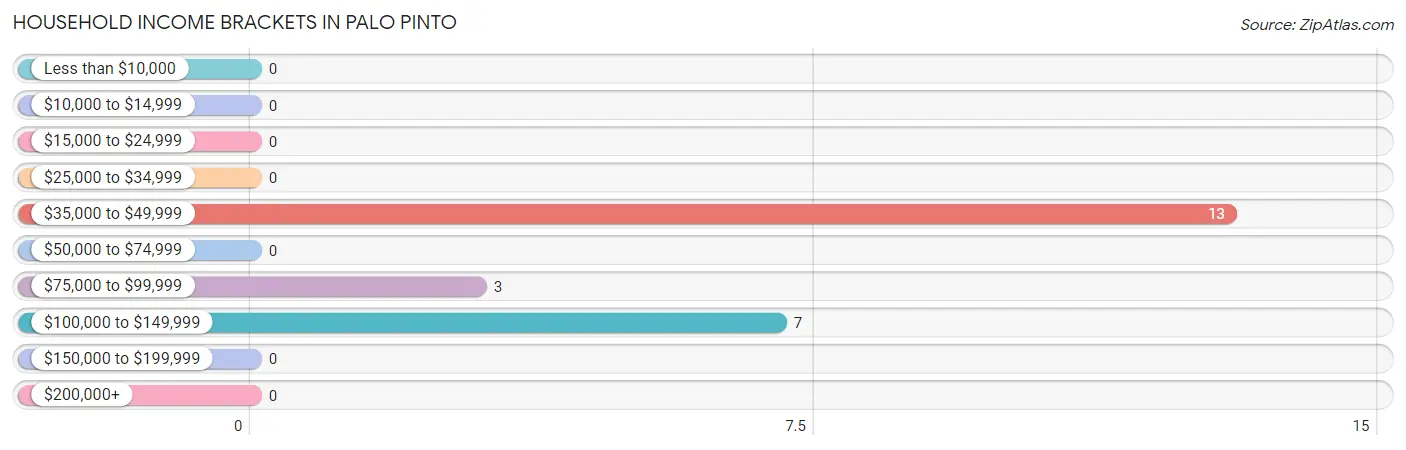
Household Income Brackets in Palo Pinto
With 13 households falling in the category, the $35,000 to $49,999 income range is the most frequent in Palo Pinto, accounting for 56.5% of all households.
| Income Bracket | # Households | % Households |
| Less than $10,000 | 0 | 0.0% |
| $10,000 to $14,999 | 0 | 0.0% |
| $15,000 to $24,999 | 0 | 0.0% |
| $25,000 to $34,999 | 0 | 0.0% |
| $35,000 to $49,999 | 13 | 56.5% |
| $50,000 to $74,999 | 0 | 0.0% |
| $75,000 to $99,999 | 3 | 13.0% |
| $100,000 to $149,999 | 7 | 30.4% |
| $150,000 to $199,999 | 0 | 0.0% |
| $200,000+ | 0 | 0.0% |
Household Income by Householder Age in Palo Pinto
| Income Bracket | # Households | Median Income |
| 15 to 24 Years | 2 (8.7%) | $0 |
| 25 to 44 Years | 11 (47.8%) | $0 |
| 45 to 64 Years | 10 (43.5%) | $0 |
| 65+ Years | 0 (0.0%) | $0 |
| Total | 23 (100.0%) | $0 |
Poverty in Palo Pinto
Income Below Poverty by Sex and Age in Palo Pinto
| Age Bracket | Male | Female |
| Under 5 Years | 0 (0.0%) | 0 (0.0%) |
| 5 Years | 0 (0.0%) | 0 (0.0%) |
| 6 to 11 Years | 0 (0.0%) | 0 (0.0%) |
| 12 to 14 Years | 0 (0.0%) | 0 (0.0%) |
| 15 Years | 0 (0.0%) | 0 (0.0%) |
| 16 and 17 Years | 0 (0.0%) | 0 (0.0%) |
| 18 to 24 Years | 0 (0.0%) | 0 (0.0%) |
| 25 to 34 Years | 0 (0.0%) | 0 (0.0%) |
| 35 to 44 Years | 0 (0.0%) | 0 (0.0%) |
| 45 to 54 Years | 0 (0.0%) | 0 (0.0%) |
| 55 to 64 Years | 0 (0.0%) | 0 (0.0%) |
| 65 to 74 Years | 0 (0.0%) | 0 (0.0%) |
| 75 Years and over | 0 (0.0%) | 0 (0.0%) |
| Total | 0 (0.0%) | 0 (0.0%) |
Income Above Poverty by Sex and Age in Palo Pinto
According to the poverty statistics in Palo Pinto, males aged 18 to 24 years and females aged 16 and 17 years are the age groups that are most secure financially, with 100.0% of males and 100.0% of females in these age groups living above the poverty line.
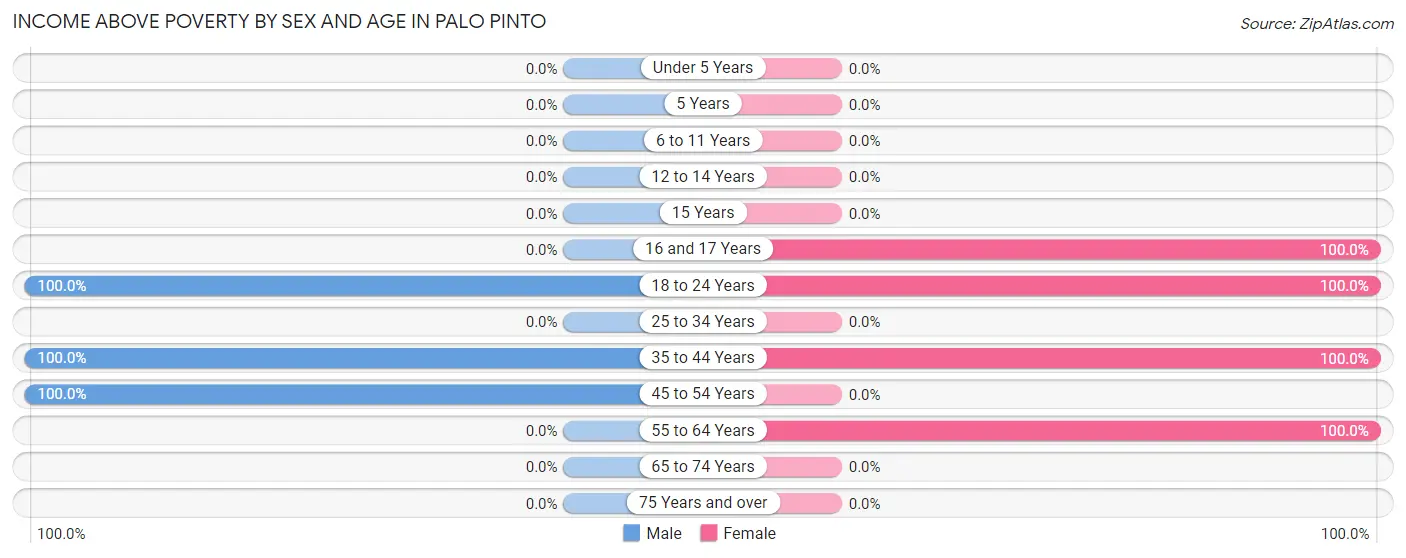
| Age Bracket | Male | Female |
| Under 5 Years | 0 (0.0%) | 0 (0.0%) |
| 5 Years | 0 (0.0%) | 0 (0.0%) |
| 6 to 11 Years | 0 (0.0%) | 0 (0.0%) |
| 12 to 14 Years | 0 (0.0%) | 0 (0.0%) |
| 15 Years | 0 (0.0%) | 0 (0.0%) |
| 16 and 17 Years | 0 (0.0%) | 70 (100.0%) |
| 18 to 24 Years | 4 (100.0%) | 11 (100.0%) |
| 25 to 34 Years | 0 (0.0%) | 0 (0.0%) |
| 35 to 44 Years | 11 (100.0%) | 11 (100.0%) |
| 45 to 54 Years | 13 (100.0%) | 0 (0.0%) |
| 55 to 64 Years | 0 (0.0%) | 3 (100.0%) |
| 65 to 74 Years | 0 (0.0%) | 0 (0.0%) |
| 75 Years and over | 0 (0.0%) | 0 (0.0%) |
| Total | 28 (100.0%) | 95 (100.0%) |
Income Below Poverty Among Married-Couple Families in Palo Pinto
| Children | Above Poverty | Below Poverty |
| No Children | 13 (100.0%) | 0 (0.0%) |
| 1 or 2 Children | 0 (0.0%) | 0 (0.0%) |
| 3 or 4 Children | 0 (0.0%) | 0 (0.0%) |
| 5 or more Children | 0 (0.0%) | 0 (0.0%) |
| Total | 13 (100.0%) | 0 (0.0%) |
Income Below Poverty Among Single-Parent Households in Palo Pinto
| Children | Single Father | Single Mother |
| No Children | 0 (0.0%) | 0 (0.0%) |
| 1 or 2 Children | 0 (0.0%) | 0 (0.0%) |
| 3 or 4 Children | 0 (0.0%) | 0 (0.0%) |
| 5 or more Children | 0 (0.0%) | 0 (0.0%) |
| Total | 0 (0.0%) | 0 (0.0%) |
Income Below Poverty Among Married-Couple vs Single-Parent Households in Palo Pinto
| Children | Married-Couple Families | Single-Parent Households |
| No Children | 0 (0.0%) | 0 (0.0%) |
| 1 or 2 Children | 0 (0.0%) | 0 (0.0%) |
| 3 or 4 Children | 0 (0.0%) | 0 (0.0%) |
| 5 or more Children | 0 (0.0%) | 0 (0.0%) |
| Total | 0 (0.0%) | 0 (0.0%) |
Race in Palo Pinto
The most populous races in Palo Pinto are White / Caucasian (140 | 69.7%), Hispanic or Latino (101 | 50.2%), and Two or more Races (38 | 18.9%).
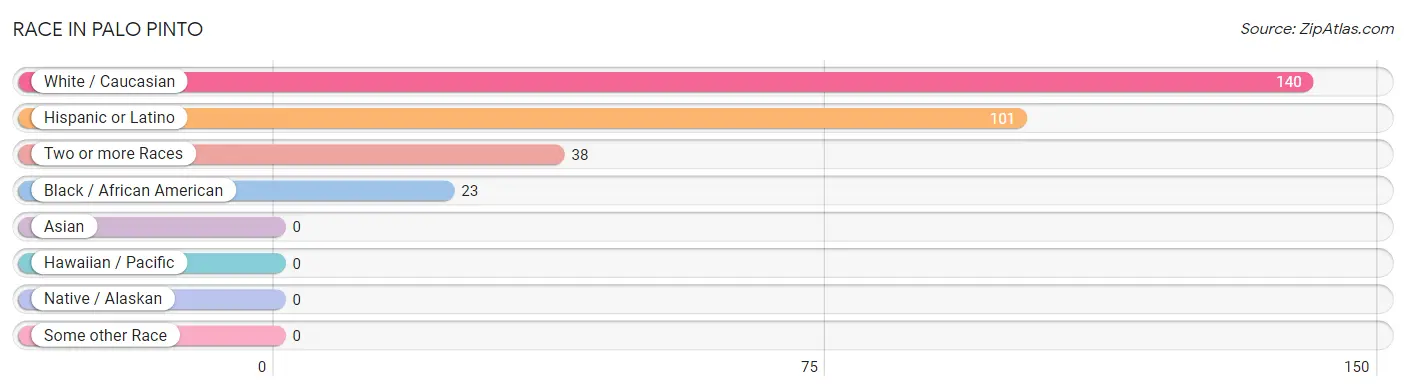
| Race | # Population | % Population |
| Asian | 0 | 0.0% |
| Black / African American | 23 | 11.4% |
| Hawaiian / Pacific | 0 | 0.0% |
| Hispanic or Latino | 101 | 50.2% |
| Native / Alaskan | 0 | 0.0% |
| White / Caucasian | 140 | 69.7% |
| Two or more Races | 38 | 18.9% |
| Some other Race | 0 | 0.0% |
| Total | 201 | 100.0% |
Ancestry in Palo Pinto
The most populous ancestries reported in Palo Pinto are German (77 | 38.3%), Spaniard (70 | 34.8%), Mexican (31 | 15.4%), Irish (10 | 5.0%), and American (9 | 4.5%), together accounting for 98.0% of all Palo Pinto residents.
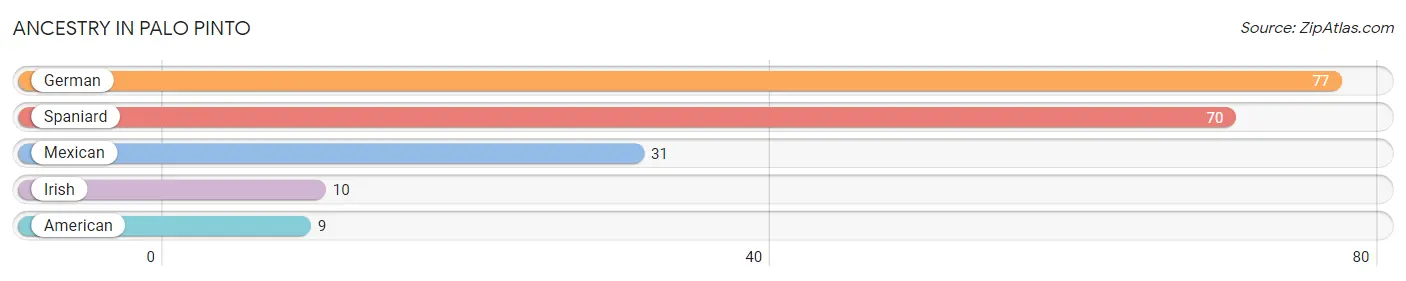
| Ancestry | # Population | % Population |
| American | 9 | 4.5% |
| German | 77 | 38.3% |
| Irish | 10 | 5.0% |
| Mexican | 31 | 15.4% |
| Spaniard | 70 | 34.8% | View All 5 Rows |
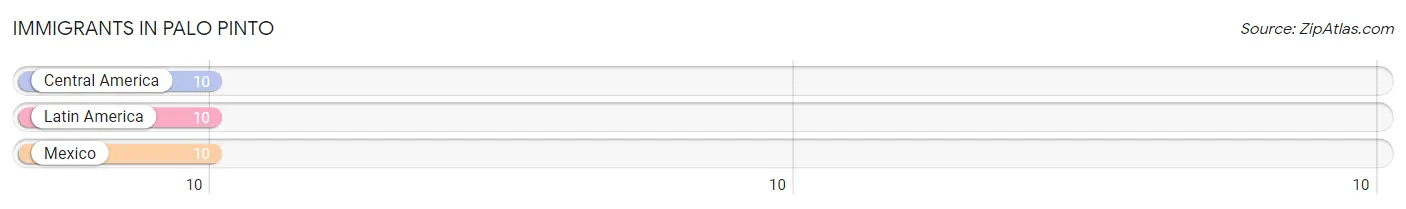
Immigrants in Palo Pinto
The most numerous immigrant groups reported in Palo Pinto came from Central America (10 | 5.0%), Latin America (10 | 5.0%), and Mexico (10 | 5.0%), together accounting for 14.9% of all Palo Pinto residents.
| Immigration Origin | # Population | % Population |
| Central America | 10 | 5.0% |
| Latin America | 10 | 5.0% |
| Mexico | 10 | 5.0% | View All 3 Rows |
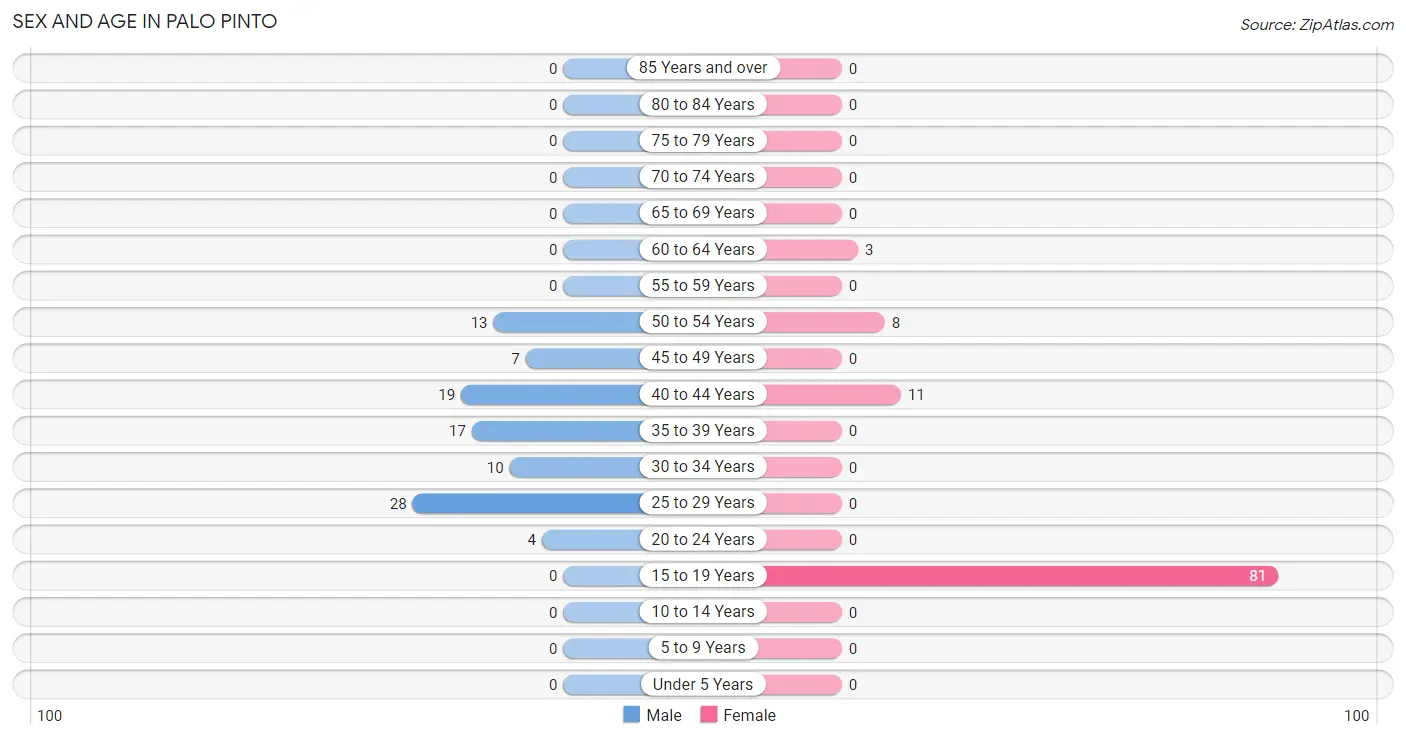
Sex and Age in Palo Pinto
Sex and Age in Palo Pinto
The most populous age groups in Palo Pinto are 25 to 29 Years (28 | 28.6%) for men and 15 to 19 Years (81 | 78.6%) for women.
| Age Bracket | Male | Female |
| Under 5 Years | 0 (0.0%) | 0 (0.0%) |
| 5 to 9 Years | 0 (0.0%) | 0 (0.0%) |
| 10 to 14 Years | 0 (0.0%) | 0 (0.0%) |
| 15 to 19 Years | 0 (0.0%) | 81 (78.6%) |
| 20 to 24 Years | 4 (4.1%) | 0 (0.0%) |
| 25 to 29 Years | 28 (28.6%) | 0 (0.0%) |
| 30 to 34 Years | 10 (10.2%) | 0 (0.0%) |
| 35 to 39 Years | 17 (17.3%) | 0 (0.0%) |
| 40 to 44 Years | 19 (19.4%) | 11 (10.7%) |
| 45 to 49 Years | 7 (7.1%) | 0 (0.0%) |
| 50 to 54 Years | 13 (13.3%) | 8 (7.8%) |
| 55 to 59 Years | 0 (0.0%) | 0 (0.0%) |
| 60 to 64 Years | 0 (0.0%) | 3 (2.9%) |
| 65 to 69 Years | 0 (0.0%) | 0 (0.0%) |
| 70 to 74 Years | 0 (0.0%) | 0 (0.0%) |
| 75 to 79 Years | 0 (0.0%) | 0 (0.0%) |
| 80 to 84 Years | 0 (0.0%) | 0 (0.0%) |
| 85 Years and over | 0 (0.0%) | 0 (0.0%) |
| Total | 98 (100.0%) | 103 (100.0%) |
Families and Households in Palo Pinto
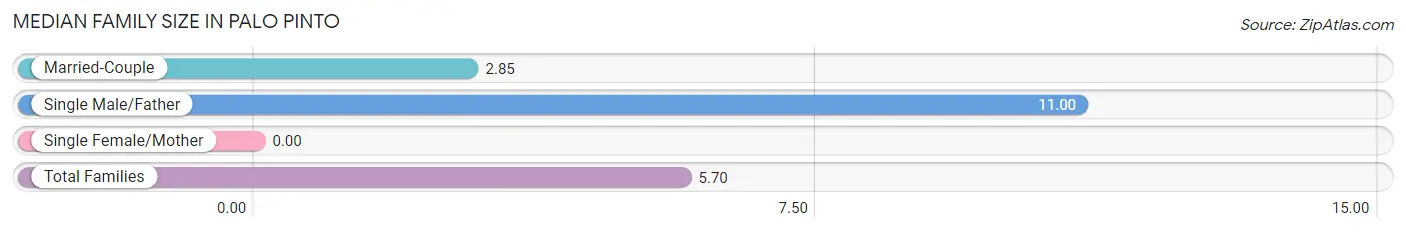
Median Family Size in Palo Pinto
| Family Type | # Families | Family Size |
| Married-Couple | 13 (65.0%) | 2.85 |
| Single Male/Father | 7 (35.0%) | 11.00 |
| Single Female/Mother | 0 (0.0%) | - |
| Total Families | 20 (100.0%) | 5.70 |
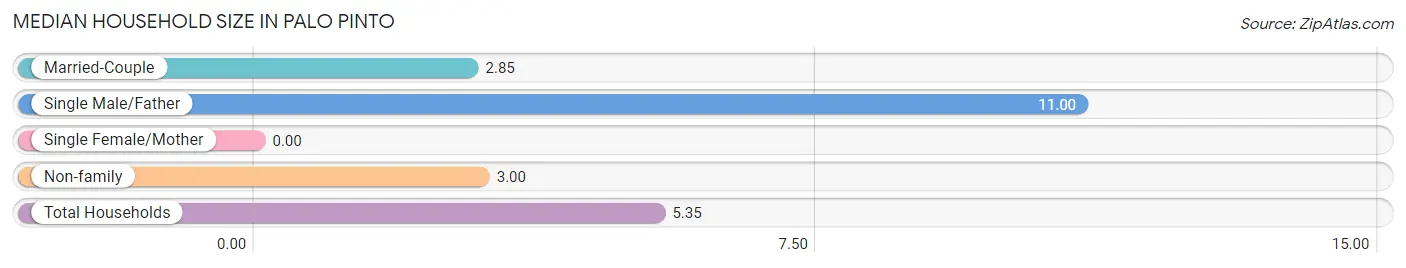
Median Household Size in Palo Pinto
| Household Type | # Households | Household Size |
| Married-Couple | 13 (56.5%) | 2.85 |
| Single Male/Father | 7 (30.4%) | 11.00 |
| Single Female/Mother | 0 (0.0%) | - |
| Non-family | 3 (13.0%) | 3.00 |
| Total Households | 23 (100.0%) | 5.35 |
Household Size by Marriage Status in Palo Pinto
Out of a total of 23 households in Palo Pinto, 20 (87.0%) are family households, while 3 (13.0%) are nonfamily households. The most numerous type of family households are 3-person households, comprising 11, and the most common type of nonfamily households are 2-person households, comprising 3.
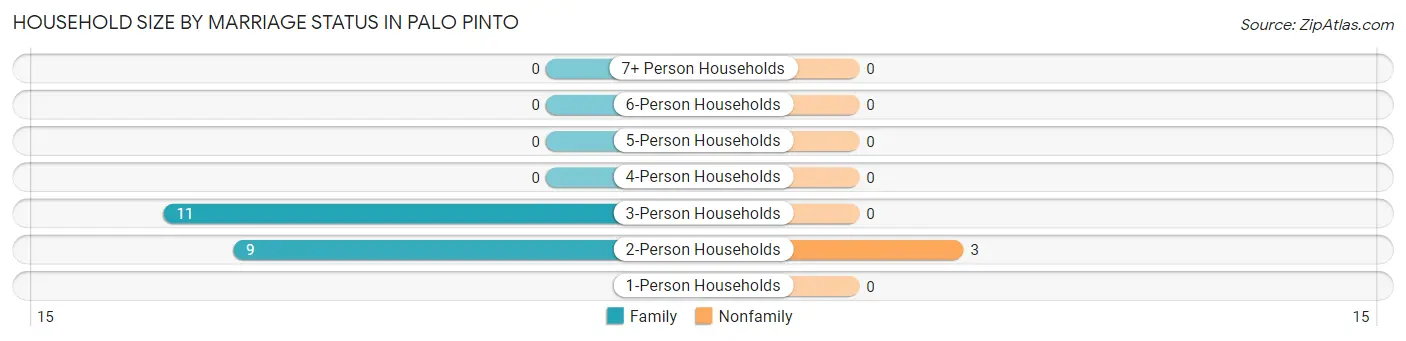
| Household Size | Family Households | Nonfamily Households |
| 1-Person Households | - | 0 (0.0%) |
| 2-Person Households | 9 (39.1%) | 3 (13.0%) |
| 3-Person Households | 11 (47.8%) | 0 (0.0%) |
| 4-Person Households | 0 (0.0%) | 0 (0.0%) |
| 5-Person Households | 0 (0.0%) | 0 (0.0%) |
| 6-Person Households | 0 (0.0%) | 0 (0.0%) |
| 7+ Person Households | 0 (0.0%) | 0 (0.0%) |
| Total | 20 (87.0%) | 3 (13.0%) |
Female Fertility in Palo Pinto
Fertility by Age in Palo Pinto
| Age Bracket | Women with Births | Births / 1,000 Women |
| 15 to 19 years | 0 (0.0%) | 0.0 |
| 20 to 34 years | 0 (0.0%) | 0.0 |
| 35 to 50 years | 0 (0.0%) | 0.0 |
| Total | 0 (0.0%) | 0.0 |
Fertility by Age by Marriage Status in Palo Pinto
| Age Bracket | Married | Unmarried |
| 15 to 19 years | 0 (0.0%) | 0 (0.0%) |
| 20 to 34 years | 0 (0.0%) | 0 (0.0%) |
| 35 to 50 years | 0 (0.0%) | 0 (0.0%) |
| Total | 0 (0.0%) | 0 (0.0%) |
Fertility by Education in Palo Pinto
| Educational Attainment | Women with Births | Births / 1,000 Women |
| Less than High School | 0 (0.0%) | 0.0 |
| High School Diploma | 0 (0.0%) | 0.0 |
| College or Associate's Degree | 0 (0.0%) | 0.0 |
| Bachelor's Degree | 0 (0.0%) | 0.0 |
| Graduate Degree | 0 (0.0%) | 0.0 |
| Total | 0 (0.0%) | 0.0 |
Fertility by Education by Marriage Status in Palo Pinto
| Educational Attainment | Married | Unmarried |
| Less than High School | 0 (0.0%) | 0 (0.0%) |
| High School Diploma | 0 (0.0%) | 0 (0.0%) |
| College or Associate's Degree | 0 (0.0%) | 0 (0.0%) |
| Bachelor's Degree | 0 (0.0%) | 0 (0.0%) |
| Graduate Degree | 0 (0.0%) | 0 (0.0%) |
| Total | 0 (0.0%) | 0 (0.0%) |
Employment Characteristics in Palo Pinto
Employment by Class of Employer in Palo Pinto
Among the 50 employed individuals in Palo Pinto, private company employees (37 | 74.0%), not-for-profit organizations (7 | 14.0%), and state government employees (6 | 12.0%) make up the most common classes of employment.
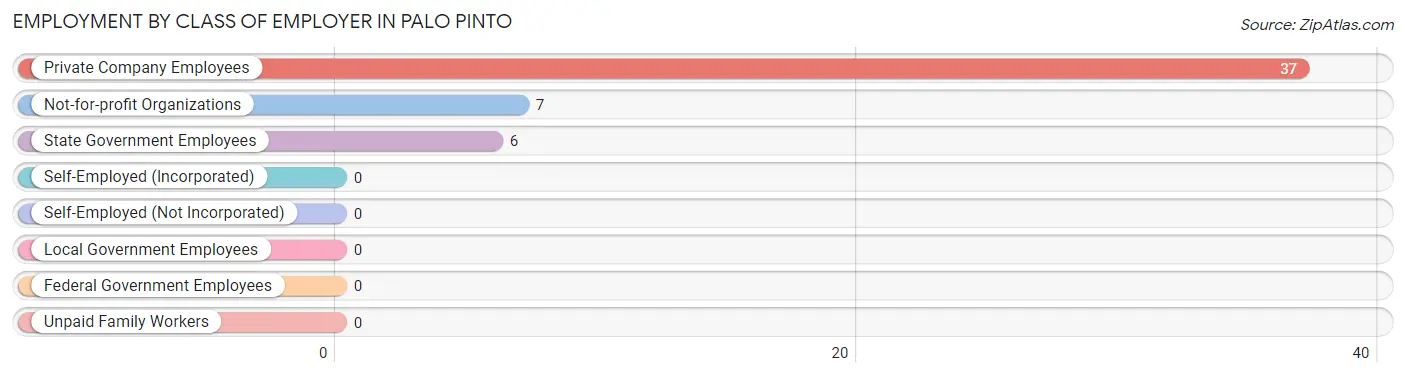
| Employer Class | # Employees | % Employees |
| Private Company Employees | 37 | 74.0% |
| Self-Employed (Incorporated) | 0 | 0.0% |
| Self-Employed (Not Incorporated) | 0 | 0.0% |
| Not-for-profit Organizations | 7 | 14.0% |
| Local Government Employees | 0 | 0.0% |
| State Government Employees | 6 | 12.0% |
| Federal Government Employees | 0 | 0.0% |
| Unpaid Family Workers | 0 | 0.0% |
| Total | 50 | 100.0% |
Employment Status by Age in Palo Pinto
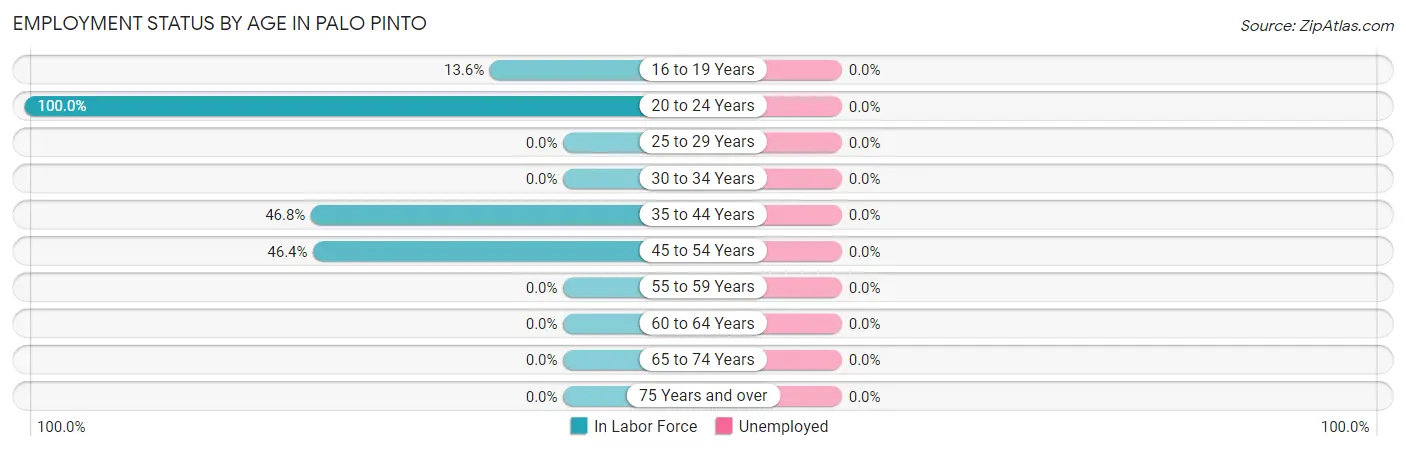
| Age Bracket | In Labor Force | Unemployed |
| 16 to 19 Years | 11 (13.6%) | 0 (0.0%) |
| 20 to 24 Years | 4 (100.0%) | 0 (0.0%) |
| 25 to 29 Years | 0 (0.0%) | 0 (0.0%) |
| 30 to 34 Years | 0 (0.0%) | 0 (0.0%) |
| 35 to 44 Years | 22 (46.8%) | 0 (0.0%) |
| 45 to 54 Years | 13 (46.4%) | 0 (0.0%) |
| 55 to 59 Years | 0 (0.0%) | 0 (0.0%) |
| 60 to 64 Years | 0 (0.0%) | 0 (0.0%) |
| 65 to 74 Years | 0 (0.0%) | 0 (0.0%) |
| 75 Years and over | 0 (0.0%) | 0 (0.0%) |
| Total | 50 (24.9%) | 0 (0.0%) |
Employment Status by Educational Attainment in Palo Pinto
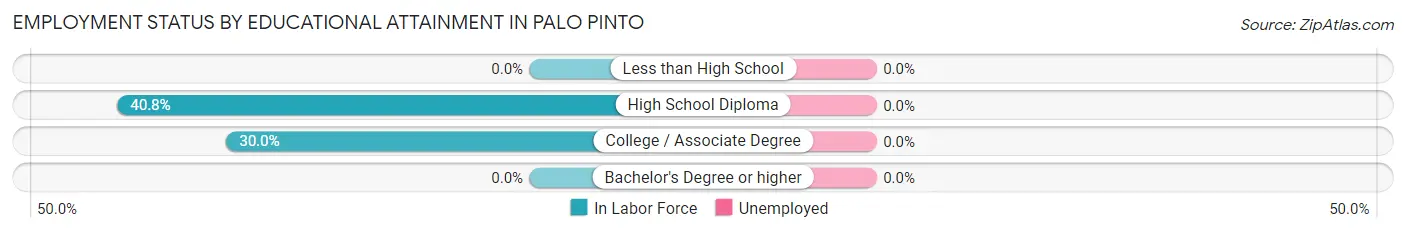
| Educational Attainment | In Labor Force | Unemployed |
| Less than High School | 0 (0.0%) | 0 (0.0%) |
| High School Diploma | 29 (40.8%) | 0 (0.0%) |
| College / Associate Degree | 6 (30.0%) | 0 (0.0%) |
| Bachelor's Degree or higher | 0 (0.0%) | 0 (0.0%) |
| Total | 35 (30.2%) | 0 (0.0%) |
Employment Occupations by Sex in Palo Pinto
Management, Business, Science and Arts Occupations
Management, Business, Science and Arts Occupations by Sex
| Occupation | Male | Female |
| Management | 0 (0.0%) | 0 (0.0%) |
| Business & Financial | 0 (0.0%) | 0 (0.0%) |
| Computers, Engineering & Science | 0 (0.0%) | 0 (0.0%) |
| Computers & Mathematics | 0 (0.0%) | 0 (0.0%) |
| Architecture & Engineering | 0 (0.0%) | 0 (0.0%) |
| Life, Physical & Social Science | 0 (0.0%) | 0 (0.0%) |
| Community & Social Service | 0 (0.0%) | 0 (0.0%) |
| Education, Arts & Media | 0 (0.0%) | 0 (0.0%) |
| Legal Services & Support | 0 (0.0%) | 0 (0.0%) |
| Education Instruction & Library | 0 (0.0%) | 0 (0.0%) |
| Arts, Media & Entertainment | 0 (0.0%) | 0 (0.0%) |
| Health Diagnosing & Treating | 0 (0.0%) | 0 (0.0%) |
| Health Technologists | 0 (0.0%) | 0 (0.0%) |
| Total (Category) | 0 (0.0%) | 0 (0.0%) |
| Total (Overall) | 28 (56.0%) | 22 (44.0%) |
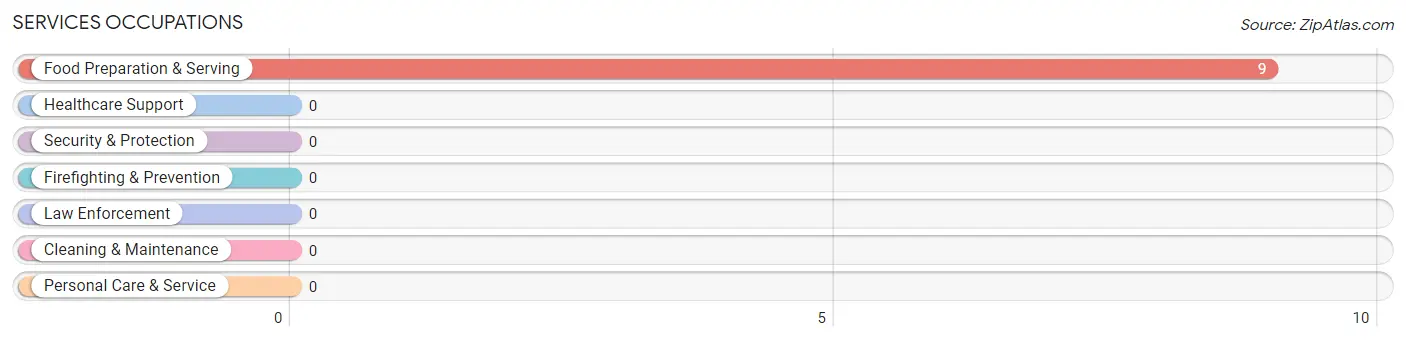
Services Occupations
The most common Services occupations in Palo Pinto are , and Food Preparation & Serving (9 | 18.0%).
Services Occupations by Sex
| Occupation | Male | Female |
| Healthcare Support | 0 (0.0%) | 0 (0.0%) |
| Security & Protection | 0 (0.0%) | 0 (0.0%) |
| Firefighting & Prevention | 0 (0.0%) | 0 (0.0%) |
| Law Enforcement | 0 (0.0%) | 0 (0.0%) |
| Food Preparation & Serving | 0 (0.0%) | 9 (100.0%) |
| Cleaning & Maintenance | 0 (0.0%) | 0 (0.0%) |
| Personal Care & Service | 0 (0.0%) | 0 (0.0%) |
| Total (Category) | 0 (0.0%) | 9 (100.0%) |
| Total (Overall) | 28 (56.0%) | 22 (44.0%) |
Sales and Office Occupations
The most common Sales and Office occupations in Palo Pinto are , and Sales & Related (22 | 44.0%).
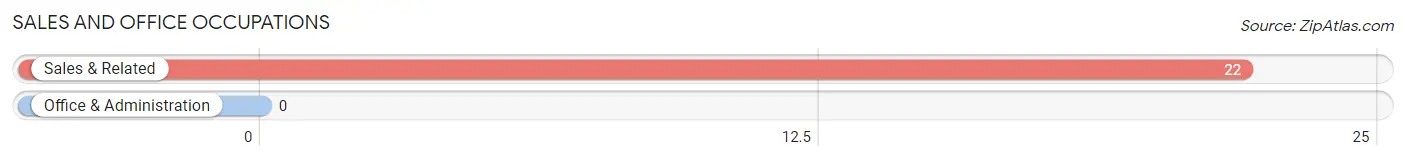
Sales and Office Occupations by Sex

| Occupation | Male | Female |
| Sales & Related | 11 (50.0%) | 11 (50.0%) |
| Office & Administration | 0 (0.0%) | 0 (0.0%) |
| Total (Category) | 11 (50.0%) | 11 (50.0%) |
| Total (Overall) | 28 (56.0%) | 22 (44.0%) |
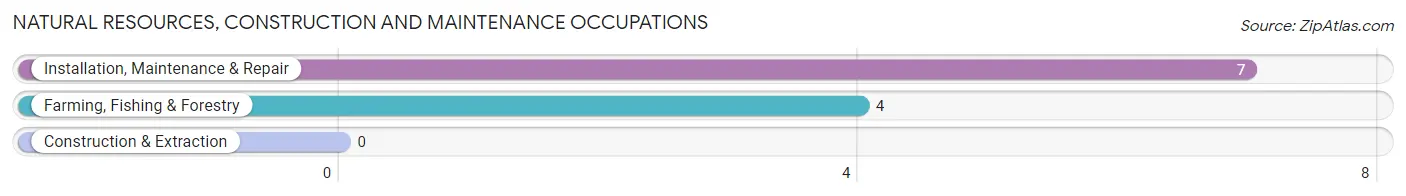
Natural Resources, Construction and Maintenance Occupations
The most common Natural Resources, Construction and Maintenance occupations in Palo Pinto are Installation, Maintenance & Repair (7 | 14.0%), and Farming, Fishing & Forestry (4 | 8.0%).
Natural Resources, Construction and Maintenance Occupations by Sex
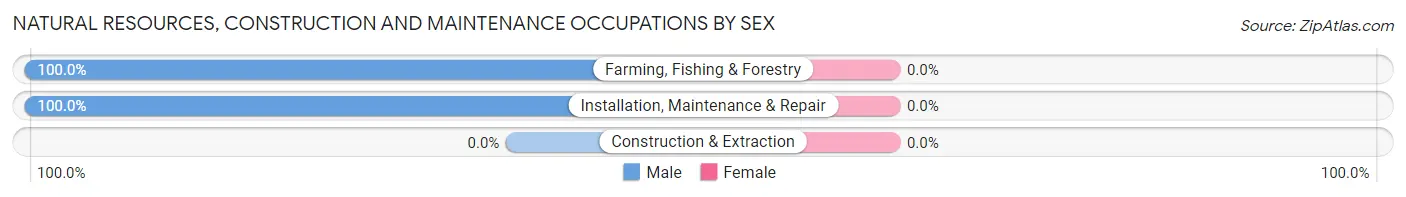
| Occupation | Male | Female |
| Farming, Fishing & Forestry | 4 (100.0%) | 0 (0.0%) |
| Construction & Extraction | 0 (0.0%) | 0 (0.0%) |
| Installation, Maintenance & Repair | 7 (100.0%) | 0 (0.0%) |
| Total (Category) | 11 (100.0%) | 0 (0.0%) |
| Total (Overall) | 28 (56.0%) | 22 (44.0%) |
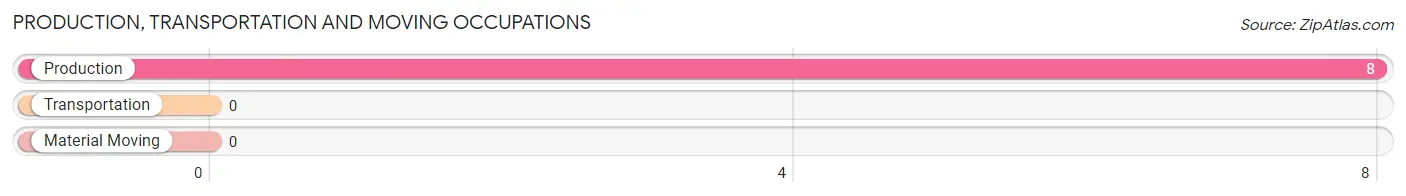
Production, Transportation and Moving Occupations
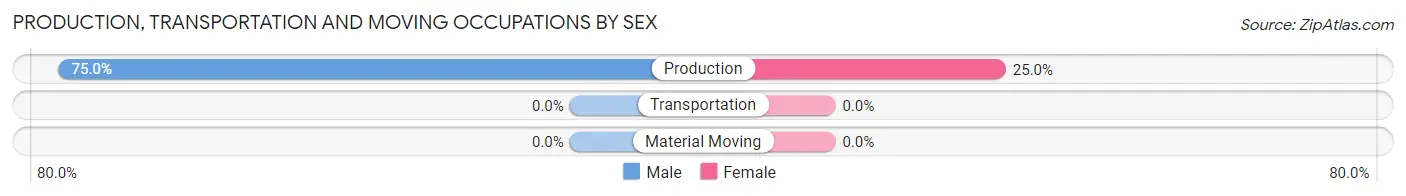
The most common Production, Transportation and Moving occupations in Palo Pinto are , and Production (8 | 16.0%).
Production, Transportation and Moving Occupations by Sex
| Occupation | Male | Female |
| Production | 6 (75.0%) | 2 (25.0%) |
| Transportation | 0 (0.0%) | 0 (0.0%) |
| Material Moving | 0 (0.0%) | 0 (0.0%) |
| Total (Category) | 6 (75.0%) | 2 (25.0%) |
| Total (Overall) | 28 (56.0%) | 22 (44.0%) |
Employment Industries by Sex in Palo Pinto
Employment Industries in Palo Pinto
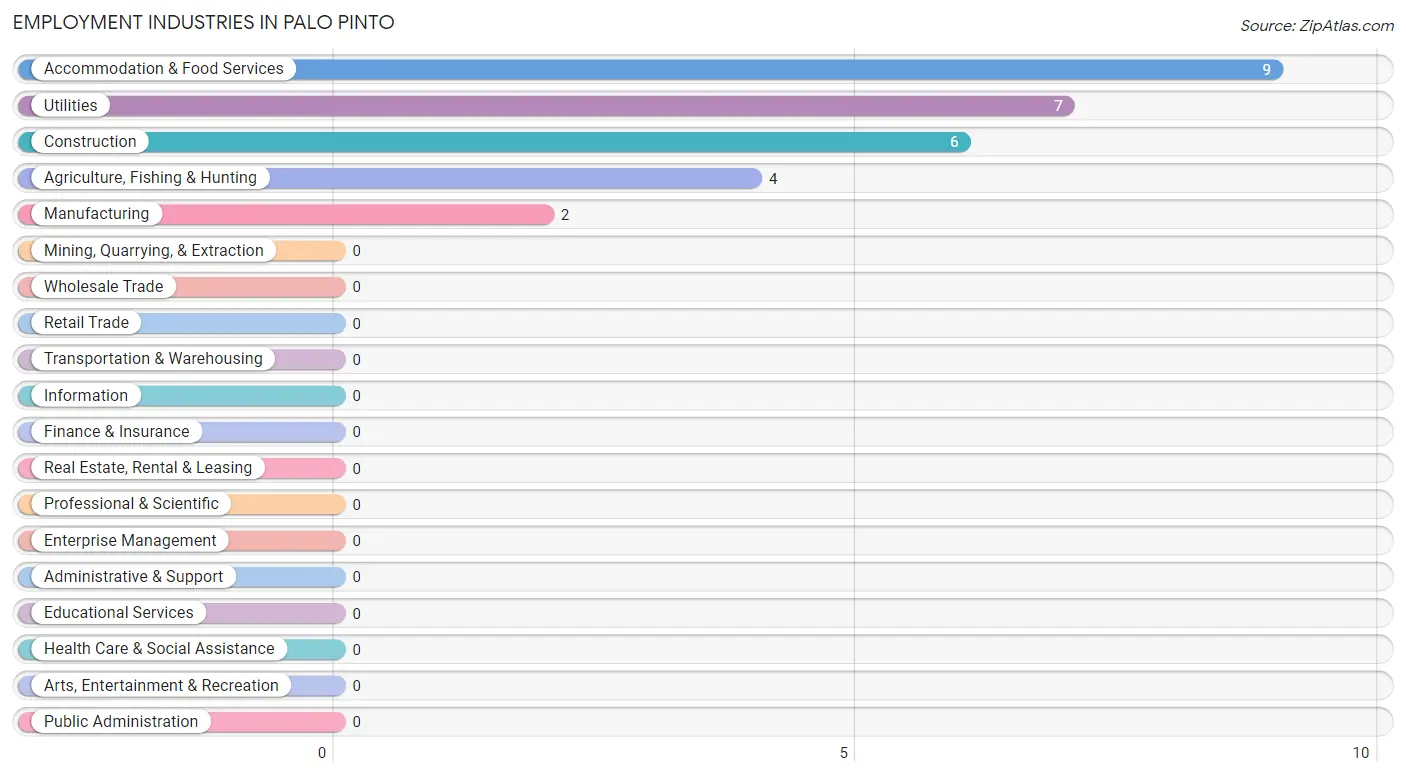
The major employment industries in Palo Pinto include Accommodation & Food Services (9 | 18.0%), Utilities (7 | 14.0%), Construction (6 | 12.0%), Agriculture, Fishing & Hunting (4 | 8.0%), and Manufacturing (2 | 4.0%).
Employment Industries by Sex in Palo Pinto
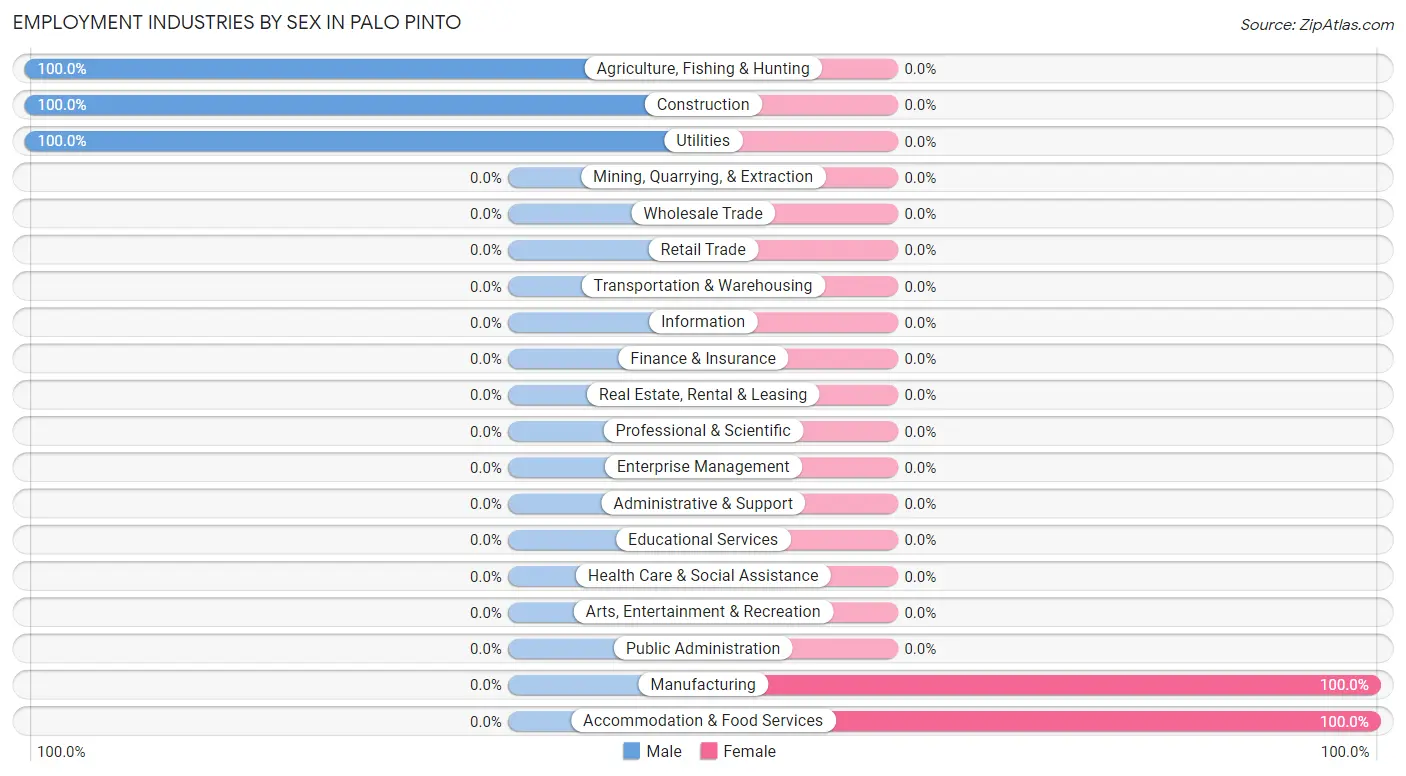
The Palo Pinto industries that see more men than women are Agriculture, Fishing & Hunting (100.0%), Construction (100.0%), and Utilities (100.0%), whereas the industries that tend to have a higher number of women are Manufacturing (100.0%), and Accommodation & Food Services (100.0%).
| Industry | Male | Female |
| Agriculture, Fishing & Hunting | 4 (100.0%) | 0 (0.0%) |
| Mining, Quarrying, & Extraction | 0 (0.0%) | 0 (0.0%) |
| Construction | 6 (100.0%) | 0 (0.0%) |
| Manufacturing | 0 (0.0%) | 2 (100.0%) |
| Wholesale Trade | 0 (0.0%) | 0 (0.0%) |
| Retail Trade | 0 (0.0%) | 0 (0.0%) |
| Transportation & Warehousing | 0 (0.0%) | 0 (0.0%) |
| Utilities | 7 (100.0%) | 0 (0.0%) |
| Information | 0 (0.0%) | 0 (0.0%) |
| Finance & Insurance | 0 (0.0%) | 0 (0.0%) |
| Real Estate, Rental & Leasing | 0 (0.0%) | 0 (0.0%) |
| Professional & Scientific | 0 (0.0%) | 0 (0.0%) |
| Enterprise Management | 0 (0.0%) | 0 (0.0%) |
| Administrative & Support | 0 (0.0%) | 0 (0.0%) |
| Educational Services | 0 (0.0%) | 0 (0.0%) |
| Health Care & Social Assistance | 0 (0.0%) | 0 (0.0%) |
| Arts, Entertainment & Recreation | 0 (0.0%) | 0 (0.0%) |
| Accommodation & Food Services | 0 (0.0%) | 9 (100.0%) |
| Public Administration | 0 (0.0%) | 0 (0.0%) |
| Total | 28 (56.0%) | 22 (44.0%) |
Education in Palo Pinto
School Enrollment in Palo Pinto
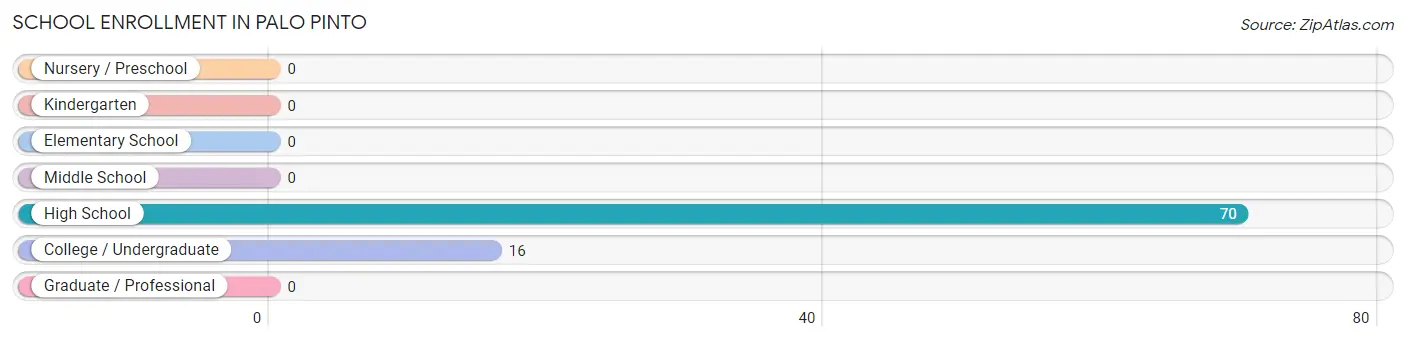
The most common levels of schooling among the 86 students in Palo Pinto are high school (70 | 81.4%), and college / undergraduate (16 | 18.6%).
| School Level | # Students | % Students |
| Nursery / Preschool | 0 | 0.0% |
| Kindergarten | 0 | 0.0% |
| Elementary School | 0 | 0.0% |
| Middle School | 0 | 0.0% |
| High School | 70 | 81.4% |
| College / Undergraduate | 16 | 18.6% |
| Graduate / Professional | 0 | 0.0% |
| Total | 86 | 100.0% |
School Enrollment by Age by Funding Source in Palo Pinto
Out of a total of 86 students who are enrolled in schools in Palo Pinto, 7 (8.1%) attend a private institution, while the remaining 79 (91.9%) are enrolled in public schools. The age group of 35 years and over has the highest likelihood of being enrolled in private schools, with 7 (100.0% in the age bracket) enrolled. Conversely, the age group of 15 to 17 year olds has the lowest likelihood of being enrolled in a private school, with 70 (100.0% in the age bracket) attending a public institution.
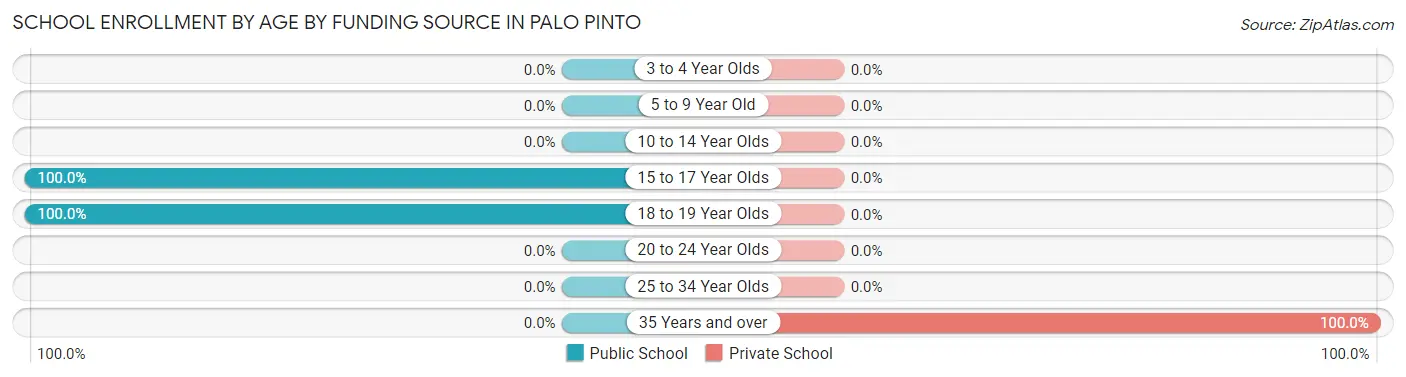
| Age Bracket | Public School | Private School |
| 3 to 4 Year Olds | 0 (0.0%) | 0 (0.0%) |
| 5 to 9 Year Old | 0 (0.0%) | 0 (0.0%) |
| 10 to 14 Year Olds | 0 (0.0%) | 0 (0.0%) |
| 15 to 17 Year Olds | 70 (100.0%) | 0 (0.0%) |
| 18 to 19 Year Olds | 9 (100.0%) | 0 (0.0%) |
| 20 to 24 Year Olds | 0 (0.0%) | 0 (0.0%) |
| 25 to 34 Year Olds | 0 (0.0%) | 0 (0.0%) |
| 35 Years and over | 0 (0.0%) | 7 (100.0%) |
| Total | 79 (91.9%) | 7 (8.1%) |
Educational Attainment by Field of Study in Palo Pinto
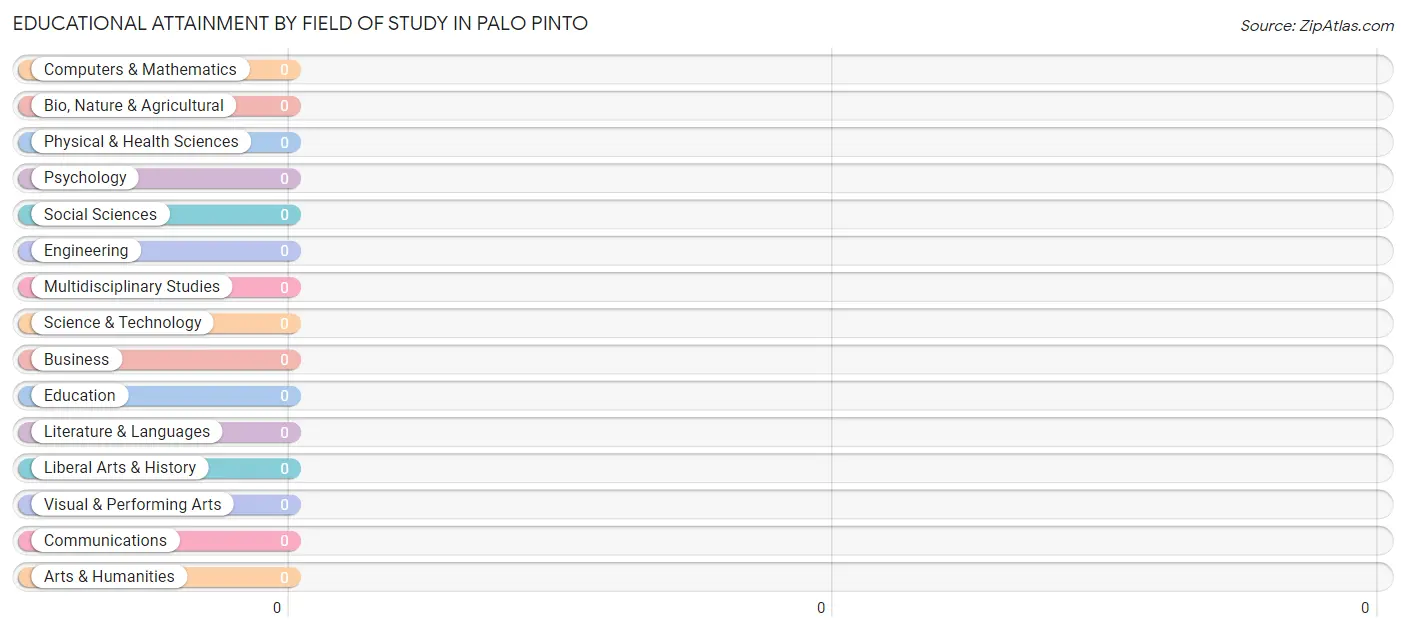
| Field of Study | # Graduates | % Graduates |
| Computers & Mathematics | 0 | 0.0% |
| Bio, Nature & Agricultural | 0 | 0.0% |
| Physical & Health Sciences | 0 | 0.0% |
| Psychology | 0 | 0.0% |
| Social Sciences | 0 | 0.0% |
| Engineering | 0 | 0.0% |
| Multidisciplinary Studies | 0 | 0.0% |
| Science & Technology | 0 | 0.0% |
| Business | 0 | 0.0% |
| Education | 0 | 0.0% |
| Literature & Languages | 0 | 0.0% |
| Liberal Arts & History | 0 | 0.0% |
| Visual & Performing Arts | 0 | 0.0% |
| Communications | 0 | 0.0% |
| Arts & Humanities | 0 | 0.0% |
| Total | 0 | 0.0% |
Transportation & Commute in Palo Pinto
Vehicle Availability by Sex in Palo Pinto
The most prevalent vehicle ownership categories in Palo Pinto are males with 3 vehicles (13, accounting for 46.4%) and females with 3 vehicles (0, making up 59.1%).
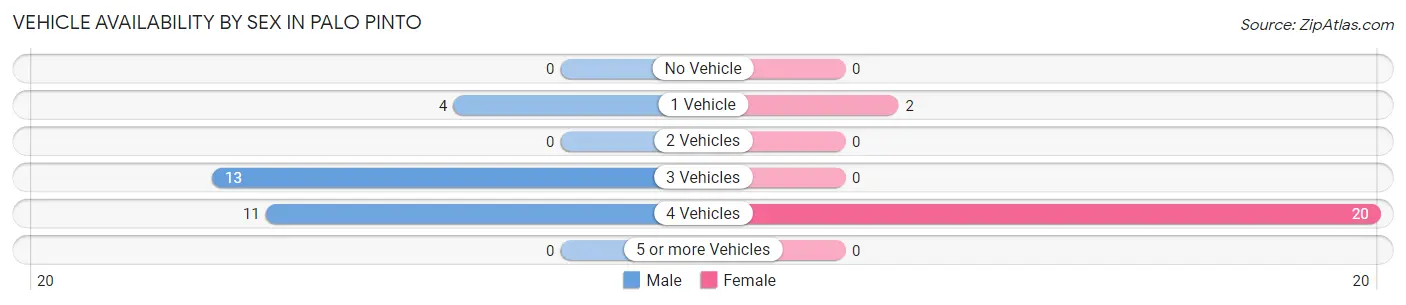
| Vehicles Available | Male | Female |
| No Vehicle | 0 (0.0%) | 0 (0.0%) |
| 1 Vehicle | 4 (14.3%) | 2 (9.1%) |
| 2 Vehicles | 0 (0.0%) | 0 (0.0%) |
| 3 Vehicles | 13 (46.4%) | 0 (0.0%) |
| 4 Vehicles | 11 (39.3%) | 20 (90.9%) |
| 5 or more Vehicles | 0 (0.0%) | 0 (0.0%) |
| Total | 28 (100.0%) | 22 (100.0%) |
Commute Time in Palo Pinto
The most frequently occuring commute durations in Palo Pinto are 20 to 24 minutes (17 commuters, 34.0%), 45 to 59 minutes (11 commuters, 22.0%), and 5 to 9 minutes (9 commuters, 18.0%).
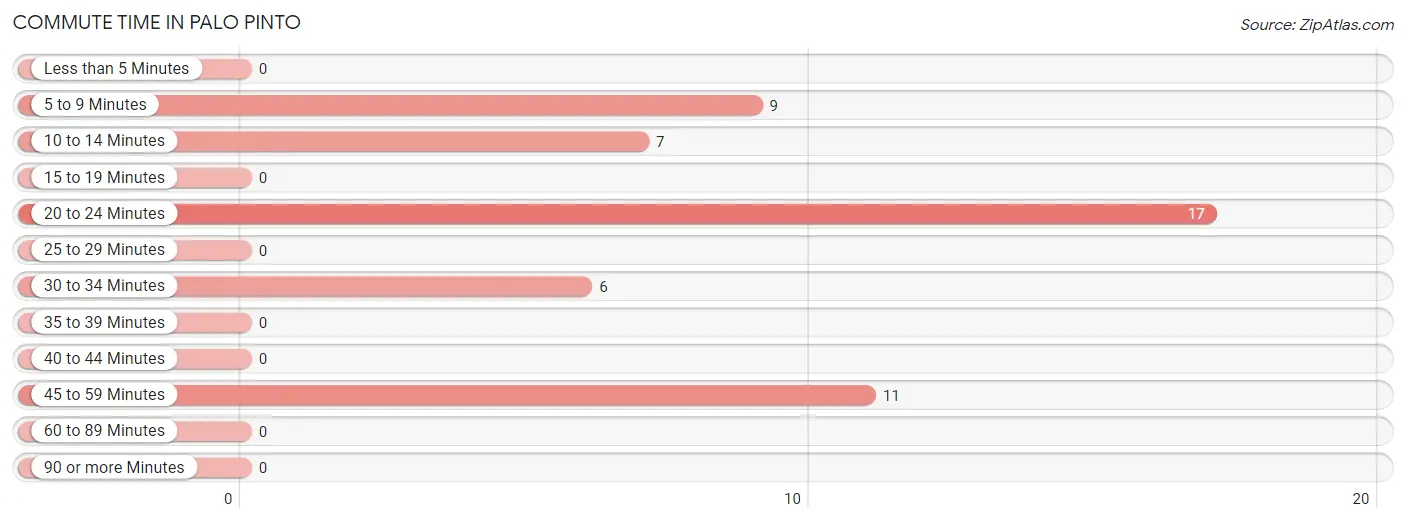
| Commute Time | # Commuters | % Commuters |
| Less than 5 Minutes | 0 | 0.0% |
| 5 to 9 Minutes | 9 | 18.0% |
| 10 to 14 Minutes | 7 | 14.0% |
| 15 to 19 Minutes | 0 | 0.0% |
| 20 to 24 Minutes | 17 | 34.0% |
| 25 to 29 Minutes | 0 | 0.0% |
| 30 to 34 Minutes | 6 | 12.0% |
| 35 to 39 Minutes | 0 | 0.0% |
| 40 to 44 Minutes | 0 | 0.0% |
| 45 to 59 Minutes | 11 | 22.0% |
| 60 to 89 Minutes | 0 | 0.0% |
| 90 or more Minutes | 0 | 0.0% |
Commute Time by Sex in Palo Pinto
The most common commute times in Palo Pinto are 45 to 59 minutes (11 commuters, 39.3%) for males and 20 to 24 minutes (13 commuters, 59.1%) for females.
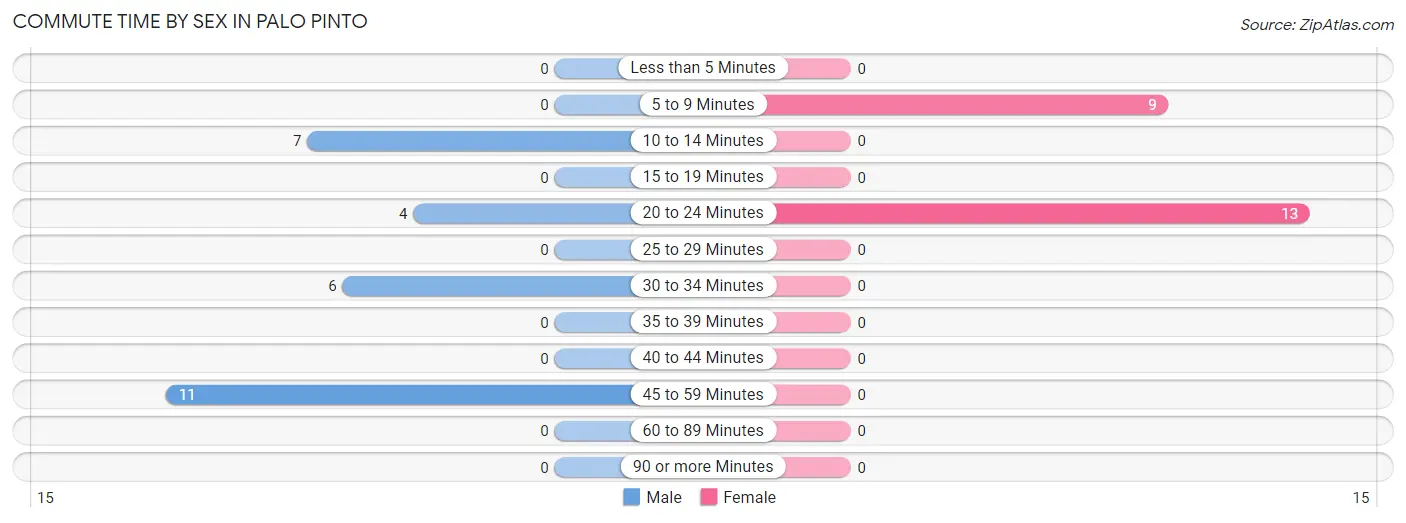
| Commute Time | Male | Female |
| Less than 5 Minutes | 0 (0.0%) | 0 (0.0%) |
| 5 to 9 Minutes | 0 (0.0%) | 9 (40.9%) |
| 10 to 14 Minutes | 7 (25.0%) | 0 (0.0%) |
| 15 to 19 Minutes | 0 (0.0%) | 0 (0.0%) |
| 20 to 24 Minutes | 4 (14.3%) | 13 (59.1%) |
| 25 to 29 Minutes | 0 (0.0%) | 0 (0.0%) |
| 30 to 34 Minutes | 6 (21.4%) | 0 (0.0%) |
| 35 to 39 Minutes | 0 (0.0%) | 0 (0.0%) |
| 40 to 44 Minutes | 0 (0.0%) | 0 (0.0%) |
| 45 to 59 Minutes | 11 (39.3%) | 0 (0.0%) |
| 60 to 89 Minutes | 0 (0.0%) | 0 (0.0%) |
| 90 or more Minutes | 0 (0.0%) | 0 (0.0%) |
Time of Departure to Work by Sex in Palo Pinto
The most frequent times of departure to work in Palo Pinto are 6:00 AM to 6:29 AM (11, 39.3%) for males and 7:00 AM to 7:29 AM (11, 50.0%) for females.
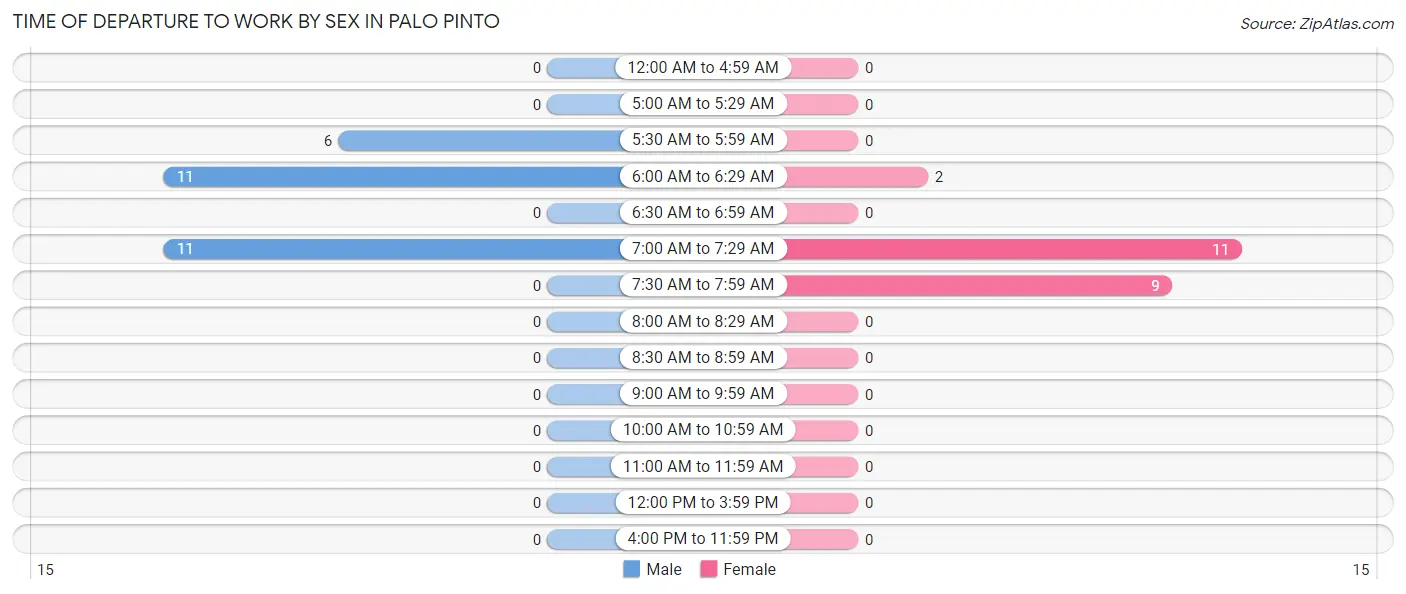
| Time of Departure | Male | Female |
| 12:00 AM to 4:59 AM | 0 (0.0%) | 0 (0.0%) |
| 5:00 AM to 5:29 AM | 0 (0.0%) | 0 (0.0%) |
| 5:30 AM to 5:59 AM | 6 (21.4%) | 0 (0.0%) |
| 6:00 AM to 6:29 AM | 11 (39.3%) | 2 (9.1%) |
| 6:30 AM to 6:59 AM | 0 (0.0%) | 0 (0.0%) |
| 7:00 AM to 7:29 AM | 11 (39.3%) | 11 (50.0%) |
| 7:30 AM to 7:59 AM | 0 (0.0%) | 9 (40.9%) |
| 8:00 AM to 8:29 AM | 0 (0.0%) | 0 (0.0%) |
| 8:30 AM to 8:59 AM | 0 (0.0%) | 0 (0.0%) |
| 9:00 AM to 9:59 AM | 0 (0.0%) | 0 (0.0%) |
| 10:00 AM to 10:59 AM | 0 (0.0%) | 0 (0.0%) |
| 11:00 AM to 11:59 AM | 0 (0.0%) | 0 (0.0%) |
| 12:00 PM to 3:59 PM | 0 (0.0%) | 0 (0.0%) |
| 4:00 PM to 11:59 PM | 0 (0.0%) | 0 (0.0%) |
| Total | 28 (100.0%) | 22 (100.0%) |
Housing Occupancy in Palo Pinto
Occupancy by Ownership in Palo Pinto
Of the total 23 dwellings in Palo Pinto, owner-occupied units account for 21 (91.3%), while renter-occupied units make up 2 (8.7%).
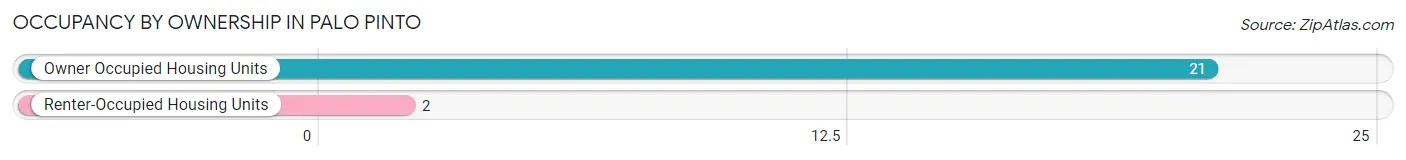
| Occupancy | # Housing Units | % Housing Units |
| Owner Occupied Housing Units | 21 | 91.3% |
| Renter-Occupied Housing Units | 2 | 8.7% |
| Total Occupied Housing Units | 23 | 100.0% |
Occupancy by Household Size in Palo Pinto
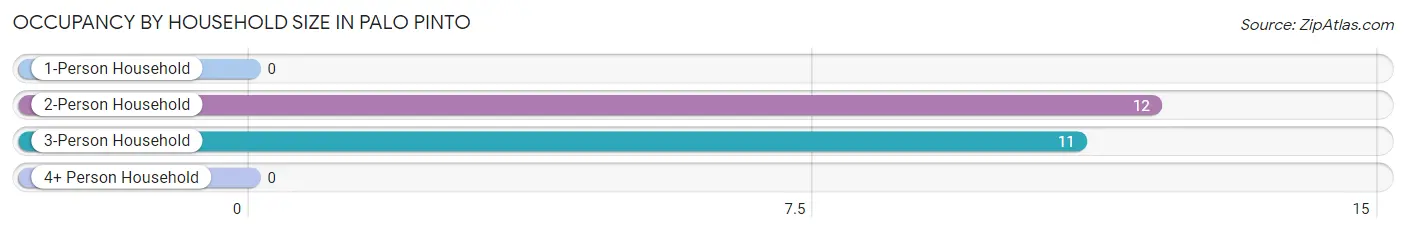
| Household Size | # Housing Units | % Housing Units |
| 1-Person Household | 0 | 0.0% |
| 2-Person Household | 12 | 52.2% |
| 3-Person Household | 11 | 47.8% |
| 4+ Person Household | 0 | 0.0% |
| Total Housing Units | 23 | 100.0% |
Occupancy by Ownership by Household Size in Palo Pinto

| Household Size | Owner-occupied | Renter-occupied |
| 1-Person Household | 0 (0.0%) | 0 (0.0%) |
| 2-Person Household | 10 (83.3%) | 2 (16.7%) |
| 3-Person Household | 11 (100.0%) | 0 (0.0%) |
| 4+ Person Household | 0 (0.0%) | 0 (0.0%) |
| Total Housing Units | 21 (91.3%) | 2 (8.7%) |
Occupancy by Educational Attainment in Palo Pinto
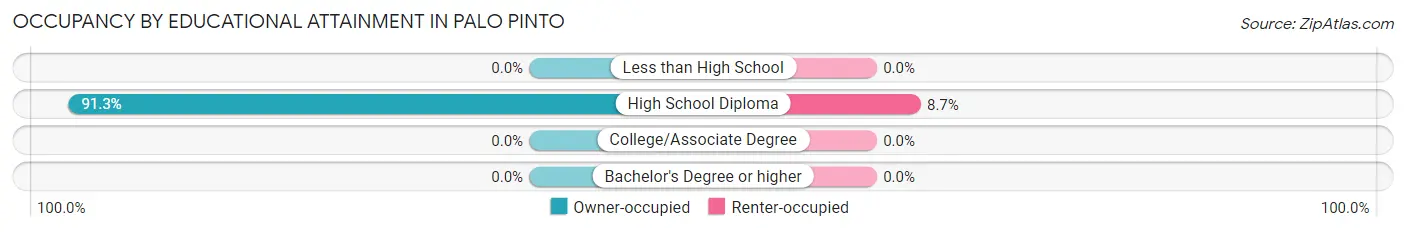
| Household Size | Owner-occupied | Renter-occupied |
| Less than High School | 0 (0.0%) | 0 (0.0%) |
| High School Diploma | 21 (91.3%) | 2 (8.7%) |
| College/Associate Degree | 0 (0.0%) | 0 (0.0%) |
| Bachelor's Degree or higher | 0 (0.0%) | 0 (0.0%) |
Occupancy by Age of Householder in Palo Pinto
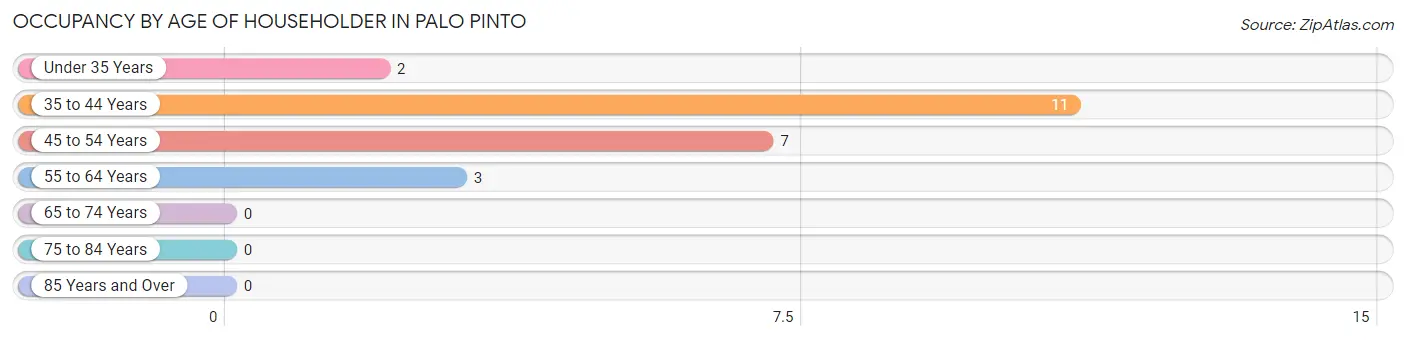
| Age Bracket | # Households | % Households |
| Under 35 Years | 2 | 8.7% |
| 35 to 44 Years | 11 | 47.8% |
| 45 to 54 Years | 7 | 30.4% |
| 55 to 64 Years | 3 | 13.0% |
| 65 to 74 Years | 0 | 0.0% |
| 75 to 84 Years | 0 | 0.0% |
| 85 Years and Over | 0 | 0.0% |
| Total | 23 | 100.0% |
Housing Finances in Palo Pinto
Median Income by Occupancy in Palo Pinto
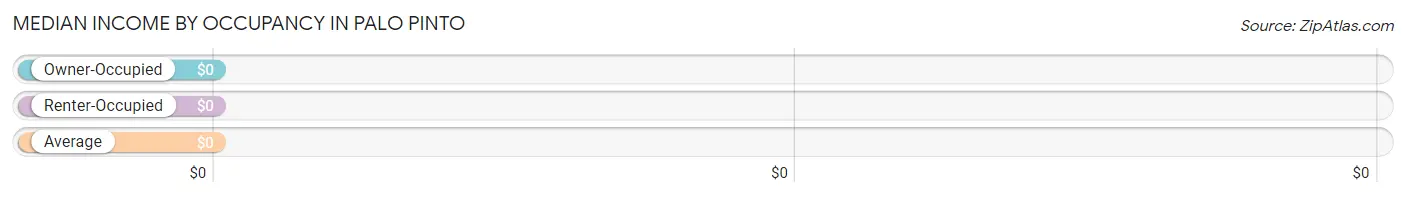
| Occupancy Type | # Households | Median Income |
| Owner-Occupied | 21 (91.3%) | $0 |
| Renter-Occupied | 2 (8.7%) | $0 |
| Average | 23 (100.0%) | $0 |
Occupancy by Householder Income Bracket in Palo Pinto
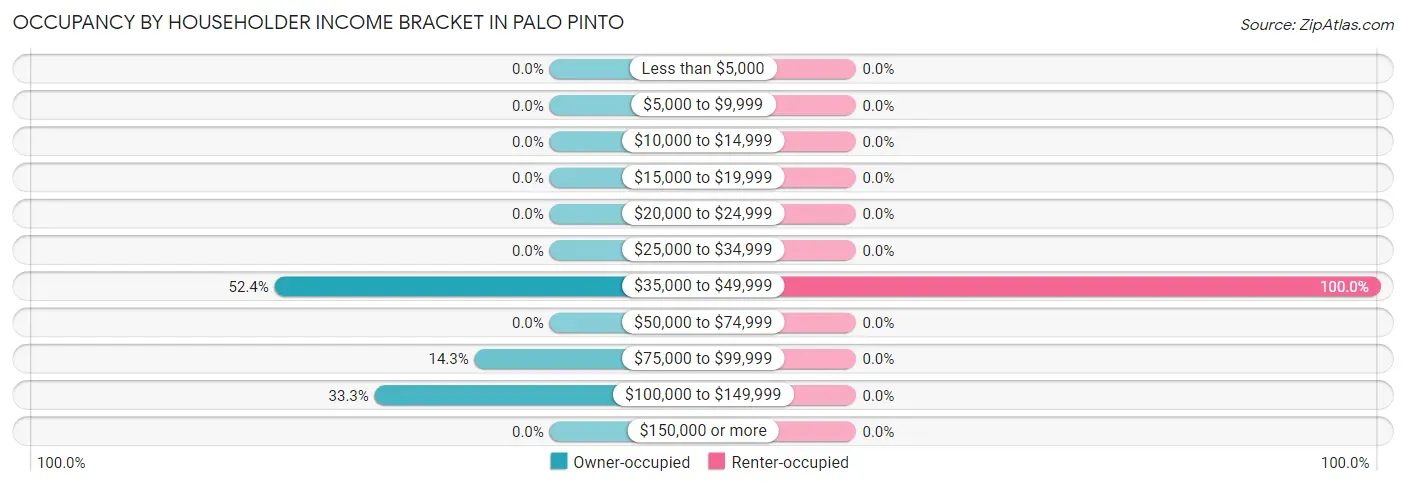
| Income Bracket | Owner-occupied | Renter-occupied |
| Less than $5,000 | 0 (0.0%) | 0 (0.0%) |
| $5,000 to $9,999 | 0 (0.0%) | 0 (0.0%) |
| $10,000 to $14,999 | 0 (0.0%) | 0 (0.0%) |
| $15,000 to $19,999 | 0 (0.0%) | 0 (0.0%) |
| $20,000 to $24,999 | 0 (0.0%) | 0 (0.0%) |
| $25,000 to $34,999 | 0 (0.0%) | 0 (0.0%) |
| $35,000 to $49,999 | 11 (52.4%) | 2 (100.0%) |
| $50,000 to $74,999 | 0 (0.0%) | 0 (0.0%) |
| $75,000 to $99,999 | 3 (14.3%) | 0 (0.0%) |
| $100,000 to $149,999 | 7 (33.3%) | 0 (0.0%) |
| $150,000 or more | 0 (0.0%) | 0 (0.0%) |
| Total | 21 (100.0%) | 2 (100.0%) |
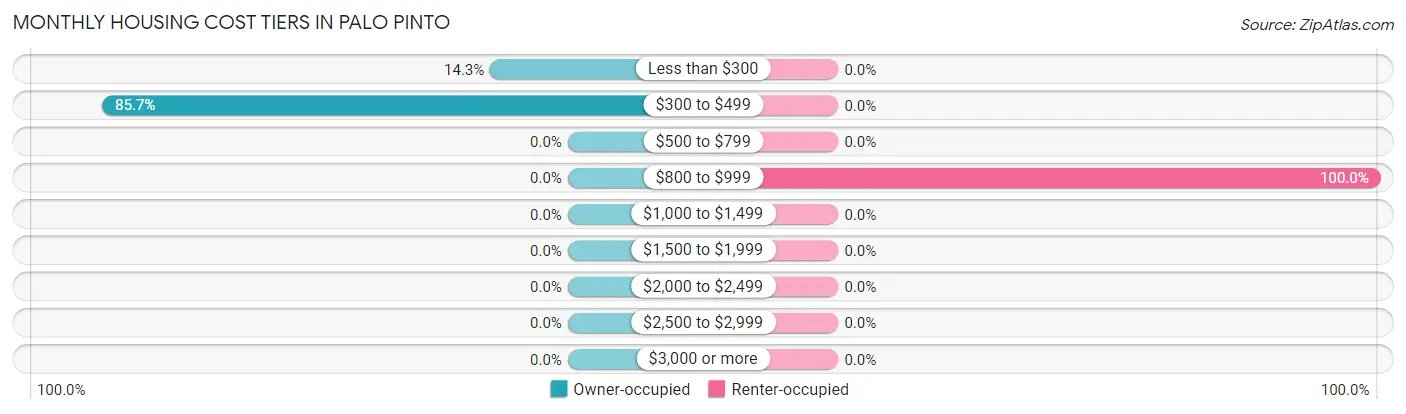
Monthly Housing Cost Tiers in Palo Pinto
| Monthly Cost | Owner-occupied | Renter-occupied |
| Less than $300 | 3 (14.3%) | 0 (0.0%) |
| $300 to $499 | 18 (85.7%) | 0 (0.0%) |
| $500 to $799 | 0 (0.0%) | 0 (0.0%) |
| $800 to $999 | 0 (0.0%) | 2 (100.0%) |
| $1,000 to $1,499 | 0 (0.0%) | 0 (0.0%) |
| $1,500 to $1,999 | 0 (0.0%) | 0 (0.0%) |
| $2,000 to $2,499 | 0 (0.0%) | 0 (0.0%) |
| $2,500 to $2,999 | 0 (0.0%) | 0 (0.0%) |
| $3,000 or more | 0 (0.0%) | 0 (0.0%) |
| Total | 21 (100.0%) | 2 (100.0%) |
Physical Housing Characteristics in Palo Pinto
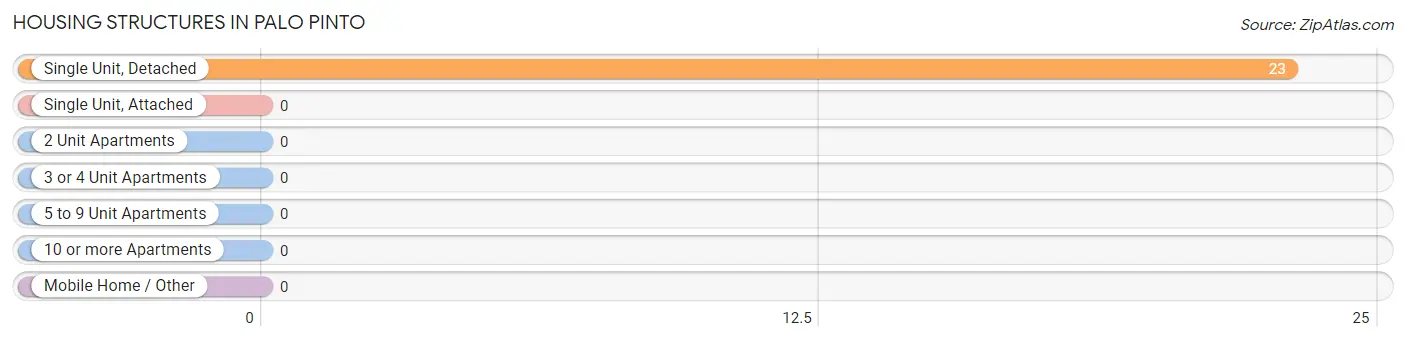
Housing Structures in Palo Pinto
| Structure Type | # Housing Units | % Housing Units |
| Single Unit, Detached | 23 | 100.0% |
| Single Unit, Attached | 0 | 0.0% |
| 2 Unit Apartments | 0 | 0.0% |
| 3 or 4 Unit Apartments | 0 | 0.0% |
| 5 to 9 Unit Apartments | 0 | 0.0% |
| 10 or more Apartments | 0 | 0.0% |
| Mobile Home / Other | 0 | 0.0% |
| Total | 23 | 100.0% |
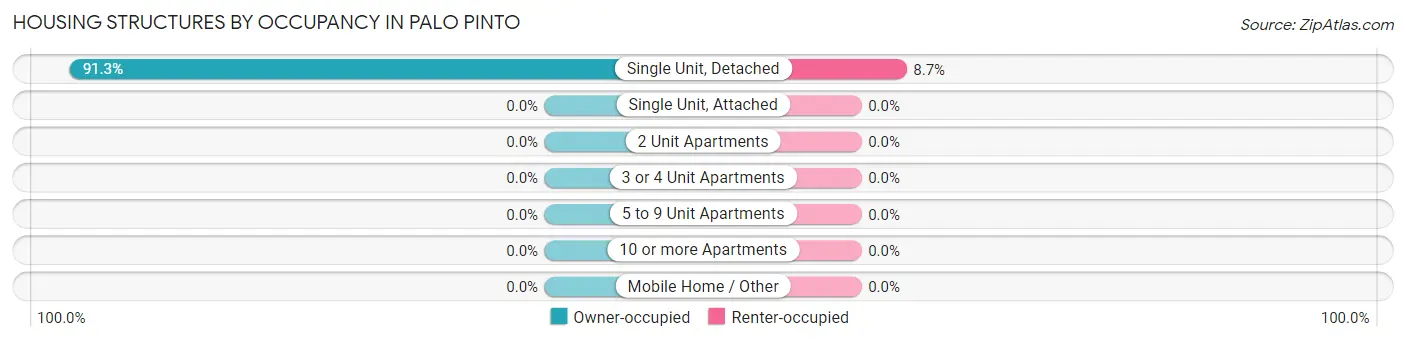
Housing Structures by Occupancy in Palo Pinto
| Structure Type | Owner-occupied | Renter-occupied |
| Single Unit, Detached | 21 (91.3%) | 2 (8.7%) |
| Single Unit, Attached | 0 (0.0%) | 0 (0.0%) |
| 2 Unit Apartments | 0 (0.0%) | 0 (0.0%) |
| 3 or 4 Unit Apartments | 0 (0.0%) | 0 (0.0%) |
| 5 to 9 Unit Apartments | 0 (0.0%) | 0 (0.0%) |
| 10 or more Apartments | 0 (0.0%) | 0 (0.0%) |
| Mobile Home / Other | 0 (0.0%) | 0 (0.0%) |
| Total | 21 (91.3%) | 2 (8.7%) |
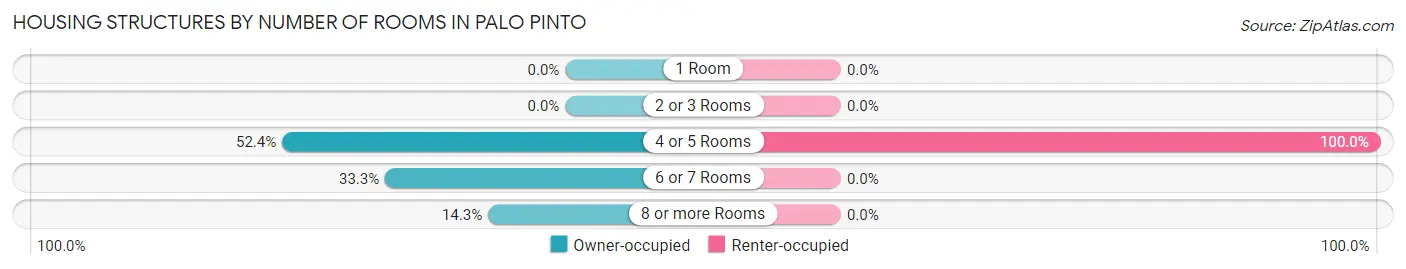
Housing Structures by Number of Rooms in Palo Pinto
| Number of Rooms | Owner-occupied | Renter-occupied |
| 1 Room | 0 (0.0%) | 0 (0.0%) |
| 2 or 3 Rooms | 0 (0.0%) | 0 (0.0%) |
| 4 or 5 Rooms | 11 (52.4%) | 2 (100.0%) |
| 6 or 7 Rooms | 7 (33.3%) | 0 (0.0%) |
| 8 or more Rooms | 3 (14.3%) | 0 (0.0%) |
| Total | 21 (100.0%) | 2 (100.0%) |
Housing Structure by Heating Type in Palo Pinto
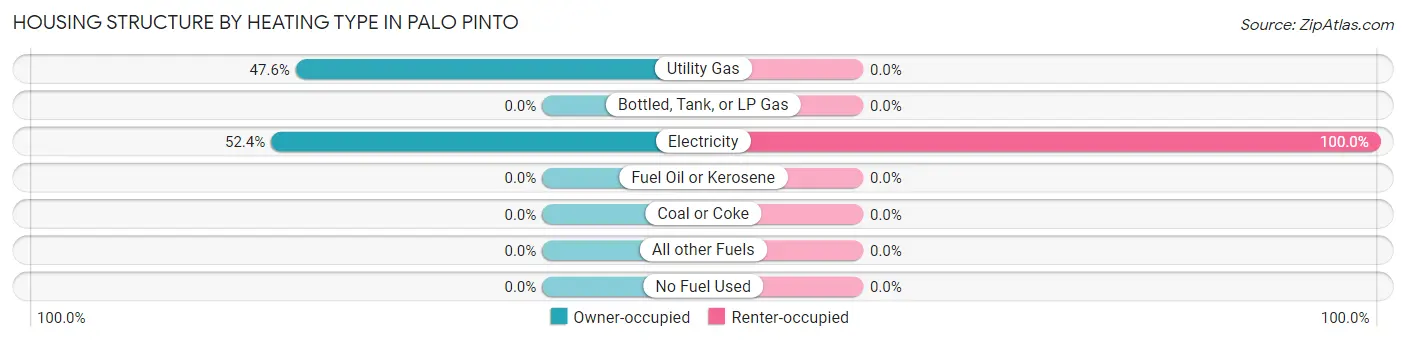
| Heating Type | Owner-occupied | Renter-occupied |
| Utility Gas | 10 (47.6%) | 0 (0.0%) |
| Bottled, Tank, or LP Gas | 0 (0.0%) | 0 (0.0%) |
| Electricity | 11 (52.4%) | 2 (100.0%) |
| Fuel Oil or Kerosene | 0 (0.0%) | 0 (0.0%) |
| Coal or Coke | 0 (0.0%) | 0 (0.0%) |
| All other Fuels | 0 (0.0%) | 0 (0.0%) |
| No Fuel Used | 0 (0.0%) | 0 (0.0%) |
| Total | 21 (100.0%) | 2 (100.0%) |
Household Vehicle Usage in Palo Pinto
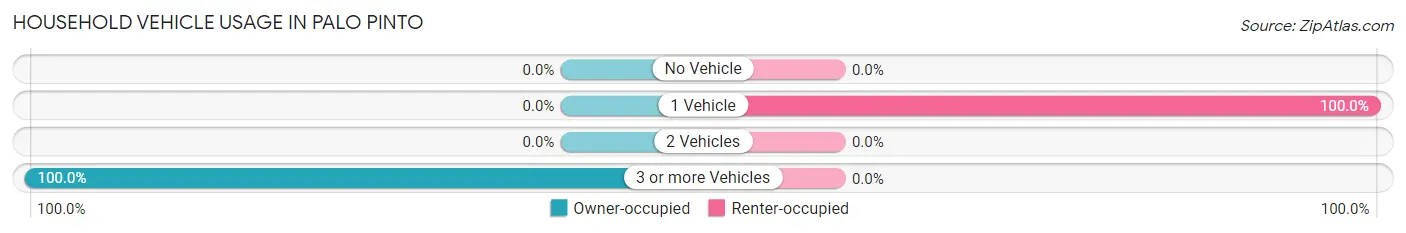
| Vehicles per Household | Owner-occupied | Renter-occupied |
| No Vehicle | 0 (0.0%) | 0 (0.0%) |
| 1 Vehicle | 0 (0.0%) | 2 (100.0%) |
| 2 Vehicles | 0 (0.0%) | 0 (0.0%) |
| 3 or more Vehicles | 21 (100.0%) | 0 (0.0%) |
| Total | 21 (100.0%) | 2 (100.0%) |
Real Estate & Mortgages in Palo Pinto
Real Estate and Mortgage Overview in Palo Pinto
| Characteristic | Without Mortgage | With Mortgage |
| Housing Units | 21 | 0 |
| Median Property Value | - | - |
| Median Household Income | - | - |
| Monthly Housing Costs | $334 | $0 |
| Real Estate Taxes | $1,208 | $0 |
Property Value by Mortgage Status in Palo Pinto
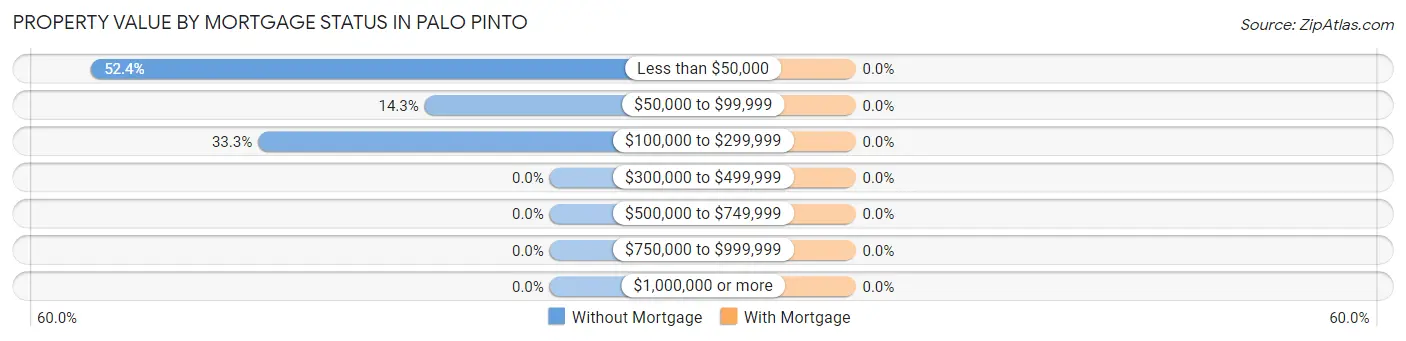
| Property Value | Without Mortgage | With Mortgage |
| Less than $50,000 | 11 (52.4%) | 0 (0.0%) |
| $50,000 to $99,999 | 3 (14.3%) | 0 (0.0%) |
| $100,000 to $299,999 | 7 (33.3%) | 0 (0.0%) |
| $300,000 to $499,999 | 0 (0.0%) | 0 (0.0%) |
| $500,000 to $749,999 | 0 (0.0%) | 0 (0.0%) |
| $750,000 to $999,999 | 0 (0.0%) | 0 (0.0%) |
| $1,000,000 or more | 0 (0.0%) | 0 (0.0%) |
| Total | 21 (100.0%) | 0 (0.0%) |
Household Income by Mortgage Status in Palo Pinto
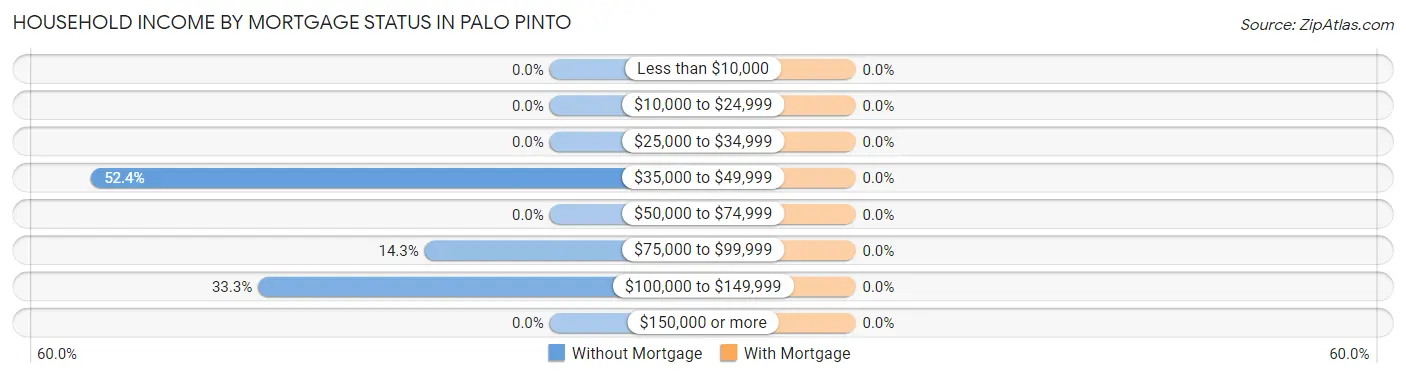
| Household Income | Without Mortgage | With Mortgage |
| Less than $10,000 | 0 (0.0%) | 0 (0.0%) |
| $10,000 to $24,999 | 0 (0.0%) | 0 (0.0%) |
| $25,000 to $34,999 | 0 (0.0%) | 0 (0.0%) |
| $35,000 to $49,999 | 11 (52.4%) | 0 (0.0%) |
| $50,000 to $74,999 | 0 (0.0%) | 0 (0.0%) |
| $75,000 to $99,999 | 3 (14.3%) | 0 (0.0%) |
| $100,000 to $149,999 | 7 (33.3%) | 0 (0.0%) |
| $150,000 or more | 0 (0.0%) | 0 (0.0%) |
| Total | 21 (100.0%) | 0 (0.0%) |
Property Value to Household Income Ratio in Palo Pinto
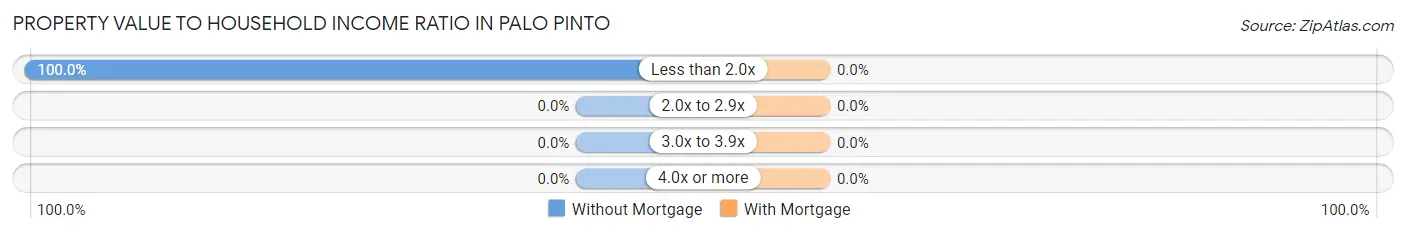
| Value-to-Income Ratio | Without Mortgage | With Mortgage |
| Less than 2.0x | 21 (100.0%) | 0 (0.0%) |
| 2.0x to 2.9x | 0 (0.0%) | 0 (0.0%) |
| 3.0x to 3.9x | 0 (0.0%) | 0 (0.0%) |
| 4.0x or more | 0 (0.0%) | 0 (0.0%) |
| Total | 21 (100.0%) | 0 (0.0%) |
Real Estate Taxes by Mortgage Status in Palo Pinto
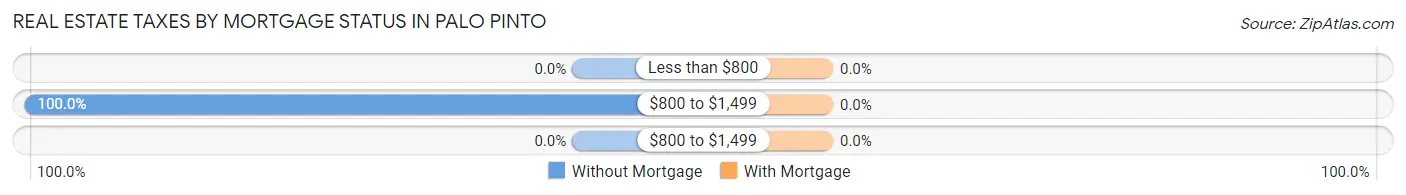
| Property Taxes | Without Mortgage | With Mortgage |
| Less than $800 | 0 (0.0%) | 0 (0.0%) |
| $800 to $1,499 | 21 (100.0%) | 0 (0.0%) |
| $800 to $1,499 | 0 (0.0%) | 0 (0.0%) |
| Total | 21 (100.0%) | 0 (0.0%) |
Health & Disability in Palo Pinto
Health Insurance Coverage by Age in Palo Pinto
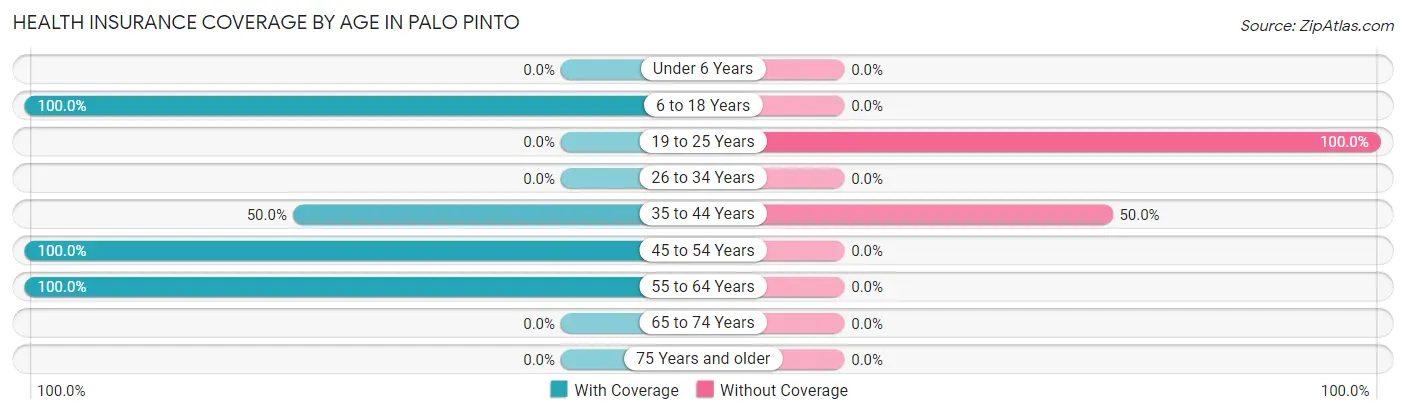
| Age Bracket | With Coverage | Without Coverage |
| Under 6 Years | 0 (0.0%) | 0 (0.0%) |
| 6 to 18 Years | 79 (100.0%) | 0 (0.0%) |
| 19 to 25 Years | 0 (0.0%) | 6 (100.0%) |
| 26 to 34 Years | 0 (0.0%) | 0 (0.0%) |
| 35 to 44 Years | 11 (50.0%) | 11 (50.0%) |
| 45 to 54 Years | 13 (100.0%) | 0 (0.0%) |
| 55 to 64 Years | 3 (100.0%) | 0 (0.0%) |
| 65 to 74 Years | 0 (0.0%) | 0 (0.0%) |
| 75 Years and older | 0 (0.0%) | 0 (0.0%) |
| Total | 106 (86.2%) | 17 (13.8%) |
Health Insurance Coverage by Citizenship Status in Palo Pinto
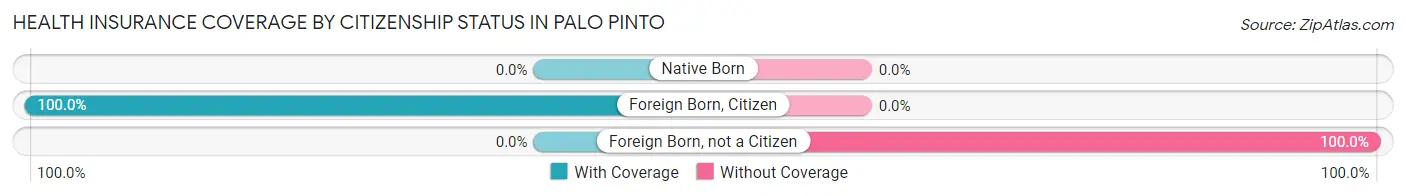
| Citizenship Status | With Coverage | Without Coverage |
| Native Born | 0 (0.0%) | 0 (0.0%) |
| Foreign Born, Citizen | 79 (100.0%) | 0 (0.0%) |
| Foreign Born, not a Citizen | 0 (0.0%) | 6 (100.0%) |
Health Insurance Coverage by Household Income in Palo Pinto
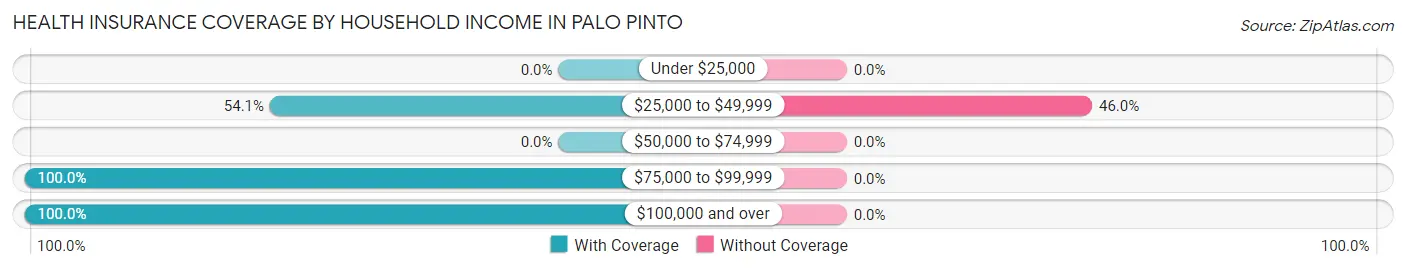
| Household Income | With Coverage | Without Coverage |
| Under $25,000 | 0 (0.0%) | 0 (0.0%) |
| $25,000 to $49,999 | 20 (54.0%) | 17 (46.0%) |
| $50,000 to $74,999 | 0 (0.0%) | 0 (0.0%) |
| $75,000 to $99,999 | 9 (100.0%) | 0 (0.0%) |
| $100,000 and over | 77 (100.0%) | 0 (0.0%) |
Public vs Private Health Insurance Coverage by Age in Palo Pinto
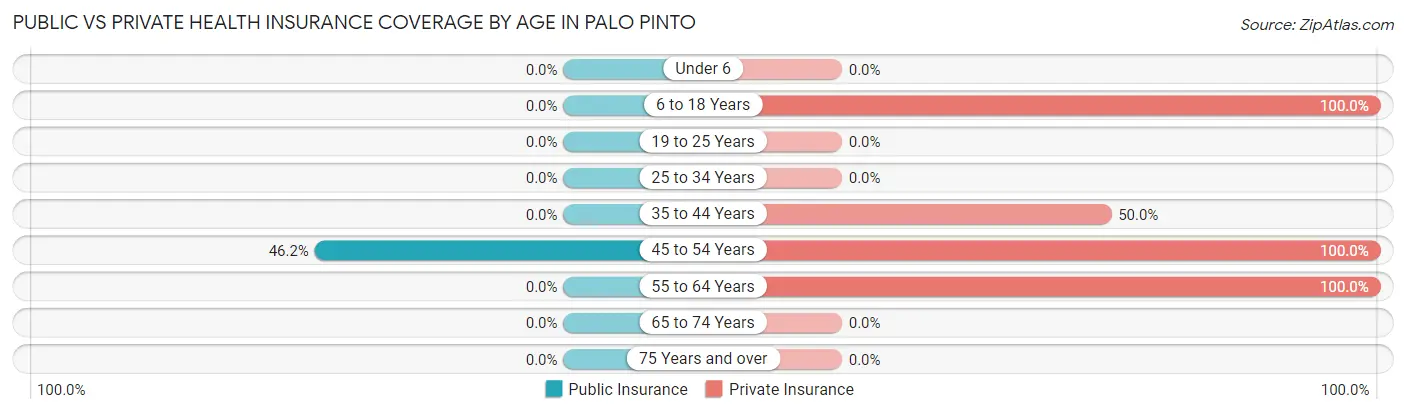
| Age Bracket | Public Insurance | Private Insurance |
| Under 6 | 0 (0.0%) | 0 (0.0%) |
| 6 to 18 Years | 0 (0.0%) | 79 (100.0%) |
| 19 to 25 Years | 0 (0.0%) | 0 (0.0%) |
| 25 to 34 Years | 0 (0.0%) | 0 (0.0%) |
| 35 to 44 Years | 0 (0.0%) | 11 (50.0%) |
| 45 to 54 Years | 6 (46.2%) | 13 (100.0%) |
| 55 to 64 Years | 0 (0.0%) | 3 (100.0%) |
| 65 to 74 Years | 0 (0.0%) | 0 (0.0%) |
| 75 Years and over | 0 (0.0%) | 0 (0.0%) |
| Total | 6 (4.9%) | 106 (86.2%) |
Disability Status by Sex by Age in Palo Pinto
| Age Bracket | Male | Female |
| Under 5 Years | 0 (0.0%) | 0 (0.0%) |
| 5 to 17 Years | 0 (0.0%) | 0 (0.0%) |
| 18 to 34 Years | 0 (0.0%) | 0 (0.0%) |
| 35 to 64 Years | 0 (0.0%) | 0 (0.0%) |
| 65 to 74 Years | 0 (0.0%) | 0 (0.0%) |
| 75 Years and over | 0 (0.0%) | 0 (0.0%) |
Disability Class by Sex by Age in Palo Pinto
Disability Class: Hearing Difficulty
| Age Bracket | Male | Female |
| Under 5 Years | 0 (0.0%) | 0 (0.0%) |
| 5 to 17 Years | 0 (0.0%) | 0 (0.0%) |
| 18 to 34 Years | 0 (0.0%) | 0 (0.0%) |
| 35 to 64 Years | 0 (0.0%) | 0 (0.0%) |
| 65 to 74 Years | 0 (0.0%) | 0 (0.0%) |
| 75 Years and over | 0 (0.0%) | 0 (0.0%) |
Disability Class: Vision Difficulty
| Age Bracket | Male | Female |
| Under 5 Years | 0 (0.0%) | 0 (0.0%) |
| 5 to 17 Years | 0 (0.0%) | 0 (0.0%) |
| 18 to 34 Years | 0 (0.0%) | 0 (0.0%) |
| 35 to 64 Years | 0 (0.0%) | 0 (0.0%) |
| 65 to 74 Years | 0 (0.0%) | 0 (0.0%) |
| 75 Years and over | 0 (0.0%) | 0 (0.0%) |
Disability Class: Cognitive Difficulty
| Age Bracket | Male | Female |
| 5 to 17 Years | 0 (0.0%) | 0 (0.0%) |
| 18 to 34 Years | 0 (0.0%) | 0 (0.0%) |
| 35 to 64 Years | 0 (0.0%) | 0 (0.0%) |
| 65 to 74 Years | 0 (0.0%) | 0 (0.0%) |
| 75 Years and over | 0 (0.0%) | 0 (0.0%) |
Disability Class: Ambulatory Difficulty
| Age Bracket | Male | Female |
| 5 to 17 Years | 0 (0.0%) | 0 (0.0%) |
| 18 to 34 Years | 0 (0.0%) | 0 (0.0%) |
| 35 to 64 Years | 0 (0.0%) | 0 (0.0%) |
| 65 to 74 Years | 0 (0.0%) | 0 (0.0%) |
| 75 Years and over | 0 (0.0%) | 0 (0.0%) |
Disability Class: Self-Care Difficulty
| Age Bracket | Male | Female |
| 5 to 17 Years | 0 (0.0%) | 0 (0.0%) |
| 18 to 34 Years | 0 (0.0%) | 0 (0.0%) |
| 35 to 64 Years | 0 (0.0%) | 0 (0.0%) |
| 65 to 74 Years | 0 (0.0%) | 0 (0.0%) |
| 75 Years and over | 0 (0.0%) | 0 (0.0%) |
Technology Access in Palo Pinto
Computing Device Access in Palo Pinto
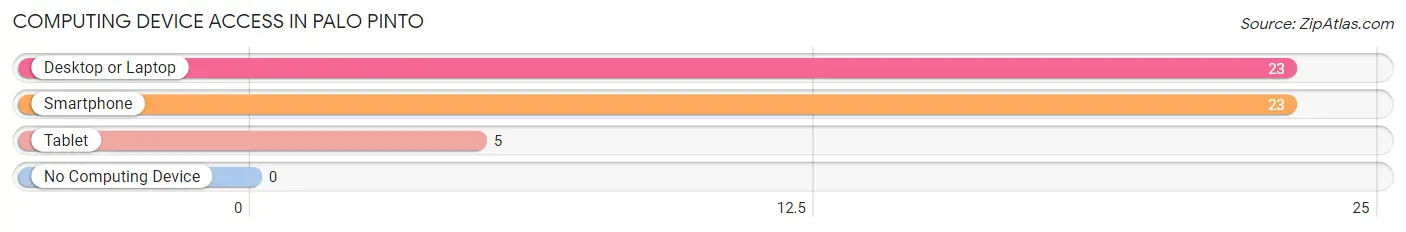
| Device Type | # Households | % Households |
| Desktop or Laptop | 23 | 100.0% |
| Smartphone | 23 | 100.0% |
| Tablet | 5 | 21.7% |
| No Computing Device | 0 | 0.0% |
| Total | 23 | 100.0% |
Internet Access in Palo Pinto
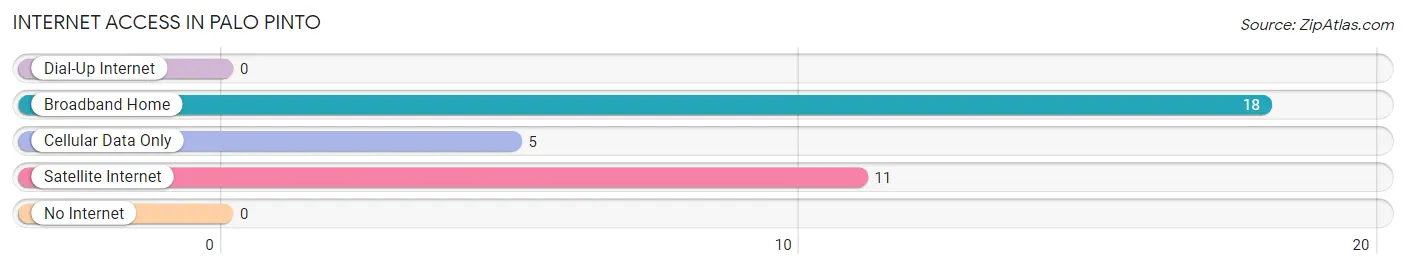
| Internet Type | # Households | % Households |
| Dial-Up Internet | 0 | 0.0% |
| Broadband Home | 18 | 78.3% |
| Cellular Data Only | 5 | 21.7% |
| Satellite Internet | 11 | 47.8% |
| No Internet | 0 | 0.0% |
| Total | 23 | 100.0% |
Palo Pinto Summary
Palo Pinto is a small town located in the north-central region of Texas, in the United States. It is situated in Palo Pinto County, and is the county seat. The town is located approximately 80 miles west of Fort Worth, and is part of the Mineral Wells Micropolitan Statistical Area. As of the 2010 census, the population of Palo Pinto was 1,444.
History
The area that is now Palo Pinto was originally inhabited by Native American tribes, including the Comanche and Kiowa. The first European settlers arrived in the area in the 1840s, and the town was officially established in 1856. The town was named after the nearby Palo Pinto Creek, which was named by Spanish explorers in the 1700s. The creek was named for the abundance of Palo Pinto trees in the area.
The town was initially a small farming community, but it began to grow in the late 19th century when the Texas and Pacific Railway was built through the area. This allowed for the transportation of goods and people, and the town began to develop. In 1876, the town was chosen as the county seat of Palo Pinto County.
In the early 20th century, the town was a center for the oil and gas industry. The town was also home to several large ranches, and it was a popular destination for tourists. The town continued to grow throughout the 20th century, and it remains a popular destination for tourists today.
Geography
Palo Pinto is located in north-central Texas, in the United States. It is situated in Palo Pinto County, and is the county seat. The town is located approximately 80 miles west of Fort Worth, and is part of the Mineral Wells Micropolitan Statistical Area.
The town is situated on the banks of the Palo Pinto Creek, and is surrounded by rolling hills and grasslands. The town is located at an elevation of 1,068 feet above sea level. The climate in the area is semi-arid, with hot summers and mild winters.
Economy
The economy of Palo Pinto is largely based on agriculture and tourism. The town is home to several large ranches, and it is a popular destination for tourists. The town is also home to several businesses, including restaurants, retail stores, and service providers.
The town is also home to several oil and gas companies, and it is a center for the oil and gas industry. The town is home to several large oil and gas companies, and it is a major producer of oil and gas in the region.
Demographics
As of the 2010 census, the population of Palo Pinto was 1,444. The racial makeup of the town was 94.3% White, 0.7% African American, 0.7% Native American, 0.2% Asian, 0.1% Pacific Islander, 2.7% from other races, and 1.2% from two or more races. Hispanic or Latino of any race were 5.3% of the population.
The median household income in the town was $31,250, and the median family income was $37,500. The per capita income in the town was $17,845. About 15.3% of the population was below the poverty line.
Common Questions
What is Per Capita Income in Palo Pinto?
Per Capita income in Palo Pinto is $14,091.
What is Inequality or Gini Index in Palo Pinto?
Inequality or Gini Index in Palo Pinto is 0.23.
What is the Total Population of Palo Pinto?
Total Population of Palo Pinto is 201.
What is the Total Male Population of Palo Pinto?
Total Male Population of Palo Pinto is 98.
What is the Total Female Population of Palo Pinto?
Total Female Population of Palo Pinto is 103.
What is the Ratio of Males per 100 Females in Palo Pinto?
There are 95.15 Males per 100 Females in Palo Pinto.
What is the Ratio of Females per 100 Males in Palo Pinto?
There are 105.10 Females per 100 Males in Palo Pinto.
What is the Median Population Age in Palo Pinto?
Median Population Age in Palo Pinto is 28.1 Years.
What is the Average Family Size in Palo Pinto
Average Family Size in Palo Pinto is 5.7 People.
What is the Average Household Size in Palo Pinto
Average Household Size in Palo Pinto is 5.3 People.
How Large is the Labor Force in Palo Pinto?
There are 50 People in the Labor Forcein in Palo Pinto.
What is the Percentage of People in the Labor Force in Palo Pinto?
24.9% of People are in the Labor Force in Palo Pinto.