Paducah, TX Map & Demographics
Paducah Map
Paducah Overview
$24,451
PER CAPITA INCOME
$46,750
AVG FAMILY INCOME
$33,250
AVG HOUSEHOLD INCOME
57.4%
WAGE / INCOME GAP [ % ]
42.6¢/ $1
WAGE / INCOME GAP [ $ ]
0.52
INEQUALITY / GINI INDEX
1,201
TOTAL POPULATION
619
MALE POPULATION
582
FEMALE POPULATION
106.36
MALES / 100 FEMALES
94.02
FEMALES / 100 MALES
37.0
MEDIAN AGE
3.4
AVG FAMILY SIZE
2.2
AVG HOUSEHOLD SIZE
512
LABOR FORCE [ PEOPLE ]
56.8%
PERCENT IN LABOR FORCE
6.1%
UNEMPLOYMENT RATE
Paducah Zip Codes
Paducah Area Codes
Income in Paducah
Income Overview in Paducah
Per Capita Income in Paducah is $24,451, while median incomes of families and households are $46,750 and $33,250 respectively.
| Characteristic | Number | Measure |
| Per Capita Income | 1,201 | $24,451 |
| Median Family Income | 245 | $46,750 |
| Mean Family Income | 245 | $80,271 |
| Median Household Income | 550 | $33,250 |
| Mean Household Income | 550 | $56,347 |
| Income Deficit | 245 | $0 |
| Wage / Income Gap (%) | 1,201 | 57.36% |
| Wage / Income Gap ($) | 1,201 | 42.64¢ per $1 |
| Gini / Inequality Index | 1,201 | 0.52 |
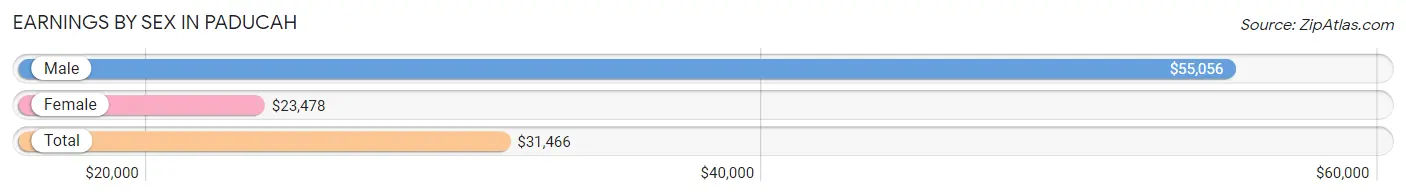
Earnings by Sex in Paducah
Average Earnings in Paducah are $31,466, $55,056 for men and $23,478 for women, a difference of 57.4%.
| Sex | Number | Average Earnings |
| Male | 278 (49.8%) | $55,056 |
| Female | 280 (50.2%) | $23,478 |
| Total | 558 (100.0%) | $31,466 |
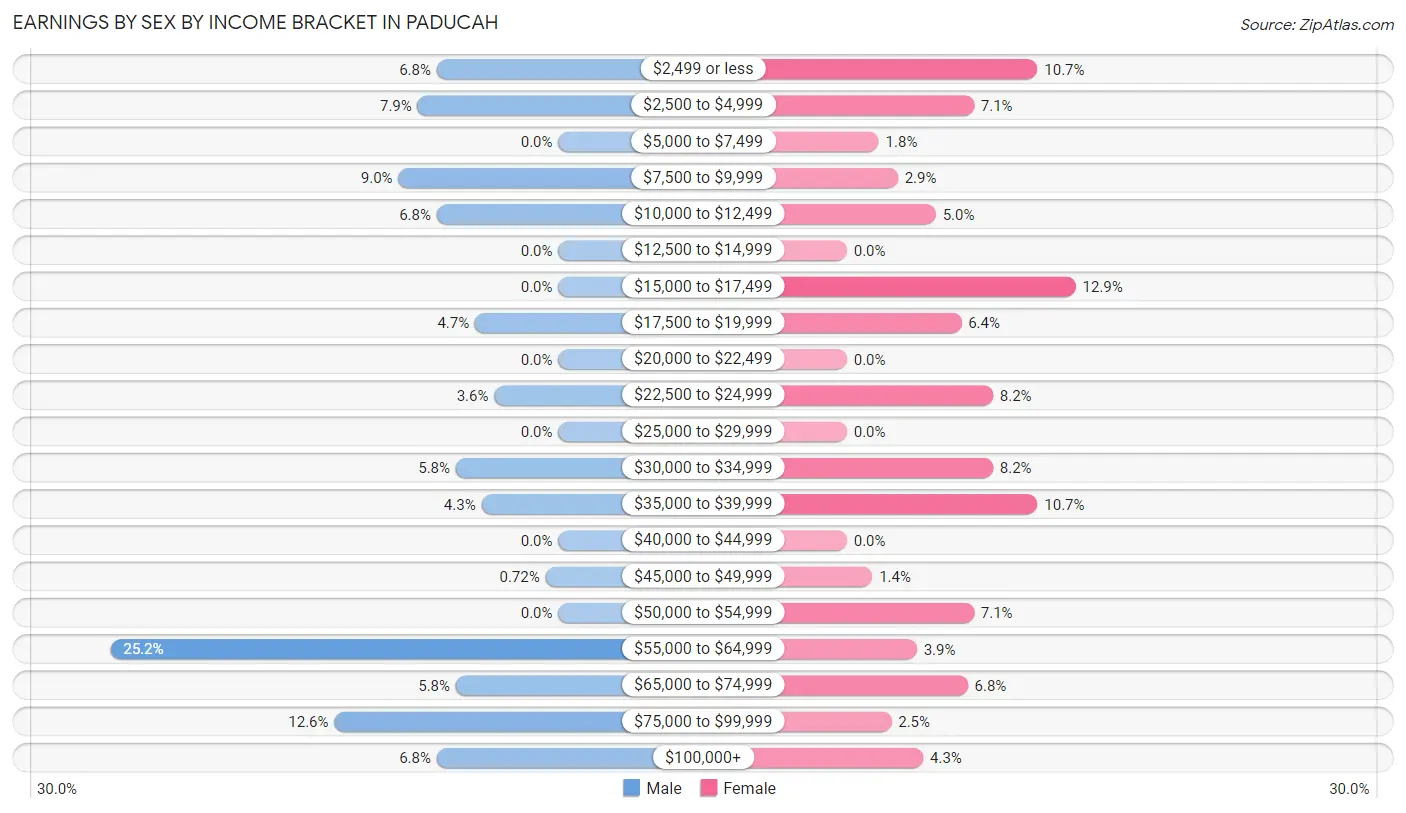
Earnings by Sex by Income Bracket in Paducah
The most common earnings brackets in Paducah are $55,000 to $64,999 for men (70 | 25.2%) and $15,000 to $17,499 for women (36 | 12.9%).
| Income | Male | Female |
| $2,499 or less | 19 (6.8%) | 30 (10.7%) |
| $2,500 to $4,999 | 22 (7.9%) | 20 (7.1%) |
| $5,000 to $7,499 | 0 (0.0%) | 5 (1.8%) |
| $7,500 to $9,999 | 25 (9.0%) | 8 (2.9%) |
| $10,000 to $12,499 | 19 (6.8%) | 14 (5.0%) |
| $12,500 to $14,999 | 0 (0.0%) | 0 (0.0%) |
| $15,000 to $17,499 | 0 (0.0%) | 36 (12.9%) |
| $17,500 to $19,999 | 13 (4.7%) | 18 (6.4%) |
| $20,000 to $22,499 | 0 (0.0%) | 0 (0.0%) |
| $22,500 to $24,999 | 10 (3.6%) | 23 (8.2%) |
| $25,000 to $29,999 | 0 (0.0%) | 0 (0.0%) |
| $30,000 to $34,999 | 16 (5.8%) | 23 (8.2%) |
| $35,000 to $39,999 | 12 (4.3%) | 30 (10.7%) |
| $40,000 to $44,999 | 0 (0.0%) | 0 (0.0%) |
| $45,000 to $49,999 | 2 (0.7%) | 4 (1.4%) |
| $50,000 to $54,999 | 0 (0.0%) | 20 (7.1%) |
| $55,000 to $64,999 | 70 (25.2%) | 11 (3.9%) |
| $65,000 to $74,999 | 16 (5.8%) | 19 (6.8%) |
| $75,000 to $99,999 | 35 (12.6%) | 7 (2.5%) |
| $100,000+ | 19 (6.8%) | 12 (4.3%) |
| Total | 278 (100.0%) | 280 (100.0%) |
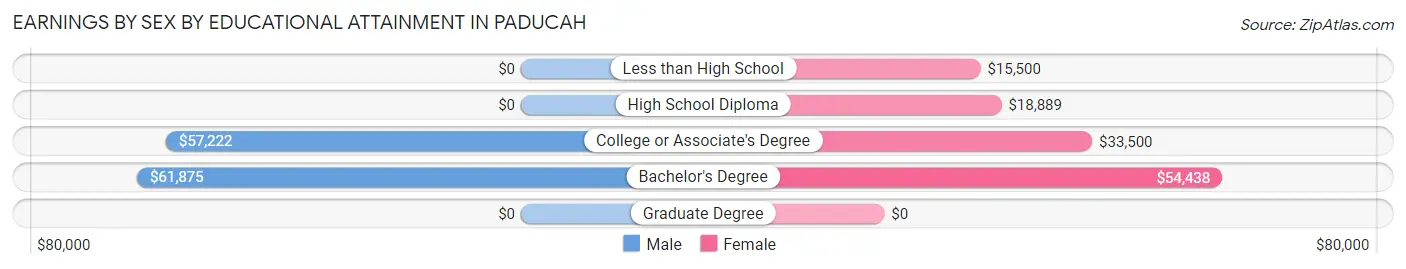
Earnings by Sex by Educational Attainment in Paducah
Average earnings in Paducah are $56,417 for men and $24,783 for women, a difference of 56.1%. Men with an educational attainment of bachelor's degree enjoy the highest average annual earnings of $61,875, while those with college or associate's degree education earn the least with $57,222. Women with an educational attainment of bachelor's degree earn the most with the average annual earnings of $54,438, while those with less than high school education have the smallest earnings of $15,500.
| Educational Attainment | Male Income | Female Income |
| Less than High School | - | - |
| High School Diploma | - | - |
| College or Associate's Degree | $57,222 | $33,500 |
| Bachelor's Degree | $61,875 | $54,438 |
| Graduate Degree | - | - |
| Total | $56,417 | $24,783 |
Family Income in Paducah
Family Income Brackets in Paducah
According to the Paducah family income data, there are 39 families falling into the $35,000 to $49,999 income range, which is the most common income bracket and makes up 15.9% of all families.
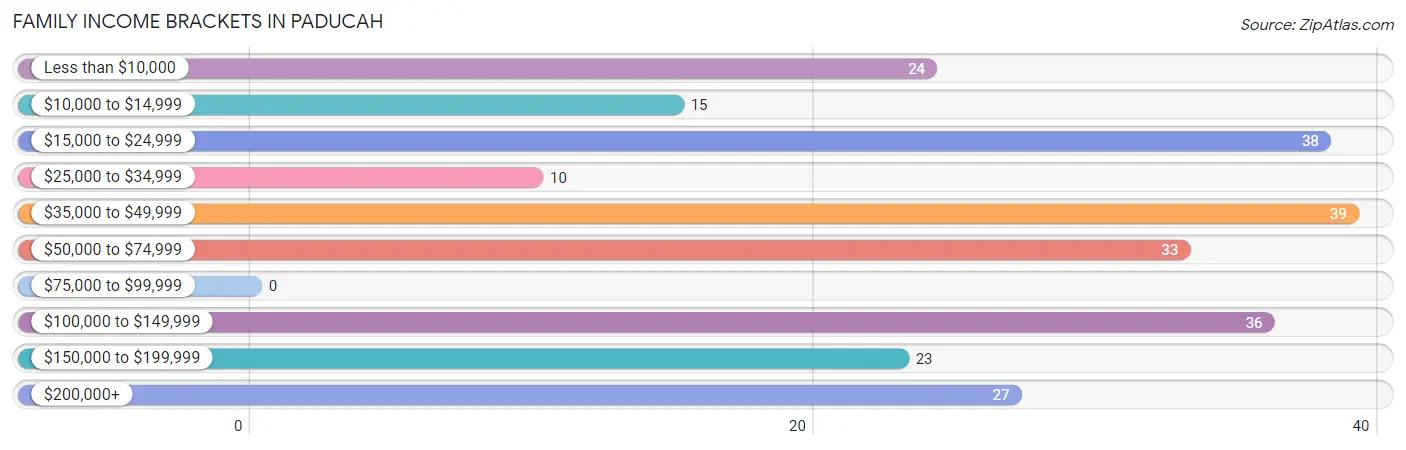
| Income Bracket | # Families | % Families |
| Less than $10,000 | 24 | 9.8% |
| $10,000 to $14,999 | 15 | 6.1% |
| $15,000 to $24,999 | 38 | 15.5% |
| $25,000 to $34,999 | 10 | 4.1% |
| $35,000 to $49,999 | 39 | 15.9% |
| $50,000 to $74,999 | 33 | 13.5% |
| $75,000 to $99,999 | 0 | 0.0% |
| $100,000 to $149,999 | 36 | 14.7% |
| $150,000 to $199,999 | 23 | 9.4% |
| $200,000+ | 27 | 11.0% |
Family Income by Famaliy Size in Paducah
3-person families (56 | 22.9%) account for the highest median family income in Paducah with $55,521 per family, while 3-person families (56 | 22.9%) have the highest median income of $18,507 per family member.
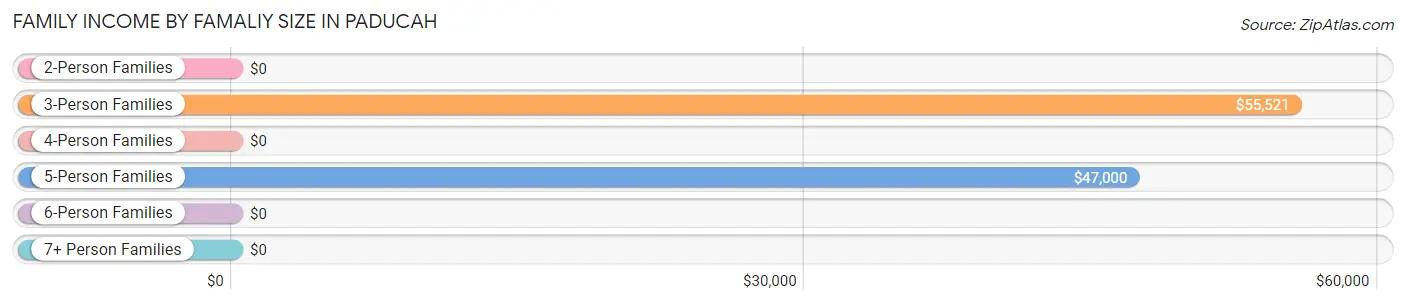
| Income Bracket | # Families | Median Income |
| 2-Person Families | 100 (40.8%) | $0 |
| 3-Person Families | 56 (22.9%) | $55,521 |
| 4-Person Families | 61 (24.9%) | $0 |
| 5-Person Families | 28 (11.4%) | $47,000 |
| 6-Person Families | 0 (0.0%) | $0 |
| 7+ Person Families | 0 (0.0%) | $0 |
| Total | 245 (100.0%) | $46,750 |
Family Income by Number of Earners in Paducah
The median family income in Paducah is $46,750, with families comprising 3+ earners (19) having the highest median family income of $137,250, while families with no earners (52) have the lowest median family income of $14,833, accounting for 7.8% and 21.2% of families, respectively.
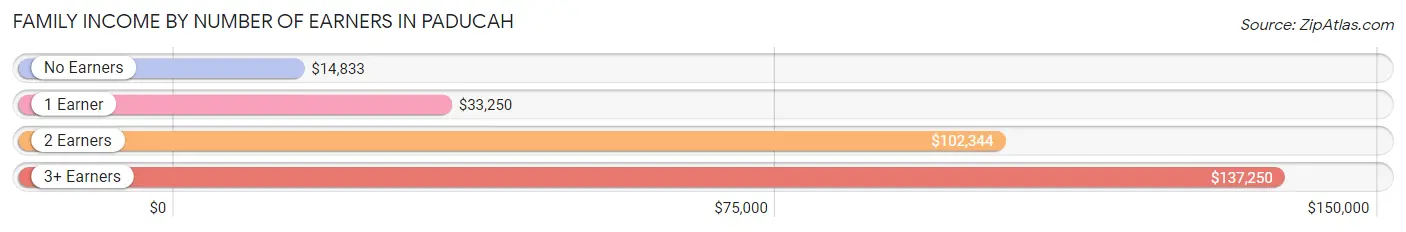
| Number of Earners | # Families | Median Income |
| No Earners | 52 (21.2%) | $14,833 |
| 1 Earner | 78 (31.8%) | $33,250 |
| 2 Earners | 96 (39.2%) | $102,344 |
| 3+ Earners | 19 (7.8%) | $137,250 |
| Total | 245 (100.0%) | $46,750 |
Household Income in Paducah
Household Income Brackets in Paducah
With 139 households falling in the category, the $15,000 to $24,999 income range is the most frequent in Paducah, accounting for 25.3% of all households. In contrast, only 27 households (4.9%) fall into the $200,000+ income bracket, making it the least populous group.
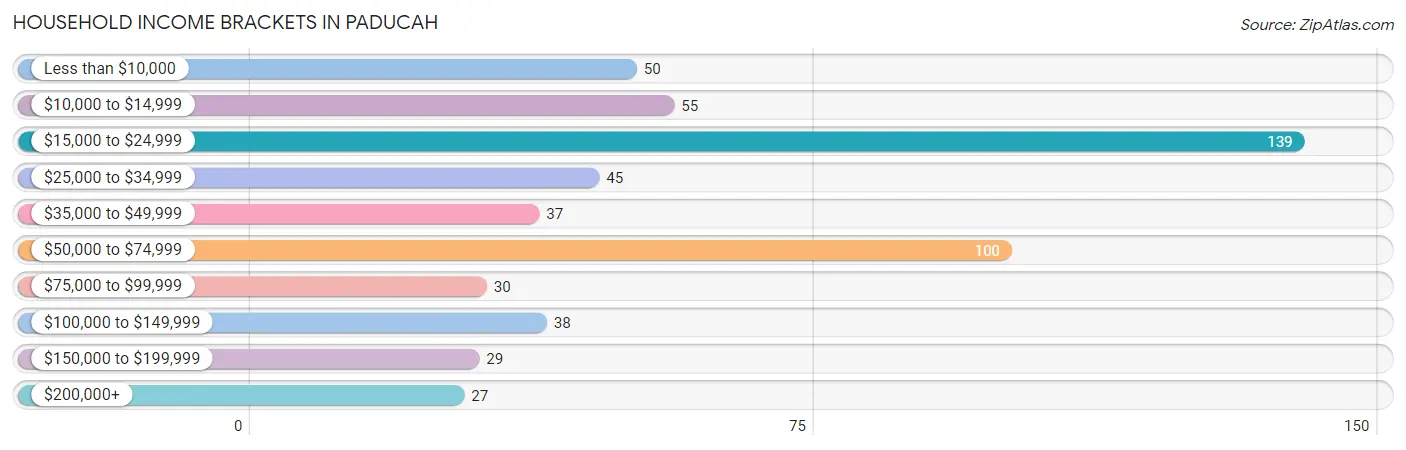
| Income Bracket | # Households | % Households |
| Less than $10,000 | 50 | 9.1% |
| $10,000 to $14,999 | 55 | 10.0% |
| $15,000 to $24,999 | 139 | 25.3% |
| $25,000 to $34,999 | 45 | 8.2% |
| $35,000 to $49,999 | 37 | 6.7% |
| $50,000 to $74,999 | 100 | 18.2% |
| $75,000 to $99,999 | 30 | 5.5% |
| $100,000 to $149,999 | 38 | 6.9% |
| $150,000 to $199,999 | 29 | 5.3% |
| $200,000+ | 27 | 4.9% |
Household Income by Householder Age in Paducah
The median household income in Paducah is $33,250, with the highest median household income of $56,028 found in the 25 to 44 years age bracket for the primary householder. A total of 181 households (32.9%) fall into this category. Meanwhile, the 15 to 24 years age bracket for the primary householder has the lowest median household income of $0, with 8 households (1.5%) in this group.
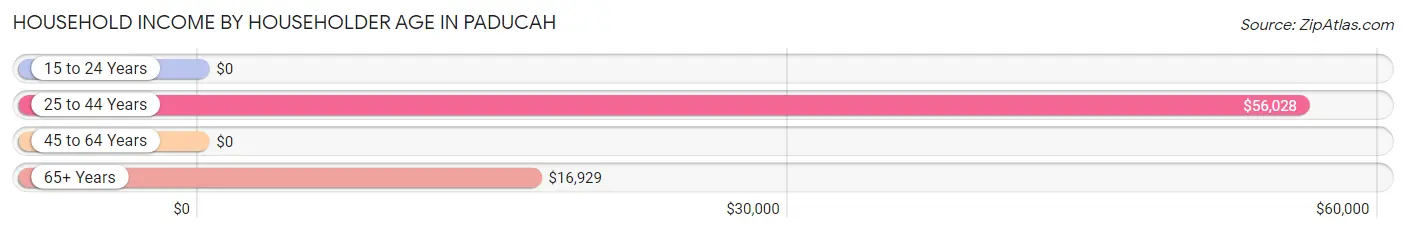
| Income Bracket | # Households | Median Income |
| 15 to 24 Years | 8 (1.5%) | $0 |
| 25 to 44 Years | 181 (32.9%) | $56,028 |
| 45 to 64 Years | 137 (24.9%) | $0 |
| 65+ Years | 224 (40.7%) | $16,929 |
| Total | 550 (100.0%) | $33,250 |
Poverty in Paducah
Income Below Poverty by Sex and Age in Paducah
With 27.8% poverty level for males and 37.6% for females among the residents of Paducah, under 5 year old males and 6 to 11 year old females are the most vulnerable to poverty, with 39 males (78.0%) and 25 females (73.5%) in their respective age groups living below the poverty level.
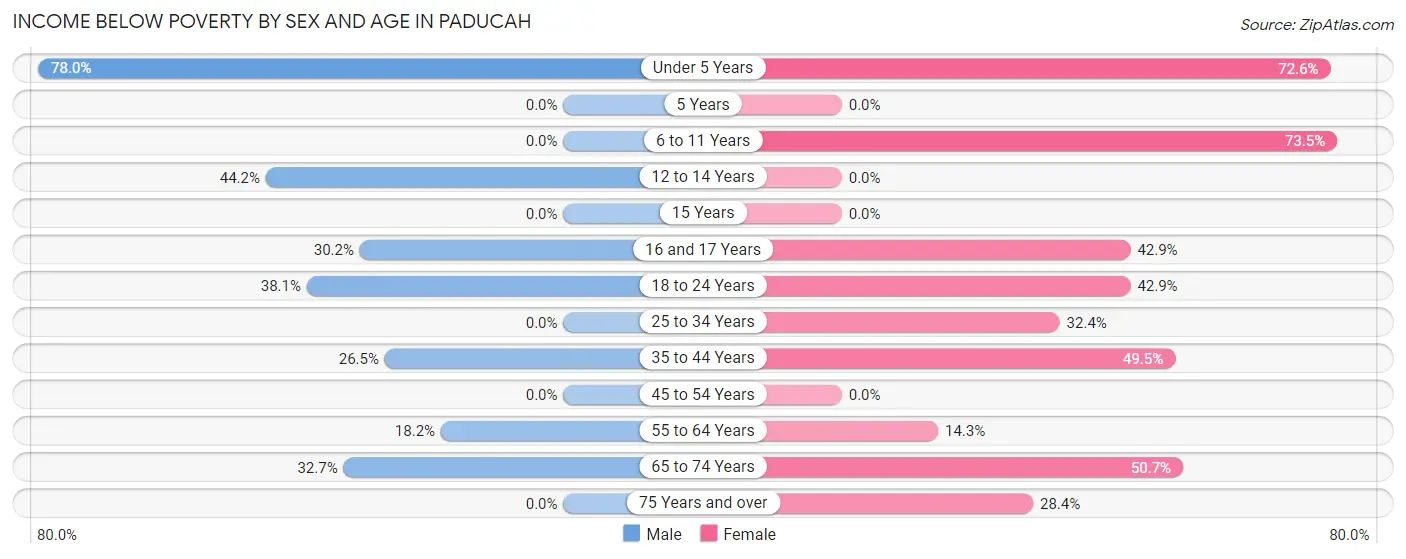
| Age Bracket | Male | Female |
| Under 5 Years | 39 (78.0%) | 37 (72.6%) |
| 5 Years | 0 (0.0%) | 0 (0.0%) |
| 6 to 11 Years | 0 (0.0%) | 25 (73.5%) |
| 12 to 14 Years | 38 (44.2%) | 0 (0.0%) |
| 15 Years | 0 (0.0%) | 0 (0.0%) |
| 16 and 17 Years | 13 (30.2%) | 6 (42.9%) |
| 18 to 24 Years | 24 (38.1%) | 12 (42.9%) |
| 25 to 34 Years | 0 (0.0%) | 22 (32.4%) |
| 35 to 44 Years | 22 (26.5%) | 48 (49.5%) |
| 45 to 54 Years | 0 (0.0%) | 0 (0.0%) |
| 55 to 64 Years | 4 (18.2%) | 7 (14.3%) |
| 65 to 74 Years | 32 (32.7%) | 39 (50.6%) |
| 75 Years and over | 0 (0.0%) | 23 (28.4%) |
| Total | 172 (27.8%) | 219 (37.6%) |
Income Above Poverty by Sex and Age in Paducah
According to the poverty statistics in Paducah, males aged 6 to 11 years and females aged 5 years are the age groups that are most secure financially, with 100.0% of males and 100.0% of females in these age groups living above the poverty line.
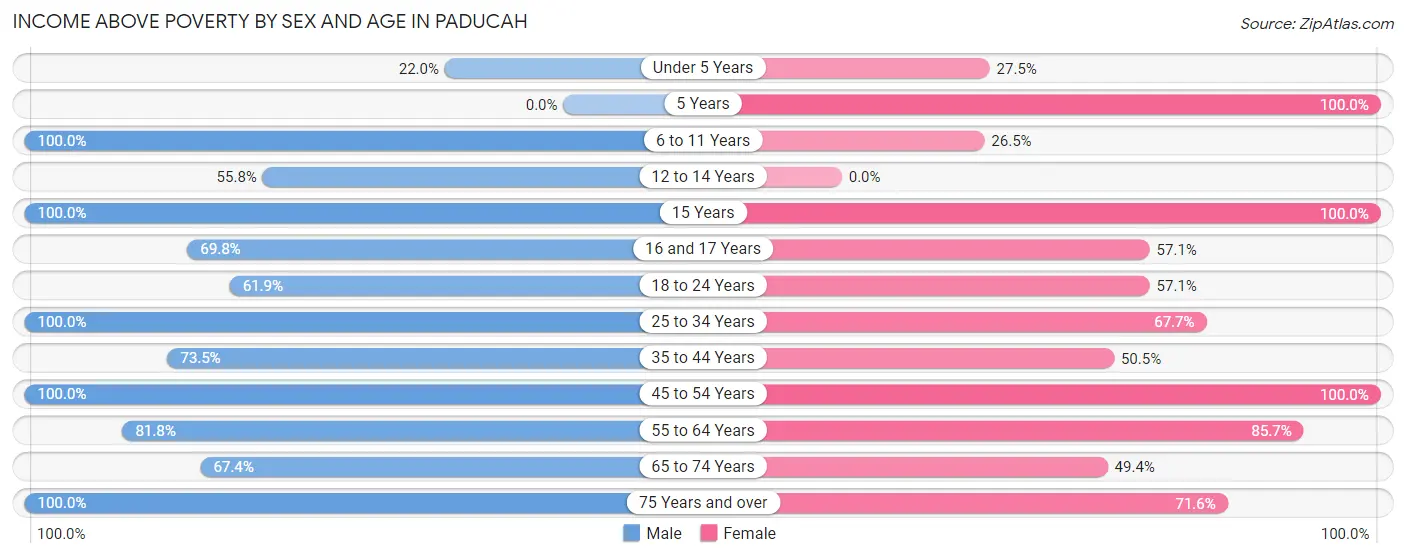
| Age Bracket | Male | Female |
| Under 5 Years | 11 (22.0%) | 14 (27.5%) |
| 5 Years | 0 (0.0%) | 2 (100.0%) |
| 6 to 11 Years | 63 (100.0%) | 9 (26.5%) |
| 12 to 14 Years | 48 (55.8%) | 0 (0.0%) |
| 15 Years | 5 (100.0%) | 8 (100.0%) |
| 16 and 17 Years | 30 (69.8%) | 8 (57.1%) |
| 18 to 24 Years | 39 (61.9%) | 16 (57.1%) |
| 25 to 34 Years | 45 (100.0%) | 46 (67.6%) |
| 35 to 44 Years | 61 (73.5%) | 49 (50.5%) |
| 45 to 54 Years | 34 (100.0%) | 73 (100.0%) |
| 55 to 64 Years | 18 (81.8%) | 42 (85.7%) |
| 65 to 74 Years | 66 (67.3%) | 38 (49.3%) |
| 75 Years and over | 27 (100.0%) | 58 (71.6%) |
| Total | 447 (72.2%) | 363 (62.4%) |
Income Below Poverty Among Married-Couple Families in Paducah
The poverty statistics for married-couple families in Paducah show that 13.1% or 19 of the total 145 families live below the poverty line. Families with no children have the highest poverty rate of 22.9%, comprising of 19 families. On the other hand, families with 1 or 2 children have the lowest poverty rate of 0.0%, which includes 0 families.
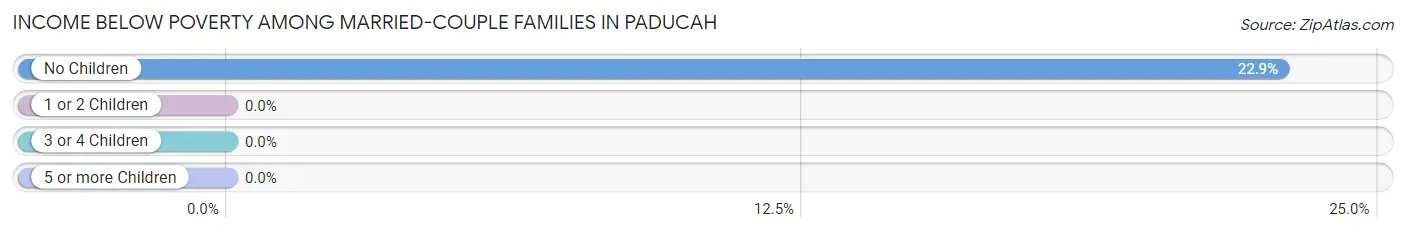
| Children | Above Poverty | Below Poverty |
| No Children | 64 (77.1%) | 19 (22.9%) |
| 1 or 2 Children | 54 (100.0%) | 0 (0.0%) |
| 3 or 4 Children | 8 (100.0%) | 0 (0.0%) |
| 5 or more Children | 0 (0.0%) | 0 (0.0%) |
| Total | 126 (86.9%) | 19 (13.1%) |
Income Below Poverty Among Single-Parent Households in Paducah
According to the poverty data in Paducah, 41.7% or 10 single-father households and 63.2% or 48 single-mother households are living below the poverty line. Among single-father households, those with 1 or 2 children have the highest poverty rate, with 10 households (83.3%) experiencing poverty. Likewise, among single-mother households, those with 3 or 4 children have the highest poverty rate, with 28 households (84.9%) falling below the poverty line.
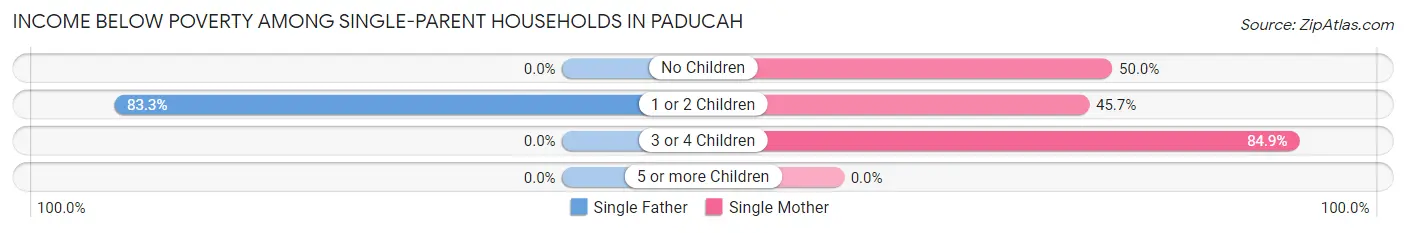
| Children | Single Father | Single Mother |
| No Children | 0 (0.0%) | 4 (50.0%) |
| 1 or 2 Children | 10 (83.3%) | 16 (45.7%) |
| 3 or 4 Children | 0 (0.0%) | 28 (84.9%) |
| 5 or more Children | 0 (0.0%) | 0 (0.0%) |
| Total | 10 (41.7%) | 48 (63.2%) |
Income Below Poverty Among Married-Couple vs Single-Parent Households in Paducah
The poverty data for Paducah shows that 19 of the married-couple family households (13.1%) and 58 of the single-parent households (58.0%) are living below the poverty level. Within the married-couple family households, those with no children have the highest poverty rate, with 19 households (22.9%) falling below the poverty line. Among the single-parent households, those with 3 or 4 children have the highest poverty rate, with 28 household (62.2%) living below poverty.
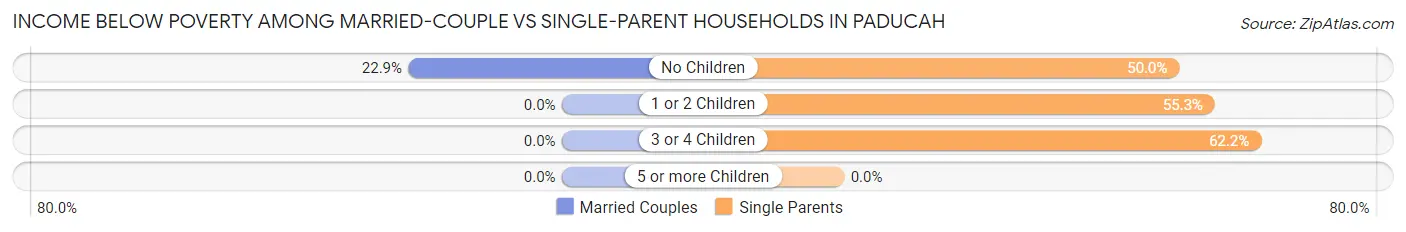
| Children | Married-Couple Families | Single-Parent Households |
| No Children | 19 (22.9%) | 4 (50.0%) |
| 1 or 2 Children | 0 (0.0%) | 26 (55.3%) |
| 3 or 4 Children | 0 (0.0%) | 28 (62.2%) |
| 5 or more Children | 0 (0.0%) | 0 (0.0%) |
| Total | 19 (13.1%) | 58 (58.0%) |
Race in Paducah
The most populous races in Paducah are White / Caucasian (814 | 67.8%), Two or more Races (264 | 22.0%), and Hispanic or Latino (261 | 21.7%).
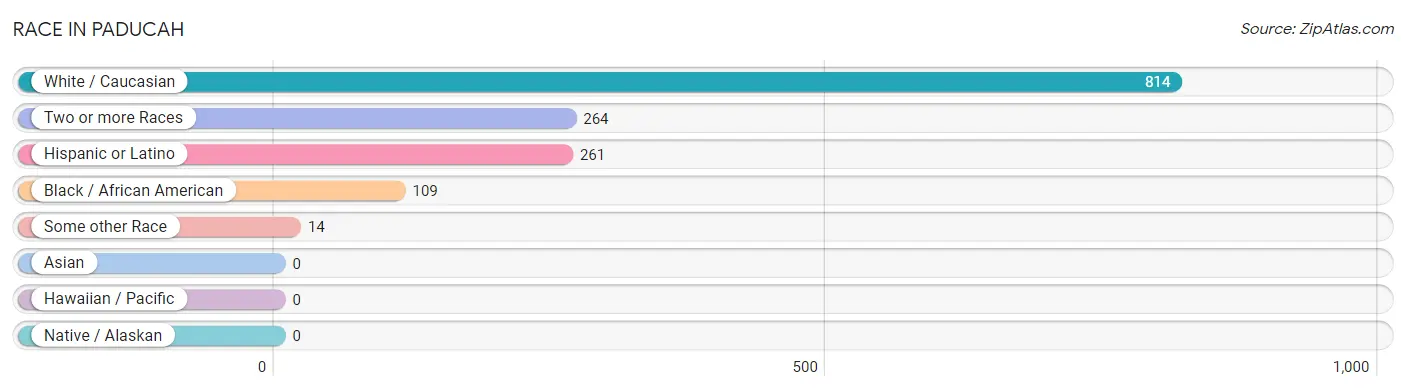
| Race | # Population | % Population |
| Asian | 0 | 0.0% |
| Black / African American | 109 | 9.1% |
| Hawaiian / Pacific | 0 | 0.0% |
| Hispanic or Latino | 261 | 21.7% |
| Native / Alaskan | 0 | 0.0% |
| White / Caucasian | 814 | 67.8% |
| Two or more Races | 264 | 22.0% |
| Some other Race | 14 | 1.2% |
| Total | 1,201 | 100.0% |
Ancestry in Paducah
The most populous ancestries reported in Paducah are Mexican (244 | 20.3%), Irish (127 | 10.6%), European (116 | 9.7%), Burmese (78 | 6.5%), and German (74 | 6.2%), together accounting for 53.2% of all Paducah residents.
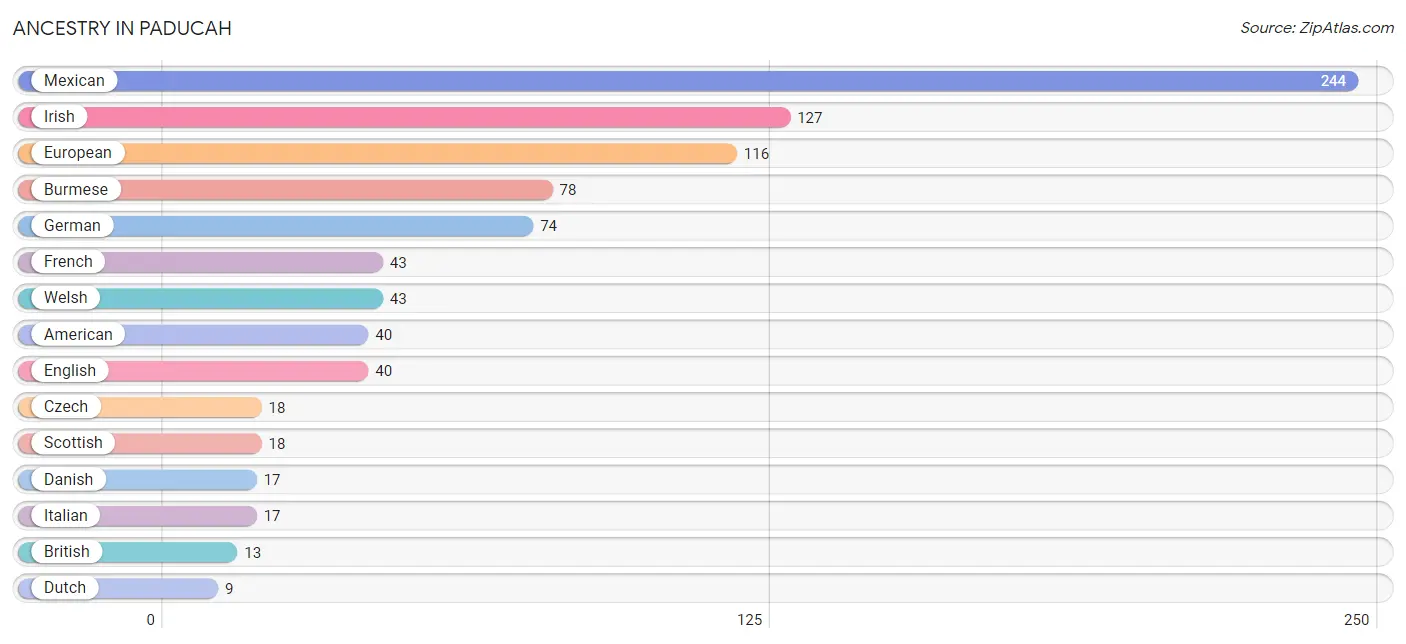
| Ancestry | # Population | % Population |
| American | 40 | 3.3% |
| Blackfeet | 5 | 0.4% |
| British | 13 | 1.1% |
| Burmese | 78 | 6.5% |
| Cherokee | 5 | 0.4% |
| Choctaw | 2 | 0.2% |
| Czech | 18 | 1.5% |
| Danish | 17 | 1.4% |
| Dutch | 9 | 0.7% |
| English | 40 | 3.3% |
| European | 116 | 9.7% |
| French | 43 | 3.6% |
| German | 74 | 6.2% |
| German Russian | 9 | 0.7% |
| Irish | 127 | 10.6% |
| Italian | 17 | 1.4% |
| Mexican | 244 | 20.3% |
| Scotch-Irish | 8 | 0.7% |
| Scottish | 18 | 1.5% |
| Welsh | 43 | 3.6% | View All 20 Rows |
Immigrants in Paducah

| Immigration Origin | # Population | % Population | View All 0 Rows |
Sex and Age in Paducah
Sex and Age in Paducah
The most populous age groups in Paducah are 10 to 14 Years (128 | 20.7%) for men and 50 to 54 Years (52 | 8.9%) for women.
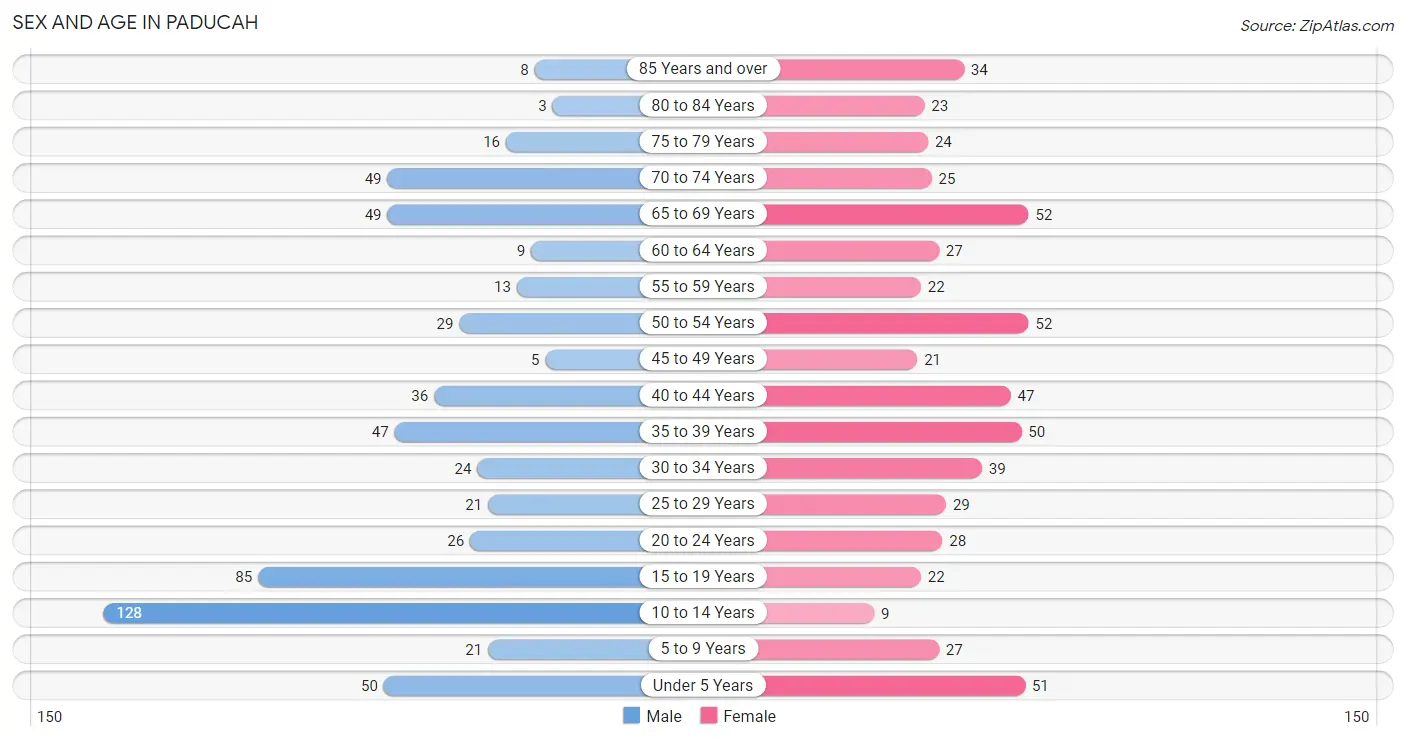
| Age Bracket | Male | Female |
| Under 5 Years | 50 (8.1%) | 51 (8.8%) |
| 5 to 9 Years | 21 (3.4%) | 27 (4.6%) |
| 10 to 14 Years | 128 (20.7%) | 9 (1.5%) |
| 15 to 19 Years | 85 (13.7%) | 22 (3.8%) |
| 20 to 24 Years | 26 (4.2%) | 28 (4.8%) |
| 25 to 29 Years | 21 (3.4%) | 29 (5.0%) |
| 30 to 34 Years | 24 (3.9%) | 39 (6.7%) |
| 35 to 39 Years | 47 (7.6%) | 50 (8.6%) |
| 40 to 44 Years | 36 (5.8%) | 47 (8.1%) |
| 45 to 49 Years | 5 (0.8%) | 21 (3.6%) |
| 50 to 54 Years | 29 (4.7%) | 52 (8.9%) |
| 55 to 59 Years | 13 (2.1%) | 22 (3.8%) |
| 60 to 64 Years | 9 (1.5%) | 27 (4.6%) |
| 65 to 69 Years | 49 (7.9%) | 52 (8.9%) |
| 70 to 74 Years | 49 (7.9%) | 25 (4.3%) |
| 75 to 79 Years | 16 (2.6%) | 24 (4.1%) |
| 80 to 84 Years | 3 (0.5%) | 23 (4.0%) |
| 85 Years and over | 8 (1.3%) | 34 (5.8%) |
| Total | 619 (100.0%) | 582 (100.0%) |
Families and Households in Paducah
Median Family Size in Paducah
The median family size in Paducah is 3.36 persons per family, with single female/mother families (76 | 31.0%) accounting for the largest median family size of 4.59 persons per family. On the other hand, married-couple families (145 | 59.2%) represent the smallest median family size with 2.54 persons per family.
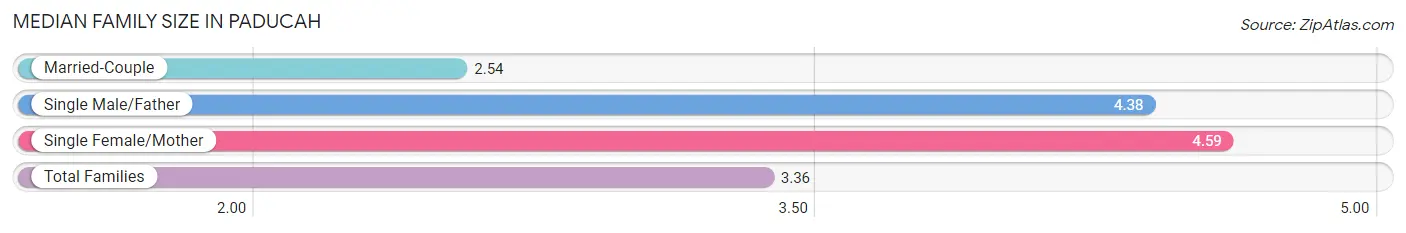
| Family Type | # Families | Family Size |
| Married-Couple | 145 (59.2%) | 2.54 |
| Single Male/Father | 24 (9.8%) | 4.38 |
| Single Female/Mother | 76 (31.0%) | 4.59 |
| Total Families | 245 (100.0%) | 3.36 |
Median Household Size in Paducah
The median household size in Paducah is 2.18 persons per household, with single male/father households (24 | 4.4%) accounting for the largest median household size of 5.71 persons per household. non-family households (305 | 55.4%) represent the smallest median household size with 1.09 persons per household.
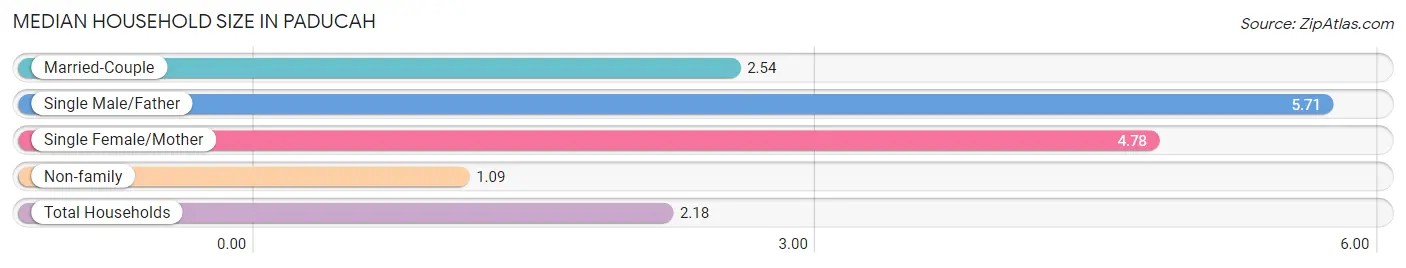
| Household Type | # Households | Household Size |
| Married-Couple | 145 (26.4%) | 2.54 |
| Single Male/Father | 24 (4.4%) | 5.71 |
| Single Female/Mother | 76 (13.8%) | 4.78 |
| Non-family | 305 (55.4%) | 1.09 |
| Total Households | 550 (100.0%) | 2.18 |
Household Size by Marriage Status in Paducah
Out of a total of 550 households in Paducah, 245 (44.6%) are family households, while 305 (55.4%) are nonfamily households. The most numerous type of family households are 2-person households, comprising 100, and the most common type of nonfamily households are 1-person households, comprising 295.
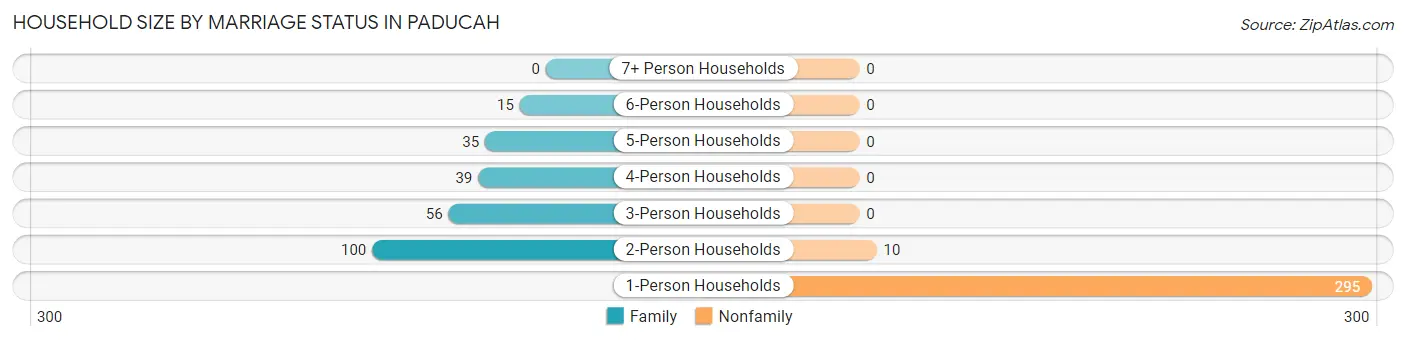
| Household Size | Family Households | Nonfamily Households |
| 1-Person Households | - | 295 (53.6%) |
| 2-Person Households | 100 (18.2%) | 10 (1.8%) |
| 3-Person Households | 56 (10.2%) | 0 (0.0%) |
| 4-Person Households | 39 (7.1%) | 0 (0.0%) |
| 5-Person Households | 35 (6.4%) | 0 (0.0%) |
| 6-Person Households | 15 (2.7%) | 0 (0.0%) |
| 7+ Person Households | 0 (0.0%) | 0 (0.0%) |
| Total | 245 (44.6%) | 305 (55.4%) |
Female Fertility in Paducah
Fertility by Age in Paducah
Average fertility rate in Paducah is 99.0 births per 1,000 women. Women in the age bracket of 20 to 34 years have the highest fertility rate with 250.0 births per 1,000 women. Women in the age bracket of 20 to 34 years acount for 100.0% of all women with births.
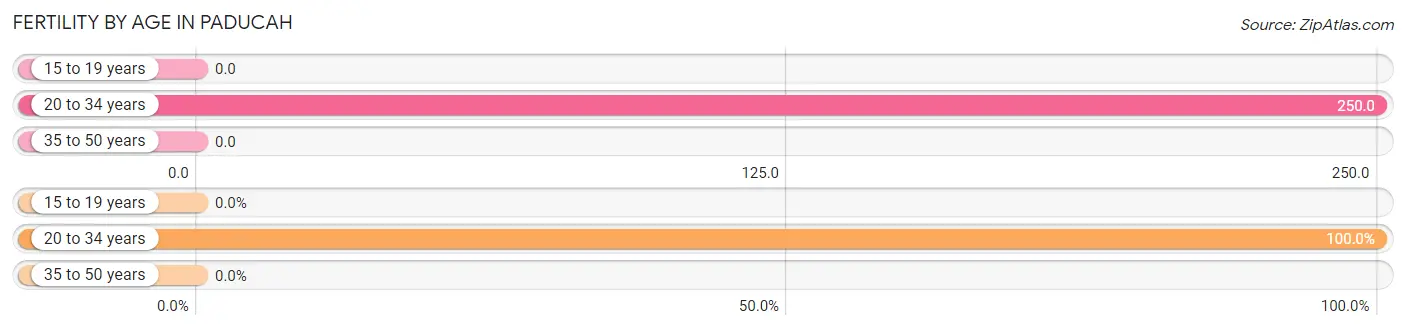
| Age Bracket | Women with Births | Births / 1,000 Women |
| 15 to 19 years | 0 (0.0%) | 0.0 |
| 20 to 34 years | 24 (100.0%) | 250.0 |
| 35 to 50 years | 0 (0.0%) | 0.0 |
| Total | 24 (100.0%) | 99.0 |
Fertility by Age by Marriage Status in Paducah
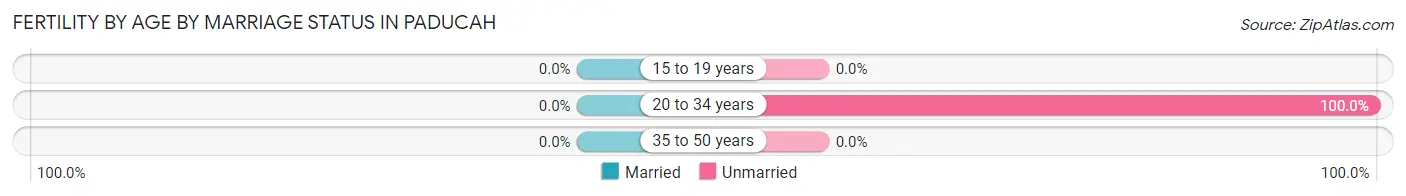
| Age Bracket | Married | Unmarried |
| 15 to 19 years | 0 (0.0%) | 0 (0.0%) |
| 20 to 34 years | 0 (0.0%) | 24 (100.0%) |
| 35 to 50 years | 0 (0.0%) | 0 (0.0%) |
| Total | 0 (0.0%) | 24 (100.0%) |
Fertility by Education in Paducah
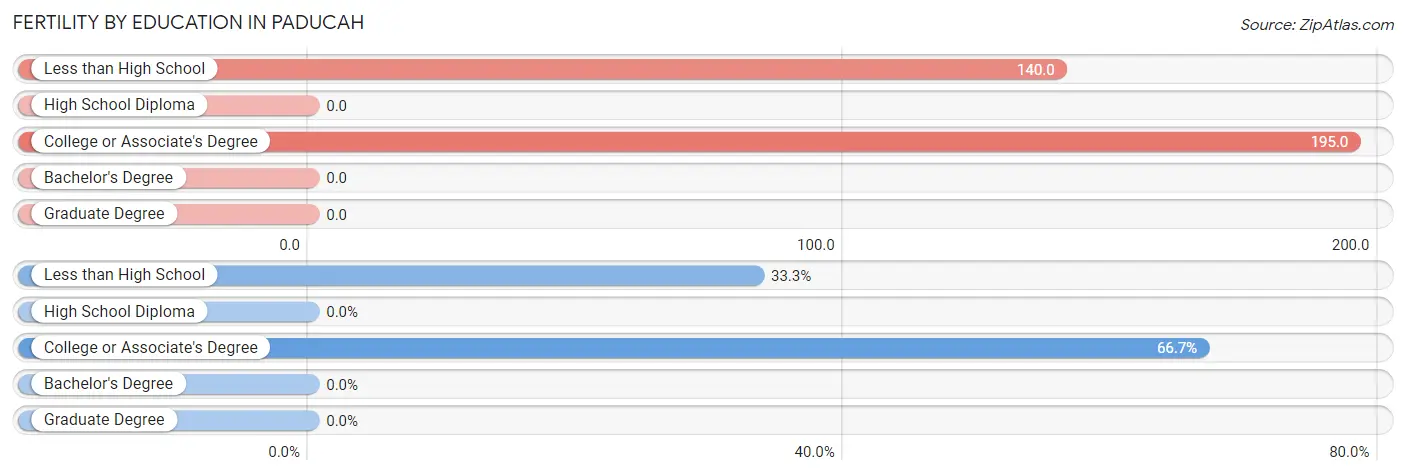
| Educational Attainment | Women with Births | Births / 1,000 Women |
| Less than High School | 8 (33.3%) | 140.0 |
| High School Diploma | 0 (0.0%) | 0.0 |
| College or Associate's Degree | 16 (66.7%) | 195.0 |
| Bachelor's Degree | 0 (0.0%) | 0.0 |
| Graduate Degree | 0 (0.0%) | 0.0 |
| Total | 24 (100.0%) | 99.0 |
Fertility by Education by Marriage Status in Paducah
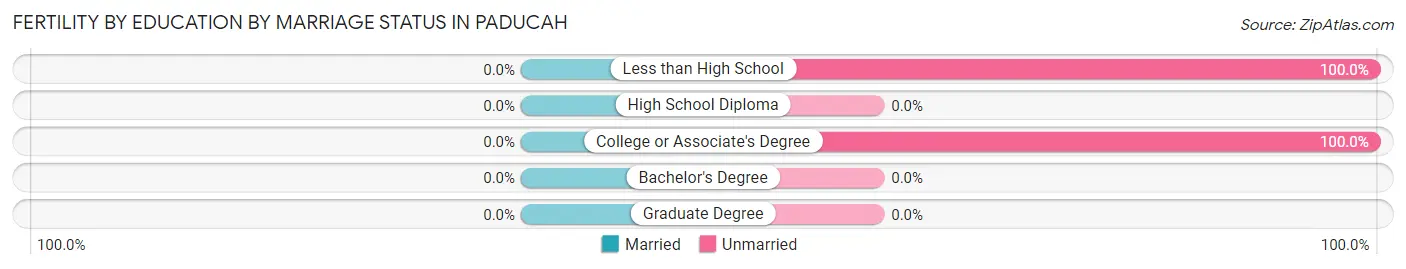
| Educational Attainment | Married | Unmarried |
| Less than High School | 0 (0.0%) | 8 (100.0%) |
| High School Diploma | 0 (0.0%) | 0 (0.0%) |
| College or Associate's Degree | 0 (0.0%) | 16 (100.0%) |
| Bachelor's Degree | 0 (0.0%) | 0 (0.0%) |
| Graduate Degree | 0 (0.0%) | 0 (0.0%) |
| Total | 0 (0.0%) | 24 (100.0%) |
Employment Characteristics in Paducah
Employment by Class of Employer in Paducah
Among the 477 employed individuals in Paducah, private company employees (225 | 47.2%), not-for-profit organizations (70 | 14.7%), and self-employed (not incorporated) (55 | 11.5%) make up the most common classes of employment.
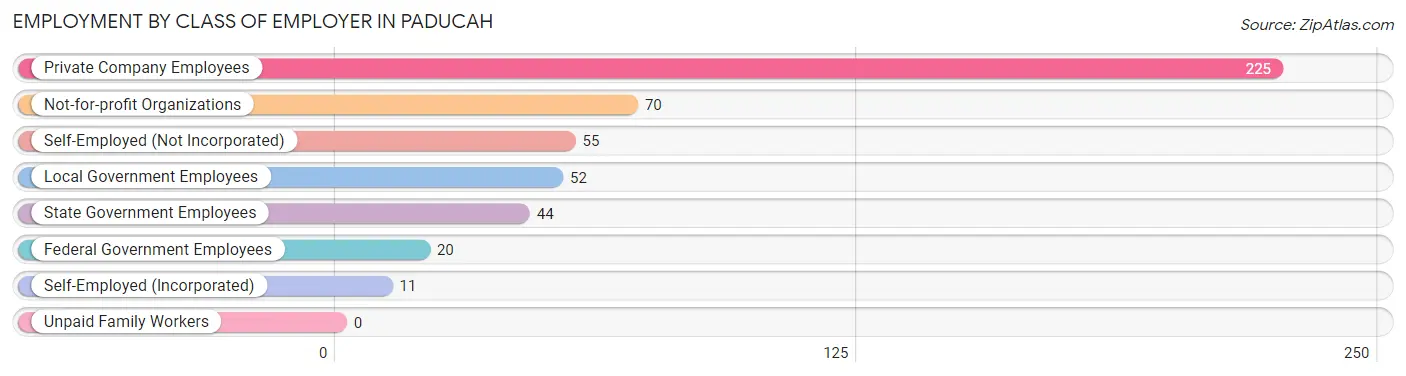
| Employer Class | # Employees | % Employees |
| Private Company Employees | 225 | 47.2% |
| Self-Employed (Incorporated) | 11 | 2.3% |
| Self-Employed (Not Incorporated) | 55 | 11.5% |
| Not-for-profit Organizations | 70 | 14.7% |
| Local Government Employees | 52 | 10.9% |
| State Government Employees | 44 | 9.2% |
| Federal Government Employees | 20 | 4.2% |
| Unpaid Family Workers | 0 | 0.0% |
| Total | 477 | 100.0% |
Employment Status by Age in Paducah
According to the labor force statistics for Paducah, out of the total population over 16 years of age (902), 56.8% or 512 individuals are in the labor force, with 6.1% or 31 of them unemployed. The age group with the highest labor force participation rate is 25 to 29 years, with 100.0% or 50 individuals in the labor force. Within the labor force, the 75 years and over age range has the highest percentage of unemployed individuals, with 100.0% or 8 of them being unemployed.
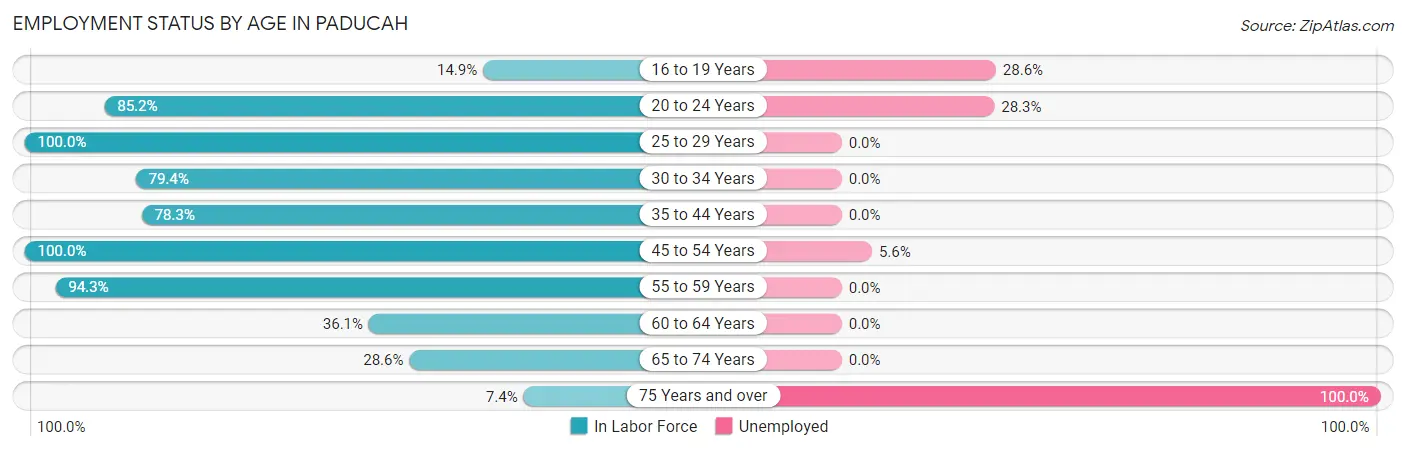
| Age Bracket | In Labor Force | Unemployed |
| 16 to 19 Years | 14 (14.9%) | 4 (28.6%) |
| 20 to 24 Years | 46 (85.2%) | 13 (28.3%) |
| 25 to 29 Years | 50 (100.0%) | 0 (0.0%) |
| 30 to 34 Years | 50 (79.4%) | 0 (0.0%) |
| 35 to 44 Years | 141 (78.3%) | 0 (0.0%) |
| 45 to 54 Years | 107 (100.0%) | 6 (5.6%) |
| 55 to 59 Years | 33 (94.3%) | 0 (0.0%) |
| 60 to 64 Years | 13 (36.1%) | 0 (0.0%) |
| 65 to 74 Years | 50 (28.6%) | 0 (0.0%) |
| 75 Years and over | 8 (7.4%) | 8 (100.0%) |
| Total | 512 (56.8%) | 31 (6.1%) |
Employment Status by Educational Attainment in Paducah
According to labor force statistics for Paducah, 83.7% of individuals (394) out of the total population between 25 and 64 years of age (471) are in the labor force, with 1.5% or 6 of them being unemployed. The group with the highest labor force participation rate are those with the educational attainment of bachelor's degree or higher, with 94.1% or 112 individuals in the labor force. Within the labor force, individuals with bachelor's degree or higher education have the highest percentage of unemployment, with 5.4% or 6 of them being unemployed.
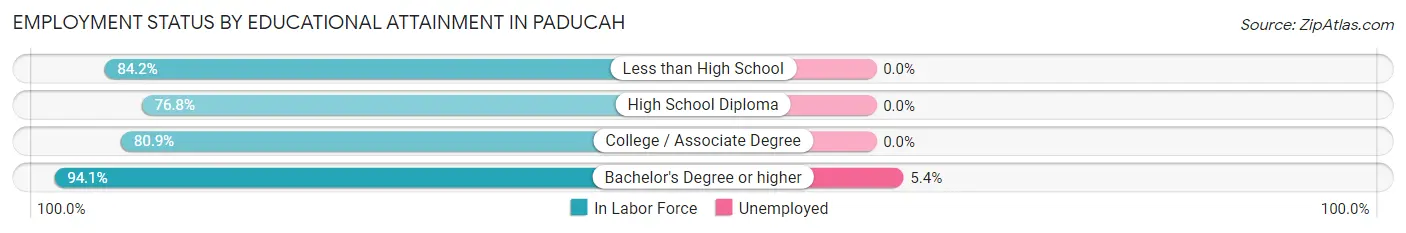
| Educational Attainment | In Labor Force | Unemployed |
| Less than High School | 48 (84.2%) | 0 (0.0%) |
| High School Diploma | 86 (76.8%) | 0 (0.0%) |
| College / Associate Degree | 148 (80.9%) | 0 (0.0%) |
| Bachelor's Degree or higher | 112 (94.1%) | 6 (5.4%) |
| Total | 394 (83.7%) | 7 (1.5%) |
Employment Occupations by Sex in Paducah
Management, Business, Science and Arts Occupations
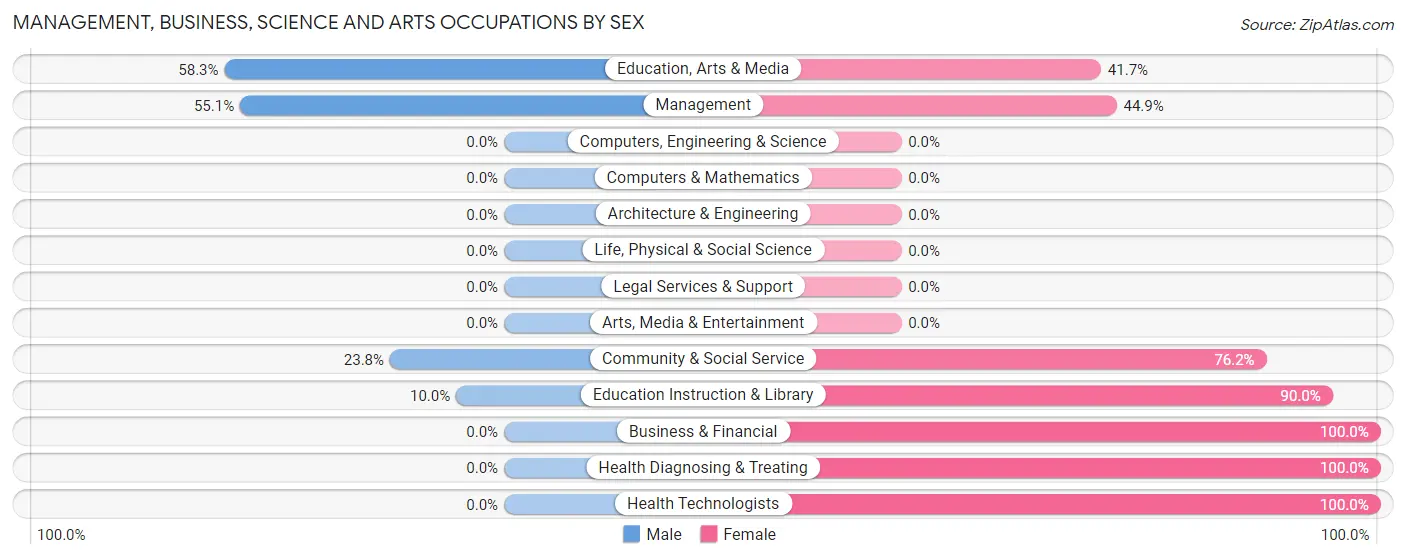
The most common Management, Business, Science and Arts occupations in Paducah are Management (69 | 14.3%), Community & Social Service (42 | 8.7%), Education Instruction & Library (30 | 6.2%), Business & Financial (20 | 4.2%), and Health Diagnosing & Treating (19 | 4.0%).
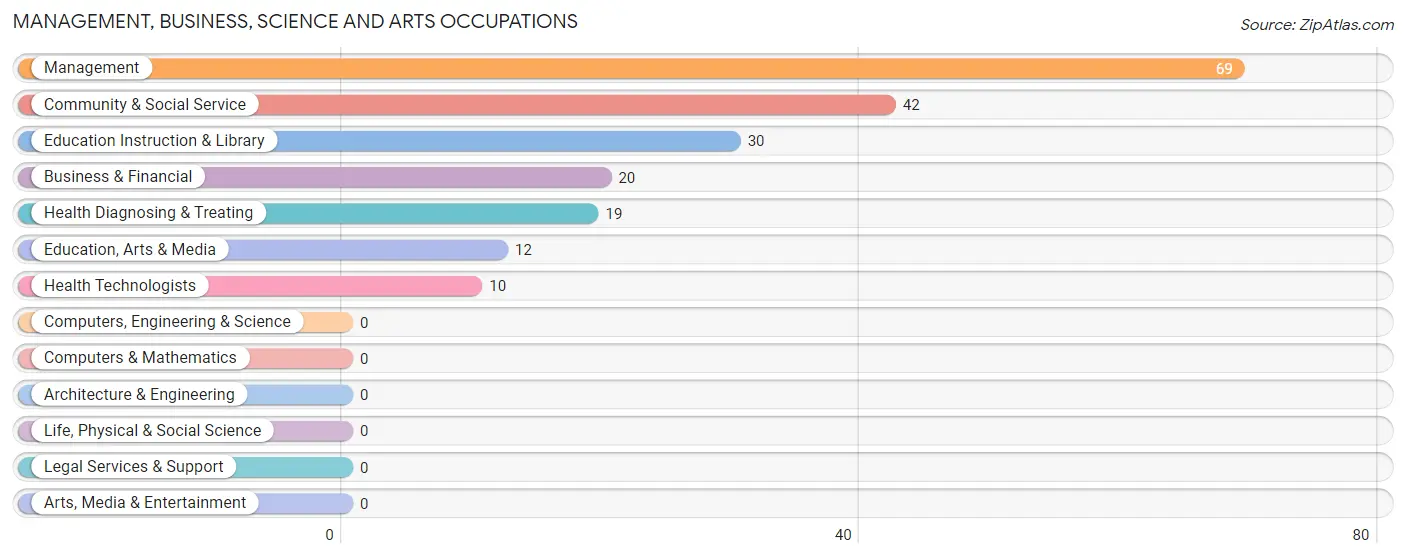
Management, Business, Science and Arts Occupations by Sex
Within the Management, Business, Science and Arts occupations in Paducah, the most male-oriented occupations are Education, Arts & Media (58.3%), Management (55.1%), and Community & Social Service (23.8%), while the most female-oriented occupations are Business & Financial (100.0%), Health Diagnosing & Treating (100.0%), and Health Technologists (100.0%).
| Occupation | Male | Female |
| Management | 38 (55.1%) | 31 (44.9%) |
| Business & Financial | 0 (0.0%) | 20 (100.0%) |
| Computers, Engineering & Science | 0 (0.0%) | 0 (0.0%) |
| Computers & Mathematics | 0 (0.0%) | 0 (0.0%) |
| Architecture & Engineering | 0 (0.0%) | 0 (0.0%) |
| Life, Physical & Social Science | 0 (0.0%) | 0 (0.0%) |
| Community & Social Service | 10 (23.8%) | 32 (76.2%) |
| Education, Arts & Media | 7 (58.3%) | 5 (41.7%) |
| Legal Services & Support | 0 (0.0%) | 0 (0.0%) |
| Education Instruction & Library | 3 (10.0%) | 27 (90.0%) |
| Arts, Media & Entertainment | 0 (0.0%) | 0 (0.0%) |
| Health Diagnosing & Treating | 0 (0.0%) | 19 (100.0%) |
| Health Technologists | 0 (0.0%) | 10 (100.0%) |
| Total (Category) | 48 (32.0%) | 102 (68.0%) |
| Total (Overall) | 234 (48.6%) | 247 (51.3%) |
Services Occupations
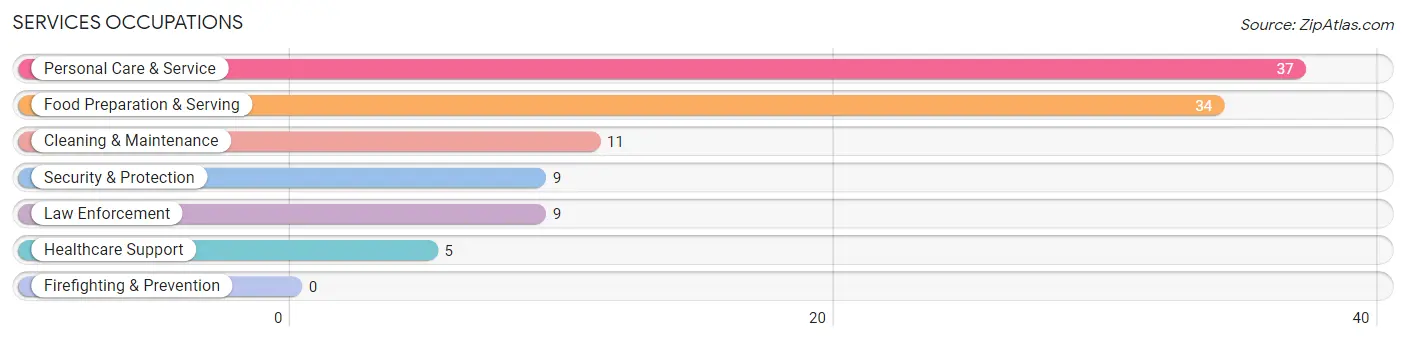
The most common Services occupations in Paducah are Personal Care & Service (37 | 7.7%), Food Preparation & Serving (34 | 7.1%), Cleaning & Maintenance (11 | 2.3%), Security & Protection (9 | 1.9%), and Law Enforcement (9 | 1.9%).
Services Occupations by Sex
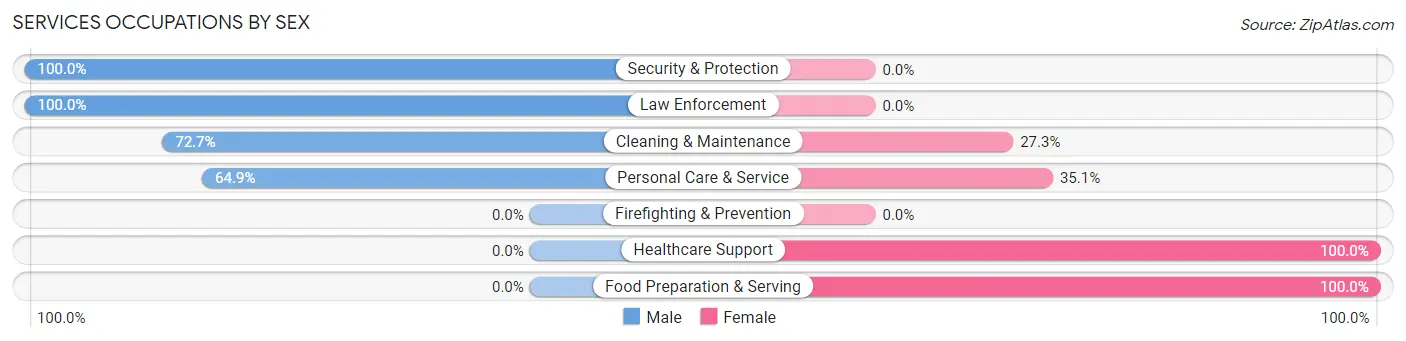
Within the Services occupations in Paducah, the most male-oriented occupations are Security & Protection (100.0%), Law Enforcement (100.0%), and Cleaning & Maintenance (72.7%), while the most female-oriented occupations are Healthcare Support (100.0%), Food Preparation & Serving (100.0%), and Personal Care & Service (35.1%).
| Occupation | Male | Female |
| Healthcare Support | 0 (0.0%) | 5 (100.0%) |
| Security & Protection | 9 (100.0%) | 0 (0.0%) |
| Firefighting & Prevention | 0 (0.0%) | 0 (0.0%) |
| Law Enforcement | 9 (100.0%) | 0 (0.0%) |
| Food Preparation & Serving | 0 (0.0%) | 34 (100.0%) |
| Cleaning & Maintenance | 8 (72.7%) | 3 (27.3%) |
| Personal Care & Service | 24 (64.9%) | 13 (35.1%) |
| Total (Category) | 41 (42.7%) | 55 (57.3%) |
| Total (Overall) | 234 (48.6%) | 247 (51.3%) |
Sales and Office Occupations
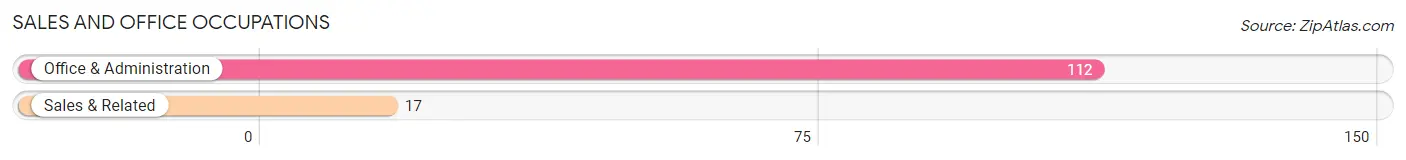
The most common Sales and Office occupations in Paducah are Office & Administration (112 | 23.3%), and Sales & Related (17 | 3.5%).
Sales and Office Occupations by Sex
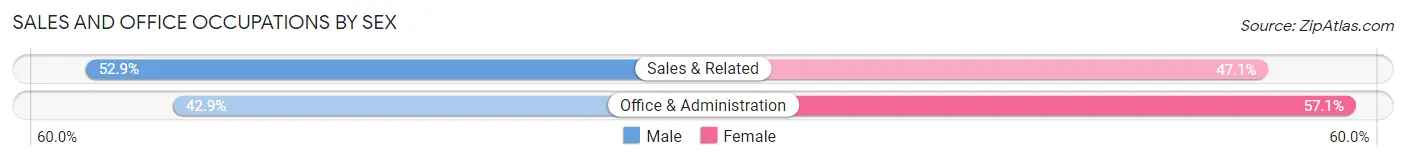
| Occupation | Male | Female |
| Sales & Related | 9 (52.9%) | 8 (47.1%) |
| Office & Administration | 48 (42.9%) | 64 (57.1%) |
| Total (Category) | 57 (44.2%) | 72 (55.8%) |
| Total (Overall) | 234 (48.6%) | 247 (51.3%) |
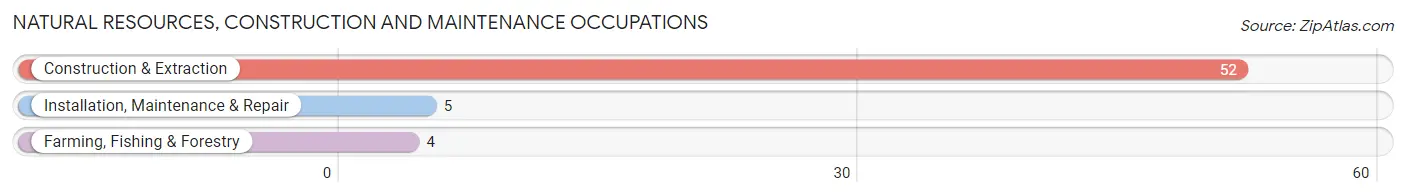
Natural Resources, Construction and Maintenance Occupations
The most common Natural Resources, Construction and Maintenance occupations in Paducah are Construction & Extraction (52 | 10.8%), Installation, Maintenance & Repair (5 | 1.0%), and Farming, Fishing & Forestry (4 | 0.8%).
Natural Resources, Construction and Maintenance Occupations by Sex
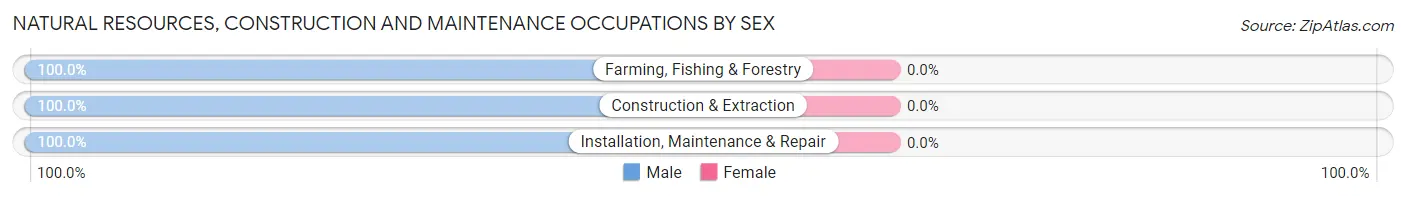
| Occupation | Male | Female |
| Farming, Fishing & Forestry | 4 (100.0%) | 0 (0.0%) |
| Construction & Extraction | 52 (100.0%) | 0 (0.0%) |
| Installation, Maintenance & Repair | 5 (100.0%) | 0 (0.0%) |
| Total (Category) | 61 (100.0%) | 0 (0.0%) |
| Total (Overall) | 234 (48.6%) | 247 (51.3%) |
Production, Transportation and Moving Occupations
The most common Production, Transportation and Moving occupations in Paducah are , and Material Moving (45 | 9.4%).
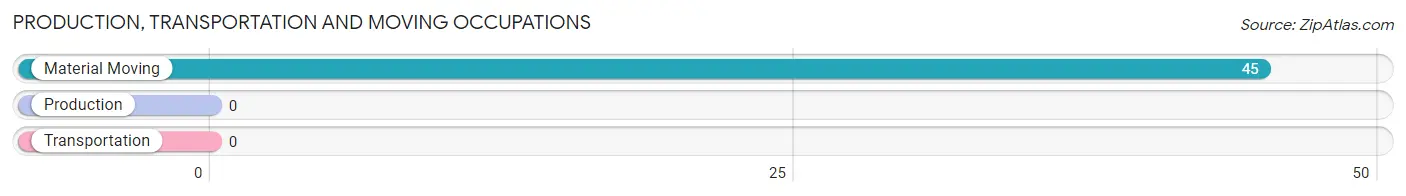
Production, Transportation and Moving Occupations by Sex
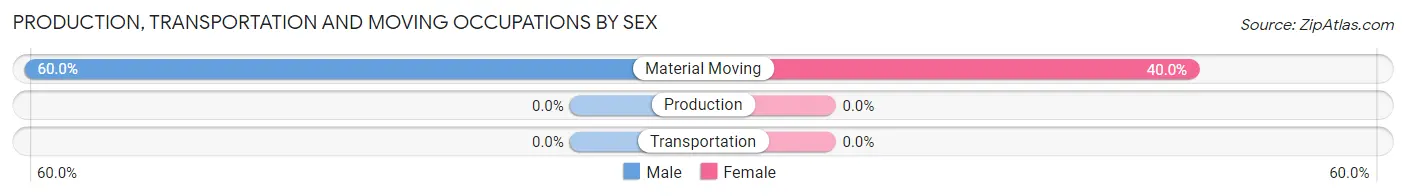
| Occupation | Male | Female |
| Production | 0 (0.0%) | 0 (0.0%) |
| Transportation | 0 (0.0%) | 0 (0.0%) |
| Material Moving | 27 (60.0%) | 18 (40.0%) |
| Total (Category) | 27 (60.0%) | 18 (40.0%) |
| Total (Overall) | 234 (48.6%) | 247 (51.3%) |
Employment Industries by Sex in Paducah
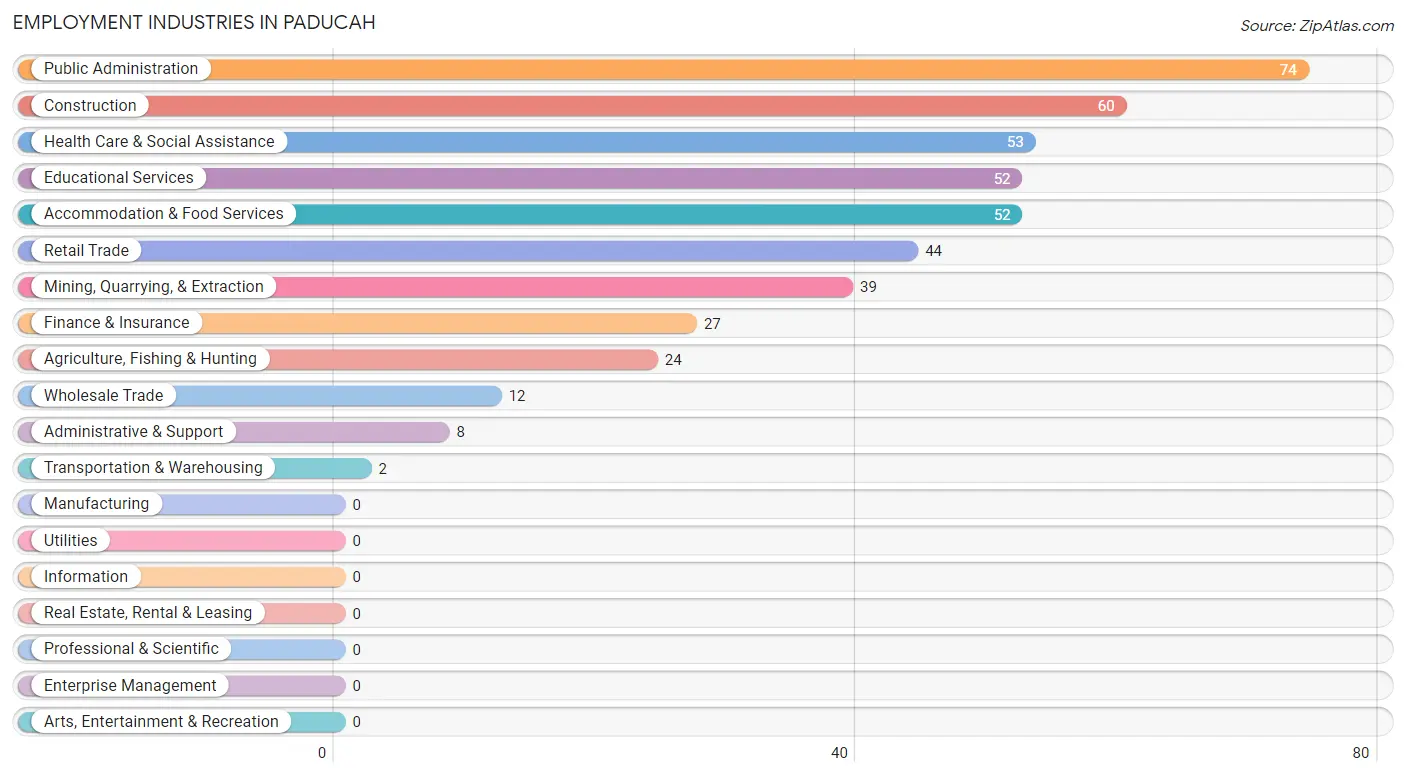
Employment Industries in Paducah
The major employment industries in Paducah include Public Administration (74 | 15.4%), Construction (60 | 12.5%), Health Care & Social Assistance (53 | 11.0%), Educational Services (52 | 10.8%), and Accommodation & Food Services (52 | 10.8%).
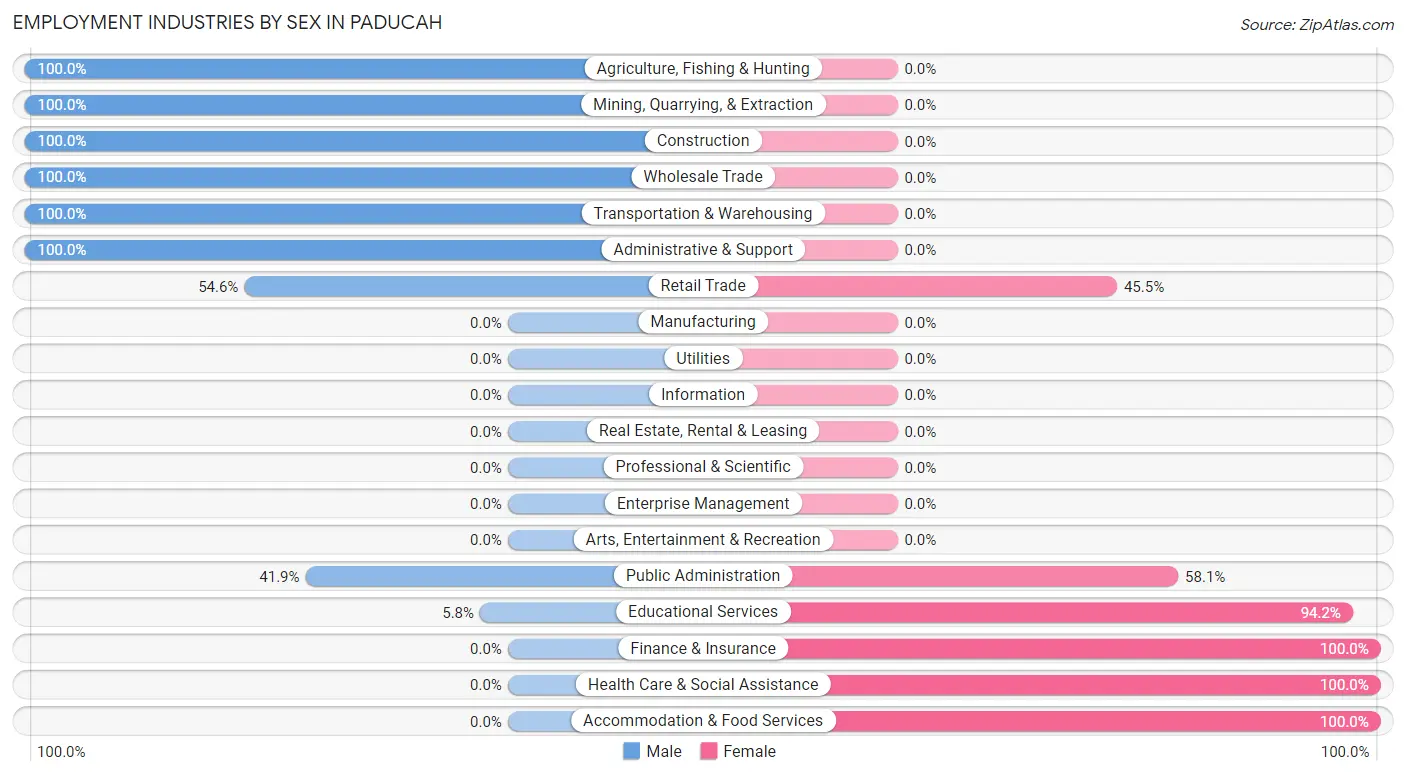
Employment Industries by Sex in Paducah
The Paducah industries that see more men than women are Agriculture, Fishing & Hunting (100.0%), Mining, Quarrying, & Extraction (100.0%), and Construction (100.0%), whereas the industries that tend to have a higher number of women are Finance & Insurance (100.0%), Health Care & Social Assistance (100.0%), and Accommodation & Food Services (100.0%).
| Industry | Male | Female |
| Agriculture, Fishing & Hunting | 24 (100.0%) | 0 (0.0%) |
| Mining, Quarrying, & Extraction | 39 (100.0%) | 0 (0.0%) |
| Construction | 60 (100.0%) | 0 (0.0%) |
| Manufacturing | 0 (0.0%) | 0 (0.0%) |
| Wholesale Trade | 12 (100.0%) | 0 (0.0%) |
| Retail Trade | 24 (54.5%) | 20 (45.5%) |
| Transportation & Warehousing | 2 (100.0%) | 0 (0.0%) |
| Utilities | 0 (0.0%) | 0 (0.0%) |
| Information | 0 (0.0%) | 0 (0.0%) |
| Finance & Insurance | 0 (0.0%) | 27 (100.0%) |
| Real Estate, Rental & Leasing | 0 (0.0%) | 0 (0.0%) |
| Professional & Scientific | 0 (0.0%) | 0 (0.0%) |
| Enterprise Management | 0 (0.0%) | 0 (0.0%) |
| Administrative & Support | 8 (100.0%) | 0 (0.0%) |
| Educational Services | 3 (5.8%) | 49 (94.2%) |
| Health Care & Social Assistance | 0 (0.0%) | 53 (100.0%) |
| Arts, Entertainment & Recreation | 0 (0.0%) | 0 (0.0%) |
| Accommodation & Food Services | 0 (0.0%) | 52 (100.0%) |
| Public Administration | 31 (41.9%) | 43 (58.1%) |
| Total | 234 (48.6%) | 247 (51.3%) |
Education in Paducah
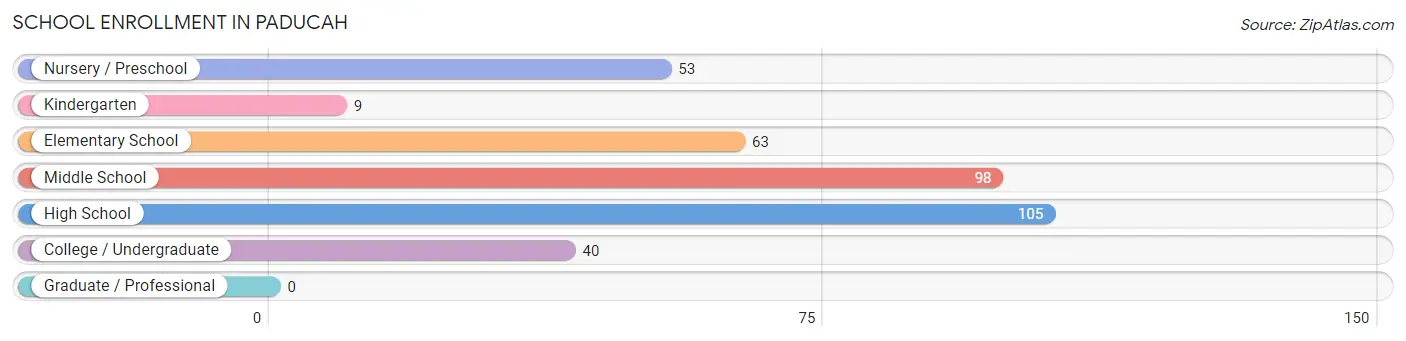
School Enrollment in Paducah
The most common levels of schooling among the 368 students in Paducah are high school (105 | 28.5%), middle school (98 | 26.6%), and elementary school (63 | 17.1%).
| School Level | # Students | % Students |
| Nursery / Preschool | 53 | 14.4% |
| Kindergarten | 9 | 2.5% |
| Elementary School | 63 | 17.1% |
| Middle School | 98 | 26.6% |
| High School | 105 | 28.5% |
| College / Undergraduate | 40 | 10.9% |
| Graduate / Professional | 0 | 0.0% |
| Total | 368 | 100.0% |
School Enrollment by Age by Funding Source in Paducah
Out of a total of 368 students who are enrolled in schools in Paducah, 31 (8.4%) attend a private institution, while the remaining 337 (91.6%) are enrolled in public schools. The age group of 25 to 34 year olds has the highest likelihood of being enrolled in private schools, with 21 (100.0% in the age bracket) enrolled. Conversely, the age group of 3 to 4 year olds has the lowest likelihood of being enrolled in a private school, with 53 (100.0% in the age bracket) attending a public institution.
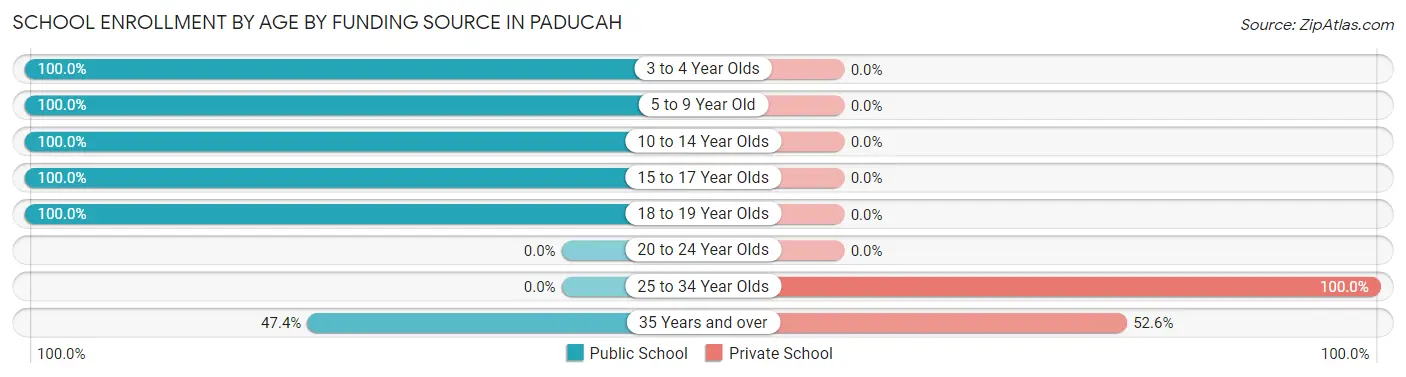
| Age Bracket | Public School | Private School |
| 3 to 4 Year Olds | 53 (100.0%) | 0 (0.0%) |
| 5 to 9 Year Old | 41 (100.0%) | 0 (0.0%) |
| 10 to 14 Year Olds | 137 (100.0%) | 0 (0.0%) |
| 15 to 17 Year Olds | 60 (100.0%) | 0 (0.0%) |
| 18 to 19 Year Olds | 37 (100.0%) | 0 (0.0%) |
| 20 to 24 Year Olds | 0 (0.0%) | 0 (0.0%) |
| 25 to 34 Year Olds | 0 (0.0%) | 21 (100.0%) |
| 35 Years and over | 9 (47.4%) | 10 (52.6%) |
| Total | 337 (91.6%) | 31 (8.4%) |
Educational Attainment by Field of Study in Paducah
Education (56 | 32.8%), business (42 | 24.6%), visual & performing arts (20 | 11.7%), computers & mathematics (18 | 10.5%), and science & technology (11 | 6.4%) are the most common fields of study among 171 individuals in Paducah who have obtained a bachelor's degree or higher.
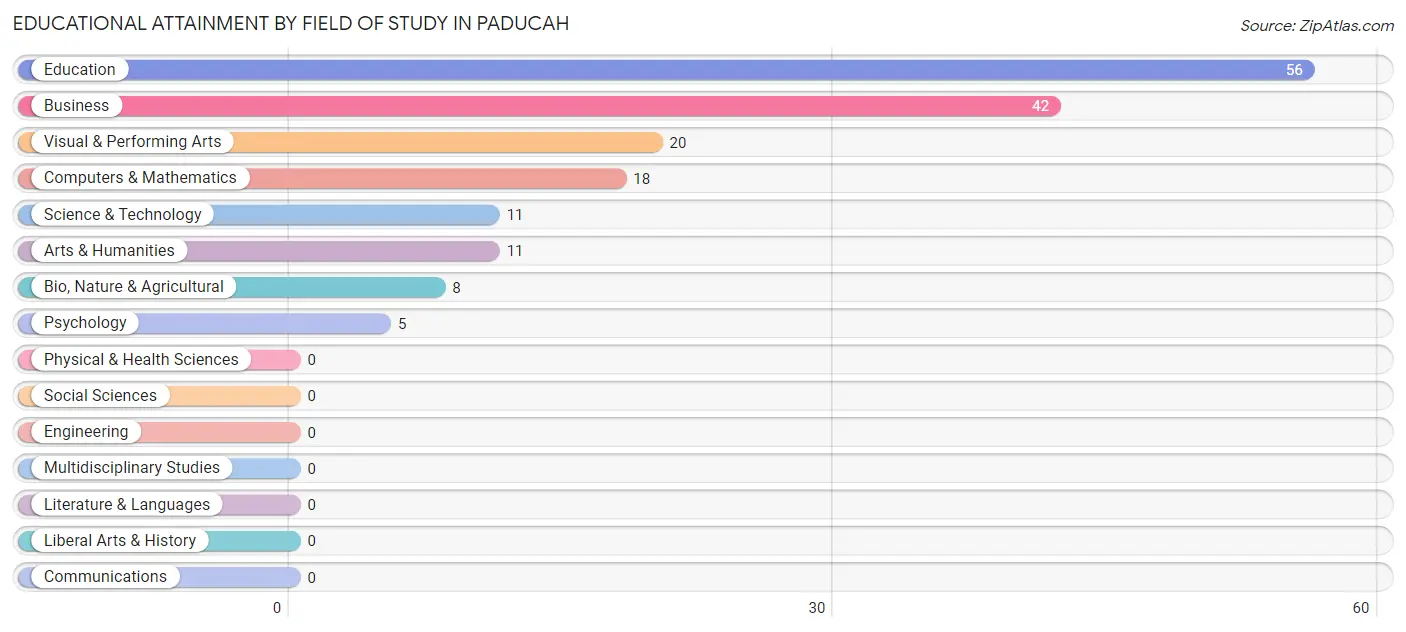
| Field of Study | # Graduates | % Graduates |
| Computers & Mathematics | 18 | 10.5% |
| Bio, Nature & Agricultural | 8 | 4.7% |
| Physical & Health Sciences | 0 | 0.0% |
| Psychology | 5 | 2.9% |
| Social Sciences | 0 | 0.0% |
| Engineering | 0 | 0.0% |
| Multidisciplinary Studies | 0 | 0.0% |
| Science & Technology | 11 | 6.4% |
| Business | 42 | 24.6% |
| Education | 56 | 32.8% |
| Literature & Languages | 0 | 0.0% |
| Liberal Arts & History | 0 | 0.0% |
| Visual & Performing Arts | 20 | 11.7% |
| Communications | 0 | 0.0% |
| Arts & Humanities | 11 | 6.4% |
| Total | 171 | 100.0% |
Transportation & Commute in Paducah
Vehicle Availability by Sex in Paducah
The most prevalent vehicle ownership categories in Paducah are males with 2 vehicles (91, accounting for 39.6%) and females with 2 vehicles (120, making up 36.8%).
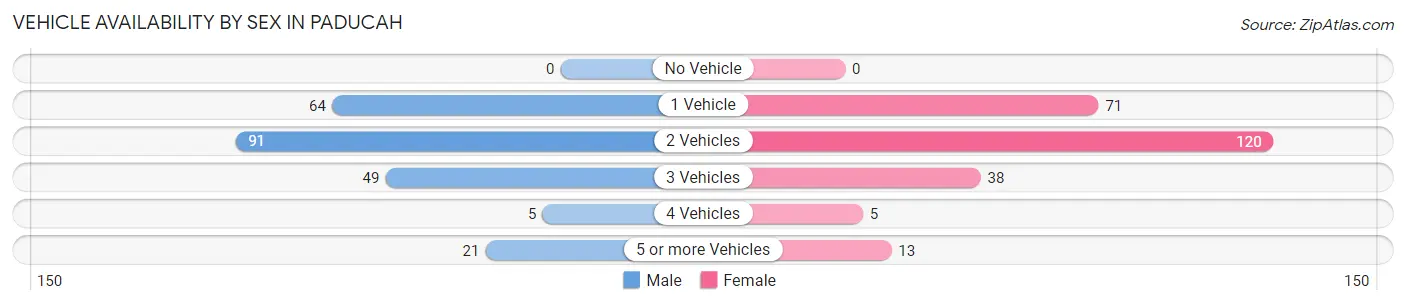
| Vehicles Available | Male | Female |
| No Vehicle | 0 (0.0%) | 0 (0.0%) |
| 1 Vehicle | 64 (27.8%) | 71 (28.7%) |
| 2 Vehicles | 91 (39.6%) | 120 (48.6%) |
| 3 Vehicles | 49 (21.3%) | 38 (15.4%) |
| 4 Vehicles | 5 (2.2%) | 5 (2.0%) |
| 5 or more Vehicles | 21 (9.1%) | 13 (5.3%) |
| Total | 230 (100.0%) | 247 (100.0%) |
Commute Time in Paducah
The most frequently occuring commute durations in Paducah are less than 5 minutes (118 commuters, 26.1%), 15 to 19 minutes (76 commuters, 16.8%), and 30 to 34 minutes (72 commuters, 15.9%).
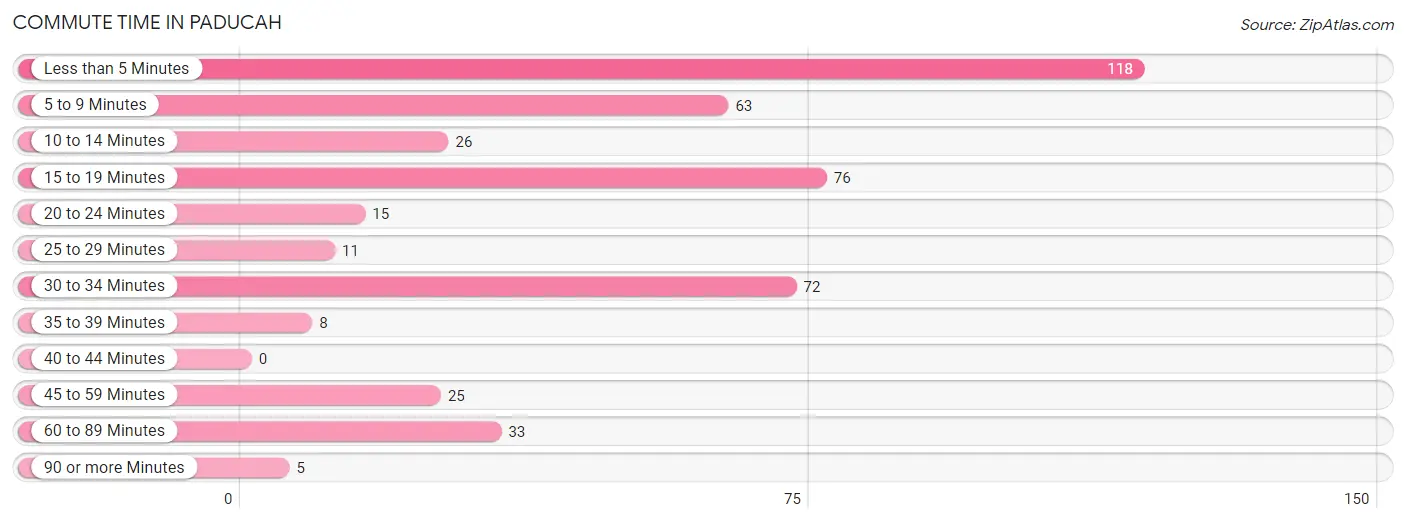
| Commute Time | # Commuters | % Commuters |
| Less than 5 Minutes | 118 | 26.1% |
| 5 to 9 Minutes | 63 | 13.9% |
| 10 to 14 Minutes | 26 | 5.8% |
| 15 to 19 Minutes | 76 | 16.8% |
| 20 to 24 Minutes | 15 | 3.3% |
| 25 to 29 Minutes | 11 | 2.4% |
| 30 to 34 Minutes | 72 | 15.9% |
| 35 to 39 Minutes | 8 | 1.8% |
| 40 to 44 Minutes | 0 | 0.0% |
| 45 to 59 Minutes | 25 | 5.5% |
| 60 to 89 Minutes | 33 | 7.3% |
| 90 or more Minutes | 5 | 1.1% |
Commute Time by Sex in Paducah
The most common commute times in Paducah are less than 5 minutes (50 commuters, 23.4%) for males and less than 5 minutes (68 commuters, 28.6%) for females.
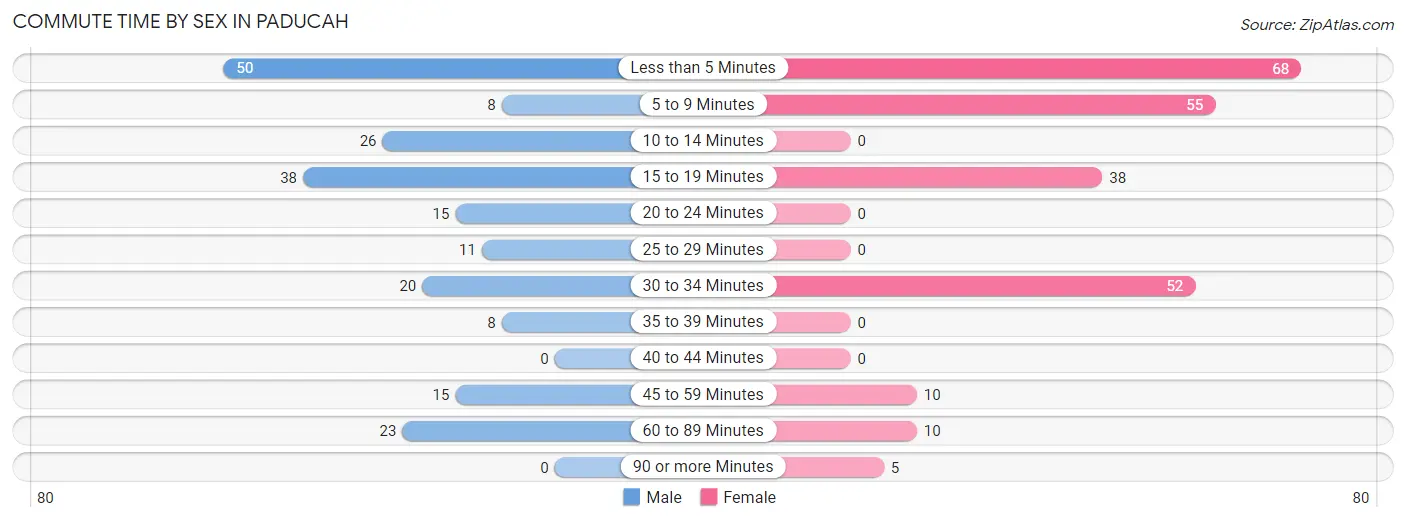
| Commute Time | Male | Female |
| Less than 5 Minutes | 50 (23.4%) | 68 (28.6%) |
| 5 to 9 Minutes | 8 (3.7%) | 55 (23.1%) |
| 10 to 14 Minutes | 26 (12.1%) | 0 (0.0%) |
| 15 to 19 Minutes | 38 (17.8%) | 38 (16.0%) |
| 20 to 24 Minutes | 15 (7.0%) | 0 (0.0%) |
| 25 to 29 Minutes | 11 (5.1%) | 0 (0.0%) |
| 30 to 34 Minutes | 20 (9.3%) | 52 (21.8%) |
| 35 to 39 Minutes | 8 (3.7%) | 0 (0.0%) |
| 40 to 44 Minutes | 0 (0.0%) | 0 (0.0%) |
| 45 to 59 Minutes | 15 (7.0%) | 10 (4.2%) |
| 60 to 89 Minutes | 23 (10.7%) | 10 (4.2%) |
| 90 or more Minutes | 0 (0.0%) | 5 (2.1%) |
Time of Departure to Work by Sex in Paducah
The most frequent times of departure to work in Paducah are 7:30 AM to 7:59 AM (42, 19.6%) for males and 7:30 AM to 7:59 AM (61, 25.6%) for females.
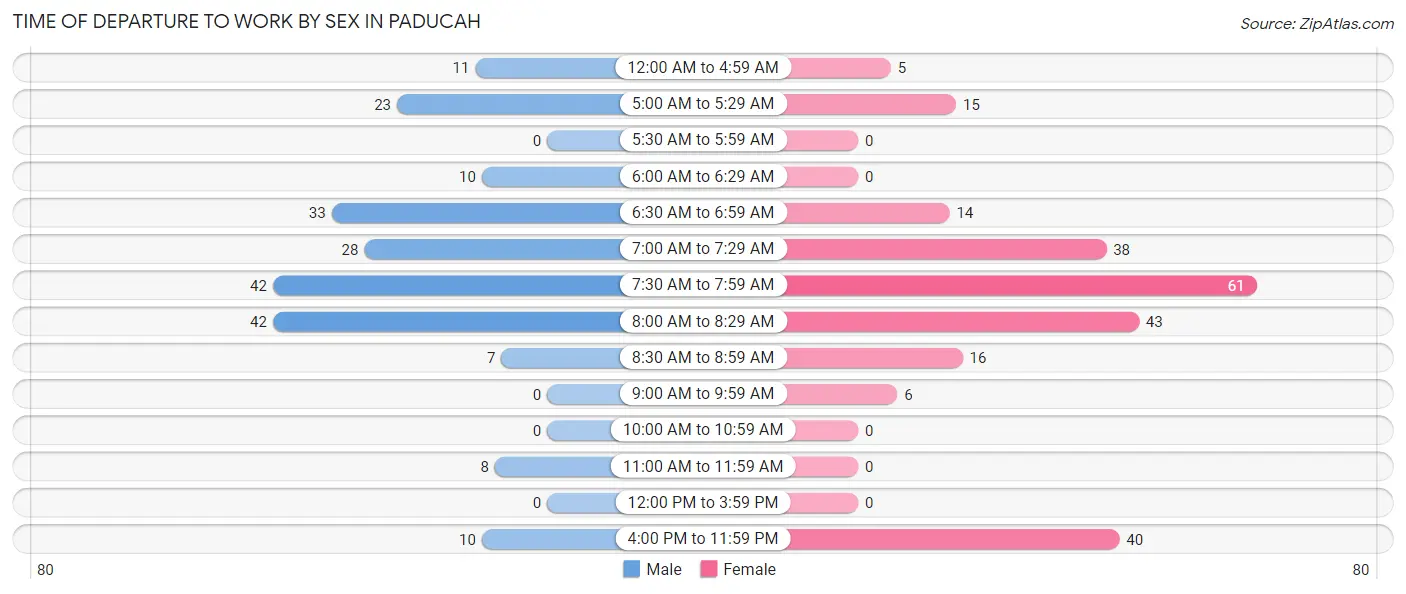
| Time of Departure | Male | Female |
| 12:00 AM to 4:59 AM | 11 (5.1%) | 5 (2.1%) |
| 5:00 AM to 5:29 AM | 23 (10.7%) | 15 (6.3%) |
| 5:30 AM to 5:59 AM | 0 (0.0%) | 0 (0.0%) |
| 6:00 AM to 6:29 AM | 10 (4.7%) | 0 (0.0%) |
| 6:30 AM to 6:59 AM | 33 (15.4%) | 14 (5.9%) |
| 7:00 AM to 7:29 AM | 28 (13.1%) | 38 (16.0%) |
| 7:30 AM to 7:59 AM | 42 (19.6%) | 61 (25.6%) |
| 8:00 AM to 8:29 AM | 42 (19.6%) | 43 (18.1%) |
| 8:30 AM to 8:59 AM | 7 (3.3%) | 16 (6.7%) |
| 9:00 AM to 9:59 AM | 0 (0.0%) | 6 (2.5%) |
| 10:00 AM to 10:59 AM | 0 (0.0%) | 0 (0.0%) |
| 11:00 AM to 11:59 AM | 8 (3.7%) | 0 (0.0%) |
| 12:00 PM to 3:59 PM | 0 (0.0%) | 0 (0.0%) |
| 4:00 PM to 11:59 PM | 10 (4.7%) | 40 (16.8%) |
| Total | 214 (100.0%) | 238 (100.0%) |
Housing Occupancy in Paducah
Occupancy by Ownership in Paducah
Of the total 550 dwellings in Paducah, owner-occupied units account for 355 (64.5%), while renter-occupied units make up 195 (35.4%).
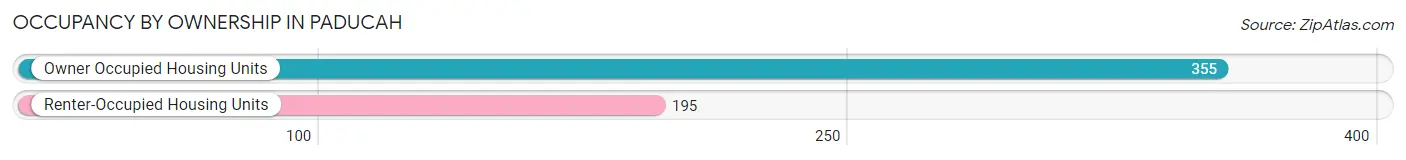
| Occupancy | # Housing Units | % Housing Units |
| Owner Occupied Housing Units | 355 | 64.5% |
| Renter-Occupied Housing Units | 195 | 35.4% |
| Total Occupied Housing Units | 550 | 100.0% |
Occupancy by Household Size in Paducah
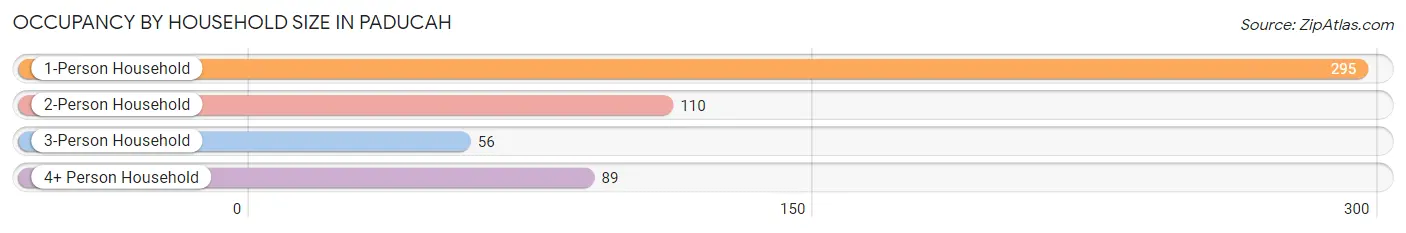
| Household Size | # Housing Units | % Housing Units |
| 1-Person Household | 295 | 53.6% |
| 2-Person Household | 110 | 20.0% |
| 3-Person Household | 56 | 10.2% |
| 4+ Person Household | 89 | 16.2% |
| Total Housing Units | 550 | 100.0% |
Occupancy by Ownership by Household Size in Paducah
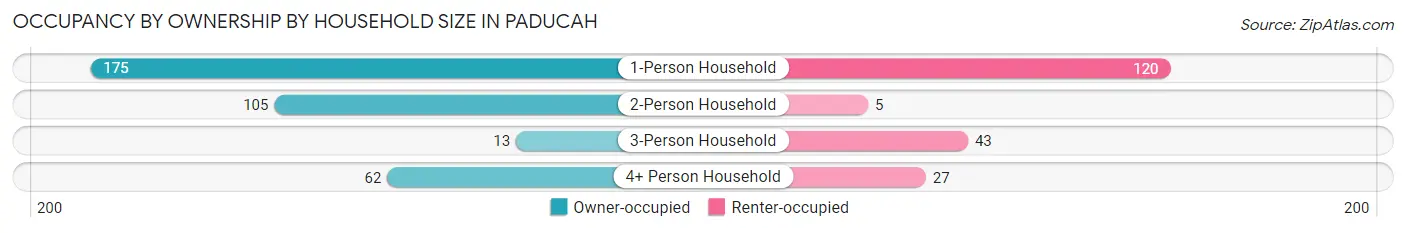
| Household Size | Owner-occupied | Renter-occupied |
| 1-Person Household | 175 (59.3%) | 120 (40.7%) |
| 2-Person Household | 105 (95.5%) | 5 (4.5%) |
| 3-Person Household | 13 (23.2%) | 43 (76.8%) |
| 4+ Person Household | 62 (69.7%) | 27 (30.3%) |
| Total Housing Units | 355 (64.5%) | 195 (35.4%) |
Occupancy by Educational Attainment in Paducah
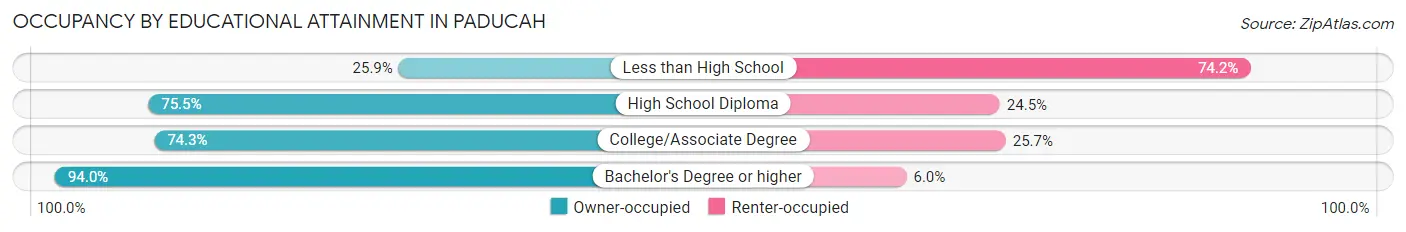
| Household Size | Owner-occupied | Renter-occupied |
| Less than High School | 38 (25.9%) | 109 (74.2%) |
| High School Diploma | 80 (75.5%) | 26 (24.5%) |
| College/Associate Degree | 159 (74.3%) | 55 (25.7%) |
| Bachelor's Degree or higher | 78 (94.0%) | 5 (6.0%) |
Occupancy by Age of Householder in Paducah
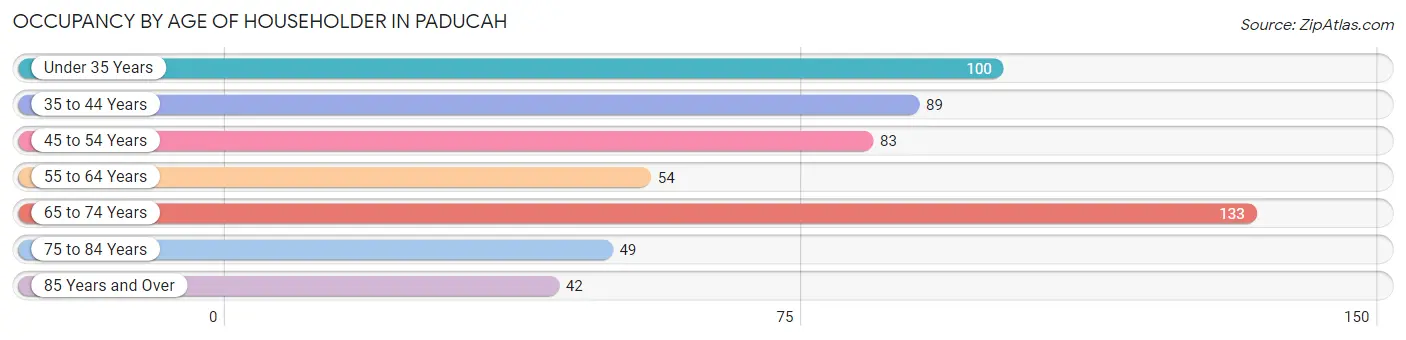
| Age Bracket | # Households | % Households |
| Under 35 Years | 100 | 18.2% |
| 35 to 44 Years | 89 | 16.2% |
| 45 to 54 Years | 83 | 15.1% |
| 55 to 64 Years | 54 | 9.8% |
| 65 to 74 Years | 133 | 24.2% |
| 75 to 84 Years | 49 | 8.9% |
| 85 Years and Over | 42 | 7.6% |
| Total | 550 | 100.0% |
Housing Finances in Paducah
Median Income by Occupancy in Paducah
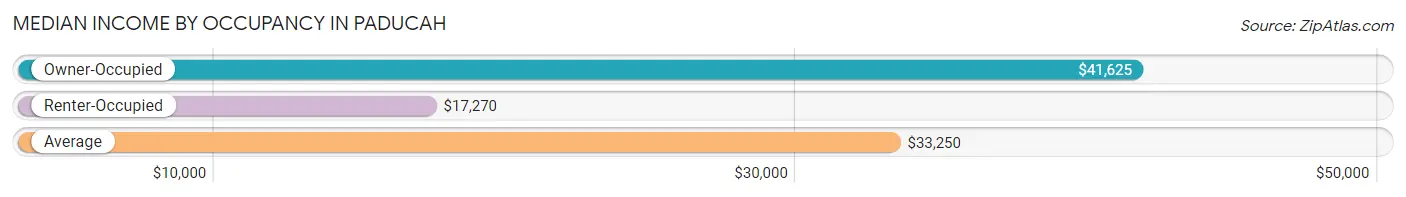
| Occupancy Type | # Households | Median Income |
| Owner-Occupied | 355 (64.5%) | $41,625 |
| Renter-Occupied | 195 (35.4%) | $17,270 |
| Average | 550 (100.0%) | $33,250 |
Occupancy by Householder Income Bracket in Paducah
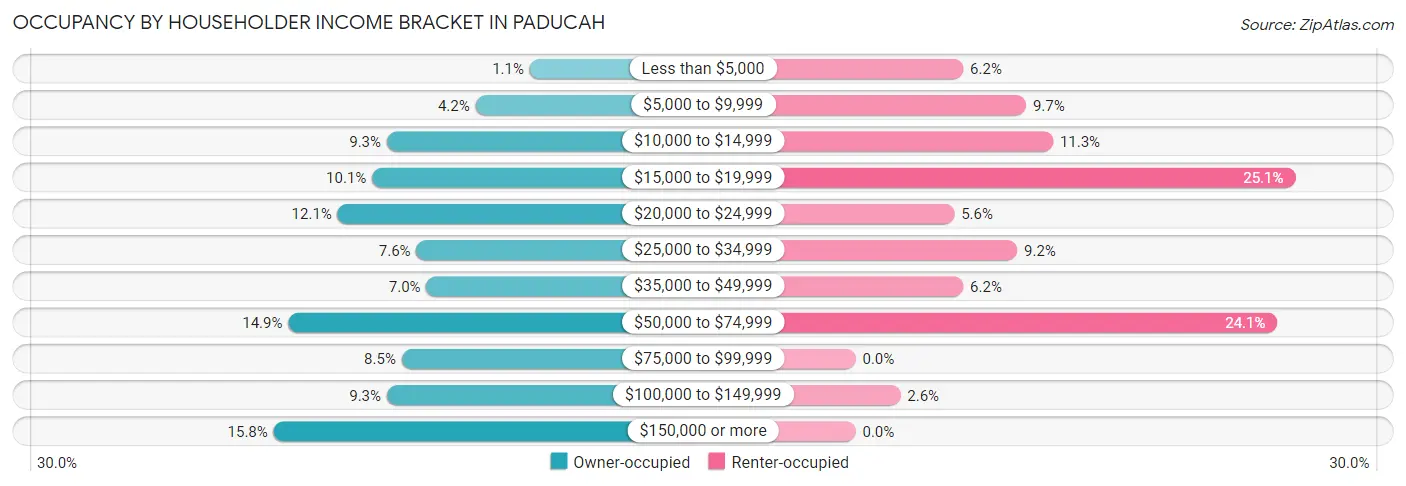
| Income Bracket | Owner-occupied | Renter-occupied |
| Less than $5,000 | 4 (1.1%) | 12 (6.1%) |
| $5,000 to $9,999 | 15 (4.2%) | 19 (9.7%) |
| $10,000 to $14,999 | 33 (9.3%) | 22 (11.3%) |
| $15,000 to $19,999 | 36 (10.1%) | 49 (25.1%) |
| $20,000 to $24,999 | 43 (12.1%) | 11 (5.6%) |
| $25,000 to $34,999 | 27 (7.6%) | 18 (9.2%) |
| $35,000 to $49,999 | 25 (7.0%) | 12 (6.1%) |
| $50,000 to $74,999 | 53 (14.9%) | 47 (24.1%) |
| $75,000 to $99,999 | 30 (8.5%) | 0 (0.0%) |
| $100,000 to $149,999 | 33 (9.3%) | 5 (2.6%) |
| $150,000 or more | 56 (15.8%) | 0 (0.0%) |
| Total | 355 (100.0%) | 195 (100.0%) |
Monthly Housing Cost Tiers in Paducah
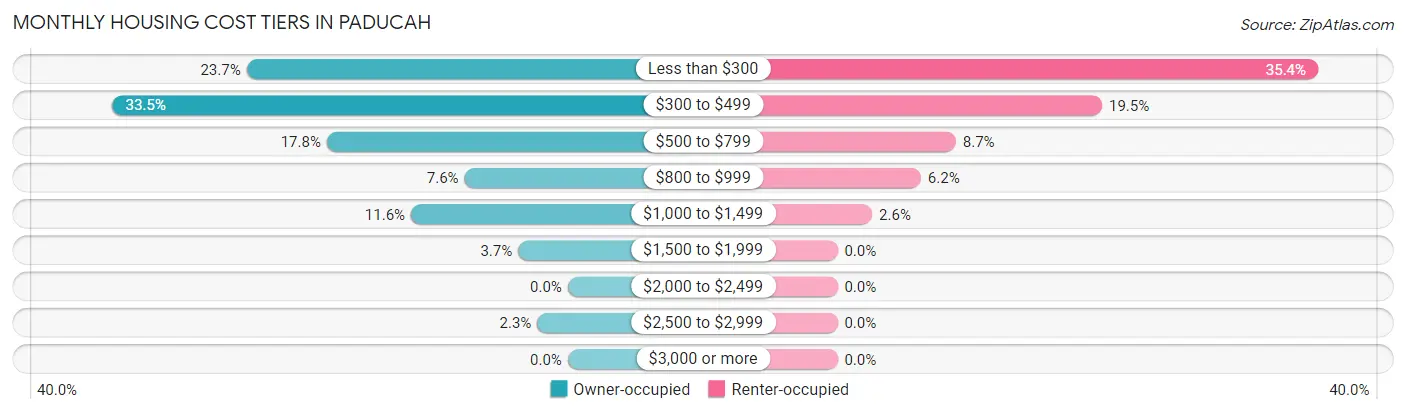
| Monthly Cost | Owner-occupied | Renter-occupied |
| Less than $300 | 84 (23.7%) | 69 (35.4%) |
| $300 to $499 | 119 (33.5%) | 38 (19.5%) |
| $500 to $799 | 63 (17.7%) | 17 (8.7%) |
| $800 to $999 | 27 (7.6%) | 12 (6.1%) |
| $1,000 to $1,499 | 41 (11.6%) | 5 (2.6%) |
| $1,500 to $1,999 | 13 (3.7%) | 0 (0.0%) |
| $2,000 to $2,499 | 0 (0.0%) | 0 (0.0%) |
| $2,500 to $2,999 | 8 (2.2%) | 0 (0.0%) |
| $3,000 or more | 0 (0.0%) | 0 (0.0%) |
| Total | 355 (100.0%) | 195 (100.0%) |
Physical Housing Characteristics in Paducah
Housing Structures in Paducah
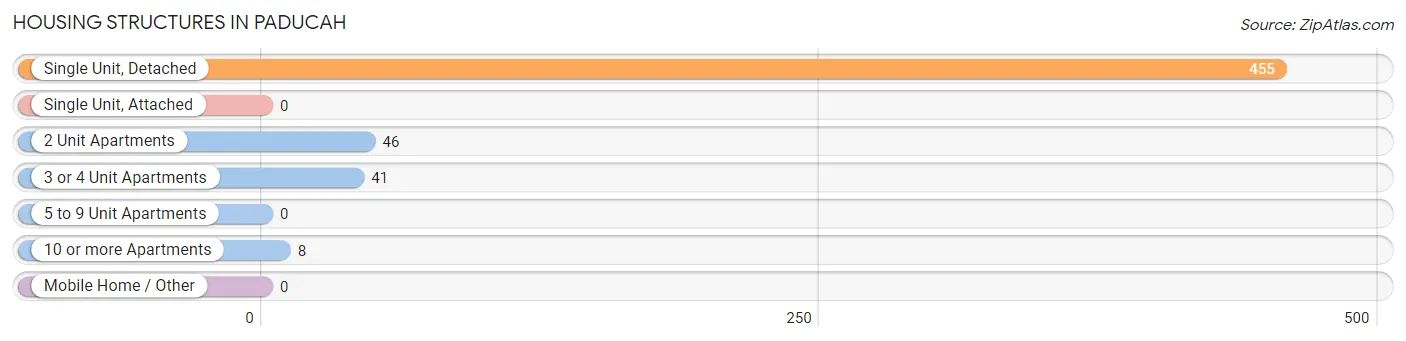
| Structure Type | # Housing Units | % Housing Units |
| Single Unit, Detached | 455 | 82.7% |
| Single Unit, Attached | 0 | 0.0% |
| 2 Unit Apartments | 46 | 8.4% |
| 3 or 4 Unit Apartments | 41 | 7.4% |
| 5 to 9 Unit Apartments | 0 | 0.0% |
| 10 or more Apartments | 8 | 1.5% |
| Mobile Home / Other | 0 | 0.0% |
| Total | 550 | 100.0% |
Housing Structures by Occupancy in Paducah
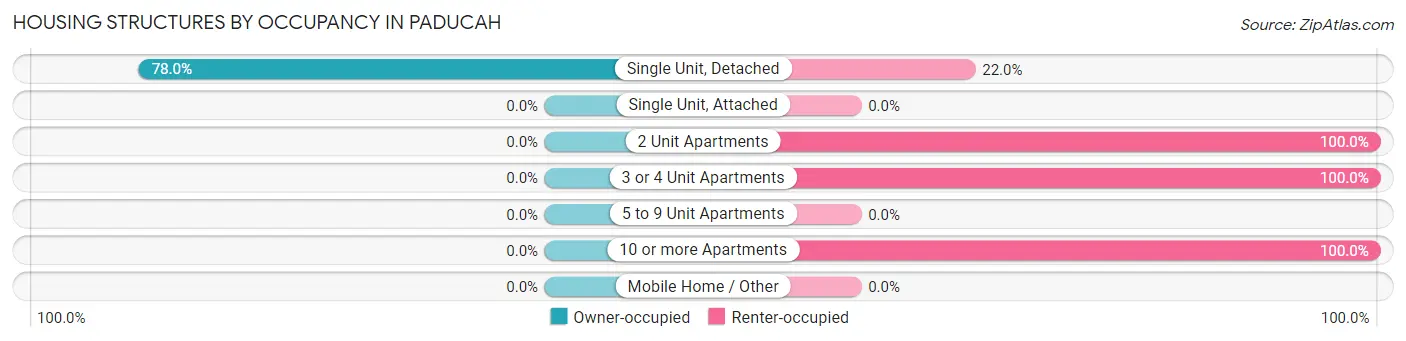
| Structure Type | Owner-occupied | Renter-occupied |
| Single Unit, Detached | 355 (78.0%) | 100 (22.0%) |
| Single Unit, Attached | 0 (0.0%) | 0 (0.0%) |
| 2 Unit Apartments | 0 (0.0%) | 46 (100.0%) |
| 3 or 4 Unit Apartments | 0 (0.0%) | 41 (100.0%) |
| 5 to 9 Unit Apartments | 0 (0.0%) | 0 (0.0%) |
| 10 or more Apartments | 0 (0.0%) | 8 (100.0%) |
| Mobile Home / Other | 0 (0.0%) | 0 (0.0%) |
| Total | 355 (64.5%) | 195 (35.4%) |
Housing Structures by Number of Rooms in Paducah
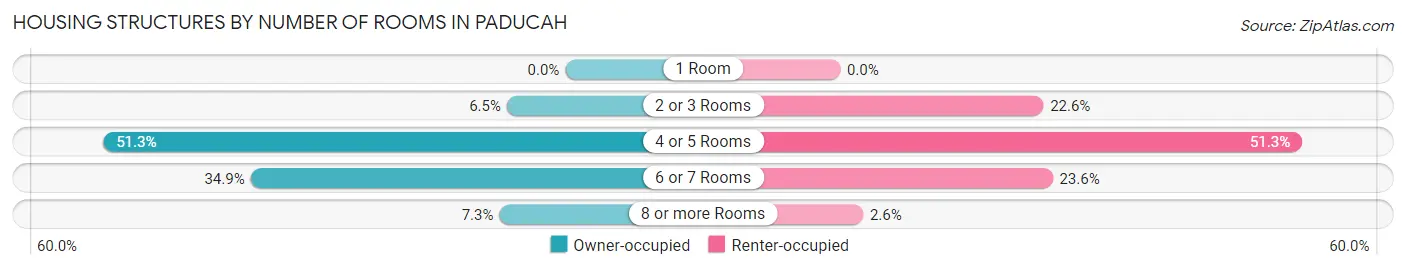
| Number of Rooms | Owner-occupied | Renter-occupied |
| 1 Room | 0 (0.0%) | 0 (0.0%) |
| 2 or 3 Rooms | 23 (6.5%) | 44 (22.6%) |
| 4 or 5 Rooms | 182 (51.3%) | 100 (51.3%) |
| 6 or 7 Rooms | 124 (34.9%) | 46 (23.6%) |
| 8 or more Rooms | 26 (7.3%) | 5 (2.6%) |
| Total | 355 (100.0%) | 195 (100.0%) |
Housing Structure by Heating Type in Paducah
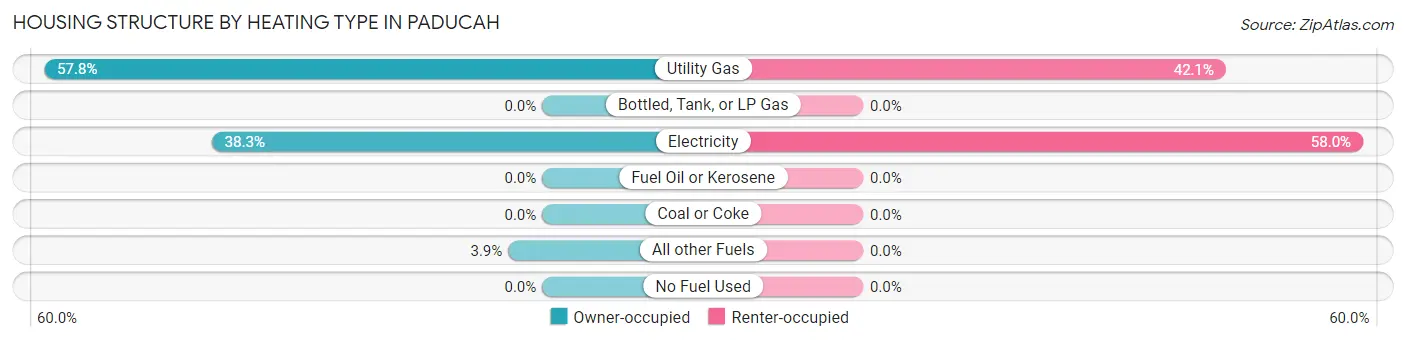
| Heating Type | Owner-occupied | Renter-occupied |
| Utility Gas | 205 (57.8%) | 82 (42.0%) |
| Bottled, Tank, or LP Gas | 0 (0.0%) | 0 (0.0%) |
| Electricity | 136 (38.3%) | 113 (58.0%) |
| Fuel Oil or Kerosene | 0 (0.0%) | 0 (0.0%) |
| Coal or Coke | 0 (0.0%) | 0 (0.0%) |
| All other Fuels | 14 (3.9%) | 0 (0.0%) |
| No Fuel Used | 0 (0.0%) | 0 (0.0%) |
| Total | 355 (100.0%) | 195 (100.0%) |
Household Vehicle Usage in Paducah
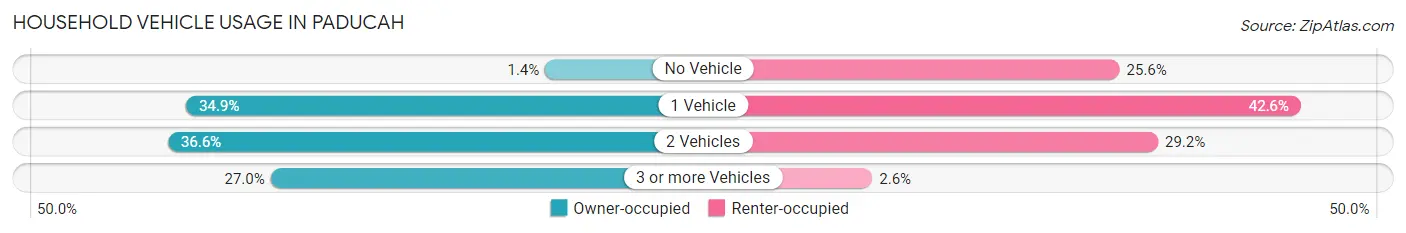
| Vehicles per Household | Owner-occupied | Renter-occupied |
| No Vehicle | 5 (1.4%) | 50 (25.6%) |
| 1 Vehicle | 124 (34.9%) | 83 (42.6%) |
| 2 Vehicles | 130 (36.6%) | 57 (29.2%) |
| 3 or more Vehicles | 96 (27.0%) | 5 (2.6%) |
| Total | 355 (100.0%) | 195 (100.0%) |
Real Estate & Mortgages in Paducah
Real Estate and Mortgage Overview in Paducah
| Characteristic | Without Mortgage | With Mortgage |
| Housing Units | 247 | 108 |
| Median Property Value | $47,800 | $47,000 |
| Median Household Income | $35,139 | $21 |
| Monthly Housing Costs | $371 | $0 |
| Real Estate Taxes | $585 | $0 |
Property Value by Mortgage Status in Paducah
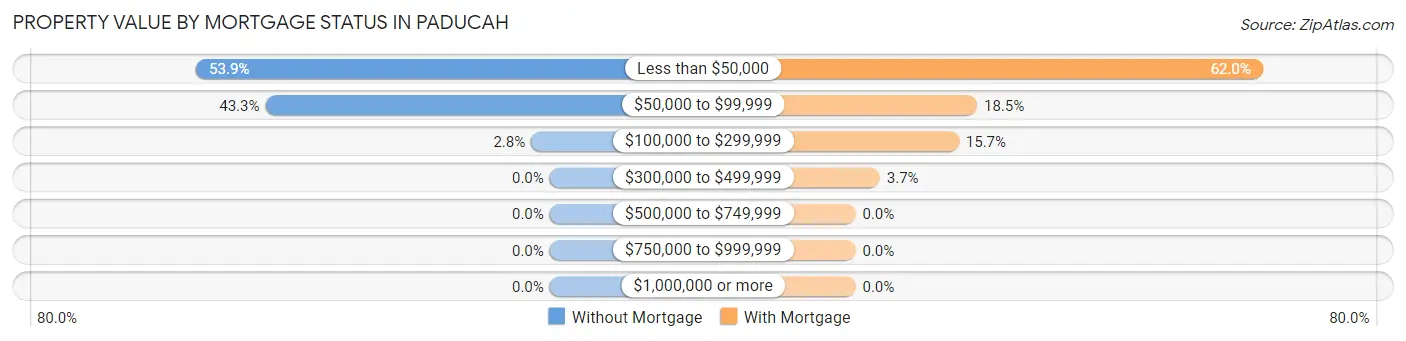
| Property Value | Without Mortgage | With Mortgage |
| Less than $50,000 | 133 (53.8%) | 67 (62.0%) |
| $50,000 to $99,999 | 107 (43.3%) | 20 (18.5%) |
| $100,000 to $299,999 | 7 (2.8%) | 17 (15.7%) |
| $300,000 to $499,999 | 0 (0.0%) | 4 (3.7%) |
| $500,000 to $749,999 | 0 (0.0%) | 0 (0.0%) |
| $750,000 to $999,999 | 0 (0.0%) | 0 (0.0%) |
| $1,000,000 or more | 0 (0.0%) | 0 (0.0%) |
| Total | 247 (100.0%) | 108 (100.0%) |
Household Income by Mortgage Status in Paducah
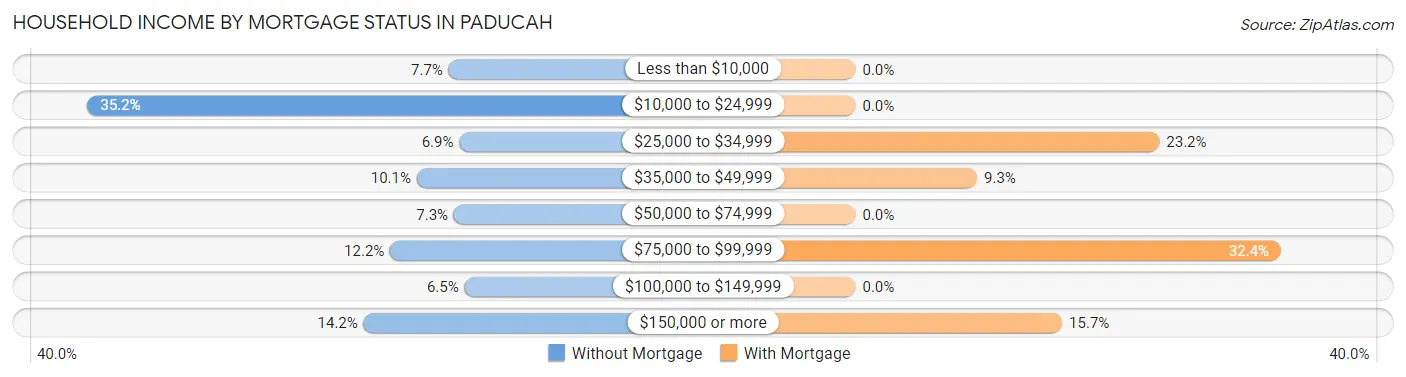
| Household Income | Without Mortgage | With Mortgage |
| Less than $10,000 | 19 (7.7%) | 0 (0.0%) |
| $10,000 to $24,999 | 87 (35.2%) | 0 (0.0%) |
| $25,000 to $34,999 | 17 (6.9%) | 25 (23.2%) |
| $35,000 to $49,999 | 25 (10.1%) | 10 (9.3%) |
| $50,000 to $74,999 | 18 (7.3%) | 0 (0.0%) |
| $75,000 to $99,999 | 30 (12.1%) | 35 (32.4%) |
| $100,000 to $149,999 | 16 (6.5%) | 0 (0.0%) |
| $150,000 or more | 35 (14.2%) | 17 (15.7%) |
| Total | 247 (100.0%) | 108 (100.0%) |
Property Value to Household Income Ratio in Paducah
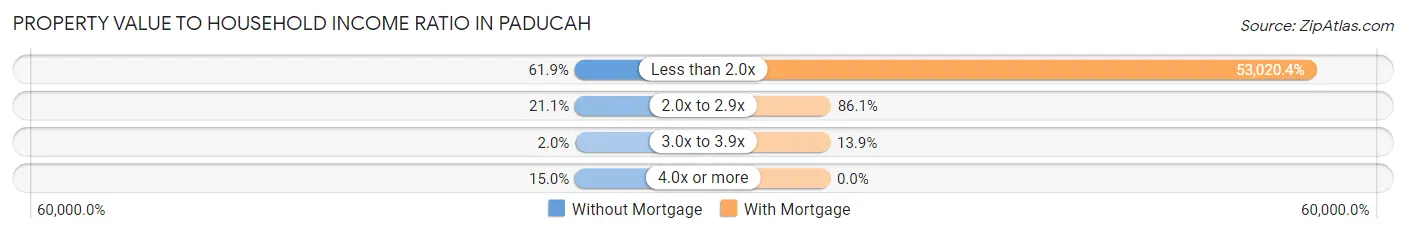
| Value-to-Income Ratio | Without Mortgage | With Mortgage |
| Less than 2.0x | 153 (61.9%) | 57,262 (53,020.4%) |
| 2.0x to 2.9x | 52 (21.0%) | 93 (86.1%) |
| 3.0x to 3.9x | 5 (2.0%) | 15 (13.9%) |
| 4.0x or more | 37 (15.0%) | 0 (0.0%) |
| Total | 247 (100.0%) | 108 (100.0%) |
Real Estate Taxes by Mortgage Status in Paducah
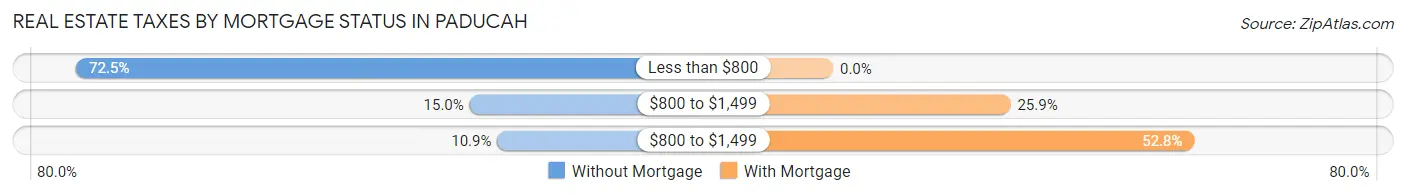
| Property Taxes | Without Mortgage | With Mortgage |
| Less than $800 | 179 (72.5%) | 0 (0.0%) |
| $800 to $1,499 | 37 (15.0%) | 28 (25.9%) |
| $800 to $1,499 | 27 (10.9%) | 57 (52.8%) |
| Total | 247 (100.0%) | 108 (100.0%) |
Health & Disability in Paducah
Health Insurance Coverage by Age in Paducah
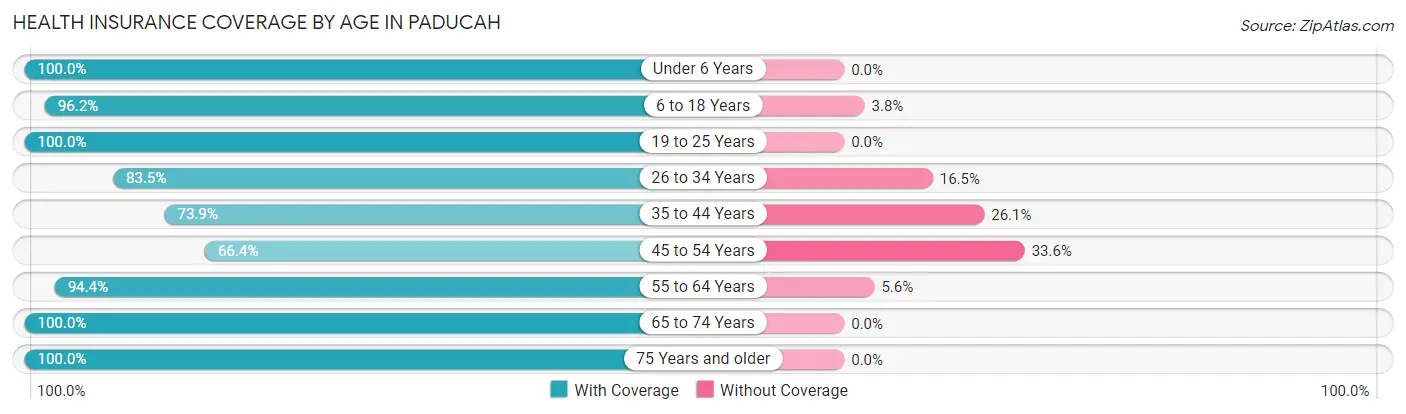
| Age Bracket | With Coverage | Without Coverage |
| Under 6 Years | 103 (100.0%) | 0 (0.0%) |
| 6 to 18 Years | 279 (96.2%) | 11 (3.8%) |
| 19 to 25 Years | 58 (100.0%) | 0 (0.0%) |
| 26 to 34 Years | 91 (83.5%) | 18 (16.5%) |
| 35 to 44 Years | 133 (73.9%) | 47 (26.1%) |
| 45 to 54 Years | 71 (66.4%) | 36 (33.6%) |
| 55 to 64 Years | 67 (94.4%) | 4 (5.6%) |
| 65 to 74 Years | 175 (100.0%) | 0 (0.0%) |
| 75 Years and older | 108 (100.0%) | 0 (0.0%) |
| Total | 1,085 (90.3%) | 116 (9.7%) |
Health Insurance Coverage by Citizenship Status in Paducah
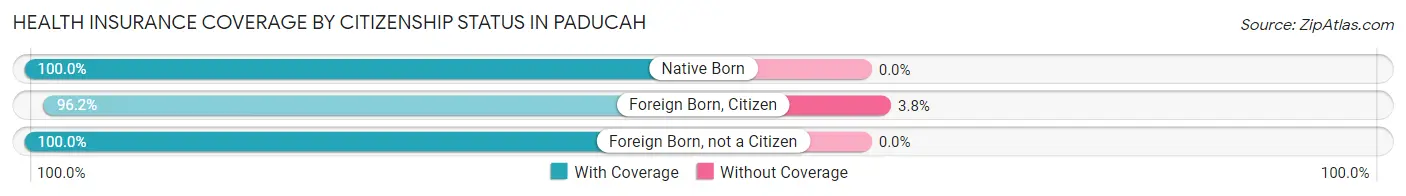
| Citizenship Status | With Coverage | Without Coverage |
| Native Born | 103 (100.0%) | 0 (0.0%) |
| Foreign Born, Citizen | 279 (96.2%) | 11 (3.8%) |
| Foreign Born, not a Citizen | 58 (100.0%) | 0 (0.0%) |
Health Insurance Coverage by Household Income in Paducah
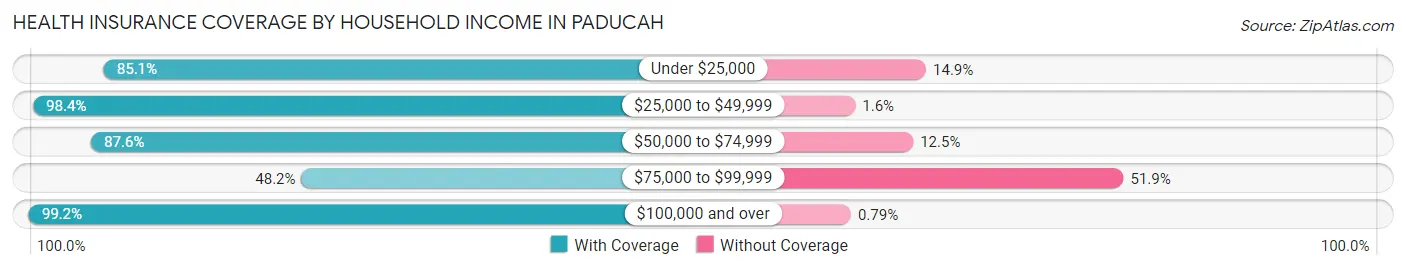
| Household Income | With Coverage | Without Coverage |
| Under $25,000 | 298 (85.1%) | 52 (14.9%) |
| $25,000 to $49,999 | 305 (98.4%) | 5 (1.6%) |
| $50,000 to $74,999 | 204 (87.5%) | 29 (12.4%) |
| $75,000 to $99,999 | 26 (48.1%) | 28 (51.8%) |
| $100,000 and over | 252 (99.2%) | 2 (0.8%) |
Public vs Private Health Insurance Coverage by Age in Paducah
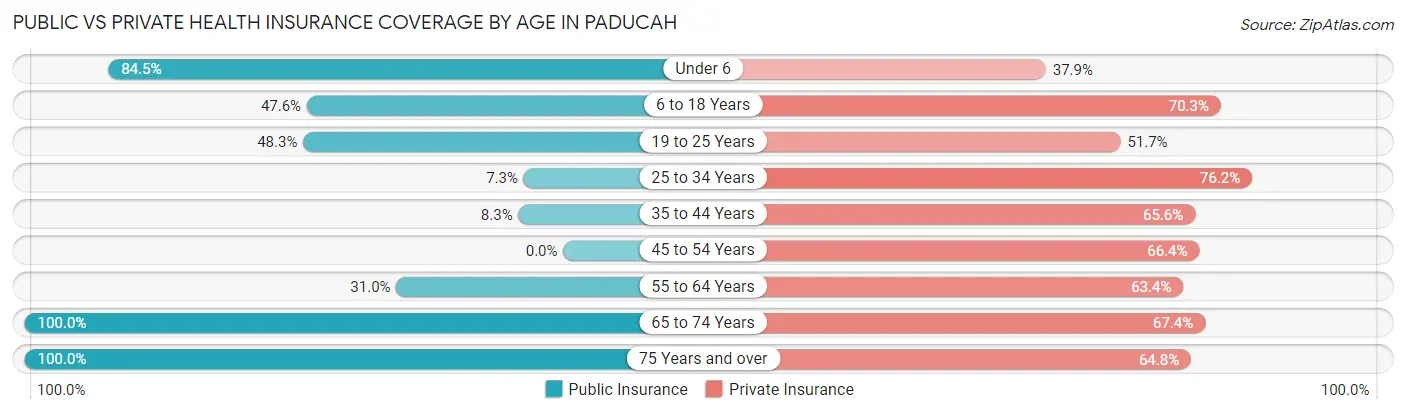
| Age Bracket | Public Insurance | Private Insurance |
| Under 6 | 87 (84.5%) | 39 (37.9%) |
| 6 to 18 Years | 138 (47.6%) | 204 (70.3%) |
| 19 to 25 Years | 28 (48.3%) | 30 (51.7%) |
| 25 to 34 Years | 8 (7.3%) | 83 (76.1%) |
| 35 to 44 Years | 15 (8.3%) | 118 (65.6%) |
| 45 to 54 Years | 0 (0.0%) | 71 (66.4%) |
| 55 to 64 Years | 22 (31.0%) | 45 (63.4%) |
| 65 to 74 Years | 175 (100.0%) | 118 (67.4%) |
| 75 Years and over | 108 (100.0%) | 70 (64.8%) |
| Total | 581 (48.4%) | 778 (64.8%) |
Disability Status by Sex by Age in Paducah
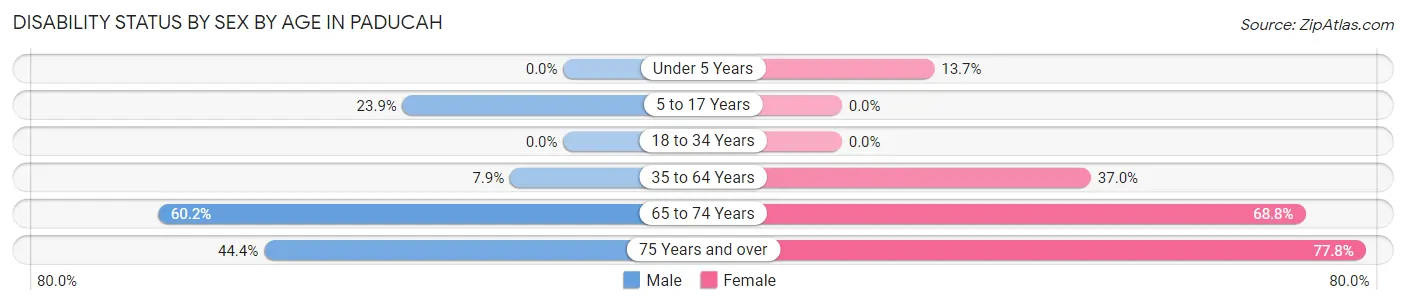
| Age Bracket | Male | Female |
| Under 5 Years | 0 (0.0%) | 7 (13.7%) |
| 5 to 17 Years | 47 (23.9%) | 0 (0.0%) |
| 18 to 34 Years | 0 (0.0%) | 0 (0.0%) |
| 35 to 64 Years | 11 (7.9%) | 81 (37.0%) |
| 65 to 74 Years | 59 (60.2%) | 53 (68.8%) |
| 75 Years and over | 12 (44.4%) | 63 (77.8%) |
Disability Class by Sex by Age in Paducah
Disability Class: Hearing Difficulty
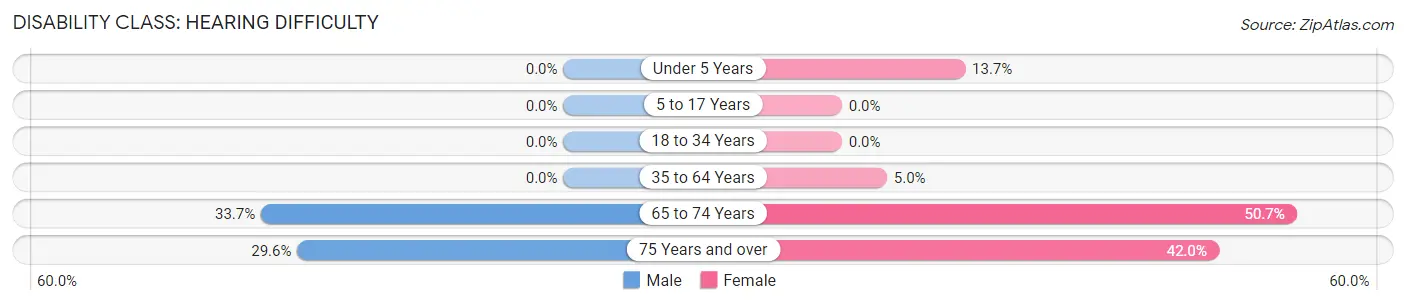
| Age Bracket | Male | Female |
| Under 5 Years | 0 (0.0%) | 7 (13.7%) |
| 5 to 17 Years | 0 (0.0%) | 0 (0.0%) |
| 18 to 34 Years | 0 (0.0%) | 0 (0.0%) |
| 35 to 64 Years | 0 (0.0%) | 11 (5.0%) |
| 65 to 74 Years | 33 (33.7%) | 39 (50.6%) |
| 75 Years and over | 8 (29.6%) | 34 (42.0%) |
Disability Class: Vision Difficulty
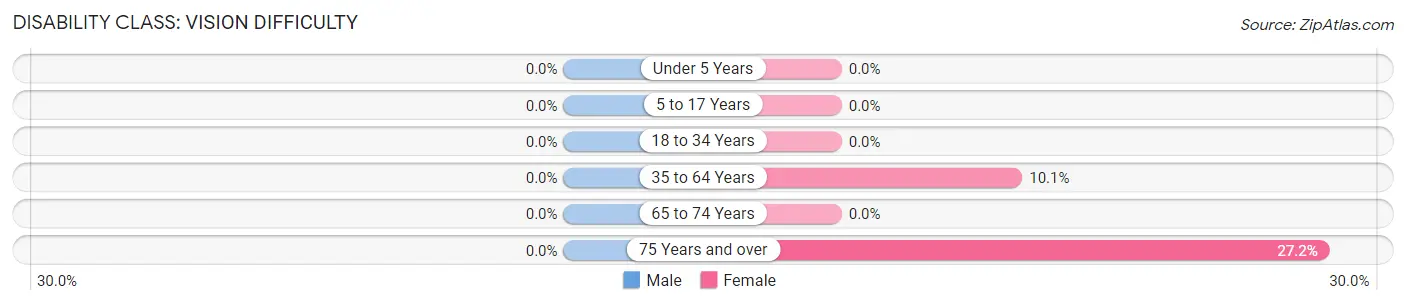
| Age Bracket | Male | Female |
| Under 5 Years | 0 (0.0%) | 0 (0.0%) |
| 5 to 17 Years | 0 (0.0%) | 0 (0.0%) |
| 18 to 34 Years | 0 (0.0%) | 0 (0.0%) |
| 35 to 64 Years | 0 (0.0%) | 22 (10.1%) |
| 65 to 74 Years | 0 (0.0%) | 0 (0.0%) |
| 75 Years and over | 0 (0.0%) | 22 (27.2%) |
Disability Class: Cognitive Difficulty
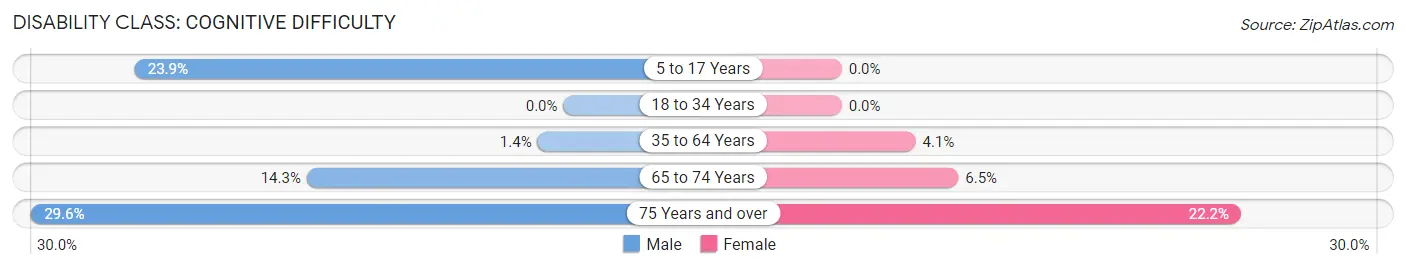
| Age Bracket | Male | Female |
| 5 to 17 Years | 47 (23.9%) | 0 (0.0%) |
| 18 to 34 Years | 0 (0.0%) | 0 (0.0%) |
| 35 to 64 Years | 2 (1.4%) | 9 (4.1%) |
| 65 to 74 Years | 14 (14.3%) | 5 (6.5%) |
| 75 Years and over | 8 (29.6%) | 18 (22.2%) |
Disability Class: Ambulatory Difficulty
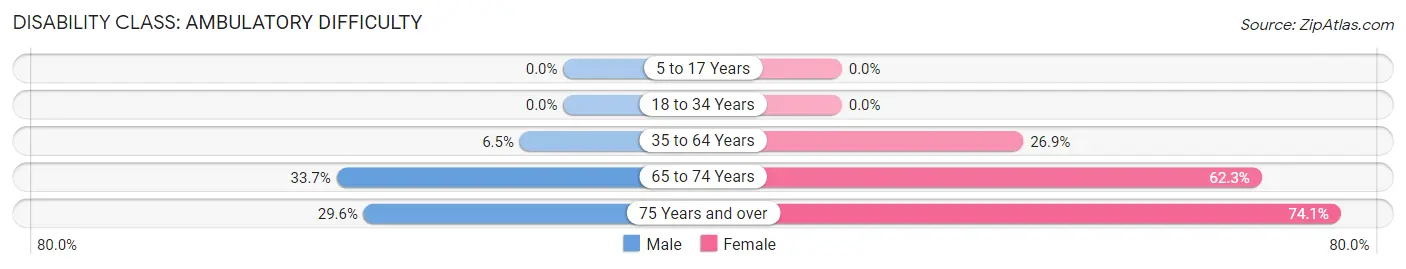
| Age Bracket | Male | Female |
| 5 to 17 Years | 0 (0.0%) | 0 (0.0%) |
| 18 to 34 Years | 0 (0.0%) | 0 (0.0%) |
| 35 to 64 Years | 9 (6.5%) | 59 (26.9%) |
| 65 to 74 Years | 33 (33.7%) | 48 (62.3%) |
| 75 Years and over | 8 (29.6%) | 60 (74.1%) |
Disability Class: Self-Care Difficulty
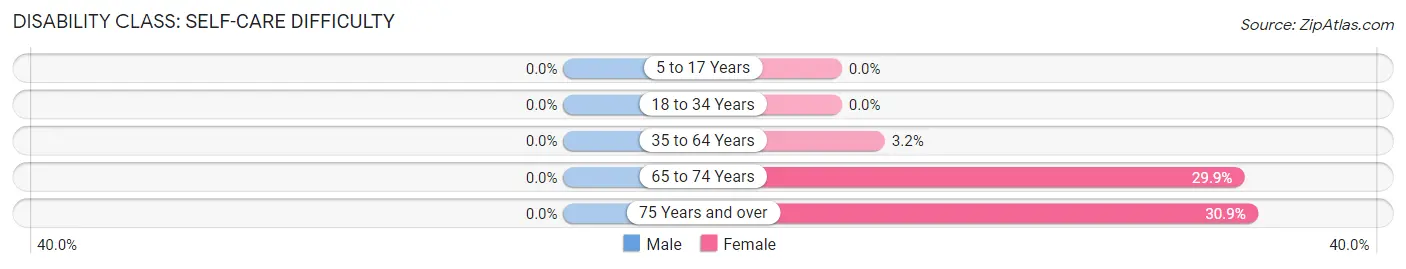
| Age Bracket | Male | Female |
| 5 to 17 Years | 0 (0.0%) | 0 (0.0%) |
| 18 to 34 Years | 0 (0.0%) | 0 (0.0%) |
| 35 to 64 Years | 0 (0.0%) | 7 (3.2%) |
| 65 to 74 Years | 0 (0.0%) | 23 (29.9%) |
| 75 Years and over | 0 (0.0%) | 25 (30.9%) |
Technology Access in Paducah
Computing Device Access in Paducah
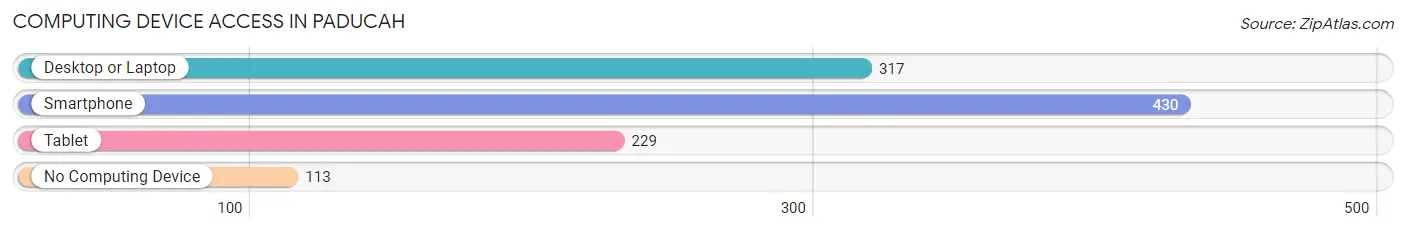
| Device Type | # Households | % Households |
| Desktop or Laptop | 317 | 57.6% |
| Smartphone | 430 | 78.2% |
| Tablet | 229 | 41.6% |
| No Computing Device | 113 | 20.5% |
| Total | 550 | 100.0% |
Internet Access in Paducah
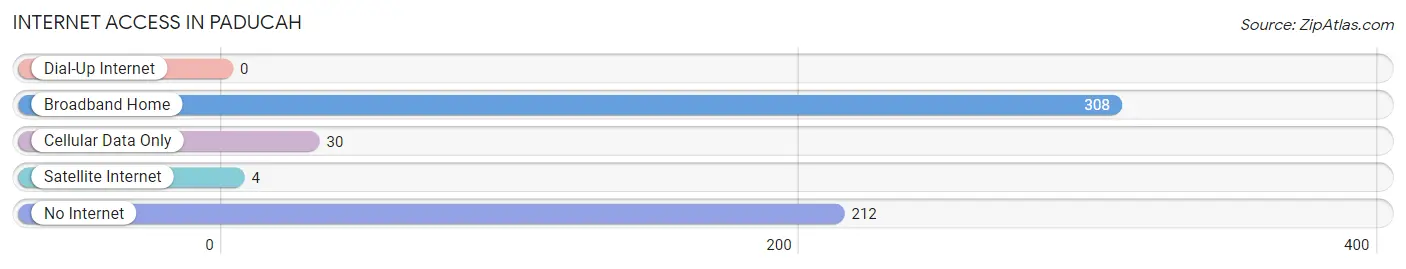
| Internet Type | # Households | % Households |
| Dial-Up Internet | 0 | 0.0% |
| Broadband Home | 308 | 56.0% |
| Cellular Data Only | 30 | 5.4% |
| Satellite Internet | 4 | 0.7% |
| No Internet | 212 | 38.6% |
| Total | 550 | 100.0% |
Paducah Summary
Paducah is a small town located in Cottle County, Texas, United States. It is situated on the banks of the Red River, approximately 90 miles northwest of Wichita Falls. The population was 1,072 at the 2010 census.
History
The town of Paducah was founded in 1876 by a group of settlers from Paducah, Kentucky. The town was named after the Kentucky city, which was in turn named after the ancient Egyptian city of Padua. The settlers were attracted to the area by the abundance of water and the fertile soil.
The town was incorporated in 1882 and soon became a thriving agricultural center. Cotton, corn, and wheat were the main crops grown in the area. The town also had a number of businesses, including a cotton gin, a grist mill, and a blacksmith shop.
In the early 1900s, Paducah began to experience a population boom. The town was connected to the rest of the state by the Texas and Pacific Railway in 1906. This allowed for the transportation of goods and people to and from Paducah.
Geography
Paducah is located at 33°45'25" North, 99°45'25" West (33.756944, -99.756944). According to the United States Census Bureau, the town has a total area of 1.2 square miles (3.1 km2), all of it land.
Economy
The economy of Paducah is largely based on agriculture. Cotton, corn, and wheat are the main crops grown in the area. The town also has a number of businesses, including a cotton gin, a grist mill, and a blacksmith shop.
In addition to agriculture, Paducah is home to a number of manufacturing companies. These include a furniture factory, a plastics factory, and a metal fabrication plant.
Demographics
As of the census of 2000, there were 1,072 people, 431 households, and 294 families residing in the town. The population density was 890.2 people per square mile (344.3/km2). There were 486 housing units at an average density of 400.2 per square mile (154.4/km2). The racial makeup of the town was 81.90% White, 0.09% African American, 0.09% Native American, 0.09% Asian, 0.09% Pacific Islander, 16.45% from other races, and 1.37% from two or more races. Hispanic or Latino of any race were 28.45% of the population.
There were 431 households, out of which 33.2% had children under the age of 18 living with them, 51.2% were married couples living together, 12.2% had a female householder with no husband present, and 32.2% were non-families. 28.2% of all households were made up of individuals, and 15.2% had someone living alone who was 65 years of age or older. The average household size was 2.50 and the average family size was 3.09.
In the town, the population was spread out, with 28.2% under the age of 18, 8.2% from 18 to 24, 25.2% from 25 to 44, 21.2% from 45 to 64, and 17.2% who were 65 years of age or older. The median age was 36 years. For every 100 females, there were 91.2 males. For every 100 females age 18 and over, there were 86.2 males.
The median income for a household in the town was $25,000, and the median income for a family was $30,000. Males had a median income of $25,000 versus $17,000 for females. The per capita income for the town was $13,000. About 17.2% of families and 20.2% of the population were below the poverty line, including 25.2% of those under age 18 and 16.2% of those age 65 or over.
Common Questions
What is Per Capita Income in Paducah?
Per Capita income in Paducah is $24,451.
What is the Median Family Income in Paducah?
Median Family Income in Paducah is $46,750.
What is the Median Household income in Paducah?
Median Household Income in Paducah is $33,250.
What is Income or Wage Gap in Paducah?
Income or Wage Gap in Paducah is 57.4%.
Women in Paducah earn 42.6 cents for every dollar earned by a man.
What is Inequality or Gini Index in Paducah?
Inequality or Gini Index in Paducah is 0.52.
What is the Total Population of Paducah?
Total Population of Paducah is 1,201.
What is the Total Male Population of Paducah?
Total Male Population of Paducah is 619.
What is the Total Female Population of Paducah?
Total Female Population of Paducah is 582.
What is the Ratio of Males per 100 Females in Paducah?
There are 106.36 Males per 100 Females in Paducah.
What is the Ratio of Females per 100 Males in Paducah?
There are 94.02 Females per 100 Males in Paducah.
What is the Median Population Age in Paducah?
Median Population Age in Paducah is 37.0 Years.
What is the Average Family Size in Paducah
Average Family Size in Paducah is 3.4 People.
What is the Average Household Size in Paducah
Average Household Size in Paducah is 2.2 People.
How Large is the Labor Force in Paducah?
There are 512 People in the Labor Forcein in Paducah.
What is the Percentage of People in the Labor Force in Paducah?
56.8% of People are in the Labor Force in Paducah.
What is the Unemployment Rate in Paducah?
Unemployment Rate in Paducah is 6.1%.