Orange Grove, TX Map & Demographics
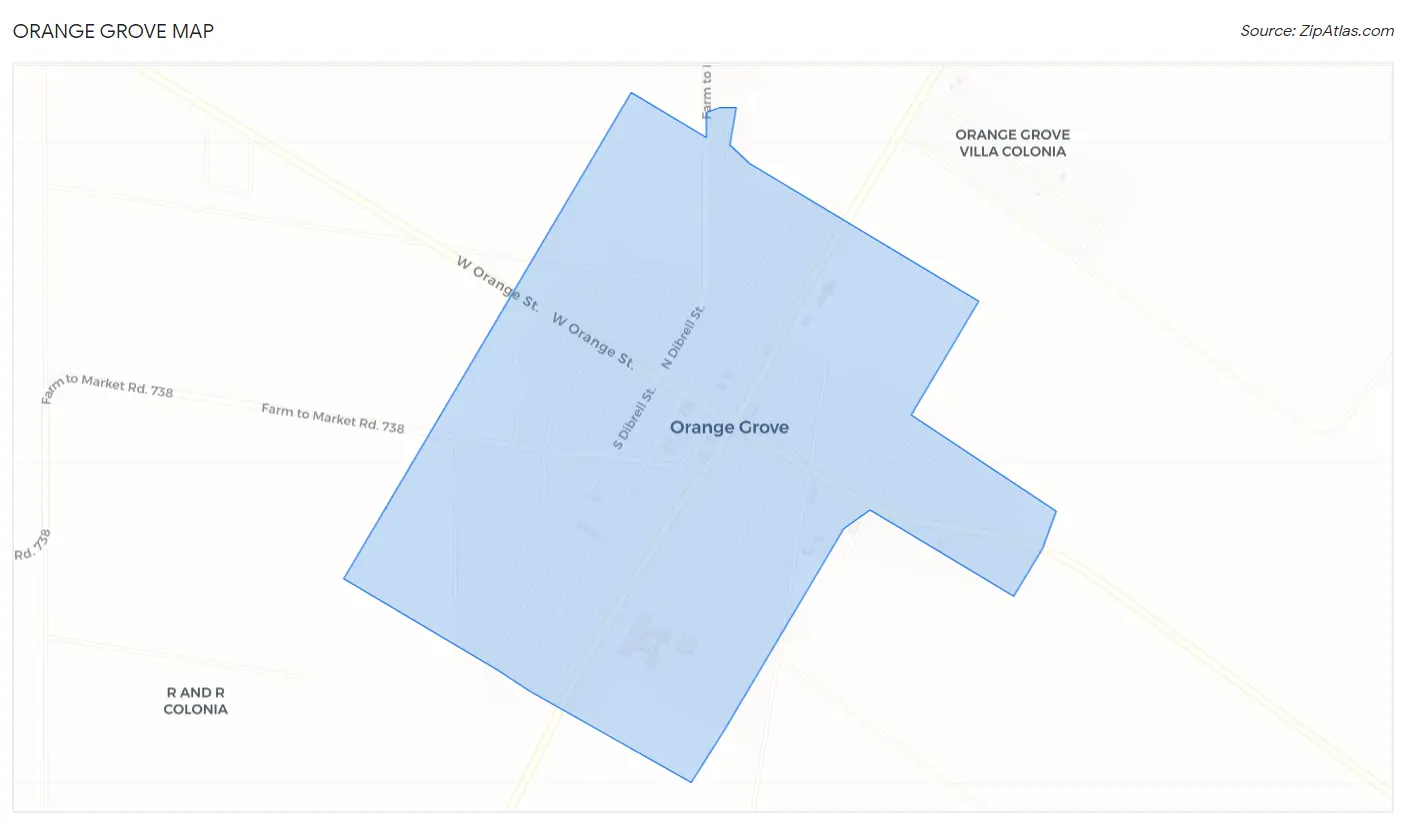
Orange Grove Map
Orange Grove Overview
$29,518
PER CAPITA INCOME
$79,653
AVG FAMILY INCOME
$55,391
AVG HOUSEHOLD INCOME
54.5%
WAGE / INCOME GAP [ % ]
45.5¢/ $1
WAGE / INCOME GAP [ $ ]
0.43
INEQUALITY / GINI INDEX
1,067
TOTAL POPULATION
559
MALE POPULATION
508
FEMALE POPULATION
110.04
MALES / 100 FEMALES
90.88
FEMALES / 100 MALES
39.4
MEDIAN AGE
3.2
AVG FAMILY SIZE
2.4
AVG HOUSEHOLD SIZE
448
LABOR FORCE [ PEOPLE ]
54.0%
PERCENT IN LABOR FORCE
4.7%
UNEMPLOYMENT RATE
Orange Grove Zip Codes
Orange Grove Area Codes
Income in Orange Grove
Income Overview in Orange Grove
Per Capita Income in Orange Grove is $29,518, while median incomes of families and households are $79,653 and $55,391 respectively.
| Characteristic | Number | Measure |
| Per Capita Income | 1,067 | $29,518 |
| Median Family Income | 233 | $79,653 |
| Mean Family Income | 233 | $82,048 |
| Median Household Income | 439 | $55,391 |
| Mean Household Income | 439 | $65,174 |
| Income Deficit | 233 | $0 |
| Wage / Income Gap (%) | 1,067 | 54.55% |
| Wage / Income Gap ($) | 1,067 | 45.45¢ per $1 |
| Gini / Inequality Index | 1,067 | 0.43 |
Earnings by Sex in Orange Grove
Average Earnings in Orange Grove are $42,708, $59,667 for men and $27,121 for women, a difference of 54.5%.
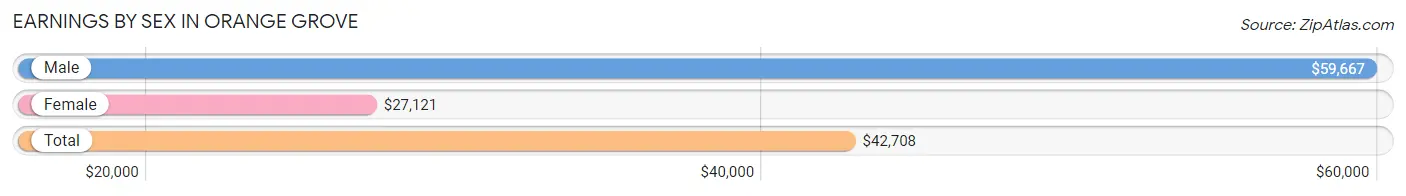
| Sex | Number | Average Earnings |
| Male | 248 (54.6%) | $59,667 |
| Female | 206 (45.4%) | $27,121 |
| Total | 454 (100.0%) | $42,708 |
Earnings by Sex by Income Bracket in Orange Grove
The most common earnings brackets in Orange Grove are $65,000 to $74,999 for men (51 | 20.6%) and $25,000 to $29,999 for women (33 | 16.0%).
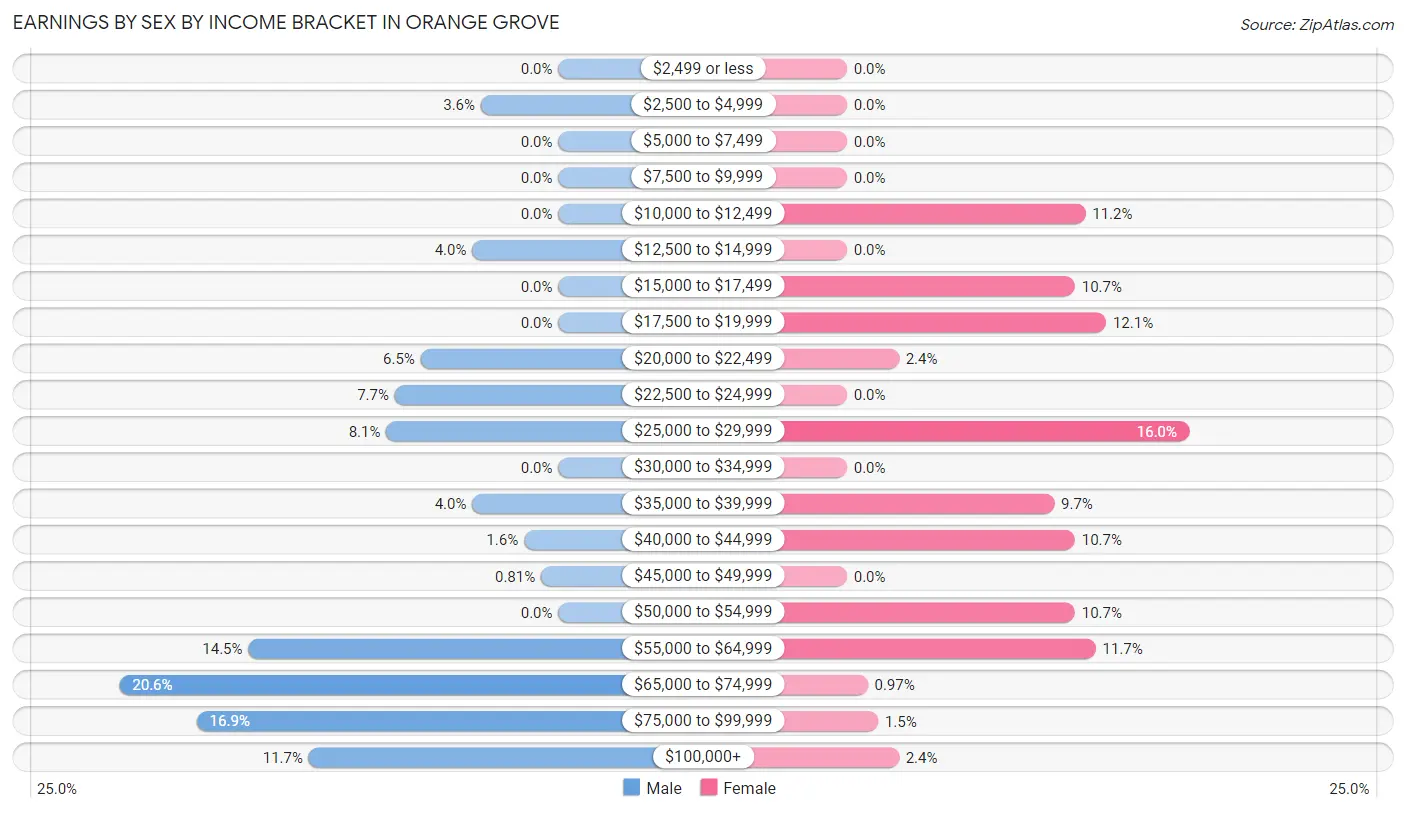
| Income | Male | Female |
| $2,499 or less | 0 (0.0%) | 0 (0.0%) |
| $2,500 to $4,999 | 9 (3.6%) | 0 (0.0%) |
| $5,000 to $7,499 | 0 (0.0%) | 0 (0.0%) |
| $7,500 to $9,999 | 0 (0.0%) | 0 (0.0%) |
| $10,000 to $12,499 | 0 (0.0%) | 23 (11.2%) |
| $12,500 to $14,999 | 10 (4.0%) | 0 (0.0%) |
| $15,000 to $17,499 | 0 (0.0%) | 22 (10.7%) |
| $17,500 to $19,999 | 0 (0.0%) | 25 (12.1%) |
| $20,000 to $22,499 | 16 (6.5%) | 5 (2.4%) |
| $22,500 to $24,999 | 19 (7.7%) | 0 (0.0%) |
| $25,000 to $29,999 | 20 (8.1%) | 33 (16.0%) |
| $30,000 to $34,999 | 0 (0.0%) | 0 (0.0%) |
| $35,000 to $39,999 | 10 (4.0%) | 20 (9.7%) |
| $40,000 to $44,999 | 4 (1.6%) | 22 (10.7%) |
| $45,000 to $49,999 | 2 (0.8%) | 0 (0.0%) |
| $50,000 to $54,999 | 0 (0.0%) | 22 (10.7%) |
| $55,000 to $64,999 | 36 (14.5%) | 24 (11.7%) |
| $65,000 to $74,999 | 51 (20.6%) | 2 (1.0%) |
| $75,000 to $99,999 | 42 (16.9%) | 3 (1.5%) |
| $100,000+ | 29 (11.7%) | 5 (2.4%) |
| Total | 248 (100.0%) | 206 (100.0%) |
Earnings by Sex by Educational Attainment in Orange Grove
Average earnings in Orange Grove are $66,181 for men and $39,938 for women, a difference of 39.7%. Men with an educational attainment of bachelor's degree enjoy the highest average annual earnings of $76,103, while those with college or associate's degree education earn the least with $70,833. Women with an educational attainment of high school diploma earn the most with the average annual earnings of $51,176, while those with high school diploma education have the smallest earnings of $51,176.
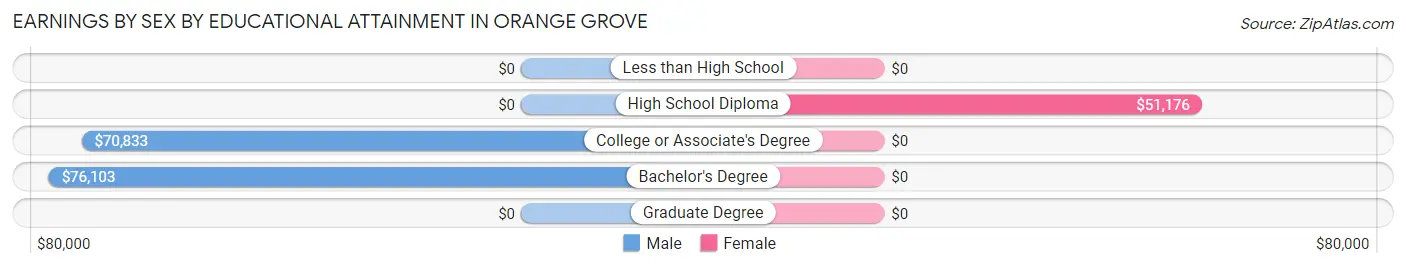
| Educational Attainment | Male Income | Female Income |
| Less than High School | - | - |
| High School Diploma | - | - |
| College or Associate's Degree | $70,833 | $0 |
| Bachelor's Degree | $76,103 | $0 |
| Graduate Degree | - | - |
| Total | $66,181 | $39,938 |
Family Income in Orange Grove
Family Income Brackets in Orange Grove
According to the Orange Grove family income data, there are 71 families falling into the $75,000 to $99,999 income range, which is the most common income bracket and makes up 30.5% of all families.
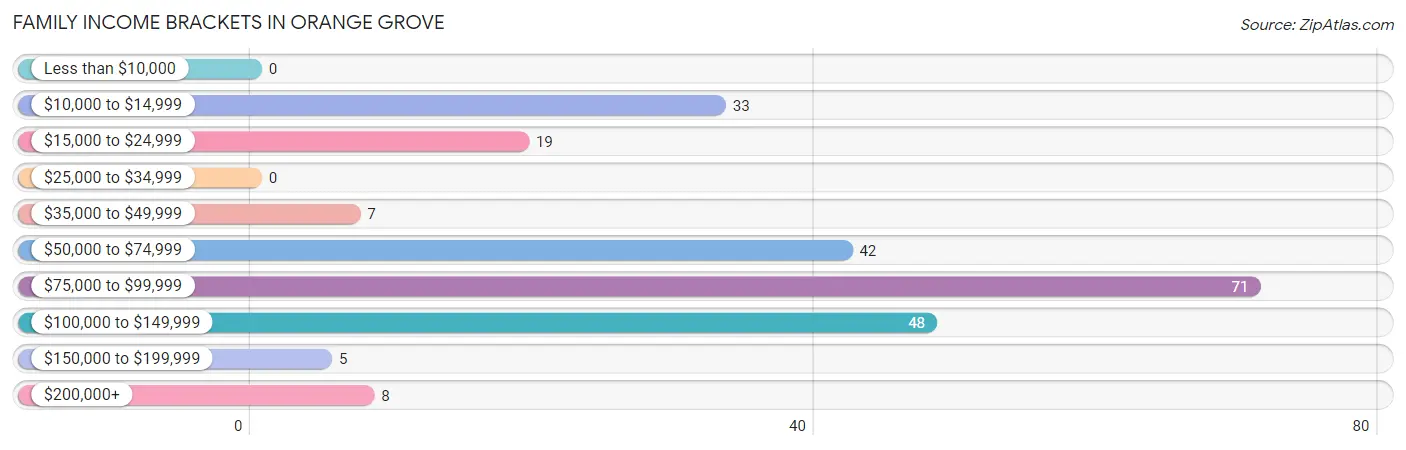
| Income Bracket | # Families | % Families |
| Less than $10,000 | 0 | 0.0% |
| $10,000 to $14,999 | 33 | 14.2% |
| $15,000 to $24,999 | 19 | 8.2% |
| $25,000 to $34,999 | 0 | 0.0% |
| $35,000 to $49,999 | 7 | 3.0% |
| $50,000 to $74,999 | 42 | 18.0% |
| $75,000 to $99,999 | 71 | 30.5% |
| $100,000 to $149,999 | 48 | 20.6% |
| $150,000 to $199,999 | 5 | 2.1% |
| $200,000+ | 8 | 3.4% |
Family Income by Famaliy Size in Orange Grove
3-person families (30 | 12.9%) account for the highest median family income in Orange Grove with $108,542 per family, while 3-person families (30 | 12.9%) have the highest median income of $36,181 per family member.
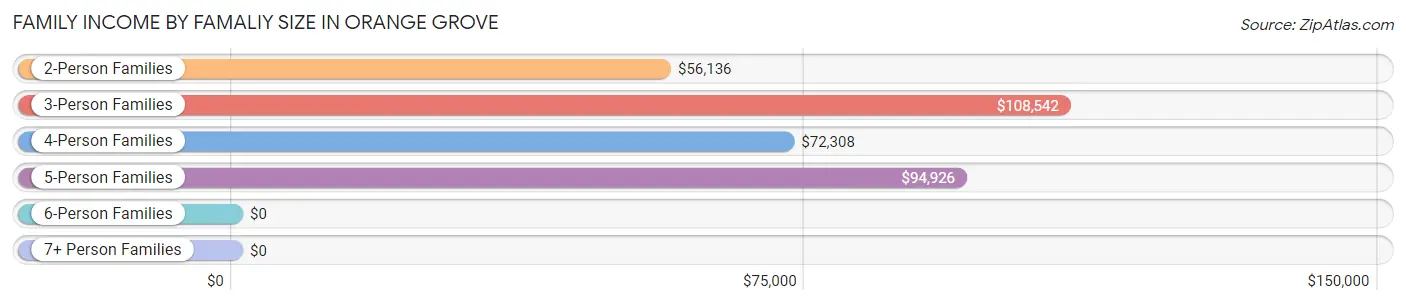
| Income Bracket | # Families | Median Income |
| 2-Person Families | 126 (54.1%) | $56,136 |
| 3-Person Families | 30 (12.9%) | $108,542 |
| 4-Person Families | 44 (18.9%) | $72,308 |
| 5-Person Families | 33 (14.2%) | $94,926 |
| 6-Person Families | 0 (0.0%) | $0 |
| 7+ Person Families | 0 (0.0%) | $0 |
| Total | 233 (100.0%) | $79,653 |
Family Income by Number of Earners in Orange Grove
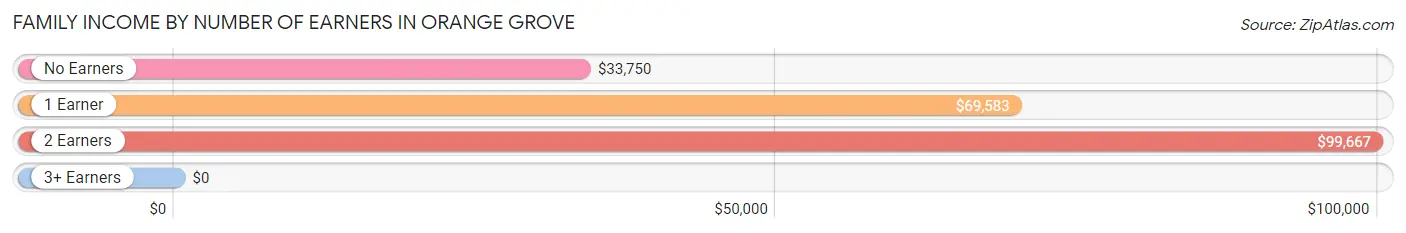
| Number of Earners | # Families | Median Income |
| No Earners | 38 (16.3%) | $33,750 |
| 1 Earner | 93 (39.9%) | $69,583 |
| 2 Earners | 90 (38.6%) | $99,667 |
| 3+ Earners | 12 (5.1%) | $0 |
| Total | 233 (100.0%) | $79,653 |
Household Income in Orange Grove
Household Income Brackets in Orange Grove
With 95 households falling in the category, the $75,000 to $99,999 income range is the most frequent in Orange Grove, accounting for 21.6% of all households. In contrast, only 8 households (1.8%) fall into the $25,000 to $34,999 income bracket, making it the least populous group.
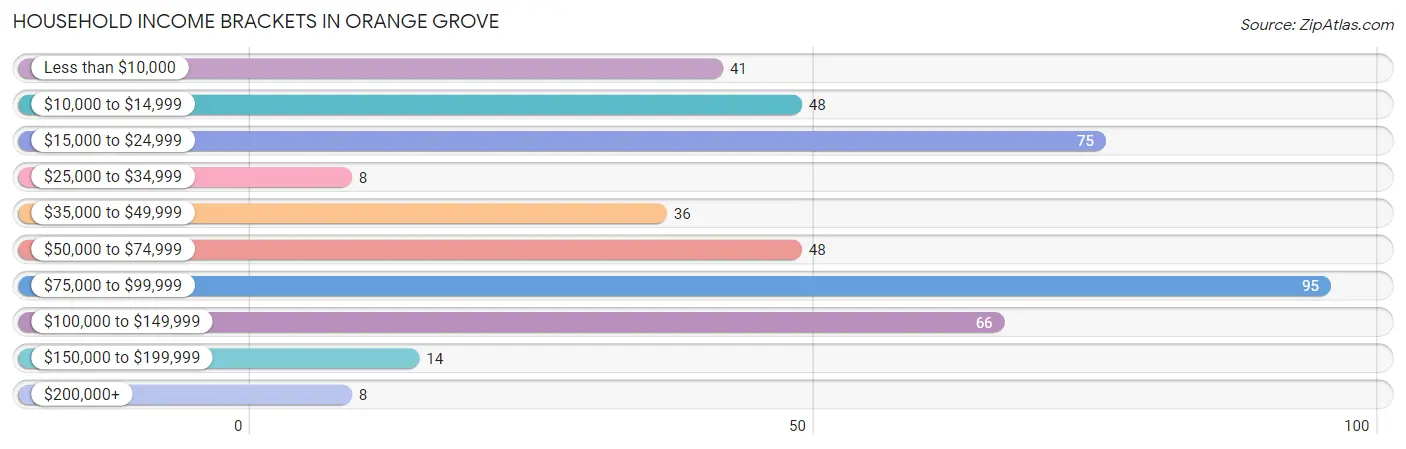
| Income Bracket | # Households | % Households |
| Less than $10,000 | 41 | 9.3% |
| $10,000 to $14,999 | 48 | 10.9% |
| $15,000 to $24,999 | 75 | 17.1% |
| $25,000 to $34,999 | 8 | 1.8% |
| $35,000 to $49,999 | 36 | 8.2% |
| $50,000 to $74,999 | 48 | 10.9% |
| $75,000 to $99,999 | 95 | 21.6% |
| $100,000 to $149,999 | 66 | 15.0% |
| $150,000 to $199,999 | 14 | 3.2% |
| $200,000+ | 8 | 1.8% |
Household Income by Householder Age in Orange Grove
The median household income in Orange Grove is $55,391, with the highest median household income of $92,647 found in the 25 to 44 years age bracket for the primary householder. A total of 138 households (31.4%) fall into this category. Meanwhile, the 15 to 24 years age bracket for the primary householder has the lowest median household income of $0, with 36 households (8.2%) in this group.
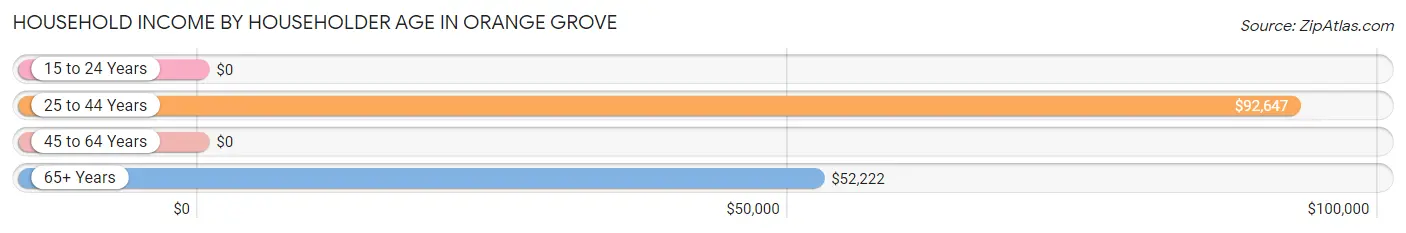
| Income Bracket | # Households | Median Income |
| 15 to 24 Years | 36 (8.2%) | $0 |
| 25 to 44 Years | 138 (31.4%) | $92,647 |
| 45 to 64 Years | 149 (33.9%) | $0 |
| 65+ Years | 116 (26.4%) | $52,222 |
| Total | 439 (100.0%) | $55,391 |
Poverty in Orange Grove
Income Below Poverty by Sex and Age in Orange Grove
With 15.1% poverty level for males and 20.3% for females among the residents of Orange Grove, 5 year old males and 12 to 14 year old females are the most vulnerable to poverty, with 10 males (100.0%) and 13 females (86.7%) in their respective age groups living below the poverty level.
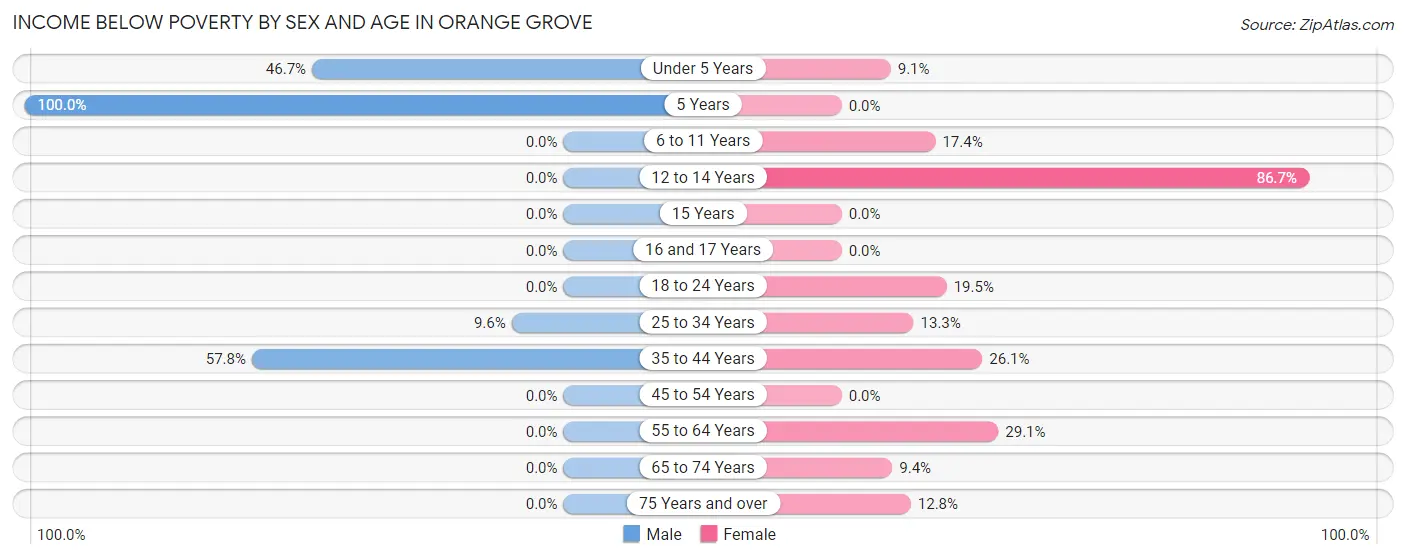
| Age Bracket | Male | Female |
| Under 5 Years | 14 (46.7%) | 5 (9.1%) |
| 5 Years | 10 (100.0%) | 0 (0.0%) |
| 6 to 11 Years | 0 (0.0%) | 8 (17.4%) |
| 12 to 14 Years | 0 (0.0%) | 13 (86.7%) |
| 15 Years | 0 (0.0%) | 0 (0.0%) |
| 16 and 17 Years | 0 (0.0%) | 0 (0.0%) |
| 18 to 24 Years | 0 (0.0%) | 15 (19.5%) |
| 25 to 34 Years | 10 (9.6%) | 8 (13.3%) |
| 35 to 44 Years | 48 (57.8%) | 12 (26.1%) |
| 45 to 54 Years | 0 (0.0%) | 0 (0.0%) |
| 55 to 64 Years | 0 (0.0%) | 34 (29.1%) |
| 65 to 74 Years | 0 (0.0%) | 3 (9.4%) |
| 75 Years and over | 0 (0.0%) | 5 (12.8%) |
| Total | 82 (15.1%) | 103 (20.3%) |
Income Above Poverty by Sex and Age in Orange Grove
According to the poverty statistics in Orange Grove, males aged 6 to 11 years and females aged 45 to 54 years are the age groups that are most secure financially, with 100.0% of males and 100.0% of females in these age groups living above the poverty line.
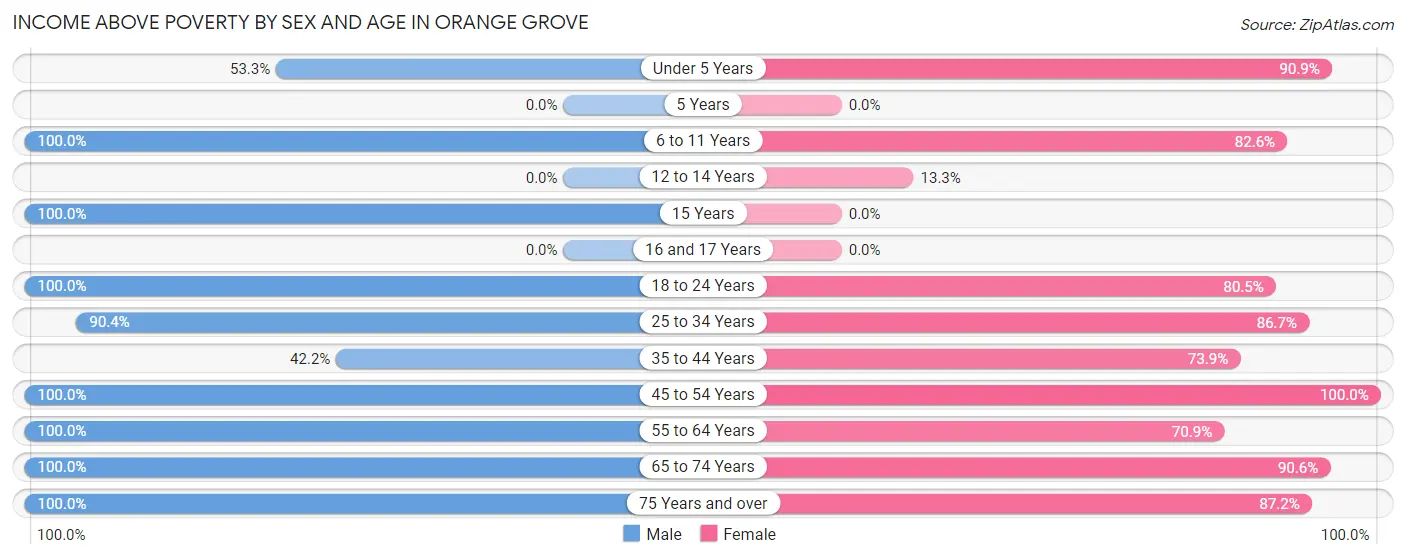
| Age Bracket | Male | Female |
| Under 5 Years | 16 (53.3%) | 50 (90.9%) |
| 5 Years | 0 (0.0%) | 0 (0.0%) |
| 6 to 11 Years | 50 (100.0%) | 38 (82.6%) |
| 12 to 14 Years | 0 (0.0%) | 2 (13.3%) |
| 15 Years | 16 (100.0%) | 0 (0.0%) |
| 16 and 17 Years | 0 (0.0%) | 0 (0.0%) |
| 18 to 24 Years | 26 (100.0%) | 62 (80.5%) |
| 25 to 34 Years | 94 (90.4%) | 52 (86.7%) |
| 35 to 44 Years | 35 (42.2%) | 34 (73.9%) |
| 45 to 54 Years | 65 (100.0%) | 21 (100.0%) |
| 55 to 64 Years | 55 (100.0%) | 83 (70.9%) |
| 65 to 74 Years | 60 (100.0%) | 29 (90.6%) |
| 75 Years and over | 44 (100.0%) | 34 (87.2%) |
| Total | 461 (84.9%) | 405 (79.7%) |
Income Below Poverty Among Married-Couple Families in Orange Grove
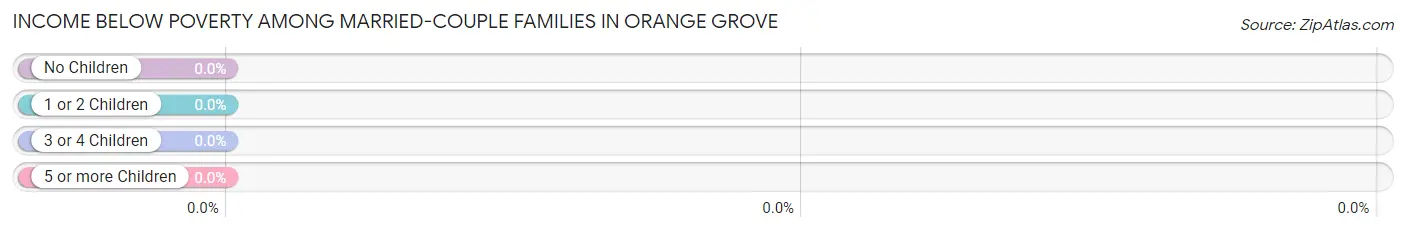
| Children | Above Poverty | Below Poverty |
| No Children | 124 (100.0%) | 0 (0.0%) |
| 1 or 2 Children | 59 (100.0%) | 0 (0.0%) |
| 3 or 4 Children | 14 (100.0%) | 0 (0.0%) |
| 5 or more Children | 0 (0.0%) | 0 (0.0%) |
| Total | 197 (100.0%) | 0 (0.0%) |
Income Below Poverty Among Single-Parent Households in Orange Grove
According to the poverty data in Orange Grove, 100.0% or 10 single-father households and 88.5% or 23 single-mother households are living below the poverty line. Among single-father households, those with 3 or 4 children have the highest poverty rate, with 10 households (100.0%) experiencing poverty. Likewise, among single-mother households, those with 1 or 2 children have the highest poverty rate, with 23 households (100.0%) falling below the poverty line.
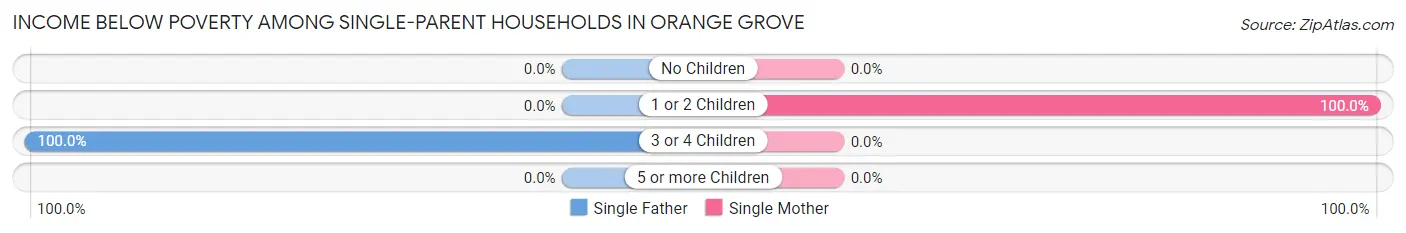
| Children | Single Father | Single Mother |
| No Children | 0 (0.0%) | 0 (0.0%) |
| 1 or 2 Children | 0 (0.0%) | 23 (100.0%) |
| 3 or 4 Children | 10 (100.0%) | 0 (0.0%) |
| 5 or more Children | 0 (0.0%) | 0 (0.0%) |
| Total | 10 (100.0%) | 23 (88.5%) |
Income Below Poverty Among Married-Couple vs Single-Parent Households in Orange Grove
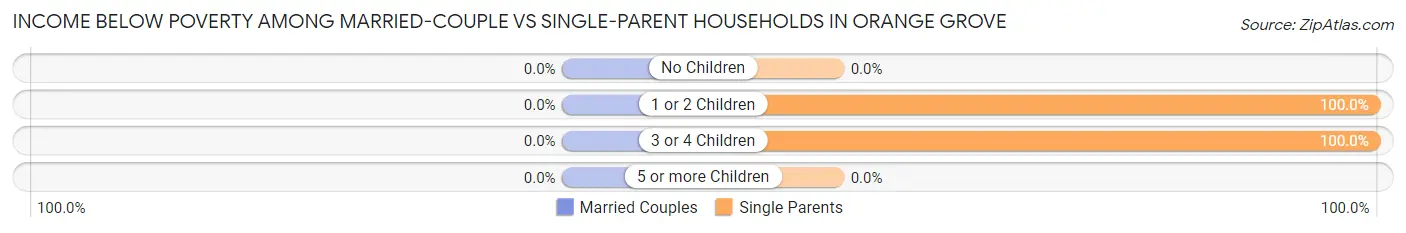
| Children | Married-Couple Families | Single-Parent Households |
| No Children | 0 (0.0%) | 0 (0.0%) |
| 1 or 2 Children | 0 (0.0%) | 23 (100.0%) |
| 3 or 4 Children | 0 (0.0%) | 10 (100.0%) |
| 5 or more Children | 0 (0.0%) | 0 (0.0%) |
| Total | 0 (0.0%) | 33 (91.7%) |
Race in Orange Grove
The most populous races in Orange Grove are White / Caucasian (979 | 91.7%), Hispanic or Latino (601 | 56.3%), and Two or more Races (88 | 8.3%).
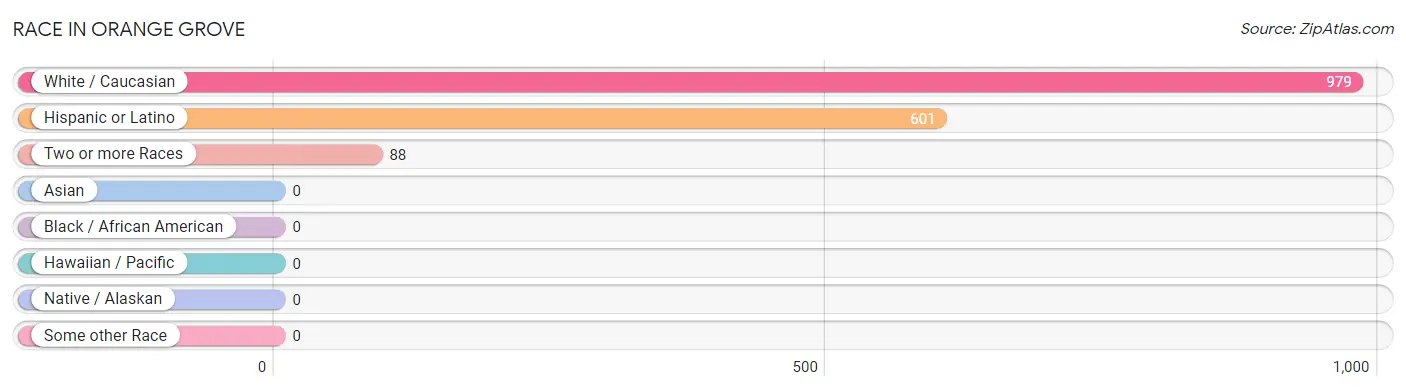
| Race | # Population | % Population |
| Asian | 0 | 0.0% |
| Black / African American | 0 | 0.0% |
| Hawaiian / Pacific | 0 | 0.0% |
| Hispanic or Latino | 601 | 56.3% |
| Native / Alaskan | 0 | 0.0% |
| White / Caucasian | 979 | 91.7% |
| Two or more Races | 88 | 8.3% |
| Some other Race | 0 | 0.0% |
| Total | 1,067 | 100.0% |
Ancestry in Orange Grove
The most populous ancestries reported in Orange Grove are Mexican (586 | 54.9%), German (158 | 14.8%), Irish (61 | 5.7%), American (52 | 4.9%), and English (38 | 3.6%), together accounting for 83.9% of all Orange Grove residents.
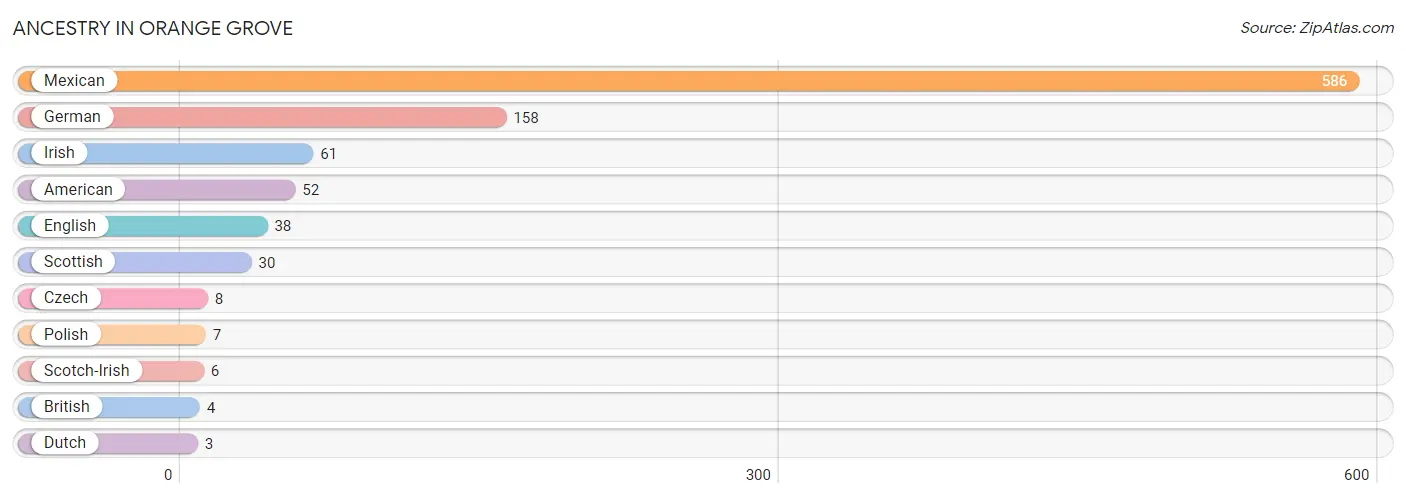
| Ancestry | # Population | % Population |
| American | 52 | 4.9% |
| British | 4 | 0.4% |
| Czech | 8 | 0.7% |
| Dutch | 3 | 0.3% |
| English | 38 | 3.6% |
| German | 158 | 14.8% |
| Irish | 61 | 5.7% |
| Mexican | 586 | 54.9% |
| Polish | 7 | 0.7% |
| Scotch-Irish | 6 | 0.6% |
| Scottish | 30 | 2.8% | View All 11 Rows |
Immigrants in Orange Grove
The most numerous immigrant groups reported in Orange Grove came from Central America (47 | 4.4%), Latin America (47 | 4.4%), and Mexico (47 | 4.4%), together accounting for 13.2% of all Orange Grove residents.
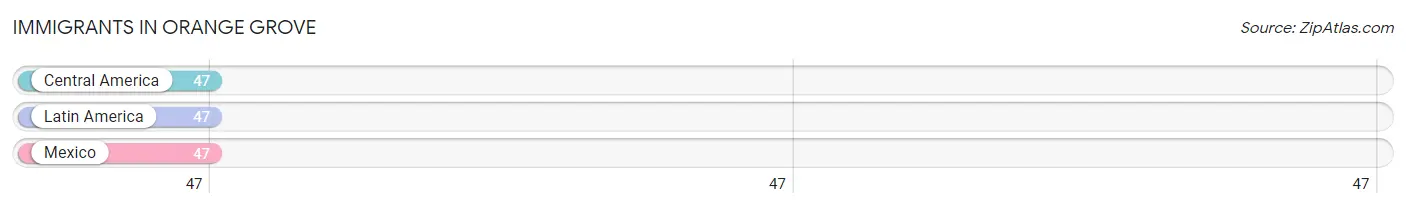
| Immigration Origin | # Population | % Population |
| Central America | 47 | 4.4% |
| Latin America | 47 | 4.4% |
| Mexico | 47 | 4.4% | View All 3 Rows |
Sex and Age in Orange Grove
Sex and Age in Orange Grove
The most populous age groups in Orange Grove are 30 to 34 Years (69 | 12.3%) for men and 55 to 59 Years (73 | 14.4%) for women.
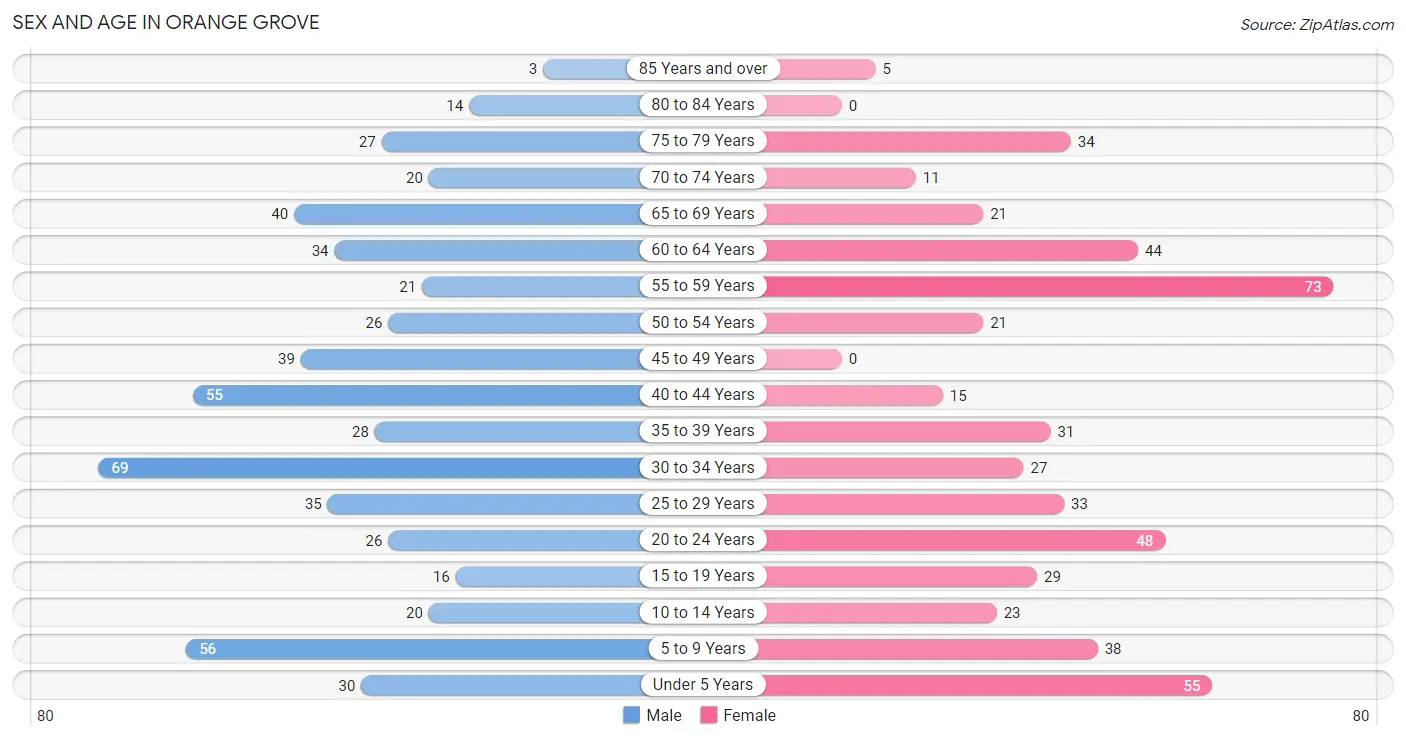
| Age Bracket | Male | Female |
| Under 5 Years | 30 (5.4%) | 55 (10.8%) |
| 5 to 9 Years | 56 (10.0%) | 38 (7.5%) |
| 10 to 14 Years | 20 (3.6%) | 23 (4.5%) |
| 15 to 19 Years | 16 (2.9%) | 29 (5.7%) |
| 20 to 24 Years | 26 (4.6%) | 48 (9.5%) |
| 25 to 29 Years | 35 (6.3%) | 33 (6.5%) |
| 30 to 34 Years | 69 (12.3%) | 27 (5.3%) |
| 35 to 39 Years | 28 (5.0%) | 31 (6.1%) |
| 40 to 44 Years | 55 (9.8%) | 15 (2.9%) |
| 45 to 49 Years | 39 (7.0%) | 0 (0.0%) |
| 50 to 54 Years | 26 (4.6%) | 21 (4.1%) |
| 55 to 59 Years | 21 (3.8%) | 73 (14.4%) |
| 60 to 64 Years | 34 (6.1%) | 44 (8.7%) |
| 65 to 69 Years | 40 (7.2%) | 21 (4.1%) |
| 70 to 74 Years | 20 (3.6%) | 11 (2.2%) |
| 75 to 79 Years | 27 (4.8%) | 34 (6.7%) |
| 80 to 84 Years | 14 (2.5%) | 0 (0.0%) |
| 85 Years and over | 3 (0.5%) | 5 (1.0%) |
| Total | 559 (100.0%) | 508 (100.0%) |
Families and Households in Orange Grove
Median Family Size in Orange Grove
The median family size in Orange Grove is 3.17 persons per family, with single male/father families (10 | 4.3%) accounting for the largest median family size of 3.3 persons per family. On the other hand, single female/mother families (26 | 11.2%) represent the smallest median family size with 2.23 persons per family.
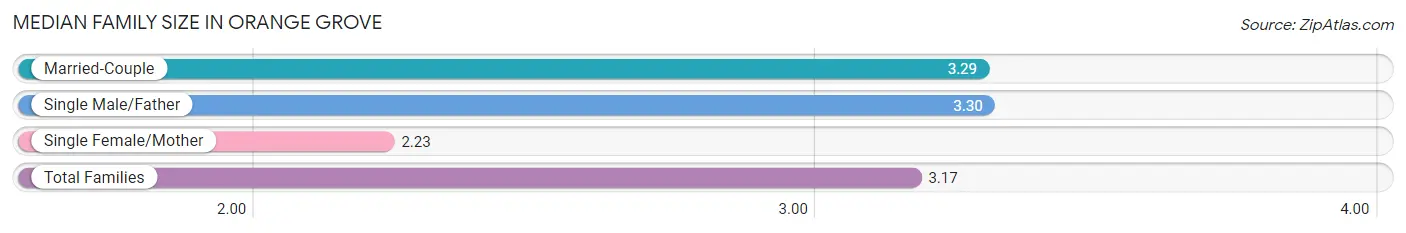
| Family Type | # Families | Family Size |
| Married-Couple | 197 (84.6%) | 3.29 |
| Single Male/Father | 10 (4.3%) | 3.30 |
| Single Female/Mother | 26 (11.2%) | 2.23 |
| Total Families | 233 (100.0%) | 3.17 |
Median Household Size in Orange Grove
The median household size in Orange Grove is 2.43 persons per household, with single male/father households (10 | 2.3%) accounting for the largest median household size of 4.1 persons per household. non-family households (206 | 46.9%) represent the smallest median household size with 1.38 persons per household.
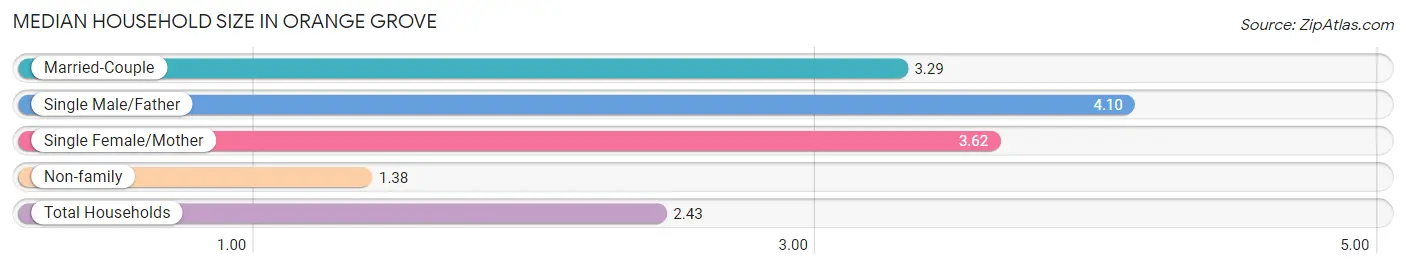
| Household Type | # Households | Household Size |
| Married-Couple | 197 (44.9%) | 3.29 |
| Single Male/Father | 10 (2.3%) | 4.10 |
| Single Female/Mother | 26 (5.9%) | 3.62 |
| Non-family | 206 (46.9%) | 1.38 |
| Total Households | 439 (100.0%) | 2.43 |
Household Size by Marriage Status in Orange Grove
Out of a total of 439 households in Orange Grove, 233 (53.1%) are family households, while 206 (46.9%) are nonfamily households. The most numerous type of family households are 2-person households, comprising 112, and the most common type of nonfamily households are 1-person households, comprising 142.
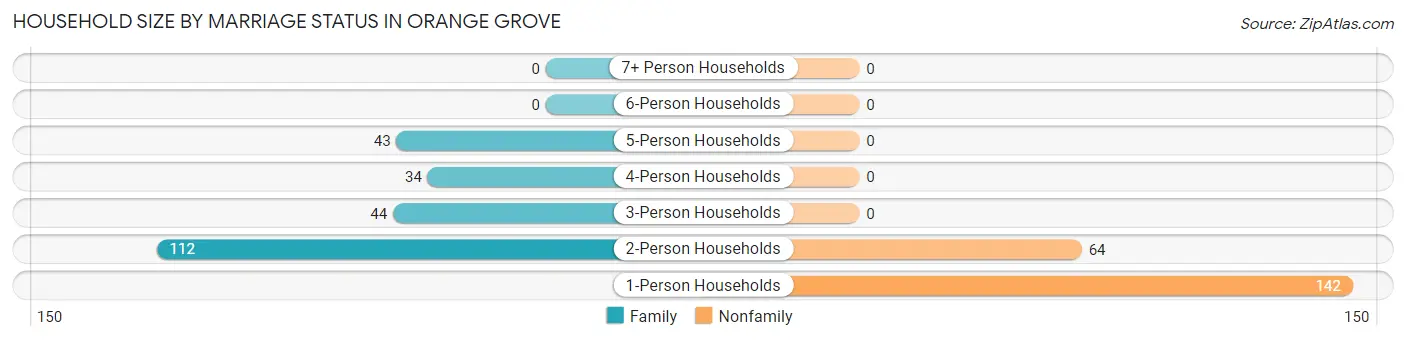
| Household Size | Family Households | Nonfamily Households |
| 1-Person Households | - | 142 (32.4%) |
| 2-Person Households | 112 (25.5%) | 64 (14.6%) |
| 3-Person Households | 44 (10.0%) | 0 (0.0%) |
| 4-Person Households | 34 (7.7%) | 0 (0.0%) |
| 5-Person Households | 43 (9.8%) | 0 (0.0%) |
| 6-Person Households | 0 (0.0%) | 0 (0.0%) |
| 7+ Person Households | 0 (0.0%) | 0 (0.0%) |
| Total | 233 (53.1%) | 206 (46.9%) |
Female Fertility in Orange Grove
Fertility by Age in Orange Grove
| Age Bracket | Women with Births | Births / 1,000 Women |
| 15 to 19 years | 0 (0.0%) | 0.0 |
| 20 to 34 years | 0 (0.0%) | 0.0 |
| 35 to 50 years | 0 (0.0%) | 0.0 |
| Total | 0 (0.0%) | 0.0 |
Fertility by Age by Marriage Status in Orange Grove
| Age Bracket | Married | Unmarried |
| 15 to 19 years | 0 (0.0%) | 0 (0.0%) |
| 20 to 34 years | 0 (0.0%) | 0 (0.0%) |
| 35 to 50 years | 0 (0.0%) | 0 (0.0%) |
| Total | 0 (0.0%) | 0 (0.0%) |
Fertility by Education in Orange Grove
| Educational Attainment | Women with Births | Births / 1,000 Women |
| Less than High School | 0 (0.0%) | 0.0 |
| High School Diploma | 0 (0.0%) | 0.0 |
| College or Associate's Degree | 0 (0.0%) | 0.0 |
| Bachelor's Degree | 0 (0.0%) | 0.0 |
| Graduate Degree | 0 (0.0%) | 0.0 |
| Total | 0 (0.0%) | 0.0 |
Fertility by Education by Marriage Status in Orange Grove
| Educational Attainment | Married | Unmarried |
| Less than High School | 0 (0.0%) | 0 (0.0%) |
| High School Diploma | 0 (0.0%) | 0 (0.0%) |
| College or Associate's Degree | 0 (0.0%) | 0 (0.0%) |
| Bachelor's Degree | 0 (0.0%) | 0 (0.0%) |
| Graduate Degree | 0 (0.0%) | 0 (0.0%) |
| Total | 0 (0.0%) | 0 (0.0%) |
Employment Characteristics in Orange Grove
Employment by Class of Employer in Orange Grove
Among the 427 employed individuals in Orange Grove, private company employees (378 | 88.5%), local government employees (28 | 6.6%), and not-for-profit organizations (21 | 4.9%) make up the most common classes of employment.
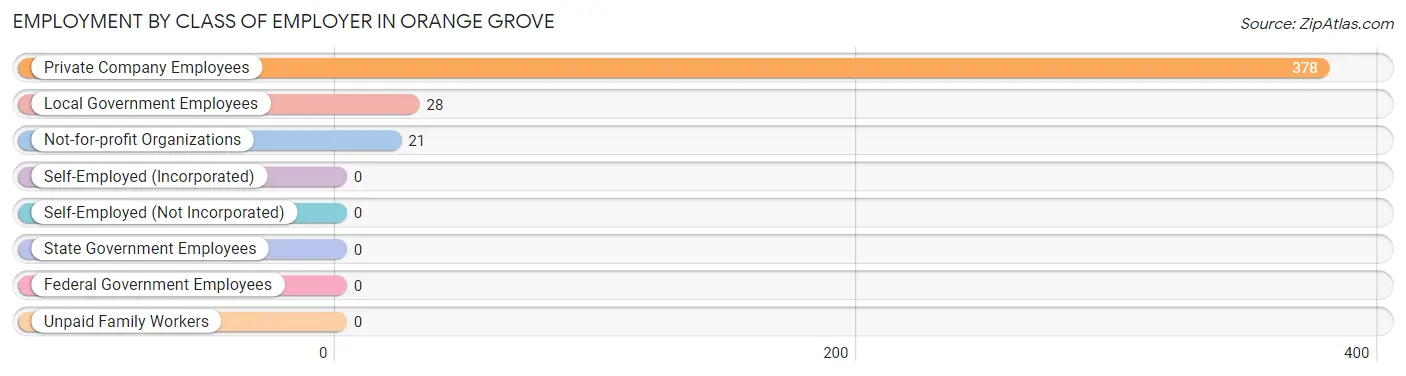
| Employer Class | # Employees | % Employees |
| Private Company Employees | 378 | 88.5% |
| Self-Employed (Incorporated) | 0 | 0.0% |
| Self-Employed (Not Incorporated) | 0 | 0.0% |
| Not-for-profit Organizations | 21 | 4.9% |
| Local Government Employees | 28 | 6.6% |
| State Government Employees | 0 | 0.0% |
| Federal Government Employees | 0 | 0.0% |
| Unpaid Family Workers | 0 | 0.0% |
| Total | 427 | 100.0% |
Employment Status by Age in Orange Grove
According to the labor force statistics for Orange Grove, out of the total population over 16 years of age (829), 54.0% or 448 individuals are in the labor force, with 4.7% or 21 of them unemployed. The age group with the highest labor force participation rate is 30 to 34 years, with 91.7% or 88 individuals in the labor force. Within the labor force, the 65 to 74 years age range has the highest percentage of unemployed individuals, with 40.5% or 15 of them being unemployed.
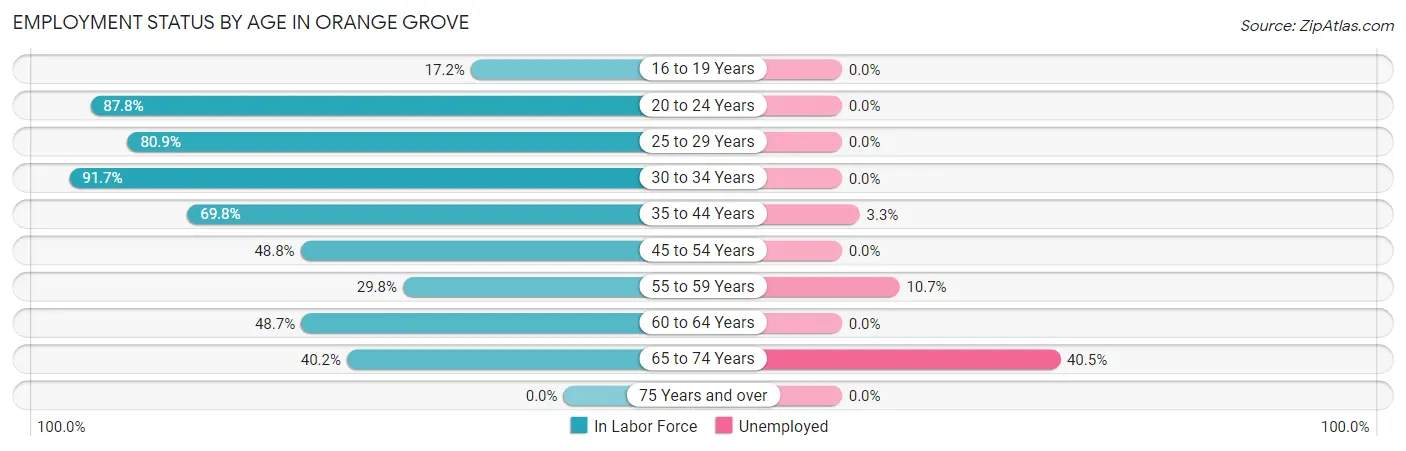
| Age Bracket | In Labor Force | Unemployed |
| 16 to 19 Years | 5 (17.2%) | 0 (0.0%) |
| 20 to 24 Years | 65 (87.8%) | 0 (0.0%) |
| 25 to 29 Years | 55 (80.9%) | 0 (0.0%) |
| 30 to 34 Years | 88 (91.7%) | 0 (0.0%) |
| 35 to 44 Years | 90 (69.8%) | 3 (3.3%) |
| 45 to 54 Years | 42 (48.8%) | 0 (0.0%) |
| 55 to 59 Years | 28 (29.8%) | 3 (10.7%) |
| 60 to 64 Years | 38 (48.7%) | 0 (0.0%) |
| 65 to 74 Years | 37 (40.2%) | 15 (40.5%) |
| 75 Years and over | 0 (0.0%) | 0 (0.0%) |
| Total | 448 (54.0%) | 21 (4.7%) |
Employment Status by Educational Attainment in Orange Grove
According to labor force statistics for Orange Grove, 61.9% of individuals (341) out of the total population between 25 and 64 years of age (551) are in the labor force, with 1.8% or 6 of them being unemployed. The group with the highest labor force participation rate are those with the educational attainment of bachelor's degree or higher, with 85.1% or 63 individuals in the labor force. Within the labor force, individuals with college / associate degree education have the highest percentage of unemployment, with 5.5% or 6 of them being unemployed.
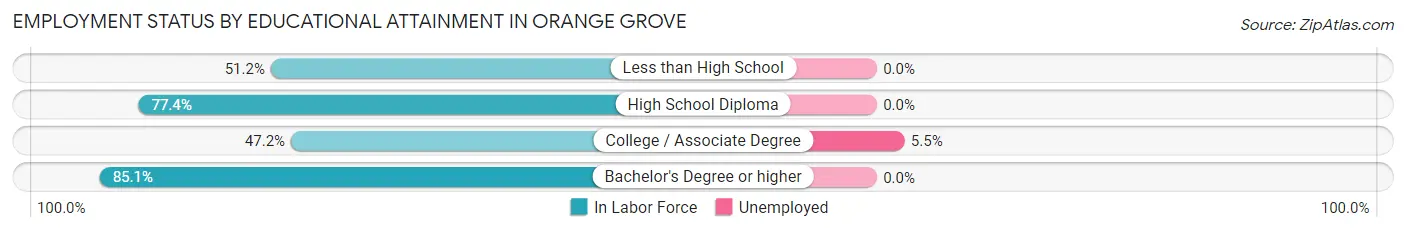
| Educational Attainment | In Labor Force | Unemployed |
| Less than High School | 42 (51.2%) | 0 (0.0%) |
| High School Diploma | 127 (77.4%) | 0 (0.0%) |
| College / Associate Degree | 109 (47.2%) | 13 (5.5%) |
| Bachelor's Degree or higher | 63 (85.1%) | 0 (0.0%) |
| Total | 341 (61.9%) | 10 (1.8%) |
Employment Occupations by Sex in Orange Grove
Management, Business, Science and Arts Occupations
The most common Management, Business, Science and Arts occupations in Orange Grove are Health Diagnosing & Treating (33 | 7.7%), Management (29 | 6.8%), Health Technologists (28 | 6.6%), Computers, Engineering & Science (26 | 6.1%), and Life, Physical & Social Science (17 | 4.0%).
Management, Business, Science and Arts Occupations by Sex
Within the Management, Business, Science and Arts occupations in Orange Grove, the most male-oriented occupations are Computers & Mathematics (100.0%), Life, Physical & Social Science (100.0%), and Computers, Engineering & Science (88.5%), while the most female-oriented occupations are Business & Financial (100.0%), Architecture & Engineering (100.0%), and Management (86.2%).
| Occupation | Male | Female |
| Management | 4 (13.8%) | 25 (86.2%) |
| Business & Financial | 0 (0.0%) | 5 (100.0%) |
| Computers, Engineering & Science | 23 (88.5%) | 3 (11.5%) |
| Computers & Mathematics | 6 (100.0%) | 0 (0.0%) |
| Architecture & Engineering | 0 (0.0%) | 3 (100.0%) |
| Life, Physical & Social Science | 17 (100.0%) | 0 (0.0%) |
| Community & Social Service | 4 (28.6%) | 10 (71.4%) |
| Education, Arts & Media | 0 (0.0%) | 0 (0.0%) |
| Legal Services & Support | 0 (0.0%) | 0 (0.0%) |
| Education Instruction & Library | 4 (28.6%) | 10 (71.4%) |
| Arts, Media & Entertainment | 0 (0.0%) | 0 (0.0%) |
| Health Diagnosing & Treating | 16 (48.5%) | 17 (51.5%) |
| Health Technologists | 16 (57.1%) | 12 (42.9%) |
| Total (Category) | 47 (43.9%) | 60 (56.1%) |
| Total (Overall) | 221 (51.8%) | 206 (48.2%) |
Services Occupations
The most common Services occupations in Orange Grove are Personal Care & Service (34 | 8.0%), Healthcare Support (20 | 4.7%), Food Preparation & Serving (19 | 4.4%), and Cleaning & Maintenance (17 | 4.0%).
Services Occupations by Sex
| Occupation | Male | Female |
| Healthcare Support | 0 (0.0%) | 20 (100.0%) |
| Security & Protection | 0 (0.0%) | 0 (0.0%) |
| Firefighting & Prevention | 0 (0.0%) | 0 (0.0%) |
| Law Enforcement | 0 (0.0%) | 0 (0.0%) |
| Food Preparation & Serving | 19 (100.0%) | 0 (0.0%) |
| Cleaning & Maintenance | 0 (0.0%) | 17 (100.0%) |
| Personal Care & Service | 0 (0.0%) | 34 (100.0%) |
| Total (Category) | 19 (21.1%) | 71 (78.9%) |
| Total (Overall) | 221 (51.8%) | 206 (48.2%) |
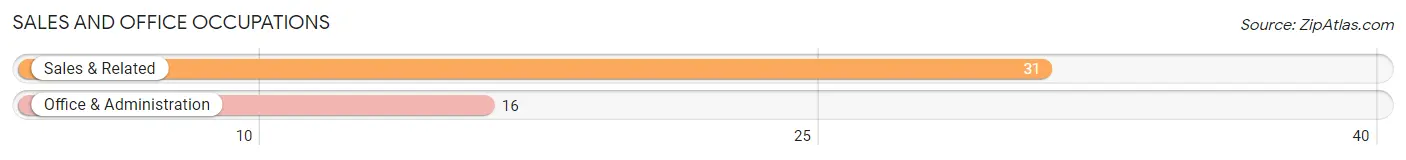
Sales and Office Occupations
The most common Sales and Office occupations in Orange Grove are Sales & Related (31 | 7.3%), and Office & Administration (16 | 3.7%).
Sales and Office Occupations by Sex
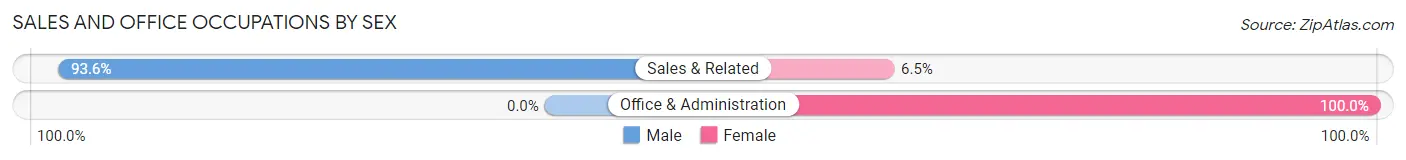
| Occupation | Male | Female |
| Sales & Related | 29 (93.5%) | 2 (6.5%) |
| Office & Administration | 0 (0.0%) | 16 (100.0%) |
| Total (Category) | 29 (61.7%) | 18 (38.3%) |
| Total (Overall) | 221 (51.8%) | 206 (48.2%) |
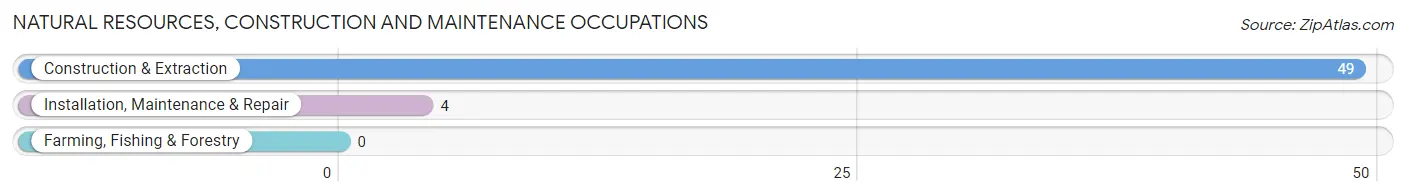
Natural Resources, Construction and Maintenance Occupations
The most common Natural Resources, Construction and Maintenance occupations in Orange Grove are Construction & Extraction (49 | 11.5%), and Installation, Maintenance & Repair (4 | 0.9%).
Natural Resources, Construction and Maintenance Occupations by Sex
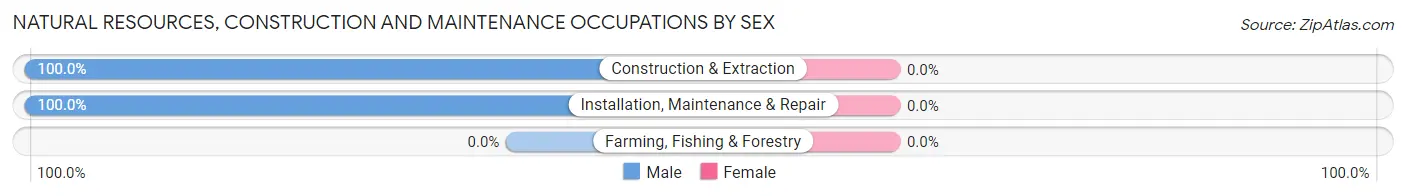
| Occupation | Male | Female |
| Farming, Fishing & Forestry | 0 (0.0%) | 0 (0.0%) |
| Construction & Extraction | 49 (100.0%) | 0 (0.0%) |
| Installation, Maintenance & Repair | 4 (100.0%) | 0 (0.0%) |
| Total (Category) | 53 (100.0%) | 0 (0.0%) |
| Total (Overall) | 221 (51.8%) | 206 (48.2%) |
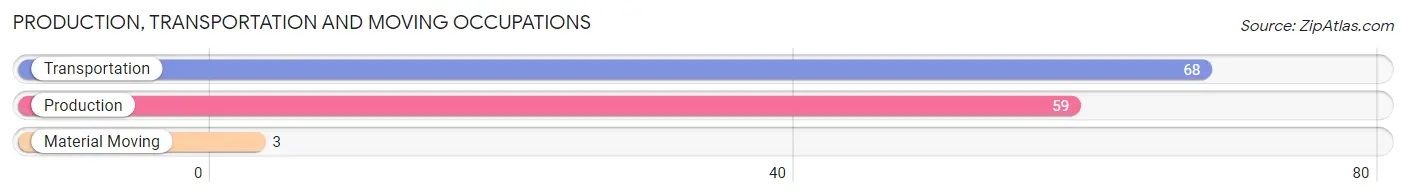
Production, Transportation and Moving Occupations
The most common Production, Transportation and Moving occupations in Orange Grove are Transportation (68 | 15.9%), Production (59 | 13.8%), and Material Moving (3 | 0.7%).
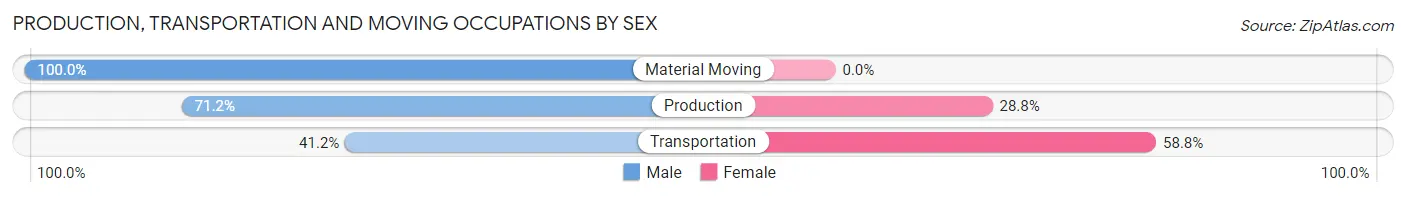
Production, Transportation and Moving Occupations by Sex
| Occupation | Male | Female |
| Production | 42 (71.2%) | 17 (28.8%) |
| Transportation | 28 (41.2%) | 40 (58.8%) |
| Material Moving | 3 (100.0%) | 0 (0.0%) |
| Total (Category) | 73 (56.1%) | 57 (43.9%) |
| Total (Overall) | 221 (51.8%) | 206 (48.2%) |
Employment Industries by Sex in Orange Grove
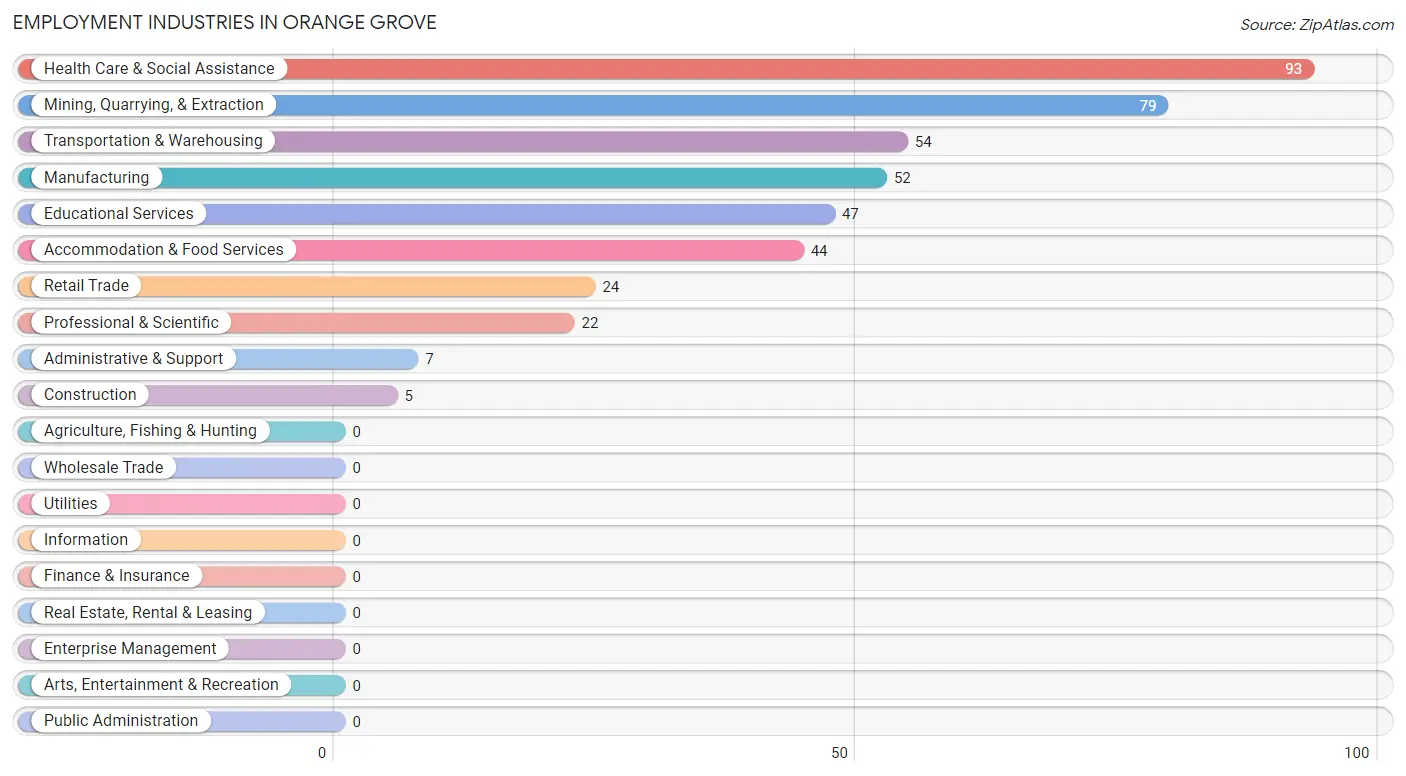
Employment Industries in Orange Grove
The major employment industries in Orange Grove include Health Care & Social Assistance (93 | 21.8%), Mining, Quarrying, & Extraction (79 | 18.5%), Transportation & Warehousing (54 | 12.7%), Manufacturing (52 | 12.2%), and Educational Services (47 | 11.0%).
Employment Industries by Sex in Orange Grove
The Orange Grove industries that see more men than women are Mining, Quarrying, & Extraction (100.0%), Construction (100.0%), and Manufacturing (100.0%), whereas the industries that tend to have a higher number of women are Retail Trade (100.0%), Educational Services (91.5%), and Health Care & Social Assistance (78.5%).
| Industry | Male | Female |
| Agriculture, Fishing & Hunting | 0 (0.0%) | 0 (0.0%) |
| Mining, Quarrying, & Extraction | 79 (100.0%) | 0 (0.0%) |
| Construction | 5 (100.0%) | 0 (0.0%) |
| Manufacturing | 52 (100.0%) | 0 (0.0%) |
| Wholesale Trade | 0 (0.0%) | 0 (0.0%) |
| Retail Trade | 0 (0.0%) | 24 (100.0%) |
| Transportation & Warehousing | 21 (38.9%) | 33 (61.1%) |
| Utilities | 0 (0.0%) | 0 (0.0%) |
| Information | 0 (0.0%) | 0 (0.0%) |
| Finance & Insurance | 0 (0.0%) | 0 (0.0%) |
| Real Estate, Rental & Leasing | 0 (0.0%) | 0 (0.0%) |
| Professional & Scientific | 14 (63.6%) | 8 (36.4%) |
| Enterprise Management | 0 (0.0%) | 0 (0.0%) |
| Administrative & Support | 7 (100.0%) | 0 (0.0%) |
| Educational Services | 4 (8.5%) | 43 (91.5%) |
| Health Care & Social Assistance | 20 (21.5%) | 73 (78.5%) |
| Arts, Entertainment & Recreation | 0 (0.0%) | 0 (0.0%) |
| Accommodation & Food Services | 19 (43.2%) | 25 (56.8%) |
| Public Administration | 0 (0.0%) | 0 (0.0%) |
| Total | 221 (51.8%) | 206 (48.2%) |
Education in Orange Grove
School Enrollment in Orange Grove
The most common levels of schooling among the 230 students in Orange Grove are elementary school (60 | 26.1%), nursery / preschool (49 | 21.3%), and college / undergraduate (45 | 19.6%).
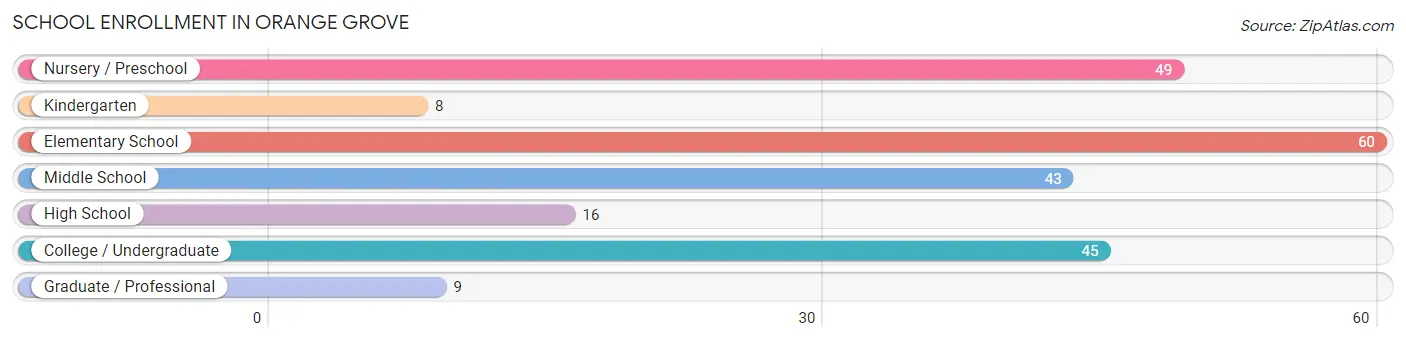
| School Level | # Students | % Students |
| Nursery / Preschool | 49 | 21.3% |
| Kindergarten | 8 | 3.5% |
| Elementary School | 60 | 26.1% |
| Middle School | 43 | 18.7% |
| High School | 16 | 7.0% |
| College / Undergraduate | 45 | 19.6% |
| Graduate / Professional | 9 | 3.9% |
| Total | 230 | 100.0% |
School Enrollment by Age by Funding Source in Orange Grove
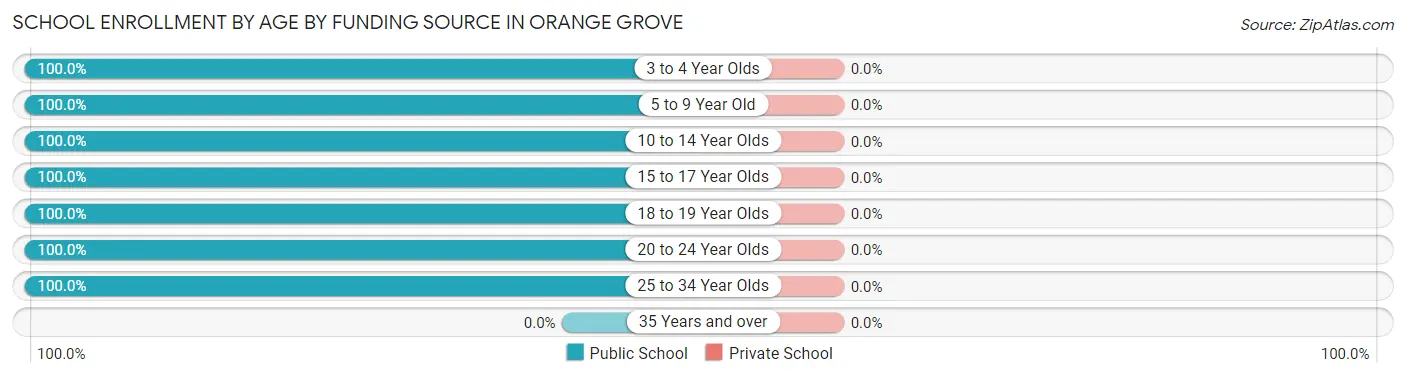
| Age Bracket | Public School | Private School |
| 3 to 4 Year Olds | 23 (100.0%) | 0 (0.0%) |
| 5 to 9 Year Old | 94 (100.0%) | 0 (0.0%) |
| 10 to 14 Year Olds | 43 (100.0%) | 0 (0.0%) |
| 15 to 17 Year Olds | 16 (100.0%) | 0 (0.0%) |
| 18 to 19 Year Olds | 24 (100.0%) | 0 (0.0%) |
| 20 to 24 Year Olds | 4 (100.0%) | 0 (0.0%) |
| 25 to 34 Year Olds | 26 (100.0%) | 0 (0.0%) |
| 35 Years and over | 0 (0.0%) | 0 (0.0%) |
| Total | 230 (100.0%) | 0 (0.0%) |
Educational Attainment by Field of Study in Orange Grove
Education (41 | 32.3%), bio, nature & agricultural (38 | 29.9%), social sciences (17 | 13.4%), arts & humanities (17 | 13.4%), and physical & health sciences (5 | 3.9%) are the most common fields of study among 127 individuals in Orange Grove who have obtained a bachelor's degree or higher.
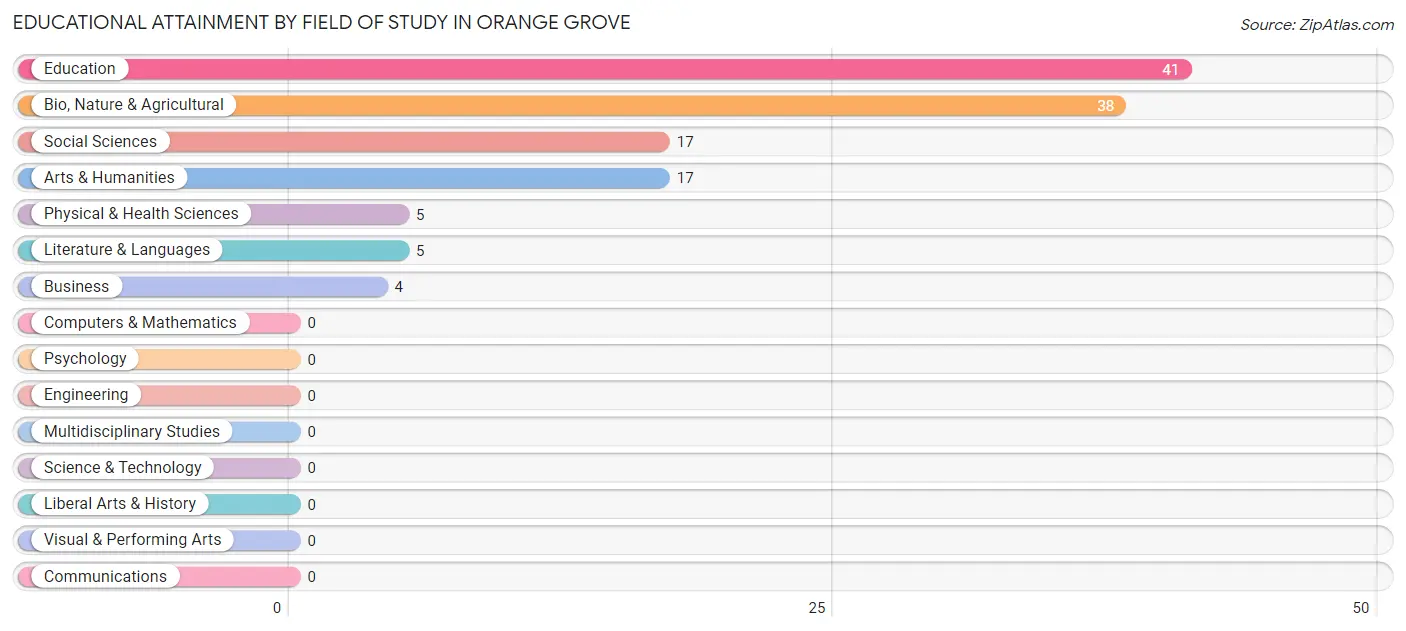
| Field of Study | # Graduates | % Graduates |
| Computers & Mathematics | 0 | 0.0% |
| Bio, Nature & Agricultural | 38 | 29.9% |
| Physical & Health Sciences | 5 | 3.9% |
| Psychology | 0 | 0.0% |
| Social Sciences | 17 | 13.4% |
| Engineering | 0 | 0.0% |
| Multidisciplinary Studies | 0 | 0.0% |
| Science & Technology | 0 | 0.0% |
| Business | 4 | 3.2% |
| Education | 41 | 32.3% |
| Literature & Languages | 5 | 3.9% |
| Liberal Arts & History | 0 | 0.0% |
| Visual & Performing Arts | 0 | 0.0% |
| Communications | 0 | 0.0% |
| Arts & Humanities | 17 | 13.4% |
| Total | 127 | 100.0% |
Transportation & Commute in Orange Grove
Vehicle Availability by Sex in Orange Grove
The most prevalent vehicle ownership categories in Orange Grove are males with 2 vehicles (105, accounting for 47.5%) and females with 2 vehicles (126, making up 51.0%).
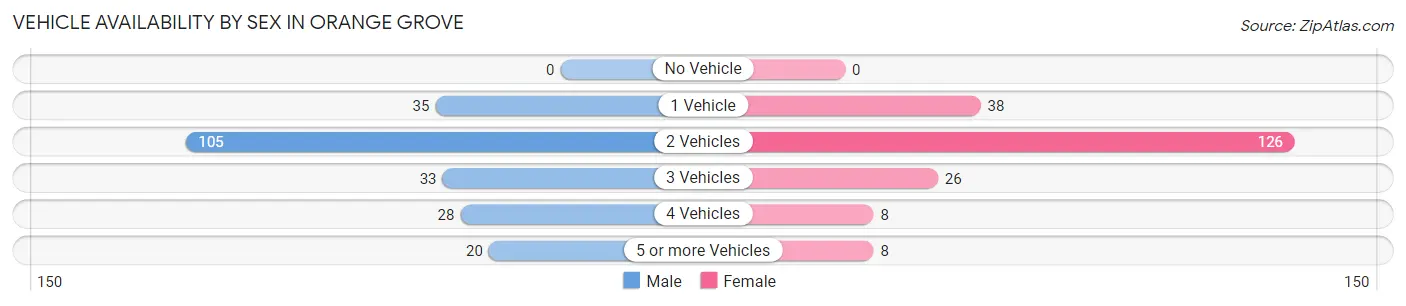
| Vehicles Available | Male | Female |
| No Vehicle | 0 (0.0%) | 0 (0.0%) |
| 1 Vehicle | 35 (15.8%) | 38 (18.4%) |
| 2 Vehicles | 105 (47.5%) | 126 (61.2%) |
| 3 Vehicles | 33 (14.9%) | 26 (12.6%) |
| 4 Vehicles | 28 (12.7%) | 8 (3.9%) |
| 5 or more Vehicles | 20 (9.0%) | 8 (3.9%) |
| Total | 221 (100.0%) | 206 (100.0%) |
Commute Time in Orange Grove
The most frequently occuring commute durations in Orange Grove are 30 to 34 minutes (79 commuters, 18.7%), 5 to 9 minutes (72 commuters, 17.1%), and 45 to 59 minutes (72 commuters, 17.1%).
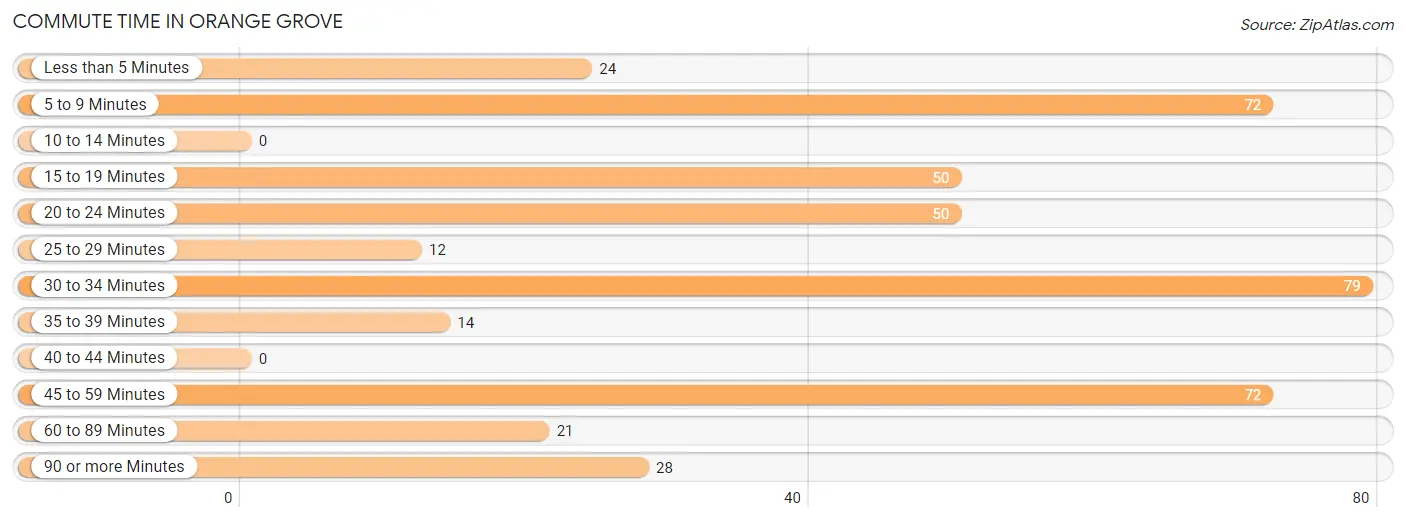
| Commute Time | # Commuters | % Commuters |
| Less than 5 Minutes | 24 | 5.7% |
| 5 to 9 Minutes | 72 | 17.1% |
| 10 to 14 Minutes | 0 | 0.0% |
| 15 to 19 Minutes | 50 | 11.8% |
| 20 to 24 Minutes | 50 | 11.8% |
| 25 to 29 Minutes | 12 | 2.8% |
| 30 to 34 Minutes | 79 | 18.7% |
| 35 to 39 Minutes | 14 | 3.3% |
| 40 to 44 Minutes | 0 | 0.0% |
| 45 to 59 Minutes | 72 | 17.1% |
| 60 to 89 Minutes | 21 | 5.0% |
| 90 or more Minutes | 28 | 6.6% |
Commute Time by Sex in Orange Grove
The most common commute times in Orange Grove are 30 to 34 minutes (65 commuters, 29.4%) for males and 20 to 24 minutes (50 commuters, 24.9%) for females.
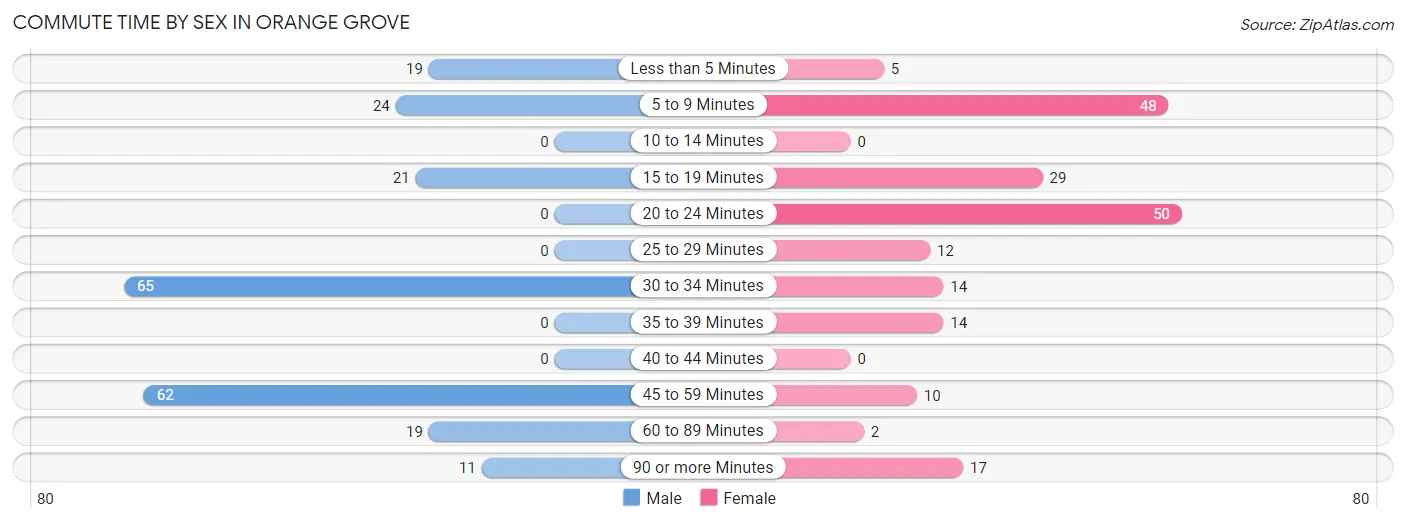
| Commute Time | Male | Female |
| Less than 5 Minutes | 19 (8.6%) | 5 (2.5%) |
| 5 to 9 Minutes | 24 (10.9%) | 48 (23.9%) |
| 10 to 14 Minutes | 0 (0.0%) | 0 (0.0%) |
| 15 to 19 Minutes | 21 (9.5%) | 29 (14.4%) |
| 20 to 24 Minutes | 0 (0.0%) | 50 (24.9%) |
| 25 to 29 Minutes | 0 (0.0%) | 12 (6.0%) |
| 30 to 34 Minutes | 65 (29.4%) | 14 (7.0%) |
| 35 to 39 Minutes | 0 (0.0%) | 14 (7.0%) |
| 40 to 44 Minutes | 0 (0.0%) | 0 (0.0%) |
| 45 to 59 Minutes | 62 (28.1%) | 10 (5.0%) |
| 60 to 89 Minutes | 19 (8.6%) | 2 (1.0%) |
| 90 or more Minutes | 11 (5.0%) | 17 (8.5%) |
Time of Departure to Work by Sex in Orange Grove
The most frequent times of departure to work in Orange Grove are 7:00 AM to 7:29 AM (59, 26.7%) for males and 7:00 AM to 7:29 AM (108, 53.7%) for females.
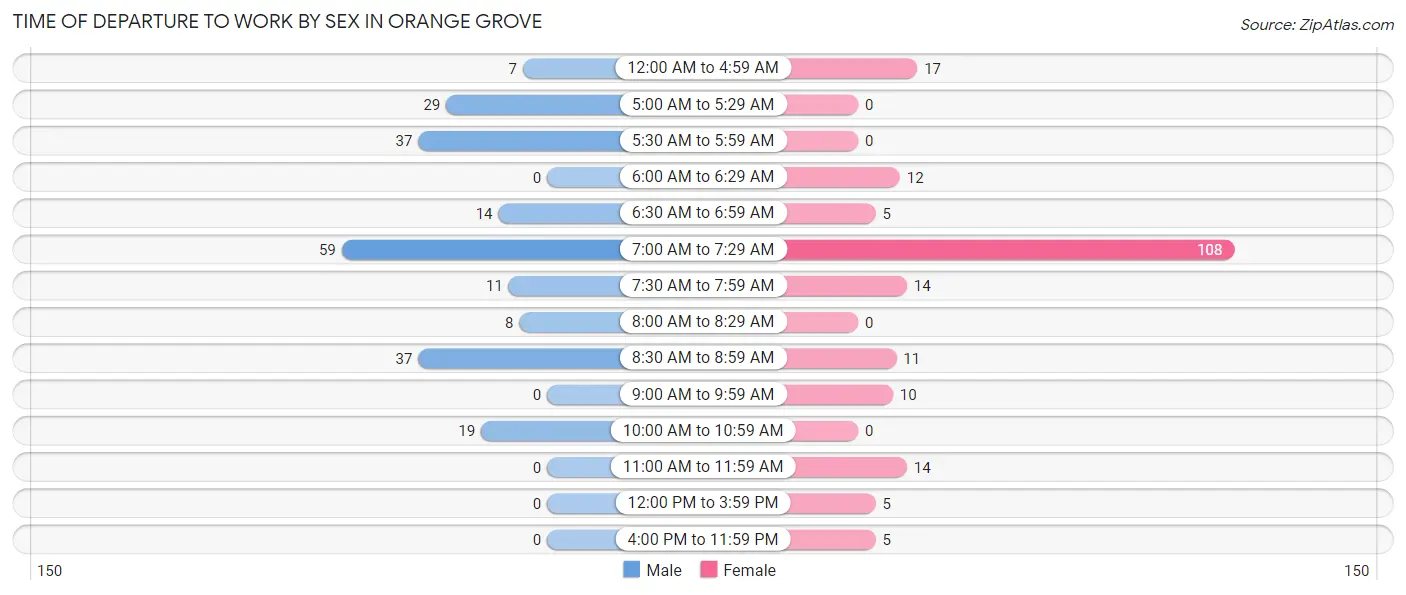
| Time of Departure | Male | Female |
| 12:00 AM to 4:59 AM | 7 (3.2%) | 17 (8.5%) |
| 5:00 AM to 5:29 AM | 29 (13.1%) | 0 (0.0%) |
| 5:30 AM to 5:59 AM | 37 (16.7%) | 0 (0.0%) |
| 6:00 AM to 6:29 AM | 0 (0.0%) | 12 (6.0%) |
| 6:30 AM to 6:59 AM | 14 (6.3%) | 5 (2.5%) |
| 7:00 AM to 7:29 AM | 59 (26.7%) | 108 (53.7%) |
| 7:30 AM to 7:59 AM | 11 (5.0%) | 14 (7.0%) |
| 8:00 AM to 8:29 AM | 8 (3.6%) | 0 (0.0%) |
| 8:30 AM to 8:59 AM | 37 (16.7%) | 11 (5.5%) |
| 9:00 AM to 9:59 AM | 0 (0.0%) | 10 (5.0%) |
| 10:00 AM to 10:59 AM | 19 (8.6%) | 0 (0.0%) |
| 11:00 AM to 11:59 AM | 0 (0.0%) | 14 (7.0%) |
| 12:00 PM to 3:59 PM | 0 (0.0%) | 5 (2.5%) |
| 4:00 PM to 11:59 PM | 0 (0.0%) | 5 (2.5%) |
| Total | 221 (100.0%) | 201 (100.0%) |
Housing Occupancy in Orange Grove
Occupancy by Ownership in Orange Grove
Of the total 439 dwellings in Orange Grove, owner-occupied units account for 225 (51.2%), while renter-occupied units make up 214 (48.7%).
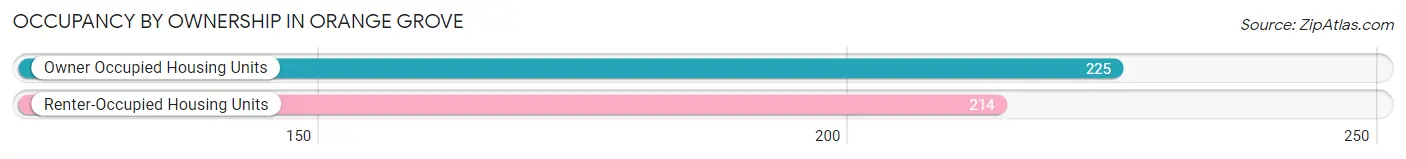
| Occupancy | # Housing Units | % Housing Units |
| Owner Occupied Housing Units | 225 | 51.2% |
| Renter-Occupied Housing Units | 214 | 48.7% |
| Total Occupied Housing Units | 439 | 100.0% |
Occupancy by Household Size in Orange Grove
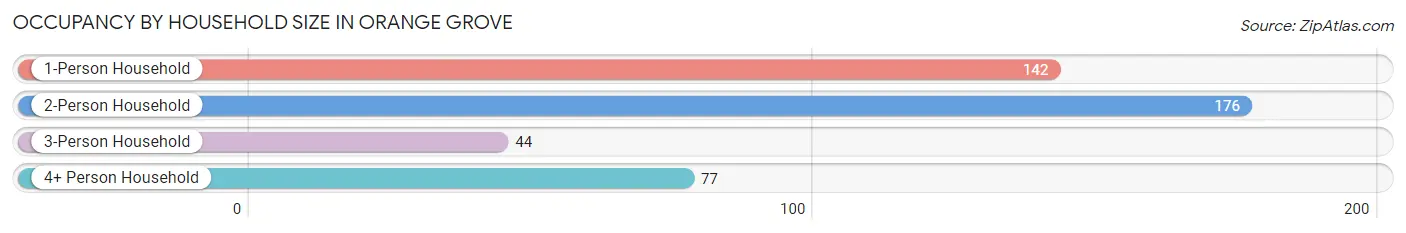
| Household Size | # Housing Units | % Housing Units |
| 1-Person Household | 142 | 32.4% |
| 2-Person Household | 176 | 40.1% |
| 3-Person Household | 44 | 10.0% |
| 4+ Person Household | 77 | 17.5% |
| Total Housing Units | 439 | 100.0% |
Occupancy by Ownership by Household Size in Orange Grove
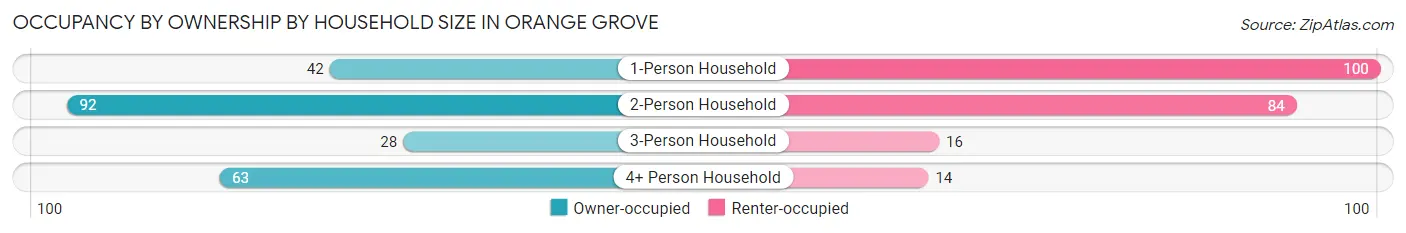
| Household Size | Owner-occupied | Renter-occupied |
| 1-Person Household | 42 (29.6%) | 100 (70.4%) |
| 2-Person Household | 92 (52.3%) | 84 (47.7%) |
| 3-Person Household | 28 (63.6%) | 16 (36.4%) |
| 4+ Person Household | 63 (81.8%) | 14 (18.2%) |
| Total Housing Units | 225 (51.2%) | 214 (48.7%) |
Occupancy by Educational Attainment in Orange Grove
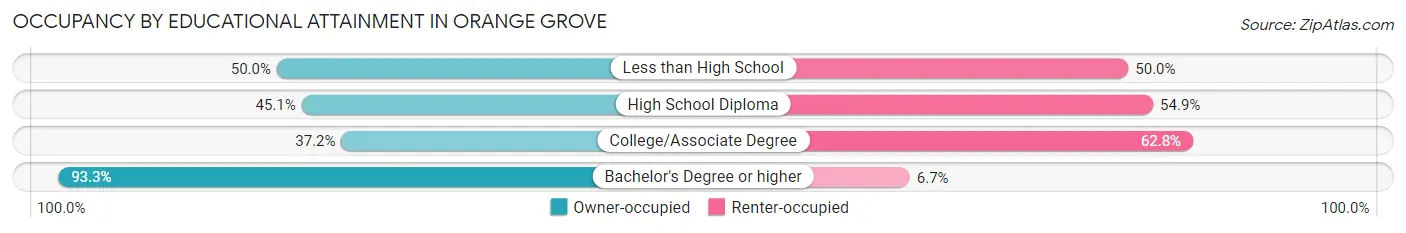
| Household Size | Owner-occupied | Renter-occupied |
| Less than High School | 39 (50.0%) | 39 (50.0%) |
| High School Diploma | 55 (45.1%) | 67 (54.9%) |
| College/Associate Degree | 61 (37.2%) | 103 (62.8%) |
| Bachelor's Degree or higher | 70 (93.3%) | 5 (6.7%) |
Occupancy by Age of Householder in Orange Grove
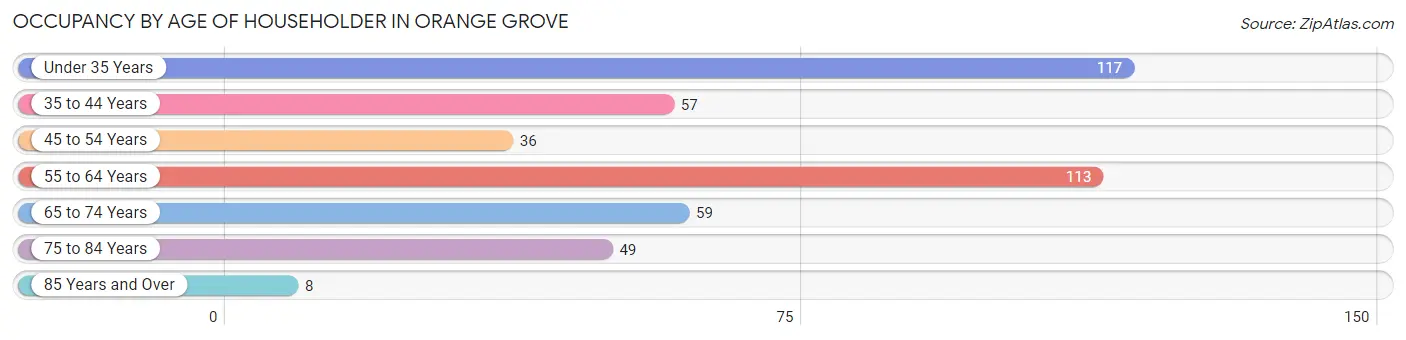
| Age Bracket | # Households | % Households |
| Under 35 Years | 117 | 26.7% |
| 35 to 44 Years | 57 | 13.0% |
| 45 to 54 Years | 36 | 8.2% |
| 55 to 64 Years | 113 | 25.7% |
| 65 to 74 Years | 59 | 13.4% |
| 75 to 84 Years | 49 | 11.2% |
| 85 Years and Over | 8 | 1.8% |
| Total | 439 | 100.0% |
Housing Finances in Orange Grove
Median Income by Occupancy in Orange Grove
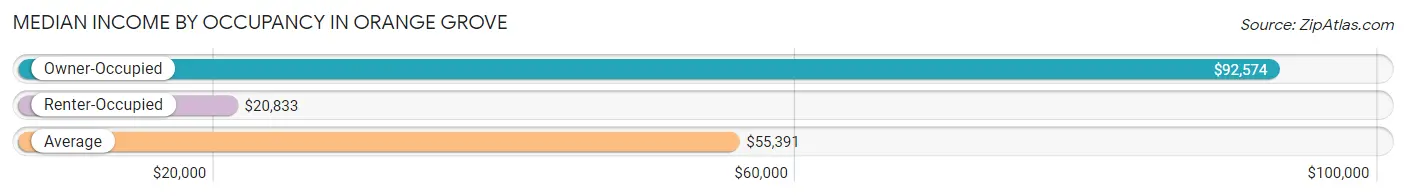
| Occupancy Type | # Households | Median Income |
| Owner-Occupied | 225 (51.2%) | $92,574 |
| Renter-Occupied | 214 (48.7%) | $20,833 |
| Average | 439 (100.0%) | $55,391 |
Occupancy by Householder Income Bracket in Orange Grove
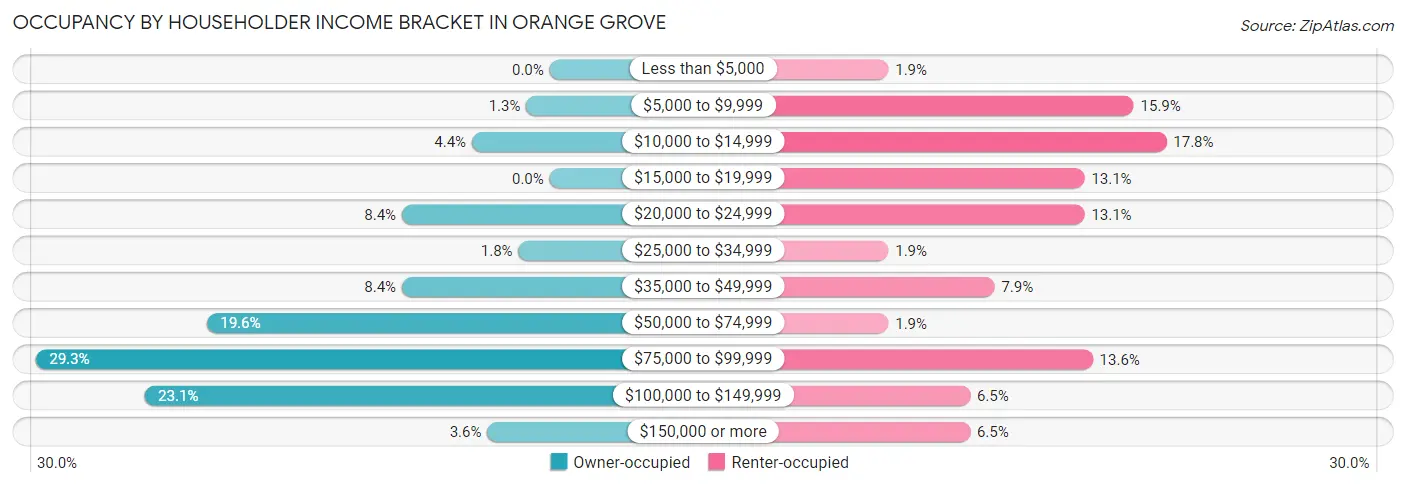
| Income Bracket | Owner-occupied | Renter-occupied |
| Less than $5,000 | 0 (0.0%) | 4 (1.9%) |
| $5,000 to $9,999 | 3 (1.3%) | 34 (15.9%) |
| $10,000 to $14,999 | 10 (4.4%) | 38 (17.8%) |
| $15,000 to $19,999 | 0 (0.0%) | 28 (13.1%) |
| $20,000 to $24,999 | 19 (8.4%) | 28 (13.1%) |
| $25,000 to $34,999 | 4 (1.8%) | 4 (1.9%) |
| $35,000 to $49,999 | 19 (8.4%) | 17 (7.9%) |
| $50,000 to $74,999 | 44 (19.6%) | 4 (1.9%) |
| $75,000 to $99,999 | 66 (29.3%) | 29 (13.6%) |
| $100,000 to $149,999 | 52 (23.1%) | 14 (6.5%) |
| $150,000 or more | 8 (3.6%) | 14 (6.5%) |
| Total | 225 (100.0%) | 214 (100.0%) |
Monthly Housing Cost Tiers in Orange Grove
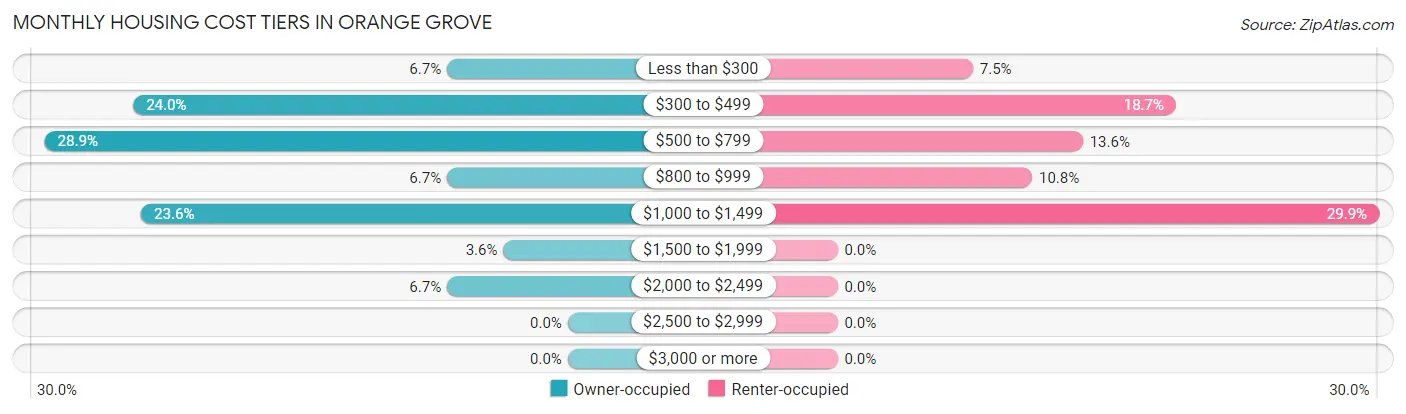
| Monthly Cost | Owner-occupied | Renter-occupied |
| Less than $300 | 15 (6.7%) | 16 (7.5%) |
| $300 to $499 | 54 (24.0%) | 40 (18.7%) |
| $500 to $799 | 65 (28.9%) | 29 (13.6%) |
| $800 to $999 | 15 (6.7%) | 23 (10.7%) |
| $1,000 to $1,499 | 53 (23.6%) | 64 (29.9%) |
| $1,500 to $1,999 | 8 (3.6%) | 0 (0.0%) |
| $2,000 to $2,499 | 15 (6.7%) | 0 (0.0%) |
| $2,500 to $2,999 | 0 (0.0%) | 0 (0.0%) |
| $3,000 or more | 0 (0.0%) | 0 (0.0%) |
| Total | 225 (100.0%) | 214 (100.0%) |
Physical Housing Characteristics in Orange Grove
Housing Structures in Orange Grove
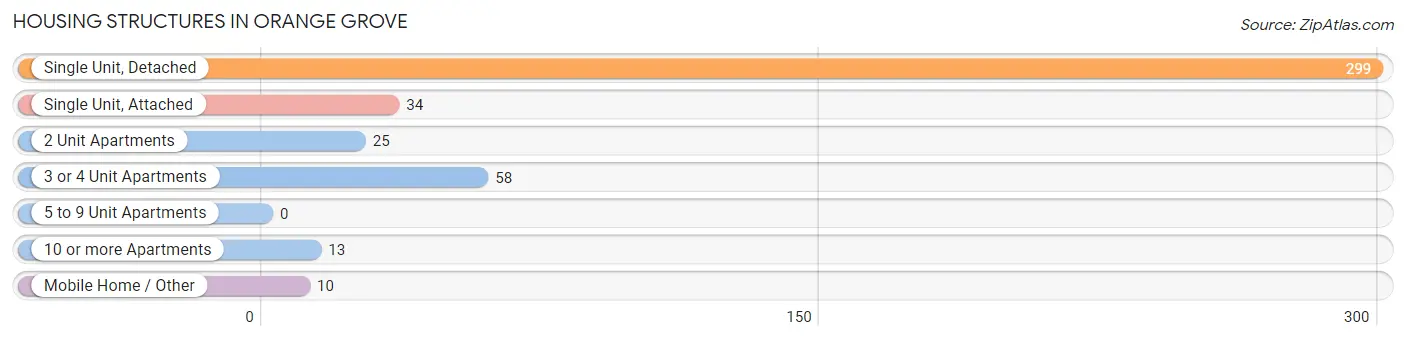
| Structure Type | # Housing Units | % Housing Units |
| Single Unit, Detached | 299 | 68.1% |
| Single Unit, Attached | 34 | 7.7% |
| 2 Unit Apartments | 25 | 5.7% |
| 3 or 4 Unit Apartments | 58 | 13.2% |
| 5 to 9 Unit Apartments | 0 | 0.0% |
| 10 or more Apartments | 13 | 3.0% |
| Mobile Home / Other | 10 | 2.3% |
| Total | 439 | 100.0% |
Housing Structures by Occupancy in Orange Grove
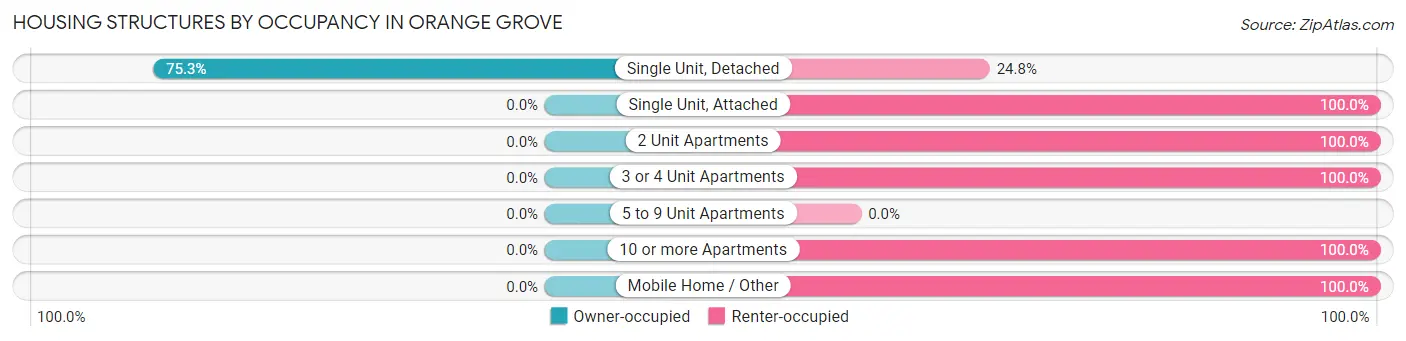
| Structure Type | Owner-occupied | Renter-occupied |
| Single Unit, Detached | 225 (75.2%) | 74 (24.7%) |
| Single Unit, Attached | 0 (0.0%) | 34 (100.0%) |
| 2 Unit Apartments | 0 (0.0%) | 25 (100.0%) |
| 3 or 4 Unit Apartments | 0 (0.0%) | 58 (100.0%) |
| 5 to 9 Unit Apartments | 0 (0.0%) | 0 (0.0%) |
| 10 or more Apartments | 0 (0.0%) | 13 (100.0%) |
| Mobile Home / Other | 0 (0.0%) | 10 (100.0%) |
| Total | 225 (51.2%) | 214 (48.7%) |
Housing Structures by Number of Rooms in Orange Grove
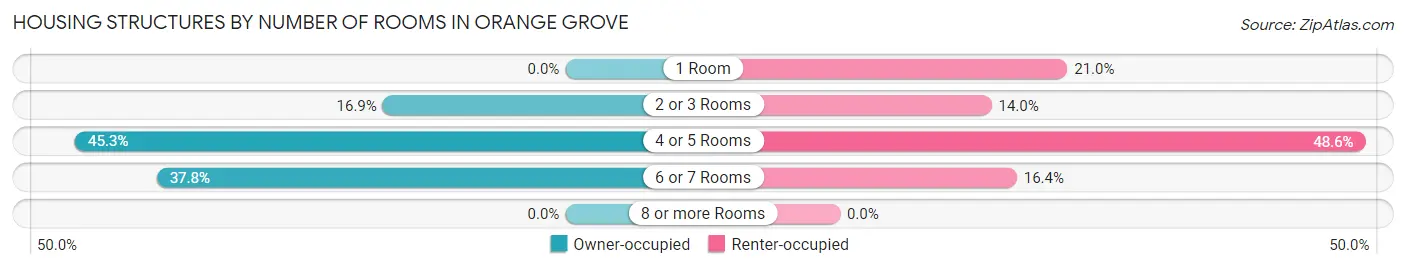
| Number of Rooms | Owner-occupied | Renter-occupied |
| 1 Room | 0 (0.0%) | 45 (21.0%) |
| 2 or 3 Rooms | 38 (16.9%) | 30 (14.0%) |
| 4 or 5 Rooms | 102 (45.3%) | 104 (48.6%) |
| 6 or 7 Rooms | 85 (37.8%) | 35 (16.4%) |
| 8 or more Rooms | 0 (0.0%) | 0 (0.0%) |
| Total | 225 (100.0%) | 214 (100.0%) |
Housing Structure by Heating Type in Orange Grove
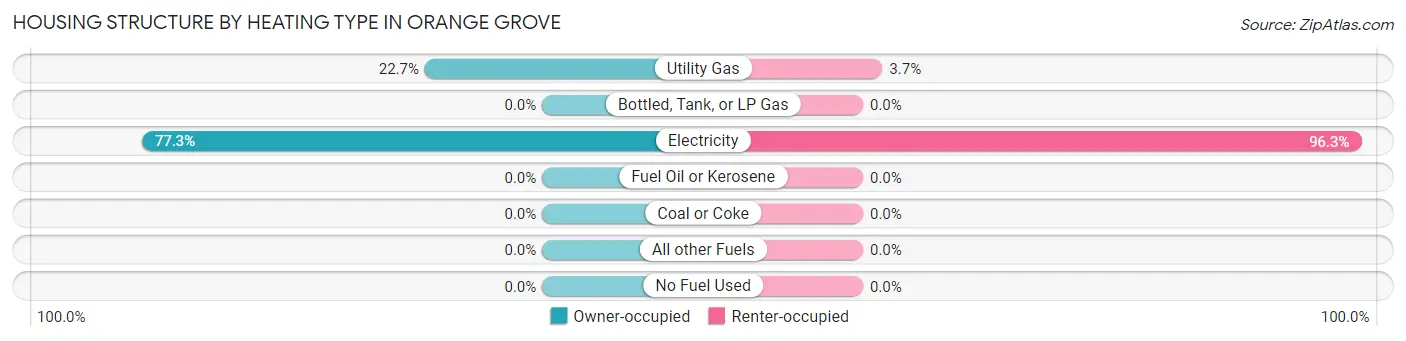
| Heating Type | Owner-occupied | Renter-occupied |
| Utility Gas | 51 (22.7%) | 8 (3.7%) |
| Bottled, Tank, or LP Gas | 0 (0.0%) | 0 (0.0%) |
| Electricity | 174 (77.3%) | 206 (96.3%) |
| Fuel Oil or Kerosene | 0 (0.0%) | 0 (0.0%) |
| Coal or Coke | 0 (0.0%) | 0 (0.0%) |
| All other Fuels | 0 (0.0%) | 0 (0.0%) |
| No Fuel Used | 0 (0.0%) | 0 (0.0%) |
| Total | 225 (100.0%) | 214 (100.0%) |
Household Vehicle Usage in Orange Grove
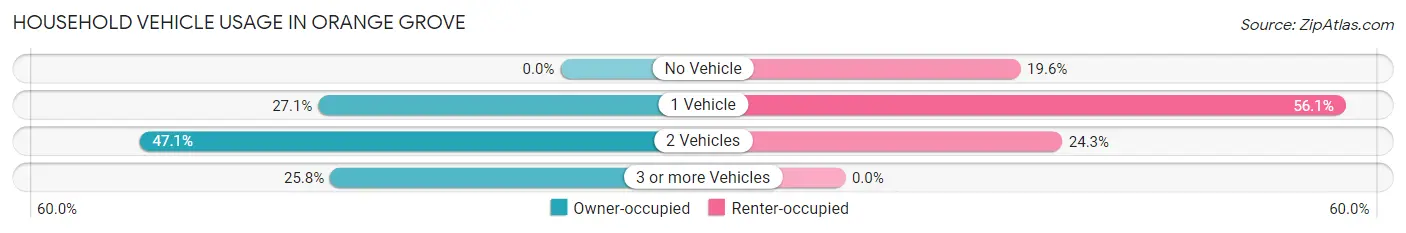
| Vehicles per Household | Owner-occupied | Renter-occupied |
| No Vehicle | 0 (0.0%) | 42 (19.6%) |
| 1 Vehicle | 61 (27.1%) | 120 (56.1%) |
| 2 Vehicles | 106 (47.1%) | 52 (24.3%) |
| 3 or more Vehicles | 58 (25.8%) | 0 (0.0%) |
| Total | 225 (100.0%) | 214 (100.0%) |
Real Estate & Mortgages in Orange Grove
Real Estate and Mortgage Overview in Orange Grove
| Characteristic | Without Mortgage | With Mortgage |
| Housing Units | 134 | 91 |
| Median Property Value | $100,600 | $165,600 |
| Median Household Income | $55,682 | $8 |
| Monthly Housing Costs | $490 | $0 |
| Real Estate Taxes | - | - |
Property Value by Mortgage Status in Orange Grove
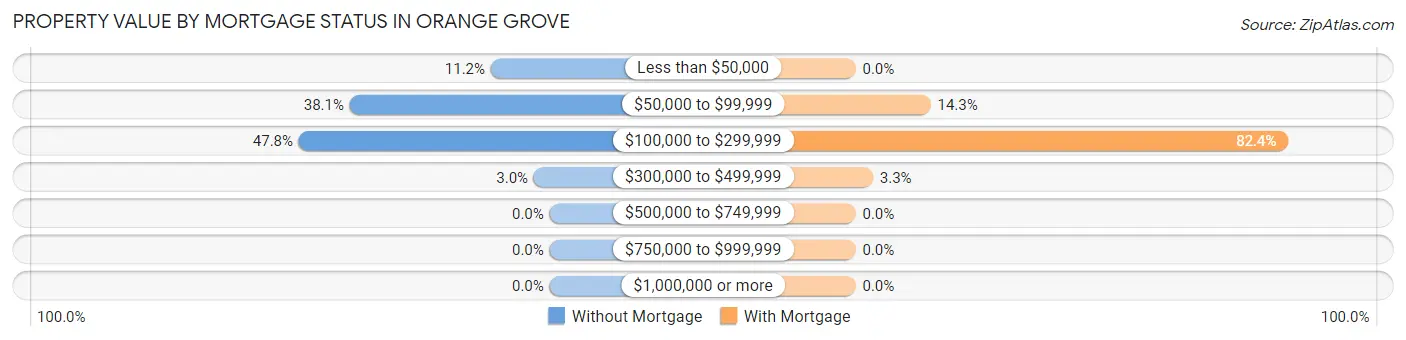
| Property Value | Without Mortgage | With Mortgage |
| Less than $50,000 | 15 (11.2%) | 0 (0.0%) |
| $50,000 to $99,999 | 51 (38.1%) | 13 (14.3%) |
| $100,000 to $299,999 | 64 (47.8%) | 75 (82.4%) |
| $300,000 to $499,999 | 4 (3.0%) | 3 (3.3%) |
| $500,000 to $749,999 | 0 (0.0%) | 0 (0.0%) |
| $750,000 to $999,999 | 0 (0.0%) | 0 (0.0%) |
| $1,000,000 or more | 0 (0.0%) | 0 (0.0%) |
| Total | 134 (100.0%) | 91 (100.0%) |
Household Income by Mortgage Status in Orange Grove
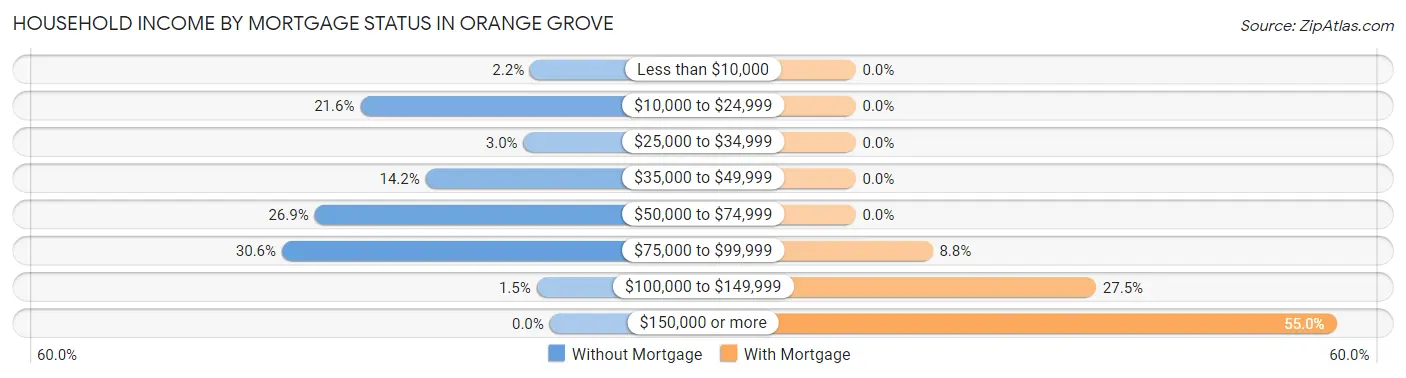
| Household Income | Without Mortgage | With Mortgage |
| Less than $10,000 | 3 (2.2%) | 0 (0.0%) |
| $10,000 to $24,999 | 29 (21.6%) | 0 (0.0%) |
| $25,000 to $34,999 | 4 (3.0%) | 0 (0.0%) |
| $35,000 to $49,999 | 19 (14.2%) | 0 (0.0%) |
| $50,000 to $74,999 | 36 (26.9%) | 0 (0.0%) |
| $75,000 to $99,999 | 41 (30.6%) | 8 (8.8%) |
| $100,000 to $149,999 | 2 (1.5%) | 25 (27.5%) |
| $150,000 or more | 0 (0.0%) | 50 (54.9%) |
| Total | 134 (100.0%) | 91 (100.0%) |
Property Value to Household Income Ratio in Orange Grove
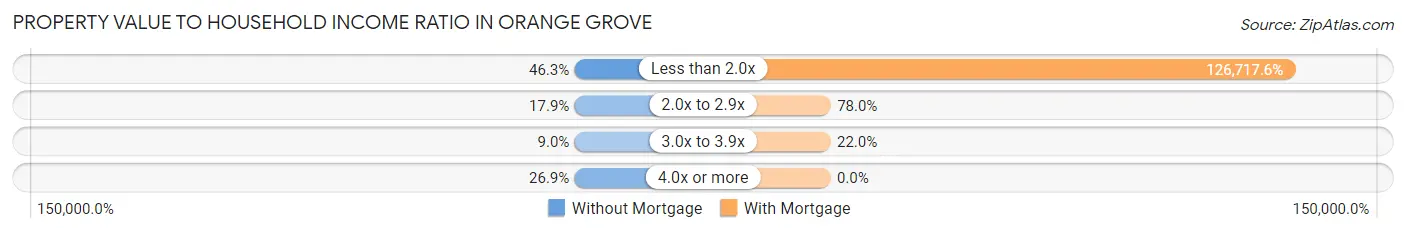
| Value-to-Income Ratio | Without Mortgage | With Mortgage |
| Less than 2.0x | 62 (46.3%) | 115,313 (126,717.6%) |
| 2.0x to 2.9x | 24 (17.9%) | 71 (78.0%) |
| 3.0x to 3.9x | 12 (9.0%) | 20 (22.0%) |
| 4.0x or more | 36 (26.9%) | 0 (0.0%) |
| Total | 134 (100.0%) | 91 (100.0%) |
Real Estate Taxes by Mortgage Status in Orange Grove
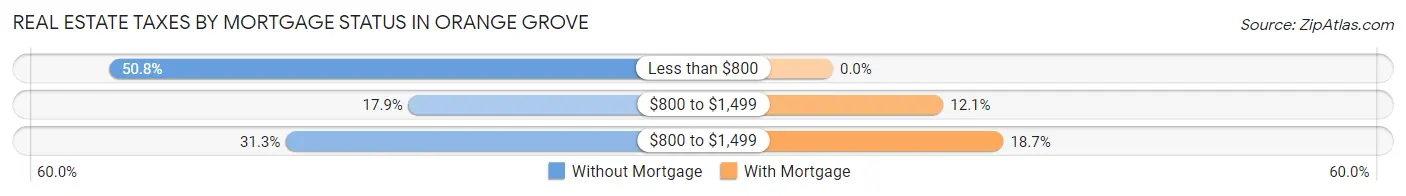
| Property Taxes | Without Mortgage | With Mortgage |
| Less than $800 | 68 (50.7%) | 0 (0.0%) |
| $800 to $1,499 | 24 (17.9%) | 11 (12.1%) |
| $800 to $1,499 | 42 (31.3%) | 17 (18.7%) |
| Total | 134 (100.0%) | 91 (100.0%) |
Health & Disability in Orange Grove
Health Insurance Coverage by Age in Orange Grove
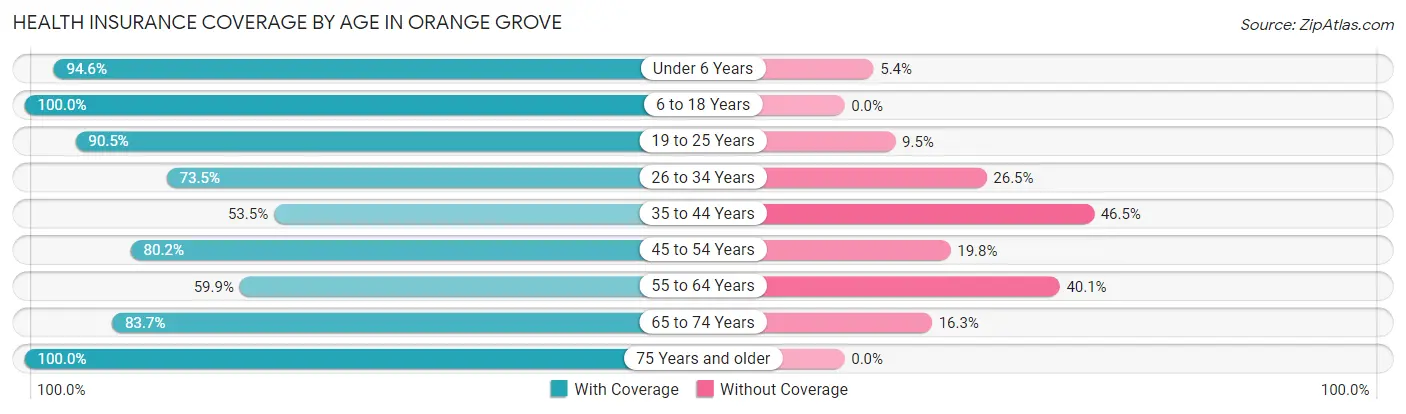
| Age Bracket | With Coverage | Without Coverage |
| Under 6 Years | 105 (94.6%) | 6 (5.4%) |
| 6 to 18 Years | 127 (100.0%) | 0 (0.0%) |
| 19 to 25 Years | 105 (90.5%) | 11 (9.5%) |
| 26 to 34 Years | 111 (73.5%) | 40 (26.5%) |
| 35 to 44 Years | 69 (53.5%) | 60 (46.5%) |
| 45 to 54 Years | 69 (80.2%) | 17 (19.8%) |
| 55 to 64 Years | 103 (59.9%) | 69 (40.1%) |
| 65 to 74 Years | 77 (83.7%) | 15 (16.3%) |
| 75 Years and older | 83 (100.0%) | 0 (0.0%) |
| Total | 849 (79.6%) | 218 (20.4%) |
Health Insurance Coverage by Citizenship Status in Orange Grove
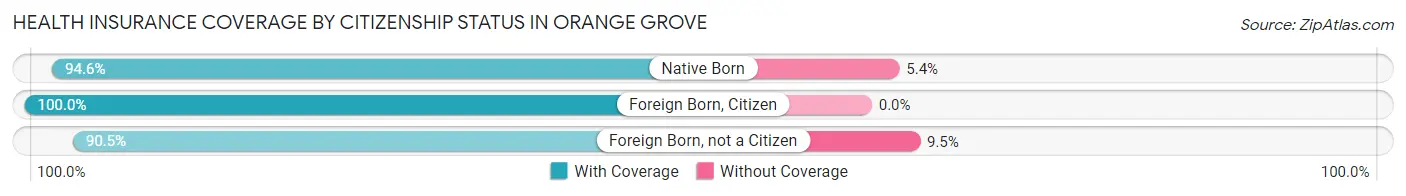
| Citizenship Status | With Coverage | Without Coverage |
| Native Born | 105 (94.6%) | 6 (5.4%) |
| Foreign Born, Citizen | 127 (100.0%) | 0 (0.0%) |
| Foreign Born, not a Citizen | 105 (90.5%) | 11 (9.5%) |
Health Insurance Coverage by Household Income in Orange Grove
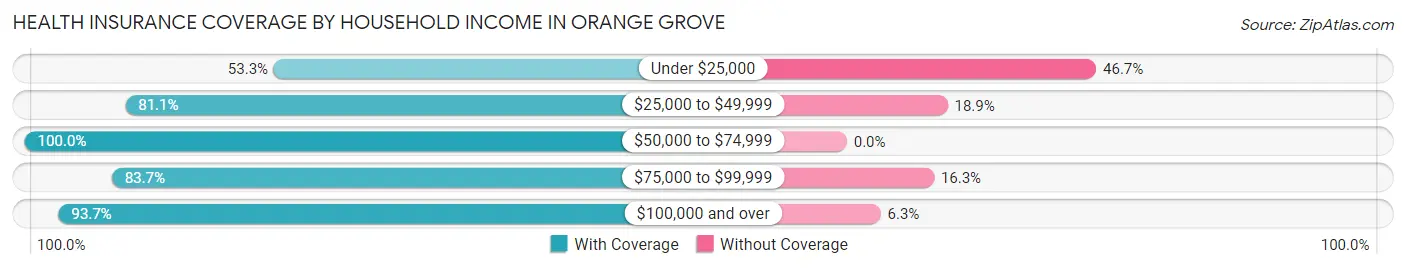
| Household Income | With Coverage | Without Coverage |
| Under $25,000 | 162 (53.3%) | 142 (46.7%) |
| $25,000 to $49,999 | 43 (81.1%) | 10 (18.9%) |
| $50,000 to $74,999 | 142 (100.0%) | 0 (0.0%) |
| $75,000 to $99,999 | 251 (83.7%) | 49 (16.3%) |
| $100,000 and over | 251 (93.7%) | 17 (6.3%) |
Public vs Private Health Insurance Coverage by Age in Orange Grove
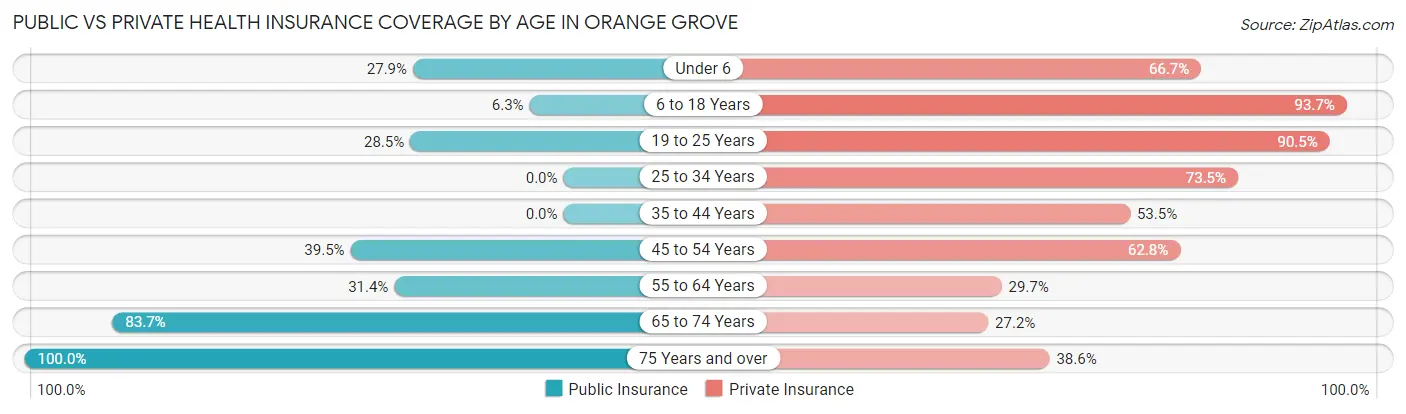
| Age Bracket | Public Insurance | Private Insurance |
| Under 6 | 31 (27.9%) | 74 (66.7%) |
| 6 to 18 Years | 8 (6.3%) | 119 (93.7%) |
| 19 to 25 Years | 33 (28.4%) | 105 (90.5%) |
| 25 to 34 Years | 0 (0.0%) | 111 (73.5%) |
| 35 to 44 Years | 0 (0.0%) | 69 (53.5%) |
| 45 to 54 Years | 34 (39.5%) | 54 (62.8%) |
| 55 to 64 Years | 54 (31.4%) | 51 (29.6%) |
| 65 to 74 Years | 77 (83.7%) | 25 (27.2%) |
| 75 Years and over | 83 (100.0%) | 32 (38.6%) |
| Total | 320 (30.0%) | 640 (60.0%) |
Disability Status by Sex by Age in Orange Grove
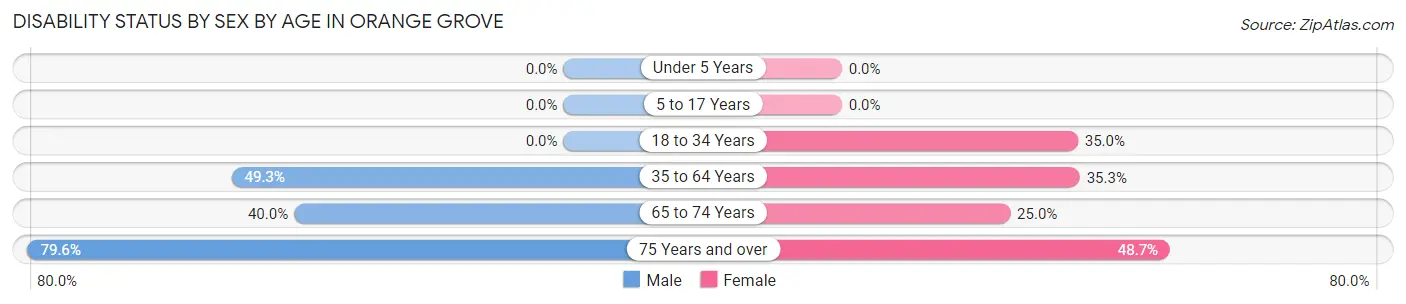
| Age Bracket | Male | Female |
| Under 5 Years | 0 (0.0%) | 0 (0.0%) |
| 5 to 17 Years | 0 (0.0%) | 0 (0.0%) |
| 18 to 34 Years | 0 (0.0%) | 48 (35.0%) |
| 35 to 64 Years | 100 (49.3%) | 65 (35.3%) |
| 65 to 74 Years | 24 (40.0%) | 8 (25.0%) |
| 75 Years and over | 35 (79.5%) | 19 (48.7%) |
Disability Class by Sex by Age in Orange Grove
Disability Class: Hearing Difficulty
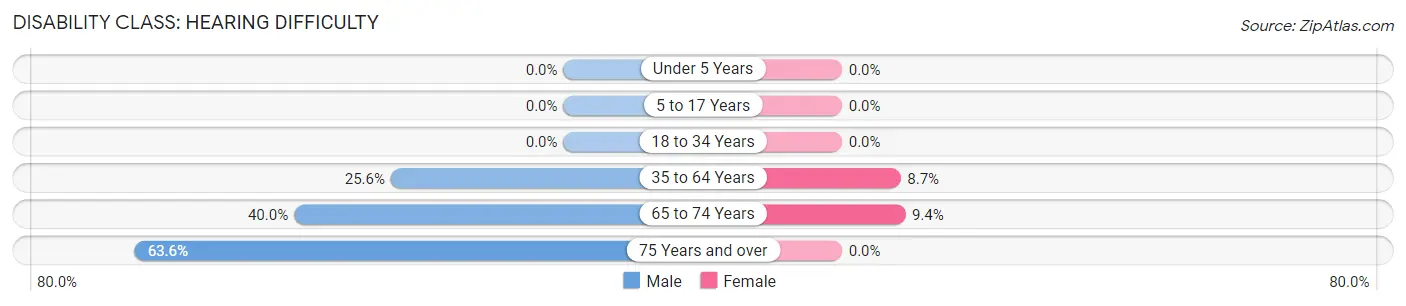
| Age Bracket | Male | Female |
| Under 5 Years | 0 (0.0%) | 0 (0.0%) |
| 5 to 17 Years | 0 (0.0%) | 0 (0.0%) |
| 18 to 34 Years | 0 (0.0%) | 0 (0.0%) |
| 35 to 64 Years | 52 (25.6%) | 16 (8.7%) |
| 65 to 74 Years | 24 (40.0%) | 3 (9.4%) |
| 75 Years and over | 28 (63.6%) | 0 (0.0%) |
Disability Class: Vision Difficulty
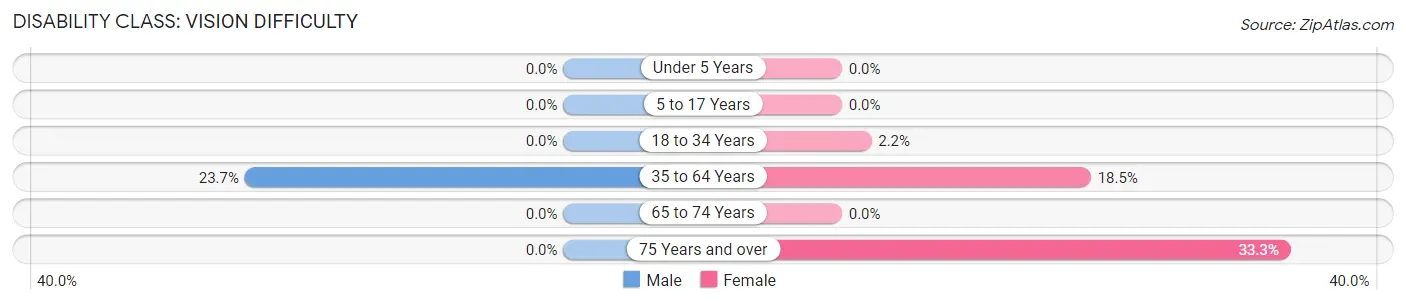
| Age Bracket | Male | Female |
| Under 5 Years | 0 (0.0%) | 0 (0.0%) |
| 5 to 17 Years | 0 (0.0%) | 0 (0.0%) |
| 18 to 34 Years | 0 (0.0%) | 3 (2.2%) |
| 35 to 64 Years | 48 (23.6%) | 34 (18.5%) |
| 65 to 74 Years | 0 (0.0%) | 0 (0.0%) |
| 75 Years and over | 0 (0.0%) | 13 (33.3%) |
Disability Class: Cognitive Difficulty
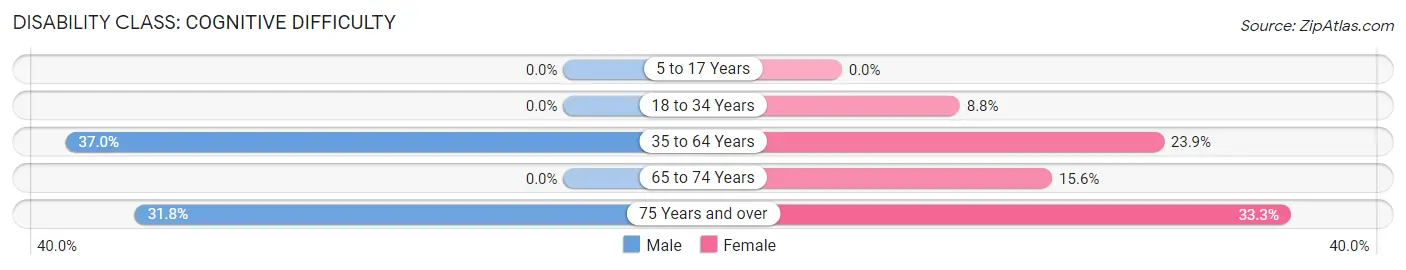
| Age Bracket | Male | Female |
| 5 to 17 Years | 0 (0.0%) | 0 (0.0%) |
| 18 to 34 Years | 0 (0.0%) | 12 (8.8%) |
| 35 to 64 Years | 75 (36.9%) | 44 (23.9%) |
| 65 to 74 Years | 0 (0.0%) | 5 (15.6%) |
| 75 Years and over | 14 (31.8%) | 13 (33.3%) |
Disability Class: Ambulatory Difficulty
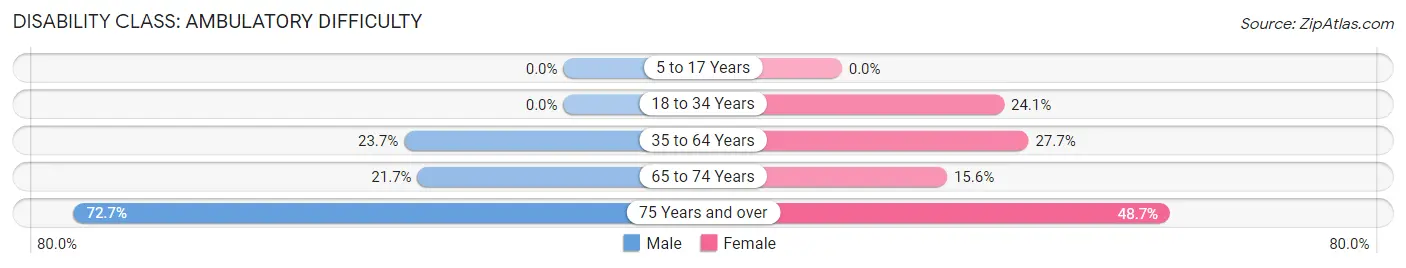
| Age Bracket | Male | Female |
| 5 to 17 Years | 0 (0.0%) | 0 (0.0%) |
| 18 to 34 Years | 0 (0.0%) | 33 (24.1%) |
| 35 to 64 Years | 48 (23.6%) | 51 (27.7%) |
| 65 to 74 Years | 13 (21.7%) | 5 (15.6%) |
| 75 Years and over | 32 (72.7%) | 19 (48.7%) |
Disability Class: Self-Care Difficulty
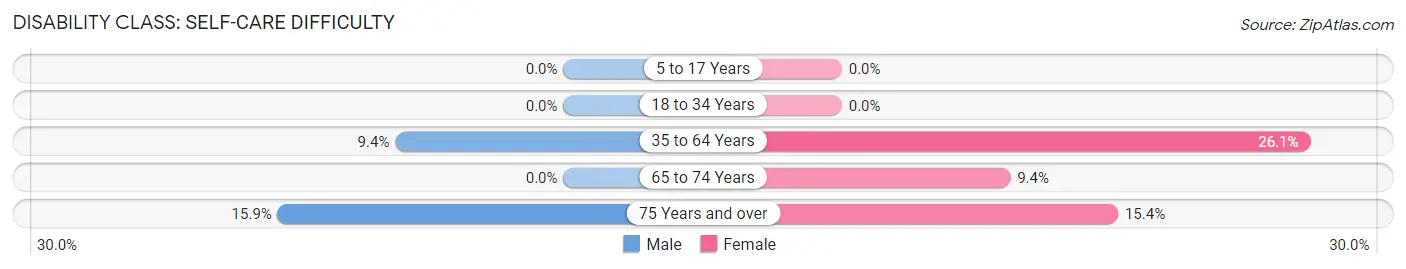
| Age Bracket | Male | Female |
| 5 to 17 Years | 0 (0.0%) | 0 (0.0%) |
| 18 to 34 Years | 0 (0.0%) | 0 (0.0%) |
| 35 to 64 Years | 19 (9.4%) | 48 (26.1%) |
| 65 to 74 Years | 0 (0.0%) | 3 (9.4%) |
| 75 Years and over | 7 (15.9%) | 6 (15.4%) |
Technology Access in Orange Grove
Computing Device Access in Orange Grove
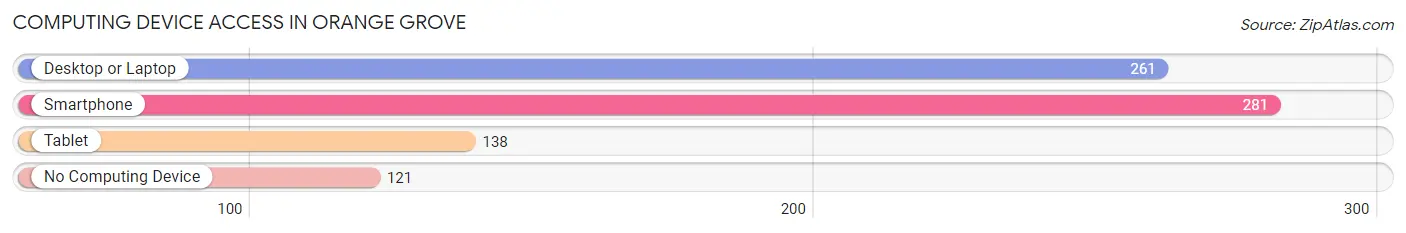
| Device Type | # Households | % Households |
| Desktop or Laptop | 261 | 59.5% |
| Smartphone | 281 | 64.0% |
| Tablet | 138 | 31.4% |
| No Computing Device | 121 | 27.6% |
| Total | 439 | 100.0% |
Internet Access in Orange Grove
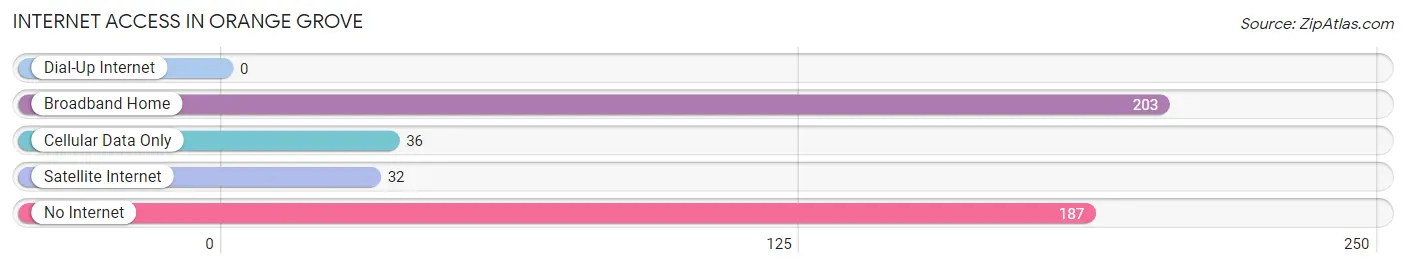
| Internet Type | # Households | % Households |
| Dial-Up Internet | 0 | 0.0% |
| Broadband Home | 203 | 46.2% |
| Cellular Data Only | 36 | 8.2% |
| Satellite Internet | 32 | 7.3% |
| No Internet | 187 | 42.6% |
| Total | 439 | 100.0% |
Orange Grove Summary
Orange Grove is a small town located in Jim Wells County, Texas. It is situated about 25 miles northwest of Corpus Christi and is part of the Alice-Kingsville-Orange Grove Metropolitan Statistical Area. The town has a population of 2,717 people, according to the 2010 census.
History
Orange Grove was founded in 1883 by a group of settlers from the nearby town of Kingsville. The town was named after the abundance of orange groves in the area. The first post office was established in 1884 and the town was incorporated in 1909.
In the early 1900s, the town was a major center for citrus production. The citrus industry was so successful that the town was known as the “Citrus Capital of Texas.” The town also had a thriving dairy industry, which provided milk to the local population.
In the 1950s, the citrus industry began to decline and the town’s economy shifted to oil and gas production. The town is still home to several oil and gas companies, as well as a few citrus farms.
Geography
Orange Grove is located in the Coastal Plains region of Texas. The town is situated on the banks of the Nueces River, which flows through the area. The town is surrounded by flat terrain and is located about 25 miles northwest of Corpus Christi.
The climate in Orange Grove is subtropical, with hot summers and mild winters. The average temperature in the summer is around 90 degrees Fahrenheit, while the average temperature in the winter is around 60 degrees Fahrenheit.
Economy
The economy of Orange Grove is largely based on oil and gas production. The town is home to several oil and gas companies, as well as a few citrus farms. The town also has a few small businesses, such as restaurants, grocery stores, and retail stores.
The town is also home to a few manufacturing companies, such as a plastics manufacturer and a metal fabrication company. The town also has a few medical facilities, including a hospital and a nursing home.
Demographics
According to the 2010 census, the population of Orange Grove was 2,717 people. The town has a median household income of $37,945 and a median age of 33.7 years. The town is predominantly white, with a population that is 77.3% white, 16.2% Hispanic, and 4.5% African American.
Conclusion
Orange Grove is a small town located in Jim Wells County, Texas. It is situated about 25 miles northwest of Corpus Christi and is part of the Alice-Kingsville-Orange Grove Metropolitan Statistical Area. The town has a population of 2,717 people, according to the 2010 census. The town’s economy is largely based on oil and gas production, as well as a few citrus farms and small businesses. The town is predominantly white, with a population that is 77.3% white, 16.2% Hispanic, and 4.5% African American.
Common Questions
What is Per Capita Income in Orange Grove?
Per Capita income in Orange Grove is $29,518.
What is the Median Family Income in Orange Grove?
Median Family Income in Orange Grove is $79,653.
What is the Median Household income in Orange Grove?
Median Household Income in Orange Grove is $55,391.
What is Income or Wage Gap in Orange Grove?
Income or Wage Gap in Orange Grove is 54.5%.
Women in Orange Grove earn 45.5 cents for every dollar earned by a man.
What is Inequality or Gini Index in Orange Grove?
Inequality or Gini Index in Orange Grove is 0.43.
What is the Total Population of Orange Grove?
Total Population of Orange Grove is 1,067.
What is the Total Male Population of Orange Grove?
Total Male Population of Orange Grove is 559.
What is the Total Female Population of Orange Grove?
Total Female Population of Orange Grove is 508.
What is the Ratio of Males per 100 Females in Orange Grove?
There are 110.04 Males per 100 Females in Orange Grove.
What is the Ratio of Females per 100 Males in Orange Grove?
There are 90.88 Females per 100 Males in Orange Grove.
What is the Median Population Age in Orange Grove?
Median Population Age in Orange Grove is 39.4 Years.
What is the Average Family Size in Orange Grove
Average Family Size in Orange Grove is 3.2 People.
What is the Average Household Size in Orange Grove
Average Household Size in Orange Grove is 2.4 People.
How Large is the Labor Force in Orange Grove?
There are 448 People in the Labor Forcein in Orange Grove.
What is the Percentage of People in the Labor Force in Orange Grove?
54.0% of People are in the Labor Force in Orange Grove.
What is the Unemployment Rate in Orange Grove?
Unemployment Rate in Orange Grove is 4.7%.