Olton, TX Map & Demographics
Olton Map
Olton Overview
$25,419
PER CAPITA INCOME
$71,250
AVG FAMILY INCOME
$57,250
AVG HOUSEHOLD INCOME
42.3%
WAGE / INCOME GAP [ % ]
57.7¢/ $1
WAGE / INCOME GAP [ $ ]
0.43
INEQUALITY / GINI INDEX
1,749
TOTAL POPULATION
873
MALE POPULATION
876
FEMALE POPULATION
99.66
MALES / 100 FEMALES
100.34
FEMALES / 100 MALES
38.4
MEDIAN AGE
3.5
AVG FAMILY SIZE
3.1
AVG HOUSEHOLD SIZE
692
LABOR FORCE [ PEOPLE ]
51.2%
PERCENT IN LABOR FORCE
3.3%
UNEMPLOYMENT RATE
Olton Zip Codes
Olton Area Codes
Income in Olton
Income Overview in Olton
Per Capita Income in Olton is $25,419, while median incomes of families and households are $71,250 and $57,250 respectively.
| Characteristic | Number | Measure |
| Per Capita Income | 1,749 | $25,419 |
| Median Family Income | 423 | $71,250 |
| Mean Family Income | 423 | $86,229 |
| Median Household Income | 543 | $57,250 |
| Mean Household Income | 543 | $77,855 |
| Income Deficit | 423 | $0 |
| Wage / Income Gap (%) | 1,749 | 42.29% |
| Wage / Income Gap ($) | 1,749 | 57.71¢ per $1 |
| Gini / Inequality Index | 1,749 | 0.43 |
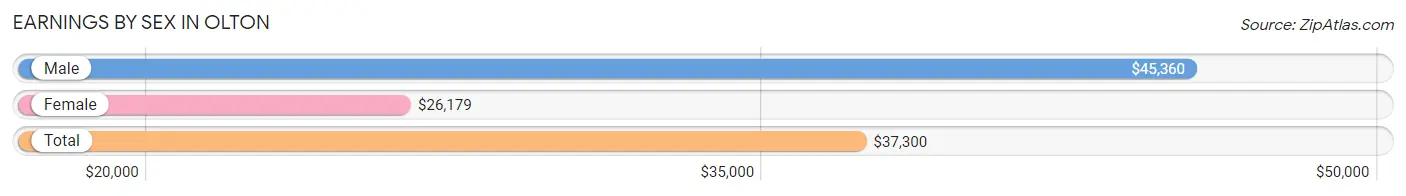
Earnings by Sex in Olton
Average Earnings in Olton are $37,300, $45,360 for men and $26,179 for women, a difference of 42.3%.
| Sex | Number | Average Earnings |
| Male | 453 (62.6%) | $45,360 |
| Female | 271 (37.4%) | $26,179 |
| Total | 724 (100.0%) | $37,300 |
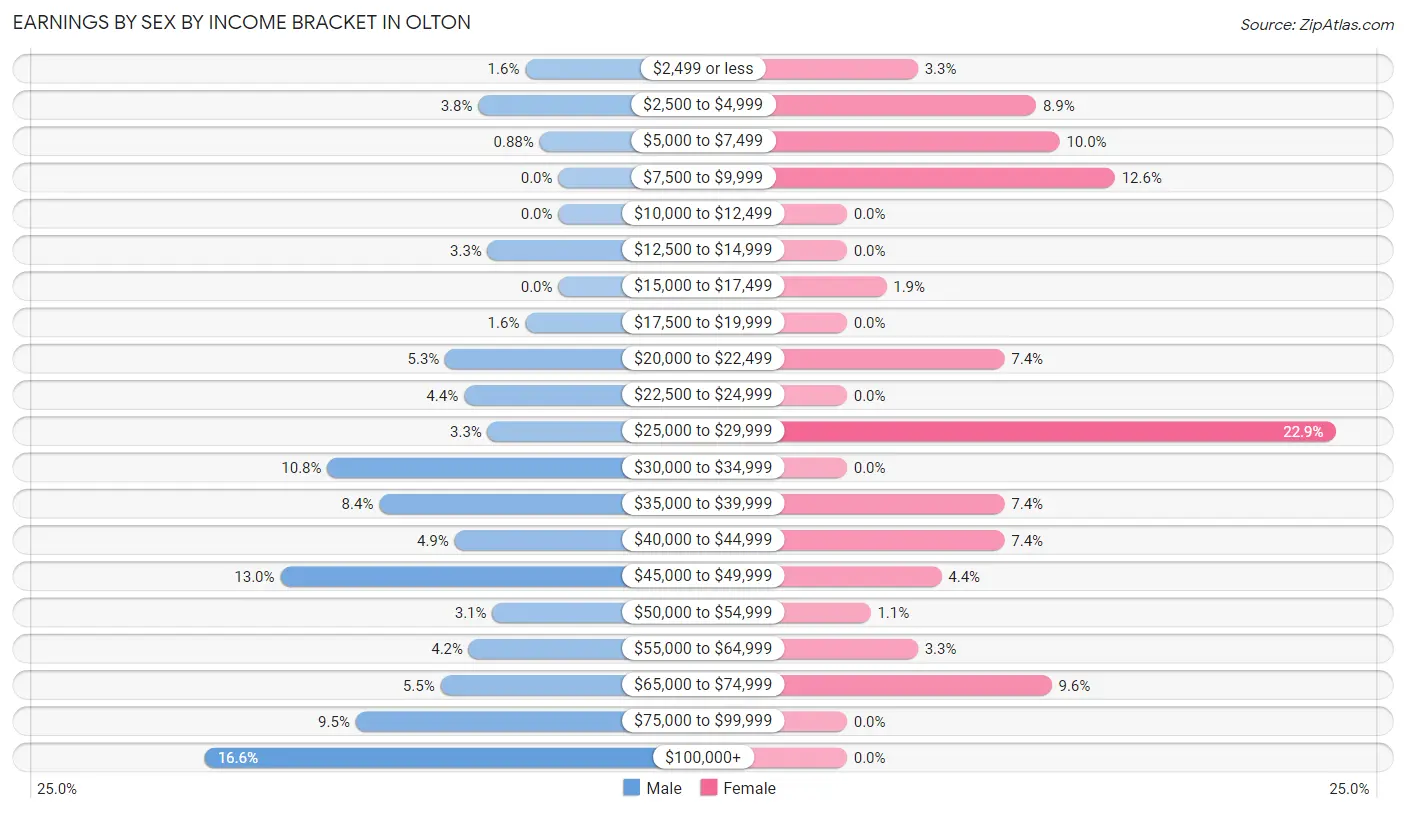
Earnings by Sex by Income Bracket in Olton
The most common earnings brackets in Olton are $100,000+ for men (75 | 16.6%) and $25,000 to $29,999 for women (62 | 22.9%).
| Income | Male | Female |
| $2,499 or less | 7 (1.5%) | 9 (3.3%) |
| $2,500 to $4,999 | 17 (3.7%) | 24 (8.9%) |
| $5,000 to $7,499 | 4 (0.9%) | 27 (10.0%) |
| $7,500 to $9,999 | 0 (0.0%) | 34 (12.6%) |
| $10,000 to $12,499 | 0 (0.0%) | 0 (0.0%) |
| $12,500 to $14,999 | 15 (3.3%) | 0 (0.0%) |
| $15,000 to $17,499 | 0 (0.0%) | 5 (1.8%) |
| $17,500 to $19,999 | 7 (1.5%) | 0 (0.0%) |
| $20,000 to $22,499 | 24 (5.3%) | 20 (7.4%) |
| $22,500 to $24,999 | 20 (4.4%) | 0 (0.0%) |
| $25,000 to $29,999 | 15 (3.3%) | 62 (22.9%) |
| $30,000 to $34,999 | 49 (10.8%) | 0 (0.0%) |
| $35,000 to $39,999 | 38 (8.4%) | 20 (7.4%) |
| $40,000 to $44,999 | 22 (4.9%) | 20 (7.4%) |
| $45,000 to $49,999 | 59 (13.0%) | 12 (4.4%) |
| $50,000 to $54,999 | 14 (3.1%) | 3 (1.1%) |
| $55,000 to $64,999 | 19 (4.2%) | 9 (3.3%) |
| $65,000 to $74,999 | 25 (5.5%) | 26 (9.6%) |
| $75,000 to $99,999 | 43 (9.5%) | 0 (0.0%) |
| $100,000+ | 75 (16.6%) | 0 (0.0%) |
| Total | 453 (100.0%) | 271 (100.0%) |
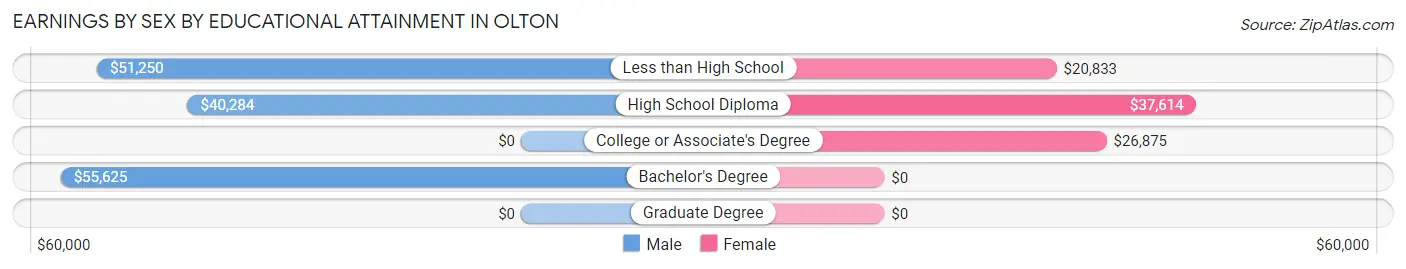
Earnings by Sex by Educational Attainment in Olton
Average earnings in Olton are $46,864 for men and $26,708 for women, a difference of 43.0%. Men with an educational attainment of bachelor's degree enjoy the highest average annual earnings of $55,625, while those with high school diploma education earn the least with $40,284. Women with an educational attainment of high school diploma earn the most with the average annual earnings of $37,614, while those with less than high school education have the smallest earnings of $20,833.
| Educational Attainment | Male Income | Female Income |
| Less than High School | $51,250 | $20,833 |
| High School Diploma | $40,284 | $37,614 |
| College or Associate's Degree | - | - |
| Bachelor's Degree | $55,625 | $0 |
| Graduate Degree | - | - |
| Total | $46,864 | $26,708 |
Family Income in Olton
Family Income Brackets in Olton
According to the Olton family income data, there are 95 families falling into the $50,000 to $74,999 income range, which is the most common income bracket and makes up 22.5% of all families.
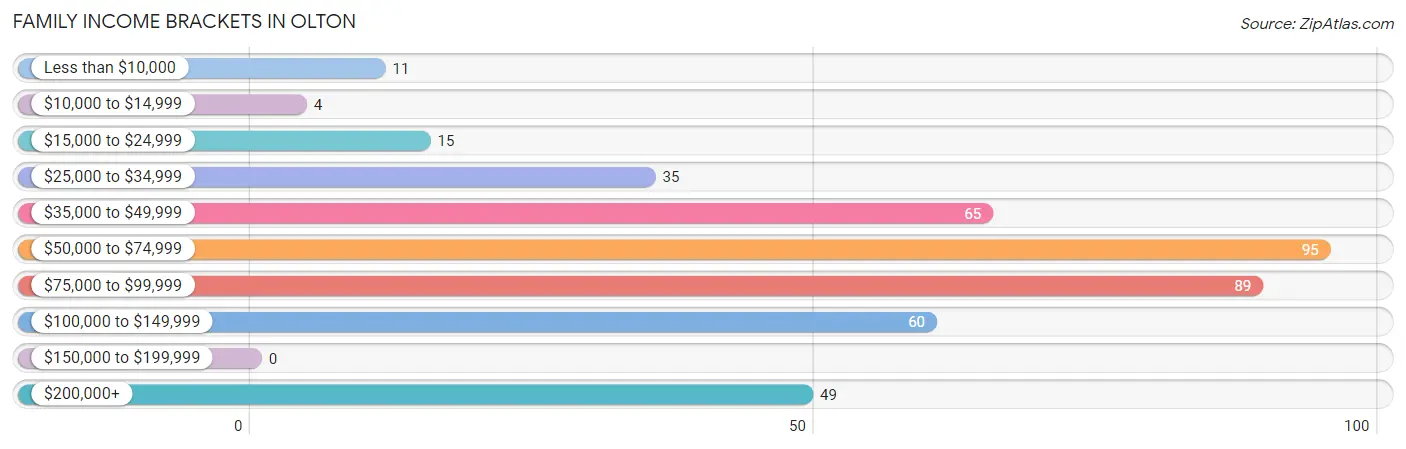
| Income Bracket | # Families | % Families |
| Less than $10,000 | 11 | 2.6% |
| $10,000 to $14,999 | 4 | 0.9% |
| $15,000 to $24,999 | 15 | 3.5% |
| $25,000 to $34,999 | 35 | 8.3% |
| $35,000 to $49,999 | 65 | 15.4% |
| $50,000 to $74,999 | 95 | 22.5% |
| $75,000 to $99,999 | 89 | 21.0% |
| $100,000 to $149,999 | 60 | 14.2% |
| $150,000 to $199,999 | 0 | 0.0% |
| $200,000+ | 49 | 11.6% |
Family Income by Famaliy Size in Olton
5-person families (71 | 16.8%) account for the highest median family income in Olton with $77,440 per family, while 2-person families (149 | 35.2%) have the highest median income of $30,469 per family member.
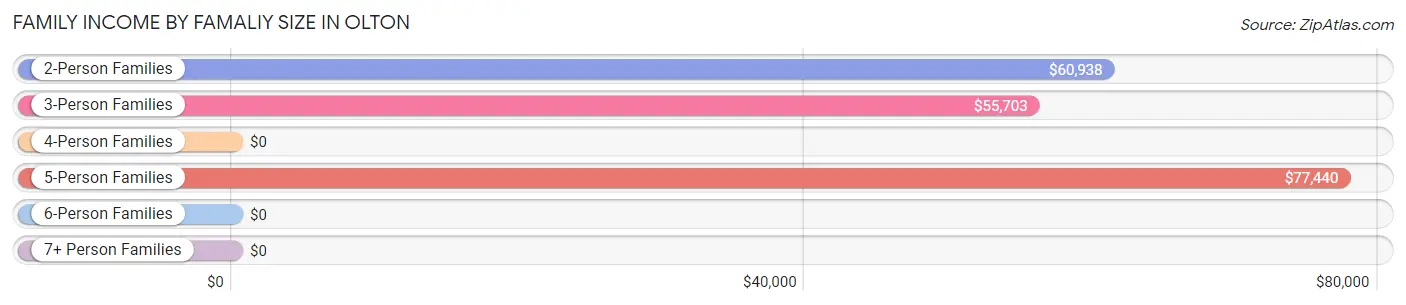
| Income Bracket | # Families | Median Income |
| 2-Person Families | 149 (35.2%) | $60,938 |
| 3-Person Families | 107 (25.3%) | $55,703 |
| 4-Person Families | 55 (13.0%) | $0 |
| 5-Person Families | 71 (16.8%) | $77,440 |
| 6-Person Families | 29 (6.9%) | $0 |
| 7+ Person Families | 12 (2.8%) | $0 |
| Total | 423 (100.0%) | $71,250 |
Family Income by Number of Earners in Olton
The median family income in Olton is $71,250, with families comprising 3+ earners (34) having the highest median family income of $127,875, while families with no earners (49) have the lowest median family income of $36,375, accounting for 8.0% and 11.6% of families, respectively.
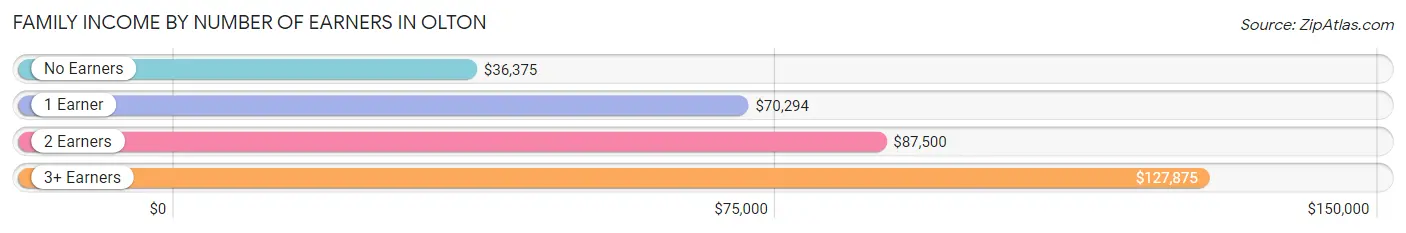
| Number of Earners | # Families | Median Income |
| No Earners | 49 (11.6%) | $36,375 |
| 1 Earner | 200 (47.3%) | $70,294 |
| 2 Earners | 140 (33.1%) | $87,500 |
| 3+ Earners | 34 (8.0%) | $127,875 |
| Total | 423 (100.0%) | $71,250 |
Household Income in Olton
Household Income Brackets in Olton
With 102 households falling in the category, the $50,000 to $74,999 income range is the most frequent in Olton, accounting for 18.8% of all households.
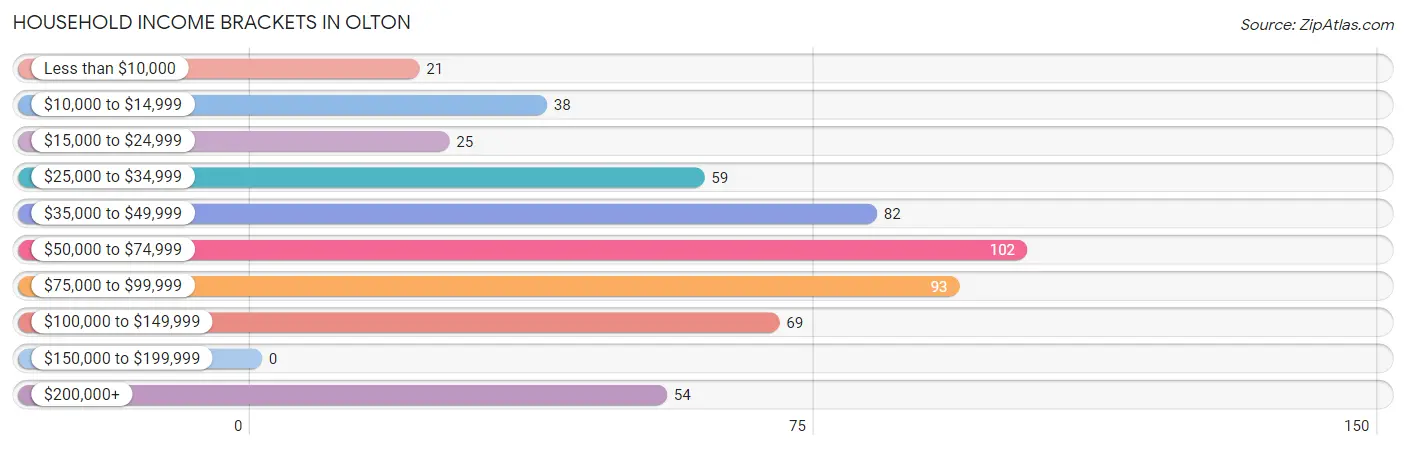
| Income Bracket | # Households | % Households |
| Less than $10,000 | 21 | 3.9% |
| $10,000 to $14,999 | 38 | 7.0% |
| $15,000 to $24,999 | 25 | 4.6% |
| $25,000 to $34,999 | 59 | 10.9% |
| $35,000 to $49,999 | 82 | 15.1% |
| $50,000 to $74,999 | 102 | 18.8% |
| $75,000 to $99,999 | 93 | 17.1% |
| $100,000 to $149,999 | 69 | 12.7% |
| $150,000 to $199,999 | 0 | 0.0% |
| $200,000+ | 54 | 9.9% |
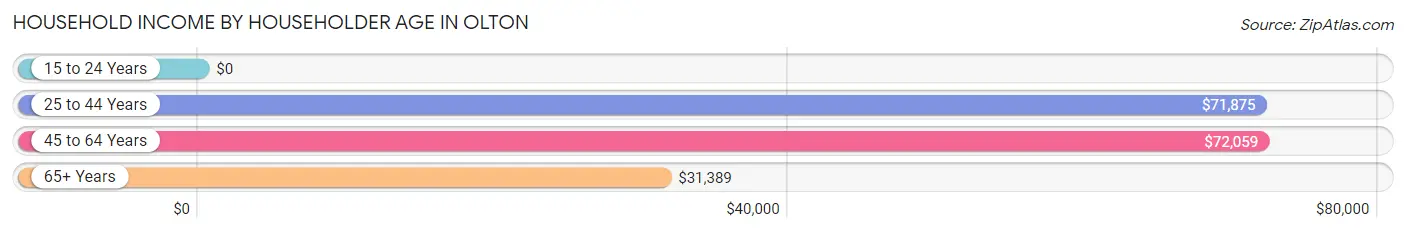
Household Income by Householder Age in Olton
The median household income in Olton is $57,250, with the highest median household income of $72,059 found in the 45 to 64 years age bracket for the primary householder. A total of 260 households (47.9%) fall into this category. Meanwhile, the 15 to 24 years age bracket for the primary householder has the lowest median household income of $0, with 24 households (4.4%) in this group.
| Income Bracket | # Households | Median Income |
| 15 to 24 Years | 24 (4.4%) | $0 |
| 25 to 44 Years | 135 (24.9%) | $71,875 |
| 45 to 64 Years | 260 (47.9%) | $72,059 |
| 65+ Years | 124 (22.8%) | $31,389 |
| Total | 543 (100.0%) | $57,250 |
Poverty in Olton
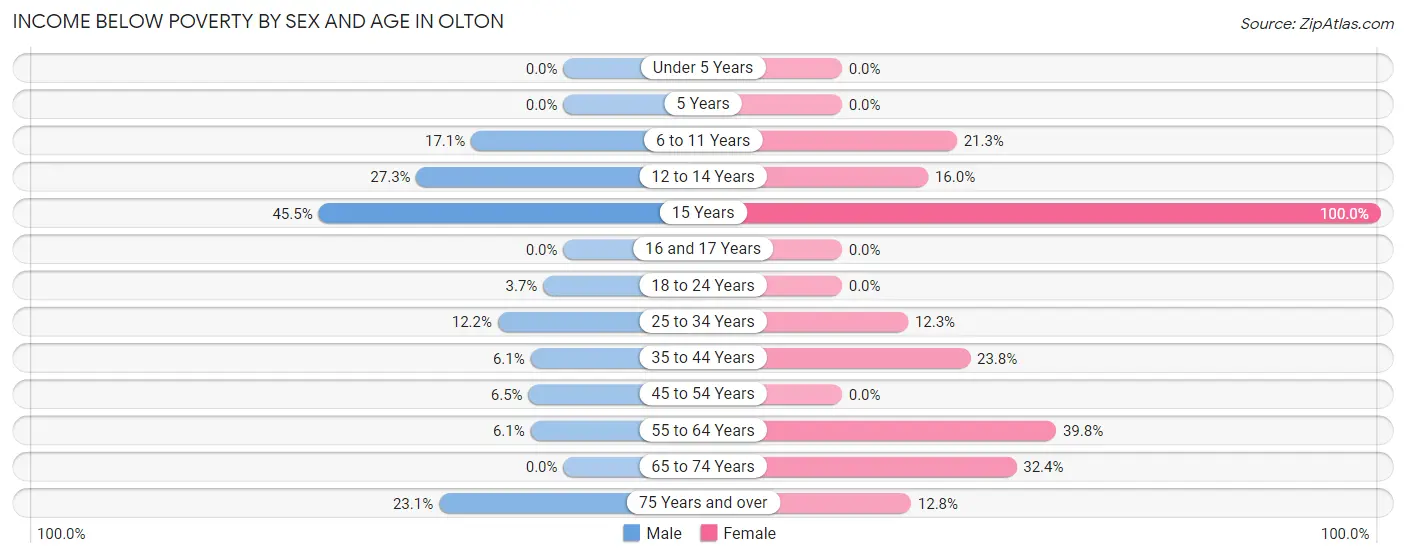
Income Below Poverty by Sex and Age in Olton
With 9.0% poverty level for males and 14.8% for females among the residents of Olton, 15 year old males and 15 year old females are the most vulnerable to poverty, with 10 males (45.5%) and 4 females (100.0%) in their respective age groups living below the poverty level.
| Age Bracket | Male | Female |
| Under 5 Years | 0 (0.0%) | 0 (0.0%) |
| 5 Years | 0 (0.0%) | 0 (0.0%) |
| 6 to 11 Years | 12 (17.1%) | 16 (21.3%) |
| 12 to 14 Years | 6 (27.3%) | 8 (16.0%) |
| 15 Years | 10 (45.5%) | 4 (100.0%) |
| 16 and 17 Years | 0 (0.0%) | 0 (0.0%) |
| 18 to 24 Years | 4 (3.7%) | 0 (0.0%) |
| 25 to 34 Years | 9 (12.2%) | 7 (12.3%) |
| 35 to 44 Years | 7 (6.1%) | 25 (23.8%) |
| 45 to 54 Years | 7 (6.5%) | 0 (0.0%) |
| 55 to 64 Years | 7 (6.1%) | 33 (39.8%) |
| 65 to 74 Years | 0 (0.0%) | 23 (32.4%) |
| 75 Years and over | 12 (23.1%) | 5 (12.8%) |
| Total | 74 (9.0%) | 121 (14.8%) |
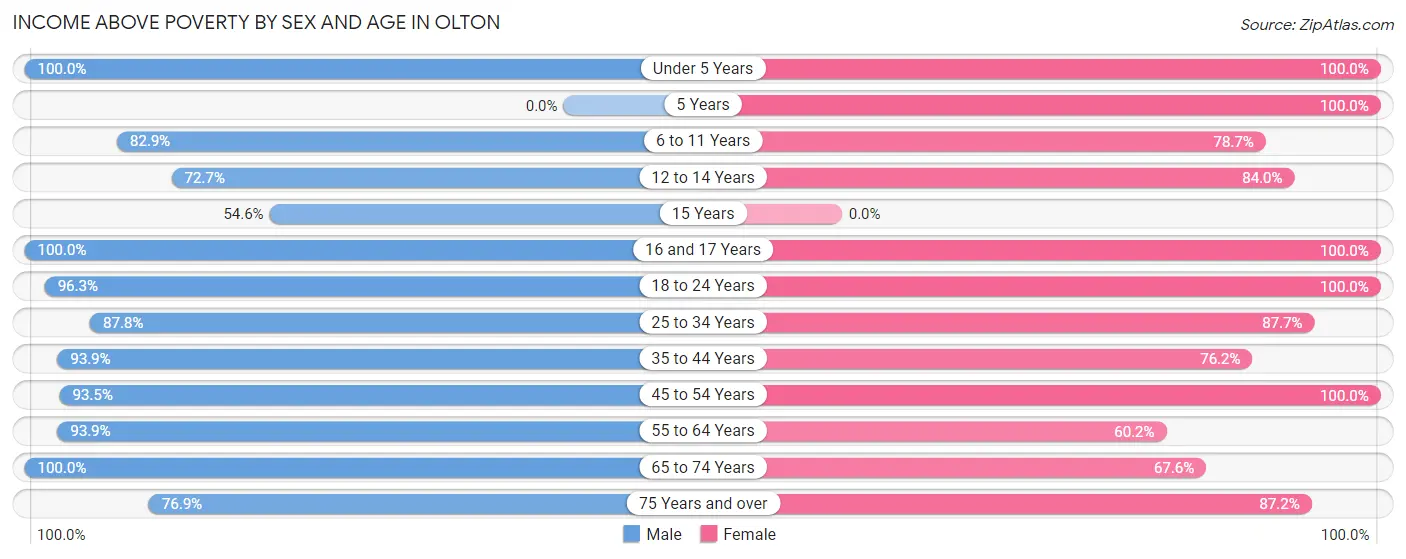
Income Above Poverty by Sex and Age in Olton
According to the poverty statistics in Olton, males aged under 5 years and females aged under 5 years are the age groups that are most secure financially, with 100.0% of males and 100.0% of females in these age groups living above the poverty line.
| Age Bracket | Male | Female |
| Under 5 Years | 69 (100.0%) | 33 (100.0%) |
| 5 Years | 0 (0.0%) | 24 (100.0%) |
| 6 to 11 Years | 58 (82.9%) | 59 (78.7%) |
| 12 to 14 Years | 16 (72.7%) | 42 (84.0%) |
| 15 Years | 12 (54.5%) | 0 (0.0%) |
| 16 and 17 Years | 15 (100.0%) | 30 (100.0%) |
| 18 to 24 Years | 103 (96.3%) | 115 (100.0%) |
| 25 to 34 Years | 65 (87.8%) | 50 (87.7%) |
| 35 to 44 Years | 108 (93.9%) | 80 (76.2%) |
| 45 to 54 Years | 101 (93.5%) | 134 (100.0%) |
| 55 to 64 Years | 108 (93.9%) | 50 (60.2%) |
| 65 to 74 Years | 53 (100.0%) | 48 (67.6%) |
| 75 Years and over | 40 (76.9%) | 34 (87.2%) |
| Total | 748 (91.0%) | 699 (85.2%) |
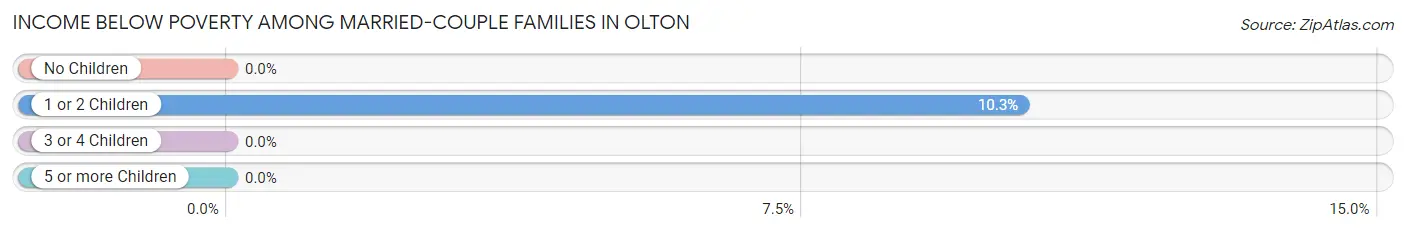
Income Below Poverty Among Married-Couple Families in Olton
The poverty statistics for married-couple families in Olton show that 1.9% or 6 of the total 316 families live below the poverty line. Families with 1 or 2 children have the highest poverty rate of 10.3%, comprising of 6 families. On the other hand, families with no children have the lowest poverty rate of 0.0%, which includes 0 families.
| Children | Above Poverty | Below Poverty |
| No Children | 194 (100.0%) | 0 (0.0%) |
| 1 or 2 Children | 52 (89.7%) | 6 (10.3%) |
| 3 or 4 Children | 64 (100.0%) | 0 (0.0%) |
| 5 or more Children | 0 (0.0%) | 0 (0.0%) |
| Total | 310 (98.1%) | 6 (1.9%) |
Income Below Poverty Among Single-Parent Households in Olton
According to the poverty data in Olton, 17.2% or 11 single-father households and 25.6% or 11 single-mother households are living below the poverty line. Among single-father households, those with no children have the highest poverty rate, with 4 households (28.6%) experiencing poverty. Likewise, among single-mother households, those with 3 or 4 children have the highest poverty rate, with 11 households (100.0%) falling below the poverty line.
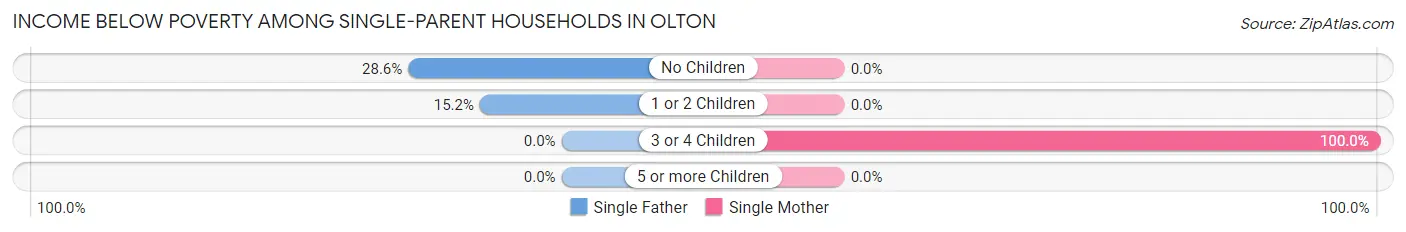
| Children | Single Father | Single Mother |
| No Children | 4 (28.6%) | 0 (0.0%) |
| 1 or 2 Children | 7 (15.2%) | 0 (0.0%) |
| 3 or 4 Children | 0 (0.0%) | 11 (100.0%) |
| 5 or more Children | 0 (0.0%) | 0 (0.0%) |
| Total | 11 (17.2%) | 11 (25.6%) |
Income Below Poverty Among Married-Couple vs Single-Parent Households in Olton
The poverty data for Olton shows that 6 of the married-couple family households (1.9%) and 22 of the single-parent households (20.6%) are living below the poverty level. Within the married-couple family households, those with 1 or 2 children have the highest poverty rate, with 6 households (10.3%) falling below the poverty line. Among the single-parent households, those with 3 or 4 children have the highest poverty rate, with 11 household (73.3%) living below poverty.
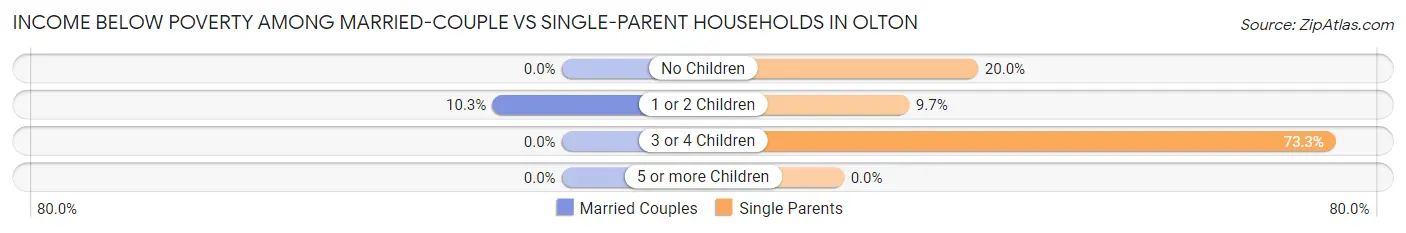
| Children | Married-Couple Families | Single-Parent Households |
| No Children | 0 (0.0%) | 4 (20.0%) |
| 1 or 2 Children | 6 (10.3%) | 7 (9.7%) |
| 3 or 4 Children | 0 (0.0%) | 11 (73.3%) |
| 5 or more Children | 0 (0.0%) | 0 (0.0%) |
| Total | 6 (1.9%) | 22 (20.6%) |
Race in Olton
The most populous races in Olton are White / Caucasian (1,377 | 78.7%), Hispanic or Latino (1,283 | 73.4%), and Two or more Races (327 | 18.7%).
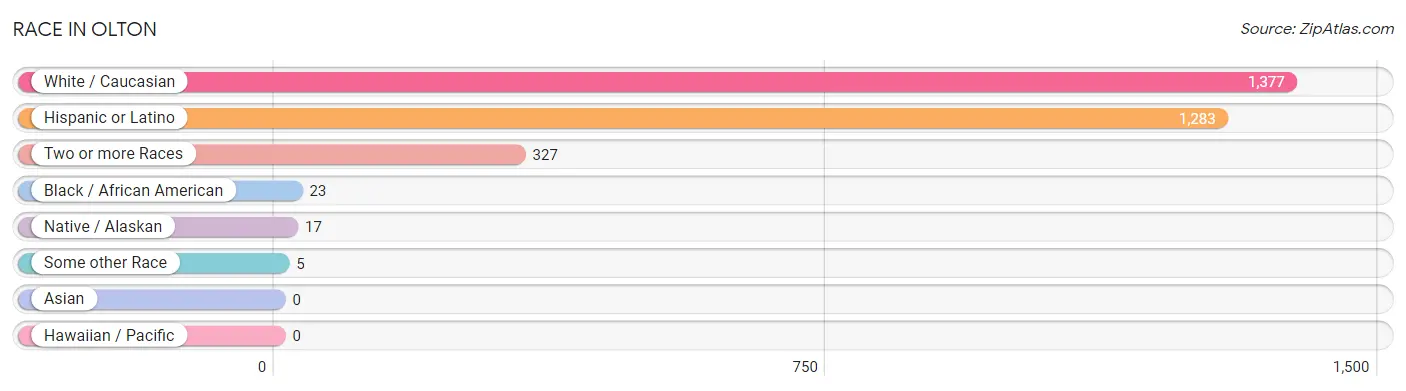
| Race | # Population | % Population |
| Asian | 0 | 0.0% |
| Black / African American | 23 | 1.3% |
| Hawaiian / Pacific | 0 | 0.0% |
| Hispanic or Latino | 1,283 | 73.4% |
| Native / Alaskan | 17 | 1.0% |
| White / Caucasian | 1,377 | 78.7% |
| Two or more Races | 327 | 18.7% |
| Some other Race | 5 | 0.3% |
| Total | 1,749 | 100.0% |
Ancestry in Olton
The most populous ancestries reported in Olton are Mexican (1,209 | 69.1%), German (62 | 3.5%), Irish (46 | 2.6%), Spaniard (43 | 2.5%), and English (25 | 1.4%), together accounting for 79.2% of all Olton residents.
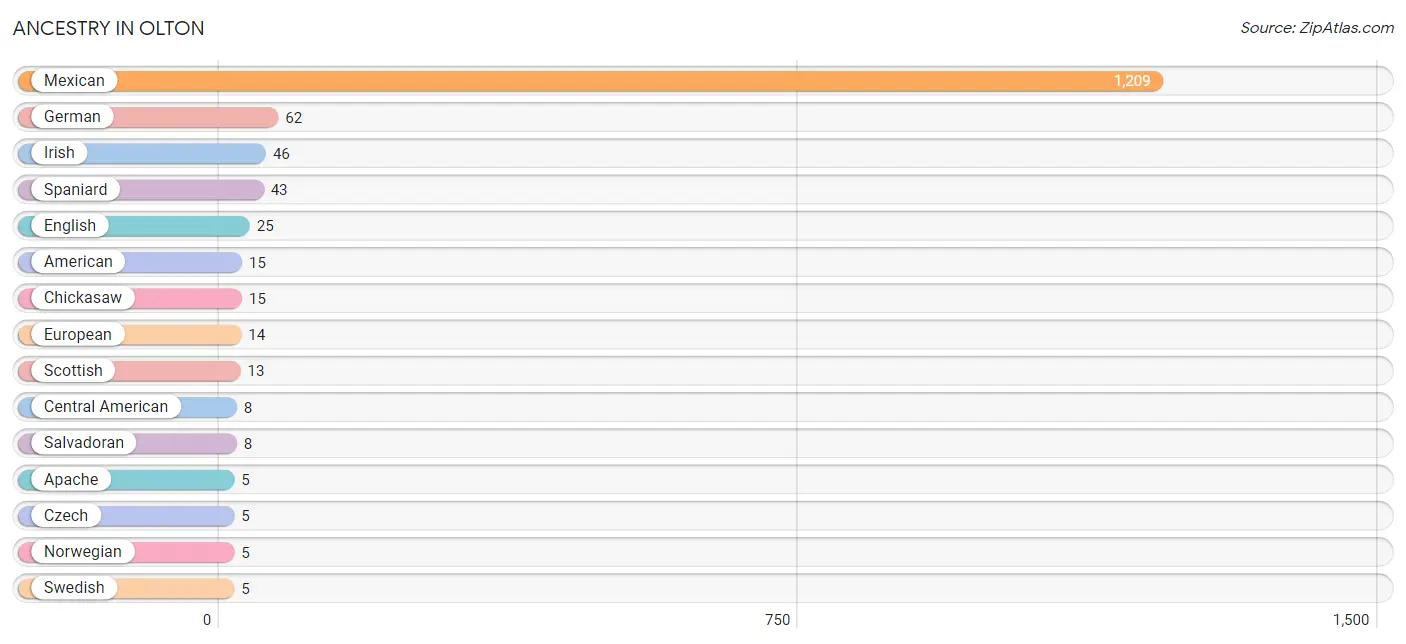
| Ancestry | # Population | % Population |
| American | 15 | 0.9% |
| Apache | 5 | 0.3% |
| Central American | 8 | 0.5% |
| Cherokee | 2 | 0.1% |
| Chickasaw | 15 | 0.9% |
| Czech | 5 | 0.3% |
| English | 25 | 1.4% |
| European | 14 | 0.8% |
| German | 62 | 3.5% |
| Irish | 46 | 2.6% |
| Mexican | 1,209 | 69.1% |
| Norwegian | 5 | 0.3% |
| Salvadoran | 8 | 0.5% |
| Scottish | 13 | 0.7% |
| Spaniard | 43 | 2.5% |
| Swedish | 5 | 0.3% | View All 16 Rows |
Immigrants in Olton
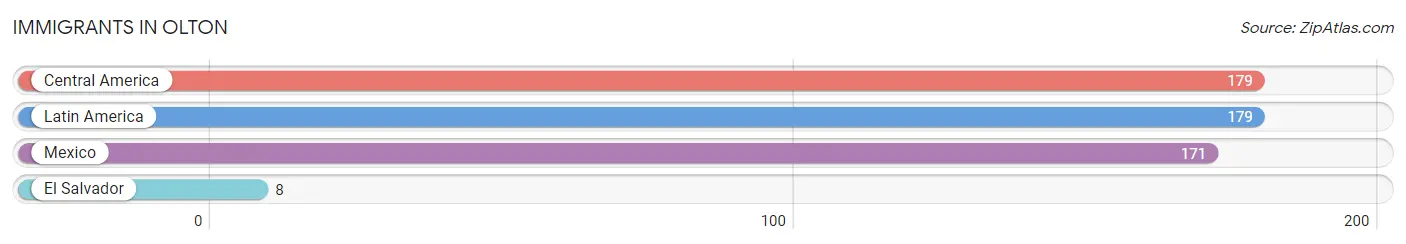
The most numerous immigrant groups reported in Olton came from Central America (179 | 10.2%), Latin America (179 | 10.2%), Mexico (171 | 9.8%), and El Salvador (8 | 0.5%), together accounting for 30.7% of all Olton residents.
| Immigration Origin | # Population | % Population |
| Central America | 179 | 10.2% |
| El Salvador | 8 | 0.5% |
| Latin America | 179 | 10.2% |
| Mexico | 171 | 9.8% | View All 4 Rows |
Sex and Age in Olton
Sex and Age in Olton
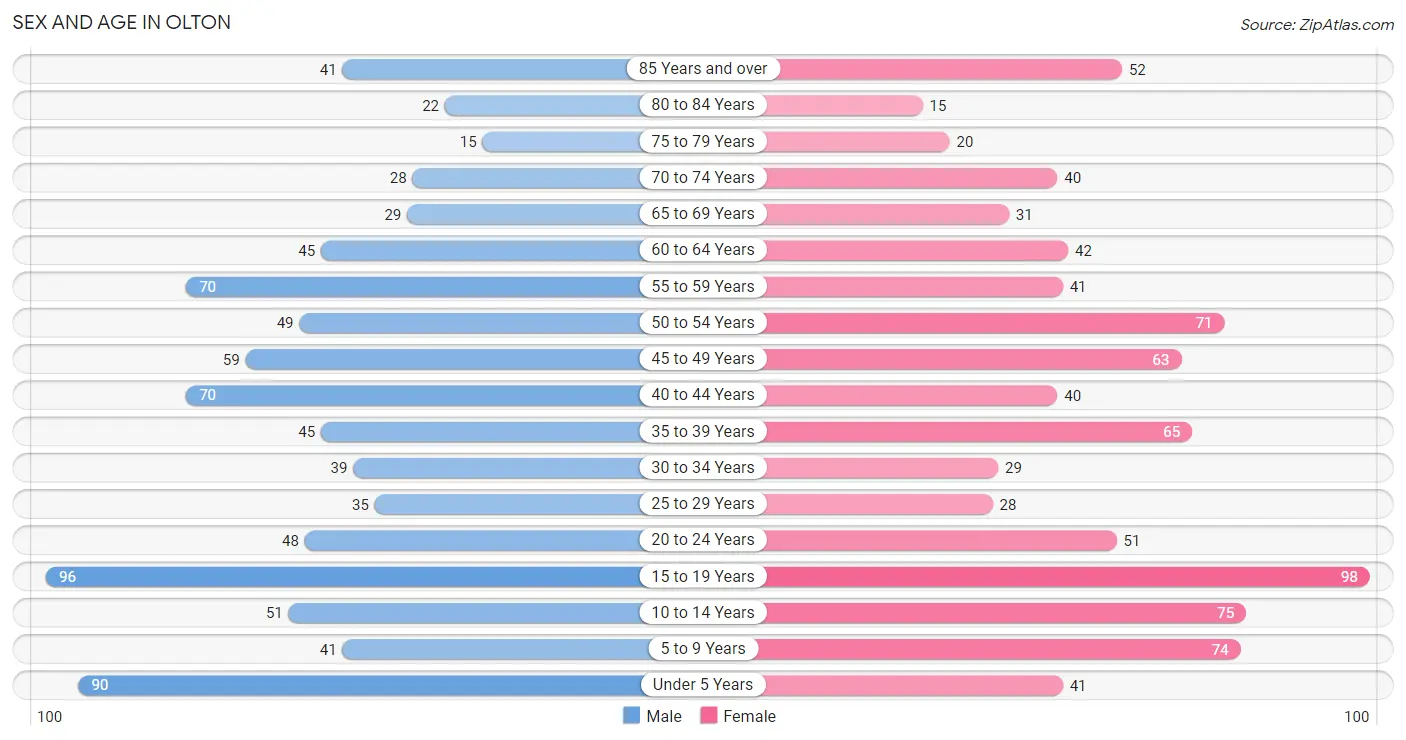
The most populous age groups in Olton are 15 to 19 Years (96 | 11.0%) for men and 15 to 19 Years (98 | 11.2%) for women.
| Age Bracket | Male | Female |
| Under 5 Years | 90 (10.3%) | 41 (4.7%) |
| 5 to 9 Years | 41 (4.7%) | 74 (8.5%) |
| 10 to 14 Years | 51 (5.8%) | 75 (8.6%) |
| 15 to 19 Years | 96 (11.0%) | 98 (11.2%) |
| 20 to 24 Years | 48 (5.5%) | 51 (5.8%) |
| 25 to 29 Years | 35 (4.0%) | 28 (3.2%) |
| 30 to 34 Years | 39 (4.5%) | 29 (3.3%) |
| 35 to 39 Years | 45 (5.1%) | 65 (7.4%) |
| 40 to 44 Years | 70 (8.0%) | 40 (4.6%) |
| 45 to 49 Years | 59 (6.8%) | 63 (7.2%) |
| 50 to 54 Years | 49 (5.6%) | 71 (8.1%) |
| 55 to 59 Years | 70 (8.0%) | 41 (4.7%) |
| 60 to 64 Years | 45 (5.1%) | 42 (4.8%) |
| 65 to 69 Years | 29 (3.3%) | 31 (3.5%) |
| 70 to 74 Years | 28 (3.2%) | 40 (4.6%) |
| 75 to 79 Years | 15 (1.7%) | 20 (2.3%) |
| 80 to 84 Years | 22 (2.5%) | 15 (1.7%) |
| 85 Years and over | 41 (4.7%) | 52 (5.9%) |
| Total | 873 (100.0%) | 876 (100.0%) |
Families and Households in Olton
Median Family Size in Olton
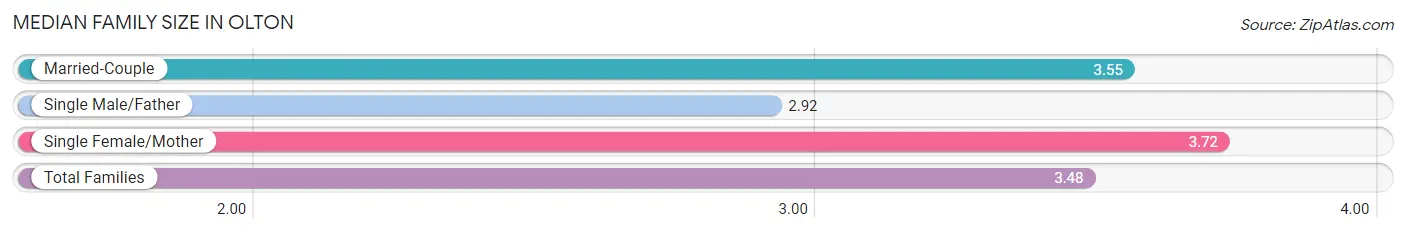
The median family size in Olton is 3.48 persons per family, with single female/mother families (43 | 10.2%) accounting for the largest median family size of 3.72 persons per family. On the other hand, single male/father families (64 | 15.1%) represent the smallest median family size with 2.92 persons per family.
| Family Type | # Families | Family Size |
| Married-Couple | 316 (74.7%) | 3.55 |
| Single Male/Father | 64 (15.1%) | 2.92 |
| Single Female/Mother | 43 (10.2%) | 3.72 |
| Total Families | 423 (100.0%) | 3.48 |
Median Household Size in Olton
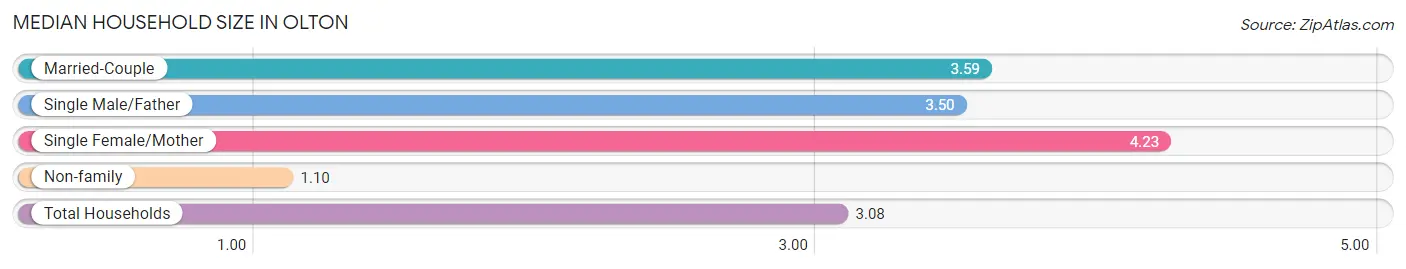
The median household size in Olton is 3.08 persons per household, with single female/mother households (43 | 7.9%) accounting for the largest median household size of 4.23 persons per household. non-family households (120 | 22.1%) represent the smallest median household size with 1.10 persons per household.
| Household Type | # Households | Household Size |
| Married-Couple | 316 (58.2%) | 3.59 |
| Single Male/Father | 64 (11.8%) | 3.50 |
| Single Female/Mother | 43 (7.9%) | 4.23 |
| Non-family | 120 (22.1%) | 1.10 |
| Total Households | 543 (100.0%) | 3.08 |
Household Size by Marriage Status in Olton
Out of a total of 543 households in Olton, 423 (77.9%) are family households, while 120 (22.1%) are nonfamily households. The most numerous type of family households are 2-person households, comprising 149, and the most common type of nonfamily households are 1-person households, comprising 110.
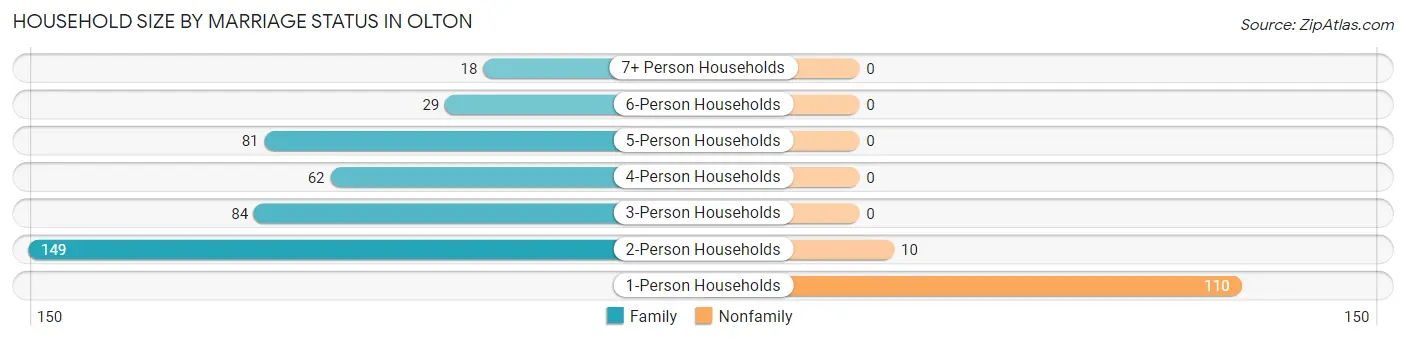
| Household Size | Family Households | Nonfamily Households |
| 1-Person Households | - | 110 (20.3%) |
| 2-Person Households | 149 (27.4%) | 10 (1.8%) |
| 3-Person Households | 84 (15.5%) | 0 (0.0%) |
| 4-Person Households | 62 (11.4%) | 0 (0.0%) |
| 5-Person Households | 81 (14.9%) | 0 (0.0%) |
| 6-Person Households | 29 (5.3%) | 0 (0.0%) |
| 7+ Person Households | 18 (3.3%) | 0 (0.0%) |
| Total | 423 (77.9%) | 120 (22.1%) |
Female Fertility in Olton
Fertility by Age in Olton
Average fertility rate in Olton is 21.0 births per 1,000 women. Women in the age bracket of 20 to 34 years have the highest fertility rate with 74.0 births per 1,000 women. Women in the age bracket of 20 to 34 years acount for 100.0% of all women with births.
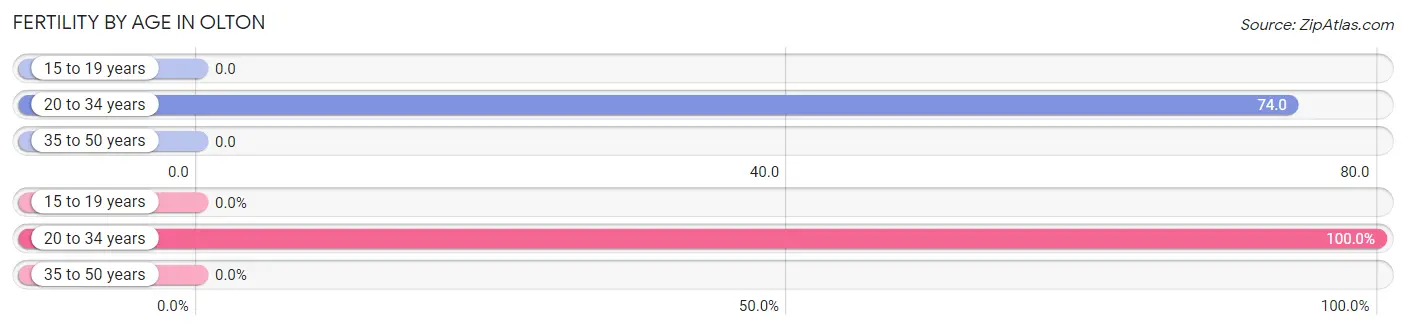
| Age Bracket | Women with Births | Births / 1,000 Women |
| 15 to 19 years | 0 (0.0%) | 0.0 |
| 20 to 34 years | 8 (100.0%) | 74.0 |
| 35 to 50 years | 0 (0.0%) | 0.0 |
| Total | 8 (100.0%) | 21.0 |
Fertility by Age by Marriage Status in Olton
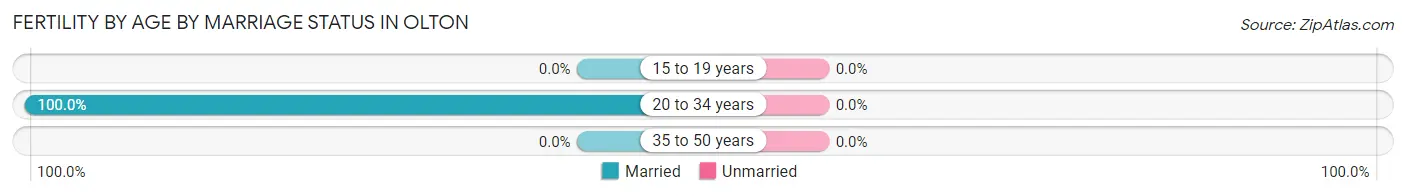
| Age Bracket | Married | Unmarried |
| 15 to 19 years | 0 (0.0%) | 0 (0.0%) |
| 20 to 34 years | 8 (100.0%) | 0 (0.0%) |
| 35 to 50 years | 0 (0.0%) | 0 (0.0%) |
| Total | 8 (100.0%) | 0 (0.0%) |
Fertility by Education in Olton
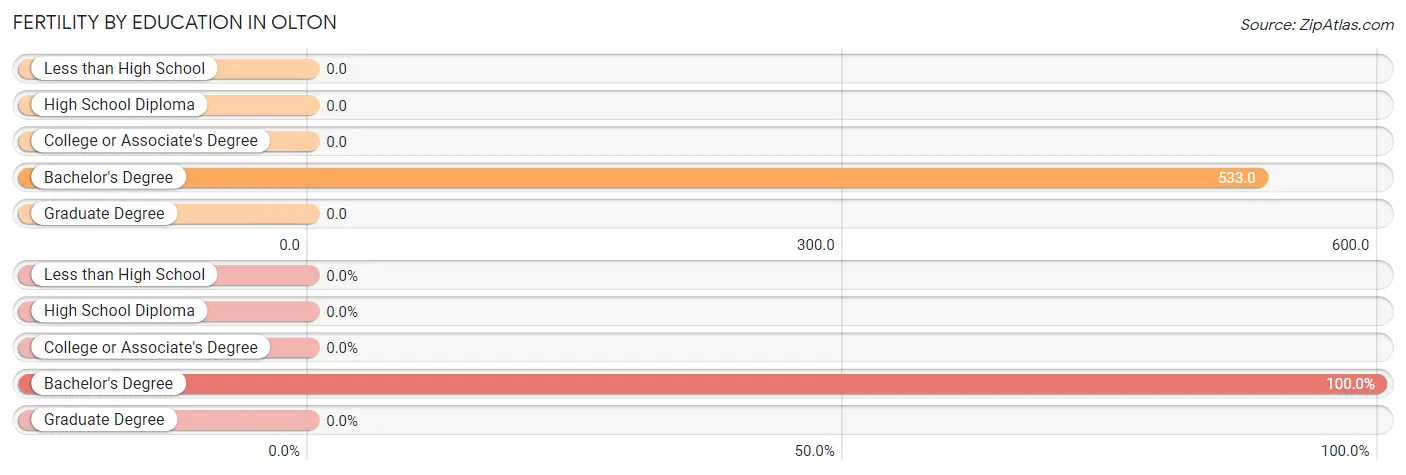
| Educational Attainment | Women with Births | Births / 1,000 Women |
| Less than High School | 0 (0.0%) | 0.0 |
| High School Diploma | 0 (0.0%) | 0.0 |
| College or Associate's Degree | 0 (0.0%) | 0.0 |
| Bachelor's Degree | 8 (100.0%) | 533.0 |
| Graduate Degree | 0 (0.0%) | 0.0 |
| Total | 8 (100.0%) | 21.0 |
Fertility by Education by Marriage Status in Olton
| Educational Attainment | Married | Unmarried |
| Less than High School | 0 (0.0%) | 0 (0.0%) |
| High School Diploma | 0 (0.0%) | 0 (0.0%) |
| College or Associate's Degree | 0 (0.0%) | 0 (0.0%) |
| Bachelor's Degree | 8 (100.0%) | 0 (0.0%) |
| Graduate Degree | 0 (0.0%) | 0 (0.0%) |
| Total | 8 (100.0%) | 0 (0.0%) |
Employment Characteristics in Olton
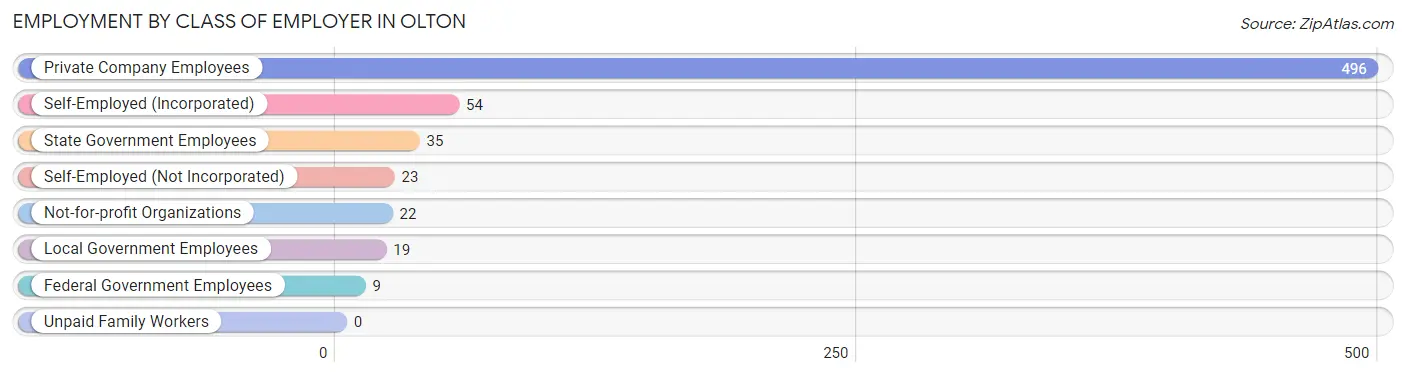
Employment by Class of Employer in Olton
Among the 658 employed individuals in Olton, private company employees (496 | 75.4%), self-employed (incorporated) (54 | 8.2%), and state government employees (35 | 5.3%) make up the most common classes of employment.
| Employer Class | # Employees | % Employees |
| Private Company Employees | 496 | 75.4% |
| Self-Employed (Incorporated) | 54 | 8.2% |
| Self-Employed (Not Incorporated) | 23 | 3.5% |
| Not-for-profit Organizations | 22 | 3.3% |
| Local Government Employees | 19 | 2.9% |
| State Government Employees | 35 | 5.3% |
| Federal Government Employees | 9 | 1.4% |
| Unpaid Family Workers | 0 | 0.0% |
| Total | 658 | 100.0% |
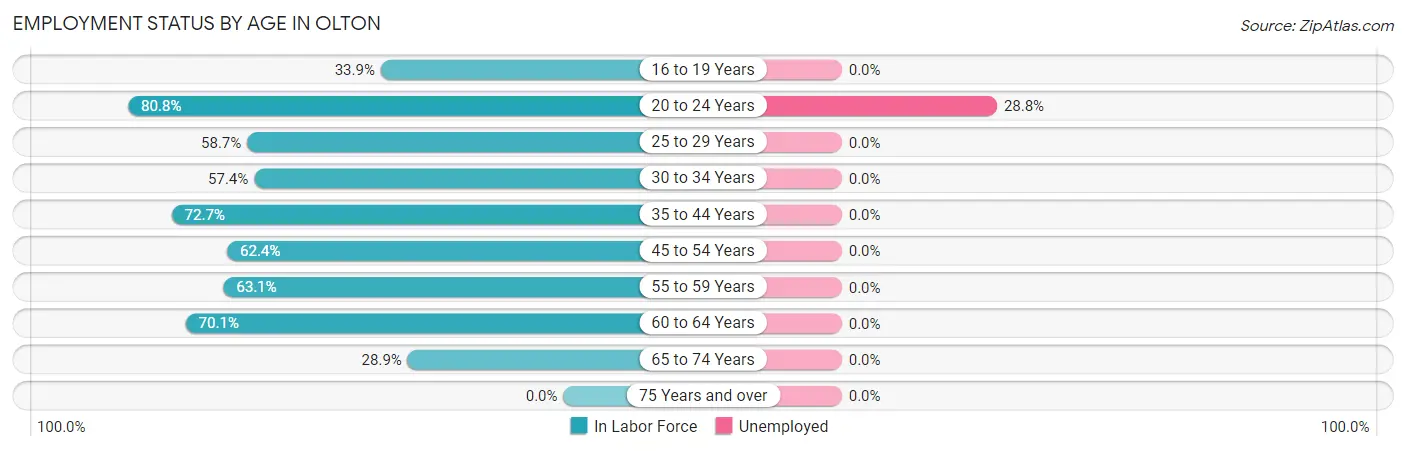
Employment Status by Age in Olton
According to the labor force statistics for Olton, out of the total population over 16 years of age (1,351), 51.2% or 692 individuals are in the labor force, with 3.3% or 23 of them unemployed. The age group with the highest labor force participation rate is 20 to 24 years, with 80.8% or 80 individuals in the labor force. Within the labor force, the 20 to 24 years age range has the highest percentage of unemployed individuals, with 28.8% or 23 of them being unemployed.
| Age Bracket | In Labor Force | Unemployed |
| 16 to 19 Years | 57 (33.9%) | 0 (0.0%) |
| 20 to 24 Years | 80 (80.8%) | 23 (28.8%) |
| 25 to 29 Years | 37 (58.7%) | 0 (0.0%) |
| 30 to 34 Years | 39 (57.4%) | 0 (0.0%) |
| 35 to 44 Years | 160 (72.7%) | 0 (0.0%) |
| 45 to 54 Years | 151 (62.4%) | 0 (0.0%) |
| 55 to 59 Years | 70 (63.1%) | 0 (0.0%) |
| 60 to 64 Years | 61 (70.1%) | 0 (0.0%) |
| 65 to 74 Years | 37 (28.9%) | 0 (0.0%) |
| 75 Years and over | 0 (0.0%) | 0 (0.0%) |
| Total | 692 (51.2%) | 23 (3.3%) |
Employment Status by Educational Attainment in Olton
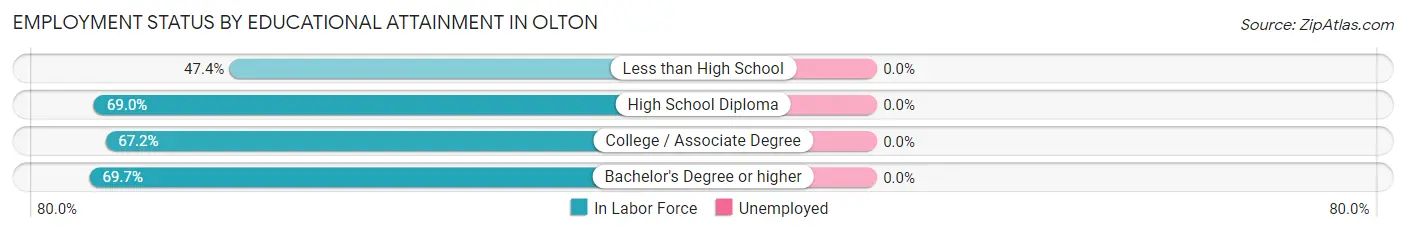
| Educational Attainment | In Labor Force | Unemployed |
| Less than High School | 54 (47.4%) | 0 (0.0%) |
| High School Diploma | 258 (69.0%) | 0 (0.0%) |
| College / Associate Degree | 137 (67.2%) | 0 (0.0%) |
| Bachelor's Degree or higher | 69 (69.7%) | 0 (0.0%) |
| Total | 518 (65.5%) | 0 (0.0%) |
Employment Occupations by Sex in Olton
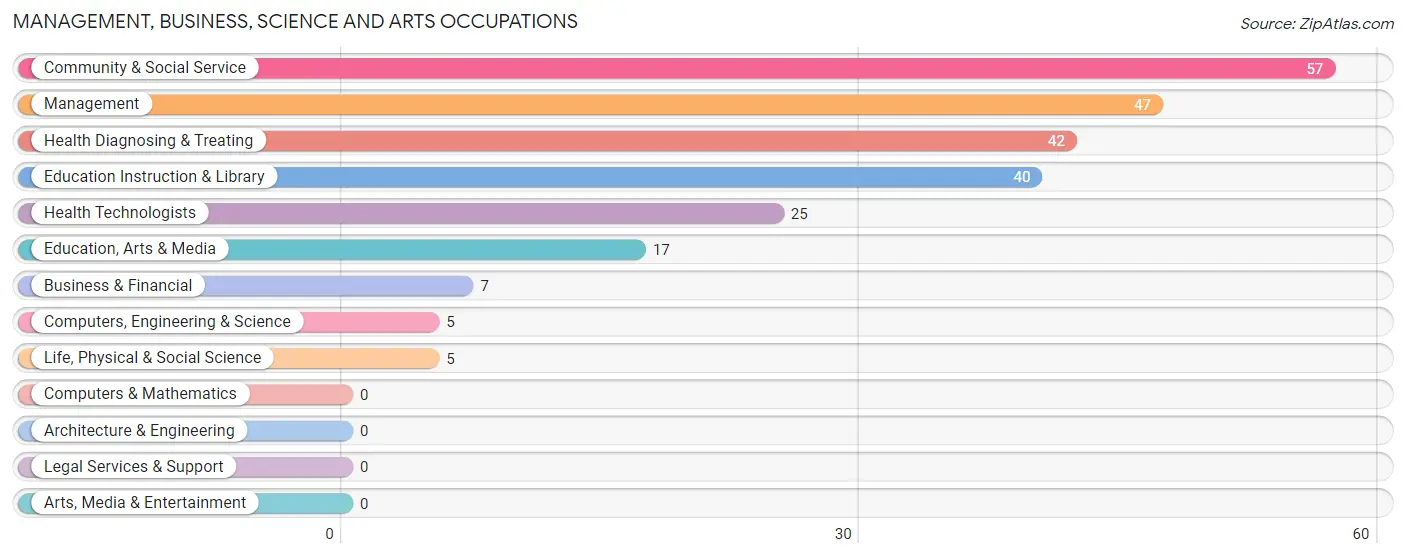
Management, Business, Science and Arts Occupations
The most common Management, Business, Science and Arts occupations in Olton are Community & Social Service (57 | 8.5%), Management (47 | 7.0%), Health Diagnosing & Treating (42 | 6.3%), Education Instruction & Library (40 | 6.0%), and Health Technologists (25 | 3.7%).
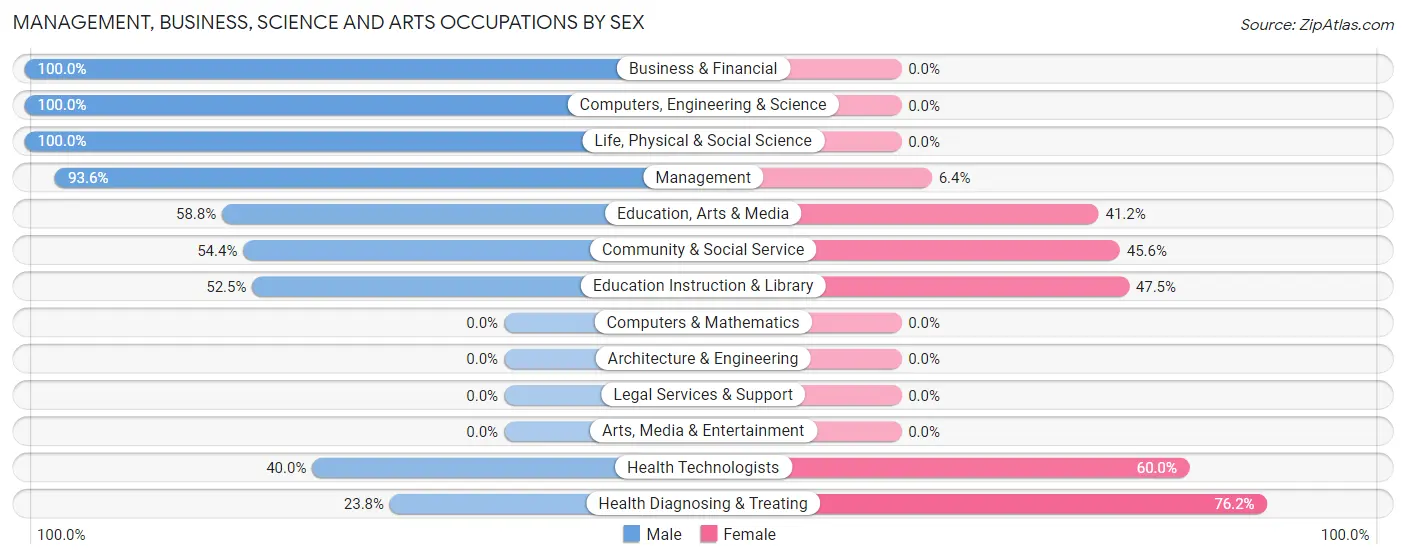
Management, Business, Science and Arts Occupations by Sex
Within the Management, Business, Science and Arts occupations in Olton, the most male-oriented occupations are Business & Financial (100.0%), Computers, Engineering & Science (100.0%), and Life, Physical & Social Science (100.0%), while the most female-oriented occupations are Health Diagnosing & Treating (76.2%), Health Technologists (60.0%), and Education Instruction & Library (47.5%).
| Occupation | Male | Female |
| Management | 44 (93.6%) | 3 (6.4%) |
| Business & Financial | 7 (100.0%) | 0 (0.0%) |
| Computers, Engineering & Science | 5 (100.0%) | 0 (0.0%) |
| Computers & Mathematics | 0 (0.0%) | 0 (0.0%) |
| Architecture & Engineering | 0 (0.0%) | 0 (0.0%) |
| Life, Physical & Social Science | 5 (100.0%) | 0 (0.0%) |
| Community & Social Service | 31 (54.4%) | 26 (45.6%) |
| Education, Arts & Media | 10 (58.8%) | 7 (41.2%) |
| Legal Services & Support | 0 (0.0%) | 0 (0.0%) |
| Education Instruction & Library | 21 (52.5%) | 19 (47.5%) |
| Arts, Media & Entertainment | 0 (0.0%) | 0 (0.0%) |
| Health Diagnosing & Treating | 10 (23.8%) | 32 (76.2%) |
| Health Technologists | 10 (40.0%) | 15 (60.0%) |
| Total (Category) | 97 (61.4%) | 61 (38.6%) |
| Total (Overall) | 416 (62.2%) | 253 (37.8%) |
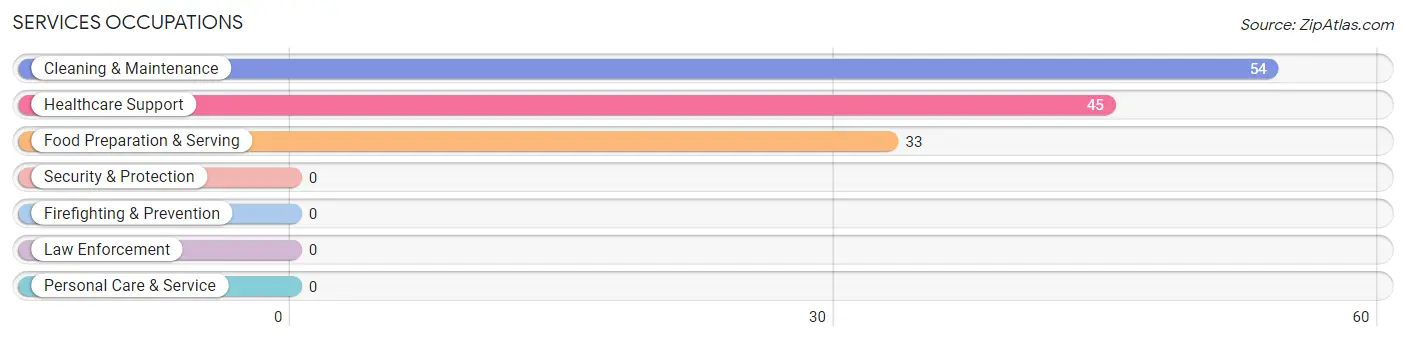
Services Occupations
The most common Services occupations in Olton are Cleaning & Maintenance (54 | 8.1%), Healthcare Support (45 | 6.7%), and Food Preparation & Serving (33 | 4.9%).
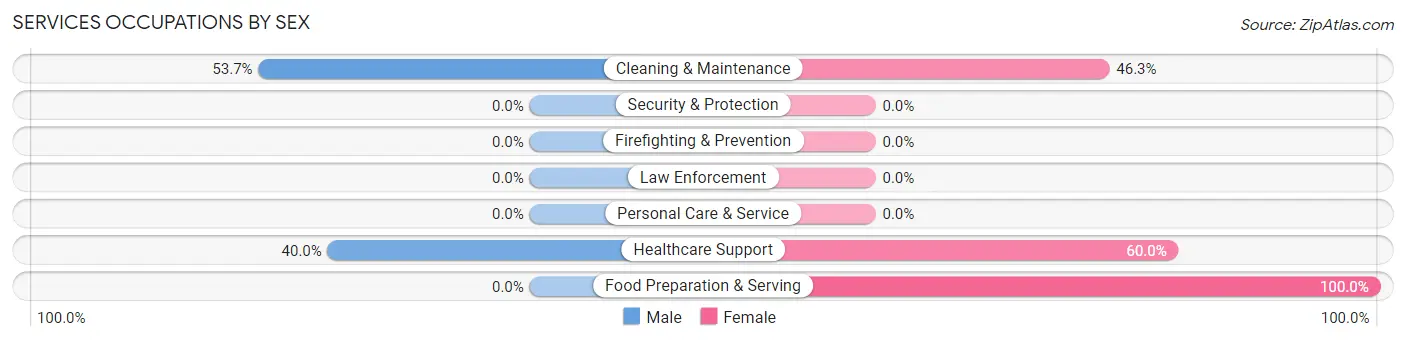
Services Occupations by Sex
Within the Services occupations in Olton, the most male-oriented occupations are Cleaning & Maintenance (53.7%), and Healthcare Support (40.0%), while the most female-oriented occupations are Food Preparation & Serving (100.0%), Healthcare Support (60.0%), and Cleaning & Maintenance (46.3%).
| Occupation | Male | Female |
| Healthcare Support | 18 (40.0%) | 27 (60.0%) |
| Security & Protection | 0 (0.0%) | 0 (0.0%) |
| Firefighting & Prevention | 0 (0.0%) | 0 (0.0%) |
| Law Enforcement | 0 (0.0%) | 0 (0.0%) |
| Food Preparation & Serving | 0 (0.0%) | 33 (100.0%) |
| Cleaning & Maintenance | 29 (53.7%) | 25 (46.3%) |
| Personal Care & Service | 0 (0.0%) | 0 (0.0%) |
| Total (Category) | 47 (35.6%) | 85 (64.4%) |
| Total (Overall) | 416 (62.2%) | 253 (37.8%) |
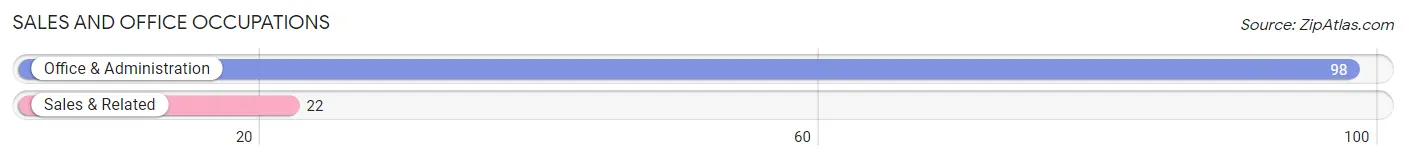
Sales and Office Occupations
The most common Sales and Office occupations in Olton are Office & Administration (98 | 14.6%), and Sales & Related (22 | 3.3%).
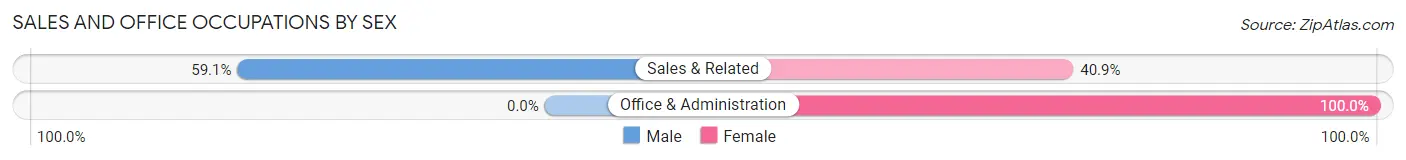
Sales and Office Occupations by Sex
| Occupation | Male | Female |
| Sales & Related | 13 (59.1%) | 9 (40.9%) |
| Office & Administration | 0 (0.0%) | 98 (100.0%) |
| Total (Category) | 13 (10.8%) | 107 (89.2%) |
| Total (Overall) | 416 (62.2%) | 253 (37.8%) |
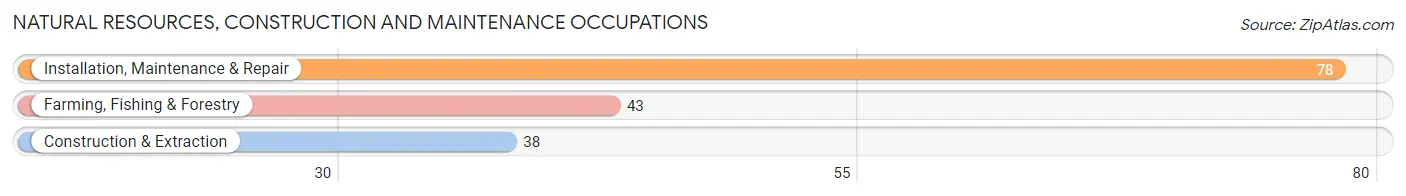
Natural Resources, Construction and Maintenance Occupations
The most common Natural Resources, Construction and Maintenance occupations in Olton are Installation, Maintenance & Repair (78 | 11.7%), Farming, Fishing & Forestry (43 | 6.4%), and Construction & Extraction (38 | 5.7%).
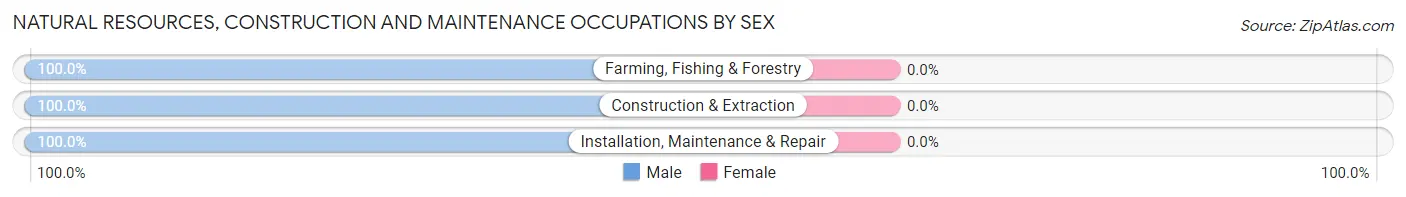
Natural Resources, Construction and Maintenance Occupations by Sex
| Occupation | Male | Female |
| Farming, Fishing & Forestry | 43 (100.0%) | 0 (0.0%) |
| Construction & Extraction | 38 (100.0%) | 0 (0.0%) |
| Installation, Maintenance & Repair | 78 (100.0%) | 0 (0.0%) |
| Total (Category) | 159 (100.0%) | 0 (0.0%) |
| Total (Overall) | 416 (62.2%) | 253 (37.8%) |
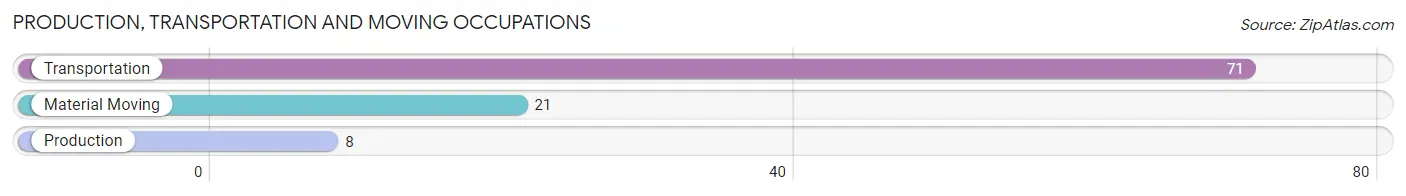
Production, Transportation and Moving Occupations
The most common Production, Transportation and Moving occupations in Olton are Transportation (71 | 10.6%), Material Moving (21 | 3.1%), and Production (8 | 1.2%).
Production, Transportation and Moving Occupations by Sex
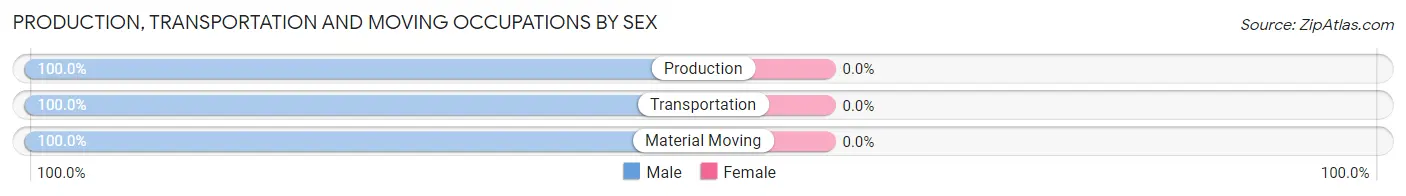
| Occupation | Male | Female |
| Production | 8 (100.0%) | 0 (0.0%) |
| Transportation | 71 (100.0%) | 0 (0.0%) |
| Material Moving | 21 (100.0%) | 0 (0.0%) |
| Total (Category) | 100 (100.0%) | 0 (0.0%) |
| Total (Overall) | 416 (62.2%) | 253 (37.8%) |
Employment Industries by Sex in Olton
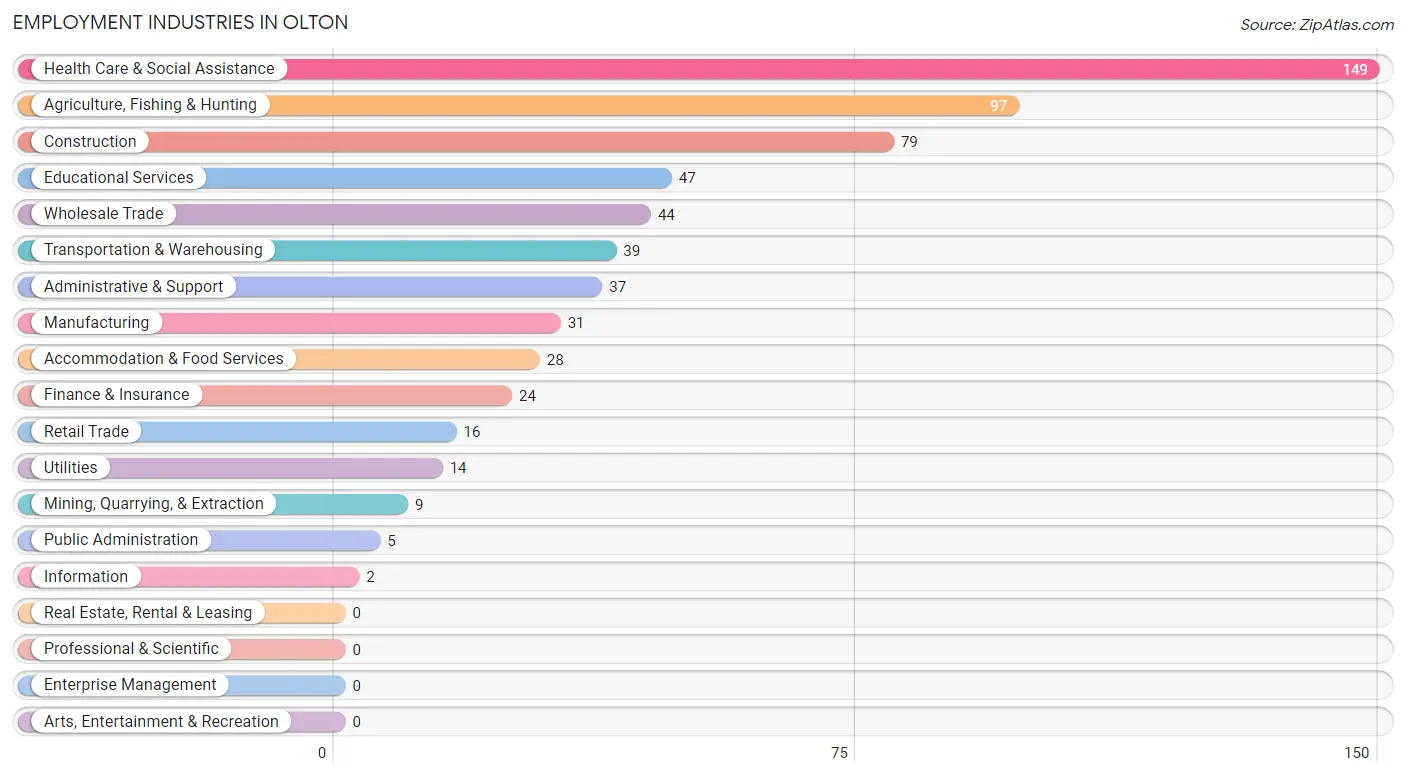
Employment Industries in Olton
The major employment industries in Olton include Health Care & Social Assistance (149 | 22.3%), Agriculture, Fishing & Hunting (97 | 14.5%), Construction (79 | 11.8%), Educational Services (47 | 7.0%), and Wholesale Trade (44 | 6.6%).
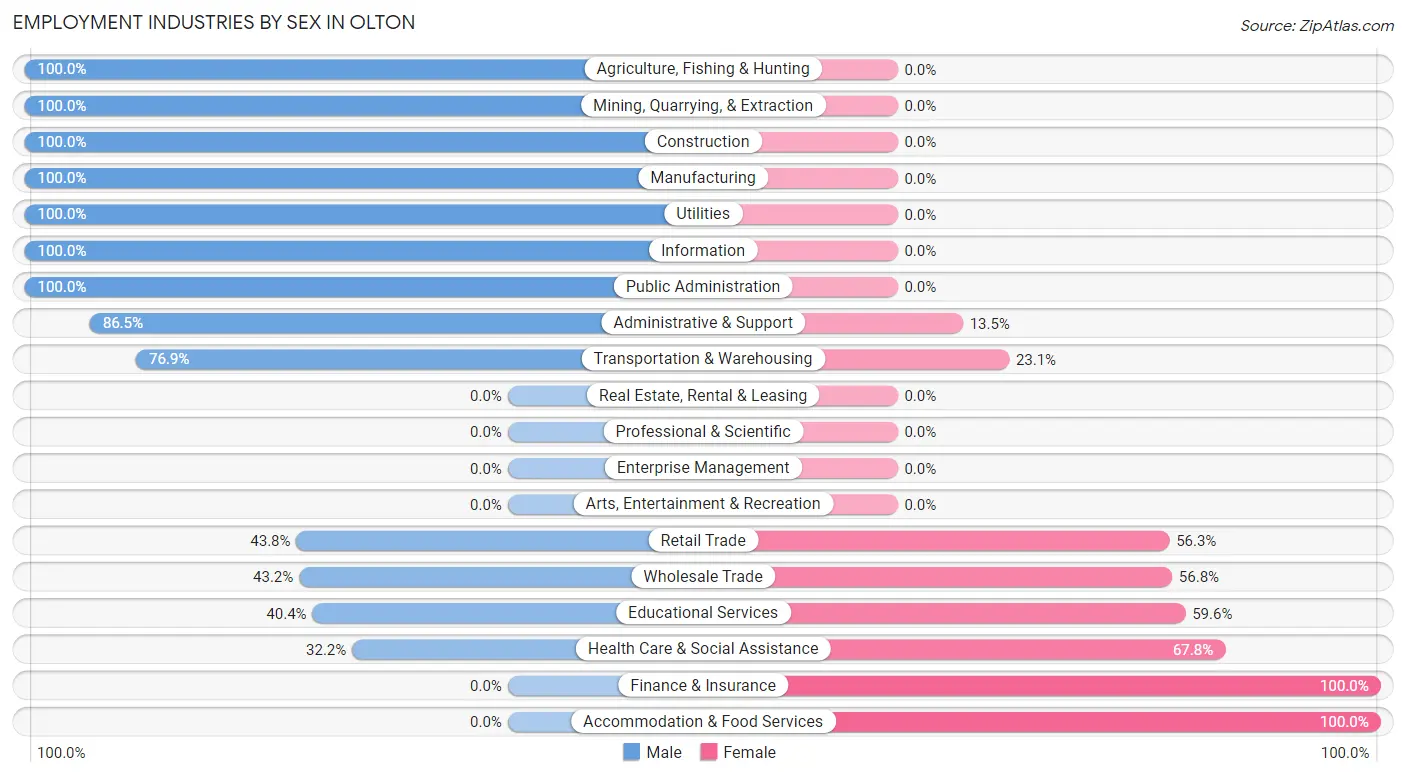
Employment Industries by Sex in Olton
The Olton industries that see more men than women are Agriculture, Fishing & Hunting (100.0%), Mining, Quarrying, & Extraction (100.0%), and Construction (100.0%), whereas the industries that tend to have a higher number of women are Finance & Insurance (100.0%), Accommodation & Food Services (100.0%), and Health Care & Social Assistance (67.8%).
| Industry | Male | Female |
| Agriculture, Fishing & Hunting | 97 (100.0%) | 0 (0.0%) |
| Mining, Quarrying, & Extraction | 9 (100.0%) | 0 (0.0%) |
| Construction | 79 (100.0%) | 0 (0.0%) |
| Manufacturing | 31 (100.0%) | 0 (0.0%) |
| Wholesale Trade | 19 (43.2%) | 25 (56.8%) |
| Retail Trade | 7 (43.8%) | 9 (56.2%) |
| Transportation & Warehousing | 30 (76.9%) | 9 (23.1%) |
| Utilities | 14 (100.0%) | 0 (0.0%) |
| Information | 2 (100.0%) | 0 (0.0%) |
| Finance & Insurance | 0 (0.0%) | 24 (100.0%) |
| Real Estate, Rental & Leasing | 0 (0.0%) | 0 (0.0%) |
| Professional & Scientific | 0 (0.0%) | 0 (0.0%) |
| Enterprise Management | 0 (0.0%) | 0 (0.0%) |
| Administrative & Support | 32 (86.5%) | 5 (13.5%) |
| Educational Services | 19 (40.4%) | 28 (59.6%) |
| Health Care & Social Assistance | 48 (32.2%) | 101 (67.8%) |
| Arts, Entertainment & Recreation | 0 (0.0%) | 0 (0.0%) |
| Accommodation & Food Services | 0 (0.0%) | 28 (100.0%) |
| Public Administration | 5 (100.0%) | 0 (0.0%) |
| Total | 416 (62.2%) | 253 (37.8%) |
Education in Olton
School Enrollment in Olton
The most common levels of schooling among the 387 students in Olton are middle school (111 | 28.7%), elementary school (98 | 25.3%), and high school (98 | 25.3%).
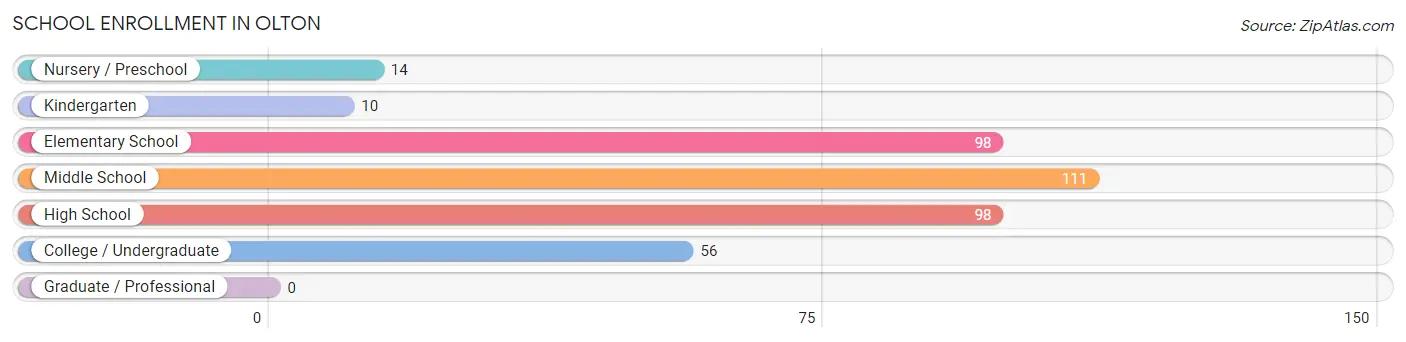
| School Level | # Students | % Students |
| Nursery / Preschool | 14 | 3.6% |
| Kindergarten | 10 | 2.6% |
| Elementary School | 98 | 25.3% |
| Middle School | 111 | 28.7% |
| High School | 98 | 25.3% |
| College / Undergraduate | 56 | 14.5% |
| Graduate / Professional | 0 | 0.0% |
| Total | 387 | 100.0% |
School Enrollment by Age by Funding Source in Olton
Out of a total of 387 students who are enrolled in schools in Olton, 13 (3.4%) attend a private institution, while the remaining 374 (96.6%) are enrolled in public schools. The age group of 35 years and over has the highest likelihood of being enrolled in private schools, with 7 (100.0% in the age bracket) enrolled. Conversely, the age group of 5 to 9 year old has the lowest likelihood of being enrolled in a private school, with 110 (100.0% in the age bracket) attending a public institution.
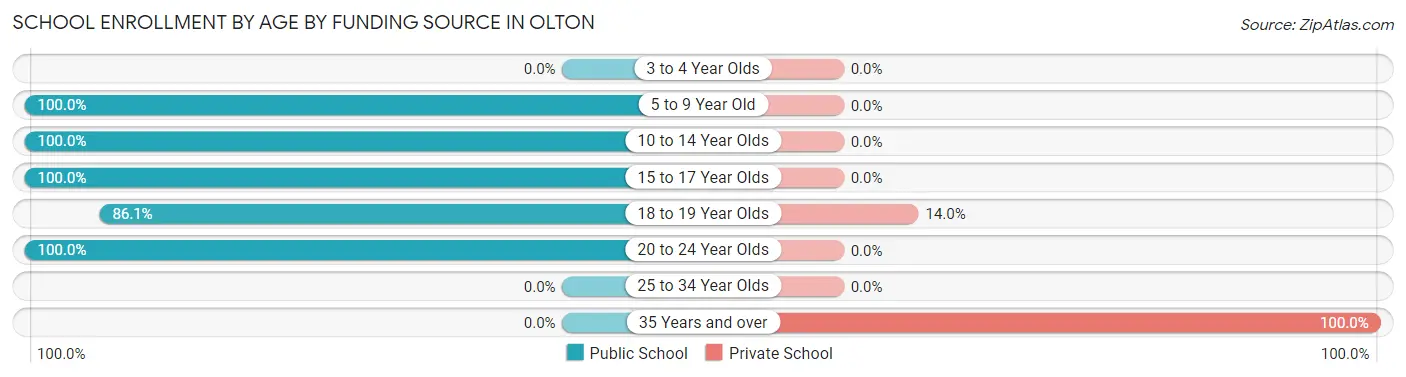
| Age Bracket | Public School | Private School |
| 3 to 4 Year Olds | 0 (0.0%) | 0 (0.0%) |
| 5 to 9 Year Old | 110 (100.0%) | 0 (0.0%) |
| 10 to 14 Year Olds | 126 (100.0%) | 0 (0.0%) |
| 15 to 17 Year Olds | 71 (100.0%) | 0 (0.0%) |
| 18 to 19 Year Olds | 37 (86.1%) | 6 (14.0%) |
| 20 to 24 Year Olds | 30 (100.0%) | 0 (0.0%) |
| 25 to 34 Year Olds | 0 (0.0%) | 0 (0.0%) |
| 35 Years and over | 0 (0.0%) | 7 (100.0%) |
| Total | 374 (96.6%) | 13 (3.4%) |
Educational Attainment by Field of Study in Olton
Physical & health sciences (28 | 21.9%), engineering (21 | 16.4%), education (21 | 16.4%), bio, nature & agricultural (18 | 14.1%), and arts & humanities (14 | 10.9%) are the most common fields of study among 128 individuals in Olton who have obtained a bachelor's degree or higher.
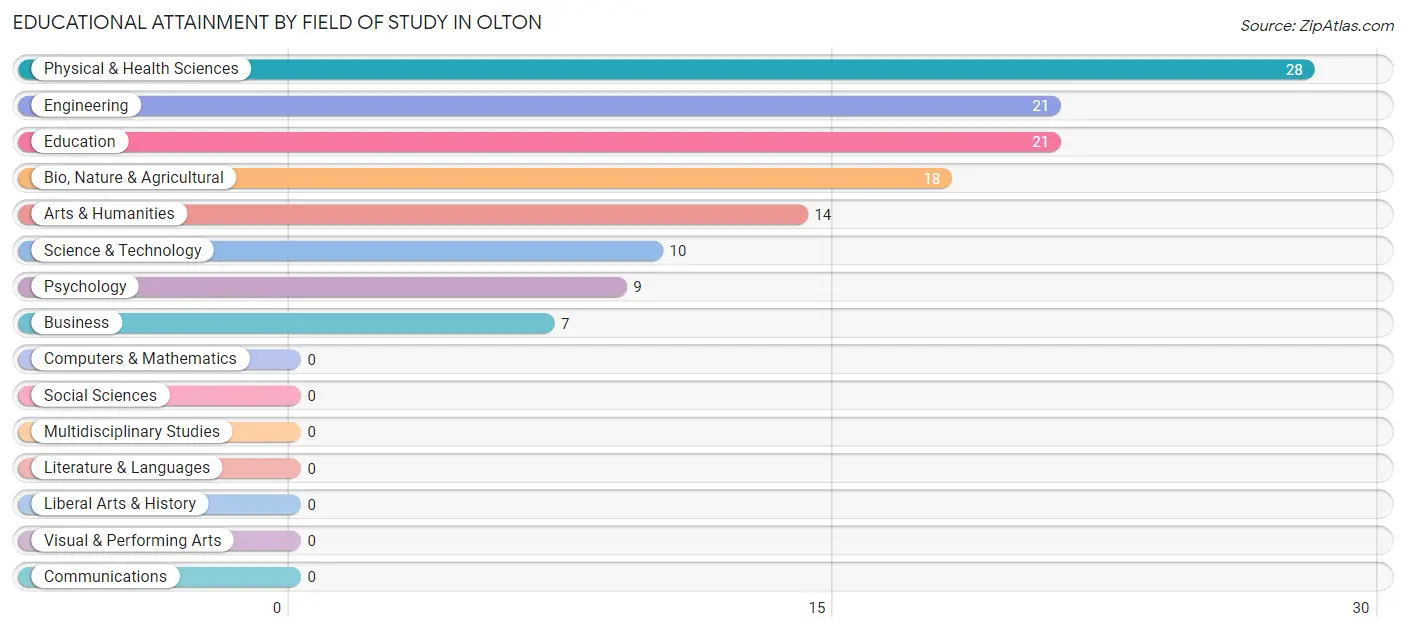
| Field of Study | # Graduates | % Graduates |
| Computers & Mathematics | 0 | 0.0% |
| Bio, Nature & Agricultural | 18 | 14.1% |
| Physical & Health Sciences | 28 | 21.9% |
| Psychology | 9 | 7.0% |
| Social Sciences | 0 | 0.0% |
| Engineering | 21 | 16.4% |
| Multidisciplinary Studies | 0 | 0.0% |
| Science & Technology | 10 | 7.8% |
| Business | 7 | 5.5% |
| Education | 21 | 16.4% |
| Literature & Languages | 0 | 0.0% |
| Liberal Arts & History | 0 | 0.0% |
| Visual & Performing Arts | 0 | 0.0% |
| Communications | 0 | 0.0% |
| Arts & Humanities | 14 | 10.9% |
| Total | 128 | 100.0% |
Transportation & Commute in Olton
Vehicle Availability by Sex in Olton
The most prevalent vehicle ownership categories in Olton are males with 2 vehicles (168, accounting for 40.4%) and females with 2 vehicles (107, making up 69.4%).
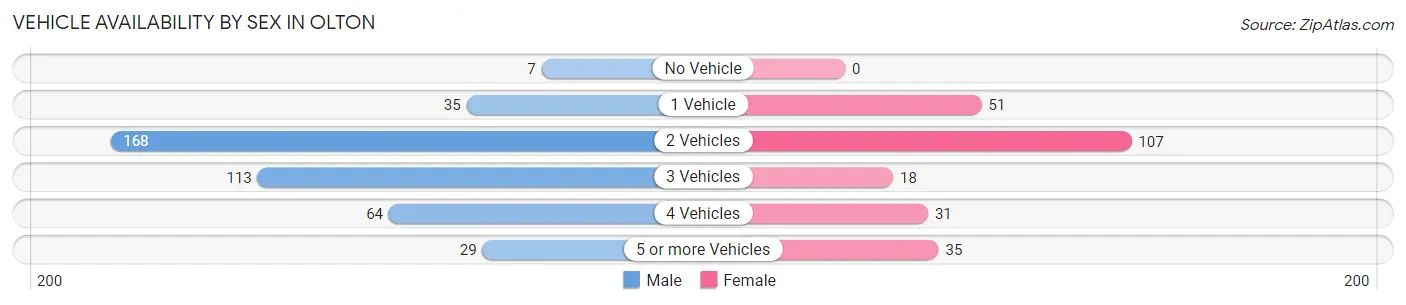
| Vehicles Available | Male | Female |
| No Vehicle | 7 (1.7%) | 0 (0.0%) |
| 1 Vehicle | 35 (8.4%) | 51 (21.1%) |
| 2 Vehicles | 168 (40.4%) | 107 (44.2%) |
| 3 Vehicles | 113 (27.2%) | 18 (7.4%) |
| 4 Vehicles | 64 (15.4%) | 31 (12.8%) |
| 5 or more Vehicles | 29 (7.0%) | 35 (14.5%) |
| Total | 416 (100.0%) | 242 (100.0%) |
Commute Time in Olton
The most frequently occuring commute durations in Olton are 5 to 9 minutes (169 commuters, 27.9%), less than 5 minutes (156 commuters, 25.8%), and 10 to 14 minutes (76 commuters, 12.6%).
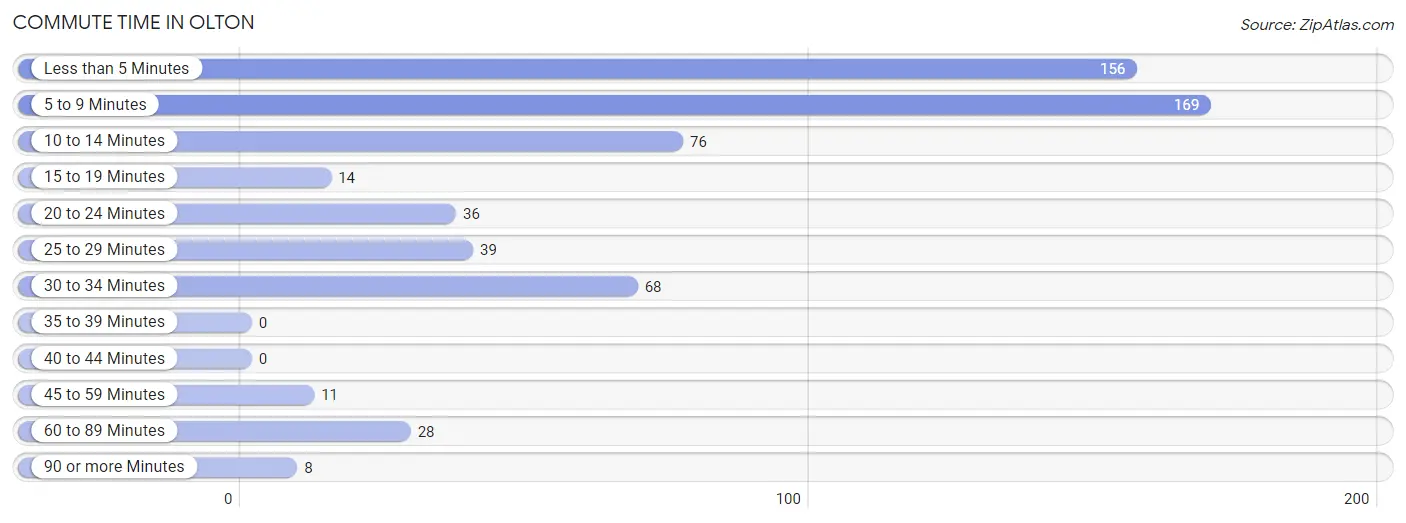
| Commute Time | # Commuters | % Commuters |
| Less than 5 Minutes | 156 | 25.8% |
| 5 to 9 Minutes | 169 | 27.9% |
| 10 to 14 Minutes | 76 | 12.6% |
| 15 to 19 Minutes | 14 | 2.3% |
| 20 to 24 Minutes | 36 | 5.9% |
| 25 to 29 Minutes | 39 | 6.5% |
| 30 to 34 Minutes | 68 | 11.2% |
| 35 to 39 Minutes | 0 | 0.0% |
| 40 to 44 Minutes | 0 | 0.0% |
| 45 to 59 Minutes | 11 | 1.8% |
| 60 to 89 Minutes | 28 | 4.6% |
| 90 or more Minutes | 8 | 1.3% |
Commute Time by Sex in Olton
The most common commute times in Olton are less than 5 minutes (115 commuters, 29.2%) for males and 5 to 9 minutes (57 commuters, 27.0%) for females.
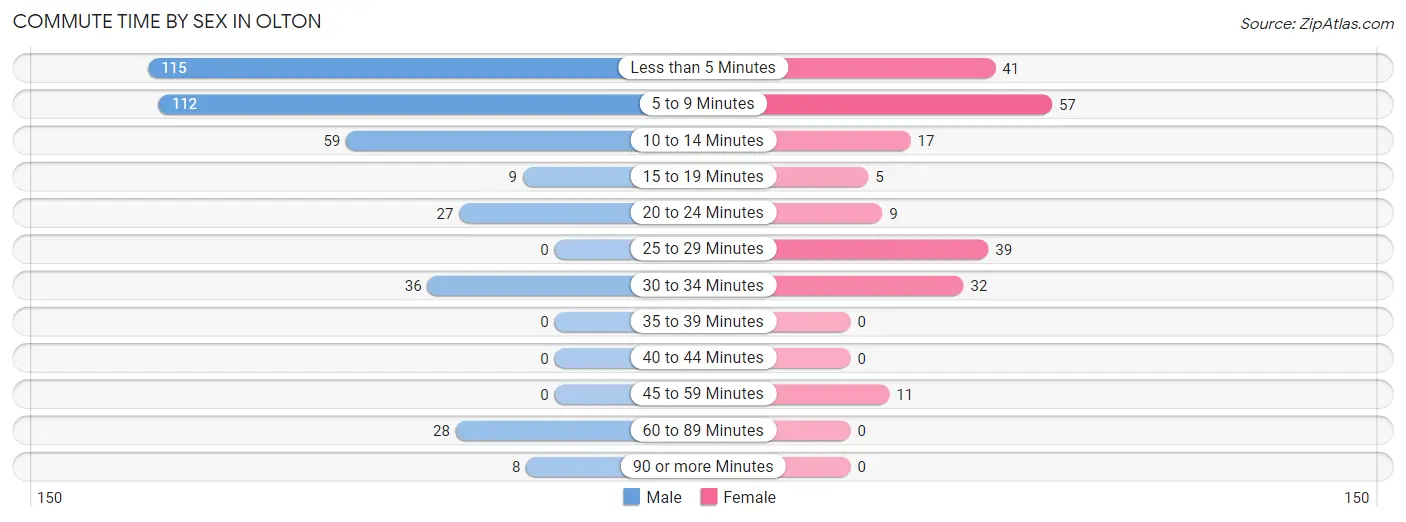
| Commute Time | Male | Female |
| Less than 5 Minutes | 115 (29.2%) | 41 (19.4%) |
| 5 to 9 Minutes | 112 (28.4%) | 57 (27.0%) |
| 10 to 14 Minutes | 59 (15.0%) | 17 (8.1%) |
| 15 to 19 Minutes | 9 (2.3%) | 5 (2.4%) |
| 20 to 24 Minutes | 27 (6.9%) | 9 (4.3%) |
| 25 to 29 Minutes | 0 (0.0%) | 39 (18.5%) |
| 30 to 34 Minutes | 36 (9.1%) | 32 (15.2%) |
| 35 to 39 Minutes | 0 (0.0%) | 0 (0.0%) |
| 40 to 44 Minutes | 0 (0.0%) | 0 (0.0%) |
| 45 to 59 Minutes | 0 (0.0%) | 11 (5.2%) |
| 60 to 89 Minutes | 28 (7.1%) | 0 (0.0%) |
| 90 or more Minutes | 8 (2.0%) | 0 (0.0%) |
Time of Departure to Work by Sex in Olton
The most frequent times of departure to work in Olton are 7:00 AM to 7:29 AM (87, 22.1%) for males and 7:00 AM to 7:29 AM (83, 39.3%) for females.
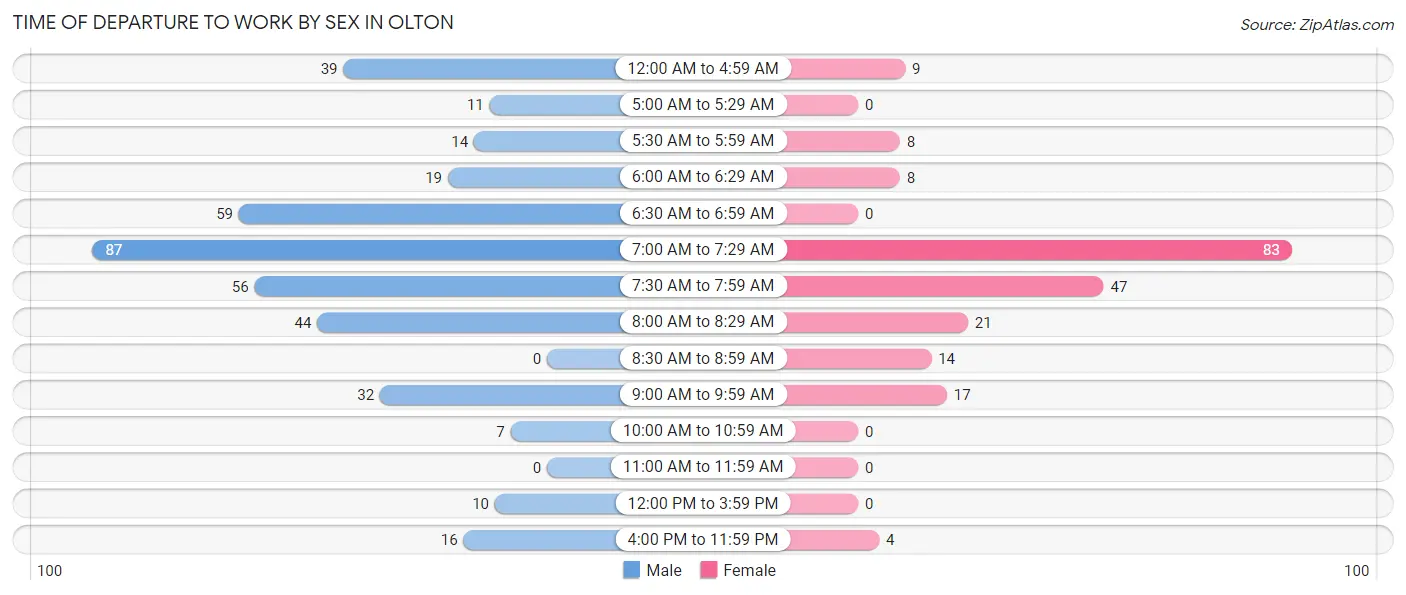
| Time of Departure | Male | Female |
| 12:00 AM to 4:59 AM | 39 (9.9%) | 9 (4.3%) |
| 5:00 AM to 5:29 AM | 11 (2.8%) | 0 (0.0%) |
| 5:30 AM to 5:59 AM | 14 (3.5%) | 8 (3.8%) |
| 6:00 AM to 6:29 AM | 19 (4.8%) | 8 (3.8%) |
| 6:30 AM to 6:59 AM | 59 (15.0%) | 0 (0.0%) |
| 7:00 AM to 7:29 AM | 87 (22.1%) | 83 (39.3%) |
| 7:30 AM to 7:59 AM | 56 (14.2%) | 47 (22.3%) |
| 8:00 AM to 8:29 AM | 44 (11.2%) | 21 (10.0%) |
| 8:30 AM to 8:59 AM | 0 (0.0%) | 14 (6.6%) |
| 9:00 AM to 9:59 AM | 32 (8.1%) | 17 (8.1%) |
| 10:00 AM to 10:59 AM | 7 (1.8%) | 0 (0.0%) |
| 11:00 AM to 11:59 AM | 0 (0.0%) | 0 (0.0%) |
| 12:00 PM to 3:59 PM | 10 (2.5%) | 0 (0.0%) |
| 4:00 PM to 11:59 PM | 16 (4.1%) | 4 (1.9%) |
| Total | 394 (100.0%) | 211 (100.0%) |
Housing Occupancy in Olton
Occupancy by Ownership in Olton
Of the total 543 dwellings in Olton, owner-occupied units account for 392 (72.2%), while renter-occupied units make up 151 (27.8%).
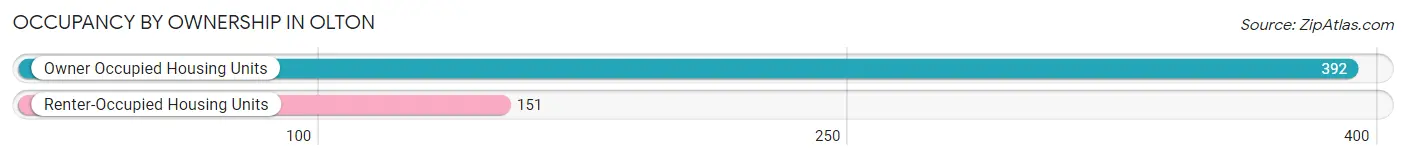
| Occupancy | # Housing Units | % Housing Units |
| Owner Occupied Housing Units | 392 | 72.2% |
| Renter-Occupied Housing Units | 151 | 27.8% |
| Total Occupied Housing Units | 543 | 100.0% |
Occupancy by Household Size in Olton
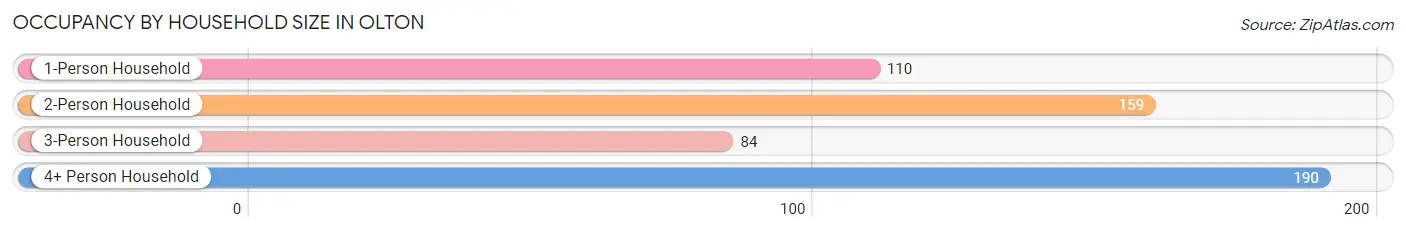
| Household Size | # Housing Units | % Housing Units |
| 1-Person Household | 110 | 20.3% |
| 2-Person Household | 159 | 29.3% |
| 3-Person Household | 84 | 15.5% |
| 4+ Person Household | 190 | 35.0% |
| Total Housing Units | 543 | 100.0% |
Occupancy by Ownership by Household Size in Olton
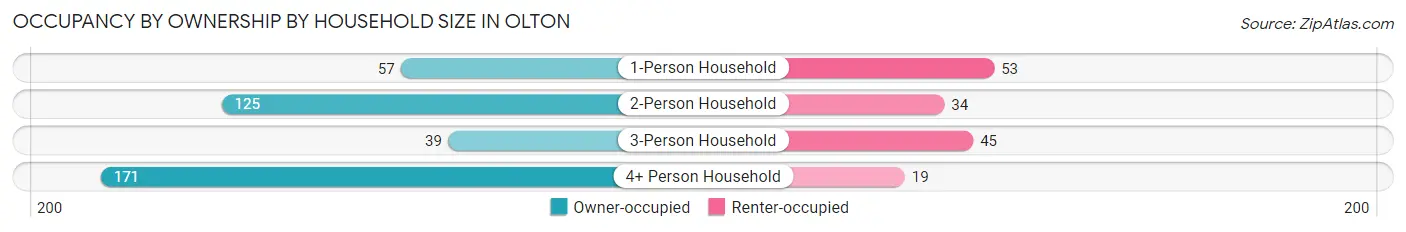
| Household Size | Owner-occupied | Renter-occupied |
| 1-Person Household | 57 (51.8%) | 53 (48.2%) |
| 2-Person Household | 125 (78.6%) | 34 (21.4%) |
| 3-Person Household | 39 (46.4%) | 45 (53.6%) |
| 4+ Person Household | 171 (90.0%) | 19 (10.0%) |
| Total Housing Units | 392 (72.2%) | 151 (27.8%) |
Occupancy by Educational Attainment in Olton
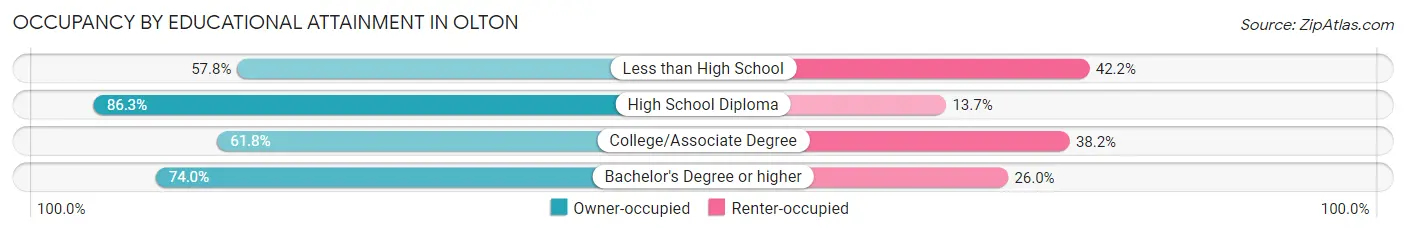
| Household Size | Owner-occupied | Renter-occupied |
| Less than High School | 59 (57.8%) | 43 (42.2%) |
| High School Diploma | 182 (86.3%) | 29 (13.7%) |
| College/Associate Degree | 97 (61.8%) | 60 (38.2%) |
| Bachelor's Degree or higher | 54 (74.0%) | 19 (26.0%) |
Occupancy by Age of Householder in Olton
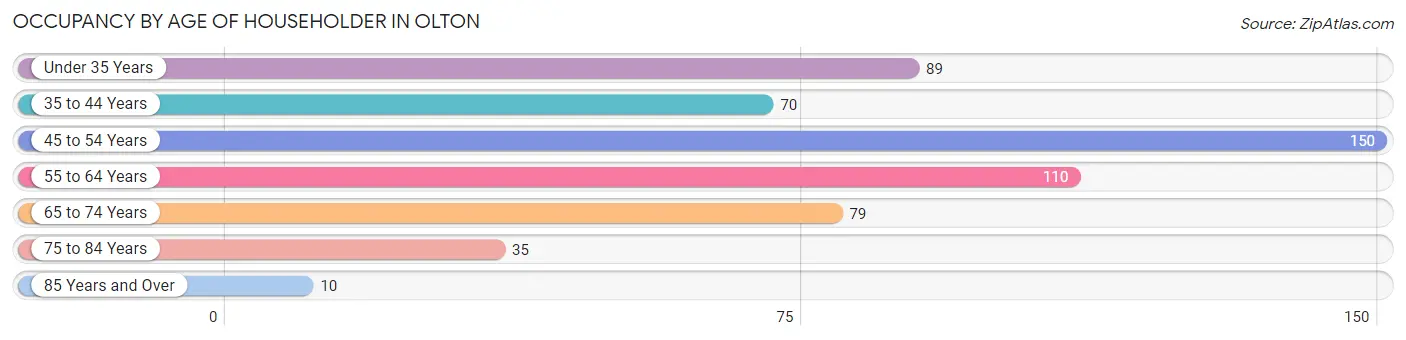
| Age Bracket | # Households | % Households |
| Under 35 Years | 89 | 16.4% |
| 35 to 44 Years | 70 | 12.9% |
| 45 to 54 Years | 150 | 27.6% |
| 55 to 64 Years | 110 | 20.3% |
| 65 to 74 Years | 79 | 14.5% |
| 75 to 84 Years | 35 | 6.5% |
| 85 Years and Over | 10 | 1.8% |
| Total | 543 | 100.0% |
Housing Finances in Olton
Median Income by Occupancy in Olton
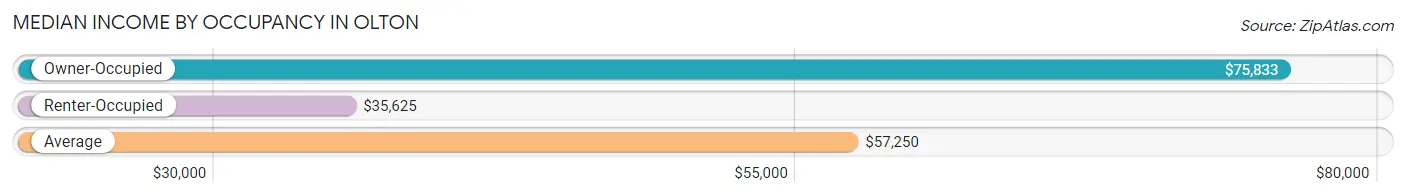
| Occupancy Type | # Households | Median Income |
| Owner-Occupied | 392 (72.2%) | $75,833 |
| Renter-Occupied | 151 (27.8%) | $35,625 |
| Average | 543 (100.0%) | $57,250 |
Occupancy by Householder Income Bracket in Olton
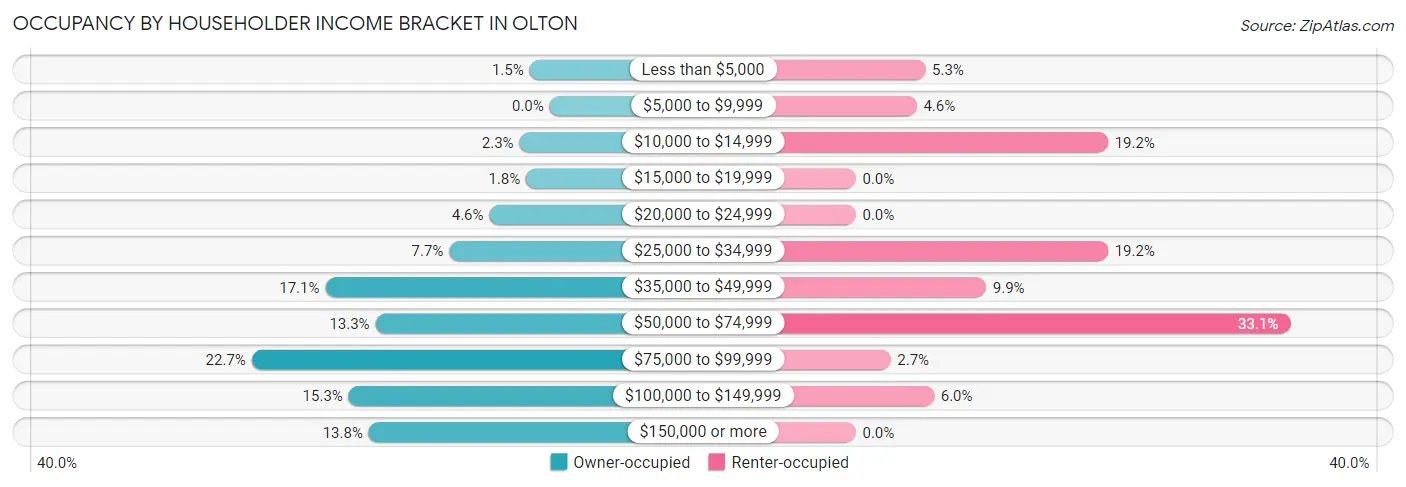
| Income Bracket | Owner-occupied | Renter-occupied |
| Less than $5,000 | 6 (1.5%) | 8 (5.3%) |
| $5,000 to $9,999 | 0 (0.0%) | 7 (4.6%) |
| $10,000 to $14,999 | 9 (2.3%) | 29 (19.2%) |
| $15,000 to $19,999 | 7 (1.8%) | 0 (0.0%) |
| $20,000 to $24,999 | 18 (4.6%) | 0 (0.0%) |
| $25,000 to $34,999 | 30 (7.6%) | 29 (19.2%) |
| $35,000 to $49,999 | 67 (17.1%) | 15 (9.9%) |
| $50,000 to $74,999 | 52 (13.3%) | 50 (33.1%) |
| $75,000 to $99,999 | 89 (22.7%) | 4 (2.6%) |
| $100,000 to $149,999 | 60 (15.3%) | 9 (6.0%) |
| $150,000 or more | 54 (13.8%) | 0 (0.0%) |
| Total | 392 (100.0%) | 151 (100.0%) |
Monthly Housing Cost Tiers in Olton
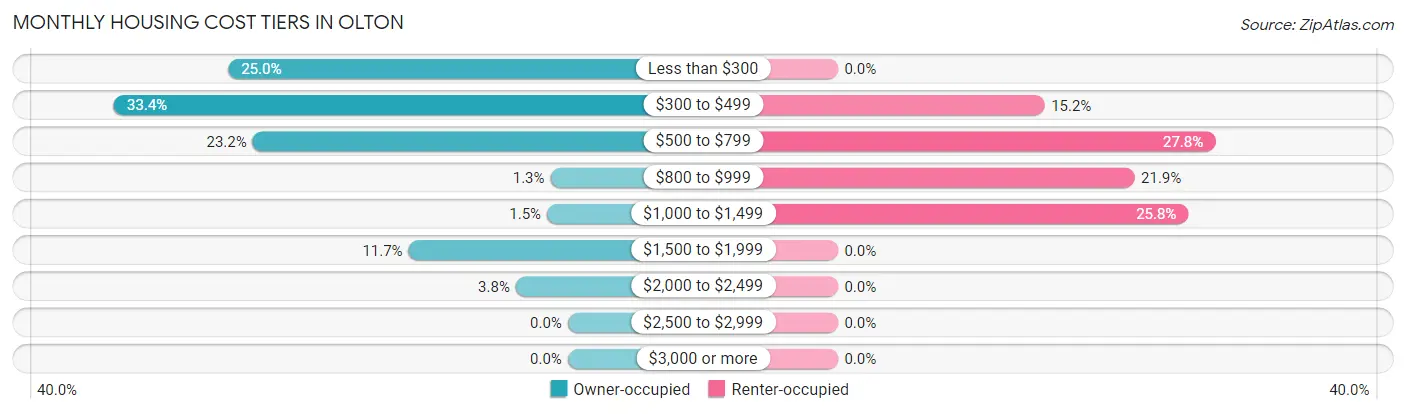
| Monthly Cost | Owner-occupied | Renter-occupied |
| Less than $300 | 98 (25.0%) | 0 (0.0%) |
| $300 to $499 | 131 (33.4%) | 23 (15.2%) |
| $500 to $799 | 91 (23.2%) | 42 (27.8%) |
| $800 to $999 | 5 (1.3%) | 33 (21.8%) |
| $1,000 to $1,499 | 6 (1.5%) | 39 (25.8%) |
| $1,500 to $1,999 | 46 (11.7%) | 0 (0.0%) |
| $2,000 to $2,499 | 15 (3.8%) | 0 (0.0%) |
| $2,500 to $2,999 | 0 (0.0%) | 0 (0.0%) |
| $3,000 or more | 0 (0.0%) | 0 (0.0%) |
| Total | 392 (100.0%) | 151 (100.0%) |
Physical Housing Characteristics in Olton
Housing Structures in Olton
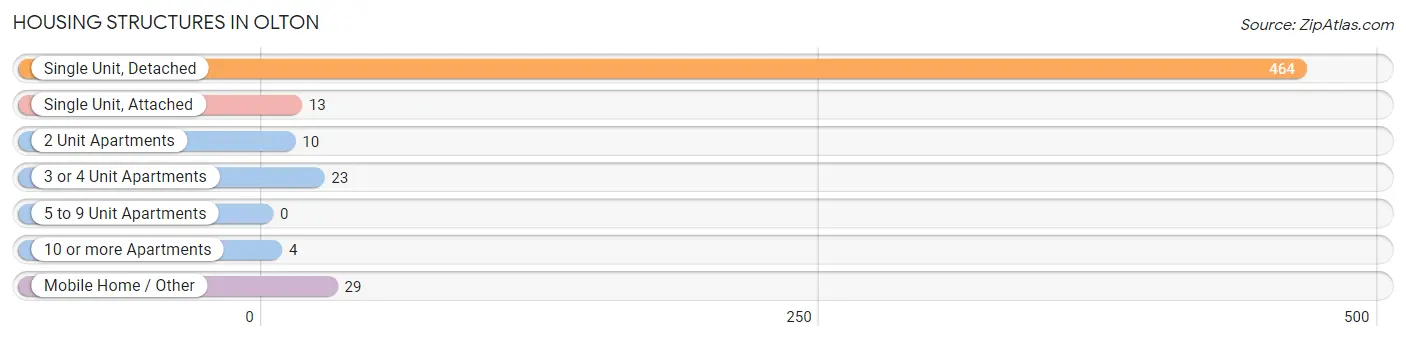
| Structure Type | # Housing Units | % Housing Units |
| Single Unit, Detached | 464 | 85.5% |
| Single Unit, Attached | 13 | 2.4% |
| 2 Unit Apartments | 10 | 1.8% |
| 3 or 4 Unit Apartments | 23 | 4.2% |
| 5 to 9 Unit Apartments | 0 | 0.0% |
| 10 or more Apartments | 4 | 0.7% |
| Mobile Home / Other | 29 | 5.3% |
| Total | 543 | 100.0% |
Housing Structures by Occupancy in Olton
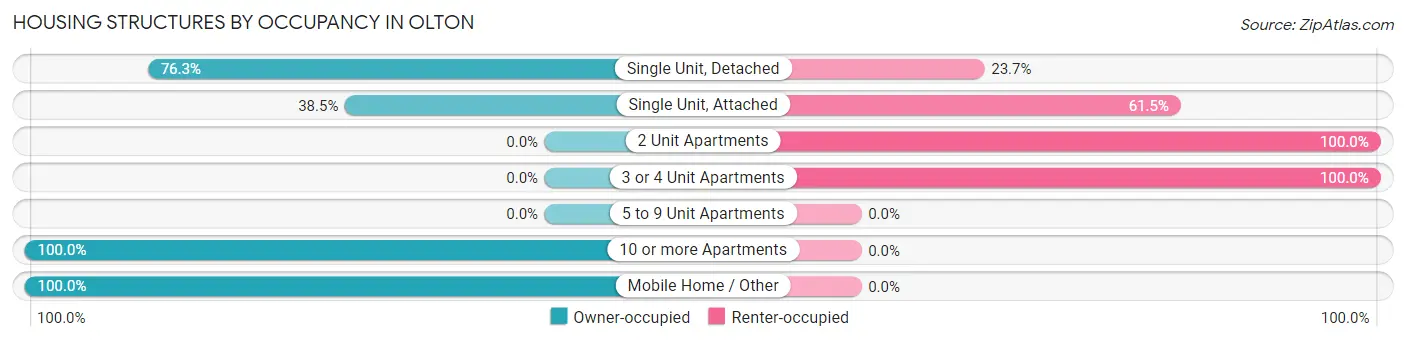
| Structure Type | Owner-occupied | Renter-occupied |
| Single Unit, Detached | 354 (76.3%) | 110 (23.7%) |
| Single Unit, Attached | 5 (38.5%) | 8 (61.5%) |
| 2 Unit Apartments | 0 (0.0%) | 10 (100.0%) |
| 3 or 4 Unit Apartments | 0 (0.0%) | 23 (100.0%) |
| 5 to 9 Unit Apartments | 0 (0.0%) | 0 (0.0%) |
| 10 or more Apartments | 4 (100.0%) | 0 (0.0%) |
| Mobile Home / Other | 29 (100.0%) | 0 (0.0%) |
| Total | 392 (72.2%) | 151 (27.8%) |
Housing Structures by Number of Rooms in Olton
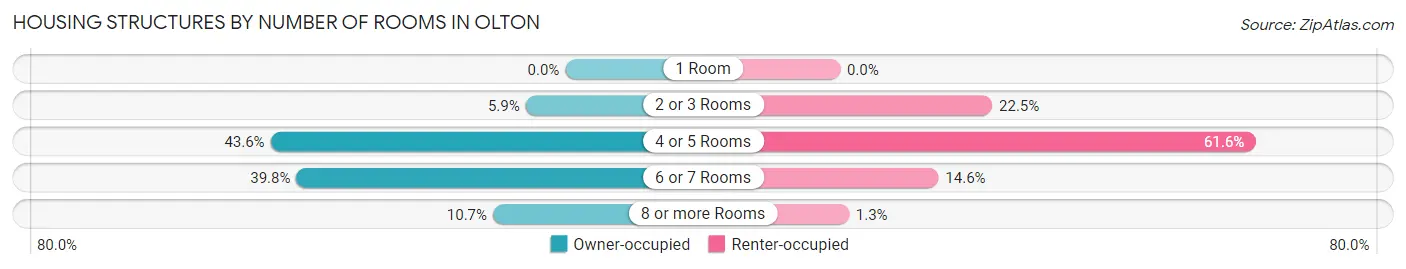
| Number of Rooms | Owner-occupied | Renter-occupied |
| 1 Room | 0 (0.0%) | 0 (0.0%) |
| 2 or 3 Rooms | 23 (5.9%) | 34 (22.5%) |
| 4 or 5 Rooms | 171 (43.6%) | 93 (61.6%) |
| 6 or 7 Rooms | 156 (39.8%) | 22 (14.6%) |
| 8 or more Rooms | 42 (10.7%) | 2 (1.3%) |
| Total | 392 (100.0%) | 151 (100.0%) |
Housing Structure by Heating Type in Olton
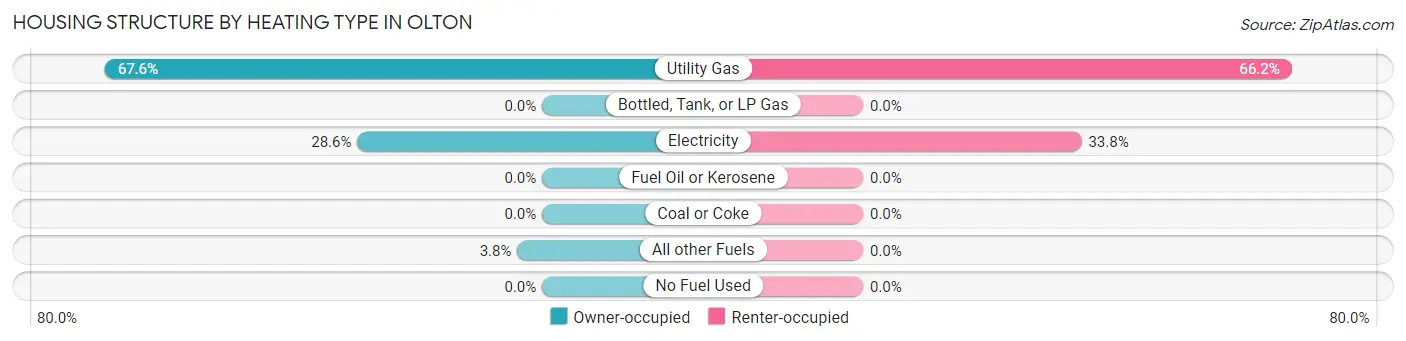
| Heating Type | Owner-occupied | Renter-occupied |
| Utility Gas | 265 (67.6%) | 100 (66.2%) |
| Bottled, Tank, or LP Gas | 0 (0.0%) | 0 (0.0%) |
| Electricity | 112 (28.6%) | 51 (33.8%) |
| Fuel Oil or Kerosene | 0 (0.0%) | 0 (0.0%) |
| Coal or Coke | 0 (0.0%) | 0 (0.0%) |
| All other Fuels | 15 (3.8%) | 0 (0.0%) |
| No Fuel Used | 0 (0.0%) | 0 (0.0%) |
| Total | 392 (100.0%) | 151 (100.0%) |
Household Vehicle Usage in Olton
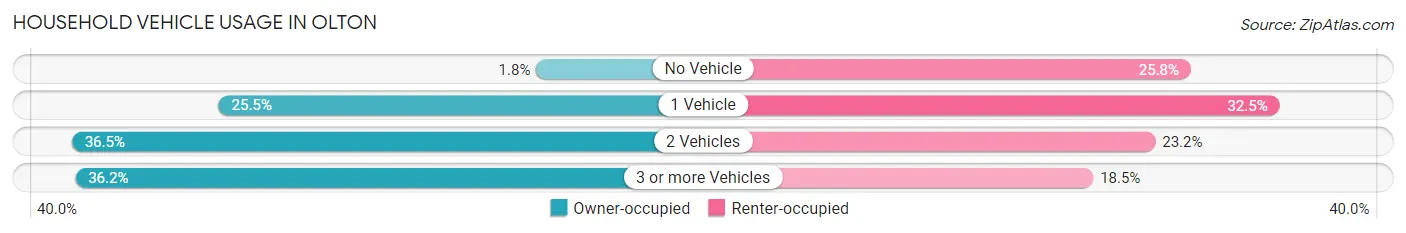
| Vehicles per Household | Owner-occupied | Renter-occupied |
| No Vehicle | 7 (1.8%) | 39 (25.8%) |
| 1 Vehicle | 100 (25.5%) | 49 (32.5%) |
| 2 Vehicles | 143 (36.5%) | 35 (23.2%) |
| 3 or more Vehicles | 142 (36.2%) | 28 (18.5%) |
| Total | 392 (100.0%) | 151 (100.0%) |
Real Estate & Mortgages in Olton
Real Estate and Mortgage Overview in Olton
| Characteristic | Without Mortgage | With Mortgage |
| Housing Units | 321 | 71 |
| Median Property Value | $61,800 | $161,500 |
| Median Household Income | $60,375 | $10 |
| Monthly Housing Costs | $387 | $0 |
| Real Estate Taxes | $566 | $0 |
Property Value by Mortgage Status in Olton
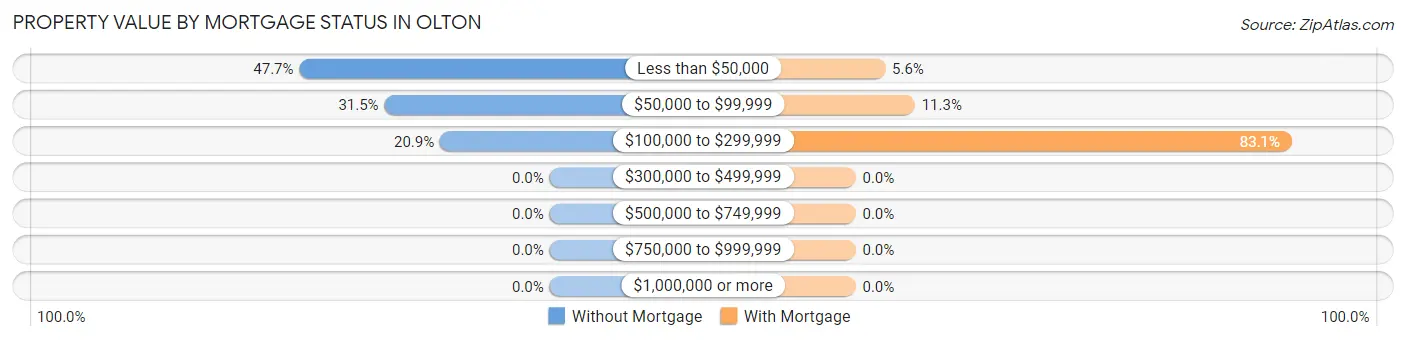
| Property Value | Without Mortgage | With Mortgage |
| Less than $50,000 | 153 (47.7%) | 4 (5.6%) |
| $50,000 to $99,999 | 101 (31.5%) | 8 (11.3%) |
| $100,000 to $299,999 | 67 (20.9%) | 59 (83.1%) |
| $300,000 to $499,999 | 0 (0.0%) | 0 (0.0%) |
| $500,000 to $749,999 | 0 (0.0%) | 0 (0.0%) |
| $750,000 to $999,999 | 0 (0.0%) | 0 (0.0%) |
| $1,000,000 or more | 0 (0.0%) | 0 (0.0%) |
| Total | 321 (100.0%) | 71 (100.0%) |
Household Income by Mortgage Status in Olton
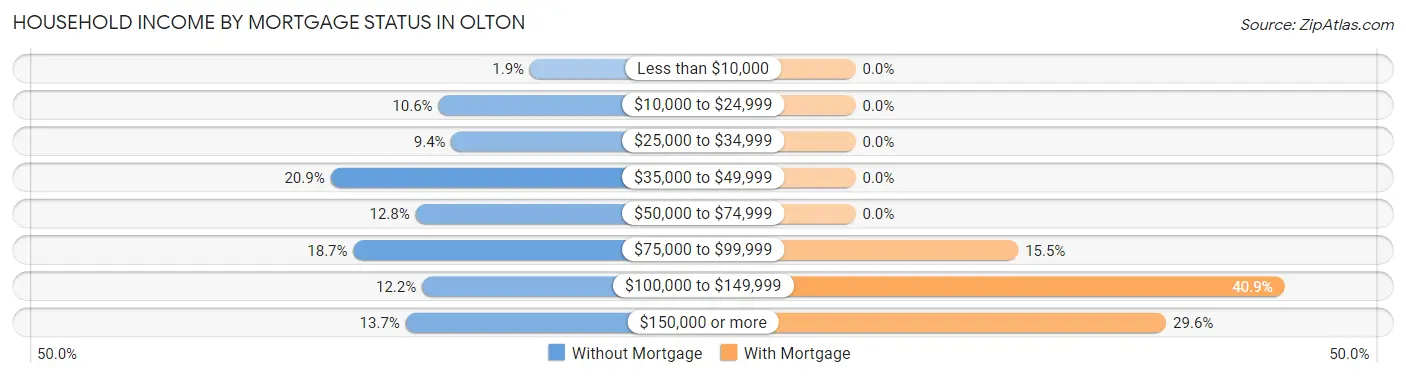
| Household Income | Without Mortgage | With Mortgage |
| Less than $10,000 | 6 (1.9%) | 0 (0.0%) |
| $10,000 to $24,999 | 34 (10.6%) | 0 (0.0%) |
| $25,000 to $34,999 | 30 (9.3%) | 0 (0.0%) |
| $35,000 to $49,999 | 67 (20.9%) | 0 (0.0%) |
| $50,000 to $74,999 | 41 (12.8%) | 0 (0.0%) |
| $75,000 to $99,999 | 60 (18.7%) | 11 (15.5%) |
| $100,000 to $149,999 | 39 (12.1%) | 29 (40.8%) |
| $150,000 or more | 44 (13.7%) | 21 (29.6%) |
| Total | 321 (100.0%) | 71 (100.0%) |
Property Value to Household Income Ratio in Olton
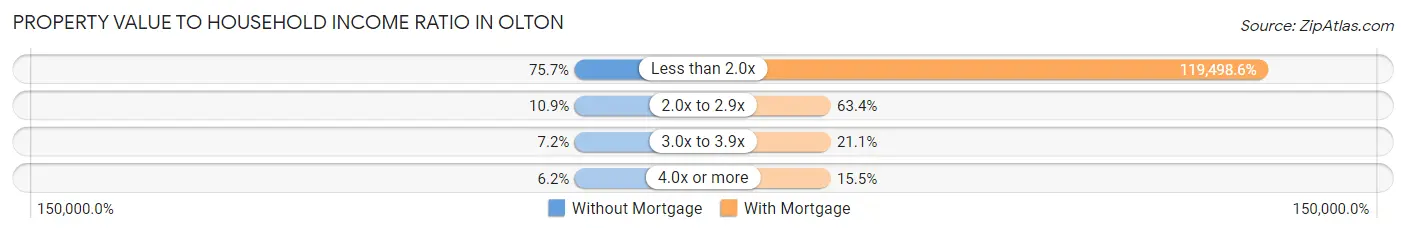
| Value-to-Income Ratio | Without Mortgage | With Mortgage |
| Less than 2.0x | 243 (75.7%) | 84,844 (119,498.6%) |
| 2.0x to 2.9x | 35 (10.9%) | 45 (63.4%) |
| 3.0x to 3.9x | 23 (7.2%) | 15 (21.1%) |
| 4.0x or more | 20 (6.2%) | 11 (15.5%) |
| Total | 321 (100.0%) | 71 (100.0%) |
Real Estate Taxes by Mortgage Status in Olton
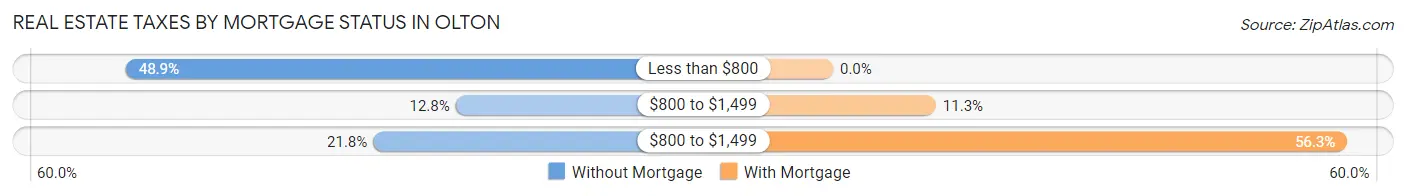
| Property Taxes | Without Mortgage | With Mortgage |
| Less than $800 | 157 (48.9%) | 0 (0.0%) |
| $800 to $1,499 | 41 (12.8%) | 8 (11.3%) |
| $800 to $1,499 | 70 (21.8%) | 40 (56.3%) |
| Total | 321 (100.0%) | 71 (100.0%) |
Health & Disability in Olton
Health Insurance Coverage by Age in Olton
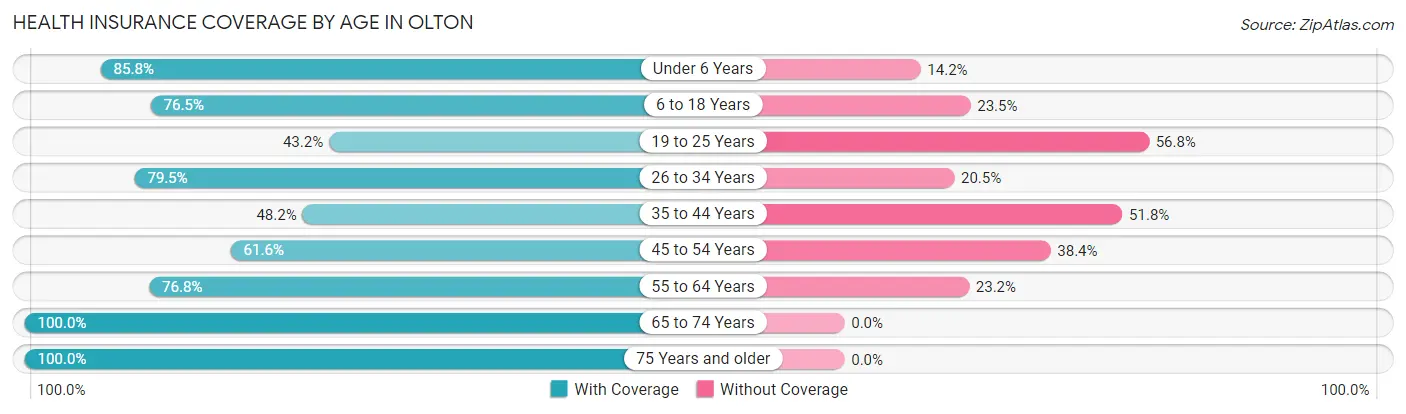
| Age Bracket | With Coverage | Without Coverage |
| Under 6 Years | 133 (85.8%) | 22 (14.2%) |
| 6 to 18 Years | 280 (76.5%) | 86 (23.5%) |
| 19 to 25 Years | 64 (43.2%) | 84 (56.8%) |
| 26 to 34 Years | 101 (79.5%) | 26 (20.5%) |
| 35 to 44 Years | 106 (48.2%) | 114 (51.8%) |
| 45 to 54 Years | 149 (61.6%) | 93 (38.4%) |
| 55 to 64 Years | 152 (76.8%) | 46 (23.2%) |
| 65 to 74 Years | 124 (100.0%) | 0 (0.0%) |
| 75 Years and older | 91 (100.0%) | 0 (0.0%) |
| Total | 1,200 (71.8%) | 471 (28.2%) |
Health Insurance Coverage by Citizenship Status in Olton
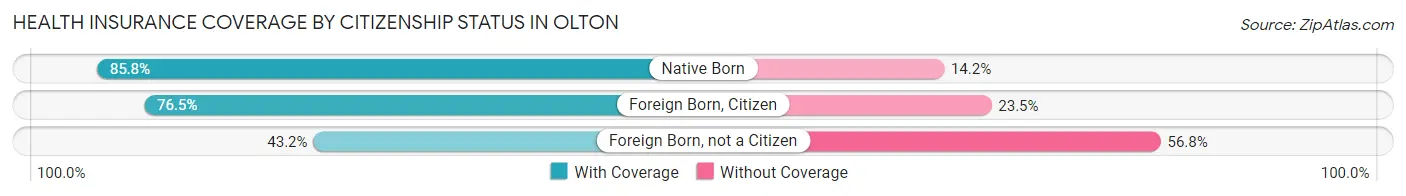
| Citizenship Status | With Coverage | Without Coverage |
| Native Born | 133 (85.8%) | 22 (14.2%) |
| Foreign Born, Citizen | 280 (76.5%) | 86 (23.5%) |
| Foreign Born, not a Citizen | 64 (43.2%) | 84 (56.8%) |
Health Insurance Coverage by Household Income in Olton
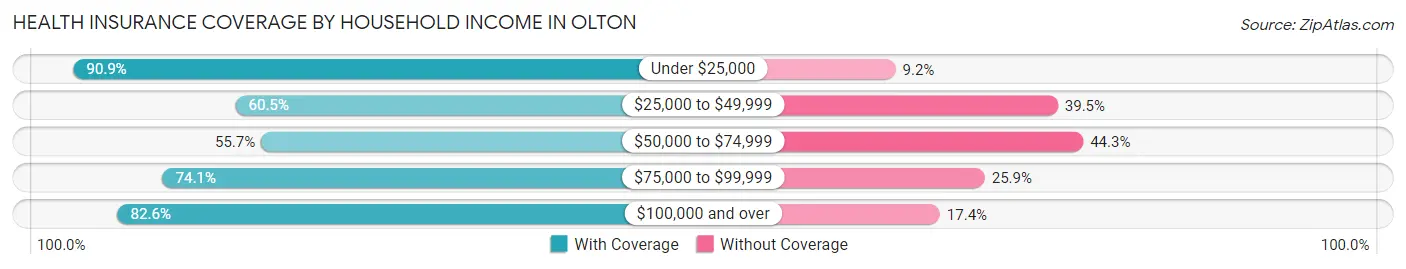
| Household Income | With Coverage | Without Coverage |
| Under $25,000 | 129 (90.8%) | 13 (9.1%) |
| $25,000 to $49,999 | 211 (60.5%) | 138 (39.5%) |
| $50,000 to $74,999 | 166 (55.7%) | 132 (44.3%) |
| $75,000 to $99,999 | 301 (74.1%) | 105 (25.9%) |
| $100,000 and over | 393 (82.6%) | 83 (17.4%) |
Public vs Private Health Insurance Coverage by Age in Olton
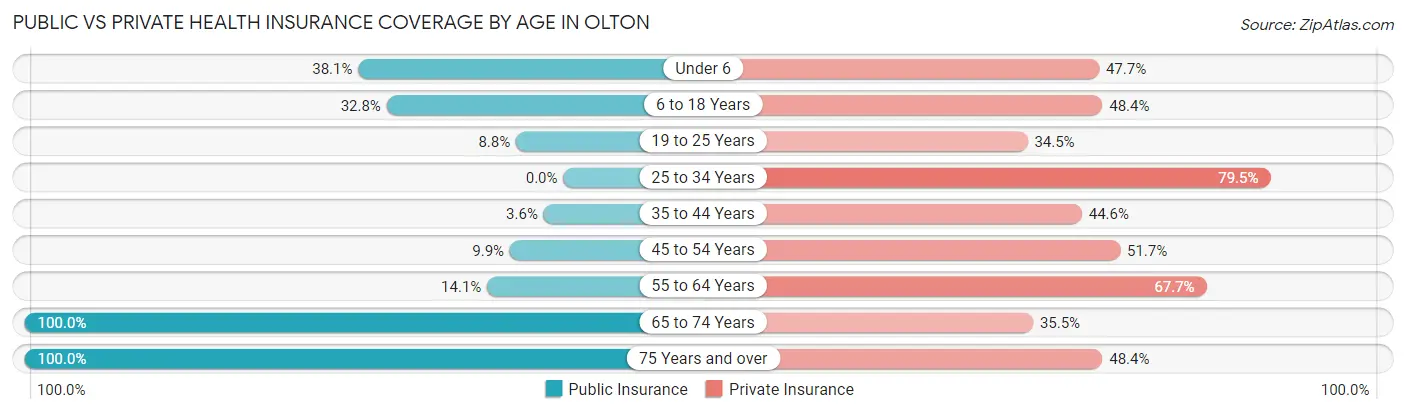
| Age Bracket | Public Insurance | Private Insurance |
| Under 6 | 59 (38.1%) | 74 (47.7%) |
| 6 to 18 Years | 120 (32.8%) | 177 (48.4%) |
| 19 to 25 Years | 13 (8.8%) | 51 (34.5%) |
| 25 to 34 Years | 0 (0.0%) | 101 (79.5%) |
| 35 to 44 Years | 8 (3.6%) | 98 (44.6%) |
| 45 to 54 Years | 24 (9.9%) | 125 (51.6%) |
| 55 to 64 Years | 28 (14.1%) | 134 (67.7%) |
| 65 to 74 Years | 124 (100.0%) | 44 (35.5%) |
| 75 Years and over | 91 (100.0%) | 44 (48.3%) |
| Total | 467 (28.0%) | 848 (50.7%) |
Disability Status by Sex by Age in Olton
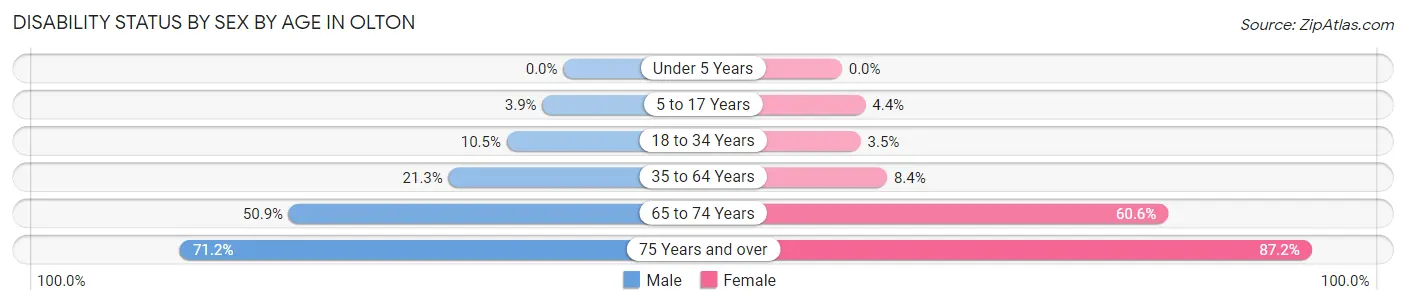
| Age Bracket | Male | Female |
| Under 5 Years | 0 (0.0%) | 0 (0.0%) |
| 5 to 17 Years | 5 (3.9%) | 8 (4.4%) |
| 18 to 34 Years | 19 (10.5%) | 6 (3.5%) |
| 35 to 64 Years | 72 (21.3%) | 27 (8.4%) |
| 65 to 74 Years | 27 (50.9%) | 43 (60.6%) |
| 75 Years and over | 37 (71.2%) | 34 (87.2%) |
Disability Class by Sex by Age in Olton
Disability Class: Hearing Difficulty
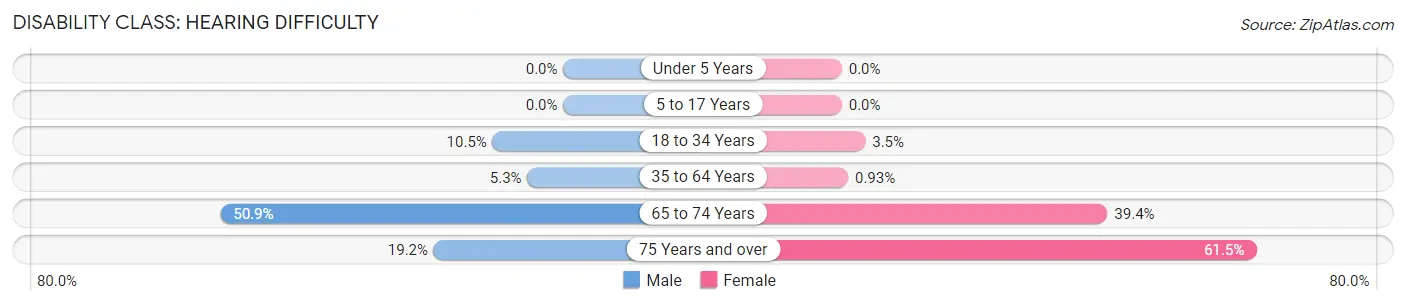
| Age Bracket | Male | Female |
| Under 5 Years | 0 (0.0%) | 0 (0.0%) |
| 5 to 17 Years | 0 (0.0%) | 0 (0.0%) |
| 18 to 34 Years | 19 (10.5%) | 6 (3.5%) |
| 35 to 64 Years | 18 (5.3%) | 3 (0.9%) |
| 65 to 74 Years | 27 (50.9%) | 28 (39.4%) |
| 75 Years and over | 10 (19.2%) | 24 (61.5%) |
Disability Class: Vision Difficulty
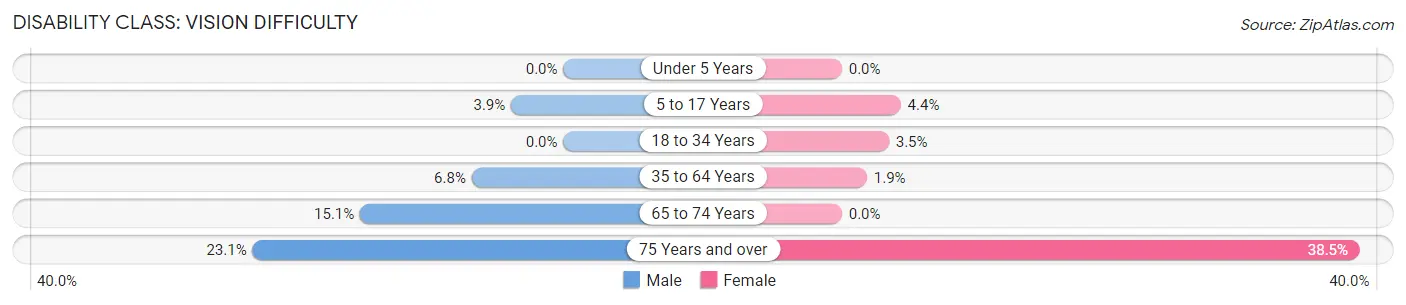
| Age Bracket | Male | Female |
| Under 5 Years | 0 (0.0%) | 0 (0.0%) |
| 5 to 17 Years | 5 (3.9%) | 8 (4.4%) |
| 18 to 34 Years | 0 (0.0%) | 6 (3.5%) |
| 35 to 64 Years | 23 (6.8%) | 6 (1.9%) |
| 65 to 74 Years | 8 (15.1%) | 0 (0.0%) |
| 75 Years and over | 12 (23.1%) | 15 (38.5%) |
Disability Class: Cognitive Difficulty
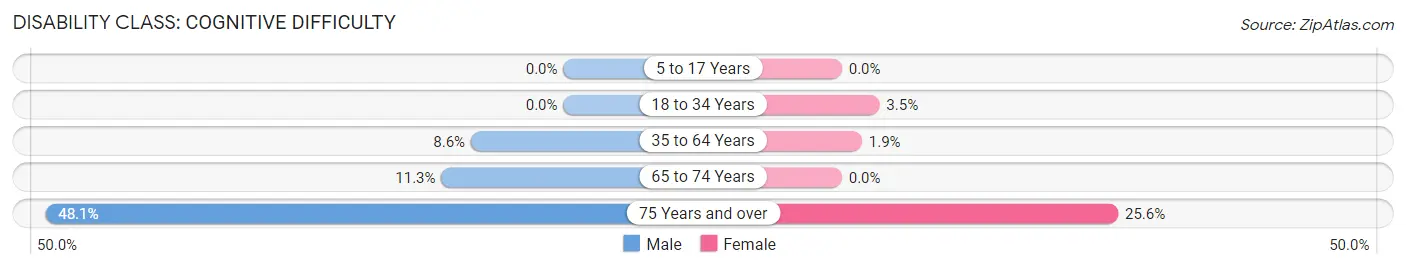
| Age Bracket | Male | Female |
| 5 to 17 Years | 0 (0.0%) | 0 (0.0%) |
| 18 to 34 Years | 0 (0.0%) | 6 (3.5%) |
| 35 to 64 Years | 29 (8.6%) | 6 (1.9%) |
| 65 to 74 Years | 6 (11.3%) | 0 (0.0%) |
| 75 Years and over | 25 (48.1%) | 10 (25.6%) |
Disability Class: Ambulatory Difficulty
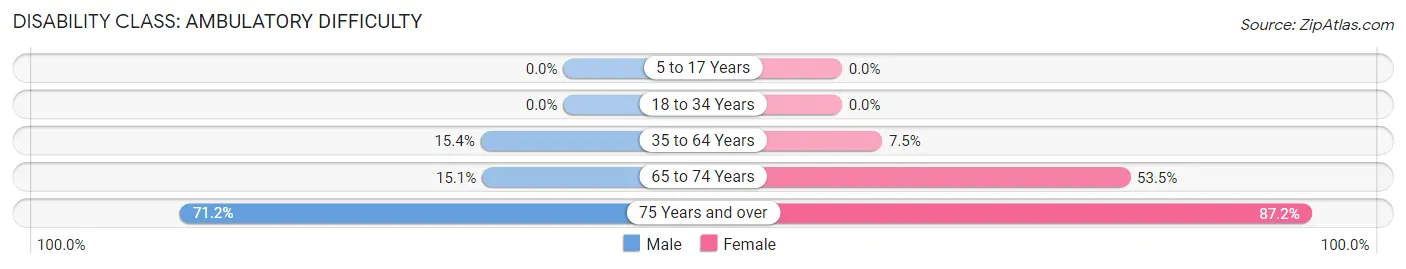
| Age Bracket | Male | Female |
| 5 to 17 Years | 0 (0.0%) | 0 (0.0%) |
| 18 to 34 Years | 0 (0.0%) | 0 (0.0%) |
| 35 to 64 Years | 52 (15.4%) | 24 (7.4%) |
| 65 to 74 Years | 8 (15.1%) | 38 (53.5%) |
| 75 Years and over | 37 (71.2%) | 34 (87.2%) |
Disability Class: Self-Care Difficulty
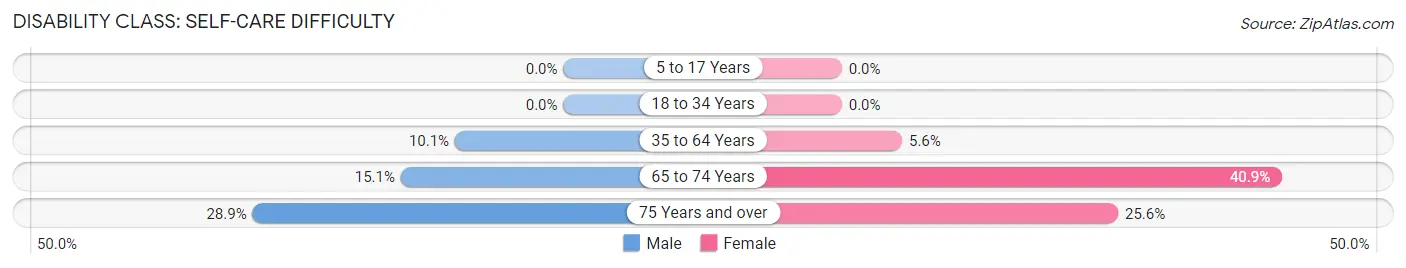
| Age Bracket | Male | Female |
| 5 to 17 Years | 0 (0.0%) | 0 (0.0%) |
| 18 to 34 Years | 0 (0.0%) | 0 (0.0%) |
| 35 to 64 Years | 34 (10.1%) | 18 (5.6%) |
| 65 to 74 Years | 8 (15.1%) | 29 (40.8%) |
| 75 Years and over | 15 (28.8%) | 10 (25.6%) |
Technology Access in Olton
Computing Device Access in Olton
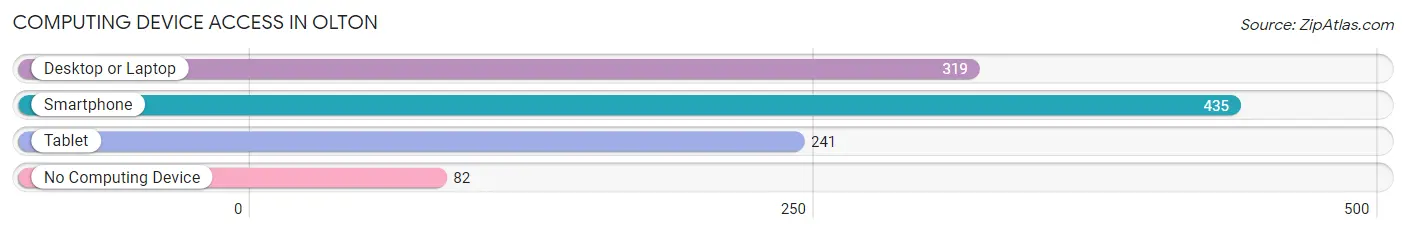
| Device Type | # Households | % Households |
| Desktop or Laptop | 319 | 58.8% |
| Smartphone | 435 | 80.1% |
| Tablet | 241 | 44.4% |
| No Computing Device | 82 | 15.1% |
| Total | 543 | 100.0% |
Internet Access in Olton
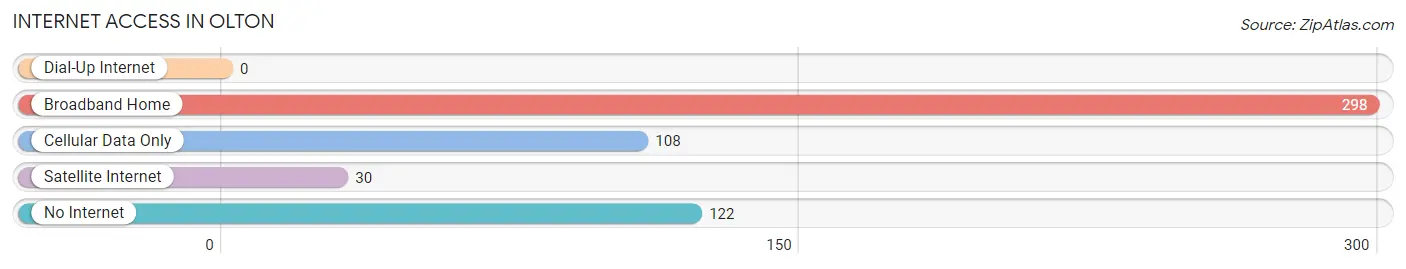
| Internet Type | # Households | % Households |
| Dial-Up Internet | 0 | 0.0% |
| Broadband Home | 298 | 54.9% |
| Cellular Data Only | 108 | 19.9% |
| Satellite Internet | 30 | 5.5% |
| No Internet | 122 | 22.5% |
| Total | 543 | 100.0% |
Olton Summary
Olton, Texas is a small town located in Lamb County, Texas. It is situated in the Texas Panhandle, approximately 30 miles east of Lubbock. The town was founded in 1909 and has a population of approximately 2,000 people.
History
Olton was founded in 1909 by the Olton Land and Cattle Company. The company was owned by the Olton family, who had moved to the area from Oklahoma. The town was named after the family’s patriarch, John Olton. The town was originally a small farming community, but it soon grew to become a center for the local cattle industry.
In the early 1900s, the town was home to several businesses, including a bank, a hotel, a general store, and a post office. The town also had a school, which was established in 1910. The school was later renamed Olton High School.
In the 1920s, the town experienced a period of growth and prosperity. The population increased from 500 to 1,000 people. The town also saw the construction of several new buildings, including a new courthouse and a new school.
In the 1930s, the Great Depression hit the town hard. Many of the businesses in the town closed, and the population decreased to 500 people. The town was able to survive the depression, however, and by the 1940s, the population had increased to 1,000 people.
Geography
Olton is located in the Texas Panhandle, approximately 30 miles east of Lubbock. The town is situated in Lamb County, which is part of the Llano Estacado region. The town is located on the banks of the Olton River, which is a tributary of the Red River.
The town is surrounded by flat, open plains. The area is known for its dry climate and hot summers. The average temperature in the summer is around 90 degrees Fahrenheit.
Economy
The economy of Olton is largely based on agriculture. The town is home to several large farms, which produce a variety of crops, including cotton, corn, and wheat. The town is also home to several cattle ranches, which produce beef and dairy products.
In addition to agriculture, the town is home to several small businesses, including restaurants, retail stores, and service providers. The town is also home to a few manufacturing companies, which produce a variety of products, including furniture and clothing.
Demographics
As of the 2010 census, the population of Olton was 2,000 people. The town is predominantly white, with approximately 90% of the population being white. The remaining 10% of the population is made up of African Americans, Hispanics, and Native Americans.
The median household income in Olton is $35,000, which is slightly lower than the national average. The town has a poverty rate of approximately 20%, which is higher than the national average.
Conclusion
Olton, Texas is a small town located in Lamb County, Texas. The town was founded in 1909 and has a population of approximately 2,000 people. The town’s economy is largely based on agriculture, and it is home to several small businesses. The town is predominantly white, with approximately 90% of the population being white. The median household income in Olton is $35,000, which is slightly lower than the national average.
Common Questions
What is Per Capita Income in Olton?
Per Capita income in Olton is $25,419.
What is the Median Family Income in Olton?
Median Family Income in Olton is $71,250.
What is the Median Household income in Olton?
Median Household Income in Olton is $57,250.
What is Income or Wage Gap in Olton?
Income or Wage Gap in Olton is 42.3%.
Women in Olton earn 57.7 cents for every dollar earned by a man.
What is Inequality or Gini Index in Olton?
Inequality or Gini Index in Olton is 0.43.
What is the Total Population of Olton?
Total Population of Olton is 1,749.
What is the Total Male Population of Olton?
Total Male Population of Olton is 873.
What is the Total Female Population of Olton?
Total Female Population of Olton is 876.
What is the Ratio of Males per 100 Females in Olton?
There are 99.66 Males per 100 Females in Olton.
What is the Ratio of Females per 100 Males in Olton?
There are 100.34 Females per 100 Males in Olton.
What is the Median Population Age in Olton?
Median Population Age in Olton is 38.4 Years.
What is the Average Family Size in Olton
Average Family Size in Olton is 3.5 People.
What is the Average Household Size in Olton
Average Household Size in Olton is 3.1 People.
How Large is the Labor Force in Olton?
There are 692 People in the Labor Forcein in Olton.
What is the Percentage of People in the Labor Force in Olton?
51.2% of People are in the Labor Force in Olton.
What is the Unemployment Rate in Olton?
Unemployment Rate in Olton is 3.3%.