Olney, TX Map & Demographics
Olney Map
Olney Overview
$30,521
PER CAPITA INCOME
$88,095
AVG FAMILY INCOME
$39,770
AVG HOUSEHOLD INCOME
45.3%
WAGE / INCOME GAP [ % ]
54.7¢/ $1
WAGE / INCOME GAP [ $ ]
0.50
INEQUALITY / GINI INDEX
3,016
TOTAL POPULATION
1,537
MALE POPULATION
1,479
FEMALE POPULATION
103.92
MALES / 100 FEMALES
96.23
FEMALES / 100 MALES
36.2
MEDIAN AGE
2.8
AVG FAMILY SIZE
2.1
AVG HOUSEHOLD SIZE
1,518
LABOR FORCE [ PEOPLE ]
63.2%
PERCENT IN LABOR FORCE
8.0%
UNEMPLOYMENT RATE
Olney Zip Codes
Olney Area Codes
Income in Olney
Income Overview in Olney
Per Capita Income in Olney is $30,521, while median incomes of families and households are $88,095 and $39,770 respectively.
| Characteristic | Number | Measure |
| Per Capita Income | 3,016 | $30,521 |
| Median Family Income | 758 | $88,095 |
| Mean Family Income | 758 | $93,443 |
| Median Household Income | 1,393 | $39,770 |
| Mean Household Income | 1,393 | $67,784 |
| Income Deficit | 758 | $0 |
| Wage / Income Gap (%) | 3,016 | 45.34% |
| Wage / Income Gap ($) | 3,016 | 54.66¢ per $1 |
| Gini / Inequality Index | 3,016 | 0.50 |
Earnings by Sex in Olney
Average Earnings in Olney are $34,951, $43,929 for men and $24,010 for women, a difference of 45.3%.
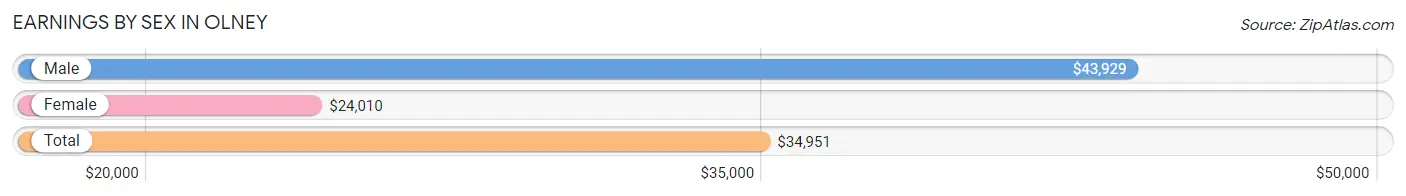
| Sex | Number | Average Earnings |
| Male | 882 (57.0%) | $43,929 |
| Female | 666 (43.0%) | $24,010 |
| Total | 1,548 (100.0%) | $34,951 |
Earnings by Sex by Income Bracket in Olney
The most common earnings brackets in Olney are $55,000 to $64,999 for men (176 | 20.0%) and $2,500 to $4,999 for women (114 | 17.1%).
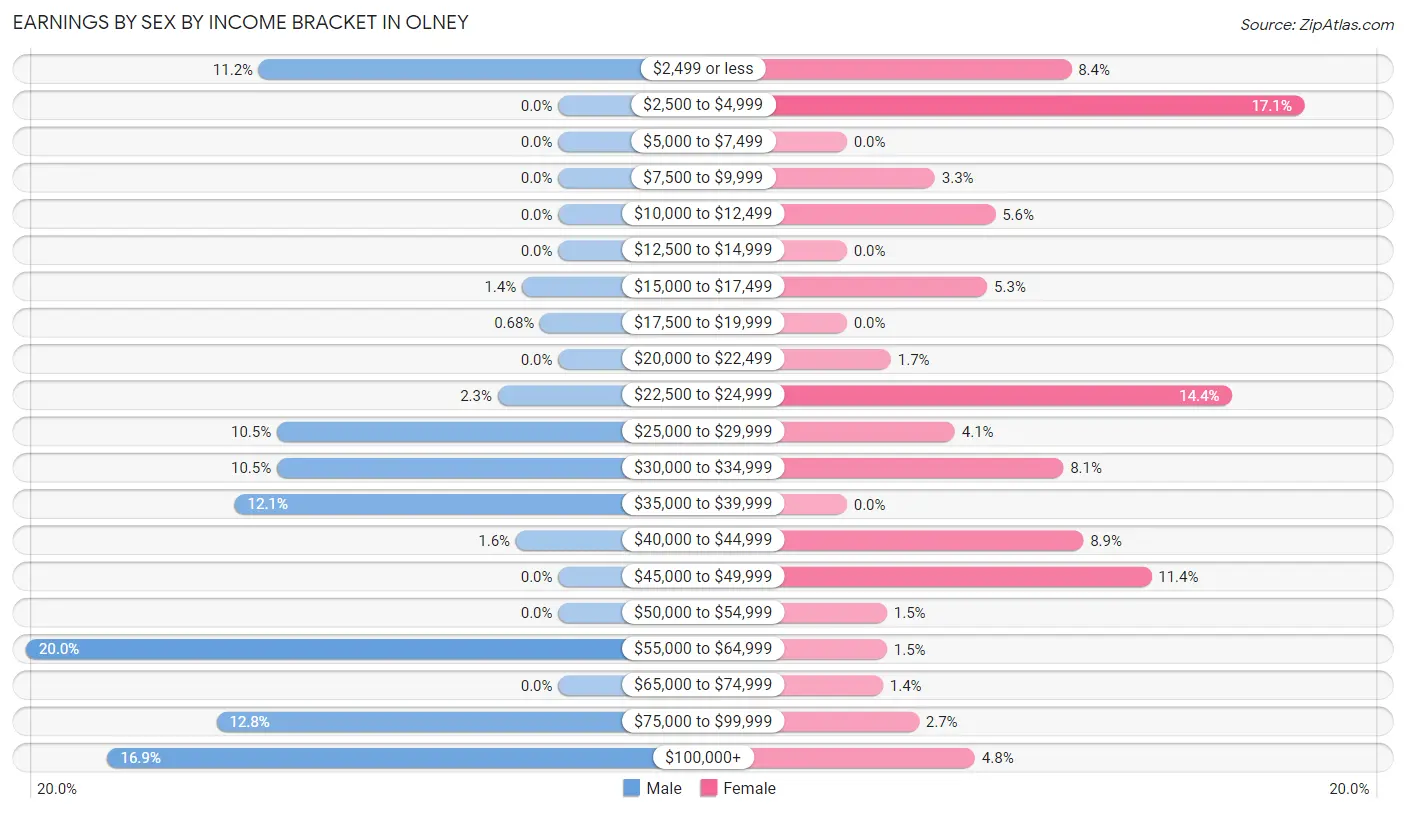
| Income | Male | Female |
| $2,499 or less | 99 (11.2%) | 56 (8.4%) |
| $2,500 to $4,999 | 0 (0.0%) | 114 (17.1%) |
| $5,000 to $7,499 | 0 (0.0%) | 0 (0.0%) |
| $7,500 to $9,999 | 0 (0.0%) | 22 (3.3%) |
| $10,000 to $12,499 | 0 (0.0%) | 37 (5.6%) |
| $12,500 to $14,999 | 0 (0.0%) | 0 (0.0%) |
| $15,000 to $17,499 | 12 (1.4%) | 35 (5.3%) |
| $17,500 to $19,999 | 6 (0.7%) | 0 (0.0%) |
| $20,000 to $22,499 | 0 (0.0%) | 11 (1.7%) |
| $22,500 to $24,999 | 20 (2.3%) | 96 (14.4%) |
| $25,000 to $29,999 | 93 (10.5%) | 27 (4.1%) |
| $30,000 to $34,999 | 93 (10.5%) | 54 (8.1%) |
| $35,000 to $39,999 | 107 (12.1%) | 0 (0.0%) |
| $40,000 to $44,999 | 14 (1.6%) | 59 (8.9%) |
| $45,000 to $49,999 | 0 (0.0%) | 76 (11.4%) |
| $50,000 to $54,999 | 0 (0.0%) | 10 (1.5%) |
| $55,000 to $64,999 | 176 (20.0%) | 10 (1.5%) |
| $65,000 to $74,999 | 0 (0.0%) | 9 (1.3%) |
| $75,000 to $99,999 | 113 (12.8%) | 18 (2.7%) |
| $100,000+ | 149 (16.9%) | 32 (4.8%) |
| Total | 882 (100.0%) | 666 (100.0%) |
Earnings by Sex by Educational Attainment in Olney
Average earnings in Olney are $58,050 for men and $24,688 for women, a difference of 57.5%. Men with an educational attainment of bachelor's degree enjoy the highest average annual earnings of $87,750, while those with less than high school education earn the least with $26,536. Women with an educational attainment of bachelor's degree earn the most with the average annual earnings of $48,846, while those with high school diploma education have the smallest earnings of $28,935.
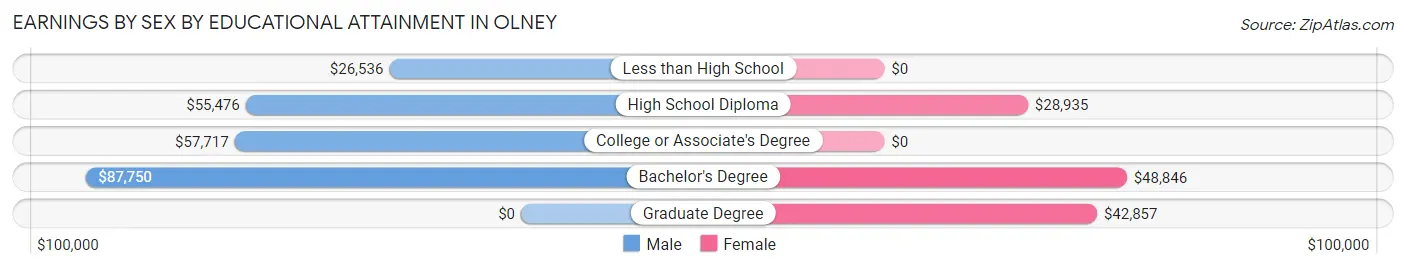
| Educational Attainment | Male Income | Female Income |
| Less than High School | $26,536 | $0 |
| High School Diploma | $55,476 | $28,935 |
| College or Associate's Degree | $57,717 | $0 |
| Bachelor's Degree | $87,750 | $48,846 |
| Graduate Degree | - | - |
| Total | $58,050 | $24,688 |
Family Income in Olney
Family Income Brackets in Olney
According to the Olney family income data, there are 222 families falling into the $100,000 to $149,999 income range, which is the most common income bracket and makes up 29.3% of all families. Conversely, the $15,000 to $24,999 income bracket is the least frequent group with only 14 families (1.8%) belonging to this category.
| Income Bracket | # Families | % Families |
| Less than $10,000 | 103 | 13.6% |
| $10,000 to $14,999 | 47 | 6.2% |
| $15,000 to $24,999 | 14 | 1.8% |
| $25,000 to $34,999 | 41 | 5.4% |
| $35,000 to $49,999 | 66 | 8.7% |
| $50,000 to $74,999 | 16 | 2.1% |
| $75,000 to $99,999 | 133 | 17.5% |
| $100,000 to $149,999 | 222 | 29.3% |
| $150,000 to $199,999 | 50 | 6.6% |
| $200,000+ | 66 | 8.7% |
Family Income by Famaliy Size in Olney
2-person families (386 | 50.9%) account for the highest median family income in Olney with $101,304 per family, while 2-person families (386 | 50.9%) have the highest median income of $50,652 per family member.
| Income Bracket | # Families | Median Income |
| 2-Person Families | 386 (50.9%) | $101,304 |
| 3-Person Families | 274 (36.1%) | $75,500 |
| 4-Person Families | 46 (6.1%) | $0 |
| 5-Person Families | 31 (4.1%) | $0 |
| 6-Person Families | 21 (2.8%) | $0 |
| 7+ Person Families | 0 (0.0%) | $0 |
| Total | 758 (100.0%) | $88,095 |
Family Income by Number of Earners in Olney
| Number of Earners | # Families | Median Income |
| No Earners | 127 (16.8%) | $0 |
| 1 Earner | 244 (32.2%) | $89,048 |
| 2 Earners | 379 (50.0%) | $132,525 |
| 3+ Earners | 8 (1.1%) | $0 |
| Total | 758 (100.0%) | $88,095 |
Household Income in Olney
Household Income Brackets in Olney
With 244 households falling in the category, the $25,000 to $34,999 income range is the most frequent in Olney, accounting for 17.5% of all households. In contrast, only 59 households (4.2%) fall into the $50,000 to $74,999 income bracket, making it the least populous group.
| Income Bracket | # Households | % Households |
| Less than $10,000 | 206 | 14.8% |
| $10,000 to $14,999 | 91 | 6.5% |
| $15,000 to $24,999 | 86 | 6.2% |
| $25,000 to $34,999 | 244 | 17.5% |
| $35,000 to $49,999 | 156 | 11.2% |
| $50,000 to $74,999 | 59 | 4.2% |
| $75,000 to $99,999 | 215 | 15.4% |
| $100,000 to $149,999 | 202 | 14.5% |
| $150,000 to $199,999 | 70 | 5.0% |
| $200,000+ | 65 | 4.7% |
Household Income by Householder Age in Olney
The median household income in Olney is $39,770, with the highest median household income of $76,221 found in the 45 to 64 years age bracket for the primary householder. A total of 404 households (29.0%) fall into this category. Meanwhile, the 15 to 24 years age bracket for the primary householder has the lowest median household income of $0, with 116 households (8.3%) in this group.
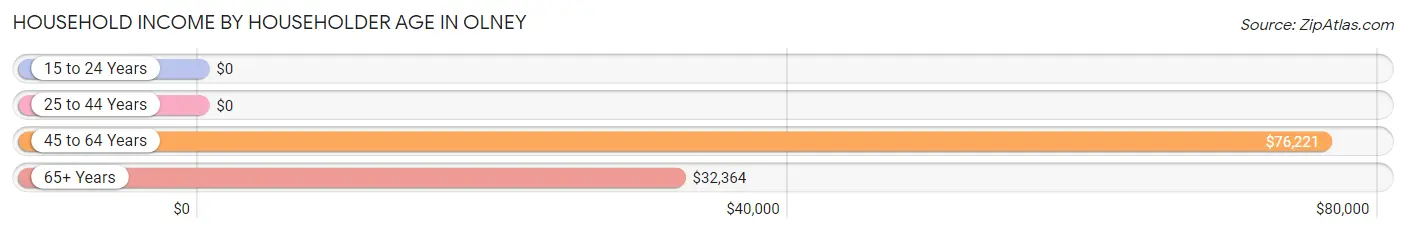
| Income Bracket | # Households | Median Income |
| 15 to 24 Years | 116 (8.3%) | $0 |
| 25 to 44 Years | 512 (36.8%) | $0 |
| 45 to 64 Years | 404 (29.0%) | $76,221 |
| 65+ Years | 361 (25.9%) | $32,364 |
| Total | 1,393 (100.0%) | $39,770 |
Poverty in Olney
Income Below Poverty by Sex and Age in Olney
With 18.9% poverty level for males and 27.9% for females among the residents of Olney, 15 year old males and 12 to 14 year old females are the most vulnerable to poverty, with 31 males (100.0%) and 39 females (100.0%) in their respective age groups living below the poverty level.
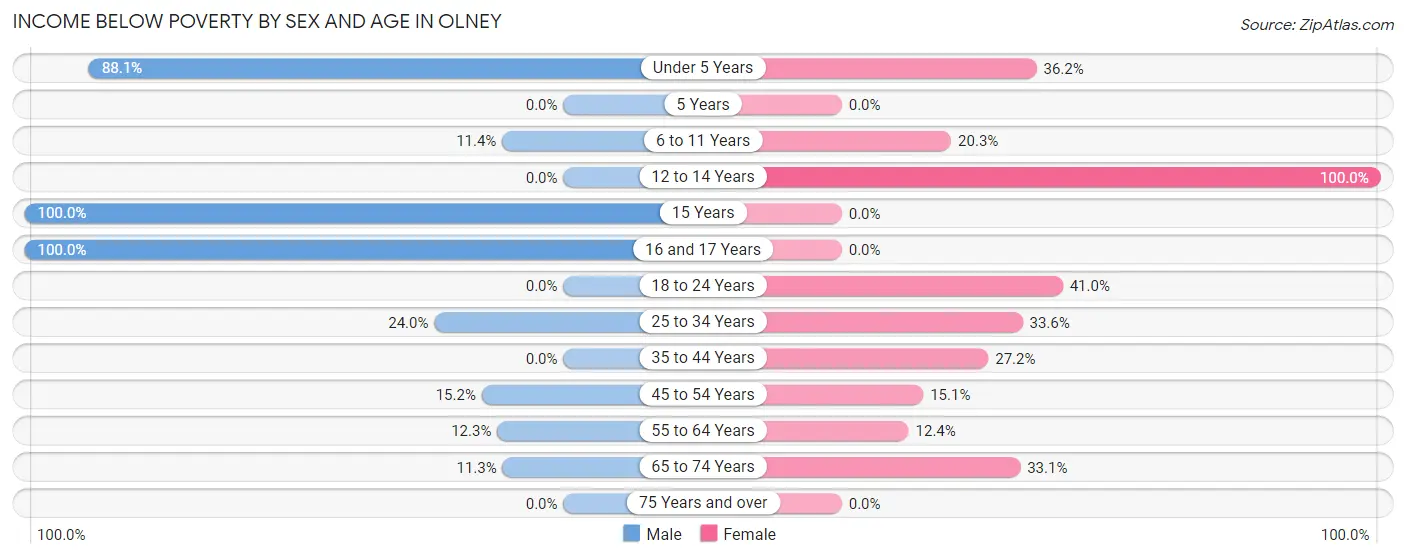
| Age Bracket | Male | Female |
| Under 5 Years | 59 (88.1%) | 47 (36.1%) |
| 5 Years | 0 (0.0%) | 0 (0.0%) |
| 6 to 11 Years | 21 (11.4%) | 27 (20.3%) |
| 12 to 14 Years | 0 (0.0%) | 39 (100.0%) |
| 15 Years | 31 (100.0%) | 0 (0.0%) |
| 16 and 17 Years | 52 (100.0%) | 0 (0.0%) |
| 18 to 24 Years | 0 (0.0%) | 57 (41.0%) |
| 25 to 34 Years | 57 (23.9%) | 103 (33.6%) |
| 35 to 44 Years | 0 (0.0%) | 31 (27.2%) |
| 45 to 54 Years | 20 (15.1%) | 26 (15.1%) |
| 55 to 64 Years | 33 (12.3%) | 16 (12.4%) |
| 65 to 74 Years | 15 (11.3%) | 52 (33.1%) |
| 75 Years and over | 0 (0.0%) | 0 (0.0%) |
| Total | 288 (18.9%) | 398 (27.9%) |
Income Above Poverty by Sex and Age in Olney
According to the poverty statistics in Olney, males aged 12 to 14 years and females aged 75 years and over are the age groups that are most secure financially, with 100.0% of males and 100.0% of females in these age groups living above the poverty line.
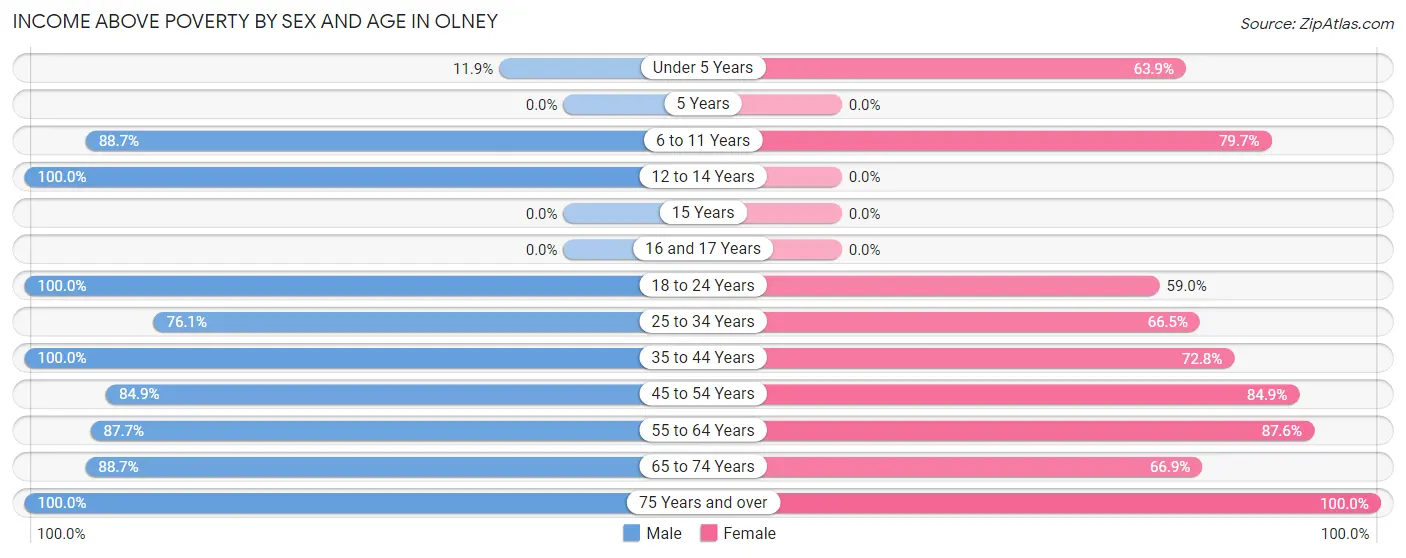
| Age Bracket | Male | Female |
| Under 5 Years | 8 (11.9%) | 83 (63.8%) |
| 5 Years | 0 (0.0%) | 0 (0.0%) |
| 6 to 11 Years | 164 (88.6%) | 106 (79.7%) |
| 12 to 14 Years | 29 (100.0%) | 0 (0.0%) |
| 15 Years | 0 (0.0%) | 0 (0.0%) |
| 16 and 17 Years | 0 (0.0%) | 0 (0.0%) |
| 18 to 24 Years | 97 (100.0%) | 82 (59.0%) |
| 25 to 34 Years | 181 (76.0%) | 204 (66.4%) |
| 35 to 44 Years | 219 (100.0%) | 83 (72.8%) |
| 45 to 54 Years | 112 (84.9%) | 146 (84.9%) |
| 55 to 64 Years | 236 (87.7%) | 113 (87.6%) |
| 65 to 74 Years | 118 (88.7%) | 105 (66.9%) |
| 75 Years and over | 72 (100.0%) | 106 (100.0%) |
| Total | 1,236 (81.1%) | 1,028 (72.1%) |
Income Below Poverty Among Married-Couple Families in Olney
The poverty statistics for married-couple families in Olney show that 2.1% or 10 of the total 467 families live below the poverty line. Families with no children have the highest poverty rate of 3.0%, comprising of 10 families. On the other hand, families with 1 or 2 children have the lowest poverty rate of 0.0%, which includes 0 families.
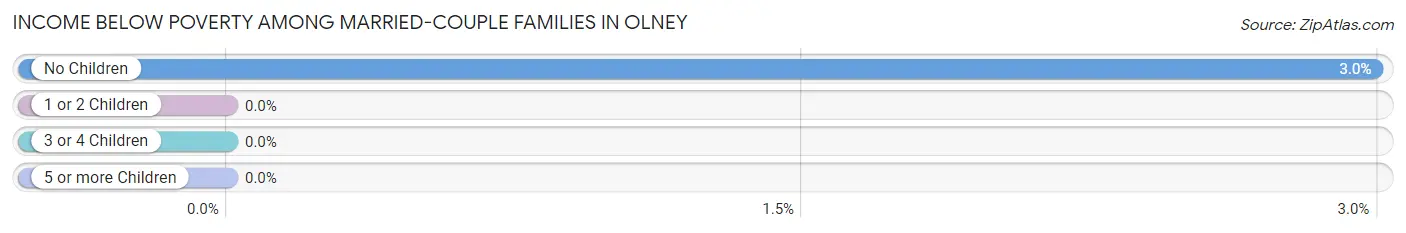
| Children | Above Poverty | Below Poverty |
| No Children | 324 (97.0%) | 10 (3.0%) |
| 1 or 2 Children | 112 (100.0%) | 0 (0.0%) |
| 3 or 4 Children | 21 (100.0%) | 0 (0.0%) |
| 5 or more Children | 0 (0.0%) | 0 (0.0%) |
| Total | 457 (97.9%) | 10 (2.1%) |
Income Below Poverty Among Single-Parent Households in Olney
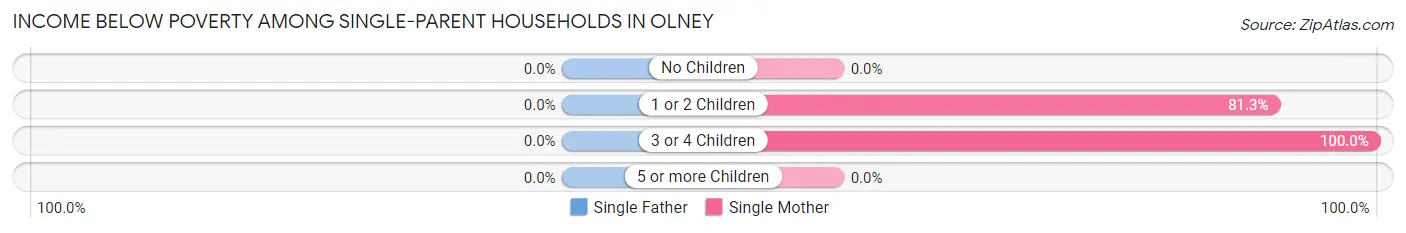
| Children | Single Father | Single Mother |
| No Children | 0 (0.0%) | 0 (0.0%) |
| 1 or 2 Children | 0 (0.0%) | 87 (81.3%) |
| 3 or 4 Children | 0 (0.0%) | 53 (100.0%) |
| 5 or more Children | 0 (0.0%) | 0 (0.0%) |
| Total | 0 (0.0%) | 140 (67.0%) |
Income Below Poverty Among Married-Couple vs Single-Parent Households in Olney
The poverty data for Olney shows that 10 of the married-couple family households (2.1%) and 140 of the single-parent households (48.1%) are living below the poverty level. Within the married-couple family households, those with no children have the highest poverty rate, with 10 households (3.0%) falling below the poverty line. Among the single-parent households, those with 3 or 4 children have the highest poverty rate, with 53 household (100.0%) living below poverty.
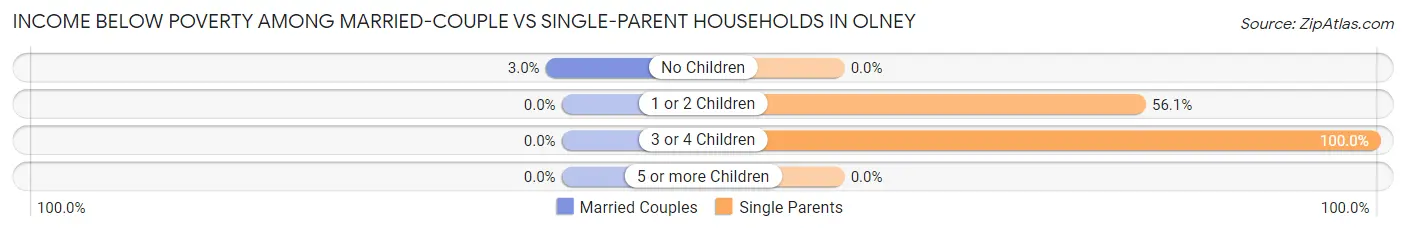
| Children | Married-Couple Families | Single-Parent Households |
| No Children | 10 (3.0%) | 0 (0.0%) |
| 1 or 2 Children | 0 (0.0%) | 87 (56.1%) |
| 3 or 4 Children | 0 (0.0%) | 53 (100.0%) |
| 5 or more Children | 0 (0.0%) | 0 (0.0%) |
| Total | 10 (2.1%) | 140 (48.1%) |
Race in Olney
The most populous races in Olney are White / Caucasian (2,659 | 88.2%), Hispanic or Latino (703 | 23.3%), and Some other Race (140 | 4.6%).
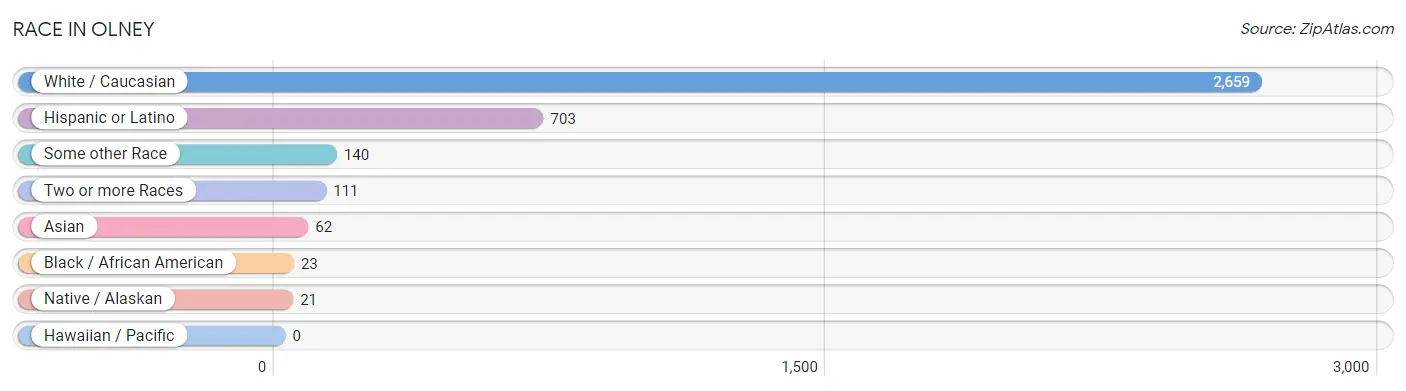
| Race | # Population | % Population |
| Asian | 62 | 2.1% |
| Black / African American | 23 | 0.8% |
| Hawaiian / Pacific | 0 | 0.0% |
| Hispanic or Latino | 703 | 23.3% |
| Native / Alaskan | 21 | 0.7% |
| White / Caucasian | 2,659 | 88.2% |
| Two or more Races | 111 | 3.7% |
| Some other Race | 140 | 4.6% |
| Total | 3,016 | 100.0% |
Ancestry in Olney
The most populous ancestries reported in Olney are Mexican (664 | 22.0%), German (408 | 13.5%), English (283 | 9.4%), Irish (279 | 9.2%), and American (128 | 4.2%), together accounting for 58.4% of all Olney residents.
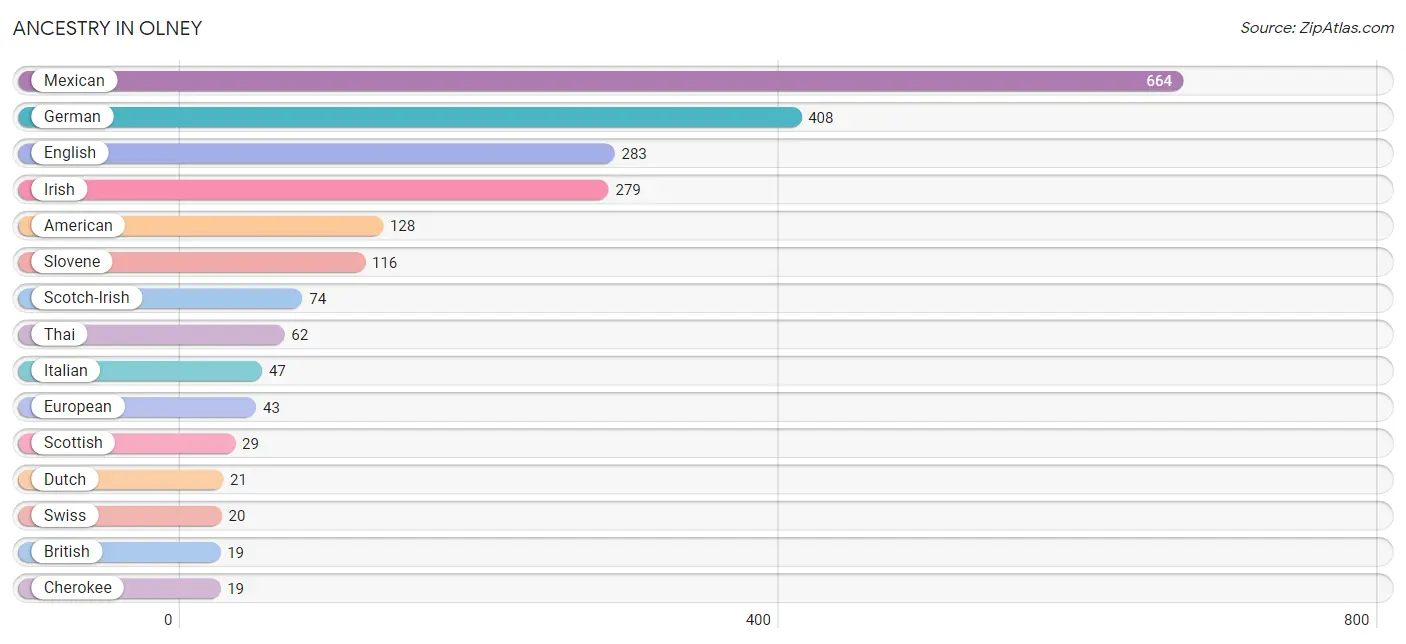
| Ancestry | # Population | % Population |
| American | 128 | 4.2% |
| British | 19 | 0.6% |
| Canadian | 14 | 0.5% |
| Cherokee | 19 | 0.6% |
| Choctaw | 18 | 0.6% |
| Dutch | 21 | 0.7% |
| English | 283 | 9.4% |
| European | 43 | 1.4% |
| French | 17 | 0.6% |
| German | 408 | 13.5% |
| Greek | 8 | 0.3% |
| Hungarian | 16 | 0.5% |
| Irish | 279 | 9.2% |
| Italian | 47 | 1.6% |
| Korean | 4 | 0.1% |
| Mexican | 664 | 22.0% |
| Scotch-Irish | 74 | 2.5% |
| Scottish | 29 | 1.0% |
| Slovene | 116 | 3.8% |
| Spanish | 15 | 0.5% |
| Swiss | 20 | 0.7% |
| Thai | 62 | 2.1% | View All 22 Rows |
Immigrants in Olney
The most numerous immigrant groups reported in Olney came from Central America (208 | 6.9%), Latin America (208 | 6.9%), Mexico (208 | 6.9%), Asia (62 | 2.1%), and India (62 | 2.1%), together accounting for 24.8% of all Olney residents.
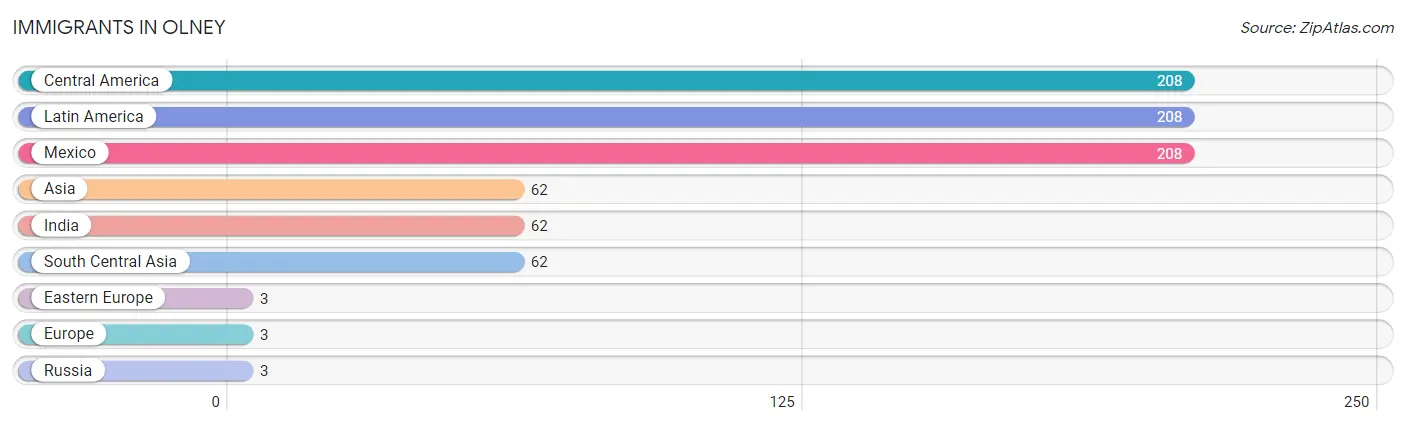
| Immigration Origin | # Population | % Population |
| Asia | 62 | 2.1% |
| Central America | 208 | 6.9% |
| Eastern Europe | 3 | 0.1% |
| Europe | 3 | 0.1% |
| India | 62 | 2.1% |
| Latin America | 208 | 6.9% |
| Mexico | 208 | 6.9% |
| Russia | 3 | 0.1% |
| South Central Asia | 62 | 2.1% | View All 9 Rows |
Sex and Age in Olney
Sex and Age in Olney
The most populous age groups in Olney are 25 to 29 Years (199 | 13.0%) for men and 25 to 29 Years (173 | 11.7%) for women.
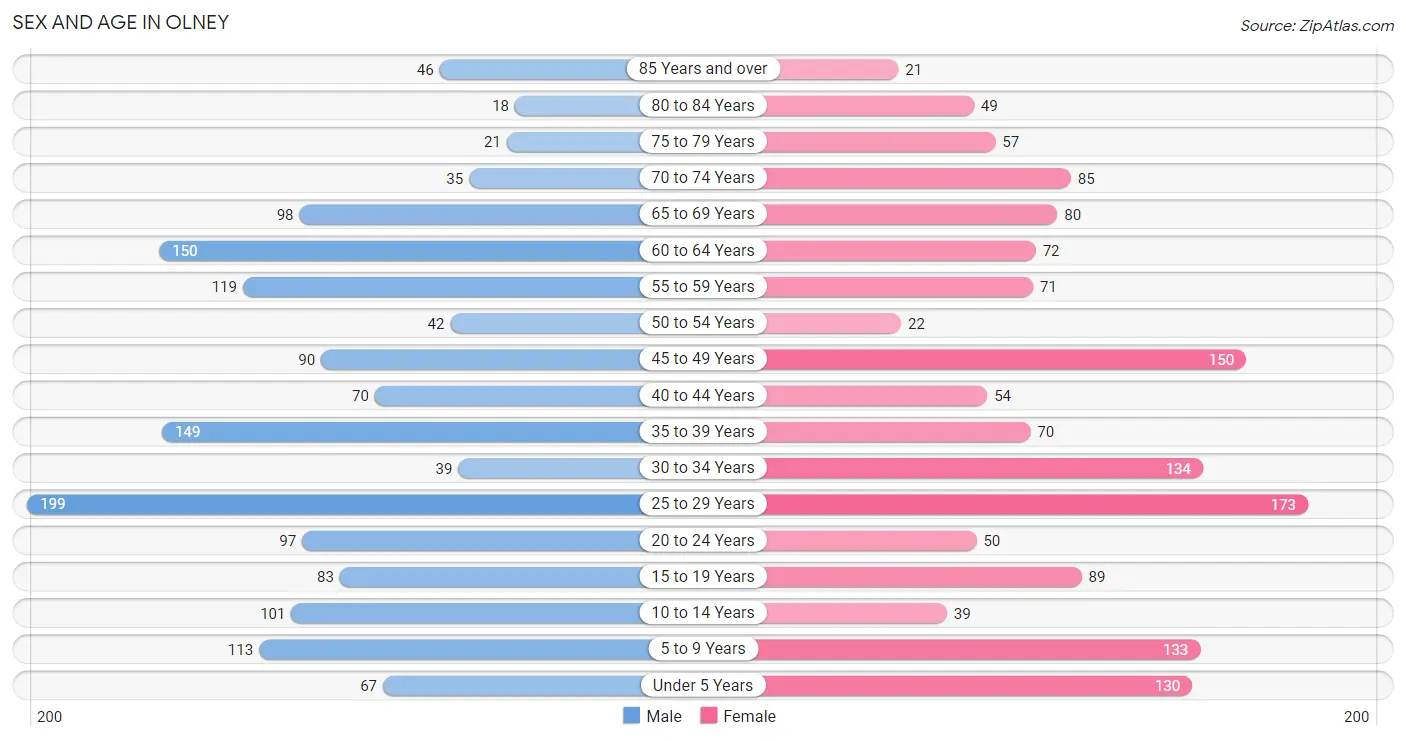
| Age Bracket | Male | Female |
| Under 5 Years | 67 (4.4%) | 130 (8.8%) |
| 5 to 9 Years | 113 (7.3%) | 133 (9.0%) |
| 10 to 14 Years | 101 (6.6%) | 39 (2.6%) |
| 15 to 19 Years | 83 (5.4%) | 89 (6.0%) |
| 20 to 24 Years | 97 (6.3%) | 50 (3.4%) |
| 25 to 29 Years | 199 (13.0%) | 173 (11.7%) |
| 30 to 34 Years | 39 (2.5%) | 134 (9.1%) |
| 35 to 39 Years | 149 (9.7%) | 70 (4.7%) |
| 40 to 44 Years | 70 (4.5%) | 54 (3.6%) |
| 45 to 49 Years | 90 (5.9%) | 150 (10.1%) |
| 50 to 54 Years | 42 (2.7%) | 22 (1.5%) |
| 55 to 59 Years | 119 (7.7%) | 71 (4.8%) |
| 60 to 64 Years | 150 (9.8%) | 72 (4.9%) |
| 65 to 69 Years | 98 (6.4%) | 80 (5.4%) |
| 70 to 74 Years | 35 (2.3%) | 85 (5.8%) |
| 75 to 79 Years | 21 (1.4%) | 57 (3.8%) |
| 80 to 84 Years | 18 (1.2%) | 49 (3.3%) |
| 85 Years and over | 46 (3.0%) | 21 (1.4%) |
| Total | 1,537 (100.0%) | 1,479 (100.0%) |
Families and Households in Olney
Median Family Size in Olney
The median family size in Olney is 2.77 persons per family, with single female/mother families (209 | 27.6%) accounting for the largest median family size of 2.79 persons per family. On the other hand, single male/father families (82 | 10.8%) represent the smallest median family size with 2.65 persons per family.
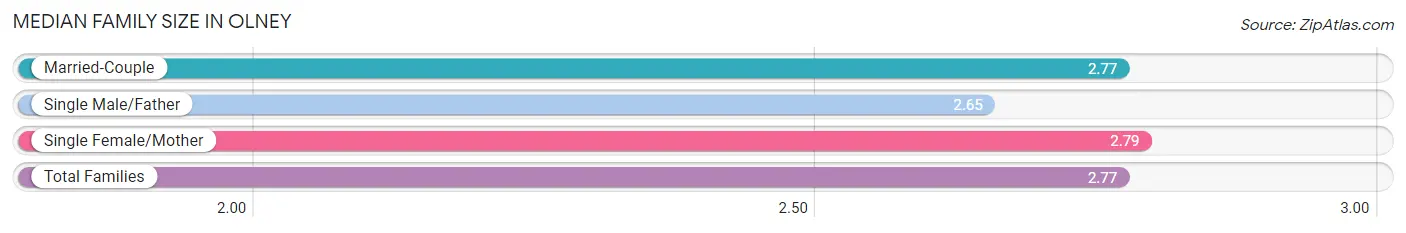
| Family Type | # Families | Family Size |
| Married-Couple | 467 (61.6%) | 2.77 |
| Single Male/Father | 82 (10.8%) | 2.65 |
| Single Female/Mother | 209 (27.6%) | 2.79 |
| Total Families | 758 (100.0%) | 2.77 |
Median Household Size in Olney
The median household size in Olney is 2.11 persons per household, with single female/mother households (209 | 15.0%) accounting for the largest median household size of 3.45 persons per household. non-family households (635 | 45.6%) represent the smallest median household size with 1.05 persons per household.
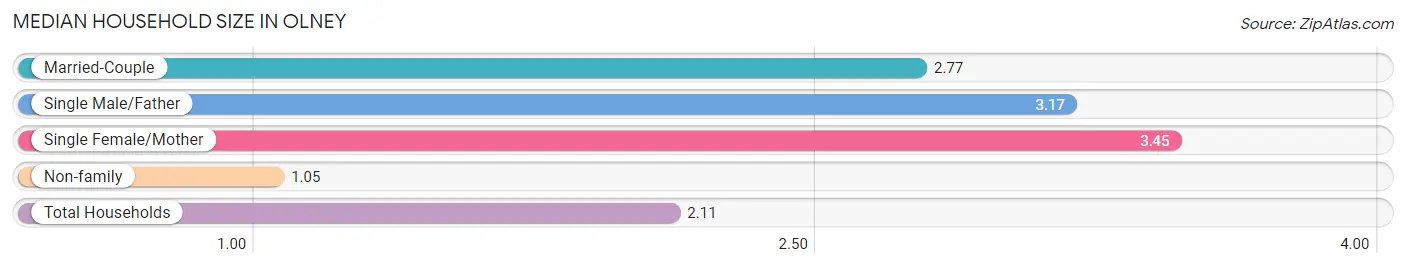
| Household Type | # Households | Household Size |
| Married-Couple | 467 (33.5%) | 2.77 |
| Single Male/Father | 82 (5.9%) | 3.17 |
| Single Female/Mother | 209 (15.0%) | 3.45 |
| Non-family | 635 (45.6%) | 1.05 |
| Total Households | 1,393 (100.0%) | 2.11 |
Household Size by Marriage Status in Olney
Out of a total of 1,393 households in Olney, 758 (54.4%) are family households, while 635 (45.6%) are nonfamily households. The most numerous type of family households are 2-person households, comprising 378, and the most common type of nonfamily households are 1-person households, comprising 595.
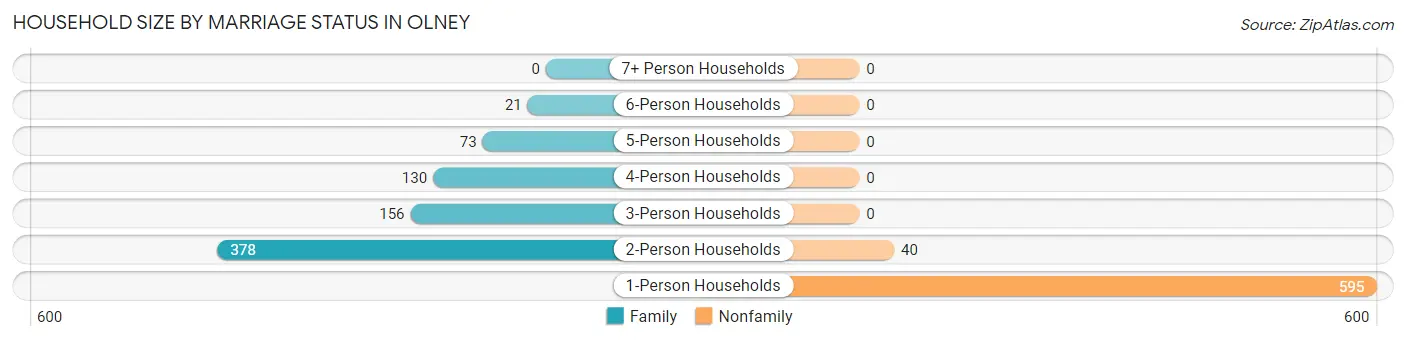
| Household Size | Family Households | Nonfamily Households |
| 1-Person Households | - | 595 (42.7%) |
| 2-Person Households | 378 (27.1%) | 40 (2.9%) |
| 3-Person Households | 156 (11.2%) | 0 (0.0%) |
| 4-Person Households | 130 (9.3%) | 0 (0.0%) |
| 5-Person Households | 73 (5.2%) | 0 (0.0%) |
| 6-Person Households | 21 (1.5%) | 0 (0.0%) |
| 7+ Person Households | 0 (0.0%) | 0 (0.0%) |
| Total | 758 (54.4%) | 635 (45.6%) |
Female Fertility in Olney
Fertility by Age in Olney
Average fertility rate in Olney is 161.0 births per 1,000 women. Women in the age bracket of 15 to 19 years have the highest fertility rate with 191.0 births per 1,000 women. Women in the age bracket of 20 to 34 years acount for 58.6% of all women with births.
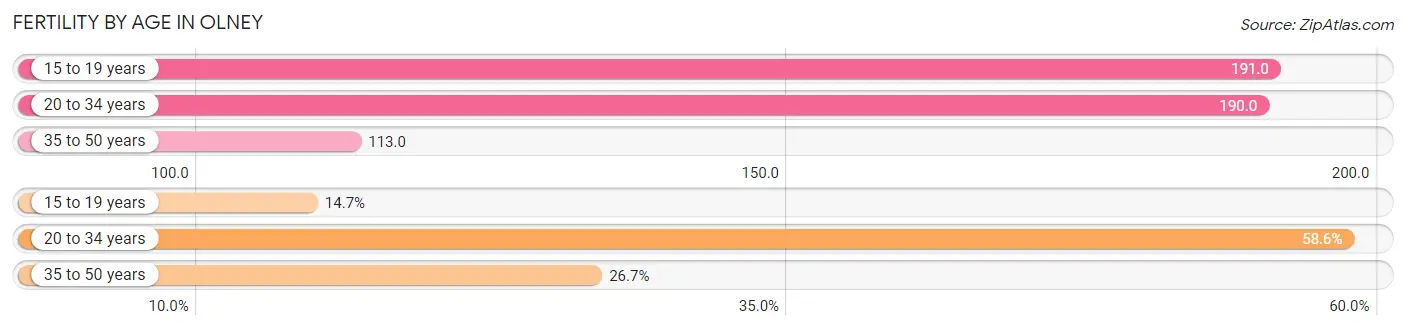
| Age Bracket | Women with Births | Births / 1,000 Women |
| 15 to 19 years | 17 (14.7%) | 191.0 |
| 20 to 34 years | 68 (58.6%) | 190.0 |
| 35 to 50 years | 31 (26.7%) | 113.0 |
| Total | 116 (100.0%) | 161.0 |
Fertility by Age by Marriage Status in Olney
23.3% of women with births (116) in Olney are married. The highest percentage of unmarried women with births falls into 15 to 19 years age bracket with 100.0% of them unmarried at the time of birth, while the lowest percentage of unmarried women with births belong to 20 to 34 years age bracket with 60.3% of them unmarried.
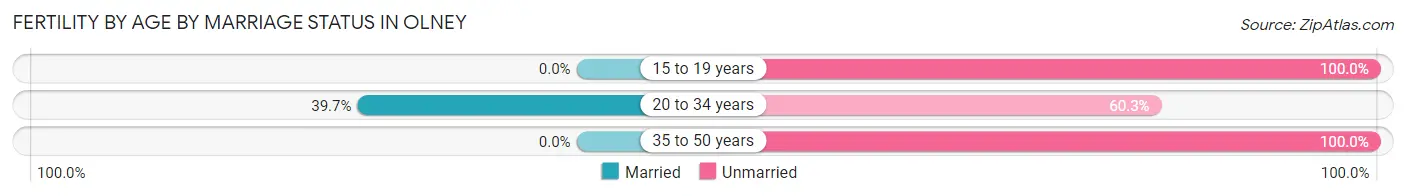
| Age Bracket | Married | Unmarried |
| 15 to 19 years | 0 (0.0%) | 17 (100.0%) |
| 20 to 34 years | 27 (39.7%) | 41 (60.3%) |
| 35 to 50 years | 0 (0.0%) | 31 (100.0%) |
| Total | 27 (23.3%) | 89 (76.7%) |
Fertility by Education in Olney
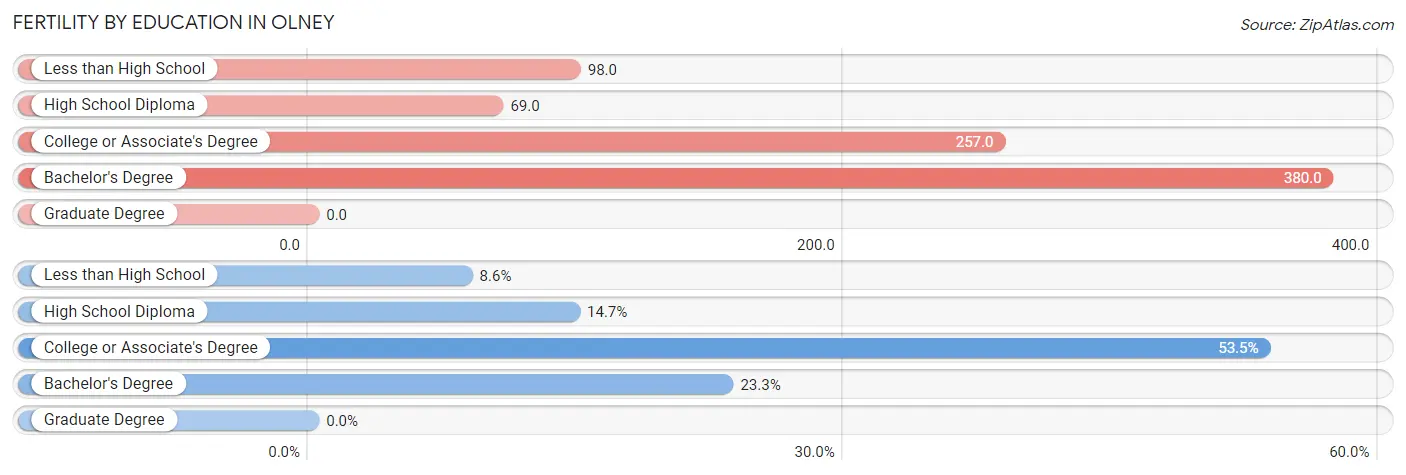
| Educational Attainment | Women with Births | Births / 1,000 Women |
| Less than High School | 10 (8.6%) | 98.0 |
| High School Diploma | 17 (14.7%) | 69.0 |
| College or Associate's Degree | 62 (53.4%) | 257.0 |
| Bachelor's Degree | 27 (23.3%) | 380.0 |
| Graduate Degree | 0 (0.0%) | 0.0 |
| Total | 116 (100.0%) | 161.0 |
Fertility by Education by Marriage Status in Olney
76.7% of women with births in Olney are unmarried. Women with the educational attainment of bachelor's degree are most likely to be married with 100.0% of them married at childbirth, while women with the educational attainment of less than high school are least likely to be married with 100.0% of them unmarried at childbirth.
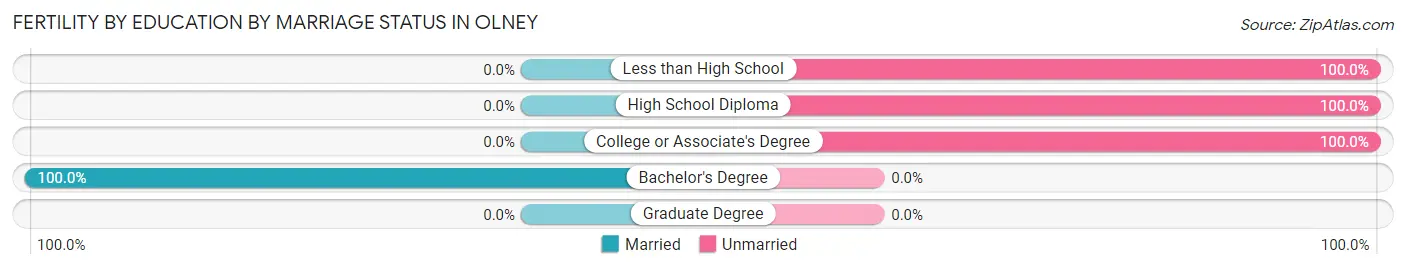
| Educational Attainment | Married | Unmarried |
| Less than High School | 0 (0.0%) | 10 (100.0%) |
| High School Diploma | 0 (0.0%) | 17 (100.0%) |
| College or Associate's Degree | 0 (0.0%) | 62 (100.0%) |
| Bachelor's Degree | 27 (100.0%) | 0 (0.0%) |
| Graduate Degree | 0 (0.0%) | 0 (0.0%) |
| Total | 27 (23.3%) | 89 (76.7%) |
Employment Characteristics in Olney
Employment by Class of Employer in Olney
Among the 1,377 employed individuals in Olney, private company employees (975 | 70.8%), local government employees (120 | 8.7%), and not-for-profit organizations (79 | 5.7%) make up the most common classes of employment.
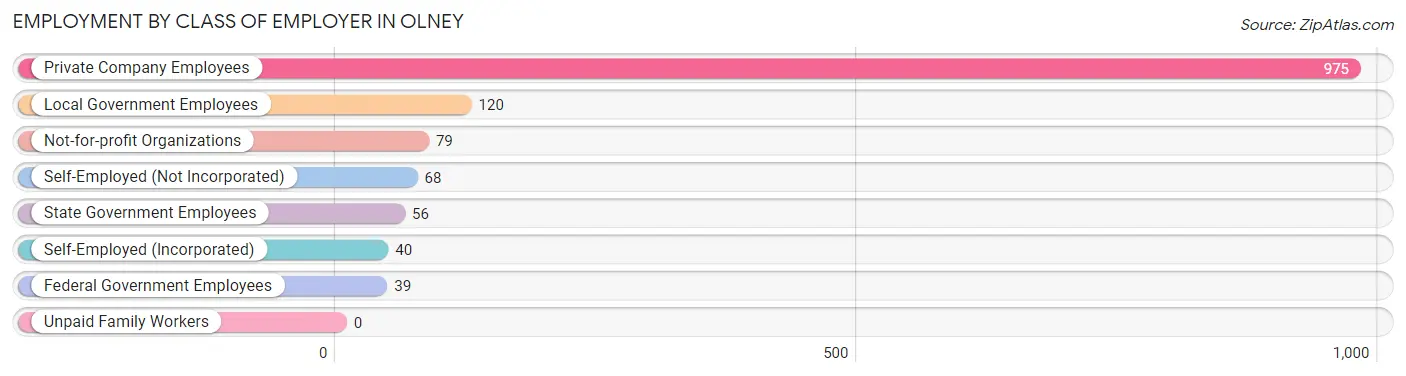
| Employer Class | # Employees | % Employees |
| Private Company Employees | 975 | 70.8% |
| Self-Employed (Incorporated) | 40 | 2.9% |
| Self-Employed (Not Incorporated) | 68 | 4.9% |
| Not-for-profit Organizations | 79 | 5.7% |
| Local Government Employees | 120 | 8.7% |
| State Government Employees | 56 | 4.1% |
| Federal Government Employees | 39 | 2.8% |
| Unpaid Family Workers | 0 | 0.0% |
| Total | 1,377 | 100.0% |
Employment Status by Age in Olney
According to the labor force statistics for Olney, out of the total population over 16 years of age (2,402), 63.2% or 1,518 individuals are in the labor force, with 8.0% or 121 of them unemployed. The age group with the highest labor force participation rate is 25 to 29 years, with 86.6% or 322 individuals in the labor force. Within the labor force, the 25 to 29 years age range has the highest percentage of unemployed individuals, with 22.4% or 72 of them being unemployed.
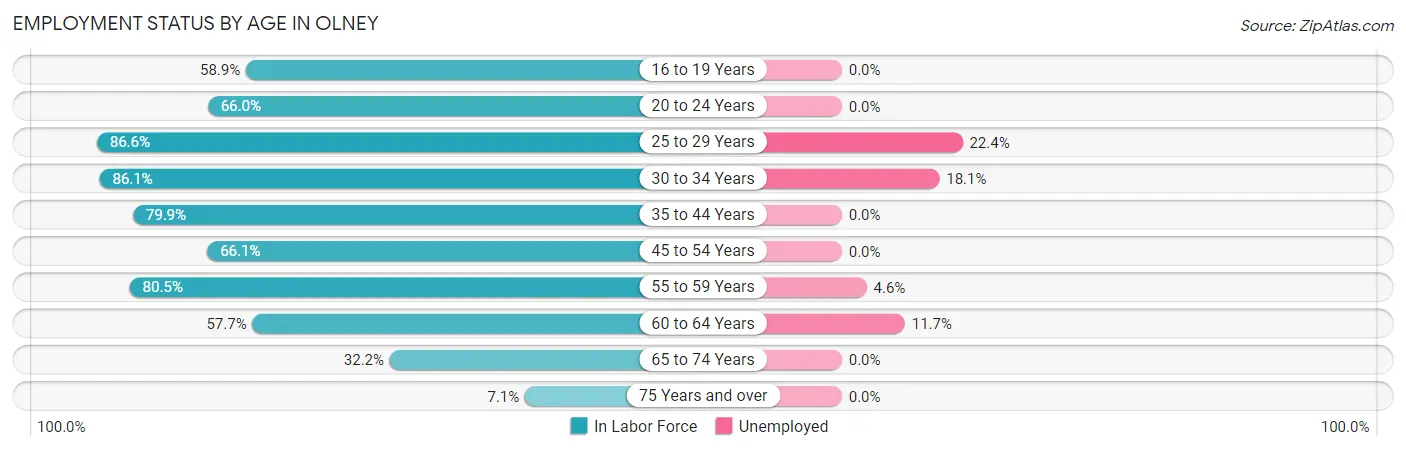
| Age Bracket | In Labor Force | Unemployed |
| 16 to 19 Years | 83 (58.9%) | 0 (0.0%) |
| 20 to 24 Years | 97 (66.0%) | 0 (0.0%) |
| 25 to 29 Years | 322 (86.6%) | 72 (22.4%) |
| 30 to 34 Years | 149 (86.1%) | 27 (18.1%) |
| 35 to 44 Years | 274 (79.9%) | 0 (0.0%) |
| 45 to 54 Years | 201 (66.1%) | 0 (0.0%) |
| 55 to 59 Years | 153 (80.5%) | 7 (4.6%) |
| 60 to 64 Years | 128 (57.7%) | 15 (11.7%) |
| 65 to 74 Years | 96 (32.2%) | 0 (0.0%) |
| 75 Years and over | 15 (7.1%) | 0 (0.0%) |
| Total | 1,518 (63.2%) | 121 (8.0%) |
Employment Status by Educational Attainment in Olney
According to labor force statistics for Olney, 76.5% of individuals (1,227) out of the total population between 25 and 64 years of age (1,604) are in the labor force, with 9.9% or 121 of them being unemployed. The group with the highest labor force participation rate are those with the educational attainment of bachelor's degree or higher, with 92.1% or 327 individuals in the labor force. Within the labor force, individuals with less than high school education have the highest percentage of unemployment, with 61.1% or 55 of them being unemployed.
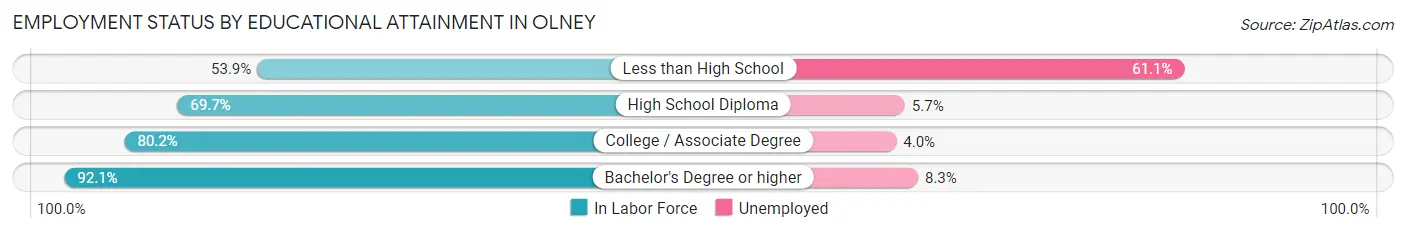
| Educational Attainment | In Labor Force | Unemployed |
| Less than High School | 90 (53.9%) | 102 (61.1%) |
| High School Diploma | 385 (69.7%) | 31 (5.7%) |
| College / Associate Degree | 425 (80.2%) | 21 (4.0%) |
| Bachelor's Degree or higher | 327 (92.1%) | 29 (8.3%) |
| Total | 1,227 (76.5%) | 159 (9.9%) |
Employment Occupations by Sex in Olney
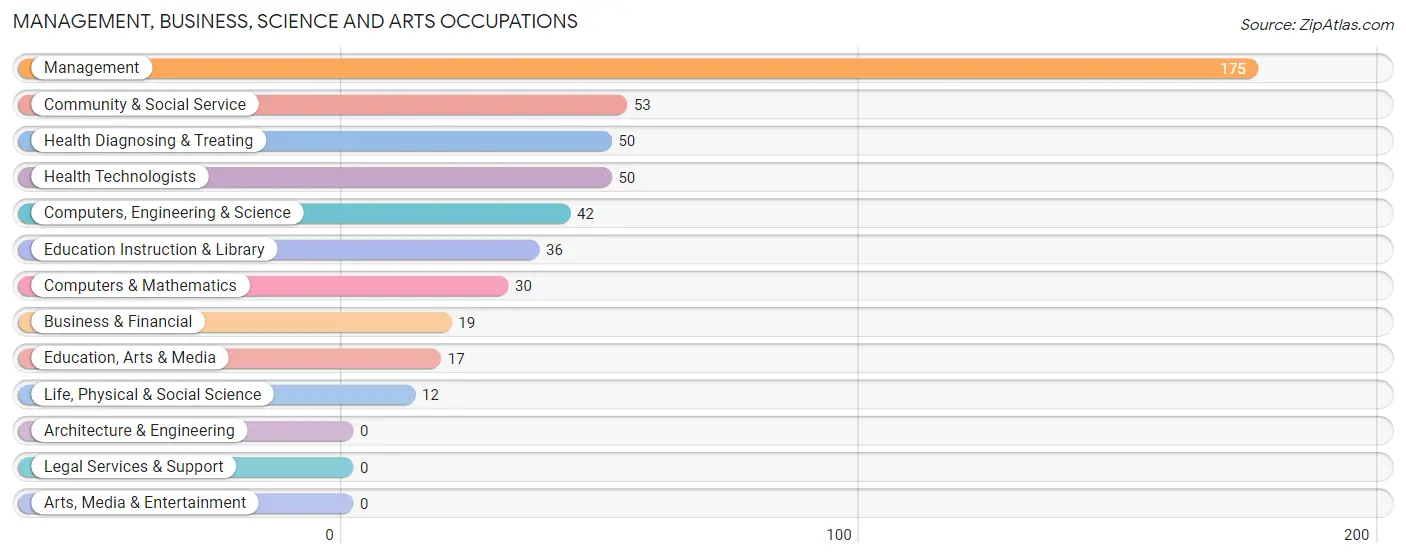
Management, Business, Science and Arts Occupations
The most common Management, Business, Science and Arts occupations in Olney are Management (175 | 12.5%), Community & Social Service (53 | 3.8%), Health Diagnosing & Treating (50 | 3.6%), Health Technologists (50 | 3.6%), and Computers, Engineering & Science (42 | 3.0%).
Management, Business, Science and Arts Occupations by Sex
Within the Management, Business, Science and Arts occupations in Olney, the most male-oriented occupations are Computers & Mathematics (100.0%), Education, Arts & Media (100.0%), and Management (78.3%), while the most female-oriented occupations are Life, Physical & Social Science (100.0%), Education Instruction & Library (100.0%), and Health Diagnosing & Treating (100.0%).
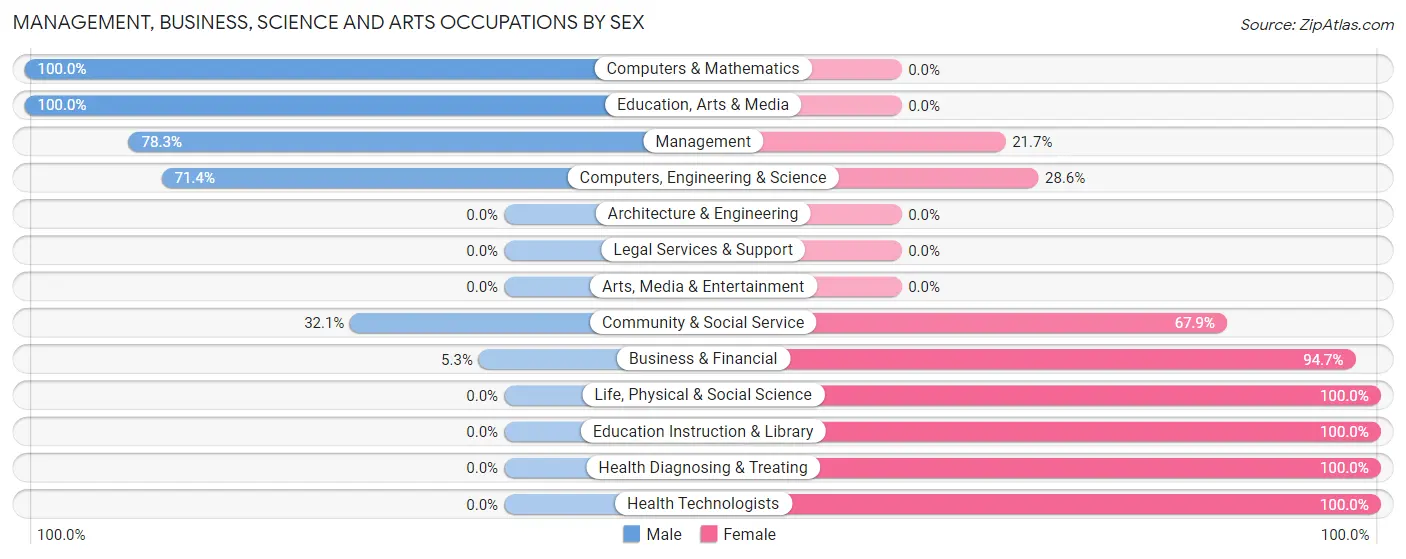
| Occupation | Male | Female |
| Management | 137 (78.3%) | 38 (21.7%) |
| Business & Financial | 1 (5.3%) | 18 (94.7%) |
| Computers, Engineering & Science | 30 (71.4%) | 12 (28.6%) |
| Computers & Mathematics | 30 (100.0%) | 0 (0.0%) |
| Architecture & Engineering | 0 (0.0%) | 0 (0.0%) |
| Life, Physical & Social Science | 0 (0.0%) | 12 (100.0%) |
| Community & Social Service | 17 (32.1%) | 36 (67.9%) |
| Education, Arts & Media | 17 (100.0%) | 0 (0.0%) |
| Legal Services & Support | 0 (0.0%) | 0 (0.0%) |
| Education Instruction & Library | 0 (0.0%) | 36 (100.0%) |
| Arts, Media & Entertainment | 0 (0.0%) | 0 (0.0%) |
| Health Diagnosing & Treating | 0 (0.0%) | 50 (100.0%) |
| Health Technologists | 0 (0.0%) | 50 (100.0%) |
| Total (Category) | 185 (54.6%) | 154 (45.4%) |
| Total (Overall) | 788 (56.4%) | 609 (43.6%) |
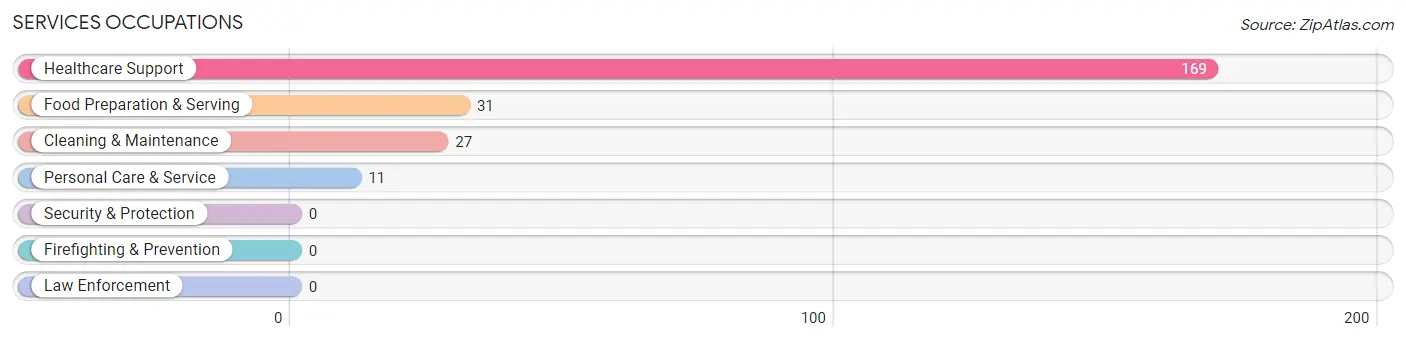
Services Occupations
The most common Services occupations in Olney are Healthcare Support (169 | 12.1%), Food Preparation & Serving (31 | 2.2%), Cleaning & Maintenance (27 | 1.9%), and Personal Care & Service (11 | 0.8%).
Services Occupations by Sex
Within the Services occupations in Olney, the most male-oriented occupations are Food Preparation & Serving (100.0%), and Cleaning & Maintenance (100.0%), while the most female-oriented occupations are Healthcare Support (100.0%), and Personal Care & Service (100.0%).
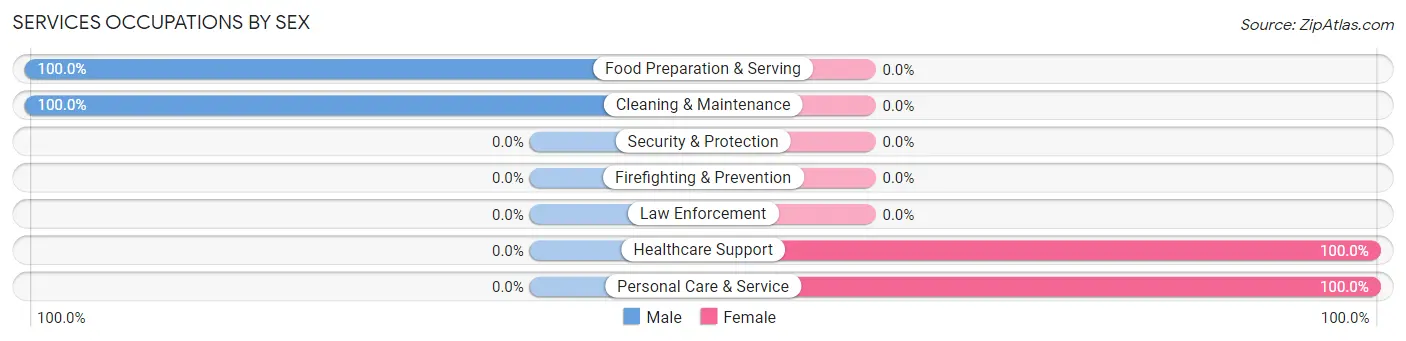
| Occupation | Male | Female |
| Healthcare Support | 0 (0.0%) | 169 (100.0%) |
| Security & Protection | 0 (0.0%) | 0 (0.0%) |
| Firefighting & Prevention | 0 (0.0%) | 0 (0.0%) |
| Law Enforcement | 0 (0.0%) | 0 (0.0%) |
| Food Preparation & Serving | 31 (100.0%) | 0 (0.0%) |
| Cleaning & Maintenance | 27 (100.0%) | 0 (0.0%) |
| Personal Care & Service | 0 (0.0%) | 11 (100.0%) |
| Total (Category) | 58 (24.4%) | 180 (75.6%) |
| Total (Overall) | 788 (56.4%) | 609 (43.6%) |
Sales and Office Occupations
The most common Sales and Office occupations in Olney are Office & Administration (130 | 9.3%), and Sales & Related (91 | 6.5%).
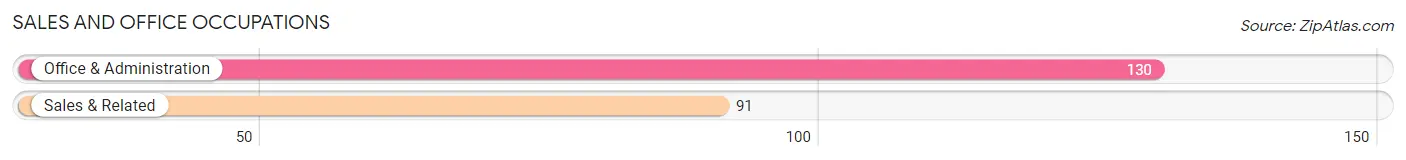
Sales and Office Occupations by Sex
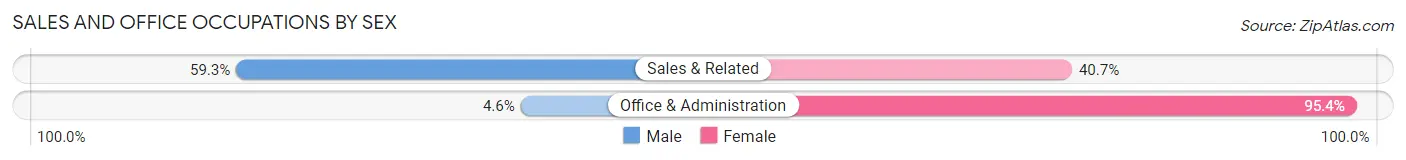
| Occupation | Male | Female |
| Sales & Related | 54 (59.3%) | 37 (40.7%) |
| Office & Administration | 6 (4.6%) | 124 (95.4%) |
| Total (Category) | 60 (27.2%) | 161 (72.9%) |
| Total (Overall) | 788 (56.4%) | 609 (43.6%) |
Natural Resources, Construction and Maintenance Occupations
The most common Natural Resources, Construction and Maintenance occupations in Olney are Construction & Extraction (118 | 8.5%), Farming, Fishing & Forestry (42 | 3.0%), and Installation, Maintenance & Repair (37 | 2.6%).
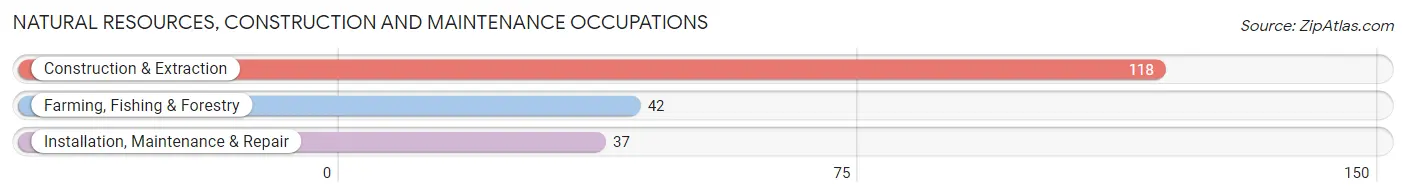
Natural Resources, Construction and Maintenance Occupations by Sex
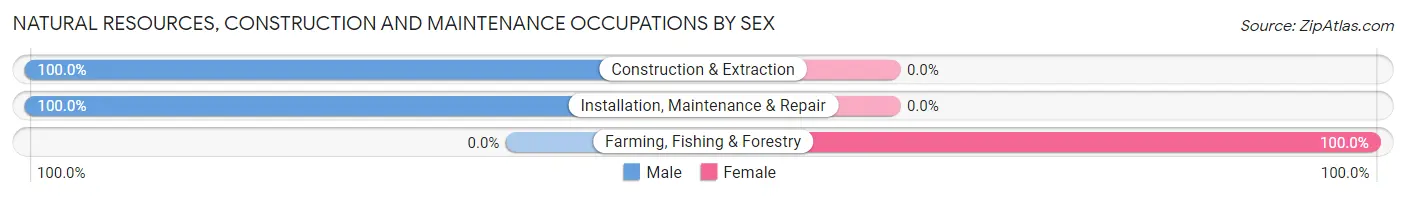
| Occupation | Male | Female |
| Farming, Fishing & Forestry | 0 (0.0%) | 42 (100.0%) |
| Construction & Extraction | 118 (100.0%) | 0 (0.0%) |
| Installation, Maintenance & Repair | 37 (100.0%) | 0 (0.0%) |
| Total (Category) | 155 (78.7%) | 42 (21.3%) |
| Total (Overall) | 788 (56.4%) | 609 (43.6%) |
Production, Transportation and Moving Occupations
The most common Production, Transportation and Moving occupations in Olney are Production (263 | 18.8%), Material Moving (132 | 9.5%), and Transportation (7 | 0.5%).
Production, Transportation and Moving Occupations by Sex
| Occupation | Male | Female |
| Production | 241 (91.6%) | 22 (8.4%) |
| Transportation | 7 (100.0%) | 0 (0.0%) |
| Material Moving | 82 (62.1%) | 50 (37.9%) |
| Total (Category) | 330 (82.1%) | 72 (17.9%) |
| Total (Overall) | 788 (56.4%) | 609 (43.6%) |
Employment Industries by Sex in Olney
Employment Industries in Olney
The major employment industries in Olney include Manufacturing (406 | 29.1%), Health Care & Social Assistance (193 | 13.8%), Retail Trade (153 | 11.0%), Educational Services (133 | 9.5%), and Construction (104 | 7.4%).
Employment Industries by Sex in Olney
The Olney industries that see more men than women are Agriculture, Fishing & Hunting (100.0%), Mining, Quarrying, & Extraction (100.0%), and Construction (100.0%), whereas the industries that tend to have a higher number of women are Public Administration (100.0%), Health Care & Social Assistance (96.9%), and Retail Trade (79.7%).
| Industry | Male | Female |
| Agriculture, Fishing & Hunting | 40 (100.0%) | 0 (0.0%) |
| Mining, Quarrying, & Extraction | 61 (100.0%) | 0 (0.0%) |
| Construction | 104 (100.0%) | 0 (0.0%) |
| Manufacturing | 352 (86.7%) | 54 (13.3%) |
| Wholesale Trade | 0 (0.0%) | 0 (0.0%) |
| Retail Trade | 31 (20.3%) | 122 (79.7%) |
| Transportation & Warehousing | 7 (100.0%) | 0 (0.0%) |
| Utilities | 17 (100.0%) | 0 (0.0%) |
| Information | 0 (0.0%) | 0 (0.0%) |
| Finance & Insurance | 0 (0.0%) | 0 (0.0%) |
| Real Estate, Rental & Leasing | 4 (100.0%) | 0 (0.0%) |
| Professional & Scientific | 50 (49.0%) | 52 (51.0%) |
| Enterprise Management | 0 (0.0%) | 0 (0.0%) |
| Administrative & Support | 23 (35.4%) | 42 (64.6%) |
| Educational Services | 28 (21.0%) | 105 (78.9%) |
| Health Care & Social Assistance | 6 (3.1%) | 187 (96.9%) |
| Arts, Entertainment & Recreation | 0 (0.0%) | 0 (0.0%) |
| Accommodation & Food Services | 31 (100.0%) | 0 (0.0%) |
| Public Administration | 0 (0.0%) | 47 (100.0%) |
| Total | 788 (56.4%) | 609 (43.6%) |
Education in Olney
School Enrollment in Olney
The most common levels of schooling among the 613 students in Olney are elementary school (267 | 43.6%), high school (140 | 22.8%), and middle school (87 | 14.2%).
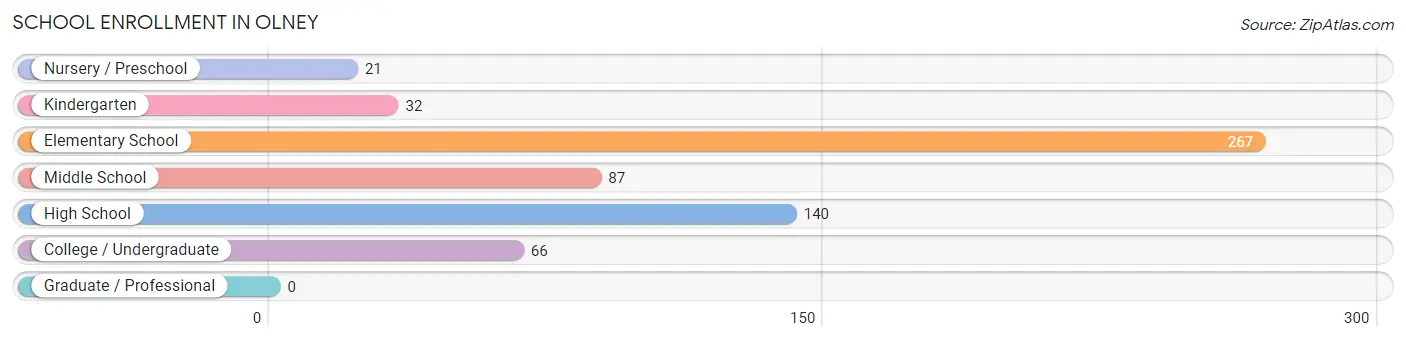
| School Level | # Students | % Students |
| Nursery / Preschool | 21 | 3.4% |
| Kindergarten | 32 | 5.2% |
| Elementary School | 267 | 43.6% |
| Middle School | 87 | 14.2% |
| High School | 140 | 22.8% |
| College / Undergraduate | 66 | 10.8% |
| Graduate / Professional | 0 | 0.0% |
| Total | 613 | 100.0% |
School Enrollment by Age by Funding Source in Olney
Out of a total of 613 students who are enrolled in schools in Olney, 95 (15.5%) attend a private institution, while the remaining 518 (84.5%) are enrolled in public schools. The age group of 18 to 19 year olds has the highest likelihood of being enrolled in private schools, with 35 (48.6% in the age bracket) enrolled. Conversely, the age group of 3 to 4 year olds has the lowest likelihood of being enrolled in a private school, with 21 (100.0% in the age bracket) attending a public institution.
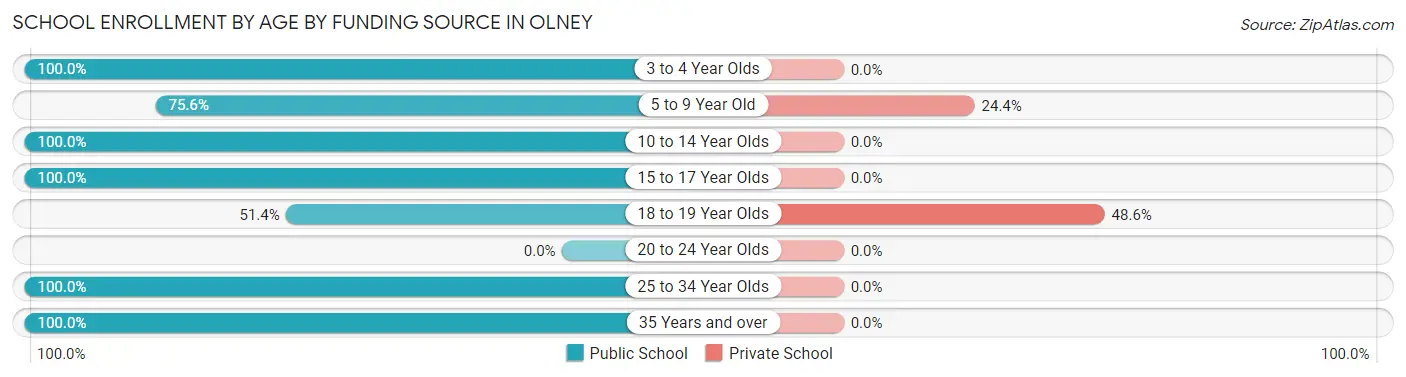
| Age Bracket | Public School | Private School |
| 3 to 4 Year Olds | 21 (100.0%) | 0 (0.0%) |
| 5 to 9 Year Old | 186 (75.6%) | 60 (24.4%) |
| 10 to 14 Year Olds | 140 (100.0%) | 0 (0.0%) |
| 15 to 17 Year Olds | 83 (100.0%) | 0 (0.0%) |
| 18 to 19 Year Olds | 37 (51.4%) | 35 (48.6%) |
| 20 to 24 Year Olds | 0 (0.0%) | 0 (0.0%) |
| 25 to 34 Year Olds | 31 (100.0%) | 0 (0.0%) |
| 35 Years and over | 20 (100.0%) | 0 (0.0%) |
| Total | 518 (84.5%) | 95 (15.5%) |
Educational Attainment by Field of Study in Olney
Education (180 | 35.9%), science & technology (74 | 14.8%), business (63 | 12.6%), social sciences (44 | 8.8%), and engineering (41 | 8.2%) are the most common fields of study among 501 individuals in Olney who have obtained a bachelor's degree or higher.
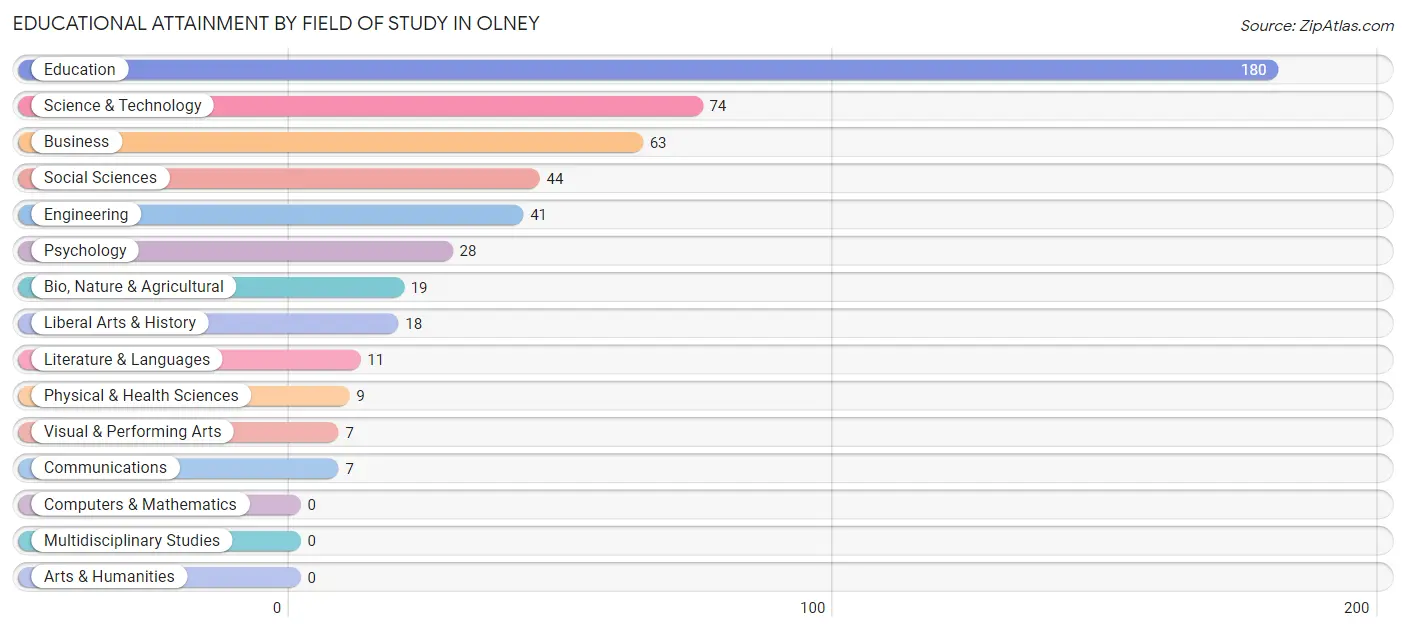
| Field of Study | # Graduates | % Graduates |
| Computers & Mathematics | 0 | 0.0% |
| Bio, Nature & Agricultural | 19 | 3.8% |
| Physical & Health Sciences | 9 | 1.8% |
| Psychology | 28 | 5.6% |
| Social Sciences | 44 | 8.8% |
| Engineering | 41 | 8.2% |
| Multidisciplinary Studies | 0 | 0.0% |
| Science & Technology | 74 | 14.8% |
| Business | 63 | 12.6% |
| Education | 180 | 35.9% |
| Literature & Languages | 11 | 2.2% |
| Liberal Arts & History | 18 | 3.6% |
| Visual & Performing Arts | 7 | 1.4% |
| Communications | 7 | 1.4% |
| Arts & Humanities | 0 | 0.0% |
| Total | 501 | 100.0% |
Transportation & Commute in Olney
Vehicle Availability by Sex in Olney
The most prevalent vehicle ownership categories in Olney are males with 2 vehicles (289, accounting for 37.6%) and females with 2 vehicles (224, making up 47.4%).
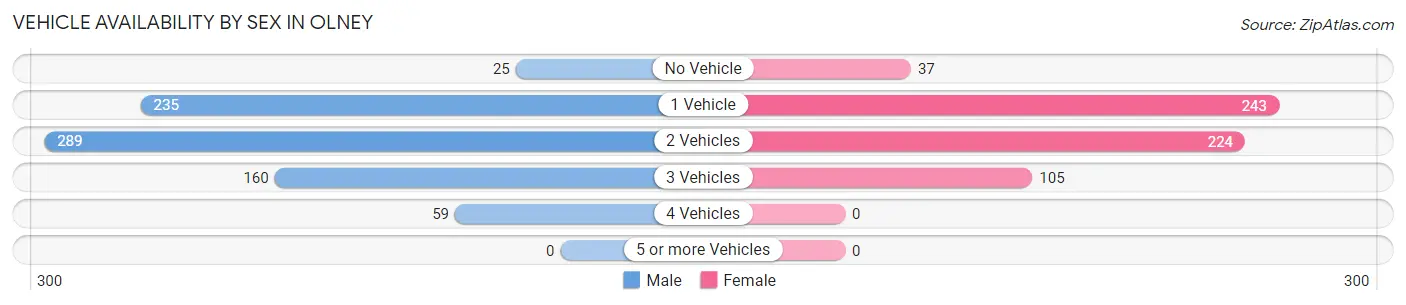
| Vehicles Available | Male | Female |
| No Vehicle | 25 (3.3%) | 37 (6.1%) |
| 1 Vehicle | 235 (30.6%) | 243 (39.9%) |
| 2 Vehicles | 289 (37.6%) | 224 (36.8%) |
| 3 Vehicles | 160 (20.8%) | 105 (17.2%) |
| 4 Vehicles | 59 (7.7%) | 0 (0.0%) |
| 5 or more Vehicles | 0 (0.0%) | 0 (0.0%) |
| Total | 768 (100.0%) | 609 (100.0%) |
Commute Time in Olney
The most frequently occuring commute durations in Olney are 5 to 9 minutes (695 commuters, 53.1%), less than 5 minutes (156 commuters, 11.9%), and 15 to 19 minutes (134 commuters, 10.2%).
| Commute Time | # Commuters | % Commuters |
| Less than 5 Minutes | 156 | 11.9% |
| 5 to 9 Minutes | 695 | 53.1% |
| 10 to 14 Minutes | 114 | 8.7% |
| 15 to 19 Minutes | 134 | 10.2% |
| 20 to 24 Minutes | 10 | 0.8% |
| 25 to 29 Minutes | 0 | 0.0% |
| 30 to 34 Minutes | 109 | 8.3% |
| 35 to 39 Minutes | 59 | 4.5% |
| 40 to 44 Minutes | 17 | 1.3% |
| 45 to 59 Minutes | 14 | 1.1% |
| 60 to 89 Minutes | 0 | 0.0% |
| 90 or more Minutes | 0 | 0.0% |
Commute Time by Sex in Olney
The most common commute times in Olney are 5 to 9 minutes (360 commuters, 50.0%) for males and 5 to 9 minutes (335 commuters, 57.0%) for females.
| Commute Time | Male | Female |
| Less than 5 Minutes | 131 (18.2%) | 25 (4.3%) |
| 5 to 9 Minutes | 360 (50.0%) | 335 (57.0%) |
| 10 to 14 Minutes | 97 (13.5%) | 17 (2.9%) |
| 15 to 19 Minutes | 94 (13.1%) | 40 (6.8%) |
| 20 to 24 Minutes | 0 (0.0%) | 10 (1.7%) |
| 25 to 29 Minutes | 0 (0.0%) | 0 (0.0%) |
| 30 to 34 Minutes | 7 (1.0%) | 102 (17.3%) |
| 35 to 39 Minutes | 0 (0.0%) | 59 (10.0%) |
| 40 to 44 Minutes | 17 (2.4%) | 0 (0.0%) |
| 45 to 59 Minutes | 14 (1.9%) | 0 (0.0%) |
| 60 to 89 Minutes | 0 (0.0%) | 0 (0.0%) |
| 90 or more Minutes | 0 (0.0%) | 0 (0.0%) |
Time of Departure to Work by Sex in Olney
The most frequent times of departure to work in Olney are 6:30 AM to 6:59 AM (206, 28.6%) for males and 7:30 AM to 7:59 AM (206, 35.0%) for females.
| Time of Departure | Male | Female |
| 12:00 AM to 4:59 AM | 76 (10.6%) | 0 (0.0%) |
| 5:00 AM to 5:29 AM | 0 (0.0%) | 0 (0.0%) |
| 5:30 AM to 5:59 AM | 59 (8.2%) | 75 (12.8%) |
| 6:00 AM to 6:29 AM | 37 (5.1%) | 0 (0.0%) |
| 6:30 AM to 6:59 AM | 206 (28.6%) | 75 (12.8%) |
| 7:00 AM to 7:29 AM | 72 (10.0%) | 100 (17.0%) |
| 7:30 AM to 7:59 AM | 63 (8.7%) | 206 (35.0%) |
| 8:00 AM to 8:29 AM | 129 (17.9%) | 10 (1.7%) |
| 8:30 AM to 8:59 AM | 0 (0.0%) | 0 (0.0%) |
| 9:00 AM to 9:59 AM | 17 (2.4%) | 47 (8.0%) |
| 10:00 AM to 10:59 AM | 0 (0.0%) | 50 (8.5%) |
| 11:00 AM to 11:59 AM | 0 (0.0%) | 0 (0.0%) |
| 12:00 PM to 3:59 PM | 0 (0.0%) | 25 (4.3%) |
| 4:00 PM to 11:59 PM | 61 (8.5%) | 0 (0.0%) |
| Total | 720 (100.0%) | 588 (100.0%) |
Housing Occupancy in Olney
Occupancy by Ownership in Olney
Of the total 1,393 dwellings in Olney, owner-occupied units account for 990 (71.1%), while renter-occupied units make up 403 (28.9%).
| Occupancy | # Housing Units | % Housing Units |
| Owner Occupied Housing Units | 990 | 71.1% |
| Renter-Occupied Housing Units | 403 | 28.9% |
| Total Occupied Housing Units | 1,393 | 100.0% |
Occupancy by Household Size in Olney
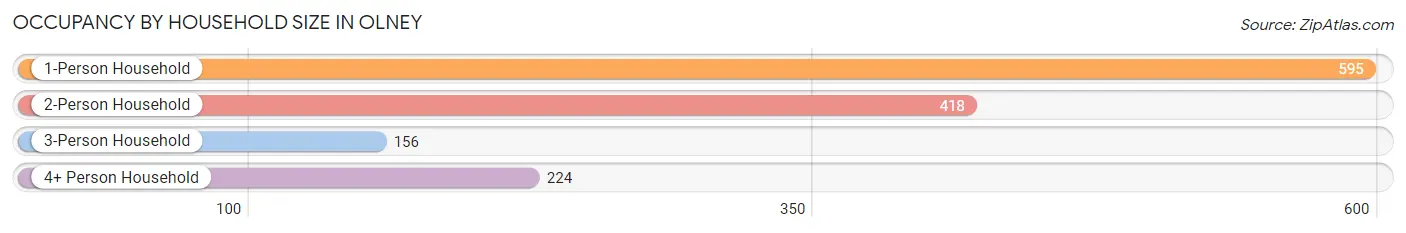
| Household Size | # Housing Units | % Housing Units |
| 1-Person Household | 595 | 42.7% |
| 2-Person Household | 418 | 30.0% |
| 3-Person Household | 156 | 11.2% |
| 4+ Person Household | 224 | 16.1% |
| Total Housing Units | 1,393 | 100.0% |
Occupancy by Ownership by Household Size in Olney
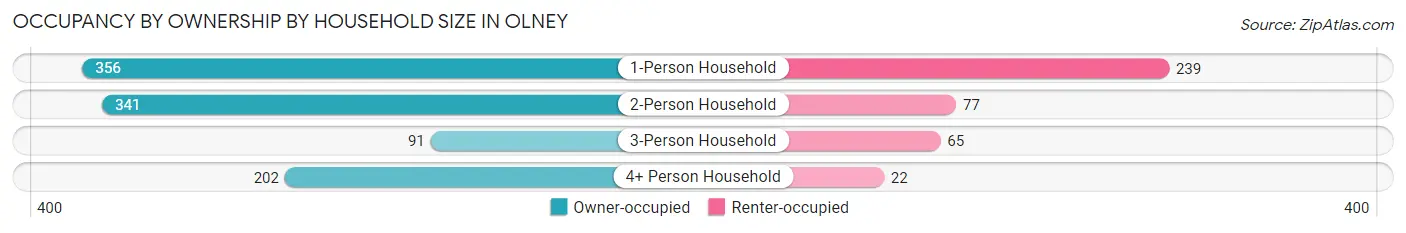
| Household Size | Owner-occupied | Renter-occupied |
| 1-Person Household | 356 (59.8%) | 239 (40.2%) |
| 2-Person Household | 341 (81.6%) | 77 (18.4%) |
| 3-Person Household | 91 (58.3%) | 65 (41.7%) |
| 4+ Person Household | 202 (90.2%) | 22 (9.8%) |
| Total Housing Units | 990 (71.1%) | 403 (28.9%) |
Occupancy by Educational Attainment in Olney
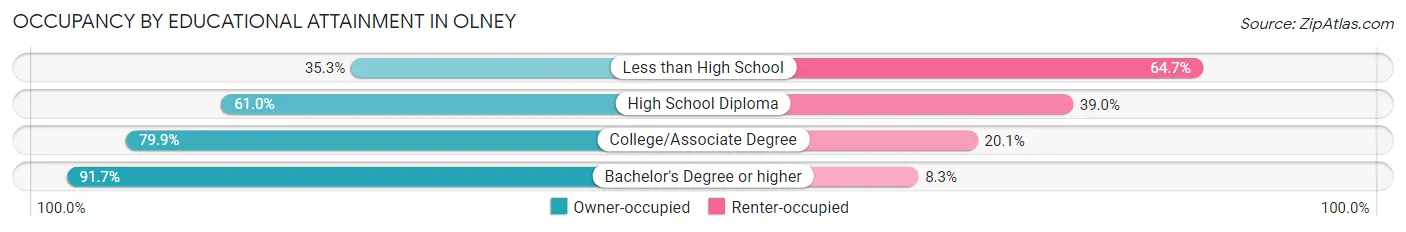
| Household Size | Owner-occupied | Renter-occupied |
| Less than High School | 54 (35.3%) | 99 (64.7%) |
| High School Diploma | 277 (61.0%) | 177 (39.0%) |
| College/Associate Degree | 417 (79.9%) | 105 (20.1%) |
| Bachelor's Degree or higher | 242 (91.7%) | 22 (8.3%) |
Occupancy by Age of Householder in Olney
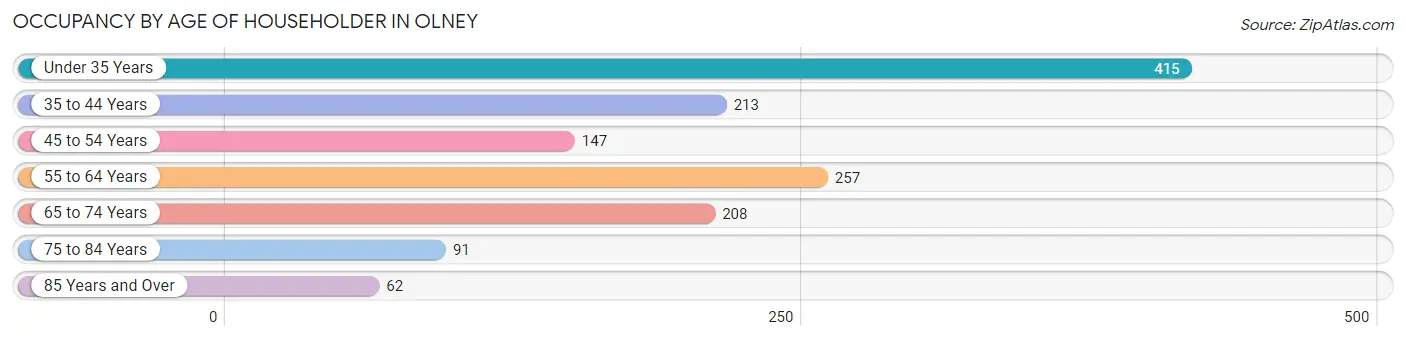
| Age Bracket | # Households | % Households |
| Under 35 Years | 415 | 29.8% |
| 35 to 44 Years | 213 | 15.3% |
| 45 to 54 Years | 147 | 10.5% |
| 55 to 64 Years | 257 | 18.4% |
| 65 to 74 Years | 208 | 14.9% |
| 75 to 84 Years | 91 | 6.5% |
| 85 Years and Over | 62 | 4.4% |
| Total | 1,393 | 100.0% |
Housing Finances in Olney
Median Income by Occupancy in Olney
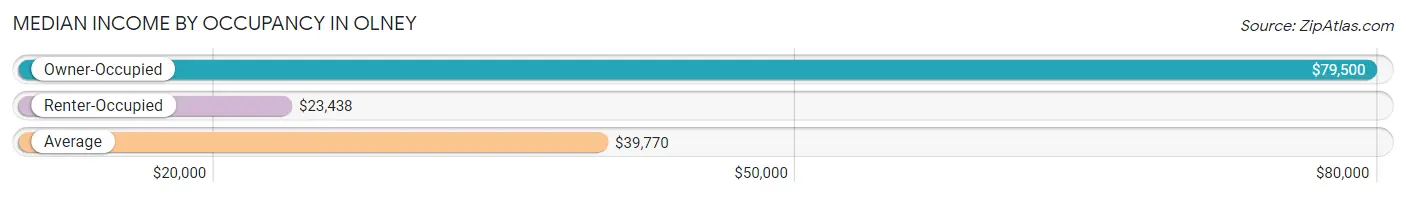
| Occupancy Type | # Households | Median Income |
| Owner-Occupied | 990 (71.1%) | $79,500 |
| Renter-Occupied | 403 (28.9%) | $23,438 |
| Average | 1,393 (100.0%) | $39,770 |
Occupancy by Householder Income Bracket in Olney
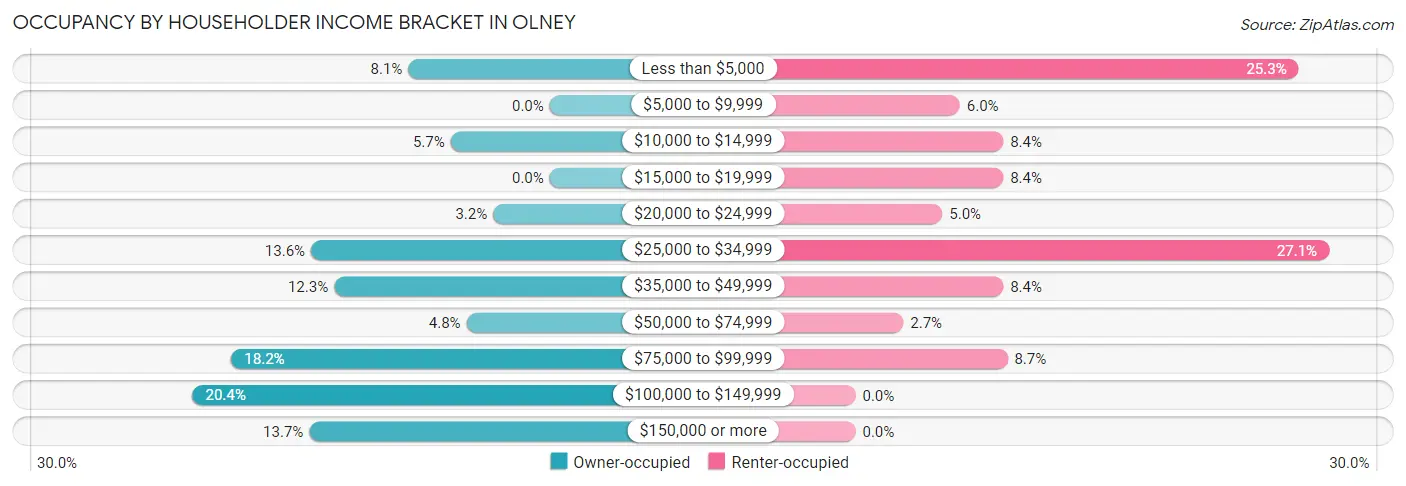
| Income Bracket | Owner-occupied | Renter-occupied |
| Less than $5,000 | 80 (8.1%) | 102 (25.3%) |
| $5,000 to $9,999 | 0 (0.0%) | 24 (6.0%) |
| $10,000 to $14,999 | 56 (5.7%) | 34 (8.4%) |
| $15,000 to $19,999 | 0 (0.0%) | 34 (8.4%) |
| $20,000 to $24,999 | 32 (3.2%) | 20 (5.0%) |
| $25,000 to $34,999 | 135 (13.6%) | 109 (27.1%) |
| $35,000 to $49,999 | 122 (12.3%) | 34 (8.4%) |
| $50,000 to $74,999 | 47 (4.8%) | 11 (2.7%) |
| $75,000 to $99,999 | 180 (18.2%) | 35 (8.7%) |
| $100,000 to $149,999 | 202 (20.4%) | 0 (0.0%) |
| $150,000 or more | 136 (13.7%) | 0 (0.0%) |
| Total | 990 (100.0%) | 403 (100.0%) |
Monthly Housing Cost Tiers in Olney
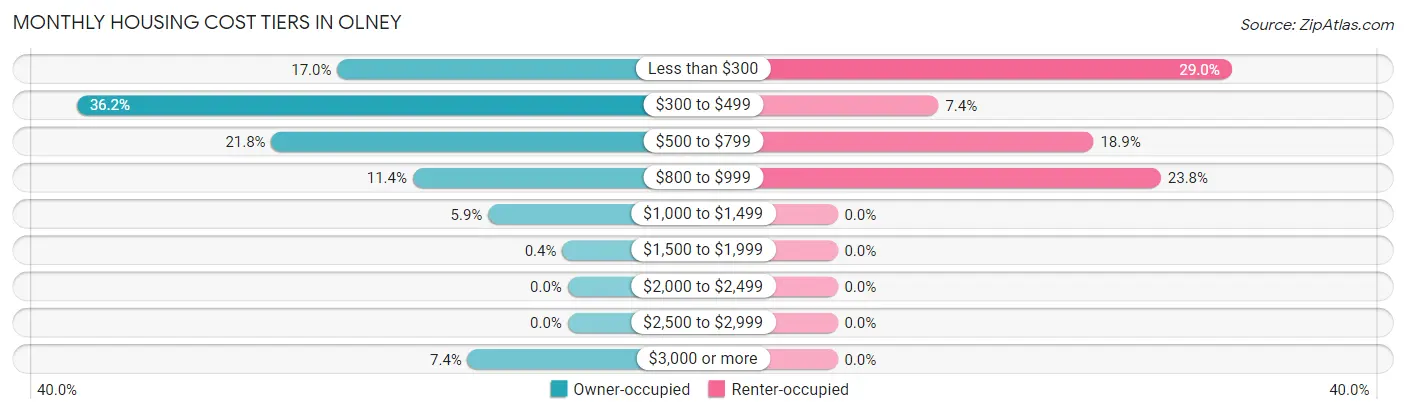
| Monthly Cost | Owner-occupied | Renter-occupied |
| Less than $300 | 168 (17.0%) | 117 (29.0%) |
| $300 to $499 | 358 (36.2%) | 30 (7.4%) |
| $500 to $799 | 216 (21.8%) | 76 (18.9%) |
| $800 to $999 | 113 (11.4%) | 96 (23.8%) |
| $1,000 to $1,499 | 58 (5.9%) | 0 (0.0%) |
| $1,500 to $1,999 | 4 (0.4%) | 0 (0.0%) |
| $2,000 to $2,499 | 0 (0.0%) | 0 (0.0%) |
| $2,500 to $2,999 | 0 (0.0%) | 0 (0.0%) |
| $3,000 or more | 73 (7.4%) | 0 (0.0%) |
| Total | 990 (100.0%) | 403 (100.0%) |
Physical Housing Characteristics in Olney
Housing Structures in Olney
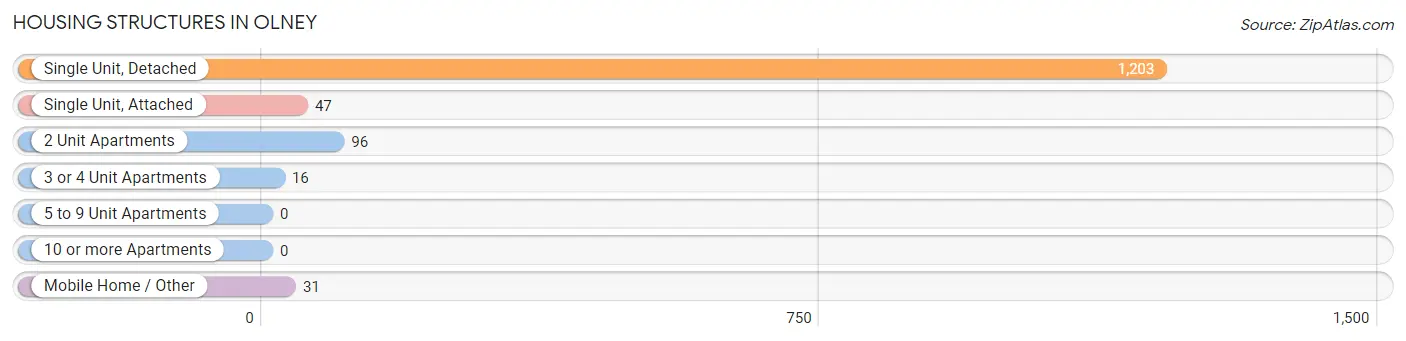
| Structure Type | # Housing Units | % Housing Units |
| Single Unit, Detached | 1,203 | 86.4% |
| Single Unit, Attached | 47 | 3.4% |
| 2 Unit Apartments | 96 | 6.9% |
| 3 or 4 Unit Apartments | 16 | 1.1% |
| 5 to 9 Unit Apartments | 0 | 0.0% |
| 10 or more Apartments | 0 | 0.0% |
| Mobile Home / Other | 31 | 2.2% |
| Total | 1,393 | 100.0% |
Housing Structures by Occupancy in Olney
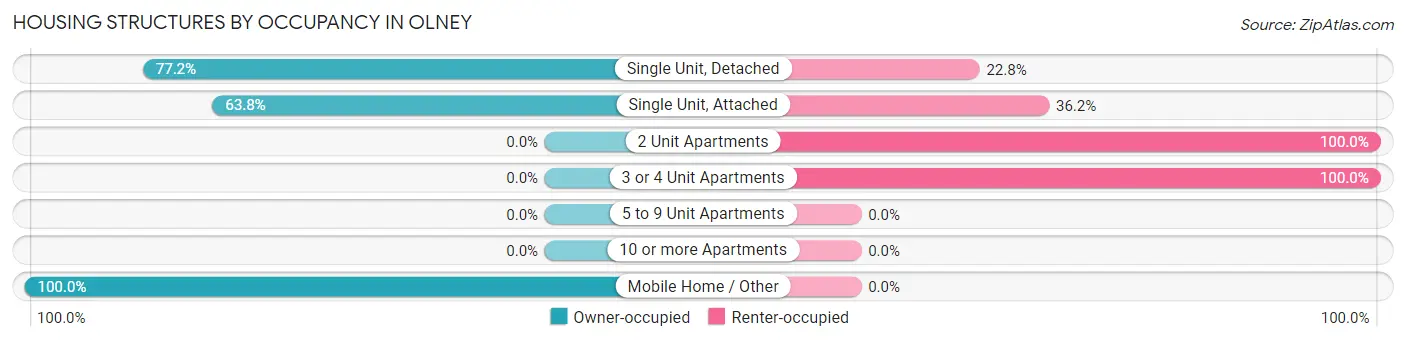
| Structure Type | Owner-occupied | Renter-occupied |
| Single Unit, Detached | 929 (77.2%) | 274 (22.8%) |
| Single Unit, Attached | 30 (63.8%) | 17 (36.2%) |
| 2 Unit Apartments | 0 (0.0%) | 96 (100.0%) |
| 3 or 4 Unit Apartments | 0 (0.0%) | 16 (100.0%) |
| 5 to 9 Unit Apartments | 0 (0.0%) | 0 (0.0%) |
| 10 or more Apartments | 0 (0.0%) | 0 (0.0%) |
| Mobile Home / Other | 31 (100.0%) | 0 (0.0%) |
| Total | 990 (71.1%) | 403 (28.9%) |
Housing Structures by Number of Rooms in Olney
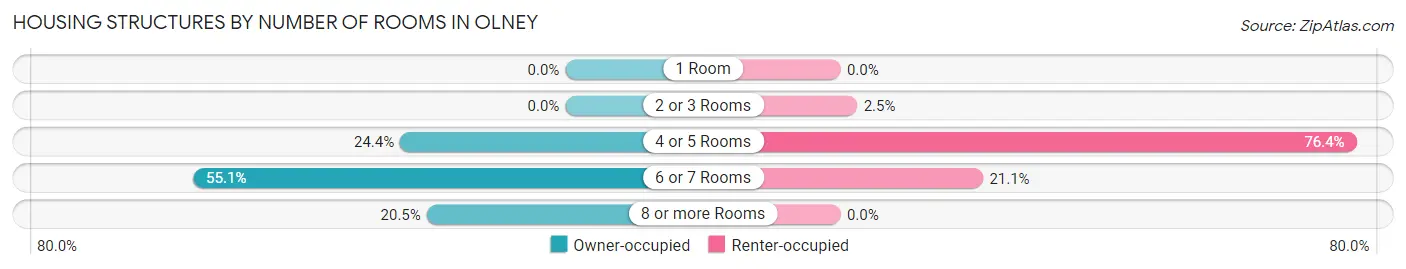
| Number of Rooms | Owner-occupied | Renter-occupied |
| 1 Room | 0 (0.0%) | 0 (0.0%) |
| 2 or 3 Rooms | 0 (0.0%) | 10 (2.5%) |
| 4 or 5 Rooms | 242 (24.4%) | 308 (76.4%) |
| 6 or 7 Rooms | 545 (55.0%) | 85 (21.1%) |
| 8 or more Rooms | 203 (20.5%) | 0 (0.0%) |
| Total | 990 (100.0%) | 403 (100.0%) |
Housing Structure by Heating Type in Olney
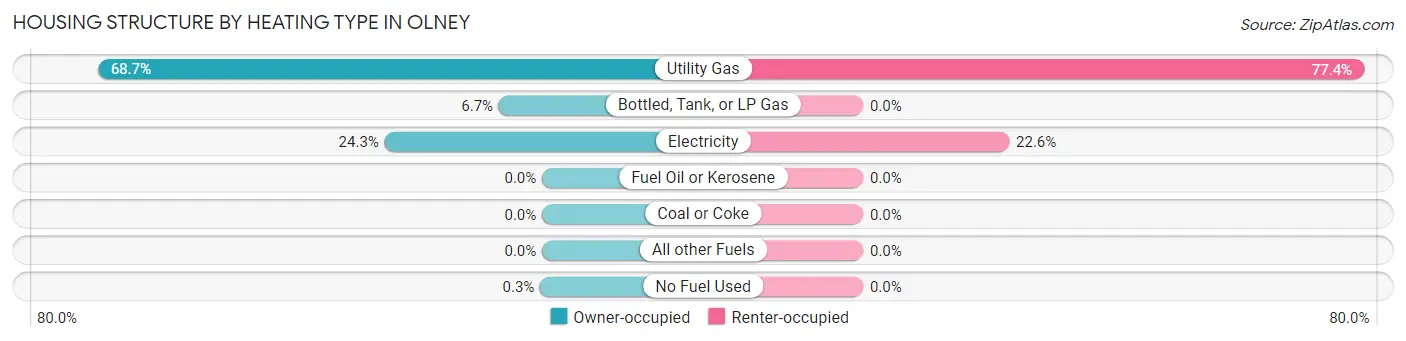
| Heating Type | Owner-occupied | Renter-occupied |
| Utility Gas | 680 (68.7%) | 312 (77.4%) |
| Bottled, Tank, or LP Gas | 66 (6.7%) | 0 (0.0%) |
| Electricity | 241 (24.3%) | 91 (22.6%) |
| Fuel Oil or Kerosene | 0 (0.0%) | 0 (0.0%) |
| Coal or Coke | 0 (0.0%) | 0 (0.0%) |
| All other Fuels | 0 (0.0%) | 0 (0.0%) |
| No Fuel Used | 3 (0.3%) | 0 (0.0%) |
| Total | 990 (100.0%) | 403 (100.0%) |
Household Vehicle Usage in Olney
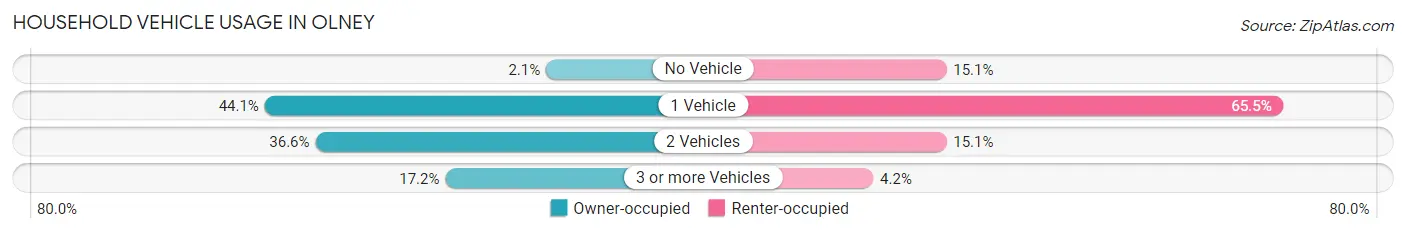
| Vehicles per Household | Owner-occupied | Renter-occupied |
| No Vehicle | 21 (2.1%) | 61 (15.1%) |
| 1 Vehicle | 437 (44.1%) | 264 (65.5%) |
| 2 Vehicles | 362 (36.6%) | 61 (15.1%) |
| 3 or more Vehicles | 170 (17.2%) | 17 (4.2%) |
| Total | 990 (100.0%) | 403 (100.0%) |
Real Estate & Mortgages in Olney
Real Estate and Mortgage Overview in Olney
| Characteristic | Without Mortgage | With Mortgage |
| Housing Units | 694 | 296 |
| Median Property Value | $73,700 | $96,500 |
| Median Household Income | $70,395 | $63 |
| Monthly Housing Costs | $386 | $73 |
| Real Estate Taxes | $749 | $0 |
Property Value by Mortgage Status in Olney
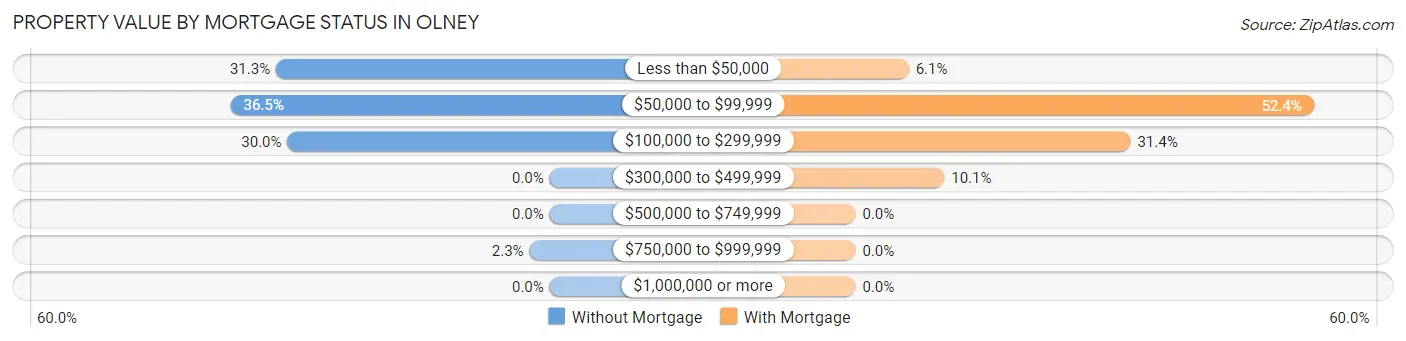
| Property Value | Without Mortgage | With Mortgage |
| Less than $50,000 | 217 (31.3%) | 18 (6.1%) |
| $50,000 to $99,999 | 253 (36.5%) | 155 (52.4%) |
| $100,000 to $299,999 | 208 (30.0%) | 93 (31.4%) |
| $300,000 to $499,999 | 0 (0.0%) | 30 (10.1%) |
| $500,000 to $749,999 | 0 (0.0%) | 0 (0.0%) |
| $750,000 to $999,999 | 16 (2.3%) | 0 (0.0%) |
| $1,000,000 or more | 0 (0.0%) | 0 (0.0%) |
| Total | 694 (100.0%) | 296 (100.0%) |
Household Income by Mortgage Status in Olney
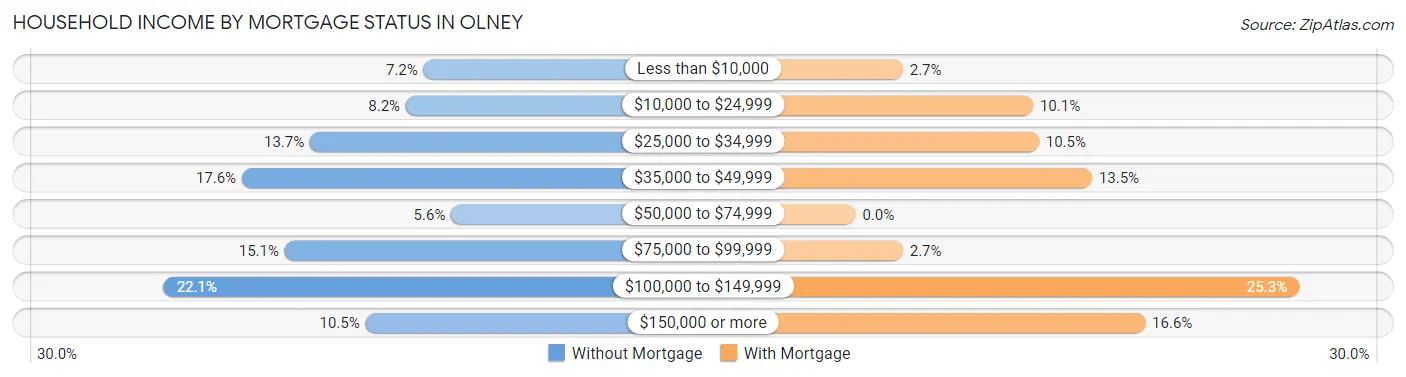
| Household Income | Without Mortgage | With Mortgage |
| Less than $10,000 | 50 (7.2%) | 8 (2.7%) |
| $10,000 to $24,999 | 57 (8.2%) | 30 (10.1%) |
| $25,000 to $34,999 | 95 (13.7%) | 31 (10.5%) |
| $35,000 to $49,999 | 122 (17.6%) | 40 (13.5%) |
| $50,000 to $74,999 | 39 (5.6%) | 0 (0.0%) |
| $75,000 to $99,999 | 105 (15.1%) | 8 (2.7%) |
| $100,000 to $149,999 | 153 (22.1%) | 75 (25.3%) |
| $150,000 or more | 73 (10.5%) | 49 (16.6%) |
| Total | 694 (100.0%) | 296 (100.0%) |
Property Value to Household Income Ratio in Olney
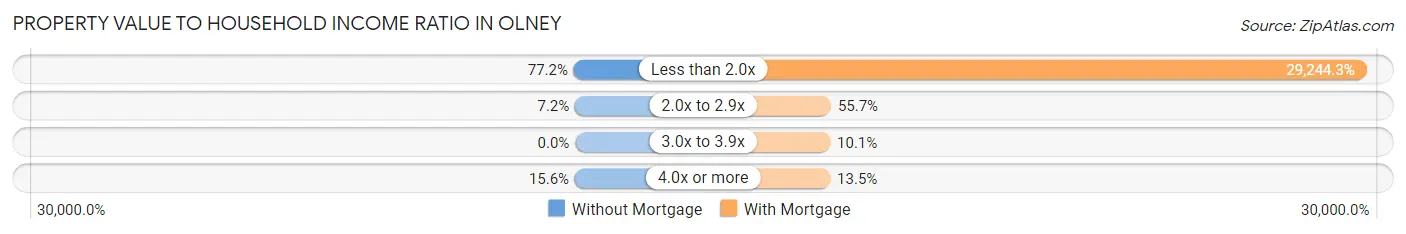
| Value-to-Income Ratio | Without Mortgage | With Mortgage |
| Less than 2.0x | 536 (77.2%) | 86,563 (29,244.3%) |
| 2.0x to 2.9x | 50 (7.2%) | 165 (55.7%) |
| 3.0x to 3.9x | 0 (0.0%) | 30 (10.1%) |
| 4.0x or more | 108 (15.6%) | 40 (13.5%) |
| Total | 694 (100.0%) | 296 (100.0%) |
Real Estate Taxes by Mortgage Status in Olney
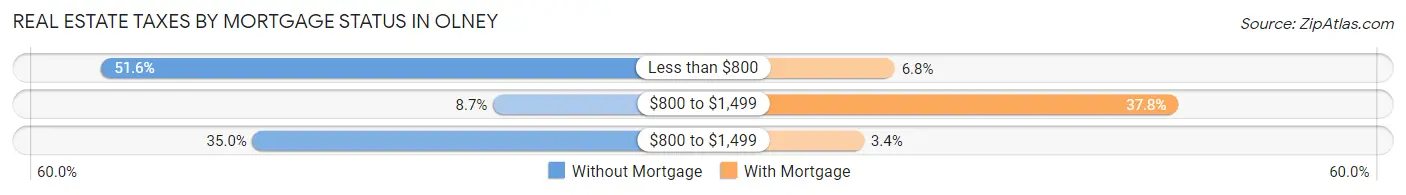
| Property Taxes | Without Mortgage | With Mortgage |
| Less than $800 | 358 (51.6%) | 20 (6.8%) |
| $800 to $1,499 | 60 (8.6%) | 112 (37.8%) |
| $800 to $1,499 | 243 (35.0%) | 10 (3.4%) |
| Total | 694 (100.0%) | 296 (100.0%) |
Health & Disability in Olney
Health Insurance Coverage by Age in Olney
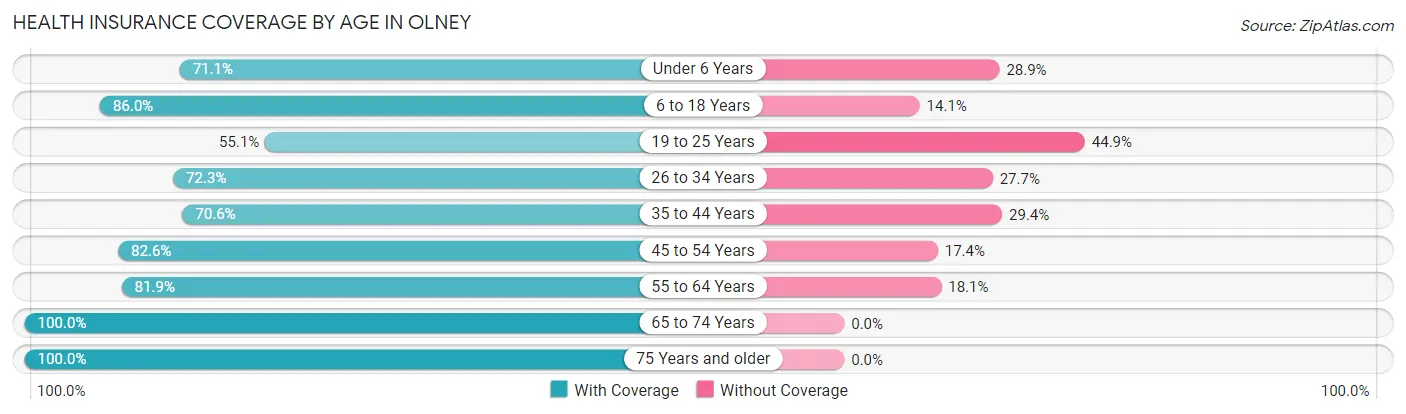
| Age Bracket | With Coverage | Without Coverage |
| Under 6 Years | 140 (71.1%) | 57 (28.9%) |
| 6 to 18 Years | 465 (86.0%) | 76 (14.1%) |
| 19 to 25 Years | 118 (55.1%) | 96 (44.9%) |
| 26 to 34 Years | 358 (72.3%) | 137 (27.7%) |
| 35 to 44 Years | 235 (70.6%) | 98 (29.4%) |
| 45 to 54 Years | 251 (82.6%) | 53 (17.4%) |
| 55 to 64 Years | 326 (81.9%) | 72 (18.1%) |
| 65 to 74 Years | 290 (100.0%) | 0 (0.0%) |
| 75 Years and older | 178 (100.0%) | 0 (0.0%) |
| Total | 2,361 (80.0%) | 589 (20.0%) |
Health Insurance Coverage by Citizenship Status in Olney
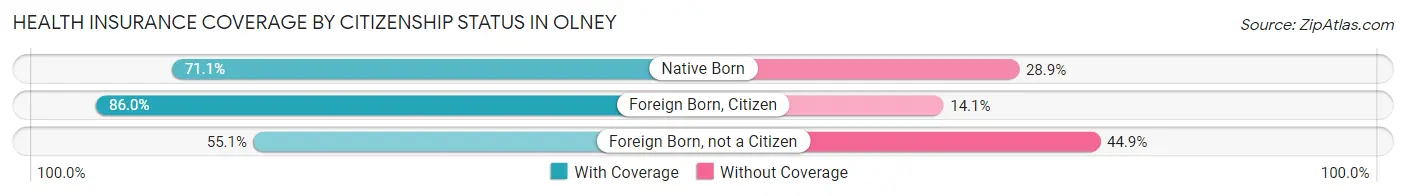
| Citizenship Status | With Coverage | Without Coverage |
| Native Born | 140 (71.1%) | 57 (28.9%) |
| Foreign Born, Citizen | 465 (86.0%) | 76 (14.1%) |
| Foreign Born, not a Citizen | 118 (55.1%) | 96 (44.9%) |
Health Insurance Coverage by Household Income in Olney
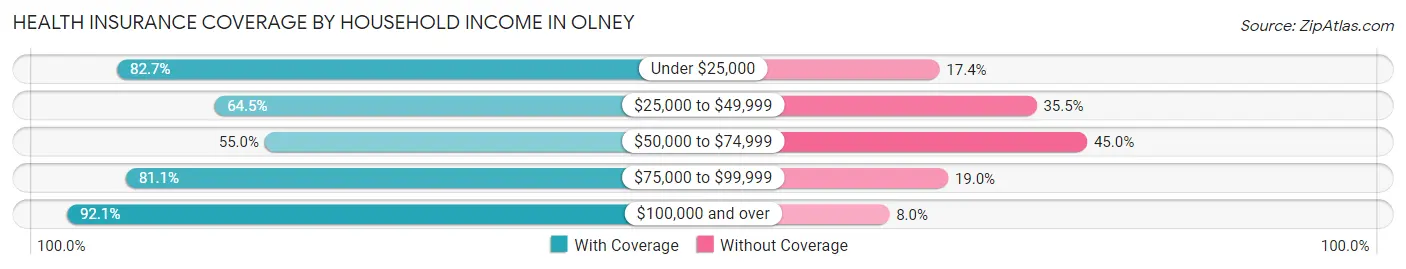
| Household Income | With Coverage | Without Coverage |
| Under $25,000 | 481 (82.7%) | 101 (17.3%) |
| $25,000 to $49,999 | 459 (64.5%) | 253 (35.5%) |
| $50,000 to $74,999 | 44 (55.0%) | 36 (45.0%) |
| $75,000 to $99,999 | 509 (81.0%) | 119 (19.0%) |
| $100,000 and over | 868 (92.0%) | 75 (8.0%) |
Public vs Private Health Insurance Coverage by Age in Olney
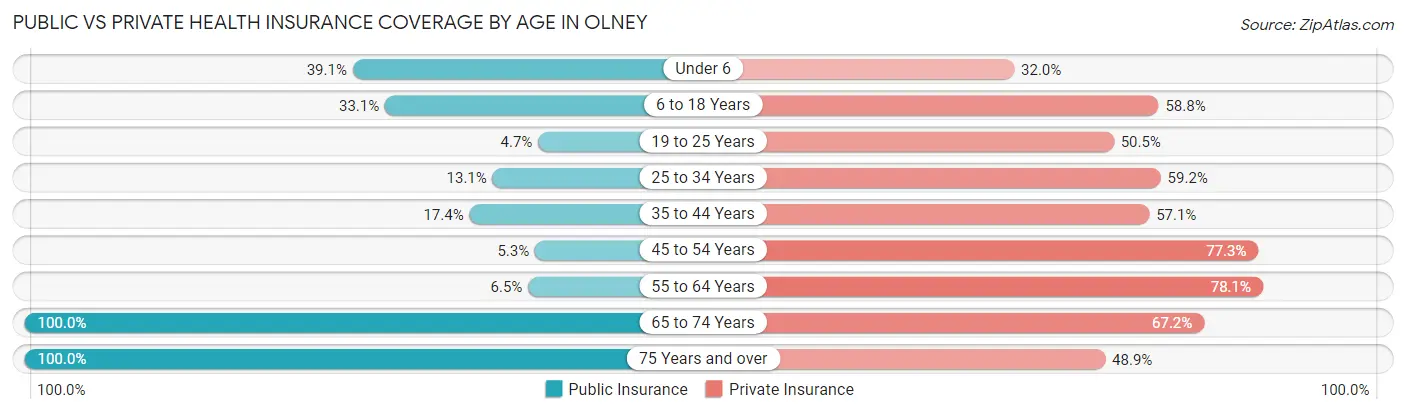
| Age Bracket | Public Insurance | Private Insurance |
| Under 6 | 77 (39.1%) | 63 (32.0%) |
| 6 to 18 Years | 179 (33.1%) | 318 (58.8%) |
| 19 to 25 Years | 10 (4.7%) | 108 (50.5%) |
| 25 to 34 Years | 65 (13.1%) | 293 (59.2%) |
| 35 to 44 Years | 58 (17.4%) | 190 (57.1%) |
| 45 to 54 Years | 16 (5.3%) | 235 (77.3%) |
| 55 to 64 Years | 26 (6.5%) | 311 (78.1%) |
| 65 to 74 Years | 290 (100.0%) | 195 (67.2%) |
| 75 Years and over | 178 (100.0%) | 87 (48.9%) |
| Total | 899 (30.5%) | 1,800 (61.0%) |
Disability Status by Sex by Age in Olney
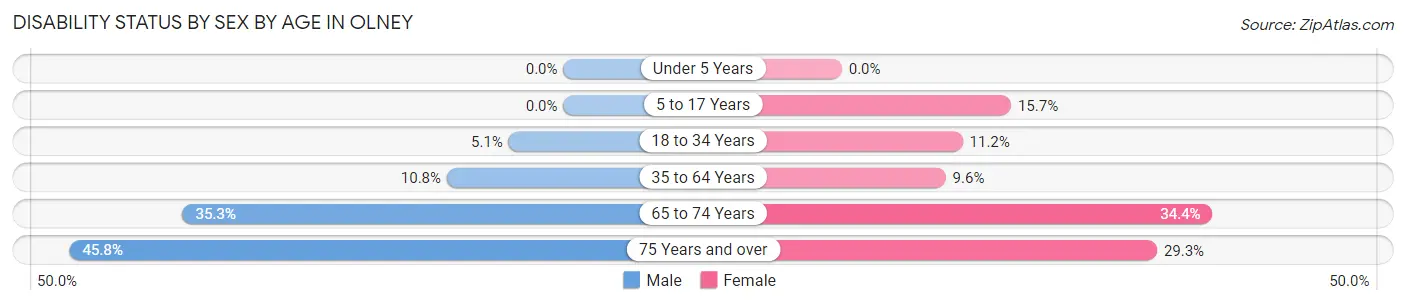
| Age Bracket | Male | Female |
| Under 5 Years | 0 (0.0%) | 0 (0.0%) |
| 5 to 17 Years | 0 (0.0%) | 27 (15.7%) |
| 18 to 34 Years | 17 (5.1%) | 50 (11.2%) |
| 35 to 64 Years | 67 (10.8%) | 40 (9.6%) |
| 65 to 74 Years | 47 (35.3%) | 54 (34.4%) |
| 75 Years and over | 33 (45.8%) | 31 (29.2%) |
Disability Class by Sex by Age in Olney
Disability Class: Hearing Difficulty
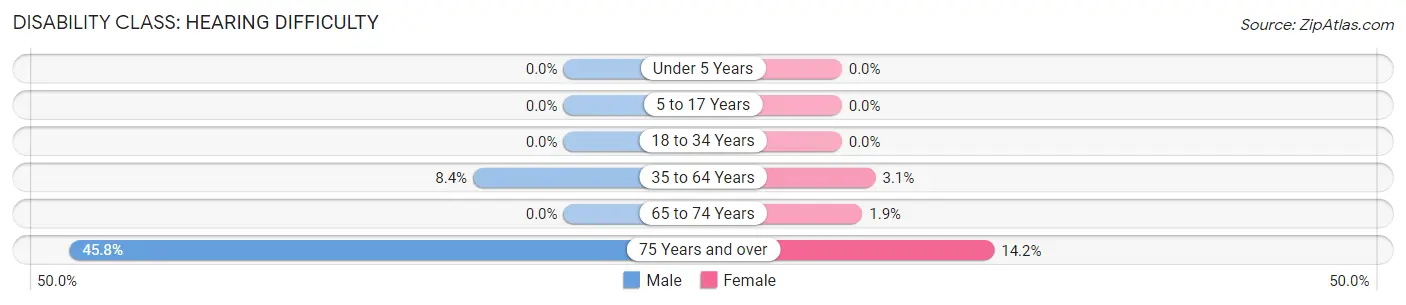
| Age Bracket | Male | Female |
| Under 5 Years | 0 (0.0%) | 0 (0.0%) |
| 5 to 17 Years | 0 (0.0%) | 0 (0.0%) |
| 18 to 34 Years | 0 (0.0%) | 0 (0.0%) |
| 35 to 64 Years | 52 (8.4%) | 13 (3.1%) |
| 65 to 74 Years | 0 (0.0%) | 3 (1.9%) |
| 75 Years and over | 33 (45.8%) | 15 (14.1%) |
Disability Class: Vision Difficulty
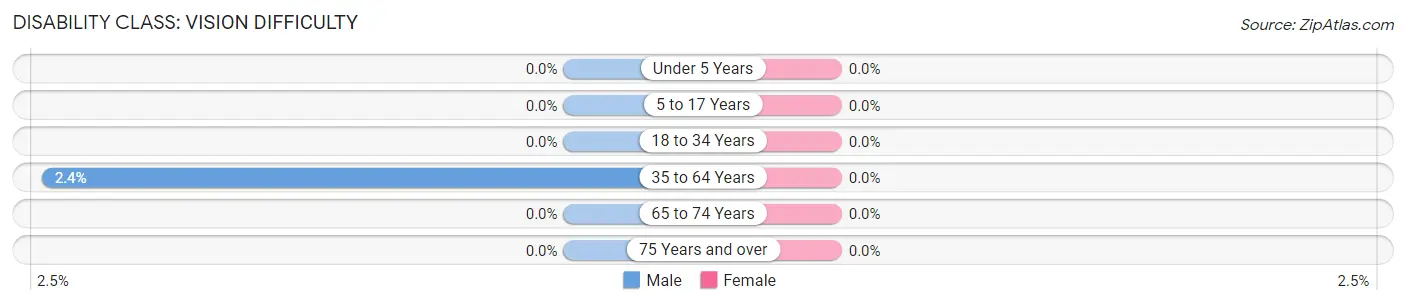
| Age Bracket | Male | Female |
| Under 5 Years | 0 (0.0%) | 0 (0.0%) |
| 5 to 17 Years | 0 (0.0%) | 0 (0.0%) |
| 18 to 34 Years | 0 (0.0%) | 0 (0.0%) |
| 35 to 64 Years | 15 (2.4%) | 0 (0.0%) |
| 65 to 74 Years | 0 (0.0%) | 0 (0.0%) |
| 75 Years and over | 0 (0.0%) | 0 (0.0%) |
Disability Class: Cognitive Difficulty
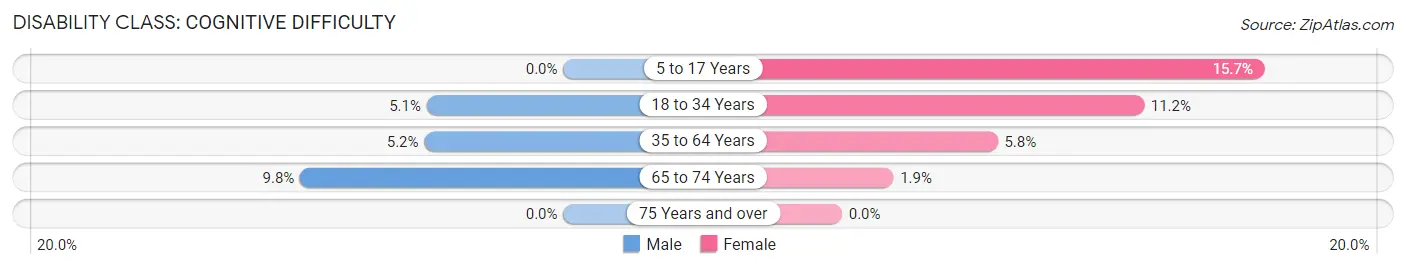
| Age Bracket | Male | Female |
| 5 to 17 Years | 0 (0.0%) | 27 (15.7%) |
| 18 to 34 Years | 17 (5.1%) | 50 (11.2%) |
| 35 to 64 Years | 32 (5.2%) | 24 (5.8%) |
| 65 to 74 Years | 13 (9.8%) | 3 (1.9%) |
| 75 Years and over | 0 (0.0%) | 0 (0.0%) |
Disability Class: Ambulatory Difficulty
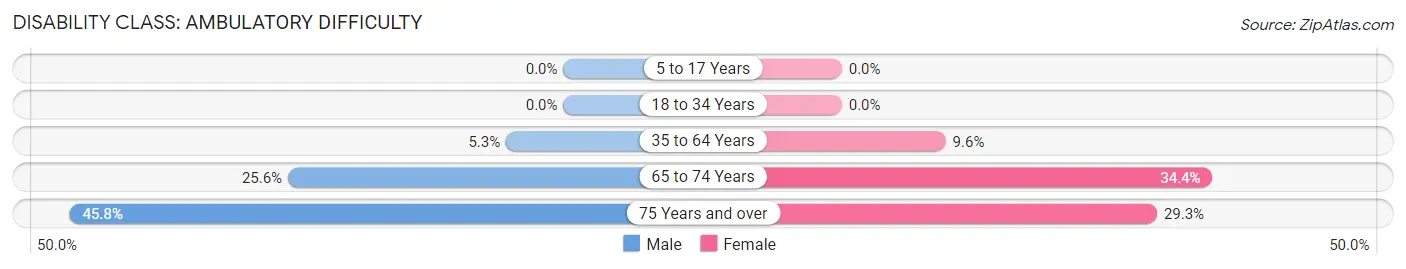
| Age Bracket | Male | Female |
| 5 to 17 Years | 0 (0.0%) | 0 (0.0%) |
| 18 to 34 Years | 0 (0.0%) | 0 (0.0%) |
| 35 to 64 Years | 33 (5.3%) | 40 (9.6%) |
| 65 to 74 Years | 34 (25.6%) | 54 (34.4%) |
| 75 Years and over | 33 (45.8%) | 31 (29.2%) |
Disability Class: Self-Care Difficulty
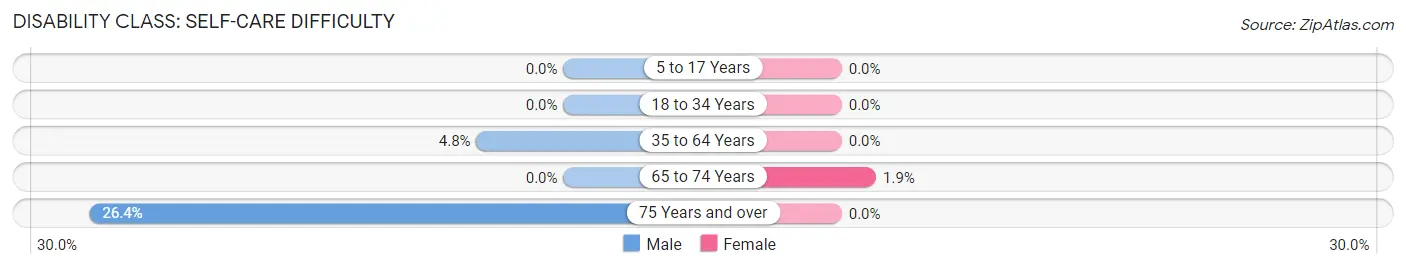
| Age Bracket | Male | Female |
| 5 to 17 Years | 0 (0.0%) | 0 (0.0%) |
| 18 to 34 Years | 0 (0.0%) | 0 (0.0%) |
| 35 to 64 Years | 30 (4.8%) | 0 (0.0%) |
| 65 to 74 Years | 0 (0.0%) | 3 (1.9%) |
| 75 Years and over | 19 (26.4%) | 0 (0.0%) |
Technology Access in Olney
Computing Device Access in Olney
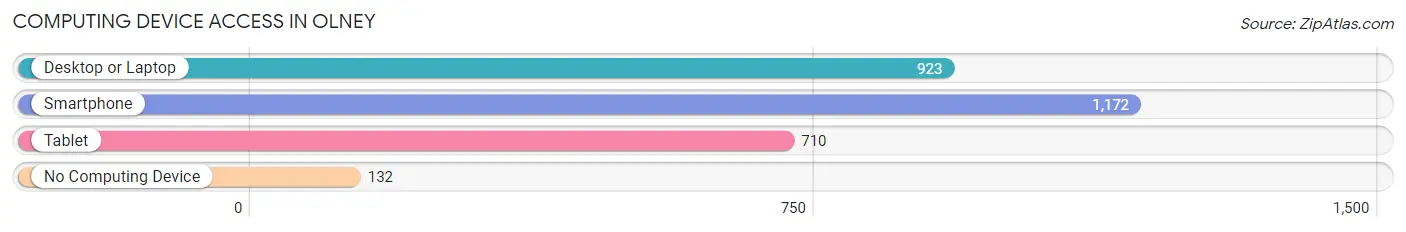
| Device Type | # Households | % Households |
| Desktop or Laptop | 923 | 66.3% |
| Smartphone | 1,172 | 84.1% |
| Tablet | 710 | 51.0% |
| No Computing Device | 132 | 9.5% |
| Total | 1,393 | 100.0% |
Internet Access in Olney
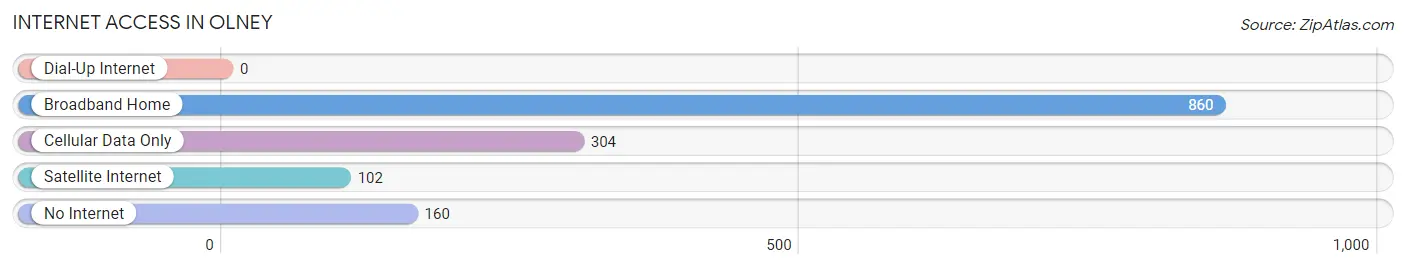
| Internet Type | # Households | % Households |
| Dial-Up Internet | 0 | 0.0% |
| Broadband Home | 860 | 61.7% |
| Cellular Data Only | 304 | 21.8% |
| Satellite Internet | 102 | 7.3% |
| No Internet | 160 | 11.5% |
| Total | 1,393 | 100.0% |
Olney Summary
Olney, Texas is a small town located in Young County, Texas, United States. It is situated approximately 100 miles northwest of Fort Worth and is the county seat of Young County. The population of Olney was 3,084 at the 2010 census.
History
Olney was founded in 1876 by a group of settlers from Illinois. The town was named after the hometown of one of the settlers, Olney, Illinois. The town was incorporated in 1881 and the first post office was established in 1882.
The town grew rapidly in the late 19th century and early 20th century due to the discovery of oil in the area. The first oil well was drilled in Olney in 1901 and the town quickly became a center for oil production. The population of Olney peaked in the 1920s and 1930s, reaching a high of 5,000 people.
Geography
Olney is located at 33°25'25" North, 98°37'45" West (33.423, -98.629). The town is situated in the rolling hills of north central Texas, approximately 100 miles northwest of Fort Worth. The town is located in the Brazos River Valley and is surrounded by the cities of Graham, Jacksboro, and Newcastle.
The climate in Olney is characterized by hot, humid summers and mild winters. The average annual temperature is 68°F (20°C). The average annual precipitation is 33 inches (84 cm).
Economy
The economy of Olney is largely based on agriculture and oil production. The town is home to several large farms and ranches, as well as several oil and gas production companies. The town is also home to several small businesses, including restaurants, retail stores, and service providers.
Demographics
As of the 2010 census, the population of Olney was 3,084. The racial makeup of the town was 81.3% White, 11.3% Hispanic or Latino, 5.2% African American, 0.7% Native American, 0.3% Asian, and 1.4% from other races.
The median household income in Olney was $37,917 in 2010. The per capita income was $17,945. The median age of the population was 37.7 years. The town had a poverty rate of 17.3%.
Conclusion
Olney, Texas is a small town located in Young County, Texas, United States. It is situated approximately 100 miles northwest of Fort Worth and is the county seat of Young County. The population of Olney was 3,084 at the 2010 census. The town was founded in 1876 and has a long history of oil production. The economy of Olney is largely based on agriculture and oil production. The racial makeup of the town was 81.3% White, 11.3% Hispanic or Latino, 5.2% African American, 0.7% Native American, 0.3% Asian, and 1.4% from other races. The median household income in Olney was $37,917 in 2010. The per capita income was $17,945. The median age of the population was 37.7 years. The town had a poverty rate of 17.3%. Olney is a small town with a rich history and a diverse population.
Common Questions
What is Per Capita Income in Olney?
Per Capita income in Olney is $30,521.
What is the Median Family Income in Olney?
Median Family Income in Olney is $88,095.
What is the Median Household income in Olney?
Median Household Income in Olney is $39,770.
What is Income or Wage Gap in Olney?
Income or Wage Gap in Olney is 45.3%.
Women in Olney earn 54.7 cents for every dollar earned by a man.
What is Inequality or Gini Index in Olney?
Inequality or Gini Index in Olney is 0.50.
What is the Total Population of Olney?
Total Population of Olney is 3,016.
What is the Total Male Population of Olney?
Total Male Population of Olney is 1,537.
What is the Total Female Population of Olney?
Total Female Population of Olney is 1,479.
What is the Ratio of Males per 100 Females in Olney?
There are 103.92 Males per 100 Females in Olney.
What is the Ratio of Females per 100 Males in Olney?
There are 96.23 Females per 100 Males in Olney.
What is the Median Population Age in Olney?
Median Population Age in Olney is 36.2 Years.
What is the Average Family Size in Olney
Average Family Size in Olney is 2.8 People.
What is the Average Household Size in Olney
Average Household Size in Olney is 2.1 People.
How Large is the Labor Force in Olney?
There are 1,518 People in the Labor Forcein in Olney.
What is the Percentage of People in the Labor Force in Olney?
63.2% of People are in the Labor Force in Olney.
What is the Unemployment Rate in Olney?
Unemployment Rate in Olney is 8.0%.