Nocona, TX Map & Demographics
Nocona Map
Nocona Overview
$20,578
PER CAPITA INCOME
$61,250
AVG FAMILY INCOME
$42,104
AVG HOUSEHOLD INCOME
51.9%
WAGE / INCOME GAP [ % ]
48.1¢/ $1
WAGE / INCOME GAP [ $ ]
0.46
INEQUALITY / GINI INDEX
3,027
TOTAL POPULATION
1,357
MALE POPULATION
1,670
FEMALE POPULATION
81.26
MALES / 100 FEMALES
123.07
FEMALES / 100 MALES
32.5
MEDIAN AGE
4.0
AVG FAMILY SIZE
2.8
AVG HOUSEHOLD SIZE
1,243
LABOR FORCE [ PEOPLE ]
55.9%
PERCENT IN LABOR FORCE
15.7%
UNEMPLOYMENT RATE
Nocona Zip Codes
Nocona Area Codes
Income in Nocona
Income Overview in Nocona
Per Capita Income in Nocona is $20,578, while median incomes of families and households are $61,250 and $42,104 respectively.
| Characteristic | Number | Measure |
| Per Capita Income | 3,027 | $20,578 |
| Median Family Income | 609 | $61,250 |
| Mean Family Income | 609 | $71,225 |
| Median Household Income | 1,055 | $42,104 |
| Mean Household Income | 1,055 | $55,364 |
| Income Deficit | 609 | $0 |
| Wage / Income Gap (%) | 3,027 | 51.93% |
| Wage / Income Gap ($) | 3,027 | 48.07¢ per $1 |
| Gini / Inequality Index | 3,027 | 0.46 |
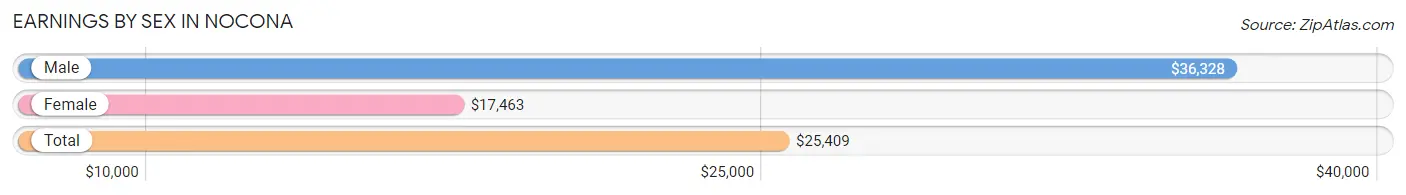
Earnings by Sex in Nocona
Average Earnings in Nocona are $25,409, $36,328 for men and $17,463 for women, a difference of 51.9%.
| Sex | Number | Average Earnings |
| Male | 647 (52.8%) | $36,328 |
| Female | 578 (47.2%) | $17,463 |
| Total | 1,225 (100.0%) | $25,409 |
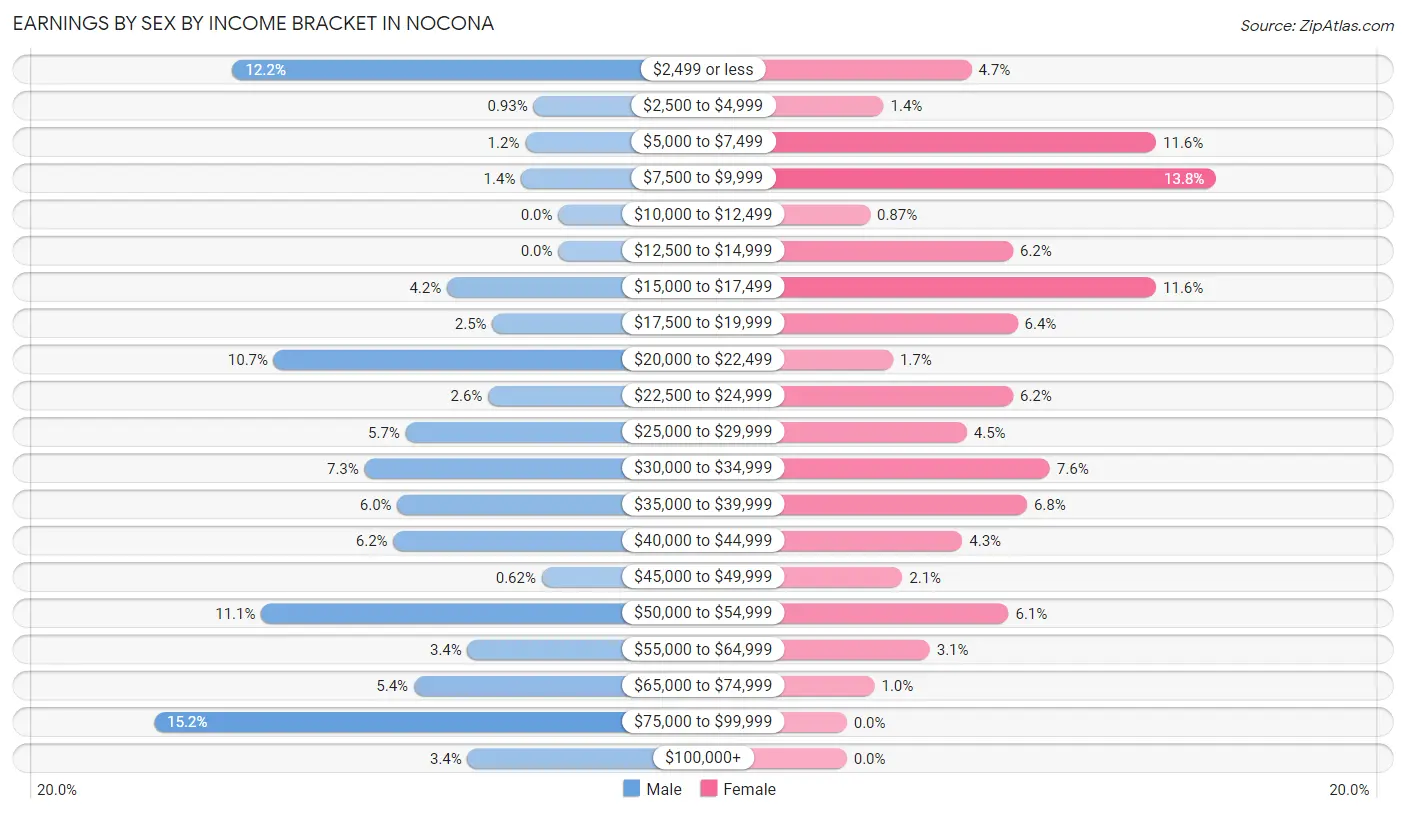
Earnings by Sex by Income Bracket in Nocona
The most common earnings brackets in Nocona are $75,000 to $99,999 for men (98 | 15.1%) and $7,500 to $9,999 for women (80 | 13.8%).
| Income | Male | Female |
| $2,499 or less | 79 (12.2%) | 27 (4.7%) |
| $2,500 to $4,999 | 6 (0.9%) | 8 (1.4%) |
| $5,000 to $7,499 | 8 (1.2%) | 67 (11.6%) |
| $7,500 to $9,999 | 9 (1.4%) | 80 (13.8%) |
| $10,000 to $12,499 | 0 (0.0%) | 5 (0.9%) |
| $12,500 to $14,999 | 0 (0.0%) | 36 (6.2%) |
| $15,000 to $17,499 | 27 (4.2%) | 67 (11.6%) |
| $17,500 to $19,999 | 16 (2.5%) | 37 (6.4%) |
| $20,000 to $22,499 | 69 (10.7%) | 10 (1.7%) |
| $22,500 to $24,999 | 17 (2.6%) | 36 (6.2%) |
| $25,000 to $29,999 | 37 (5.7%) | 26 (4.5%) |
| $30,000 to $34,999 | 47 (7.3%) | 44 (7.6%) |
| $35,000 to $39,999 | 39 (6.0%) | 39 (6.8%) |
| $40,000 to $44,999 | 40 (6.2%) | 25 (4.3%) |
| $45,000 to $49,999 | 4 (0.6%) | 12 (2.1%) |
| $50,000 to $54,999 | 72 (11.1%) | 35 (6.1%) |
| $55,000 to $64,999 | 22 (3.4%) | 18 (3.1%) |
| $65,000 to $74,999 | 35 (5.4%) | 6 (1.0%) |
| $75,000 to $99,999 | 98 (15.1%) | 0 (0.0%) |
| $100,000+ | 22 (3.4%) | 0 (0.0%) |
| Total | 647 (100.0%) | 578 (100.0%) |
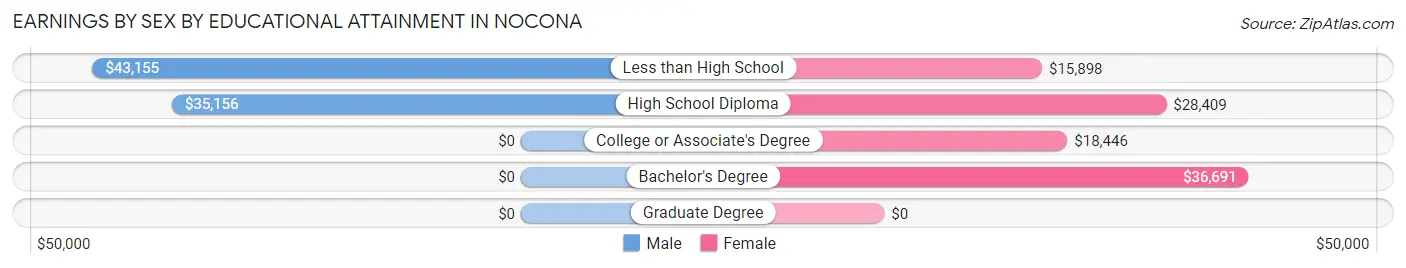
Earnings by Sex by Educational Attainment in Nocona
Average earnings in Nocona are $42,702 for men and $22,604 for women, a difference of 47.1%. Men with an educational attainment of less than high school enjoy the highest average annual earnings of $43,155, while those with high school diploma education earn the least with $35,156. Women with an educational attainment of bachelor's degree earn the most with the average annual earnings of $36,691, while those with less than high school education have the smallest earnings of $15,898.
| Educational Attainment | Male Income | Female Income |
| Less than High School | $43,155 | $15,898 |
| High School Diploma | $35,156 | $28,409 |
| College or Associate's Degree | - | - |
| Bachelor's Degree | - | - |
| Graduate Degree | - | - |
| Total | $42,702 | $22,604 |
Family Income in Nocona
Family Income Brackets in Nocona
According to the Nocona family income data, there are 168 families falling into the $50,000 to $74,999 income range, which is the most common income bracket and makes up 27.6% of all families.
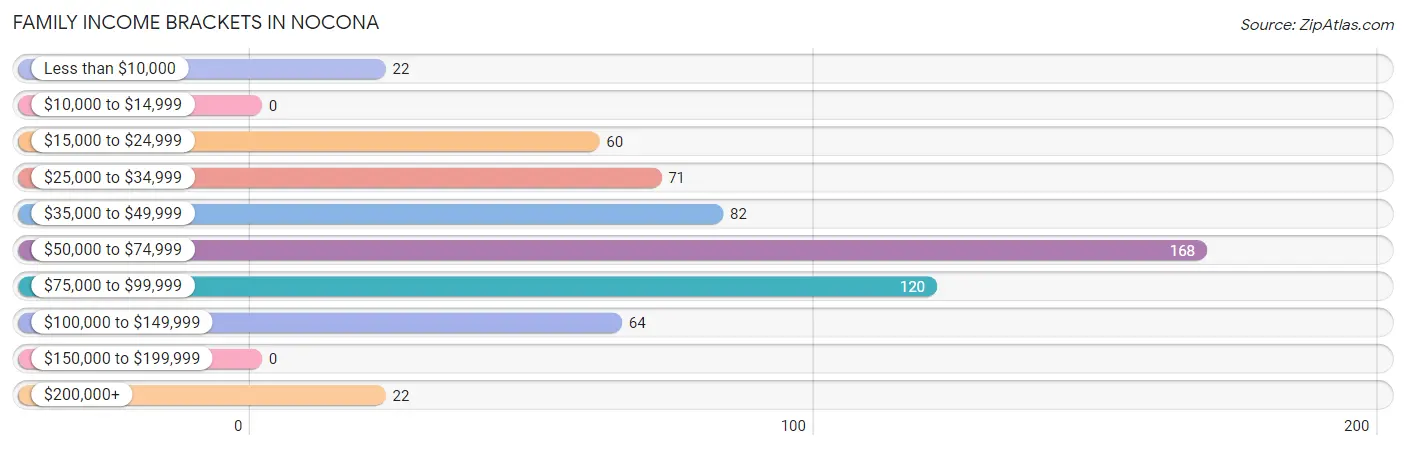
| Income Bracket | # Families | % Families |
| Less than $10,000 | 22 | 3.6% |
| $10,000 to $14,999 | 0 | 0.0% |
| $15,000 to $24,999 | 60 | 9.9% |
| $25,000 to $34,999 | 71 | 11.7% |
| $35,000 to $49,999 | 82 | 13.5% |
| $50,000 to $74,999 | 168 | 27.6% |
| $75,000 to $99,999 | 120 | 19.7% |
| $100,000 to $149,999 | 64 | 10.5% |
| $150,000 to $199,999 | 0 | 0.0% |
| $200,000+ | 22 | 3.6% |
Family Income by Famaliy Size in Nocona
5-person families (80 | 13.1%) account for the highest median family income in Nocona with $93,113 per family, while 2-person families (185 | 30.4%) have the highest median income of $31,287 per family member.
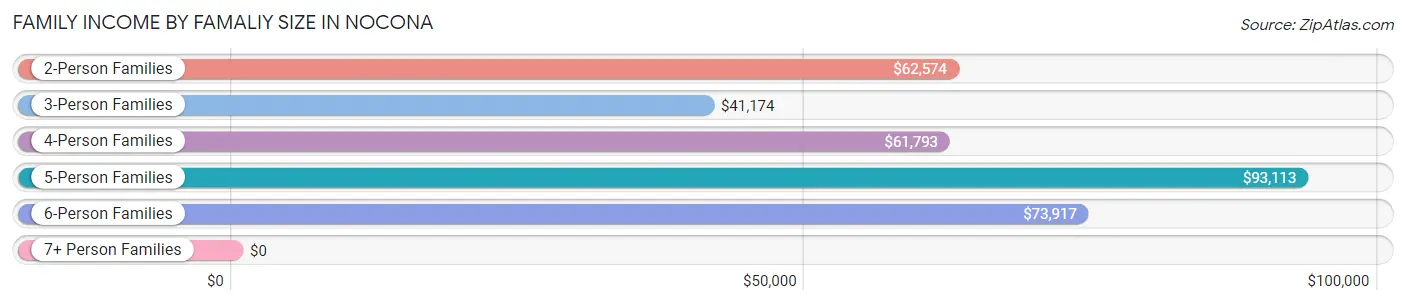
| Income Bracket | # Families | Median Income |
| 2-Person Families | 185 (30.4%) | $62,574 |
| 3-Person Families | 133 (21.8%) | $41,174 |
| 4-Person Families | 171 (28.1%) | $61,793 |
| 5-Person Families | 80 (13.1%) | $93,113 |
| 6-Person Families | 27 (4.4%) | $73,917 |
| 7+ Person Families | 13 (2.1%) | $0 |
| Total | 609 (100.0%) | $61,250 |
Family Income by Number of Earners in Nocona
The median family income in Nocona is $61,250, with families comprising 2 earners (246) having the highest median family income of $92,830, while families with no earners (98) have the lowest median family income of $33,777, accounting for 40.4% and 16.1% of families, respectively.
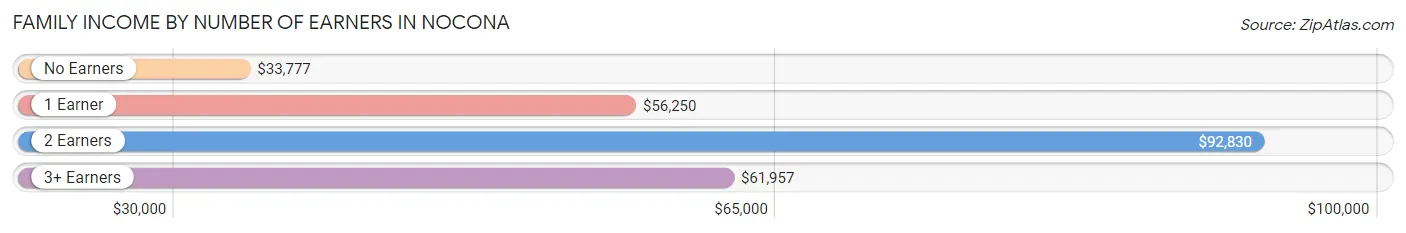
| Number of Earners | # Families | Median Income |
| No Earners | 98 (16.1%) | $33,777 |
| 1 Earner | 211 (34.6%) | $56,250 |
| 2 Earners | 246 (40.4%) | $92,830 |
| 3+ Earners | 54 (8.9%) | $61,957 |
| Total | 609 (100.0%) | $61,250 |
Household Income in Nocona
Household Income Brackets in Nocona
With 239 households falling in the category, the $50,000 to $74,999 income range is the most frequent in Nocona, accounting for 22.7% of all households.
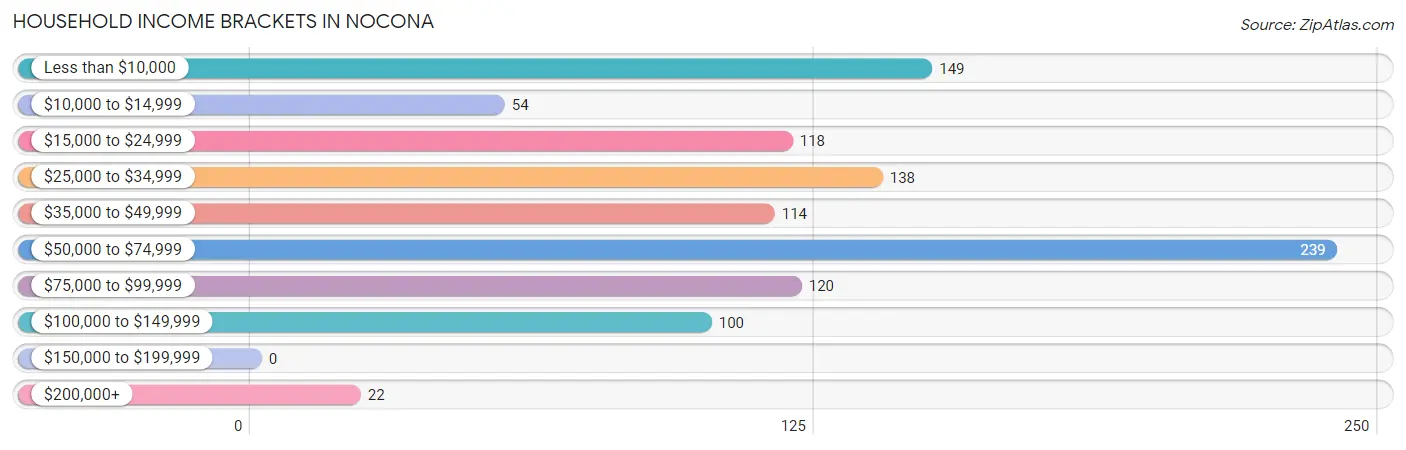
| Income Bracket | # Households | % Households |
| Less than $10,000 | 149 | 14.1% |
| $10,000 to $14,999 | 54 | 5.1% |
| $15,000 to $24,999 | 118 | 11.2% |
| $25,000 to $34,999 | 138 | 13.1% |
| $35,000 to $49,999 | 114 | 10.8% |
| $50,000 to $74,999 | 239 | 22.7% |
| $75,000 to $99,999 | 120 | 11.4% |
| $100,000 to $149,999 | 100 | 9.5% |
| $150,000 to $199,999 | 0 | 0.0% |
| $200,000+ | 22 | 2.1% |
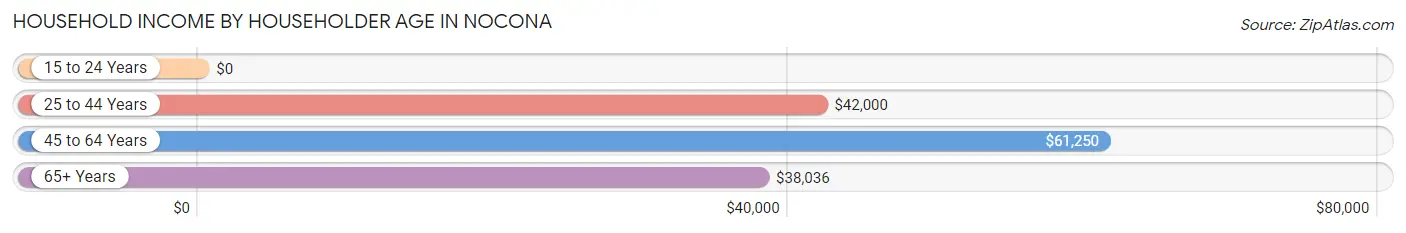
Household Income by Householder Age in Nocona
The median household income in Nocona is $42,104, with the highest median household income of $61,250 found in the 45 to 64 years age bracket for the primary householder. A total of 312 households (29.6%) fall into this category. Meanwhile, the 15 to 24 years age bracket for the primary householder has the lowest median household income of $0, with 127 households (12.0%) in this group.
| Income Bracket | # Households | Median Income |
| 15 to 24 Years | 127 (12.0%) | $0 |
| 25 to 44 Years | 276 (26.2%) | $42,000 |
| 45 to 64 Years | 312 (29.6%) | $61,250 |
| 65+ Years | 340 (32.2%) | $38,036 |
| Total | 1,055 (100.0%) | $42,104 |
Poverty in Nocona
Income Below Poverty by Sex and Age in Nocona
With 11.9% poverty level for males and 23.4% for females among the residents of Nocona, under 5 year old males and 15 year old females are the most vulnerable to poverty, with 19 males (24.0%) and 33 females (75.0%) in their respective age groups living below the poverty level.
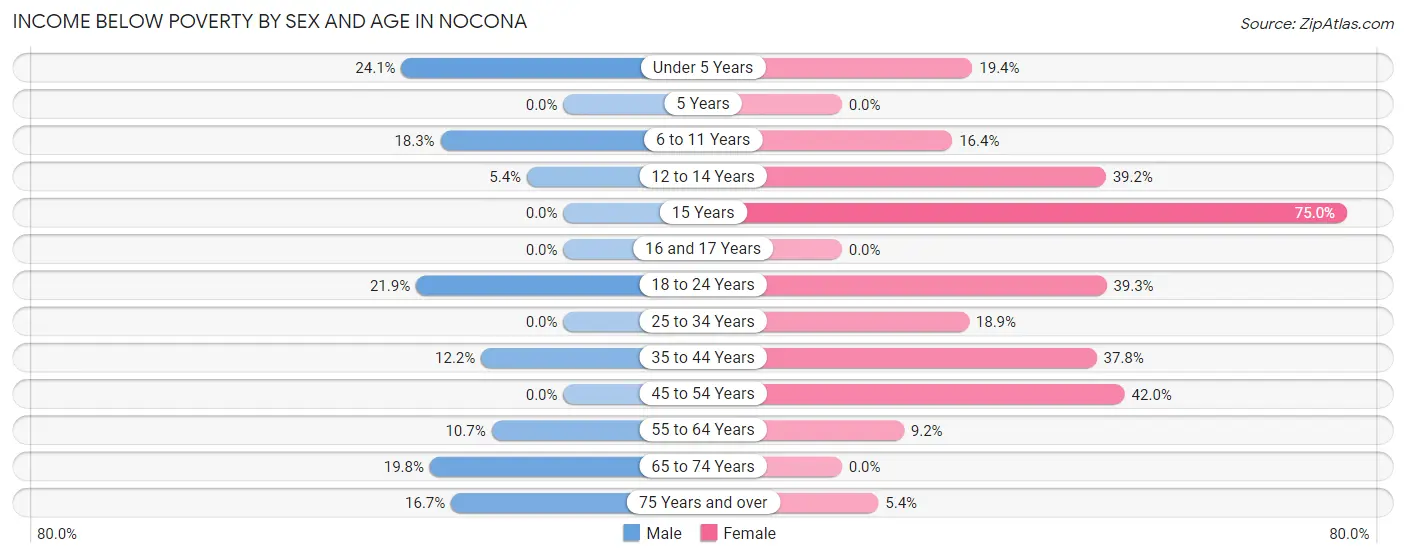
| Age Bracket | Male | Female |
| Under 5 Years | 19 (24.0%) | 19 (19.4%) |
| 5 Years | 0 (0.0%) | 0 (0.0%) |
| 6 to 11 Years | 25 (18.2%) | 31 (16.4%) |
| 12 to 14 Years | 4 (5.4%) | 58 (39.2%) |
| 15 Years | 0 (0.0%) | 33 (75.0%) |
| 16 and 17 Years | 0 (0.0%) | 0 (0.0%) |
| 18 to 24 Years | 21 (21.9%) | 90 (39.3%) |
| 25 to 34 Years | 0 (0.0%) | 40 (18.9%) |
| 35 to 44 Years | 26 (12.2%) | 28 (37.8%) |
| 45 to 54 Years | 0 (0.0%) | 63 (42.0%) |
| 55 to 64 Years | 19 (10.7%) | 14 (9.2%) |
| 65 to 74 Years | 24 (19.8%) | 0 (0.0%) |
| 75 Years and over | 21 (16.7%) | 7 (5.4%) |
| Total | 159 (11.9%) | 383 (23.4%) |
Income Above Poverty by Sex and Age in Nocona
According to the poverty statistics in Nocona, males aged 5 years and females aged 5 years are the age groups that are most secure financially, with 100.0% of males and 100.0% of females in these age groups living above the poverty line.
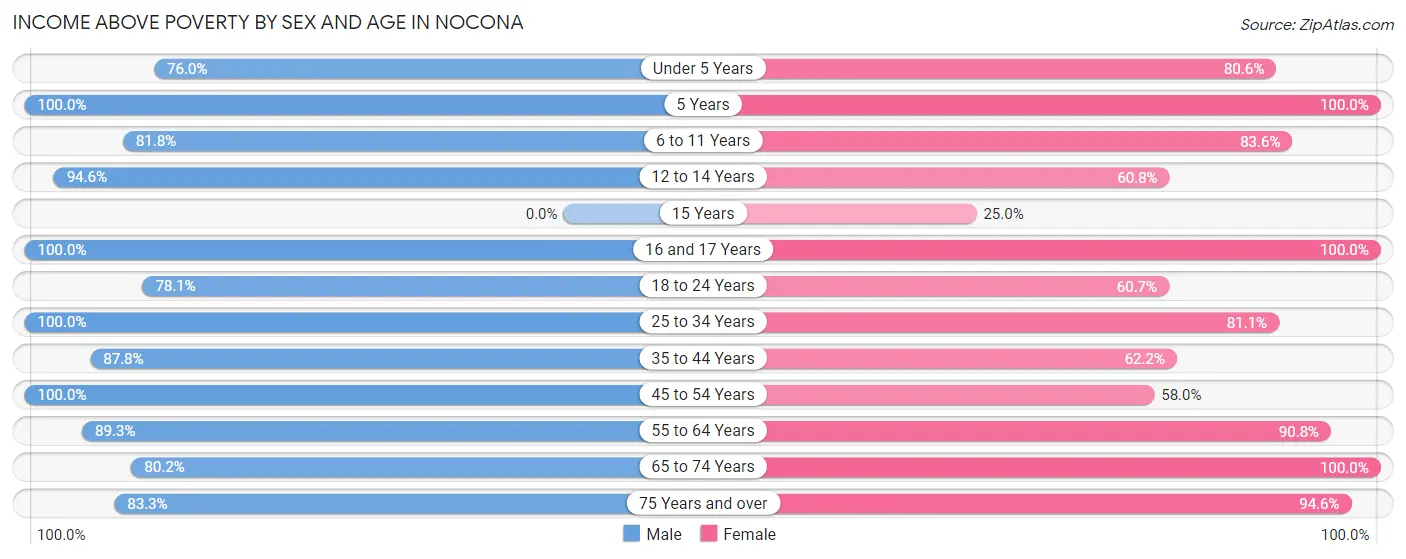
| Age Bracket | Male | Female |
| Under 5 Years | 60 (75.9%) | 79 (80.6%) |
| 5 Years | 7 (100.0%) | 27 (100.0%) |
| 6 to 11 Years | 112 (81.8%) | 158 (83.6%) |
| 12 to 14 Years | 70 (94.6%) | 90 (60.8%) |
| 15 Years | 0 (0.0%) | 11 (25.0%) |
| 16 and 17 Years | 35 (100.0%) | 19 (100.0%) |
| 18 to 24 Years | 75 (78.1%) | 139 (60.7%) |
| 25 to 34 Years | 172 (100.0%) | 172 (81.1%) |
| 35 to 44 Years | 187 (87.8%) | 46 (62.2%) |
| 45 to 54 Years | 93 (100.0%) | 87 (58.0%) |
| 55 to 64 Years | 159 (89.3%) | 138 (90.8%) |
| 65 to 74 Years | 97 (80.2%) | 166 (100.0%) |
| 75 Years and over | 105 (83.3%) | 122 (94.6%) |
| Total | 1,172 (88.0%) | 1,254 (76.6%) |
Income Below Poverty Among Married-Couple Families in Nocona
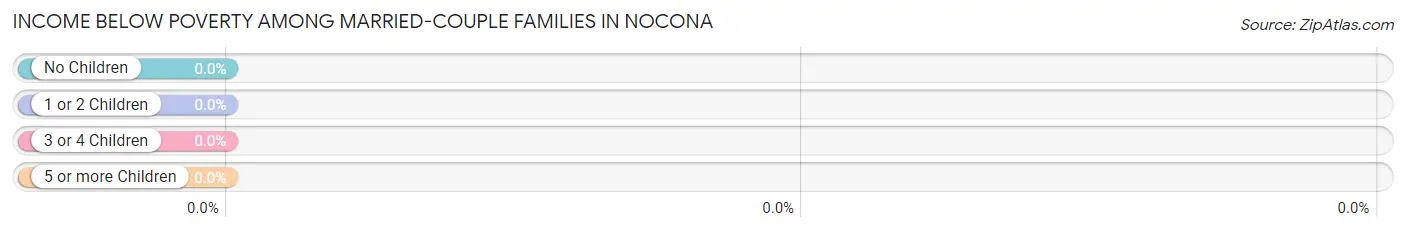
| Children | Above Poverty | Below Poverty |
| No Children | 229 (100.0%) | 0 (0.0%) |
| 1 or 2 Children | 197 (100.0%) | 0 (0.0%) |
| 3 or 4 Children | 45 (100.0%) | 0 (0.0%) |
| 5 or more Children | 13 (100.0%) | 0 (0.0%) |
| Total | 484 (100.0%) | 0 (0.0%) |
Income Below Poverty Among Single-Parent Households in Nocona
According to the poverty data in Nocona, 78.6% or 22 single-father households and 59.8% or 58 single-mother households are living below the poverty line. Among single-father households, those with 1 or 2 children have the highest poverty rate, with 22 households (78.6%) experiencing poverty. Likewise, among single-mother households, those with 3 or 4 children have the highest poverty rate, with 44 households (100.0%) falling below the poverty line.
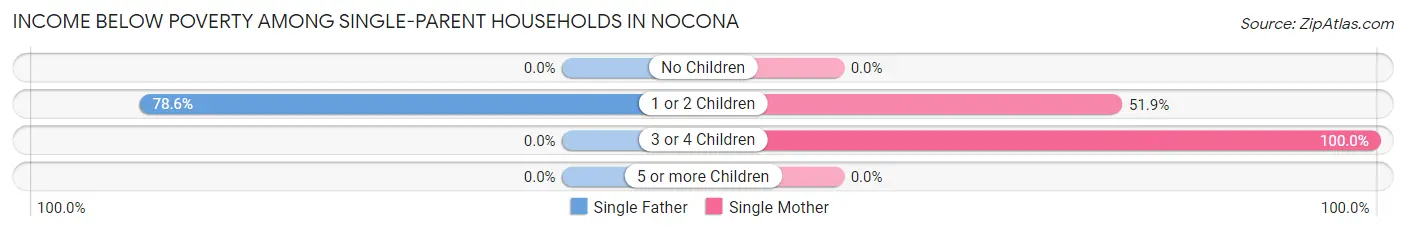
| Children | Single Father | Single Mother |
| No Children | 0 (0.0%) | 0 (0.0%) |
| 1 or 2 Children | 22 (78.6%) | 14 (51.8%) |
| 3 or 4 Children | 0 (0.0%) | 44 (100.0%) |
| 5 or more Children | 0 (0.0%) | 0 (0.0%) |
| Total | 22 (78.6%) | 58 (59.8%) |
Income Below Poverty Among Married-Couple vs Single-Parent Households in Nocona
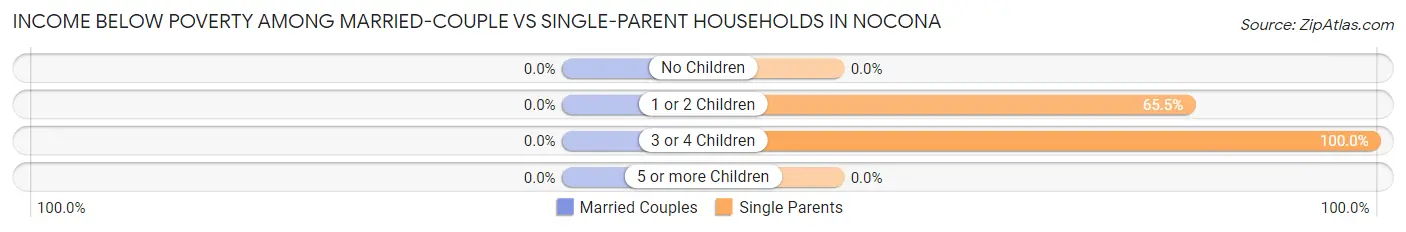
| Children | Married-Couple Families | Single-Parent Households |
| No Children | 0 (0.0%) | 0 (0.0%) |
| 1 or 2 Children | 0 (0.0%) | 36 (65.4%) |
| 3 or 4 Children | 0 (0.0%) | 44 (100.0%) |
| 5 or more Children | 0 (0.0%) | 0 (0.0%) |
| Total | 0 (0.0%) | 80 (64.0%) |
Race in Nocona
The most populous races in Nocona are White / Caucasian (2,486 | 82.1%), Hispanic or Latino (685 | 22.6%), and Some other Race (430 | 14.2%).
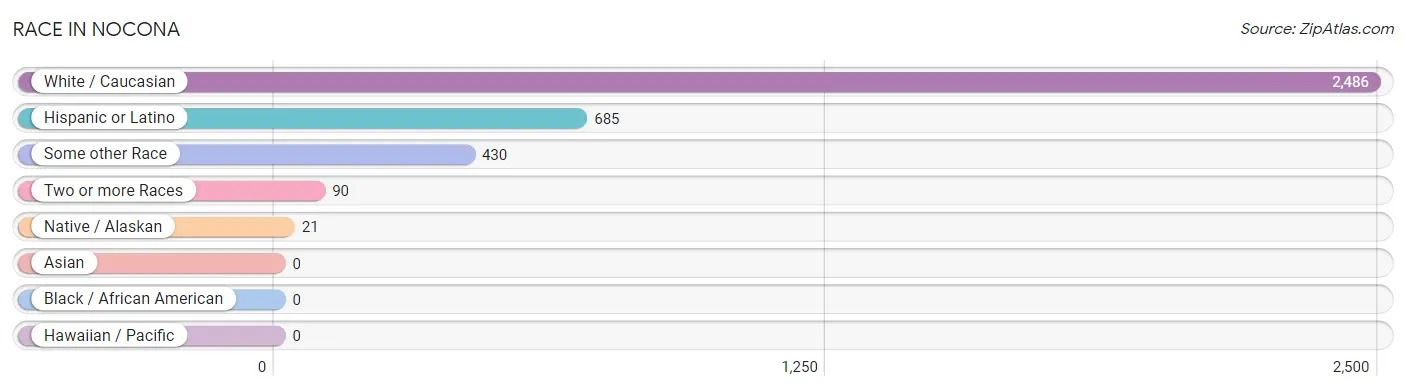
| Race | # Population | % Population |
| Asian | 0 | 0.0% |
| Black / African American | 0 | 0.0% |
| Hawaiian / Pacific | 0 | 0.0% |
| Hispanic or Latino | 685 | 22.6% |
| Native / Alaskan | 21 | 0.7% |
| White / Caucasian | 2,486 | 82.1% |
| Two or more Races | 90 | 3.0% |
| Some other Race | 430 | 14.2% |
| Total | 3,027 | 100.0% |
Ancestry in Nocona
The most populous ancestries reported in Nocona are Mexican (667 | 22.0%), English (433 | 14.3%), Irish (309 | 10.2%), German (199 | 6.6%), and American (164 | 5.4%), together accounting for 58.5% of all Nocona residents.
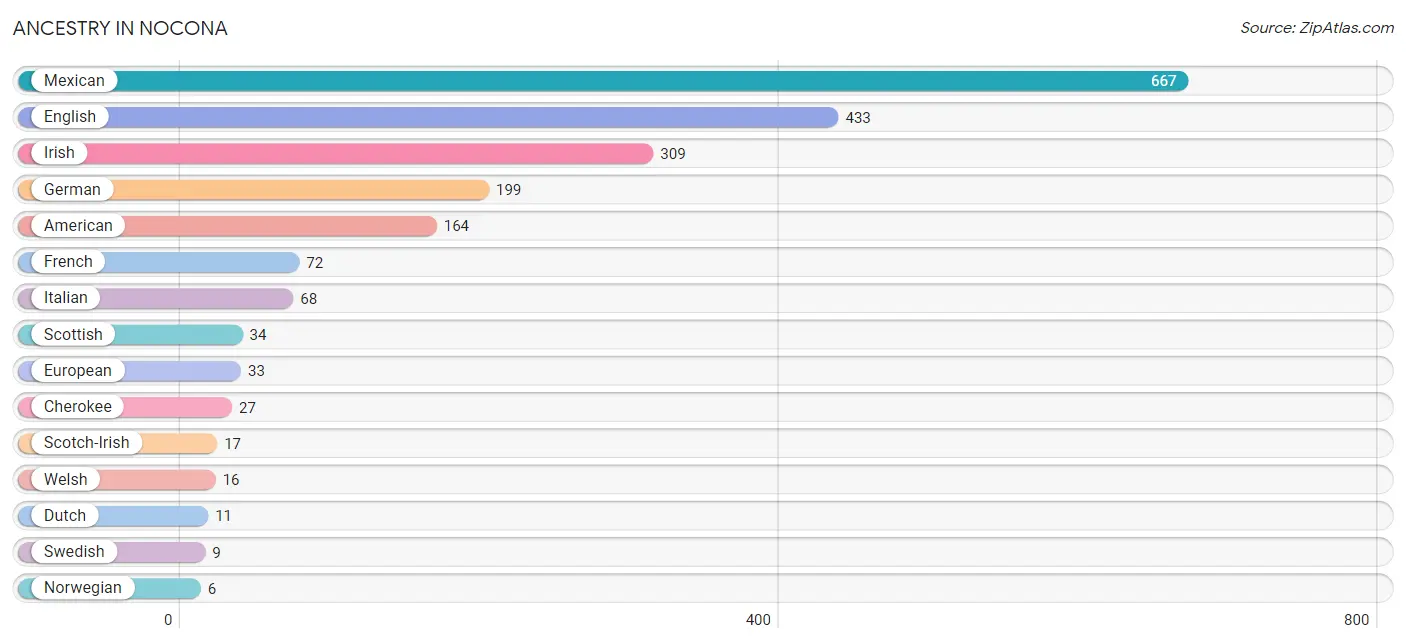
| Ancestry | # Population | % Population |
| American | 164 | 5.4% |
| Cherokee | 27 | 0.9% |
| Dutch | 11 | 0.4% |
| English | 433 | 14.3% |
| European | 33 | 1.1% |
| French | 72 | 2.4% |
| German | 199 | 6.6% |
| Irish | 309 | 10.2% |
| Italian | 68 | 2.2% |
| Mexican | 667 | 22.0% |
| Norwegian | 6 | 0.2% |
| Scotch-Irish | 17 | 0.6% |
| Scottish | 34 | 1.1% |
| Swedish | 9 | 0.3% |
| Welsh | 16 | 0.5% | View All 15 Rows |
Immigrants in Nocona
The most numerous immigrant groups reported in Nocona came from Central America (166 | 5.5%), Latin America (166 | 5.5%), and Mexico (166 | 5.5%), together accounting for 16.4% of all Nocona residents.
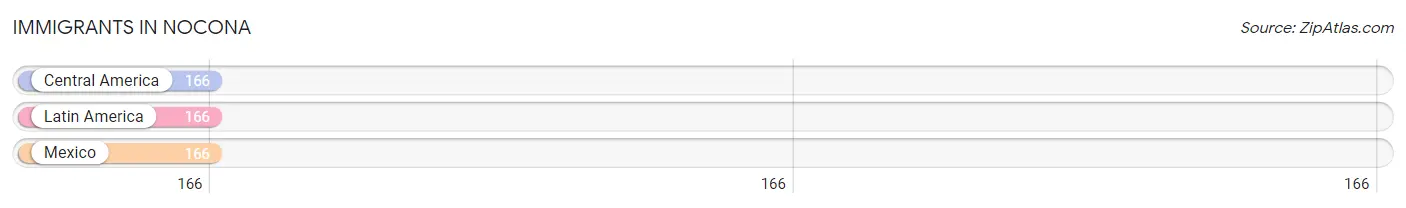
| Immigration Origin | # Population | % Population |
| Central America | 166 | 5.5% |
| Latin America | 166 | 5.5% |
| Mexico | 166 | 5.5% | View All 3 Rows |
Sex and Age in Nocona
Sex and Age in Nocona
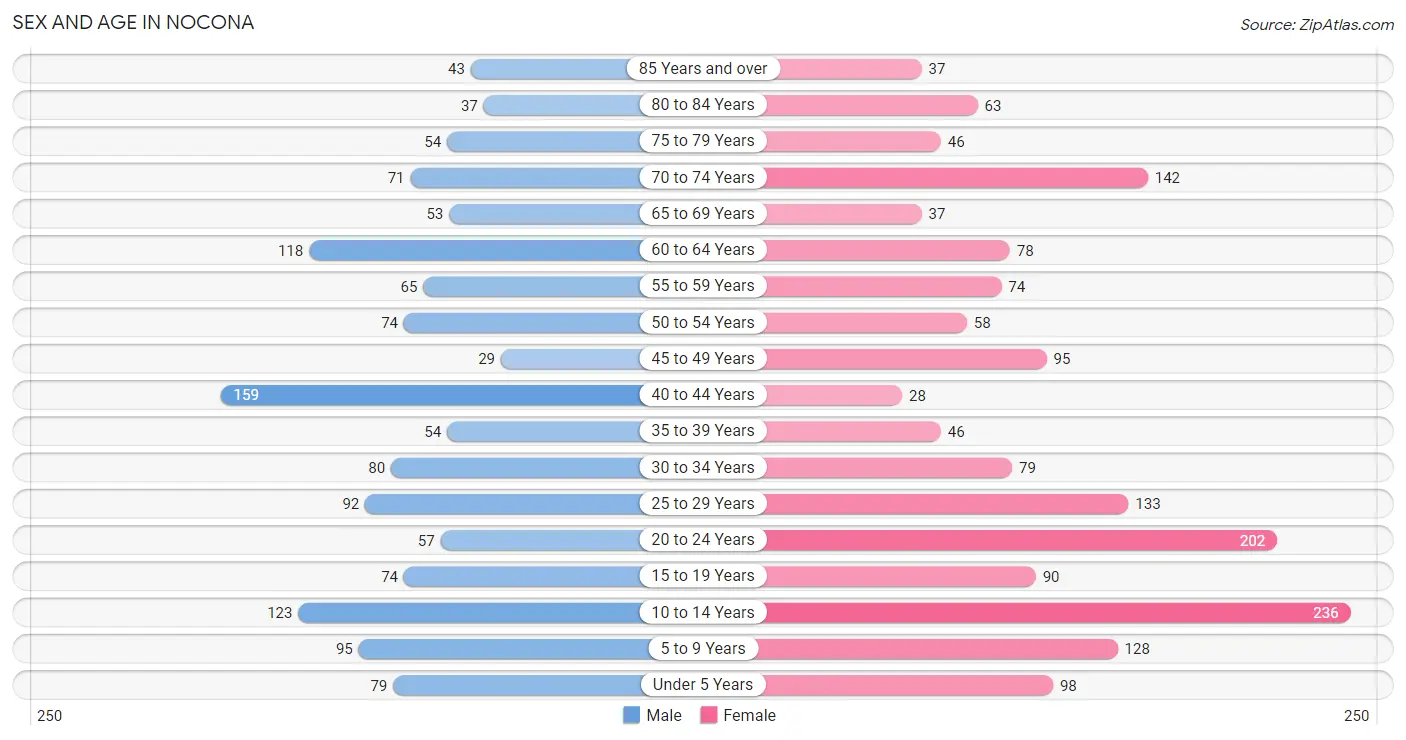
The most populous age groups in Nocona are 40 to 44 Years (159 | 11.7%) for men and 10 to 14 Years (236 | 14.1%) for women.
| Age Bracket | Male | Female |
| Under 5 Years | 79 (5.8%) | 98 (5.9%) |
| 5 to 9 Years | 95 (7.0%) | 128 (7.7%) |
| 10 to 14 Years | 123 (9.1%) | 236 (14.1%) |
| 15 to 19 Years | 74 (5.4%) | 90 (5.4%) |
| 20 to 24 Years | 57 (4.2%) | 202 (12.1%) |
| 25 to 29 Years | 92 (6.8%) | 133 (8.0%) |
| 30 to 34 Years | 80 (5.9%) | 79 (4.7%) |
| 35 to 39 Years | 54 (4.0%) | 46 (2.8%) |
| 40 to 44 Years | 159 (11.7%) | 28 (1.7%) |
| 45 to 49 Years | 29 (2.1%) | 95 (5.7%) |
| 50 to 54 Years | 74 (5.4%) | 58 (3.5%) |
| 55 to 59 Years | 65 (4.8%) | 74 (4.4%) |
| 60 to 64 Years | 118 (8.7%) | 78 (4.7%) |
| 65 to 69 Years | 53 (3.9%) | 37 (2.2%) |
| 70 to 74 Years | 71 (5.2%) | 142 (8.5%) |
| 75 to 79 Years | 54 (4.0%) | 46 (2.8%) |
| 80 to 84 Years | 37 (2.7%) | 63 (3.8%) |
| 85 Years and over | 43 (3.2%) | 37 (2.2%) |
| Total | 1,357 (100.0%) | 1,670 (100.0%) |
Families and Households in Nocona
Median Family Size in Nocona
The median family size in Nocona is 3.96 persons per family, with married-couple families (484 | 79.5%) accounting for the largest median family size of 4.09 persons per family. On the other hand, single female/mother families (97 | 15.9%) represent the smallest median family size with 3.42 persons per family.
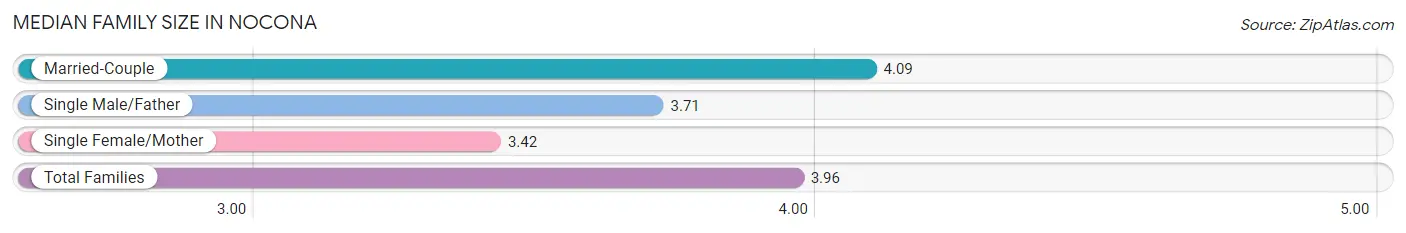
| Family Type | # Families | Family Size |
| Married-Couple | 484 (79.5%) | 4.09 |
| Single Male/Father | 28 (4.6%) | 3.71 |
| Single Female/Mother | 97 (15.9%) | 3.42 |
| Total Families | 609 (100.0%) | 3.96 |
Median Household Size in Nocona
The median household size in Nocona is 2.81 persons per household, with single male/father households (28 | 2.6%) accounting for the largest median household size of 4.75 persons per household. non-family households (446 | 42.3%) represent the smallest median household size with 1.17 persons per household.
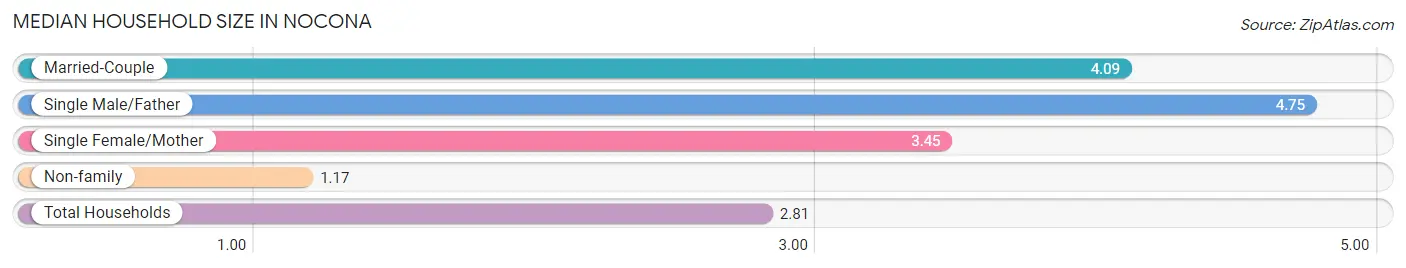
| Household Type | # Households | Household Size |
| Married-Couple | 484 (45.9%) | 4.09 |
| Single Male/Father | 28 (2.6%) | 4.75 |
| Single Female/Mother | 97 (9.2%) | 3.45 |
| Non-family | 446 (42.3%) | 1.17 |
| Total Households | 1,055 (100.0%) | 2.81 |
Household Size by Marriage Status in Nocona
Out of a total of 1,055 households in Nocona, 609 (57.7%) are family households, while 446 (42.3%) are nonfamily households. The most numerous type of family households are 4-person households, comprising 190, and the most common type of nonfamily households are 1-person households, comprising 376.
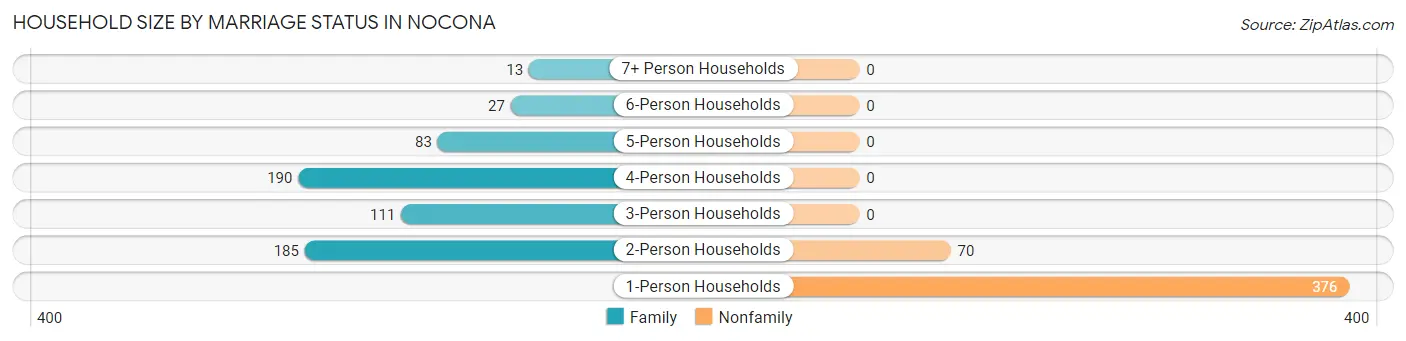
| Household Size | Family Households | Nonfamily Households |
| 1-Person Households | - | 376 (35.6%) |
| 2-Person Households | 185 (17.5%) | 70 (6.6%) |
| 3-Person Households | 111 (10.5%) | 0 (0.0%) |
| 4-Person Households | 190 (18.0%) | 0 (0.0%) |
| 5-Person Households | 83 (7.9%) | 0 (0.0%) |
| 6-Person Households | 27 (2.6%) | 0 (0.0%) |
| 7+ Person Households | 13 (1.2%) | 0 (0.0%) |
| Total | 609 (57.7%) | 446 (42.3%) |
Female Fertility in Nocona
Fertility by Age in Nocona
Average fertility rate in Nocona is 15.0 births per 1,000 women. Women in the age bracket of 20 to 34 years have the highest fertility rate with 24.0 births per 1,000 women. Women in the age bracket of 20 to 34 years acount for 100.0% of all women with births.
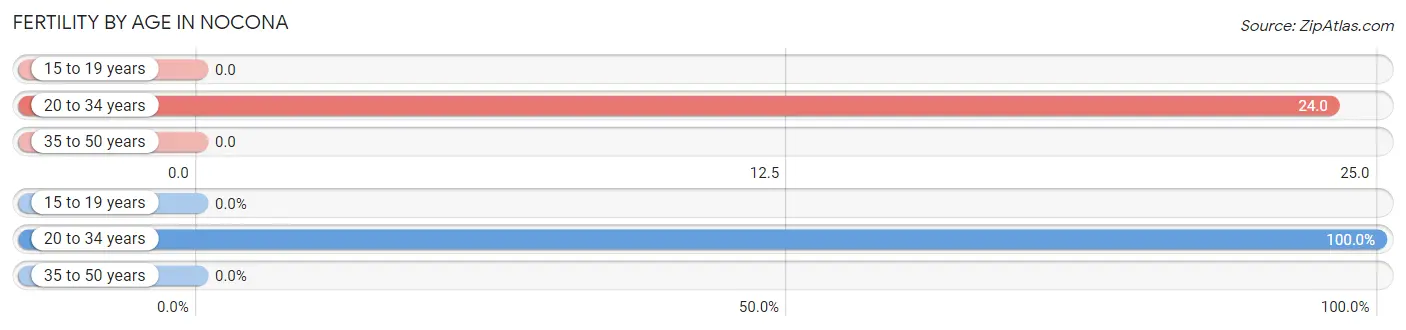
| Age Bracket | Women with Births | Births / 1,000 Women |
| 15 to 19 years | 0 (0.0%) | 0.0 |
| 20 to 34 years | 10 (100.0%) | 24.0 |
| 35 to 50 years | 0 (0.0%) | 0.0 |
| Total | 10 (100.0%) | 15.0 |
Fertility by Age by Marriage Status in Nocona
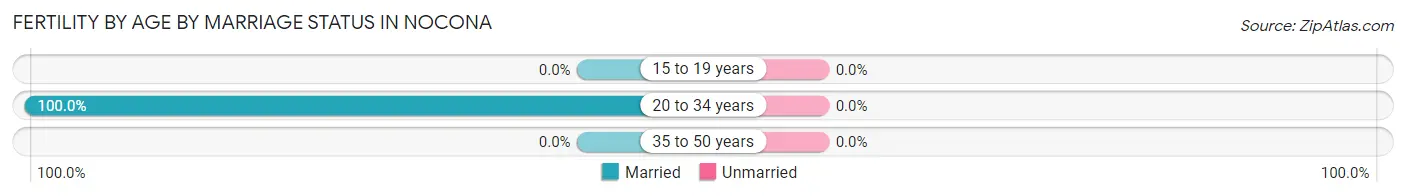
| Age Bracket | Married | Unmarried |
| 15 to 19 years | 0 (0.0%) | 0 (0.0%) |
| 20 to 34 years | 10 (100.0%) | 0 (0.0%) |
| 35 to 50 years | 0 (0.0%) | 0 (0.0%) |
| Total | 10 (100.0%) | 0 (0.0%) |
Fertility by Education in Nocona
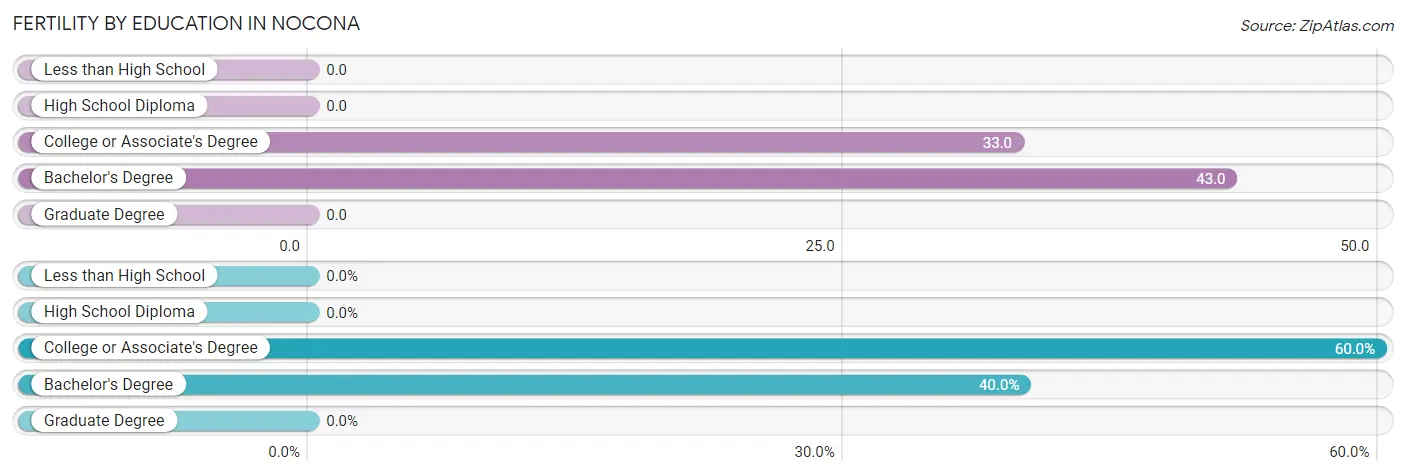
| Educational Attainment | Women with Births | Births / 1,000 Women |
| Less than High School | 0 (0.0%) | 0.0 |
| High School Diploma | 0 (0.0%) | 0.0 |
| College or Associate's Degree | 6 (60.0%) | 33.0 |
| Bachelor's Degree | 4 (40.0%) | 43.0 |
| Graduate Degree | 0 (0.0%) | 0.0 |
| Total | 10 (100.0%) | 15.0 |
Fertility by Education by Marriage Status in Nocona
| Educational Attainment | Married | Unmarried |
| Less than High School | 0 (0.0%) | 0 (0.0%) |
| High School Diploma | 0 (0.0%) | 0 (0.0%) |
| College or Associate's Degree | 6 (100.0%) | 0 (0.0%) |
| Bachelor's Degree | 4 (100.0%) | 0 (0.0%) |
| Graduate Degree | 0 (0.0%) | 0 (0.0%) |
| Total | 10 (100.0%) | 0 (0.0%) |
Employment Characteristics in Nocona
Employment by Class of Employer in Nocona
Among the 1,002 employed individuals in Nocona, private company employees (786 | 78.4%), not-for-profit organizations (89 | 8.9%), and local government employees (53 | 5.3%) make up the most common classes of employment.
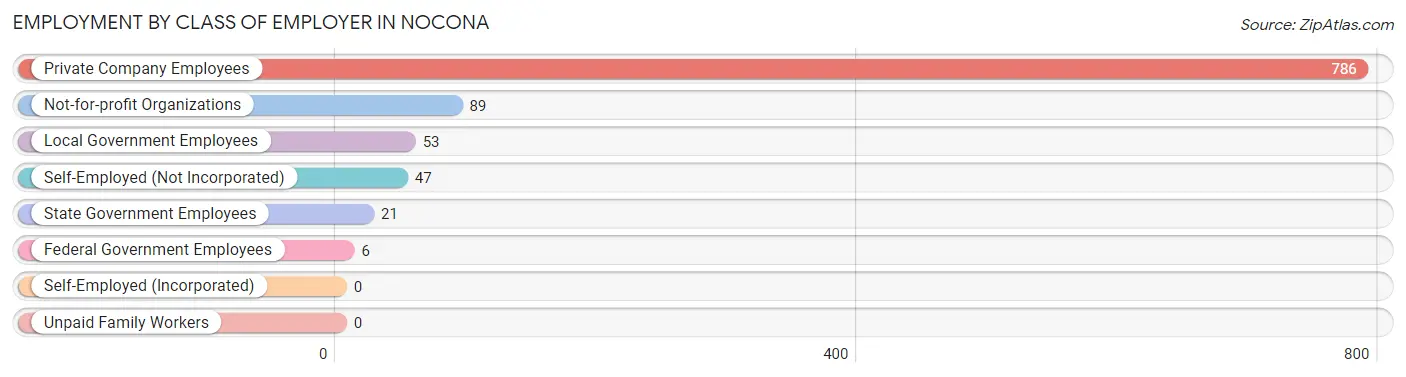
| Employer Class | # Employees | % Employees |
| Private Company Employees | 786 | 78.4% |
| Self-Employed (Incorporated) | 0 | 0.0% |
| Self-Employed (Not Incorporated) | 47 | 4.7% |
| Not-for-profit Organizations | 89 | 8.9% |
| Local Government Employees | 53 | 5.3% |
| State Government Employees | 21 | 2.1% |
| Federal Government Employees | 6 | 0.6% |
| Unpaid Family Workers | 0 | 0.0% |
| Total | 1,002 | 100.0% |
Employment Status by Age in Nocona
According to the labor force statistics for Nocona, out of the total population over 16 years of age (2,224), 55.9% or 1,243 individuals are in the labor force, with 15.7% or 195 of them unemployed. The age group with the highest labor force participation rate is 30 to 34 years, with 98.1% or 156 individuals in the labor force. Within the labor force, the 16 to 19 years age range has the highest percentage of unemployed individuals, with 37.2% or 16 of them being unemployed.
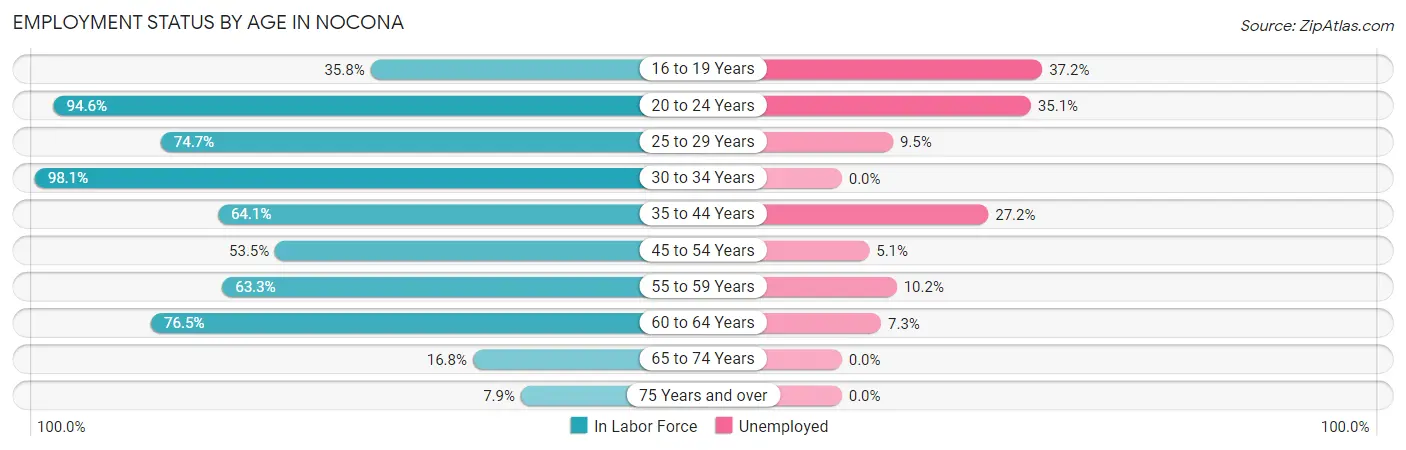
| Age Bracket | In Labor Force | Unemployed |
| 16 to 19 Years | 43 (35.8%) | 16 (37.2%) |
| 20 to 24 Years | 245 (94.6%) | 86 (35.1%) |
| 25 to 29 Years | 168 (74.7%) | 16 (9.5%) |
| 30 to 34 Years | 156 (98.1%) | 0 (0.0%) |
| 35 to 44 Years | 184 (64.1%) | 50 (27.2%) |
| 45 to 54 Years | 137 (53.5%) | 7 (5.1%) |
| 55 to 59 Years | 88 (63.3%) | 9 (10.2%) |
| 60 to 64 Years | 150 (76.5%) | 11 (7.3%) |
| 65 to 74 Years | 51 (16.8%) | 0 (0.0%) |
| 75 Years and over | 22 (7.9%) | 0 (0.0%) |
| Total | 1,243 (55.9%) | 195 (15.7%) |
Employment Status by Educational Attainment in Nocona
According to labor force statistics for Nocona, 70.0% of individuals (883) out of the total population between 25 and 64 years of age (1,262) are in the labor force, with 10.5% or 93 of them being unemployed. The group with the highest labor force participation rate are those with the educational attainment of high school diploma, with 81.0% or 345 individuals in the labor force. Within the labor force, individuals with college / associate degree education have the highest percentage of unemployment, with 15.8% or 50 of them being unemployed.
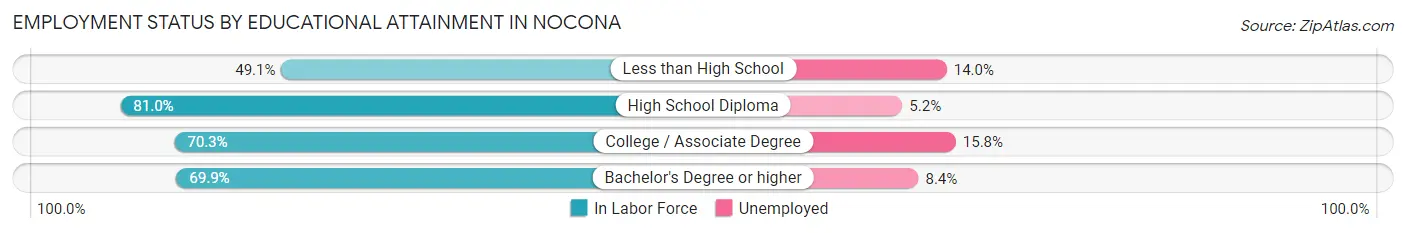
| Educational Attainment | In Labor Force | Unemployed |
| Less than High School | 114 (49.1%) | 32 (14.0%) |
| High School Diploma | 345 (81.0%) | 22 (5.2%) |
| College / Associate Degree | 317 (70.3%) | 71 (15.8%) |
| Bachelor's Degree or higher | 107 (69.9%) | 13 (8.4%) |
| Total | 883 (70.0%) | 133 (10.5%) |
Employment Occupations by Sex in Nocona
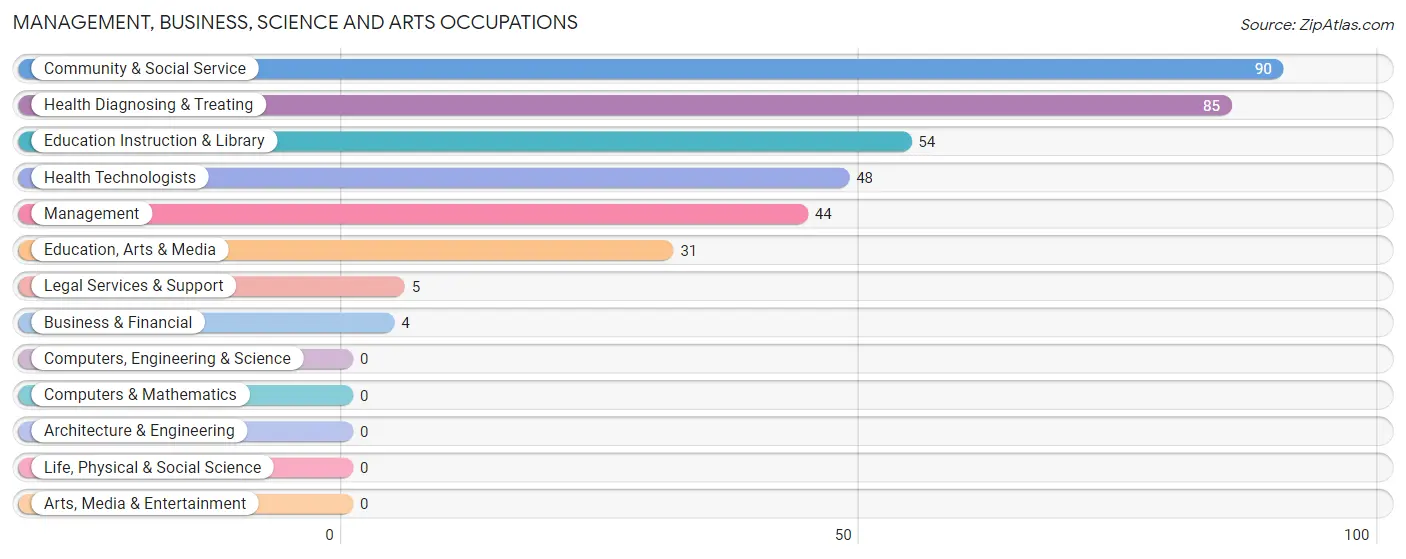
Management, Business, Science and Arts Occupations
The most common Management, Business, Science and Arts occupations in Nocona are Community & Social Service (90 | 8.6%), Health Diagnosing & Treating (85 | 8.1%), Education Instruction & Library (54 | 5.1%), Health Technologists (48 | 4.6%), and Management (44 | 4.2%).
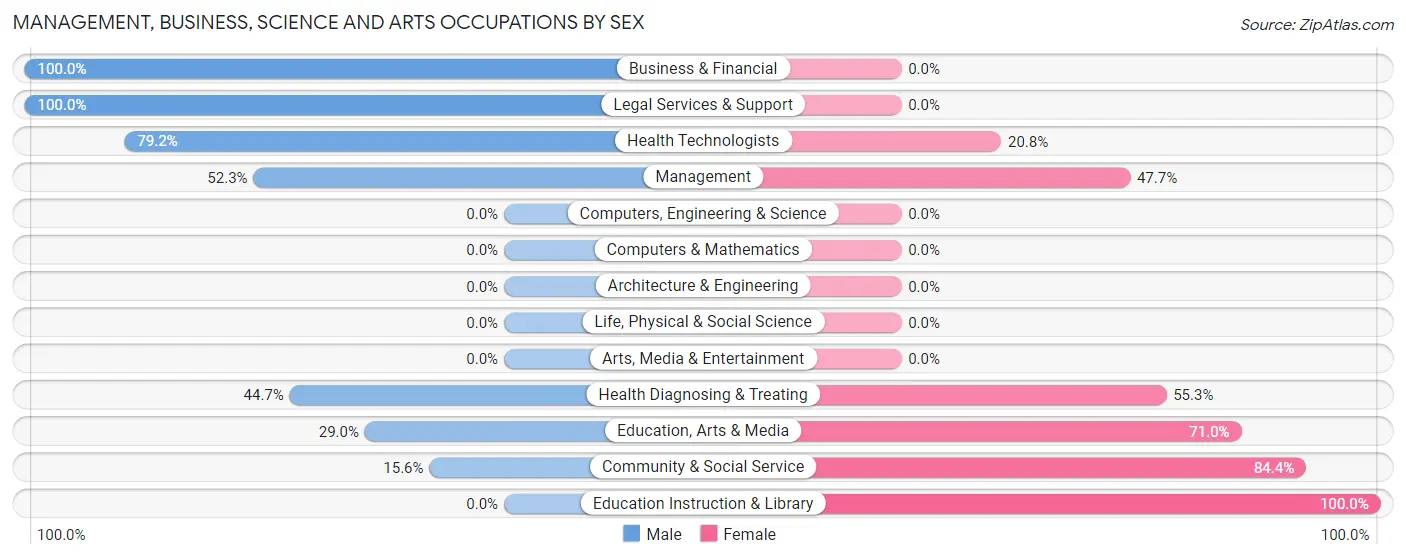
Management, Business, Science and Arts Occupations by Sex
Within the Management, Business, Science and Arts occupations in Nocona, the most male-oriented occupations are Business & Financial (100.0%), Legal Services & Support (100.0%), and Health Technologists (79.2%), while the most female-oriented occupations are Education Instruction & Library (100.0%), Community & Social Service (84.4%), and Education, Arts & Media (71.0%).
| Occupation | Male | Female |
| Management | 23 (52.3%) | 21 (47.7%) |
| Business & Financial | 4 (100.0%) | 0 (0.0%) |
| Computers, Engineering & Science | 0 (0.0%) | 0 (0.0%) |
| Computers & Mathematics | 0 (0.0%) | 0 (0.0%) |
| Architecture & Engineering | 0 (0.0%) | 0 (0.0%) |
| Life, Physical & Social Science | 0 (0.0%) | 0 (0.0%) |
| Community & Social Service | 14 (15.6%) | 76 (84.4%) |
| Education, Arts & Media | 9 (29.0%) | 22 (71.0%) |
| Legal Services & Support | 5 (100.0%) | 0 (0.0%) |
| Education Instruction & Library | 0 (0.0%) | 54 (100.0%) |
| Arts, Media & Entertainment | 0 (0.0%) | 0 (0.0%) |
| Health Diagnosing & Treating | 38 (44.7%) | 47 (55.3%) |
| Health Technologists | 38 (79.2%) | 10 (20.8%) |
| Total (Category) | 79 (35.4%) | 144 (64.6%) |
| Total (Overall) | 561 (53.5%) | 488 (46.5%) |
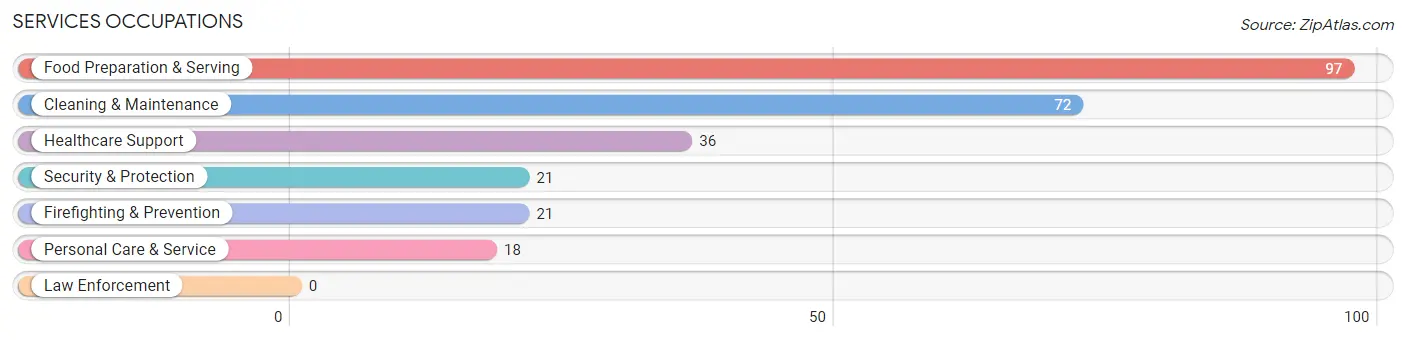
Services Occupations
The most common Services occupations in Nocona are Food Preparation & Serving (97 | 9.2%), Cleaning & Maintenance (72 | 6.9%), Healthcare Support (36 | 3.4%), Security & Protection (21 | 2.0%), and Firefighting & Prevention (21 | 2.0%).
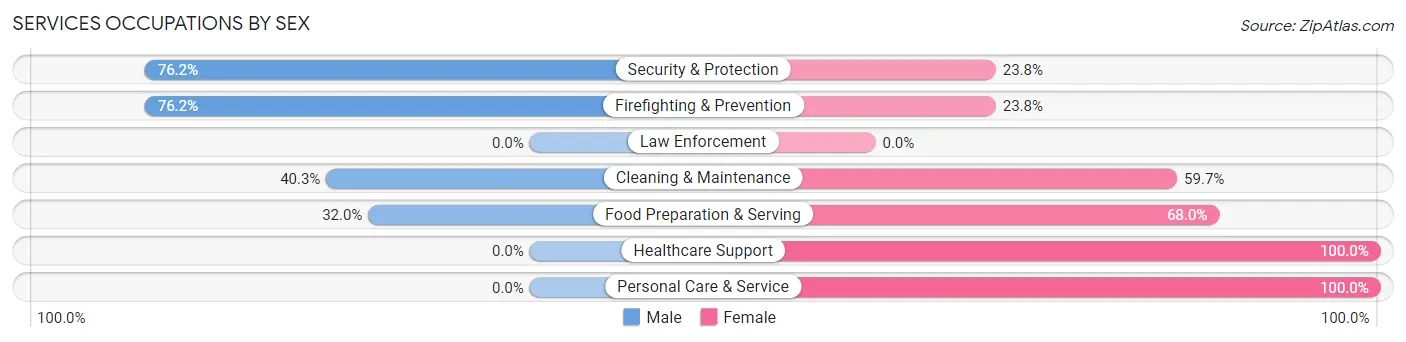
Services Occupations by Sex
Within the Services occupations in Nocona, the most male-oriented occupations are Security & Protection (76.2%), Firefighting & Prevention (76.2%), and Cleaning & Maintenance (40.3%), while the most female-oriented occupations are Healthcare Support (100.0%), Personal Care & Service (100.0%), and Food Preparation & Serving (68.0%).
| Occupation | Male | Female |
| Healthcare Support | 0 (0.0%) | 36 (100.0%) |
| Security & Protection | 16 (76.2%) | 5 (23.8%) |
| Firefighting & Prevention | 16 (76.2%) | 5 (23.8%) |
| Law Enforcement | 0 (0.0%) | 0 (0.0%) |
| Food Preparation & Serving | 31 (32.0%) | 66 (68.0%) |
| Cleaning & Maintenance | 29 (40.3%) | 43 (59.7%) |
| Personal Care & Service | 0 (0.0%) | 18 (100.0%) |
| Total (Category) | 76 (31.1%) | 168 (68.9%) |
| Total (Overall) | 561 (53.5%) | 488 (46.5%) |
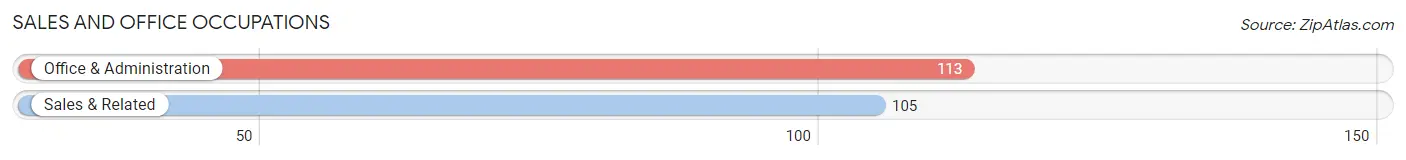
Sales and Office Occupations
The most common Sales and Office occupations in Nocona are Office & Administration (113 | 10.8%), and Sales & Related (105 | 10.0%).
Sales and Office Occupations by Sex
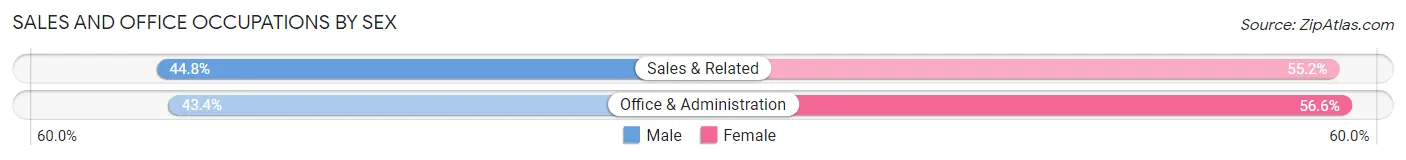
| Occupation | Male | Female |
| Sales & Related | 47 (44.8%) | 58 (55.2%) |
| Office & Administration | 49 (43.4%) | 64 (56.6%) |
| Total (Category) | 96 (44.0%) | 122 (56.0%) |
| Total (Overall) | 561 (53.5%) | 488 (46.5%) |
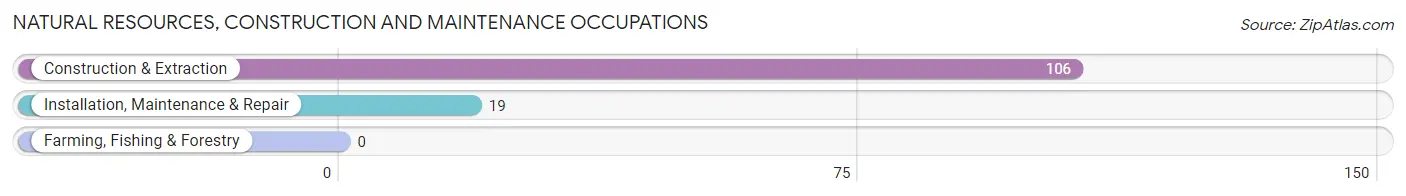
Natural Resources, Construction and Maintenance Occupations
The most common Natural Resources, Construction and Maintenance occupations in Nocona are Construction & Extraction (106 | 10.1%), and Installation, Maintenance & Repair (19 | 1.8%).
Natural Resources, Construction and Maintenance Occupations by Sex
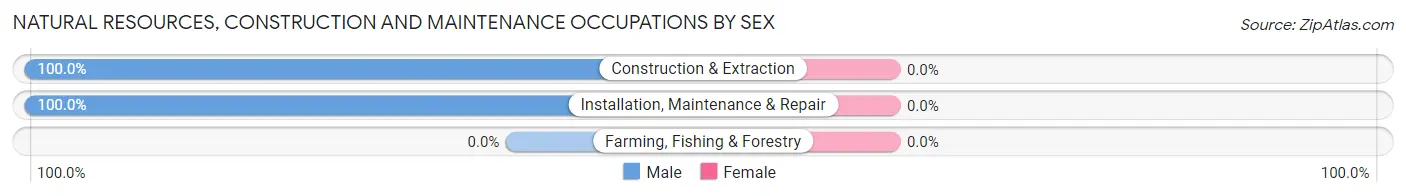
| Occupation | Male | Female |
| Farming, Fishing & Forestry | 0 (0.0%) | 0 (0.0%) |
| Construction & Extraction | 106 (100.0%) | 0 (0.0%) |
| Installation, Maintenance & Repair | 19 (100.0%) | 0 (0.0%) |
| Total (Category) | 125 (100.0%) | 0 (0.0%) |
| Total (Overall) | 561 (53.5%) | 488 (46.5%) |
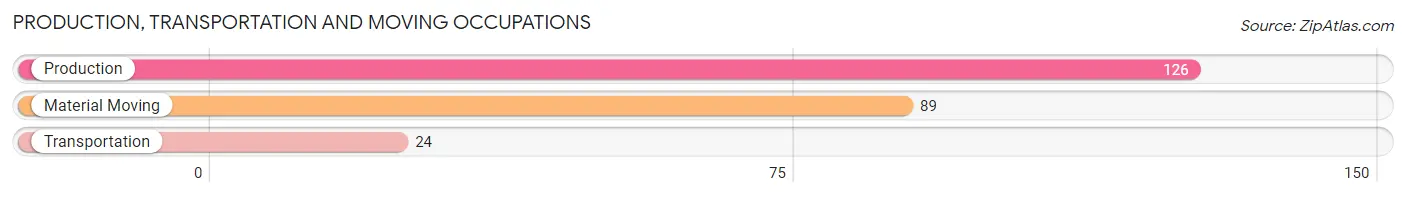
Production, Transportation and Moving Occupations
The most common Production, Transportation and Moving occupations in Nocona are Production (126 | 12.0%), Material Moving (89 | 8.5%), and Transportation (24 | 2.3%).
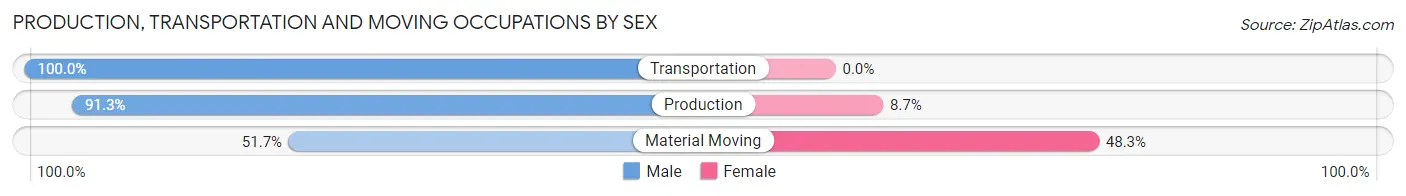
Production, Transportation and Moving Occupations by Sex
| Occupation | Male | Female |
| Production | 115 (91.3%) | 11 (8.7%) |
| Transportation | 24 (100.0%) | 0 (0.0%) |
| Material Moving | 46 (51.7%) | 43 (48.3%) |
| Total (Category) | 185 (77.4%) | 54 (22.6%) |
| Total (Overall) | 561 (53.5%) | 488 (46.5%) |
Employment Industries by Sex in Nocona
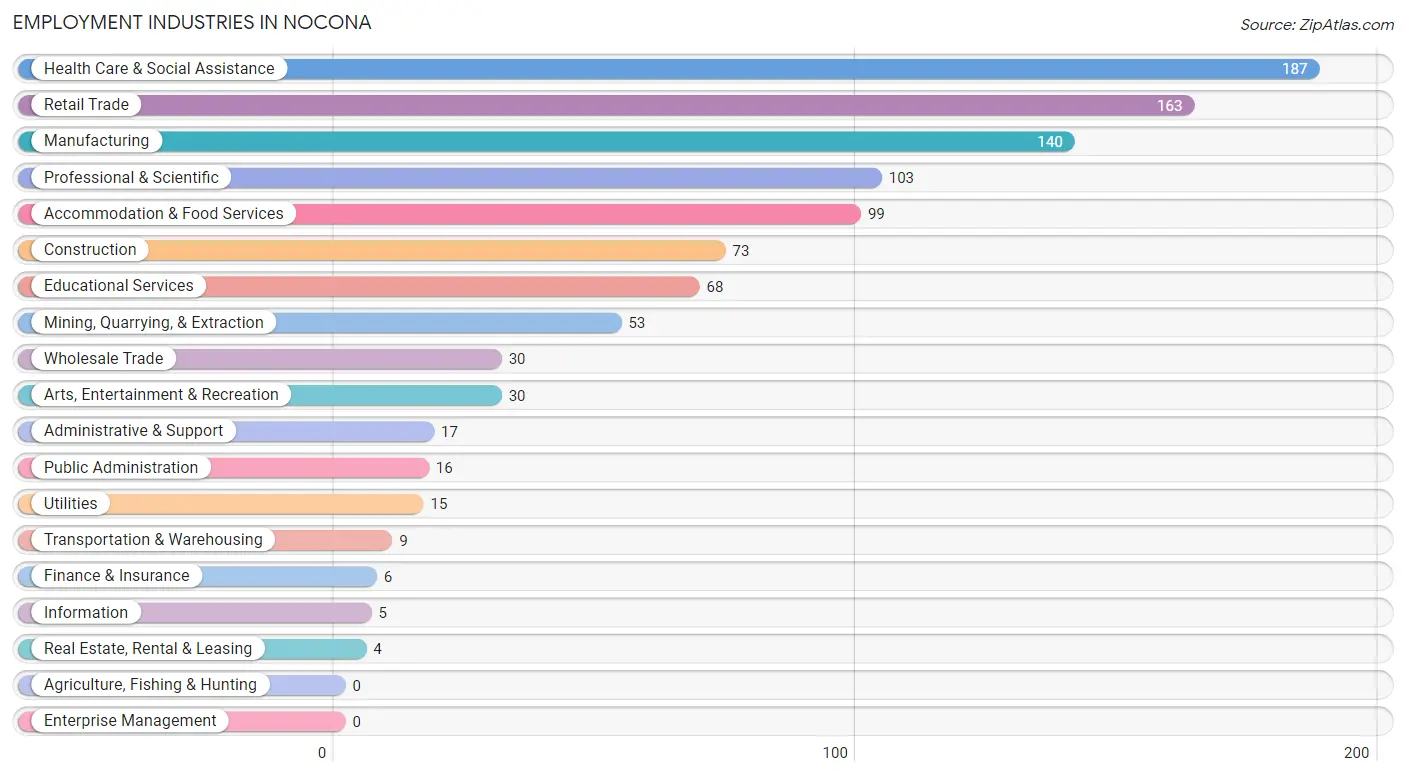
Employment Industries in Nocona
The major employment industries in Nocona include Health Care & Social Assistance (187 | 17.8%), Retail Trade (163 | 15.5%), Manufacturing (140 | 13.4%), Professional & Scientific (103 | 9.8%), and Accommodation & Food Services (99 | 9.4%).
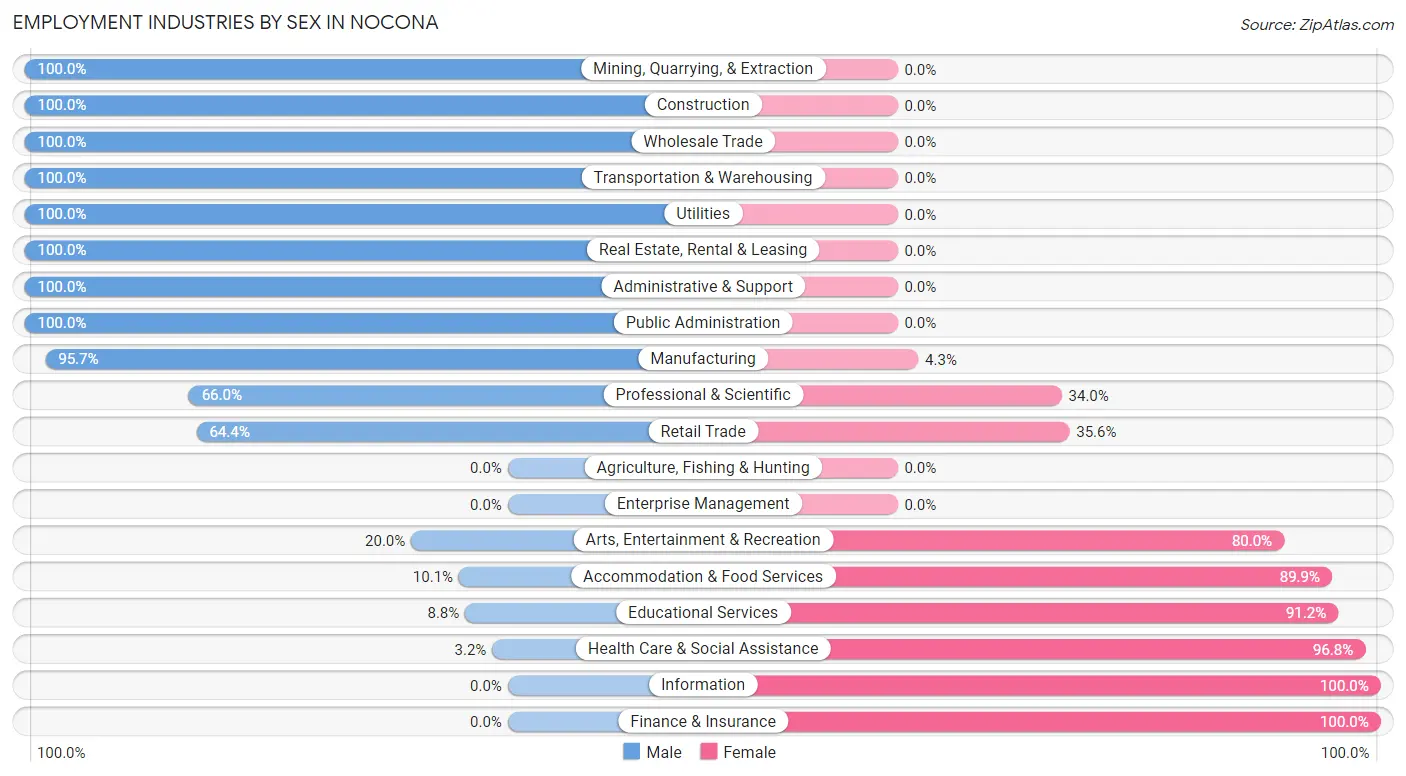
Employment Industries by Sex in Nocona
The Nocona industries that see more men than women are Mining, Quarrying, & Extraction (100.0%), Construction (100.0%), and Wholesale Trade (100.0%), whereas the industries that tend to have a higher number of women are Information (100.0%), Finance & Insurance (100.0%), and Health Care & Social Assistance (96.8%).
| Industry | Male | Female |
| Agriculture, Fishing & Hunting | 0 (0.0%) | 0 (0.0%) |
| Mining, Quarrying, & Extraction | 53 (100.0%) | 0 (0.0%) |
| Construction | 73 (100.0%) | 0 (0.0%) |
| Manufacturing | 134 (95.7%) | 6 (4.3%) |
| Wholesale Trade | 30 (100.0%) | 0 (0.0%) |
| Retail Trade | 105 (64.4%) | 58 (35.6%) |
| Transportation & Warehousing | 9 (100.0%) | 0 (0.0%) |
| Utilities | 15 (100.0%) | 0 (0.0%) |
| Information | 0 (0.0%) | 5 (100.0%) |
| Finance & Insurance | 0 (0.0%) | 6 (100.0%) |
| Real Estate, Rental & Leasing | 4 (100.0%) | 0 (0.0%) |
| Professional & Scientific | 68 (66.0%) | 35 (34.0%) |
| Enterprise Management | 0 (0.0%) | 0 (0.0%) |
| Administrative & Support | 17 (100.0%) | 0 (0.0%) |
| Educational Services | 6 (8.8%) | 62 (91.2%) |
| Health Care & Social Assistance | 6 (3.2%) | 181 (96.8%) |
| Arts, Entertainment & Recreation | 6 (20.0%) | 24 (80.0%) |
| Accommodation & Food Services | 10 (10.1%) | 89 (89.9%) |
| Public Administration | 16 (100.0%) | 0 (0.0%) |
| Total | 561 (53.5%) | 488 (46.5%) |
Education in Nocona
School Enrollment in Nocona
The most common levels of schooling among the 802 students in Nocona are middle school (250 | 31.2%), elementary school (225 | 28.1%), and high school (180 | 22.4%).
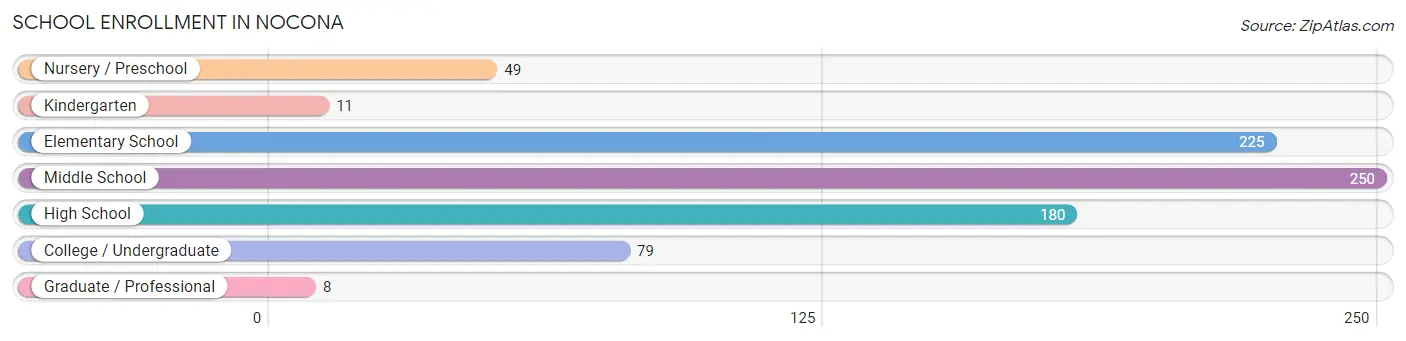
| School Level | # Students | % Students |
| Nursery / Preschool | 49 | 6.1% |
| Kindergarten | 11 | 1.4% |
| Elementary School | 225 | 28.1% |
| Middle School | 250 | 31.2% |
| High School | 180 | 22.4% |
| College / Undergraduate | 79 | 9.9% |
| Graduate / Professional | 8 | 1.0% |
| Total | 802 | 100.0% |
School Enrollment by Age by Funding Source in Nocona
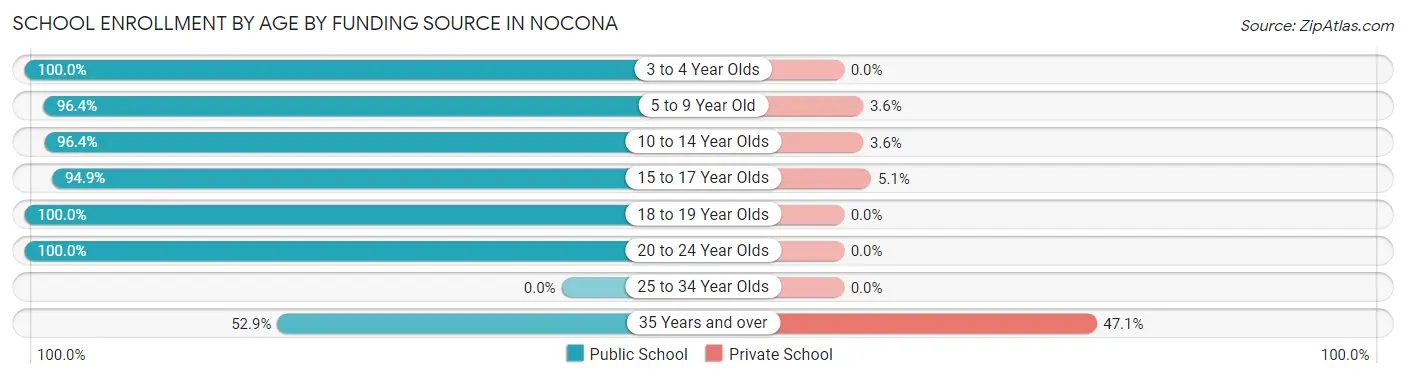
Out of a total of 802 students who are enrolled in schools in Nocona, 34 (4.2%) attend a private institution, while the remaining 768 (95.8%) are enrolled in public schools. The age group of 35 years and over has the highest likelihood of being enrolled in private schools, with 8 (47.1% in the age bracket) enrolled. Conversely, the age group of 3 to 4 year olds has the lowest likelihood of being enrolled in a private school, with 22 (100.0% in the age bracket) attending a public institution.
| Age Bracket | Public School | Private School |
| 3 to 4 Year Olds | 22 (100.0%) | 0 (0.0%) |
| 5 to 9 Year Old | 215 (96.4%) | 8 (3.6%) |
| 10 to 14 Year Olds | 346 (96.4%) | 13 (3.6%) |
| 15 to 17 Year Olds | 93 (94.9%) | 5 (5.1%) |
| 18 to 19 Year Olds | 13 (100.0%) | 0 (0.0%) |
| 20 to 24 Year Olds | 70 (100.0%) | 0 (0.0%) |
| 25 to 34 Year Olds | 0 (0.0%) | 0 (0.0%) |
| 35 Years and over | 9 (52.9%) | 8 (47.1%) |
| Total | 768 (95.8%) | 34 (4.2%) |
Educational Attainment by Field of Study in Nocona
Science & technology (63 | 23.1%), education (63 | 23.1%), liberal arts & history (39 | 14.3%), visual & performing arts (26 | 9.5%), and psychology (21 | 7.7%) are the most common fields of study among 273 individuals in Nocona who have obtained a bachelor's degree or higher.
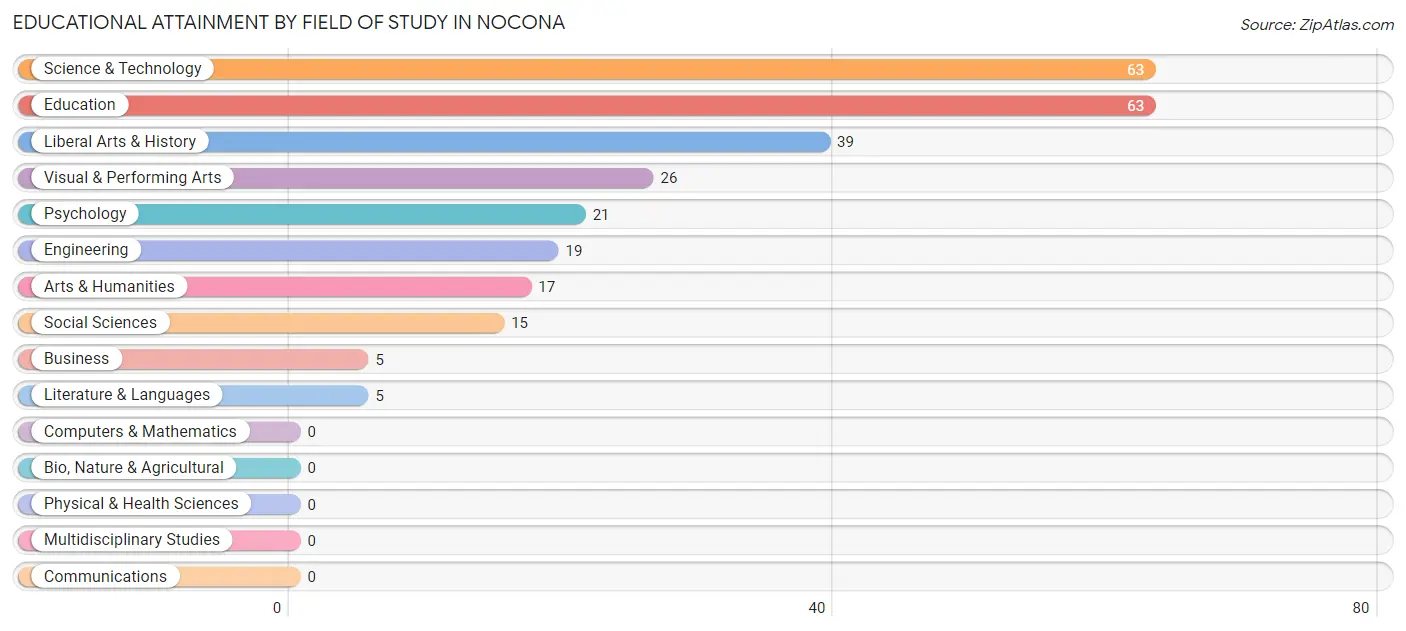
| Field of Study | # Graduates | % Graduates |
| Computers & Mathematics | 0 | 0.0% |
| Bio, Nature & Agricultural | 0 | 0.0% |
| Physical & Health Sciences | 0 | 0.0% |
| Psychology | 21 | 7.7% |
| Social Sciences | 15 | 5.5% |
| Engineering | 19 | 7.0% |
| Multidisciplinary Studies | 0 | 0.0% |
| Science & Technology | 63 | 23.1% |
| Business | 5 | 1.8% |
| Education | 63 | 23.1% |
| Literature & Languages | 5 | 1.8% |
| Liberal Arts & History | 39 | 14.3% |
| Visual & Performing Arts | 26 | 9.5% |
| Communications | 0 | 0.0% |
| Arts & Humanities | 17 | 6.2% |
| Total | 273 | 100.0% |
Transportation & Commute in Nocona
Vehicle Availability by Sex in Nocona
The most prevalent vehicle ownership categories in Nocona are males with 2 vehicles (199, accounting for 37.6%) and females with 2 vehicles (151, making up 42.1%).
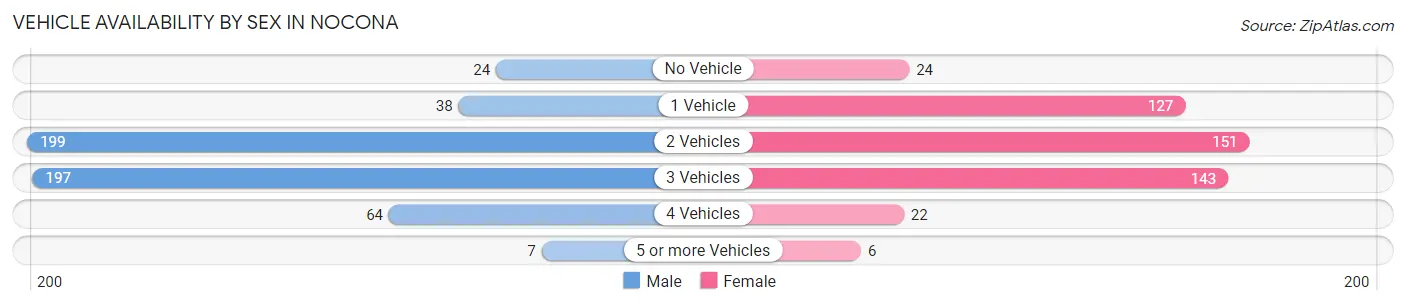
| Vehicles Available | Male | Female |
| No Vehicle | 24 (4.5%) | 24 (5.1%) |
| 1 Vehicle | 38 (7.2%) | 127 (26.9%) |
| 2 Vehicles | 199 (37.6%) | 151 (31.9%) |
| 3 Vehicles | 197 (37.2%) | 143 (30.2%) |
| 4 Vehicles | 64 (12.1%) | 22 (4.6%) |
| 5 or more Vehicles | 7 (1.3%) | 6 (1.3%) |
| Total | 529 (100.0%) | 473 (100.0%) |
Commute Time in Nocona
The most frequently occuring commute durations in Nocona are 5 to 9 minutes (271 commuters, 28.3%), 45 to 59 minutes (135 commuters, 14.1%), and less than 5 minutes (127 commuters, 13.2%).
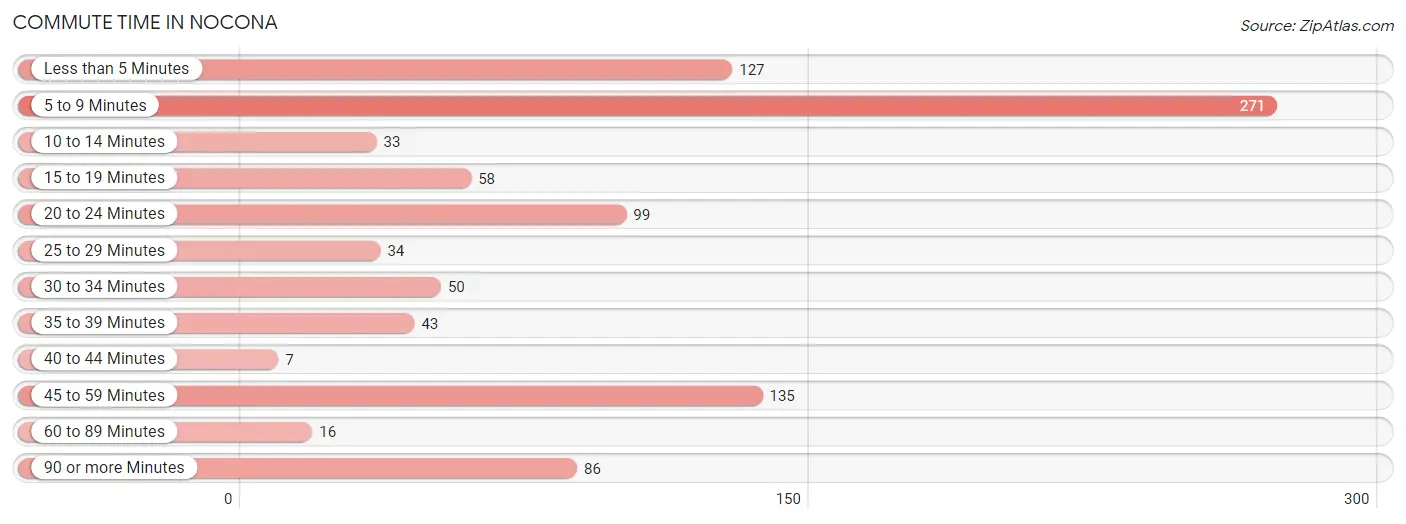
| Commute Time | # Commuters | % Commuters |
| Less than 5 Minutes | 127 | 13.2% |
| 5 to 9 Minutes | 271 | 28.3% |
| 10 to 14 Minutes | 33 | 3.4% |
| 15 to 19 Minutes | 58 | 6.0% |
| 20 to 24 Minutes | 99 | 10.3% |
| 25 to 29 Minutes | 34 | 3.5% |
| 30 to 34 Minutes | 50 | 5.2% |
| 35 to 39 Minutes | 43 | 4.5% |
| 40 to 44 Minutes | 7 | 0.7% |
| 45 to 59 Minutes | 135 | 14.1% |
| 60 to 89 Minutes | 16 | 1.7% |
| 90 or more Minutes | 86 | 9.0% |
Commute Time by Sex in Nocona
The most common commute times in Nocona are 45 to 59 minutes (92 commuters, 18.0%) for males and 5 to 9 minutes (222 commuters, 49.5%) for females.
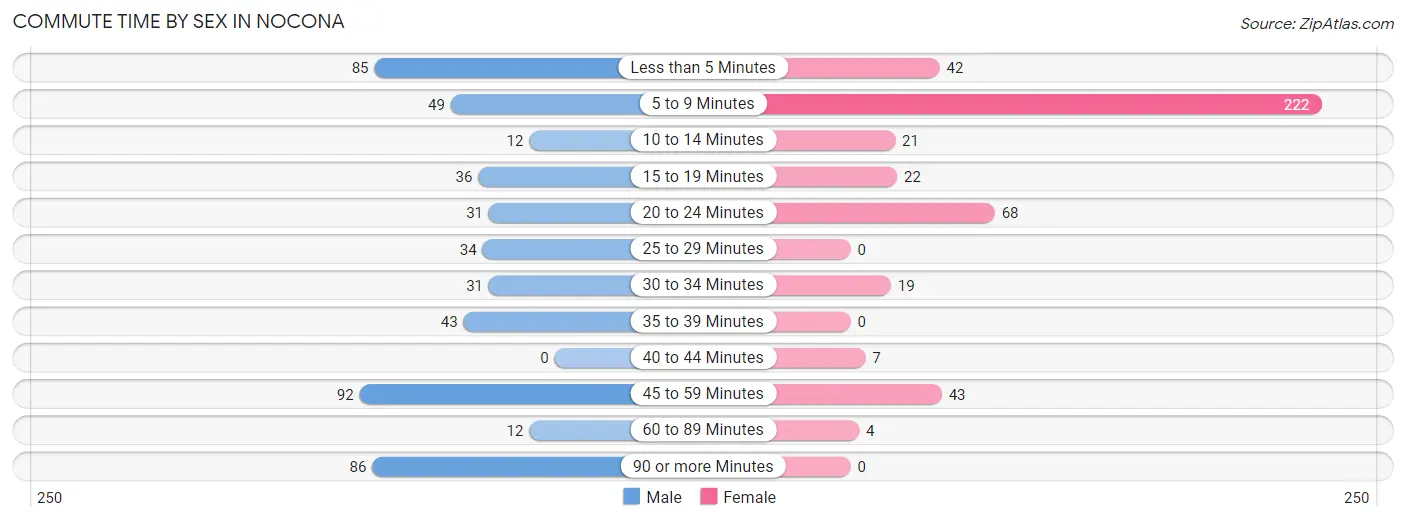
| Commute Time | Male | Female |
| Less than 5 Minutes | 85 (16.6%) | 42 (9.4%) |
| 5 to 9 Minutes | 49 (9.6%) | 222 (49.5%) |
| 10 to 14 Minutes | 12 (2.4%) | 21 (4.7%) |
| 15 to 19 Minutes | 36 (7.0%) | 22 (4.9%) |
| 20 to 24 Minutes | 31 (6.1%) | 68 (15.2%) |
| 25 to 29 Minutes | 34 (6.7%) | 0 (0.0%) |
| 30 to 34 Minutes | 31 (6.1%) | 19 (4.2%) |
| 35 to 39 Minutes | 43 (8.4%) | 0 (0.0%) |
| 40 to 44 Minutes | 0 (0.0%) | 7 (1.6%) |
| 45 to 59 Minutes | 92 (18.0%) | 43 (9.6%) |
| 60 to 89 Minutes | 12 (2.4%) | 4 (0.9%) |
| 90 or more Minutes | 86 (16.8%) | 0 (0.0%) |
Time of Departure to Work by Sex in Nocona
The most frequent times of departure to work in Nocona are 12:00 AM to 4:59 AM (97, 19.0%) for males and 7:30 AM to 7:59 AM (108, 24.1%) for females.
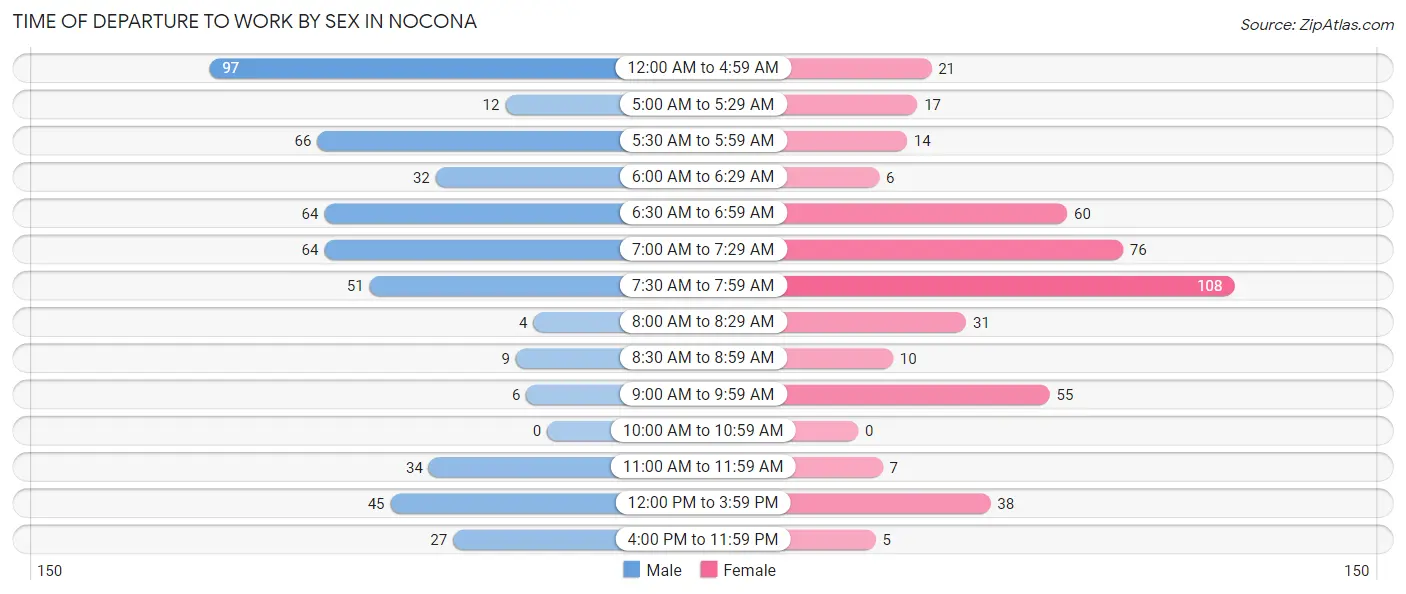
| Time of Departure | Male | Female |
| 12:00 AM to 4:59 AM | 97 (19.0%) | 21 (4.7%) |
| 5:00 AM to 5:29 AM | 12 (2.4%) | 17 (3.8%) |
| 5:30 AM to 5:59 AM | 66 (12.9%) | 14 (3.1%) |
| 6:00 AM to 6:29 AM | 32 (6.3%) | 6 (1.3%) |
| 6:30 AM to 6:59 AM | 64 (12.5%) | 60 (13.4%) |
| 7:00 AM to 7:29 AM | 64 (12.5%) | 76 (17.0%) |
| 7:30 AM to 7:59 AM | 51 (10.0%) | 108 (24.1%) |
| 8:00 AM to 8:29 AM | 4 (0.8%) | 31 (6.9%) |
| 8:30 AM to 8:59 AM | 9 (1.8%) | 10 (2.2%) |
| 9:00 AM to 9:59 AM | 6 (1.2%) | 55 (12.3%) |
| 10:00 AM to 10:59 AM | 0 (0.0%) | 0 (0.0%) |
| 11:00 AM to 11:59 AM | 34 (6.7%) | 7 (1.6%) |
| 12:00 PM to 3:59 PM | 45 (8.8%) | 38 (8.5%) |
| 4:00 PM to 11:59 PM | 27 (5.3%) | 5 (1.1%) |
| Total | 511 (100.0%) | 448 (100.0%) |
Housing Occupancy in Nocona
Occupancy by Ownership in Nocona
Of the total 1,055 dwellings in Nocona, owner-occupied units account for 728 (69.0%), while renter-occupied units make up 327 (31.0%).
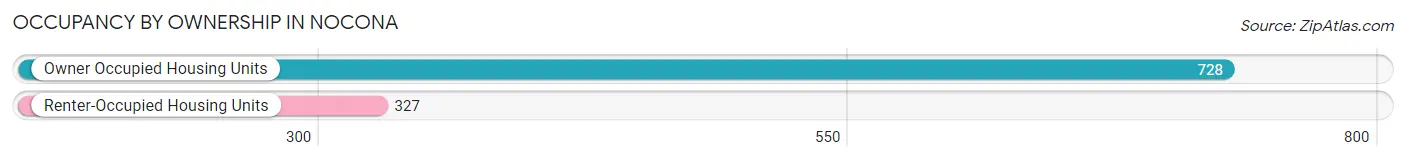
| Occupancy | # Housing Units | % Housing Units |
| Owner Occupied Housing Units | 728 | 69.0% |
| Renter-Occupied Housing Units | 327 | 31.0% |
| Total Occupied Housing Units | 1,055 | 100.0% |
Occupancy by Household Size in Nocona
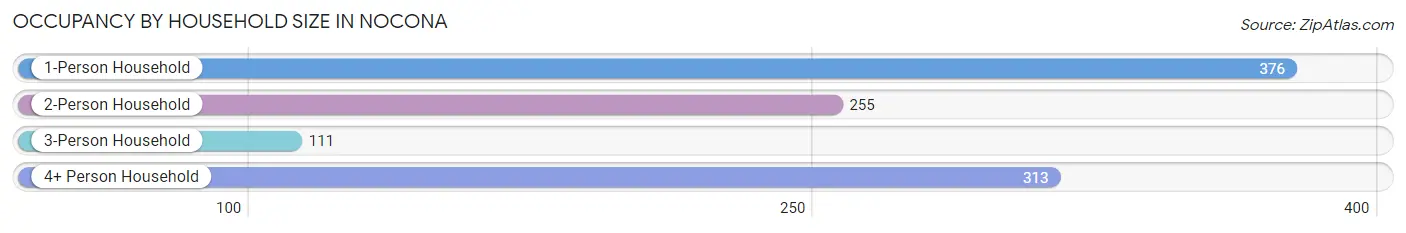
| Household Size | # Housing Units | % Housing Units |
| 1-Person Household | 376 | 35.6% |
| 2-Person Household | 255 | 24.2% |
| 3-Person Household | 111 | 10.5% |
| 4+ Person Household | 313 | 29.7% |
| Total Housing Units | 1,055 | 100.0% |
Occupancy by Ownership by Household Size in Nocona
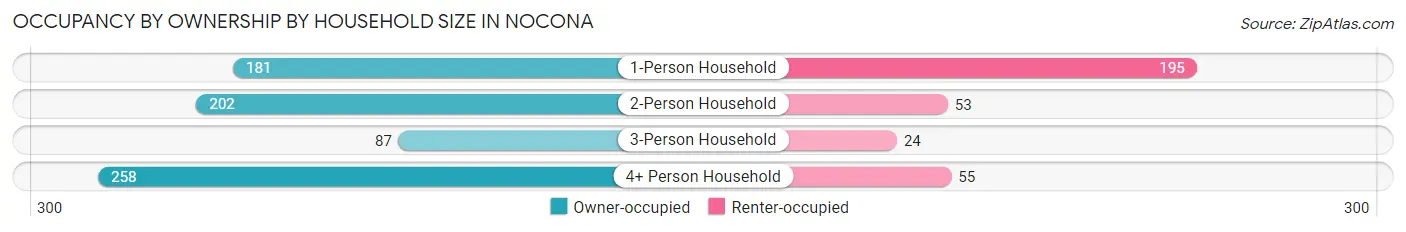
| Household Size | Owner-occupied | Renter-occupied |
| 1-Person Household | 181 (48.1%) | 195 (51.9%) |
| 2-Person Household | 202 (79.2%) | 53 (20.8%) |
| 3-Person Household | 87 (78.4%) | 24 (21.6%) |
| 4+ Person Household | 258 (82.4%) | 55 (17.6%) |
| Total Housing Units | 728 (69.0%) | 327 (31.0%) |
Occupancy by Educational Attainment in Nocona
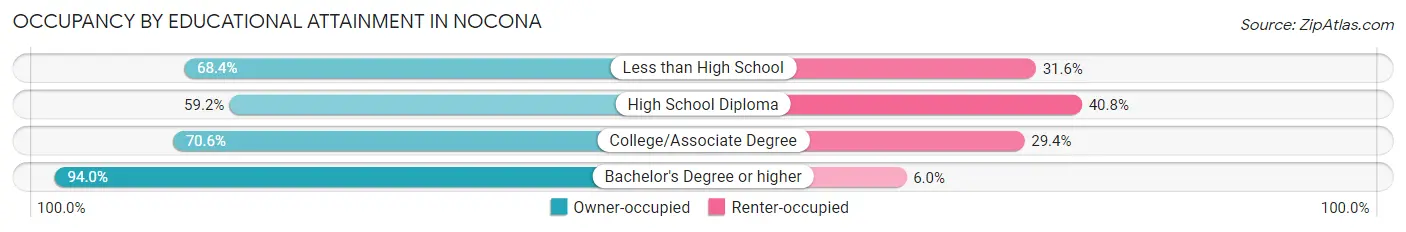
| Household Size | Owner-occupied | Renter-occupied |
| Less than High School | 134 (68.4%) | 62 (31.6%) |
| High School Diploma | 250 (59.2%) | 172 (40.8%) |
| College/Associate Degree | 202 (70.6%) | 84 (29.4%) |
| Bachelor's Degree or higher | 142 (94.0%) | 9 (6.0%) |
Occupancy by Age of Householder in Nocona
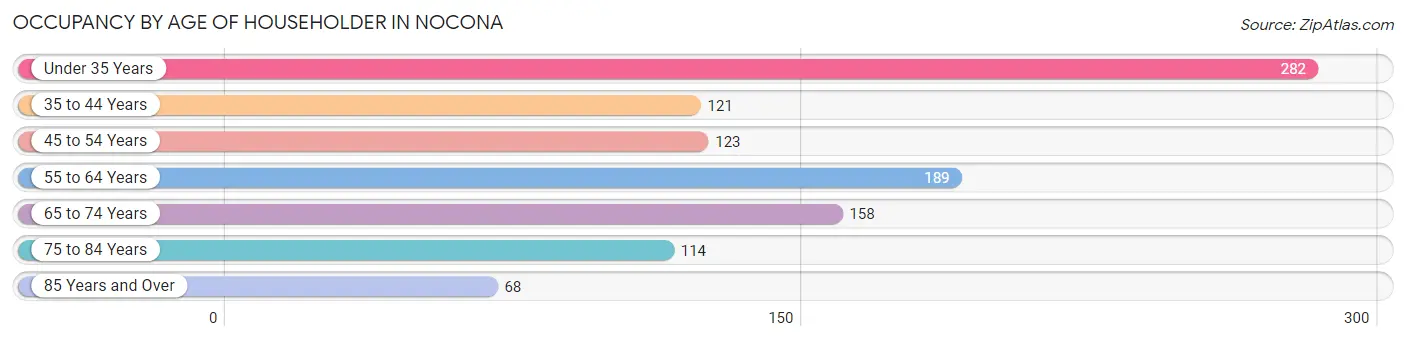
| Age Bracket | # Households | % Households |
| Under 35 Years | 282 | 26.7% |
| 35 to 44 Years | 121 | 11.5% |
| 45 to 54 Years | 123 | 11.7% |
| 55 to 64 Years | 189 | 17.9% |
| 65 to 74 Years | 158 | 15.0% |
| 75 to 84 Years | 114 | 10.8% |
| 85 Years and Over | 68 | 6.5% |
| Total | 1,055 | 100.0% |
Housing Finances in Nocona
Median Income by Occupancy in Nocona
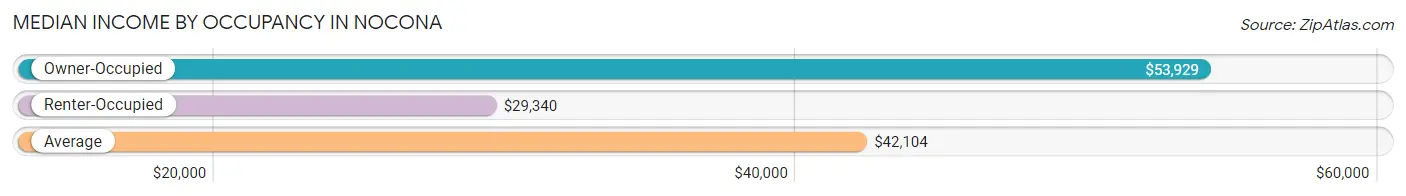
| Occupancy Type | # Households | Median Income |
| Owner-Occupied | 728 (69.0%) | $53,929 |
| Renter-Occupied | 327 (31.0%) | $29,340 |
| Average | 1,055 (100.0%) | $42,104 |
Occupancy by Householder Income Bracket in Nocona
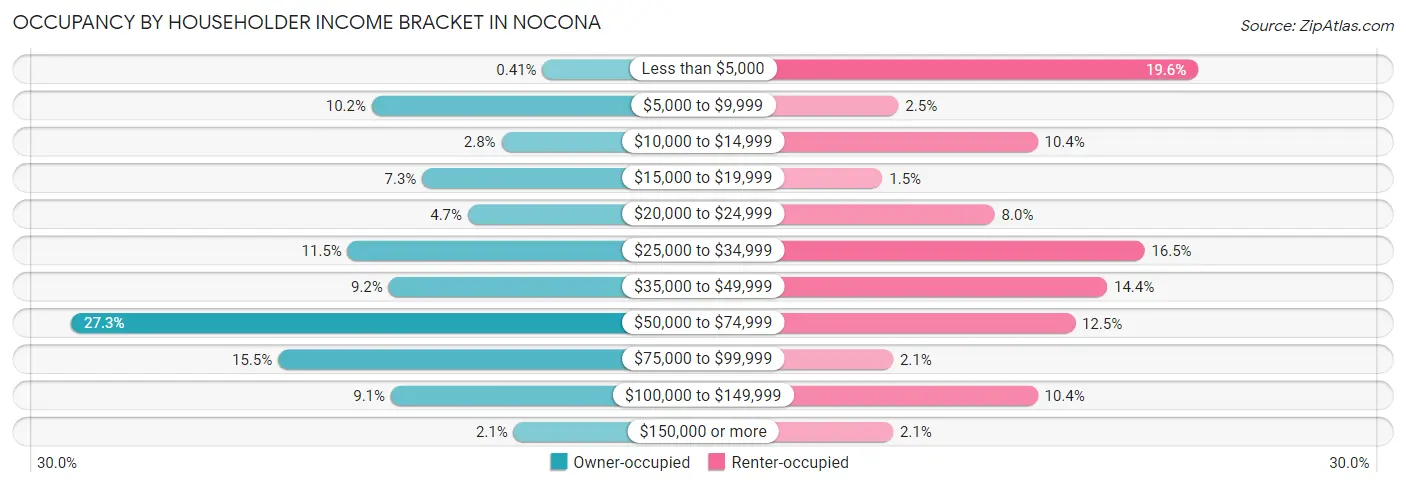
| Income Bracket | Owner-occupied | Renter-occupied |
| Less than $5,000 | 3 (0.4%) | 64 (19.6%) |
| $5,000 to $9,999 | 74 (10.2%) | 8 (2.5%) |
| $10,000 to $14,999 | 20 (2.8%) | 34 (10.4%) |
| $15,000 to $19,999 | 53 (7.3%) | 5 (1.5%) |
| $20,000 to $24,999 | 34 (4.7%) | 26 (8.0%) |
| $25,000 to $34,999 | 84 (11.5%) | 54 (16.5%) |
| $35,000 to $49,999 | 67 (9.2%) | 47 (14.4%) |
| $50,000 to $74,999 | 199 (27.3%) | 41 (12.5%) |
| $75,000 to $99,999 | 113 (15.5%) | 7 (2.1%) |
| $100,000 to $149,999 | 66 (9.1%) | 34 (10.4%) |
| $150,000 or more | 15 (2.1%) | 7 (2.1%) |
| Total | 728 (100.0%) | 327 (100.0%) |
Monthly Housing Cost Tiers in Nocona
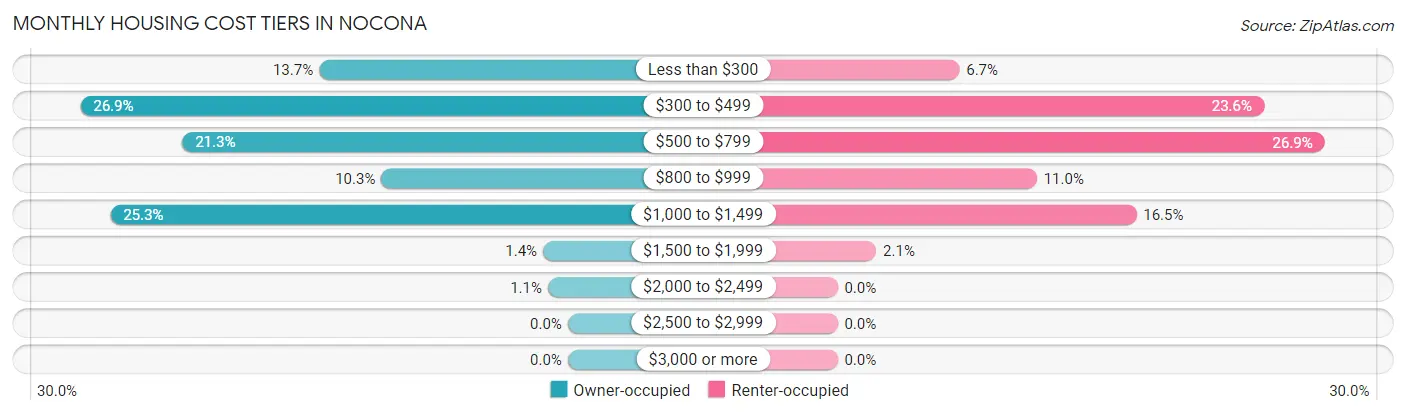
| Monthly Cost | Owner-occupied | Renter-occupied |
| Less than $300 | 100 (13.7%) | 22 (6.7%) |
| $300 to $499 | 196 (26.9%) | 77 (23.5%) |
| $500 to $799 | 155 (21.3%) | 88 (26.9%) |
| $800 to $999 | 75 (10.3%) | 36 (11.0%) |
| $1,000 to $1,499 | 184 (25.3%) | 54 (16.5%) |
| $1,500 to $1,999 | 10 (1.4%) | 7 (2.1%) |
| $2,000 to $2,499 | 8 (1.1%) | 0 (0.0%) |
| $2,500 to $2,999 | 0 (0.0%) | 0 (0.0%) |
| $3,000 or more | 0 (0.0%) | 0 (0.0%) |
| Total | 728 (100.0%) | 327 (100.0%) |
Physical Housing Characteristics in Nocona
Housing Structures in Nocona
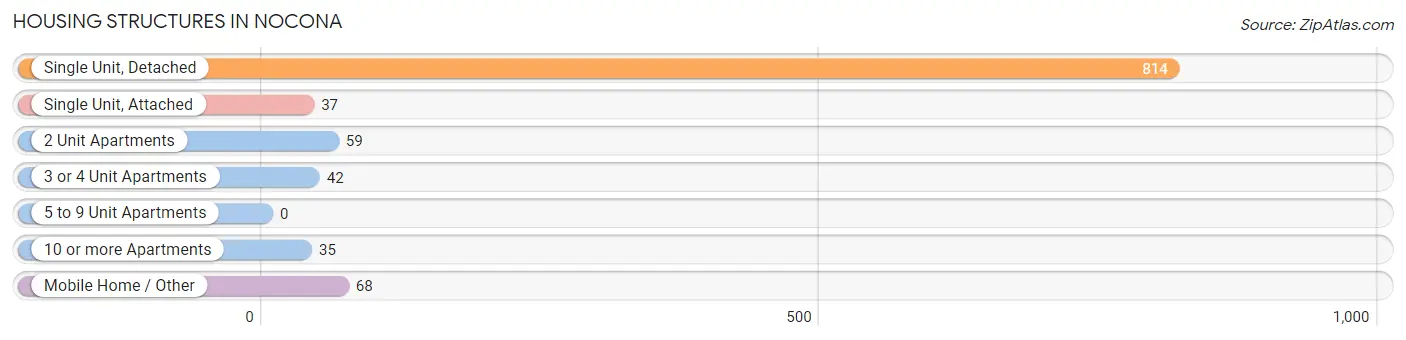
| Structure Type | # Housing Units | % Housing Units |
| Single Unit, Detached | 814 | 77.2% |
| Single Unit, Attached | 37 | 3.5% |
| 2 Unit Apartments | 59 | 5.6% |
| 3 or 4 Unit Apartments | 42 | 4.0% |
| 5 to 9 Unit Apartments | 0 | 0.0% |
| 10 or more Apartments | 35 | 3.3% |
| Mobile Home / Other | 68 | 6.5% |
| Total | 1,055 | 100.0% |
Housing Structures by Occupancy in Nocona
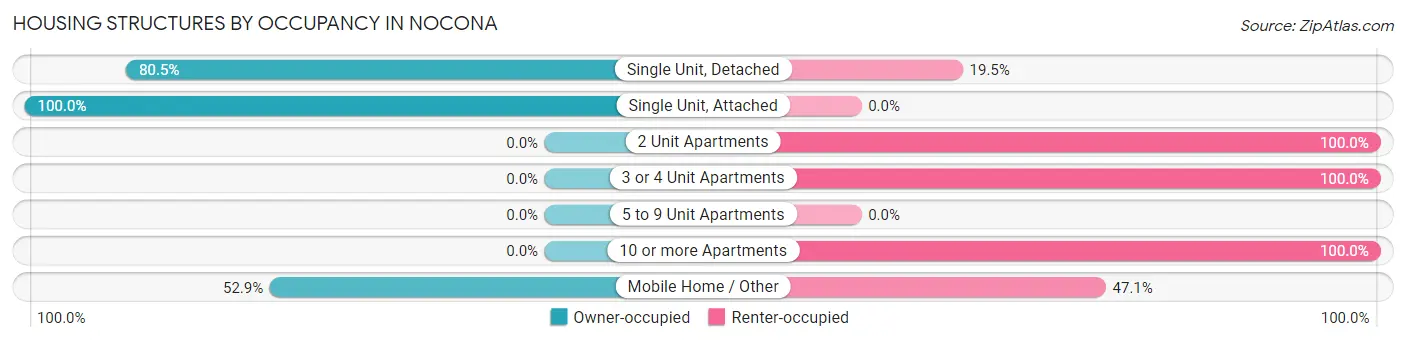
| Structure Type | Owner-occupied | Renter-occupied |
| Single Unit, Detached | 655 (80.5%) | 159 (19.5%) |
| Single Unit, Attached | 37 (100.0%) | 0 (0.0%) |
| 2 Unit Apartments | 0 (0.0%) | 59 (100.0%) |
| 3 or 4 Unit Apartments | 0 (0.0%) | 42 (100.0%) |
| 5 to 9 Unit Apartments | 0 (0.0%) | 0 (0.0%) |
| 10 or more Apartments | 0 (0.0%) | 35 (100.0%) |
| Mobile Home / Other | 36 (52.9%) | 32 (47.1%) |
| Total | 728 (69.0%) | 327 (31.0%) |
Housing Structures by Number of Rooms in Nocona
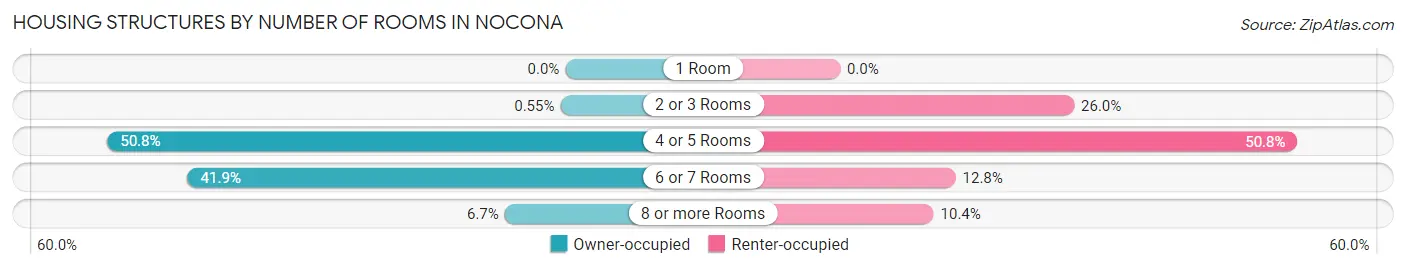
| Number of Rooms | Owner-occupied | Renter-occupied |
| 1 Room | 0 (0.0%) | 0 (0.0%) |
| 2 or 3 Rooms | 4 (0.5%) | 85 (26.0%) |
| 4 or 5 Rooms | 370 (50.8%) | 166 (50.8%) |
| 6 or 7 Rooms | 305 (41.9%) | 42 (12.8%) |
| 8 or more Rooms | 49 (6.7%) | 34 (10.4%) |
| Total | 728 (100.0%) | 327 (100.0%) |
Housing Structure by Heating Type in Nocona
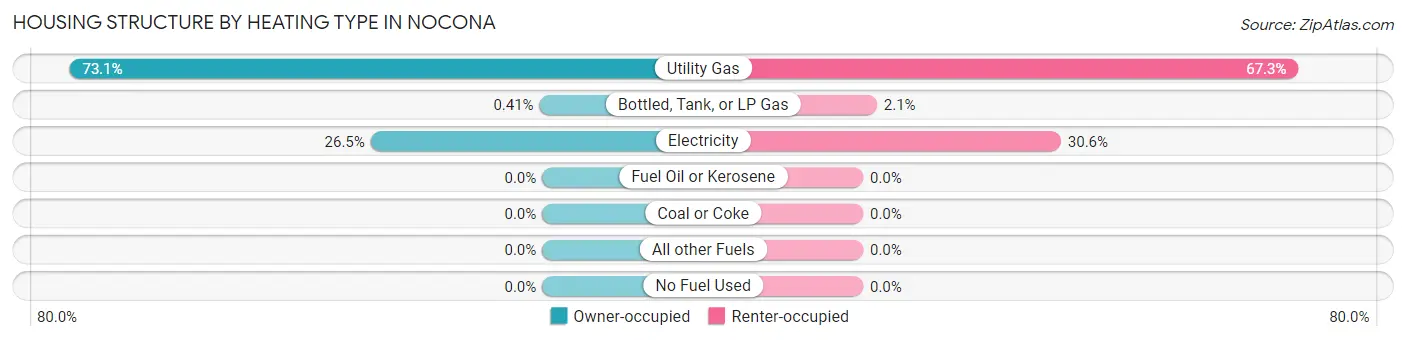
| Heating Type | Owner-occupied | Renter-occupied |
| Utility Gas | 532 (73.1%) | 220 (67.3%) |
| Bottled, Tank, or LP Gas | 3 (0.4%) | 7 (2.1%) |
| Electricity | 193 (26.5%) | 100 (30.6%) |
| Fuel Oil or Kerosene | 0 (0.0%) | 0 (0.0%) |
| Coal or Coke | 0 (0.0%) | 0 (0.0%) |
| All other Fuels | 0 (0.0%) | 0 (0.0%) |
| No Fuel Used | 0 (0.0%) | 0 (0.0%) |
| Total | 728 (100.0%) | 327 (100.0%) |
Household Vehicle Usage in Nocona
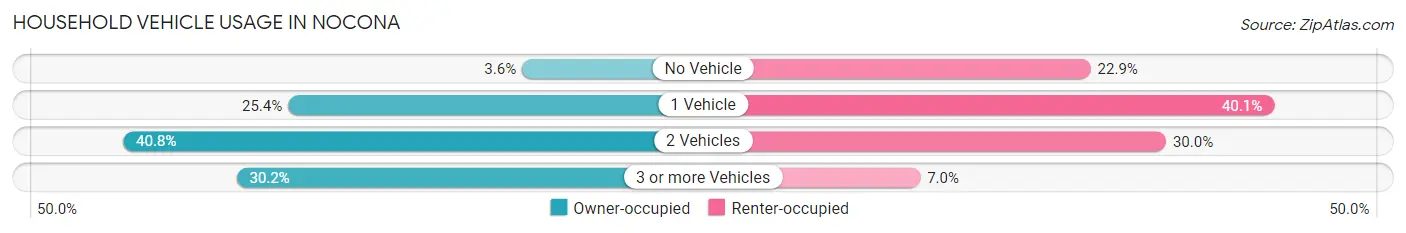
| Vehicles per Household | Owner-occupied | Renter-occupied |
| No Vehicle | 26 (3.6%) | 75 (22.9%) |
| 1 Vehicle | 185 (25.4%) | 131 (40.1%) |
| 2 Vehicles | 297 (40.8%) | 98 (30.0%) |
| 3 or more Vehicles | 220 (30.2%) | 23 (7.0%) |
| Total | 728 (100.0%) | 327 (100.0%) |
Real Estate & Mortgages in Nocona
Real Estate and Mortgage Overview in Nocona
| Characteristic | Without Mortgage | With Mortgage |
| Housing Units | 474 | 254 |
| Median Property Value | $90,000 | $103,500 |
| Median Household Income | $47,143 | $8 |
| Monthly Housing Costs | $414 | $0 |
| Real Estate Taxes | $1,183 | $0 |
Property Value by Mortgage Status in Nocona
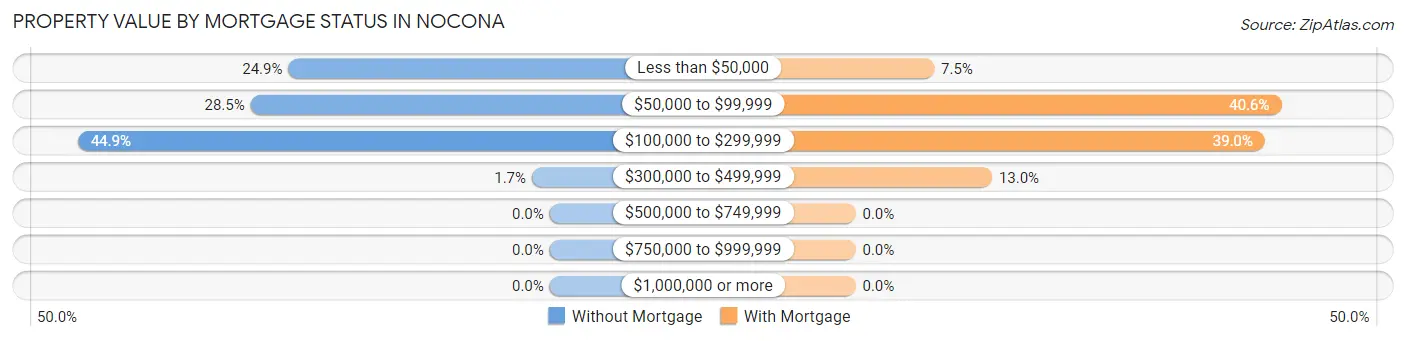
| Property Value | Without Mortgage | With Mortgage |
| Less than $50,000 | 118 (24.9%) | 19 (7.5%) |
| $50,000 to $99,999 | 135 (28.5%) | 103 (40.6%) |
| $100,000 to $299,999 | 213 (44.9%) | 99 (39.0%) |
| $300,000 to $499,999 | 8 (1.7%) | 33 (13.0%) |
| $500,000 to $749,999 | 0 (0.0%) | 0 (0.0%) |
| $750,000 to $999,999 | 0 (0.0%) | 0 (0.0%) |
| $1,000,000 or more | 0 (0.0%) | 0 (0.0%) |
| Total | 474 (100.0%) | 254 (100.0%) |
Household Income by Mortgage Status in Nocona
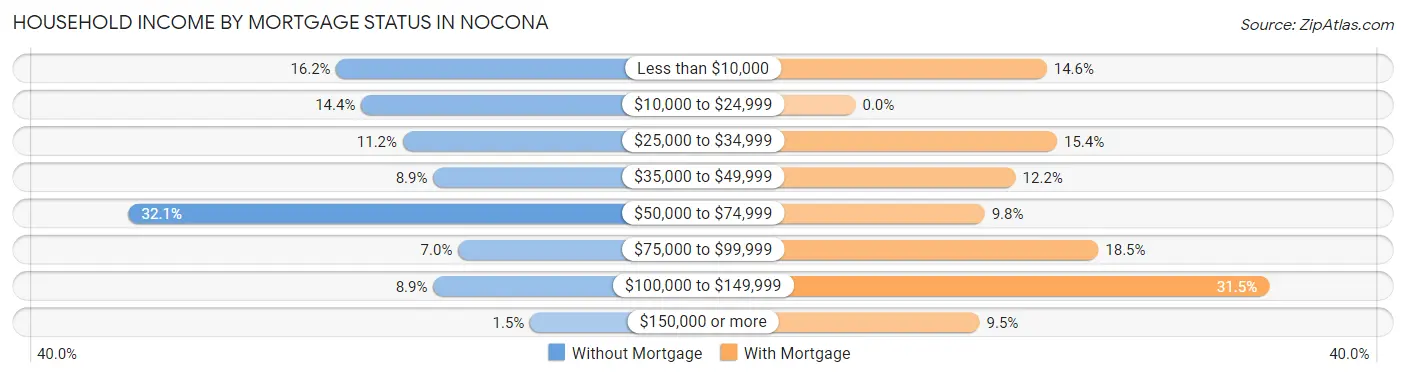
| Household Income | Without Mortgage | With Mortgage |
| Less than $10,000 | 77 (16.2%) | 37 (14.6%) |
| $10,000 to $24,999 | 68 (14.3%) | 0 (0.0%) |
| $25,000 to $34,999 | 53 (11.2%) | 39 (15.3%) |
| $35,000 to $49,999 | 42 (8.9%) | 31 (12.2%) |
| $50,000 to $74,999 | 152 (32.1%) | 25 (9.8%) |
| $75,000 to $99,999 | 33 (7.0%) | 47 (18.5%) |
| $100,000 to $149,999 | 42 (8.9%) | 80 (31.5%) |
| $150,000 or more | 7 (1.5%) | 24 (9.5%) |
| Total | 474 (100.0%) | 254 (100.0%) |
Property Value to Household Income Ratio in Nocona
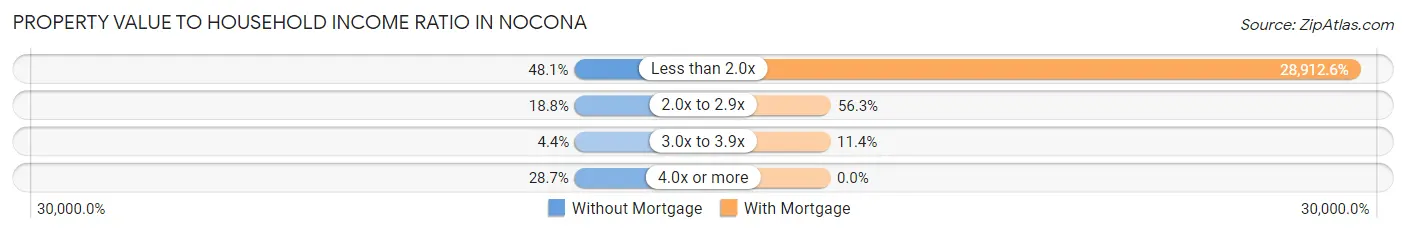
| Value-to-Income Ratio | Without Mortgage | With Mortgage |
| Less than 2.0x | 228 (48.1%) | 73,438 (28,912.6%) |
| 2.0x to 2.9x | 89 (18.8%) | 143 (56.3%) |
| 3.0x to 3.9x | 21 (4.4%) | 29 (11.4%) |
| 4.0x or more | 136 (28.7%) | 0 (0.0%) |
| Total | 474 (100.0%) | 254 (100.0%) |
Real Estate Taxes by Mortgage Status in Nocona
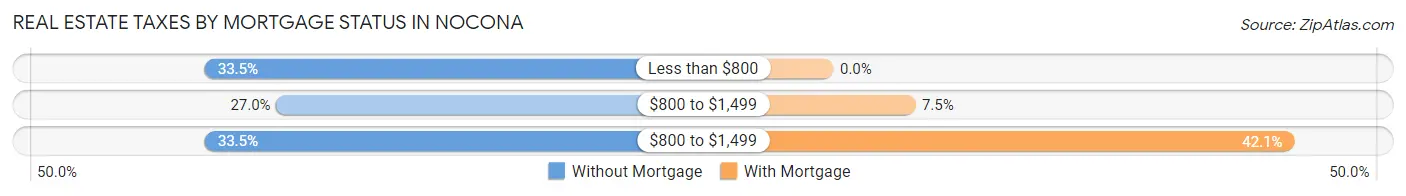
| Property Taxes | Without Mortgage | With Mortgage |
| Less than $800 | 159 (33.5%) | 0 (0.0%) |
| $800 to $1,499 | 128 (27.0%) | 19 (7.5%) |
| $800 to $1,499 | 159 (33.5%) | 107 (42.1%) |
| Total | 474 (100.0%) | 254 (100.0%) |
Health & Disability in Nocona
Health Insurance Coverage by Age in Nocona
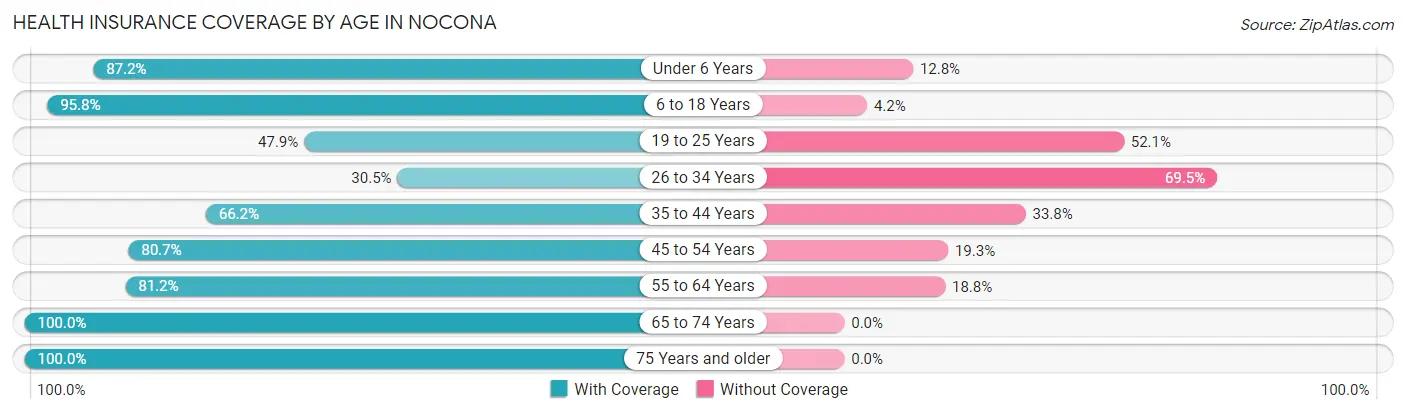
| Age Bracket | With Coverage | Without Coverage |
| Under 6 Years | 184 (87.2%) | 27 (12.8%) |
| 6 to 18 Years | 634 (95.8%) | 28 (4.2%) |
| 19 to 25 Years | 181 (47.9%) | 197 (52.1%) |
| 26 to 34 Years | 96 (30.5%) | 219 (69.5%) |
| 35 to 44 Years | 190 (66.2%) | 97 (33.8%) |
| 45 to 54 Years | 196 (80.7%) | 47 (19.3%) |
| 55 to 64 Years | 268 (81.2%) | 62 (18.8%) |
| 65 to 74 Years | 287 (100.0%) | 0 (0.0%) |
| 75 Years and older | 255 (100.0%) | 0 (0.0%) |
| Total | 2,291 (77.2%) | 677 (22.8%) |
Health Insurance Coverage by Citizenship Status in Nocona
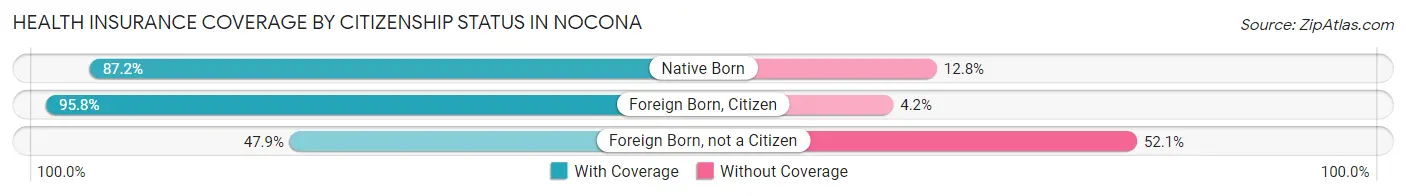
| Citizenship Status | With Coverage | Without Coverage |
| Native Born | 184 (87.2%) | 27 (12.8%) |
| Foreign Born, Citizen | 634 (95.8%) | 28 (4.2%) |
| Foreign Born, not a Citizen | 181 (47.9%) | 197 (52.1%) |
Health Insurance Coverage by Household Income in Nocona
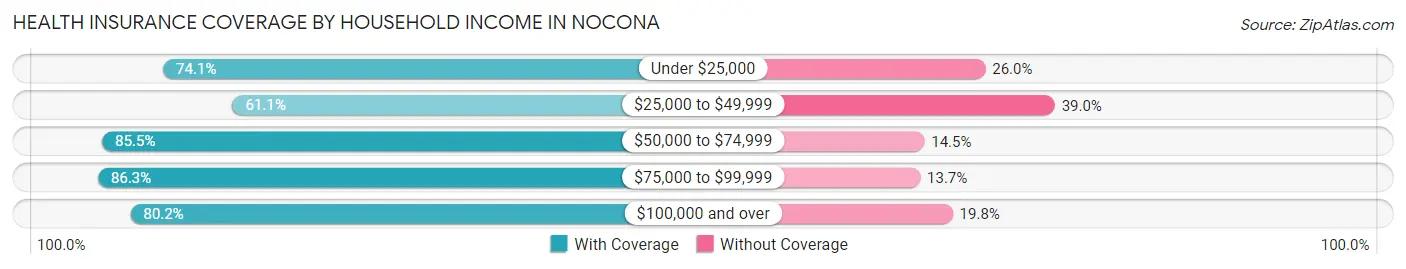
| Household Income | With Coverage | Without Coverage |
| Under $25,000 | 408 (74.1%) | 143 (26.0%) |
| $25,000 to $49,999 | 420 (61.1%) | 268 (39.0%) |
| $50,000 to $74,999 | 730 (85.5%) | 124 (14.5%) |
| $75,000 to $99,999 | 446 (86.3%) | 71 (13.7%) |
| $100,000 and over | 287 (80.2%) | 71 (19.8%) |
Public vs Private Health Insurance Coverage by Age in Nocona
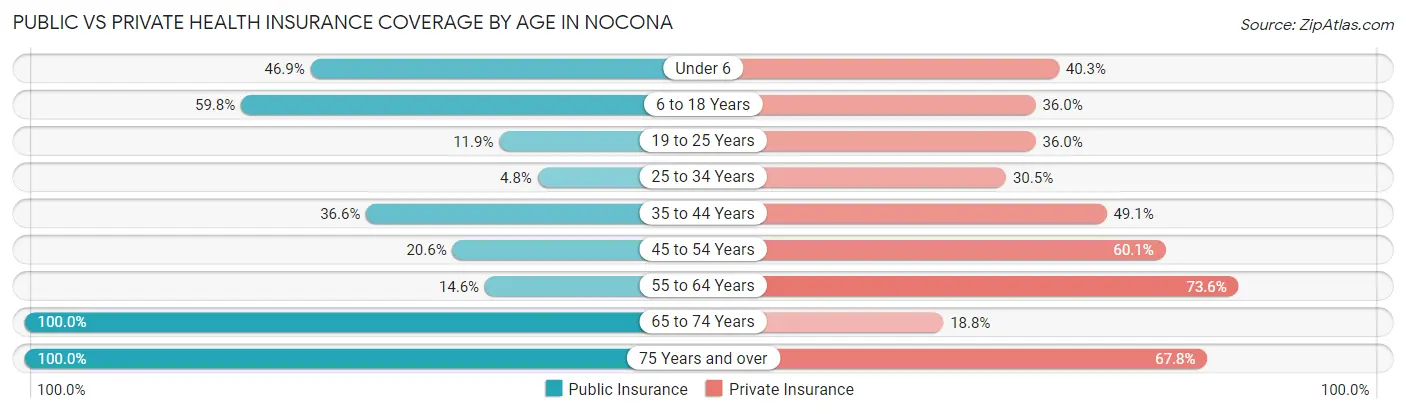
| Age Bracket | Public Insurance | Private Insurance |
| Under 6 | 99 (46.9%) | 85 (40.3%) |
| 6 to 18 Years | 396 (59.8%) | 238 (35.9%) |
| 19 to 25 Years | 45 (11.9%) | 136 (36.0%) |
| 25 to 34 Years | 15 (4.8%) | 96 (30.5%) |
| 35 to 44 Years | 105 (36.6%) | 141 (49.1%) |
| 45 to 54 Years | 50 (20.6%) | 146 (60.1%) |
| 55 to 64 Years | 48 (14.5%) | 243 (73.6%) |
| 65 to 74 Years | 287 (100.0%) | 54 (18.8%) |
| 75 Years and over | 255 (100.0%) | 173 (67.8%) |
| Total | 1,300 (43.8%) | 1,312 (44.2%) |
Disability Status by Sex by Age in Nocona
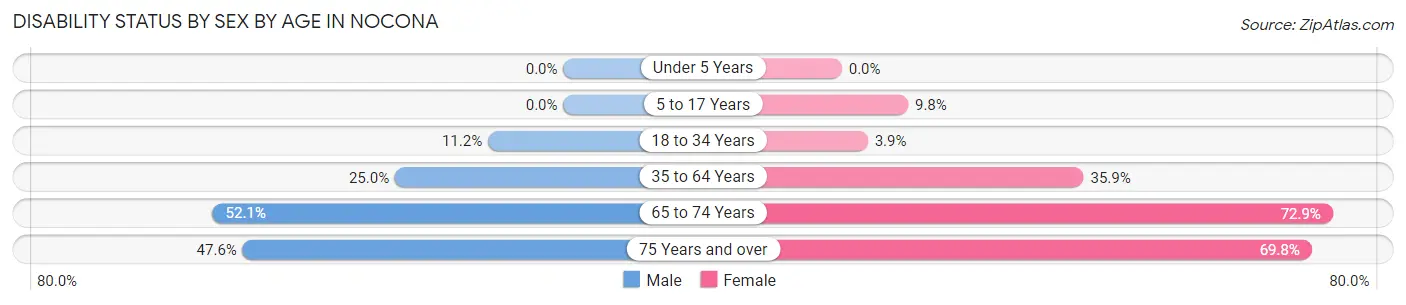
| Age Bracket | Male | Female |
| Under 5 Years | 0 (0.0%) | 0 (0.0%) |
| 5 to 17 Years | 0 (0.0%) | 42 (9.8%) |
| 18 to 34 Years | 30 (11.2%) | 17 (3.8%) |
| 35 to 64 Years | 121 (25.0%) | 135 (35.9%) |
| 65 to 74 Years | 63 (52.1%) | 121 (72.9%) |
| 75 Years and over | 60 (47.6%) | 90 (69.8%) |
Disability Class by Sex by Age in Nocona
Disability Class: Hearing Difficulty
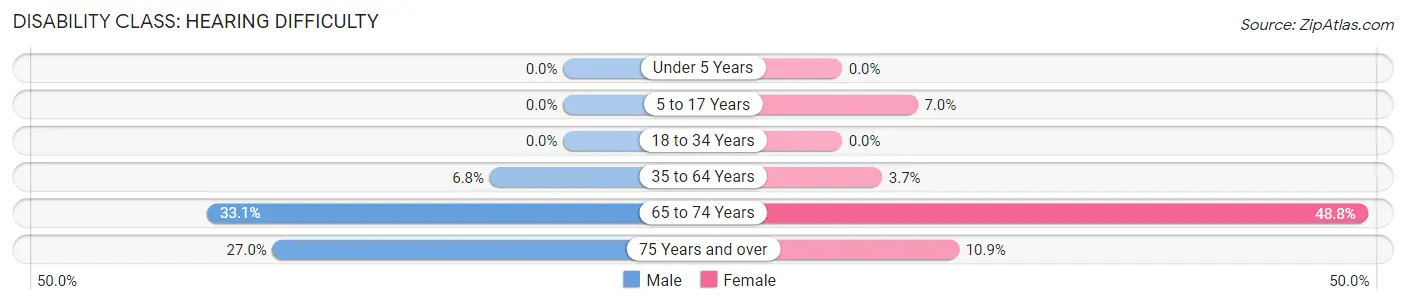
| Age Bracket | Male | Female |
| Under 5 Years | 0 (0.0%) | 0 (0.0%) |
| 5 to 17 Years | 0 (0.0%) | 30 (7.0%) |
| 18 to 34 Years | 0 (0.0%) | 0 (0.0%) |
| 35 to 64 Years | 33 (6.8%) | 14 (3.7%) |
| 65 to 74 Years | 40 (33.1%) | 81 (48.8%) |
| 75 Years and over | 34 (27.0%) | 14 (10.8%) |
Disability Class: Vision Difficulty
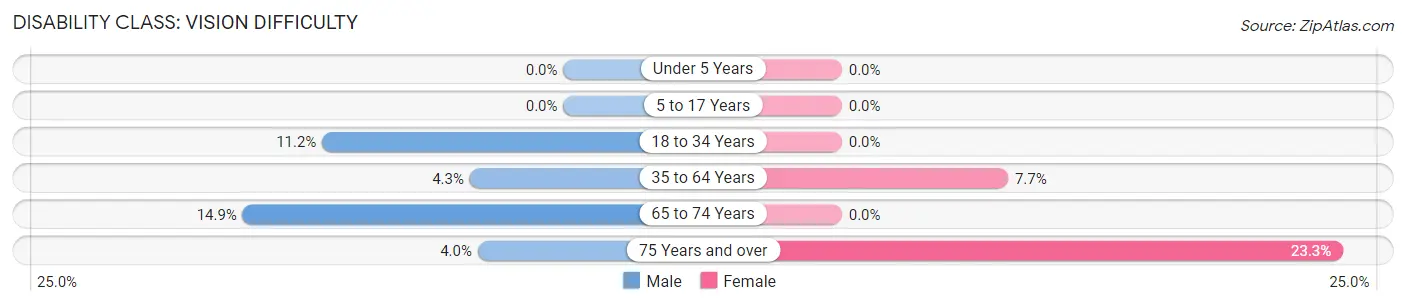
| Age Bracket | Male | Female |
| Under 5 Years | 0 (0.0%) | 0 (0.0%) |
| 5 to 17 Years | 0 (0.0%) | 0 (0.0%) |
| 18 to 34 Years | 30 (11.2%) | 0 (0.0%) |
| 35 to 64 Years | 21 (4.3%) | 29 (7.7%) |
| 65 to 74 Years | 18 (14.9%) | 0 (0.0%) |
| 75 Years and over | 5 (4.0%) | 30 (23.3%) |
Disability Class: Cognitive Difficulty
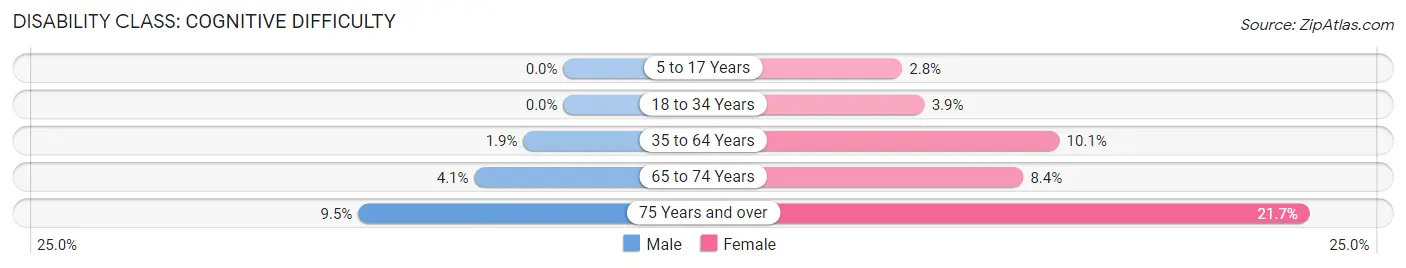
| Age Bracket | Male | Female |
| 5 to 17 Years | 0 (0.0%) | 12 (2.8%) |
| 18 to 34 Years | 0 (0.0%) | 17 (3.8%) |
| 35 to 64 Years | 9 (1.9%) | 38 (10.1%) |
| 65 to 74 Years | 5 (4.1%) | 14 (8.4%) |
| 75 Years and over | 12 (9.5%) | 28 (21.7%) |
Disability Class: Ambulatory Difficulty
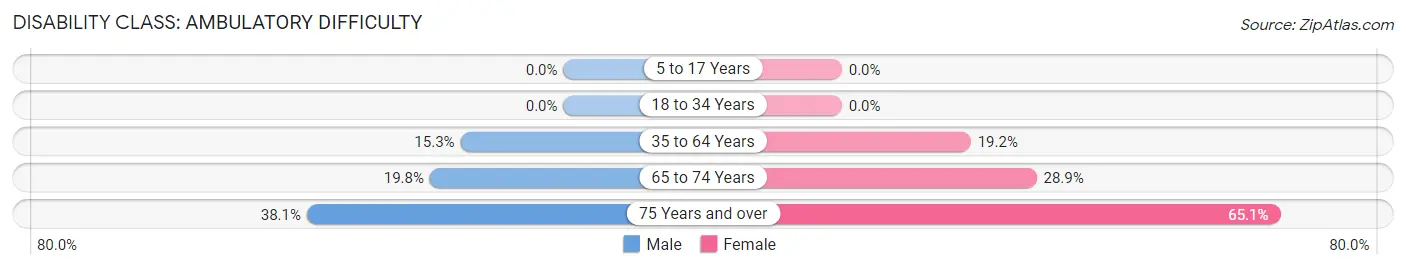
| Age Bracket | Male | Female |
| 5 to 17 Years | 0 (0.0%) | 0 (0.0%) |
| 18 to 34 Years | 0 (0.0%) | 0 (0.0%) |
| 35 to 64 Years | 74 (15.3%) | 72 (19.2%) |
| 65 to 74 Years | 24 (19.8%) | 48 (28.9%) |
| 75 Years and over | 48 (38.1%) | 84 (65.1%) |
Disability Class: Self-Care Difficulty
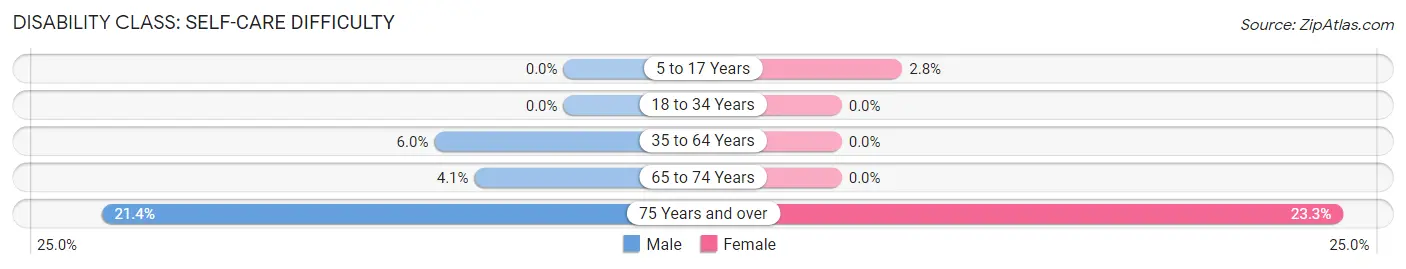
| Age Bracket | Male | Female |
| 5 to 17 Years | 0 (0.0%) | 12 (2.8%) |
| 18 to 34 Years | 0 (0.0%) | 0 (0.0%) |
| 35 to 64 Years | 29 (6.0%) | 0 (0.0%) |
| 65 to 74 Years | 5 (4.1%) | 0 (0.0%) |
| 75 Years and over | 27 (21.4%) | 30 (23.3%) |
Technology Access in Nocona
Computing Device Access in Nocona
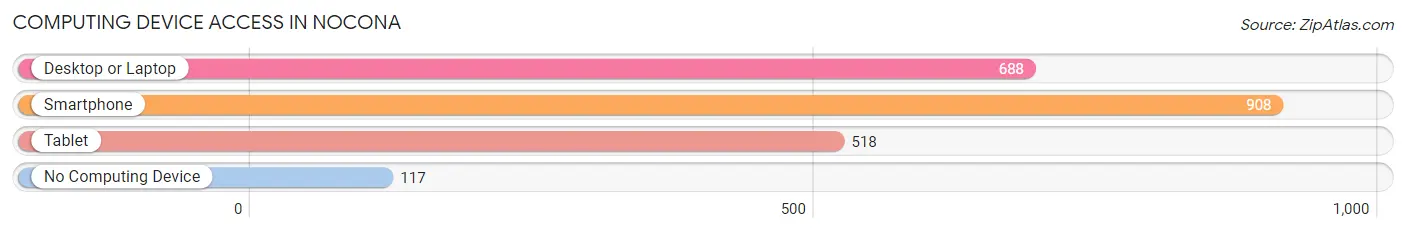
| Device Type | # Households | % Households |
| Desktop or Laptop | 688 | 65.2% |
| Smartphone | 908 | 86.1% |
| Tablet | 518 | 49.1% |
| No Computing Device | 117 | 11.1% |
| Total | 1,055 | 100.0% |
Internet Access in Nocona
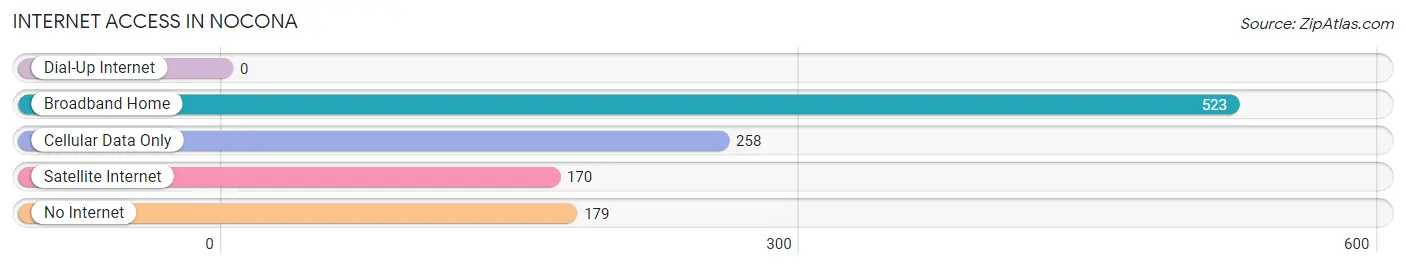
| Internet Type | # Households | % Households |
| Dial-Up Internet | 0 | 0.0% |
| Broadband Home | 523 | 49.6% |
| Cellular Data Only | 258 | 24.4% |
| Satellite Internet | 170 | 16.1% |
| No Internet | 179 | 17.0% |
| Total | 1,055 | 100.0% |
Nocona Summary
Nocona, Texas is a small town located in Montague County, Texas, United States. It is situated on the banks of the Red River, approximately 90 miles northwest of Dallas. The town was founded in 1883 and named after Comanche Chief Peta Nocona. The population of Nocona was 2,023 at the 2010 census.
Geography
Nocona is located at 33°45'25" North, 97°51'25" West (33.756944, -97.856944). It is situated on the banks of the Red River, approximately 90 miles northwest of Dallas. The town is located in the Cross Timbers region of North Central Texas. The terrain is mostly flat with rolling hills and is covered with a mix of grassland and woodlands.
Climate
Nocona has a humid subtropical climate, with hot summers and mild winters. The average annual temperature is 64°F (18°C). The average annual precipitation is 33.5 inches (85 cm).
Demographics
As of the 2010 census, the population of Nocona was 2,023. The racial makeup of the town was 87.3% White, 0.7% African American, 0.7% Native American, 0.2% Asian, 0.1% Pacific Islander, 9.3% from other races, and 1.9% from two or more races. Hispanic or Latino of any race were 18.2% of the population.
Economy
Nocona is a small town with a limited economy. The main industries are agriculture, manufacturing, and tourism. The town is home to several small businesses, including a grocery store, a hardware store, and a few restaurants. The town is also home to several large companies, including Nocona Boot Company, which manufactures western boots and apparel, and Nocona Leather Company, which manufactures leather goods.
The town is also home to several tourist attractions, including the Nocona Boot Company Museum, the Nocona Leather Company Museum, and the Nocona Hills Golf Course.
History
Nocona was founded in 1883 and named after Comanche Chief Peta Nocona. The town was originally a trading post for the Comanche and other Native American tribes. In the late 19th century, the town became a center for the cattle industry.
In the early 20th century, the town began to grow and develop. The Nocona Boot Company was founded in 1925 and the Nocona Leather Company was founded in 1929. The town was incorporated in 1937.
In the late 20th century, the town began to decline. The population decreased and many businesses closed. However, in recent years, the town has seen a resurgence in population and economic activity.
Common Questions
What is Per Capita Income in Nocona?
Per Capita income in Nocona is $20,578.
What is the Median Family Income in Nocona?
Median Family Income in Nocona is $61,250.
What is the Median Household income in Nocona?
Median Household Income in Nocona is $42,104.
What is Income or Wage Gap in Nocona?
Income or Wage Gap in Nocona is 51.9%.
Women in Nocona earn 48.1 cents for every dollar earned by a man.
What is Inequality or Gini Index in Nocona?
Inequality or Gini Index in Nocona is 0.46.
What is the Total Population of Nocona?
Total Population of Nocona is 3,027.
What is the Total Male Population of Nocona?
Total Male Population of Nocona is 1,357.
What is the Total Female Population of Nocona?
Total Female Population of Nocona is 1,670.
What is the Ratio of Males per 100 Females in Nocona?
There are 81.26 Males per 100 Females in Nocona.
What is the Ratio of Females per 100 Males in Nocona?
There are 123.07 Females per 100 Males in Nocona.
What is the Median Population Age in Nocona?
Median Population Age in Nocona is 32.5 Years.
What is the Average Family Size in Nocona
Average Family Size in Nocona is 4.0 People.
What is the Average Household Size in Nocona
Average Household Size in Nocona is 2.8 People.
How Large is the Labor Force in Nocona?
There are 1,243 People in the Labor Forcein in Nocona.
What is the Percentage of People in the Labor Force in Nocona?
55.9% of People are in the Labor Force in Nocona.
What is the Unemployment Rate in Nocona?
Unemployment Rate in Nocona is 15.7%.