New Home, TX Map & Demographics
New Home Map
New Home Overview
$24,039
PER CAPITA INCOME
$54,792
AVG FAMILY INCOME
$52,083
AVG HOUSEHOLD INCOME
49.3%
WAGE / INCOME GAP [ % ]
50.7¢/ $1
WAGE / INCOME GAP [ $ ]
0.43
INEQUALITY / GINI INDEX
367
TOTAL POPULATION
190
MALE POPULATION
177
FEMALE POPULATION
107.34
MALES / 100 FEMALES
93.16
FEMALES / 100 MALES
31.1
MEDIAN AGE
3.4
AVG FAMILY SIZE
2.8
AVG HOUSEHOLD SIZE
193
LABOR FORCE [ PEOPLE ]
71.7%
PERCENT IN LABOR FORCE
4.7%
UNEMPLOYMENT RATE
New Home Zip Codes
New Home Area Codes
Income in New Home
Income Overview in New Home
Per Capita Income in New Home is $24,039, while median incomes of families and households are $54,792 and $52,083 respectively.
| Characteristic | Number | Measure |
| Per Capita Income | 367 | $24,039 |
| Median Family Income | 99 | $54,792 |
| Mean Family Income | 99 | $71,794 |
| Median Household Income | 129 | $52,083 |
| Mean Household Income | 129 | $70,378 |
| Income Deficit | 99 | $0 |
| Wage / Income Gap (%) | 367 | 49.35% |
| Wage / Income Gap ($) | 367 | 50.65¢ per $1 |
| Gini / Inequality Index | 367 | 0.43 |
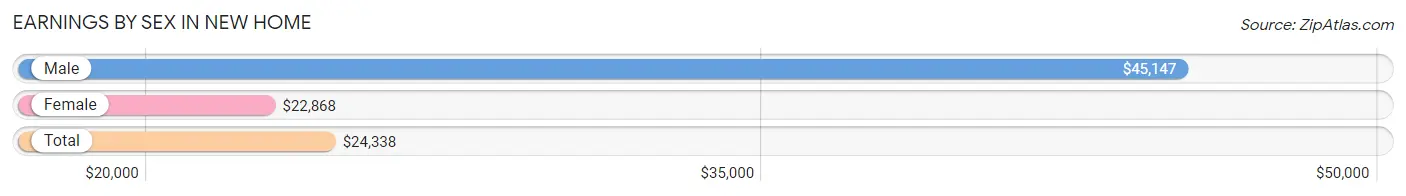
Earnings by Sex in New Home
Average Earnings in New Home are $24,338, $45,147 for men and $22,868 for women, a difference of 49.3%.
| Sex | Number | Average Earnings |
| Male | 124 (59.3%) | $45,147 |
| Female | 85 (40.7%) | $22,868 |
| Total | 209 (100.0%) | $24,338 |
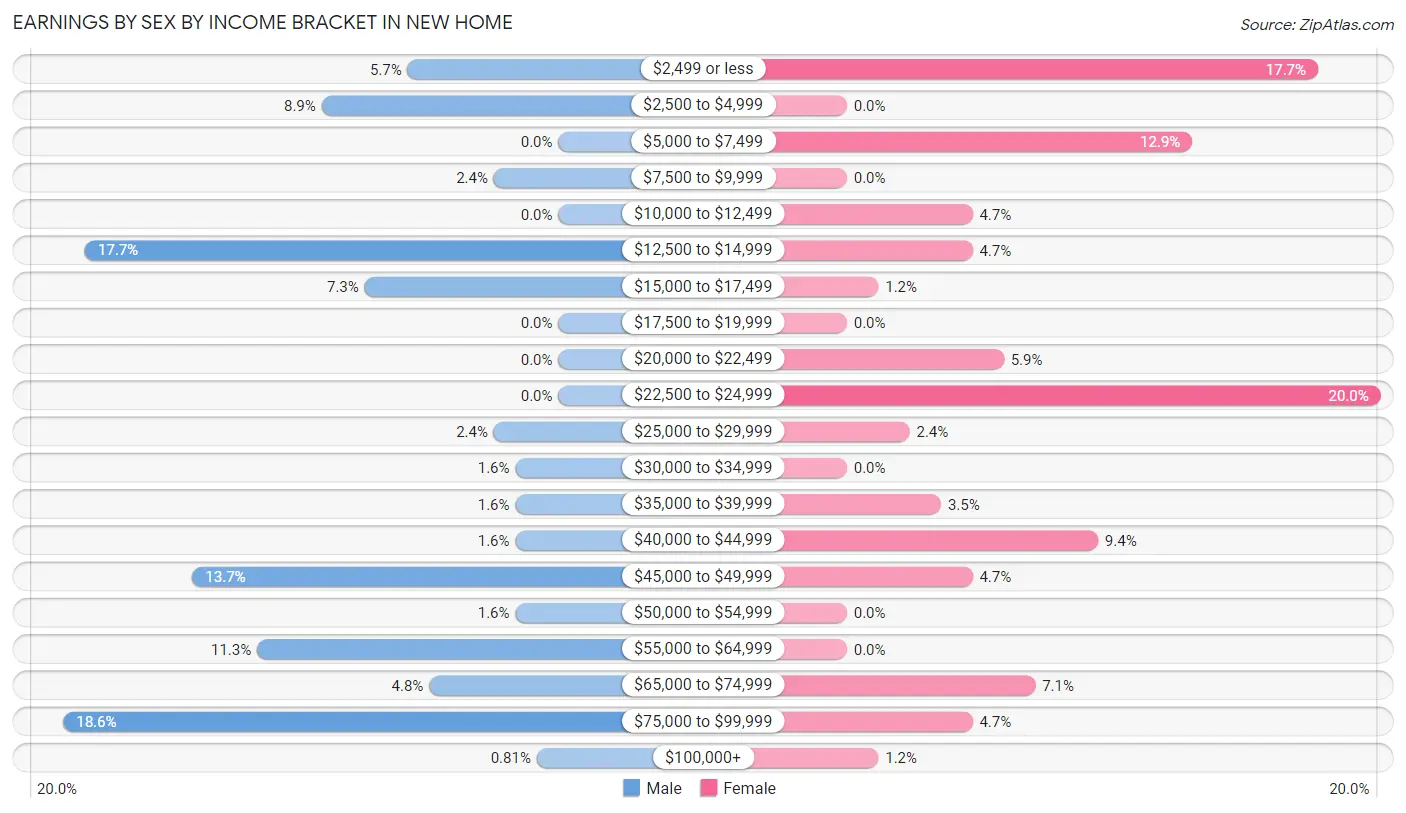
Earnings by Sex by Income Bracket in New Home
The most common earnings brackets in New Home are $75,000 to $99,999 for men (23 | 18.5%) and $22,500 to $24,999 for women (17 | 20.0%).
| Income | Male | Female |
| $2,499 or less | 7 (5.7%) | 15 (17.6%) |
| $2,500 to $4,999 | 11 (8.9%) | 0 (0.0%) |
| $5,000 to $7,499 | 0 (0.0%) | 11 (12.9%) |
| $7,500 to $9,999 | 3 (2.4%) | 0 (0.0%) |
| $10,000 to $12,499 | 0 (0.0%) | 4 (4.7%) |
| $12,500 to $14,999 | 22 (17.7%) | 4 (4.7%) |
| $15,000 to $17,499 | 9 (7.3%) | 1 (1.2%) |
| $17,500 to $19,999 | 0 (0.0%) | 0 (0.0%) |
| $20,000 to $22,499 | 0 (0.0%) | 5 (5.9%) |
| $22,500 to $24,999 | 0 (0.0%) | 17 (20.0%) |
| $25,000 to $29,999 | 3 (2.4%) | 2 (2.4%) |
| $30,000 to $34,999 | 2 (1.6%) | 0 (0.0%) |
| $35,000 to $39,999 | 2 (1.6%) | 3 (3.5%) |
| $40,000 to $44,999 | 2 (1.6%) | 8 (9.4%) |
| $45,000 to $49,999 | 17 (13.7%) | 4 (4.7%) |
| $50,000 to $54,999 | 2 (1.6%) | 0 (0.0%) |
| $55,000 to $64,999 | 14 (11.3%) | 0 (0.0%) |
| $65,000 to $74,999 | 6 (4.8%) | 6 (7.1%) |
| $75,000 to $99,999 | 23 (18.5%) | 4 (4.7%) |
| $100,000+ | 1 (0.8%) | 1 (1.2%) |
| Total | 124 (100.0%) | 85 (100.0%) |
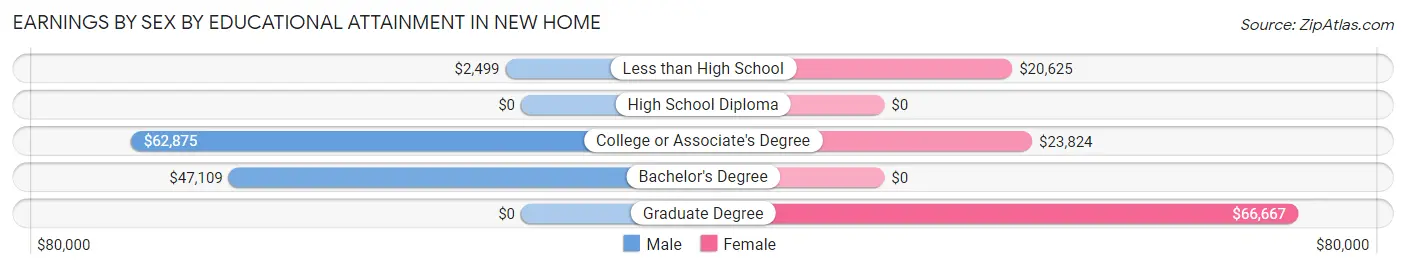
Earnings by Sex by Educational Attainment in New Home
Average earnings in New Home are $47,279 for men and $23,676 for women, a difference of 49.9%. Men with an educational attainment of college or associate's degree enjoy the highest average annual earnings of $62,875, while those with less than high school education earn the least with $2,499. Women with an educational attainment of graduate degree earn the most with the average annual earnings of $66,667, while those with less than high school education have the smallest earnings of $20,625.
| Educational Attainment | Male Income | Female Income |
| Less than High School | $2,499 | $20,625 |
| High School Diploma | - | - |
| College or Associate's Degree | $62,875 | $23,824 |
| Bachelor's Degree | $47,109 | $0 |
| Graduate Degree | - | - |
| Total | $47,279 | $23,676 |
Family Income in New Home
Family Income Brackets in New Home
According to the New Home family income data, there are 15 families falling into the $25,000 to $34,999 income range, which is the most common income bracket and makes up 15.1% of all families.
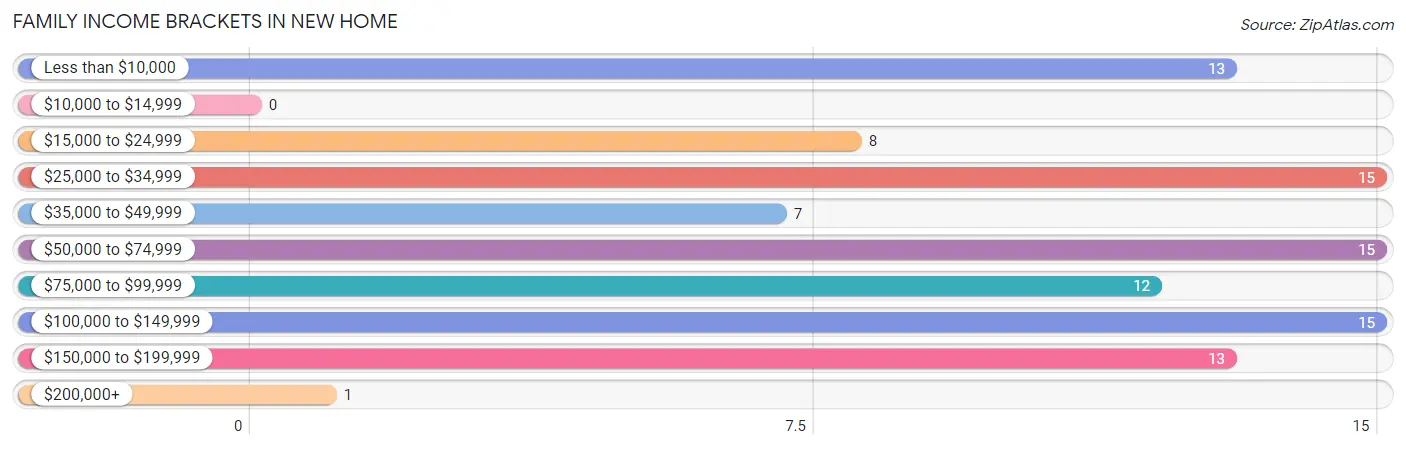
| Income Bracket | # Families | % Families |
| Less than $10,000 | 13 | 13.1% |
| $10,000 to $14,999 | 0 | 0.0% |
| $15,000 to $24,999 | 8 | 8.1% |
| $25,000 to $34,999 | 15 | 15.2% |
| $35,000 to $49,999 | 7 | 7.1% |
| $50,000 to $74,999 | 15 | 15.2% |
| $75,000 to $99,999 | 12 | 12.1% |
| $100,000 to $149,999 | 15 | 15.2% |
| $150,000 to $199,999 | 13 | 13.1% |
| $200,000+ | 1 | 1.0% |
Family Income by Famaliy Size in New Home
3-person families (26 | 26.3%) account for the highest median family income in New Home with $97,143 per family, while 3-person families (26 | 26.3%) have the highest median income of $32,381 per family member.
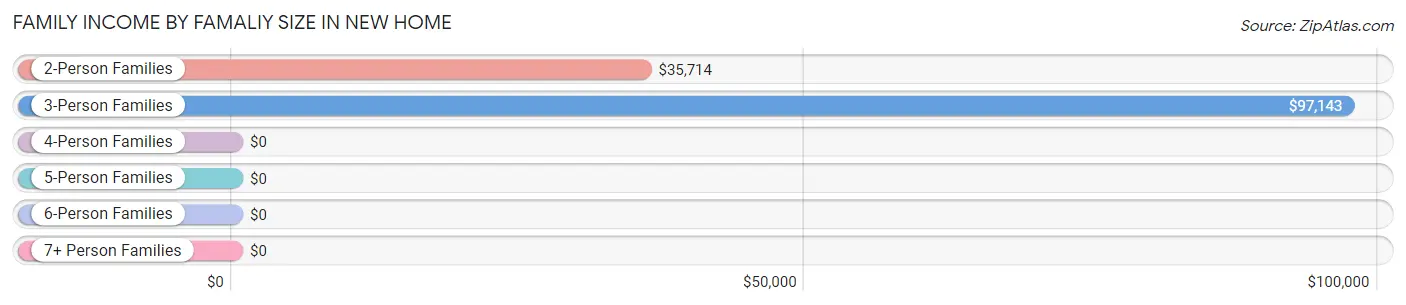
| Income Bracket | # Families | Median Income |
| 2-Person Families | 40 (40.4%) | $35,714 |
| 3-Person Families | 26 (26.3%) | $97,143 |
| 4-Person Families | 21 (21.2%) | $0 |
| 5-Person Families | 7 (7.1%) | $0 |
| 6-Person Families | 5 (5.1%) | $0 |
| 7+ Person Families | 0 (0.0%) | $0 |
| Total | 99 (100.0%) | $54,792 |
Family Income by Number of Earners in New Home
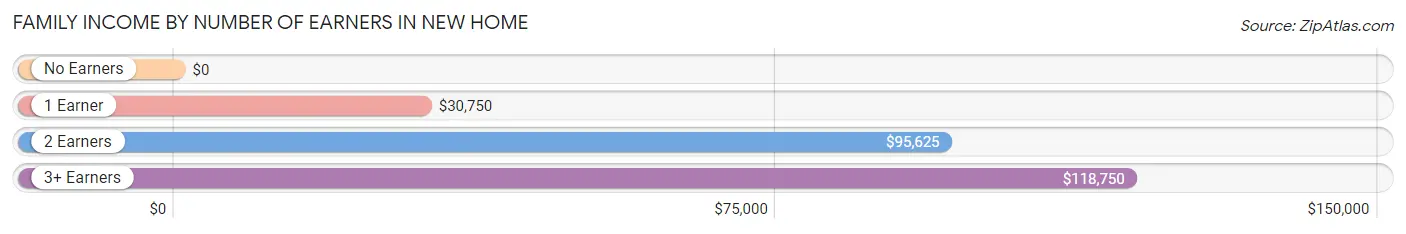
| Number of Earners | # Families | Median Income |
| No Earners | 11 (11.1%) | $0 |
| 1 Earner | 35 (35.3%) | $30,750 |
| 2 Earners | 37 (37.4%) | $95,625 |
| 3+ Earners | 16 (16.2%) | $118,750 |
| Total | 99 (100.0%) | $54,792 |
Household Income in New Home
Household Income Brackets in New Home
With 23 households falling in the category, the $100,000 to $149,999 income range is the most frequent in New Home, accounting for 17.8% of all households. In contrast, only 1 households (0.8%) fall into the $10,000 to $14,999 income bracket, making it the least populous group.
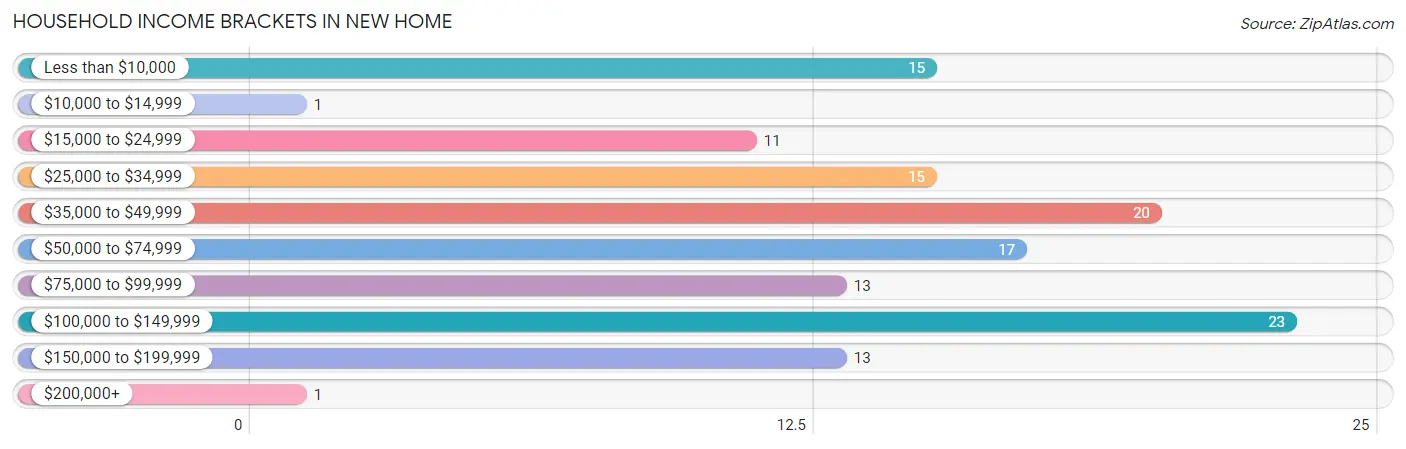
| Income Bracket | # Households | % Households |
| Less than $10,000 | 15 | 11.6% |
| $10,000 to $14,999 | 1 | 0.8% |
| $15,000 to $24,999 | 11 | 8.5% |
| $25,000 to $34,999 | 15 | 11.6% |
| $35,000 to $49,999 | 20 | 15.5% |
| $50,000 to $74,999 | 17 | 13.2% |
| $75,000 to $99,999 | 13 | 10.1% |
| $100,000 to $149,999 | 23 | 17.8% |
| $150,000 to $199,999 | 13 | 10.1% |
| $200,000+ | 1 | 0.8% |
Household Income by Householder Age in New Home
The median household income in New Home is $52,083, with the highest median household income of $93,125 found in the 45 to 64 years age bracket for the primary householder. A total of 39 households (30.2%) fall into this category.
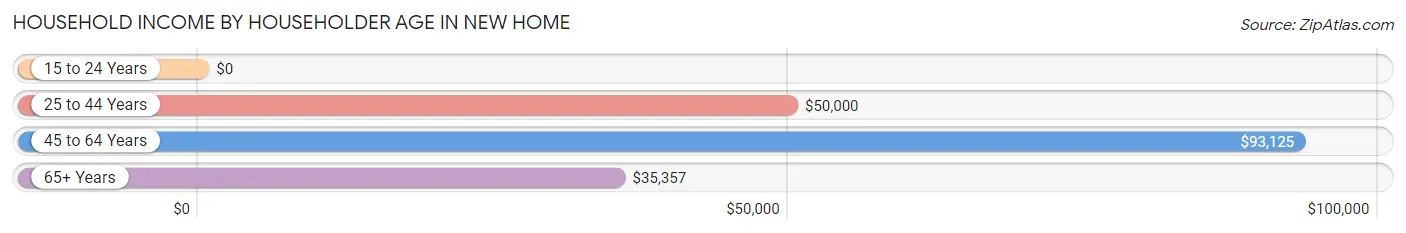
| Income Bracket | # Households | Median Income |
| 15 to 24 Years | 0 (0.0%) | $0 |
| 25 to 44 Years | 62 (48.1%) | $50,000 |
| 45 to 64 Years | 39 (30.2%) | $93,125 |
| 65+ Years | 28 (21.7%) | $35,357 |
| Total | 129 (100.0%) | $52,083 |
Poverty in New Home
Income Below Poverty by Sex and Age in New Home
With 24.7% poverty level for males and 30.5% for females among the residents of New Home, 5 year old males and under 5 year old females are the most vulnerable to poverty, with 8 males (100.0%) and 4 females (100.0%) in their respective age groups living below the poverty level.
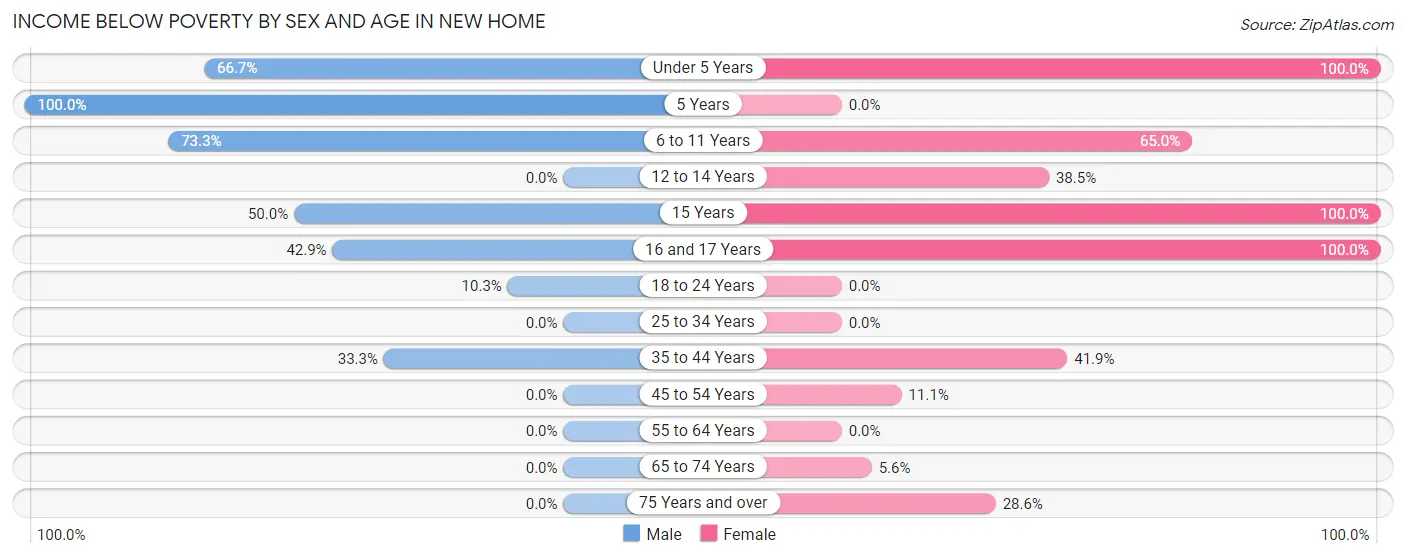
| Age Bracket | Male | Female |
| Under 5 Years | 4 (66.7%) | 4 (100.0%) |
| 5 Years | 8 (100.0%) | 0 (0.0%) |
| 6 to 11 Years | 22 (73.3%) | 13 (65.0%) |
| 12 to 14 Years | 0 (0.0%) | 5 (38.5%) |
| 15 Years | 2 (50.0%) | 2 (100.0%) |
| 16 and 17 Years | 3 (42.9%) | 5 (100.0%) |
| 18 to 24 Years | 3 (10.3%) | 0 (0.0%) |
| 25 to 34 Years | 0 (0.0%) | 0 (0.0%) |
| 35 to 44 Years | 5 (33.3%) | 18 (41.9%) |
| 45 to 54 Years | 0 (0.0%) | 3 (11.1%) |
| 55 to 64 Years | 0 (0.0%) | 0 (0.0%) |
| 65 to 74 Years | 0 (0.0%) | 1 (5.6%) |
| 75 Years and over | 0 (0.0%) | 2 (28.6%) |
| Total | 47 (24.7%) | 53 (30.5%) |
Income Above Poverty by Sex and Age in New Home
According to the poverty statistics in New Home, males aged 12 to 14 years and females aged 5 years are the age groups that are most secure financially, with 100.0% of males and 100.0% of females in these age groups living above the poverty line.
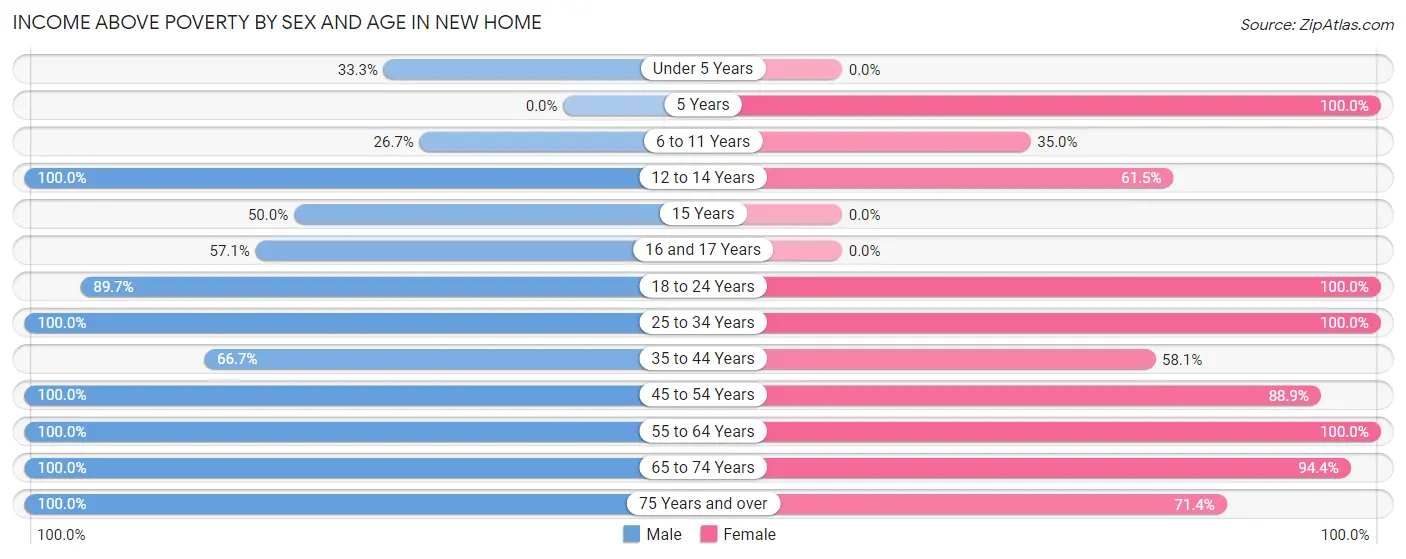
| Age Bracket | Male | Female |
| Under 5 Years | 2 (33.3%) | 0 (0.0%) |
| 5 Years | 0 (0.0%) | 3 (100.0%) |
| 6 to 11 Years | 8 (26.7%) | 7 (35.0%) |
| 12 to 14 Years | 5 (100.0%) | 8 (61.5%) |
| 15 Years | 2 (50.0%) | 0 (0.0%) |
| 16 and 17 Years | 4 (57.1%) | 0 (0.0%) |
| 18 to 24 Years | 26 (89.7%) | 11 (100.0%) |
| 25 to 34 Years | 32 (100.0%) | 10 (100.0%) |
| 35 to 44 Years | 10 (66.7%) | 25 (58.1%) |
| 45 to 54 Years | 15 (100.0%) | 24 (88.9%) |
| 55 to 64 Years | 20 (100.0%) | 11 (100.0%) |
| 65 to 74 Years | 13 (100.0%) | 17 (94.4%) |
| 75 Years and over | 6 (100.0%) | 5 (71.4%) |
| Total | 143 (75.3%) | 121 (69.5%) |
Income Below Poverty Among Married-Couple Families in New Home
The poverty statistics for married-couple families in New Home show that 3.0% or 2 of the total 67 families live below the poverty line. Families with 3 or 4 children have the highest poverty rate of 28.6%, comprising of 2 families. On the other hand, families with no children have the lowest poverty rate of 0.0%, which includes 0 families.
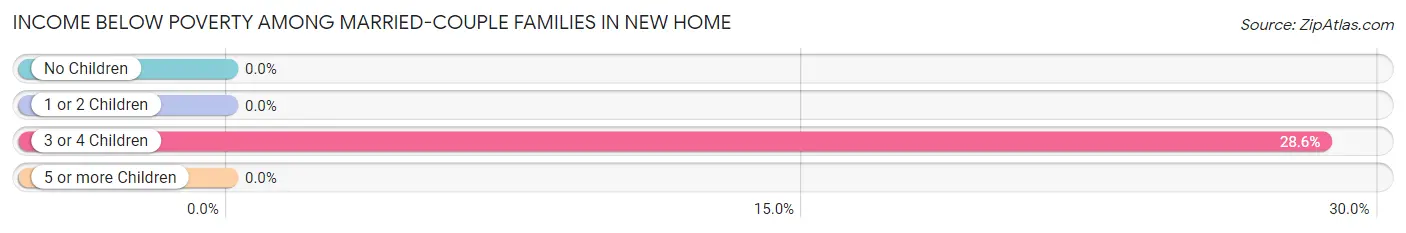
| Children | Above Poverty | Below Poverty |
| No Children | 40 (100.0%) | 0 (0.0%) |
| 1 or 2 Children | 20 (100.0%) | 0 (0.0%) |
| 3 or 4 Children | 5 (71.4%) | 2 (28.6%) |
| 5 or more Children | 0 (0.0%) | 0 (0.0%) |
| Total | 65 (97.0%) | 2 (3.0%) |
Income Below Poverty Among Single-Parent Households in New Home
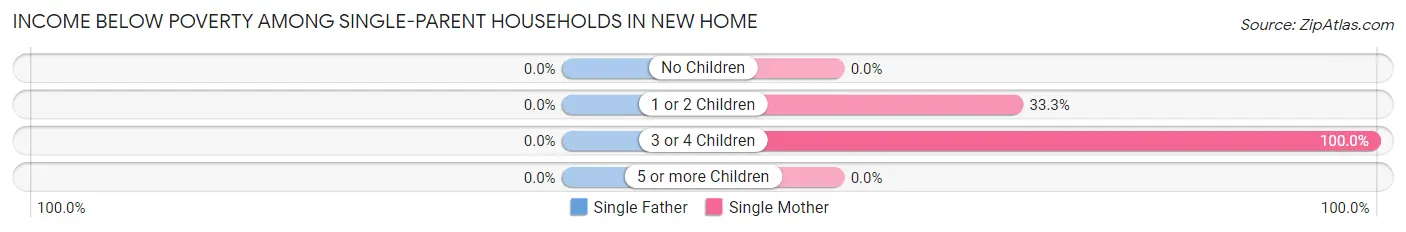
| Children | Single Father | Single Mother |
| No Children | 0 (0.0%) | 0 (0.0%) |
| 1 or 2 Children | 0 (0.0%) | 3 (33.3%) |
| 3 or 4 Children | 0 (0.0%) | 16 (100.0%) |
| 5 or more Children | 0 (0.0%) | 0 (0.0%) |
| Total | 0 (0.0%) | 19 (59.4%) |
Income Below Poverty Among Married-Couple vs Single-Parent Households in New Home
The poverty data for New Home shows that 2 of the married-couple family households (3.0%) and 19 of the single-parent households (59.4%) are living below the poverty level. Within the married-couple family households, those with 3 or 4 children have the highest poverty rate, with 2 households (28.6%) falling below the poverty line. Among the single-parent households, those with 3 or 4 children have the highest poverty rate, with 16 household (100.0%) living below poverty.
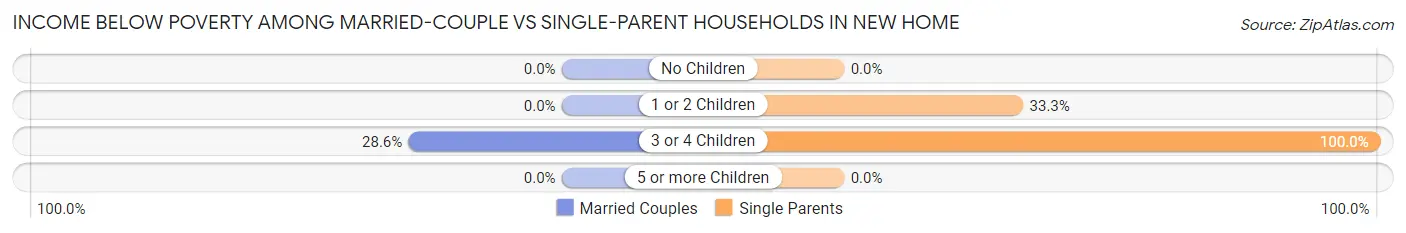
| Children | Married-Couple Families | Single-Parent Households |
| No Children | 0 (0.0%) | 0 (0.0%) |
| 1 or 2 Children | 0 (0.0%) | 3 (33.3%) |
| 3 or 4 Children | 2 (28.6%) | 16 (100.0%) |
| 5 or more Children | 0 (0.0%) | 0 (0.0%) |
| Total | 2 (3.0%) | 19 (59.4%) |
Race in New Home
The most populous races in New Home are White / Caucasian (278 | 75.7%), Hispanic or Latino (213 | 58.0%), and Some other Race (72 | 19.6%).
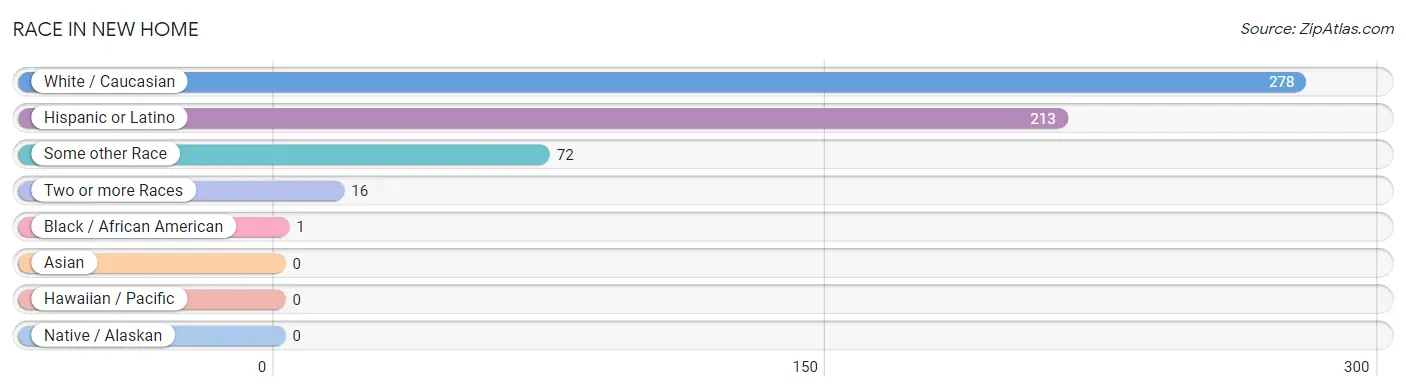
| Race | # Population | % Population |
| Asian | 0 | 0.0% |
| Black / African American | 1 | 0.3% |
| Hawaiian / Pacific | 0 | 0.0% |
| Hispanic or Latino | 213 | 58.0% |
| Native / Alaskan | 0 | 0.0% |
| White / Caucasian | 278 | 75.7% |
| Two or more Races | 16 | 4.4% |
| Some other Race | 72 | 19.6% |
| Total | 367 | 100.0% |
Ancestry in New Home
The most populous ancestries reported in New Home are Mexican (212 | 57.8%), English (31 | 8.5%), American (25 | 6.8%), Irish (19 | 5.2%), and German (14 | 3.8%), together accounting for 82.0% of all New Home residents.
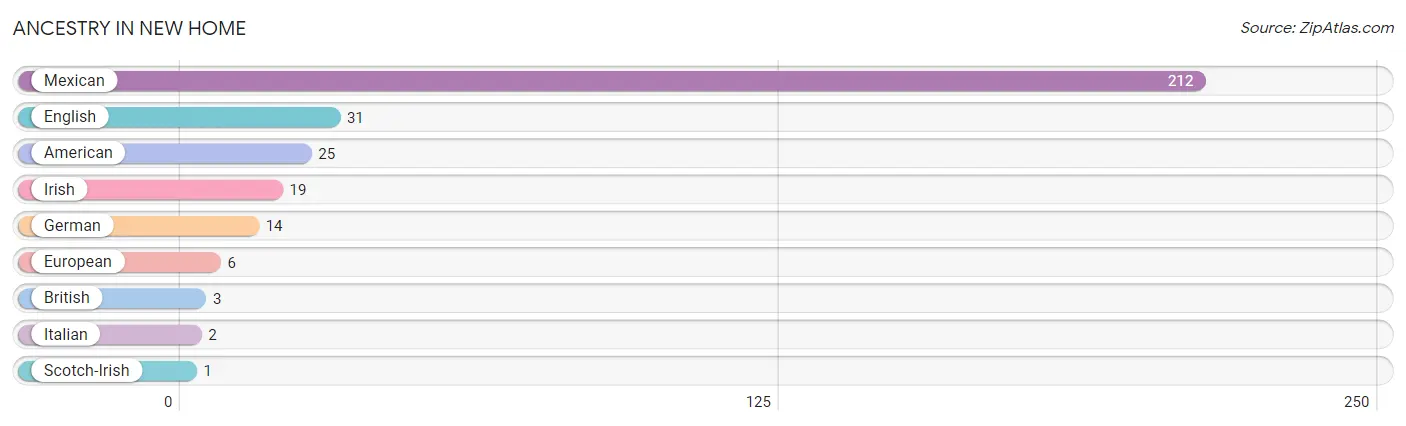
| Ancestry | # Population | % Population |
| American | 25 | 6.8% |
| British | 3 | 0.8% |
| English | 31 | 8.5% |
| European | 6 | 1.6% |
| German | 14 | 3.8% |
| Irish | 19 | 5.2% |
| Italian | 2 | 0.5% |
| Mexican | 212 | 57.8% |
| Scotch-Irish | 1 | 0.3% | View All 9 Rows |
Immigrants in New Home
The most numerous immigrant groups reported in New Home came from Central America (18 | 4.9%), Latin America (18 | 4.9%), and Mexico (18 | 4.9%), together accounting for 14.7% of all New Home residents.
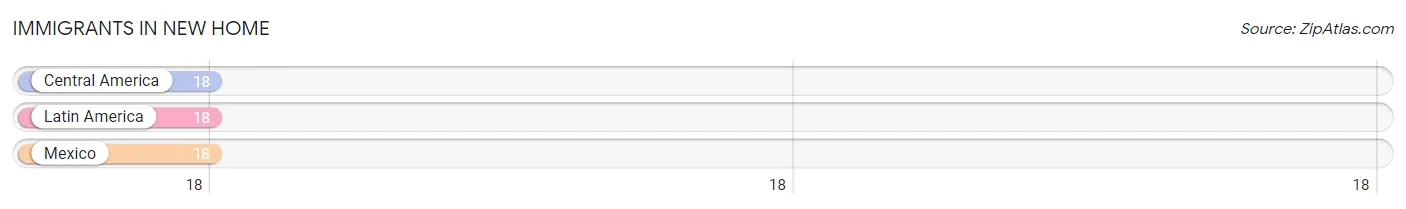
| Immigration Origin | # Population | % Population |
| Central America | 18 | 4.9% |
| Latin America | 18 | 4.9% |
| Mexico | 18 | 4.9% | View All 3 Rows |
Sex and Age in New Home
Sex and Age in New Home
The most populous age groups in New Home are 15 to 19 Years (27 | 14.2%) for men and 40 to 44 Years (28 | 15.8%) for women.
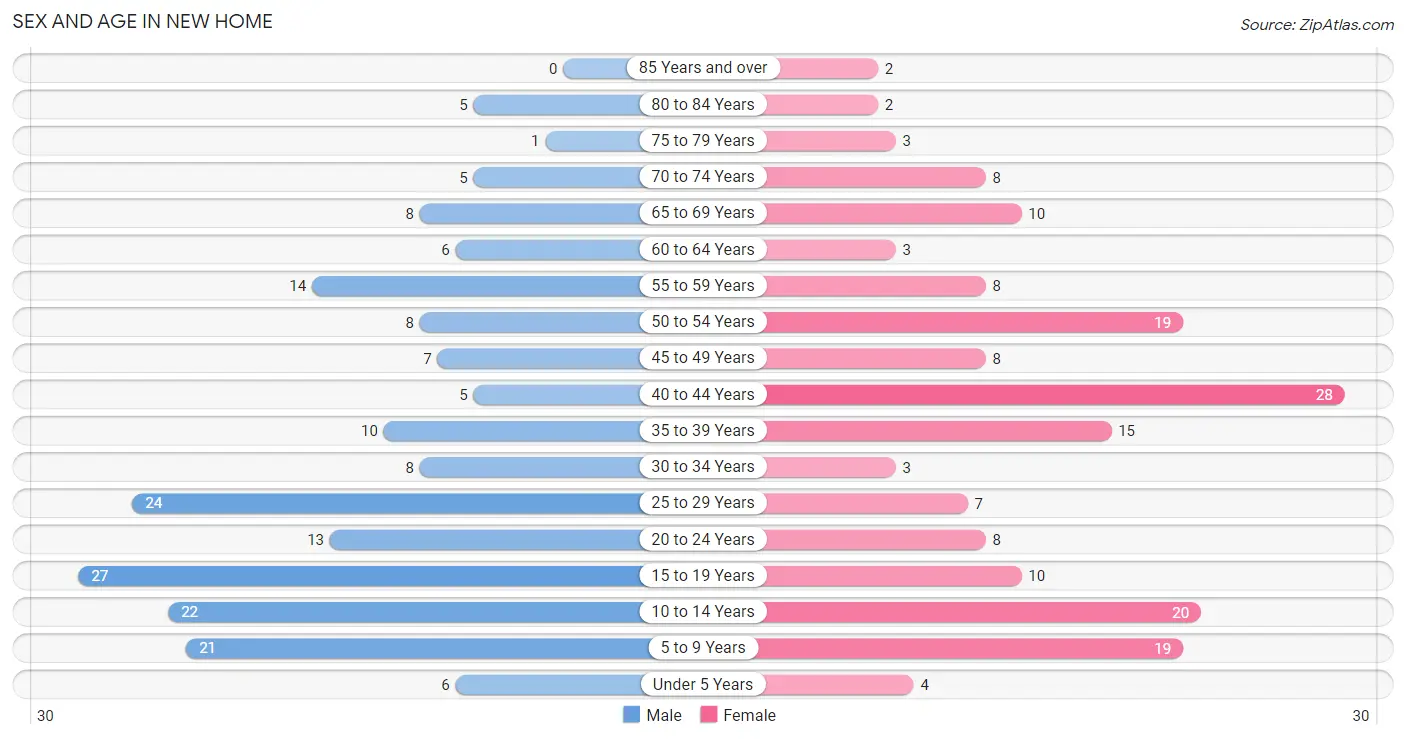
| Age Bracket | Male | Female |
| Under 5 Years | 6 (3.2%) | 4 (2.3%) |
| 5 to 9 Years | 21 (11.1%) | 19 (10.7%) |
| 10 to 14 Years | 22 (11.6%) | 20 (11.3%) |
| 15 to 19 Years | 27 (14.2%) | 10 (5.7%) |
| 20 to 24 Years | 13 (6.8%) | 8 (4.5%) |
| 25 to 29 Years | 24 (12.6%) | 7 (4.0%) |
| 30 to 34 Years | 8 (4.2%) | 3 (1.7%) |
| 35 to 39 Years | 10 (5.3%) | 15 (8.5%) |
| 40 to 44 Years | 5 (2.6%) | 28 (15.8%) |
| 45 to 49 Years | 7 (3.7%) | 8 (4.5%) |
| 50 to 54 Years | 8 (4.2%) | 19 (10.7%) |
| 55 to 59 Years | 14 (7.4%) | 8 (4.5%) |
| 60 to 64 Years | 6 (3.2%) | 3 (1.7%) |
| 65 to 69 Years | 8 (4.2%) | 10 (5.7%) |
| 70 to 74 Years | 5 (2.6%) | 8 (4.5%) |
| 75 to 79 Years | 1 (0.5%) | 3 (1.7%) |
| 80 to 84 Years | 5 (2.6%) | 2 (1.1%) |
| 85 Years and over | 0 (0.0%) | 2 (1.1%) |
| Total | 190 (100.0%) | 177 (100.0%) |
Families and Households in New Home
Median Family Size in New Home
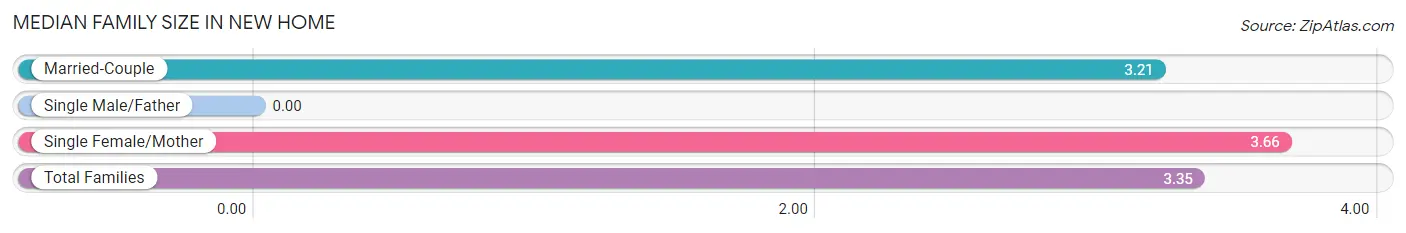
| Family Type | # Families | Family Size |
| Married-Couple | 67 (67.7%) | 3.21 |
| Single Male/Father | 0 (0.0%) | - |
| Single Female/Mother | 32 (32.3%) | 3.66 |
| Total Families | 99 (100.0%) | 3.35 |
Median Household Size in New Home
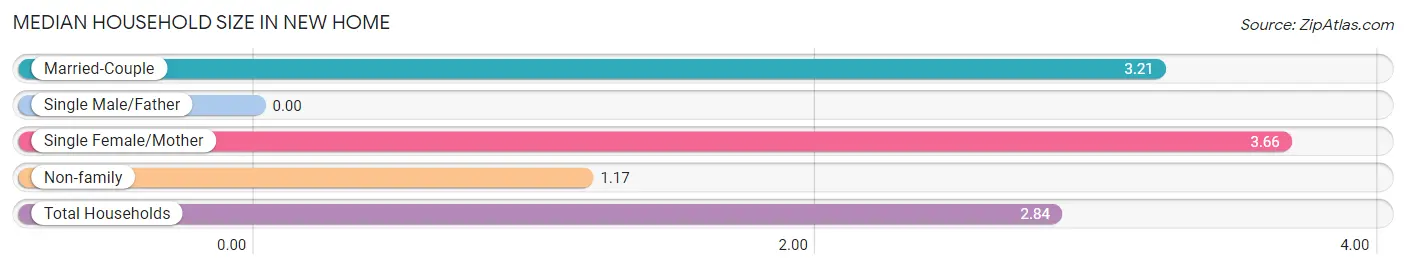
| Household Type | # Households | Household Size |
| Married-Couple | 67 (51.9%) | 3.21 |
| Single Male/Father | 0 (0.0%) | - |
| Single Female/Mother | 32 (24.8%) | 3.66 |
| Non-family | 30 (23.3%) | 1.17 |
| Total Households | 129 (100.0%) | 2.84 |
Household Size by Marriage Status in New Home
Out of a total of 129 households in New Home, 99 (76.7%) are family households, while 30 (23.3%) are nonfamily households. The most numerous type of family households are 2-person households, comprising 40, and the most common type of nonfamily households are 1-person households, comprising 23.
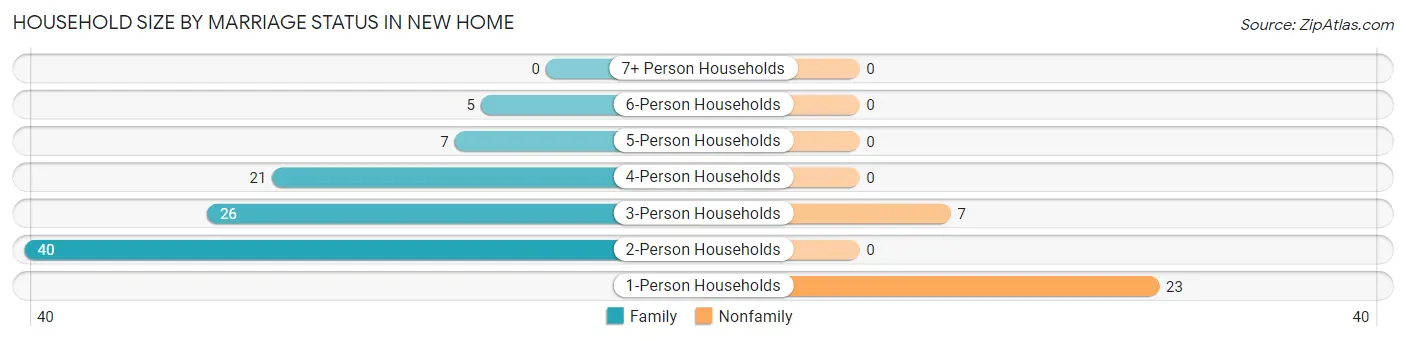
| Household Size | Family Households | Nonfamily Households |
| 1-Person Households | - | 23 (17.8%) |
| 2-Person Households | 40 (31.0%) | 0 (0.0%) |
| 3-Person Households | 26 (20.2%) | 7 (5.4%) |
| 4-Person Households | 21 (16.3%) | 0 (0.0%) |
| 5-Person Households | 7 (5.4%) | 0 (0.0%) |
| 6-Person Households | 5 (3.9%) | 0 (0.0%) |
| 7+ Person Households | 0 (0.0%) | 0 (0.0%) |
| Total | 99 (76.7%) | 30 (23.3%) |
Female Fertility in New Home
Fertility by Age in New Home
Average fertility rate in New Home is 25.0 births per 1,000 women. Women in the age bracket of 20 to 34 years have the highest fertility rate with 111.0 births per 1,000 women. Women in the age bracket of 20 to 34 years acount for 100.0% of all women with births.
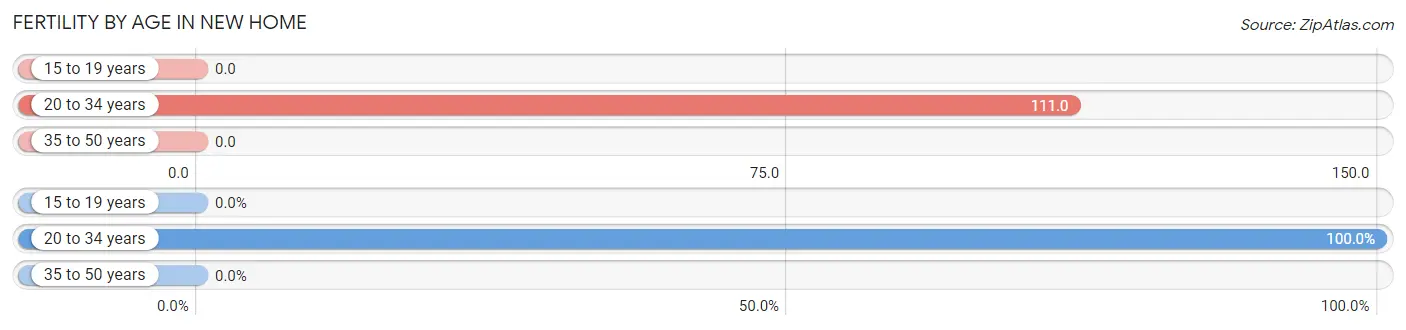
| Age Bracket | Women with Births | Births / 1,000 Women |
| 15 to 19 years | 0 (0.0%) | 0.0 |
| 20 to 34 years | 2 (100.0%) | 111.0 |
| 35 to 50 years | 0 (0.0%) | 0.0 |
| Total | 2 (100.0%) | 25.0 |
Fertility by Age by Marriage Status in New Home
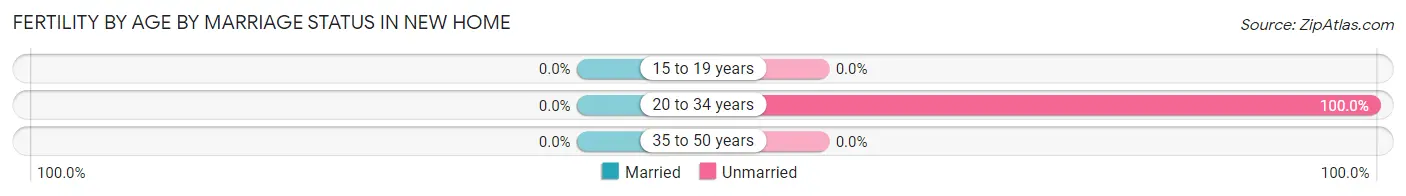
| Age Bracket | Married | Unmarried |
| 15 to 19 years | 0 (0.0%) | 0 (0.0%) |
| 20 to 34 years | 0 (0.0%) | 2 (100.0%) |
| 35 to 50 years | 0 (0.0%) | 0 (0.0%) |
| Total | 0 (0.0%) | 2 (100.0%) |
Fertility by Education in New Home
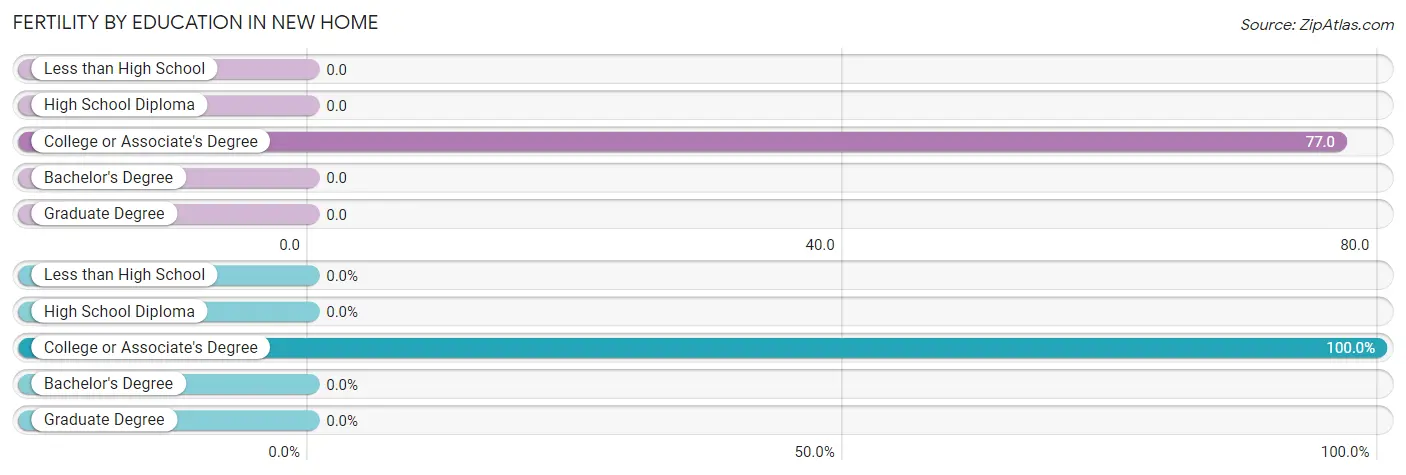
| Educational Attainment | Women with Births | Births / 1,000 Women |
| Less than High School | 0 (0.0%) | 0.0 |
| High School Diploma | 0 (0.0%) | 0.0 |
| College or Associate's Degree | 2 (100.0%) | 77.0 |
| Bachelor's Degree | 0 (0.0%) | 0.0 |
| Graduate Degree | 0 (0.0%) | 0.0 |
| Total | 2 (100.0%) | 25.0 |
Fertility by Education by Marriage Status in New Home
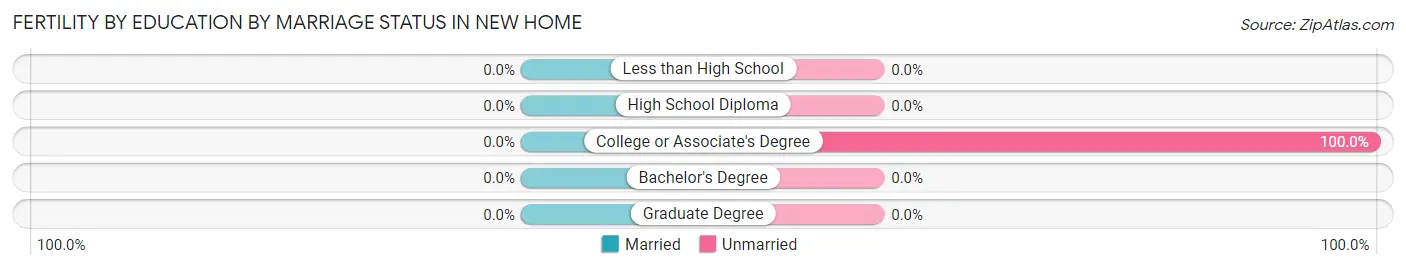
| Educational Attainment | Married | Unmarried |
| Less than High School | 0 (0.0%) | 0 (0.0%) |
| High School Diploma | 0 (0.0%) | 0 (0.0%) |
| College or Associate's Degree | 0 (0.0%) | 2 (100.0%) |
| Bachelor's Degree | 0 (0.0%) | 0 (0.0%) |
| Graduate Degree | 0 (0.0%) | 0 (0.0%) |
| Total | 0 (0.0%) | 2 (100.0%) |
Employment Characteristics in New Home
Employment by Class of Employer in New Home
Among the 174 employed individuals in New Home, private company employees (96 | 55.2%), local government employees (46 | 26.4%), and self-employed (not incorporated) (16 | 9.2%) make up the most common classes of employment.
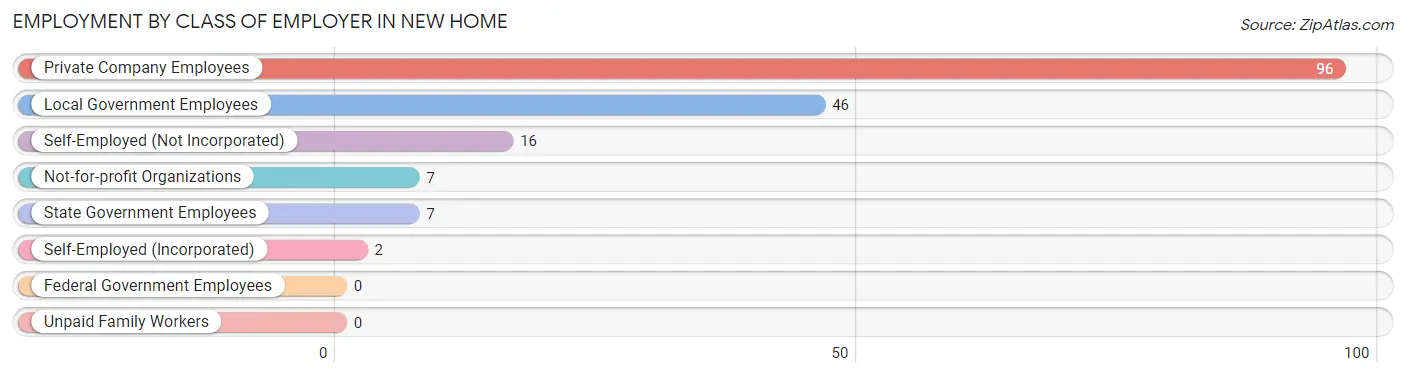
| Employer Class | # Employees | % Employees |
| Private Company Employees | 96 | 55.2% |
| Self-Employed (Incorporated) | 2 | 1.1% |
| Self-Employed (Not Incorporated) | 16 | 9.2% |
| Not-for-profit Organizations | 7 | 4.0% |
| Local Government Employees | 46 | 26.4% |
| State Government Employees | 7 | 4.0% |
| Federal Government Employees | 0 | 0.0% |
| Unpaid Family Workers | 0 | 0.0% |
| Total | 174 | 100.0% |
Employment Status by Age in New Home
According to the labor force statistics for New Home, out of the total population over 16 years of age (269), 71.7% or 193 individuals are in the labor force, with 4.7% or 9 of them unemployed. The age group with the highest labor force participation rate is 25 to 29 years, with 100.0% or 31 individuals in the labor force. Within the labor force, the 20 to 24 years age range has the highest percentage of unemployed individuals, with 45.0% or 9 of them being unemployed.
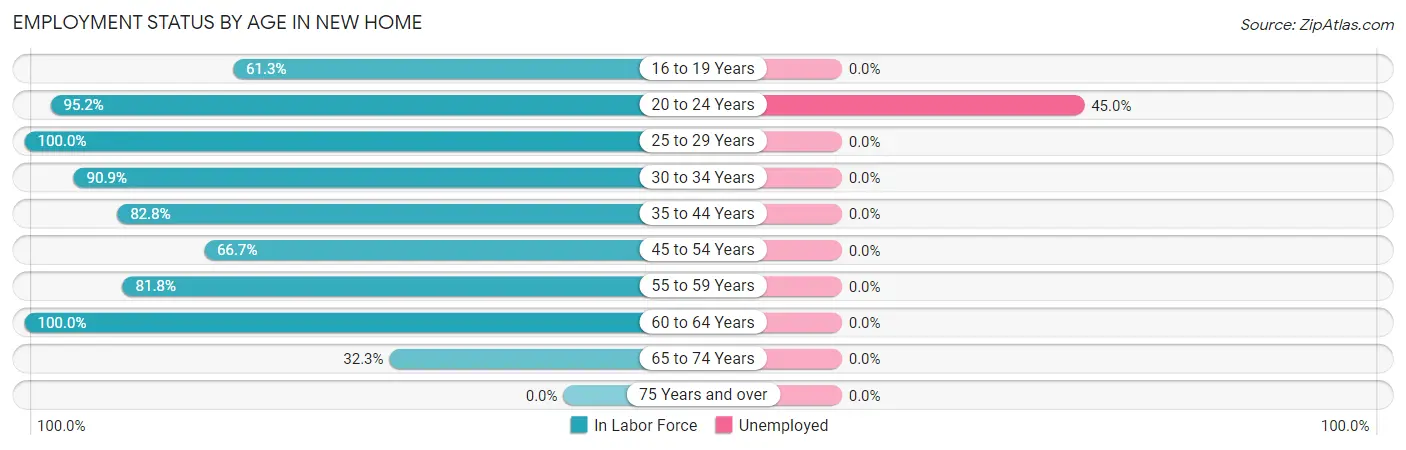
| Age Bracket | In Labor Force | Unemployed |
| 16 to 19 Years | 19 (61.3%) | 0 (0.0%) |
| 20 to 24 Years | 20 (95.2%) | 9 (45.0%) |
| 25 to 29 Years | 31 (100.0%) | 0 (0.0%) |
| 30 to 34 Years | 10 (90.9%) | 0 (0.0%) |
| 35 to 44 Years | 48 (82.8%) | 0 (0.0%) |
| 45 to 54 Years | 28 (66.7%) | 0 (0.0%) |
| 55 to 59 Years | 18 (81.8%) | 0 (0.0%) |
| 60 to 64 Years | 9 (100.0%) | 0 (0.0%) |
| 65 to 74 Years | 10 (32.3%) | 0 (0.0%) |
| 75 Years and over | 0 (0.0%) | 0 (0.0%) |
| Total | 193 (71.7%) | 9 (4.7%) |
Employment Status by Educational Attainment in New Home
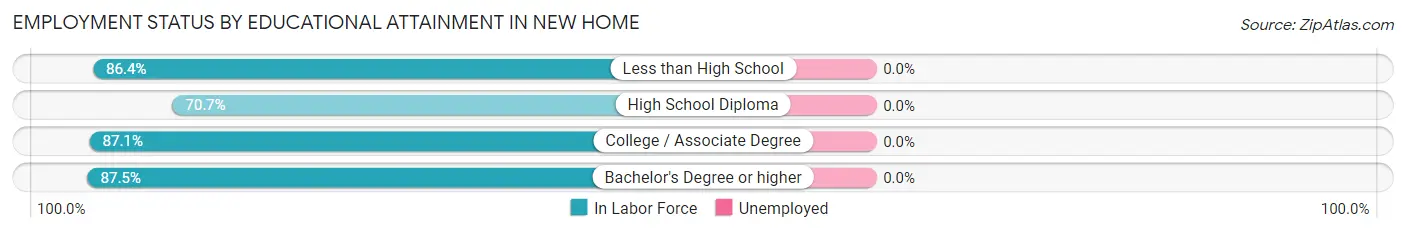
| Educational Attainment | In Labor Force | Unemployed |
| Less than High School | 19 (86.4%) | 0 (0.0%) |
| High School Diploma | 29 (70.7%) | 0 (0.0%) |
| College / Associate Degree | 54 (87.1%) | 0 (0.0%) |
| Bachelor's Degree or higher | 42 (87.5%) | 0 (0.0%) |
| Total | 144 (83.2%) | 0 (0.0%) |
Employment Occupations by Sex in New Home
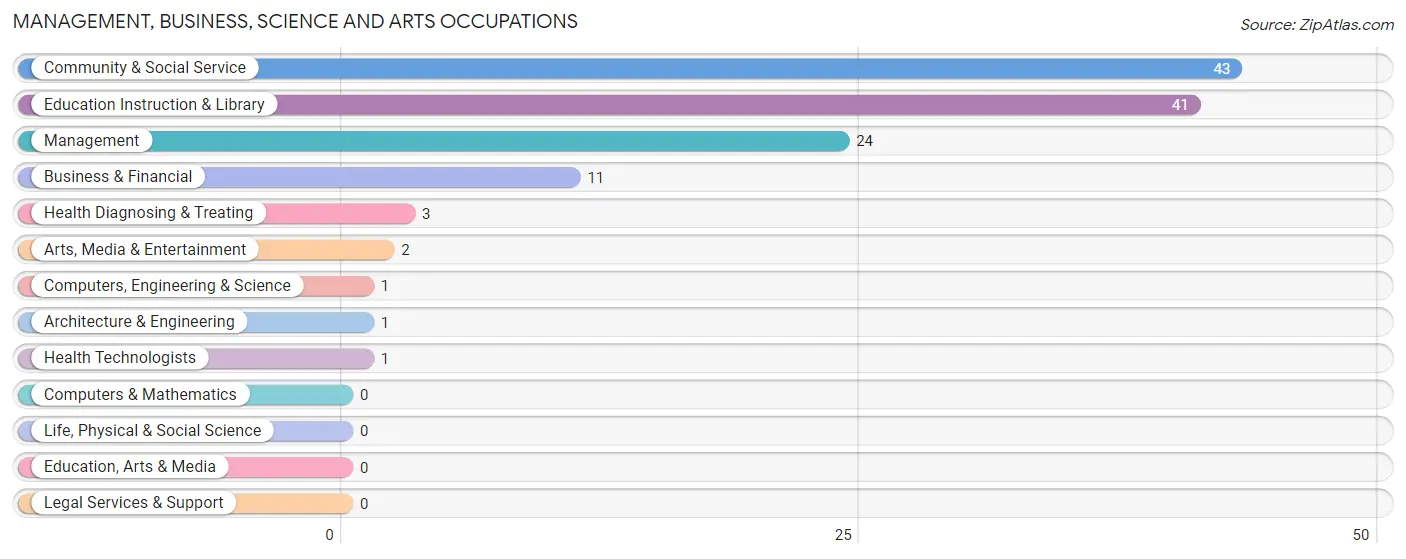
Management, Business, Science and Arts Occupations
The most common Management, Business, Science and Arts occupations in New Home are Community & Social Service (43 | 23.4%), Education Instruction & Library (41 | 22.3%), Management (24 | 13.0%), Business & Financial (11 | 6.0%), and Health Diagnosing & Treating (3 | 1.6%).
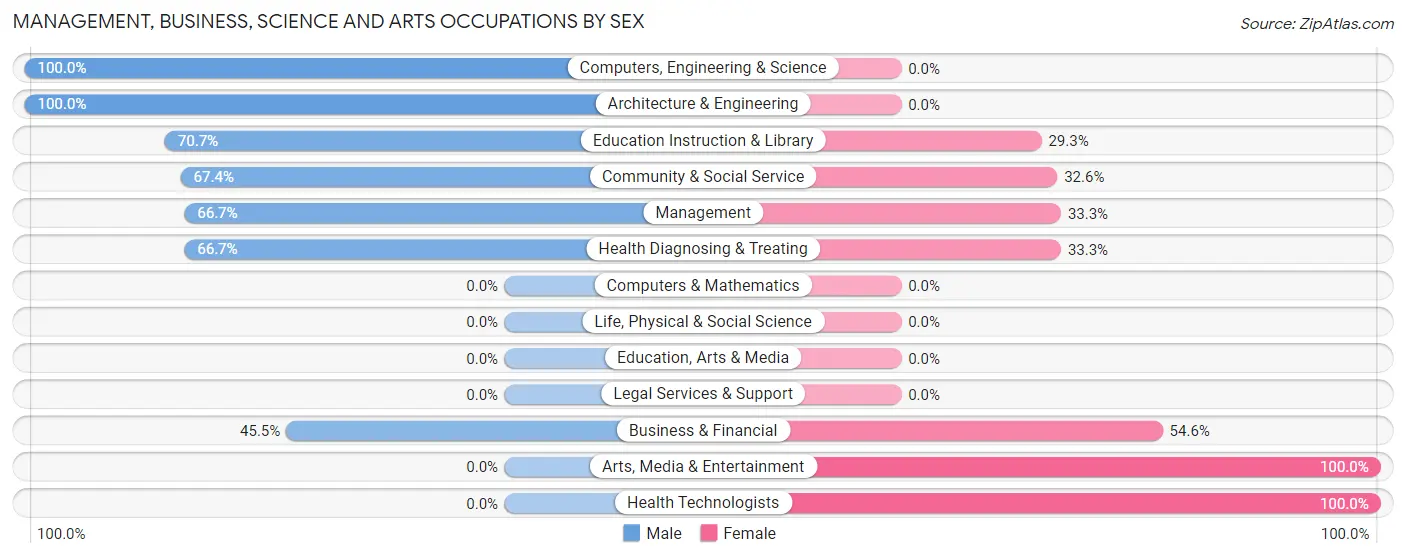
Management, Business, Science and Arts Occupations by Sex
Within the Management, Business, Science and Arts occupations in New Home, the most male-oriented occupations are Computers, Engineering & Science (100.0%), Architecture & Engineering (100.0%), and Education Instruction & Library (70.7%), while the most female-oriented occupations are Arts, Media & Entertainment (100.0%), Health Technologists (100.0%), and Business & Financial (54.5%).
| Occupation | Male | Female |
| Management | 16 (66.7%) | 8 (33.3%) |
| Business & Financial | 5 (45.5%) | 6 (54.5%) |
| Computers, Engineering & Science | 1 (100.0%) | 0 (0.0%) |
| Computers & Mathematics | 0 (0.0%) | 0 (0.0%) |
| Architecture & Engineering | 1 (100.0%) | 0 (0.0%) |
| Life, Physical & Social Science | 0 (0.0%) | 0 (0.0%) |
| Community & Social Service | 29 (67.4%) | 14 (32.6%) |
| Education, Arts & Media | 0 (0.0%) | 0 (0.0%) |
| Legal Services & Support | 0 (0.0%) | 0 (0.0%) |
| Education Instruction & Library | 29 (70.7%) | 12 (29.3%) |
| Arts, Media & Entertainment | 0 (0.0%) | 2 (100.0%) |
| Health Diagnosing & Treating | 2 (66.7%) | 1 (33.3%) |
| Health Technologists | 0 (0.0%) | 1 (100.0%) |
| Total (Category) | 53 (64.6%) | 29 (35.4%) |
| Total (Overall) | 115 (62.5%) | 69 (37.5%) |
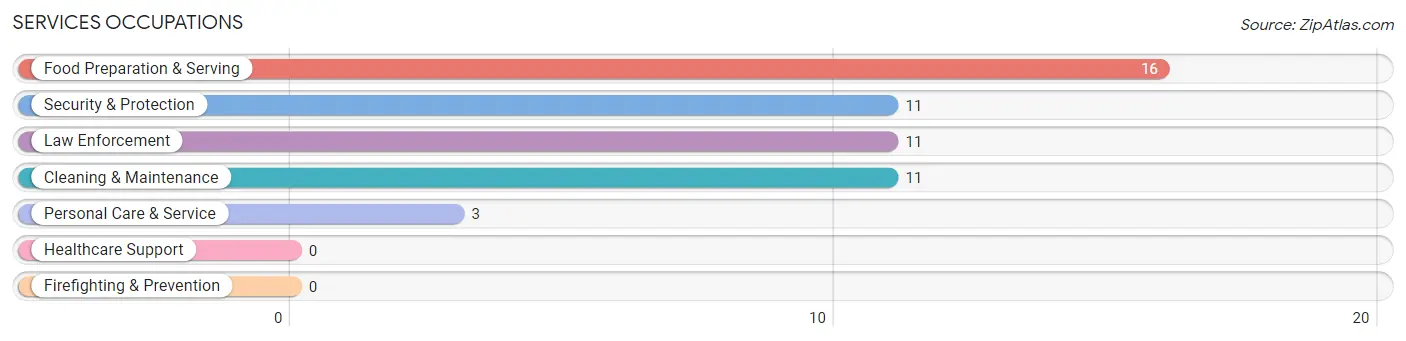
Services Occupations
The most common Services occupations in New Home are Food Preparation & Serving (16 | 8.7%), Security & Protection (11 | 6.0%), Law Enforcement (11 | 6.0%), Cleaning & Maintenance (11 | 6.0%), and Personal Care & Service (3 | 1.6%).
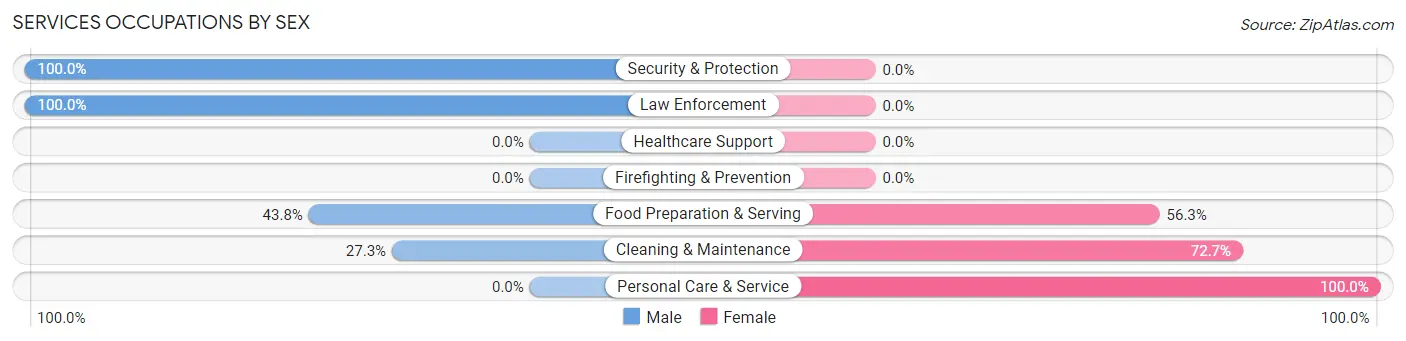
Services Occupations by Sex
Within the Services occupations in New Home, the most male-oriented occupations are Security & Protection (100.0%), Law Enforcement (100.0%), and Food Preparation & Serving (43.8%), while the most female-oriented occupations are Personal Care & Service (100.0%), Cleaning & Maintenance (72.7%), and Food Preparation & Serving (56.2%).
| Occupation | Male | Female |
| Healthcare Support | 0 (0.0%) | 0 (0.0%) |
| Security & Protection | 11 (100.0%) | 0 (0.0%) |
| Firefighting & Prevention | 0 (0.0%) | 0 (0.0%) |
| Law Enforcement | 11 (100.0%) | 0 (0.0%) |
| Food Preparation & Serving | 7 (43.8%) | 9 (56.2%) |
| Cleaning & Maintenance | 3 (27.3%) | 8 (72.7%) |
| Personal Care & Service | 0 (0.0%) | 3 (100.0%) |
| Total (Category) | 21 (51.2%) | 20 (48.8%) |
| Total (Overall) | 115 (62.5%) | 69 (37.5%) |
Sales and Office Occupations
The most common Sales and Office occupations in New Home are Sales & Related (17 | 9.2%), and Office & Administration (9 | 4.9%).

Sales and Office Occupations by Sex

| Occupation | Male | Female |
| Sales & Related | 9 (52.9%) | 8 (47.1%) |
| Office & Administration | 0 (0.0%) | 9 (100.0%) |
| Total (Category) | 9 (34.6%) | 17 (65.4%) |
| Total (Overall) | 115 (62.5%) | 69 (37.5%) |
Natural Resources, Construction and Maintenance Occupations
The most common Natural Resources, Construction and Maintenance occupations in New Home are Construction & Extraction (3 | 1.6%), and Farming, Fishing & Forestry (2 | 1.1%).
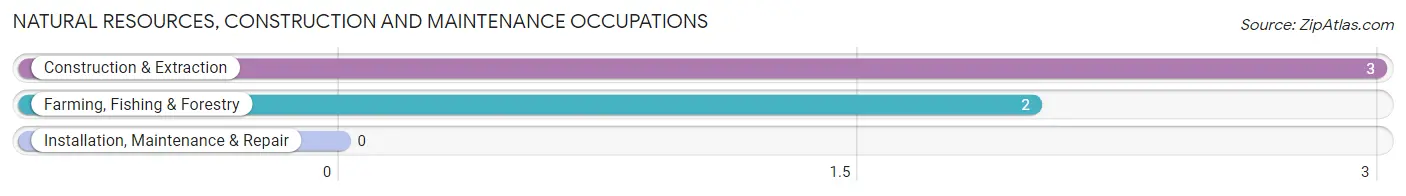
Natural Resources, Construction and Maintenance Occupations by Sex

| Occupation | Male | Female |
| Farming, Fishing & Forestry | 2 (100.0%) | 0 (0.0%) |
| Construction & Extraction | 3 (100.0%) | 0 (0.0%) |
| Installation, Maintenance & Repair | 0 (0.0%) | 0 (0.0%) |
| Total (Category) | 5 (100.0%) | 0 (0.0%) |
| Total (Overall) | 115 (62.5%) | 69 (37.5%) |
Production, Transportation and Moving Occupations
The most common Production, Transportation and Moving occupations in New Home are Transportation (17 | 9.2%), Production (10 | 5.4%), and Material Moving (3 | 1.6%).
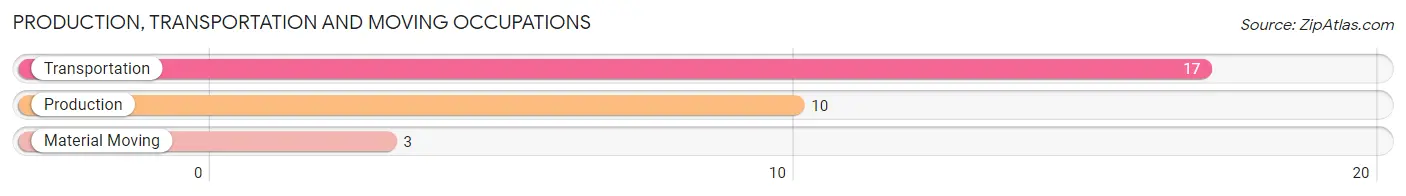
Production, Transportation and Moving Occupations by Sex
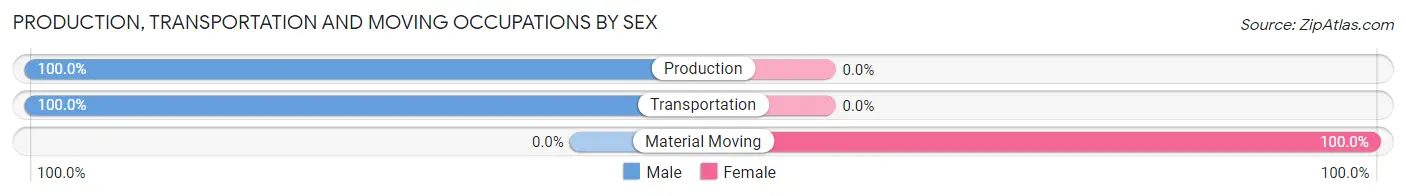
| Occupation | Male | Female |
| Production | 10 (100.0%) | 0 (0.0%) |
| Transportation | 17 (100.0%) | 0 (0.0%) |
| Material Moving | 0 (0.0%) | 3 (100.0%) |
| Total (Category) | 27 (90.0%) | 3 (10.0%) |
| Total (Overall) | 115 (62.5%) | 69 (37.5%) |
Employment Industries by Sex in New Home
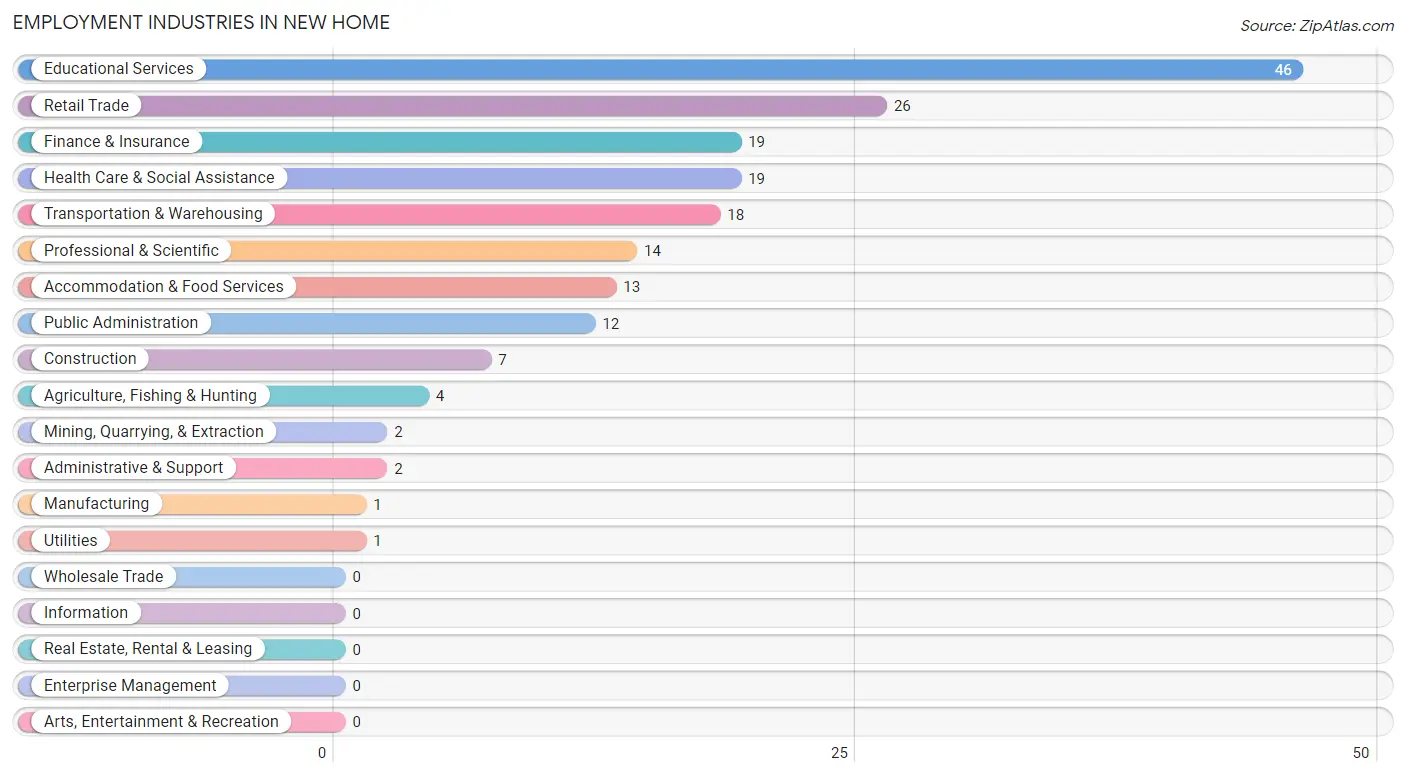
Employment Industries in New Home
The major employment industries in New Home include Educational Services (46 | 25.0%), Retail Trade (26 | 14.1%), Finance & Insurance (19 | 10.3%), Health Care & Social Assistance (19 | 10.3%), and Transportation & Warehousing (18 | 9.8%).
Employment Industries by Sex in New Home
The New Home industries that see more men than women are Agriculture, Fishing & Hunting (100.0%), Mining, Quarrying, & Extraction (100.0%), and Construction (100.0%), whereas the industries that tend to have a higher number of women are Manufacturing (100.0%), Finance & Insurance (73.7%), and Professional & Scientific (57.1%).
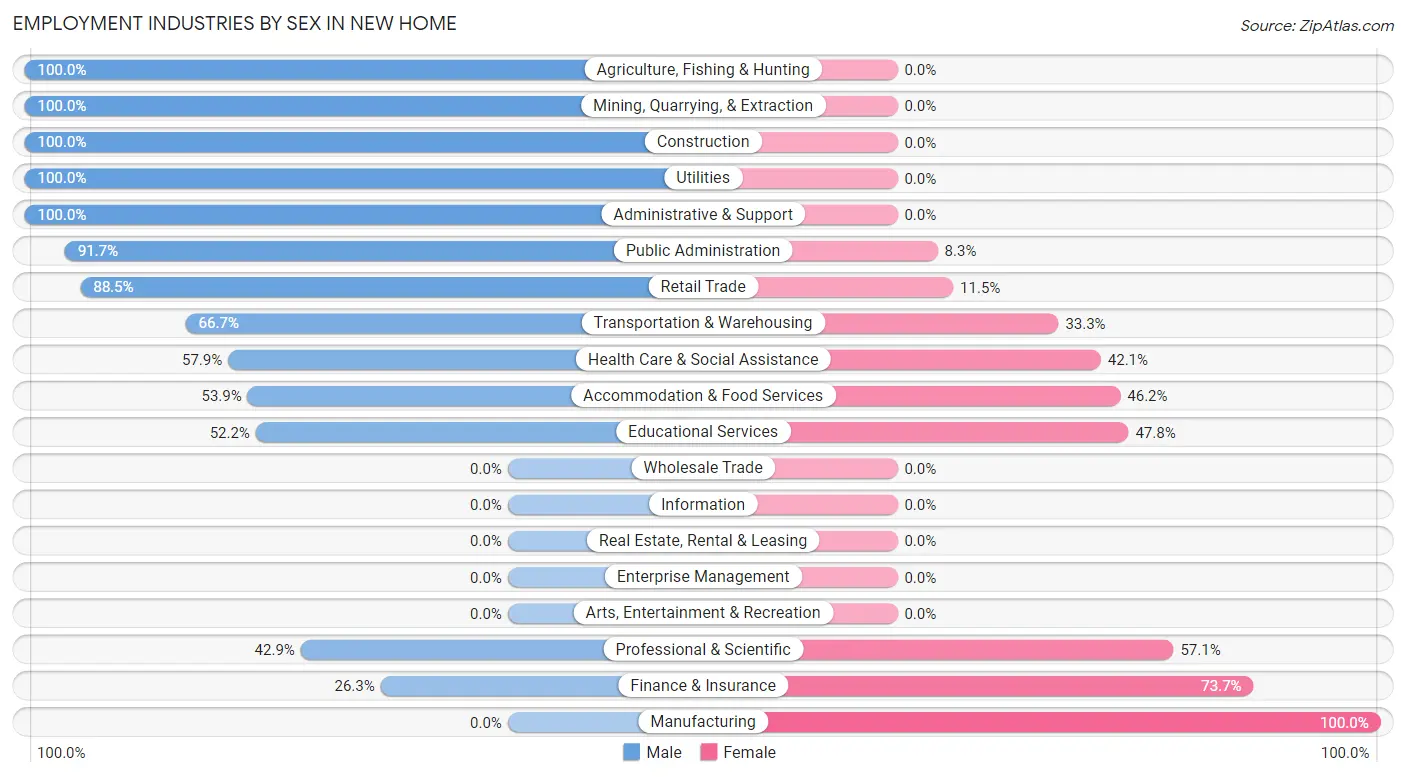
| Industry | Male | Female |
| Agriculture, Fishing & Hunting | 4 (100.0%) | 0 (0.0%) |
| Mining, Quarrying, & Extraction | 2 (100.0%) | 0 (0.0%) |
| Construction | 7 (100.0%) | 0 (0.0%) |
| Manufacturing | 0 (0.0%) | 1 (100.0%) |
| Wholesale Trade | 0 (0.0%) | 0 (0.0%) |
| Retail Trade | 23 (88.5%) | 3 (11.5%) |
| Transportation & Warehousing | 12 (66.7%) | 6 (33.3%) |
| Utilities | 1 (100.0%) | 0 (0.0%) |
| Information | 0 (0.0%) | 0 (0.0%) |
| Finance & Insurance | 5 (26.3%) | 14 (73.7%) |
| Real Estate, Rental & Leasing | 0 (0.0%) | 0 (0.0%) |
| Professional & Scientific | 6 (42.9%) | 8 (57.1%) |
| Enterprise Management | 0 (0.0%) | 0 (0.0%) |
| Administrative & Support | 2 (100.0%) | 0 (0.0%) |
| Educational Services | 24 (52.2%) | 22 (47.8%) |
| Health Care & Social Assistance | 11 (57.9%) | 8 (42.1%) |
| Arts, Entertainment & Recreation | 0 (0.0%) | 0 (0.0%) |
| Accommodation & Food Services | 7 (53.8%) | 6 (46.2%) |
| Public Administration | 11 (91.7%) | 1 (8.3%) |
| Total | 115 (62.5%) | 69 (37.5%) |
Education in New Home
School Enrollment in New Home
The most common levels of schooling among the 116 students in New Home are middle school (38 | 32.8%), elementary school (33 | 28.4%), and high school (26 | 22.4%).
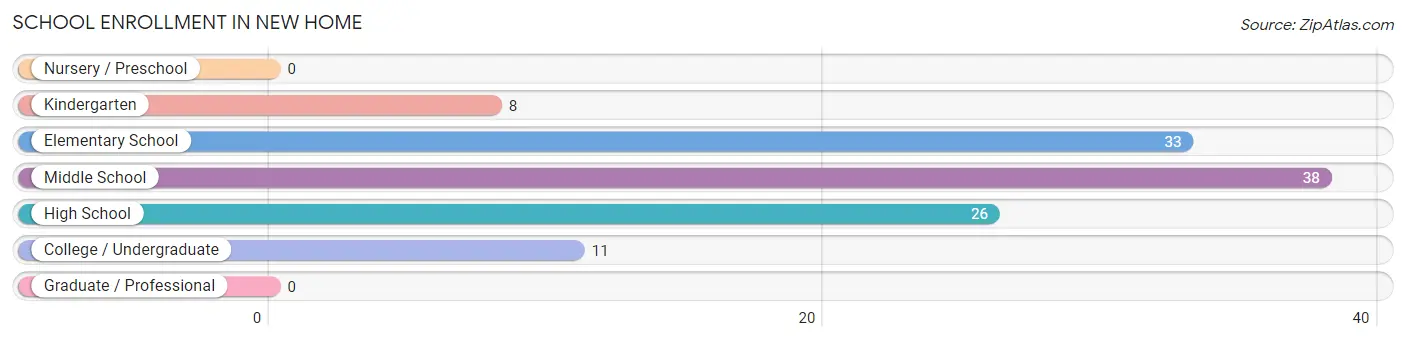
| School Level | # Students | % Students |
| Nursery / Preschool | 0 | 0.0% |
| Kindergarten | 8 | 6.9% |
| Elementary School | 33 | 28.4% |
| Middle School | 38 | 32.8% |
| High School | 26 | 22.4% |
| College / Undergraduate | 11 | 9.5% |
| Graduate / Professional | 0 | 0.0% |
| Total | 116 | 100.0% |
School Enrollment by Age by Funding Source in New Home
Out of a total of 116 students who are enrolled in schools in New Home, 10 (8.6%) attend a private institution, while the remaining 106 (91.4%) are enrolled in public schools. The age group of 18 to 19 year olds has the highest likelihood of being enrolled in private schools, with 6 (54.5% in the age bracket) enrolled. Conversely, the age group of 10 to 14 year olds has the lowest likelihood of being enrolled in a private school, with 42 (100.0% in the age bracket) attending a public institution.
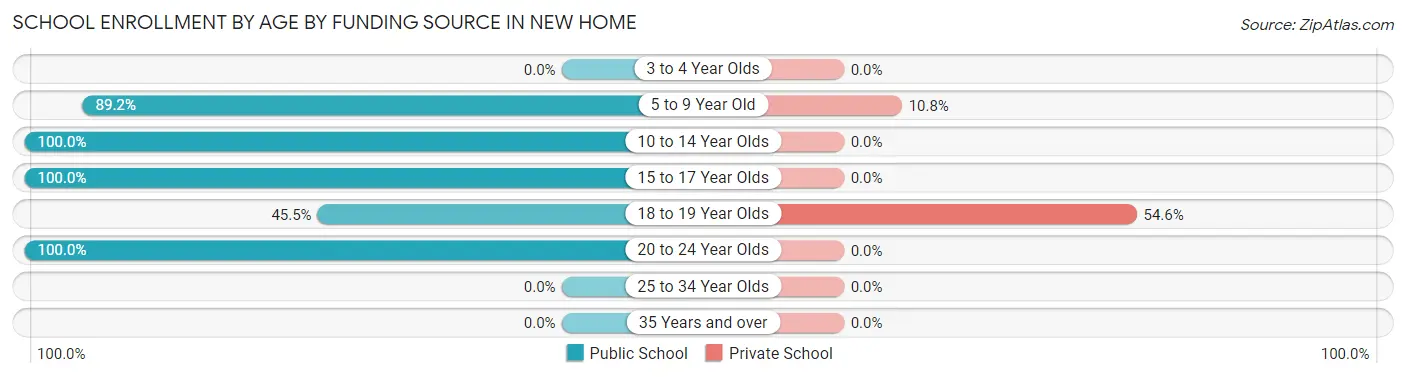
| Age Bracket | Public School | Private School |
| 3 to 4 Year Olds | 0 (0.0%) | 0 (0.0%) |
| 5 to 9 Year Old | 33 (89.2%) | 4 (10.8%) |
| 10 to 14 Year Olds | 42 (100.0%) | 0 (0.0%) |
| 15 to 17 Year Olds | 18 (100.0%) | 0 (0.0%) |
| 18 to 19 Year Olds | 5 (45.5%) | 6 (54.5%) |
| 20 to 24 Year Olds | 8 (100.0%) | 0 (0.0%) |
| 25 to 34 Year Olds | 0 (0.0%) | 0 (0.0%) |
| 35 Years and over | 0 (0.0%) | 0 (0.0%) |
| Total | 106 (91.4%) | 10 (8.6%) |
Educational Attainment by Field of Study in New Home
Arts & humanities (18 | 33.3%), science & technology (12 | 22.2%), business (7 | 13.0%), education (7 | 13.0%), and physical & health sciences (5 | 9.3%) are the most common fields of study among 54 individuals in New Home who have obtained a bachelor's degree or higher.
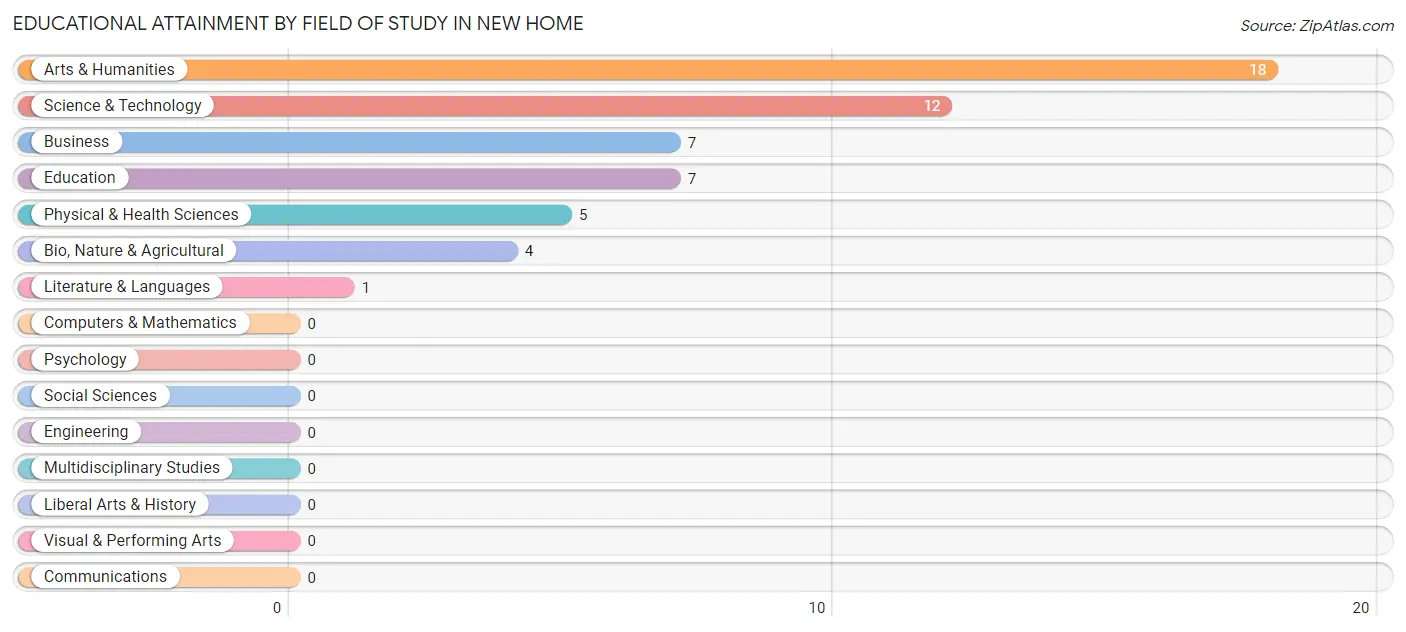
| Field of Study | # Graduates | % Graduates |
| Computers & Mathematics | 0 | 0.0% |
| Bio, Nature & Agricultural | 4 | 7.4% |
| Physical & Health Sciences | 5 | 9.3% |
| Psychology | 0 | 0.0% |
| Social Sciences | 0 | 0.0% |
| Engineering | 0 | 0.0% |
| Multidisciplinary Studies | 0 | 0.0% |
| Science & Technology | 12 | 22.2% |
| Business | 7 | 13.0% |
| Education | 7 | 13.0% |
| Literature & Languages | 1 | 1.8% |
| Liberal Arts & History | 0 | 0.0% |
| Visual & Performing Arts | 0 | 0.0% |
| Communications | 0 | 0.0% |
| Arts & Humanities | 18 | 33.3% |
| Total | 54 | 100.0% |
Transportation & Commute in New Home
Vehicle Availability by Sex in New Home
The most prevalent vehicle ownership categories in New Home are males with 2 vehicles (58, accounting for 51.8%) and females with 2 vehicles (31, making up 93.5%).
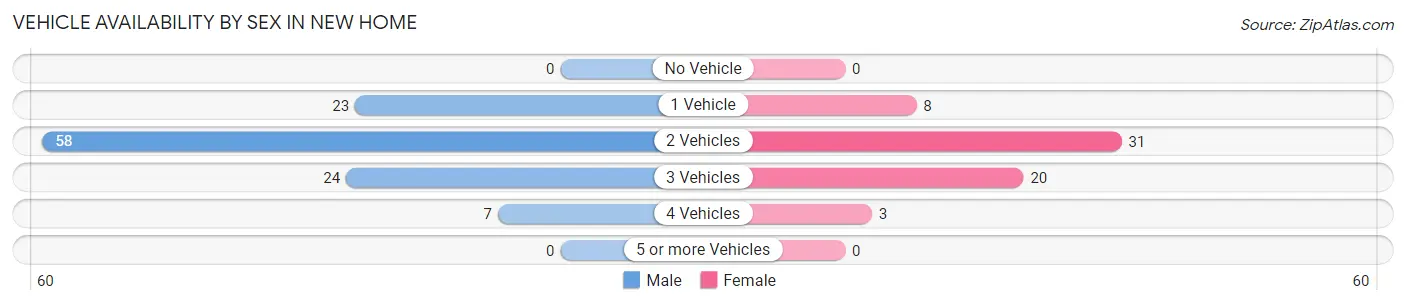
| Vehicles Available | Male | Female |
| No Vehicle | 0 (0.0%) | 0 (0.0%) |
| 1 Vehicle | 23 (20.5%) | 8 (12.9%) |
| 2 Vehicles | 58 (51.8%) | 31 (50.0%) |
| 3 Vehicles | 24 (21.4%) | 20 (32.3%) |
| 4 Vehicles | 7 (6.2%) | 3 (4.8%) |
| 5 or more Vehicles | 0 (0.0%) | 0 (0.0%) |
| Total | 112 (100.0%) | 62 (100.0%) |
Commute Time in New Home
The most frequently occuring commute durations in New Home are less than 5 minutes (35 commuters, 21.5%), 30 to 34 minutes (32 commuters, 19.6%), and 25 to 29 minutes (31 commuters, 19.0%).
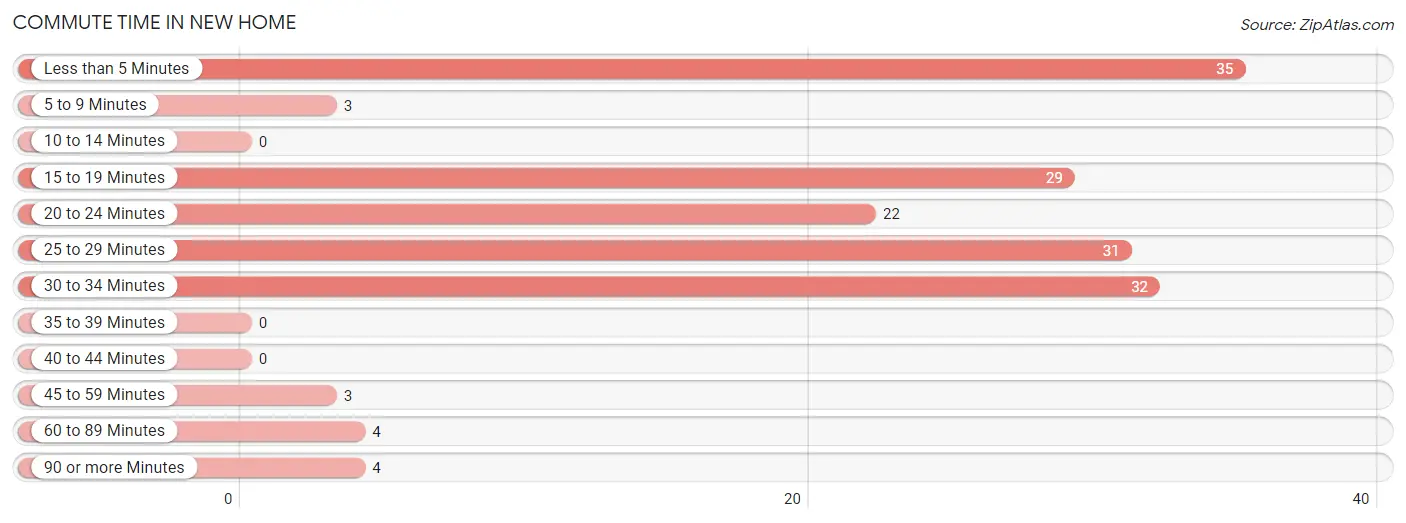
| Commute Time | # Commuters | % Commuters |
| Less than 5 Minutes | 35 | 21.5% |
| 5 to 9 Minutes | 3 | 1.8% |
| 10 to 14 Minutes | 0 | 0.0% |
| 15 to 19 Minutes | 29 | 17.8% |
| 20 to 24 Minutes | 22 | 13.5% |
| 25 to 29 Minutes | 31 | 19.0% |
| 30 to 34 Minutes | 32 | 19.6% |
| 35 to 39 Minutes | 0 | 0.0% |
| 40 to 44 Minutes | 0 | 0.0% |
| 45 to 59 Minutes | 3 | 1.8% |
| 60 to 89 Minutes | 4 | 2.5% |
| 90 or more Minutes | 4 | 2.5% |
Commute Time by Sex in New Home
The most common commute times in New Home are 15 to 19 minutes (29 commuters, 26.4%) for males and 25 to 29 minutes (19 commuters, 35.8%) for females.
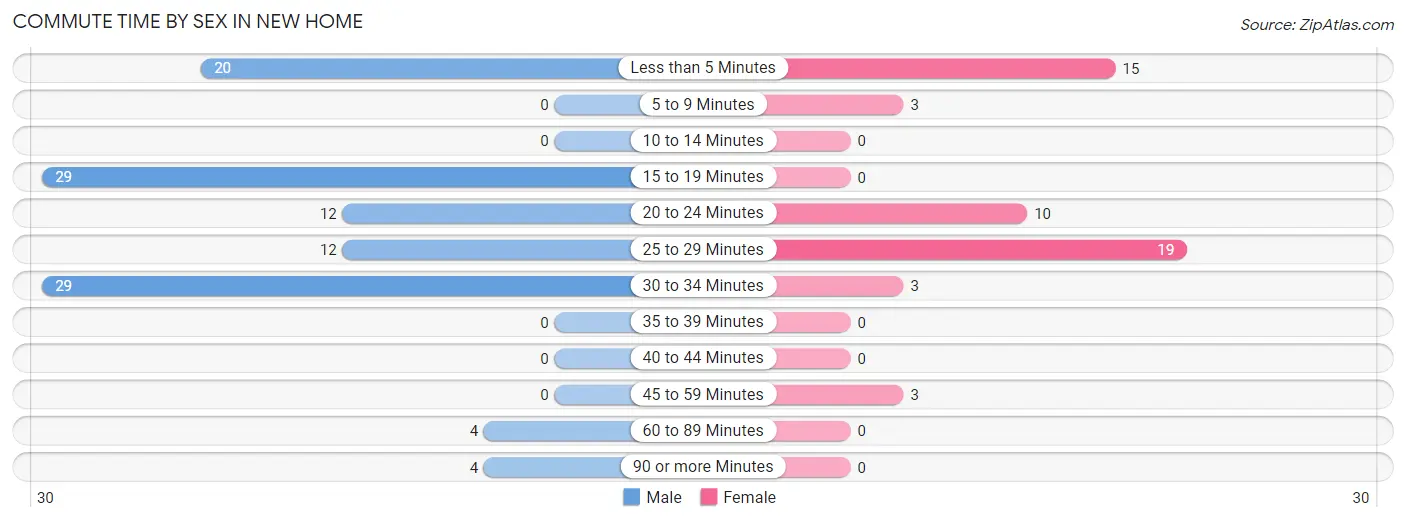
| Commute Time | Male | Female |
| Less than 5 Minutes | 20 (18.2%) | 15 (28.3%) |
| 5 to 9 Minutes | 0 (0.0%) | 3 (5.7%) |
| 10 to 14 Minutes | 0 (0.0%) | 0 (0.0%) |
| 15 to 19 Minutes | 29 (26.4%) | 0 (0.0%) |
| 20 to 24 Minutes | 12 (10.9%) | 10 (18.9%) |
| 25 to 29 Minutes | 12 (10.9%) | 19 (35.8%) |
| 30 to 34 Minutes | 29 (26.4%) | 3 (5.7%) |
| 35 to 39 Minutes | 0 (0.0%) | 0 (0.0%) |
| 40 to 44 Minutes | 0 (0.0%) | 0 (0.0%) |
| 45 to 59 Minutes | 0 (0.0%) | 3 (5.7%) |
| 60 to 89 Minutes | 4 (3.6%) | 0 (0.0%) |
| 90 or more Minutes | 4 (3.6%) | 0 (0.0%) |
Time of Departure to Work by Sex in New Home
The most frequent times of departure to work in New Home are 7:30 AM to 7:59 AM (35, 31.8%) for males and 7:30 AM to 7:59 AM (34, 64.1%) for females.
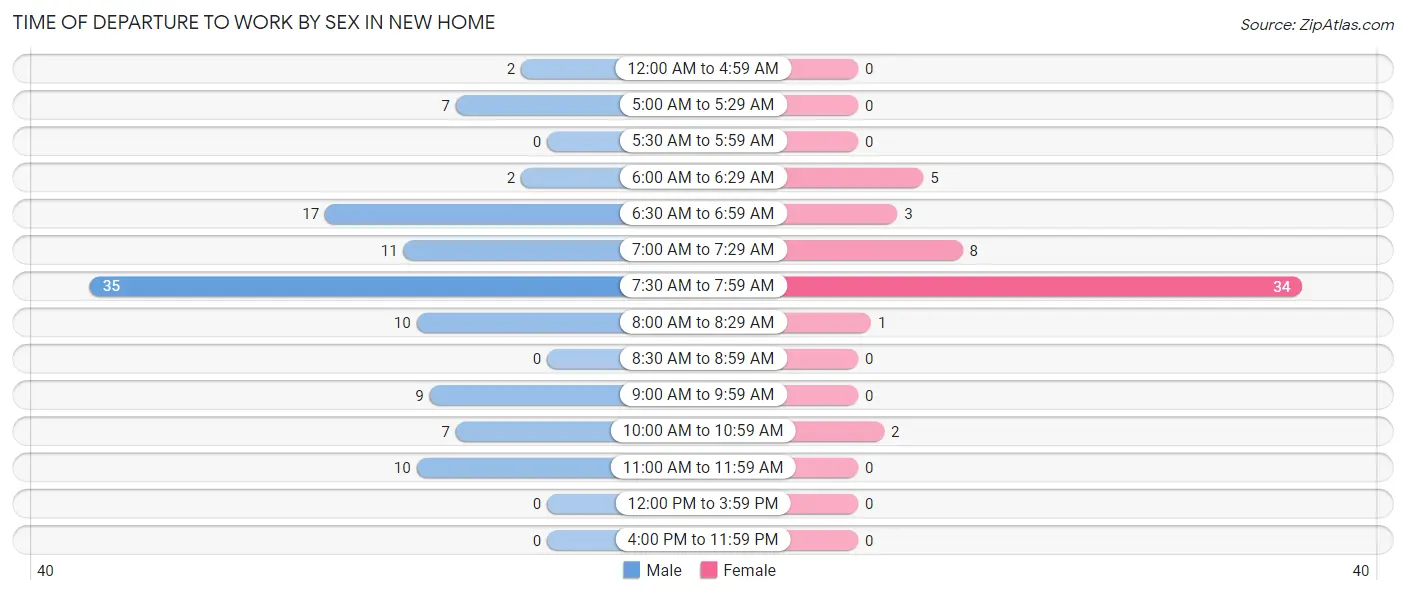
| Time of Departure | Male | Female |
| 12:00 AM to 4:59 AM | 2 (1.8%) | 0 (0.0%) |
| 5:00 AM to 5:29 AM | 7 (6.4%) | 0 (0.0%) |
| 5:30 AM to 5:59 AM | 0 (0.0%) | 0 (0.0%) |
| 6:00 AM to 6:29 AM | 2 (1.8%) | 5 (9.4%) |
| 6:30 AM to 6:59 AM | 17 (15.4%) | 3 (5.7%) |
| 7:00 AM to 7:29 AM | 11 (10.0%) | 8 (15.1%) |
| 7:30 AM to 7:59 AM | 35 (31.8%) | 34 (64.1%) |
| 8:00 AM to 8:29 AM | 10 (9.1%) | 1 (1.9%) |
| 8:30 AM to 8:59 AM | 0 (0.0%) | 0 (0.0%) |
| 9:00 AM to 9:59 AM | 9 (8.2%) | 0 (0.0%) |
| 10:00 AM to 10:59 AM | 7 (6.4%) | 2 (3.8%) |
| 11:00 AM to 11:59 AM | 10 (9.1%) | 0 (0.0%) |
| 12:00 PM to 3:59 PM | 0 (0.0%) | 0 (0.0%) |
| 4:00 PM to 11:59 PM | 0 (0.0%) | 0 (0.0%) |
| Total | 110 (100.0%) | 53 (100.0%) |
Housing Occupancy in New Home
Occupancy by Ownership in New Home
Of the total 129 dwellings in New Home, owner-occupied units account for 95 (73.6%), while renter-occupied units make up 34 (26.4%).
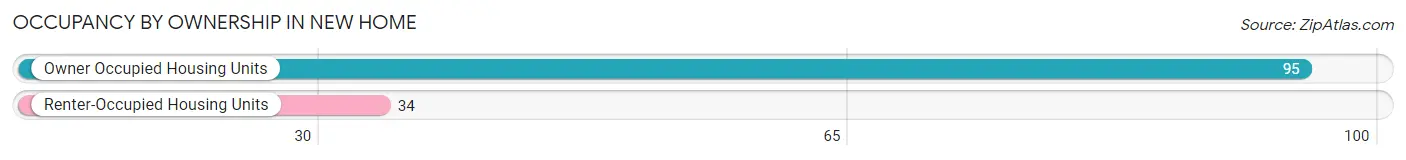
| Occupancy | # Housing Units | % Housing Units |
| Owner Occupied Housing Units | 95 | 73.6% |
| Renter-Occupied Housing Units | 34 | 26.4% |
| Total Occupied Housing Units | 129 | 100.0% |
Occupancy by Household Size in New Home
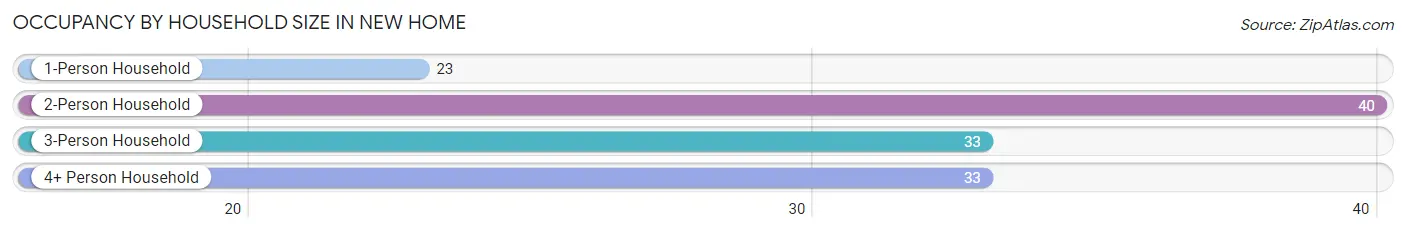
| Household Size | # Housing Units | % Housing Units |
| 1-Person Household | 23 | 17.8% |
| 2-Person Household | 40 | 31.0% |
| 3-Person Household | 33 | 25.6% |
| 4+ Person Household | 33 | 25.6% |
| Total Housing Units | 129 | 100.0% |
Occupancy by Ownership by Household Size in New Home
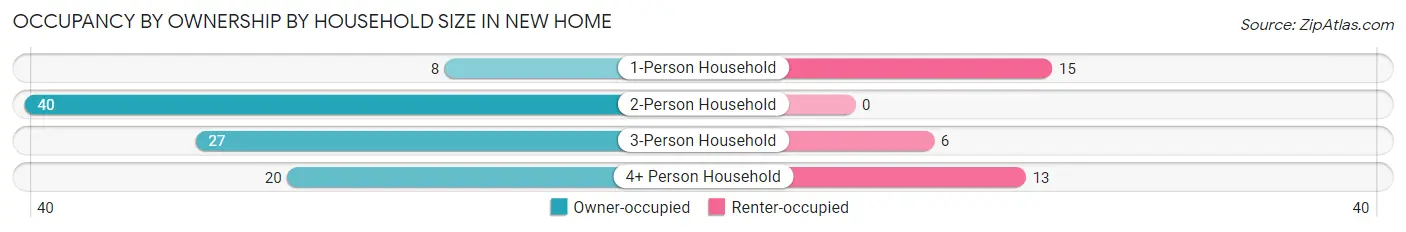
| Household Size | Owner-occupied | Renter-occupied |
| 1-Person Household | 8 (34.8%) | 15 (65.2%) |
| 2-Person Household | 40 (100.0%) | 0 (0.0%) |
| 3-Person Household | 27 (81.8%) | 6 (18.2%) |
| 4+ Person Household | 20 (60.6%) | 13 (39.4%) |
| Total Housing Units | 95 (73.6%) | 34 (26.4%) |
Occupancy by Educational Attainment in New Home
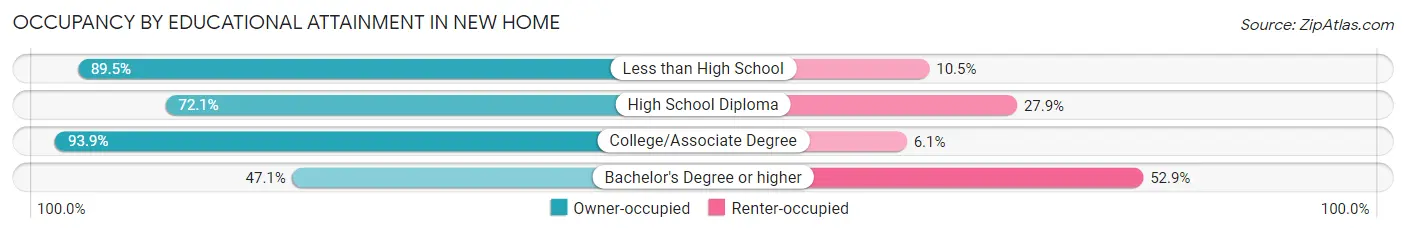
| Household Size | Owner-occupied | Renter-occupied |
| Less than High School | 17 (89.5%) | 2 (10.5%) |
| High School Diploma | 31 (72.1%) | 12 (27.9%) |
| College/Associate Degree | 31 (93.9%) | 2 (6.1%) |
| Bachelor's Degree or higher | 16 (47.1%) | 18 (52.9%) |
Occupancy by Age of Householder in New Home
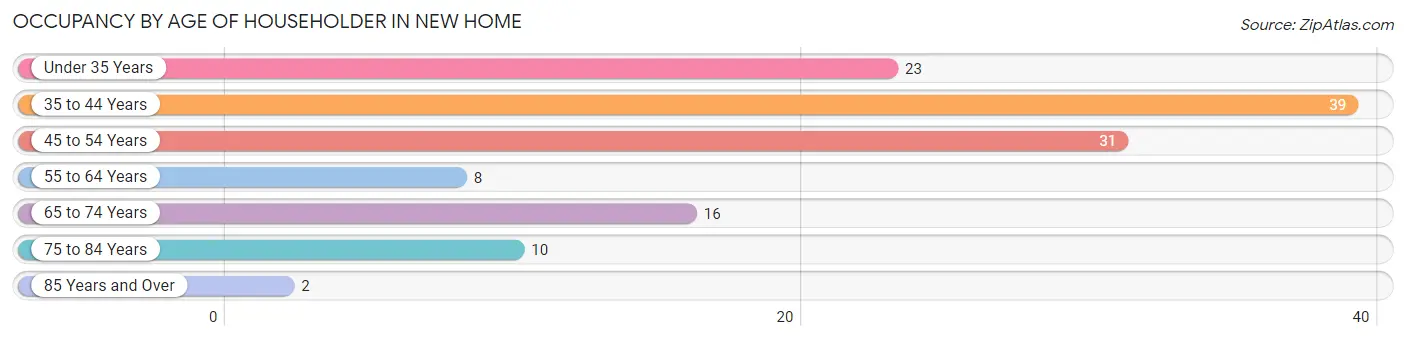
| Age Bracket | # Households | % Households |
| Under 35 Years | 23 | 17.8% |
| 35 to 44 Years | 39 | 30.2% |
| 45 to 54 Years | 31 | 24.0% |
| 55 to 64 Years | 8 | 6.2% |
| 65 to 74 Years | 16 | 12.4% |
| 75 to 84 Years | 10 | 7.7% |
| 85 Years and Over | 2 | 1.5% |
| Total | 129 | 100.0% |
Housing Finances in New Home
Median Income by Occupancy in New Home
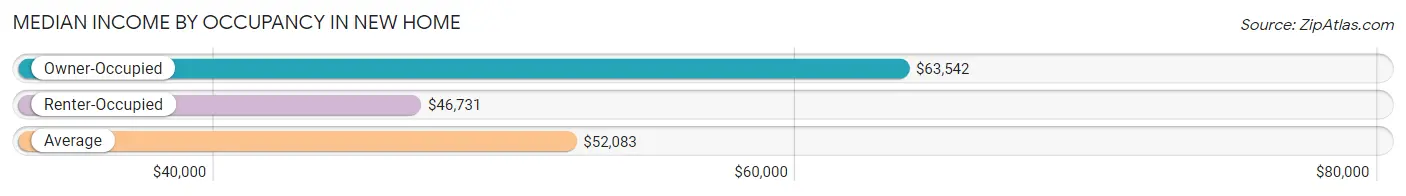
| Occupancy Type | # Households | Median Income |
| Owner-Occupied | 95 (73.6%) | $63,542 |
| Renter-Occupied | 34 (26.4%) | $46,731 |
| Average | 129 (100.0%) | $52,083 |
Occupancy by Householder Income Bracket in New Home
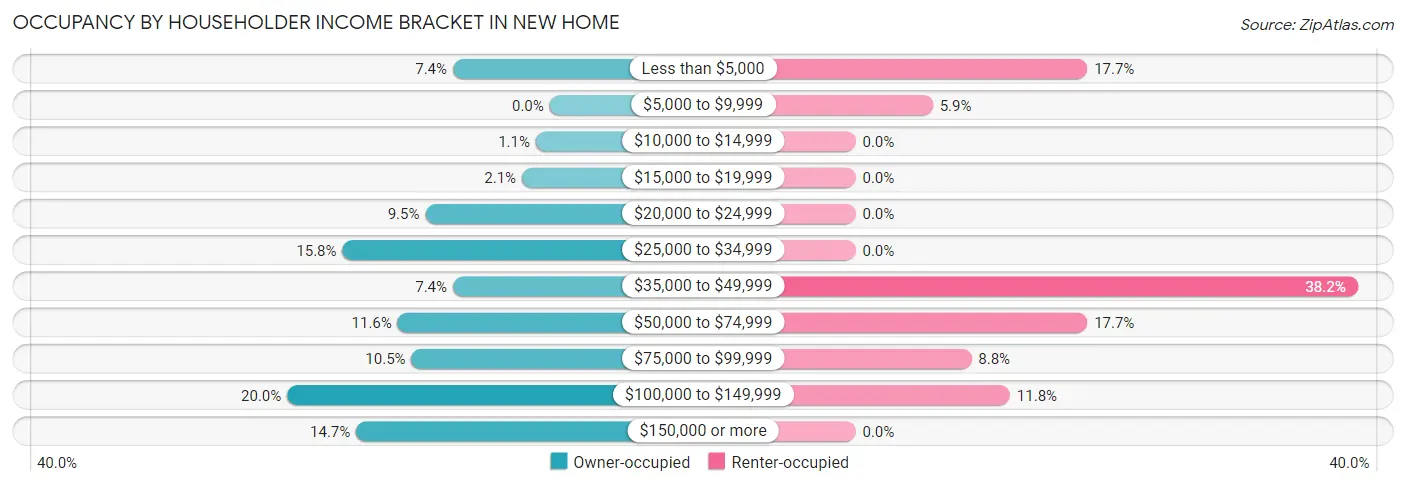
| Income Bracket | Owner-occupied | Renter-occupied |
| Less than $5,000 | 7 (7.4%) | 6 (17.6%) |
| $5,000 to $9,999 | 0 (0.0%) | 2 (5.9%) |
| $10,000 to $14,999 | 1 (1.1%) | 0 (0.0%) |
| $15,000 to $19,999 | 2 (2.1%) | 0 (0.0%) |
| $20,000 to $24,999 | 9 (9.5%) | 0 (0.0%) |
| $25,000 to $34,999 | 15 (15.8%) | 0 (0.0%) |
| $35,000 to $49,999 | 7 (7.4%) | 13 (38.2%) |
| $50,000 to $74,999 | 11 (11.6%) | 6 (17.6%) |
| $75,000 to $99,999 | 10 (10.5%) | 3 (8.8%) |
| $100,000 to $149,999 | 19 (20.0%) | 4 (11.8%) |
| $150,000 or more | 14 (14.7%) | 0 (0.0%) |
| Total | 95 (100.0%) | 34 (100.0%) |
Monthly Housing Cost Tiers in New Home
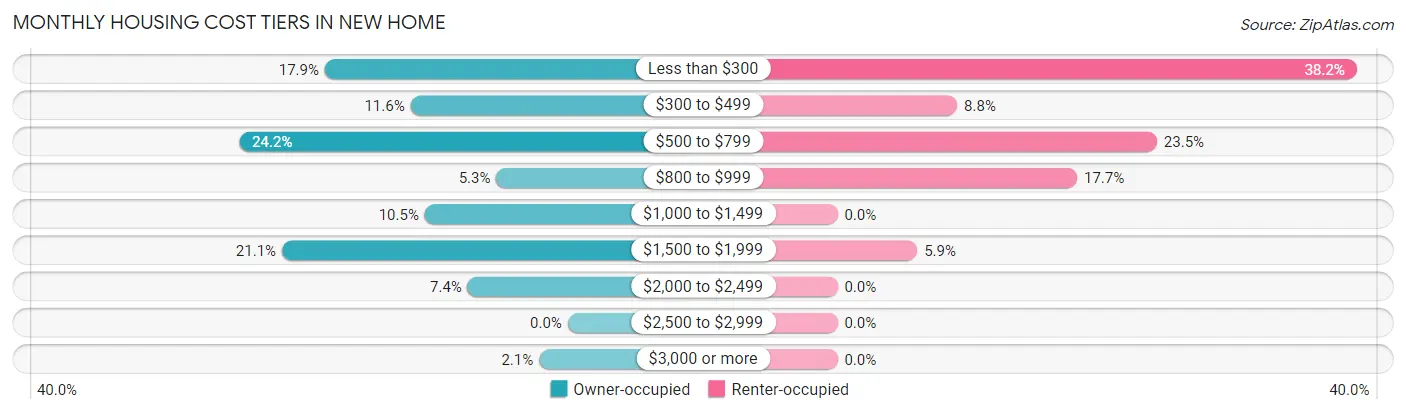
| Monthly Cost | Owner-occupied | Renter-occupied |
| Less than $300 | 17 (17.9%) | 13 (38.2%) |
| $300 to $499 | 11 (11.6%) | 3 (8.8%) |
| $500 to $799 | 23 (24.2%) | 8 (23.5%) |
| $800 to $999 | 5 (5.3%) | 6 (17.6%) |
| $1,000 to $1,499 | 10 (10.5%) | 0 (0.0%) |
| $1,500 to $1,999 | 20 (21.0%) | 2 (5.9%) |
| $2,000 to $2,499 | 7 (7.4%) | 0 (0.0%) |
| $2,500 to $2,999 | 0 (0.0%) | 0 (0.0%) |
| $3,000 or more | 2 (2.1%) | 0 (0.0%) |
| Total | 95 (100.0%) | 34 (100.0%) |
Physical Housing Characteristics in New Home
Housing Structures in New Home
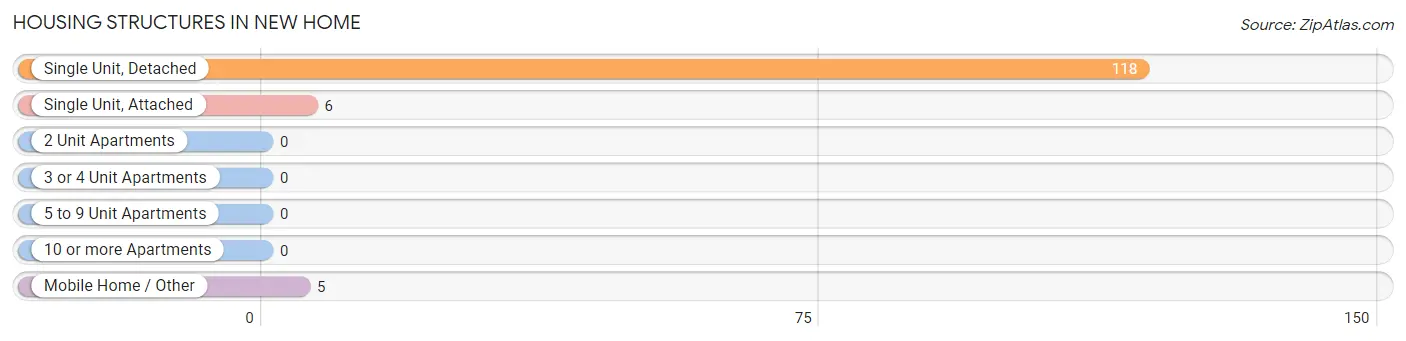
| Structure Type | # Housing Units | % Housing Units |
| Single Unit, Detached | 118 | 91.5% |
| Single Unit, Attached | 6 | 4.6% |
| 2 Unit Apartments | 0 | 0.0% |
| 3 or 4 Unit Apartments | 0 | 0.0% |
| 5 to 9 Unit Apartments | 0 | 0.0% |
| 10 or more Apartments | 0 | 0.0% |
| Mobile Home / Other | 5 | 3.9% |
| Total | 129 | 100.0% |
Housing Structures by Occupancy in New Home
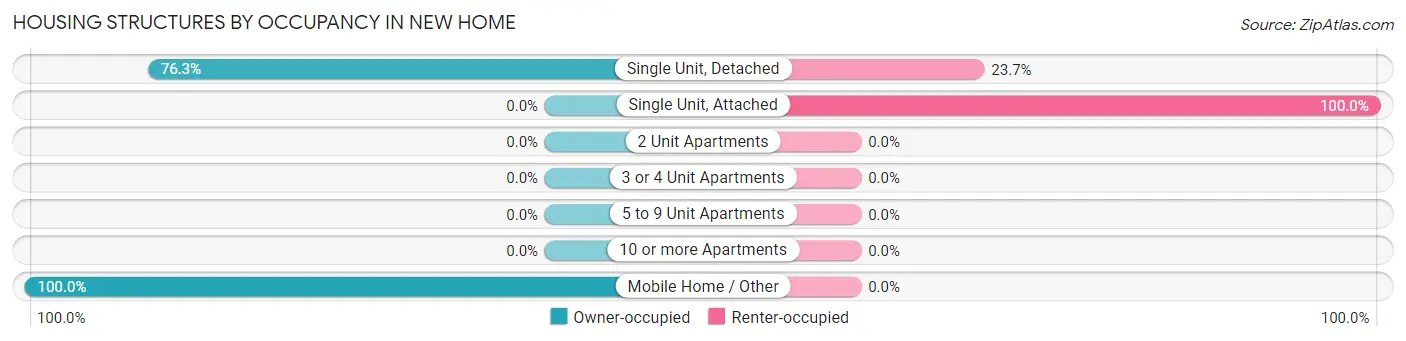
| Structure Type | Owner-occupied | Renter-occupied |
| Single Unit, Detached | 90 (76.3%) | 28 (23.7%) |
| Single Unit, Attached | 0 (0.0%) | 6 (100.0%) |
| 2 Unit Apartments | 0 (0.0%) | 0 (0.0%) |
| 3 or 4 Unit Apartments | 0 (0.0%) | 0 (0.0%) |
| 5 to 9 Unit Apartments | 0 (0.0%) | 0 (0.0%) |
| 10 or more Apartments | 0 (0.0%) | 0 (0.0%) |
| Mobile Home / Other | 5 (100.0%) | 0 (0.0%) |
| Total | 95 (73.6%) | 34 (26.4%) |
Housing Structures by Number of Rooms in New Home
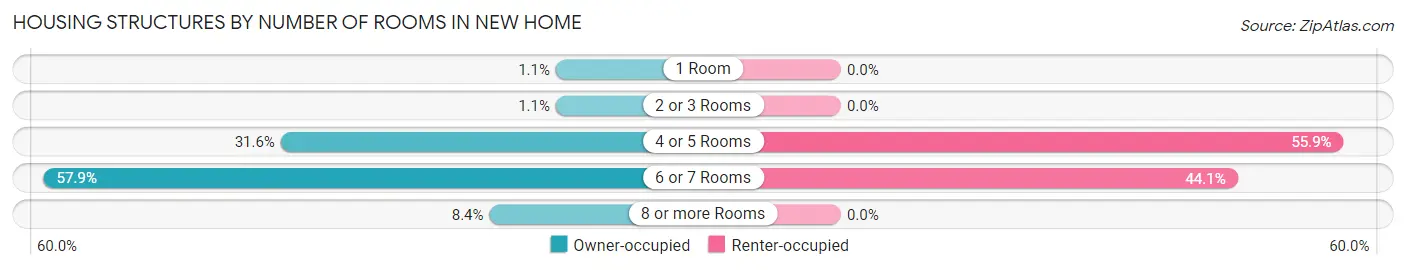
| Number of Rooms | Owner-occupied | Renter-occupied |
| 1 Room | 1 (1.1%) | 0 (0.0%) |
| 2 or 3 Rooms | 1 (1.1%) | 0 (0.0%) |
| 4 or 5 Rooms | 30 (31.6%) | 19 (55.9%) |
| 6 or 7 Rooms | 55 (57.9%) | 15 (44.1%) |
| 8 or more Rooms | 8 (8.4%) | 0 (0.0%) |
| Total | 95 (100.0%) | 34 (100.0%) |
Housing Structure by Heating Type in New Home
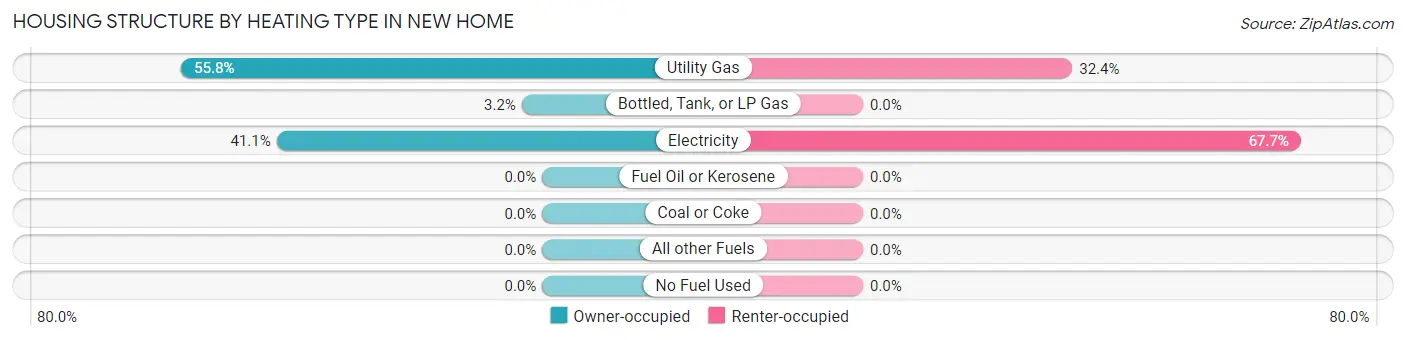
| Heating Type | Owner-occupied | Renter-occupied |
| Utility Gas | 53 (55.8%) | 11 (32.4%) |
| Bottled, Tank, or LP Gas | 3 (3.2%) | 0 (0.0%) |
| Electricity | 39 (41.0%) | 23 (67.6%) |
| Fuel Oil or Kerosene | 0 (0.0%) | 0 (0.0%) |
| Coal or Coke | 0 (0.0%) | 0 (0.0%) |
| All other Fuels | 0 (0.0%) | 0 (0.0%) |
| No Fuel Used | 0 (0.0%) | 0 (0.0%) |
| Total | 95 (100.0%) | 34 (100.0%) |
Household Vehicle Usage in New Home
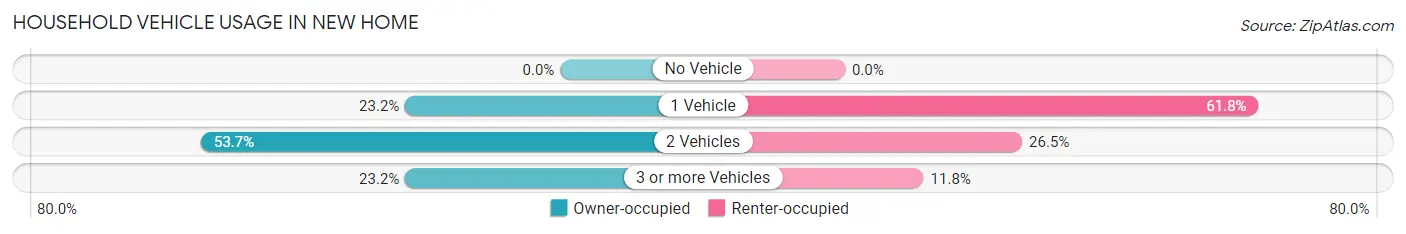
| Vehicles per Household | Owner-occupied | Renter-occupied |
| No Vehicle | 0 (0.0%) | 0 (0.0%) |
| 1 Vehicle | 22 (23.2%) | 21 (61.8%) |
| 2 Vehicles | 51 (53.7%) | 9 (26.5%) |
| 3 or more Vehicles | 22 (23.2%) | 4 (11.8%) |
| Total | 95 (100.0%) | 34 (100.0%) |
Real Estate & Mortgages in New Home
Real Estate and Mortgage Overview in New Home
| Characteristic | Without Mortgage | With Mortgage |
| Housing Units | 49 | 46 |
| Median Property Value | $108,000 | $242,900 |
| Median Household Income | $29,464 | $11 |
| Monthly Housing Costs | $430 | $2 |
| Real Estate Taxes | $1,050 | $0 |
Property Value by Mortgage Status in New Home
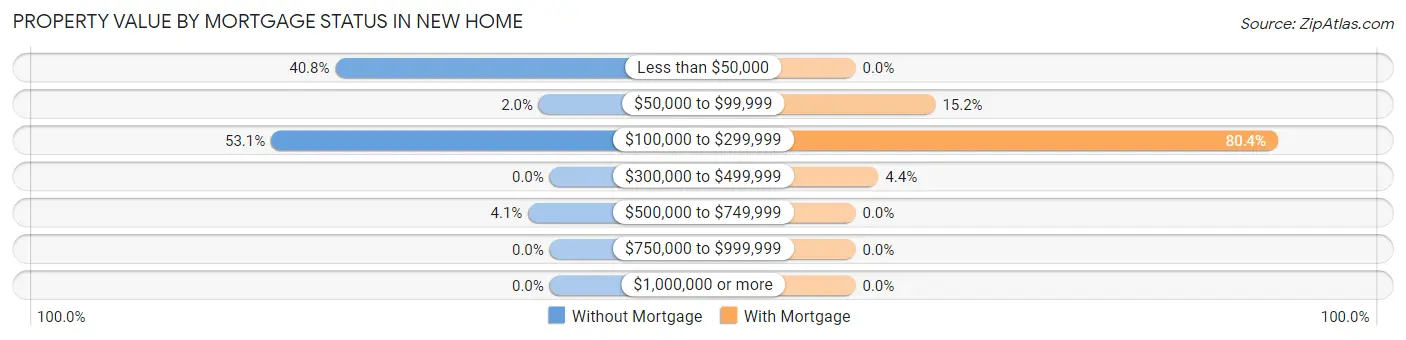
| Property Value | Without Mortgage | With Mortgage |
| Less than $50,000 | 20 (40.8%) | 0 (0.0%) |
| $50,000 to $99,999 | 1 (2.0%) | 7 (15.2%) |
| $100,000 to $299,999 | 26 (53.1%) | 37 (80.4%) |
| $300,000 to $499,999 | 0 (0.0%) | 2 (4.3%) |
| $500,000 to $749,999 | 2 (4.1%) | 0 (0.0%) |
| $750,000 to $999,999 | 0 (0.0%) | 0 (0.0%) |
| $1,000,000 or more | 0 (0.0%) | 0 (0.0%) |
| Total | 49 (100.0%) | 46 (100.0%) |
Household Income by Mortgage Status in New Home
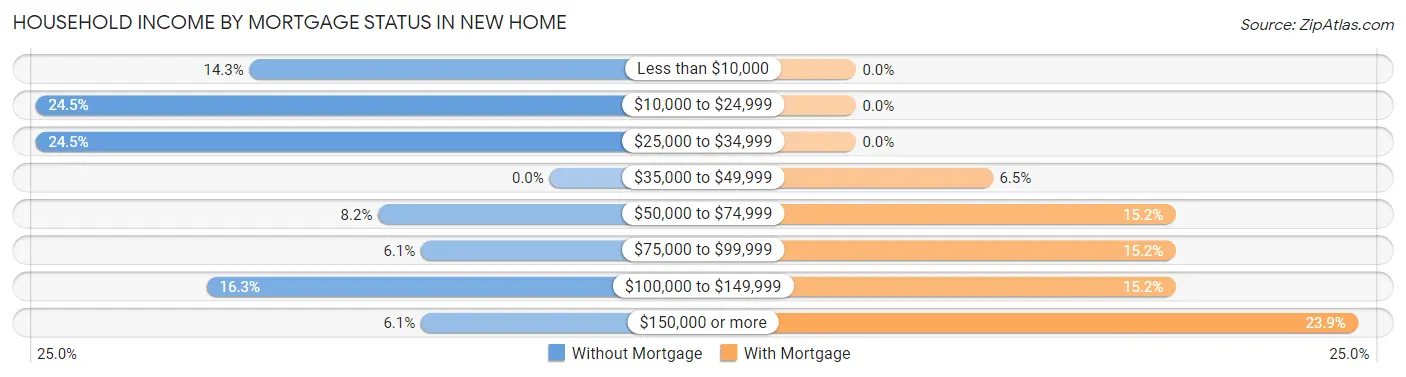
| Household Income | Without Mortgage | With Mortgage |
| Less than $10,000 | 7 (14.3%) | 0 (0.0%) |
| $10,000 to $24,999 | 12 (24.5%) | 0 (0.0%) |
| $25,000 to $34,999 | 12 (24.5%) | 0 (0.0%) |
| $35,000 to $49,999 | 0 (0.0%) | 3 (6.5%) |
| $50,000 to $74,999 | 4 (8.2%) | 7 (15.2%) |
| $75,000 to $99,999 | 3 (6.1%) | 7 (15.2%) |
| $100,000 to $149,999 | 8 (16.3%) | 7 (15.2%) |
| $150,000 or more | 3 (6.1%) | 11 (23.9%) |
| Total | 49 (100.0%) | 46 (100.0%) |
Property Value to Household Income Ratio in New Home
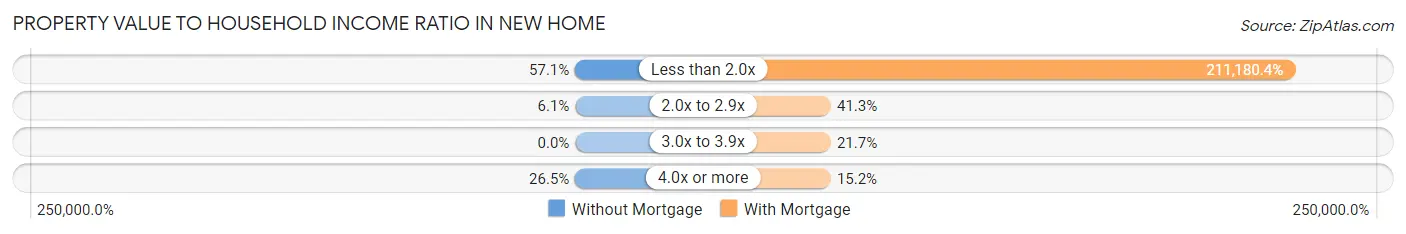
| Value-to-Income Ratio | Without Mortgage | With Mortgage |
| Less than 2.0x | 28 (57.1%) | 97,143 (211,180.4%) |
| 2.0x to 2.9x | 3 (6.1%) | 19 (41.3%) |
| 3.0x to 3.9x | 0 (0.0%) | 10 (21.7%) |
| 4.0x or more | 13 (26.5%) | 7 (15.2%) |
| Total | 49 (100.0%) | 46 (100.0%) |
Real Estate Taxes by Mortgage Status in New Home
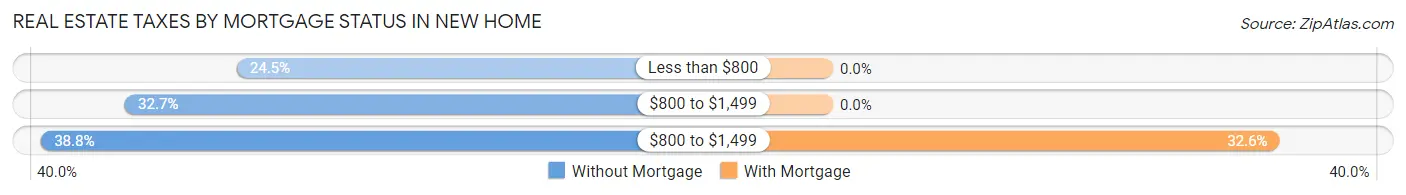
| Property Taxes | Without Mortgage | With Mortgage |
| Less than $800 | 12 (24.5%) | 0 (0.0%) |
| $800 to $1,499 | 16 (32.7%) | 0 (0.0%) |
| $800 to $1,499 | 19 (38.8%) | 15 (32.6%) |
| Total | 49 (100.0%) | 46 (100.0%) |
Health & Disability in New Home
Health Insurance Coverage by Age in New Home
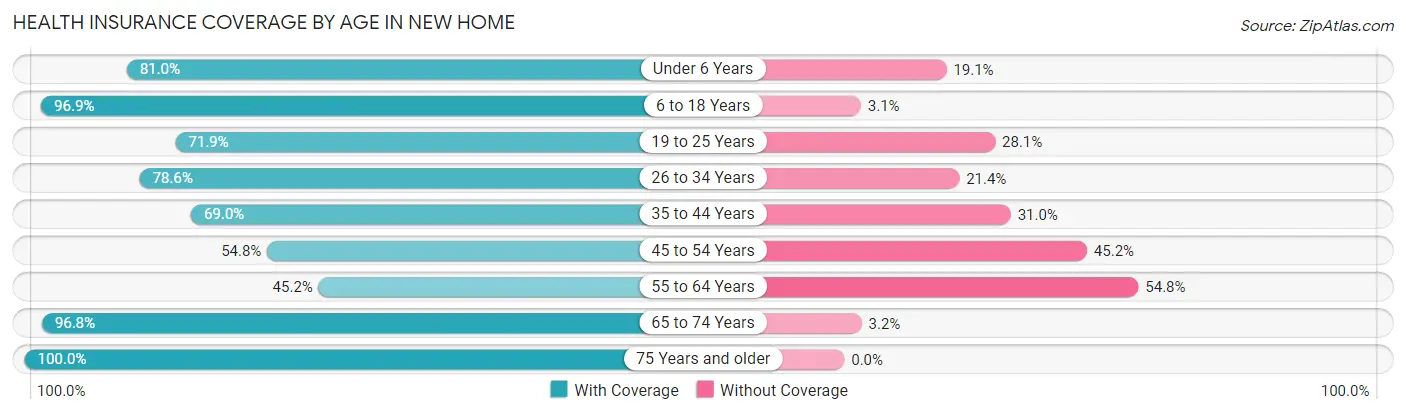
| Age Bracket | With Coverage | Without Coverage |
| Under 6 Years | 17 (80.9%) | 4 (19.1%) |
| 6 to 18 Years | 94 (96.9%) | 3 (3.1%) |
| 19 to 25 Years | 23 (71.9%) | 9 (28.1%) |
| 26 to 34 Years | 33 (78.6%) | 9 (21.4%) |
| 35 to 44 Years | 40 (69.0%) | 18 (31.0%) |
| 45 to 54 Years | 23 (54.8%) | 19 (45.2%) |
| 55 to 64 Years | 14 (45.2%) | 17 (54.8%) |
| 65 to 74 Years | 30 (96.8%) | 1 (3.2%) |
| 75 Years and older | 13 (100.0%) | 0 (0.0%) |
| Total | 287 (78.2%) | 80 (21.8%) |
Health Insurance Coverage by Citizenship Status in New Home
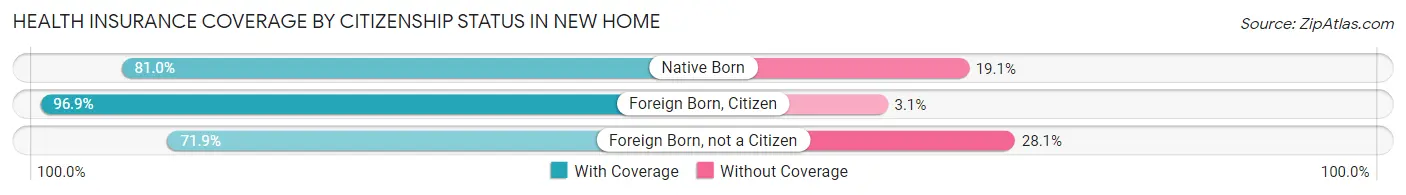
| Citizenship Status | With Coverage | Without Coverage |
| Native Born | 17 (80.9%) | 4 (19.1%) |
| Foreign Born, Citizen | 94 (96.9%) | 3 (3.1%) |
| Foreign Born, not a Citizen | 23 (71.9%) | 9 (28.1%) |
Health Insurance Coverage by Household Income in New Home
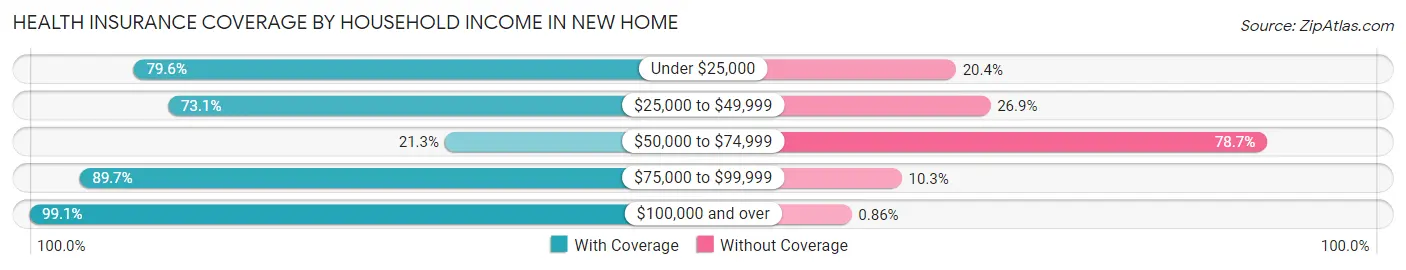
| Household Income | With Coverage | Without Coverage |
| Under $25,000 | 78 (79.6%) | 20 (20.4%) |
| $25,000 to $49,999 | 49 (73.1%) | 18 (26.9%) |
| $50,000 to $74,999 | 10 (21.3%) | 37 (78.7%) |
| $75,000 to $99,999 | 35 (89.7%) | 4 (10.3%) |
| $100,000 and over | 115 (99.1%) | 1 (0.9%) |
Public vs Private Health Insurance Coverage by Age in New Home
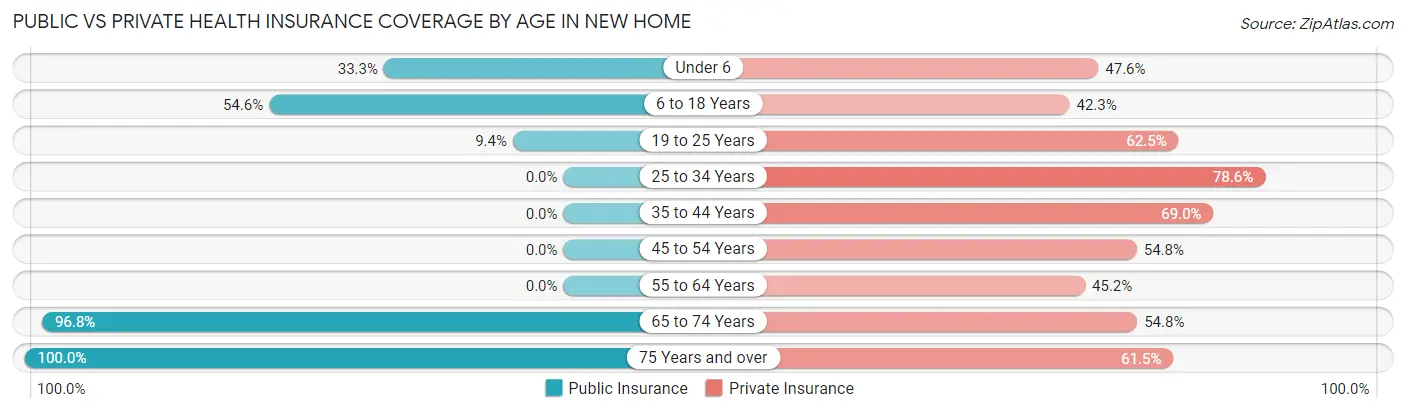
| Age Bracket | Public Insurance | Private Insurance |
| Under 6 | 7 (33.3%) | 10 (47.6%) |
| 6 to 18 Years | 53 (54.6%) | 41 (42.3%) |
| 19 to 25 Years | 3 (9.4%) | 20 (62.5%) |
| 25 to 34 Years | 0 (0.0%) | 33 (78.6%) |
| 35 to 44 Years | 0 (0.0%) | 40 (69.0%) |
| 45 to 54 Years | 0 (0.0%) | 23 (54.8%) |
| 55 to 64 Years | 0 (0.0%) | 14 (45.2%) |
| 65 to 74 Years | 30 (96.8%) | 17 (54.8%) |
| 75 Years and over | 13 (100.0%) | 8 (61.5%) |
| Total | 106 (28.9%) | 206 (56.1%) |
Disability Status by Sex by Age in New Home
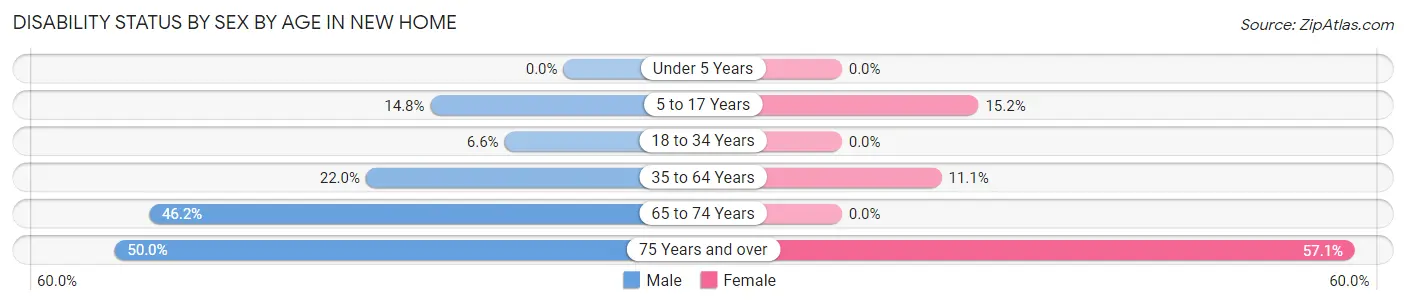
| Age Bracket | Male | Female |
| Under 5 Years | 0 (0.0%) | 0 (0.0%) |
| 5 to 17 Years | 8 (14.8%) | 7 (15.2%) |
| 18 to 34 Years | 4 (6.6%) | 0 (0.0%) |
| 35 to 64 Years | 11 (22.0%) | 9 (11.1%) |
| 65 to 74 Years | 6 (46.2%) | 0 (0.0%) |
| 75 Years and over | 3 (50.0%) | 4 (57.1%) |
Disability Class by Sex by Age in New Home
Disability Class: Hearing Difficulty
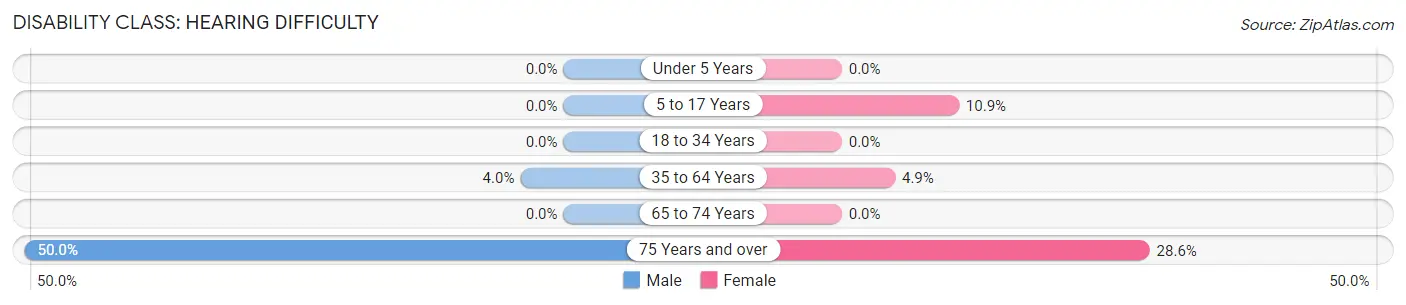
| Age Bracket | Male | Female |
| Under 5 Years | 0 (0.0%) | 0 (0.0%) |
| 5 to 17 Years | 0 (0.0%) | 5 (10.9%) |
| 18 to 34 Years | 0 (0.0%) | 0 (0.0%) |
| 35 to 64 Years | 2 (4.0%) | 4 (4.9%) |
| 65 to 74 Years | 0 (0.0%) | 0 (0.0%) |
| 75 Years and over | 3 (50.0%) | 2 (28.6%) |
Disability Class: Vision Difficulty
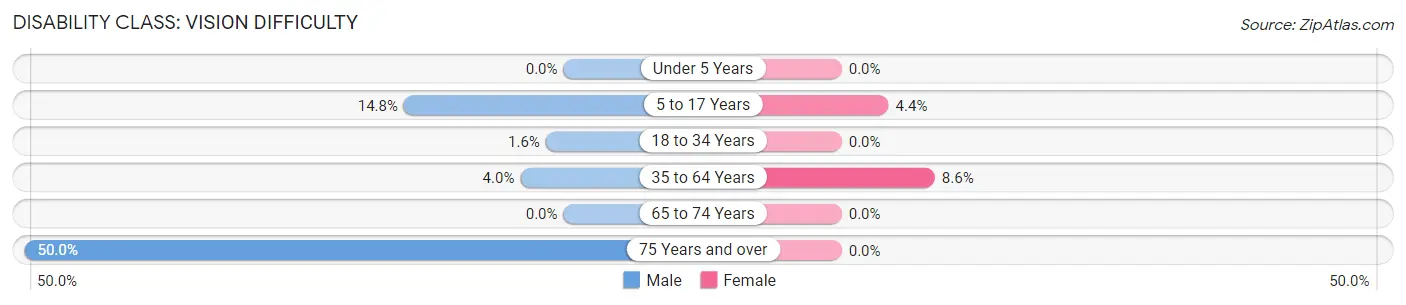
| Age Bracket | Male | Female |
| Under 5 Years | 0 (0.0%) | 0 (0.0%) |
| 5 to 17 Years | 8 (14.8%) | 2 (4.3%) |
| 18 to 34 Years | 1 (1.6%) | 0 (0.0%) |
| 35 to 64 Years | 2 (4.0%) | 7 (8.6%) |
| 65 to 74 Years | 0 (0.0%) | 0 (0.0%) |
| 75 Years and over | 3 (50.0%) | 0 (0.0%) |
Disability Class: Cognitive Difficulty
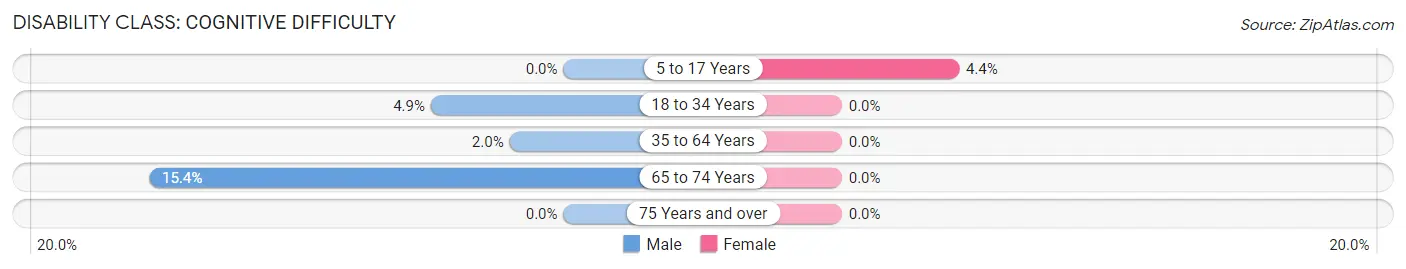
| Age Bracket | Male | Female |
| 5 to 17 Years | 0 (0.0%) | 2 (4.3%) |
| 18 to 34 Years | 3 (4.9%) | 0 (0.0%) |
| 35 to 64 Years | 1 (2.0%) | 0 (0.0%) |
| 65 to 74 Years | 2 (15.4%) | 0 (0.0%) |
| 75 Years and over | 0 (0.0%) | 0 (0.0%) |
Disability Class: Ambulatory Difficulty
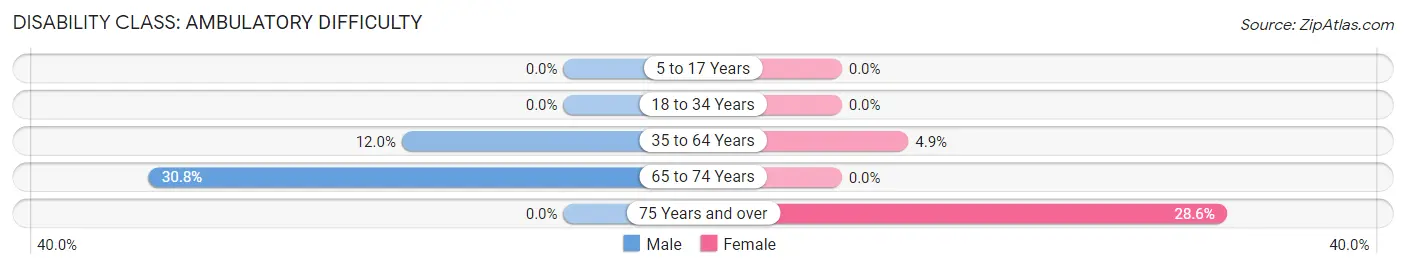
| Age Bracket | Male | Female |
| 5 to 17 Years | 0 (0.0%) | 0 (0.0%) |
| 18 to 34 Years | 0 (0.0%) | 0 (0.0%) |
| 35 to 64 Years | 6 (12.0%) | 4 (4.9%) |
| 65 to 74 Years | 4 (30.8%) | 0 (0.0%) |
| 75 Years and over | 0 (0.0%) | 2 (28.6%) |
Disability Class: Self-Care Difficulty
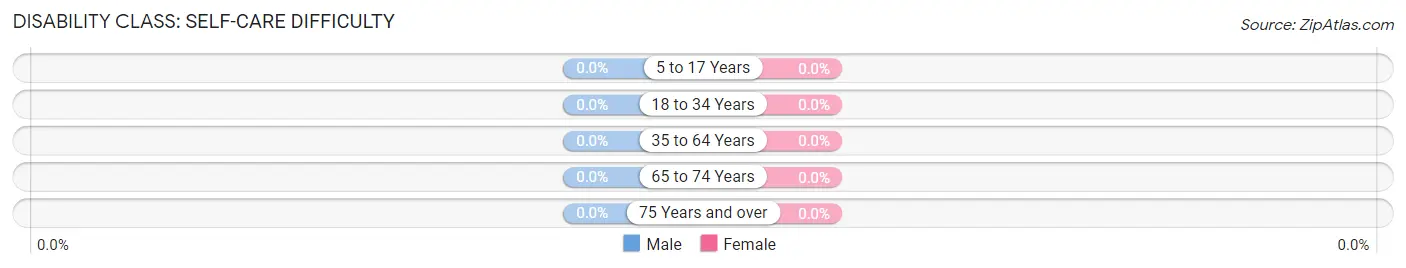
| Age Bracket | Male | Female |
| 5 to 17 Years | 0 (0.0%) | 0 (0.0%) |
| 18 to 34 Years | 0 (0.0%) | 0 (0.0%) |
| 35 to 64 Years | 0 (0.0%) | 0 (0.0%) |
| 65 to 74 Years | 0 (0.0%) | 0 (0.0%) |
| 75 Years and over | 0 (0.0%) | 0 (0.0%) |
Technology Access in New Home
Computing Device Access in New Home
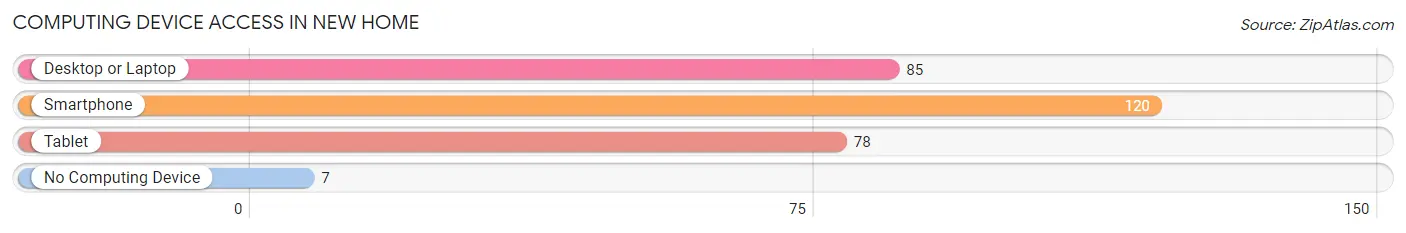
| Device Type | # Households | % Households |
| Desktop or Laptop | 85 | 65.9% |
| Smartphone | 120 | 93.0% |
| Tablet | 78 | 60.5% |
| No Computing Device | 7 | 5.4% |
| Total | 129 | 100.0% |
Internet Access in New Home
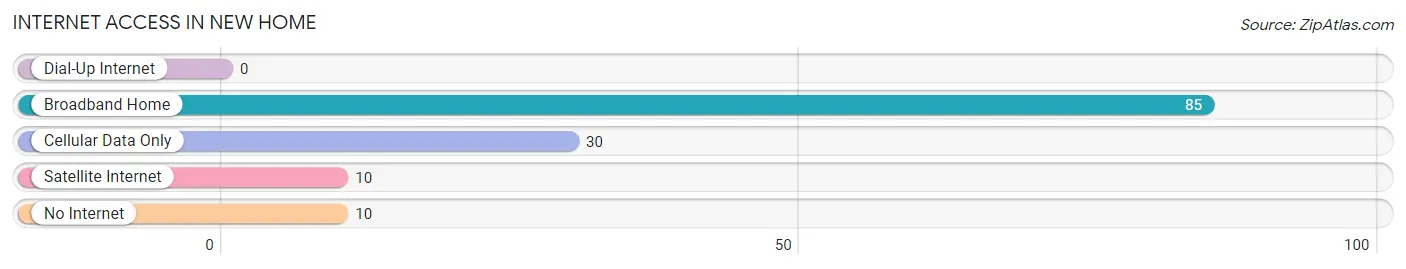
| Internet Type | # Households | % Households |
| Dial-Up Internet | 0 | 0.0% |
| Broadband Home | 85 | 65.9% |
| Cellular Data Only | 30 | 23.3% |
| Satellite Internet | 10 | 7.7% |
| No Internet | 10 | 7.7% |
| Total | 129 | 100.0% |
New Home Summary
Home, Texas is a small town located in the southeastern part of the state, about 25 miles east of Austin. It is part of the Austin-Round Rock metropolitan area and is located in Williamson County. The population of Home was 1,845 in the 2010 census, making it one of the smallest towns in the area.
History
Home was founded in 1876 by a group of settlers from the nearby town of Round Rock. The town was originally called “Home Place” and was named after the nearby Home Place Creek. The town was officially incorporated in 1882 and the name was changed to Home.
The town was a farming community for many years, with cotton and corn being the main crops. In the early 1900s, the town began to grow as a result of the railroad coming through. This allowed for the transportation of goods and people to and from the town.
In the 1950s, the town began to experience a population boom as people moved to the area for jobs in the nearby cities of Austin and Round Rock. This growth continued into the 1970s and 1980s, and the town began to develop into a bedroom community for the larger cities.
Geography
Home is located in the southeastern part of Williamson County, about 25 miles east of Austin. The town is situated on the banks of the Home Place Creek, which flows into the nearby Brushy Creek. The town is surrounded by rolling hills and is located in the Texas Hill Country.
The climate in Home is hot and humid in the summer months, with temperatures reaching into the 90s. Winters are mild, with temperatures rarely dropping below freezing.
Economy
The economy of Home is largely based on agriculture and tourism. The town is home to several farms, which produce cotton, corn, and other crops. The town also has several wineries and vineyards, which attract tourists from all over the state.
In addition to agriculture and tourism, Home is home to several small businesses, including restaurants, shops, and other services. The town is also home to a few manufacturing companies, which provide jobs to the local population.
Demographics
As of the 2010 census, the population of Home was 1,845. The racial makeup of the town was 87.3% White, 5.2% Hispanic or Latino, 4.2% African American, and 3.3% other. The median household income was $50,000, and the median age was 37.
The town is served by the Home Independent School District, which includes two elementary schools, one middle school, and one high school. The town is also home to several churches, including the First Baptist Church of Home.
Conclusion
Home, Texas is a small town located in the southeastern part of the state, about 25 miles east of Austin. It is part of the Austin-Round Rock metropolitan area and is located in Williamson County. The town has a long history, dating back to 1876, and has experienced a population boom in recent decades. The economy of Home is largely based on agriculture and tourism, and the town is served by the Home Independent School District. The population of Home was 1,845 in the 2010 census, making it one of the smallest towns in the area.
Common Questions
What is Per Capita Income in New Home?
Per Capita income in New Home is $24,039.
What is the Median Family Income in New Home?
Median Family Income in New Home is $54,792.
What is the Median Household income in New Home?
Median Household Income in New Home is $52,083.
What is Income or Wage Gap in New Home?
Income or Wage Gap in New Home is 49.3%.
Women in New Home earn 50.7 cents for every dollar earned by a man.
What is Inequality or Gini Index in New Home?
Inequality or Gini Index in New Home is 0.43.
What is the Total Population of New Home?
Total Population of New Home is 367.
What is the Total Male Population of New Home?
Total Male Population of New Home is 190.
What is the Total Female Population of New Home?
Total Female Population of New Home is 177.
What is the Ratio of Males per 100 Females in New Home?
There are 107.34 Males per 100 Females in New Home.
What is the Ratio of Females per 100 Males in New Home?
There are 93.16 Females per 100 Males in New Home.
What is the Median Population Age in New Home?
Median Population Age in New Home is 31.1 Years.
What is the Average Family Size in New Home
Average Family Size in New Home is 3.4 People.
What is the Average Household Size in New Home
Average Household Size in New Home is 2.8 People.
How Large is the Labor Force in New Home?
There are 193 People in the Labor Forcein in New Home.
What is the Percentage of People in the Labor Force in New Home?
71.7% of People are in the Labor Force in New Home.
What is the Unemployment Rate in New Home?
Unemployment Rate in New Home is 4.7%.