Muleshoe, TX Map & Demographics
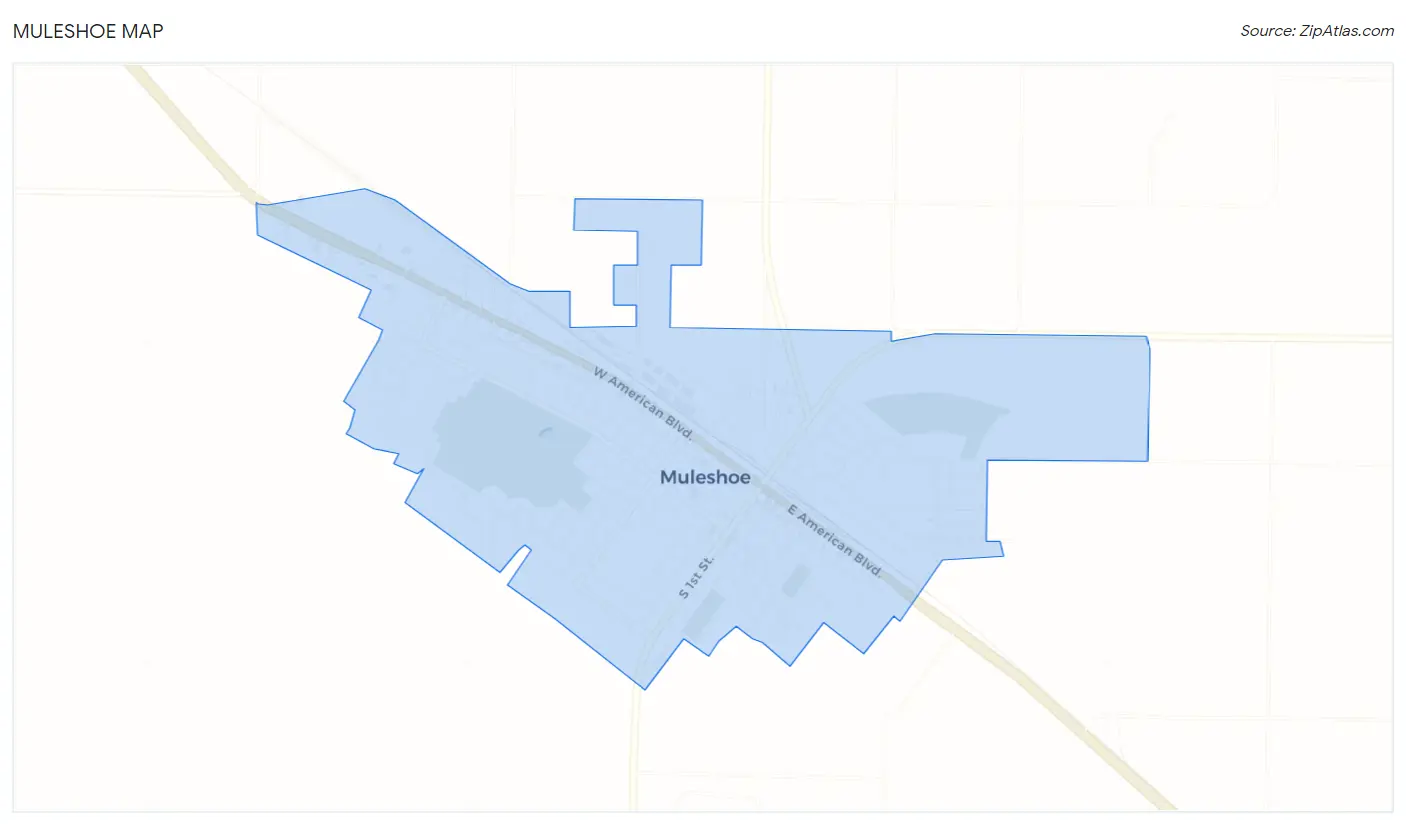
Muleshoe Map
Muleshoe Overview
$30,194
PER CAPITA INCOME
$86,007
AVG FAMILY INCOME
$76,618
AVG HOUSEHOLD INCOME
45.3%
WAGE / INCOME GAP [ % ]
54.7¢/ $1
WAGE / INCOME GAP [ $ ]
0.46
INEQUALITY / GINI INDEX
5,515
TOTAL POPULATION
2,331
MALE POPULATION
3,184
FEMALE POPULATION
73.21
MALES / 100 FEMALES
136.59
FEMALES / 100 MALES
30.0
MEDIAN AGE
4.3
AVG FAMILY SIZE
3.6
AVG HOUSEHOLD SIZE
2,246
LABOR FORCE [ PEOPLE ]
53.6%
PERCENT IN LABOR FORCE
2.9%
UNEMPLOYMENT RATE
Muleshoe Zip Codes
Muleshoe Area Codes
Income in Muleshoe
Income Overview in Muleshoe
Per Capita Income in Muleshoe is $30,194, while median incomes of families and households are $86,007 and $76,618 respectively.
| Characteristic | Number | Measure |
| Per Capita Income | 5,515 | $30,194 |
| Median Family Income | 1,039 | $86,007 |
| Mean Family Income | 1,039 | $101,746 |
| Median Household Income | 1,482 | $76,618 |
| Mean Household Income | 1,482 | $85,463 |
| Income Deficit | 1,039 | $0 |
| Wage / Income Gap (%) | 5,515 | 45.34% |
| Wage / Income Gap ($) | 5,515 | 54.66¢ per $1 |
| Gini / Inequality Index | 5,515 | 0.46 |
Earnings by Sex in Muleshoe
Average Earnings in Muleshoe are $37,069, $48,053 for men and $26,267 for women, a difference of 45.3%.
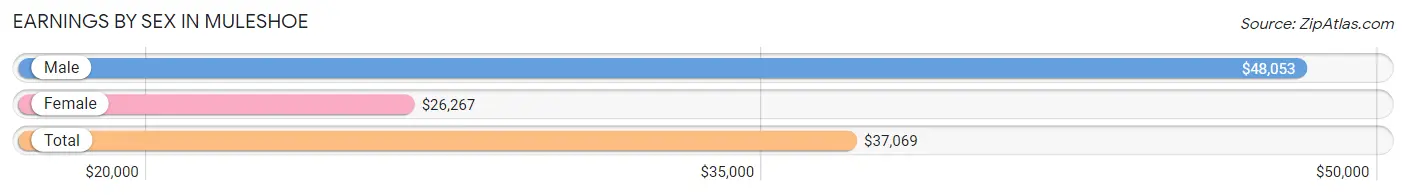
| Sex | Number | Average Earnings |
| Male | 1,408 (53.7%) | $48,053 |
| Female | 1,213 (46.3%) | $26,267 |
| Total | 2,621 (100.0%) | $37,069 |
Earnings by Sex by Income Bracket in Muleshoe
The most common earnings brackets in Muleshoe are $35,000 to $39,999 for men (317 | 22.5%) and $30,000 to $34,999 for women (219 | 18.0%).
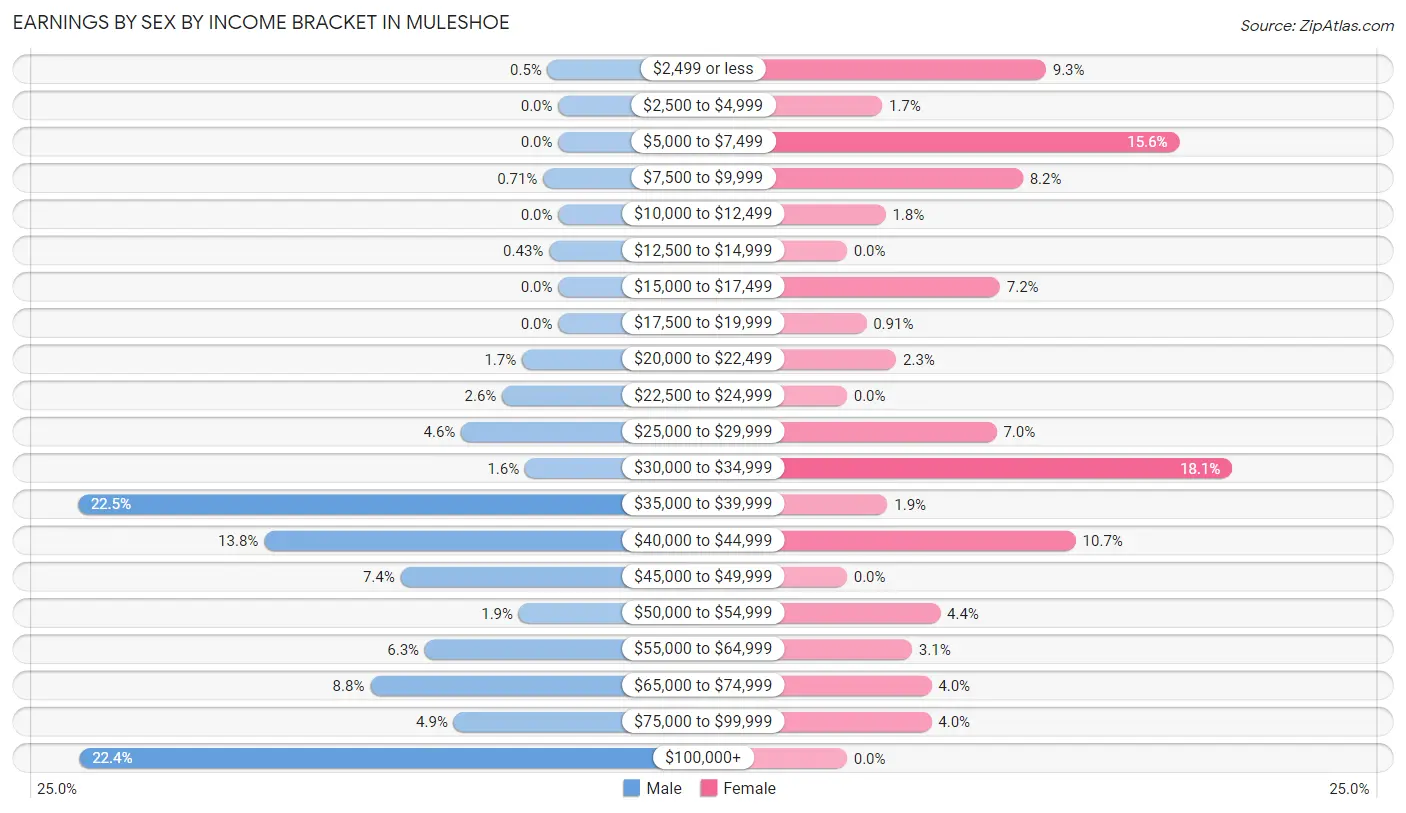
| Income | Male | Female |
| $2,499 or less | 7 (0.5%) | 113 (9.3%) |
| $2,500 to $4,999 | 0 (0.0%) | 20 (1.7%) |
| $5,000 to $7,499 | 0 (0.0%) | 189 (15.6%) |
| $7,500 to $9,999 | 10 (0.7%) | 100 (8.2%) |
| $10,000 to $12,499 | 0 (0.0%) | 22 (1.8%) |
| $12,500 to $14,999 | 6 (0.4%) | 0 (0.0%) |
| $15,000 to $17,499 | 0 (0.0%) | 87 (7.2%) |
| $17,500 to $19,999 | 0 (0.0%) | 11 (0.9%) |
| $20,000 to $22,499 | 24 (1.7%) | 28 (2.3%) |
| $22,500 to $24,999 | 37 (2.6%) | 0 (0.0%) |
| $25,000 to $29,999 | 64 (4.5%) | 85 (7.0%) |
| $30,000 to $34,999 | 22 (1.6%) | 219 (18.0%) |
| $35,000 to $39,999 | 317 (22.5%) | 23 (1.9%) |
| $40,000 to $44,999 | 194 (13.8%) | 130 (10.7%) |
| $45,000 to $49,999 | 104 (7.4%) | 0 (0.0%) |
| $50,000 to $54,999 | 26 (1.8%) | 53 (4.4%) |
| $55,000 to $64,999 | 88 (6.2%) | 37 (3.0%) |
| $65,000 to $74,999 | 124 (8.8%) | 48 (4.0%) |
| $75,000 to $99,999 | 69 (4.9%) | 48 (4.0%) |
| $100,000+ | 316 (22.4%) | 0 (0.0%) |
| Total | 1,408 (100.0%) | 1,213 (100.0%) |
Earnings by Sex by Educational Attainment in Muleshoe
Average earnings in Muleshoe are $53,413 for men and $32,751 for women, a difference of 38.7%. Men with an educational attainment of less than high school enjoy the highest average annual earnings of $102,509, while those with high school diploma education earn the least with $36,814. Women with an educational attainment of bachelor's degree earn the most with the average annual earnings of $57,188, while those with less than high school education have the smallest earnings of $16,753.
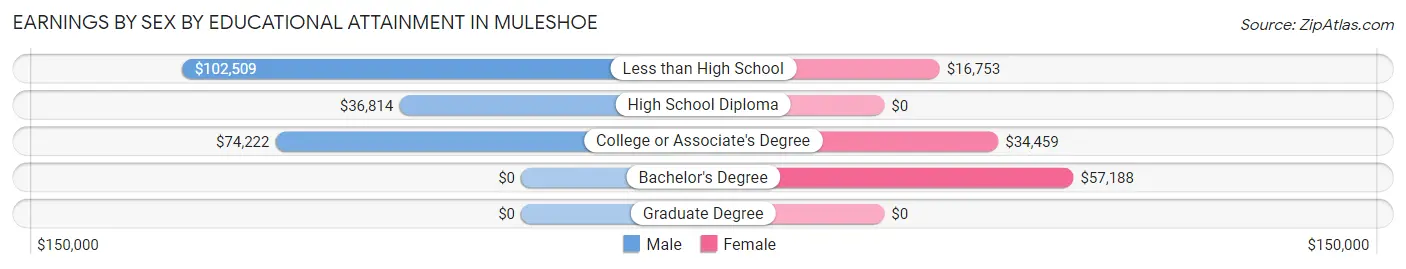
| Educational Attainment | Male Income | Female Income |
| Less than High School | $102,509 | $16,753 |
| High School Diploma | $36,814 | $0 |
| College or Associate's Degree | $74,222 | $34,459 |
| Bachelor's Degree | - | - |
| Graduate Degree | - | - |
| Total | $53,413 | $32,751 |
Family Income in Muleshoe
Family Income Brackets in Muleshoe
According to the Muleshoe family income data, there are 269 families falling into the $100,000 to $149,999 income range, which is the most common income bracket and makes up 25.9% of all families. Conversely, the less than $10,000 income bracket is the least frequent group with only 23 families (2.2%) belonging to this category.
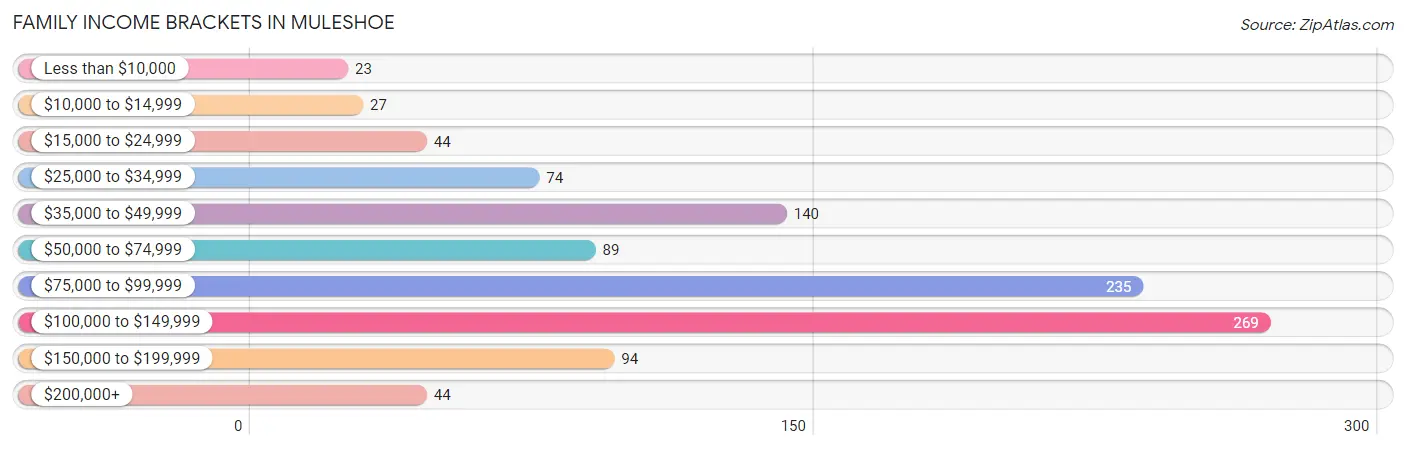
| Income Bracket | # Families | % Families |
| Less than $10,000 | 23 | 2.2% |
| $10,000 to $14,999 | 27 | 2.6% |
| $15,000 to $24,999 | 44 | 4.2% |
| $25,000 to $34,999 | 74 | 7.1% |
| $35,000 to $49,999 | 140 | 13.5% |
| $50,000 to $74,999 | 89 | 8.6% |
| $75,000 to $99,999 | 235 | 22.6% |
| $100,000 to $149,999 | 269 | 25.9% |
| $150,000 to $199,999 | 94 | 9.0% |
| $200,000+ | 44 | 4.2% |
Family Income by Famaliy Size in Muleshoe
4-person families (278 | 26.8%) account for the highest median family income in Muleshoe with $93,750 per family, while 2-person families (582 | 56.0%) have the highest median income of $42,812 per family member.
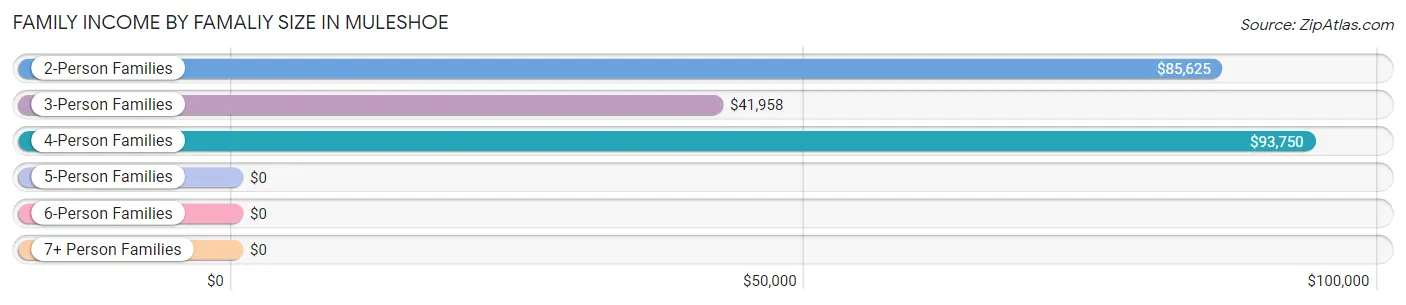
| Income Bracket | # Families | Median Income |
| 2-Person Families | 582 (56.0%) | $85,625 |
| 3-Person Families | 94 (9.0%) | $41,958 |
| 4-Person Families | 278 (26.8%) | $93,750 |
| 5-Person Families | 0 (0.0%) | $0 |
| 6-Person Families | 8 (0.8%) | $0 |
| 7+ Person Families | 77 (7.4%) | $0 |
| Total | 1,039 (100.0%) | $86,007 |
Family Income by Number of Earners in Muleshoe
The median family income in Muleshoe is $86,007, with families comprising 2 earners (392) having the highest median family income of $108,165, while families with no earners (135) have the lowest median family income of $20,134, accounting for 37.7% and 13.0% of families, respectively.
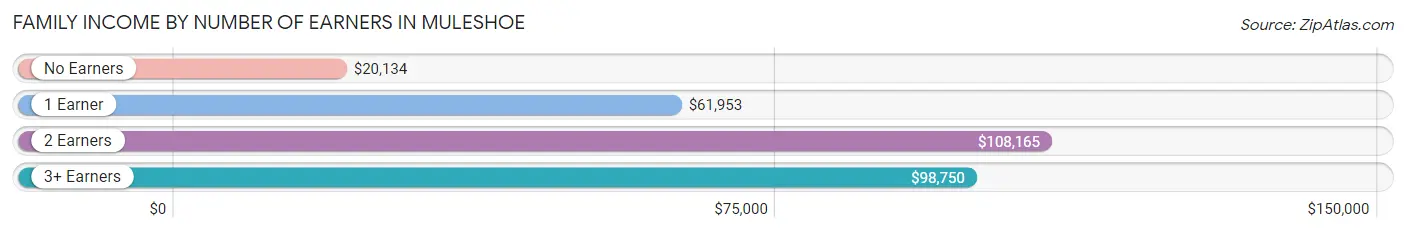
| Number of Earners | # Families | Median Income |
| No Earners | 135 (13.0%) | $20,134 |
| 1 Earner | 409 (39.4%) | $61,953 |
| 2 Earners | 392 (37.7%) | $108,165 |
| 3+ Earners | 103 (9.9%) | $98,750 |
| Total | 1,039 (100.0%) | $86,007 |
Household Income in Muleshoe
Household Income Brackets in Muleshoe
With 350 households falling in the category, the $100,000 to $149,999 income range is the most frequent in Muleshoe, accounting for 23.6% of all households. In contrast, only 46 households (3.1%) fall into the less than $10,000 income bracket, making it the least populous group.
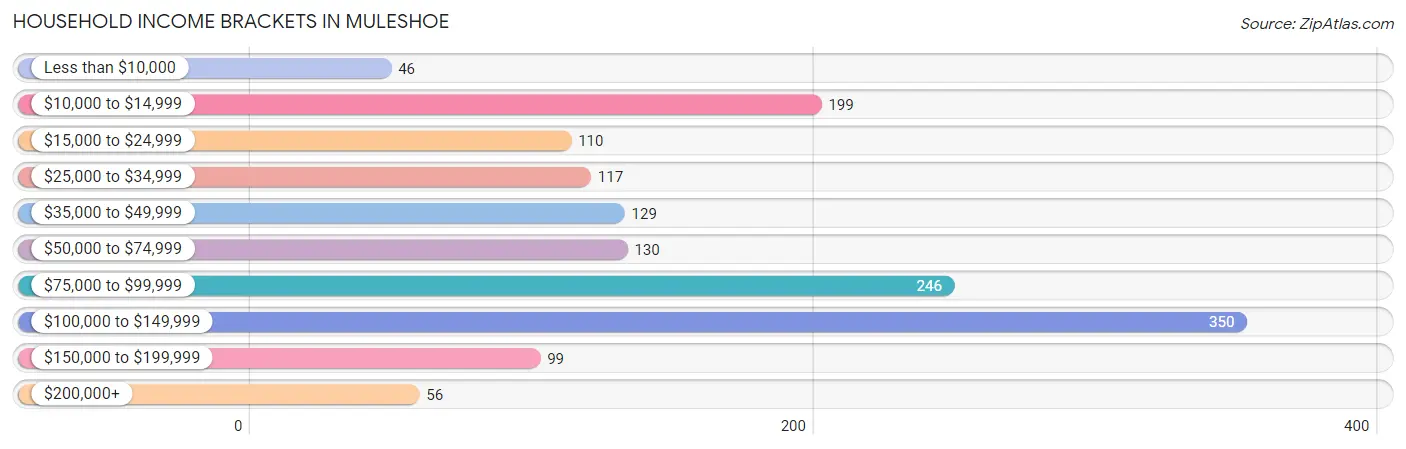
| Income Bracket | # Households | % Households |
| Less than $10,000 | 46 | 3.1% |
| $10,000 to $14,999 | 199 | 13.4% |
| $15,000 to $24,999 | 110 | 7.4% |
| $25,000 to $34,999 | 117 | 7.9% |
| $35,000 to $49,999 | 129 | 8.7% |
| $50,000 to $74,999 | 130 | 8.8% |
| $75,000 to $99,999 | 246 | 16.6% |
| $100,000 to $149,999 | 350 | 23.6% |
| $150,000 to $199,999 | 99 | 6.7% |
| $200,000+ | 56 | 3.8% |
Household Income by Householder Age in Muleshoe
The median household income in Muleshoe is $76,618, with the highest median household income of $107,813 found in the 25 to 44 years age bracket for the primary householder. A total of 468 households (31.6%) fall into this category. Meanwhile, the 15 to 24 years age bracket for the primary householder has the lowest median household income of $0, with 45 households (3.0%) in this group.
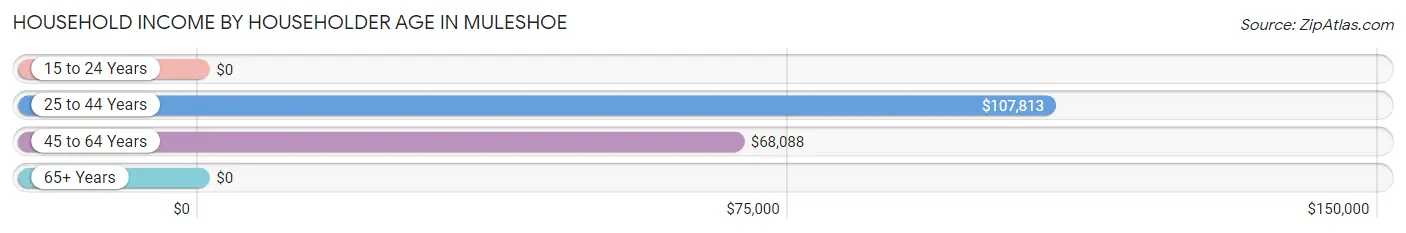
| Income Bracket | # Households | Median Income |
| 15 to 24 Years | 45 (3.0%) | $0 |
| 25 to 44 Years | 468 (31.6%) | $107,813 |
| 45 to 64 Years | 546 (36.8%) | $68,088 |
| 65+ Years | 423 (28.5%) | $0 |
| Total | 1,482 (100.0%) | $76,618 |
Poverty in Muleshoe
Income Below Poverty by Sex and Age in Muleshoe
With 16.4% poverty level for males and 9.5% for females among the residents of Muleshoe, 6 to 11 year old males and 75 year old and over females are the most vulnerable to poverty, with 73 males (100.0%) and 80 females (49.4%) in their respective age groups living below the poverty level.
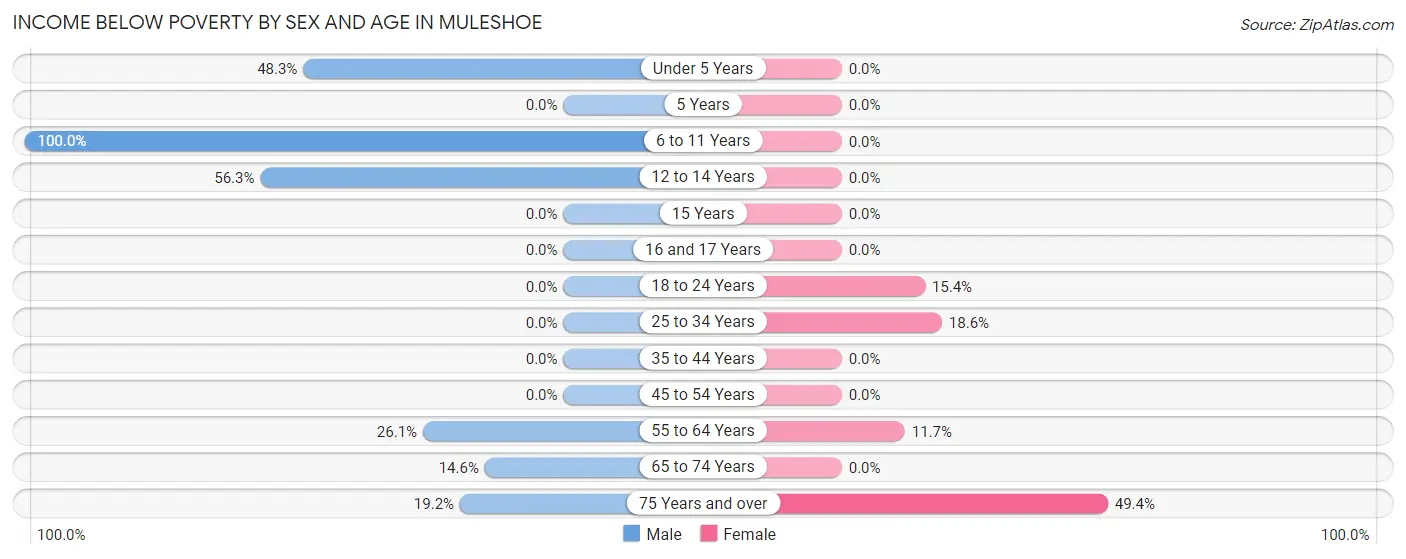
| Age Bracket | Male | Female |
| Under 5 Years | 99 (48.3%) | 0 (0.0%) |
| 5 Years | 0 (0.0%) | 0 (0.0%) |
| 6 to 11 Years | 73 (100.0%) | 0 (0.0%) |
| 12 to 14 Years | 72 (56.2%) | 0 (0.0%) |
| 15 Years | 0 (0.0%) | 0 (0.0%) |
| 16 and 17 Years | 0 (0.0%) | 0 (0.0%) |
| 18 to 24 Years | 0 (0.0%) | 52 (15.4%) |
| 25 to 34 Years | 0 (0.0%) | 105 (18.6%) |
| 35 to 44 Years | 0 (0.0%) | 0 (0.0%) |
| 45 to 54 Years | 0 (0.0%) | 0 (0.0%) |
| 55 to 64 Years | 67 (26.1%) | 55 (11.7%) |
| 65 to 74 Years | 27 (14.6%) | 0 (0.0%) |
| 75 Years and over | 24 (19.2%) | 80 (49.4%) |
| Total | 362 (16.4%) | 292 (9.5%) |
Income Above Poverty by Sex and Age in Muleshoe
According to the poverty statistics in Muleshoe, males aged 5 years and females aged under 5 years are the age groups that are most secure financially, with 100.0% of males and 100.0% of females in these age groups living above the poverty line.
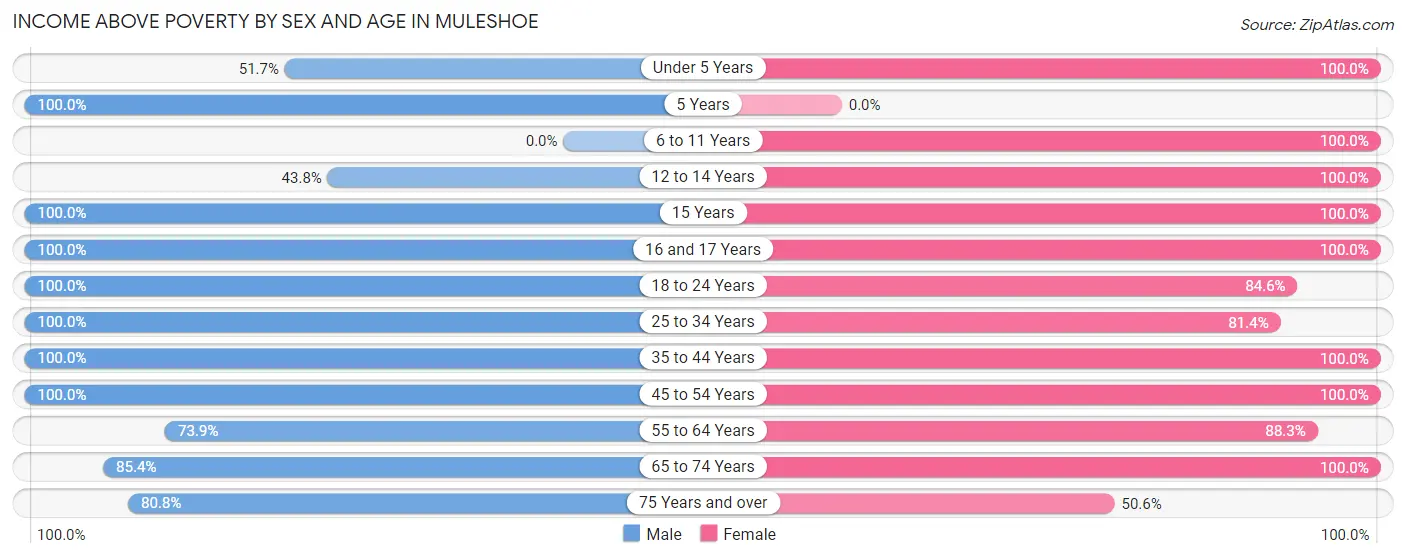
| Age Bracket | Male | Female |
| Under 5 Years | 106 (51.7%) | 348 (100.0%) |
| 5 Years | 38 (100.0%) | 0 (0.0%) |
| 6 to 11 Years | 0 (0.0%) | 381 (100.0%) |
| 12 to 14 Years | 56 (43.8%) | 51 (100.0%) |
| 15 Years | 49 (100.0%) | 14 (100.0%) |
| 16 and 17 Years | 5 (100.0%) | 144 (100.0%) |
| 18 to 24 Years | 181 (100.0%) | 285 (84.6%) |
| 25 to 34 Years | 582 (100.0%) | 460 (81.4%) |
| 35 to 44 Years | 286 (100.0%) | 249 (100.0%) |
| 45 to 54 Years | 91 (100.0%) | 199 (100.0%) |
| 55 to 64 Years | 190 (73.9%) | 415 (88.3%) |
| 65 to 74 Years | 158 (85.4%) | 168 (100.0%) |
| 75 Years and over | 101 (80.8%) | 82 (50.6%) |
| Total | 1,843 (83.6%) | 2,796 (90.5%) |
Income Below Poverty Among Married-Couple Families in Muleshoe
The poverty statistics for married-couple families in Muleshoe show that 4.1% or 27 of the total 660 families live below the poverty line. Families with no children have the highest poverty rate of 6.4%, comprising of 27 families. On the other hand, families with 1 or 2 children have the lowest poverty rate of 0.0%, which includes 0 families.
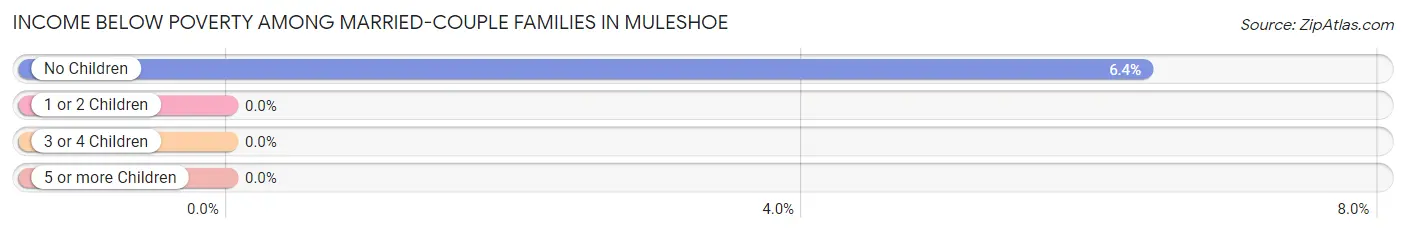
| Children | Above Poverty | Below Poverty |
| No Children | 397 (93.6%) | 27 (6.4%) |
| 1 or 2 Children | 236 (100.0%) | 0 (0.0%) |
| 3 or 4 Children | 0 (0.0%) | 0 (0.0%) |
| 5 or more Children | 0 (0.0%) | 0 (0.0%) |
| Total | 633 (95.9%) | 27 (4.1%) |
Income Below Poverty Among Single-Parent Households in Muleshoe
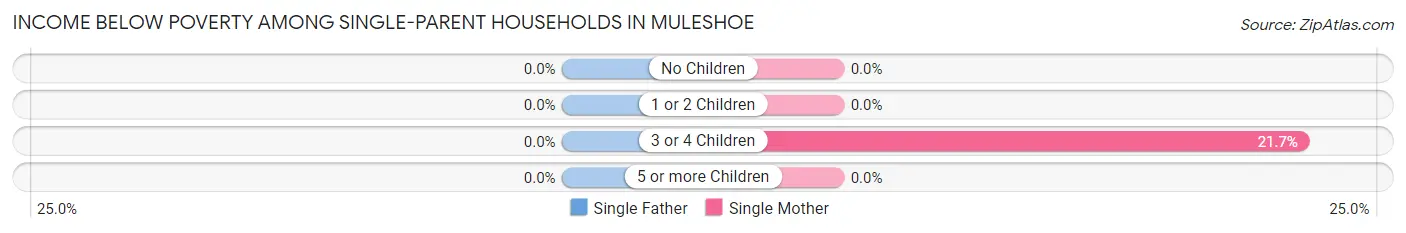
| Children | Single Father | Single Mother |
| No Children | 0 (0.0%) | 0 (0.0%) |
| 1 or 2 Children | 0 (0.0%) | 0 (0.0%) |
| 3 or 4 Children | 0 (0.0%) | 23 (21.7%) |
| 5 or more Children | 0 (0.0%) | 0 (0.0%) |
| Total | 0 (0.0%) | 23 (8.5%) |
Income Below Poverty Among Married-Couple vs Single-Parent Households in Muleshoe
The poverty data for Muleshoe shows that 27 of the married-couple family households (4.1%) and 23 of the single-parent households (6.1%) are living below the poverty level. Within the married-couple family households, those with no children have the highest poverty rate, with 27 households (6.4%) falling below the poverty line. Among the single-parent households, those with 3 or 4 children have the highest poverty rate, with 23 household (21.7%) living below poverty.
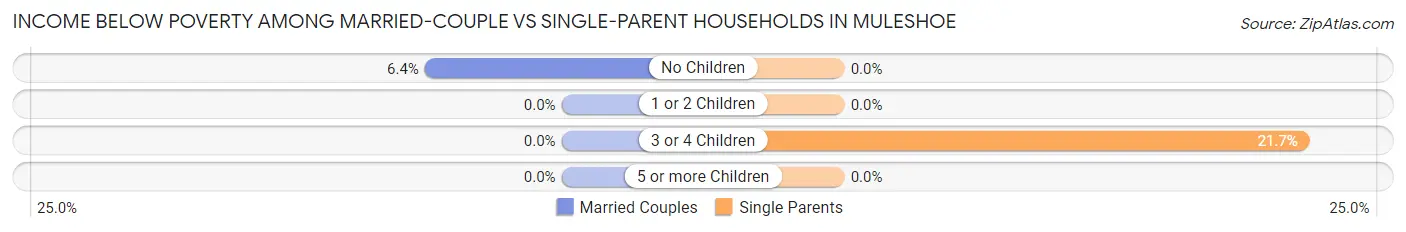
| Children | Married-Couple Families | Single-Parent Households |
| No Children | 27 (6.4%) | 0 (0.0%) |
| 1 or 2 Children | 0 (0.0%) | 0 (0.0%) |
| 3 or 4 Children | 0 (0.0%) | 23 (21.7%) |
| 5 or more Children | 0 (0.0%) | 0 (0.0%) |
| Total | 27 (4.1%) | 23 (6.1%) |
Race in Muleshoe
The most populous races in Muleshoe are White / Caucasian (4,356 | 79.0%), Hispanic or Latino (4,005 | 72.6%), and Some other Race (887 | 16.1%).
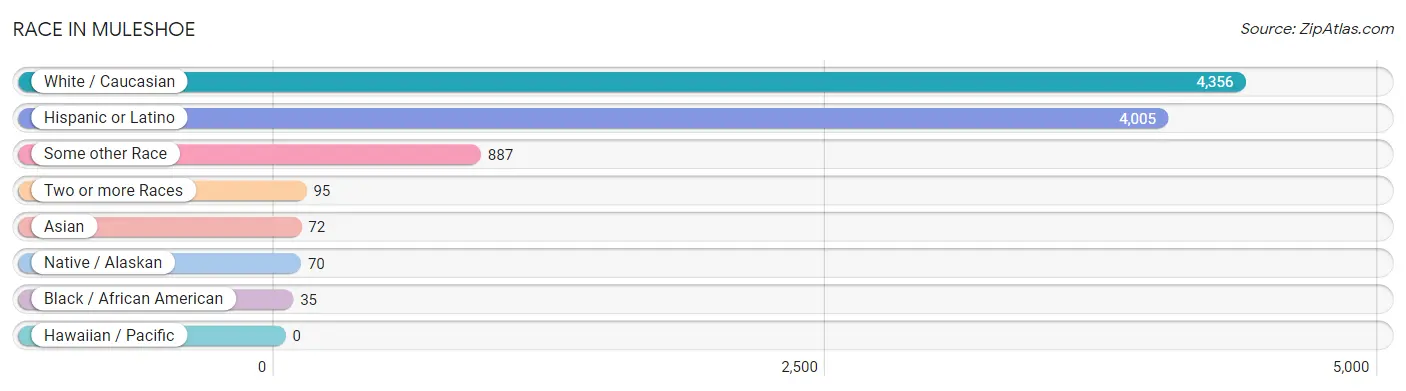
| Race | # Population | % Population |
| Asian | 72 | 1.3% |
| Black / African American | 35 | 0.6% |
| Hawaiian / Pacific | 0 | 0.0% |
| Hispanic or Latino | 4,005 | 72.6% |
| Native / Alaskan | 70 | 1.3% |
| White / Caucasian | 4,356 | 79.0% |
| Two or more Races | 95 | 1.7% |
| Some other Race | 887 | 16.1% |
| Total | 5,515 | 100.0% |
Ancestry in Muleshoe
The most populous ancestries reported in Muleshoe are Mexican (3,719 | 67.4%), Central American (267 | 4.8%), Guatemalan (267 | 4.8%), American (213 | 3.9%), and English (178 | 3.2%), together accounting for 84.2% of all Muleshoe residents.
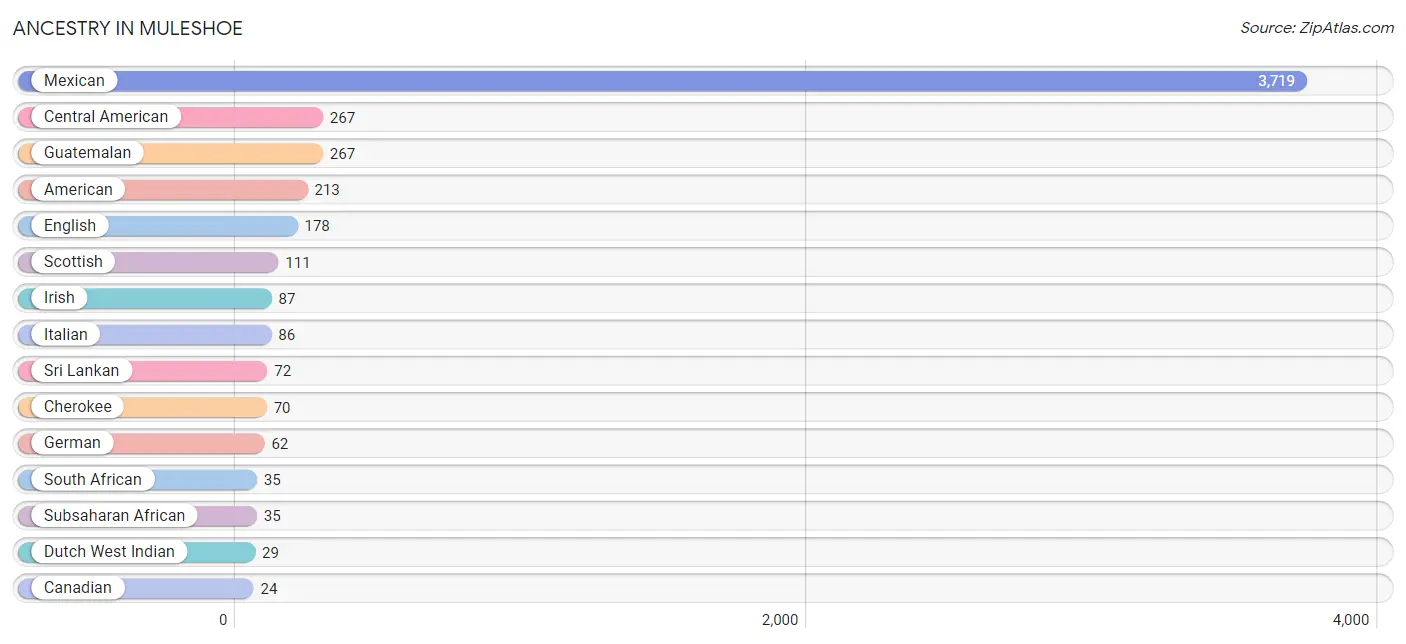
| Ancestry | # Population | % Population |
| American | 213 | 3.9% |
| Canadian | 24 | 0.4% |
| Central American | 267 | 4.8% |
| Cherokee | 70 | 1.3% |
| Cuban | 13 | 0.2% |
| Czech | 2 | 0.0% |
| Dutch West Indian | 29 | 0.5% |
| Eastern European | 8 | 0.2% |
| English | 178 | 3.2% |
| European | 8 | 0.2% |
| French | 8 | 0.2% |
| German | 62 | 1.1% |
| Guatemalan | 267 | 4.8% |
| Irish | 87 | 1.6% |
| Italian | 86 | 1.6% |
| Mexican | 3,719 | 67.4% |
| Puerto Rican | 6 | 0.1% |
| Scottish | 111 | 2.0% |
| South African | 35 | 0.6% |
| Sri Lankan | 72 | 1.3% |
| Subsaharan African | 35 | 0.6% |
| Swedish | 6 | 0.1% |
| Trinidadian and Tobagonian | 6 | 0.1% | View All 23 Rows |
Immigrants in Muleshoe
The most numerous immigrant groups reported in Muleshoe came from Central America (1,473 | 26.7%), Latin America (1,473 | 26.7%), Mexico (1,305 | 23.7%), Guatemala (168 | 3.0%), and Asia (72 | 1.3%), together accounting for 81.4% of all Muleshoe residents.
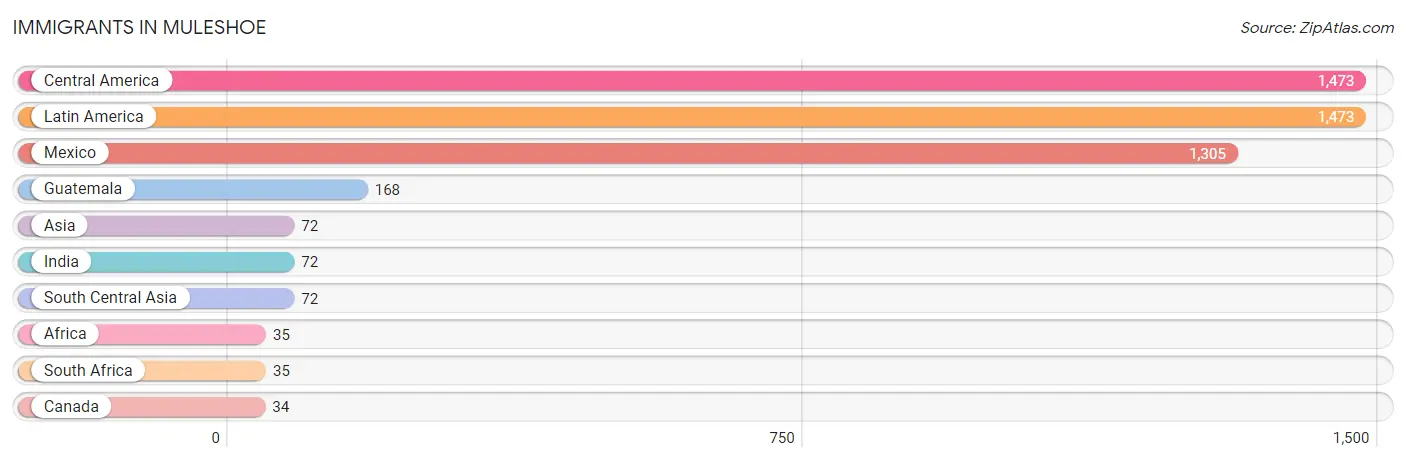
| Immigration Origin | # Population | % Population |
| Africa | 35 | 0.6% |
| Asia | 72 | 1.3% |
| Canada | 34 | 0.6% |
| Central America | 1,473 | 26.7% |
| Guatemala | 168 | 3.0% |
| India | 72 | 1.3% |
| Latin America | 1,473 | 26.7% |
| Mexico | 1,305 | 23.7% |
| South Africa | 35 | 0.6% |
| South Central Asia | 72 | 1.3% | View All 10 Rows |
Sex and Age in Muleshoe
Sex and Age in Muleshoe
The most populous age groups in Muleshoe are 25 to 29 Years (404 | 17.3%) for men and 60 to 64 Years (411 | 12.9%) for women.
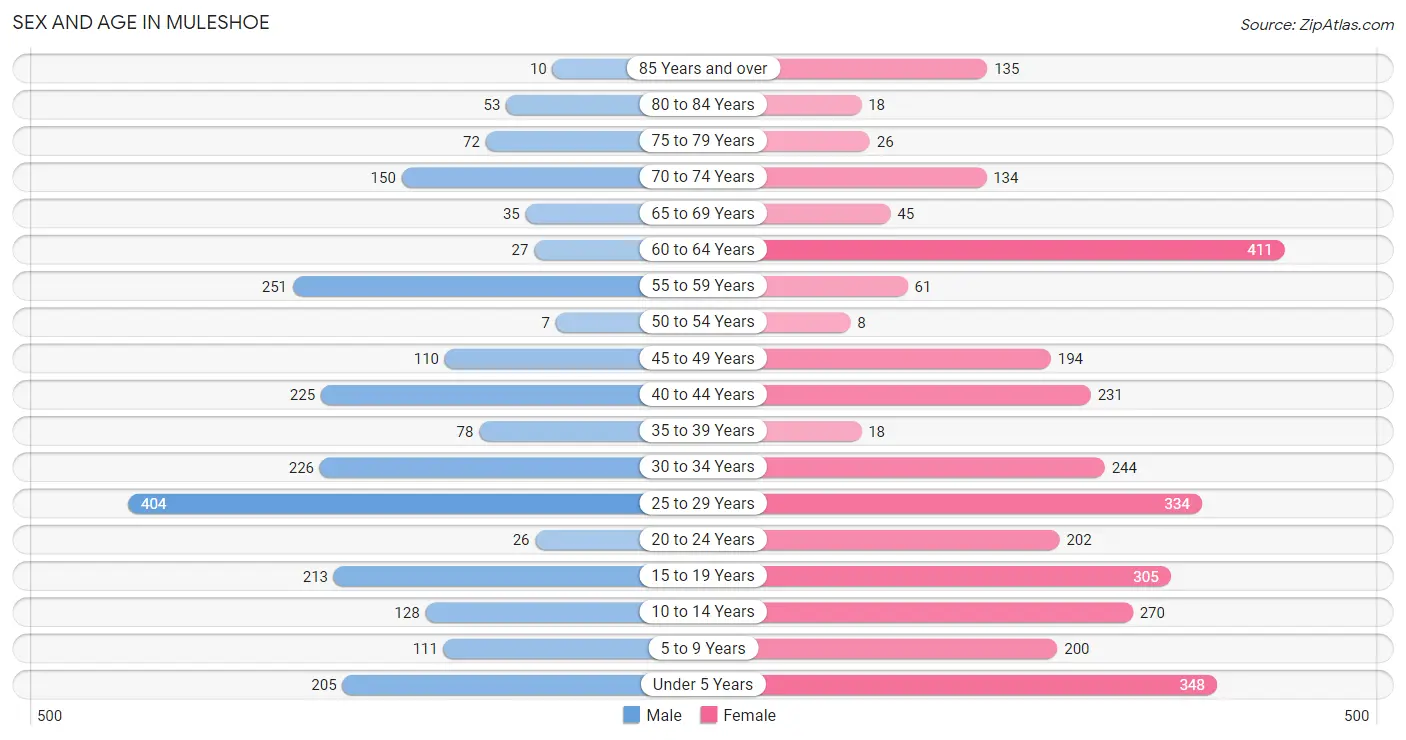
| Age Bracket | Male | Female |
| Under 5 Years | 205 (8.8%) | 348 (10.9%) |
| 5 to 9 Years | 111 (4.8%) | 200 (6.3%) |
| 10 to 14 Years | 128 (5.5%) | 270 (8.5%) |
| 15 to 19 Years | 213 (9.1%) | 305 (9.6%) |
| 20 to 24 Years | 26 (1.1%) | 202 (6.3%) |
| 25 to 29 Years | 404 (17.3%) | 334 (10.5%) |
| 30 to 34 Years | 226 (9.7%) | 244 (7.7%) |
| 35 to 39 Years | 78 (3.4%) | 18 (0.6%) |
| 40 to 44 Years | 225 (9.7%) | 231 (7.3%) |
| 45 to 49 Years | 110 (4.7%) | 194 (6.1%) |
| 50 to 54 Years | 7 (0.3%) | 8 (0.3%) |
| 55 to 59 Years | 251 (10.8%) | 61 (1.9%) |
| 60 to 64 Years | 27 (1.2%) | 411 (12.9%) |
| 65 to 69 Years | 35 (1.5%) | 45 (1.4%) |
| 70 to 74 Years | 150 (6.4%) | 134 (4.2%) |
| 75 to 79 Years | 72 (3.1%) | 26 (0.8%) |
| 80 to 84 Years | 53 (2.3%) | 18 (0.6%) |
| 85 Years and over | 10 (0.4%) | 135 (4.2%) |
| Total | 2,331 (100.0%) | 3,184 (100.0%) |
Families and Households in Muleshoe
Median Family Size in Muleshoe
The median family size in Muleshoe is 4.28 persons per family, with single female/mother families (271 | 26.1%) accounting for the largest median family size of 8.43 persons per family. On the other hand, married-couple families (660 | 63.5%) represent the smallest median family size with 2.78 persons per family.
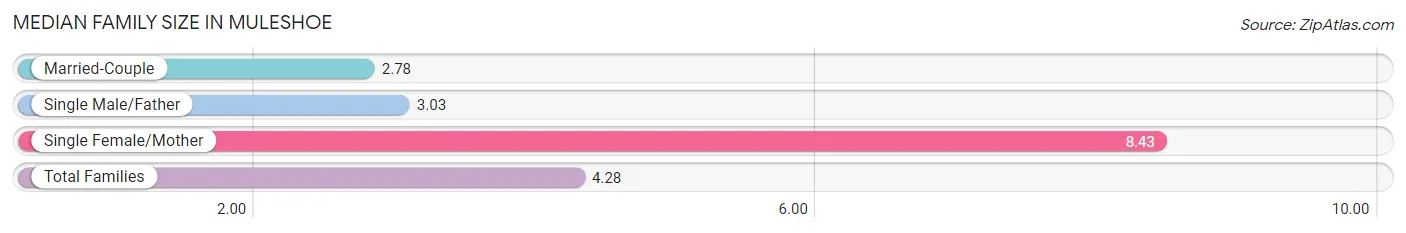
| Family Type | # Families | Family Size |
| Married-Couple | 660 (63.5%) | 2.78 |
| Single Male/Father | 108 (10.4%) | 3.03 |
| Single Female/Mother | 271 (26.1%) | 8.43 |
| Total Families | 1,039 (100.0%) | 4.28 |
Median Household Size in Muleshoe
The median household size in Muleshoe is 3.60 persons per household, with single female/mother households (271 | 18.3%) accounting for the largest median household size of 9.1 persons per household. non-family households (443 | 29.9%) represent the smallest median household size with 1.15 persons per household.
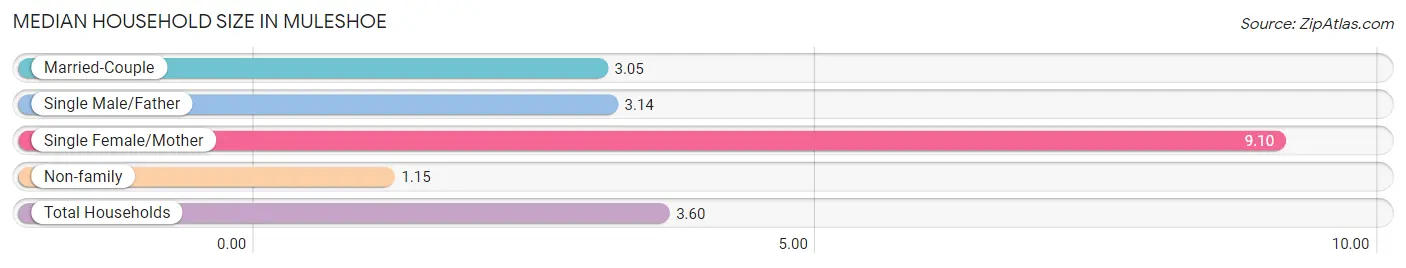
| Household Type | # Households | Household Size |
| Married-Couple | 660 (44.5%) | 3.05 |
| Single Male/Father | 108 (7.3%) | 3.14 |
| Single Female/Mother | 271 (18.3%) | 9.10 |
| Non-family | 443 (29.9%) | 1.15 |
| Total Households | 1,482 (100.0%) | 3.60 |
Household Size by Marriage Status in Muleshoe
Out of a total of 1,482 households in Muleshoe, 1,039 (70.1%) are family households, while 443 (29.9%) are nonfamily households. The most numerous type of family households are 2-person households, comprising 511, and the most common type of nonfamily households are 1-person households, comprising 393.
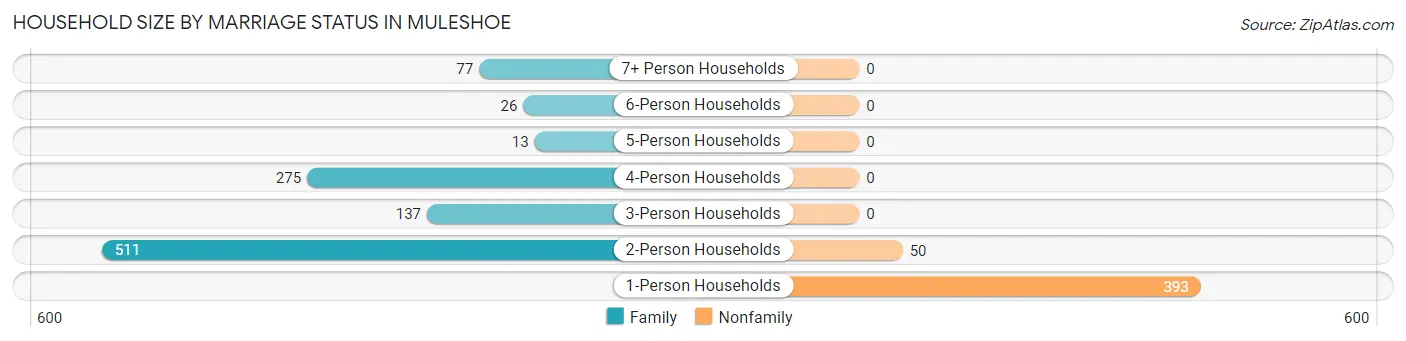
| Household Size | Family Households | Nonfamily Households |
| 1-Person Households | - | 393 (26.5%) |
| 2-Person Households | 511 (34.5%) | 50 (3.4%) |
| 3-Person Households | 137 (9.2%) | 0 (0.0%) |
| 4-Person Households | 275 (18.6%) | 0 (0.0%) |
| 5-Person Households | 13 (0.9%) | 0 (0.0%) |
| 6-Person Households | 26 (1.8%) | 0 (0.0%) |
| 7+ Person Households | 77 (5.2%) | 0 (0.0%) |
| Total | 1,039 (70.1%) | 443 (29.9%) |
Female Fertility in Muleshoe
Fertility by Age in Muleshoe
Average fertility rate in Muleshoe is 54.0 births per 1,000 women. Women in the age bracket of 20 to 34 years have the highest fertility rate with 106.0 births per 1,000 women. Women in the age bracket of 20 to 34 years acount for 100.0% of all women with births.
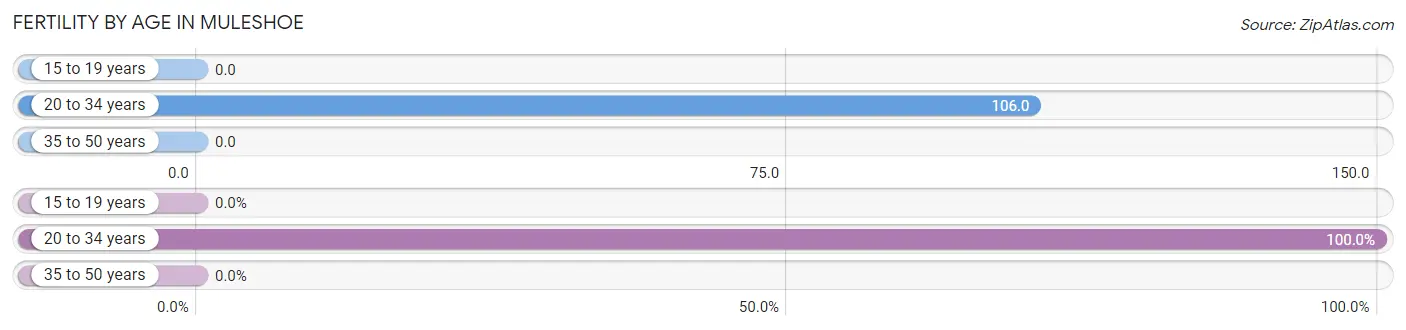
| Age Bracket | Women with Births | Births / 1,000 Women |
| 15 to 19 years | 0 (0.0%) | 0.0 |
| 20 to 34 years | 83 (100.0%) | 106.0 |
| 35 to 50 years | 0 (0.0%) | 0.0 |
| Total | 83 (100.0%) | 54.0 |
Fertility by Age by Marriage Status in Muleshoe
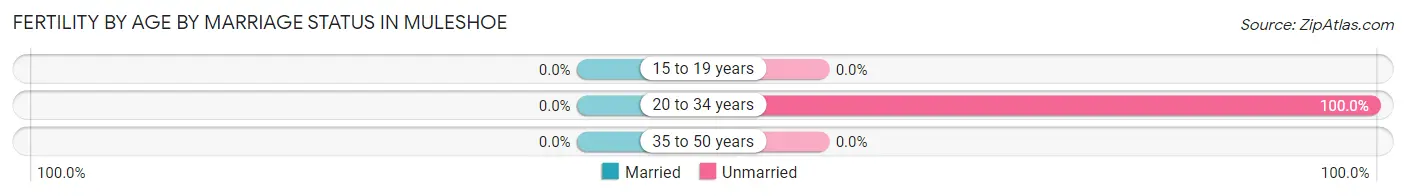
| Age Bracket | Married | Unmarried |
| 15 to 19 years | 0 (0.0%) | 0 (0.0%) |
| 20 to 34 years | 0 (0.0%) | 83 (100.0%) |
| 35 to 50 years | 0 (0.0%) | 0 (0.0%) |
| Total | 0 (0.0%) | 83 (100.0%) |
Fertility by Education in Muleshoe
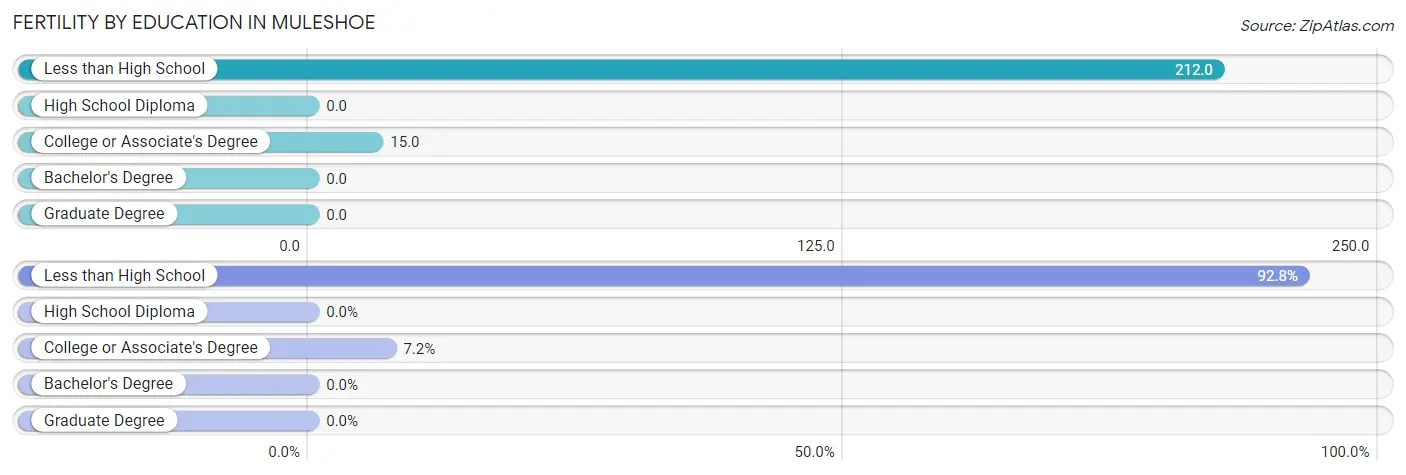
| Educational Attainment | Women with Births | Births / 1,000 Women |
| Less than High School | 77 (92.8%) | 212.0 |
| High School Diploma | 0 (0.0%) | 0.0 |
| College or Associate's Degree | 6 (7.2%) | 15.0 |
| Bachelor's Degree | 0 (0.0%) | 0.0 |
| Graduate Degree | 0 (0.0%) | 0.0 |
| Total | 83 (100.0%) | 54.0 |
Fertility by Education by Marriage Status in Muleshoe
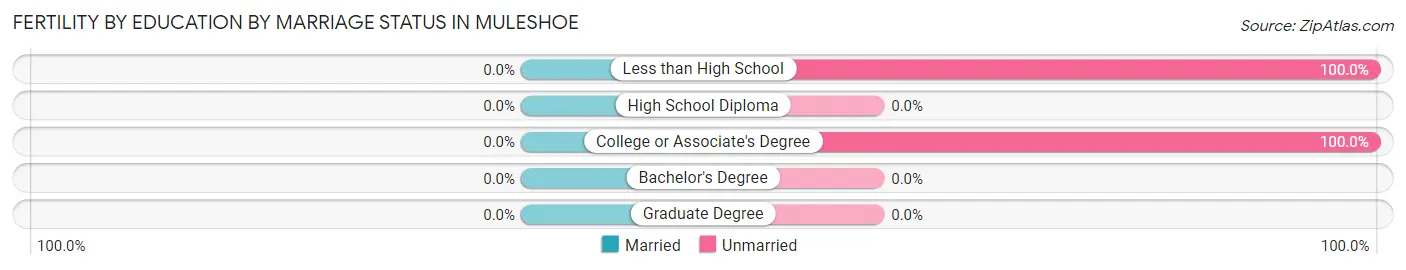
| Educational Attainment | Married | Unmarried |
| Less than High School | 0 (0.0%) | 77 (100.0%) |
| High School Diploma | 0 (0.0%) | 0 (0.0%) |
| College or Associate's Degree | 0 (0.0%) | 6 (100.0%) |
| Bachelor's Degree | 0 (0.0%) | 0 (0.0%) |
| Graduate Degree | 0 (0.0%) | 0 (0.0%) |
| Total | 0 (0.0%) | 83 (100.0%) |
Employment Characteristics in Muleshoe
Employment by Class of Employer in Muleshoe
Among the 2,014 employed individuals in Muleshoe, private company employees (1,602 | 79.5%), self-employed (not incorporated) (155 | 7.7%), and self-employed (incorporated) (134 | 6.7%) make up the most common classes of employment.
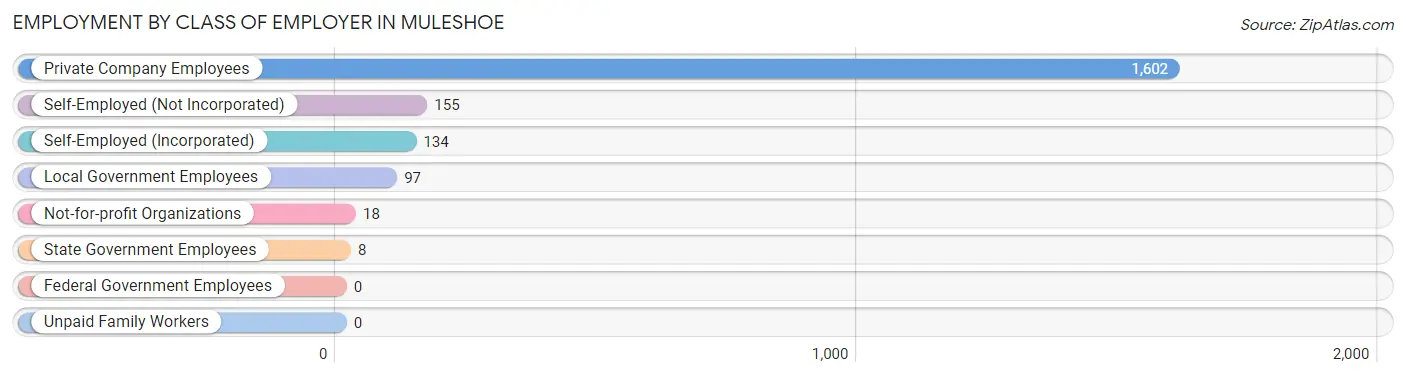
| Employer Class | # Employees | % Employees |
| Private Company Employees | 1,602 | 79.5% |
| Self-Employed (Incorporated) | 134 | 6.7% |
| Self-Employed (Not Incorporated) | 155 | 7.7% |
| Not-for-profit Organizations | 18 | 0.9% |
| Local Government Employees | 97 | 4.8% |
| State Government Employees | 8 | 0.4% |
| Federal Government Employees | 0 | 0.0% |
| Unpaid Family Workers | 0 | 0.0% |
| Total | 2,014 | 100.0% |
Employment Status by Age in Muleshoe
According to the labor force statistics for Muleshoe, out of the total population over 16 years of age (4,190), 53.6% or 2,246 individuals are in the labor force, with 2.9% or 65 of them unemployed. The age group with the highest labor force participation rate is 25 to 29 years, with 92.1% or 680 individuals in the labor force. Within the labor force, the 20 to 24 years age range has the highest percentage of unemployed individuals, with 29.4% or 52 of them being unemployed.
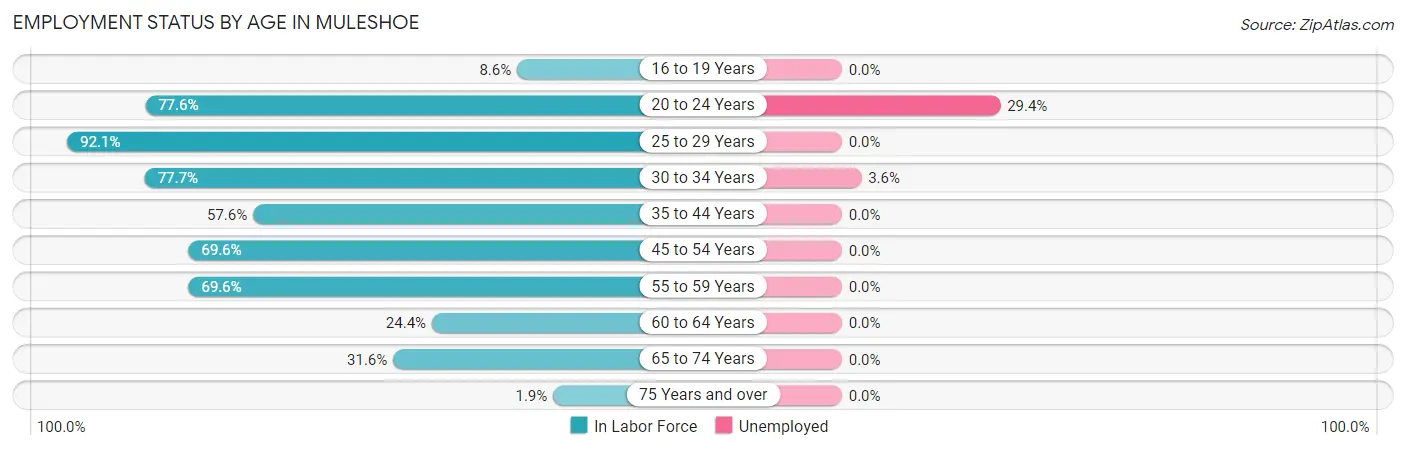
| Age Bracket | In Labor Force | Unemployed |
| 16 to 19 Years | 39 (8.6%) | 0 (0.0%) |
| 20 to 24 Years | 177 (77.6%) | 52 (29.4%) |
| 25 to 29 Years | 680 (92.1%) | 0 (0.0%) |
| 30 to 34 Years | 365 (77.7%) | 13 (3.6%) |
| 35 to 44 Years | 318 (57.6%) | 0 (0.0%) |
| 45 to 54 Years | 222 (69.6%) | 0 (0.0%) |
| 55 to 59 Years | 217 (69.6%) | 0 (0.0%) |
| 60 to 64 Years | 107 (24.4%) | 0 (0.0%) |
| 65 to 74 Years | 115 (31.6%) | 0 (0.0%) |
| 75 Years and over | 6 (1.9%) | 0 (0.0%) |
| Total | 2,246 (53.6%) | 65 (2.9%) |
Employment Status by Educational Attainment in Muleshoe
According to labor force statistics for Muleshoe, 67.5% of individuals (1,910) out of the total population between 25 and 64 years of age (2,829) are in the labor force, with 0.7% or 13 of them being unemployed. The group with the highest labor force participation rate are those with the educational attainment of college / associate degree, with 82.8% or 534 individuals in the labor force. Within the labor force, individuals with high school diploma education have the highest percentage of unemployment, with 1.6% or 13 of them being unemployed.
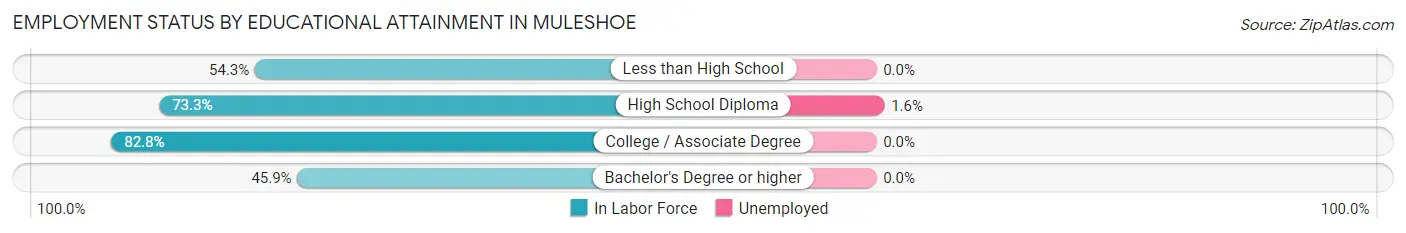
| Educational Attainment | In Labor Force | Unemployed |
| Less than High School | 473 (54.3%) | 0 (0.0%) |
| High School Diploma | 801 (73.3%) | 17 (1.6%) |
| College / Associate Degree | 534 (82.8%) | 0 (0.0%) |
| Bachelor's Degree or higher | 101 (45.9%) | 0 (0.0%) |
| Total | 1,910 (67.5%) | 20 (0.7%) |
Employment Occupations by Sex in Muleshoe
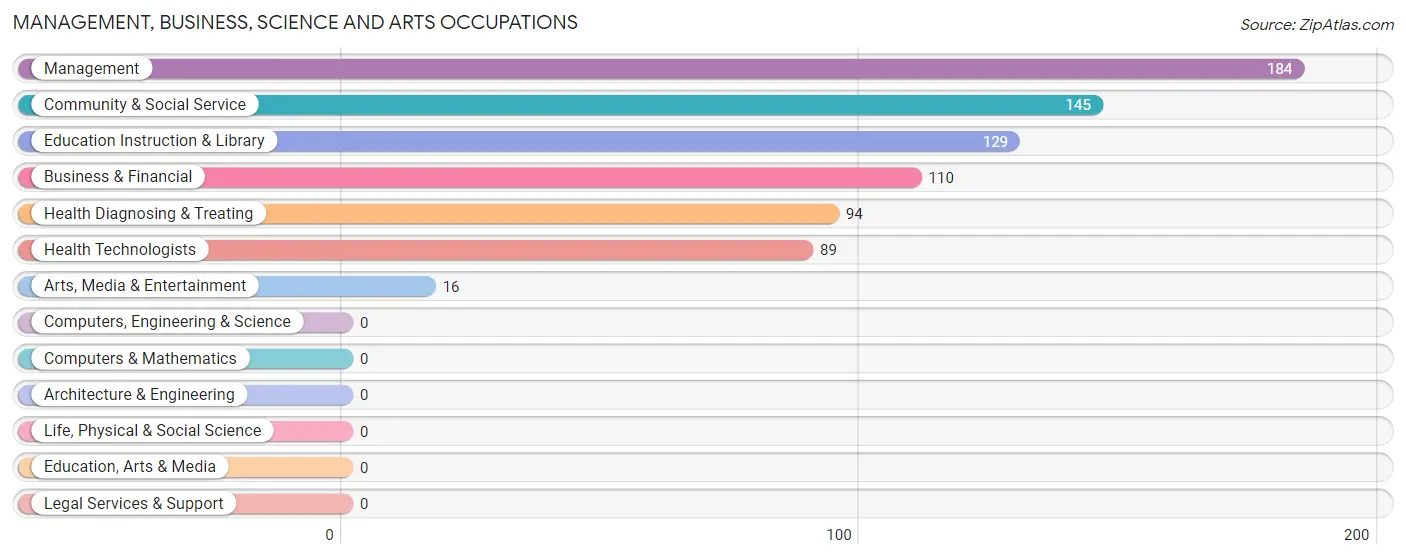
Management, Business, Science and Arts Occupations
The most common Management, Business, Science and Arts occupations in Muleshoe are Management (184 | 8.4%), Community & Social Service (145 | 6.7%), Education Instruction & Library (129 | 5.9%), Business & Financial (110 | 5.0%), and Health Diagnosing & Treating (94 | 4.3%).
Management, Business, Science and Arts Occupations by Sex
Within the Management, Business, Science and Arts occupations in Muleshoe, the most male-oriented occupations are Health Technologists (67.4%), Health Diagnosing & Treating (63.8%), and Business & Financial (58.2%), while the most female-oriented occupations are Arts, Media & Entertainment (100.0%), Community & Social Service (96.6%), and Education Instruction & Library (96.1%).
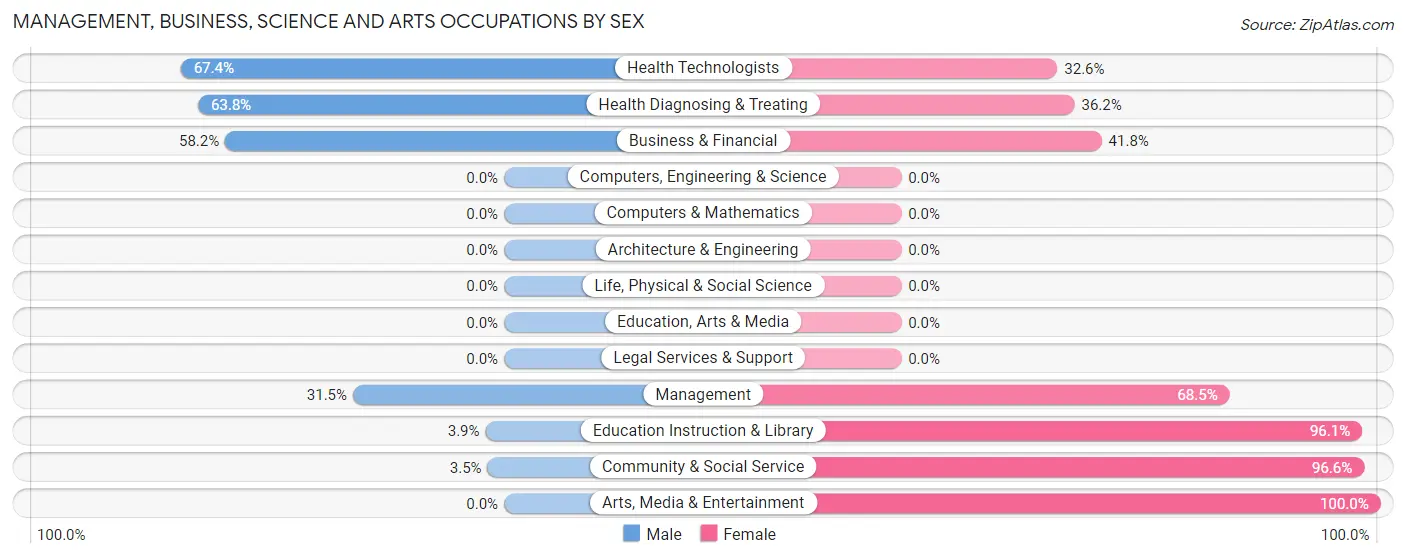
| Occupation | Male | Female |
| Management | 58 (31.5%) | 126 (68.5%) |
| Business & Financial | 64 (58.2%) | 46 (41.8%) |
| Computers, Engineering & Science | 0 (0.0%) | 0 (0.0%) |
| Computers & Mathematics | 0 (0.0%) | 0 (0.0%) |
| Architecture & Engineering | 0 (0.0%) | 0 (0.0%) |
| Life, Physical & Social Science | 0 (0.0%) | 0 (0.0%) |
| Community & Social Service | 5 (3.5%) | 140 (96.6%) |
| Education, Arts & Media | 0 (0.0%) | 0 (0.0%) |
| Legal Services & Support | 0 (0.0%) | 0 (0.0%) |
| Education Instruction & Library | 5 (3.9%) | 124 (96.1%) |
| Arts, Media & Entertainment | 0 (0.0%) | 16 (100.0%) |
| Health Diagnosing & Treating | 60 (63.8%) | 34 (36.2%) |
| Health Technologists | 60 (67.4%) | 29 (32.6%) |
| Total (Category) | 187 (35.1%) | 346 (64.9%) |
| Total (Overall) | 1,226 (56.2%) | 955 (43.8%) |
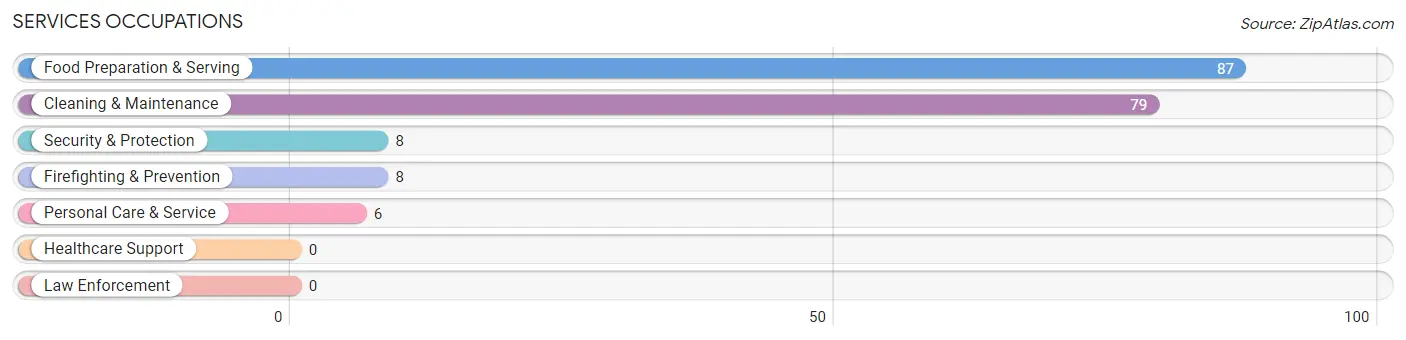
Services Occupations
The most common Services occupations in Muleshoe are Food Preparation & Serving (87 | 4.0%), Cleaning & Maintenance (79 | 3.6%), Security & Protection (8 | 0.4%), Firefighting & Prevention (8 | 0.4%), and Personal Care & Service (6 | 0.3%).
Services Occupations by Sex
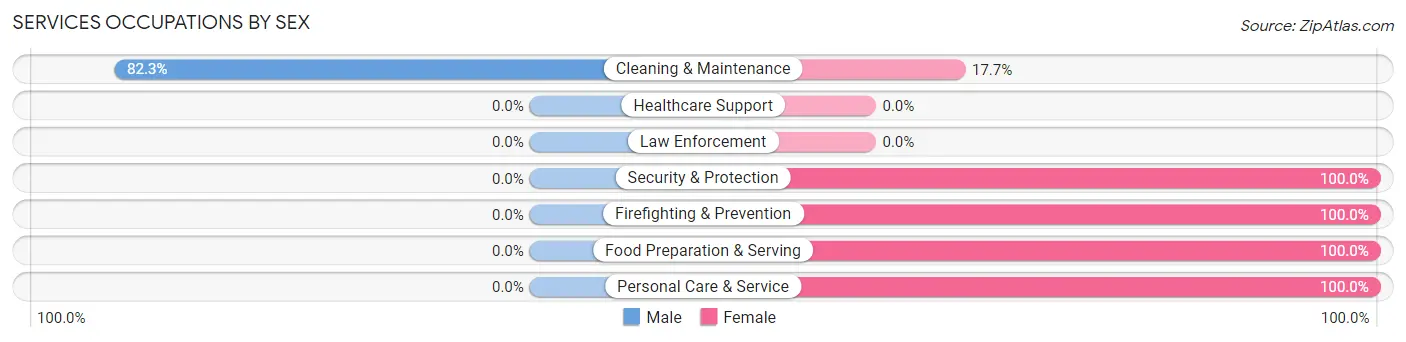
| Occupation | Male | Female |
| Healthcare Support | 0 (0.0%) | 0 (0.0%) |
| Security & Protection | 0 (0.0%) | 8 (100.0%) |
| Firefighting & Prevention | 0 (0.0%) | 8 (100.0%) |
| Law Enforcement | 0 (0.0%) | 0 (0.0%) |
| Food Preparation & Serving | 0 (0.0%) | 87 (100.0%) |
| Cleaning & Maintenance | 65 (82.3%) | 14 (17.7%) |
| Personal Care & Service | 0 (0.0%) | 6 (100.0%) |
| Total (Category) | 65 (36.1%) | 115 (63.9%) |
| Total (Overall) | 1,226 (56.2%) | 955 (43.8%) |
Sales and Office Occupations
The most common Sales and Office occupations in Muleshoe are Sales & Related (350 | 16.1%), and Office & Administration (99 | 4.5%).

Sales and Office Occupations by Sex
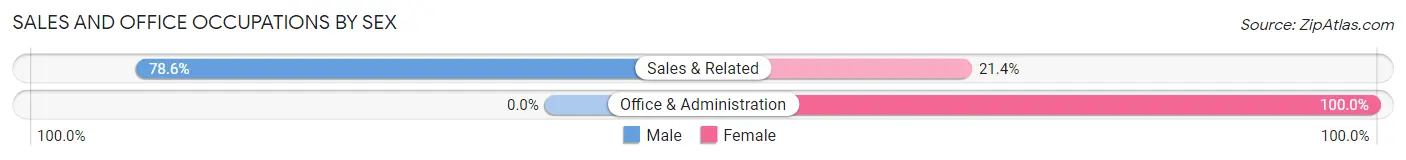
| Occupation | Male | Female |
| Sales & Related | 275 (78.6%) | 75 (21.4%) |
| Office & Administration | 0 (0.0%) | 99 (100.0%) |
| Total (Category) | 275 (61.3%) | 174 (38.8%) |
| Total (Overall) | 1,226 (56.2%) | 955 (43.8%) |
Natural Resources, Construction and Maintenance Occupations
The most common Natural Resources, Construction and Maintenance occupations in Muleshoe are Farming, Fishing & Forestry (98 | 4.5%), Construction & Extraction (83 | 3.8%), and Installation, Maintenance & Repair (9 | 0.4%).
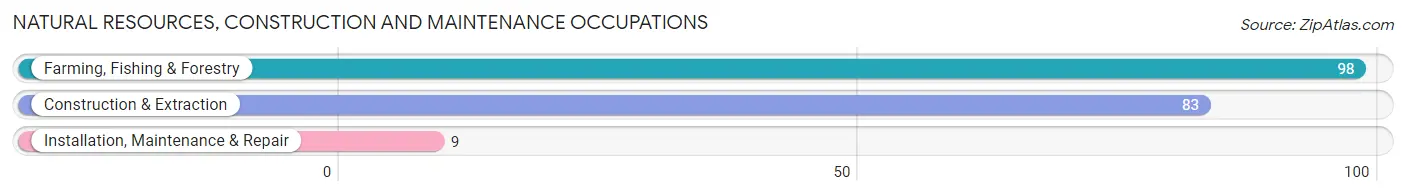
Natural Resources, Construction and Maintenance Occupations by Sex
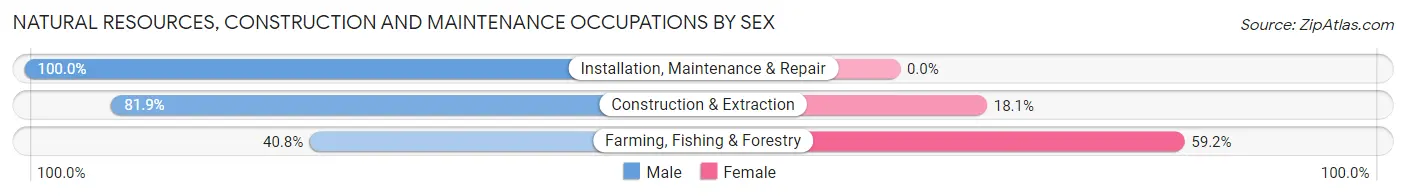
| Occupation | Male | Female |
| Farming, Fishing & Forestry | 40 (40.8%) | 58 (59.2%) |
| Construction & Extraction | 68 (81.9%) | 15 (18.1%) |
| Installation, Maintenance & Repair | 9 (100.0%) | 0 (0.0%) |
| Total (Category) | 117 (61.6%) | 73 (38.4%) |
| Total (Overall) | 1,226 (56.2%) | 955 (43.8%) |
Production, Transportation and Moving Occupations
The most common Production, Transportation and Moving occupations in Muleshoe are Material Moving (437 | 20.0%), Production (276 | 12.7%), and Transportation (116 | 5.3%).
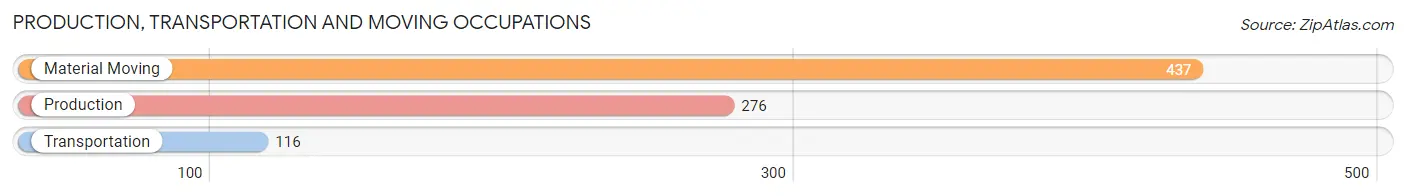
Production, Transportation and Moving Occupations by Sex
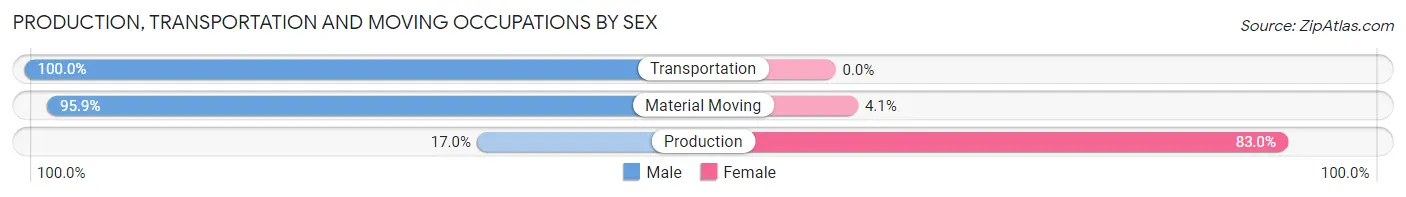
| Occupation | Male | Female |
| Production | 47 (17.0%) | 229 (83.0%) |
| Transportation | 116 (100.0%) | 0 (0.0%) |
| Material Moving | 419 (95.9%) | 18 (4.1%) |
| Total (Category) | 582 (70.2%) | 247 (29.8%) |
| Total (Overall) | 1,226 (56.2%) | 955 (43.8%) |
Employment Industries by Sex in Muleshoe
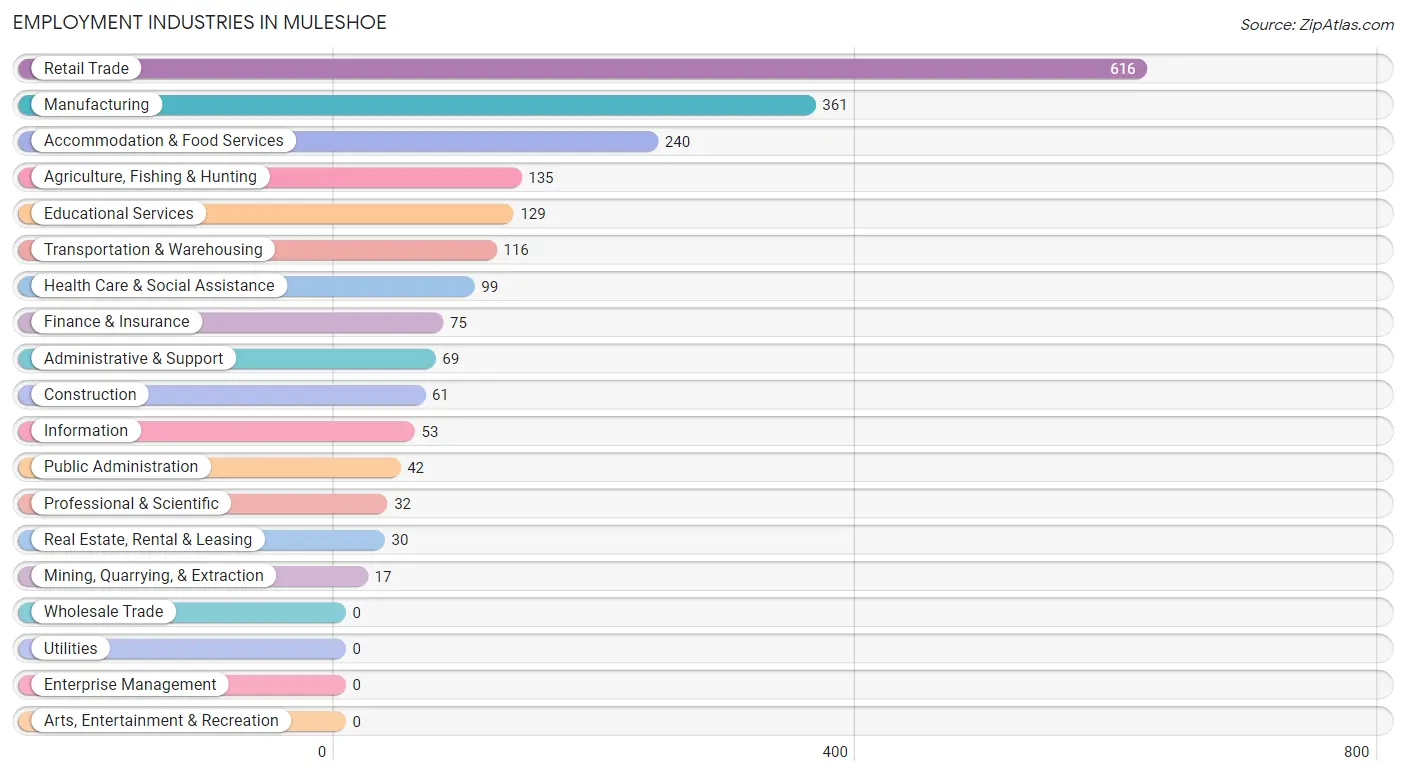
Employment Industries in Muleshoe
The major employment industries in Muleshoe include Retail Trade (616 | 28.2%), Manufacturing (361 | 16.6%), Accommodation & Food Services (240 | 11.0%), Agriculture, Fishing & Hunting (135 | 6.2%), and Educational Services (129 | 5.9%).
Employment Industries by Sex in Muleshoe
The Muleshoe industries that see more men than women are Mining, Quarrying, & Extraction (100.0%), Transportation & Warehousing (100.0%), and Administrative & Support (87.0%), whereas the industries that tend to have a higher number of women are Professional & Scientific (100.0%), Public Administration (100.0%), and Educational Services (96.1%).
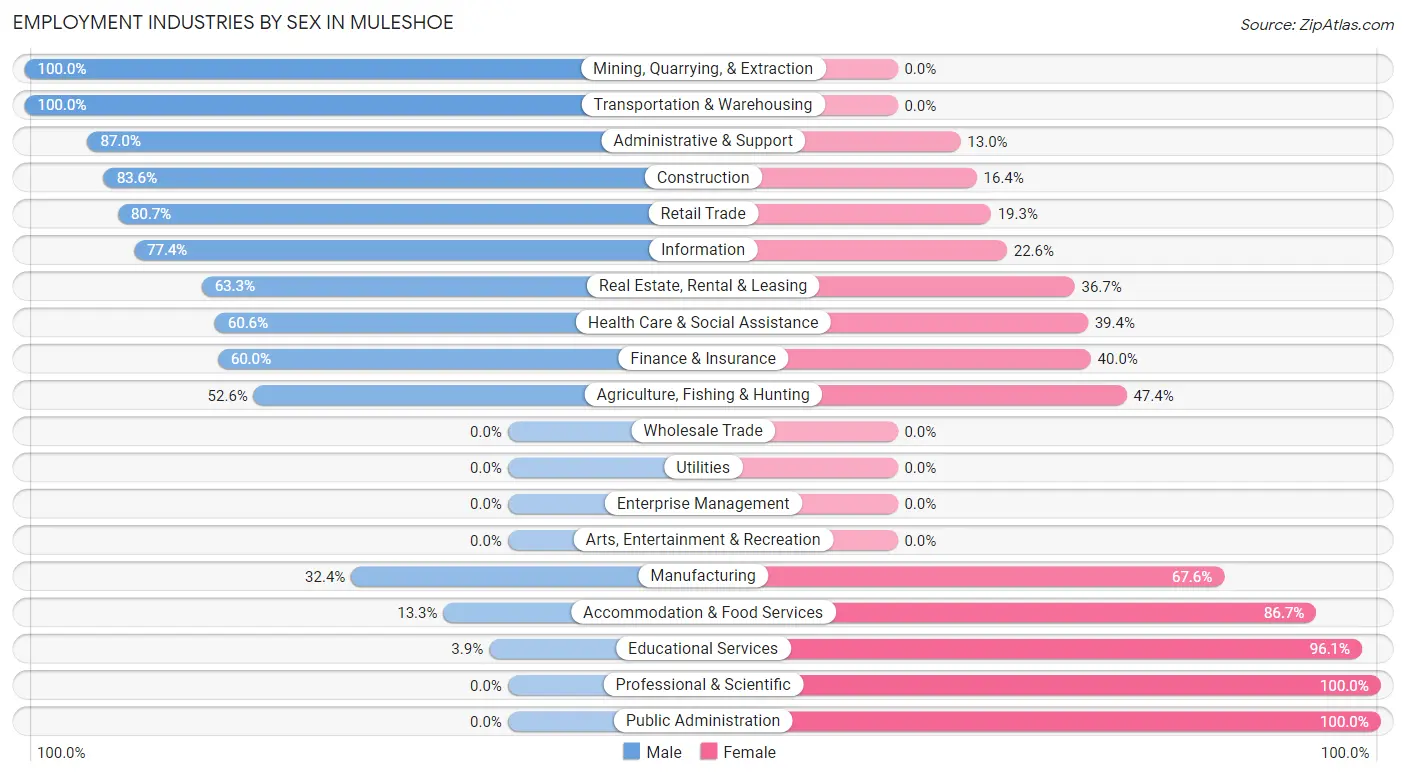
| Industry | Male | Female |
| Agriculture, Fishing & Hunting | 71 (52.6%) | 64 (47.4%) |
| Mining, Quarrying, & Extraction | 17 (100.0%) | 0 (0.0%) |
| Construction | 51 (83.6%) | 10 (16.4%) |
| Manufacturing | 117 (32.4%) | 244 (67.6%) |
| Wholesale Trade | 0 (0.0%) | 0 (0.0%) |
| Retail Trade | 497 (80.7%) | 119 (19.3%) |
| Transportation & Warehousing | 116 (100.0%) | 0 (0.0%) |
| Utilities | 0 (0.0%) | 0 (0.0%) |
| Information | 41 (77.4%) | 12 (22.6%) |
| Finance & Insurance | 45 (60.0%) | 30 (40.0%) |
| Real Estate, Rental & Leasing | 19 (63.3%) | 11 (36.7%) |
| Professional & Scientific | 0 (0.0%) | 32 (100.0%) |
| Enterprise Management | 0 (0.0%) | 0 (0.0%) |
| Administrative & Support | 60 (87.0%) | 9 (13.0%) |
| Educational Services | 5 (3.9%) | 124 (96.1%) |
| Health Care & Social Assistance | 60 (60.6%) | 39 (39.4%) |
| Arts, Entertainment & Recreation | 0 (0.0%) | 0 (0.0%) |
| Accommodation & Food Services | 32 (13.3%) | 208 (86.7%) |
| Public Administration | 0 (0.0%) | 42 (100.0%) |
| Total | 1,226 (56.2%) | 955 (43.8%) |
Education in Muleshoe
School Enrollment in Muleshoe
The most common levels of schooling among the 935 students in Muleshoe are high school (324 | 34.6%), middle school (266 | 28.4%), and kindergarten (165 | 17.6%).
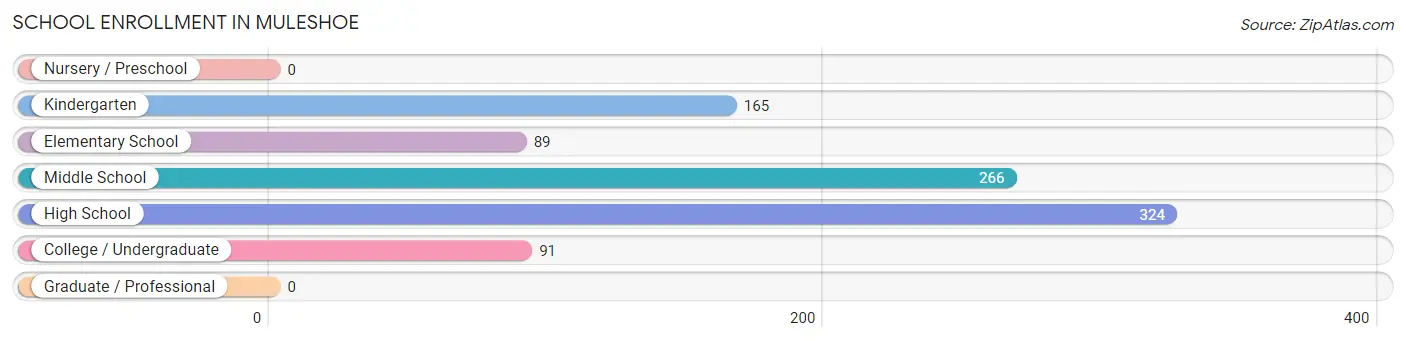
| School Level | # Students | % Students |
| Nursery / Preschool | 0 | 0.0% |
| Kindergarten | 165 | 17.6% |
| Elementary School | 89 | 9.5% |
| Middle School | 266 | 28.4% |
| High School | 324 | 34.6% |
| College / Undergraduate | 91 | 9.7% |
| Graduate / Professional | 0 | 0.0% |
| Total | 935 | 100.0% |
School Enrollment by Age by Funding Source in Muleshoe
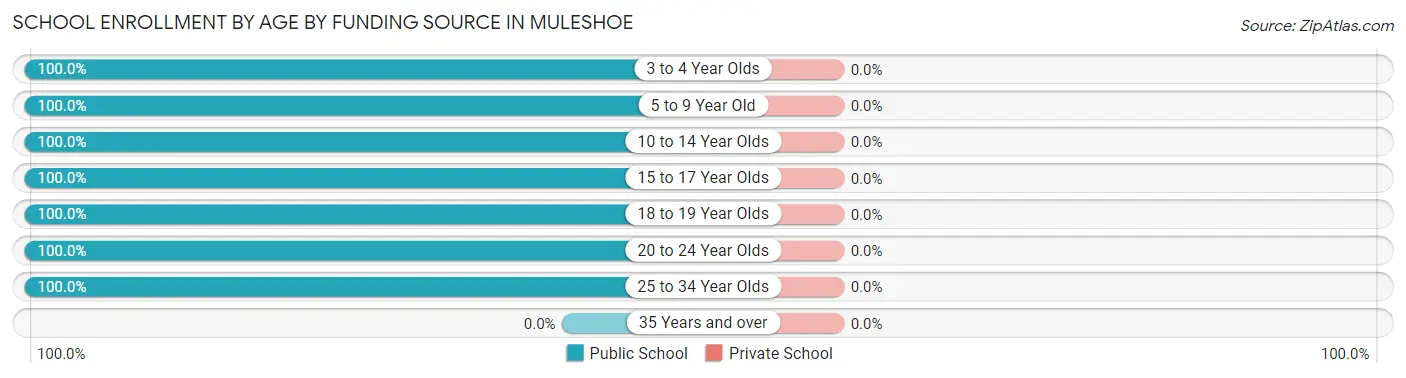
| Age Bracket | Public School | Private School |
| 3 to 4 Year Olds | 16 (100.0%) | 0 (0.0%) |
| 5 to 9 Year Old | 238 (100.0%) | 0 (0.0%) |
| 10 to 14 Year Olds | 217 (100.0%) | 0 (0.0%) |
| 15 to 17 Year Olds | 212 (100.0%) | 0 (0.0%) |
| 18 to 19 Year Olds | 200 (100.0%) | 0 (0.0%) |
| 20 to 24 Year Olds | 23 (100.0%) | 0 (0.0%) |
| 25 to 34 Year Olds | 29 (100.0%) | 0 (0.0%) |
| 35 Years and over | 0 (0.0%) | 0 (0.0%) |
| Total | 935 (100.0%) | 0 (0.0%) |
Educational Attainment by Field of Study in Muleshoe
Business (130 | 26.5%), social sciences (106 | 21.6%), psychology (57 | 11.6%), arts & humanities (57 | 11.6%), and education (52 | 10.6%) are the most common fields of study among 491 individuals in Muleshoe who have obtained a bachelor's degree or higher.
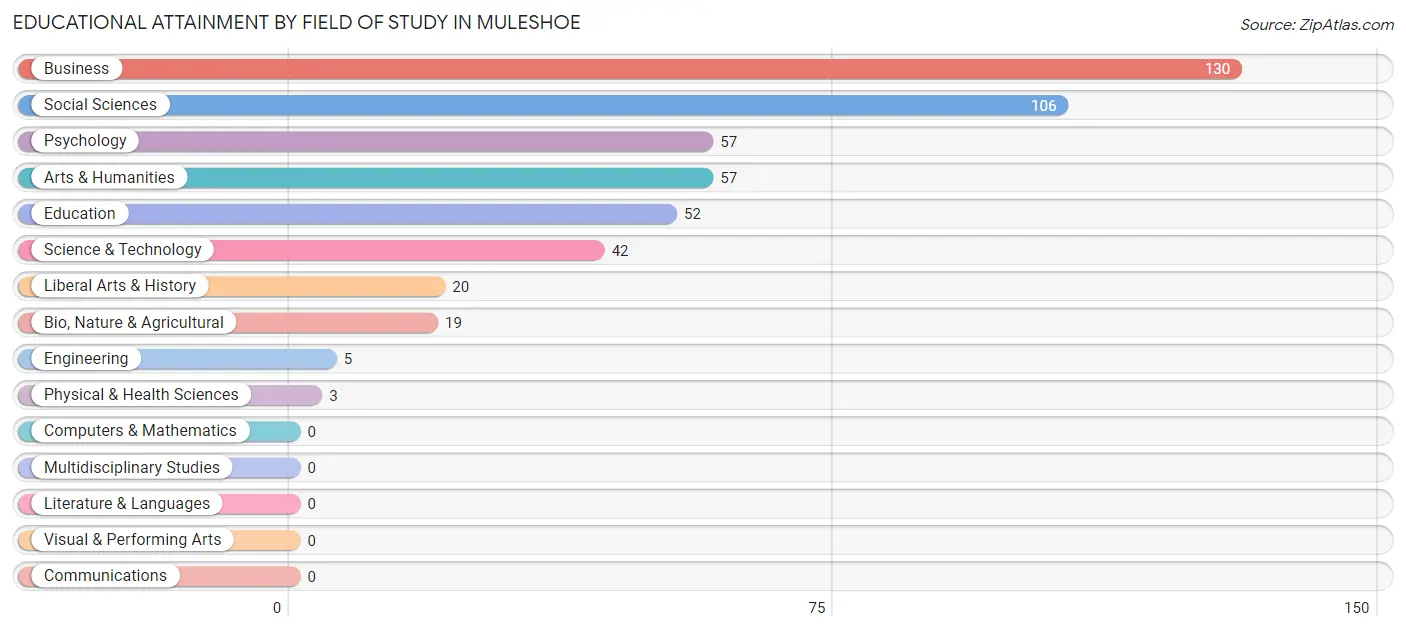
| Field of Study | # Graduates | % Graduates |
| Computers & Mathematics | 0 | 0.0% |
| Bio, Nature & Agricultural | 19 | 3.9% |
| Physical & Health Sciences | 3 | 0.6% |
| Psychology | 57 | 11.6% |
| Social Sciences | 106 | 21.6% |
| Engineering | 5 | 1.0% |
| Multidisciplinary Studies | 0 | 0.0% |
| Science & Technology | 42 | 8.6% |
| Business | 130 | 26.5% |
| Education | 52 | 10.6% |
| Literature & Languages | 0 | 0.0% |
| Liberal Arts & History | 20 | 4.1% |
| Visual & Performing Arts | 0 | 0.0% |
| Communications | 0 | 0.0% |
| Arts & Humanities | 57 | 11.6% |
| Total | 491 | 100.0% |
Transportation & Commute in Muleshoe
Vehicle Availability by Sex in Muleshoe
The most prevalent vehicle ownership categories in Muleshoe are males with 4 vehicles (447, accounting for 37.3%) and females with 4 vehicles (273, making up 54.8%).
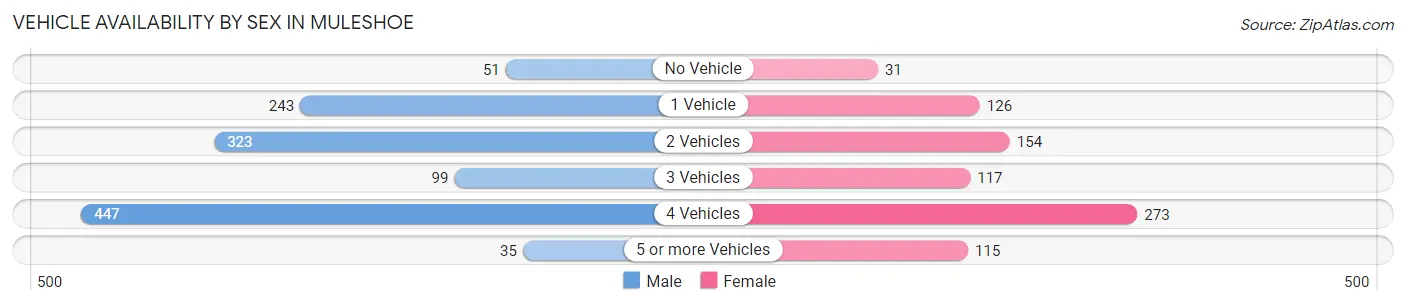
| Vehicles Available | Male | Female |
| No Vehicle | 51 (4.3%) | 31 (3.8%) |
| 1 Vehicle | 243 (20.3%) | 126 (15.4%) |
| 2 Vehicles | 323 (27.0%) | 154 (18.9%) |
| 3 Vehicles | 99 (8.3%) | 117 (14.3%) |
| 4 Vehicles | 447 (37.3%) | 273 (33.5%) |
| 5 or more Vehicles | 35 (2.9%) | 115 (14.1%) |
| Total | 1,198 (100.0%) | 816 (100.0%) |
Commute Time in Muleshoe
The most frequently occuring commute durations in Muleshoe are 30 to 34 minutes (676 commuters, 34.1%), 5 to 9 minutes (656 commuters, 33.1%), and less than 5 minutes (239 commuters, 12.1%).
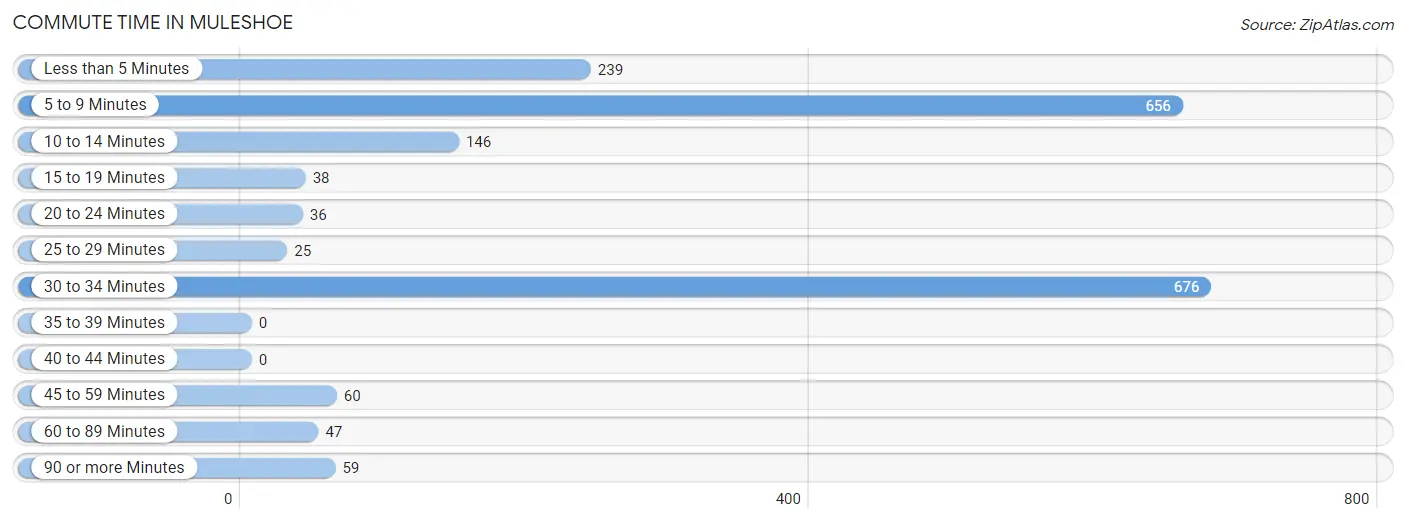
| Commute Time | # Commuters | % Commuters |
| Less than 5 Minutes | 239 | 12.1% |
| 5 to 9 Minutes | 656 | 33.1% |
| 10 to 14 Minutes | 146 | 7.4% |
| 15 to 19 Minutes | 38 | 1.9% |
| 20 to 24 Minutes | 36 | 1.8% |
| 25 to 29 Minutes | 25 | 1.3% |
| 30 to 34 Minutes | 676 | 34.1% |
| 35 to 39 Minutes | 0 | 0.0% |
| 40 to 44 Minutes | 0 | 0.0% |
| 45 to 59 Minutes | 60 | 3.0% |
| 60 to 89 Minutes | 47 | 2.4% |
| 90 or more Minutes | 59 | 3.0% |
Commute Time by Sex in Muleshoe
The most common commute times in Muleshoe are 30 to 34 minutes (457 commuters, 38.7%) for males and 5 to 9 minutes (332 commuters, 41.5%) for females.
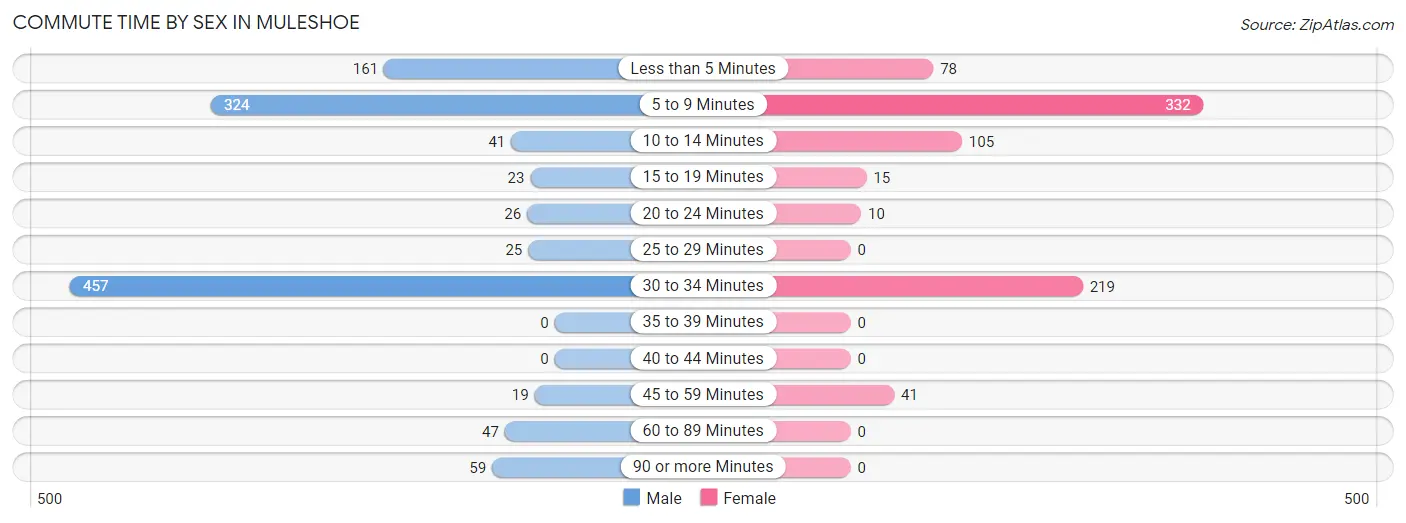
| Commute Time | Male | Female |
| Less than 5 Minutes | 161 (13.6%) | 78 (9.8%) |
| 5 to 9 Minutes | 324 (27.4%) | 332 (41.5%) |
| 10 to 14 Minutes | 41 (3.5%) | 105 (13.1%) |
| 15 to 19 Minutes | 23 (1.9%) | 15 (1.9%) |
| 20 to 24 Minutes | 26 (2.2%) | 10 (1.3%) |
| 25 to 29 Minutes | 25 (2.1%) | 0 (0.0%) |
| 30 to 34 Minutes | 457 (38.7%) | 219 (27.4%) |
| 35 to 39 Minutes | 0 (0.0%) | 0 (0.0%) |
| 40 to 44 Minutes | 0 (0.0%) | 0 (0.0%) |
| 45 to 59 Minutes | 19 (1.6%) | 41 (5.1%) |
| 60 to 89 Minutes | 47 (4.0%) | 0 (0.0%) |
| 90 or more Minutes | 59 (5.0%) | 0 (0.0%) |
Time of Departure to Work by Sex in Muleshoe
The most frequent times of departure to work in Muleshoe are 12:00 PM to 3:59 PM (335, 28.3%) for males and 12:00 PM to 3:59 PM (290, 36.2%) for females.
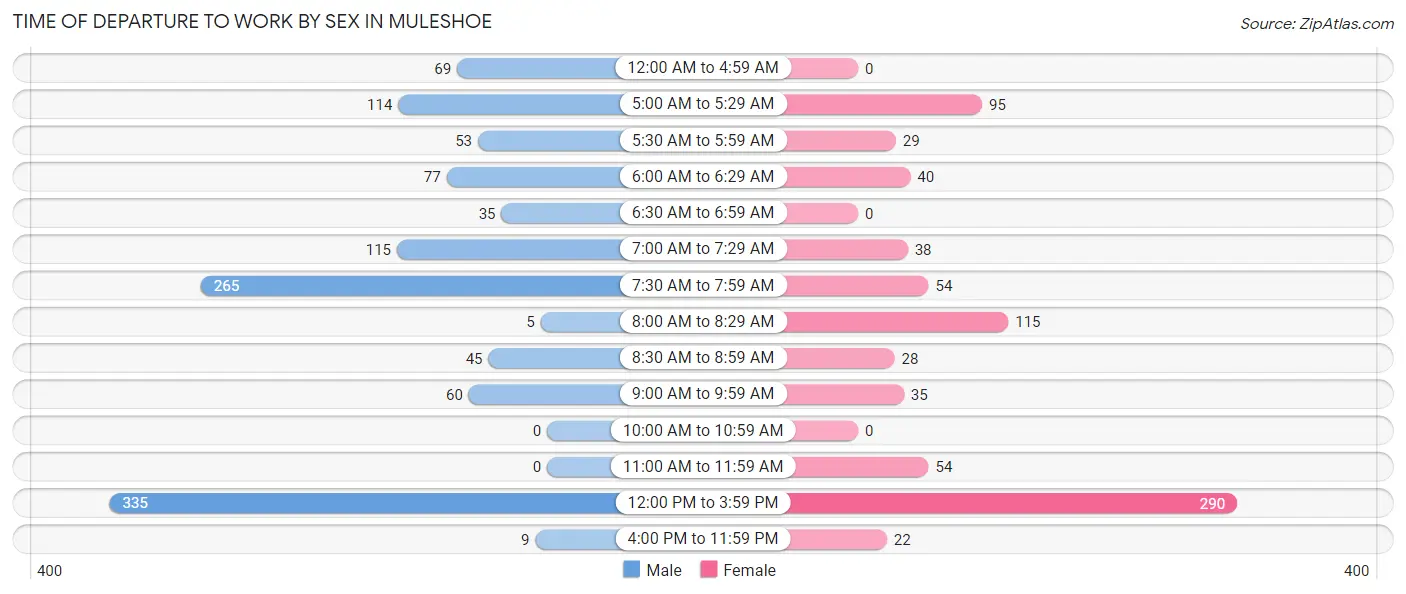
| Time of Departure | Male | Female |
| 12:00 AM to 4:59 AM | 69 (5.8%) | 0 (0.0%) |
| 5:00 AM to 5:29 AM | 114 (9.6%) | 95 (11.9%) |
| 5:30 AM to 5:59 AM | 53 (4.5%) | 29 (3.6%) |
| 6:00 AM to 6:29 AM | 77 (6.5%) | 40 (5.0%) |
| 6:30 AM to 6:59 AM | 35 (3.0%) | 0 (0.0%) |
| 7:00 AM to 7:29 AM | 115 (9.7%) | 38 (4.8%) |
| 7:30 AM to 7:59 AM | 265 (22.4%) | 54 (6.8%) |
| 8:00 AM to 8:29 AM | 5 (0.4%) | 115 (14.4%) |
| 8:30 AM to 8:59 AM | 45 (3.8%) | 28 (3.5%) |
| 9:00 AM to 9:59 AM | 60 (5.1%) | 35 (4.4%) |
| 10:00 AM to 10:59 AM | 0 (0.0%) | 0 (0.0%) |
| 11:00 AM to 11:59 AM | 0 (0.0%) | 54 (6.8%) |
| 12:00 PM to 3:59 PM | 335 (28.3%) | 290 (36.2%) |
| 4:00 PM to 11:59 PM | 9 (0.8%) | 22 (2.8%) |
| Total | 1,182 (100.0%) | 800 (100.0%) |
Housing Occupancy in Muleshoe
Occupancy by Ownership in Muleshoe
Of the total 1,482 dwellings in Muleshoe, owner-occupied units account for 1,051 (70.9%), while renter-occupied units make up 431 (29.1%).
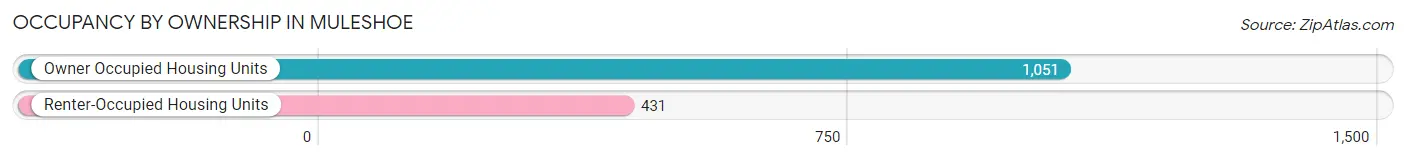
| Occupancy | # Housing Units | % Housing Units |
| Owner Occupied Housing Units | 1,051 | 70.9% |
| Renter-Occupied Housing Units | 431 | 29.1% |
| Total Occupied Housing Units | 1,482 | 100.0% |
Occupancy by Household Size in Muleshoe
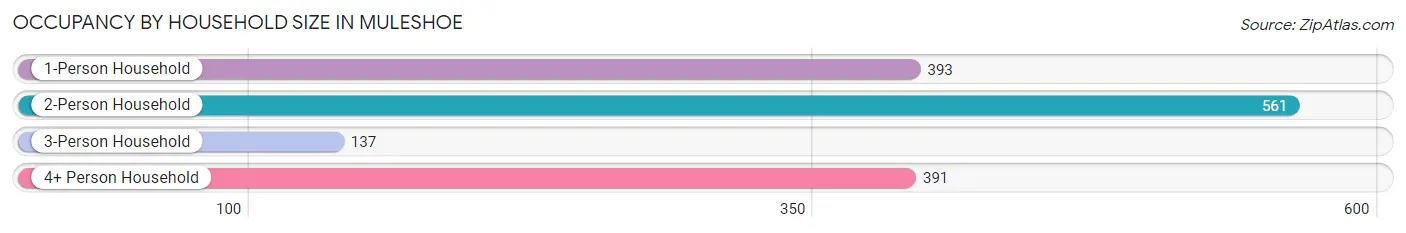
| Household Size | # Housing Units | % Housing Units |
| 1-Person Household | 393 | 26.5% |
| 2-Person Household | 561 | 37.9% |
| 3-Person Household | 137 | 9.2% |
| 4+ Person Household | 391 | 26.4% |
| Total Housing Units | 1,482 | 100.0% |
Occupancy by Ownership by Household Size in Muleshoe
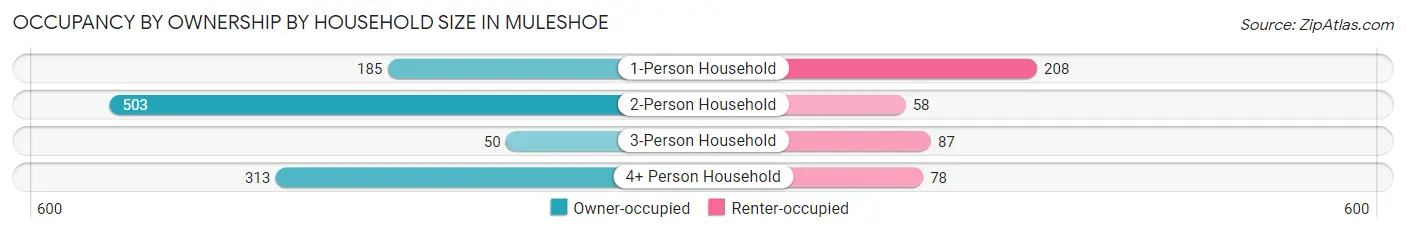
| Household Size | Owner-occupied | Renter-occupied |
| 1-Person Household | 185 (47.1%) | 208 (52.9%) |
| 2-Person Household | 503 (89.7%) | 58 (10.3%) |
| 3-Person Household | 50 (36.5%) | 87 (63.5%) |
| 4+ Person Household | 313 (80.0%) | 78 (20.0%) |
| Total Housing Units | 1,051 (70.9%) | 431 (29.1%) |
Occupancy by Educational Attainment in Muleshoe
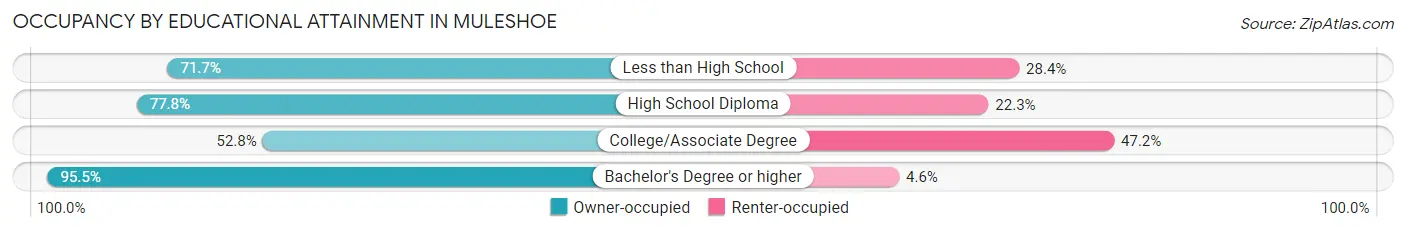
| Household Size | Owner-occupied | Renter-occupied |
| Less than High School | 364 (71.7%) | 144 (28.3%) |
| High School Diploma | 304 (77.7%) | 87 (22.3%) |
| College/Associate Degree | 215 (52.8%) | 192 (47.2%) |
| Bachelor's Degree or higher | 168 (95.5%) | 8 (4.5%) |
Occupancy by Age of Householder in Muleshoe
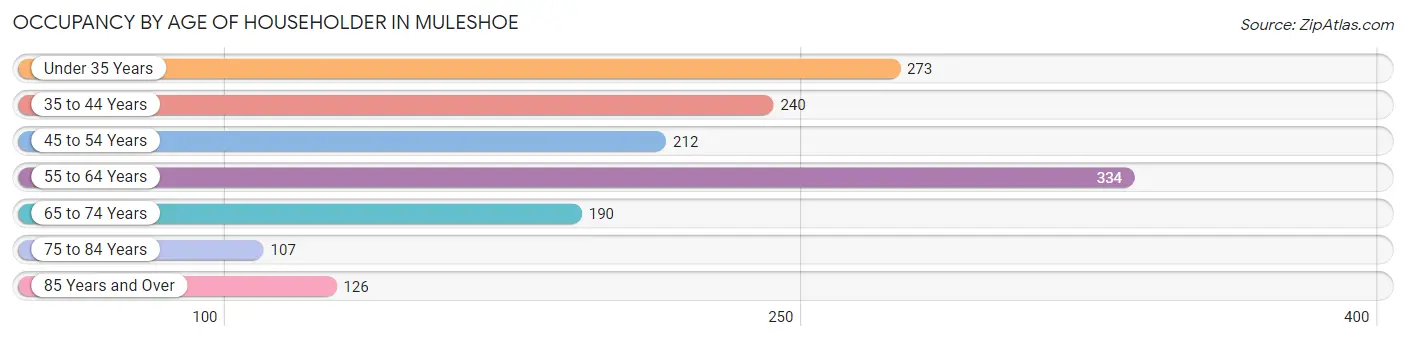
| Age Bracket | # Households | % Households |
| Under 35 Years | 273 | 18.4% |
| 35 to 44 Years | 240 | 16.2% |
| 45 to 54 Years | 212 | 14.3% |
| 55 to 64 Years | 334 | 22.5% |
| 65 to 74 Years | 190 | 12.8% |
| 75 to 84 Years | 107 | 7.2% |
| 85 Years and Over | 126 | 8.5% |
| Total | 1,482 | 100.0% |
Housing Finances in Muleshoe
Median Income by Occupancy in Muleshoe
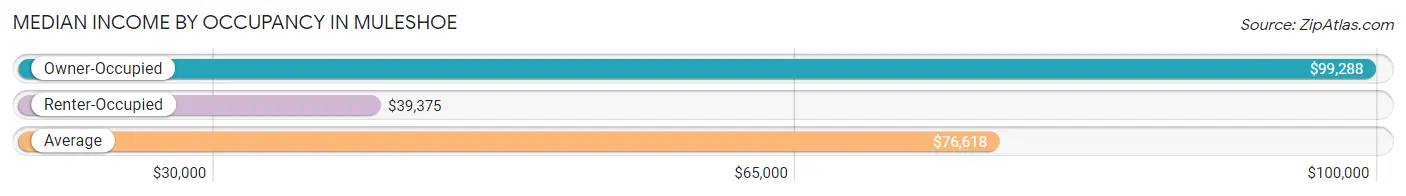
| Occupancy Type | # Households | Median Income |
| Owner-Occupied | 1,051 (70.9%) | $99,288 |
| Renter-Occupied | 431 (29.1%) | $39,375 |
| Average | 1,482 (100.0%) | $76,618 |
Occupancy by Householder Income Bracket in Muleshoe
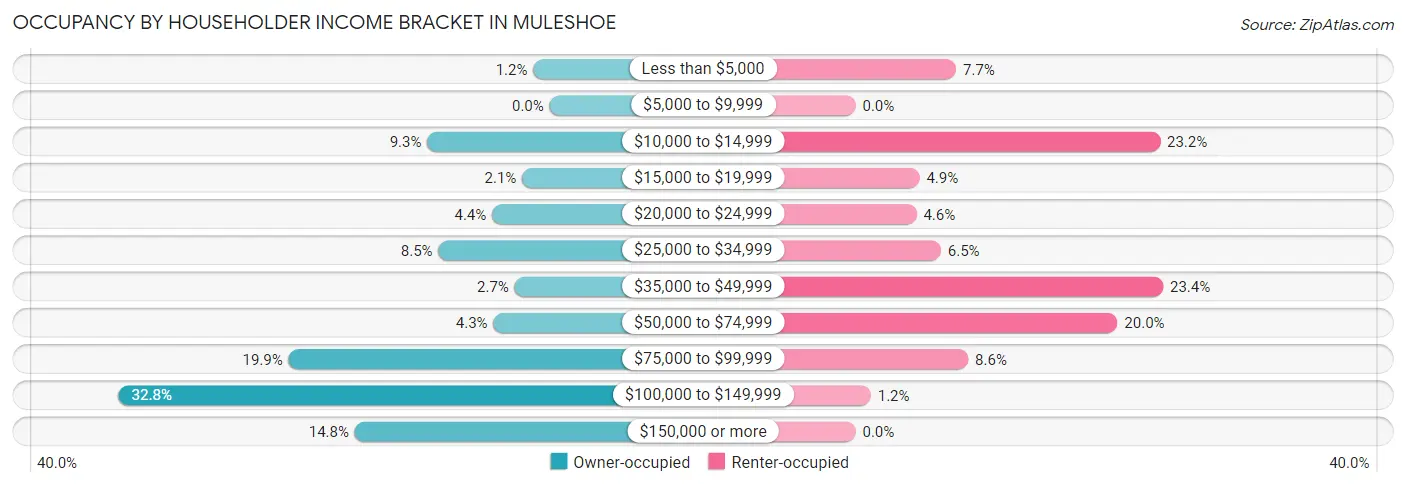
| Income Bracket | Owner-occupied | Renter-occupied |
| Less than $5,000 | 13 (1.2%) | 33 (7.7%) |
| $5,000 to $9,999 | 0 (0.0%) | 0 (0.0%) |
| $10,000 to $14,999 | 98 (9.3%) | 100 (23.2%) |
| $15,000 to $19,999 | 22 (2.1%) | 21 (4.9%) |
| $20,000 to $24,999 | 46 (4.4%) | 20 (4.6%) |
| $25,000 to $34,999 | 89 (8.5%) | 28 (6.5%) |
| $35,000 to $49,999 | 28 (2.7%) | 101 (23.4%) |
| $50,000 to $74,999 | 45 (4.3%) | 86 (20.0%) |
| $75,000 to $99,999 | 209 (19.9%) | 37 (8.6%) |
| $100,000 to $149,999 | 345 (32.8%) | 5 (1.2%) |
| $150,000 or more | 156 (14.8%) | 0 (0.0%) |
| Total | 1,051 (100.0%) | 431 (100.0%) |
Monthly Housing Cost Tiers in Muleshoe
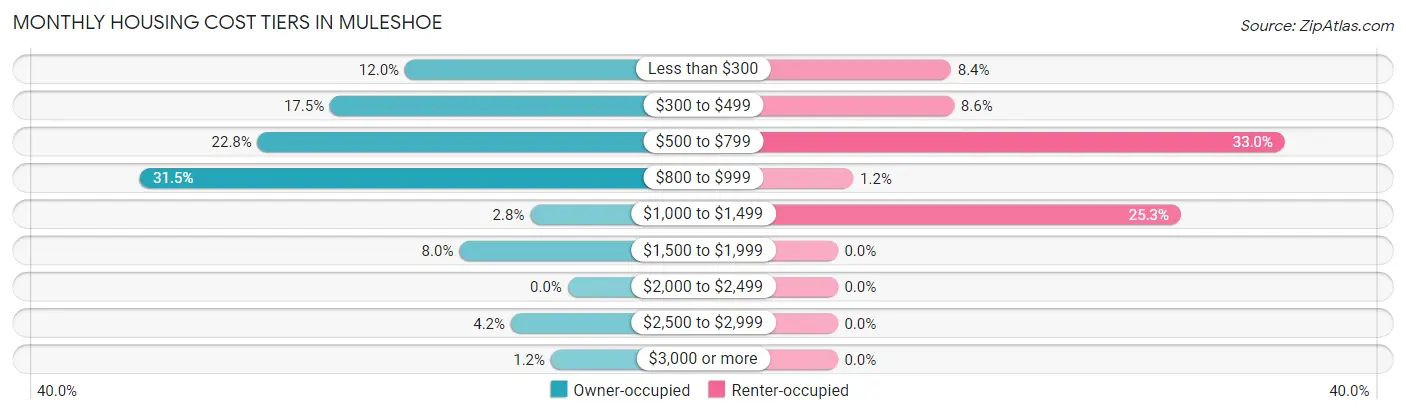
| Monthly Cost | Owner-occupied | Renter-occupied |
| Less than $300 | 126 (12.0%) | 36 (8.4%) |
| $300 to $499 | 184 (17.5%) | 37 (8.6%) |
| $500 to $799 | 240 (22.8%) | 142 (33.0%) |
| $800 to $999 | 331 (31.5%) | 5 (1.2%) |
| $1,000 to $1,499 | 29 (2.8%) | 109 (25.3%) |
| $1,500 to $1,999 | 84 (8.0%) | 0 (0.0%) |
| $2,000 to $2,499 | 0 (0.0%) | 0 (0.0%) |
| $2,500 to $2,999 | 44 (4.2%) | 0 (0.0%) |
| $3,000 or more | 13 (1.2%) | 0 (0.0%) |
| Total | 1,051 (100.0%) | 431 (100.0%) |
Physical Housing Characteristics in Muleshoe
Housing Structures in Muleshoe
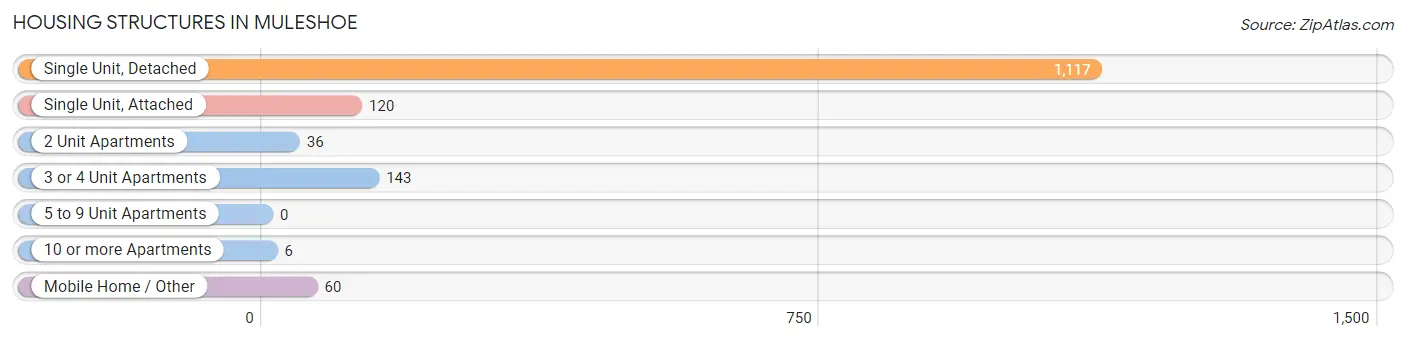
| Structure Type | # Housing Units | % Housing Units |
| Single Unit, Detached | 1,117 | 75.4% |
| Single Unit, Attached | 120 | 8.1% |
| 2 Unit Apartments | 36 | 2.4% |
| 3 or 4 Unit Apartments | 143 | 9.7% |
| 5 to 9 Unit Apartments | 0 | 0.0% |
| 10 or more Apartments | 6 | 0.4% |
| Mobile Home / Other | 60 | 4.1% |
| Total | 1,482 | 100.0% |
Housing Structures by Occupancy in Muleshoe
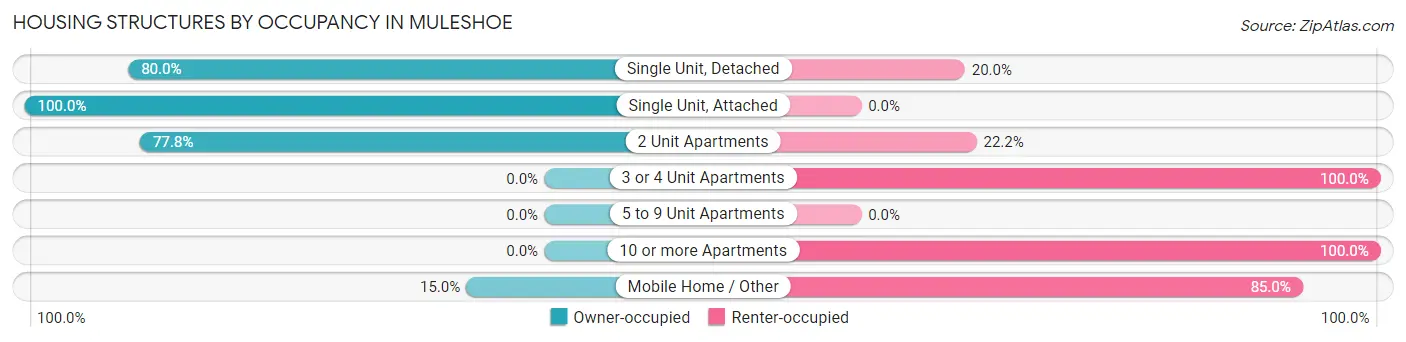
| Structure Type | Owner-occupied | Renter-occupied |
| Single Unit, Detached | 894 (80.0%) | 223 (20.0%) |
| Single Unit, Attached | 120 (100.0%) | 0 (0.0%) |
| 2 Unit Apartments | 28 (77.8%) | 8 (22.2%) |
| 3 or 4 Unit Apartments | 0 (0.0%) | 143 (100.0%) |
| 5 to 9 Unit Apartments | 0 (0.0%) | 0 (0.0%) |
| 10 or more Apartments | 0 (0.0%) | 6 (100.0%) |
| Mobile Home / Other | 9 (15.0%) | 51 (85.0%) |
| Total | 1,051 (70.9%) | 431 (29.1%) |
Housing Structures by Number of Rooms in Muleshoe
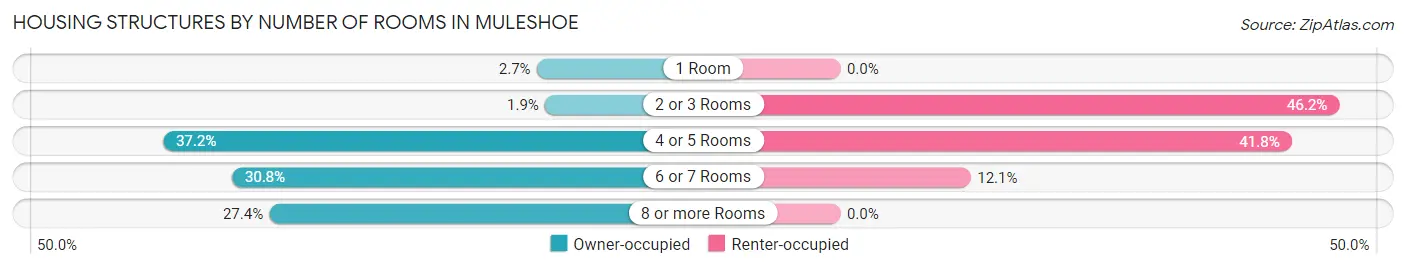
| Number of Rooms | Owner-occupied | Renter-occupied |
| 1 Room | 28 (2.7%) | 0 (0.0%) |
| 2 or 3 Rooms | 20 (1.9%) | 199 (46.2%) |
| 4 or 5 Rooms | 391 (37.2%) | 180 (41.8%) |
| 6 or 7 Rooms | 324 (30.8%) | 52 (12.1%) |
| 8 or more Rooms | 288 (27.4%) | 0 (0.0%) |
| Total | 1,051 (100.0%) | 431 (100.0%) |
Housing Structure by Heating Type in Muleshoe
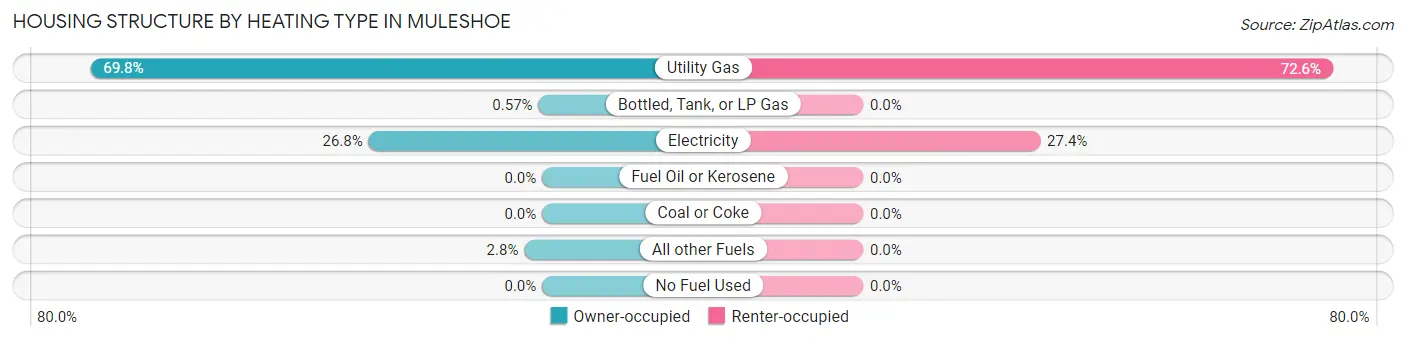
| Heating Type | Owner-occupied | Renter-occupied |
| Utility Gas | 734 (69.8%) | 313 (72.6%) |
| Bottled, Tank, or LP Gas | 6 (0.6%) | 0 (0.0%) |
| Electricity | 282 (26.8%) | 118 (27.4%) |
| Fuel Oil or Kerosene | 0 (0.0%) | 0 (0.0%) |
| Coal or Coke | 0 (0.0%) | 0 (0.0%) |
| All other Fuels | 29 (2.8%) | 0 (0.0%) |
| No Fuel Used | 0 (0.0%) | 0 (0.0%) |
| Total | 1,051 (100.0%) | 431 (100.0%) |
Household Vehicle Usage in Muleshoe
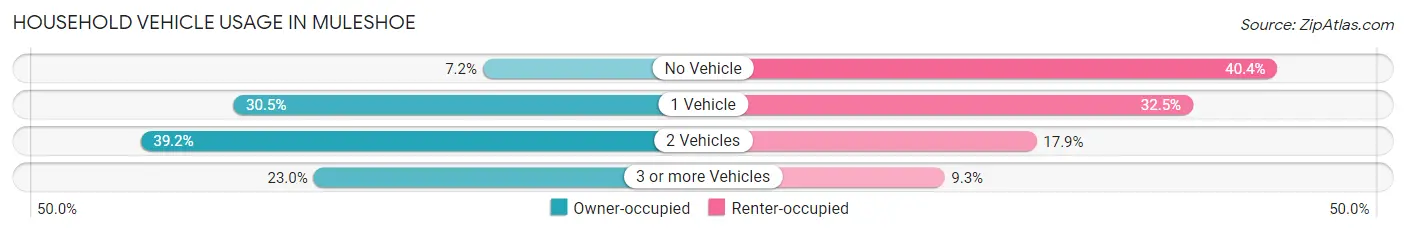
| Vehicles per Household | Owner-occupied | Renter-occupied |
| No Vehicle | 76 (7.2%) | 174 (40.4%) |
| 1 Vehicle | 321 (30.5%) | 140 (32.5%) |
| 2 Vehicles | 412 (39.2%) | 77 (17.9%) |
| 3 or more Vehicles | 242 (23.0%) | 40 (9.3%) |
| Total | 1,051 (100.0%) | 431 (100.0%) |
Real Estate & Mortgages in Muleshoe
Real Estate and Mortgage Overview in Muleshoe
| Characteristic | Without Mortgage | With Mortgage |
| Housing Units | 617 | 434 |
| Median Property Value | $99,300 | $116,400 |
| Median Household Income | $90,250 | $48 |
| Monthly Housing Costs | $498 | $13 |
| Real Estate Taxes | $1,428 | $0 |
Property Value by Mortgage Status in Muleshoe
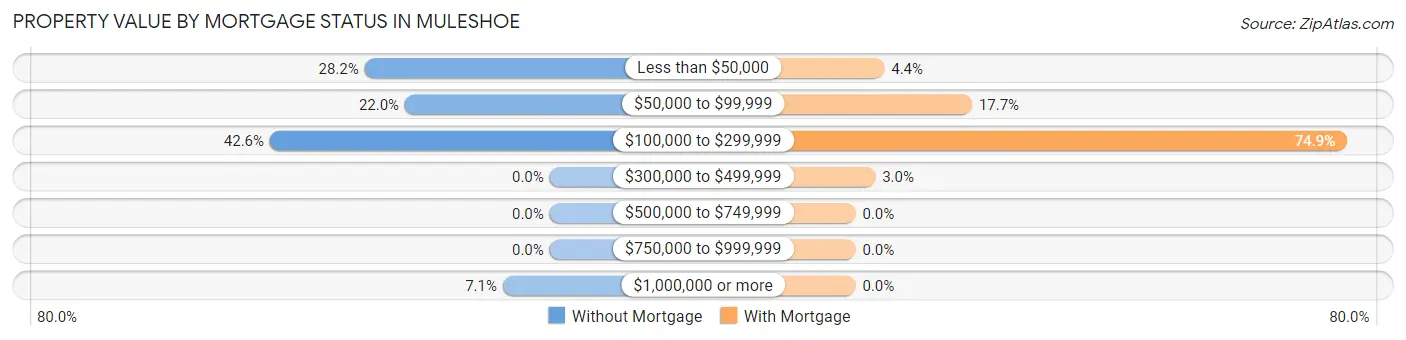
| Property Value | Without Mortgage | With Mortgage |
| Less than $50,000 | 174 (28.2%) | 19 (4.4%) |
| $50,000 to $99,999 | 136 (22.0%) | 77 (17.7%) |
| $100,000 to $299,999 | 263 (42.6%) | 325 (74.9%) |
| $300,000 to $499,999 | 0 (0.0%) | 13 (3.0%) |
| $500,000 to $749,999 | 0 (0.0%) | 0 (0.0%) |
| $750,000 to $999,999 | 0 (0.0%) | 0 (0.0%) |
| $1,000,000 or more | 44 (7.1%) | 0 (0.0%) |
| Total | 617 (100.0%) | 434 (100.0%) |
Household Income by Mortgage Status in Muleshoe
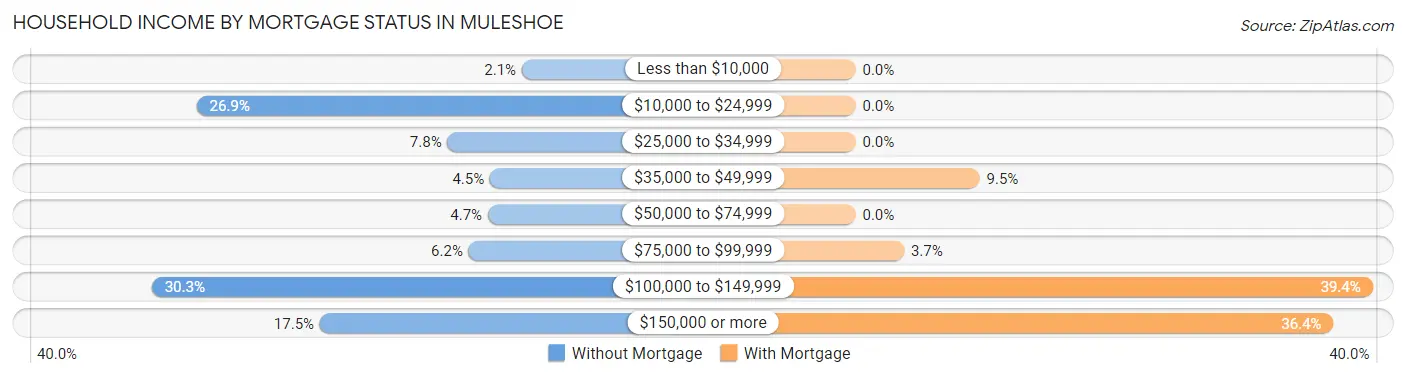
| Household Income | Without Mortgage | With Mortgage |
| Less than $10,000 | 13 (2.1%) | 0 (0.0%) |
| $10,000 to $24,999 | 166 (26.9%) | 0 (0.0%) |
| $25,000 to $34,999 | 48 (7.8%) | 0 (0.0%) |
| $35,000 to $49,999 | 28 (4.5%) | 41 (9.5%) |
| $50,000 to $74,999 | 29 (4.7%) | 0 (0.0%) |
| $75,000 to $99,999 | 38 (6.2%) | 16 (3.7%) |
| $100,000 to $149,999 | 187 (30.3%) | 171 (39.4%) |
| $150,000 or more | 108 (17.5%) | 158 (36.4%) |
| Total | 617 (100.0%) | 434 (100.0%) |
Property Value to Household Income Ratio in Muleshoe
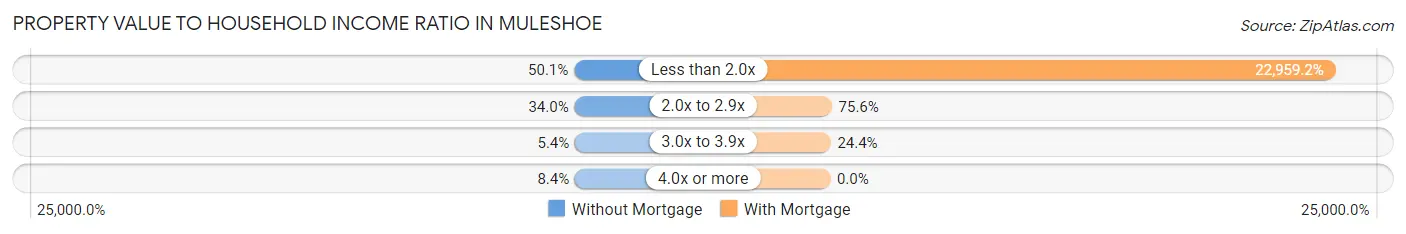
| Value-to-Income Ratio | Without Mortgage | With Mortgage |
| Less than 2.0x | 309 (50.1%) | 99,643 (22,959.2%) |
| 2.0x to 2.9x | 210 (34.0%) | 328 (75.6%) |
| 3.0x to 3.9x | 33 (5.3%) | 106 (24.4%) |
| 4.0x or more | 52 (8.4%) | 0 (0.0%) |
| Total | 617 (100.0%) | 434 (100.0%) |
Real Estate Taxes by Mortgage Status in Muleshoe
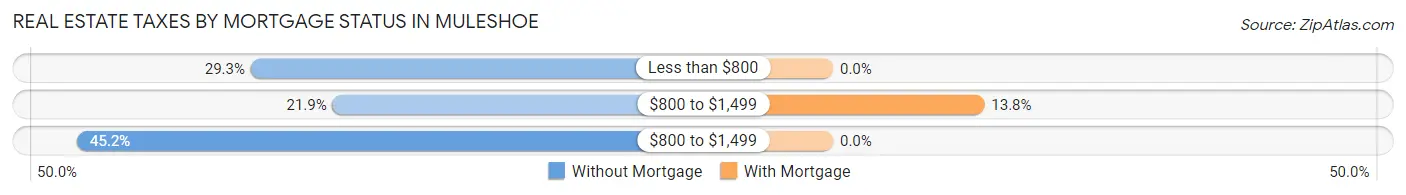
| Property Taxes | Without Mortgage | With Mortgage |
| Less than $800 | 181 (29.3%) | 0 (0.0%) |
| $800 to $1,499 | 135 (21.9%) | 60 (13.8%) |
| $800 to $1,499 | 279 (45.2%) | 0 (0.0%) |
| Total | 617 (100.0%) | 434 (100.0%) |
Health & Disability in Muleshoe
Health Insurance Coverage by Age in Muleshoe
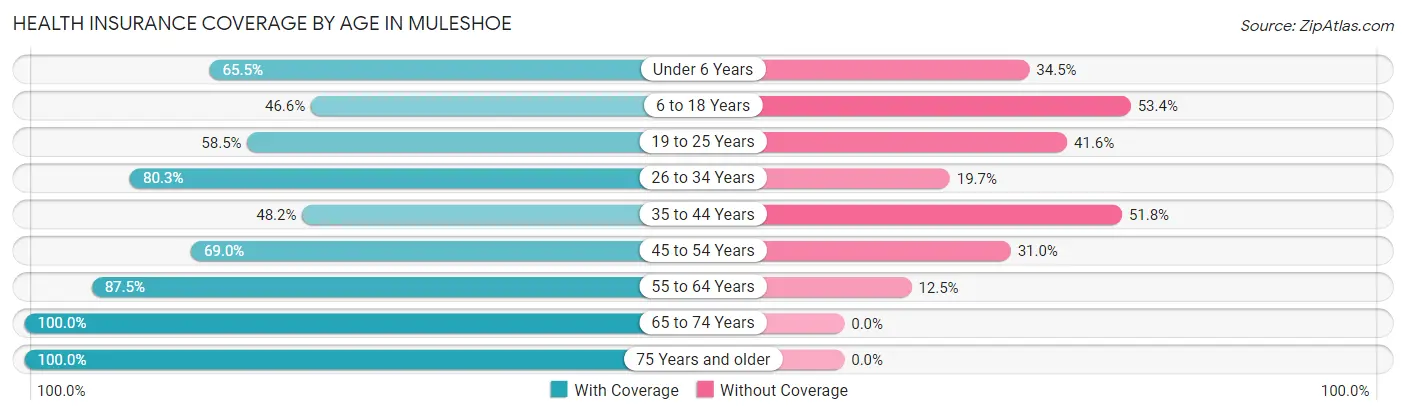
| Age Bracket | With Coverage | Without Coverage |
| Under 6 Years | 387 (65.5%) | 204 (34.5%) |
| 6 to 18 Years | 531 (46.6%) | 609 (53.4%) |
| 19 to 25 Years | 211 (58.5%) | 150 (41.5%) |
| 26 to 34 Years | 841 (80.3%) | 206 (19.7%) |
| 35 to 44 Years | 258 (48.2%) | 277 (51.8%) |
| 45 to 54 Years | 200 (69.0%) | 90 (31.0%) |
| 55 to 64 Years | 636 (87.5%) | 91 (12.5%) |
| 65 to 74 Years | 353 (100.0%) | 0 (0.0%) |
| 75 Years and older | 287 (100.0%) | 0 (0.0%) |
| Total | 3,704 (69.5%) | 1,627 (30.5%) |
Health Insurance Coverage by Citizenship Status in Muleshoe
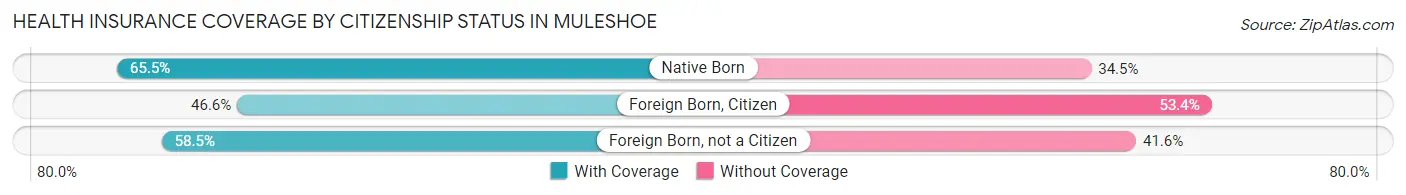
| Citizenship Status | With Coverage | Without Coverage |
| Native Born | 387 (65.5%) | 204 (34.5%) |
| Foreign Born, Citizen | 531 (46.6%) | 609 (53.4%) |
| Foreign Born, not a Citizen | 211 (58.5%) | 150 (41.5%) |
Health Insurance Coverage by Household Income in Muleshoe
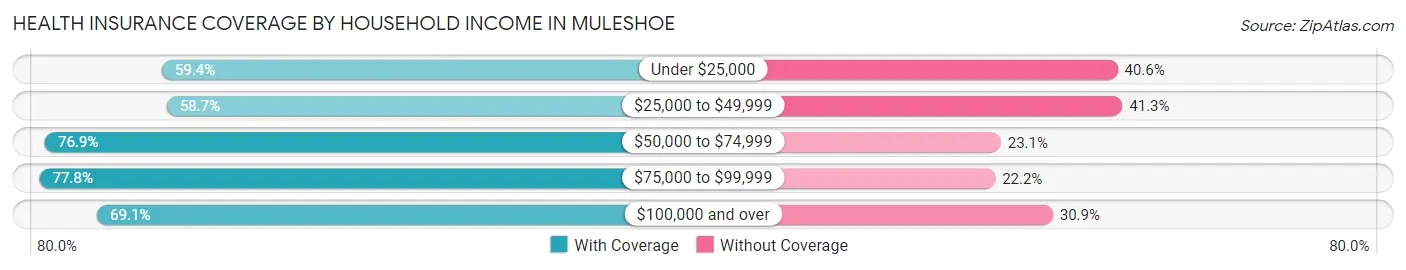
| Household Income | With Coverage | Without Coverage |
| Under $25,000 | 410 (59.4%) | 280 (40.6%) |
| $25,000 to $49,999 | 432 (58.7%) | 304 (41.3%) |
| $50,000 to $74,999 | 170 (76.9%) | 51 (23.1%) |
| $75,000 to $99,999 | 1,311 (77.8%) | 375 (22.2%) |
| $100,000 and over | 1,381 (69.1%) | 617 (30.9%) |
Public vs Private Health Insurance Coverage by Age in Muleshoe
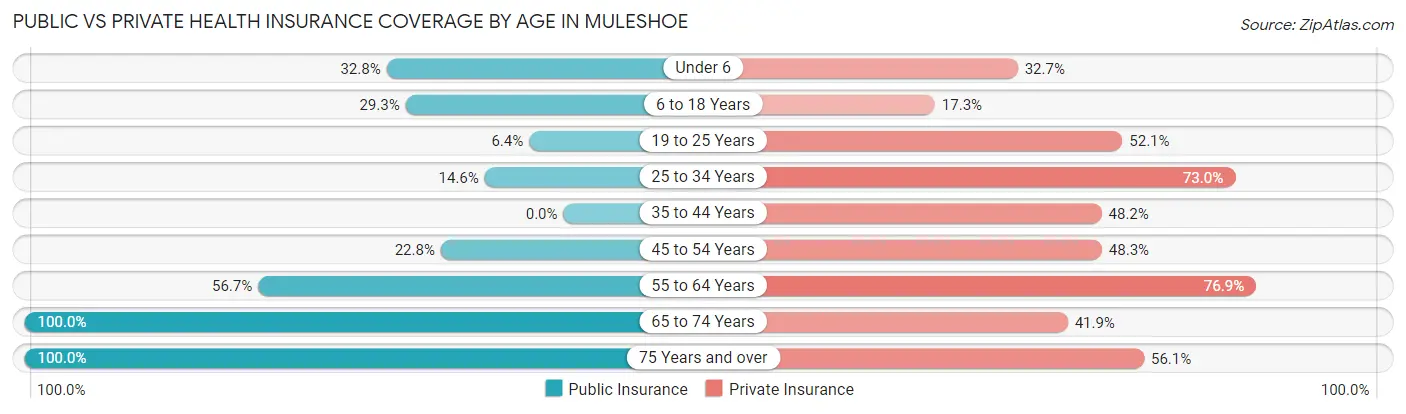
| Age Bracket | Public Insurance | Private Insurance |
| Under 6 | 194 (32.8%) | 193 (32.7%) |
| 6 to 18 Years | 334 (29.3%) | 197 (17.3%) |
| 19 to 25 Years | 23 (6.4%) | 188 (52.1%) |
| 25 to 34 Years | 153 (14.6%) | 764 (73.0%) |
| 35 to 44 Years | 0 (0.0%) | 258 (48.2%) |
| 45 to 54 Years | 66 (22.8%) | 140 (48.3%) |
| 55 to 64 Years | 412 (56.7%) | 559 (76.9%) |
| 65 to 74 Years | 353 (100.0%) | 148 (41.9%) |
| 75 Years and over | 287 (100.0%) | 161 (56.1%) |
| Total | 1,822 (34.2%) | 2,608 (48.9%) |
Disability Status by Sex by Age in Muleshoe
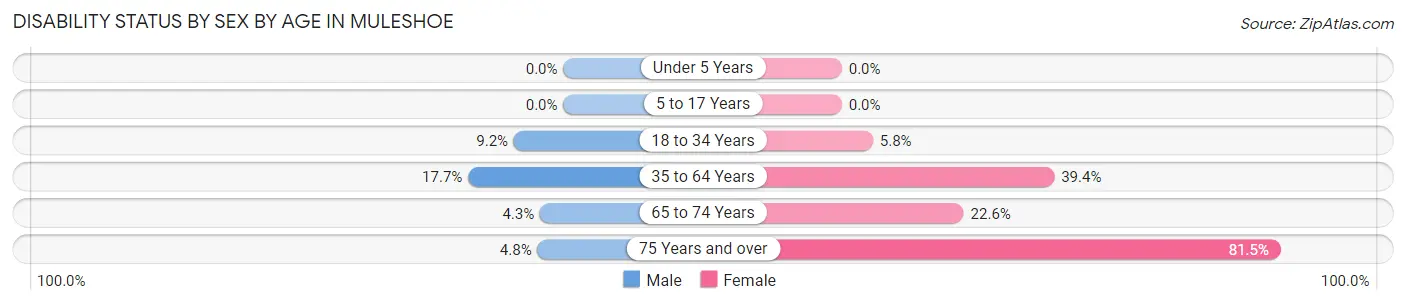
| Age Bracket | Male | Female |
| Under 5 Years | 0 (0.0%) | 0 (0.0%) |
| 5 to 17 Years | 0 (0.0%) | 0 (0.0%) |
| 18 to 34 Years | 70 (9.2%) | 52 (5.8%) |
| 35 to 64 Years | 112 (17.7%) | 362 (39.4%) |
| 65 to 74 Years | 8 (4.3%) | 38 (22.6%) |
| 75 Years and over | 6 (4.8%) | 132 (81.5%) |
Disability Class by Sex by Age in Muleshoe
Disability Class: Hearing Difficulty
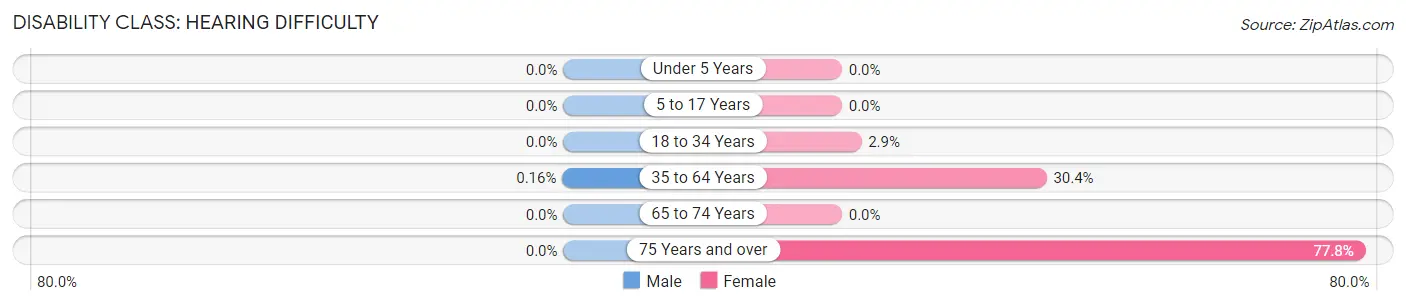
| Age Bracket | Male | Female |
| Under 5 Years | 0 (0.0%) | 0 (0.0%) |
| 5 to 17 Years | 0 (0.0%) | 0 (0.0%) |
| 18 to 34 Years | 0 (0.0%) | 26 (2.9%) |
| 35 to 64 Years | 1 (0.2%) | 279 (30.4%) |
| 65 to 74 Years | 0 (0.0%) | 0 (0.0%) |
| 75 Years and over | 0 (0.0%) | 126 (77.8%) |
Disability Class: Vision Difficulty
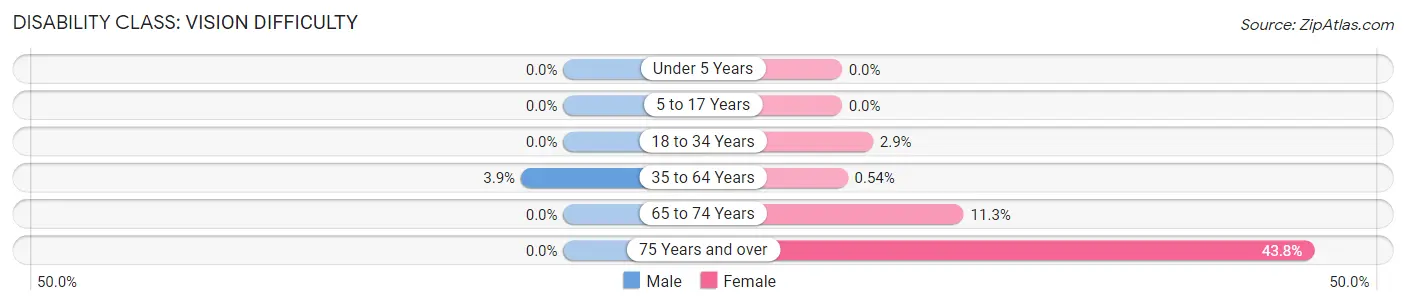
| Age Bracket | Male | Female |
| Under 5 Years | 0 (0.0%) | 0 (0.0%) |
| 5 to 17 Years | 0 (0.0%) | 0 (0.0%) |
| 18 to 34 Years | 0 (0.0%) | 26 (2.9%) |
| 35 to 64 Years | 25 (3.9%) | 5 (0.5%) |
| 65 to 74 Years | 0 (0.0%) | 19 (11.3%) |
| 75 Years and over | 0 (0.0%) | 71 (43.8%) |
Disability Class: Cognitive Difficulty
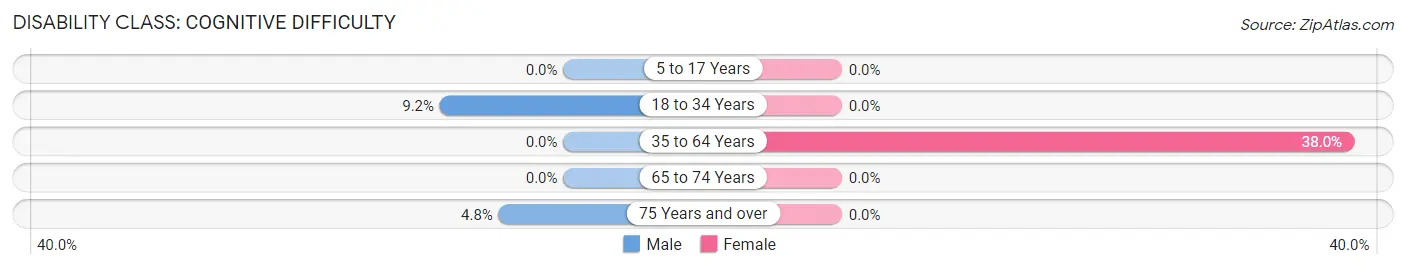
| Age Bracket | Male | Female |
| 5 to 17 Years | 0 (0.0%) | 0 (0.0%) |
| 18 to 34 Years | 70 (9.2%) | 0 (0.0%) |
| 35 to 64 Years | 0 (0.0%) | 349 (38.0%) |
| 65 to 74 Years | 0 (0.0%) | 0 (0.0%) |
| 75 Years and over | 6 (4.8%) | 0 (0.0%) |
Disability Class: Ambulatory Difficulty
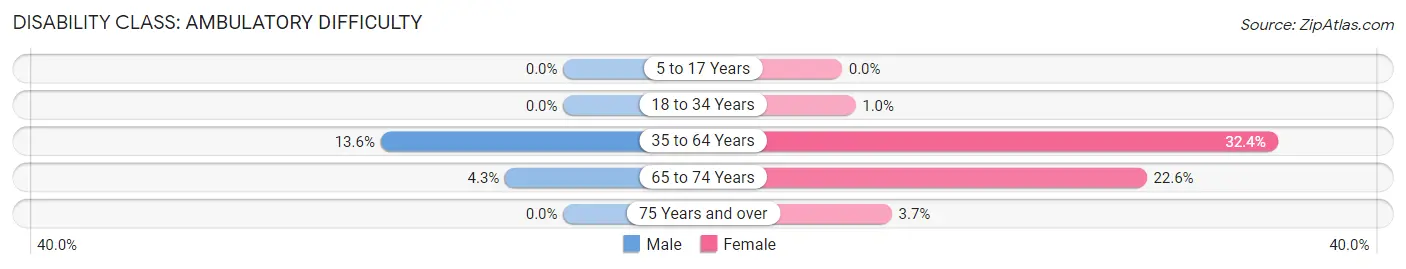
| Age Bracket | Male | Female |
| 5 to 17 Years | 0 (0.0%) | 0 (0.0%) |
| 18 to 34 Years | 0 (0.0%) | 9 (1.0%) |
| 35 to 64 Years | 86 (13.6%) | 297 (32.4%) |
| 65 to 74 Years | 8 (4.3%) | 38 (22.6%) |
| 75 Years and over | 0 (0.0%) | 6 (3.7%) |
Disability Class: Self-Care Difficulty
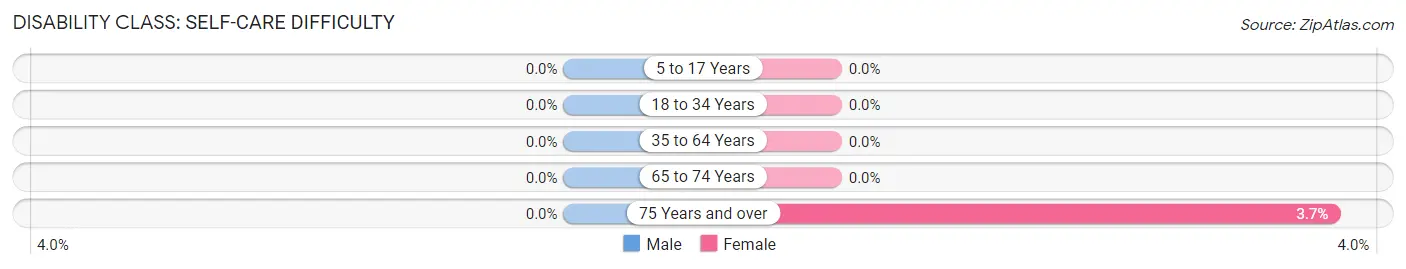
| Age Bracket | Male | Female |
| 5 to 17 Years | 0 (0.0%) | 0 (0.0%) |
| 18 to 34 Years | 0 (0.0%) | 0 (0.0%) |
| 35 to 64 Years | 0 (0.0%) | 0 (0.0%) |
| 65 to 74 Years | 0 (0.0%) | 0 (0.0%) |
| 75 Years and over | 0 (0.0%) | 6 (3.7%) |
Technology Access in Muleshoe
Computing Device Access in Muleshoe
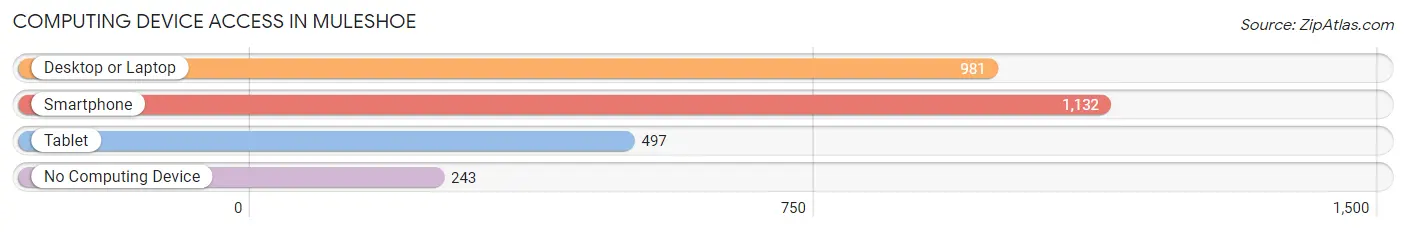
| Device Type | # Households | % Households |
| Desktop or Laptop | 981 | 66.2% |
| Smartphone | 1,132 | 76.4% |
| Tablet | 497 | 33.5% |
| No Computing Device | 243 | 16.4% |
| Total | 1,482 | 100.0% |
Internet Access in Muleshoe
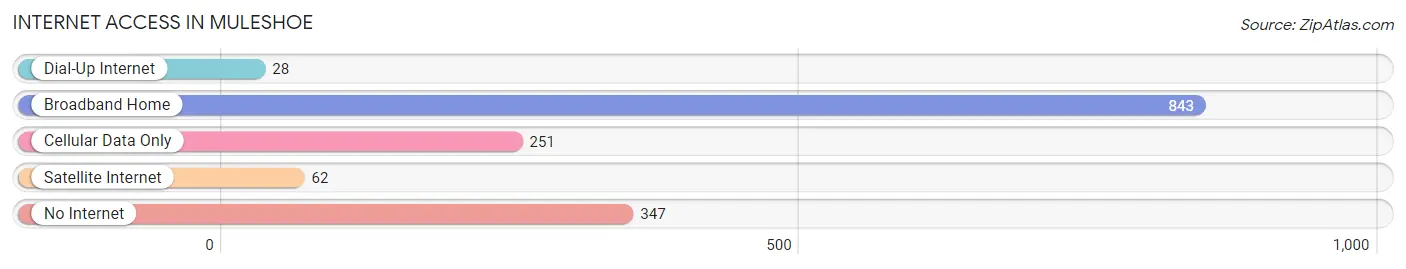
| Internet Type | # Households | % Households |
| Dial-Up Internet | 28 | 1.9% |
| Broadband Home | 843 | 56.9% |
| Cellular Data Only | 251 | 16.9% |
| Satellite Internet | 62 | 4.2% |
| No Internet | 347 | 23.4% |
| Total | 1,482 | 100.0% |
Muleshoe Summary
Muleshoe is a small city located in Bailey County, Texas, United States. It is the county seat of Bailey County and is located in the far northwest corner of the state. The population of Muleshoe was 5,158 at the 2010 census, up from 4,168 at the 2000 census.
History
Muleshoe was founded in 1913 by the Muleshoe Land and Irrigation Company. The company was formed by a group of investors from Amarillo, Texas, who wanted to develop the area for agricultural purposes. The town was named after the nearby Muleshoe Ranch, which was owned by the company. The first settlers arrived in 1914 and the town was officially incorporated in 1915.
The town grew rapidly in the early years, and by 1920 the population had reached 1,000. The town was a major center for cotton production and the local economy was largely based on agriculture. The town also had a number of businesses, including a bank, a hotel, a movie theater, and several stores.
In the 1930s, the Great Depression hit the town hard and the population declined. The town was able to survive, however, and by 1940 the population had recovered to 1,400.
In the 1950s, the town began to diversify its economy. The Muleshoe National Wildlife Refuge was established in 1951 and the town began to attract tourists. The town also began to attract new businesses, including a cotton gin, a feed mill, and a fertilizer plant.
In the 1960s, the town continued to grow and the population reached 3,000 by 1970. The town also began to attract new industries, including a meat packing plant and a plastics factory.
Geography
Muleshoe is located in the far northwest corner of Texas, near the New Mexico border. The town is situated at the intersection of U.S. Highway 84 and State Highway 214. The town is located in the High Plains region of Texas and is surrounded by flat, open farmland.
The climate in Muleshoe is semi-arid, with hot summers and mild winters. The average annual temperature is 64°F (18°C) and the average annual precipitation is 17.5 inches (44.5 cm).
Economy
The economy of Muleshoe is largely based on agriculture. The town is a major center for cotton production and is also home to a number of other agricultural businesses, including a feed mill, a fertilizer plant, and a meat packing plant.
The town also has a number of other businesses, including a bank, a hotel, a movie theater, and several stores. The town is also home to a number of manufacturing businesses, including a plastics factory and a metal fabrication plant.
Demographics
As of the 2010 census, the population of Muleshoe was 5,158. The racial makeup of the town was 75.3% White, 0.7% African American, 0.7% Native American, 0.3% Asian, 0.1% Pacific Islander, 20.7% from other races, and 2.1% from two or more races. Hispanic or Latino of any race were 44.2% of the population.
The median household income in Muleshoe was $30,938 and the median family income was $35,938. The per capita income was $15,938. About 20.7% of the population was below the poverty line.
Common Questions
What is Per Capita Income in Muleshoe?
Per Capita income in Muleshoe is $30,194.
What is the Median Family Income in Muleshoe?
Median Family Income in Muleshoe is $86,007.
What is the Median Household income in Muleshoe?
Median Household Income in Muleshoe is $76,618.
What is Income or Wage Gap in Muleshoe?
Income or Wage Gap in Muleshoe is 45.3%.
Women in Muleshoe earn 54.7 cents for every dollar earned by a man.
What is Inequality or Gini Index in Muleshoe?
Inequality or Gini Index in Muleshoe is 0.46.
What is the Total Population of Muleshoe?
Total Population of Muleshoe is 5,515.
What is the Total Male Population of Muleshoe?
Total Male Population of Muleshoe is 2,331.
What is the Total Female Population of Muleshoe?
Total Female Population of Muleshoe is 3,184.
What is the Ratio of Males per 100 Females in Muleshoe?
There are 73.21 Males per 100 Females in Muleshoe.
What is the Ratio of Females per 100 Males in Muleshoe?
There are 136.59 Females per 100 Males in Muleshoe.
What is the Median Population Age in Muleshoe?
Median Population Age in Muleshoe is 30.0 Years.
What is the Average Family Size in Muleshoe
Average Family Size in Muleshoe is 4.3 People.
What is the Average Household Size in Muleshoe
Average Household Size in Muleshoe is 3.6 People.
How Large is the Labor Force in Muleshoe?
There are 2,246 People in the Labor Forcein in Muleshoe.
What is the Percentage of People in the Labor Force in Muleshoe?
53.6% of People are in the Labor Force in Muleshoe.
What is the Unemployment Rate in Muleshoe?
Unemployment Rate in Muleshoe is 2.9%.