Mountain City, TX Map & Demographics
Mountain City Map
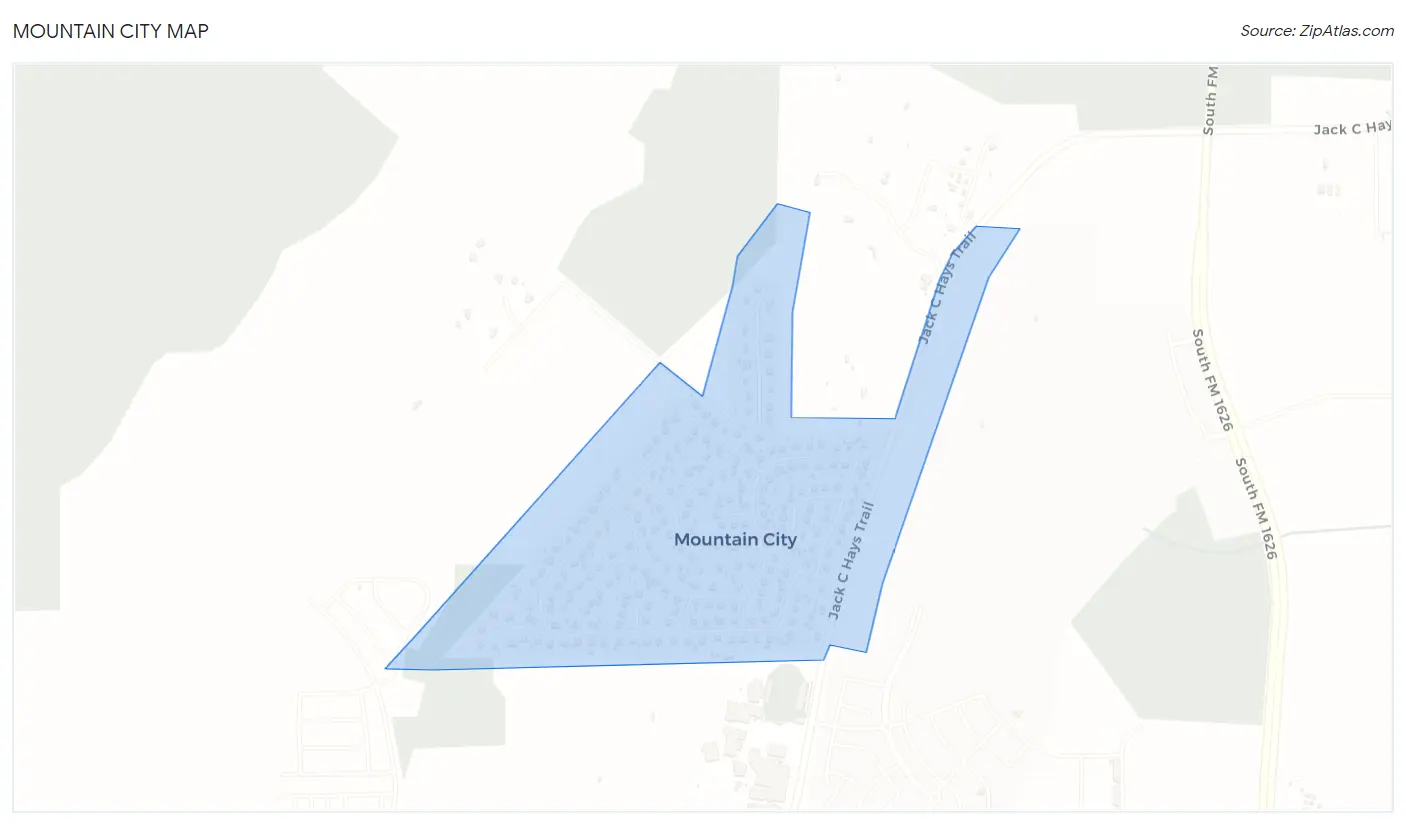
Mountain City Overview
$46,345
PER CAPITA INCOME
$132,500
AVG FAMILY INCOME
$133,750
AVG HOUSEHOLD INCOME
42.1%
WAGE / INCOME GAP [ % ]
57.9¢/ $1
WAGE / INCOME GAP [ $ ]
0.25
INEQUALITY / GINI INDEX
726
TOTAL POPULATION
399
MALE POPULATION
327
FEMALE POPULATION
122.02
MALES / 100 FEMALES
81.95
FEMALES / 100 MALES
37.2
MEDIAN AGE
3.3
AVG FAMILY SIZE
3.0
AVG HOUSEHOLD SIZE
349
LABOR FORCE [ PEOPLE ]
67.2%
PERCENT IN LABOR FORCE
0.3%
UNEMPLOYMENT RATE
Income in Mountain City
Income Overview in Mountain City
Per Capita Income in Mountain City is $46,345, while median incomes of families and households are $132,500 and $133,750 respectively.
| Characteristic | Number | Measure |
| Per Capita Income | 726 | $46,345 |
| Median Family Income | 200 | $132,500 |
| Mean Family Income | 200 | $144,746 |
| Median Household Income | 240 | $133,750 |
| Mean Household Income | 240 | $139,431 |
| Income Deficit | 200 | $0 |
| Wage / Income Gap (%) | 726 | 42.07% |
| Wage / Income Gap ($) | 726 | 57.93¢ per $1 |
| Gini / Inequality Index | 726 | 0.25 |
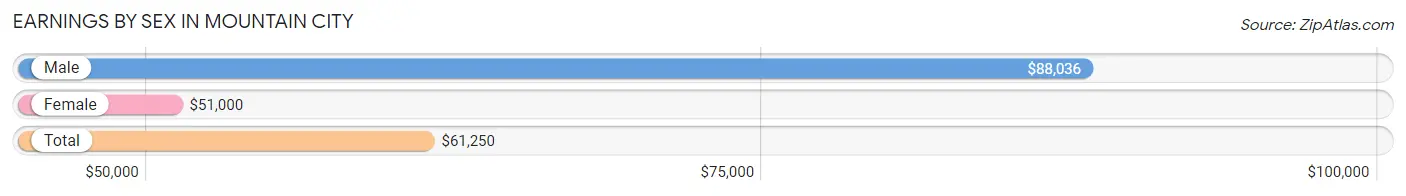
Earnings by Sex in Mountain City
Average Earnings in Mountain City are $61,250, $88,036 for men and $51,000 for women, a difference of 42.1%.
| Sex | Number | Average Earnings |
| Male | 192 (49.0%) | $88,036 |
| Female | 200 (51.0%) | $51,000 |
| Total | 392 (100.0%) | $61,250 |
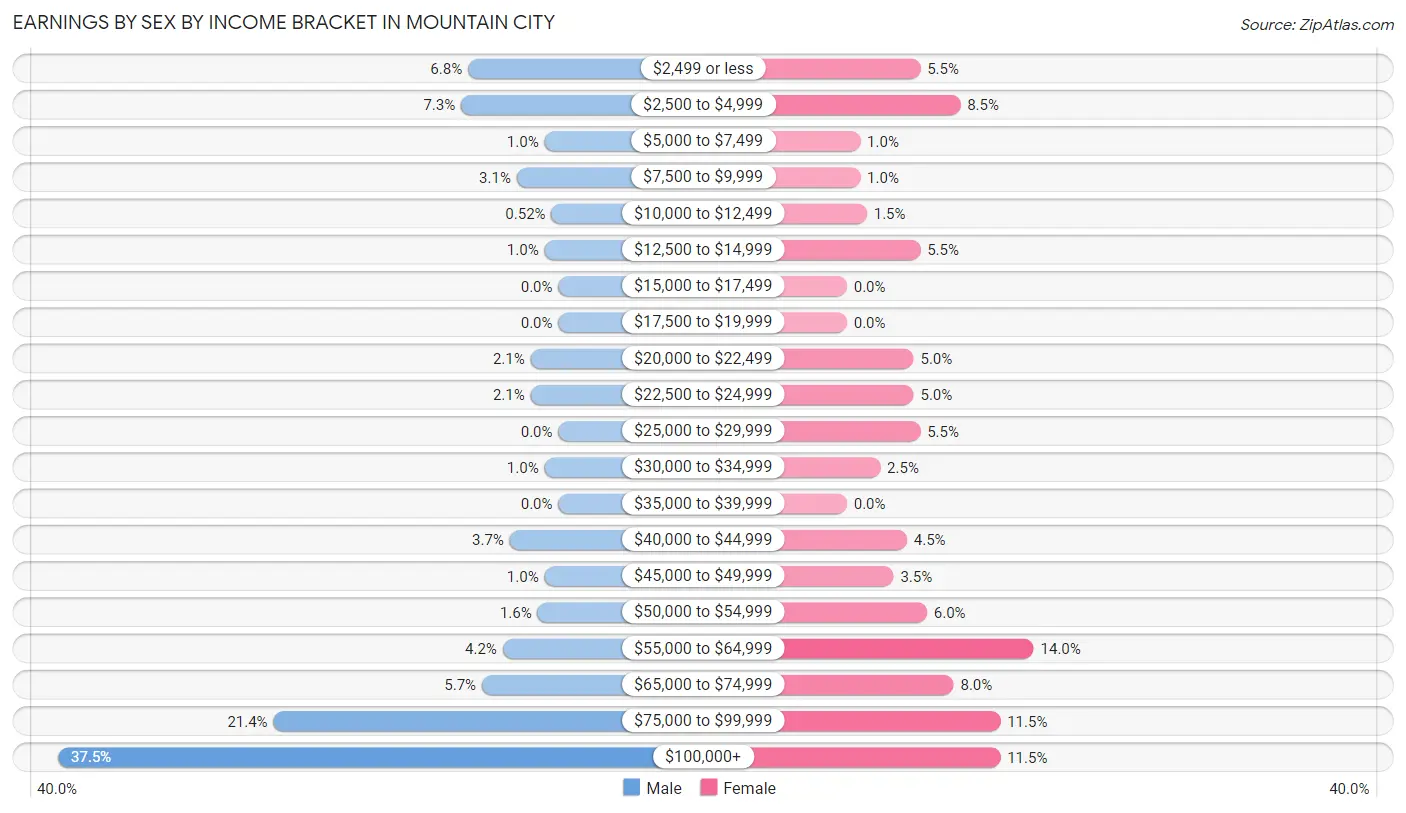
Earnings by Sex by Income Bracket in Mountain City
The most common earnings brackets in Mountain City are $100,000+ for men (72 | 37.5%) and $55,000 to $64,999 for women (28 | 14.0%).
| Income | Male | Female |
| $2,499 or less | 13 (6.8%) | 11 (5.5%) |
| $2,500 to $4,999 | 14 (7.3%) | 17 (8.5%) |
| $5,000 to $7,499 | 2 (1.0%) | 2 (1.0%) |
| $7,500 to $9,999 | 6 (3.1%) | 2 (1.0%) |
| $10,000 to $12,499 | 1 (0.5%) | 3 (1.5%) |
| $12,500 to $14,999 | 2 (1.0%) | 11 (5.5%) |
| $15,000 to $17,499 | 0 (0.0%) | 0 (0.0%) |
| $17,500 to $19,999 | 0 (0.0%) | 0 (0.0%) |
| $20,000 to $22,499 | 4 (2.1%) | 10 (5.0%) |
| $22,500 to $24,999 | 4 (2.1%) | 10 (5.0%) |
| $25,000 to $29,999 | 0 (0.0%) | 11 (5.5%) |
| $30,000 to $34,999 | 2 (1.0%) | 5 (2.5%) |
| $35,000 to $39,999 | 0 (0.0%) | 0 (0.0%) |
| $40,000 to $44,999 | 7 (3.6%) | 9 (4.5%) |
| $45,000 to $49,999 | 2 (1.0%) | 7 (3.5%) |
| $50,000 to $54,999 | 3 (1.6%) | 12 (6.0%) |
| $55,000 to $64,999 | 8 (4.2%) | 28 (14.0%) |
| $65,000 to $74,999 | 11 (5.7%) | 16 (8.0%) |
| $75,000 to $99,999 | 41 (21.3%) | 23 (11.5%) |
| $100,000+ | 72 (37.5%) | 23 (11.5%) |
| Total | 192 (100.0%) | 200 (100.0%) |
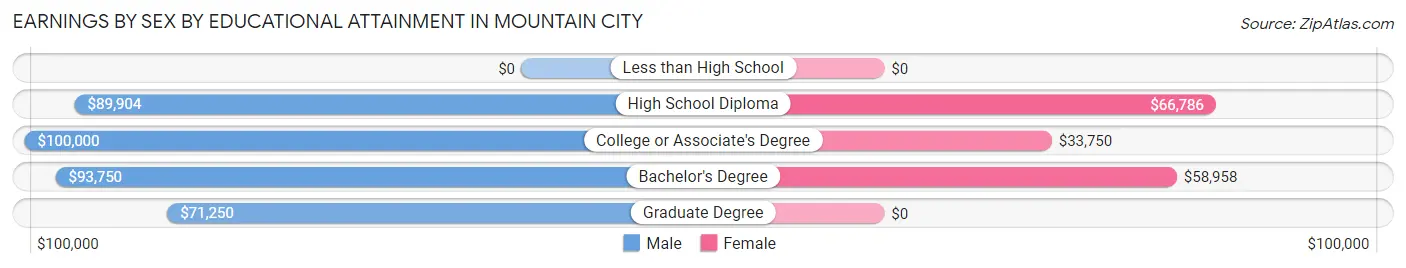
Earnings by Sex by Educational Attainment in Mountain City
Average earnings in Mountain City are $89,732 for men and $54,643 for women, a difference of 39.1%. Men with an educational attainment of college or associate's degree enjoy the highest average annual earnings of $100,000, while those with graduate degree education earn the least with $71,250. Women with an educational attainment of high school diploma earn the most with the average annual earnings of $66,786, while those with college or associate's degree education have the smallest earnings of $33,750.
| Educational Attainment | Male Income | Female Income |
| Less than High School | - | - |
| High School Diploma | $89,904 | $66,786 |
| College or Associate's Degree | $100,000 | $33,750 |
| Bachelor's Degree | $93,750 | $58,958 |
| Graduate Degree | $71,250 | $0 |
| Total | $89,732 | $54,643 |
Family Income in Mountain City
Family Income Brackets in Mountain City
According to the Mountain City family income data, there are 78 families falling into the $100,000 to $149,999 income range, which is the most common income bracket and makes up 39.0% of all families.
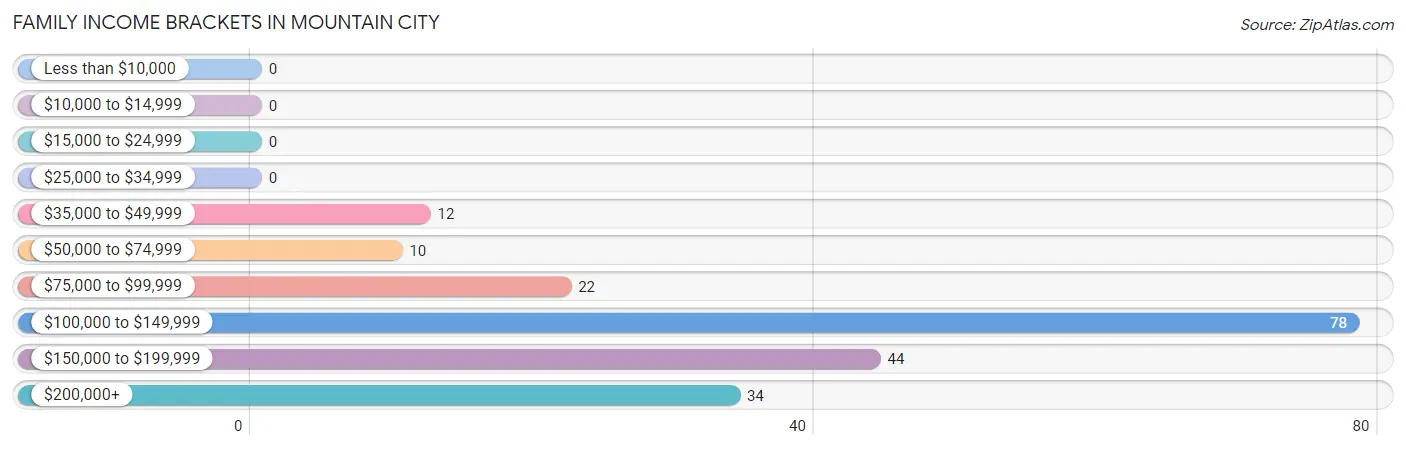
| Income Bracket | # Families | % Families |
| Less than $10,000 | 0 | 0.0% |
| $10,000 to $14,999 | 0 | 0.0% |
| $15,000 to $24,999 | 0 | 0.0% |
| $25,000 to $34,999 | 0 | 0.0% |
| $35,000 to $49,999 | 12 | 6.0% |
| $50,000 to $74,999 | 10 | 5.0% |
| $75,000 to $99,999 | 22 | 11.0% |
| $100,000 to $149,999 | 78 | 39.0% |
| $150,000 to $199,999 | 44 | 22.0% |
| $200,000+ | 34 | 17.0% |
Family Income by Famaliy Size in Mountain City
5-person families (18 | 9.0%) account for the highest median family income in Mountain City with $200,000 per family, while 2-person families (89 | 44.5%) have the highest median income of $59,062 per family member.
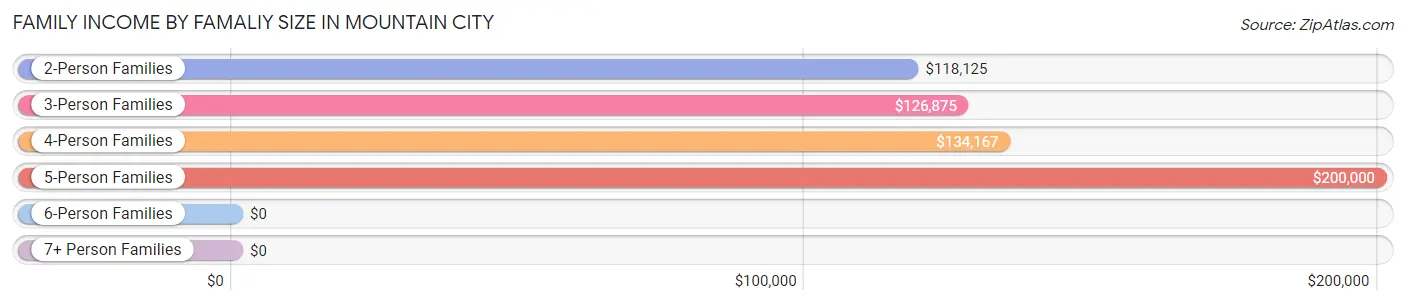
| Income Bracket | # Families | Median Income |
| 2-Person Families | 89 (44.5%) | $118,125 |
| 3-Person Families | 33 (16.5%) | $126,875 |
| 4-Person Families | 48 (24.0%) | $134,167 |
| 5-Person Families | 18 (9.0%) | $200,000 |
| 6-Person Families | 4 (2.0%) | $0 |
| 7+ Person Families | 8 (4.0%) | $0 |
| Total | 200 (100.0%) | $132,500 |
Family Income by Number of Earners in Mountain City
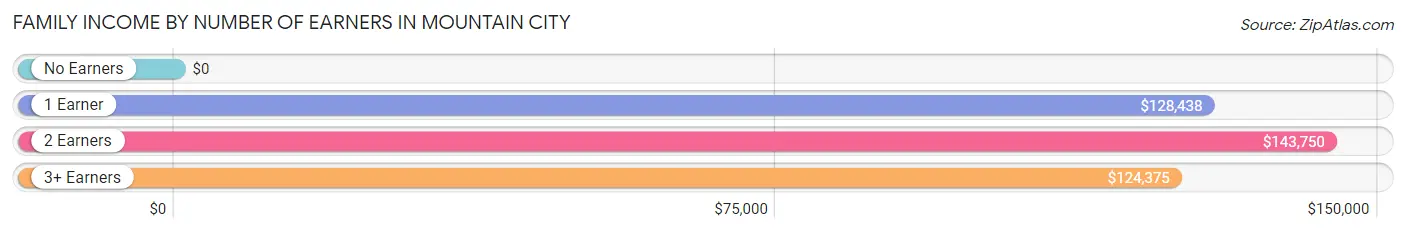
| Number of Earners | # Families | Median Income |
| No Earners | 33 (16.5%) | $0 |
| 1 Earner | 25 (12.5%) | $128,438 |
| 2 Earners | 118 (59.0%) | $143,750 |
| 3+ Earners | 24 (12.0%) | $124,375 |
| Total | 200 (100.0%) | $132,500 |
Household Income in Mountain City
Household Income Brackets in Mountain City
With 92 households falling in the category, the $100,000 to $149,999 income range is the most frequent in Mountain City, accounting for 38.3% of all households.
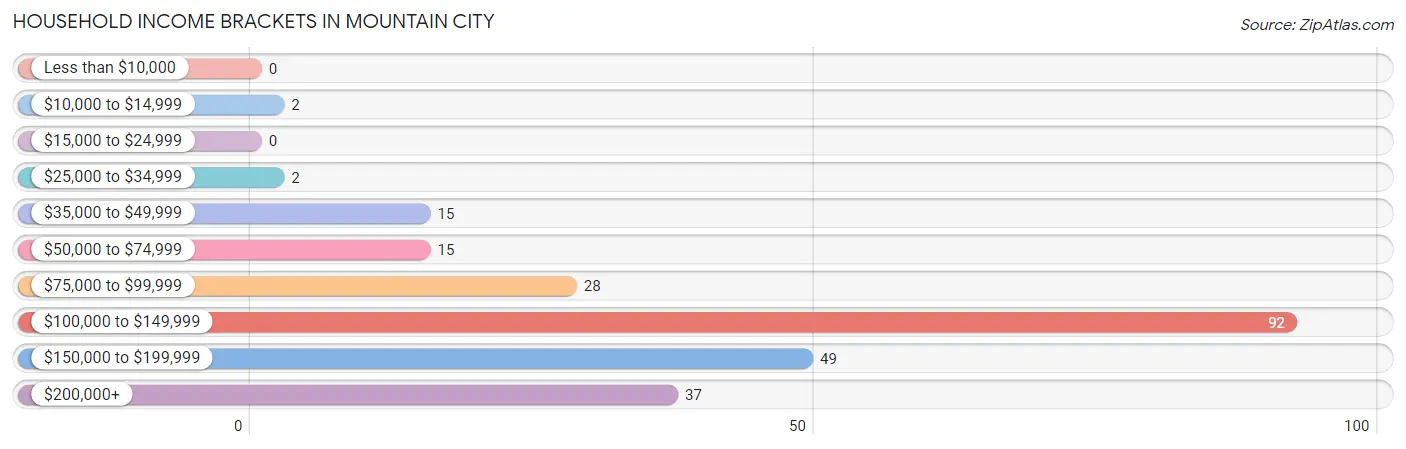
| Income Bracket | # Households | % Households |
| Less than $10,000 | 0 | 0.0% |
| $10,000 to $14,999 | 2 | 0.8% |
| $15,000 to $24,999 | 0 | 0.0% |
| $25,000 to $34,999 | 2 | 0.8% |
| $35,000 to $49,999 | 15 | 6.3% |
| $50,000 to $74,999 | 15 | 6.3% |
| $75,000 to $99,999 | 28 | 11.7% |
| $100,000 to $149,999 | 92 | 38.3% |
| $150,000 to $199,999 | 49 | 20.4% |
| $200,000+ | 37 | 15.4% |
Household Income by Householder Age in Mountain City
The median household income in Mountain City is $133,750, with the highest median household income of $143,750 found in the 45 to 64 years age bracket for the primary householder. A total of 94 households (39.2%) fall into this category.
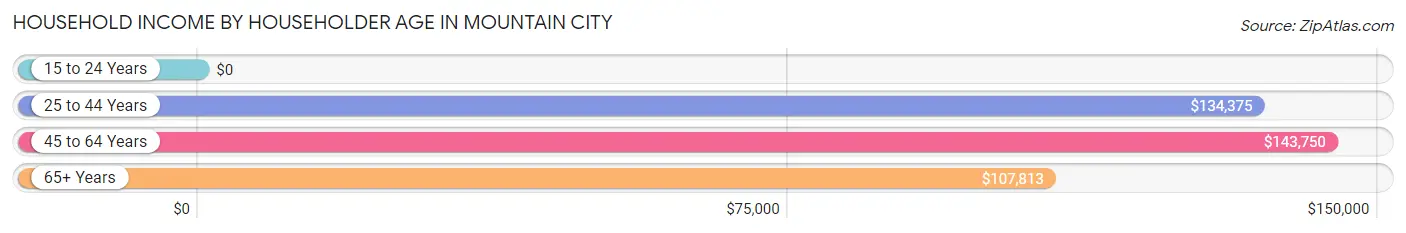
| Income Bracket | # Households | Median Income |
| 15 to 24 Years | 0 (0.0%) | $0 |
| 25 to 44 Years | 77 (32.1%) | $134,375 |
| 45 to 64 Years | 94 (39.2%) | $143,750 |
| 65+ Years | 69 (28.7%) | $107,813 |
| Total | 240 (100.0%) | $133,750 |
Poverty in Mountain City
Income Below Poverty by Sex and Age in Mountain City
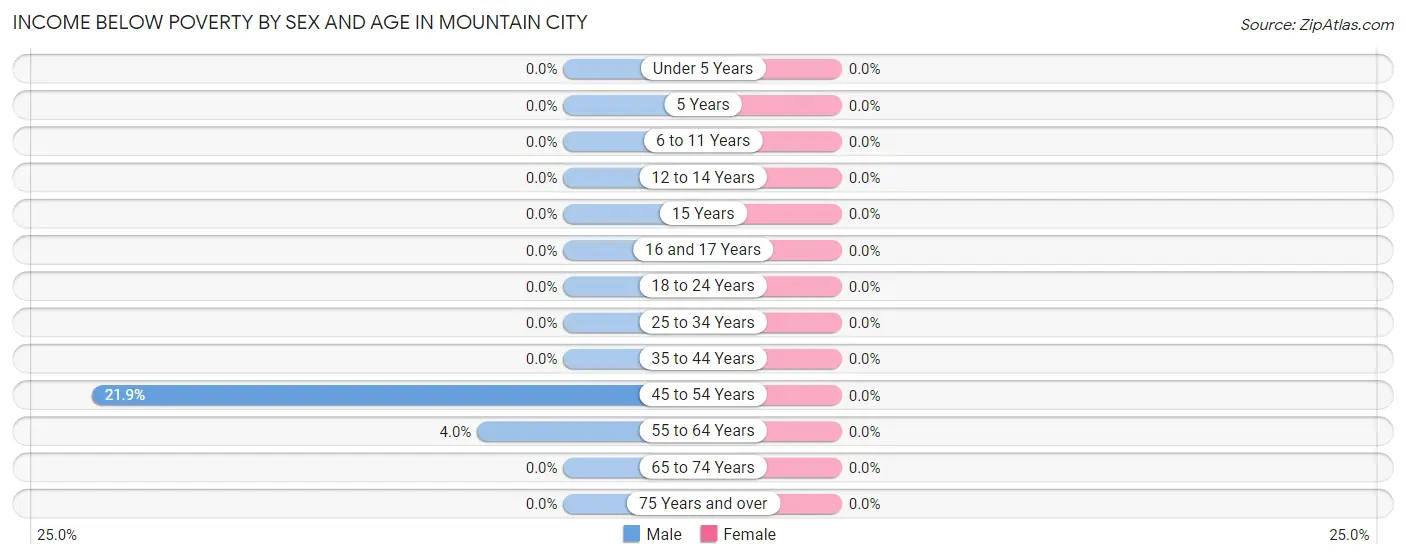
| Age Bracket | Male | Female |
| Under 5 Years | 0 (0.0%) | 0 (0.0%) |
| 5 Years | 0 (0.0%) | 0 (0.0%) |
| 6 to 11 Years | 0 (0.0%) | 0 (0.0%) |
| 12 to 14 Years | 0 (0.0%) | 0 (0.0%) |
| 15 Years | 0 (0.0%) | 0 (0.0%) |
| 16 and 17 Years | 0 (0.0%) | 0 (0.0%) |
| 18 to 24 Years | 0 (0.0%) | 0 (0.0%) |
| 25 to 34 Years | 0 (0.0%) | 0 (0.0%) |
| 35 to 44 Years | 0 (0.0%) | 0 (0.0%) |
| 45 to 54 Years | 7 (21.9%) | 0 (0.0%) |
| 55 to 64 Years | 2 (4.0%) | 0 (0.0%) |
| 65 to 74 Years | 0 (0.0%) | 0 (0.0%) |
| 75 Years and over | 0 (0.0%) | 0 (0.0%) |
| Total | 9 (2.3%) | 0 (0.0%) |
Income Above Poverty by Sex and Age in Mountain City
According to the poverty statistics in Mountain City, males aged under 5 years and females aged under 5 years are the age groups that are most secure financially, with 100.0% of males and 100.0% of females in these age groups living above the poverty line.
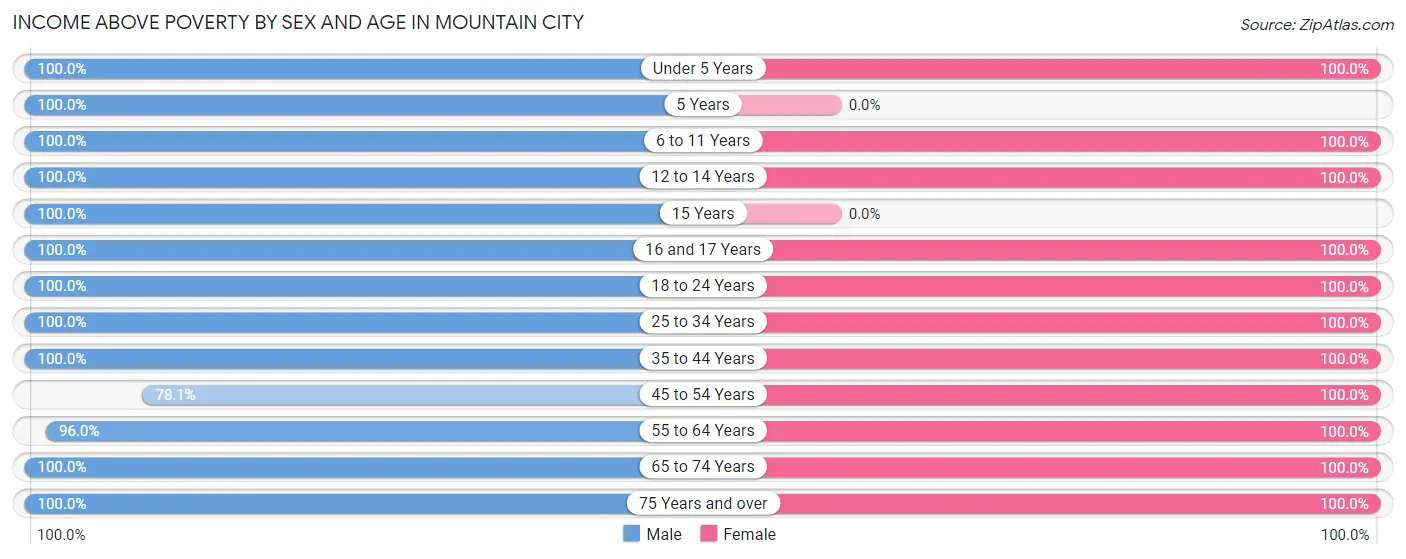
| Age Bracket | Male | Female |
| Under 5 Years | 42 (100.0%) | 29 (100.0%) |
| 5 Years | 4 (100.0%) | 0 (0.0%) |
| 6 to 11 Years | 35 (100.0%) | 22 (100.0%) |
| 12 to 14 Years | 36 (100.0%) | 21 (100.0%) |
| 15 Years | 18 (100.0%) | 0 (0.0%) |
| 16 and 17 Years | 11 (100.0%) | 3 (100.0%) |
| 18 to 24 Years | 27 (100.0%) | 21 (100.0%) |
| 25 to 34 Years | 26 (100.0%) | 40 (100.0%) |
| 35 to 44 Years | 55 (100.0%) | 50 (100.0%) |
| 45 to 54 Years | 25 (78.1%) | 48 (100.0%) |
| 55 to 64 Years | 48 (96.0%) | 43 (100.0%) |
| 65 to 74 Years | 32 (100.0%) | 41 (100.0%) |
| 75 Years and over | 31 (100.0%) | 9 (100.0%) |
| Total | 390 (97.7%) | 327 (100.0%) |
Income Below Poverty Among Married-Couple Families in Mountain City
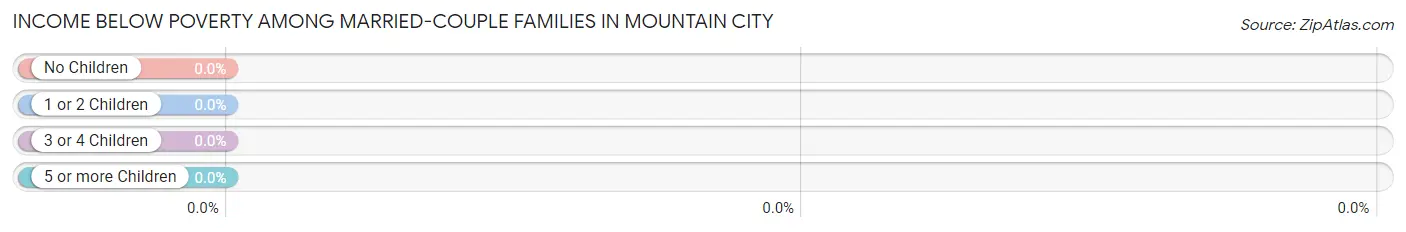
| Children | Above Poverty | Below Poverty |
| No Children | 84 (100.0%) | 0 (0.0%) |
| 1 or 2 Children | 75 (100.0%) | 0 (0.0%) |
| 3 or 4 Children | 16 (100.0%) | 0 (0.0%) |
| 5 or more Children | 4 (100.0%) | 0 (0.0%) |
| Total | 179 (100.0%) | 0 (0.0%) |
Income Below Poverty Among Single-Parent Households in Mountain City
| Children | Single Father | Single Mother |
| No Children | 0 (0.0%) | 0 (0.0%) |
| 1 or 2 Children | 0 (0.0%) | 0 (0.0%) |
| 3 or 4 Children | 0 (0.0%) | 0 (0.0%) |
| 5 or more Children | 0 (0.0%) | 0 (0.0%) |
| Total | 0 (0.0%) | 0 (0.0%) |
Income Below Poverty Among Married-Couple vs Single-Parent Households in Mountain City
| Children | Married-Couple Families | Single-Parent Households |
| No Children | 0 (0.0%) | 0 (0.0%) |
| 1 or 2 Children | 0 (0.0%) | 0 (0.0%) |
| 3 or 4 Children | 0 (0.0%) | 0 (0.0%) |
| 5 or more Children | 0 (0.0%) | 0 (0.0%) |
| Total | 0 (0.0%) | 0 (0.0%) |
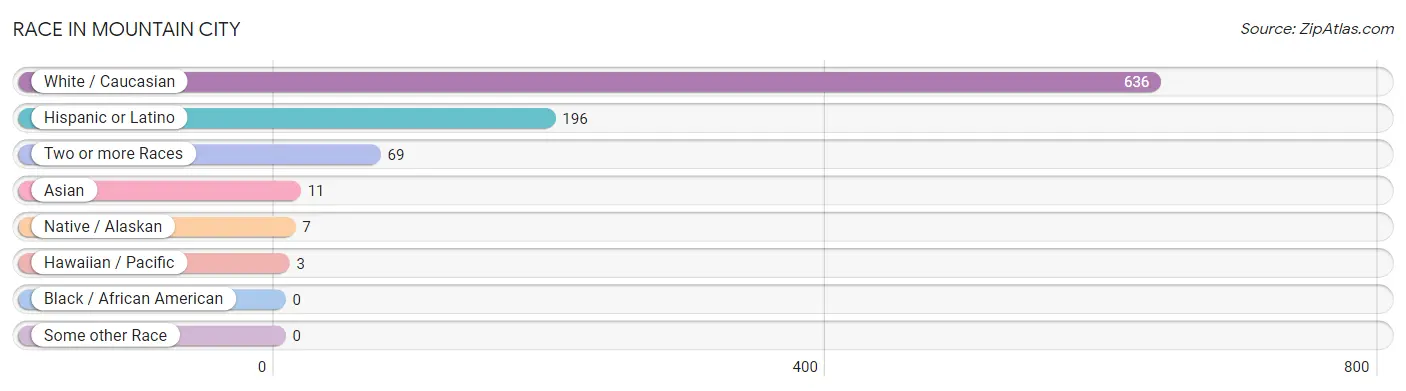
Race in Mountain City
The most populous races in Mountain City are White / Caucasian (636 | 87.6%), Hispanic or Latino (196 | 27.0%), and Two or more Races (69 | 9.5%).
| Race | # Population | % Population |
| Asian | 11 | 1.5% |
| Black / African American | 0 | 0.0% |
| Hawaiian / Pacific | 3 | 0.4% |
| Hispanic or Latino | 196 | 27.0% |
| Native / Alaskan | 7 | 1.0% |
| White / Caucasian | 636 | 87.6% |
| Two or more Races | 69 | 9.5% |
| Some other Race | 0 | 0.0% |
| Total | 726 | 100.0% |
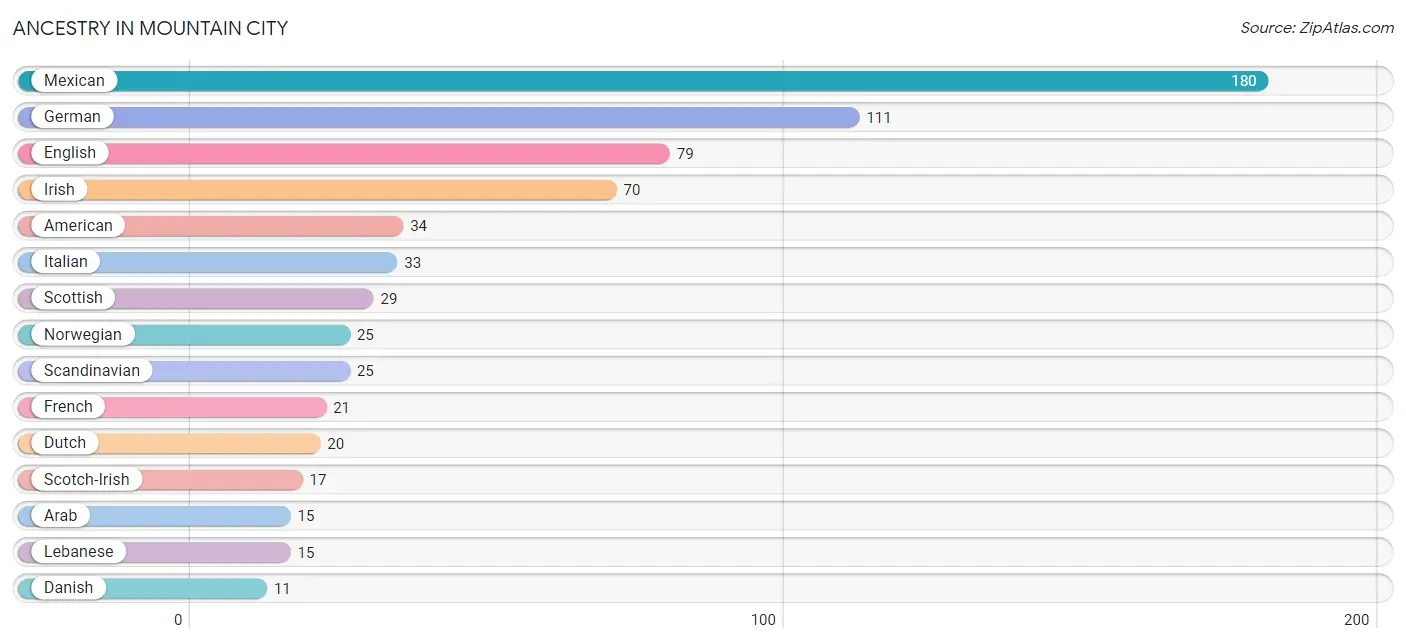
Ancestry in Mountain City
The most populous ancestries reported in Mountain City are Mexican (180 | 24.8%), German (111 | 15.3%), English (79 | 10.9%), Irish (70 | 9.6%), and American (34 | 4.7%), together accounting for 65.3% of all Mountain City residents.
| Ancestry | # Population | % Population |
| American | 34 | 4.7% |
| Arab | 15 | 2.1% |
| Austrian | 7 | 1.0% |
| Belgian | 7 | 1.0% |
| Bhutanese | 7 | 1.0% |
| Czech | 2 | 0.3% |
| Danish | 11 | 1.5% |
| Dutch | 20 | 2.8% |
| English | 79 | 10.9% |
| European | 4 | 0.5% |
| Finnish | 2 | 0.3% |
| French | 21 | 2.9% |
| German | 111 | 15.3% |
| Indian (Asian) | 4 | 0.5% |
| Irish | 70 | 9.6% |
| Italian | 33 | 4.5% |
| Korean | 2 | 0.3% |
| Latvian | 2 | 0.3% |
| Lebanese | 15 | 2.1% |
| Mexican | 180 | 24.8% |
| Mexican American Indian | 6 | 0.8% |
| Native Hawaiian | 3 | 0.4% |
| Norwegian | 25 | 3.4% |
| Polish | 8 | 1.1% |
| Scandinavian | 25 | 3.4% |
| Scotch-Irish | 17 | 2.3% |
| Scottish | 29 | 4.0% |
| Spaniard | 2 | 0.3% |
| Swedish | 3 | 0.4% |
| Ukrainian | 5 | 0.7% |
| Welsh | 2 | 0.3% | View All 31 Rows |
Immigrants in Mountain City
The most numerous immigrant groups reported in Mountain City came from Central America (18 | 2.5%), Latin America (18 | 2.5%), Mexico (18 | 2.5%), Asia (2 | 0.3%), and Canada (2 | 0.3%), together accounting for 8.0% of all Mountain City residents.
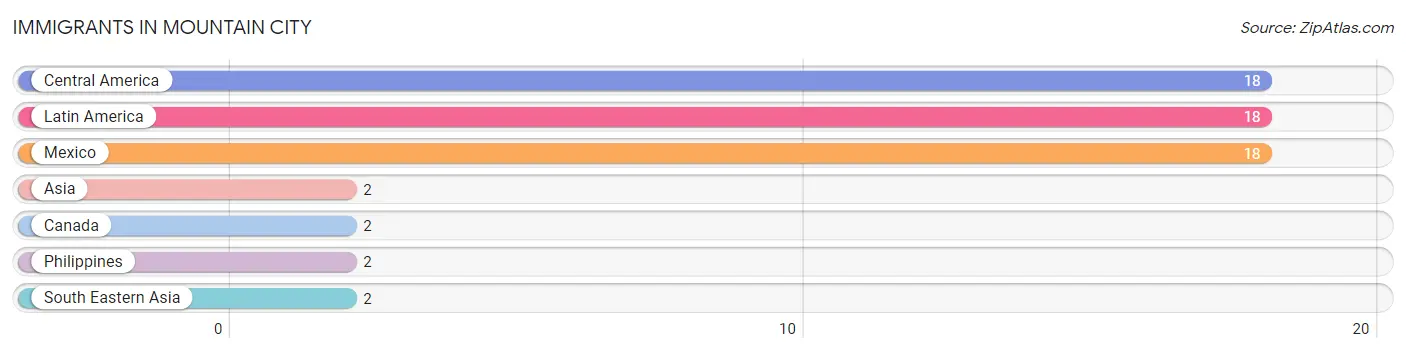
| Immigration Origin | # Population | % Population |
| Asia | 2 | 0.3% |
| Canada | 2 | 0.3% |
| Central America | 18 | 2.5% |
| Latin America | 18 | 2.5% |
| Mexico | 18 | 2.5% |
| Philippines | 2 | 0.3% |
| South Eastern Asia | 2 | 0.3% | View All 7 Rows |
Sex and Age in Mountain City
Sex and Age in Mountain City
The most populous age groups in Mountain City are 10 to 14 Years (53 | 13.3%) for men and 50 to 54 Years (39 | 11.9%) for women.
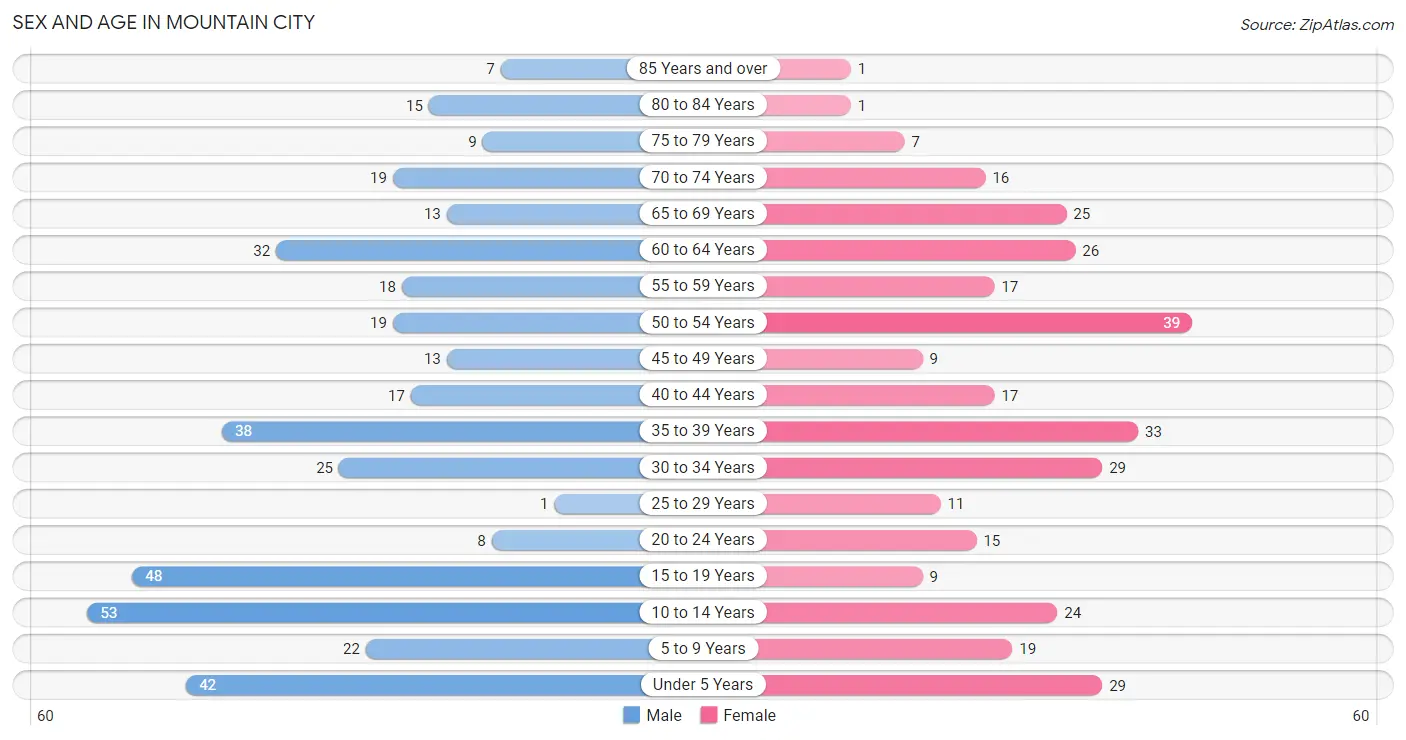
| Age Bracket | Male | Female |
| Under 5 Years | 42 (10.5%) | 29 (8.9%) |
| 5 to 9 Years | 22 (5.5%) | 19 (5.8%) |
| 10 to 14 Years | 53 (13.3%) | 24 (7.3%) |
| 15 to 19 Years | 48 (12.0%) | 9 (2.8%) |
| 20 to 24 Years | 8 (2.0%) | 15 (4.6%) |
| 25 to 29 Years | 1 (0.3%) | 11 (3.4%) |
| 30 to 34 Years | 25 (6.3%) | 29 (8.9%) |
| 35 to 39 Years | 38 (9.5%) | 33 (10.1%) |
| 40 to 44 Years | 17 (4.3%) | 17 (5.2%) |
| 45 to 49 Years | 13 (3.3%) | 9 (2.8%) |
| 50 to 54 Years | 19 (4.8%) | 39 (11.9%) |
| 55 to 59 Years | 18 (4.5%) | 17 (5.2%) |
| 60 to 64 Years | 32 (8.0%) | 26 (8.0%) |
| 65 to 69 Years | 13 (3.3%) | 25 (7.6%) |
| 70 to 74 Years | 19 (4.8%) | 16 (4.9%) |
| 75 to 79 Years | 9 (2.3%) | 7 (2.1%) |
| 80 to 84 Years | 15 (3.8%) | 1 (0.3%) |
| 85 Years and over | 7 (1.8%) | 1 (0.3%) |
| Total | 399 (100.0%) | 327 (100.0%) |
Families and Households in Mountain City
Median Family Size in Mountain City
The median family size in Mountain City is 3.33 persons per family, with married-couple families (179 | 89.5%) accounting for the largest median family size of 3.42 persons per family. On the other hand, single male/father families (2 | 1.0%) represent the smallest median family size with 2.50 persons per family.
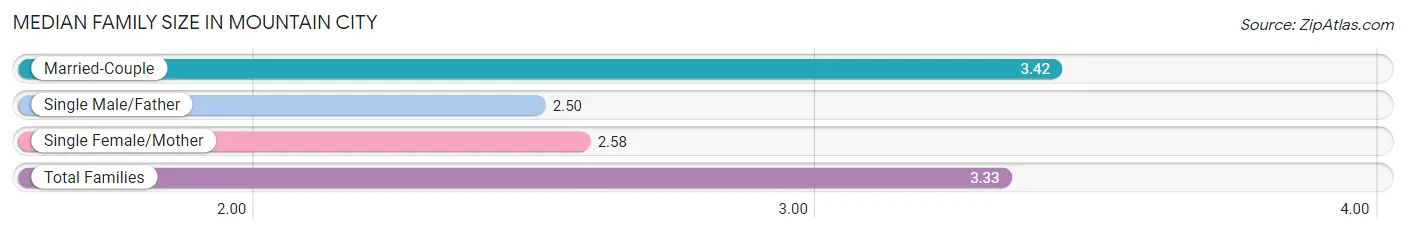
| Family Type | # Families | Family Size |
| Married-Couple | 179 (89.5%) | 3.42 |
| Single Male/Father | 2 (1.0%) | 2.50 |
| Single Female/Mother | 19 (9.5%) | 2.58 |
| Total Families | 200 (100.0%) | 3.33 |
Median Household Size in Mountain City
The median household size in Mountain City is 3.03 persons per household, with married-couple households (179 | 74.6%) accounting for the largest median household size of 3.44 persons per household. non-family households (40 | 16.7%) represent the smallest median household size with 1.43 persons per household.
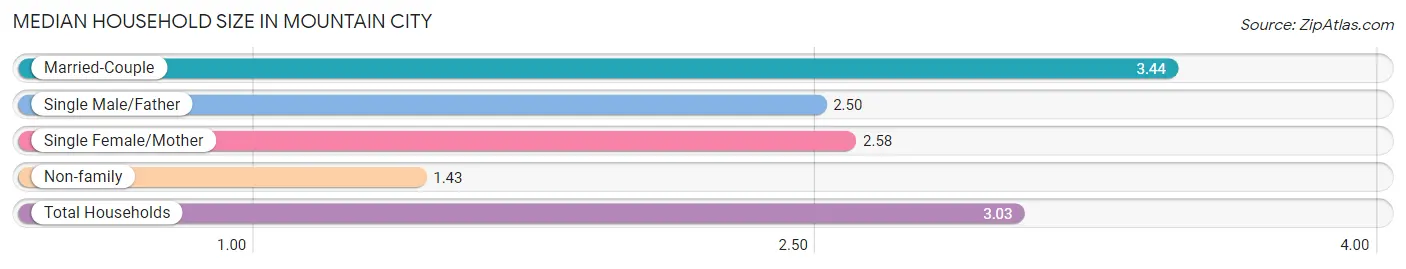
| Household Type | # Households | Household Size |
| Married-Couple | 179 (74.6%) | 3.44 |
| Single Male/Father | 2 (0.8%) | 2.50 |
| Single Female/Mother | 19 (7.9%) | 2.58 |
| Non-family | 40 (16.7%) | 1.43 |
| Total Households | 240 (100.0%) | 3.03 |
Household Size by Marriage Status in Mountain City
Out of a total of 240 households in Mountain City, 200 (83.3%) are family households, while 40 (16.7%) are nonfamily households. The most numerous type of family households are 2-person households, comprising 89, and the most common type of nonfamily households are 1-person households, comprising 22.
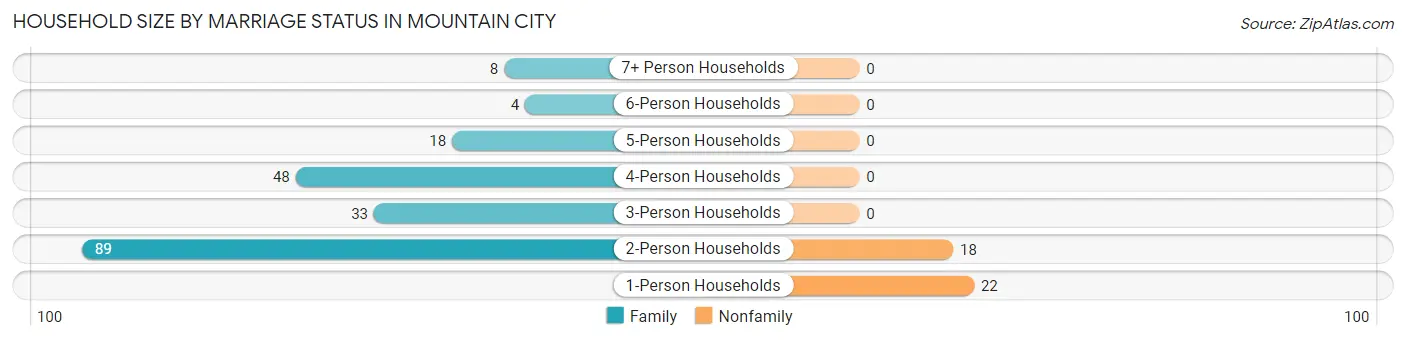
| Household Size | Family Households | Nonfamily Households |
| 1-Person Households | - | 22 (9.2%) |
| 2-Person Households | 89 (37.1%) | 18 (7.5%) |
| 3-Person Households | 33 (13.8%) | 0 (0.0%) |
| 4-Person Households | 48 (20.0%) | 0 (0.0%) |
| 5-Person Households | 18 (7.5%) | 0 (0.0%) |
| 6-Person Households | 4 (1.7%) | 0 (0.0%) |
| 7+ Person Households | 8 (3.3%) | 0 (0.0%) |
| Total | 200 (83.3%) | 40 (16.7%) |
Female Fertility in Mountain City
Fertility by Age in Mountain City
Average fertility rate in Mountain City is 118.0 births per 1,000 women. Women in the age bracket of 20 to 34 years have the highest fertility rate with 200.0 births per 1,000 women. Women in the age bracket of 20 to 34 years acount for 73.3% of all women with births.
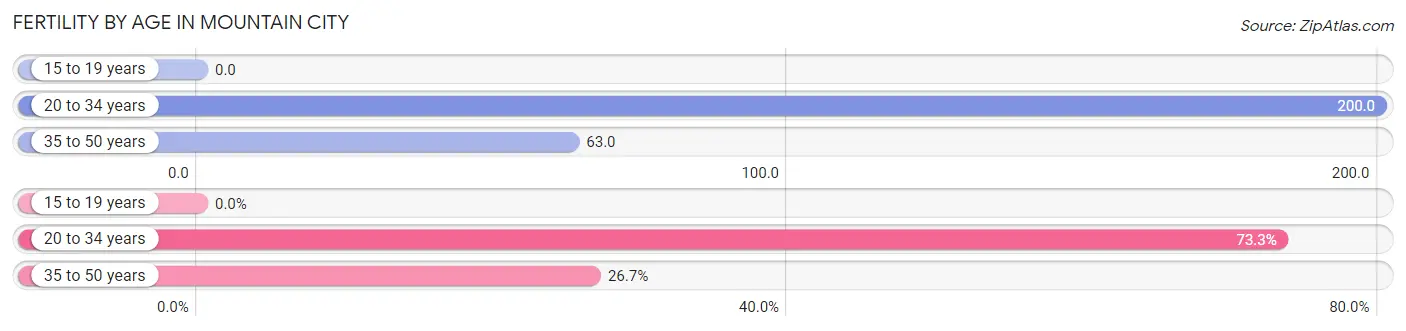
| Age Bracket | Women with Births | Births / 1,000 Women |
| 15 to 19 years | 0 (0.0%) | 0.0 |
| 20 to 34 years | 11 (73.3%) | 200.0 |
| 35 to 50 years | 4 (26.7%) | 63.0 |
| Total | 15 (100.0%) | 118.0 |
Fertility by Age by Marriage Status in Mountain City
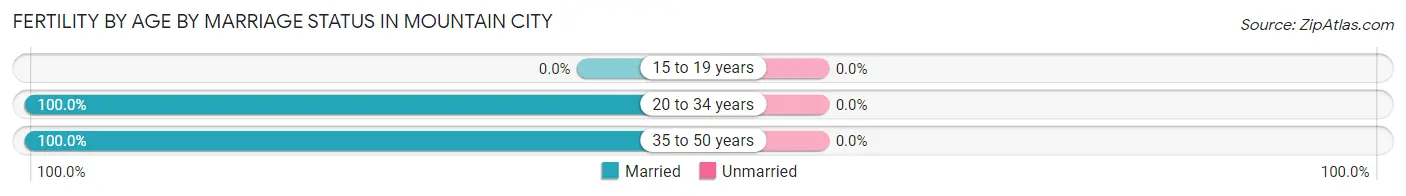
| Age Bracket | Married | Unmarried |
| 15 to 19 years | 0 (0.0%) | 0 (0.0%) |
| 20 to 34 years | 11 (100.0%) | 0 (0.0%) |
| 35 to 50 years | 4 (100.0%) | 0 (0.0%) |
| Total | 15 (100.0%) | 0 (0.0%) |
Fertility by Education in Mountain City
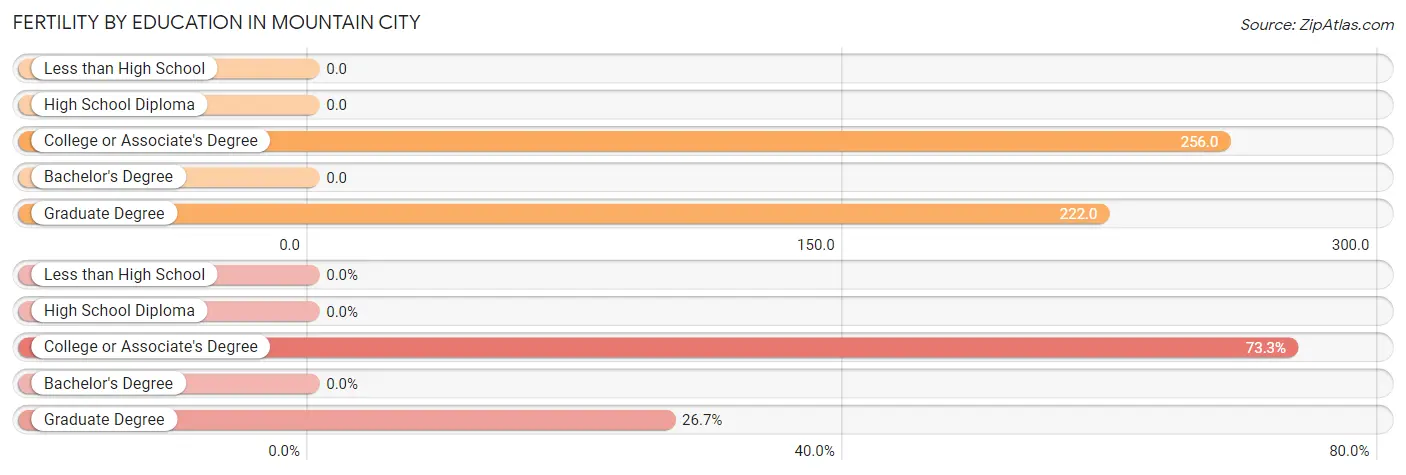
| Educational Attainment | Women with Births | Births / 1,000 Women |
| Less than High School | 0 (0.0%) | 0.0 |
| High School Diploma | 0 (0.0%) | 0.0 |
| College or Associate's Degree | 11 (73.3%) | 256.0 |
| Bachelor's Degree | 0 (0.0%) | 0.0 |
| Graduate Degree | 4 (26.7%) | 222.0 |
| Total | 15 (100.0%) | 118.0 |
Fertility by Education by Marriage Status in Mountain City
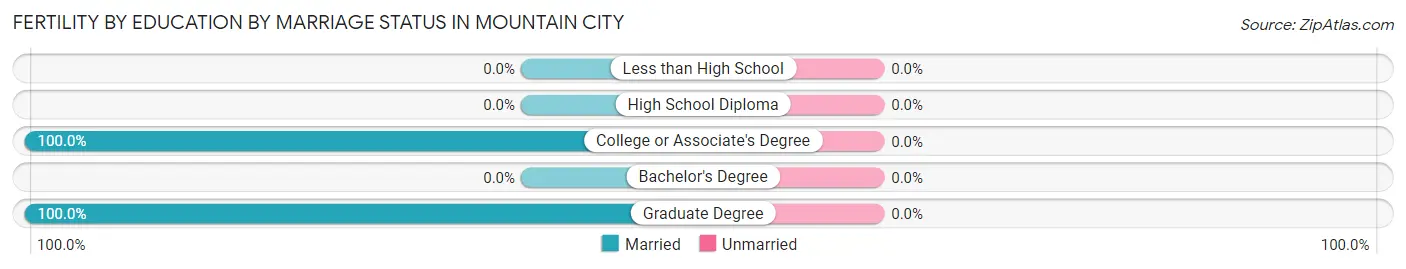
| Educational Attainment | Married | Unmarried |
| Less than High School | 0 (0.0%) | 0 (0.0%) |
| High School Diploma | 0 (0.0%) | 0 (0.0%) |
| College or Associate's Degree | 11 (100.0%) | 0 (0.0%) |
| Bachelor's Degree | 0 (0.0%) | 0 (0.0%) |
| Graduate Degree | 4 (100.0%) | 0 (0.0%) |
| Total | 15 (100.0%) | 0 (0.0%) |
Employment Characteristics in Mountain City
Employment by Class of Employer in Mountain City
Among the 346 employed individuals in Mountain City, private company employees (177 | 51.2%), local government employees (42 | 12.1%), and not-for-profit organizations (38 | 11.0%) make up the most common classes of employment.
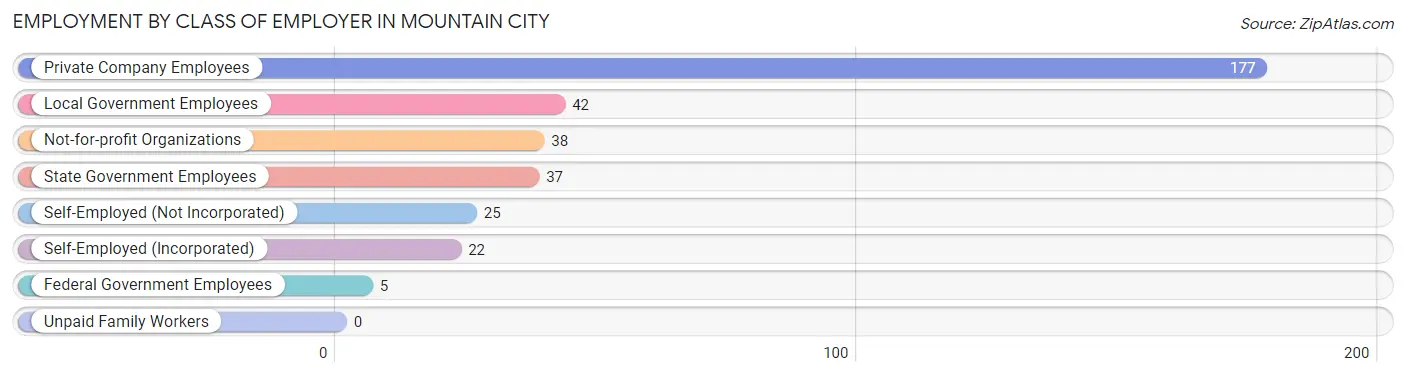
| Employer Class | # Employees | % Employees |
| Private Company Employees | 177 | 51.2% |
| Self-Employed (Incorporated) | 22 | 6.4% |
| Self-Employed (Not Incorporated) | 25 | 7.2% |
| Not-for-profit Organizations | 38 | 11.0% |
| Local Government Employees | 42 | 12.1% |
| State Government Employees | 37 | 10.7% |
| Federal Government Employees | 5 | 1.5% |
| Unpaid Family Workers | 0 | 0.0% |
| Total | 346 | 100.0% |
Employment Status by Age in Mountain City
According to the labor force statistics for Mountain City, out of the total population over 16 years of age (519), 67.2% or 349 individuals are in the labor force, with 0.3% or 1 of them unemployed. The age group with the highest labor force participation rate is 25 to 29 years, with 100.0% or 12 individuals in the labor force. Within the labor force, the 45 to 54 years age range has the highest percentage of unemployed individuals, with 1.3% or 1 of them being unemployed.
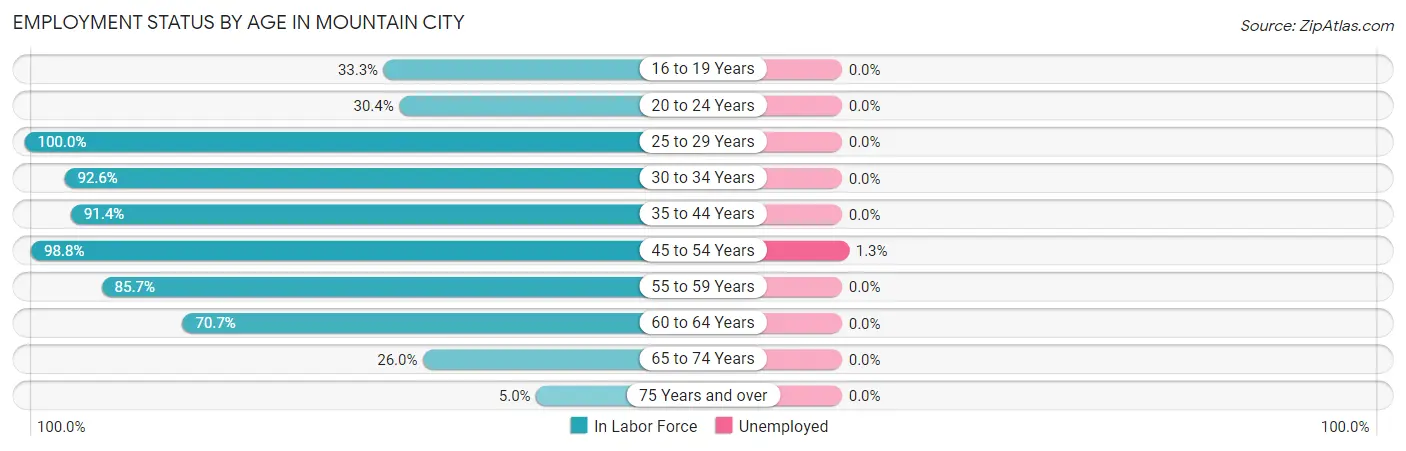
| Age Bracket | In Labor Force | Unemployed |
| 16 to 19 Years | 13 (33.3%) | 0 (0.0%) |
| 20 to 24 Years | 7 (30.4%) | 0 (0.0%) |
| 25 to 29 Years | 12 (100.0%) | 0 (0.0%) |
| 30 to 34 Years | 50 (92.6%) | 0 (0.0%) |
| 35 to 44 Years | 96 (91.4%) | 0 (0.0%) |
| 45 to 54 Years | 79 (98.8%) | 1 (1.3%) |
| 55 to 59 Years | 30 (85.7%) | 0 (0.0%) |
| 60 to 64 Years | 41 (70.7%) | 0 (0.0%) |
| 65 to 74 Years | 19 (26.0%) | 0 (0.0%) |
| 75 Years and over | 2 (5.0%) | 0 (0.0%) |
| Total | 349 (67.2%) | 1 (0.3%) |
Employment Status by Educational Attainment in Mountain City
According to labor force statistics for Mountain City, 89.5% of individuals (308) out of the total population between 25 and 64 years of age (344) are in the labor force, with 0.3% or 1 of them being unemployed. The group with the highest labor force participation rate are those with the educational attainment of bachelor's degree or higher, with 91.2% or 134 individuals in the labor force. Within the labor force, individuals with college / associate degree education have the highest percentage of unemployment, with 1.0% or 1 of them being unemployed.
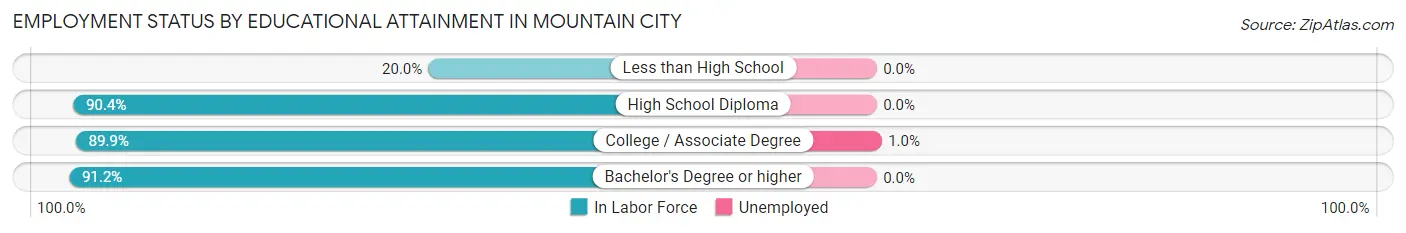
| Educational Attainment | In Labor Force | Unemployed |
| Less than High School | 1 (20.0%) | 0 (0.0%) |
| High School Diploma | 75 (90.4%) | 0 (0.0%) |
| College / Associate Degree | 98 (89.9%) | 1 (1.0%) |
| Bachelor's Degree or higher | 134 (91.2%) | 0 (0.0%) |
| Total | 308 (89.5%) | 1 (0.3%) |
Employment Occupations by Sex in Mountain City
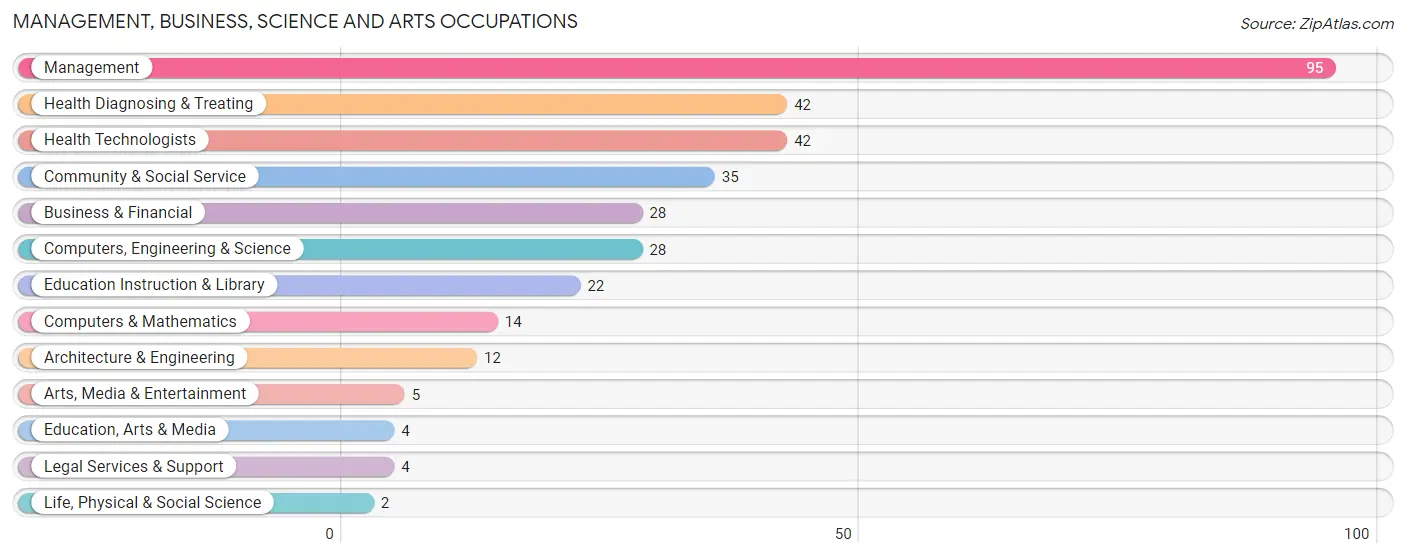
Management, Business, Science and Arts Occupations
The most common Management, Business, Science and Arts occupations in Mountain City are Management (95 | 27.3%), Health Diagnosing & Treating (42 | 12.1%), Health Technologists (42 | 12.1%), Community & Social Service (35 | 10.1%), and Business & Financial (28 | 8.1%).
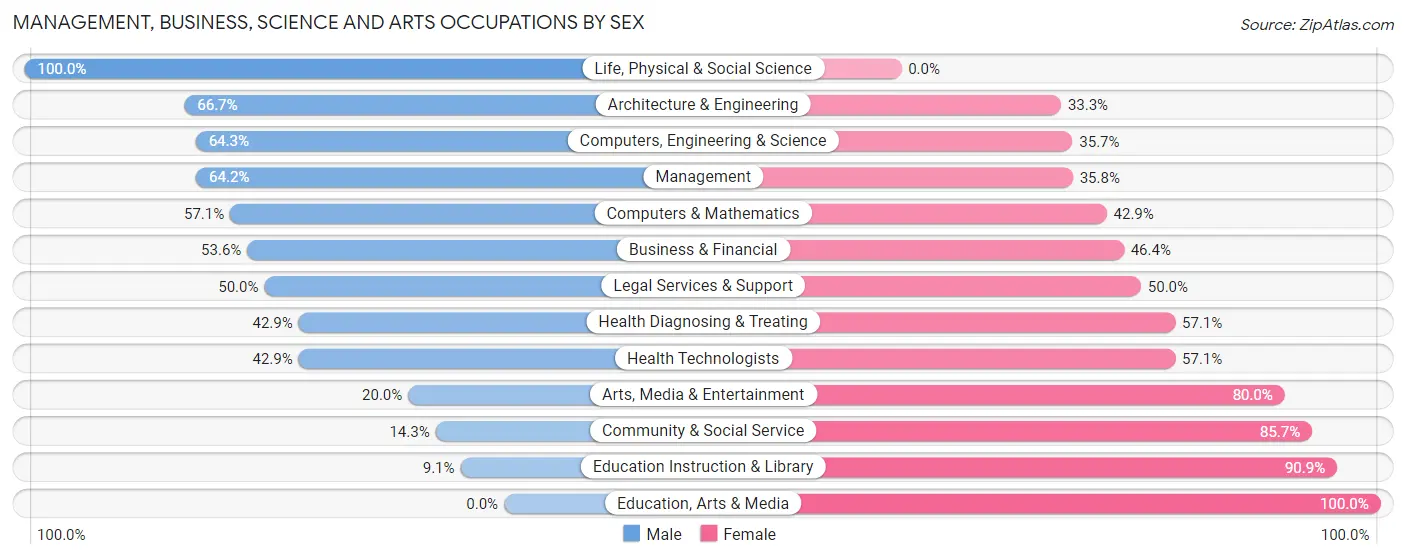
Management, Business, Science and Arts Occupations by Sex
Within the Management, Business, Science and Arts occupations in Mountain City, the most male-oriented occupations are Life, Physical & Social Science (100.0%), Architecture & Engineering (66.7%), and Computers, Engineering & Science (64.3%), while the most female-oriented occupations are Education, Arts & Media (100.0%), Education Instruction & Library (90.9%), and Community & Social Service (85.7%).
| Occupation | Male | Female |
| Management | 61 (64.2%) | 34 (35.8%) |
| Business & Financial | 15 (53.6%) | 13 (46.4%) |
| Computers, Engineering & Science | 18 (64.3%) | 10 (35.7%) |
| Computers & Mathematics | 8 (57.1%) | 6 (42.9%) |
| Architecture & Engineering | 8 (66.7%) | 4 (33.3%) |
| Life, Physical & Social Science | 2 (100.0%) | 0 (0.0%) |
| Community & Social Service | 5 (14.3%) | 30 (85.7%) |
| Education, Arts & Media | 0 (0.0%) | 4 (100.0%) |
| Legal Services & Support | 2 (50.0%) | 2 (50.0%) |
| Education Instruction & Library | 2 (9.1%) | 20 (90.9%) |
| Arts, Media & Entertainment | 1 (20.0%) | 4 (80.0%) |
| Health Diagnosing & Treating | 18 (42.9%) | 24 (57.1%) |
| Health Technologists | 18 (42.9%) | 24 (57.1%) |
| Total (Category) | 117 (51.3%) | 111 (48.7%) |
| Total (Overall) | 169 (48.6%) | 179 (51.4%) |
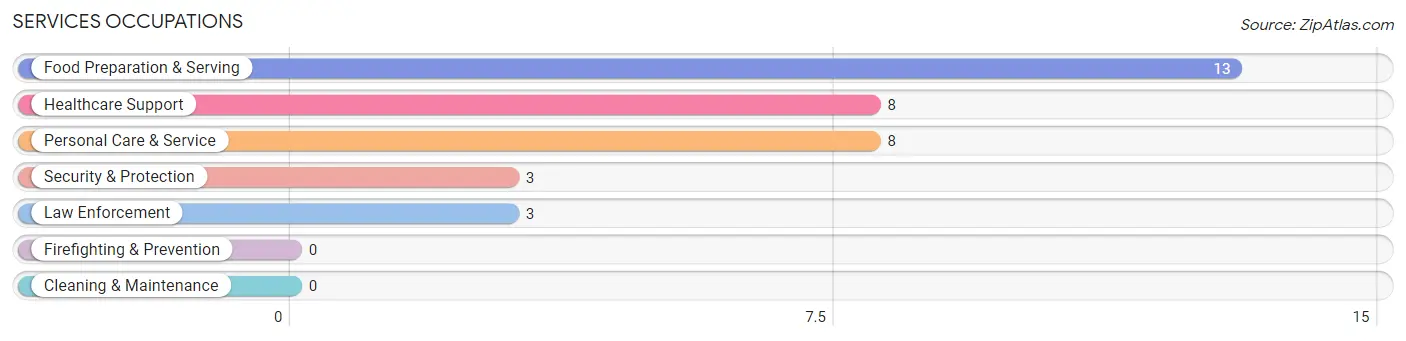
Services Occupations
The most common Services occupations in Mountain City are Food Preparation & Serving (13 | 3.7%), Healthcare Support (8 | 2.3%), Personal Care & Service (8 | 2.3%), Security & Protection (3 | 0.9%), and Law Enforcement (3 | 0.9%).
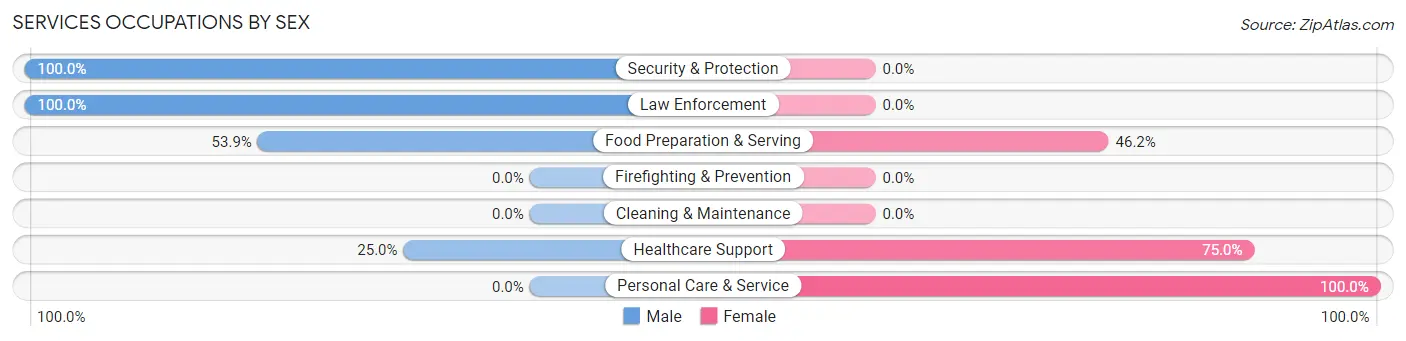
Services Occupations by Sex
Within the Services occupations in Mountain City, the most male-oriented occupations are Security & Protection (100.0%), Law Enforcement (100.0%), and Food Preparation & Serving (53.8%), while the most female-oriented occupations are Personal Care & Service (100.0%), Healthcare Support (75.0%), and Food Preparation & Serving (46.2%).
| Occupation | Male | Female |
| Healthcare Support | 2 (25.0%) | 6 (75.0%) |
| Security & Protection | 3 (100.0%) | 0 (0.0%) |
| Firefighting & Prevention | 0 (0.0%) | 0 (0.0%) |
| Law Enforcement | 3 (100.0%) | 0 (0.0%) |
| Food Preparation & Serving | 7 (53.8%) | 6 (46.2%) |
| Cleaning & Maintenance | 0 (0.0%) | 0 (0.0%) |
| Personal Care & Service | 0 (0.0%) | 8 (100.0%) |
| Total (Category) | 12 (37.5%) | 20 (62.5%) |
| Total (Overall) | 169 (48.6%) | 179 (51.4%) |
Sales and Office Occupations
The most common Sales and Office occupations in Mountain City are Office & Administration (46 | 13.2%), and Sales & Related (9 | 2.6%).
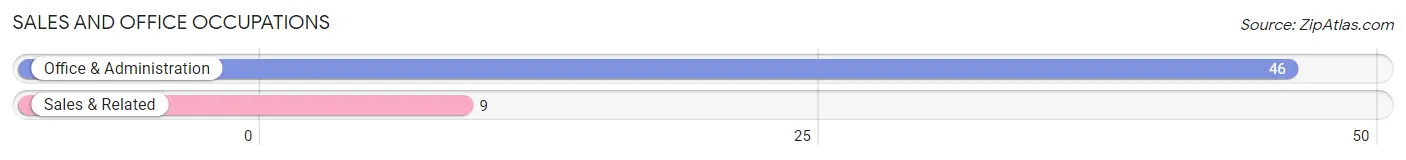
Sales and Office Occupations by Sex
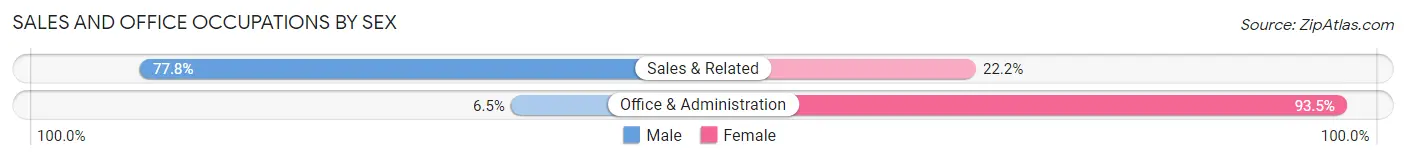
| Occupation | Male | Female |
| Sales & Related | 7 (77.8%) | 2 (22.2%) |
| Office & Administration | 3 (6.5%) | 43 (93.5%) |
| Total (Category) | 10 (18.2%) | 45 (81.8%) |
| Total (Overall) | 169 (48.6%) | 179 (51.4%) |
Natural Resources, Construction and Maintenance Occupations
The most common Natural Resources, Construction and Maintenance occupations in Mountain City are Installation, Maintenance & Repair (17 | 4.9%), and Construction & Extraction (6 | 1.7%).
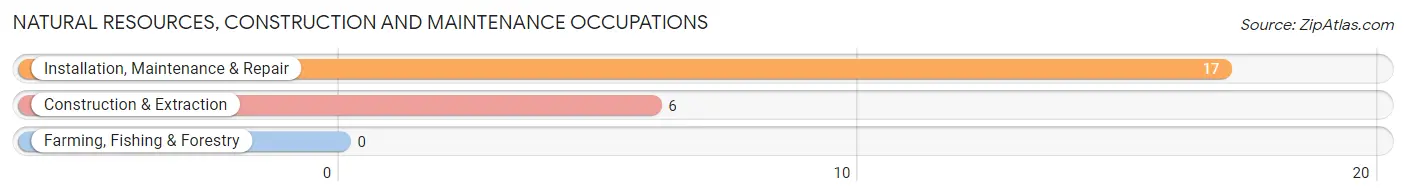
Natural Resources, Construction and Maintenance Occupations by Sex
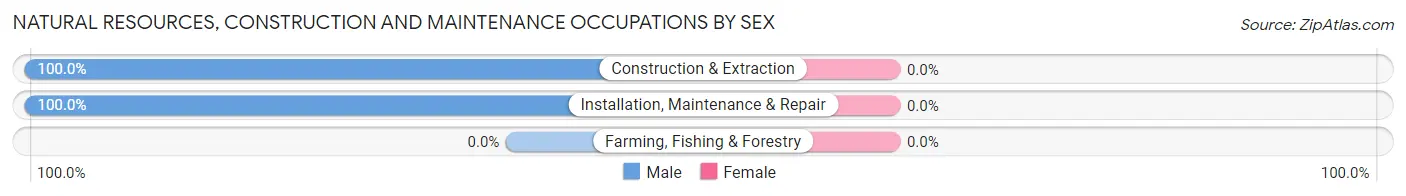
| Occupation | Male | Female |
| Farming, Fishing & Forestry | 0 (0.0%) | 0 (0.0%) |
| Construction & Extraction | 6 (100.0%) | 0 (0.0%) |
| Installation, Maintenance & Repair | 17 (100.0%) | 0 (0.0%) |
| Total (Category) | 23 (100.0%) | 0 (0.0%) |
| Total (Overall) | 169 (48.6%) | 179 (51.4%) |
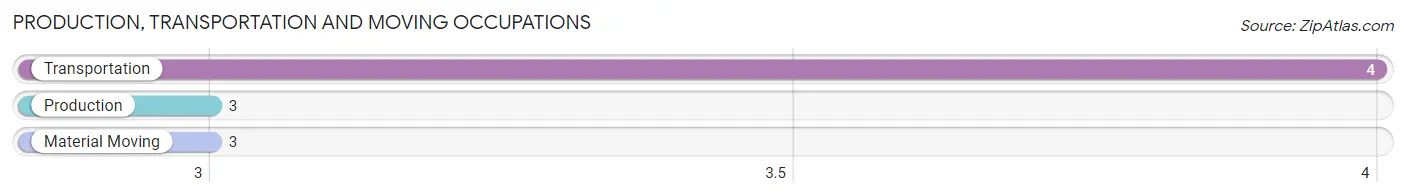
Production, Transportation and Moving Occupations
The most common Production, Transportation and Moving occupations in Mountain City are Transportation (4 | 1.1%), Production (3 | 0.9%), and Material Moving (3 | 0.9%).
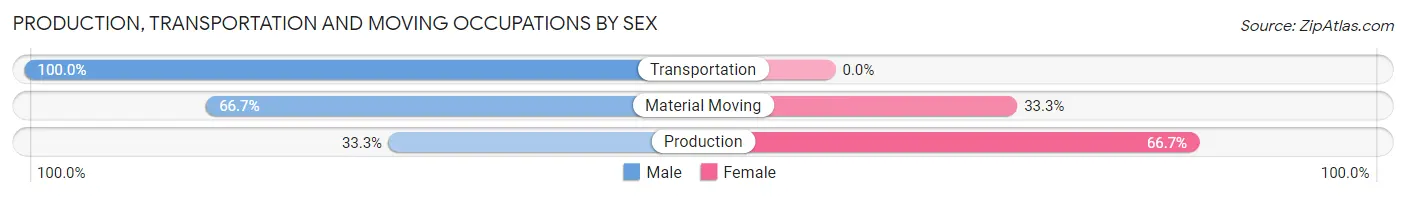
Production, Transportation and Moving Occupations by Sex
| Occupation | Male | Female |
| Production | 1 (33.3%) | 2 (66.7%) |
| Transportation | 4 (100.0%) | 0 (0.0%) |
| Material Moving | 2 (66.7%) | 1 (33.3%) |
| Total (Category) | 7 (70.0%) | 3 (30.0%) |
| Total (Overall) | 169 (48.6%) | 179 (51.4%) |
Employment Industries by Sex in Mountain City
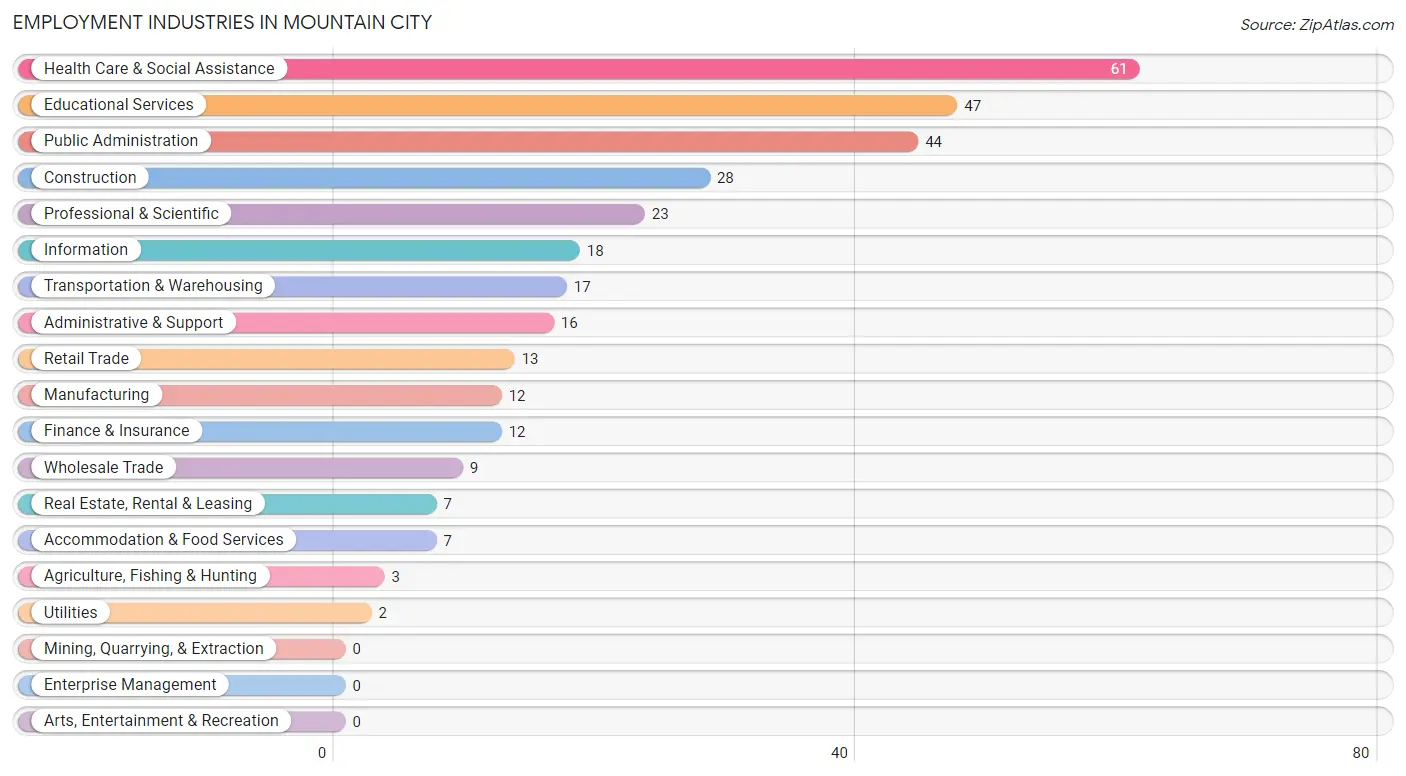
Employment Industries in Mountain City
The major employment industries in Mountain City include Health Care & Social Assistance (61 | 17.5%), Educational Services (47 | 13.5%), Public Administration (44 | 12.6%), Construction (28 | 8.1%), and Professional & Scientific (23 | 6.6%).
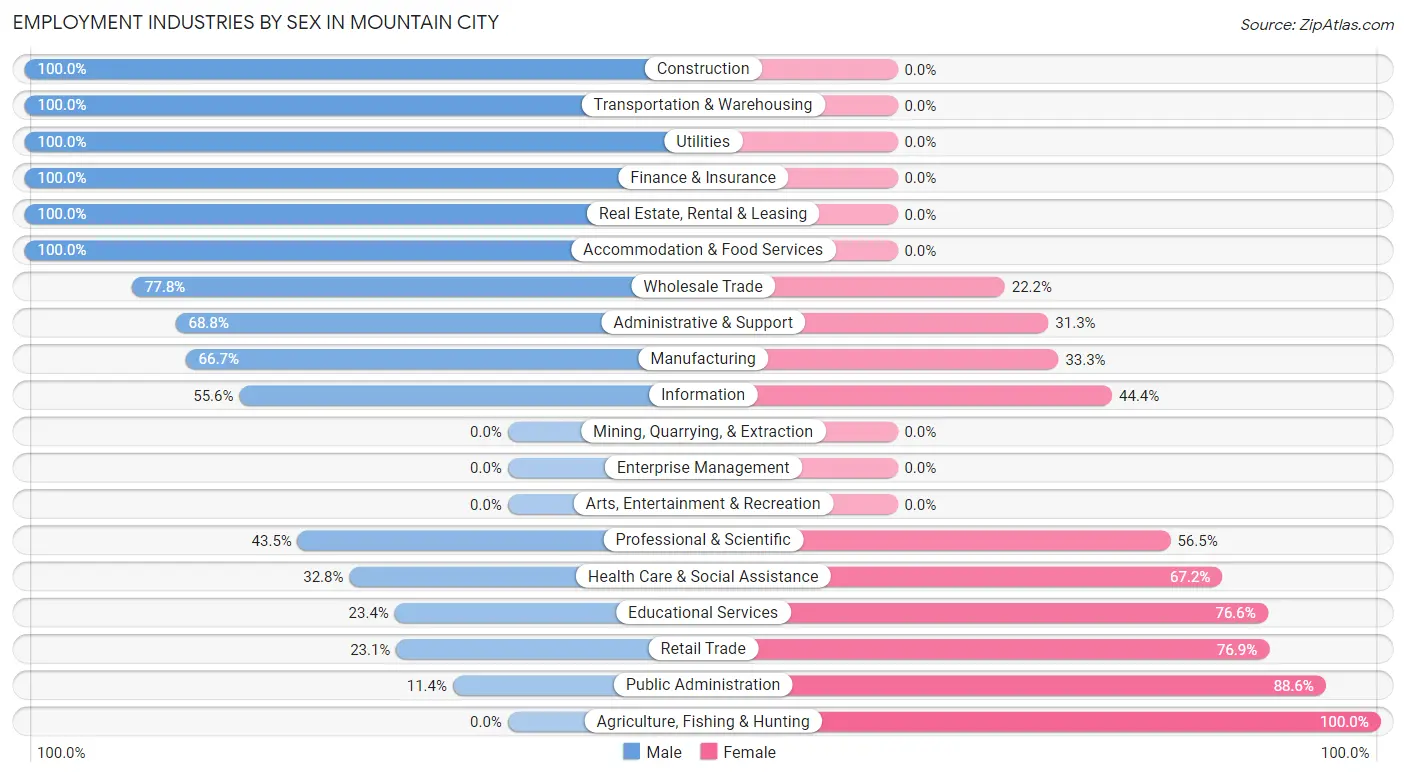
Employment Industries by Sex in Mountain City
The Mountain City industries that see more men than women are Construction (100.0%), Transportation & Warehousing (100.0%), and Utilities (100.0%), whereas the industries that tend to have a higher number of women are Agriculture, Fishing & Hunting (100.0%), Public Administration (88.6%), and Retail Trade (76.9%).
| Industry | Male | Female |
| Agriculture, Fishing & Hunting | 0 (0.0%) | 3 (100.0%) |
| Mining, Quarrying, & Extraction | 0 (0.0%) | 0 (0.0%) |
| Construction | 28 (100.0%) | 0 (0.0%) |
| Manufacturing | 8 (66.7%) | 4 (33.3%) |
| Wholesale Trade | 7 (77.8%) | 2 (22.2%) |
| Retail Trade | 3 (23.1%) | 10 (76.9%) |
| Transportation & Warehousing | 17 (100.0%) | 0 (0.0%) |
| Utilities | 2 (100.0%) | 0 (0.0%) |
| Information | 10 (55.6%) | 8 (44.4%) |
| Finance & Insurance | 12 (100.0%) | 0 (0.0%) |
| Real Estate, Rental & Leasing | 7 (100.0%) | 0 (0.0%) |
| Professional & Scientific | 10 (43.5%) | 13 (56.5%) |
| Enterprise Management | 0 (0.0%) | 0 (0.0%) |
| Administrative & Support | 11 (68.8%) | 5 (31.2%) |
| Educational Services | 11 (23.4%) | 36 (76.6%) |
| Health Care & Social Assistance | 20 (32.8%) | 41 (67.2%) |
| Arts, Entertainment & Recreation | 0 (0.0%) | 0 (0.0%) |
| Accommodation & Food Services | 7 (100.0%) | 0 (0.0%) |
| Public Administration | 5 (11.4%) | 39 (88.6%) |
| Total | 169 (48.6%) | 179 (51.4%) |
Education in Mountain City
School Enrollment in Mountain City
The most common levels of schooling among the 224 students in Mountain City are high school (77 | 34.4%), elementary school (50 | 22.3%), and middle school (39 | 17.4%).
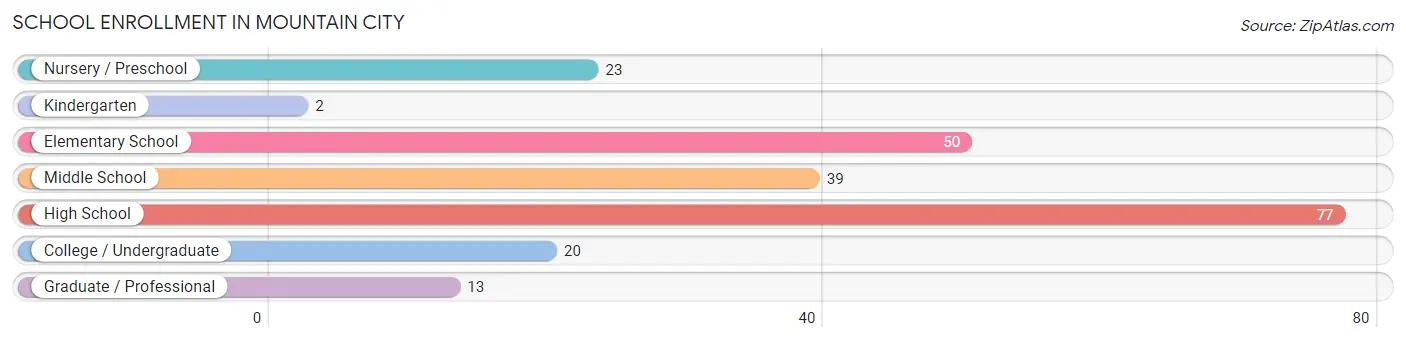
| School Level | # Students | % Students |
| Nursery / Preschool | 23 | 10.3% |
| Kindergarten | 2 | 0.9% |
| Elementary School | 50 | 22.3% |
| Middle School | 39 | 17.4% |
| High School | 77 | 34.4% |
| College / Undergraduate | 20 | 8.9% |
| Graduate / Professional | 13 | 5.8% |
| Total | 224 | 100.0% |
School Enrollment by Age by Funding Source in Mountain City
Out of a total of 224 students who are enrolled in schools in Mountain City, 14 (6.3%) attend a private institution, while the remaining 210 (93.7%) are enrolled in public schools. The age group of 5 to 9 year old has the highest likelihood of being enrolled in private schools, with 7 (17.1% in the age bracket) enrolled. Conversely, the age group of 15 to 17 year olds has the lowest likelihood of being enrolled in a private school, with 32 (100.0% in the age bracket) attending a public institution.
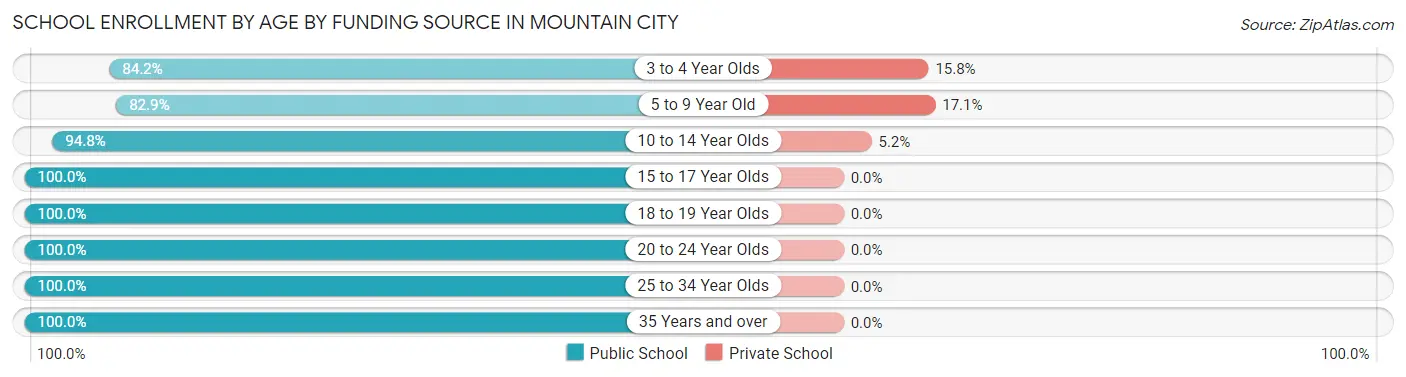
| Age Bracket | Public School | Private School |
| 3 to 4 Year Olds | 16 (84.2%) | 3 (15.8%) |
| 5 to 9 Year Old | 34 (82.9%) | 7 (17.1%) |
| 10 to 14 Year Olds | 73 (94.8%) | 4 (5.2%) |
| 15 to 17 Year Olds | 32 (100.0%) | 0 (0.0%) |
| 18 to 19 Year Olds | 22 (100.0%) | 0 (0.0%) |
| 20 to 24 Year Olds | 16 (100.0%) | 0 (0.0%) |
| 25 to 34 Year Olds | 7 (100.0%) | 0 (0.0%) |
| 35 Years and over | 10 (100.0%) | 0 (0.0%) |
| Total | 210 (93.8%) | 14 (6.3%) |
Educational Attainment by Field of Study in Mountain City
Business (39 | 17.5%), science & technology (38 | 17.0%), education (26 | 11.7%), arts & humanities (26 | 11.7%), and bio, nature & agricultural (18 | 8.1%) are the most common fields of study among 223 individuals in Mountain City who have obtained a bachelor's degree or higher.
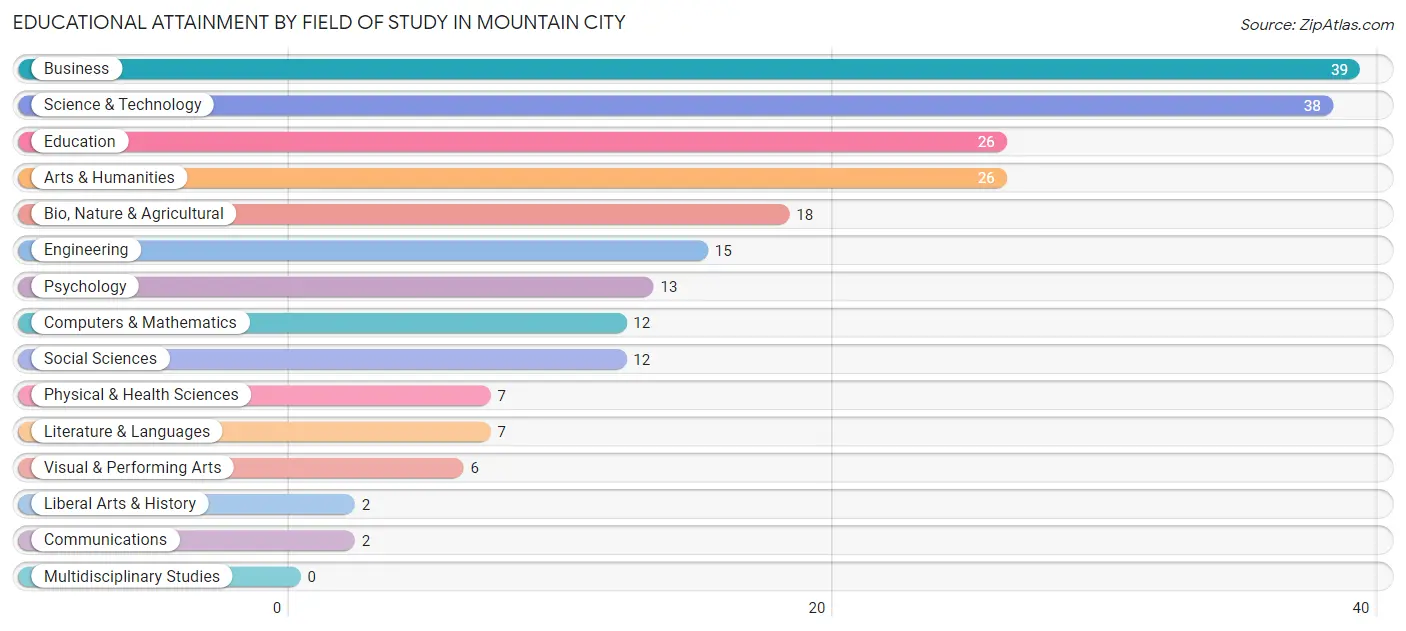
| Field of Study | # Graduates | % Graduates |
| Computers & Mathematics | 12 | 5.4% |
| Bio, Nature & Agricultural | 18 | 8.1% |
| Physical & Health Sciences | 7 | 3.1% |
| Psychology | 13 | 5.8% |
| Social Sciences | 12 | 5.4% |
| Engineering | 15 | 6.7% |
| Multidisciplinary Studies | 0 | 0.0% |
| Science & Technology | 38 | 17.0% |
| Business | 39 | 17.5% |
| Education | 26 | 11.7% |
| Literature & Languages | 7 | 3.1% |
| Liberal Arts & History | 2 | 0.9% |
| Visual & Performing Arts | 6 | 2.7% |
| Communications | 2 | 0.9% |
| Arts & Humanities | 26 | 11.7% |
| Total | 223 | 100.0% |
Transportation & Commute in Mountain City
Vehicle Availability by Sex in Mountain City
The most prevalent vehicle ownership categories in Mountain City are males with 2 vehicles (81, accounting for 47.9%) and females with 2 vehicles (79, making up 45.8%).
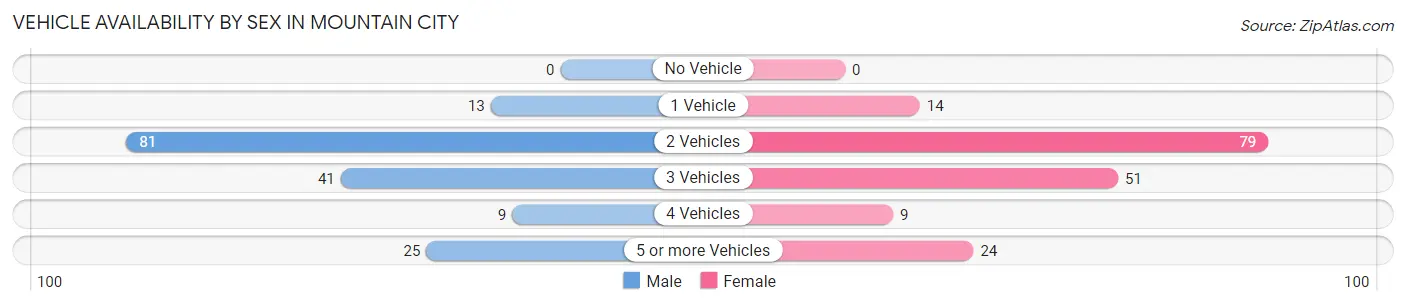
| Vehicles Available | Male | Female |
| No Vehicle | 0 (0.0%) | 0 (0.0%) |
| 1 Vehicle | 13 (7.7%) | 14 (7.9%) |
| 2 Vehicles | 81 (47.9%) | 79 (44.6%) |
| 3 Vehicles | 41 (24.3%) | 51 (28.8%) |
| 4 Vehicles | 9 (5.3%) | 9 (5.1%) |
| 5 or more Vehicles | 25 (14.8%) | 24 (13.6%) |
| Total | 169 (100.0%) | 177 (100.0%) |
Commute Time in Mountain City
The most frequently occuring commute durations in Mountain City are 45 to 59 minutes (77 commuters, 26.6%), 20 to 24 minutes (40 commuters, 13.8%), and 30 to 34 minutes (38 commuters, 13.2%).
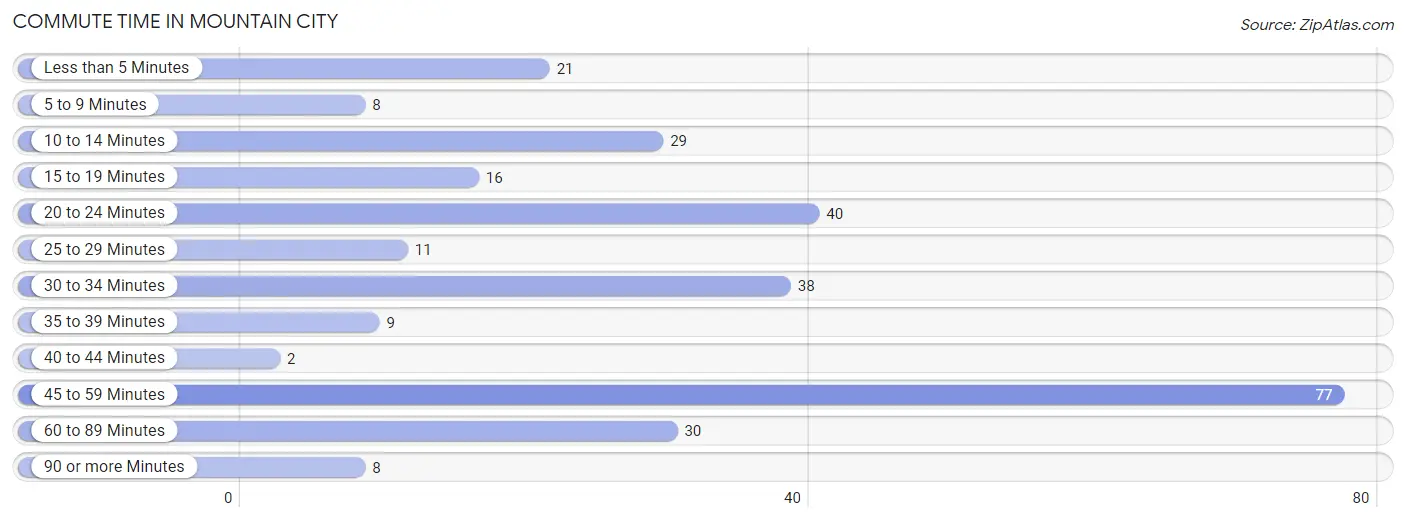
| Commute Time | # Commuters | % Commuters |
| Less than 5 Minutes | 21 | 7.3% |
| 5 to 9 Minutes | 8 | 2.8% |
| 10 to 14 Minutes | 29 | 10.0% |
| 15 to 19 Minutes | 16 | 5.5% |
| 20 to 24 Minutes | 40 | 13.8% |
| 25 to 29 Minutes | 11 | 3.8% |
| 30 to 34 Minutes | 38 | 13.2% |
| 35 to 39 Minutes | 9 | 3.1% |
| 40 to 44 Minutes | 2 | 0.7% |
| 45 to 59 Minutes | 77 | 26.6% |
| 60 to 89 Minutes | 30 | 10.4% |
| 90 or more Minutes | 8 | 2.8% |
Commute Time by Sex in Mountain City
The most common commute times in Mountain City are 45 to 59 minutes (50 commuters, 33.3%) for males and 20 to 24 minutes (30 commuters, 21.6%) for females.
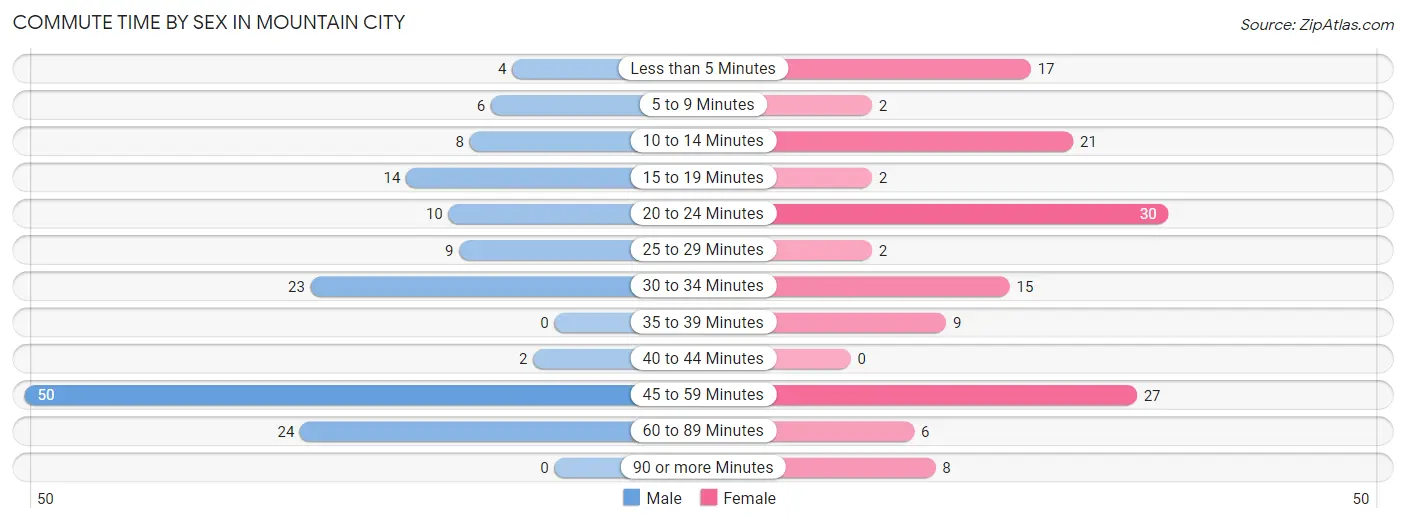
| Commute Time | Male | Female |
| Less than 5 Minutes | 4 (2.7%) | 17 (12.2%) |
| 5 to 9 Minutes | 6 (4.0%) | 2 (1.4%) |
| 10 to 14 Minutes | 8 (5.3%) | 21 (15.1%) |
| 15 to 19 Minutes | 14 (9.3%) | 2 (1.4%) |
| 20 to 24 Minutes | 10 (6.7%) | 30 (21.6%) |
| 25 to 29 Minutes | 9 (6.0%) | 2 (1.4%) |
| 30 to 34 Minutes | 23 (15.3%) | 15 (10.8%) |
| 35 to 39 Minutes | 0 (0.0%) | 9 (6.5%) |
| 40 to 44 Minutes | 2 (1.3%) | 0 (0.0%) |
| 45 to 59 Minutes | 50 (33.3%) | 27 (19.4%) |
| 60 to 89 Minutes | 24 (16.0%) | 6 (4.3%) |
| 90 or more Minutes | 0 (0.0%) | 8 (5.8%) |
Time of Departure to Work by Sex in Mountain City
The most frequent times of departure to work in Mountain City are 6:00 AM to 6:29 AM (31, 20.7%) for males and 6:00 AM to 6:29 AM (36, 25.9%) for females.
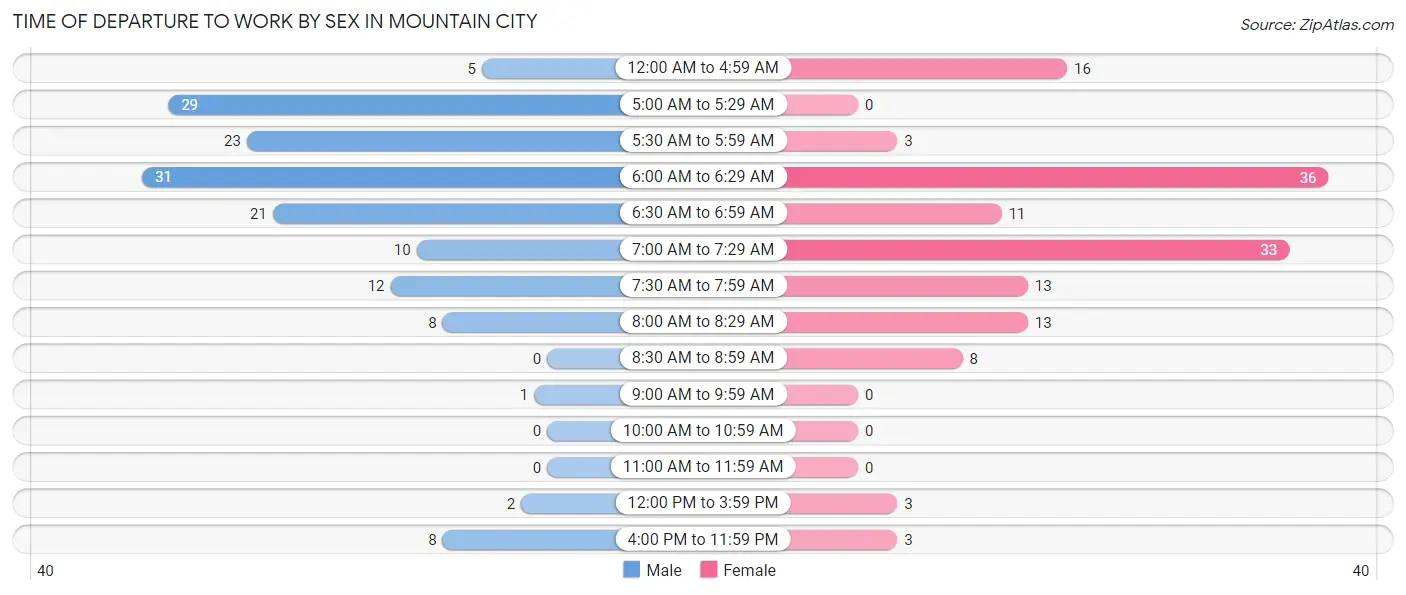
| Time of Departure | Male | Female |
| 12:00 AM to 4:59 AM | 5 (3.3%) | 16 (11.5%) |
| 5:00 AM to 5:29 AM | 29 (19.3%) | 0 (0.0%) |
| 5:30 AM to 5:59 AM | 23 (15.3%) | 3 (2.2%) |
| 6:00 AM to 6:29 AM | 31 (20.7%) | 36 (25.9%) |
| 6:30 AM to 6:59 AM | 21 (14.0%) | 11 (7.9%) |
| 7:00 AM to 7:29 AM | 10 (6.7%) | 33 (23.7%) |
| 7:30 AM to 7:59 AM | 12 (8.0%) | 13 (9.3%) |
| 8:00 AM to 8:29 AM | 8 (5.3%) | 13 (9.3%) |
| 8:30 AM to 8:59 AM | 0 (0.0%) | 8 (5.8%) |
| 9:00 AM to 9:59 AM | 1 (0.7%) | 0 (0.0%) |
| 10:00 AM to 10:59 AM | 0 (0.0%) | 0 (0.0%) |
| 11:00 AM to 11:59 AM | 0 (0.0%) | 0 (0.0%) |
| 12:00 PM to 3:59 PM | 2 (1.3%) | 3 (2.2%) |
| 4:00 PM to 11:59 PM | 8 (5.3%) | 3 (2.2%) |
| Total | 150 (100.0%) | 139 (100.0%) |
Housing Occupancy in Mountain City
Occupancy by Ownership in Mountain City
Of the total 240 dwellings in Mountain City, owner-occupied units account for 223 (92.9%), while renter-occupied units make up 17 (7.1%).
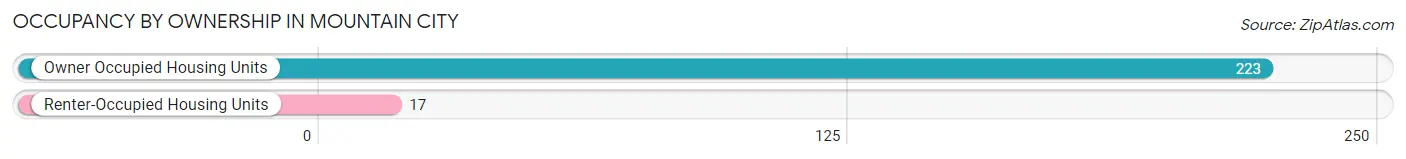
| Occupancy | # Housing Units | % Housing Units |
| Owner Occupied Housing Units | 223 | 92.9% |
| Renter-Occupied Housing Units | 17 | 7.1% |
| Total Occupied Housing Units | 240 | 100.0% |
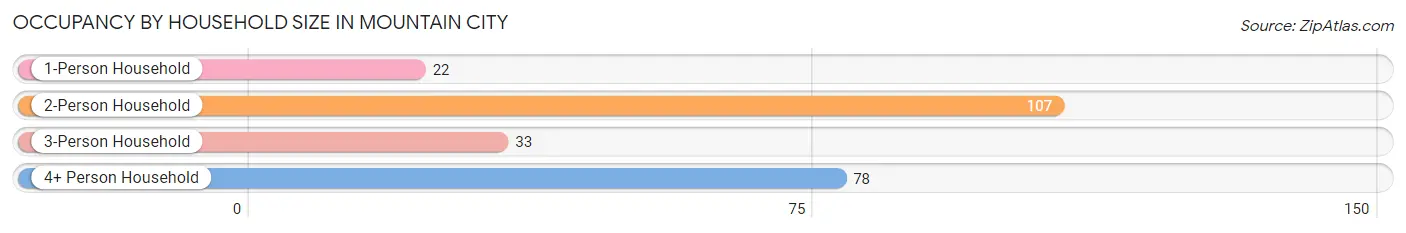
Occupancy by Household Size in Mountain City
| Household Size | # Housing Units | % Housing Units |
| 1-Person Household | 22 | 9.2% |
| 2-Person Household | 107 | 44.6% |
| 3-Person Household | 33 | 13.8% |
| 4+ Person Household | 78 | 32.5% |
| Total Housing Units | 240 | 100.0% |
Occupancy by Ownership by Household Size in Mountain City
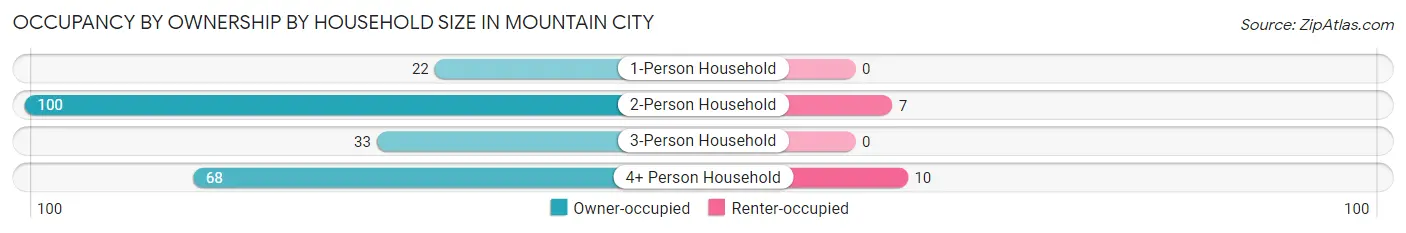
| Household Size | Owner-occupied | Renter-occupied |
| 1-Person Household | 22 (100.0%) | 0 (0.0%) |
| 2-Person Household | 100 (93.5%) | 7 (6.5%) |
| 3-Person Household | 33 (100.0%) | 0 (0.0%) |
| 4+ Person Household | 68 (87.2%) | 10 (12.8%) |
| Total Housing Units | 223 (92.9%) | 17 (7.1%) |
Occupancy by Educational Attainment in Mountain City
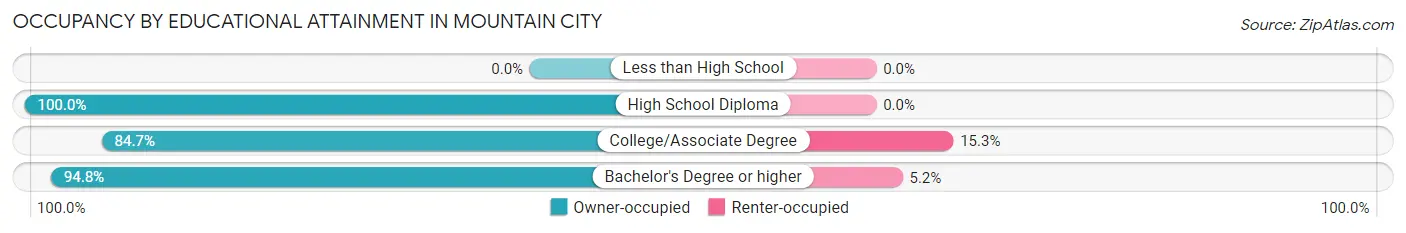
| Household Size | Owner-occupied | Renter-occupied |
| Less than High School | 0 (0.0%) | 0 (0.0%) |
| High School Diploma | 53 (100.0%) | 0 (0.0%) |
| College/Associate Degree | 61 (84.7%) | 11 (15.3%) |
| Bachelor's Degree or higher | 109 (94.8%) | 6 (5.2%) |
Occupancy by Age of Householder in Mountain City
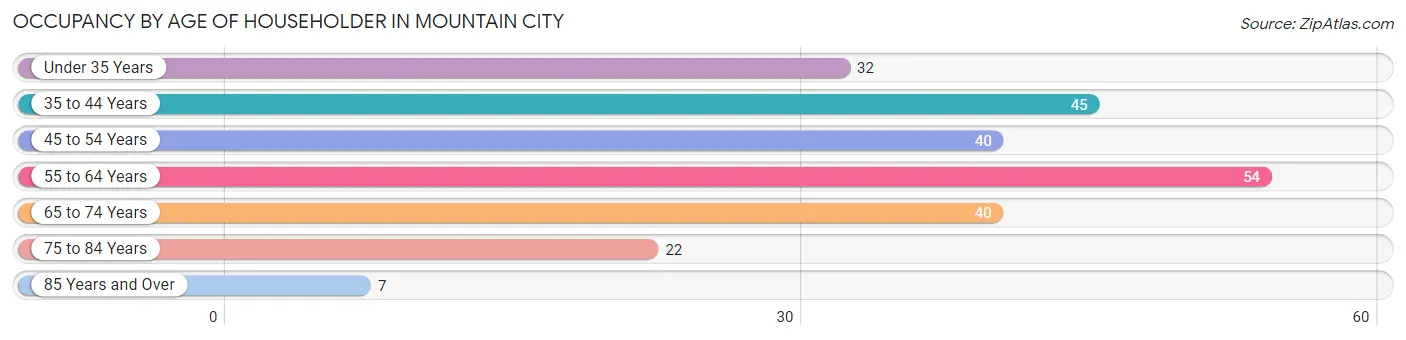
| Age Bracket | # Households | % Households |
| Under 35 Years | 32 | 13.3% |
| 35 to 44 Years | 45 | 18.8% |
| 45 to 54 Years | 40 | 16.7% |
| 55 to 64 Years | 54 | 22.5% |
| 65 to 74 Years | 40 | 16.7% |
| 75 to 84 Years | 22 | 9.2% |
| 85 Years and Over | 7 | 2.9% |
| Total | 240 | 100.0% |
Housing Finances in Mountain City
Median Income by Occupancy in Mountain City
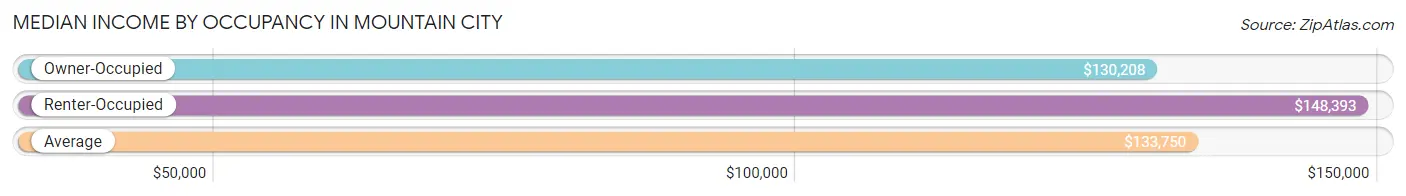
| Occupancy Type | # Households | Median Income |
| Owner-Occupied | 223 (92.9%) | $130,208 |
| Renter-Occupied | 17 (7.1%) | $148,393 |
| Average | 240 (100.0%) | $133,750 |
Occupancy by Householder Income Bracket in Mountain City
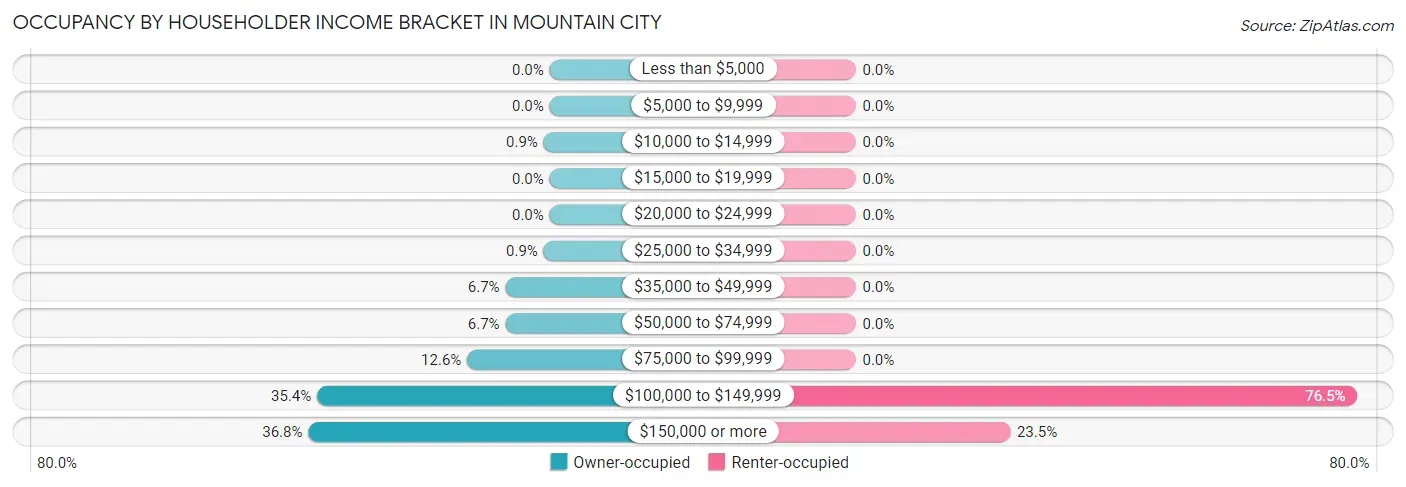
| Income Bracket | Owner-occupied | Renter-occupied |
| Less than $5,000 | 0 (0.0%) | 0 (0.0%) |
| $5,000 to $9,999 | 0 (0.0%) | 0 (0.0%) |
| $10,000 to $14,999 | 2 (0.9%) | 0 (0.0%) |
| $15,000 to $19,999 | 0 (0.0%) | 0 (0.0%) |
| $20,000 to $24,999 | 0 (0.0%) | 0 (0.0%) |
| $25,000 to $34,999 | 2 (0.9%) | 0 (0.0%) |
| $35,000 to $49,999 | 15 (6.7%) | 0 (0.0%) |
| $50,000 to $74,999 | 15 (6.7%) | 0 (0.0%) |
| $75,000 to $99,999 | 28 (12.6%) | 0 (0.0%) |
| $100,000 to $149,999 | 79 (35.4%) | 13 (76.5%) |
| $150,000 or more | 82 (36.8%) | 4 (23.5%) |
| Total | 223 (100.0%) | 17 (100.0%) |
Monthly Housing Cost Tiers in Mountain City
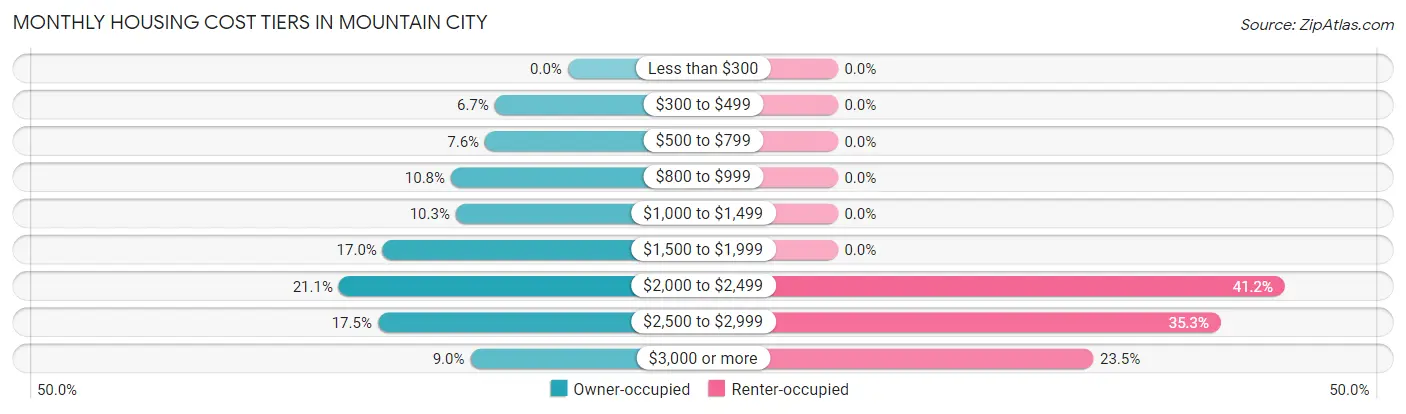
| Monthly Cost | Owner-occupied | Renter-occupied |
| Less than $300 | 0 (0.0%) | 0 (0.0%) |
| $300 to $499 | 15 (6.7%) | 0 (0.0%) |
| $500 to $799 | 17 (7.6%) | 0 (0.0%) |
| $800 to $999 | 24 (10.8%) | 0 (0.0%) |
| $1,000 to $1,499 | 23 (10.3%) | 0 (0.0%) |
| $1,500 to $1,999 | 38 (17.0%) | 0 (0.0%) |
| $2,000 to $2,499 | 47 (21.1%) | 7 (41.2%) |
| $2,500 to $2,999 | 39 (17.5%) | 6 (35.3%) |
| $3,000 or more | 20 (9.0%) | 4 (23.5%) |
| Total | 223 (100.0%) | 17 (100.0%) |
Physical Housing Characteristics in Mountain City
Housing Structures in Mountain City
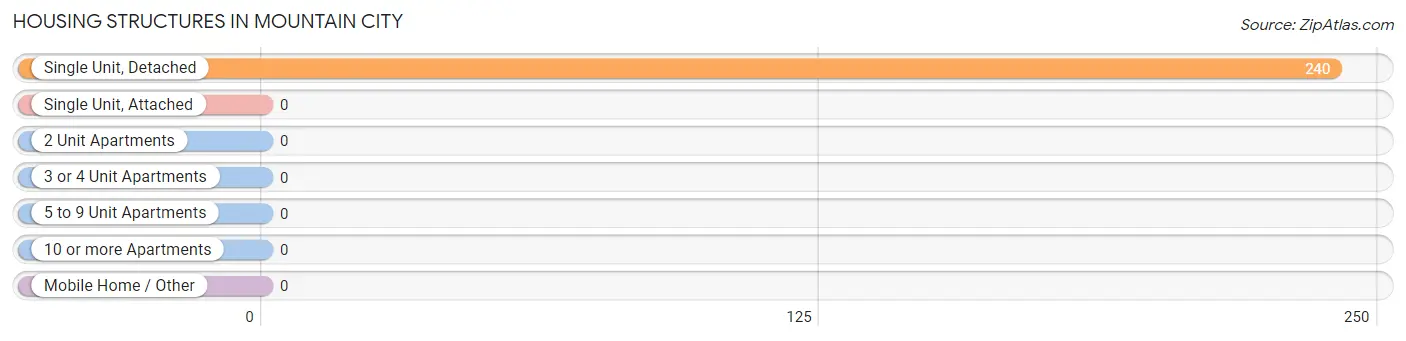
| Structure Type | # Housing Units | % Housing Units |
| Single Unit, Detached | 240 | 100.0% |
| Single Unit, Attached | 0 | 0.0% |
| 2 Unit Apartments | 0 | 0.0% |
| 3 or 4 Unit Apartments | 0 | 0.0% |
| 5 to 9 Unit Apartments | 0 | 0.0% |
| 10 or more Apartments | 0 | 0.0% |
| Mobile Home / Other | 0 | 0.0% |
| Total | 240 | 100.0% |
Housing Structures by Occupancy in Mountain City
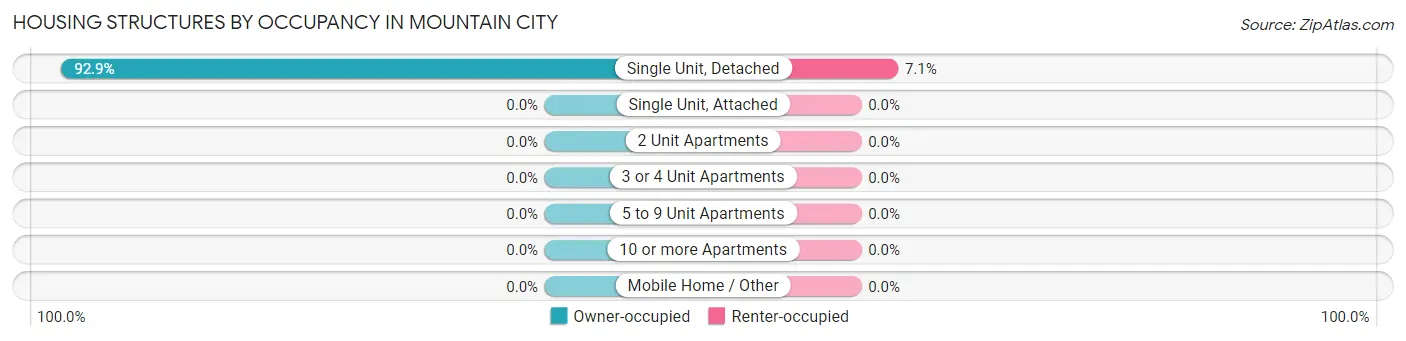
| Structure Type | Owner-occupied | Renter-occupied |
| Single Unit, Detached | 223 (92.9%) | 17 (7.1%) |
| Single Unit, Attached | 0 (0.0%) | 0 (0.0%) |
| 2 Unit Apartments | 0 (0.0%) | 0 (0.0%) |
| 3 or 4 Unit Apartments | 0 (0.0%) | 0 (0.0%) |
| 5 to 9 Unit Apartments | 0 (0.0%) | 0 (0.0%) |
| 10 or more Apartments | 0 (0.0%) | 0 (0.0%) |
| Mobile Home / Other | 0 (0.0%) | 0 (0.0%) |
| Total | 223 (92.9%) | 17 (7.1%) |
Housing Structures by Number of Rooms in Mountain City
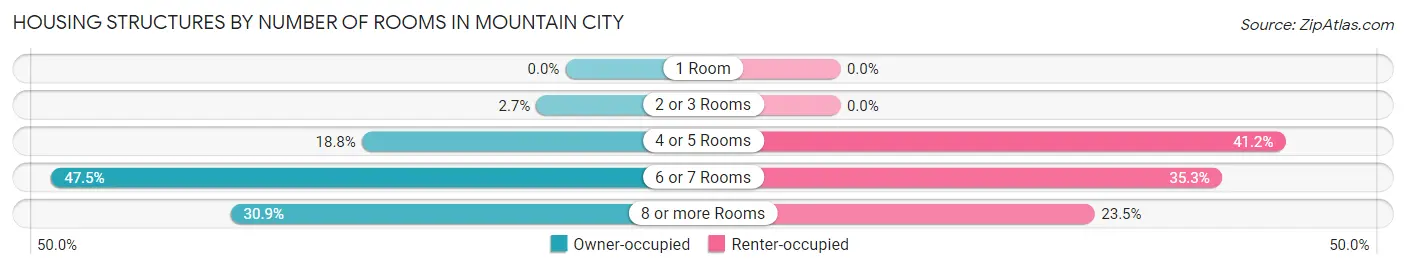
| Number of Rooms | Owner-occupied | Renter-occupied |
| 1 Room | 0 (0.0%) | 0 (0.0%) |
| 2 or 3 Rooms | 6 (2.7%) | 0 (0.0%) |
| 4 or 5 Rooms | 42 (18.8%) | 7 (41.2%) |
| 6 or 7 Rooms | 106 (47.5%) | 6 (35.3%) |
| 8 or more Rooms | 69 (30.9%) | 4 (23.5%) |
| Total | 223 (100.0%) | 17 (100.0%) |
Housing Structure by Heating Type in Mountain City
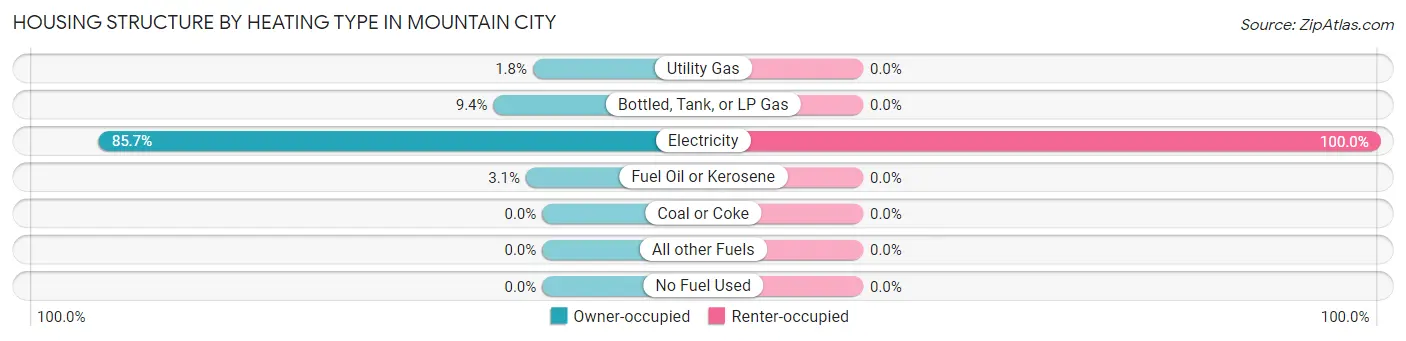
| Heating Type | Owner-occupied | Renter-occupied |
| Utility Gas | 4 (1.8%) | 0 (0.0%) |
| Bottled, Tank, or LP Gas | 21 (9.4%) | 0 (0.0%) |
| Electricity | 191 (85.7%) | 17 (100.0%) |
| Fuel Oil or Kerosene | 7 (3.1%) | 0 (0.0%) |
| Coal or Coke | 0 (0.0%) | 0 (0.0%) |
| All other Fuels | 0 (0.0%) | 0 (0.0%) |
| No Fuel Used | 0 (0.0%) | 0 (0.0%) |
| Total | 223 (100.0%) | 17 (100.0%) |
Household Vehicle Usage in Mountain City
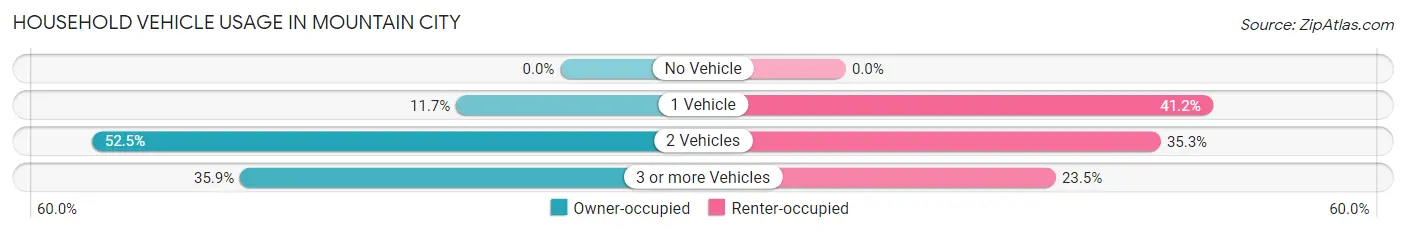
| Vehicles per Household | Owner-occupied | Renter-occupied |
| No Vehicle | 0 (0.0%) | 0 (0.0%) |
| 1 Vehicle | 26 (11.7%) | 7 (41.2%) |
| 2 Vehicles | 117 (52.5%) | 6 (35.3%) |
| 3 or more Vehicles | 80 (35.9%) | 4 (23.5%) |
| Total | 223 (100.0%) | 17 (100.0%) |
Real Estate & Mortgages in Mountain City
Real Estate and Mortgage Overview in Mountain City
| Characteristic | Without Mortgage | With Mortgage |
| Housing Units | 76 | 147 |
| Median Property Value | $355,900 | $412,500 |
| Median Household Income | $128,333 | $53 |
| Monthly Housing Costs | $875 | $20 |
| Real Estate Taxes | $5,764 | $0 |
Property Value by Mortgage Status in Mountain City
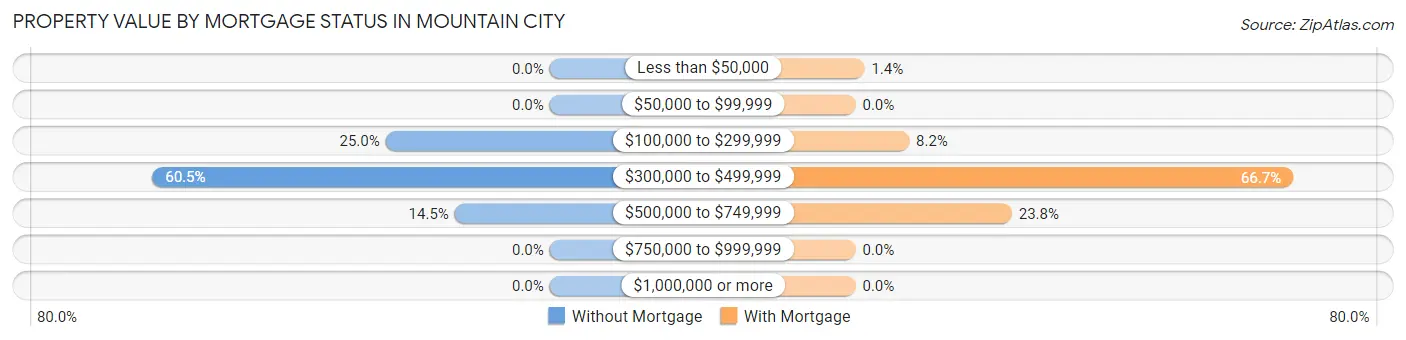
| Property Value | Without Mortgage | With Mortgage |
| Less than $50,000 | 0 (0.0%) | 2 (1.4%) |
| $50,000 to $99,999 | 0 (0.0%) | 0 (0.0%) |
| $100,000 to $299,999 | 19 (25.0%) | 12 (8.2%) |
| $300,000 to $499,999 | 46 (60.5%) | 98 (66.7%) |
| $500,000 to $749,999 | 11 (14.5%) | 35 (23.8%) |
| $750,000 to $999,999 | 0 (0.0%) | 0 (0.0%) |
| $1,000,000 or more | 0 (0.0%) | 0 (0.0%) |
| Total | 76 (100.0%) | 147 (100.0%) |
Household Income by Mortgage Status in Mountain City
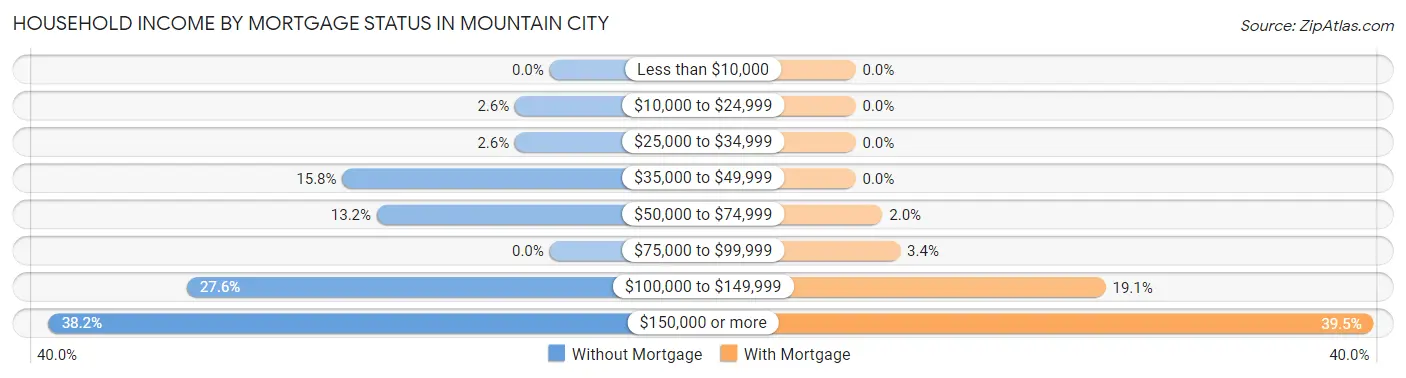
| Household Income | Without Mortgage | With Mortgage |
| Less than $10,000 | 0 (0.0%) | 0 (0.0%) |
| $10,000 to $24,999 | 2 (2.6%) | 0 (0.0%) |
| $25,000 to $34,999 | 2 (2.6%) | 0 (0.0%) |
| $35,000 to $49,999 | 12 (15.8%) | 0 (0.0%) |
| $50,000 to $74,999 | 10 (13.2%) | 3 (2.0%) |
| $75,000 to $99,999 | 0 (0.0%) | 5 (3.4%) |
| $100,000 to $149,999 | 21 (27.6%) | 28 (19.1%) |
| $150,000 or more | 29 (38.2%) | 58 (39.5%) |
| Total | 76 (100.0%) | 147 (100.0%) |
Property Value to Household Income Ratio in Mountain City

| Value-to-Income Ratio | Without Mortgage | With Mortgage |
| Less than 2.0x | 18 (23.7%) | 131,875 (89,710.9%) |
| 2.0x to 2.9x | 15 (19.7%) | 14 (9.5%) |
| 3.0x to 3.9x | 17 (22.4%) | 52 (35.4%) |
| 4.0x or more | 26 (34.2%) | 26 (17.7%) |
| Total | 76 (100.0%) | 147 (100.0%) |
Real Estate Taxes by Mortgage Status in Mountain City
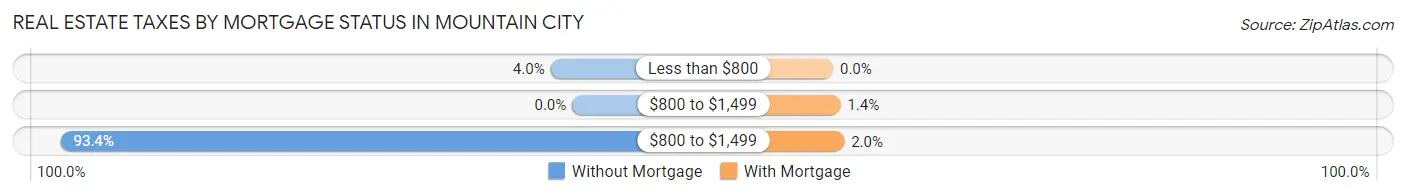
| Property Taxes | Without Mortgage | With Mortgage |
| Less than $800 | 3 (4.0%) | 0 (0.0%) |
| $800 to $1,499 | 0 (0.0%) | 2 (1.4%) |
| $800 to $1,499 | 71 (93.4%) | 3 (2.0%) |
| Total | 76 (100.0%) | 147 (100.0%) |
Health & Disability in Mountain City
Health Insurance Coverage by Age in Mountain City
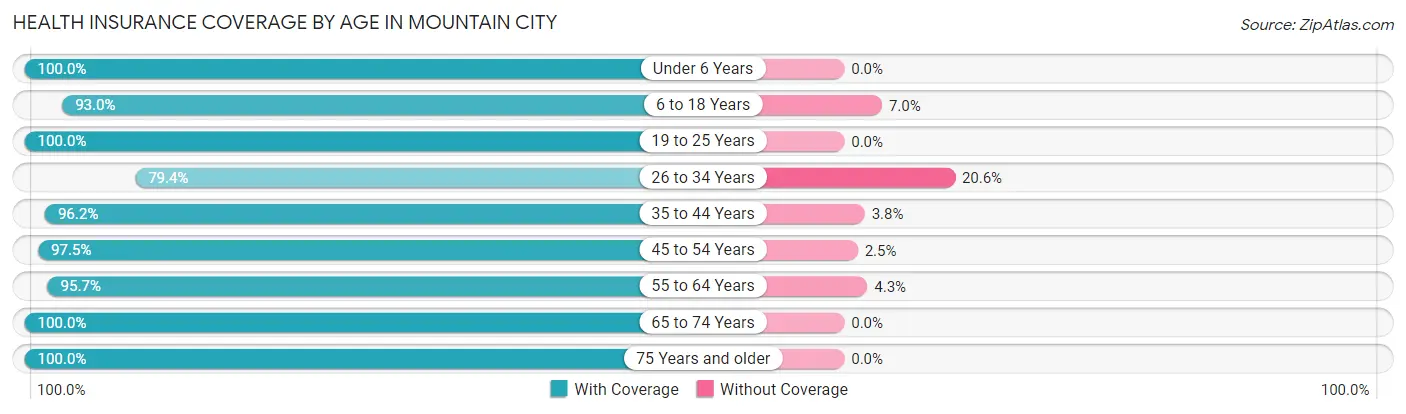
| Age Bracket | With Coverage | Without Coverage |
| Under 6 Years | 75 (100.0%) | 0 (0.0%) |
| 6 to 18 Years | 159 (93.0%) | 12 (7.0%) |
| 19 to 25 Years | 26 (100.0%) | 0 (0.0%) |
| 26 to 34 Years | 50 (79.4%) | 13 (20.6%) |
| 35 to 44 Years | 101 (96.2%) | 4 (3.8%) |
| 45 to 54 Years | 78 (97.5%) | 2 (2.5%) |
| 55 to 64 Years | 89 (95.7%) | 4 (4.3%) |
| 65 to 74 Years | 73 (100.0%) | 0 (0.0%) |
| 75 Years and older | 40 (100.0%) | 0 (0.0%) |
| Total | 691 (95.2%) | 35 (4.8%) |
Health Insurance Coverage by Citizenship Status in Mountain City
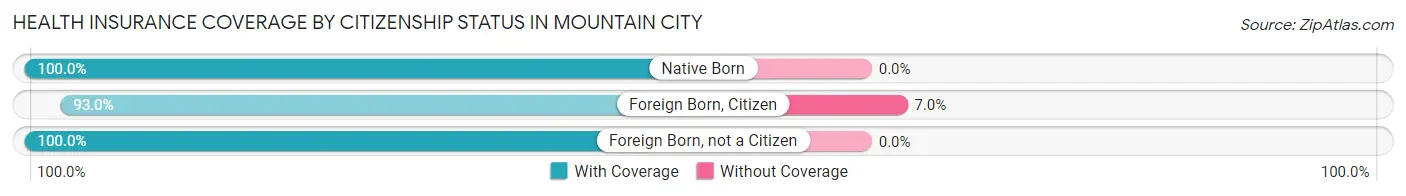
| Citizenship Status | With Coverage | Without Coverage |
| Native Born | 75 (100.0%) | 0 (0.0%) |
| Foreign Born, Citizen | 159 (93.0%) | 12 (7.0%) |
| Foreign Born, not a Citizen | 26 (100.0%) | 0 (0.0%) |
Health Insurance Coverage by Household Income in Mountain City
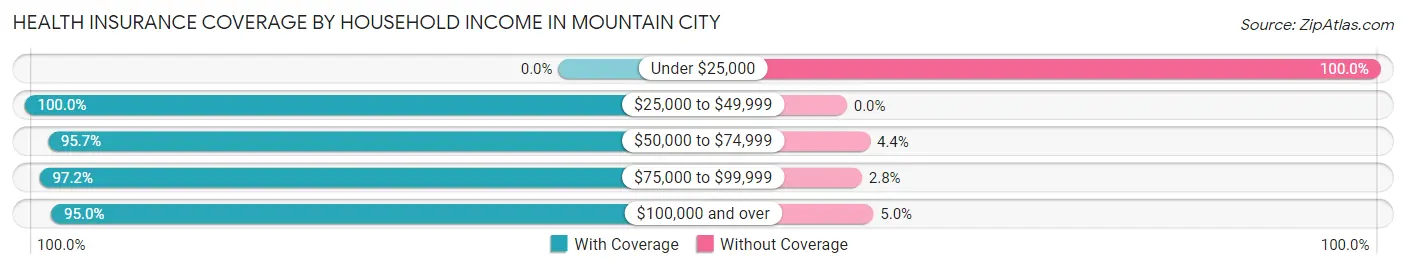
| Household Income | With Coverage | Without Coverage |
| Under $25,000 | 0 (0.0%) | 2 (100.0%) |
| $25,000 to $49,999 | 27 (100.0%) | 0 (0.0%) |
| $50,000 to $74,999 | 22 (95.7%) | 1 (4.3%) |
| $75,000 to $99,999 | 69 (97.2%) | 2 (2.8%) |
| $100,000 and over | 573 (95.0%) | 30 (5.0%) |
Public vs Private Health Insurance Coverage by Age in Mountain City
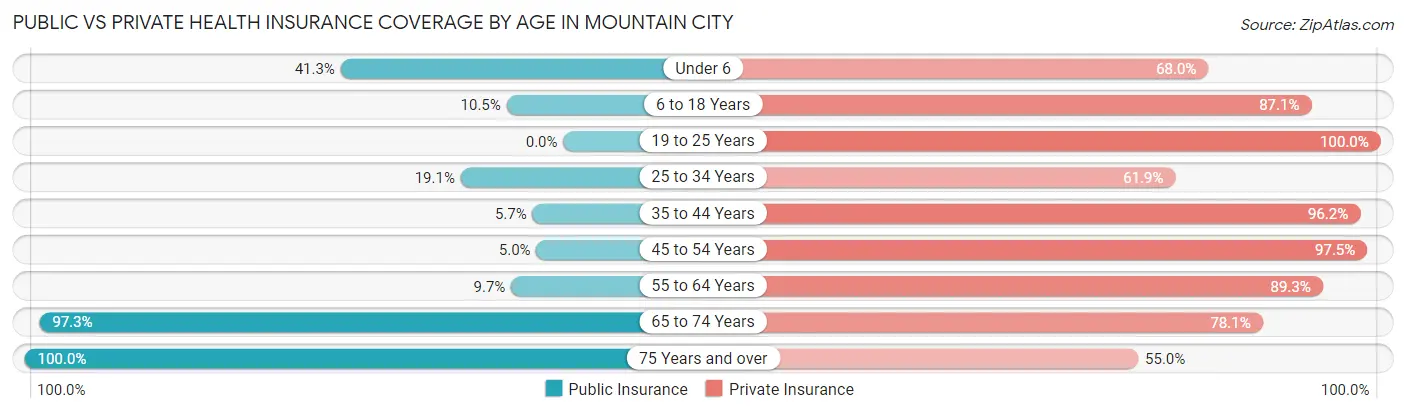
| Age Bracket | Public Insurance | Private Insurance |
| Under 6 | 31 (41.3%) | 51 (68.0%) |
| 6 to 18 Years | 18 (10.5%) | 149 (87.1%) |
| 19 to 25 Years | 0 (0.0%) | 26 (100.0%) |
| 25 to 34 Years | 12 (19.1%) | 39 (61.9%) |
| 35 to 44 Years | 6 (5.7%) | 101 (96.2%) |
| 45 to 54 Years | 4 (5.0%) | 78 (97.5%) |
| 55 to 64 Years | 9 (9.7%) | 83 (89.2%) |
| 65 to 74 Years | 71 (97.3%) | 57 (78.1%) |
| 75 Years and over | 40 (100.0%) | 22 (55.0%) |
| Total | 191 (26.3%) | 606 (83.5%) |
Disability Status by Sex by Age in Mountain City
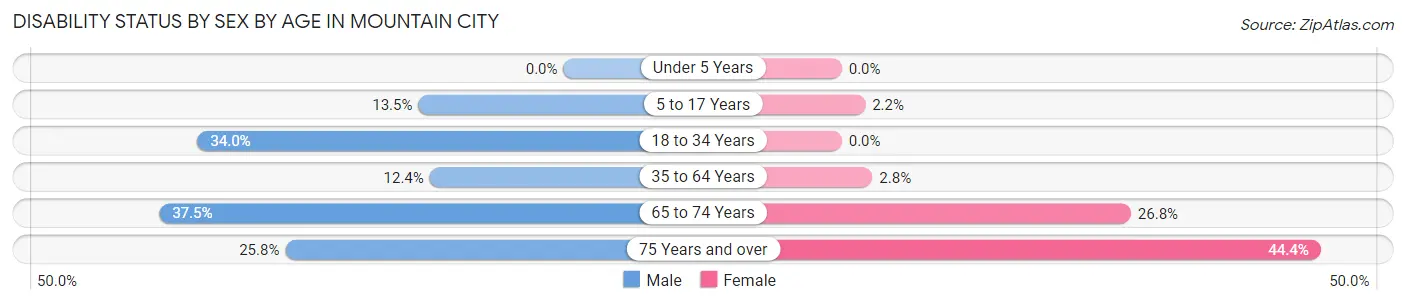
| Age Bracket | Male | Female |
| Under 5 Years | 0 (0.0%) | 0 (0.0%) |
| 5 to 17 Years | 14 (13.5%) | 1 (2.2%) |
| 18 to 34 Years | 18 (34.0%) | 0 (0.0%) |
| 35 to 64 Years | 17 (12.4%) | 4 (2.8%) |
| 65 to 74 Years | 12 (37.5%) | 11 (26.8%) |
| 75 Years and over | 8 (25.8%) | 4 (44.4%) |
Disability Class by Sex by Age in Mountain City
Disability Class: Hearing Difficulty
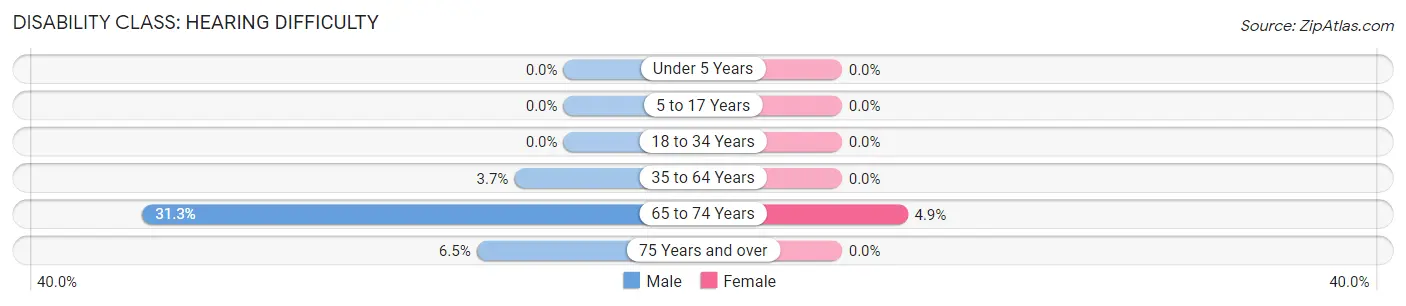
| Age Bracket | Male | Female |
| Under 5 Years | 0 (0.0%) | 0 (0.0%) |
| 5 to 17 Years | 0 (0.0%) | 0 (0.0%) |
| 18 to 34 Years | 0 (0.0%) | 0 (0.0%) |
| 35 to 64 Years | 5 (3.6%) | 0 (0.0%) |
| 65 to 74 Years | 10 (31.2%) | 2 (4.9%) |
| 75 Years and over | 2 (6.5%) | 0 (0.0%) |
Disability Class: Vision Difficulty

| Age Bracket | Male | Female |
| Under 5 Years | 0 (0.0%) | 0 (0.0%) |
| 5 to 17 Years | 0 (0.0%) | 1 (2.2%) |
| 18 to 34 Years | 0 (0.0%) | 0 (0.0%) |
| 35 to 64 Years | 4 (2.9%) | 2 (1.4%) |
| 65 to 74 Years | 2 (6.2%) | 0 (0.0%) |
| 75 Years and over | 0 (0.0%) | 0 (0.0%) |
Disability Class: Cognitive Difficulty
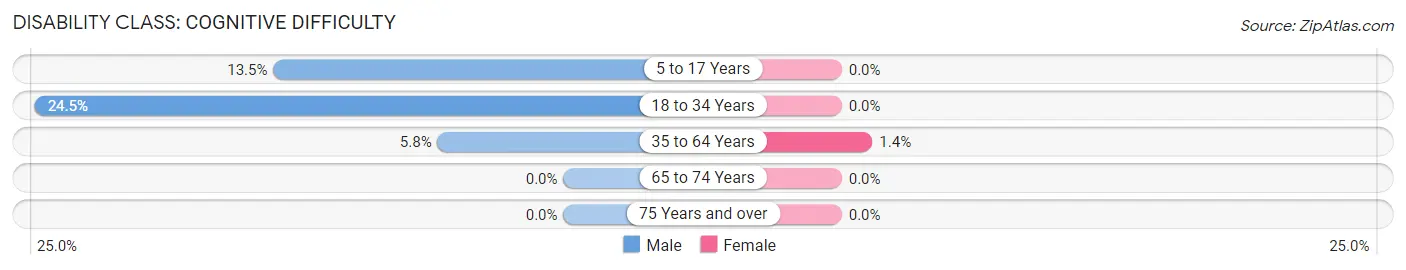
| Age Bracket | Male | Female |
| 5 to 17 Years | 14 (13.5%) | 0 (0.0%) |
| 18 to 34 Years | 13 (24.5%) | 0 (0.0%) |
| 35 to 64 Years | 8 (5.8%) | 2 (1.4%) |
| 65 to 74 Years | 0 (0.0%) | 0 (0.0%) |
| 75 Years and over | 0 (0.0%) | 0 (0.0%) |
Disability Class: Ambulatory Difficulty
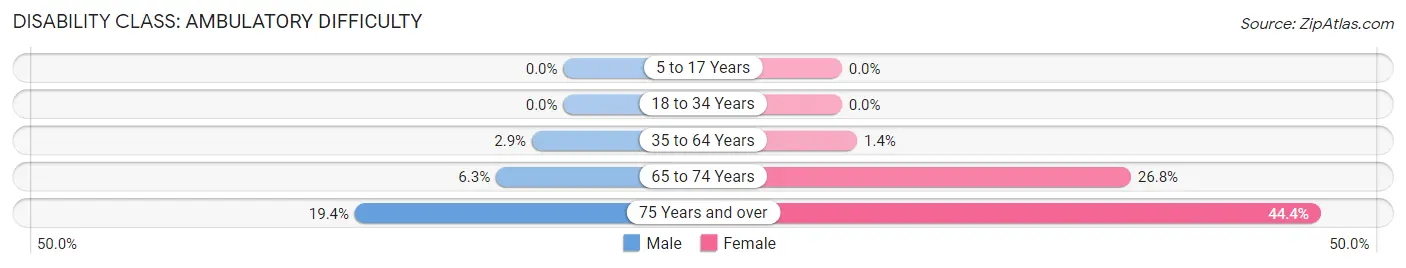
| Age Bracket | Male | Female |
| 5 to 17 Years | 0 (0.0%) | 0 (0.0%) |
| 18 to 34 Years | 0 (0.0%) | 0 (0.0%) |
| 35 to 64 Years | 4 (2.9%) | 2 (1.4%) |
| 65 to 74 Years | 2 (6.2%) | 11 (26.8%) |
| 75 Years and over | 6 (19.4%) | 4 (44.4%) |
Disability Class: Self-Care Difficulty
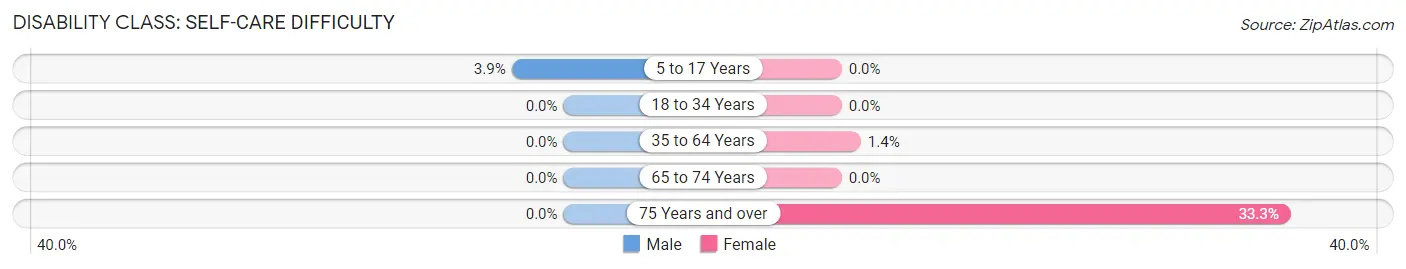
| Age Bracket | Male | Female |
| 5 to 17 Years | 4 (3.8%) | 0 (0.0%) |
| 18 to 34 Years | 0 (0.0%) | 0 (0.0%) |
| 35 to 64 Years | 0 (0.0%) | 2 (1.4%) |
| 65 to 74 Years | 0 (0.0%) | 0 (0.0%) |
| 75 Years and over | 0 (0.0%) | 3 (33.3%) |
Technology Access in Mountain City
Computing Device Access in Mountain City
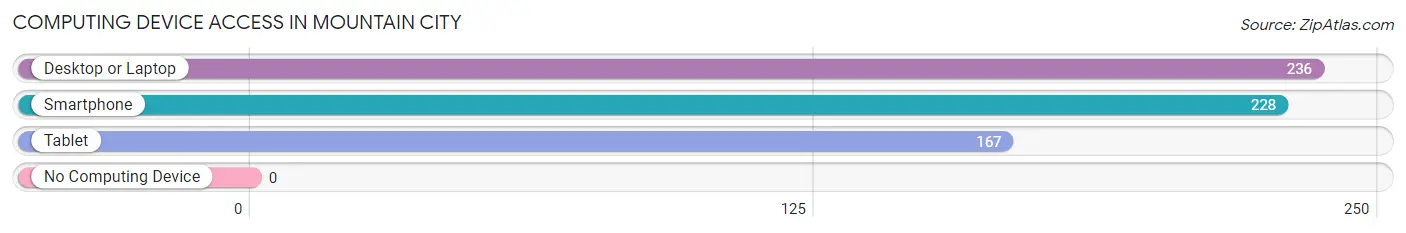
| Device Type | # Households | % Households |
| Desktop or Laptop | 236 | 98.3% |
| Smartphone | 228 | 95.0% |
| Tablet | 167 | 69.6% |
| No Computing Device | 0 | 0.0% |
| Total | 240 | 100.0% |
Internet Access in Mountain City
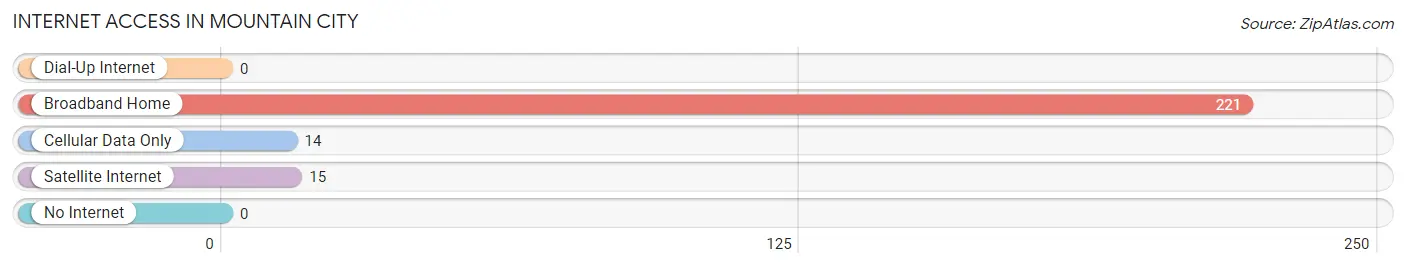
| Internet Type | # Households | % Households |
| Dial-Up Internet | 0 | 0.0% |
| Broadband Home | 221 | 92.1% |
| Cellular Data Only | 14 | 5.8% |
| Satellite Internet | 15 | 6.2% |
| No Internet | 0 | 0.0% |
| Total | 240 | 100.0% |
Mountain City Summary
Mountain City is a small unincorporated community located in the western part of Hudspeth County, Texas. It is situated on the banks of the Rio Grande, approximately 20 miles south of El Paso. The population of Mountain City was estimated to be around 200 in 2020.
History
Mountain City was founded in the late 19th century by a group of settlers from the nearby town of El Paso. The settlers were looking for a place to settle and raise their families. The area was originally known as "Mountain City" because of its proximity to the nearby Franklin Mountains. The first settlers were mostly ranchers and farmers, and the town quickly grew to include a post office, a general store, and a school.
In the early 20th century, Mountain City became a popular destination for tourists. The town was known for its scenic beauty and its proximity to the Rio Grande. The town also became a popular stop for travelers on the Southern Pacific Railroad.
Geography
Mountain City is located in the western part of Hudspeth County, Texas. It is situated on the banks of the Rio Grande, approximately 20 miles south of El Paso. The town is surrounded by the Franklin Mountains to the east and the Chihuahuan Desert to the west. The climate in Mountain City is semi-arid, with hot summers and mild winters.
Economy
Mountain City is a small, rural community with a limited economy. The primary industries in the area are agriculture and tourism. The town is home to several small farms and ranches, which produce a variety of crops and livestock. Tourism is also an important part of the local economy, as the town is a popular destination for outdoor enthusiasts.
Demographics
Mountain City is a small, rural community with a population of approximately 200 people. The town is predominantly Hispanic, with a majority of the population being of Mexican descent. The median household income in Mountain City is $25,000, and the median age is 33. The town has a high rate of poverty, with nearly 40% of the population living below the poverty line.
Common Questions
What is Per Capita Income in Mountain City?
Per Capita income in Mountain City is $46,345.
What is the Median Family Income in Mountain City?
Median Family Income in Mountain City is $132,500.
What is the Median Household income in Mountain City?
Median Household Income in Mountain City is $133,750.
What is Income or Wage Gap in Mountain City?
Income or Wage Gap in Mountain City is 42.1%.
Women in Mountain City earn 57.9 cents for every dollar earned by a man.
What is Inequality or Gini Index in Mountain City?
Inequality or Gini Index in Mountain City is 0.25.
What is the Total Population of Mountain City?
Total Population of Mountain City is 726.
What is the Total Male Population of Mountain City?
Total Male Population of Mountain City is 399.
What is the Total Female Population of Mountain City?
Total Female Population of Mountain City is 327.
What is the Ratio of Males per 100 Females in Mountain City?
There are 122.02 Males per 100 Females in Mountain City.
What is the Ratio of Females per 100 Males in Mountain City?
There are 81.95 Females per 100 Males in Mountain City.
What is the Median Population Age in Mountain City?
Median Population Age in Mountain City is 37.2 Years.
What is the Average Family Size in Mountain City
Average Family Size in Mountain City is 3.3 People.
What is the Average Household Size in Mountain City
Average Household Size in Mountain City is 3.0 People.
How Large is the Labor Force in Mountain City?
There are 349 People in the Labor Forcein in Mountain City.
What is the Percentage of People in the Labor Force in Mountain City?
67.2% of People are in the Labor Force in Mountain City.
What is the Unemployment Rate in Mountain City?
Unemployment Rate in Mountain City is 0.3%.