Mobeetie, TX Map & Demographics
Mobeetie Map
Mobeetie Overview
$34,024
PER CAPITA INCOME
$81,250
AVG FAMILY INCOME
$58,906
AVG HOUSEHOLD INCOME
0.31
INEQUALITY / GINI INDEX
105
TOTAL POPULATION
59
MALE POPULATION
46
FEMALE POPULATION
128.26
MALES / 100 FEMALES
77.97
FEMALES / 100 MALES
53.2
MEDIAN AGE
2.6
AVG FAMILY SIZE
2.3
AVG HOUSEHOLD SIZE
69
LABOR FORCE [ PEOPLE ]
73.4%
PERCENT IN LABOR FORCE
15.9%
UNEMPLOYMENT RATE
Mobeetie Zip Codes
Mobeetie Area Codes
Income in Mobeetie
Income Overview in Mobeetie
Per Capita Income in Mobeetie is $34,024, while median incomes of families and households are $81,250 and $58,906 respectively.
| Characteristic | Number | Measure |
| Per Capita Income | 105 | $34,024 |
| Median Family Income | 30 | $81,250 |
| Mean Family Income | 30 | $87,467 |
| Median Household Income | 45 | $58,906 |
| Mean Household Income | 45 | $70,153 |
| Income Deficit | 30 | $0 |
| Wage / Income Gap (%) | 105 | 0.00% |
| Wage / Income Gap ($) | 105 | 100.00¢ per $1 |
| Gini / Inequality Index | 105 | 0.31 |
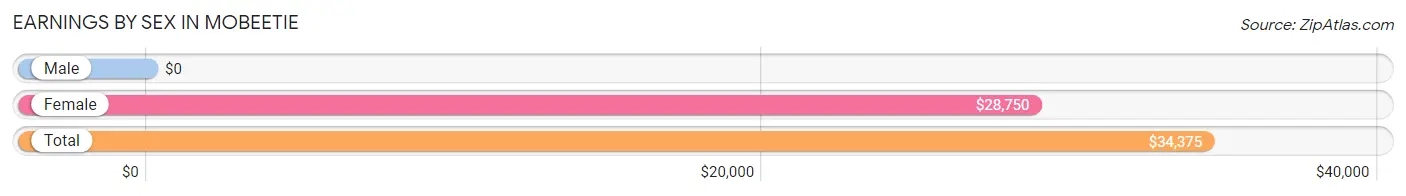
Earnings by Sex in Mobeetie
| Sex | Number | Average Earnings |
| Male | 36 (50.7%) | $0 |
| Female | 35 (49.3%) | $28,750 |
| Total | 71 (100.0%) | $34,375 |
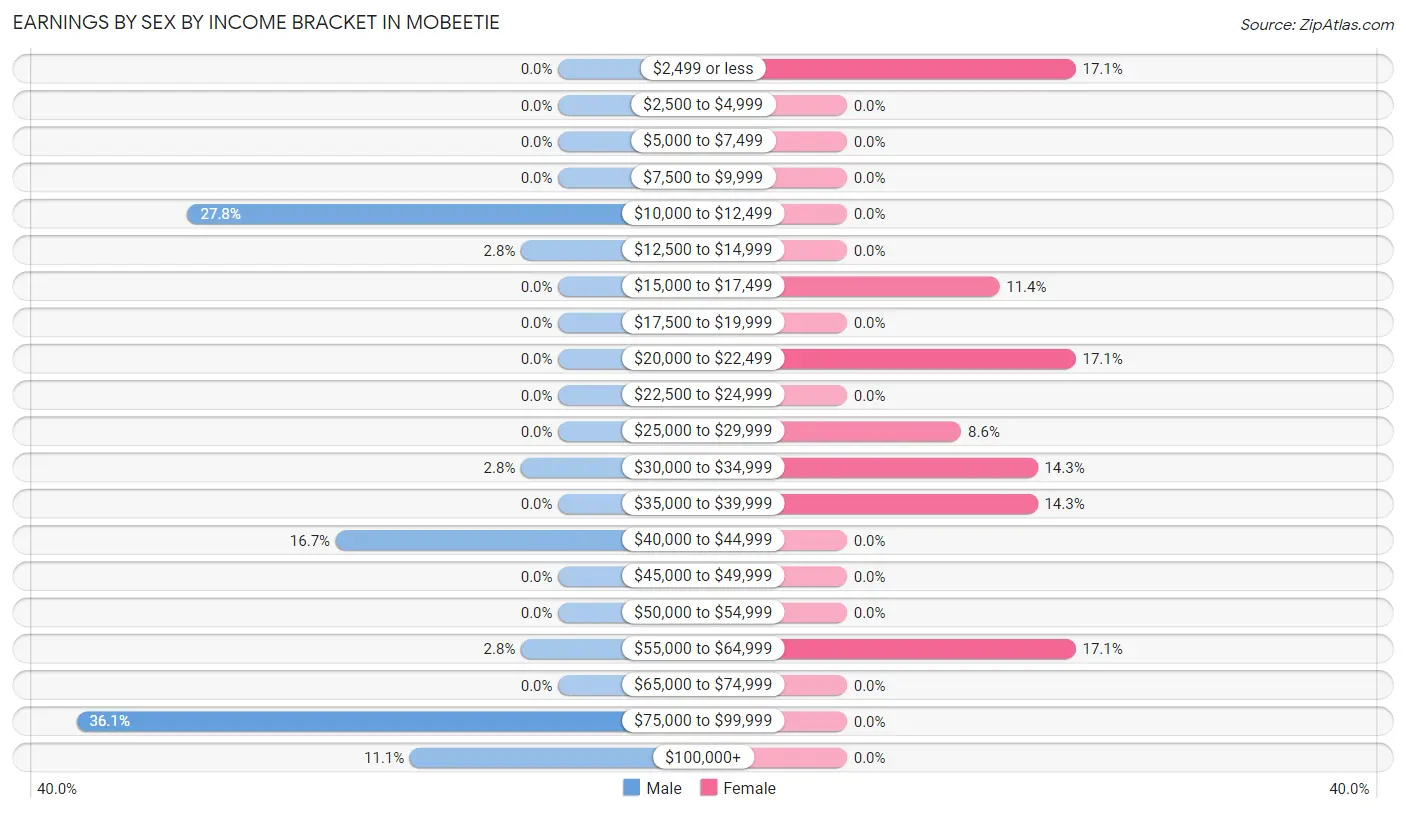
Earnings by Sex by Income Bracket in Mobeetie
The most common earnings brackets in Mobeetie are $75,000 to $99,999 for men (13 | 36.1%) and $2,499 or less for women (6 | 17.1%).
| Income | Male | Female |
| $2,499 or less | 0 (0.0%) | 6 (17.1%) |
| $2,500 to $4,999 | 0 (0.0%) | 0 (0.0%) |
| $5,000 to $7,499 | 0 (0.0%) | 0 (0.0%) |
| $7,500 to $9,999 | 0 (0.0%) | 0 (0.0%) |
| $10,000 to $12,499 | 10 (27.8%) | 0 (0.0%) |
| $12,500 to $14,999 | 1 (2.8%) | 0 (0.0%) |
| $15,000 to $17,499 | 0 (0.0%) | 4 (11.4%) |
| $17,500 to $19,999 | 0 (0.0%) | 0 (0.0%) |
| $20,000 to $22,499 | 0 (0.0%) | 6 (17.1%) |
| $22,500 to $24,999 | 0 (0.0%) | 0 (0.0%) |
| $25,000 to $29,999 | 0 (0.0%) | 3 (8.6%) |
| $30,000 to $34,999 | 1 (2.8%) | 5 (14.3%) |
| $35,000 to $39,999 | 0 (0.0%) | 5 (14.3%) |
| $40,000 to $44,999 | 6 (16.7%) | 0 (0.0%) |
| $45,000 to $49,999 | 0 (0.0%) | 0 (0.0%) |
| $50,000 to $54,999 | 0 (0.0%) | 0 (0.0%) |
| $55,000 to $64,999 | 1 (2.8%) | 6 (17.1%) |
| $65,000 to $74,999 | 0 (0.0%) | 0 (0.0%) |
| $75,000 to $99,999 | 13 (36.1%) | 0 (0.0%) |
| $100,000+ | 4 (11.1%) | 0 (0.0%) |
| Total | 36 (100.0%) | 35 (100.0%) |
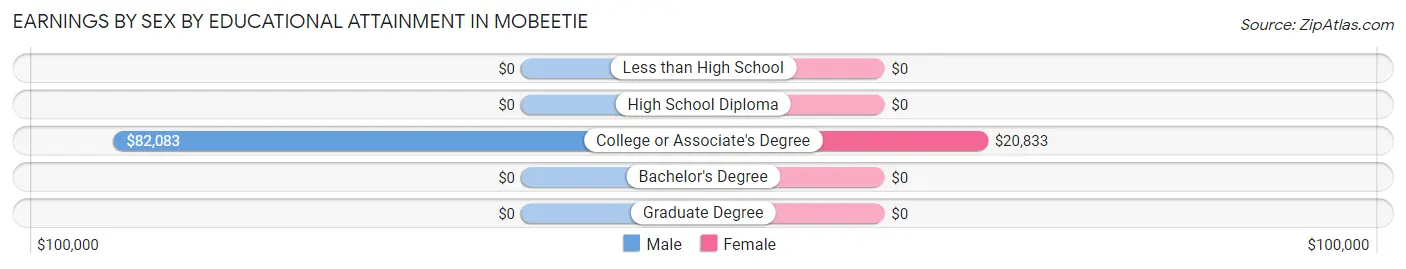
Earnings by Sex by Educational Attainment in Mobeetie
Average earnings in Mobeetie are $81,667 for men and $26,250 for women, a difference of 67.9%. Men with an educational attainment of college or associate's degree enjoy the highest average annual earnings of $82,083, while those with college or associate's degree education earn the least with $82,083. Women with an educational attainment of college or associate's degree earn the most with the average annual earnings of $20,833, while those with college or associate's degree education have the smallest earnings of $20,833.
| Educational Attainment | Male Income | Female Income |
| Less than High School | - | - |
| High School Diploma | - | - |
| College or Associate's Degree | $82,083 | $20,833 |
| Bachelor's Degree | - | - |
| Graduate Degree | - | - |
| Total | $81,667 | $26,250 |
Family Income in Mobeetie
Family Income Brackets in Mobeetie
According to the Mobeetie family income data, there are 9 families falling into the $50,000 to $74,999 income range, which is the most common income bracket and makes up 30.0% of all families.
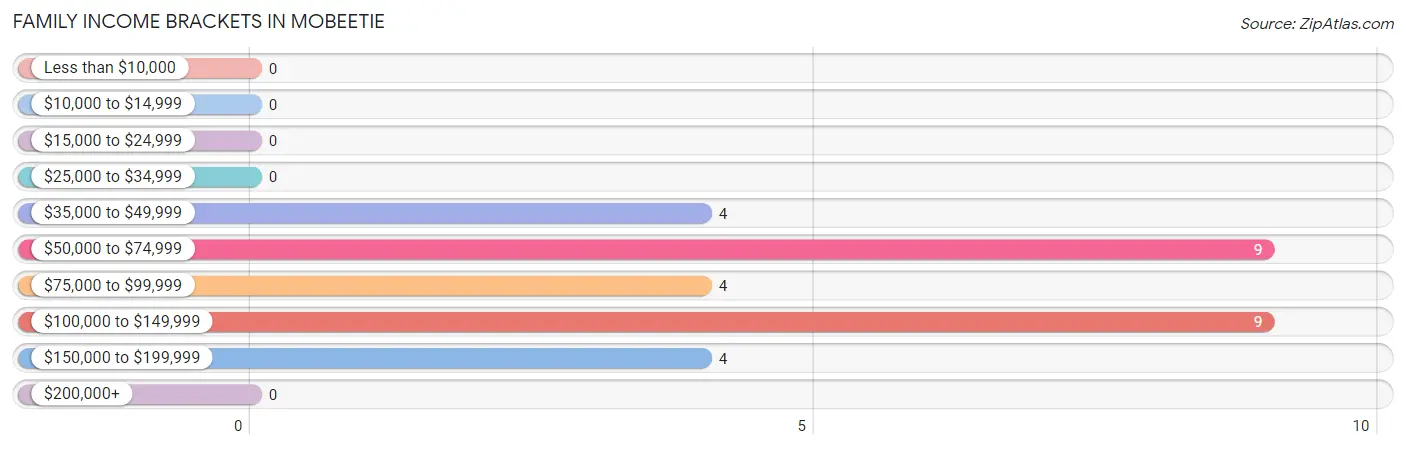
| Income Bracket | # Families | % Families |
| Less than $10,000 | 0 | 0.0% |
| $10,000 to $14,999 | 0 | 0.0% |
| $15,000 to $24,999 | 0 | 0.0% |
| $25,000 to $34,999 | 0 | 0.0% |
| $35,000 to $49,999 | 4 | 13.3% |
| $50,000 to $74,999 | 9 | 30.0% |
| $75,000 to $99,999 | 4 | 13.3% |
| $100,000 to $149,999 | 9 | 30.0% |
| $150,000 to $199,999 | 4 | 13.3% |
| $200,000+ | 0 | 0.0% |
Family Income by Famaliy Size in Mobeetie
2-person families (23 | 76.7%) account for the highest median family income in Mobeetie with $100,313 per family, while 2-person families (23 | 76.7%) have the highest median income of $50,156 per family member.
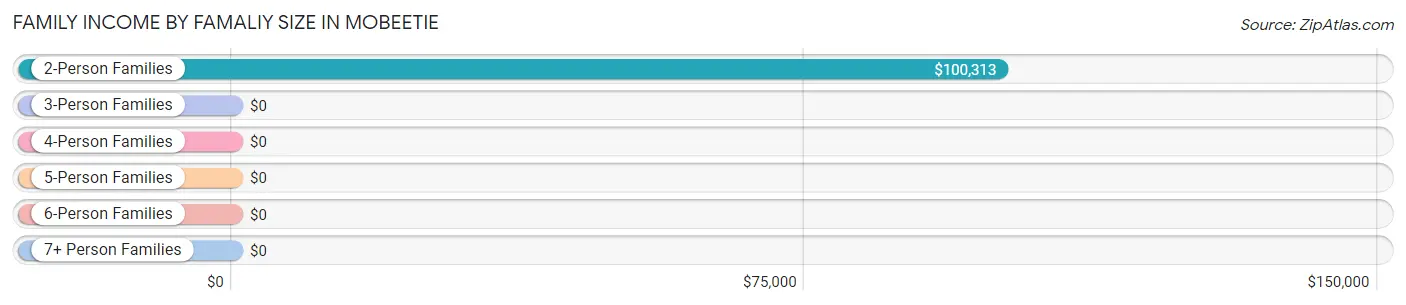
| Income Bracket | # Families | Median Income |
| 2-Person Families | 23 (76.7%) | $100,313 |
| 3-Person Families | 1 (3.3%) | $0 |
| 4-Person Families | 6 (20.0%) | $0 |
| 5-Person Families | 0 (0.0%) | $0 |
| 6-Person Families | 0 (0.0%) | $0 |
| 7+ Person Families | 0 (0.0%) | $0 |
| Total | 30 (100.0%) | $81,250 |
Family Income by Number of Earners in Mobeetie
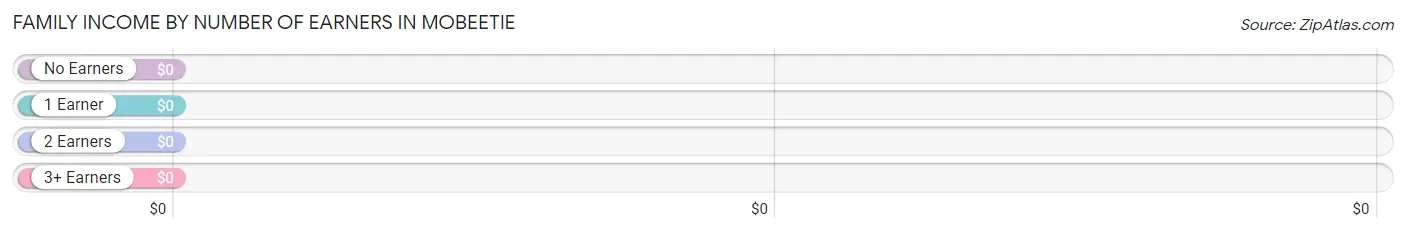
| Number of Earners | # Families | Median Income |
| No Earners | 2 (6.7%) | $0 |
| 1 Earner | 8 (26.7%) | $0 |
| 2 Earners | 20 (66.7%) | $0 |
| 3+ Earners | 0 (0.0%) | $0 |
| Total | 30 (100.0%) | $81,250 |
Household Income in Mobeetie
Household Income Brackets in Mobeetie
With 13 households falling in the category, the $35,000 to $49,999 income range is the most frequent in Mobeetie, accounting for 28.9% of all households.
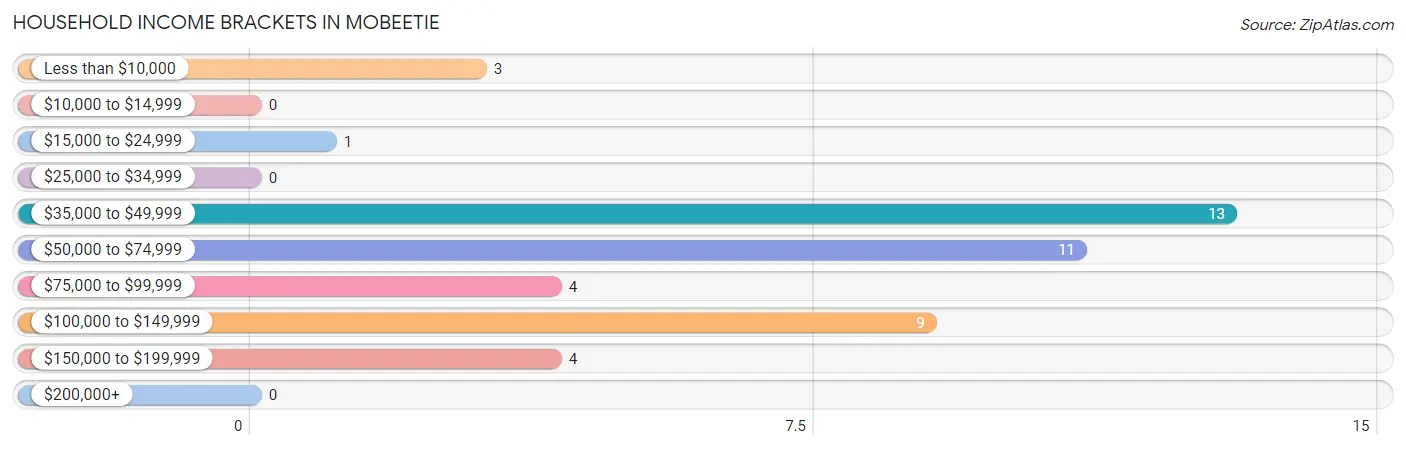
| Income Bracket | # Households | % Households |
| Less than $10,000 | 3 | 6.7% |
| $10,000 to $14,999 | 0 | 0.0% |
| $15,000 to $24,999 | 1 | 2.2% |
| $25,000 to $34,999 | 0 | 0.0% |
| $35,000 to $49,999 | 13 | 28.9% |
| $50,000 to $74,999 | 11 | 24.4% |
| $75,000 to $99,999 | 4 | 8.9% |
| $100,000 to $149,999 | 9 | 20.0% |
| $150,000 to $199,999 | 4 | 8.9% |
| $200,000+ | 0 | 0.0% |
Household Income by Householder Age in Mobeetie
The median household income in Mobeetie is $58,906, with the highest median household income of $80,000 found in the 45 to 64 years age bracket for the primary householder. A total of 26 households (57.8%) fall into this category.
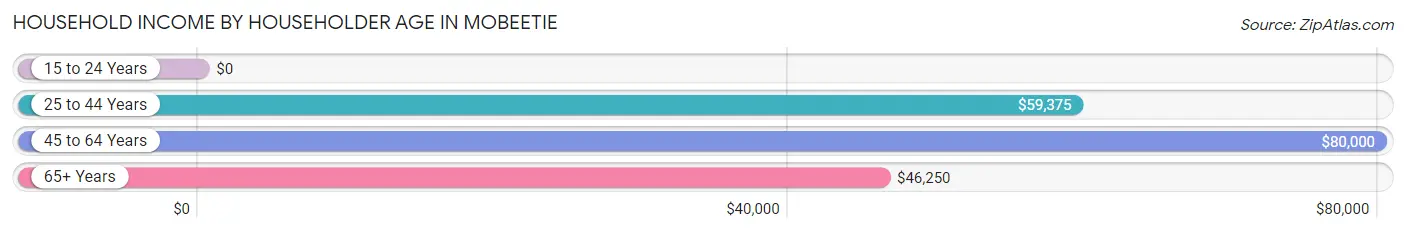
| Income Bracket | # Households | Median Income |
| 15 to 24 Years | 0 (0.0%) | $0 |
| 25 to 44 Years | 11 (24.4%) | $59,375 |
| 45 to 64 Years | 26 (57.8%) | $80,000 |
| 65+ Years | 8 (17.8%) | $46,250 |
| Total | 45 (100.0%) | $58,906 |
Poverty in Mobeetie
Income Below Poverty by Sex and Age in Mobeetie
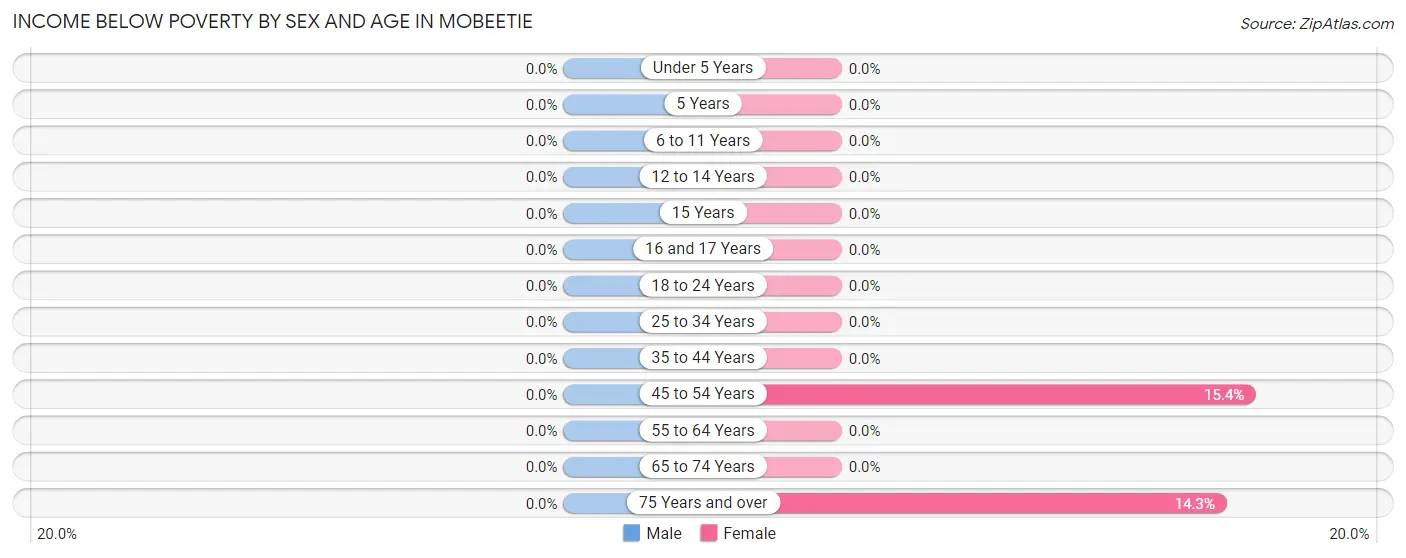
| Age Bracket | Male | Female |
| Under 5 Years | 0 (0.0%) | 0 (0.0%) |
| 5 Years | 0 (0.0%) | 0 (0.0%) |
| 6 to 11 Years | 0 (0.0%) | 0 (0.0%) |
| 12 to 14 Years | 0 (0.0%) | 0 (0.0%) |
| 15 Years | 0 (0.0%) | 0 (0.0%) |
| 16 and 17 Years | 0 (0.0%) | 0 (0.0%) |
| 18 to 24 Years | 0 (0.0%) | 0 (0.0%) |
| 25 to 34 Years | 0 (0.0%) | 0 (0.0%) |
| 35 to 44 Years | 0 (0.0%) | 0 (0.0%) |
| 45 to 54 Years | 0 (0.0%) | 2 (15.4%) |
| 55 to 64 Years | 0 (0.0%) | 0 (0.0%) |
| 65 to 74 Years | 0 (0.0%) | 0 (0.0%) |
| 75 Years and over | 0 (0.0%) | 1 (14.3%) |
| Total | 0 (0.0%) | 3 (6.5%) |
Income Above Poverty by Sex and Age in Mobeetie
According to the poverty statistics in Mobeetie, males aged 12 to 14 years and females aged 15 years are the age groups that are most secure financially, with 100.0% of males and 100.0% of females in these age groups living above the poverty line.
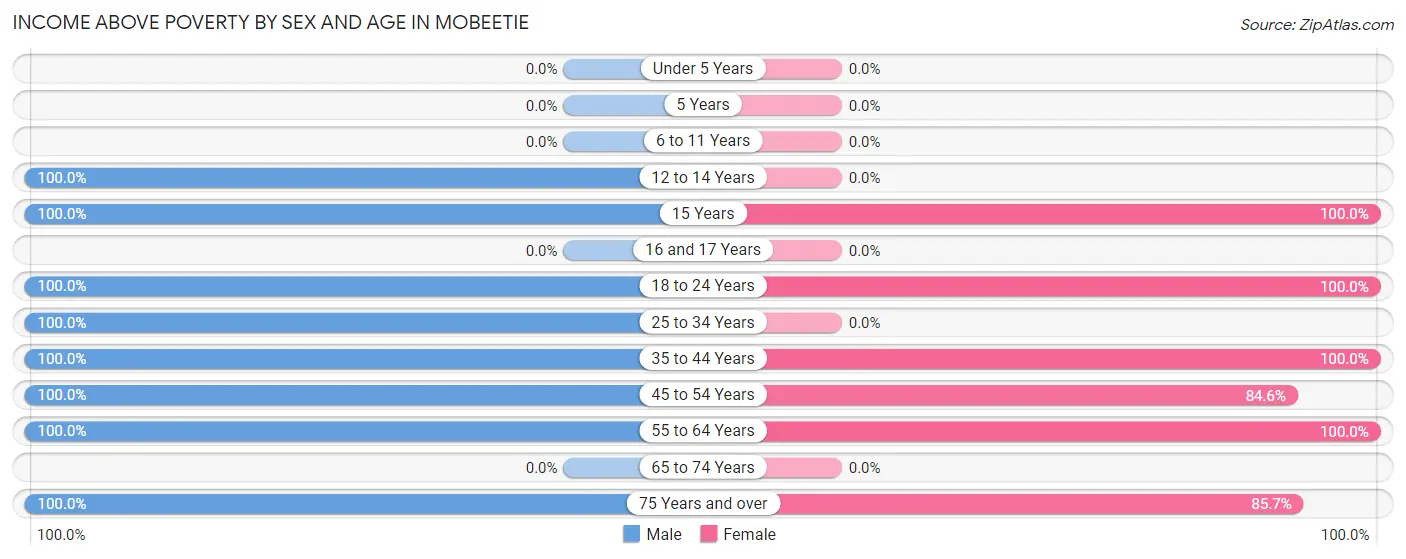
| Age Bracket | Male | Female |
| Under 5 Years | 0 (0.0%) | 0 (0.0%) |
| 5 Years | 0 (0.0%) | 0 (0.0%) |
| 6 to 11 Years | 0 (0.0%) | 0 (0.0%) |
| 12 to 14 Years | 6 (100.0%) | 0 (0.0%) |
| 15 Years | 4 (100.0%) | 1 (100.0%) |
| 16 and 17 Years | 0 (0.0%) | 0 (0.0%) |
| 18 to 24 Years | 10 (100.0%) | 3 (100.0%) |
| 25 to 34 Years | 1 (100.0%) | 0 (0.0%) |
| 35 to 44 Years | 6 (100.0%) | 8 (100.0%) |
| 45 to 54 Years | 7 (100.0%) | 11 (84.6%) |
| 55 to 64 Years | 12 (100.0%) | 14 (100.0%) |
| 65 to 74 Years | 0 (0.0%) | 0 (0.0%) |
| 75 Years and over | 13 (100.0%) | 6 (85.7%) |
| Total | 59 (100.0%) | 43 (93.5%) |
Income Below Poverty Among Married-Couple Families in Mobeetie
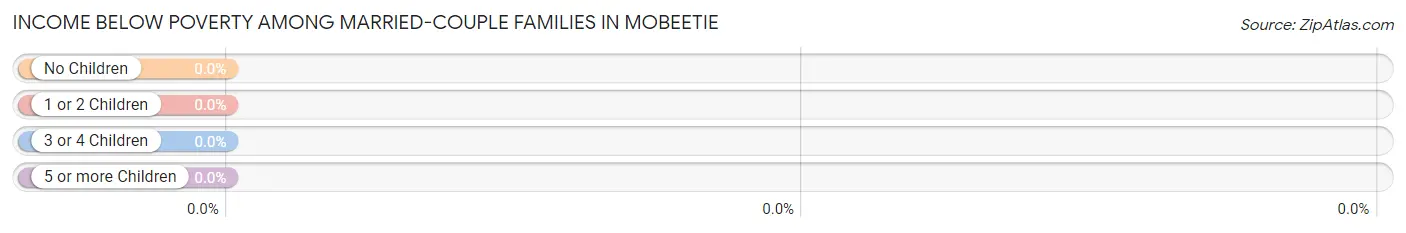
| Children | Above Poverty | Below Poverty |
| No Children | 19 (100.0%) | 0 (0.0%) |
| 1 or 2 Children | 7 (100.0%) | 0 (0.0%) |
| 3 or 4 Children | 0 (0.0%) | 0 (0.0%) |
| 5 or more Children | 0 (0.0%) | 0 (0.0%) |
| Total | 26 (100.0%) | 0 (0.0%) |
Income Below Poverty Among Single-Parent Households in Mobeetie
| Children | Single Father | Single Mother |
| No Children | 0 (0.0%) | 0 (0.0%) |
| 1 or 2 Children | 0 (0.0%) | 0 (0.0%) |
| 3 or 4 Children | 0 (0.0%) | 0 (0.0%) |
| 5 or more Children | 0 (0.0%) | 0 (0.0%) |
| Total | 0 (0.0%) | 0 (0.0%) |
Income Below Poverty Among Married-Couple vs Single-Parent Households in Mobeetie
| Children | Married-Couple Families | Single-Parent Households |
| No Children | 0 (0.0%) | 0 (0.0%) |
| 1 or 2 Children | 0 (0.0%) | 0 (0.0%) |
| 3 or 4 Children | 0 (0.0%) | 0 (0.0%) |
| 5 or more Children | 0 (0.0%) | 0 (0.0%) |
| Total | 0 (0.0%) | 0 (0.0%) |
Race in Mobeetie
The most populous races in Mobeetie are White / Caucasian (91 | 86.7%), Black / African American (11 | 10.5%), and Hispanic or Latino (3 | 2.9%).
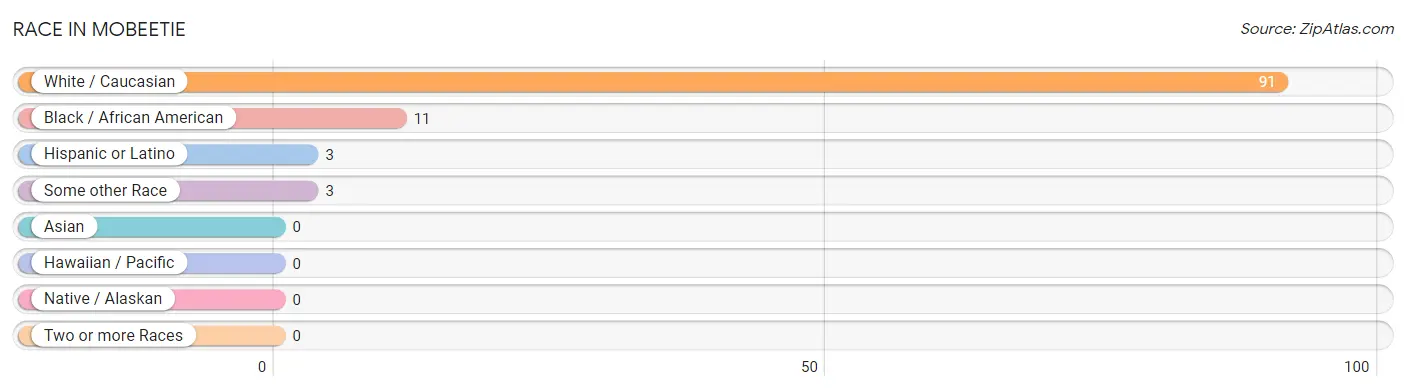
| Race | # Population | % Population |
| Asian | 0 | 0.0% |
| Black / African American | 11 | 10.5% |
| Hawaiian / Pacific | 0 | 0.0% |
| Hispanic or Latino | 3 | 2.9% |
| Native / Alaskan | 0 | 0.0% |
| White / Caucasian | 91 | 86.7% |
| Two or more Races | 0 | 0.0% |
| Some other Race | 3 | 2.9% |
| Total | 105 | 100.0% |
Ancestry in Mobeetie
The most populous ancestries reported in Mobeetie are Irish (13 | 12.4%), English (11 | 10.5%), German (6 | 5.7%), Scottish (4 | 3.8%), and Welsh (4 | 3.8%), together accounting for 36.2% of all Mobeetie residents.
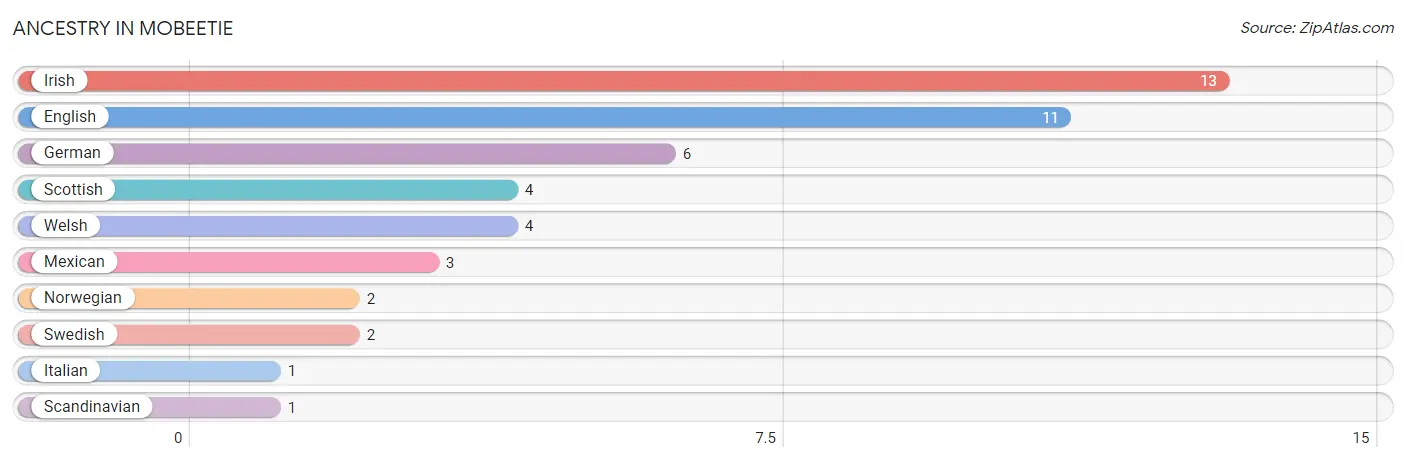
| Ancestry | # Population | % Population |
| English | 11 | 10.5% |
| German | 6 | 5.7% |
| Irish | 13 | 12.4% |
| Italian | 1 | 0.9% |
| Mexican | 3 | 2.9% |
| Norwegian | 2 | 1.9% |
| Scandinavian | 1 | 0.9% |
| Scottish | 4 | 3.8% |
| Swedish | 2 | 1.9% |
| Welsh | 4 | 3.8% | View All 10 Rows |
Immigrants in Mobeetie

| Immigration Origin | # Population | % Population | View All 0 Rows |
Sex and Age in Mobeetie
Sex and Age in Mobeetie
The most populous age groups in Mobeetie are 75 to 79 Years (13 | 22.0%) for men and 55 to 59 Years (14 | 30.4%) for women.
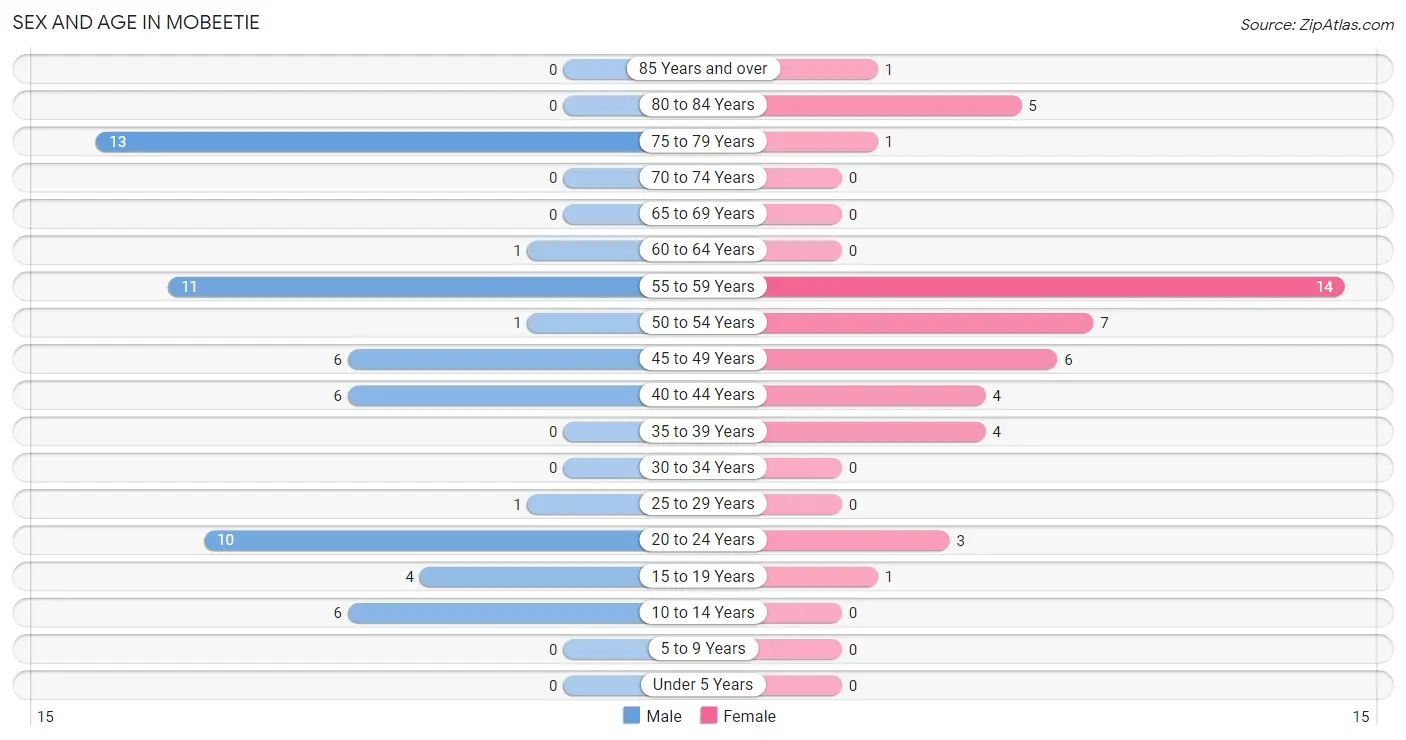
| Age Bracket | Male | Female |
| Under 5 Years | 0 (0.0%) | 0 (0.0%) |
| 5 to 9 Years | 0 (0.0%) | 0 (0.0%) |
| 10 to 14 Years | 6 (10.2%) | 0 (0.0%) |
| 15 to 19 Years | 4 (6.8%) | 1 (2.2%) |
| 20 to 24 Years | 10 (17.0%) | 3 (6.5%) |
| 25 to 29 Years | 1 (1.7%) | 0 (0.0%) |
| 30 to 34 Years | 0 (0.0%) | 0 (0.0%) |
| 35 to 39 Years | 0 (0.0%) | 4 (8.7%) |
| 40 to 44 Years | 6 (10.2%) | 4 (8.7%) |
| 45 to 49 Years | 6 (10.2%) | 6 (13.0%) |
| 50 to 54 Years | 1 (1.7%) | 7 (15.2%) |
| 55 to 59 Years | 11 (18.6%) | 14 (30.4%) |
| 60 to 64 Years | 1 (1.7%) | 0 (0.0%) |
| 65 to 69 Years | 0 (0.0%) | 0 (0.0%) |
| 70 to 74 Years | 0 (0.0%) | 0 (0.0%) |
| 75 to 79 Years | 13 (22.0%) | 1 (2.2%) |
| 80 to 84 Years | 0 (0.0%) | 5 (10.9%) |
| 85 Years and over | 0 (0.0%) | 1 (2.2%) |
| Total | 59 (100.0%) | 46 (100.0%) |
Families and Households in Mobeetie
Median Family Size in Mobeetie
The median family size in Mobeetie is 2.63 persons per family, with single female/mother families (3 | 10.0%) accounting for the largest median family size of 4.33 persons per family. On the other hand, married-couple families (26 | 86.7%) represent the smallest median family size with 2.38 persons per family.
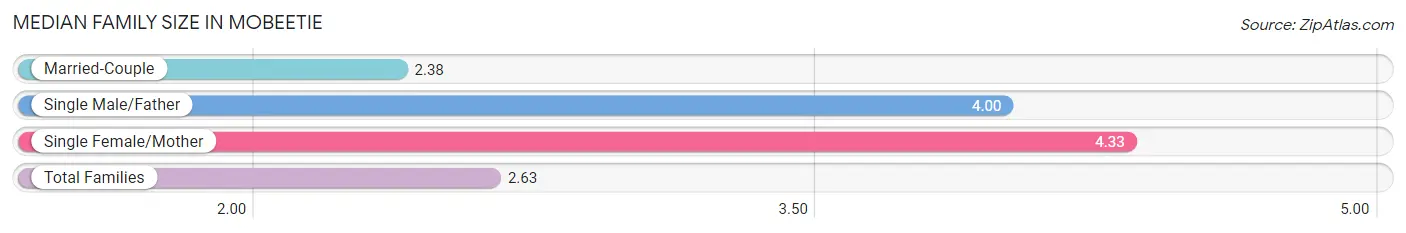
| Family Type | # Families | Family Size |
| Married-Couple | 26 (86.7%) | 2.38 |
| Single Male/Father | 1 (3.3%) | 4.00 |
| Single Female/Mother | 3 (10.0%) | 4.33 |
| Total Families | 30 (100.0%) | 2.63 |
Median Household Size in Mobeetie
The median household size in Mobeetie is 2.33 persons per household, with single female/mother households (3 | 6.7%) accounting for the largest median household size of 4.33 persons per household. non-family households (15 | 33.3%) represent the smallest median household size with 1.73 persons per household.
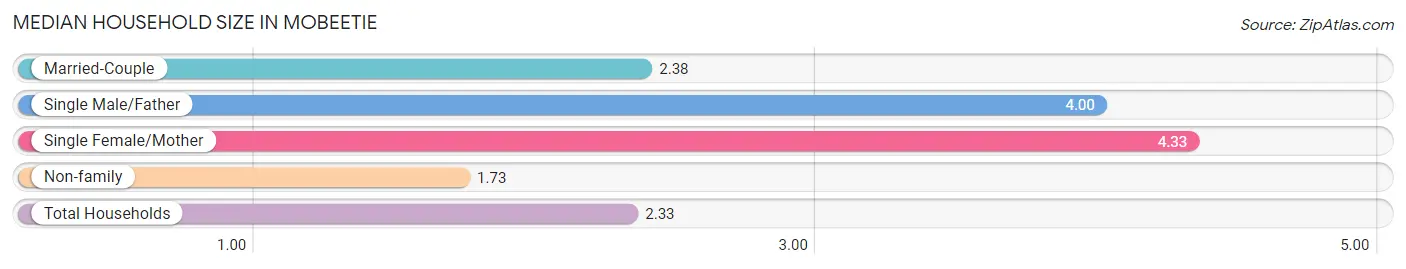
| Household Type | # Households | Household Size |
| Married-Couple | 26 (57.8%) | 2.38 |
| Single Male/Father | 1 (2.2%) | 4.00 |
| Single Female/Mother | 3 (6.7%) | 4.33 |
| Non-family | 15 (33.3%) | 1.73 |
| Total Households | 45 (100.0%) | 2.33 |
Household Size by Marriage Status in Mobeetie
Out of a total of 45 households in Mobeetie, 30 (66.7%) are family households, while 15 (33.3%) are nonfamily households. The most numerous type of family households are 2-person households, comprising 23, and the most common type of nonfamily households are 1-person households, comprising 11.
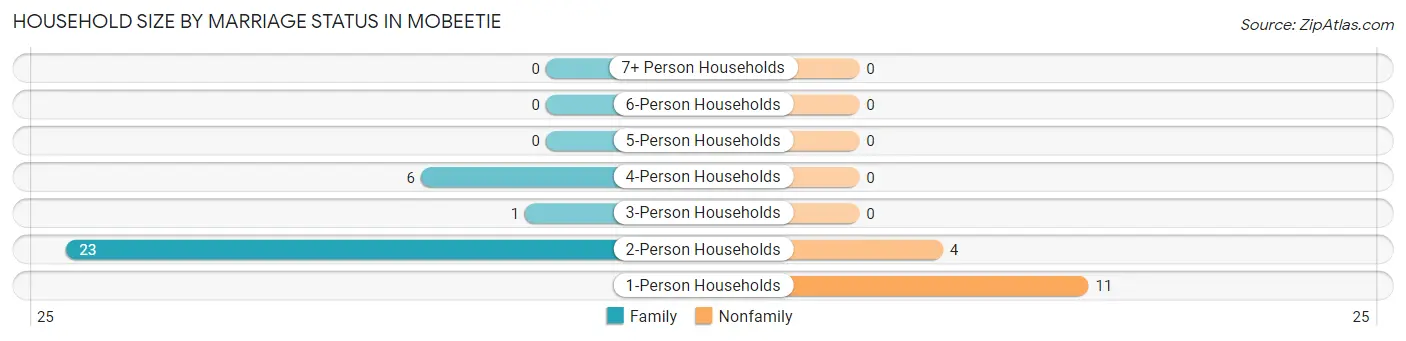
| Household Size | Family Households | Nonfamily Households |
| 1-Person Households | - | 11 (24.4%) |
| 2-Person Households | 23 (51.1%) | 4 (8.9%) |
| 3-Person Households | 1 (2.2%) | 0 (0.0%) |
| 4-Person Households | 6 (13.3%) | 0 (0.0%) |
| 5-Person Households | 0 (0.0%) | 0 (0.0%) |
| 6-Person Households | 0 (0.0%) | 0 (0.0%) |
| 7+ Person Households | 0 (0.0%) | 0 (0.0%) |
| Total | 30 (66.7%) | 15 (33.3%) |
Female Fertility in Mobeetie
Fertility by Age in Mobeetie
| Age Bracket | Women with Births | Births / 1,000 Women |
| 15 to 19 years | 0 (0.0%) | 0.0 |
| 20 to 34 years | 0 (0.0%) | 0.0 |
| 35 to 50 years | 0 (0.0%) | 0.0 |
| Total | 0 (0.0%) | 0.0 |
Fertility by Age by Marriage Status in Mobeetie
| Age Bracket | Married | Unmarried |
| 15 to 19 years | 0 (0.0%) | 0 (0.0%) |
| 20 to 34 years | 0 (0.0%) | 0 (0.0%) |
| 35 to 50 years | 0 (0.0%) | 0 (0.0%) |
| Total | 0 (0.0%) | 0 (0.0%) |
Fertility by Education in Mobeetie
| Educational Attainment | Women with Births | Births / 1,000 Women |
| Less than High School | 0 (0.0%) | 0.0 |
| High School Diploma | 0 (0.0%) | 0.0 |
| College or Associate's Degree | 0 (0.0%) | 0.0 |
| Bachelor's Degree | 0 (0.0%) | 0.0 |
| Graduate Degree | 0 (0.0%) | 0.0 |
| Total | 0 (0.0%) | 0.0 |
Fertility by Education by Marriage Status in Mobeetie
| Educational Attainment | Married | Unmarried |
| Less than High School | 0 (0.0%) | 0 (0.0%) |
| High School Diploma | 0 (0.0%) | 0 (0.0%) |
| College or Associate's Degree | 0 (0.0%) | 0 (0.0%) |
| Bachelor's Degree | 0 (0.0%) | 0 (0.0%) |
| Graduate Degree | 0 (0.0%) | 0 (0.0%) |
| Total | 0 (0.0%) | 0 (0.0%) |
Employment Characteristics in Mobeetie
Employment by Class of Employer in Mobeetie
Among the 58 employed individuals in Mobeetie, private company employees (28 | 48.3%), local government employees (17 | 29.3%), and not-for-profit organizations (5 | 8.6%) make up the most common classes of employment.
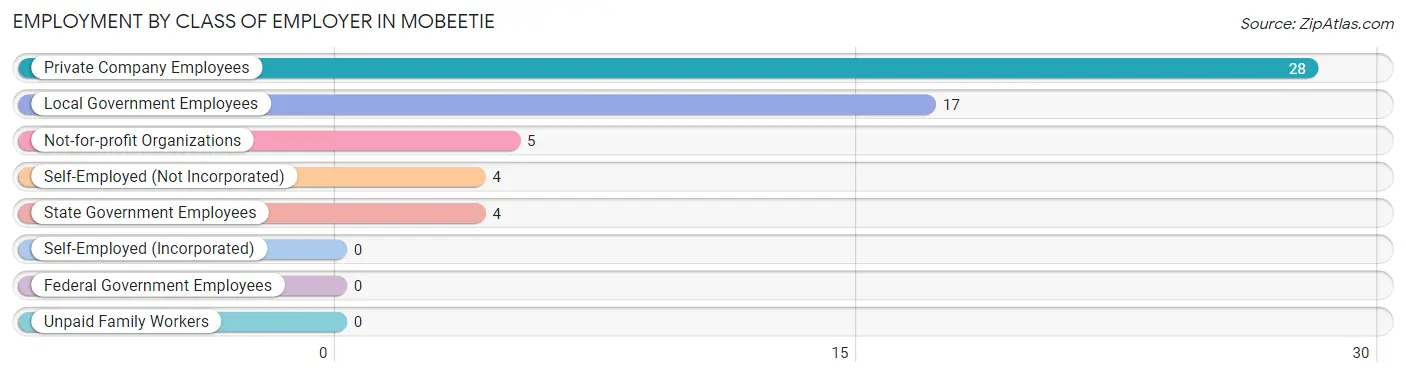
| Employer Class | # Employees | % Employees |
| Private Company Employees | 28 | 48.3% |
| Self-Employed (Incorporated) | 0 | 0.0% |
| Self-Employed (Not Incorporated) | 4 | 6.9% |
| Not-for-profit Organizations | 5 | 8.6% |
| Local Government Employees | 17 | 29.3% |
| State Government Employees | 4 | 6.9% |
| Federal Government Employees | 0 | 0.0% |
| Unpaid Family Workers | 0 | 0.0% |
| Total | 58 | 100.0% |
Employment Status by Age in Mobeetie
According to the labor force statistics for Mobeetie, out of the total population over 16 years of age (94), 73.4% or 69 individuals are in the labor force, with 15.9% or 11 of them unemployed. The age group with the highest labor force participation rate is 20 to 24 years, with 100.0% or 13 individuals in the labor force. Within the labor force, the 20 to 24 years age range has the highest percentage of unemployed individuals, with 76.9% or 10 of them being unemployed.
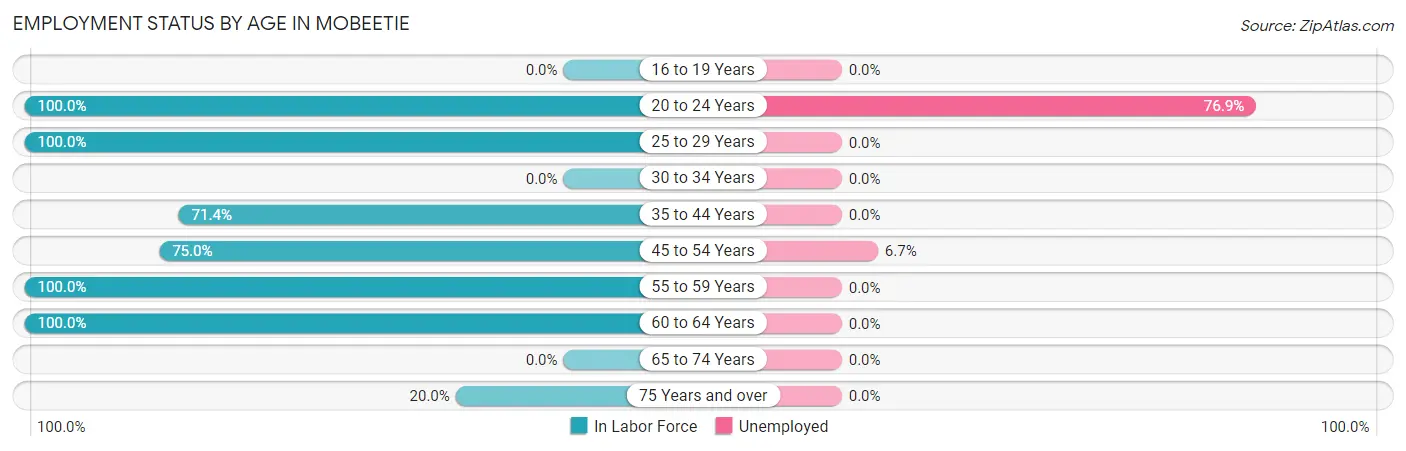
| Age Bracket | In Labor Force | Unemployed |
| 16 to 19 Years | 0 (0.0%) | 0 (0.0%) |
| 20 to 24 Years | 13 (100.0%) | 10 (76.9%) |
| 25 to 29 Years | 1 (100.0%) | 0 (0.0%) |
| 30 to 34 Years | 0 (0.0%) | 0 (0.0%) |
| 35 to 44 Years | 10 (71.4%) | 0 (0.0%) |
| 45 to 54 Years | 15 (75.0%) | 1 (6.7%) |
| 55 to 59 Years | 25 (100.0%) | 0 (0.0%) |
| 60 to 64 Years | 1 (100.0%) | 0 (0.0%) |
| 65 to 74 Years | 0 (0.0%) | 0 (0.0%) |
| 75 Years and over | 4 (20.0%) | 0 (0.0%) |
| Total | 69 (73.4%) | 11 (15.9%) |
Employment Status by Educational Attainment in Mobeetie
According to labor force statistics for Mobeetie, 85.2% of individuals (52) out of the total population between 25 and 64 years of age (61) are in the labor force, with 1.9% or 1 of them being unemployed. The group with the highest labor force participation rate are those with the educational attainment of bachelor's degree or higher, with 100.0% or 4 individuals in the labor force. Within the labor force, individuals with college / associate degree education have the highest percentage of unemployment, with 3.1% or 1 of them being unemployed.
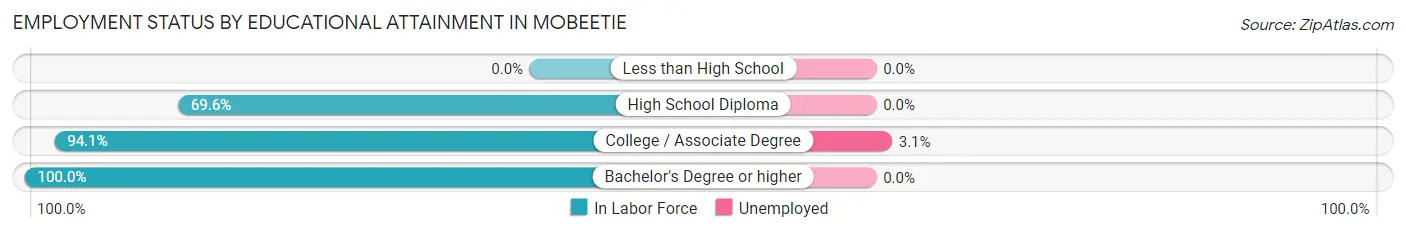
| Educational Attainment | In Labor Force | Unemployed |
| Less than High School | 0 (0.0%) | 0 (0.0%) |
| High School Diploma | 16 (69.6%) | 0 (0.0%) |
| College / Associate Degree | 32 (94.1%) | 1 (3.1%) |
| Bachelor's Degree or higher | 4 (100.0%) | 0 (0.0%) |
| Total | 52 (85.2%) | 1 (1.9%) |
Employment Occupations by Sex in Mobeetie
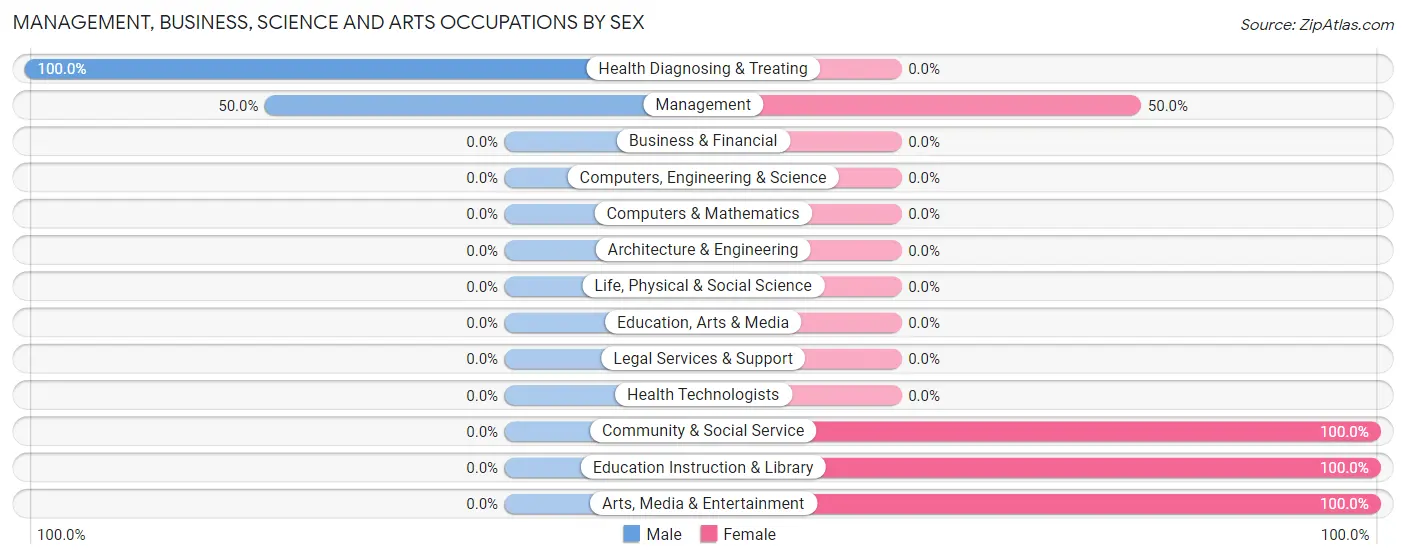
Management, Business, Science and Arts Occupations
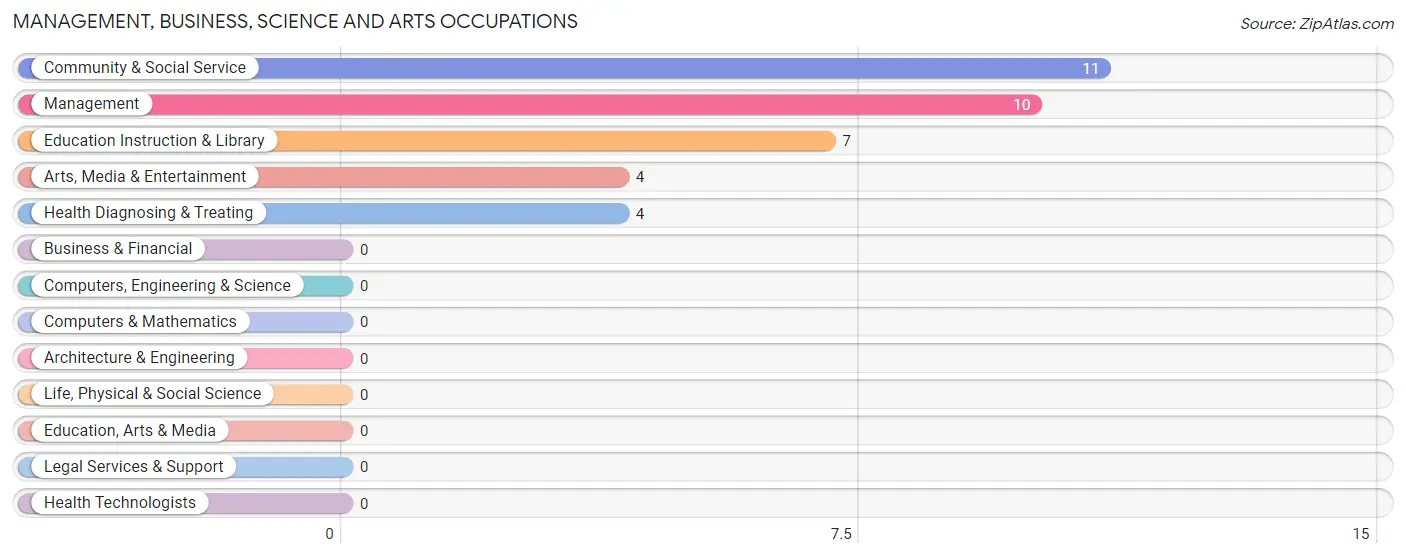
The most common Management, Business, Science and Arts occupations in Mobeetie are Community & Social Service (11 | 19.0%), Management (10 | 17.2%), Education Instruction & Library (7 | 12.1%), Arts, Media & Entertainment (4 | 6.9%), and Health Diagnosing & Treating (4 | 6.9%).
Management, Business, Science and Arts Occupations by Sex
Within the Management, Business, Science and Arts occupations in Mobeetie, the most male-oriented occupations are Health Diagnosing & Treating (100.0%), and Management (50.0%), while the most female-oriented occupations are Community & Social Service (100.0%), Education Instruction & Library (100.0%), and Arts, Media & Entertainment (100.0%).
| Occupation | Male | Female |
| Management | 5 (50.0%) | 5 (50.0%) |
| Business & Financial | 0 (0.0%) | 0 (0.0%) |
| Computers, Engineering & Science | 0 (0.0%) | 0 (0.0%) |
| Computers & Mathematics | 0 (0.0%) | 0 (0.0%) |
| Architecture & Engineering | 0 (0.0%) | 0 (0.0%) |
| Life, Physical & Social Science | 0 (0.0%) | 0 (0.0%) |
| Community & Social Service | 0 (0.0%) | 11 (100.0%) |
| Education, Arts & Media | 0 (0.0%) | 0 (0.0%) |
| Legal Services & Support | 0 (0.0%) | 0 (0.0%) |
| Education Instruction & Library | 0 (0.0%) | 7 (100.0%) |
| Arts, Media & Entertainment | 0 (0.0%) | 4 (100.0%) |
| Health Diagnosing & Treating | 4 (100.0%) | 0 (0.0%) |
| Health Technologists | 0 (0.0%) | 0 (0.0%) |
| Total (Category) | 9 (36.0%) | 16 (64.0%) |
| Total (Overall) | 25 (43.1%) | 33 (56.9%) |
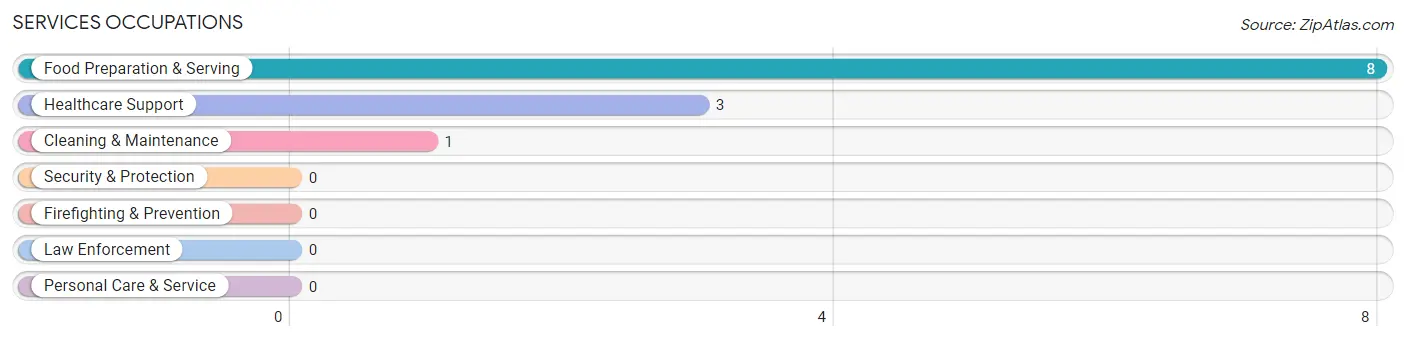
Services Occupations
The most common Services occupations in Mobeetie are Food Preparation & Serving (8 | 13.8%), Healthcare Support (3 | 5.2%), and Cleaning & Maintenance (1 | 1.7%).
Services Occupations by Sex
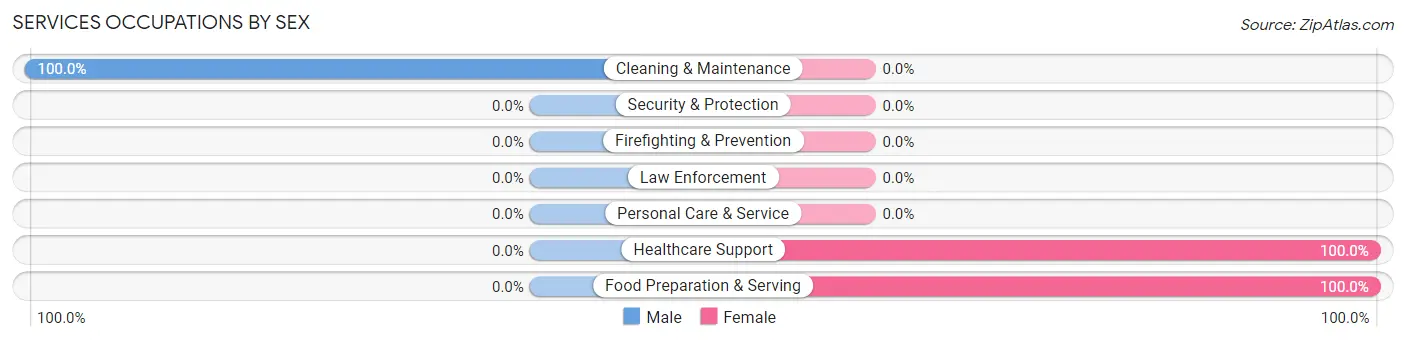
| Occupation | Male | Female |
| Healthcare Support | 0 (0.0%) | 3 (100.0%) |
| Security & Protection | 0 (0.0%) | 0 (0.0%) |
| Firefighting & Prevention | 0 (0.0%) | 0 (0.0%) |
| Law Enforcement | 0 (0.0%) | 0 (0.0%) |
| Food Preparation & Serving | 0 (0.0%) | 8 (100.0%) |
| Cleaning & Maintenance | 1 (100.0%) | 0 (0.0%) |
| Personal Care & Service | 0 (0.0%) | 0 (0.0%) |
| Total (Category) | 1 (8.3%) | 11 (91.7%) |
| Total (Overall) | 25 (43.1%) | 33 (56.9%) |
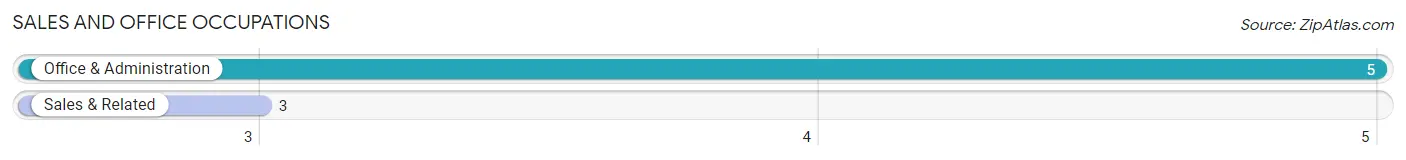
Sales and Office Occupations
The most common Sales and Office occupations in Mobeetie are Office & Administration (5 | 8.6%), and Sales & Related (3 | 5.2%).
Sales and Office Occupations by Sex
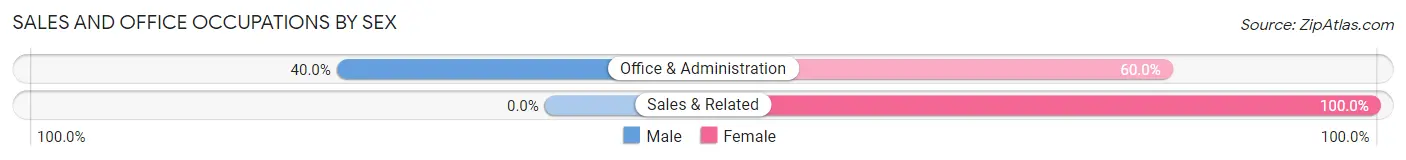
| Occupation | Male | Female |
| Sales & Related | 0 (0.0%) | 3 (100.0%) |
| Office & Administration | 2 (40.0%) | 3 (60.0%) |
| Total (Category) | 2 (25.0%) | 6 (75.0%) |
| Total (Overall) | 25 (43.1%) | 33 (56.9%) |
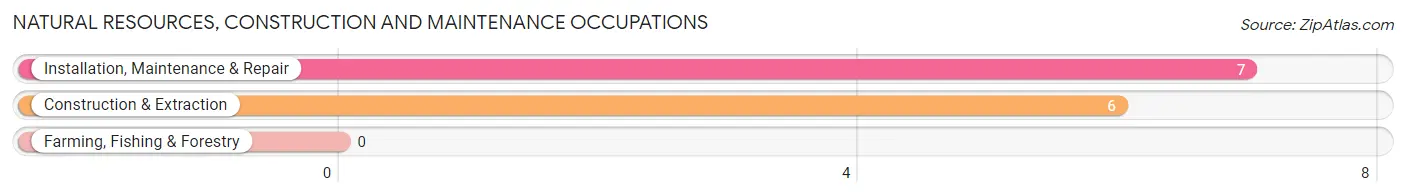
Natural Resources, Construction and Maintenance Occupations
The most common Natural Resources, Construction and Maintenance occupations in Mobeetie are Installation, Maintenance & Repair (7 | 12.1%), and Construction & Extraction (6 | 10.3%).
Natural Resources, Construction and Maintenance Occupations by Sex
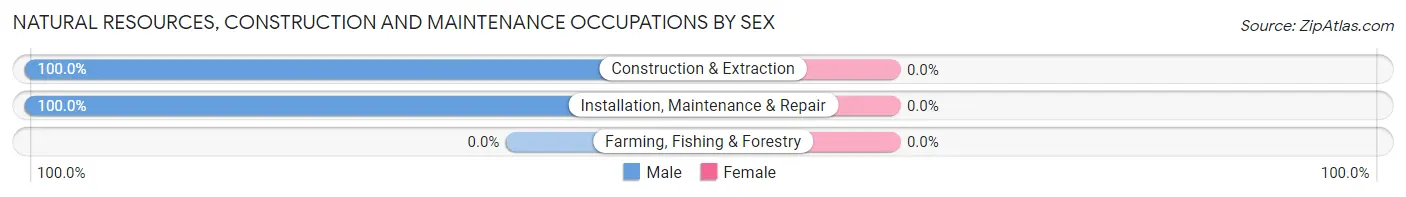
| Occupation | Male | Female |
| Farming, Fishing & Forestry | 0 (0.0%) | 0 (0.0%) |
| Construction & Extraction | 6 (100.0%) | 0 (0.0%) |
| Installation, Maintenance & Repair | 7 (100.0%) | 0 (0.0%) |
| Total (Category) | 13 (100.0%) | 0 (0.0%) |
| Total (Overall) | 25 (43.1%) | 33 (56.9%) |
Production, Transportation and Moving Occupations
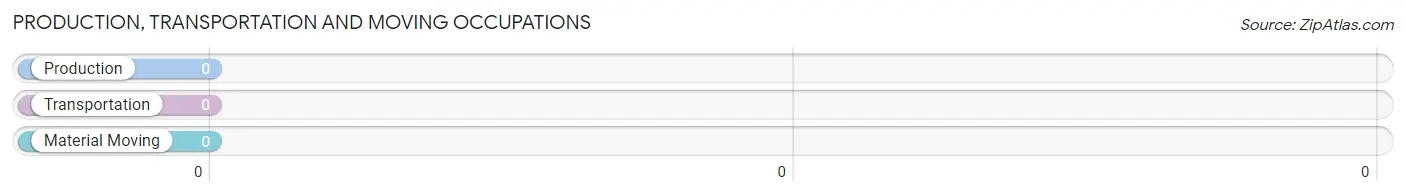
Production, Transportation and Moving Occupations by Sex
| Occupation | Male | Female |
| Production | 0 (0.0%) | 0 (0.0%) |
| Transportation | 0 (0.0%) | 0 (0.0%) |
| Material Moving | 0 (0.0%) | 0 (0.0%) |
| Total (Category) | 0 (0.0%) | 0 (0.0%) |
| Total (Overall) | 25 (43.1%) | 33 (56.9%) |
Employment Industries by Sex in Mobeetie
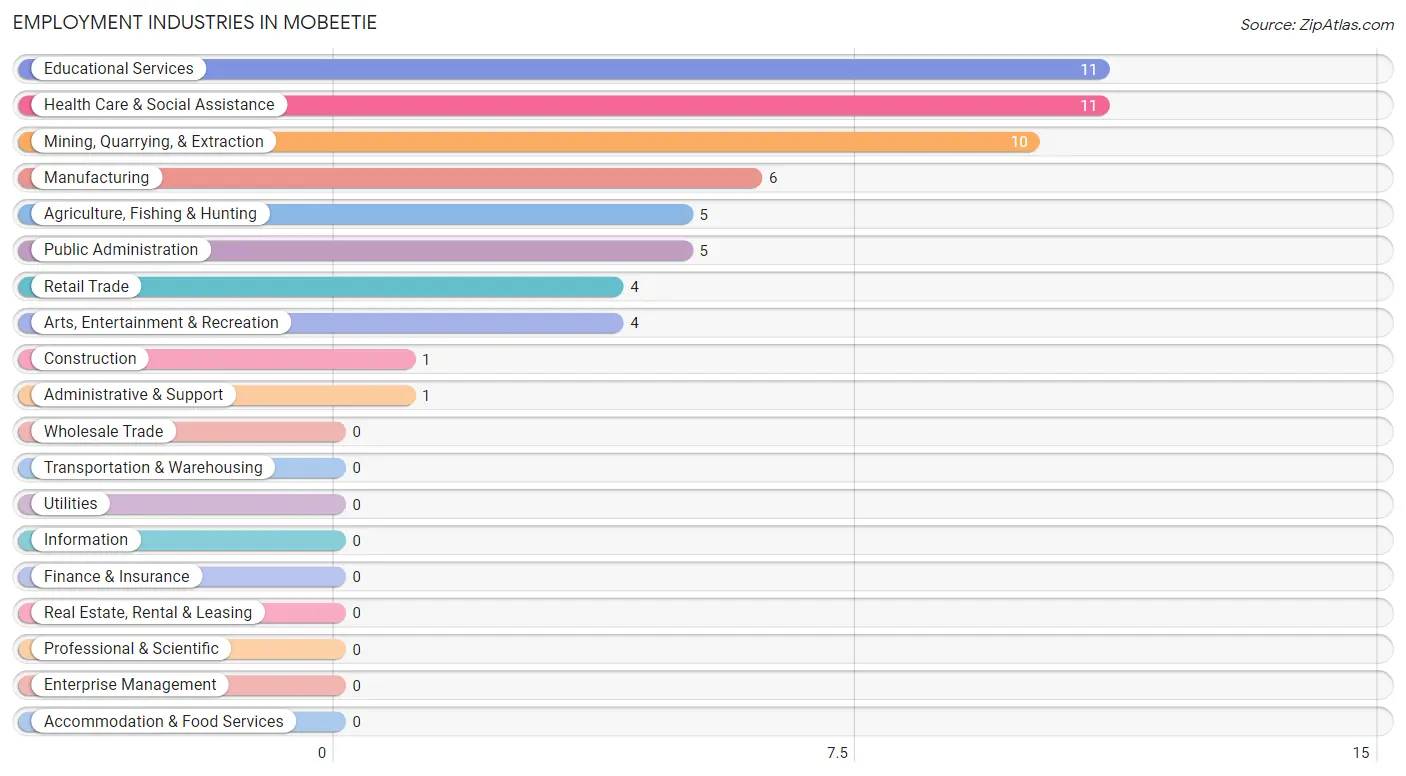
Employment Industries in Mobeetie
The major employment industries in Mobeetie include Educational Services (11 | 19.0%), Health Care & Social Assistance (11 | 19.0%), Mining, Quarrying, & Extraction (10 | 17.2%), Manufacturing (6 | 10.3%), and Agriculture, Fishing & Hunting (5 | 8.6%).
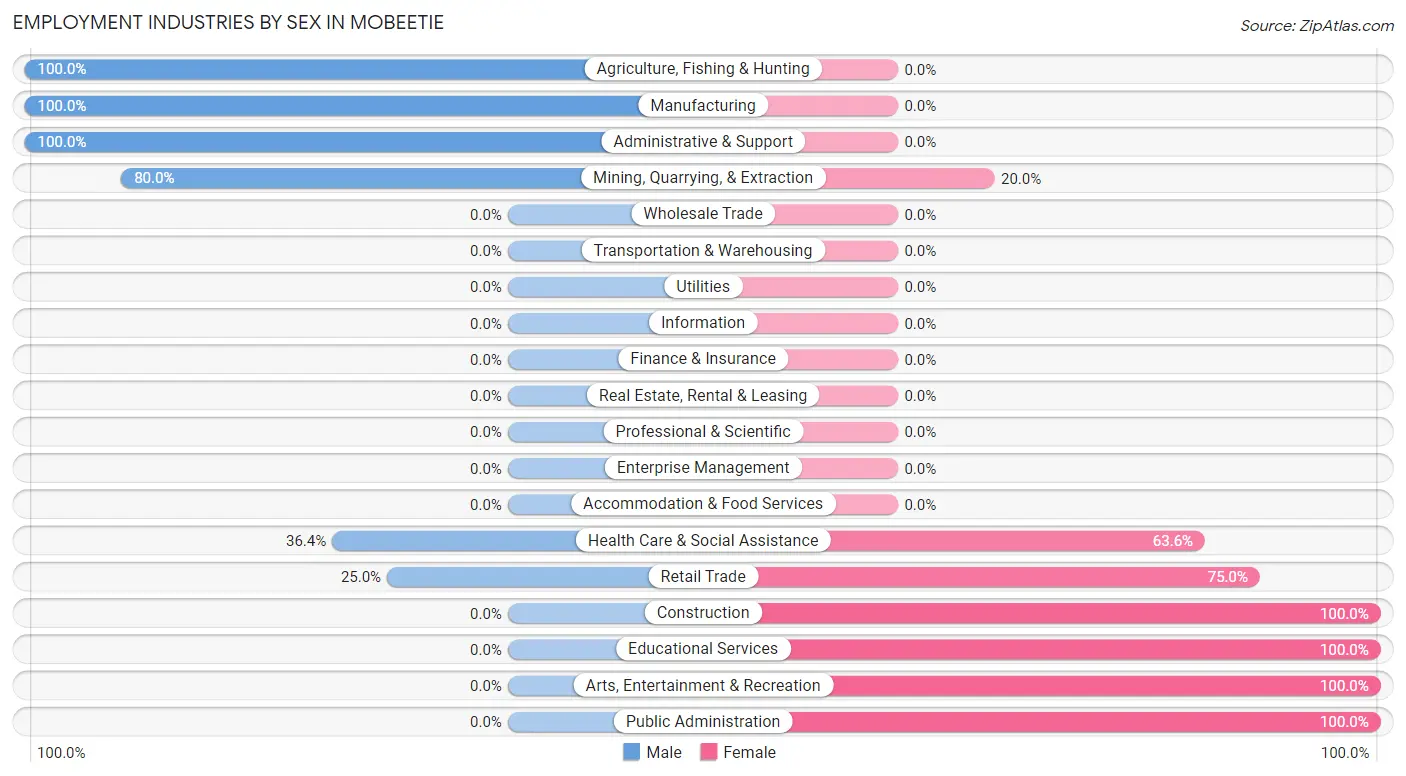
Employment Industries by Sex in Mobeetie
The Mobeetie industries that see more men than women are Agriculture, Fishing & Hunting (100.0%), Manufacturing (100.0%), and Administrative & Support (100.0%), whereas the industries that tend to have a higher number of women are Construction (100.0%), Educational Services (100.0%), and Arts, Entertainment & Recreation (100.0%).
| Industry | Male | Female |
| Agriculture, Fishing & Hunting | 5 (100.0%) | 0 (0.0%) |
| Mining, Quarrying, & Extraction | 8 (80.0%) | 2 (20.0%) |
| Construction | 0 (0.0%) | 1 (100.0%) |
| Manufacturing | 6 (100.0%) | 0 (0.0%) |
| Wholesale Trade | 0 (0.0%) | 0 (0.0%) |
| Retail Trade | 1 (25.0%) | 3 (75.0%) |
| Transportation & Warehousing | 0 (0.0%) | 0 (0.0%) |
| Utilities | 0 (0.0%) | 0 (0.0%) |
| Information | 0 (0.0%) | 0 (0.0%) |
| Finance & Insurance | 0 (0.0%) | 0 (0.0%) |
| Real Estate, Rental & Leasing | 0 (0.0%) | 0 (0.0%) |
| Professional & Scientific | 0 (0.0%) | 0 (0.0%) |
| Enterprise Management | 0 (0.0%) | 0 (0.0%) |
| Administrative & Support | 1 (100.0%) | 0 (0.0%) |
| Educational Services | 0 (0.0%) | 11 (100.0%) |
| Health Care & Social Assistance | 4 (36.4%) | 7 (63.6%) |
| Arts, Entertainment & Recreation | 0 (0.0%) | 4 (100.0%) |
| Accommodation & Food Services | 0 (0.0%) | 0 (0.0%) |
| Public Administration | 0 (0.0%) | 5 (100.0%) |
| Total | 25 (43.1%) | 33 (56.9%) |
Education in Mobeetie
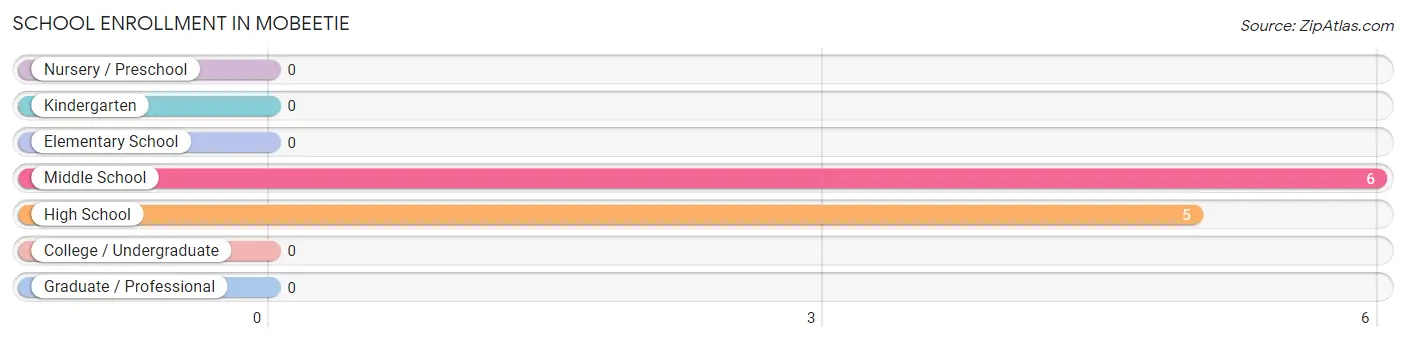
School Enrollment in Mobeetie
The most common levels of schooling among the 11 students in Mobeetie are middle school (6 | 54.5%), and high school (5 | 45.5%).
| School Level | # Students | % Students |
| Nursery / Preschool | 0 | 0.0% |
| Kindergarten | 0 | 0.0% |
| Elementary School | 0 | 0.0% |
| Middle School | 6 | 54.5% |
| High School | 5 | 45.5% |
| College / Undergraduate | 0 | 0.0% |
| Graduate / Professional | 0 | 0.0% |
| Total | 11 | 100.0% |
School Enrollment by Age by Funding Source in Mobeetie
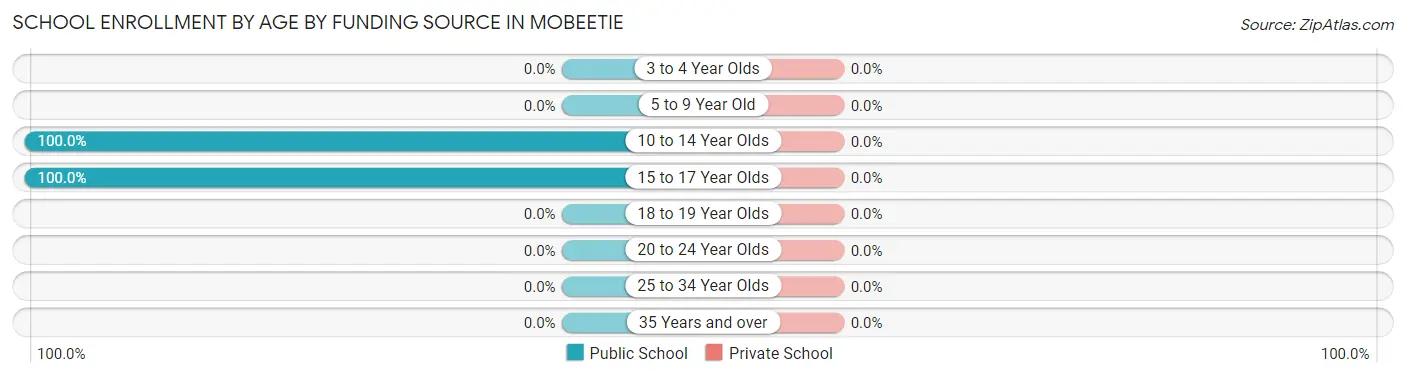
| Age Bracket | Public School | Private School |
| 3 to 4 Year Olds | 0 (0.0%) | 0 (0.0%) |
| 5 to 9 Year Old | 0 (0.0%) | 0 (0.0%) |
| 10 to 14 Year Olds | 6 (100.0%) | 0 (0.0%) |
| 15 to 17 Year Olds | 5 (100.0%) | 0 (0.0%) |
| 18 to 19 Year Olds | 0 (0.0%) | 0 (0.0%) |
| 20 to 24 Year Olds | 0 (0.0%) | 0 (0.0%) |
| 25 to 34 Year Olds | 0 (0.0%) | 0 (0.0%) |
| 35 Years and over | 0 (0.0%) | 0 (0.0%) |
| Total | 11 (100.0%) | 0 (0.0%) |
Educational Attainment by Field of Study in Mobeetie
Business (4 | 80.0%), and communications (1 | 20.0%) are the most common fields of study among 5 individuals in Mobeetie who have obtained a bachelor's degree or higher.
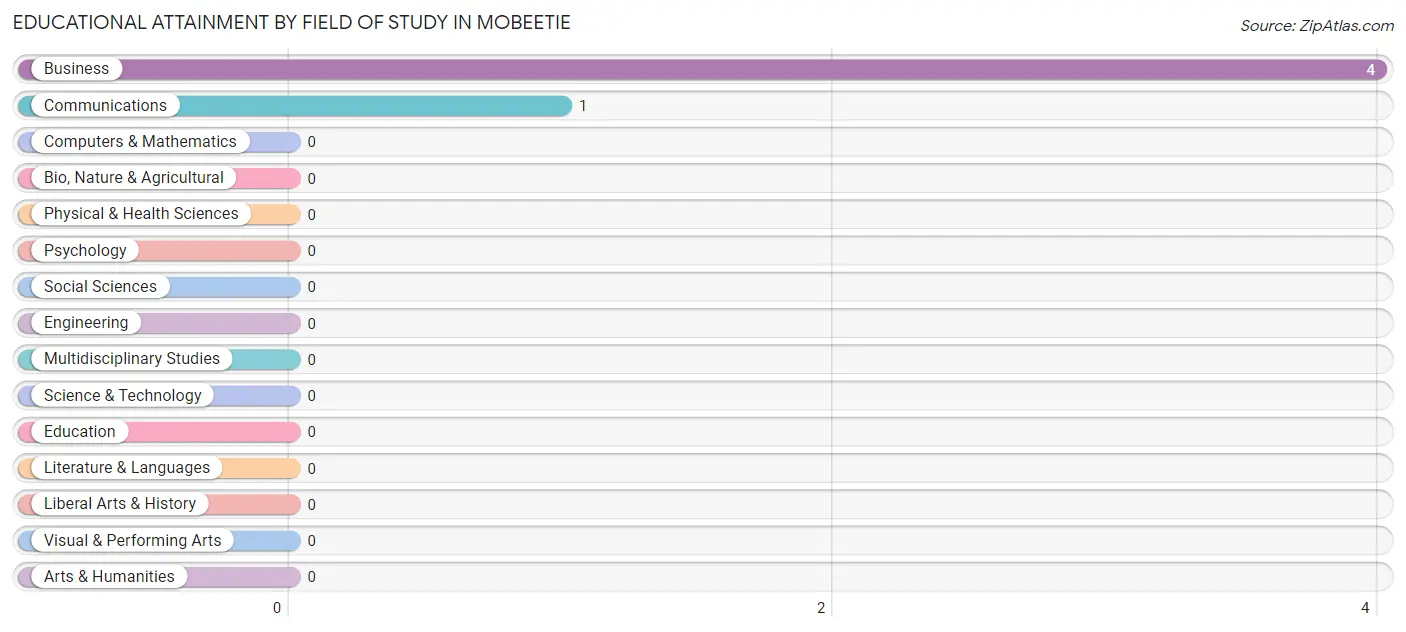
| Field of Study | # Graduates | % Graduates |
| Computers & Mathematics | 0 | 0.0% |
| Bio, Nature & Agricultural | 0 | 0.0% |
| Physical & Health Sciences | 0 | 0.0% |
| Psychology | 0 | 0.0% |
| Social Sciences | 0 | 0.0% |
| Engineering | 0 | 0.0% |
| Multidisciplinary Studies | 0 | 0.0% |
| Science & Technology | 0 | 0.0% |
| Business | 4 | 80.0% |
| Education | 0 | 0.0% |
| Literature & Languages | 0 | 0.0% |
| Liberal Arts & History | 0 | 0.0% |
| Visual & Performing Arts | 0 | 0.0% |
| Communications | 1 | 20.0% |
| Arts & Humanities | 0 | 0.0% |
| Total | 5 | 100.0% |
Transportation & Commute in Mobeetie
Vehicle Availability by Sex in Mobeetie
The most prevalent vehicle ownership categories in Mobeetie are males with 3 vehicles (19, accounting for 76.0%) and females with 3 vehicles (11, making up 57.6%).
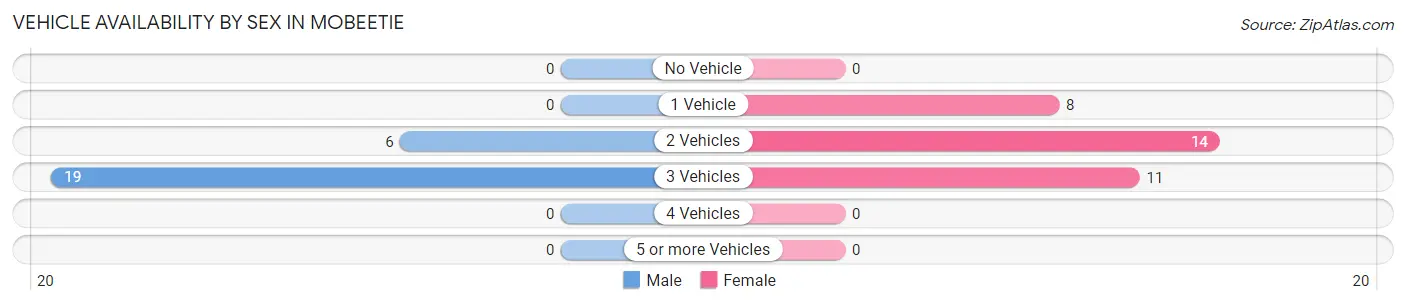
| Vehicles Available | Male | Female |
| No Vehicle | 0 (0.0%) | 0 (0.0%) |
| 1 Vehicle | 0 (0.0%) | 8 (24.2%) |
| 2 Vehicles | 6 (24.0%) | 14 (42.4%) |
| 3 Vehicles | 19 (76.0%) | 11 (33.3%) |
| 4 Vehicles | 0 (0.0%) | 0 (0.0%) |
| 5 or more Vehicles | 0 (0.0%) | 0 (0.0%) |
| Total | 25 (100.0%) | 33 (100.0%) |
Commute Time in Mobeetie
The most frequently occuring commute durations in Mobeetie are 15 to 19 minutes (22 commuters, 40.7%), 30 to 34 minutes (12 commuters, 22.2%), and 60 to 89 minutes (6 commuters, 11.1%).
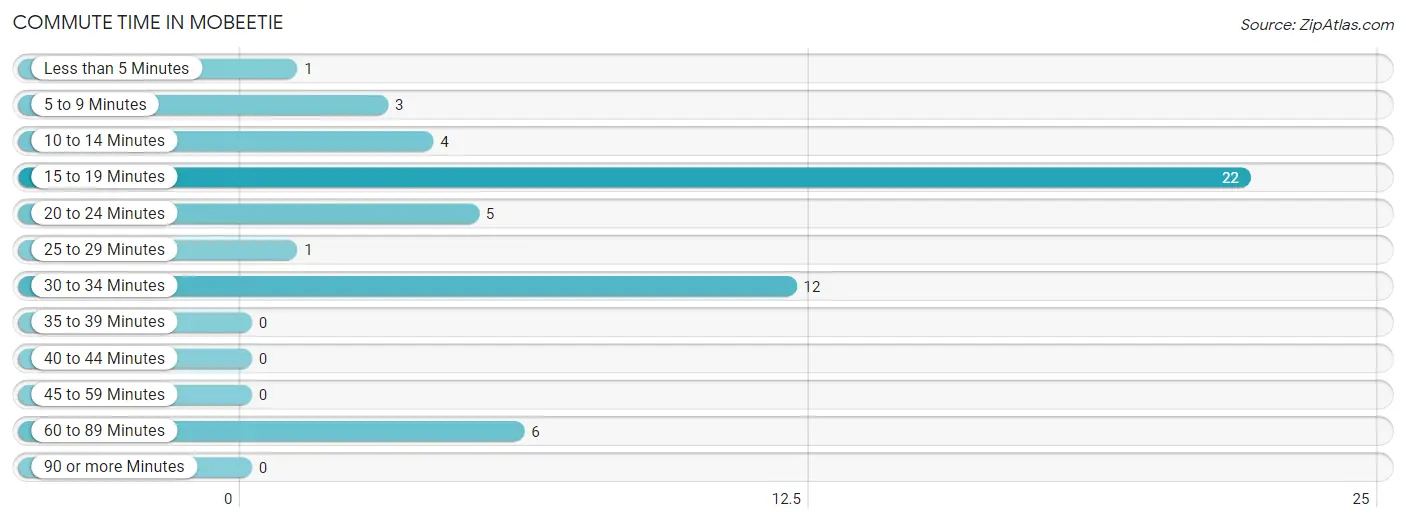
| Commute Time | # Commuters | % Commuters |
| Less than 5 Minutes | 1 | 1.8% |
| 5 to 9 Minutes | 3 | 5.6% |
| 10 to 14 Minutes | 4 | 7.4% |
| 15 to 19 Minutes | 22 | 40.7% |
| 20 to 24 Minutes | 5 | 9.3% |
| 25 to 29 Minutes | 1 | 1.8% |
| 30 to 34 Minutes | 12 | 22.2% |
| 35 to 39 Minutes | 0 | 0.0% |
| 40 to 44 Minutes | 0 | 0.0% |
| 45 to 59 Minutes | 0 | 0.0% |
| 60 to 89 Minutes | 6 | 11.1% |
| 90 or more Minutes | 0 | 0.0% |
Commute Time by Sex in Mobeetie
The most common commute times in Mobeetie are 30 to 34 minutes (8 commuters, 38.1%) for males and 15 to 19 minutes (21 commuters, 63.6%) for females.
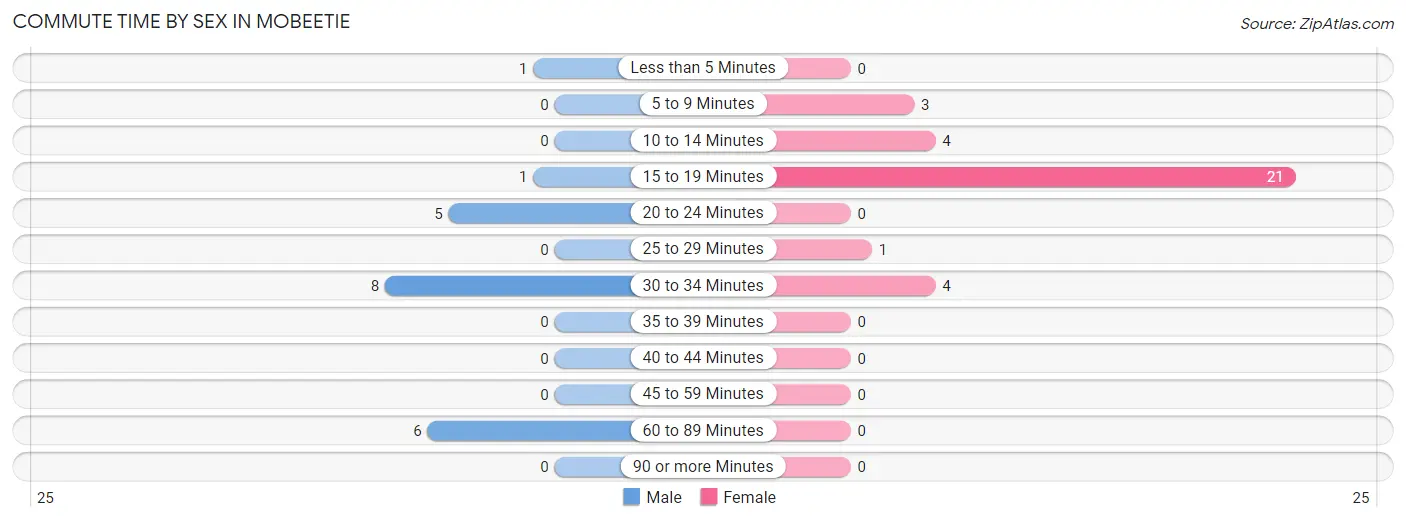
| Commute Time | Male | Female |
| Less than 5 Minutes | 1 (4.8%) | 0 (0.0%) |
| 5 to 9 Minutes | 0 (0.0%) | 3 (9.1%) |
| 10 to 14 Minutes | 0 (0.0%) | 4 (12.1%) |
| 15 to 19 Minutes | 1 (4.8%) | 21 (63.6%) |
| 20 to 24 Minutes | 5 (23.8%) | 0 (0.0%) |
| 25 to 29 Minutes | 0 (0.0%) | 1 (3.0%) |
| 30 to 34 Minutes | 8 (38.1%) | 4 (12.1%) |
| 35 to 39 Minutes | 0 (0.0%) | 0 (0.0%) |
| 40 to 44 Minutes | 0 (0.0%) | 0 (0.0%) |
| 45 to 59 Minutes | 0 (0.0%) | 0 (0.0%) |
| 60 to 89 Minutes | 6 (28.6%) | 0 (0.0%) |
| 90 or more Minutes | 0 (0.0%) | 0 (0.0%) |
Time of Departure to Work by Sex in Mobeetie
The most frequent times of departure to work in Mobeetie are 6:00 AM to 6:29 AM (6, 28.6%) for males and 7:00 AM to 7:29 AM (14, 42.4%) for females.
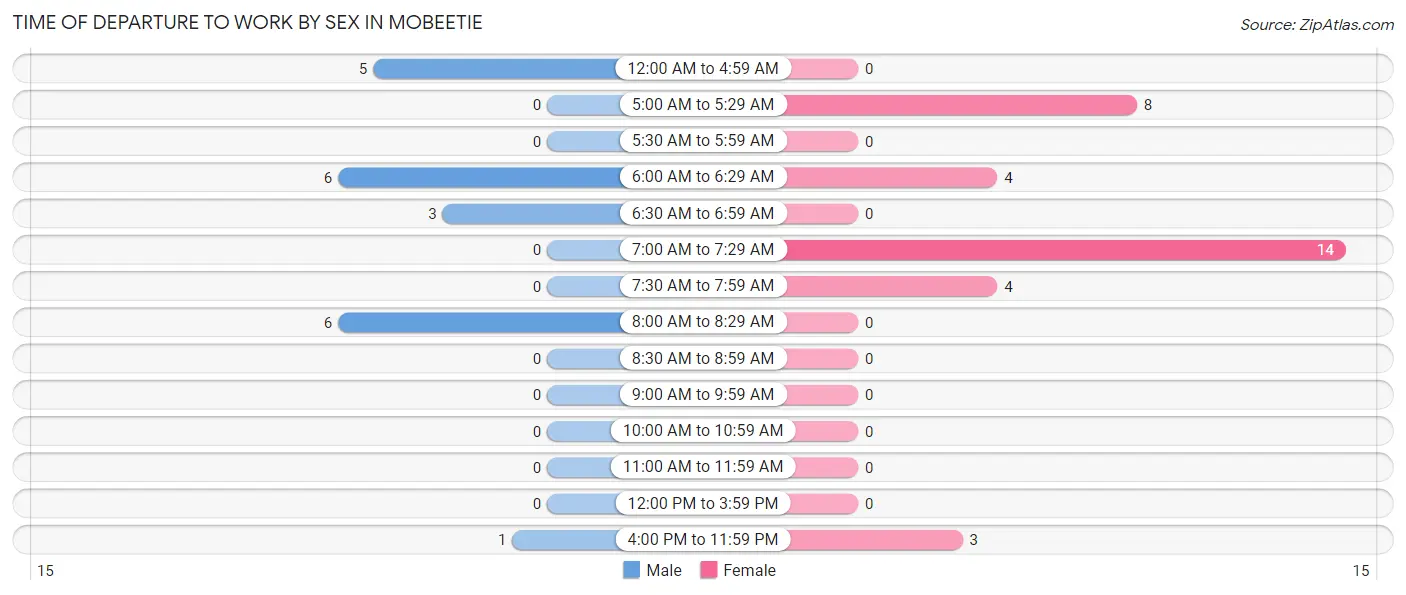
| Time of Departure | Male | Female |
| 12:00 AM to 4:59 AM | 5 (23.8%) | 0 (0.0%) |
| 5:00 AM to 5:29 AM | 0 (0.0%) | 8 (24.2%) |
| 5:30 AM to 5:59 AM | 0 (0.0%) | 0 (0.0%) |
| 6:00 AM to 6:29 AM | 6 (28.6%) | 4 (12.1%) |
| 6:30 AM to 6:59 AM | 3 (14.3%) | 0 (0.0%) |
| 7:00 AM to 7:29 AM | 0 (0.0%) | 14 (42.4%) |
| 7:30 AM to 7:59 AM | 0 (0.0%) | 4 (12.1%) |
| 8:00 AM to 8:29 AM | 6 (28.6%) | 0 (0.0%) |
| 8:30 AM to 8:59 AM | 0 (0.0%) | 0 (0.0%) |
| 9:00 AM to 9:59 AM | 0 (0.0%) | 0 (0.0%) |
| 10:00 AM to 10:59 AM | 0 (0.0%) | 0 (0.0%) |
| 11:00 AM to 11:59 AM | 0 (0.0%) | 0 (0.0%) |
| 12:00 PM to 3:59 PM | 0 (0.0%) | 0 (0.0%) |
| 4:00 PM to 11:59 PM | 1 (4.8%) | 3 (9.1%) |
| Total | 21 (100.0%) | 33 (100.0%) |
Housing Occupancy in Mobeetie
Occupancy by Ownership in Mobeetie
Of the total 45 dwellings in Mobeetie, owner-occupied units account for 42 (93.3%), while renter-occupied units make up 3 (6.7%).
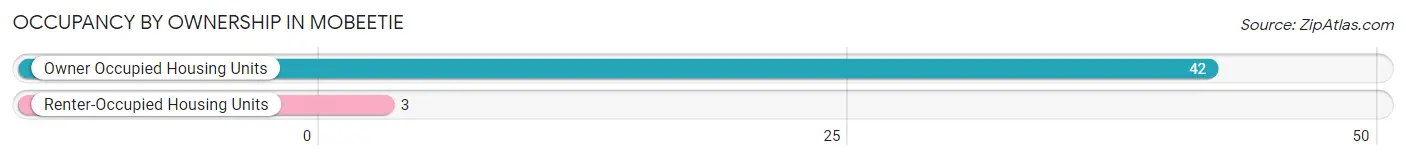
| Occupancy | # Housing Units | % Housing Units |
| Owner Occupied Housing Units | 42 | 93.3% |
| Renter-Occupied Housing Units | 3 | 6.7% |
| Total Occupied Housing Units | 45 | 100.0% |
Occupancy by Household Size in Mobeetie
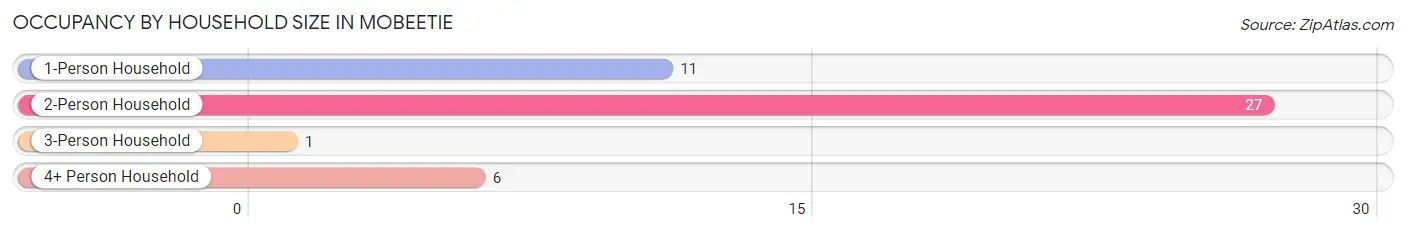
| Household Size | # Housing Units | % Housing Units |
| 1-Person Household | 11 | 24.4% |
| 2-Person Household | 27 | 60.0% |
| 3-Person Household | 1 | 2.2% |
| 4+ Person Household | 6 | 13.3% |
| Total Housing Units | 45 | 100.0% |
Occupancy by Ownership by Household Size in Mobeetie
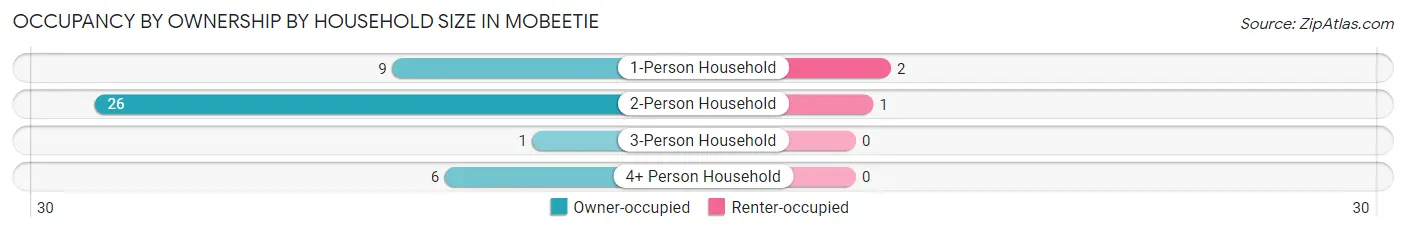
| Household Size | Owner-occupied | Renter-occupied |
| 1-Person Household | 9 (81.8%) | 2 (18.2%) |
| 2-Person Household | 26 (96.3%) | 1 (3.7%) |
| 3-Person Household | 1 (100.0%) | 0 (0.0%) |
| 4+ Person Household | 6 (100.0%) | 0 (0.0%) |
| Total Housing Units | 42 (93.3%) | 3 (6.7%) |
Occupancy by Educational Attainment in Mobeetie
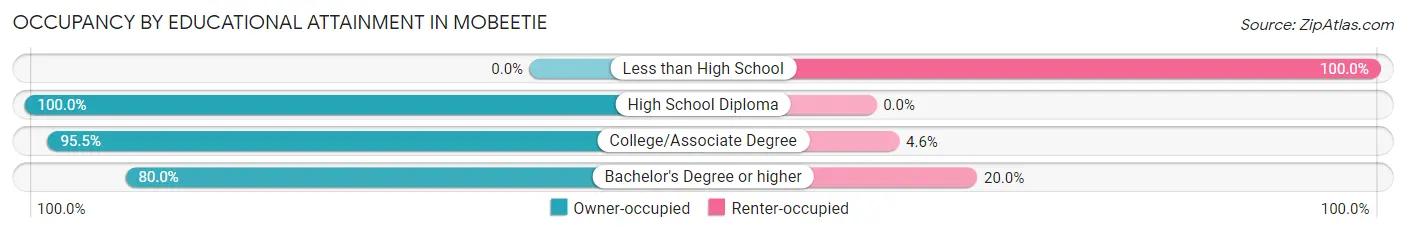
| Household Size | Owner-occupied | Renter-occupied |
| Less than High School | 0 (0.0%) | 1 (100.0%) |
| High School Diploma | 17 (100.0%) | 0 (0.0%) |
| College/Associate Degree | 21 (95.5%) | 1 (4.5%) |
| Bachelor's Degree or higher | 4 (80.0%) | 1 (20.0%) |
Occupancy by Age of Householder in Mobeetie
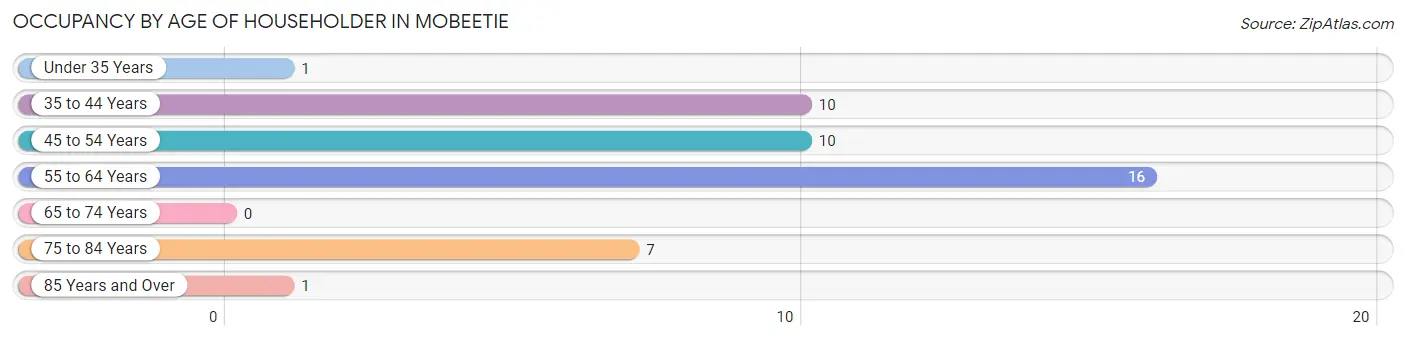
| Age Bracket | # Households | % Households |
| Under 35 Years | 1 | 2.2% |
| 35 to 44 Years | 10 | 22.2% |
| 45 to 54 Years | 10 | 22.2% |
| 55 to 64 Years | 16 | 35.6% |
| 65 to 74 Years | 0 | 0.0% |
| 75 to 84 Years | 7 | 15.6% |
| 85 Years and Over | 1 | 2.2% |
| Total | 45 | 100.0% |
Housing Finances in Mobeetie
Median Income by Occupancy in Mobeetie
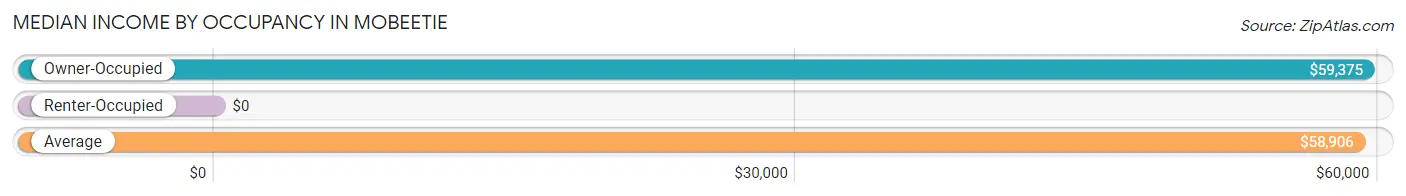
| Occupancy Type | # Households | Median Income |
| Owner-Occupied | 42 (93.3%) | $59,375 |
| Renter-Occupied | 3 (6.7%) | $0 |
| Average | 45 (100.0%) | $58,906 |
Occupancy by Householder Income Bracket in Mobeetie
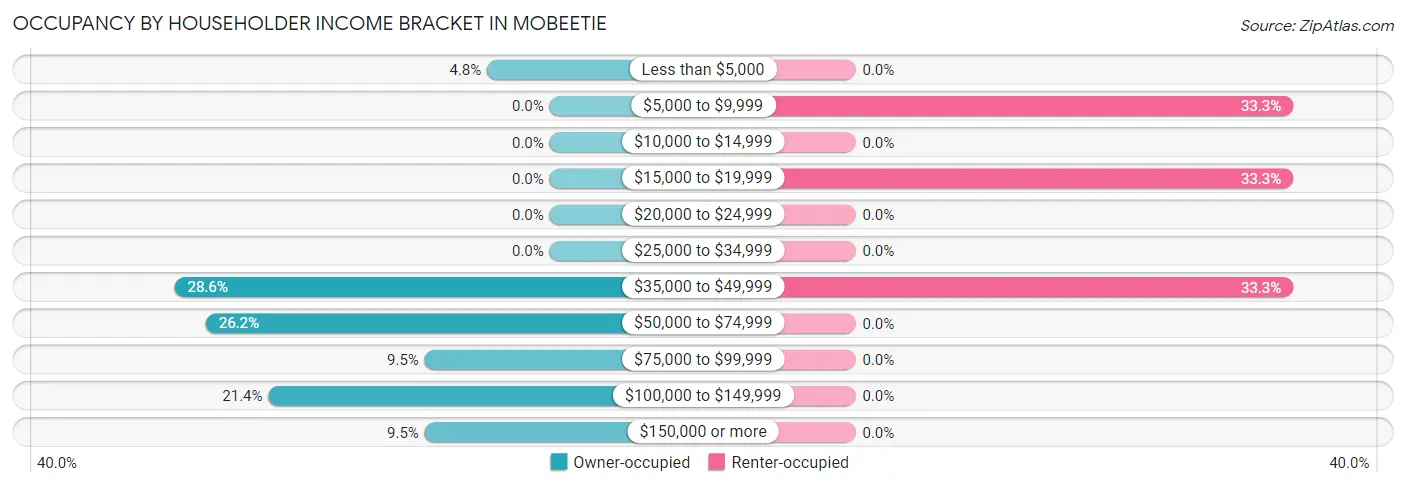
| Income Bracket | Owner-occupied | Renter-occupied |
| Less than $5,000 | 2 (4.8%) | 0 (0.0%) |
| $5,000 to $9,999 | 0 (0.0%) | 1 (33.3%) |
| $10,000 to $14,999 | 0 (0.0%) | 0 (0.0%) |
| $15,000 to $19,999 | 0 (0.0%) | 1 (33.3%) |
| $20,000 to $24,999 | 0 (0.0%) | 0 (0.0%) |
| $25,000 to $34,999 | 0 (0.0%) | 0 (0.0%) |
| $35,000 to $49,999 | 12 (28.6%) | 1 (33.3%) |
| $50,000 to $74,999 | 11 (26.2%) | 0 (0.0%) |
| $75,000 to $99,999 | 4 (9.5%) | 0 (0.0%) |
| $100,000 to $149,999 | 9 (21.4%) | 0 (0.0%) |
| $150,000 or more | 4 (9.5%) | 0 (0.0%) |
| Total | 42 (100.0%) | 3 (100.0%) |
Monthly Housing Cost Tiers in Mobeetie
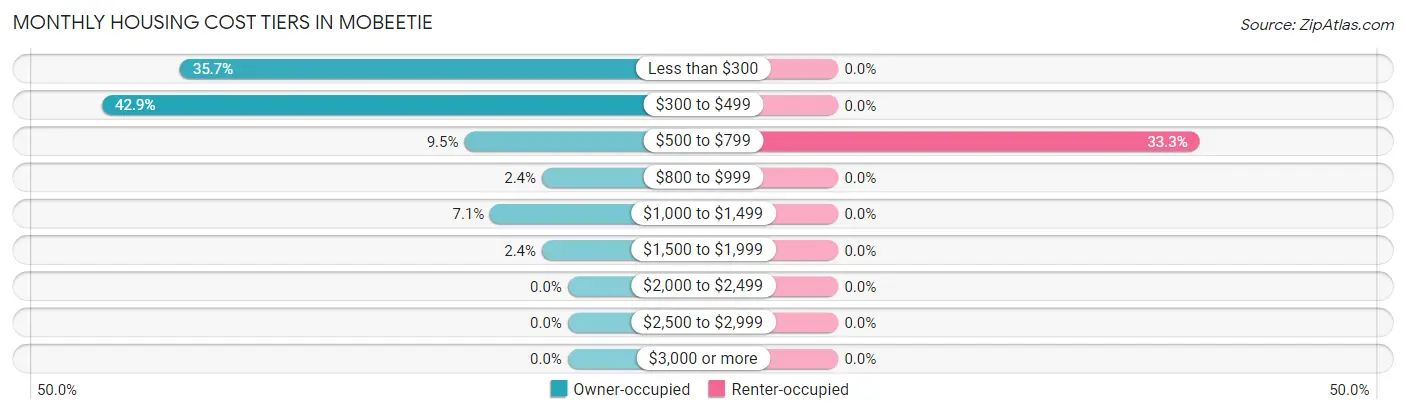
| Monthly Cost | Owner-occupied | Renter-occupied |
| Less than $300 | 15 (35.7%) | 0 (0.0%) |
| $300 to $499 | 18 (42.9%) | 0 (0.0%) |
| $500 to $799 | 4 (9.5%) | 1 (33.3%) |
| $800 to $999 | 1 (2.4%) | 0 (0.0%) |
| $1,000 to $1,499 | 3 (7.1%) | 0 (0.0%) |
| $1,500 to $1,999 | 1 (2.4%) | 0 (0.0%) |
| $2,000 to $2,499 | 0 (0.0%) | 0 (0.0%) |
| $2,500 to $2,999 | 0 (0.0%) | 0 (0.0%) |
| $3,000 or more | 0 (0.0%) | 0 (0.0%) |
| Total | 42 (100.0%) | 3 (100.0%) |
Physical Housing Characteristics in Mobeetie
Housing Structures in Mobeetie
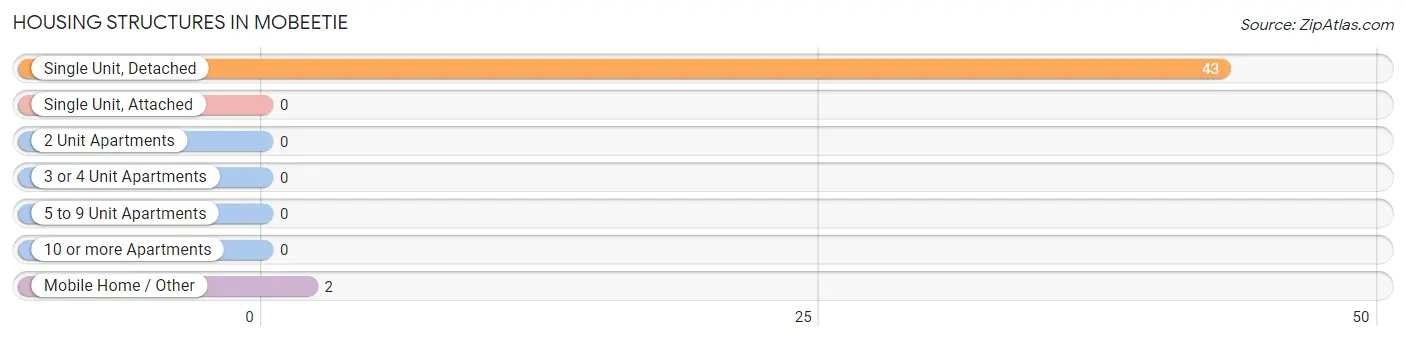
| Structure Type | # Housing Units | % Housing Units |
| Single Unit, Detached | 43 | 95.6% |
| Single Unit, Attached | 0 | 0.0% |
| 2 Unit Apartments | 0 | 0.0% |
| 3 or 4 Unit Apartments | 0 | 0.0% |
| 5 to 9 Unit Apartments | 0 | 0.0% |
| 10 or more Apartments | 0 | 0.0% |
| Mobile Home / Other | 2 | 4.4% |
| Total | 45 | 100.0% |
Housing Structures by Occupancy in Mobeetie
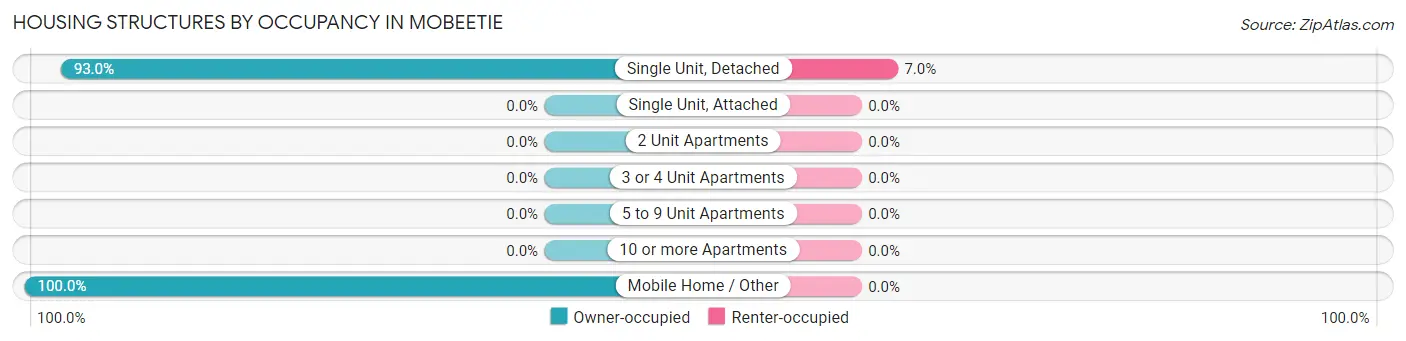
| Structure Type | Owner-occupied | Renter-occupied |
| Single Unit, Detached | 40 (93.0%) | 3 (7.0%) |
| Single Unit, Attached | 0 (0.0%) | 0 (0.0%) |
| 2 Unit Apartments | 0 (0.0%) | 0 (0.0%) |
| 3 or 4 Unit Apartments | 0 (0.0%) | 0 (0.0%) |
| 5 to 9 Unit Apartments | 0 (0.0%) | 0 (0.0%) |
| 10 or more Apartments | 0 (0.0%) | 0 (0.0%) |
| Mobile Home / Other | 2 (100.0%) | 0 (0.0%) |
| Total | 42 (93.3%) | 3 (6.7%) |
Housing Structures by Number of Rooms in Mobeetie
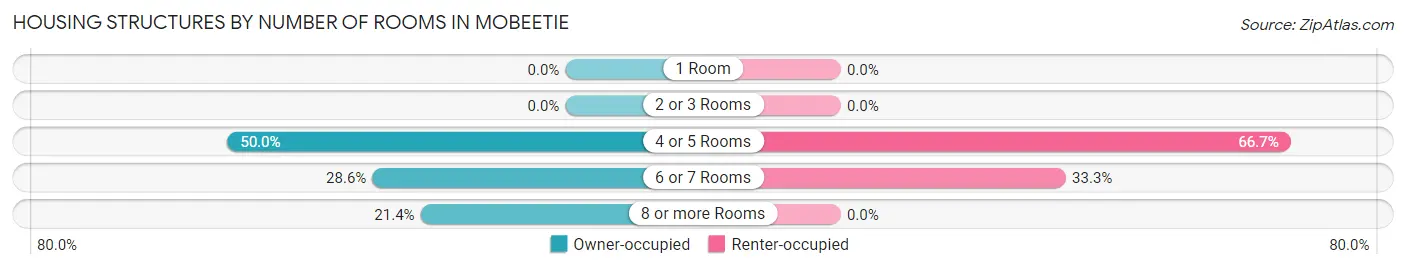
| Number of Rooms | Owner-occupied | Renter-occupied |
| 1 Room | 0 (0.0%) | 0 (0.0%) |
| 2 or 3 Rooms | 0 (0.0%) | 0 (0.0%) |
| 4 or 5 Rooms | 21 (50.0%) | 2 (66.7%) |
| 6 or 7 Rooms | 12 (28.6%) | 1 (33.3%) |
| 8 or more Rooms | 9 (21.4%) | 0 (0.0%) |
| Total | 42 (100.0%) | 3 (100.0%) |
Housing Structure by Heating Type in Mobeetie
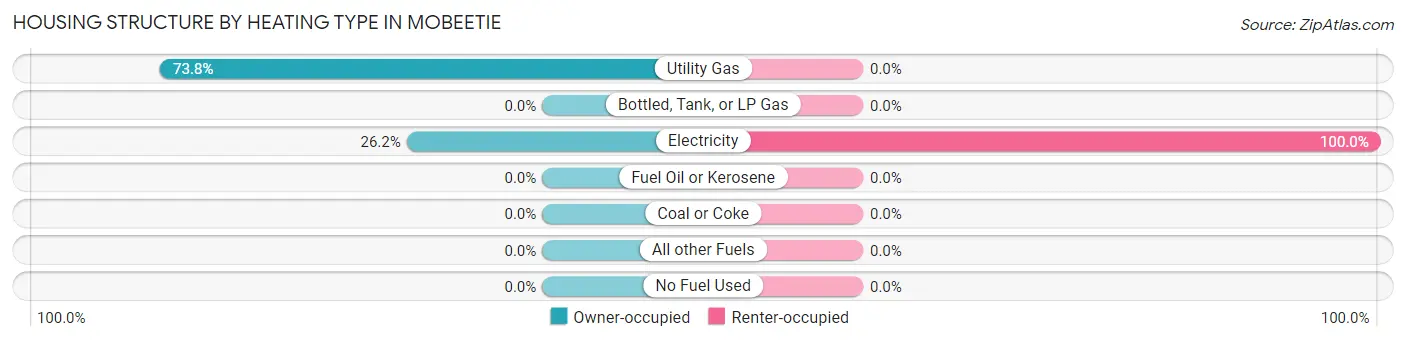
| Heating Type | Owner-occupied | Renter-occupied |
| Utility Gas | 31 (73.8%) | 0 (0.0%) |
| Bottled, Tank, or LP Gas | 0 (0.0%) | 0 (0.0%) |
| Electricity | 11 (26.2%) | 3 (100.0%) |
| Fuel Oil or Kerosene | 0 (0.0%) | 0 (0.0%) |
| Coal or Coke | 0 (0.0%) | 0 (0.0%) |
| All other Fuels | 0 (0.0%) | 0 (0.0%) |
| No Fuel Used | 0 (0.0%) | 0 (0.0%) |
| Total | 42 (100.0%) | 3 (100.0%) |
Household Vehicle Usage in Mobeetie
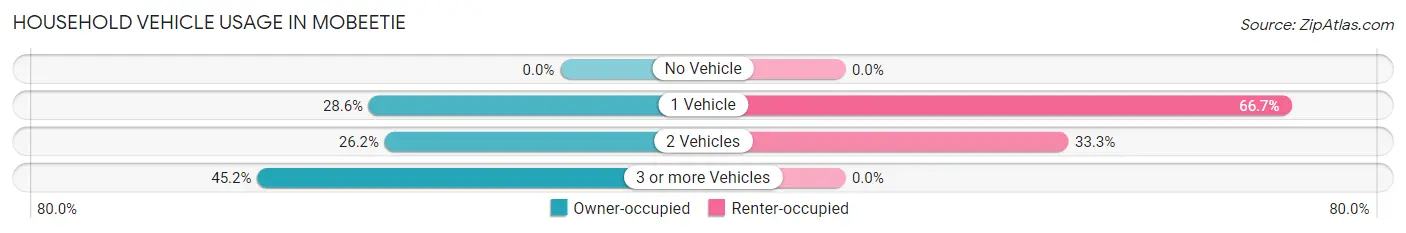
| Vehicles per Household | Owner-occupied | Renter-occupied |
| No Vehicle | 0 (0.0%) | 0 (0.0%) |
| 1 Vehicle | 12 (28.6%) | 2 (66.7%) |
| 2 Vehicles | 11 (26.2%) | 1 (33.3%) |
| 3 or more Vehicles | 19 (45.2%) | 0 (0.0%) |
| Total | 42 (100.0%) | 3 (100.0%) |
Real Estate & Mortgages in Mobeetie
Real Estate and Mortgage Overview in Mobeetie
| Characteristic | Without Mortgage | With Mortgage |
| Housing Units | 41 | 1 |
| Median Property Value | - | - |
| Median Household Income | $59,531 | $0 |
| Monthly Housing Costs | $411 | $0 |
| Real Estate Taxes | $642 | $0 |
Property Value by Mortgage Status in Mobeetie
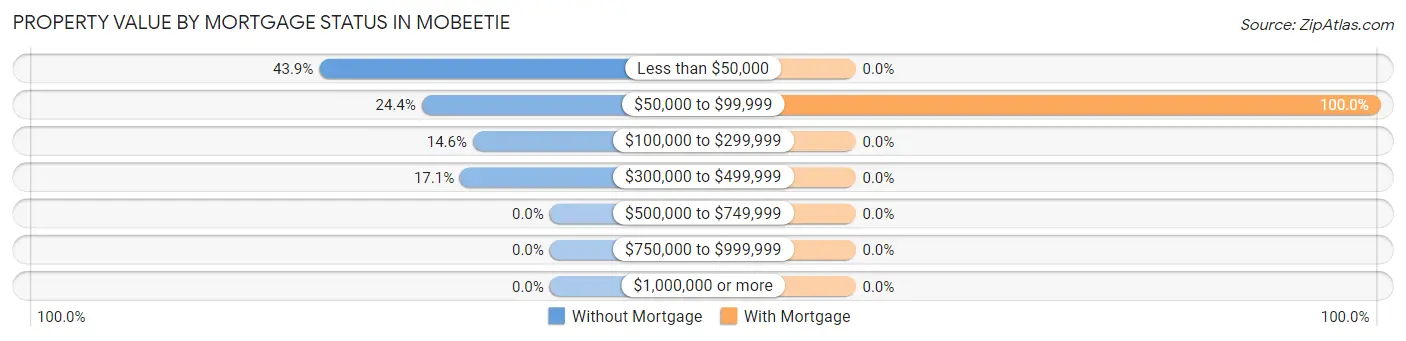
| Property Value | Without Mortgage | With Mortgage |
| Less than $50,000 | 18 (43.9%) | 0 (0.0%) |
| $50,000 to $99,999 | 10 (24.4%) | 1 (100.0%) |
| $100,000 to $299,999 | 6 (14.6%) | 0 (0.0%) |
| $300,000 to $499,999 | 7 (17.1%) | 0 (0.0%) |
| $500,000 to $749,999 | 0 (0.0%) | 0 (0.0%) |
| $750,000 to $999,999 | 0 (0.0%) | 0 (0.0%) |
| $1,000,000 or more | 0 (0.0%) | 0 (0.0%) |
| Total | 41 (100.0%) | 1 (100.0%) |
Household Income by Mortgage Status in Mobeetie
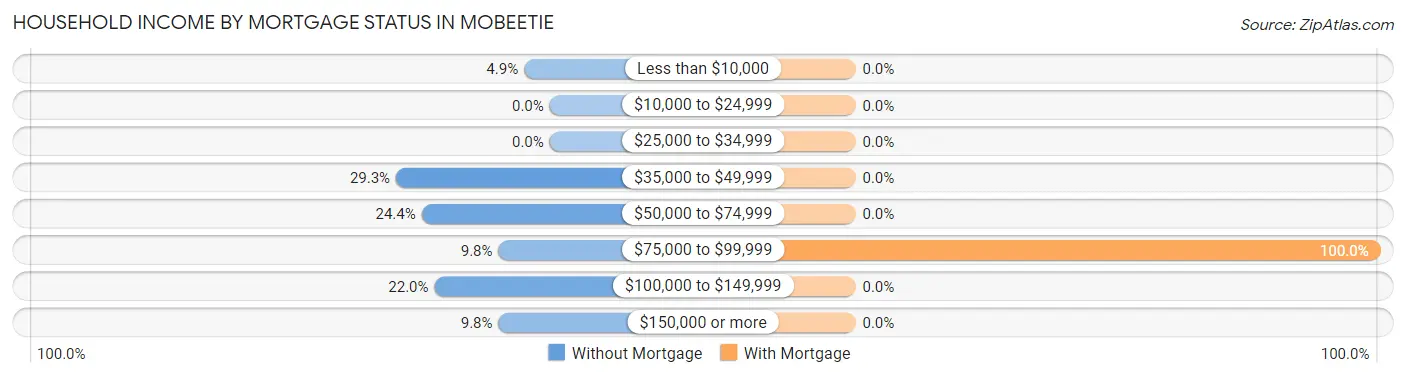
| Household Income | Without Mortgage | With Mortgage |
| Less than $10,000 | 2 (4.9%) | 0 (0.0%) |
| $10,000 to $24,999 | 0 (0.0%) | 0 (0.0%) |
| $25,000 to $34,999 | 0 (0.0%) | 0 (0.0%) |
| $35,000 to $49,999 | 12 (29.3%) | 0 (0.0%) |
| $50,000 to $74,999 | 10 (24.4%) | 0 (0.0%) |
| $75,000 to $99,999 | 4 (9.8%) | 1 (100.0%) |
| $100,000 to $149,999 | 9 (22.0%) | 0 (0.0%) |
| $150,000 or more | 4 (9.8%) | 0 (0.0%) |
| Total | 41 (100.0%) | 1 (100.0%) |
Property Value to Household Income Ratio in Mobeetie
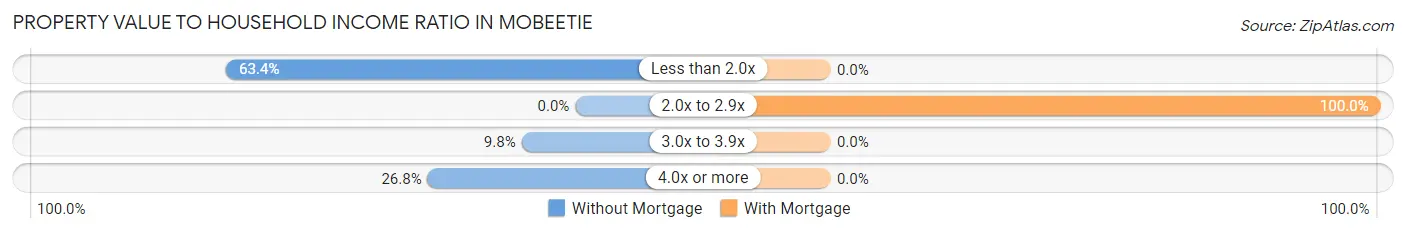
| Value-to-Income Ratio | Without Mortgage | With Mortgage |
| Less than 2.0x | 26 (63.4%) | 0 (0.0%) |
| 2.0x to 2.9x | 0 (0.0%) | 1 (100.0%) |
| 3.0x to 3.9x | 4 (9.8%) | 0 (0.0%) |
| 4.0x or more | 11 (26.8%) | 0 (0.0%) |
| Total | 41 (100.0%) | 1 (100.0%) |
Real Estate Taxes by Mortgage Status in Mobeetie
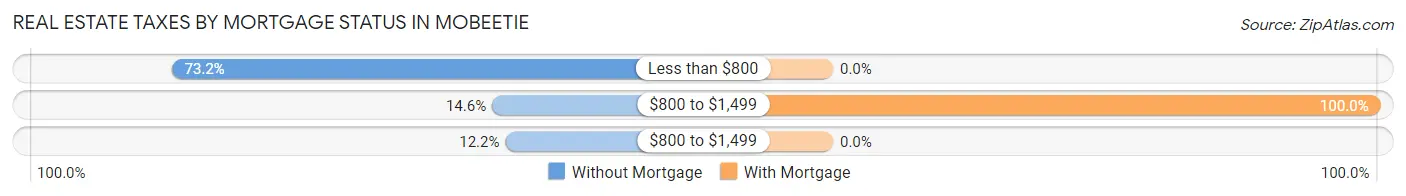
| Property Taxes | Without Mortgage | With Mortgage |
| Less than $800 | 30 (73.2%) | 0 (0.0%) |
| $800 to $1,499 | 6 (14.6%) | 1 (100.0%) |
| $800 to $1,499 | 5 (12.2%) | 0 (0.0%) |
| Total | 41 (100.0%) | 1 (100.0%) |
Health & Disability in Mobeetie
Health Insurance Coverage by Age in Mobeetie
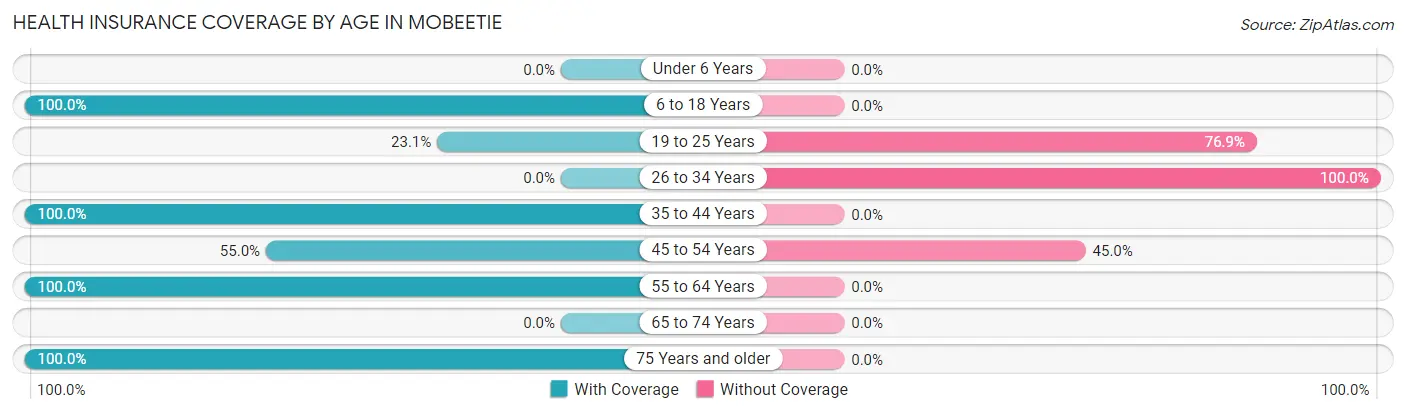
| Age Bracket | With Coverage | Without Coverage |
| Under 6 Years | 0 (0.0%) | 0 (0.0%) |
| 6 to 18 Years | 11 (100.0%) | 0 (0.0%) |
| 19 to 25 Years | 3 (23.1%) | 10 (76.9%) |
| 26 to 34 Years | 0 (0.0%) | 1 (100.0%) |
| 35 to 44 Years | 14 (100.0%) | 0 (0.0%) |
| 45 to 54 Years | 11 (55.0%) | 9 (45.0%) |
| 55 to 64 Years | 26 (100.0%) | 0 (0.0%) |
| 65 to 74 Years | 0 (0.0%) | 0 (0.0%) |
| 75 Years and older | 20 (100.0%) | 0 (0.0%) |
| Total | 85 (80.9%) | 20 (19.1%) |
Health Insurance Coverage by Citizenship Status in Mobeetie
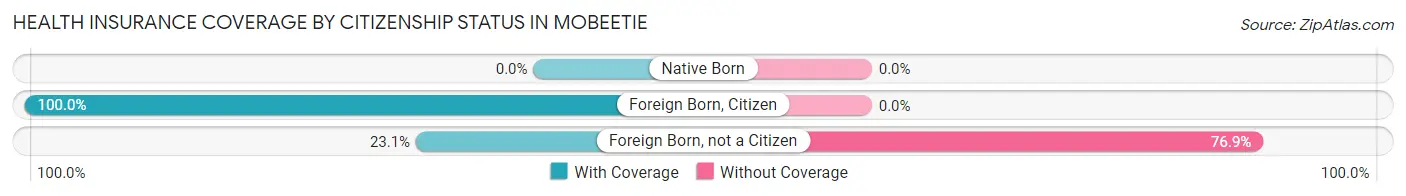
| Citizenship Status | With Coverage | Without Coverage |
| Native Born | 0 (0.0%) | 0 (0.0%) |
| Foreign Born, Citizen | 11 (100.0%) | 0 (0.0%) |
| Foreign Born, not a Citizen | 3 (23.1%) | 10 (76.9%) |
Health Insurance Coverage by Household Income in Mobeetie
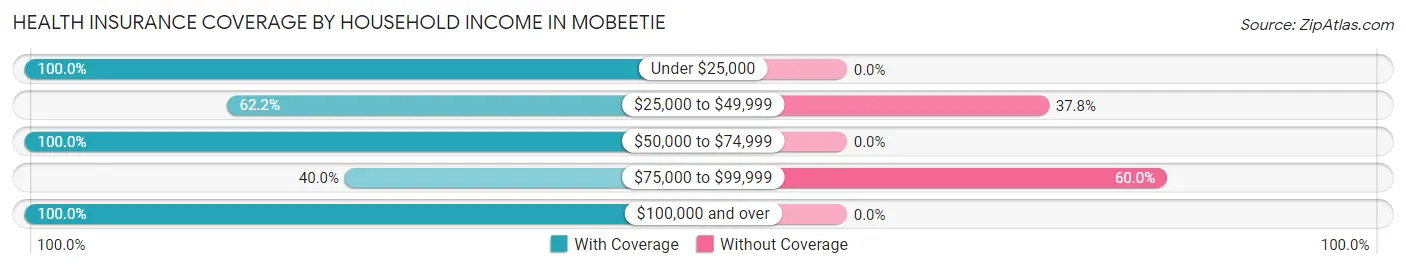
| Household Income | With Coverage | Without Coverage |
| Under $25,000 | 4 (100.0%) | 0 (0.0%) |
| $25,000 to $49,999 | 23 (62.2%) | 14 (37.8%) |
| $50,000 to $74,999 | 29 (100.0%) | 0 (0.0%) |
| $75,000 to $99,999 | 4 (40.0%) | 6 (60.0%) |
| $100,000 and over | 25 (100.0%) | 0 (0.0%) |
Public vs Private Health Insurance Coverage by Age in Mobeetie
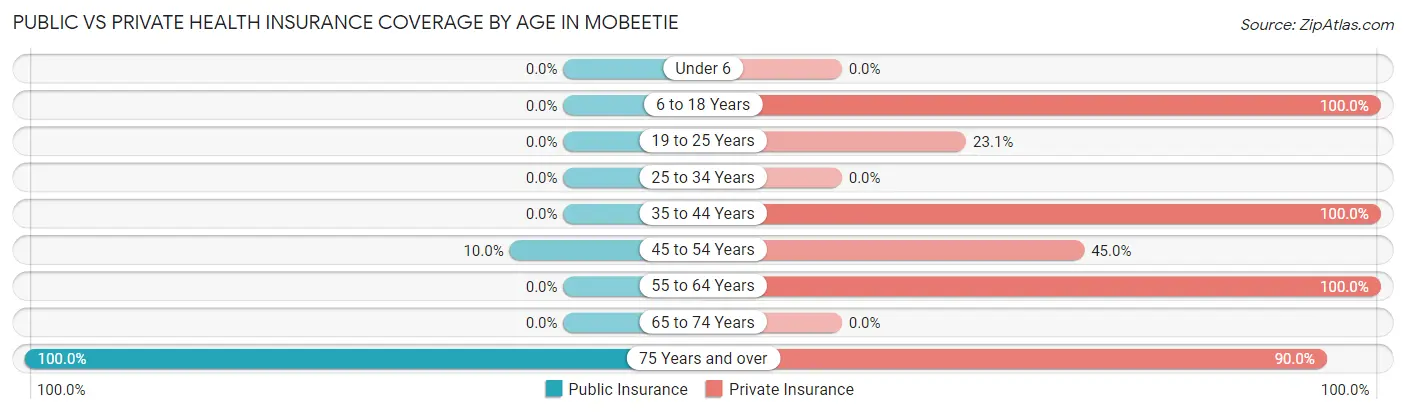
| Age Bracket | Public Insurance | Private Insurance |
| Under 6 | 0 (0.0%) | 0 (0.0%) |
| 6 to 18 Years | 0 (0.0%) | 11 (100.0%) |
| 19 to 25 Years | 0 (0.0%) | 3 (23.1%) |
| 25 to 34 Years | 0 (0.0%) | 0 (0.0%) |
| 35 to 44 Years | 0 (0.0%) | 14 (100.0%) |
| 45 to 54 Years | 2 (10.0%) | 9 (45.0%) |
| 55 to 64 Years | 0 (0.0%) | 26 (100.0%) |
| 65 to 74 Years | 0 (0.0%) | 0 (0.0%) |
| 75 Years and over | 20 (100.0%) | 18 (90.0%) |
| Total | 22 (20.9%) | 81 (77.1%) |
Disability Status by Sex by Age in Mobeetie
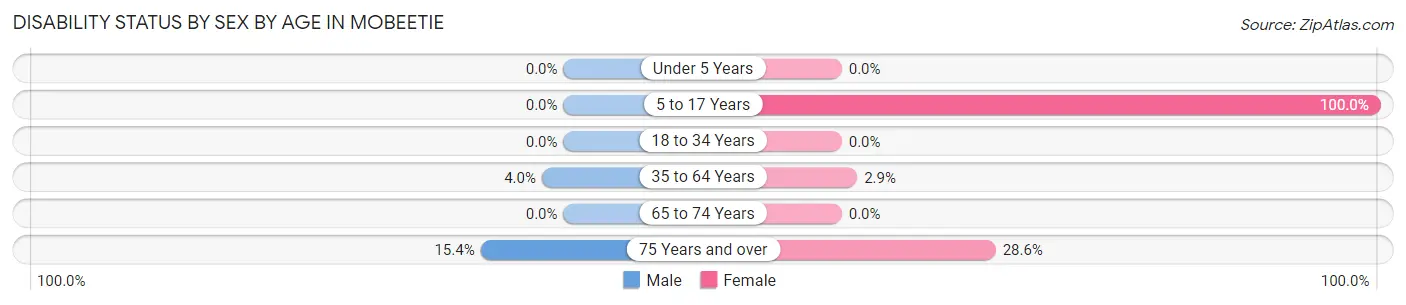
| Age Bracket | Male | Female |
| Under 5 Years | 0 (0.0%) | 0 (0.0%) |
| 5 to 17 Years | 0 (0.0%) | 1 (100.0%) |
| 18 to 34 Years | 0 (0.0%) | 0 (0.0%) |
| 35 to 64 Years | 1 (4.0%) | 1 (2.9%) |
| 65 to 74 Years | 0 (0.0%) | 0 (0.0%) |
| 75 Years and over | 2 (15.4%) | 2 (28.6%) |
Disability Class by Sex by Age in Mobeetie
Disability Class: Hearing Difficulty
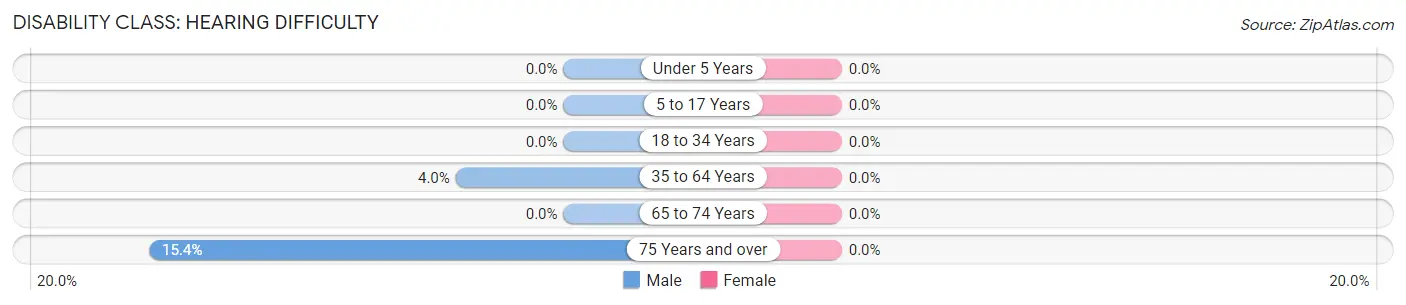
| Age Bracket | Male | Female |
| Under 5 Years | 0 (0.0%) | 0 (0.0%) |
| 5 to 17 Years | 0 (0.0%) | 0 (0.0%) |
| 18 to 34 Years | 0 (0.0%) | 0 (0.0%) |
| 35 to 64 Years | 1 (4.0%) | 0 (0.0%) |
| 65 to 74 Years | 0 (0.0%) | 0 (0.0%) |
| 75 Years and over | 2 (15.4%) | 0 (0.0%) |
Disability Class: Vision Difficulty
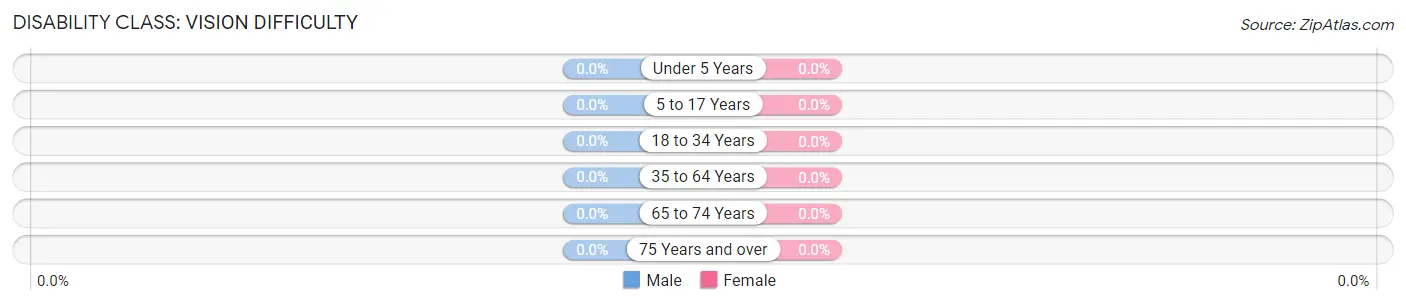
| Age Bracket | Male | Female |
| Under 5 Years | 0 (0.0%) | 0 (0.0%) |
| 5 to 17 Years | 0 (0.0%) | 0 (0.0%) |
| 18 to 34 Years | 0 (0.0%) | 0 (0.0%) |
| 35 to 64 Years | 0 (0.0%) | 0 (0.0%) |
| 65 to 74 Years | 0 (0.0%) | 0 (0.0%) |
| 75 Years and over | 0 (0.0%) | 0 (0.0%) |
Disability Class: Cognitive Difficulty
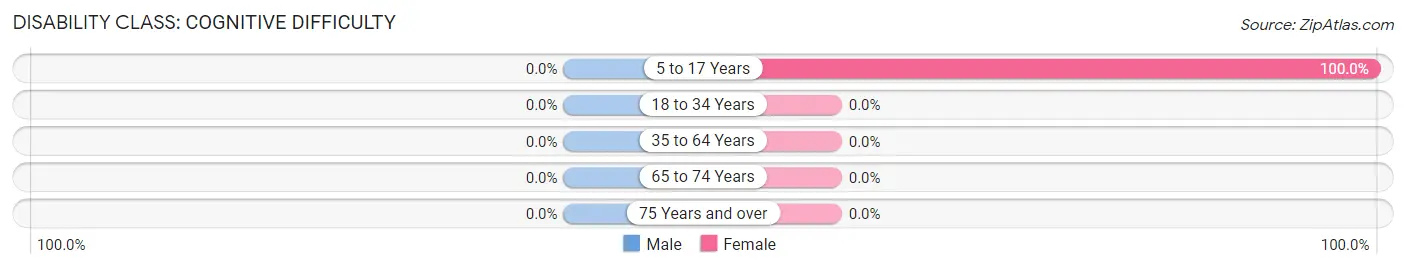
| Age Bracket | Male | Female |
| 5 to 17 Years | 0 (0.0%) | 1 (100.0%) |
| 18 to 34 Years | 0 (0.0%) | 0 (0.0%) |
| 35 to 64 Years | 0 (0.0%) | 0 (0.0%) |
| 65 to 74 Years | 0 (0.0%) | 0 (0.0%) |
| 75 Years and over | 0 (0.0%) | 0 (0.0%) |
Disability Class: Ambulatory Difficulty
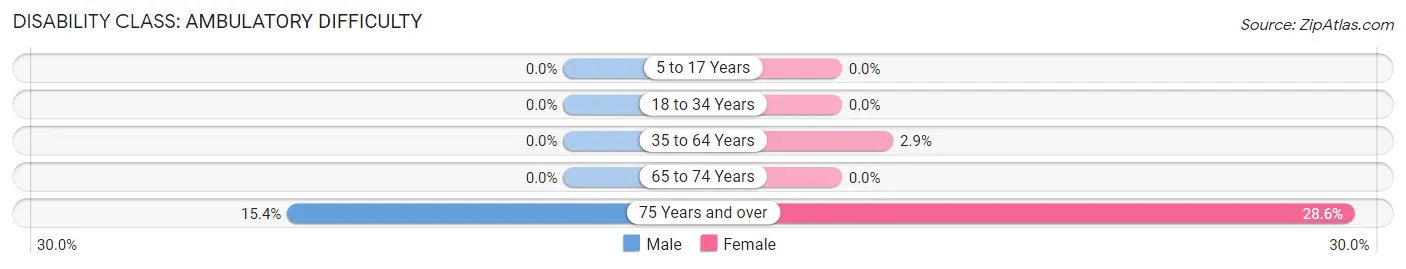
| Age Bracket | Male | Female |
| 5 to 17 Years | 0 (0.0%) | 0 (0.0%) |
| 18 to 34 Years | 0 (0.0%) | 0 (0.0%) |
| 35 to 64 Years | 0 (0.0%) | 1 (2.9%) |
| 65 to 74 Years | 0 (0.0%) | 0 (0.0%) |
| 75 Years and over | 2 (15.4%) | 2 (28.6%) |
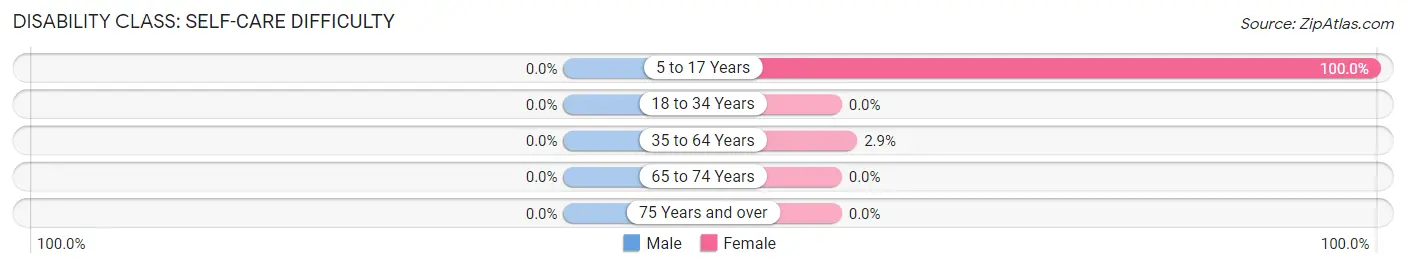
Disability Class: Self-Care Difficulty
| Age Bracket | Male | Female |
| 5 to 17 Years | 0 (0.0%) | 1 (100.0%) |
| 18 to 34 Years | 0 (0.0%) | 0 (0.0%) |
| 35 to 64 Years | 0 (0.0%) | 1 (2.9%) |
| 65 to 74 Years | 0 (0.0%) | 0 (0.0%) |
| 75 Years and over | 0 (0.0%) | 0 (0.0%) |
Technology Access in Mobeetie
Computing Device Access in Mobeetie
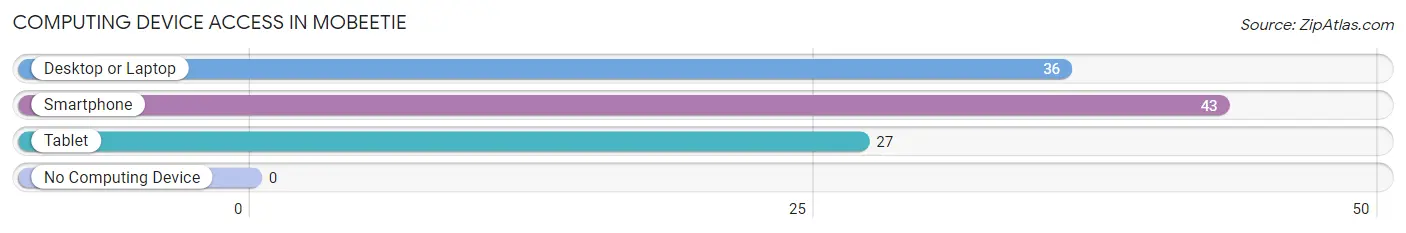
| Device Type | # Households | % Households |
| Desktop or Laptop | 36 | 80.0% |
| Smartphone | 43 | 95.6% |
| Tablet | 27 | 60.0% |
| No Computing Device | 0 | 0.0% |
| Total | 45 | 100.0% |
Internet Access in Mobeetie
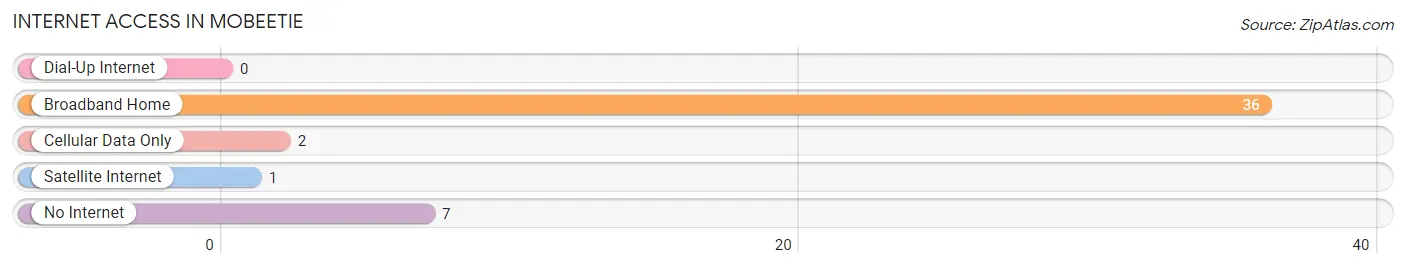
| Internet Type | # Households | % Households |
| Dial-Up Internet | 0 | 0.0% |
| Broadband Home | 36 | 80.0% |
| Cellular Data Only | 2 | 4.4% |
| Satellite Internet | 1 | 2.2% |
| No Internet | 7 | 15.6% |
| Total | 45 | 100.0% |
Mobeetie Summary
Mobeetie, Texas is a small town located in the Panhandle region of the state. It is situated in Wheeler County, approximately 25 miles northwest of the city of Canadian. The town was founded in 1878 and is the oldest settlement in the county. It is also the county seat.
History
Mobeetie was founded in 1878 by a group of settlers from the nearby town of Canadian. The town was named after a Comanche chief, Mobeetie, who had been killed in a battle with the U.S. Army in 1874. The town was originally a trading post and a stop on the Texas Trail, which was a major cattle trail in the late 19th century.
In 1882, the Texas and Pacific Railway arrived in Mobeetie, and the town quickly grew. By the early 1900s, Mobeetie had become a bustling town with a population of over 1,000 people. The town had several stores, a hotel, a bank, a newspaper, and a school.
In the early 20th century, Mobeetie was a popular stop for cowboys and cattle drives. The town was also known for its saloons and gambling halls. In the 1920s, the town was the site of a major oil boom, which brought in a large number of new residents.
Geography
Mobeetie is located in the Panhandle region of Texas, in Wheeler County. The town is situated on the Canadian River, approximately 25 miles northwest of the city of Canadian. The town is located at an elevation of 2,400 feet above sea level.
The climate in Mobeetie is semi-arid, with hot summers and mild winters. The average annual temperature is 64 degrees Fahrenheit. The average annual precipitation is 17.5 inches.
Economy
The economy of Mobeetie is largely based on agriculture and ranching. The town is home to several large ranches, including the Mobeetie Ranch, which is one of the largest in the state.
The town also has a small manufacturing sector, which produces a variety of products, including furniture, clothing, and leather goods.
Demographics
As of the 2010 census, the population of Mobeetie was 845. The racial makeup of the town was 94.3% White, 0.2% African American, 0.2% Native American, 0.2% Asian, 0.2% Pacific Islander, 3.2% from other races, and 1.9% from two or more races. Hispanic or Latino of any race were 6.2% of the population.
The median household income in Mobeetie was $31,250, and the median family income was $37,500. The per capita income was $17,857. About 15.2% of the population was below the poverty line.
Mobeetie is served by the Mobeetie Independent School District. The town is also home to the Mobeetie Museum, which is dedicated to the history of the town and the surrounding area.
Common Questions
What is Per Capita Income in Mobeetie?
Per Capita income in Mobeetie is $34,024.
What is the Median Family Income in Mobeetie?
Median Family Income in Mobeetie is $81,250.
What is the Median Household income in Mobeetie?
Median Household Income in Mobeetie is $58,906.
What is Inequality or Gini Index in Mobeetie?
Inequality or Gini Index in Mobeetie is 0.31.
What is the Total Population of Mobeetie?
Total Population of Mobeetie is 105.
What is the Total Male Population of Mobeetie?
Total Male Population of Mobeetie is 59.
What is the Total Female Population of Mobeetie?
Total Female Population of Mobeetie is 46.
What is the Ratio of Males per 100 Females in Mobeetie?
There are 128.26 Males per 100 Females in Mobeetie.
What is the Ratio of Females per 100 Males in Mobeetie?
There are 77.97 Females per 100 Males in Mobeetie.
What is the Median Population Age in Mobeetie?
Median Population Age in Mobeetie is 53.2 Years.
What is the Average Family Size in Mobeetie
Average Family Size in Mobeetie is 2.6 People.
What is the Average Household Size in Mobeetie
Average Household Size in Mobeetie is 2.3 People.
How Large is the Labor Force in Mobeetie?
There are 69 People in the Labor Forcein in Mobeetie.
What is the Percentage of People in the Labor Force in Mobeetie?
73.4% of People are in the Labor Force in Mobeetie.
What is the Unemployment Rate in Mobeetie?
Unemployment Rate in Mobeetie is 15.9%.