Mineola, TX Map & Demographics
Mineola Map
Mineola Overview
$36,240
PER CAPITA INCOME
$71,541
AVG FAMILY INCOME
$42,147
AVG HOUSEHOLD INCOME
41.1%
WAGE / INCOME GAP [ % ]
58.9¢/ $1
WAGE / INCOME GAP [ $ ]
$7,659
FAMILY INCOME DEFICIT
0.61
INEQUALITY / GINI INDEX
4,879
TOTAL POPULATION
2,345
MALE POPULATION
2,534
FEMALE POPULATION
92.54
MALES / 100 FEMALES
108.06
FEMALES / 100 MALES
43.3
MEDIAN AGE
3.5
AVG FAMILY SIZE
2.3
AVG HOUSEHOLD SIZE
2,031
LABOR FORCE [ PEOPLE ]
52.4%
PERCENT IN LABOR FORCE
5.7%
UNEMPLOYMENT RATE
Mineola Zip Codes
Income in Mineola
Income Overview in Mineola
Per Capita Income in Mineola is $36,240, while median incomes of families and households are $71,541 and $42,147 respectively.
| Characteristic | Number | Measure |
| Per Capita Income | 4,879 | $36,240 |
| Median Family Income | 999 | $71,541 |
| Mean Family Income | 999 | $107,963 |
| Median Household Income | 2,068 | $42,147 |
| Mean Household Income | 2,068 | $80,615 |
| Income Deficit | 999 | $7,659 |
| Wage / Income Gap (%) | 4,879 | 41.11% |
| Wage / Income Gap ($) | 4,879 | 58.89¢ per $1 |
| Gini / Inequality Index | 4,879 | 0.61 |
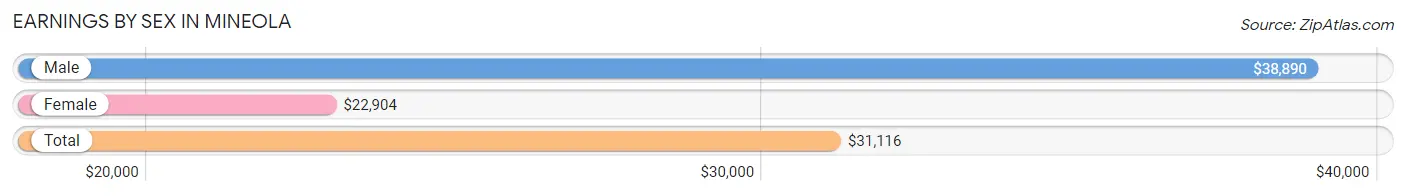
Earnings by Sex in Mineola
Average Earnings in Mineola are $31,116, $38,890 for men and $22,904 for women, a difference of 41.1%.
| Sex | Number | Average Earnings |
| Male | 1,071 (48.9%) | $38,890 |
| Female | 1,121 (51.1%) | $22,904 |
| Total | 2,192 (100.0%) | $31,116 |
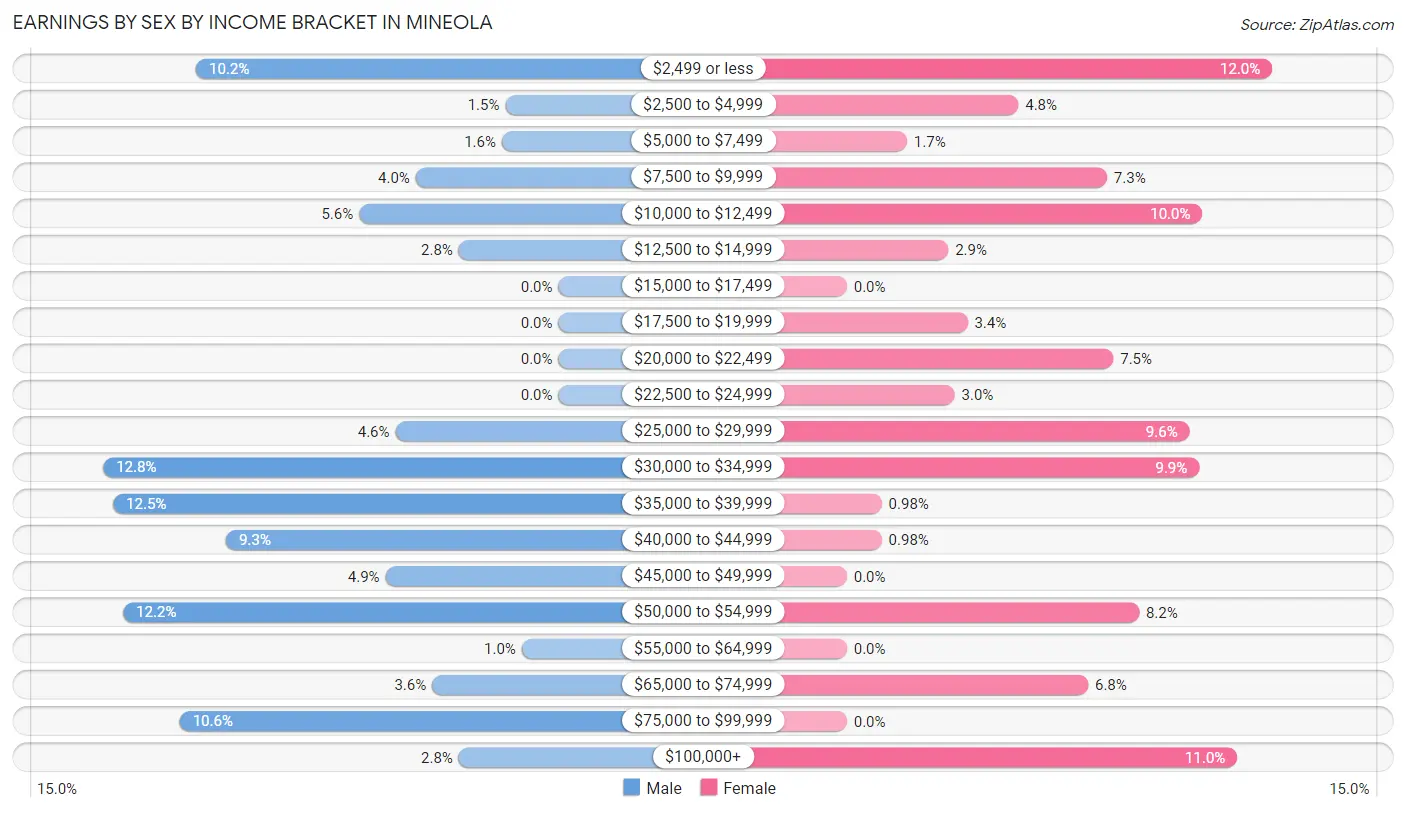
Earnings by Sex by Income Bracket in Mineola
The most common earnings brackets in Mineola are $30,000 to $34,999 for men (137 | 12.8%) and $2,499 or less for women (134 | 11.9%).
| Income | Male | Female |
| $2,499 or less | 109 (10.2%) | 134 (11.9%) |
| $2,500 to $4,999 | 16 (1.5%) | 54 (4.8%) |
| $5,000 to $7,499 | 17 (1.6%) | 19 (1.7%) |
| $7,500 to $9,999 | 43 (4.0%) | 82 (7.3%) |
| $10,000 to $12,499 | 60 (5.6%) | 112 (10.0%) |
| $12,500 to $14,999 | 30 (2.8%) | 32 (2.9%) |
| $15,000 to $17,499 | 0 (0.0%) | 0 (0.0%) |
| $17,500 to $19,999 | 0 (0.0%) | 38 (3.4%) |
| $20,000 to $22,499 | 0 (0.0%) | 84 (7.5%) |
| $22,500 to $24,999 | 0 (0.0%) | 34 (3.0%) |
| $25,000 to $29,999 | 49 (4.6%) | 108 (9.6%) |
| $30,000 to $34,999 | 137 (12.8%) | 111 (9.9%) |
| $35,000 to $39,999 | 134 (12.5%) | 11 (1.0%) |
| $40,000 to $44,999 | 100 (9.3%) | 11 (1.0%) |
| $45,000 to $49,999 | 52 (4.9%) | 0 (0.0%) |
| $50,000 to $54,999 | 131 (12.2%) | 92 (8.2%) |
| $55,000 to $64,999 | 11 (1.0%) | 0 (0.0%) |
| $65,000 to $74,999 | 38 (3.5%) | 76 (6.8%) |
| $75,000 to $99,999 | 114 (10.6%) | 0 (0.0%) |
| $100,000+ | 30 (2.8%) | 123 (11.0%) |
| Total | 1,071 (100.0%) | 1,121 (100.0%) |
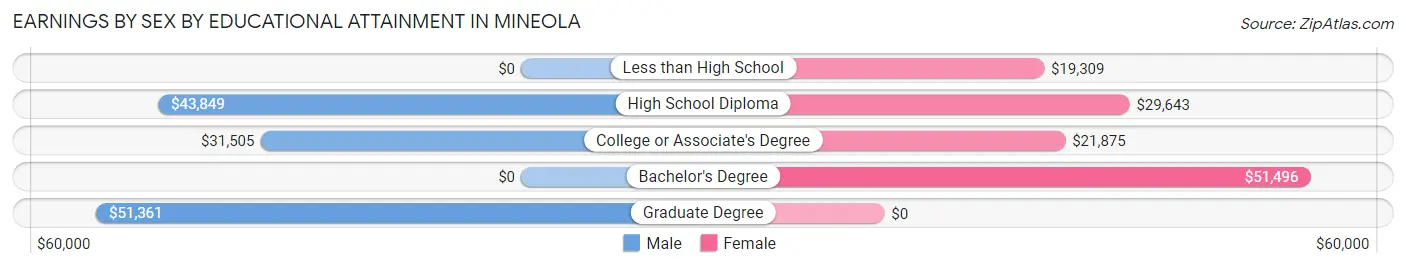
Earnings by Sex by Educational Attainment in Mineola
Average earnings in Mineola are $45,721 for men and $27,623 for women, a difference of 39.6%. Men with an educational attainment of graduate degree enjoy the highest average annual earnings of $51,361, while those with college or associate's degree education earn the least with $31,505. Women with an educational attainment of bachelor's degree earn the most with the average annual earnings of $51,496, while those with less than high school education have the smallest earnings of $19,309.
| Educational Attainment | Male Income | Female Income |
| Less than High School | - | - |
| High School Diploma | $43,849 | $29,643 |
| College or Associate's Degree | $31,505 | $21,875 |
| Bachelor's Degree | - | - |
| Graduate Degree | $51,361 | $0 |
| Total | $45,721 | $27,623 |
Family Income in Mineola
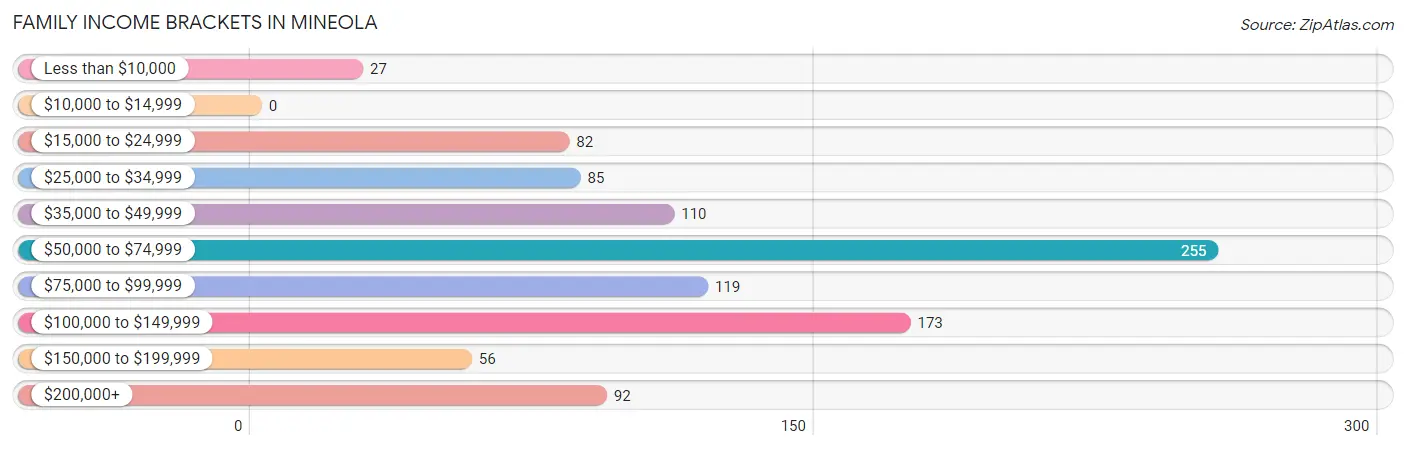
Family Income Brackets in Mineola
According to the Mineola family income data, there are 255 families falling into the $50,000 to $74,999 income range, which is the most common income bracket and makes up 25.5% of all families.
| Income Bracket | # Families | % Families |
| Less than $10,000 | 27 | 2.7% |
| $10,000 to $14,999 | 0 | 0.0% |
| $15,000 to $24,999 | 82 | 8.2% |
| $25,000 to $34,999 | 85 | 8.5% |
| $35,000 to $49,999 | 110 | 11.0% |
| $50,000 to $74,999 | 255 | 25.5% |
| $75,000 to $99,999 | 119 | 11.9% |
| $100,000 to $149,999 | 173 | 17.3% |
| $150,000 to $199,999 | 56 | 5.6% |
| $200,000+ | 92 | 9.2% |
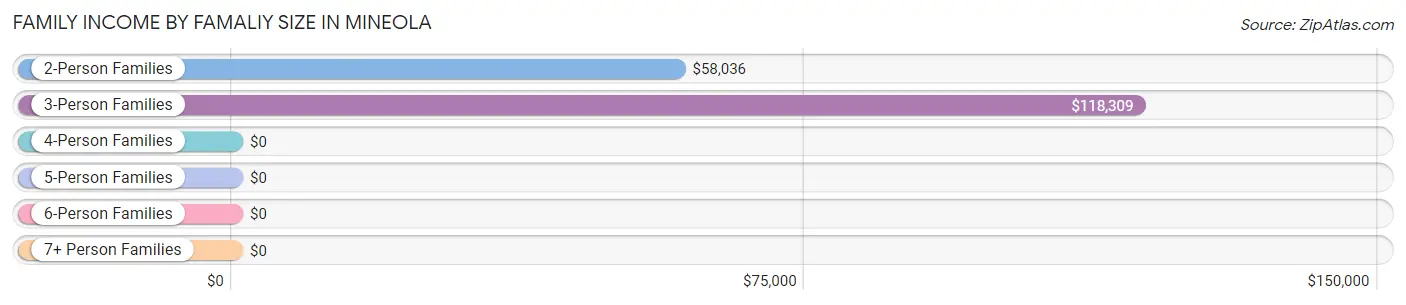
Family Income by Famaliy Size in Mineola
3-person families (147 | 14.7%) account for the highest median family income in Mineola with $118,309 per family, while 3-person families (147 | 14.7%) have the highest median income of $39,436 per family member.
| Income Bracket | # Families | Median Income |
| 2-Person Families | 418 (41.8%) | $58,036 |
| 3-Person Families | 147 (14.7%) | $118,309 |
| 4-Person Families | 235 (23.5%) | $0 |
| 5-Person Families | 85 (8.5%) | $0 |
| 6-Person Families | 86 (8.6%) | $0 |
| 7+ Person Families | 28 (2.8%) | $0 |
| Total | 999 (100.0%) | $71,541 |
Family Income by Number of Earners in Mineola
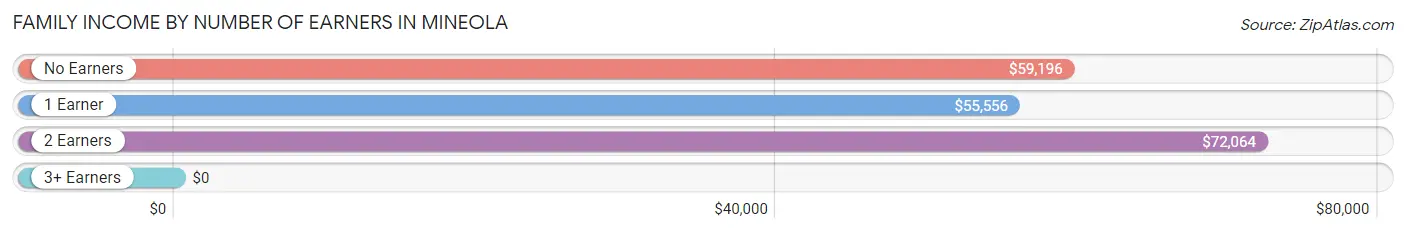
| Number of Earners | # Families | Median Income |
| No Earners | 183 (18.3%) | $59,196 |
| 1 Earner | 196 (19.6%) | $55,556 |
| 2 Earners | 433 (43.3%) | $72,064 |
| 3+ Earners | 187 (18.7%) | $0 |
| Total | 999 (100.0%) | $71,541 |
Household Income in Mineola
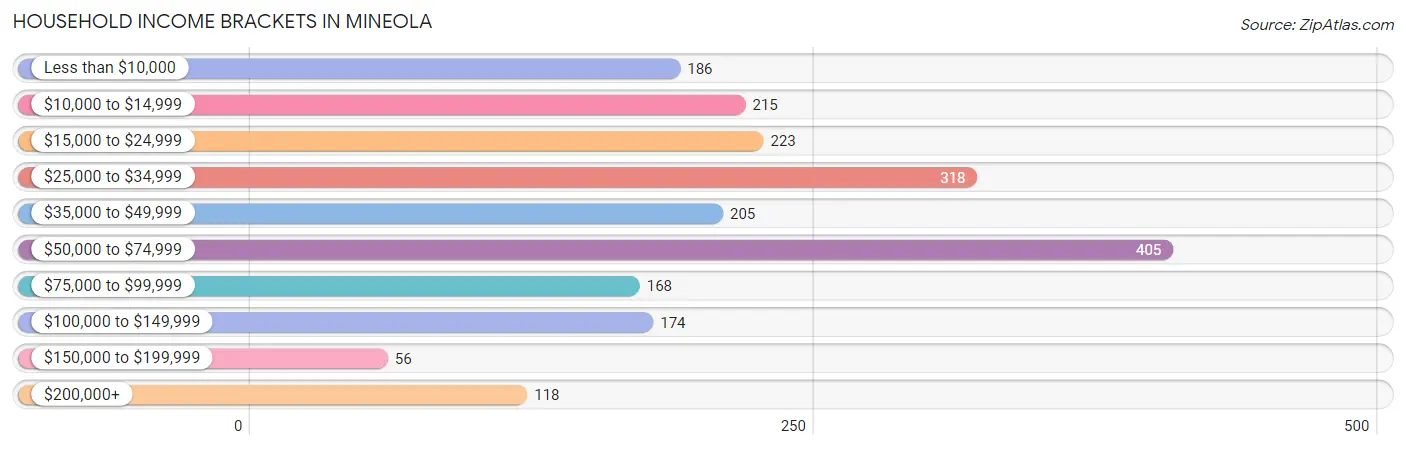
Household Income Brackets in Mineola
With 405 households falling in the category, the $50,000 to $74,999 income range is the most frequent in Mineola, accounting for 19.6% of all households. In contrast, only 56 households (2.7%) fall into the $150,000 to $199,999 income bracket, making it the least populous group.
| Income Bracket | # Households | % Households |
| Less than $10,000 | 186 | 9.0% |
| $10,000 to $14,999 | 215 | 10.4% |
| $15,000 to $24,999 | 223 | 10.8% |
| $25,000 to $34,999 | 318 | 15.4% |
| $35,000 to $49,999 | 205 | 9.9% |
| $50,000 to $74,999 | 405 | 19.6% |
| $75,000 to $99,999 | 168 | 8.1% |
| $100,000 to $149,999 | 174 | 8.4% |
| $150,000 to $199,999 | 56 | 2.7% |
| $200,000+ | 118 | 5.7% |
Household Income by Householder Age in Mineola
The median household income in Mineola is $42,147, with the highest median household income of $73,708 found in the 25 to 44 years age bracket for the primary householder. A total of 463 households (22.4%) fall into this category. Meanwhile, the 15 to 24 years age bracket for the primary householder has the lowest median household income of $0, with 93 households (4.5%) in this group.
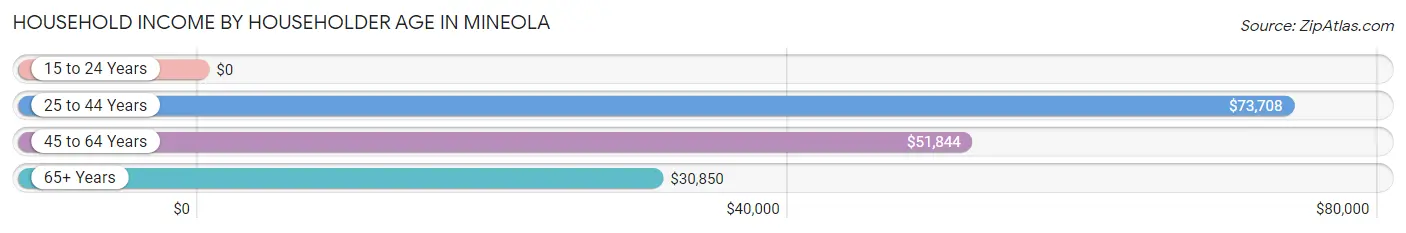
| Income Bracket | # Households | Median Income |
| 15 to 24 Years | 93 (4.5%) | $0 |
| 25 to 44 Years | 463 (22.4%) | $73,708 |
| 45 to 64 Years | 520 (25.2%) | $51,844 |
| 65+ Years | 992 (48.0%) | $30,850 |
| Total | 2,068 (100.0%) | $42,147 |
Poverty in Mineola
Income Below Poverty by Sex and Age in Mineola
With 16.0% poverty level for males and 14.9% for females among the residents of Mineola, 15 year old males and 18 to 24 year old females are the most vulnerable to poverty, with 24 males (100.0%) and 49 females (29.0%) in their respective age groups living below the poverty level.
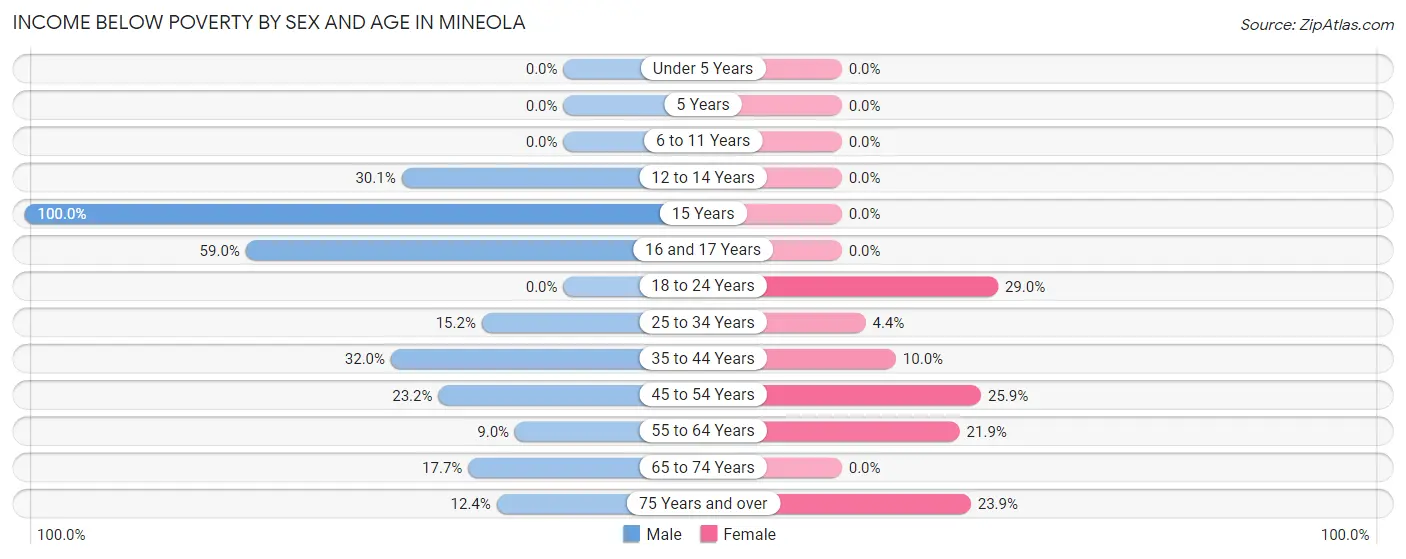
| Age Bracket | Male | Female |
| Under 5 Years | 0 (0.0%) | 0 (0.0%) |
| 5 Years | 0 (0.0%) | 0 (0.0%) |
| 6 to 11 Years | 0 (0.0%) | 0 (0.0%) |
| 12 to 14 Years | 64 (30.0%) | 0 (0.0%) |
| 15 Years | 24 (100.0%) | 0 (0.0%) |
| 16 and 17 Years | 23 (59.0%) | 0 (0.0%) |
| 18 to 24 Years | 0 (0.0%) | 49 (29.0%) |
| 25 to 34 Years | 20 (15.1%) | 10 (4.4%) |
| 35 to 44 Years | 81 (32.0%) | 28 (10.0%) |
| 45 to 54 Years | 52 (23.2%) | 76 (25.9%) |
| 55 to 64 Years | 23 (9.0%) | 63 (21.9%) |
| 65 to 74 Years | 41 (17.7%) | 0 (0.0%) |
| 75 Years and over | 27 (12.4%) | 136 (23.9%) |
| Total | 355 (16.0%) | 362 (14.9%) |
Income Above Poverty by Sex and Age in Mineola
According to the poverty statistics in Mineola, males aged under 5 years and females aged 5 years are the age groups that are most secure financially, with 100.0% of males and 100.0% of females in these age groups living above the poverty line.
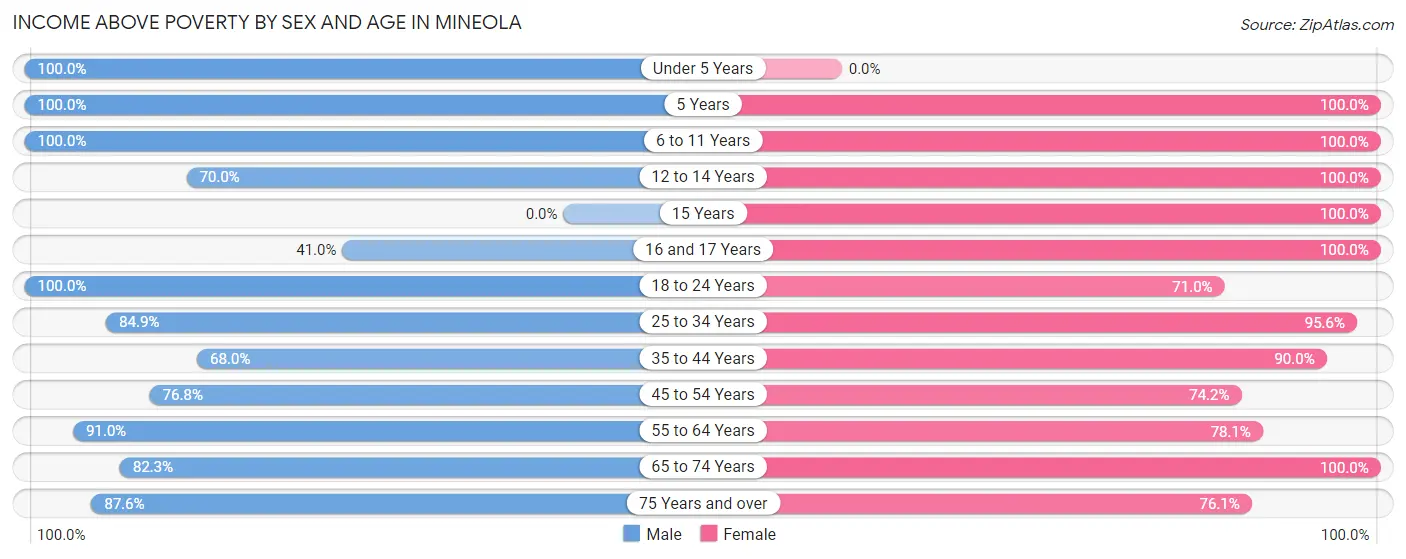
| Age Bracket | Male | Female |
| Under 5 Years | 18 (100.0%) | 0 (0.0%) |
| 5 Years | 69 (100.0%) | 15 (100.0%) |
| 6 to 11 Years | 198 (100.0%) | 206 (100.0%) |
| 12 to 14 Years | 149 (70.0%) | 132 (100.0%) |
| 15 Years | 0 (0.0%) | 49 (100.0%) |
| 16 and 17 Years | 16 (41.0%) | 35 (100.0%) |
| 18 to 24 Years | 349 (100.0%) | 120 (71.0%) |
| 25 to 34 Years | 112 (84.9%) | 217 (95.6%) |
| 35 to 44 Years | 172 (68.0%) | 251 (90.0%) |
| 45 to 54 Years | 172 (76.8%) | 218 (74.2%) |
| 55 to 64 Years | 233 (91.0%) | 225 (78.1%) |
| 65 to 74 Years | 191 (82.3%) | 162 (100.0%) |
| 75 Years and over | 191 (87.6%) | 432 (76.1%) |
| Total | 1,870 (84.0%) | 2,062 (85.1%) |
Income Below Poverty Among Married-Couple Families in Mineola
The poverty statistics for married-couple families in Mineola show that 12.8% or 104 of the total 814 families live below the poverty line. Families with 1 or 2 children have the highest poverty rate of 30.9%, comprising of 77 families. On the other hand, families with 3 or 4 children have the lowest poverty rate of 0.0%, which includes 0 families.
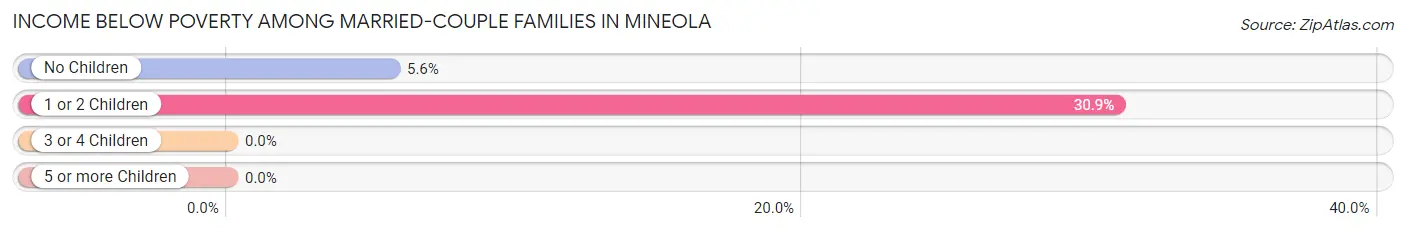
| Children | Above Poverty | Below Poverty |
| No Children | 452 (94.4%) | 27 (5.6%) |
| 1 or 2 Children | 172 (69.1%) | 77 (30.9%) |
| 3 or 4 Children | 86 (100.0%) | 0 (0.0%) |
| 5 or more Children | 0 (0.0%) | 0 (0.0%) |
| Total | 710 (87.2%) | 104 (12.8%) |
Income Below Poverty Among Single-Parent Households in Mineola
| Children | Single Father | Single Mother |
| No Children | 0 (0.0%) | 0 (0.0%) |
| 1 or 2 Children | 0 (0.0%) | 0 (0.0%) |
| 3 or 4 Children | 0 (0.0%) | 0 (0.0%) |
| 5 or more Children | 0 (0.0%) | 0 (0.0%) |
| Total | 0 (0.0%) | 0 (0.0%) |
Income Below Poverty Among Married-Couple vs Single-Parent Households in Mineola
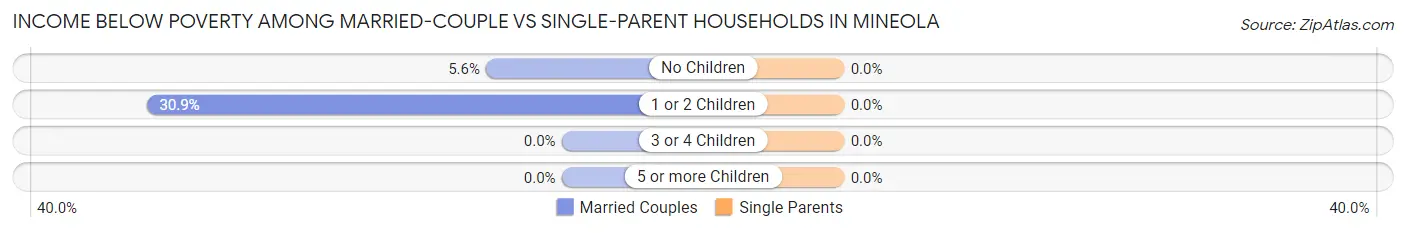
| Children | Married-Couple Families | Single-Parent Households |
| No Children | 27 (5.6%) | 0 (0.0%) |
| 1 or 2 Children | 77 (30.9%) | 0 (0.0%) |
| 3 or 4 Children | 0 (0.0%) | 0 (0.0%) |
| 5 or more Children | 0 (0.0%) | 0 (0.0%) |
| Total | 104 (12.8%) | 0 (0.0%) |
Race in Mineola
The most populous races in Mineola are White / Caucasian (3,549 | 72.7%), Hispanic or Latino (1,209 | 24.8%), and Black / African American (485 | 9.9%).
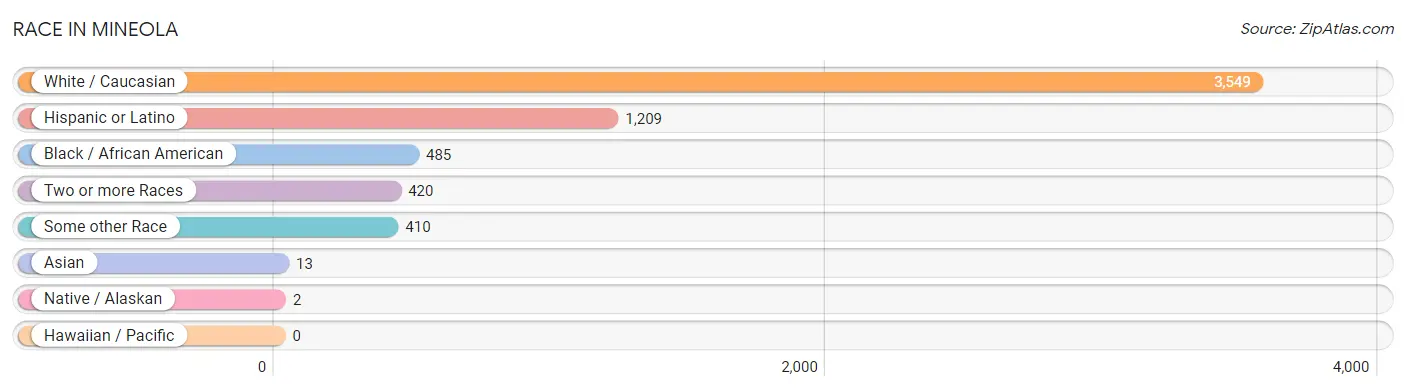
| Race | # Population | % Population |
| Asian | 13 | 0.3% |
| Black / African American | 485 | 9.9% |
| Hawaiian / Pacific | 0 | 0.0% |
| Hispanic or Latino | 1,209 | 24.8% |
| Native / Alaskan | 2 | 0.0% |
| White / Caucasian | 3,549 | 72.7% |
| Two or more Races | 420 | 8.6% |
| Some other Race | 410 | 8.4% |
| Total | 4,879 | 100.0% |
Ancestry in Mineola
The most populous ancestries reported in Mineola are Mexican (845 | 17.3%), Irish (669 | 13.7%), English (646 | 13.2%), American (436 | 8.9%), and Central American (243 | 5.0%), together accounting for 58.2% of all Mineola residents.
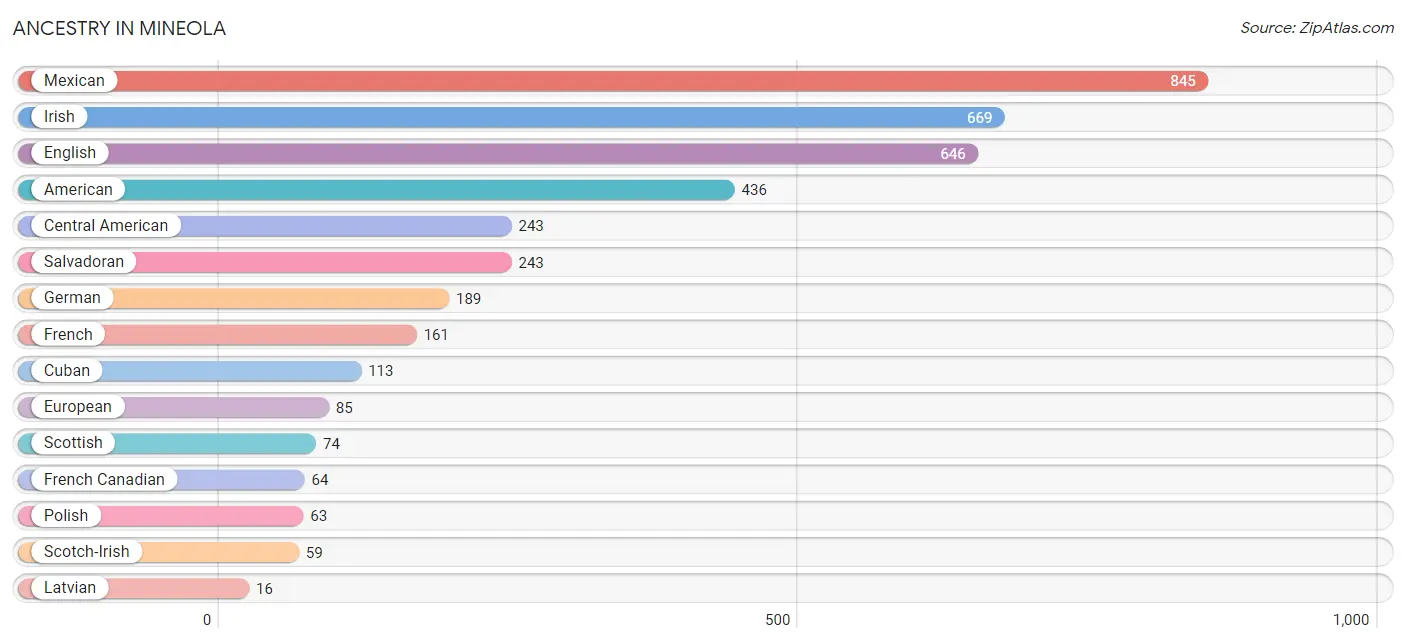
| Ancestry | # Population | % Population |
| American | 436 | 8.9% |
| Central American | 243 | 5.0% |
| Chickasaw | 6 | 0.1% |
| Choctaw | 6 | 0.1% |
| Cuban | 113 | 2.3% |
| Czech | 6 | 0.1% |
| English | 646 | 13.2% |
| European | 85 | 1.7% |
| French | 161 | 3.3% |
| French Canadian | 64 | 1.3% |
| German | 189 | 3.9% |
| Irish | 669 | 13.7% |
| Iroquois | 3 | 0.1% |
| Latvian | 16 | 0.3% |
| Mexican | 845 | 17.3% |
| Polish | 63 | 1.3% |
| Salvadoran | 243 | 5.0% |
| Scotch-Irish | 59 | 1.2% |
| Scottish | 74 | 1.5% | View All 19 Rows |
Immigrants in Mineola
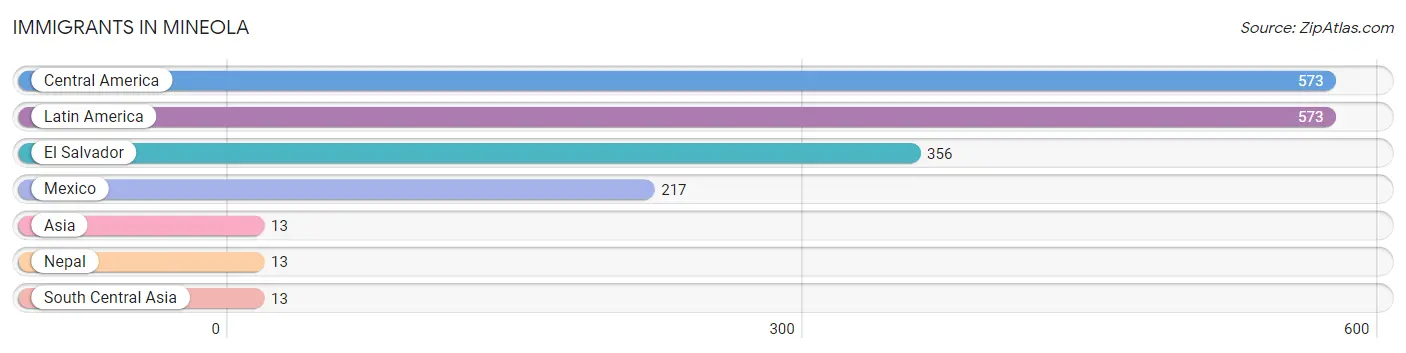
The most numerous immigrant groups reported in Mineola came from Central America (573 | 11.7%), Latin America (573 | 11.7%), El Salvador (356 | 7.3%), Mexico (217 | 4.4%), and Asia (13 | 0.3%), together accounting for 35.5% of all Mineola residents.
| Immigration Origin | # Population | % Population |
| Asia | 13 | 0.3% |
| Central America | 573 | 11.7% |
| El Salvador | 356 | 7.3% |
| Latin America | 573 | 11.7% |
| Mexico | 217 | 4.4% |
| Nepal | 13 | 0.3% |
| South Central Asia | 13 | 0.3% | View All 7 Rows |
Sex and Age in Mineola
Sex and Age in Mineola
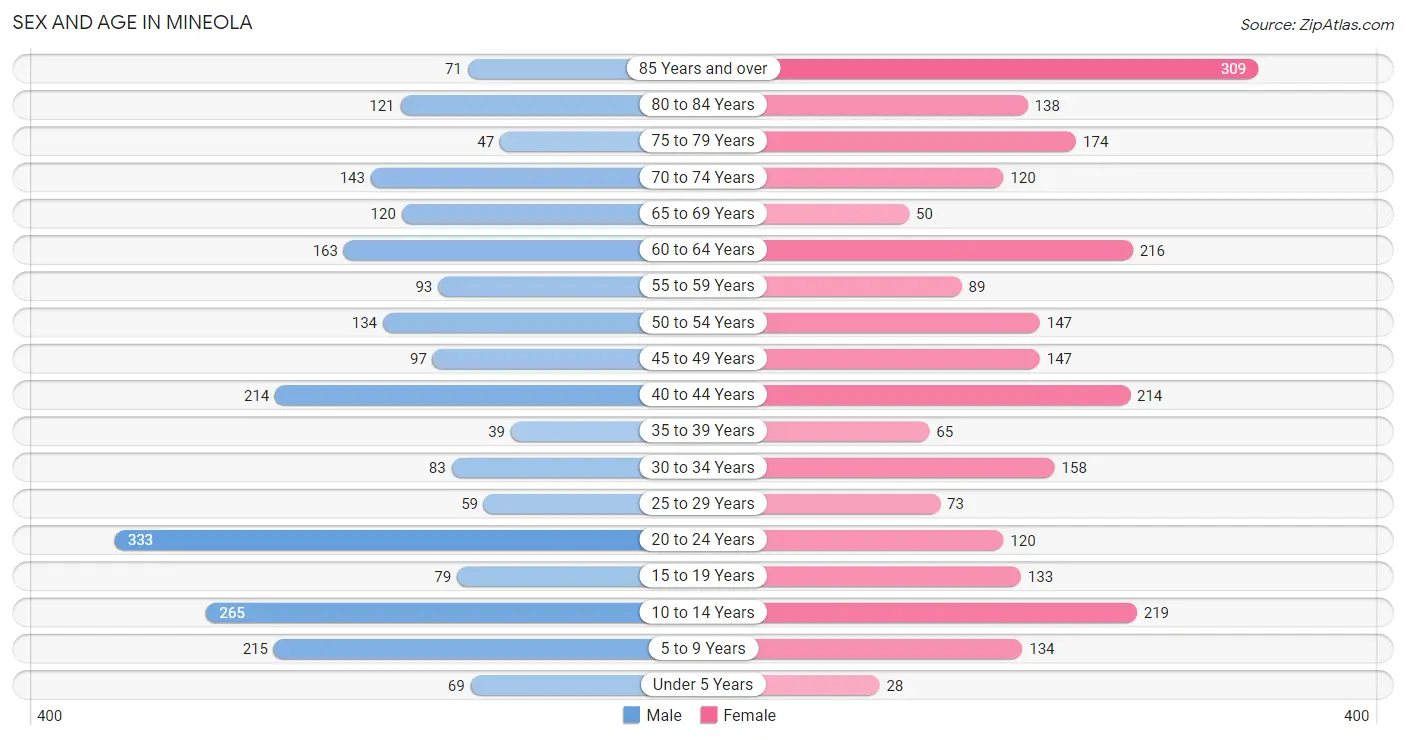
The most populous age groups in Mineola are 20 to 24 Years (333 | 14.2%) for men and 85 Years and over (309 | 12.2%) for women.
| Age Bracket | Male | Female |
| Under 5 Years | 69 (2.9%) | 28 (1.1%) |
| 5 to 9 Years | 215 (9.2%) | 134 (5.3%) |
| 10 to 14 Years | 265 (11.3%) | 219 (8.6%) |
| 15 to 19 Years | 79 (3.4%) | 133 (5.2%) |
| 20 to 24 Years | 333 (14.2%) | 120 (4.7%) |
| 25 to 29 Years | 59 (2.5%) | 73 (2.9%) |
| 30 to 34 Years | 83 (3.5%) | 158 (6.2%) |
| 35 to 39 Years | 39 (1.7%) | 65 (2.6%) |
| 40 to 44 Years | 214 (9.1%) | 214 (8.5%) |
| 45 to 49 Years | 97 (4.1%) | 147 (5.8%) |
| 50 to 54 Years | 134 (5.7%) | 147 (5.8%) |
| 55 to 59 Years | 93 (4.0%) | 89 (3.5%) |
| 60 to 64 Years | 163 (7.0%) | 216 (8.5%) |
| 65 to 69 Years | 120 (5.1%) | 50 (2.0%) |
| 70 to 74 Years | 143 (6.1%) | 120 (4.7%) |
| 75 to 79 Years | 47 (2.0%) | 174 (6.9%) |
| 80 to 84 Years | 121 (5.2%) | 138 (5.4%) |
| 85 Years and over | 71 (3.0%) | 309 (12.2%) |
| Total | 2,345 (100.0%) | 2,534 (100.0%) |
Families and Households in Mineola
Median Family Size in Mineola
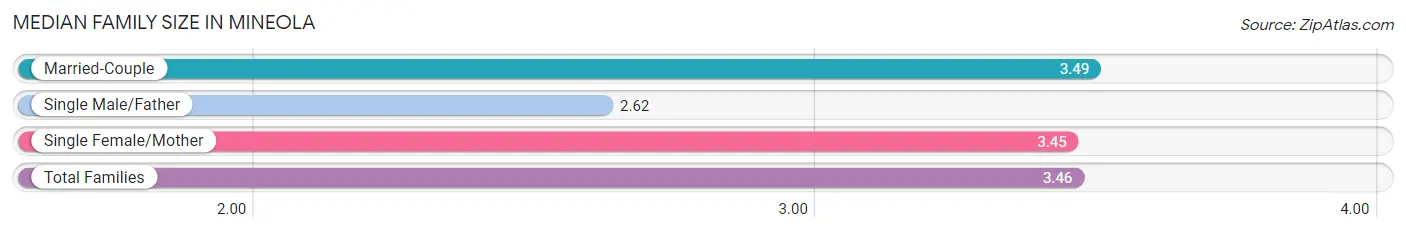
The median family size in Mineola is 3.46 persons per family, with married-couple families (814 | 81.5%) accounting for the largest median family size of 3.49 persons per family. On the other hand, single male/father families (26 | 2.6%) represent the smallest median family size with 2.62 persons per family.
| Family Type | # Families | Family Size |
| Married-Couple | 814 (81.5%) | 3.49 |
| Single Male/Father | 26 (2.6%) | 2.62 |
| Single Female/Mother | 159 (15.9%) | 3.45 |
| Total Families | 999 (100.0%) | 3.46 |
Median Household Size in Mineola
| Household Type | # Households | Household Size |
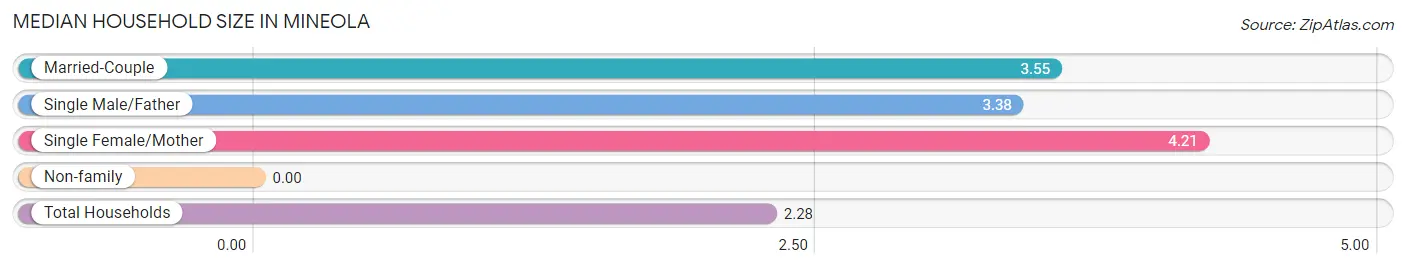
| Married-Couple | 814 (39.4%) | 3.55 |
| Single Male/Father | 26 (1.3%) | 3.38 |
| Single Female/Mother | 159 (7.7%) | 4.21 |
| Non-family | 1,069 (51.7%) | - |
| Total Households | 2,068 (100.0%) | 2.28 |
Household Size by Marriage Status in Mineola
Out of a total of 2,068 households in Mineola, 999 (48.3%) are family households, while 1,069 (51.7%) are nonfamily households. The most numerous type of family households are 2-person households, comprising 383, and the most common type of nonfamily households are 1-person households, comprising 1,069.
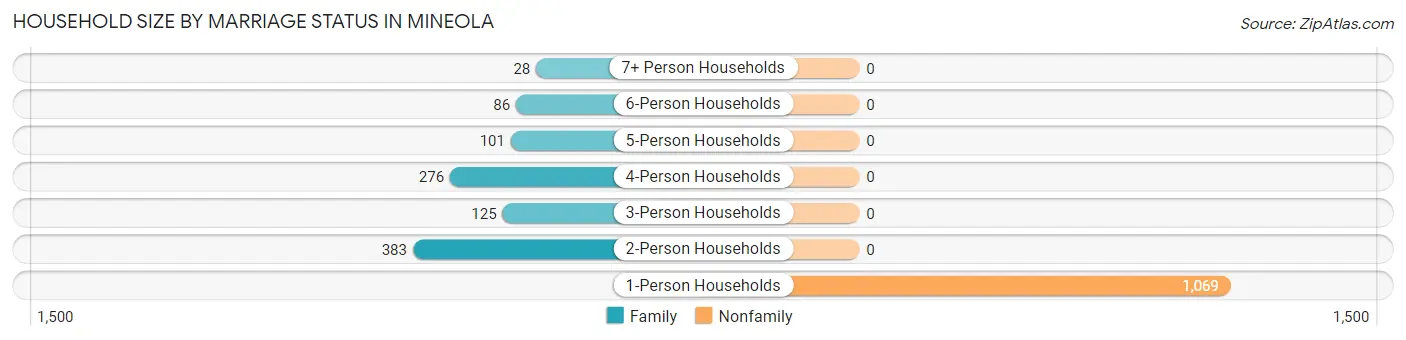
| Household Size | Family Households | Nonfamily Households |
| 1-Person Households | - | 1,069 (51.7%) |
| 2-Person Households | 383 (18.5%) | 0 (0.0%) |
| 3-Person Households | 125 (6.0%) | 0 (0.0%) |
| 4-Person Households | 276 (13.4%) | 0 (0.0%) |
| 5-Person Households | 101 (4.9%) | 0 (0.0%) |
| 6-Person Households | 86 (4.2%) | 0 (0.0%) |
| 7+ Person Households | 28 (1.3%) | 0 (0.0%) |
| Total | 999 (48.3%) | 1,069 (51.7%) |
Female Fertility in Mineola
Fertility by Age in Mineola
Average fertility rate in Mineola is 144.0 births per 1,000 women. Women in the age bracket of 20 to 34 years have the highest fertility rate with 202.0 births per 1,000 women. Women in the age bracket of 20 to 34 years acount for 50.7% of all women with births.
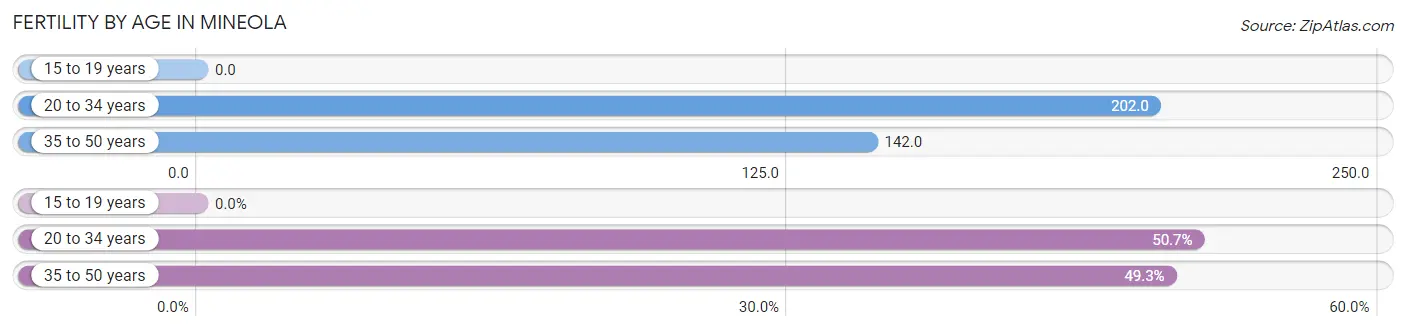
| Age Bracket | Women with Births | Births / 1,000 Women |
| 15 to 19 years | 0 (0.0%) | 0.0 |
| 20 to 34 years | 71 (50.7%) | 202.0 |
| 35 to 50 years | 69 (49.3%) | 142.0 |
| Total | 140 (100.0%) | 144.0 |
Fertility by Age by Marriage Status in Mineola
49.3% of women with births (140) in Mineola are married. The highest percentage of unmarried women with births falls into 20 to 34 years age bracket with 100.0% of them unmarried at the time of birth, while the lowest percentage of unmarried women with births belong to 35 to 50 years age bracket with 0.0% of them unmarried.
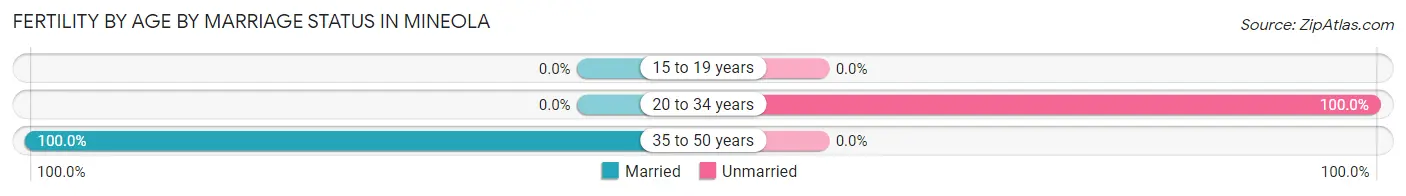
| Age Bracket | Married | Unmarried |
| 15 to 19 years | 0 (0.0%) | 0 (0.0%) |
| 20 to 34 years | 0 (0.0%) | 71 (100.0%) |
| 35 to 50 years | 69 (100.0%) | 0 (0.0%) |
| Total | 69 (49.3%) | 71 (50.7%) |
Fertility by Education in Mineola
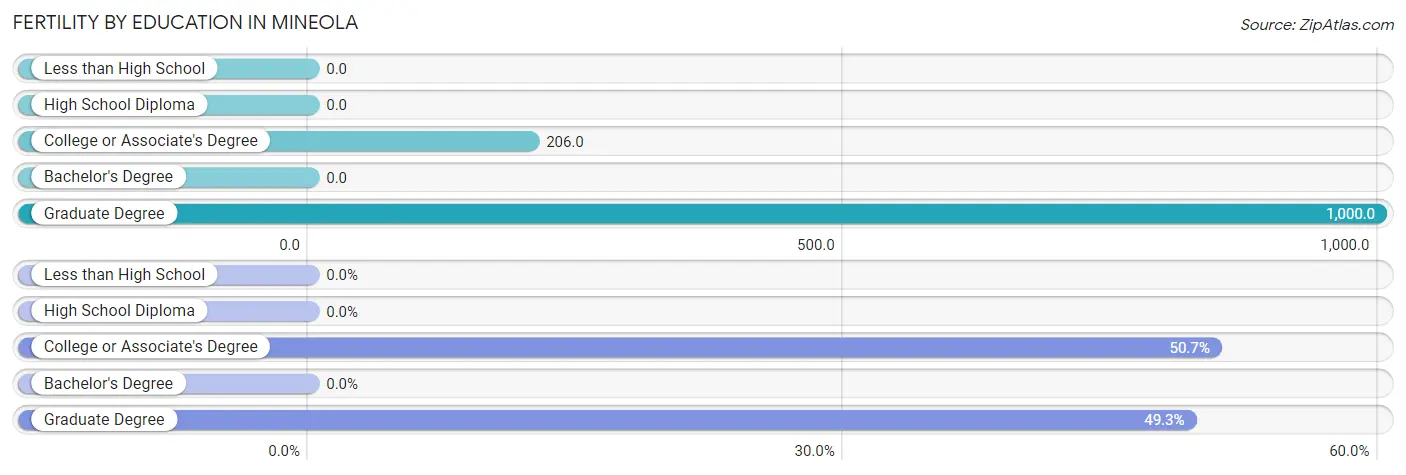
| Educational Attainment | Women with Births | Births / 1,000 Women |
| Less than High School | 0 (0.0%) | 0.0 |
| High School Diploma | 0 (0.0%) | 0.0 |
| College or Associate's Degree | 71 (50.7%) | 206.0 |
| Bachelor's Degree | 0 (0.0%) | 0.0 |
| Graduate Degree | 69 (49.3%) | 1,000.0 |
| Total | 140 (100.0%) | 144.0 |
Fertility by Education by Marriage Status in Mineola
50.7% of women with births in Mineola are unmarried. Women with the educational attainment of graduate degree are most likely to be married with 100.0% of them married at childbirth, while women with the educational attainment of college or associate's degree are least likely to be married with 100.0% of them unmarried at childbirth.
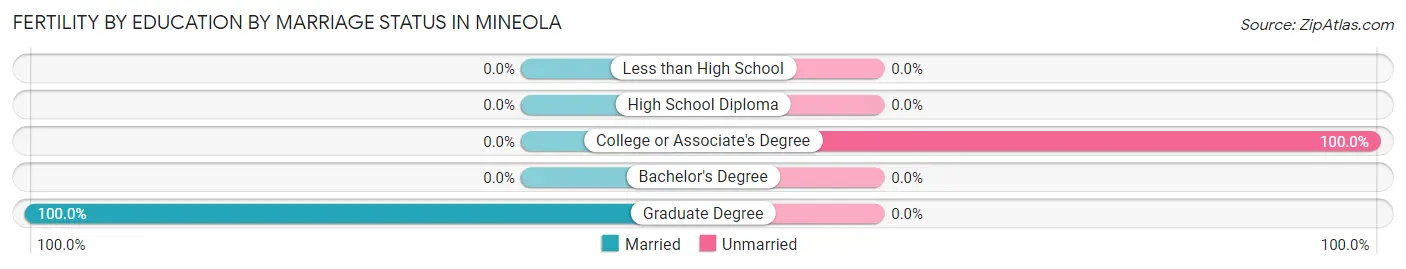
| Educational Attainment | Married | Unmarried |
| Less than High School | 0 (0.0%) | 0 (0.0%) |
| High School Diploma | 0 (0.0%) | 0 (0.0%) |
| College or Associate's Degree | 0 (0.0%) | 71 (100.0%) |
| Bachelor's Degree | 0 (0.0%) | 0 (0.0%) |
| Graduate Degree | 69 (100.0%) | 0 (0.0%) |
| Total | 69 (49.3%) | 71 (50.7%) |
Employment Characteristics in Mineola
Employment by Class of Employer in Mineola
Among the 1,892 employed individuals in Mineola, private company employees (1,193 | 63.0%), not-for-profit organizations (192 | 10.2%), and self-employed (incorporated) (139 | 7.3%) make up the most common classes of employment.
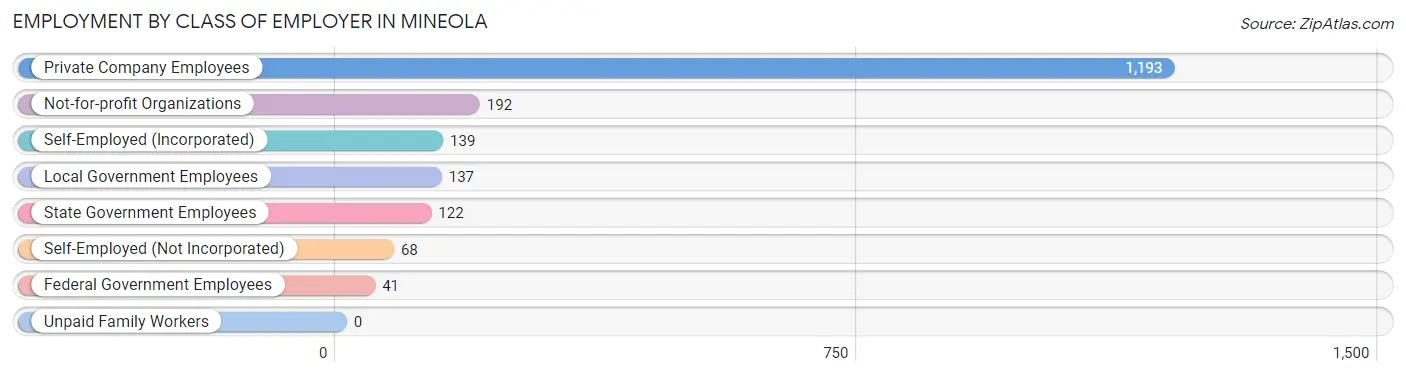
| Employer Class | # Employees | % Employees |
| Private Company Employees | 1,193 | 63.0% |
| Self-Employed (Incorporated) | 139 | 7.3% |
| Self-Employed (Not Incorporated) | 68 | 3.6% |
| Not-for-profit Organizations | 192 | 10.2% |
| Local Government Employees | 137 | 7.2% |
| State Government Employees | 122 | 6.5% |
| Federal Government Employees | 41 | 2.2% |
| Unpaid Family Workers | 0 | 0.0% |
| Total | 1,892 | 100.0% |
Employment Status by Age in Mineola
According to the labor force statistics for Mineola, out of the total population over 16 years of age (3,876), 52.4% or 2,031 individuals are in the labor force, with 5.7% or 116 of them unemployed. The age group with the highest labor force participation rate is 35 to 44 years, with 87.2% or 464 individuals in the labor force. Within the labor force, the 20 to 24 years age range has the highest percentage of unemployed individuals, with 16.2% or 54 of them being unemployed.
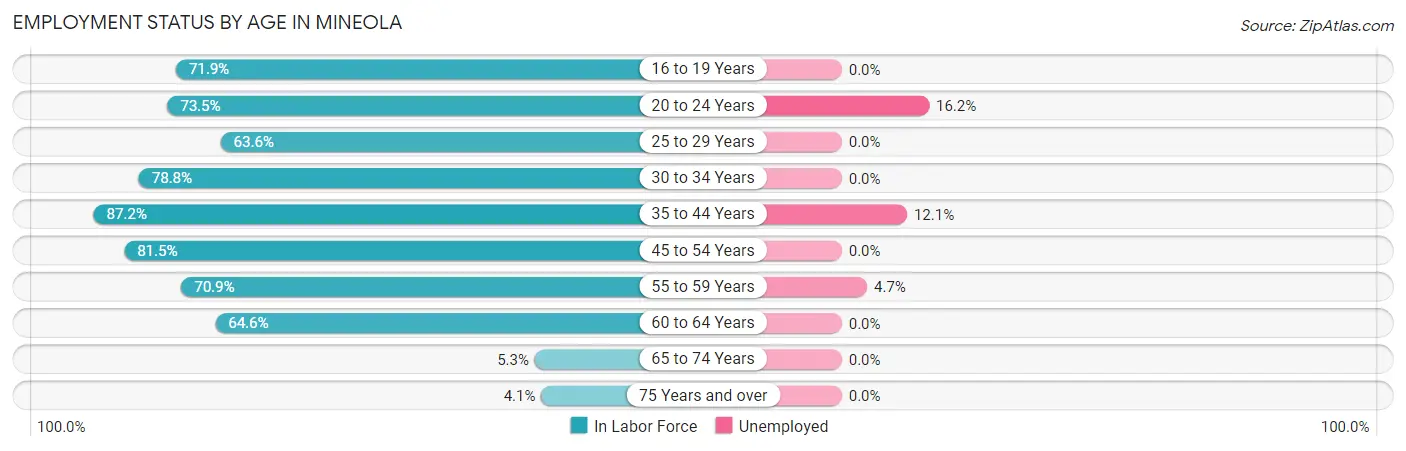
| Age Bracket | In Labor Force | Unemployed |
| 16 to 19 Years | 100 (71.9%) | 0 (0.0%) |
| 20 to 24 Years | 333 (73.5%) | 54 (16.2%) |
| 25 to 29 Years | 84 (63.6%) | 0 (0.0%) |
| 30 to 34 Years | 190 (78.8%) | 0 (0.0%) |
| 35 to 44 Years | 464 (87.2%) | 56 (12.1%) |
| 45 to 54 Years | 428 (81.5%) | 0 (0.0%) |
| 55 to 59 Years | 129 (70.9%) | 6 (4.7%) |
| 60 to 64 Years | 245 (64.6%) | 0 (0.0%) |
| 65 to 74 Years | 23 (5.3%) | 0 (0.0%) |
| 75 Years and over | 35 (4.1%) | 0 (0.0%) |
| Total | 2,031 (52.4%) | 116 (5.7%) |
Employment Status by Educational Attainment in Mineola
According to labor force statistics for Mineola, 77.3% of individuals (1,539) out of the total population between 25 and 64 years of age (1,991) are in the labor force, with 4.0% or 62 of them being unemployed. The group with the highest labor force participation rate are those with the educational attainment of college / associate degree, with 89.5% or 570 individuals in the labor force. Within the labor force, individuals with college / associate degree education have the highest percentage of unemployment, with 9.8% or 56 of them being unemployed.
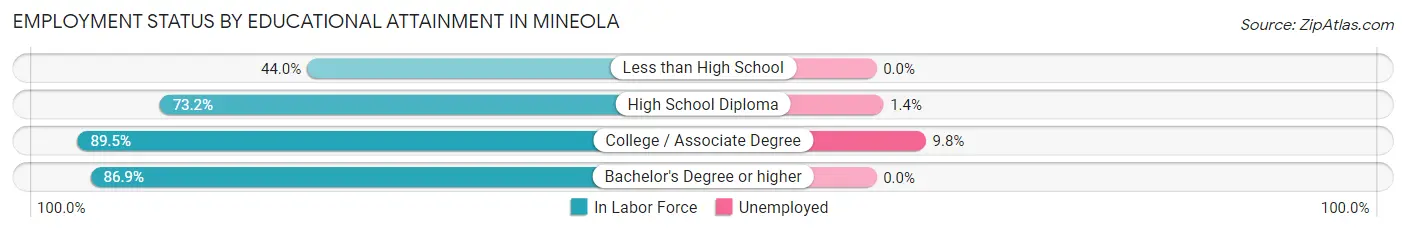
| Educational Attainment | In Labor Force | Unemployed |
| Less than High School | 128 (44.0%) | 0 (0.0%) |
| High School Diploma | 438 (73.2%) | 8 (1.4%) |
| College / Associate Degree | 570 (89.5%) | 62 (9.8%) |
| Bachelor's Degree or higher | 404 (86.9%) | 0 (0.0%) |
| Total | 1,539 (77.3%) | 80 (4.0%) |
Employment Occupations by Sex in Mineola
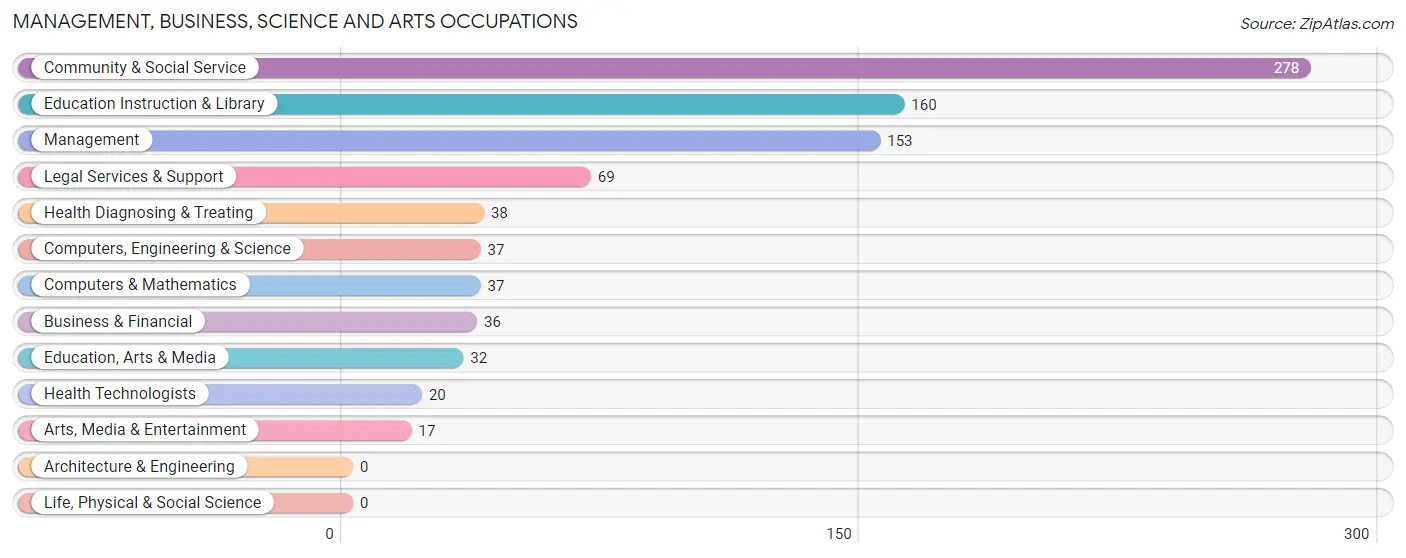
Management, Business, Science and Arts Occupations
The most common Management, Business, Science and Arts occupations in Mineola are Community & Social Service (278 | 14.5%), Education Instruction & Library (160 | 8.4%), Management (153 | 8.0%), Legal Services & Support (69 | 3.6%), and Health Diagnosing & Treating (38 | 2.0%).
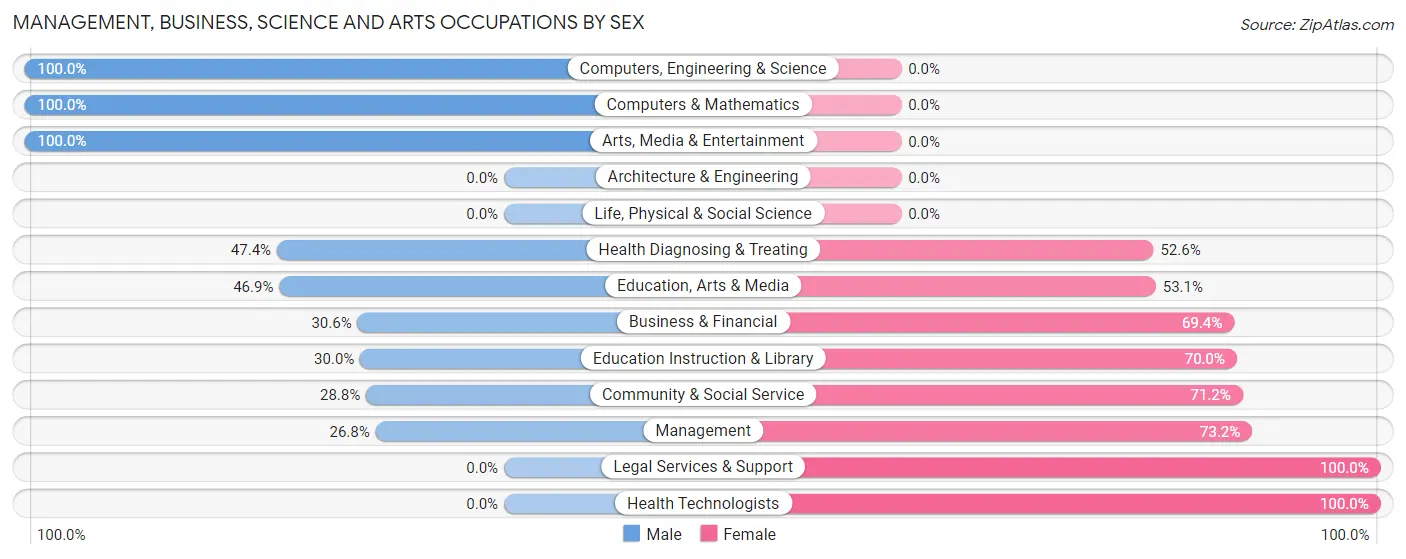
Management, Business, Science and Arts Occupations by Sex
Within the Management, Business, Science and Arts occupations in Mineola, the most male-oriented occupations are Computers, Engineering & Science (100.0%), Computers & Mathematics (100.0%), and Arts, Media & Entertainment (100.0%), while the most female-oriented occupations are Legal Services & Support (100.0%), Health Technologists (100.0%), and Management (73.2%).
| Occupation | Male | Female |
| Management | 41 (26.8%) | 112 (73.2%) |
| Business & Financial | 11 (30.6%) | 25 (69.4%) |
| Computers, Engineering & Science | 37 (100.0%) | 0 (0.0%) |
| Computers & Mathematics | 37 (100.0%) | 0 (0.0%) |
| Architecture & Engineering | 0 (0.0%) | 0 (0.0%) |
| Life, Physical & Social Science | 0 (0.0%) | 0 (0.0%) |
| Community & Social Service | 80 (28.8%) | 198 (71.2%) |
| Education, Arts & Media | 15 (46.9%) | 17 (53.1%) |
| Legal Services & Support | 0 (0.0%) | 69 (100.0%) |
| Education Instruction & Library | 48 (30.0%) | 112 (70.0%) |
| Arts, Media & Entertainment | 17 (100.0%) | 0 (0.0%) |
| Health Diagnosing & Treating | 18 (47.4%) | 20 (52.6%) |
| Health Technologists | 0 (0.0%) | 20 (100.0%) |
| Total (Category) | 187 (34.5%) | 355 (65.5%) |
| Total (Overall) | 948 (49.5%) | 967 (50.5%) |
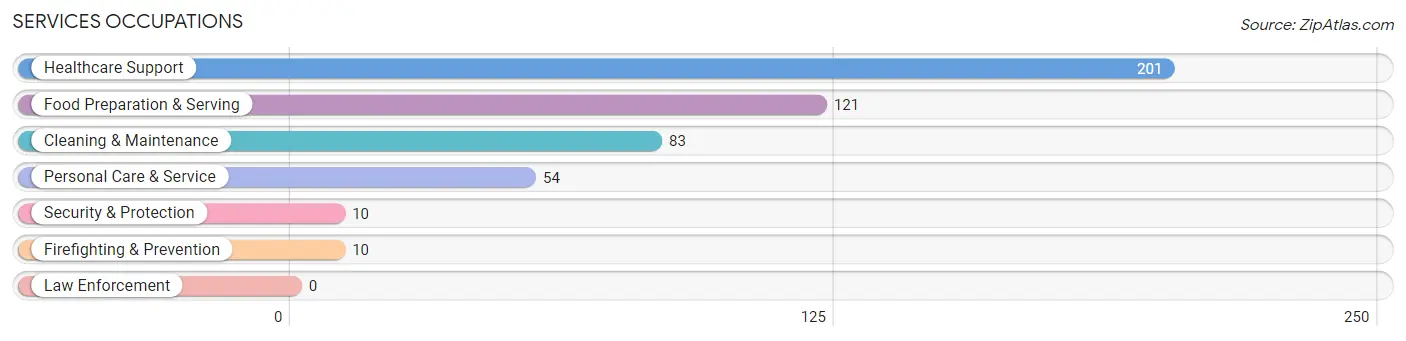
Services Occupations
The most common Services occupations in Mineola are Healthcare Support (201 | 10.5%), Food Preparation & Serving (121 | 6.3%), Cleaning & Maintenance (83 | 4.3%), Personal Care & Service (54 | 2.8%), and Security & Protection (10 | 0.5%).
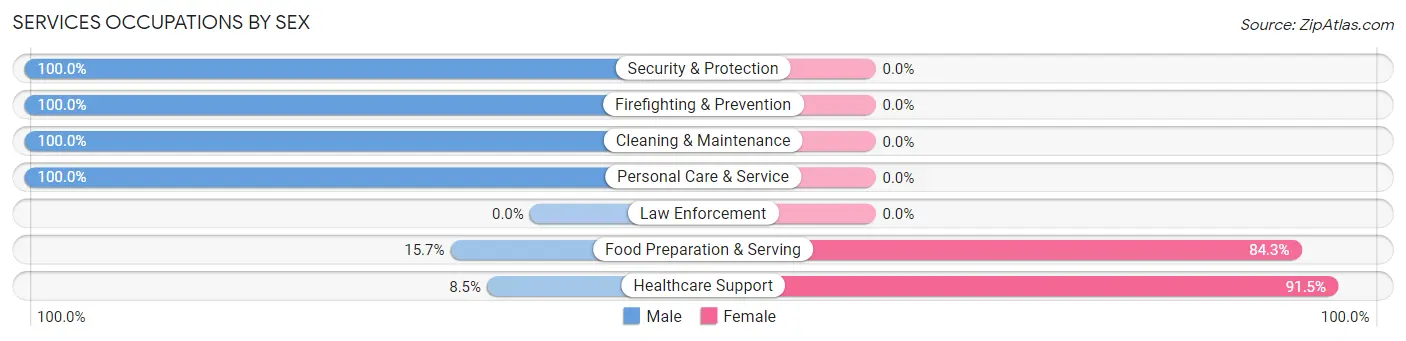
Services Occupations by Sex
Within the Services occupations in Mineola, the most male-oriented occupations are Security & Protection (100.0%), Firefighting & Prevention (100.0%), and Cleaning & Maintenance (100.0%), while the most female-oriented occupations are Healthcare Support (91.5%), and Food Preparation & Serving (84.3%).
| Occupation | Male | Female |
| Healthcare Support | 17 (8.5%) | 184 (91.5%) |
| Security & Protection | 10 (100.0%) | 0 (0.0%) |
| Firefighting & Prevention | 10 (100.0%) | 0 (0.0%) |
| Law Enforcement | 0 (0.0%) | 0 (0.0%) |
| Food Preparation & Serving | 19 (15.7%) | 102 (84.3%) |
| Cleaning & Maintenance | 83 (100.0%) | 0 (0.0%) |
| Personal Care & Service | 54 (100.0%) | 0 (0.0%) |
| Total (Category) | 183 (39.0%) | 286 (61.0%) |
| Total (Overall) | 948 (49.5%) | 967 (50.5%) |
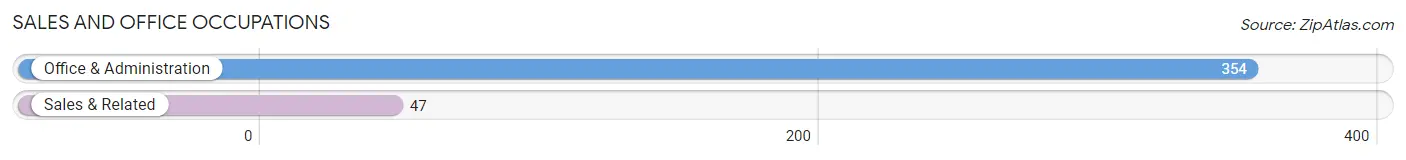
Sales and Office Occupations
The most common Sales and Office occupations in Mineola are Office & Administration (354 | 18.5%), and Sales & Related (47 | 2.5%).
Sales and Office Occupations by Sex
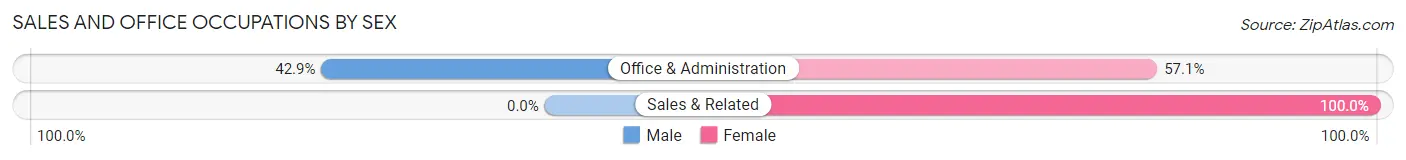
| Occupation | Male | Female |
| Sales & Related | 0 (0.0%) | 47 (100.0%) |
| Office & Administration | 152 (42.9%) | 202 (57.1%) |
| Total (Category) | 152 (37.9%) | 249 (62.1%) |
| Total (Overall) | 948 (49.5%) | 967 (50.5%) |
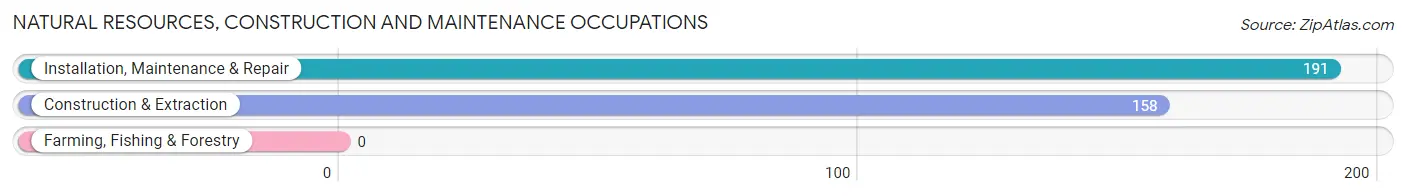
Natural Resources, Construction and Maintenance Occupations
The most common Natural Resources, Construction and Maintenance occupations in Mineola are Installation, Maintenance & Repair (191 | 10.0%), and Construction & Extraction (158 | 8.3%).
Natural Resources, Construction and Maintenance Occupations by Sex
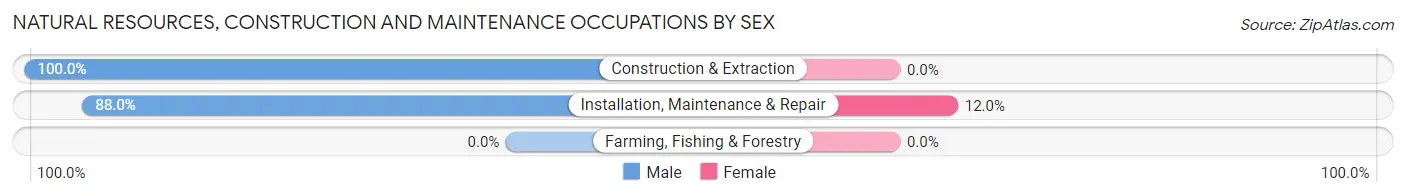
| Occupation | Male | Female |
| Farming, Fishing & Forestry | 0 (0.0%) | 0 (0.0%) |
| Construction & Extraction | 158 (100.0%) | 0 (0.0%) |
| Installation, Maintenance & Repair | 168 (88.0%) | 23 (12.0%) |
| Total (Category) | 326 (93.4%) | 23 (6.6%) |
| Total (Overall) | 948 (49.5%) | 967 (50.5%) |
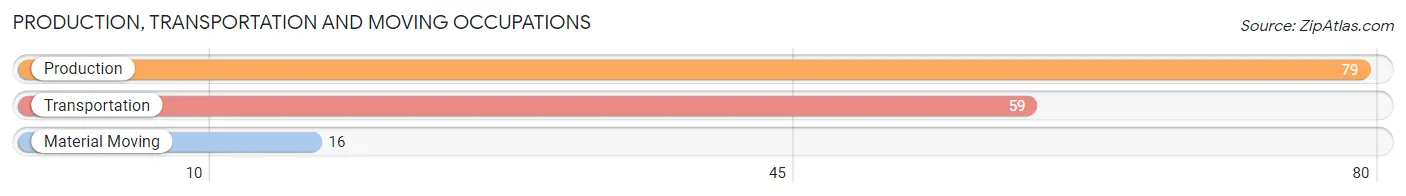
Production, Transportation and Moving Occupations
The most common Production, Transportation and Moving occupations in Mineola are Production (79 | 4.1%), Transportation (59 | 3.1%), and Material Moving (16 | 0.8%).
Production, Transportation and Moving Occupations by Sex
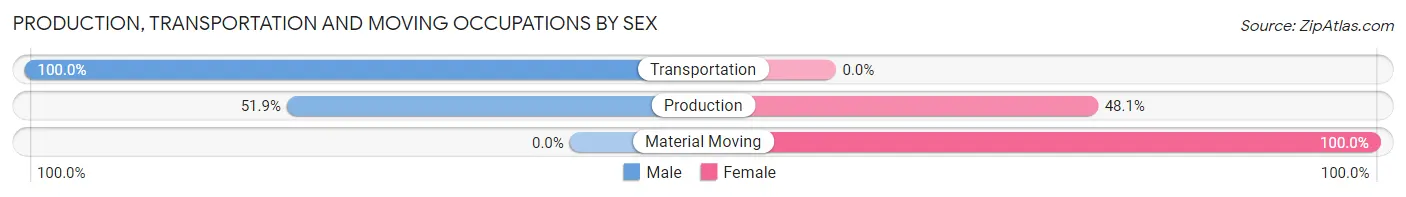
| Occupation | Male | Female |
| Production | 41 (51.9%) | 38 (48.1%) |
| Transportation | 59 (100.0%) | 0 (0.0%) |
| Material Moving | 0 (0.0%) | 16 (100.0%) |
| Total (Category) | 100 (64.9%) | 54 (35.1%) |
| Total (Overall) | 948 (49.5%) | 967 (50.5%) |
Employment Industries by Sex in Mineola
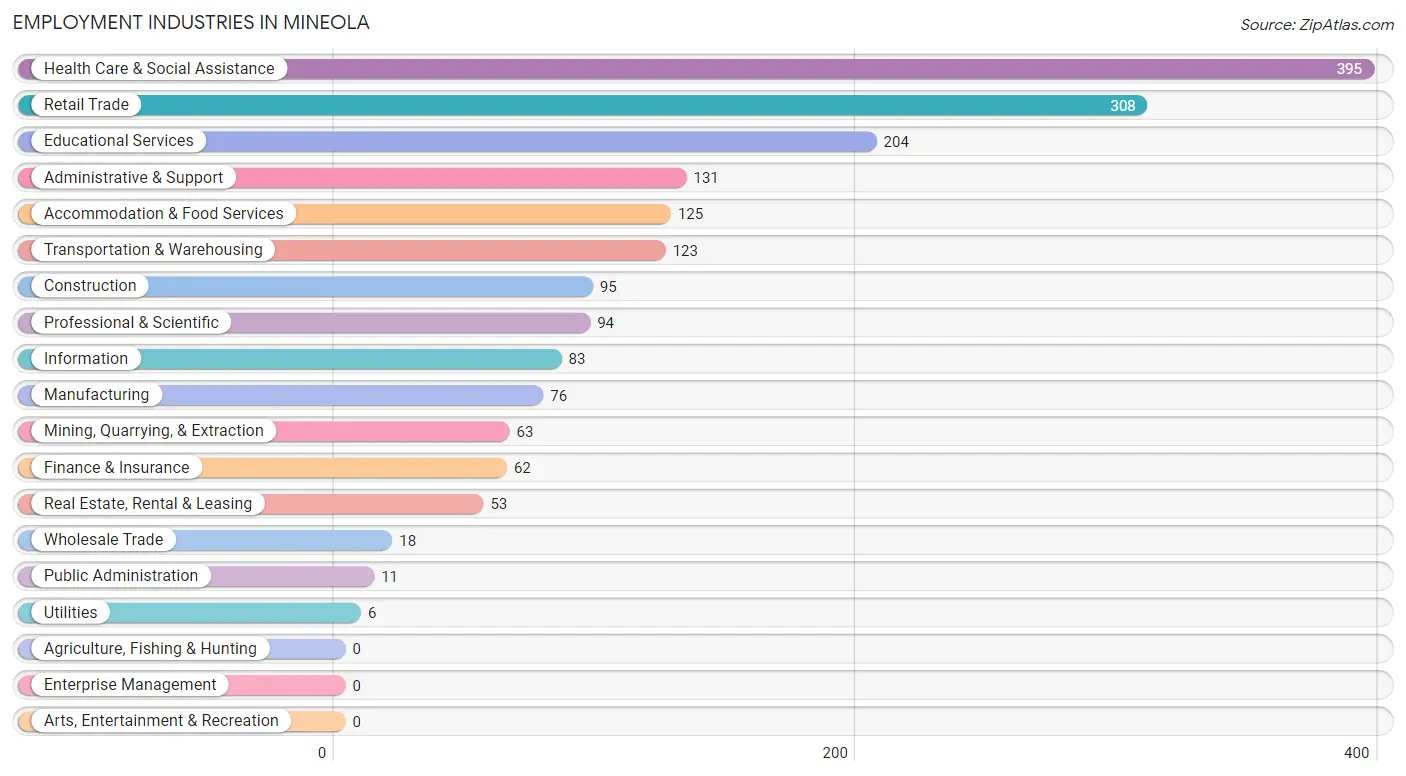
Employment Industries in Mineola
The major employment industries in Mineola include Health Care & Social Assistance (395 | 20.6%), Retail Trade (308 | 16.1%), Educational Services (204 | 10.6%), Administrative & Support (131 | 6.8%), and Accommodation & Food Services (125 | 6.5%).
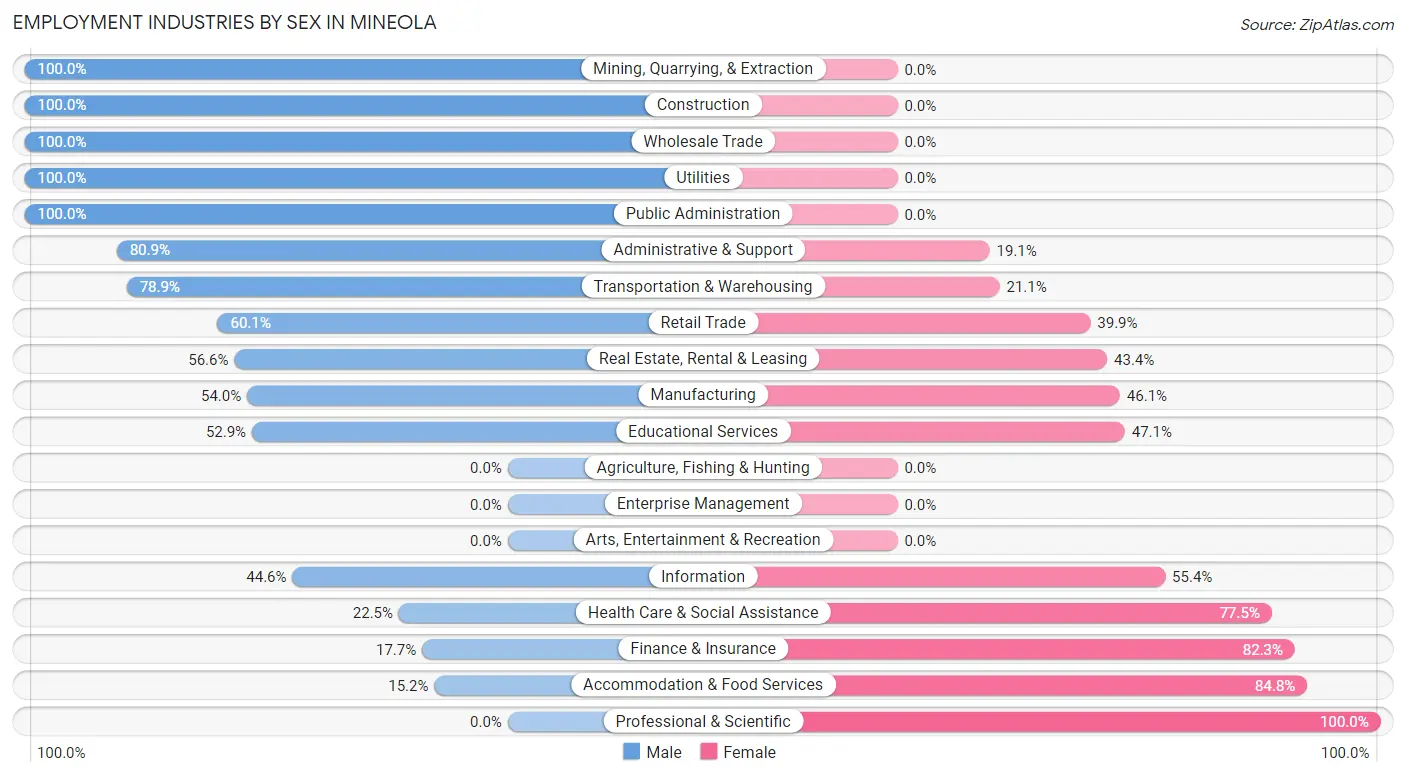
Employment Industries by Sex in Mineola
The Mineola industries that see more men than women are Mining, Quarrying, & Extraction (100.0%), Construction (100.0%), and Wholesale Trade (100.0%), whereas the industries that tend to have a higher number of women are Professional & Scientific (100.0%), Accommodation & Food Services (84.8%), and Finance & Insurance (82.3%).
| Industry | Male | Female |
| Agriculture, Fishing & Hunting | 0 (0.0%) | 0 (0.0%) |
| Mining, Quarrying, & Extraction | 63 (100.0%) | 0 (0.0%) |
| Construction | 95 (100.0%) | 0 (0.0%) |
| Manufacturing | 41 (53.9%) | 35 (46.1%) |
| Wholesale Trade | 18 (100.0%) | 0 (0.0%) |
| Retail Trade | 185 (60.1%) | 123 (39.9%) |
| Transportation & Warehousing | 97 (78.9%) | 26 (21.1%) |
| Utilities | 6 (100.0%) | 0 (0.0%) |
| Information | 37 (44.6%) | 46 (55.4%) |
| Finance & Insurance | 11 (17.7%) | 51 (82.3%) |
| Real Estate, Rental & Leasing | 30 (56.6%) | 23 (43.4%) |
| Professional & Scientific | 0 (0.0%) | 94 (100.0%) |
| Enterprise Management | 0 (0.0%) | 0 (0.0%) |
| Administrative & Support | 106 (80.9%) | 25 (19.1%) |
| Educational Services | 108 (52.9%) | 96 (47.1%) |
| Health Care & Social Assistance | 89 (22.5%) | 306 (77.5%) |
| Arts, Entertainment & Recreation | 0 (0.0%) | 0 (0.0%) |
| Accommodation & Food Services | 19 (15.2%) | 106 (84.8%) |
| Public Administration | 11 (100.0%) | 0 (0.0%) |
| Total | 948 (49.5%) | 967 (50.5%) |
Education in Mineola
School Enrollment in Mineola
The most common levels of schooling among the 1,186 students in Mineola are middle school (403 | 34.0%), elementary school (266 | 22.4%), and high school (250 | 21.1%).
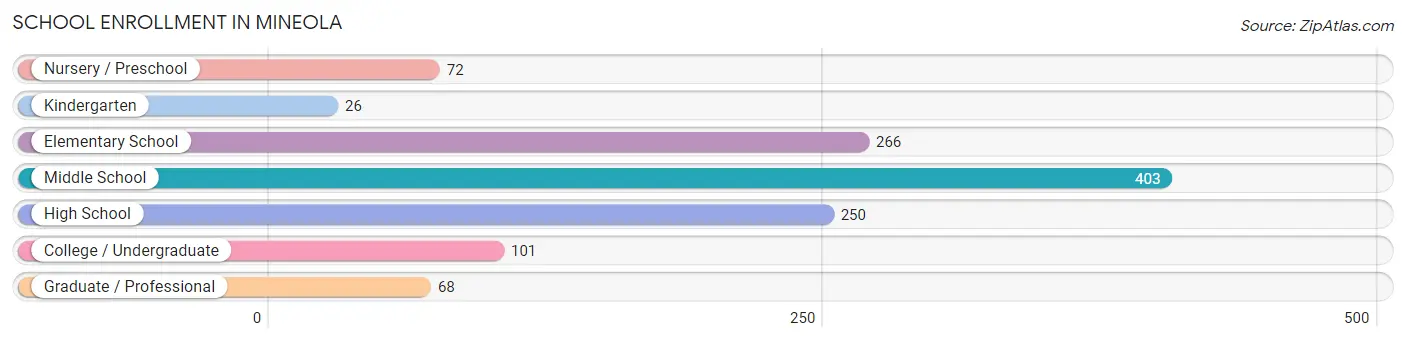
| School Level | # Students | % Students |
| Nursery / Preschool | 72 | 6.1% |
| Kindergarten | 26 | 2.2% |
| Elementary School | 266 | 22.4% |
| Middle School | 403 | 34.0% |
| High School | 250 | 21.1% |
| College / Undergraduate | 101 | 8.5% |
| Graduate / Professional | 68 | 5.7% |
| Total | 1,186 | 100.0% |
School Enrollment by Age by Funding Source in Mineola
Out of a total of 1,186 students who are enrolled in schools in Mineola, 181 (15.3%) attend a private institution, while the remaining 1,005 (84.7%) are enrolled in public schools. The age group of 15 to 17 year olds has the highest likelihood of being enrolled in private schools, with 35 (23.8% in the age bracket) enrolled. Conversely, the age group of 3 to 4 year olds has the lowest likelihood of being enrolled in a private school, with 28 (100.0% in the age bracket) attending a public institution.
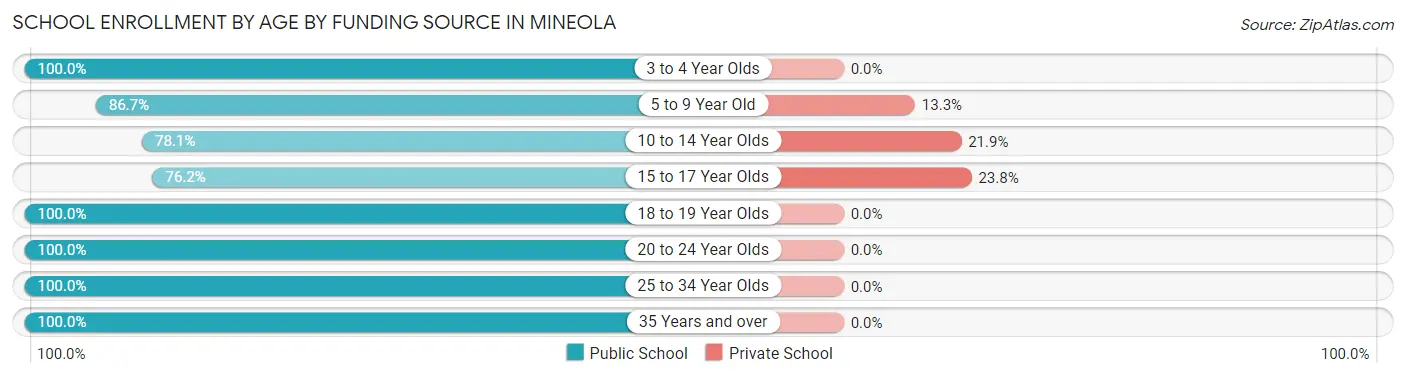
| Age Bracket | Public School | Private School |
| 3 to 4 Year Olds | 28 (100.0%) | 0 (0.0%) |
| 5 to 9 Year Old | 268 (86.7%) | 41 (13.3%) |
| 10 to 14 Year Olds | 378 (78.1%) | 106 (21.9%) |
| 15 to 17 Year Olds | 112 (76.2%) | 35 (23.8%) |
| 18 to 19 Year Olds | 65 (100.0%) | 0 (0.0%) |
| 20 to 24 Year Olds | 89 (100.0%) | 0 (0.0%) |
| 25 to 34 Year Olds | 13 (100.0%) | 0 (0.0%) |
| 35 Years and over | 51 (100.0%) | 0 (0.0%) |
| Total | 1,005 (84.7%) | 181 (15.3%) |
Educational Attainment by Field of Study in Mineola
Education (218 | 30.8%), engineering (217 | 30.6%), business (110 | 15.5%), physical & health sciences (63 | 8.9%), and literature & languages (42 | 5.9%) are the most common fields of study among 708 individuals in Mineola who have obtained a bachelor's degree or higher.
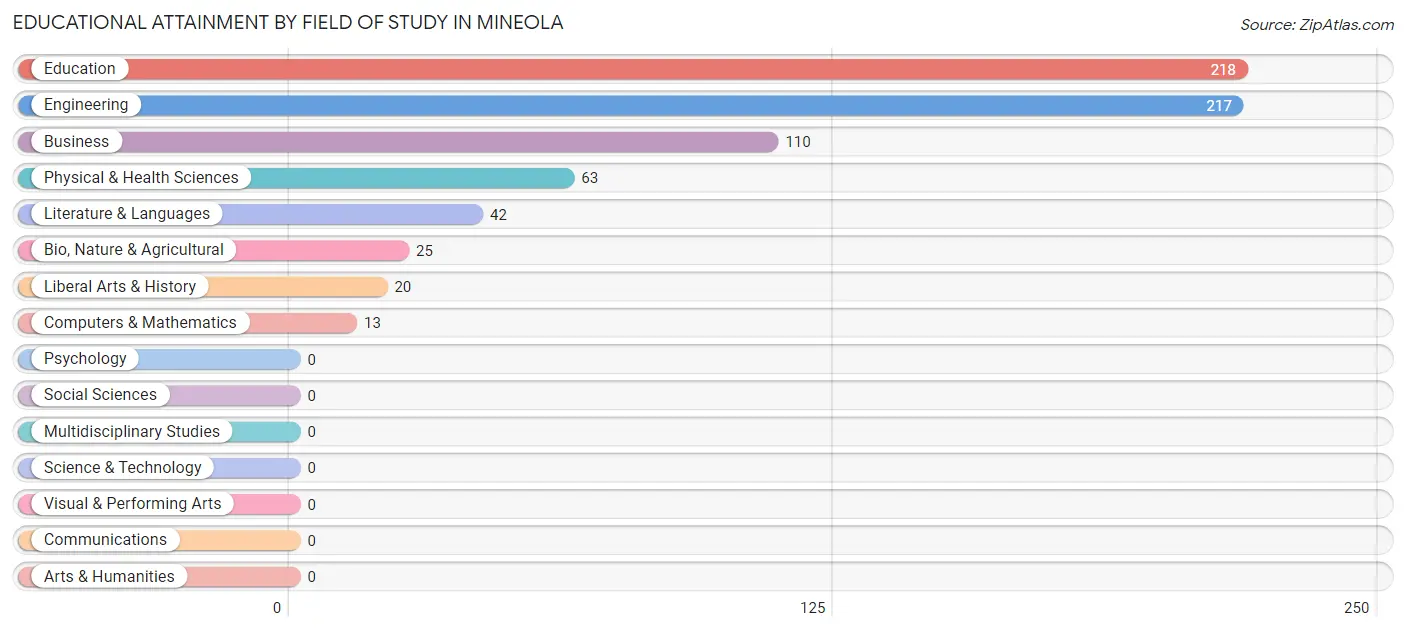
| Field of Study | # Graduates | % Graduates |
| Computers & Mathematics | 13 | 1.8% |
| Bio, Nature & Agricultural | 25 | 3.5% |
| Physical & Health Sciences | 63 | 8.9% |
| Psychology | 0 | 0.0% |
| Social Sciences | 0 | 0.0% |
| Engineering | 217 | 30.6% |
| Multidisciplinary Studies | 0 | 0.0% |
| Science & Technology | 0 | 0.0% |
| Business | 110 | 15.5% |
| Education | 218 | 30.8% |
| Literature & Languages | 42 | 5.9% |
| Liberal Arts & History | 20 | 2.8% |
| Visual & Performing Arts | 0 | 0.0% |
| Communications | 0 | 0.0% |
| Arts & Humanities | 0 | 0.0% |
| Total | 708 | 100.0% |
Transportation & Commute in Mineola
Vehicle Availability by Sex in Mineola
The most prevalent vehicle ownership categories in Mineola are males with 2 vehicles (326, accounting for 34.4%) and females with 2 vehicles (304, making up 34.5%).
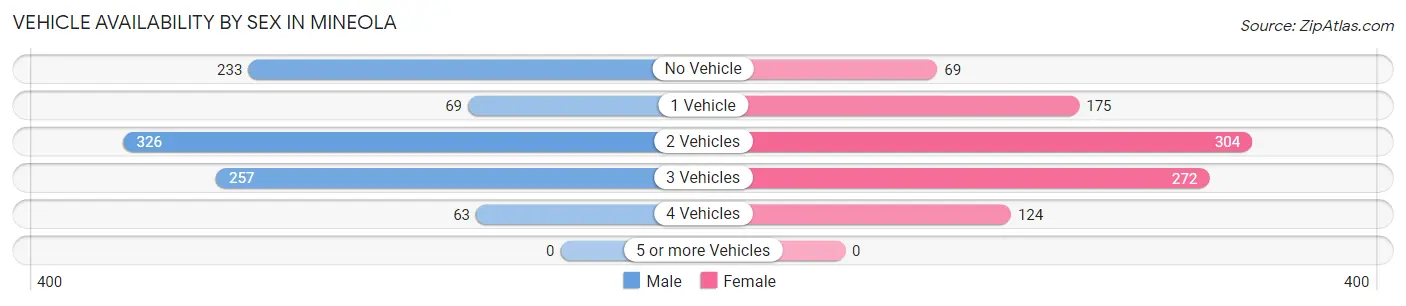
| Vehicles Available | Male | Female |
| No Vehicle | 233 (24.6%) | 69 (7.3%) |
| 1 Vehicle | 69 (7.3%) | 175 (18.5%) |
| 2 Vehicles | 326 (34.4%) | 304 (32.2%) |
| 3 Vehicles | 257 (27.1%) | 272 (28.8%) |
| 4 Vehicles | 63 (6.7%) | 124 (13.1%) |
| 5 or more Vehicles | 0 (0.0%) | 0 (0.0%) |
| Total | 948 (100.0%) | 944 (100.0%) |
Commute Time in Mineola
The most frequently occuring commute durations in Mineola are 5 to 9 minutes (433 commuters, 25.7%), 45 to 59 minutes (387 commuters, 22.9%), and 60 to 89 minutes (237 commuters, 14.0%).
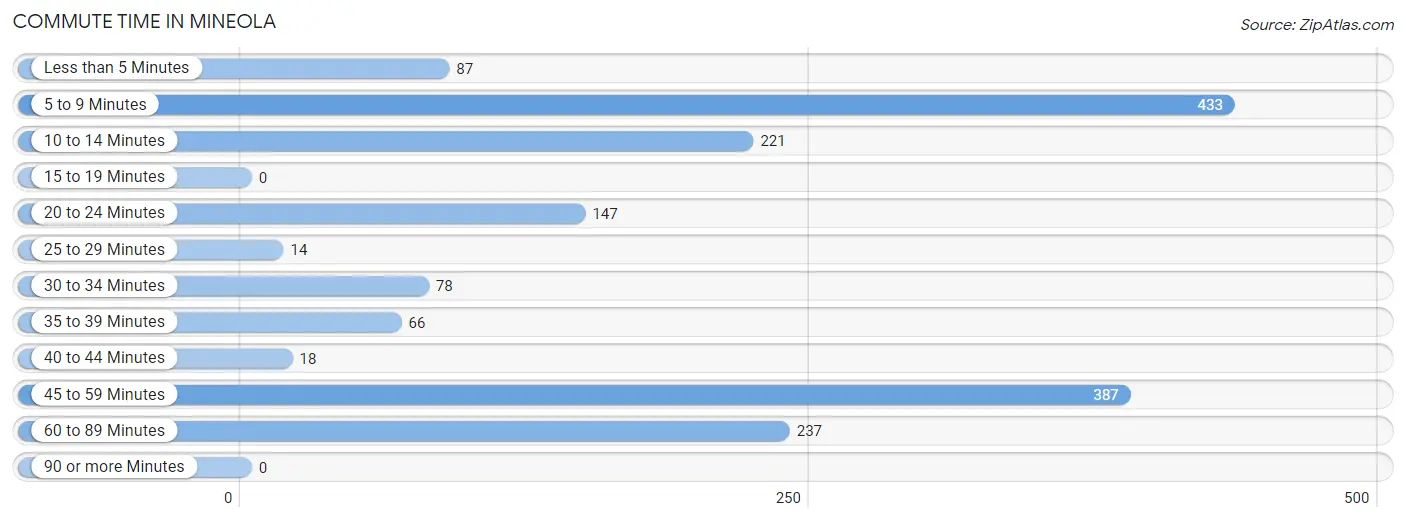
| Commute Time | # Commuters | % Commuters |
| Less than 5 Minutes | 87 | 5.1% |
| 5 to 9 Minutes | 433 | 25.7% |
| 10 to 14 Minutes | 221 | 13.1% |
| 15 to 19 Minutes | 0 | 0.0% |
| 20 to 24 Minutes | 147 | 8.7% |
| 25 to 29 Minutes | 14 | 0.8% |
| 30 to 34 Minutes | 78 | 4.6% |
| 35 to 39 Minutes | 66 | 3.9% |
| 40 to 44 Minutes | 18 | 1.1% |
| 45 to 59 Minutes | 387 | 22.9% |
| 60 to 89 Minutes | 237 | 14.0% |
| 90 or more Minutes | 0 | 0.0% |
Commute Time by Sex in Mineola
The most common commute times in Mineola are 60 to 89 minutes (237 commuters, 28.0%) for males and 5 to 9 minutes (224 commuters, 26.6%) for females.
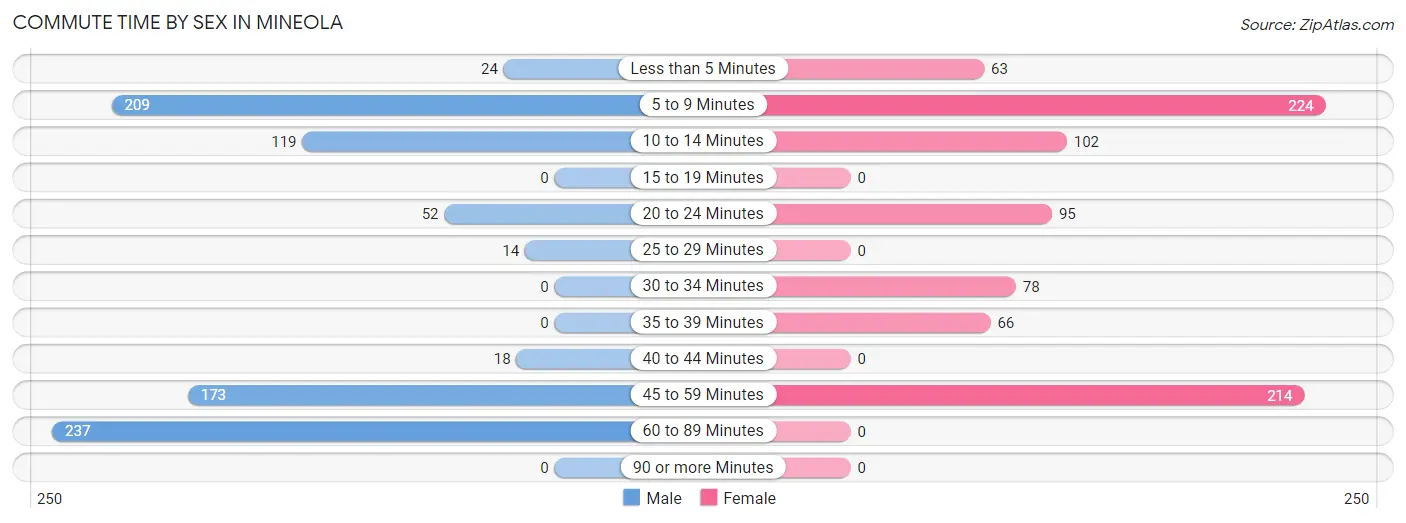
| Commute Time | Male | Female |
| Less than 5 Minutes | 24 (2.8%) | 63 (7.5%) |
| 5 to 9 Minutes | 209 (24.7%) | 224 (26.6%) |
| 10 to 14 Minutes | 119 (14.1%) | 102 (12.1%) |
| 15 to 19 Minutes | 0 (0.0%) | 0 (0.0%) |
| 20 to 24 Minutes | 52 (6.1%) | 95 (11.3%) |
| 25 to 29 Minutes | 14 (1.7%) | 0 (0.0%) |
| 30 to 34 Minutes | 0 (0.0%) | 78 (9.3%) |
| 35 to 39 Minutes | 0 (0.0%) | 66 (7.8%) |
| 40 to 44 Minutes | 18 (2.1%) | 0 (0.0%) |
| 45 to 59 Minutes | 173 (20.4%) | 214 (25.4%) |
| 60 to 89 Minutes | 237 (28.0%) | 0 (0.0%) |
| 90 or more Minutes | 0 (0.0%) | 0 (0.0%) |
Time of Departure to Work by Sex in Mineola
The most frequent times of departure to work in Mineola are 5:30 AM to 5:59 AM (223, 26.4%) for males and 6:30 AM to 6:59 AM (249, 29.6%) for females.
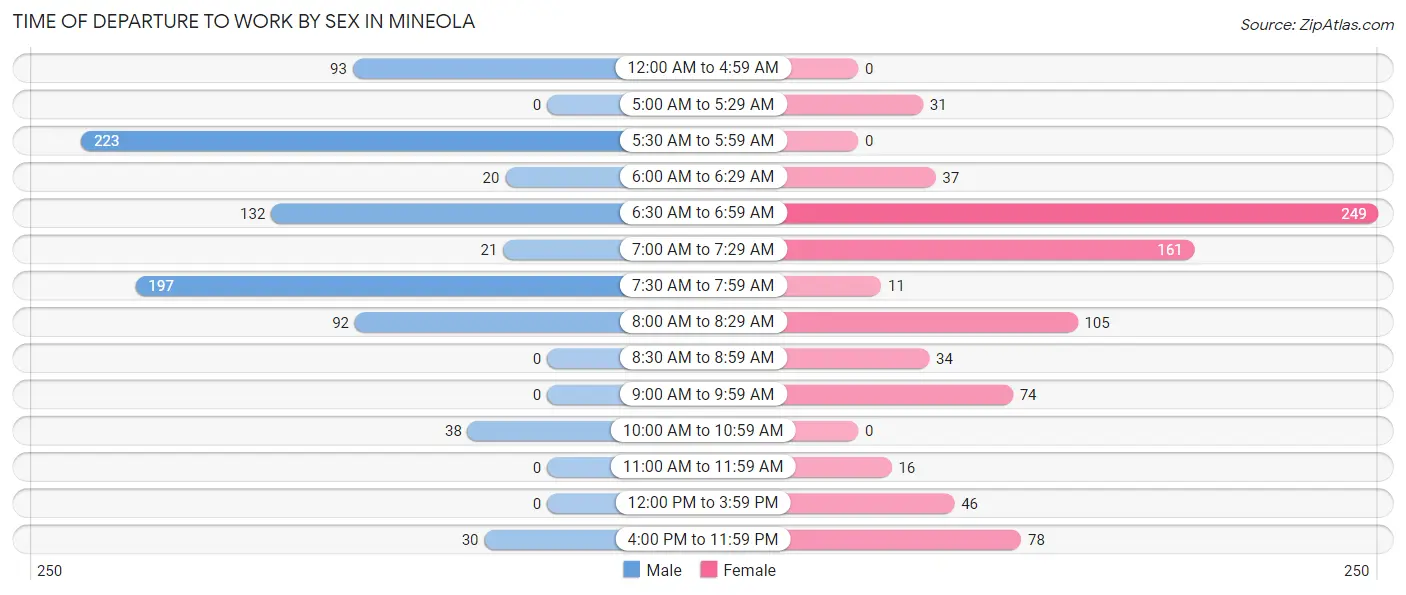
| Time of Departure | Male | Female |
| 12:00 AM to 4:59 AM | 93 (11.0%) | 0 (0.0%) |
| 5:00 AM to 5:29 AM | 0 (0.0%) | 31 (3.7%) |
| 5:30 AM to 5:59 AM | 223 (26.4%) | 0 (0.0%) |
| 6:00 AM to 6:29 AM | 20 (2.4%) | 37 (4.4%) |
| 6:30 AM to 6:59 AM | 132 (15.6%) | 249 (29.6%) |
| 7:00 AM to 7:29 AM | 21 (2.5%) | 161 (19.1%) |
| 7:30 AM to 7:59 AM | 197 (23.3%) | 11 (1.3%) |
| 8:00 AM to 8:29 AM | 92 (10.9%) | 105 (12.5%) |
| 8:30 AM to 8:59 AM | 0 (0.0%) | 34 (4.0%) |
| 9:00 AM to 9:59 AM | 0 (0.0%) | 74 (8.8%) |
| 10:00 AM to 10:59 AM | 38 (4.5%) | 0 (0.0%) |
| 11:00 AM to 11:59 AM | 0 (0.0%) | 16 (1.9%) |
| 12:00 PM to 3:59 PM | 0 (0.0%) | 46 (5.5%) |
| 4:00 PM to 11:59 PM | 30 (3.5%) | 78 (9.3%) |
| Total | 846 (100.0%) | 842 (100.0%) |
Housing Occupancy in Mineola
Occupancy by Ownership in Mineola
Of the total 2,068 dwellings in Mineola, owner-occupied units account for 1,111 (53.7%), while renter-occupied units make up 957 (46.3%).
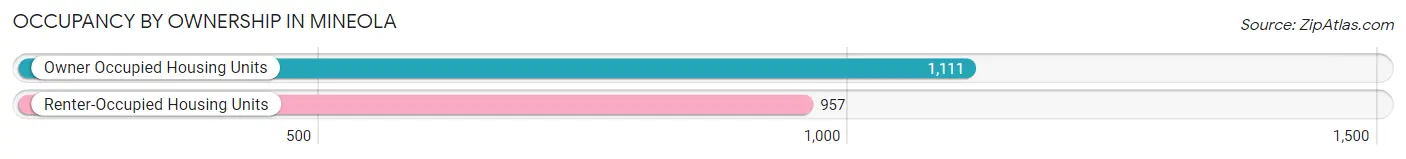
| Occupancy | # Housing Units | % Housing Units |
| Owner Occupied Housing Units | 1,111 | 53.7% |
| Renter-Occupied Housing Units | 957 | 46.3% |
| Total Occupied Housing Units | 2,068 | 100.0% |
Occupancy by Household Size in Mineola
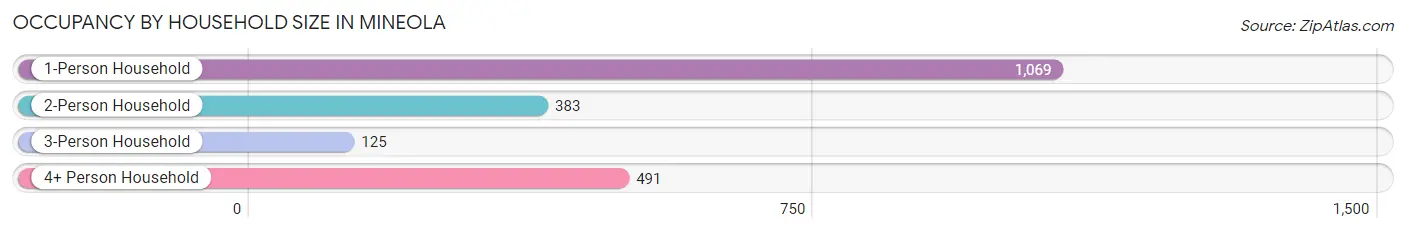
| Household Size | # Housing Units | % Housing Units |
| 1-Person Household | 1,069 | 51.7% |
| 2-Person Household | 383 | 18.5% |
| 3-Person Household | 125 | 6.0% |
| 4+ Person Household | 491 | 23.7% |
| Total Housing Units | 2,068 | 100.0% |
Occupancy by Ownership by Household Size in Mineola
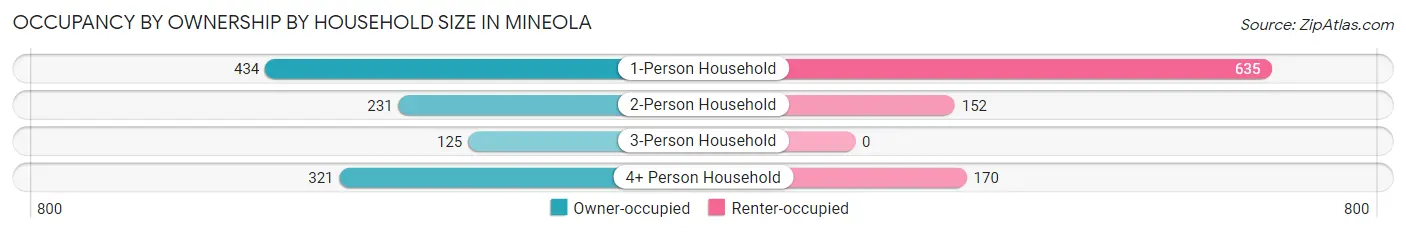
| Household Size | Owner-occupied | Renter-occupied |
| 1-Person Household | 434 (40.6%) | 635 (59.4%) |
| 2-Person Household | 231 (60.3%) | 152 (39.7%) |
| 3-Person Household | 125 (100.0%) | 0 (0.0%) |
| 4+ Person Household | 321 (65.4%) | 170 (34.6%) |
| Total Housing Units | 1,111 (53.7%) | 957 (46.3%) |
Occupancy by Educational Attainment in Mineola
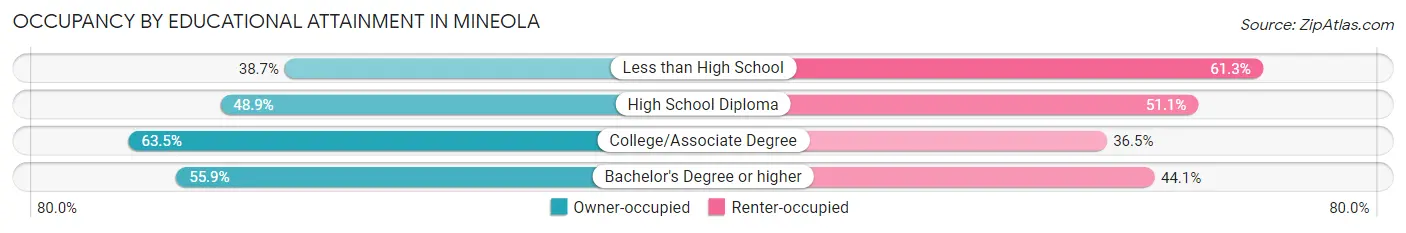
| Household Size | Owner-occupied | Renter-occupied |
| Less than High School | 134 (38.7%) | 212 (61.3%) |
| High School Diploma | 278 (48.9%) | 290 (51.1%) |
| College/Associate Degree | 449 (63.5%) | 258 (36.5%) |
| Bachelor's Degree or higher | 250 (55.9%) | 197 (44.1%) |
Occupancy by Age of Householder in Mineola
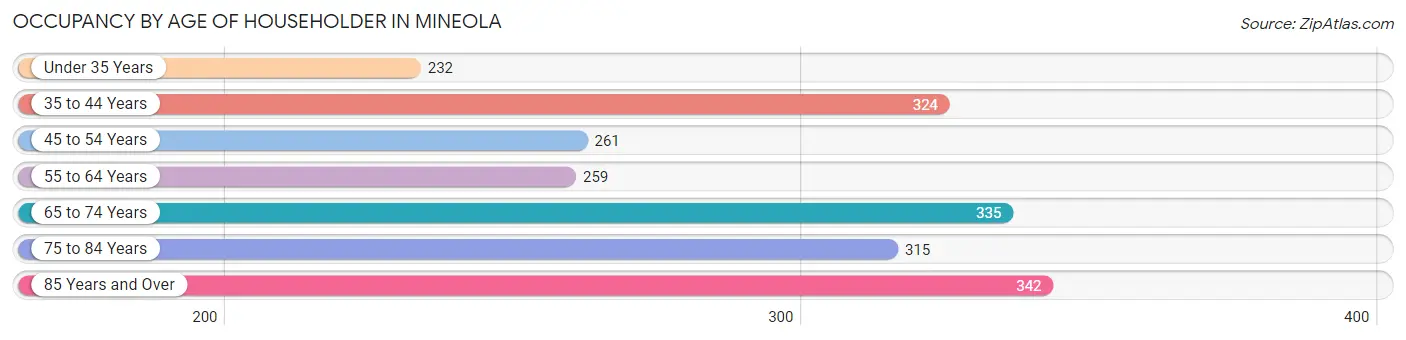
| Age Bracket | # Households | % Households |
| Under 35 Years | 232 | 11.2% |
| 35 to 44 Years | 324 | 15.7% |
| 45 to 54 Years | 261 | 12.6% |
| 55 to 64 Years | 259 | 12.5% |
| 65 to 74 Years | 335 | 16.2% |
| 75 to 84 Years | 315 | 15.2% |
| 85 Years and Over | 342 | 16.5% |
| Total | 2,068 | 100.0% |
Housing Finances in Mineola
Median Income by Occupancy in Mineola
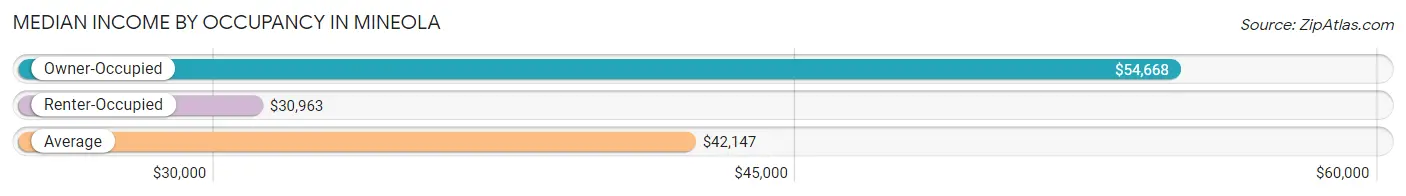
| Occupancy Type | # Households | Median Income |
| Owner-Occupied | 1,111 (53.7%) | $54,668 |
| Renter-Occupied | 957 (46.3%) | $30,963 |
| Average | 2,068 (100.0%) | $42,147 |
Occupancy by Householder Income Bracket in Mineola
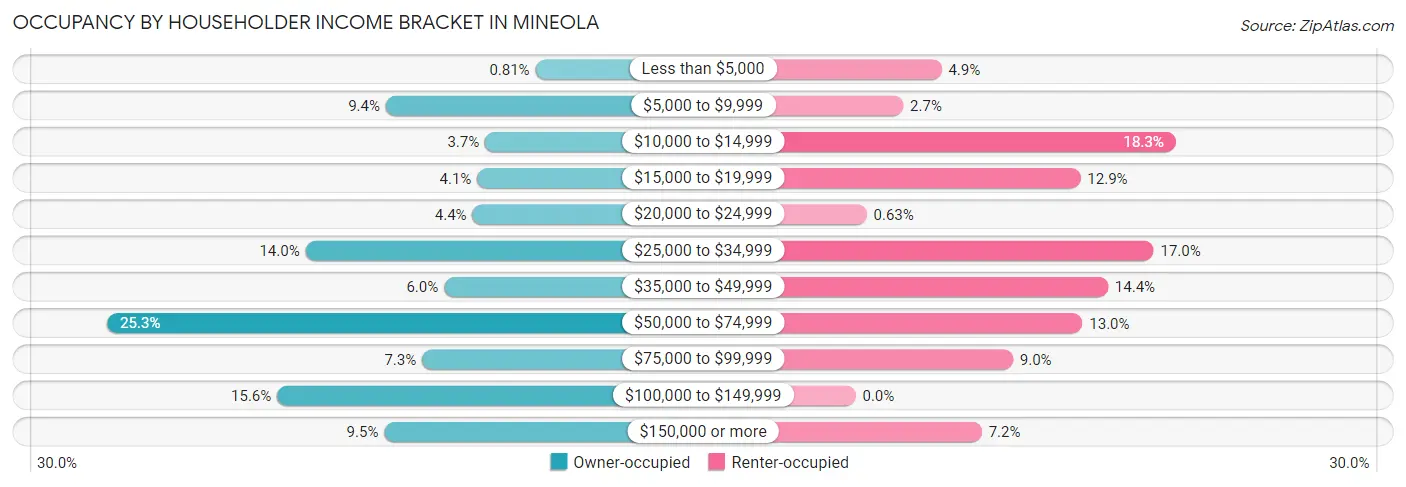
| Income Bracket | Owner-occupied | Renter-occupied |
| Less than $5,000 | 9 (0.8%) | 47 (4.9%) |
| $5,000 to $9,999 | 104 (9.4%) | 26 (2.7%) |
| $10,000 to $14,999 | 41 (3.7%) | 175 (18.3%) |
| $15,000 to $19,999 | 46 (4.1%) | 123 (12.9%) |
| $20,000 to $24,999 | 49 (4.4%) | 6 (0.6%) |
| $25,000 to $34,999 | 155 (14.0%) | 163 (17.0%) |
| $35,000 to $49,999 | 67 (6.0%) | 138 (14.4%) |
| $50,000 to $74,999 | 281 (25.3%) | 124 (13.0%) |
| $75,000 to $99,999 | 81 (7.3%) | 86 (9.0%) |
| $100,000 to $149,999 | 173 (15.6%) | 0 (0.0%) |
| $150,000 or more | 105 (9.5%) | 69 (7.2%) |
| Total | 1,111 (100.0%) | 957 (100.0%) |
Monthly Housing Cost Tiers in Mineola
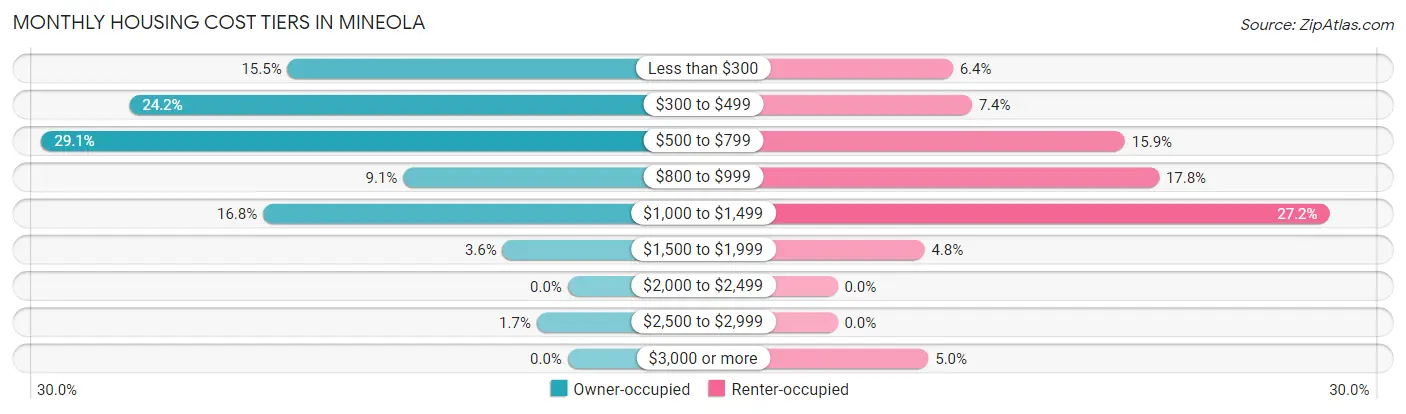
| Monthly Cost | Owner-occupied | Renter-occupied |
| Less than $300 | 172 (15.5%) | 61 (6.4%) |
| $300 to $499 | 269 (24.2%) | 71 (7.4%) |
| $500 to $799 | 323 (29.1%) | 152 (15.9%) |
| $800 to $999 | 101 (9.1%) | 170 (17.8%) |
| $1,000 to $1,499 | 187 (16.8%) | 260 (27.2%) |
| $1,500 to $1,999 | 40 (3.6%) | 46 (4.8%) |
| $2,000 to $2,499 | 0 (0.0%) | 0 (0.0%) |
| $2,500 to $2,999 | 19 (1.7%) | 0 (0.0%) |
| $3,000 or more | 0 (0.0%) | 48 (5.0%) |
| Total | 1,111 (100.0%) | 957 (100.0%) |
Physical Housing Characteristics in Mineola
Housing Structures in Mineola
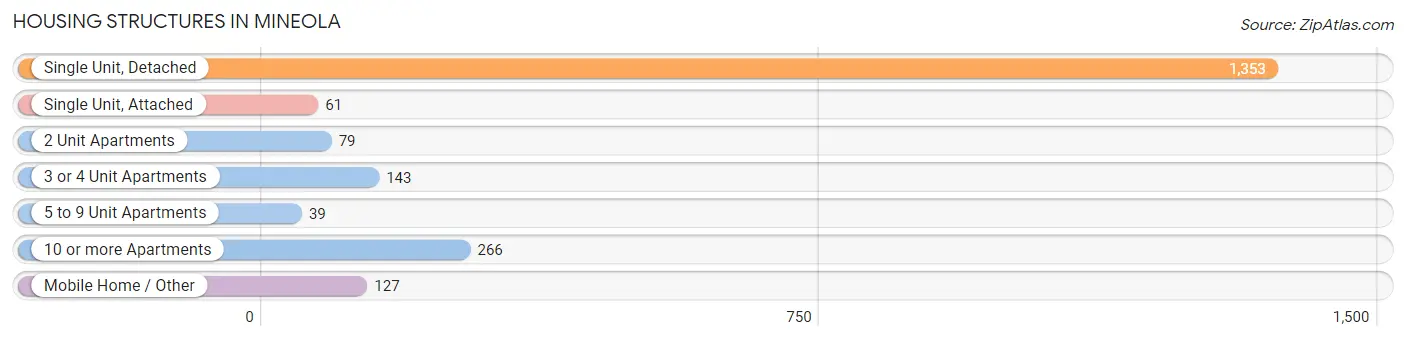
| Structure Type | # Housing Units | % Housing Units |
| Single Unit, Detached | 1,353 | 65.4% |
| Single Unit, Attached | 61 | 2.9% |
| 2 Unit Apartments | 79 | 3.8% |
| 3 or 4 Unit Apartments | 143 | 6.9% |
| 5 to 9 Unit Apartments | 39 | 1.9% |
| 10 or more Apartments | 266 | 12.9% |
| Mobile Home / Other | 127 | 6.1% |
| Total | 2,068 | 100.0% |
Housing Structures by Occupancy in Mineola
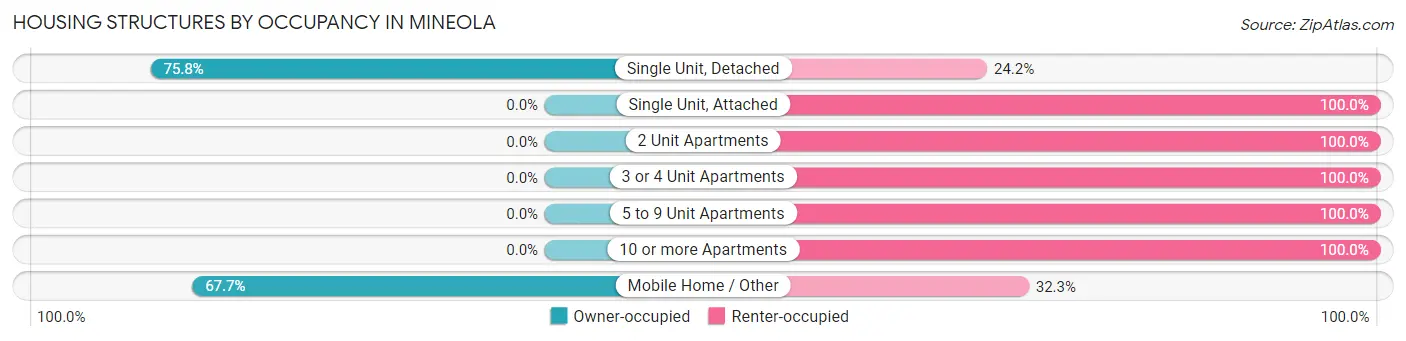
| Structure Type | Owner-occupied | Renter-occupied |
| Single Unit, Detached | 1,025 (75.8%) | 328 (24.2%) |
| Single Unit, Attached | 0 (0.0%) | 61 (100.0%) |
| 2 Unit Apartments | 0 (0.0%) | 79 (100.0%) |
| 3 or 4 Unit Apartments | 0 (0.0%) | 143 (100.0%) |
| 5 to 9 Unit Apartments | 0 (0.0%) | 39 (100.0%) |
| 10 or more Apartments | 0 (0.0%) | 266 (100.0%) |
| Mobile Home / Other | 86 (67.7%) | 41 (32.3%) |
| Total | 1,111 (53.7%) | 957 (46.3%) |
Housing Structures by Number of Rooms in Mineola
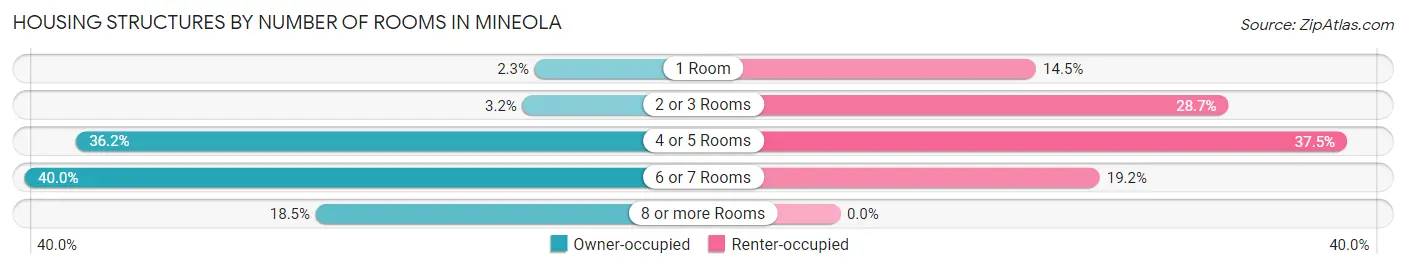
| Number of Rooms | Owner-occupied | Renter-occupied |
| 1 Room | 25 (2.2%) | 139 (14.5%) |
| 2 or 3 Rooms | 35 (3.2%) | 275 (28.7%) |
| 4 or 5 Rooms | 402 (36.2%) | 359 (37.5%) |
| 6 or 7 Rooms | 444 (40.0%) | 184 (19.2%) |
| 8 or more Rooms | 205 (18.4%) | 0 (0.0%) |
| Total | 1,111 (100.0%) | 957 (100.0%) |
Housing Structure by Heating Type in Mineola
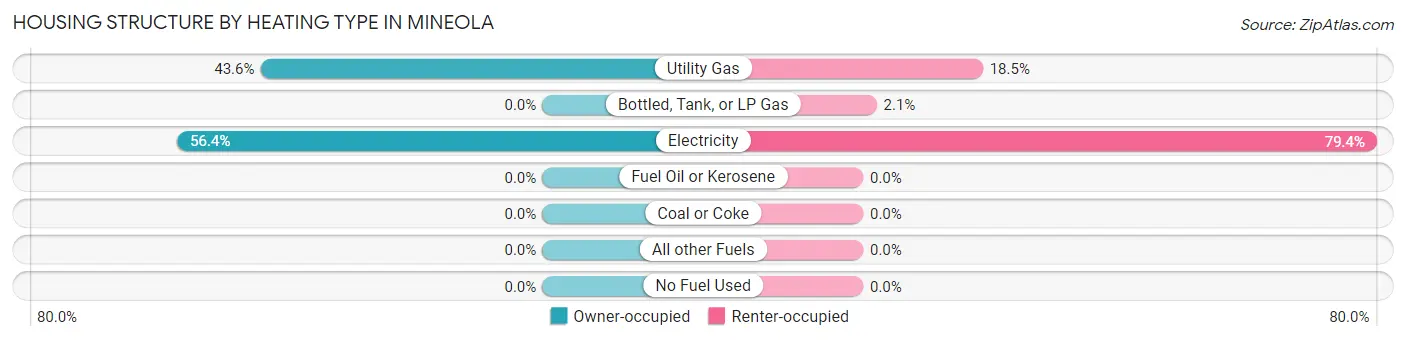
| Heating Type | Owner-occupied | Renter-occupied |
| Utility Gas | 484 (43.6%) | 177 (18.5%) |
| Bottled, Tank, or LP Gas | 0 (0.0%) | 20 (2.1%) |
| Electricity | 627 (56.4%) | 760 (79.4%) |
| Fuel Oil or Kerosene | 0 (0.0%) | 0 (0.0%) |
| Coal or Coke | 0 (0.0%) | 0 (0.0%) |
| All other Fuels | 0 (0.0%) | 0 (0.0%) |
| No Fuel Used | 0 (0.0%) | 0 (0.0%) |
| Total | 1,111 (100.0%) | 957 (100.0%) |
Household Vehicle Usage in Mineola
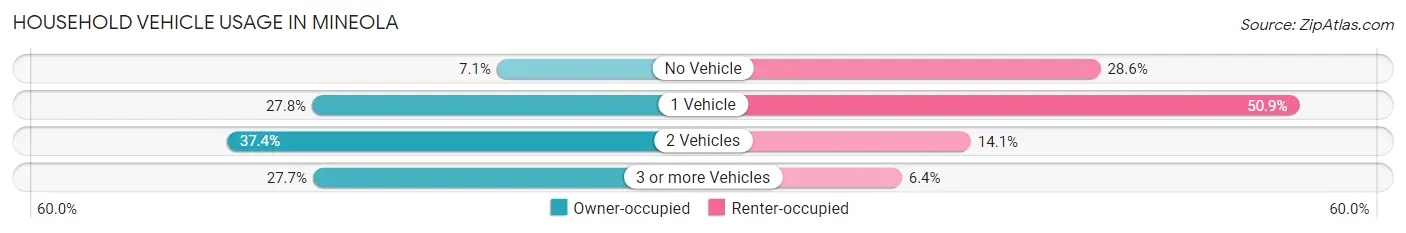
| Vehicles per Household | Owner-occupied | Renter-occupied |
| No Vehicle | 79 (7.1%) | 274 (28.6%) |
| 1 Vehicle | 309 (27.8%) | 487 (50.9%) |
| 2 Vehicles | 415 (37.3%) | 135 (14.1%) |
| 3 or more Vehicles | 308 (27.7%) | 61 (6.4%) |
| Total | 1,111 (100.0%) | 957 (100.0%) |
Real Estate & Mortgages in Mineola
Real Estate and Mortgage Overview in Mineola
| Characteristic | Without Mortgage | With Mortgage |
| Housing Units | 801 | 310 |
| Median Property Value | $114,800 | $116,500 |
| Median Household Income | $52,620 | $25 |
| Monthly Housing Costs | $463 | $0 |
| Real Estate Taxes | $1,532 | $17 |
Property Value by Mortgage Status in Mineola
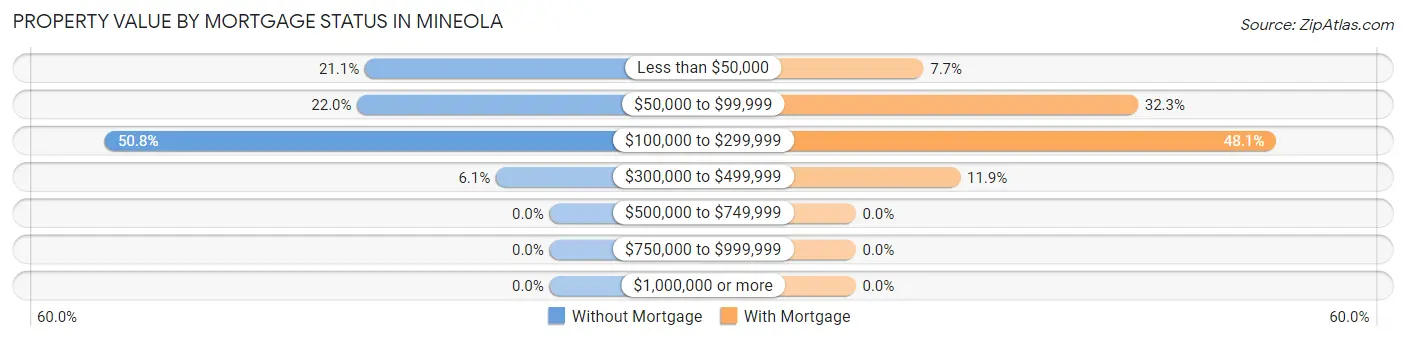
| Property Value | Without Mortgage | With Mortgage |
| Less than $50,000 | 169 (21.1%) | 24 (7.7%) |
| $50,000 to $99,999 | 176 (22.0%) | 100 (32.3%) |
| $100,000 to $299,999 | 407 (50.8%) | 149 (48.1%) |
| $300,000 to $499,999 | 49 (6.1%) | 37 (11.9%) |
| $500,000 to $749,999 | 0 (0.0%) | 0 (0.0%) |
| $750,000 to $999,999 | 0 (0.0%) | 0 (0.0%) |
| $1,000,000 or more | 0 (0.0%) | 0 (0.0%) |
| Total | 801 (100.0%) | 310 (100.0%) |
Household Income by Mortgage Status in Mineola
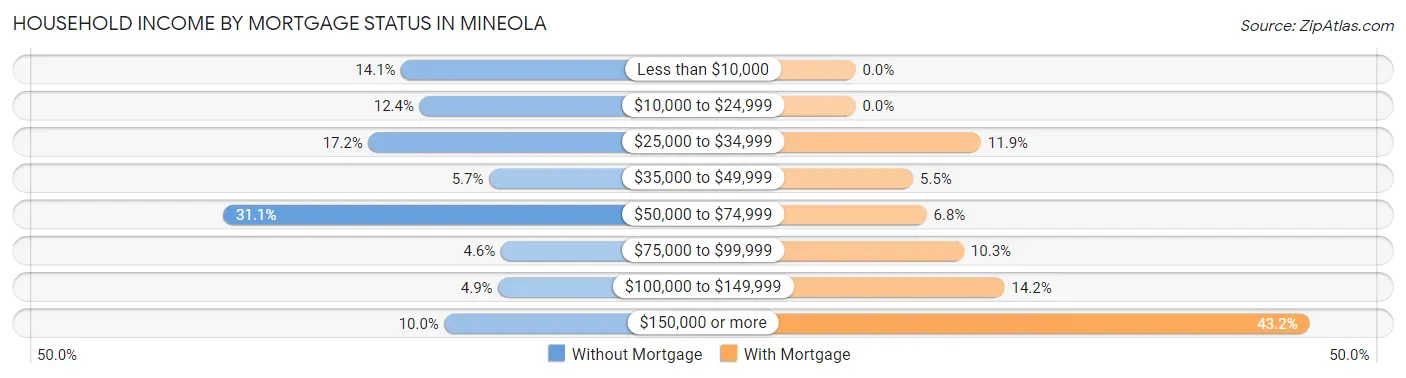
| Household Income | Without Mortgage | With Mortgage |
| Less than $10,000 | 113 (14.1%) | 0 (0.0%) |
| $10,000 to $24,999 | 99 (12.4%) | 0 (0.0%) |
| $25,000 to $34,999 | 138 (17.2%) | 37 (11.9%) |
| $35,000 to $49,999 | 46 (5.7%) | 17 (5.5%) |
| $50,000 to $74,999 | 249 (31.1%) | 21 (6.8%) |
| $75,000 to $99,999 | 37 (4.6%) | 32 (10.3%) |
| $100,000 to $149,999 | 39 (4.9%) | 44 (14.2%) |
| $150,000 or more | 80 (10.0%) | 134 (43.2%) |
| Total | 801 (100.0%) | 310 (100.0%) |
Property Value to Household Income Ratio in Mineola
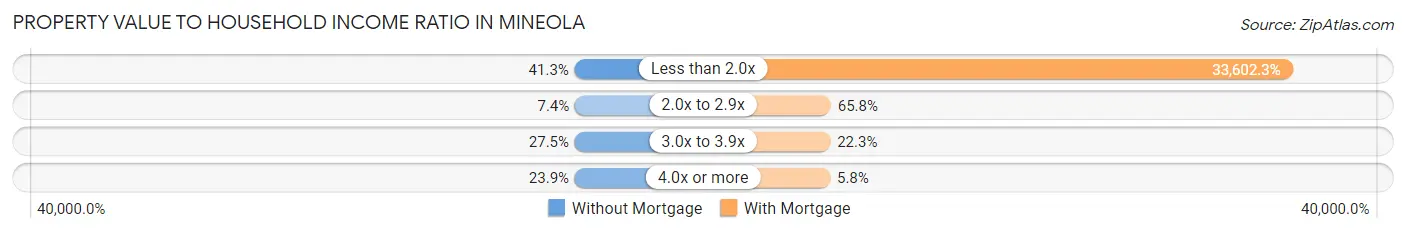
| Value-to-Income Ratio | Without Mortgage | With Mortgage |
| Less than 2.0x | 331 (41.3%) | 104,167 (33,602.3%) |
| 2.0x to 2.9x | 59 (7.4%) | 204 (65.8%) |
| 3.0x to 3.9x | 220 (27.5%) | 69 (22.3%) |
| 4.0x or more | 191 (23.8%) | 18 (5.8%) |
| Total | 801 (100.0%) | 310 (100.0%) |
Real Estate Taxes by Mortgage Status in Mineola
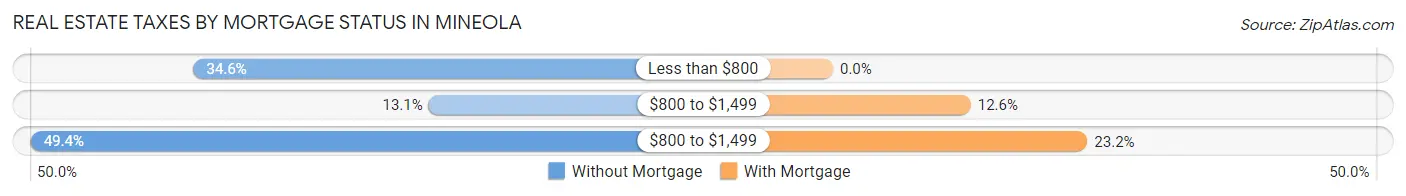
| Property Taxes | Without Mortgage | With Mortgage |
| Less than $800 | 277 (34.6%) | 0 (0.0%) |
| $800 to $1,499 | 105 (13.1%) | 39 (12.6%) |
| $800 to $1,499 | 396 (49.4%) | 72 (23.2%) |
| Total | 801 (100.0%) | 310 (100.0%) |
Health & Disability in Mineola
Health Insurance Coverage by Age in Mineola
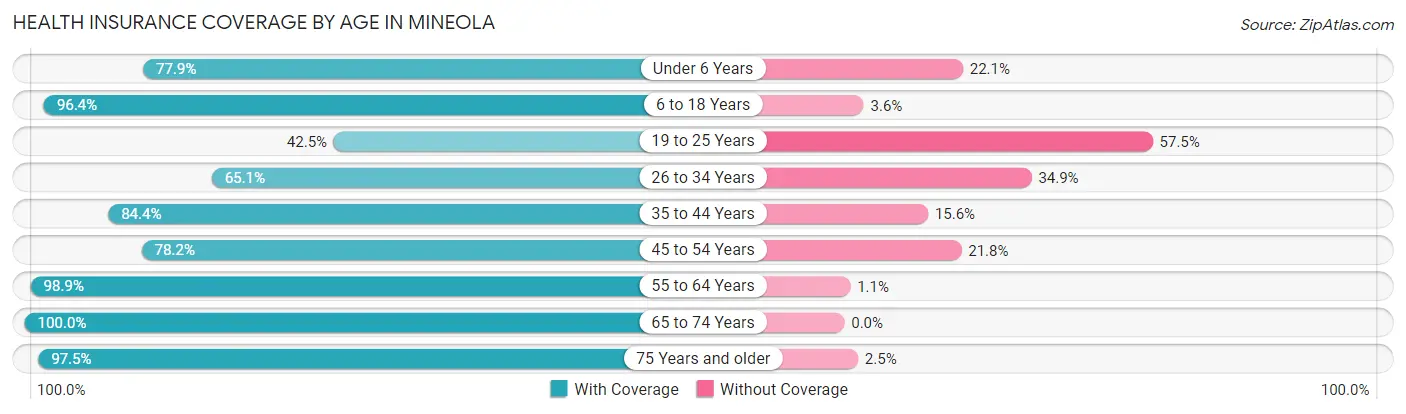
| Age Bracket | With Coverage | Without Coverage |
| Under 6 Years | 141 (77.9%) | 40 (22.1%) |
| 6 to 18 Years | 911 (96.4%) | 34 (3.6%) |
| 19 to 25 Years | 207 (42.5%) | 280 (57.5%) |
| 26 to 34 Years | 222 (65.1%) | 119 (34.9%) |
| 35 to 44 Years | 449 (84.4%) | 83 (15.6%) |
| 45 to 54 Years | 405 (78.2%) | 113 (21.8%) |
| 55 to 64 Years | 538 (98.9%) | 6 (1.1%) |
| 65 to 74 Years | 394 (100.0%) | 0 (0.0%) |
| 75 Years and older | 766 (97.5%) | 20 (2.5%) |
| Total | 4,033 (85.3%) | 695 (14.7%) |
Health Insurance Coverage by Citizenship Status in Mineola
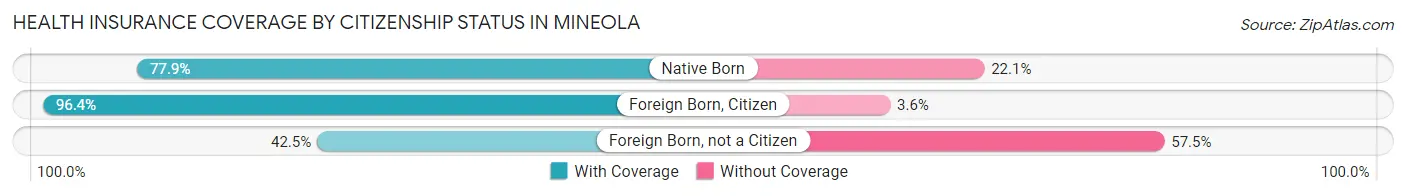
| Citizenship Status | With Coverage | Without Coverage |
| Native Born | 141 (77.9%) | 40 (22.1%) |
| Foreign Born, Citizen | 911 (96.4%) | 34 (3.6%) |
| Foreign Born, not a Citizen | 207 (42.5%) | 280 (57.5%) |
Health Insurance Coverage by Household Income in Mineola
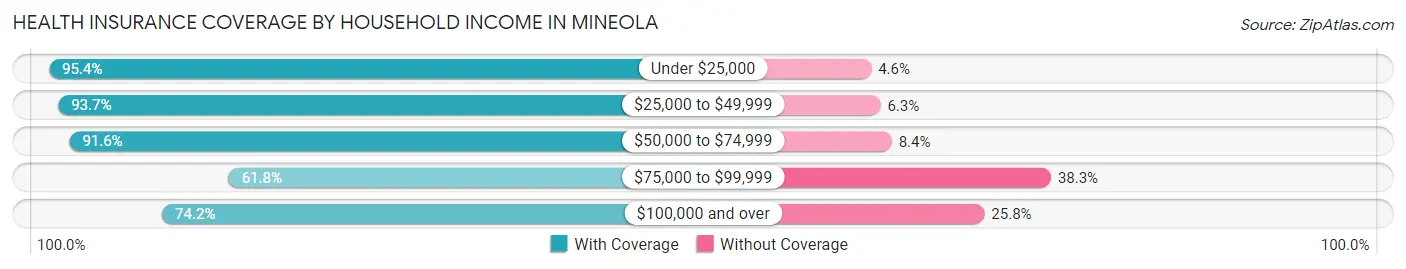
| Household Income | With Coverage | Without Coverage |
| Under $25,000 | 833 (95.4%) | 40 (4.6%) |
| $25,000 to $49,999 | 772 (93.7%) | 52 (6.3%) |
| $50,000 to $74,999 | 1,198 (91.6%) | 110 (8.4%) |
| $75,000 to $99,999 | 205 (61.8%) | 127 (38.3%) |
| $100,000 and over | 1,025 (74.2%) | 356 (25.8%) |
Public vs Private Health Insurance Coverage by Age in Mineola
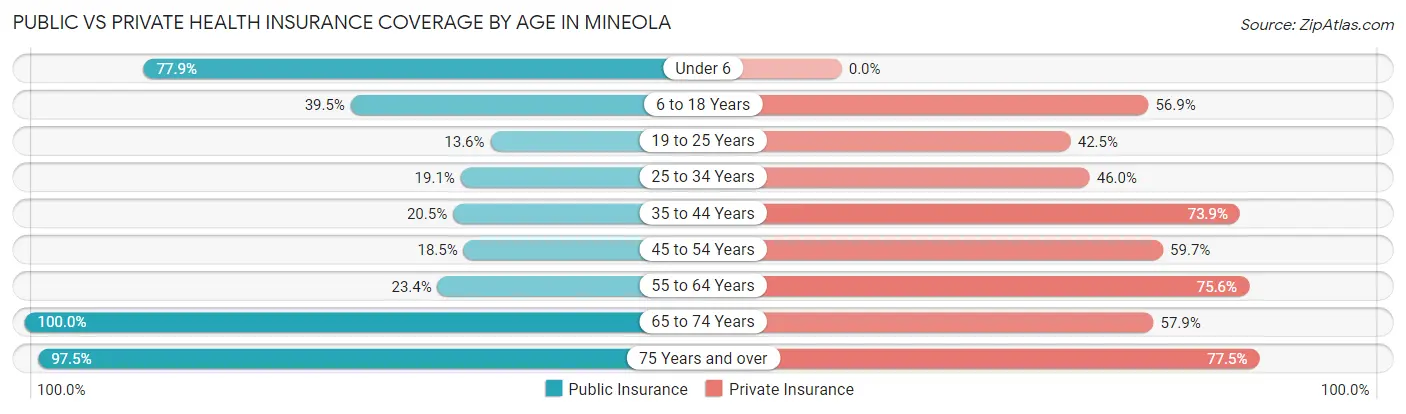
| Age Bracket | Public Insurance | Private Insurance |
| Under 6 | 141 (77.9%) | 0 (0.0%) |
| 6 to 18 Years | 373 (39.5%) | 538 (56.9%) |
| 19 to 25 Years | 66 (13.6%) | 207 (42.5%) |
| 25 to 34 Years | 65 (19.1%) | 157 (46.0%) |
| 35 to 44 Years | 109 (20.5%) | 393 (73.9%) |
| 45 to 54 Years | 96 (18.5%) | 309 (59.7%) |
| 55 to 64 Years | 127 (23.4%) | 411 (75.5%) |
| 65 to 74 Years | 394 (100.0%) | 228 (57.9%) |
| 75 Years and over | 766 (97.5%) | 609 (77.5%) |
| Total | 2,137 (45.2%) | 2,852 (60.3%) |
Disability Status by Sex by Age in Mineola
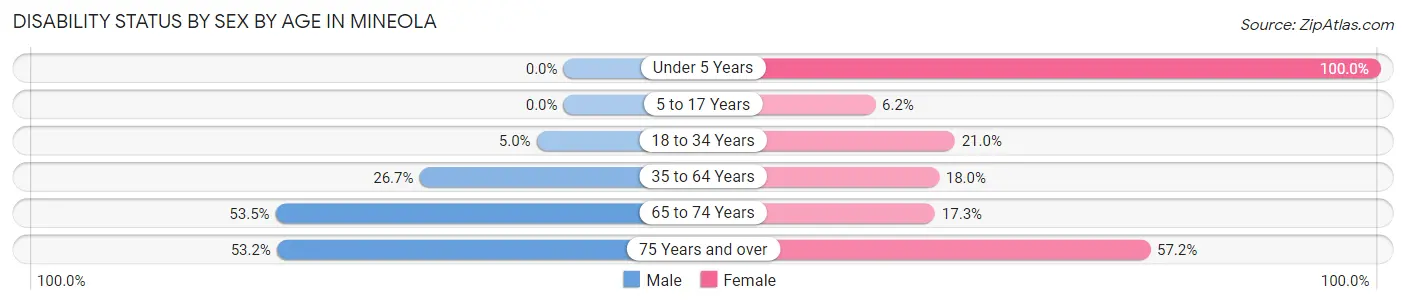
| Age Bracket | Male | Female |
| Under 5 Years | 0 (0.0%) | 28 (100.0%) |
| 5 to 17 Years | 0 (0.0%) | 27 (6.2%) |
| 18 to 34 Years | 24 (5.0%) | 83 (21.0%) |
| 35 to 64 Years | 196 (26.7%) | 155 (18.0%) |
| 65 to 74 Years | 124 (53.4%) | 28 (17.3%) |
| 75 Years and over | 116 (53.2%) | 325 (57.2%) |
Disability Class by Sex by Age in Mineola
Disability Class: Hearing Difficulty
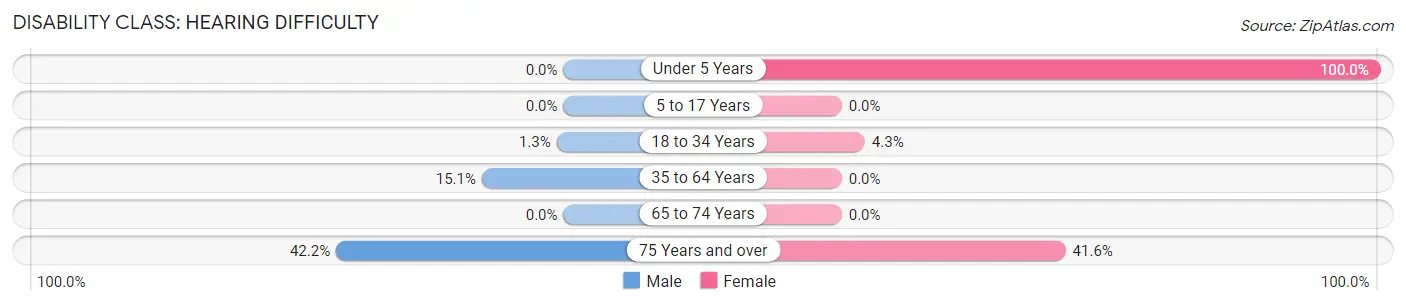
| Age Bracket | Male | Female |
| Under 5 Years | 0 (0.0%) | 28 (100.0%) |
| 5 to 17 Years | 0 (0.0%) | 0 (0.0%) |
| 18 to 34 Years | 6 (1.3%) | 17 (4.3%) |
| 35 to 64 Years | 111 (15.1%) | 0 (0.0%) |
| 65 to 74 Years | 0 (0.0%) | 0 (0.0%) |
| 75 Years and over | 92 (42.2%) | 236 (41.5%) |
Disability Class: Vision Difficulty
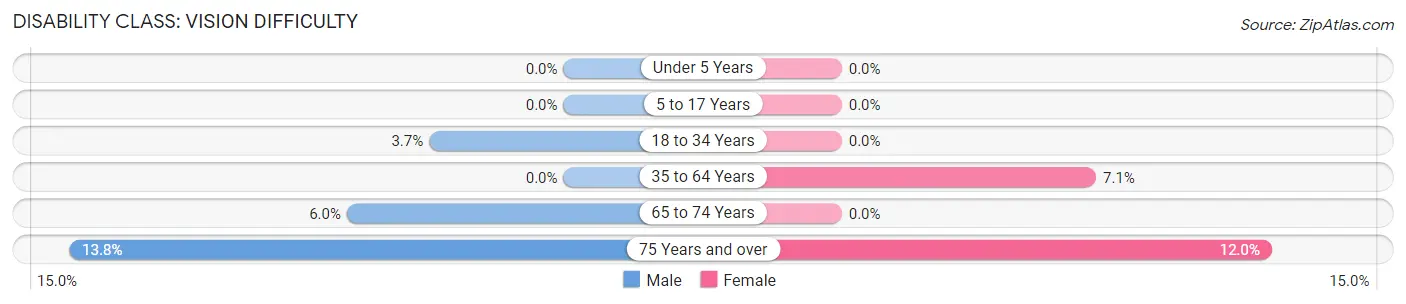
| Age Bracket | Male | Female |
| Under 5 Years | 0 (0.0%) | 0 (0.0%) |
| 5 to 17 Years | 0 (0.0%) | 0 (0.0%) |
| 18 to 34 Years | 18 (3.7%) | 0 (0.0%) |
| 35 to 64 Years | 0 (0.0%) | 61 (7.1%) |
| 65 to 74 Years | 14 (6.0%) | 0 (0.0%) |
| 75 Years and over | 30 (13.8%) | 68 (12.0%) |
Disability Class: Cognitive Difficulty
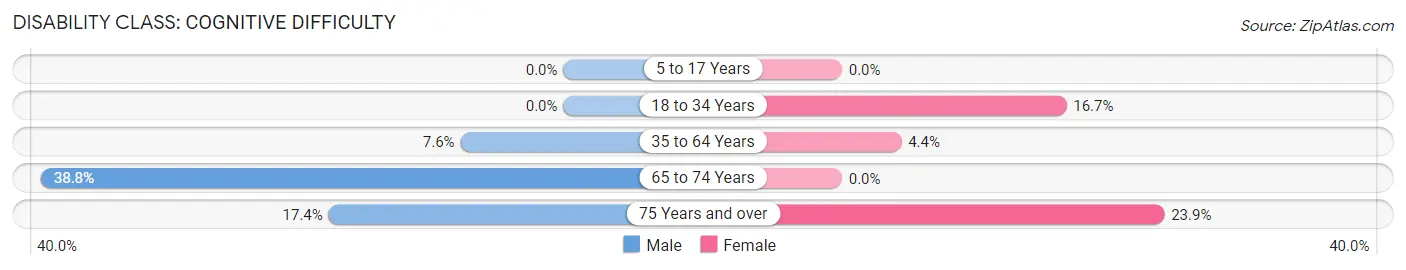
| Age Bracket | Male | Female |
| 5 to 17 Years | 0 (0.0%) | 0 (0.0%) |
| 18 to 34 Years | 0 (0.0%) | 66 (16.7%) |
| 35 to 64 Years | 56 (7.6%) | 38 (4.4%) |
| 65 to 74 Years | 90 (38.8%) | 0 (0.0%) |
| 75 Years and over | 38 (17.4%) | 136 (23.9%) |
Disability Class: Ambulatory Difficulty
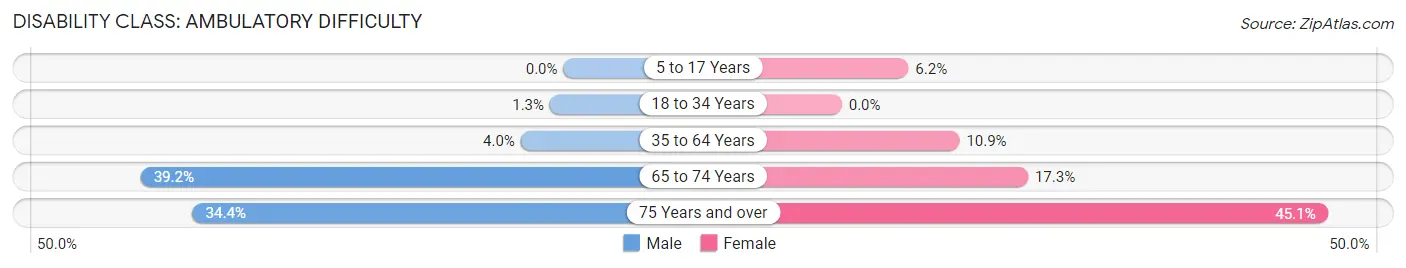
| Age Bracket | Male | Female |
| 5 to 17 Years | 0 (0.0%) | 27 (6.2%) |
| 18 to 34 Years | 6 (1.3%) | 0 (0.0%) |
| 35 to 64 Years | 29 (4.0%) | 94 (10.9%) |
| 65 to 74 Years | 91 (39.2%) | 28 (17.3%) |
| 75 Years and over | 75 (34.4%) | 256 (45.1%) |
Disability Class: Self-Care Difficulty
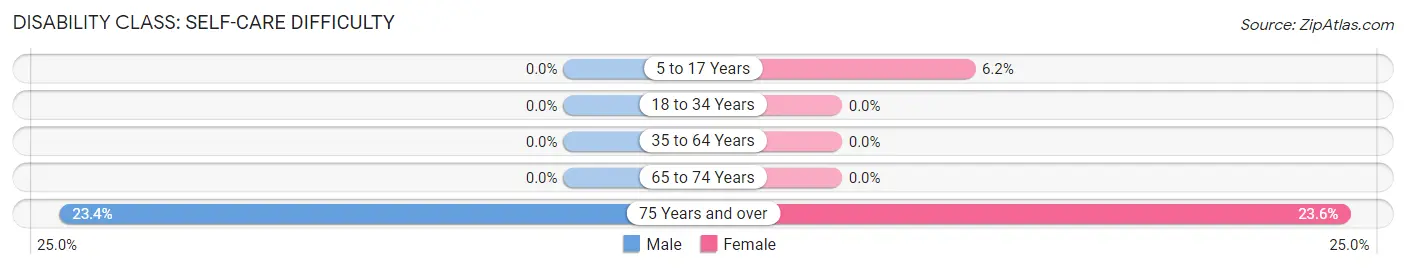
| Age Bracket | Male | Female |
| 5 to 17 Years | 0 (0.0%) | 27 (6.2%) |
| 18 to 34 Years | 0 (0.0%) | 0 (0.0%) |
| 35 to 64 Years | 0 (0.0%) | 0 (0.0%) |
| 65 to 74 Years | 0 (0.0%) | 0 (0.0%) |
| 75 Years and over | 51 (23.4%) | 134 (23.6%) |
Technology Access in Mineola
Computing Device Access in Mineola
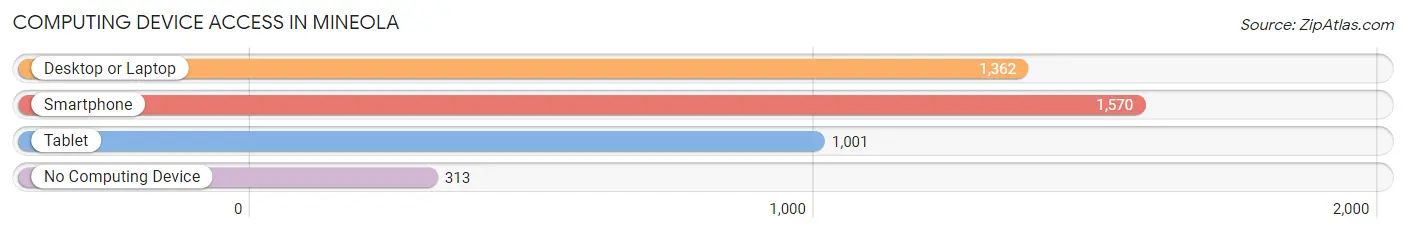
| Device Type | # Households | % Households |
| Desktop or Laptop | 1,362 | 65.9% |
| Smartphone | 1,570 | 75.9% |
| Tablet | 1,001 | 48.4% |
| No Computing Device | 313 | 15.1% |
| Total | 2,068 | 100.0% |
Internet Access in Mineola
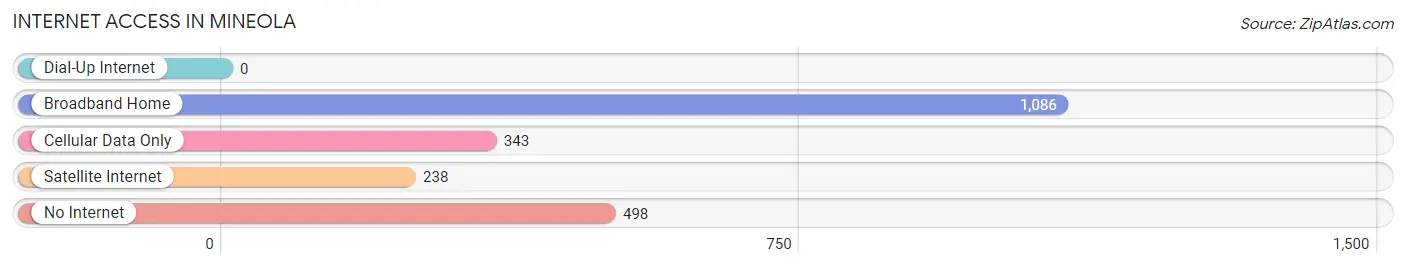
| Internet Type | # Households | % Households |
| Dial-Up Internet | 0 | 0.0% |
| Broadband Home | 1,086 | 52.5% |
| Cellular Data Only | 343 | 16.6% |
| Satellite Internet | 238 | 11.5% |
| No Internet | 498 | 24.1% |
| Total | 2,068 | 100.0% |
Mineola Summary
History
The city of Mineola, Texas is located in Wood County, Texas, and is the county seat. The city was founded in 1873 and was named after the daughter of a railroad official. The city was originally a stop on the Texas and Pacific Railway, and the city was incorporated in 1875.
The city of Mineola has a rich history that dates back to the early 1800s. The area was originally inhabited by the Caddo Indians, who were later displaced by settlers from the United States. The first settlers in the area were the families of William and John B. Moore, who arrived in 1845. The Moores were followed by other settlers, including the families of William and John B. Moore, who arrived in 1845.
The city of Mineola was officially established in 1873, when the Texas and Pacific Railway was built through the area. The city was named after the daughter of a railroad official, and the city was incorporated in 1875.
The city of Mineola has a long and interesting history. During the Civil War, the city was the site of a Confederate camp, and the city was also the site of a major battle between Union and Confederate forces in 1864. The city was also the site of a major battle between Union and Confederate forces in 1864.
The city of Mineola has also been the site of several major events in Texas history. In 1876, the city was the site of the first Texas State Fair, and in 1877, the city was the site of the first Texas State Fair. In 1878, the city was the site of the first Texas State Fair.
The city of Mineola has also been the site of several major events in Texas history. In 1876, the city was the site of the first Texas State Fair, and in 1877, the city was the site of the first Texas State Fair. In 1878, the city was the site of the first Texas State Fair.
In the late 19th century, the city of Mineola was a major center of the cotton industry. The city was also the site of several major cotton mills, and the city was also the site of several major cotton mills.
The city of Mineola has also been the site of several major events in Texas history. In 1876, the city was the site of the first Texas State Fair, and in 1877, the city was the site of the first Texas State Fair. In 1878, the city was the site of the first Texas State Fair.
Geography
Mineola is located in Wood County, Texas, and is the county seat. The city is situated in the eastern part of the state, and is located about 75 miles east of Dallas. The city is located on the banks of the Sabine River, and is surrounded by rolling hills and forests. The city has a total area of 4.3 square miles, and has a population of 5,000 people.
The city of Mineola is located in a humid subtropical climate zone, and has hot summers and mild winters. The average temperature in the summer is around 90 degrees Fahrenheit, and the average temperature in the winter is around 50 degrees Fahrenheit. The city receives an average of 40 inches of rain per year.
Economy
The economy of Mineola is largely based on agriculture and manufacturing. The city is home to several large agricultural operations, including cotton, corn, and soybean farms. The city is also home to several large manufacturing companies, including a paper mill, a furniture factory, and a plastics factory.
The city of Mineola is also home to several small businesses, including restaurants, retail stores, and service providers. The city is also home to several small businesses, including restaurants, retail stores, and service providers.
Demographics
The population of Mineola is 5,000 people, and the city has a population density of 1,200 people per square mile. The city is predominantly white, with a population that is approximately 85% white. The city also has a large Hispanic population, with a population that is approximately 15% Hispanic. The median household income in the city is $35,000, and the median home value is $90,000. The city has a poverty rate of 15%, and the unemployment rate is 5%.
Common Questions
What is Per Capita Income in Mineola?
Per Capita income in Mineola is $36,240.
What is the Median Family Income in Mineola?
Median Family Income in Mineola is $71,541.
What is the Median Household income in Mineola?
Median Household Income in Mineola is $42,147.
What is Income or Wage Gap in Mineola?
Income or Wage Gap in Mineola is 41.1%.
Women in Mineola earn 58.9 cents for every dollar earned by a man.
What is Family Income Deficit in Mineola?
Family Income Deficit in Mineola is $7,659.
Families that are below poverty line in Mineola earn $7,659 less on average than the poverty threshold level.
What is Inequality or Gini Index in Mineola?
Inequality or Gini Index in Mineola is 0.61.
What is the Total Population of Mineola?
Total Population of Mineola is 4,879.
What is the Total Male Population of Mineola?
Total Male Population of Mineola is 2,345.
What is the Total Female Population of Mineola?
Total Female Population of Mineola is 2,534.
What is the Ratio of Males per 100 Females in Mineola?
There are 92.54 Males per 100 Females in Mineola.
What is the Ratio of Females per 100 Males in Mineola?
There are 108.06 Females per 100 Males in Mineola.
What is the Median Population Age in Mineola?
Median Population Age in Mineola is 43.3 Years.
What is the Average Family Size in Mineola
Average Family Size in Mineola is 3.5 People.
What is the Average Household Size in Mineola
Average Household Size in Mineola is 2.3 People.
How Large is the Labor Force in Mineola?
There are 2,031 People in the Labor Forcein in Mineola.
What is the Percentage of People in the Labor Force in Mineola?
52.4% of People are in the Labor Force in Mineola.
What is the Unemployment Rate in Mineola?
Unemployment Rate in Mineola is 5.7%.