Milano, TX Map & Demographics
Milano Map
Milano Overview
$39,480
PER CAPITA INCOME
$69,123
AVG FAMILY INCOME
$68,003
AVG HOUSEHOLD INCOME
25.8%
WAGE / INCOME GAP [ % ]
74.2¢/ $1
WAGE / INCOME GAP [ $ ]
0.51
INEQUALITY / GINI INDEX
608
TOTAL POPULATION
446
MALE POPULATION
162
FEMALE POPULATION
275.31
MALES / 100 FEMALES
36.32
FEMALES / 100 MALES
32.1
MEDIAN AGE
3.1
AVG FAMILY SIZE
2.5
AVG HOUSEHOLD SIZE
358
LABOR FORCE [ PEOPLE ]
73.1%
PERCENT IN LABOR FORCE
1.7%
UNEMPLOYMENT RATE
Milano Zip Codes
Milano Area Codes
Income in Milano
Income Overview in Milano
Per Capita Income in Milano is $39,480, while median incomes of families and households are $69,123 and $68,003 respectively.
| Characteristic | Number | Measure |
| Per Capita Income | 608 | $39,480 |
| Median Family Income | 170 | $69,123 |
| Mean Family Income | 170 | $121,354 |
| Median Household Income | 239 | $68,003 |
| Mean Household Income | 239 | $94,135 |
| Income Deficit | 170 | $0 |
| Wage / Income Gap (%) | 608 | 25.84% |
| Wage / Income Gap ($) | 608 | 74.16¢ per $1 |
| Gini / Inequality Index | 608 | 0.51 |
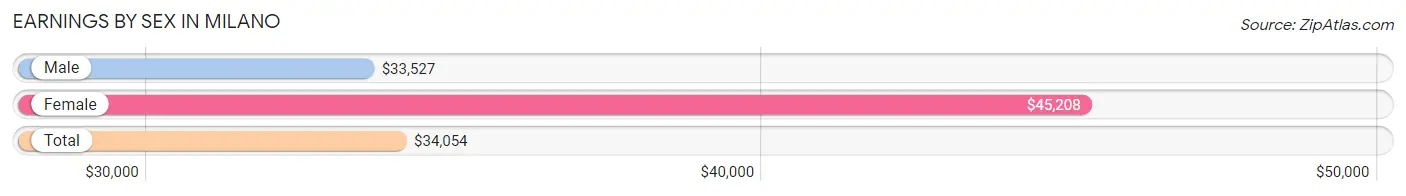
Earnings by Sex in Milano
Average Earnings in Milano are $34,054, $33,527 for men and $45,208 for women, a difference of 25.8%.
| Sex | Number | Average Earnings |
| Male | 287 (79.3%) | $33,527 |
| Female | 75 (20.7%) | $45,208 |
| Total | 362 (100.0%) | $34,054 |
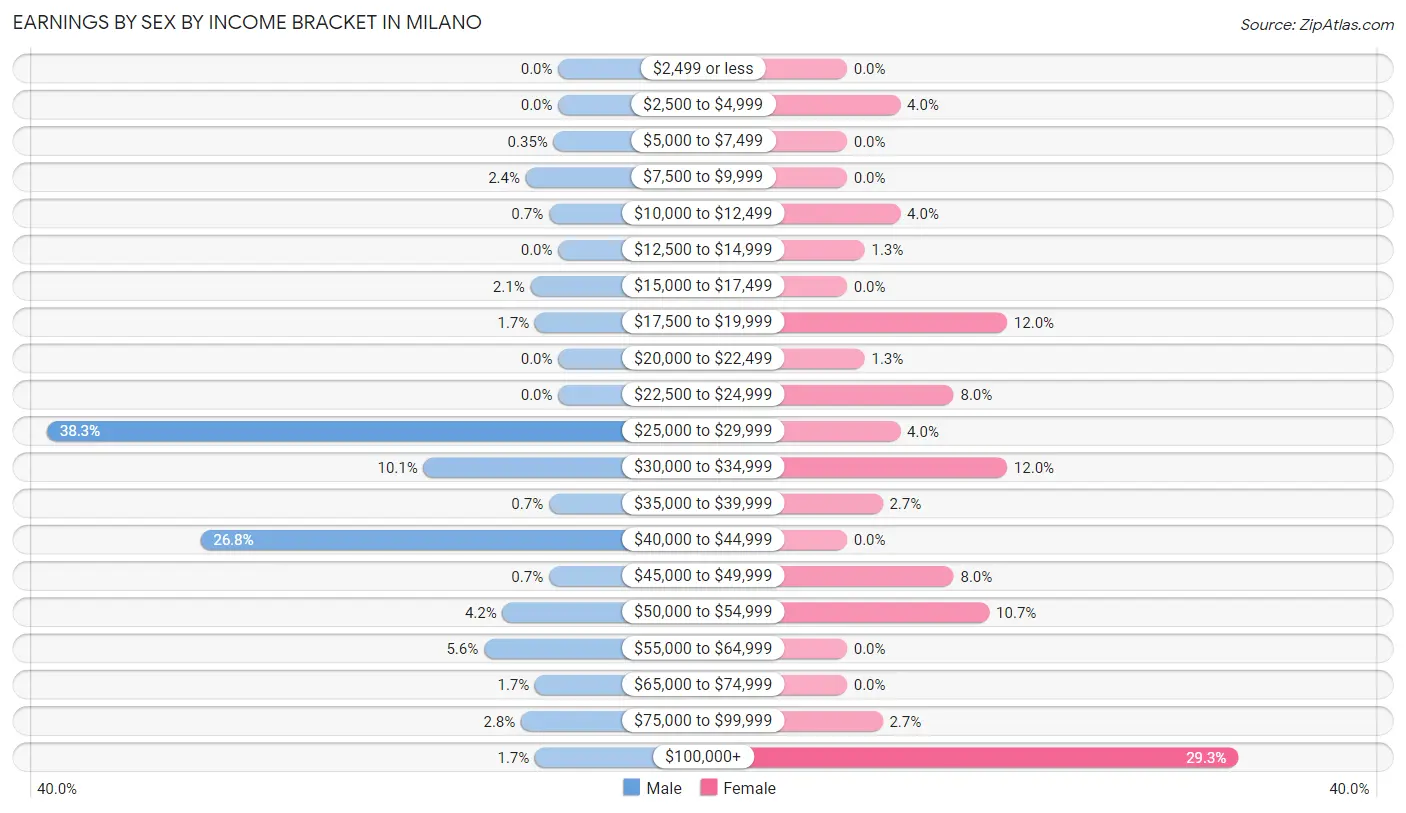
Earnings by Sex by Income Bracket in Milano
The most common earnings brackets in Milano are $25,000 to $29,999 for men (110 | 38.3%) and $100,000+ for women (22 | 29.3%).
| Income | Male | Female |
| $2,499 or less | 0 (0.0%) | 0 (0.0%) |
| $2,500 to $4,999 | 0 (0.0%) | 3 (4.0%) |
| $5,000 to $7,499 | 1 (0.4%) | 0 (0.0%) |
| $7,500 to $9,999 | 7 (2.4%) | 0 (0.0%) |
| $10,000 to $12,499 | 2 (0.7%) | 3 (4.0%) |
| $12,500 to $14,999 | 0 (0.0%) | 1 (1.3%) |
| $15,000 to $17,499 | 6 (2.1%) | 0 (0.0%) |
| $17,500 to $19,999 | 5 (1.7%) | 9 (12.0%) |
| $20,000 to $22,499 | 0 (0.0%) | 1 (1.3%) |
| $22,500 to $24,999 | 0 (0.0%) | 6 (8.0%) |
| $25,000 to $29,999 | 110 (38.3%) | 3 (4.0%) |
| $30,000 to $34,999 | 29 (10.1%) | 9 (12.0%) |
| $35,000 to $39,999 | 2 (0.7%) | 2 (2.7%) |
| $40,000 to $44,999 | 77 (26.8%) | 0 (0.0%) |
| $45,000 to $49,999 | 2 (0.7%) | 6 (8.0%) |
| $50,000 to $54,999 | 12 (4.2%) | 8 (10.7%) |
| $55,000 to $64,999 | 16 (5.6%) | 0 (0.0%) |
| $65,000 to $74,999 | 5 (1.7%) | 0 (0.0%) |
| $75,000 to $99,999 | 8 (2.8%) | 2 (2.7%) |
| $100,000+ | 5 (1.7%) | 22 (29.3%) |
| Total | 287 (100.0%) | 75 (100.0%) |
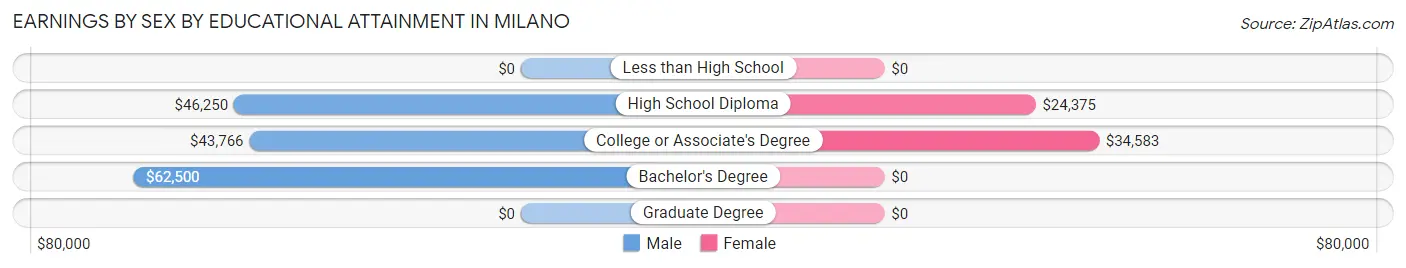
Earnings by Sex by Educational Attainment in Milano
Average earnings in Milano are $43,880 for men and $45,833 for women, a difference of 4.3%. Men with an educational attainment of bachelor's degree enjoy the highest average annual earnings of $62,500, while those with college or associate's degree education earn the least with $43,766. Women with an educational attainment of college or associate's degree earn the most with the average annual earnings of $34,583, while those with high school diploma education have the smallest earnings of $24,375.
| Educational Attainment | Male Income | Female Income |
| Less than High School | - | - |
| High School Diploma | $46,250 | $24,375 |
| College or Associate's Degree | $43,766 | $34,583 |
| Bachelor's Degree | $62,500 | $0 |
| Graduate Degree | - | - |
| Total | $43,880 | $45,833 |
Family Income in Milano
Family Income Brackets in Milano
According to the Milano family income data, there are 97 families falling into the $50,000 to $74,999 income range, which is the most common income bracket and makes up 57.1% of all families.
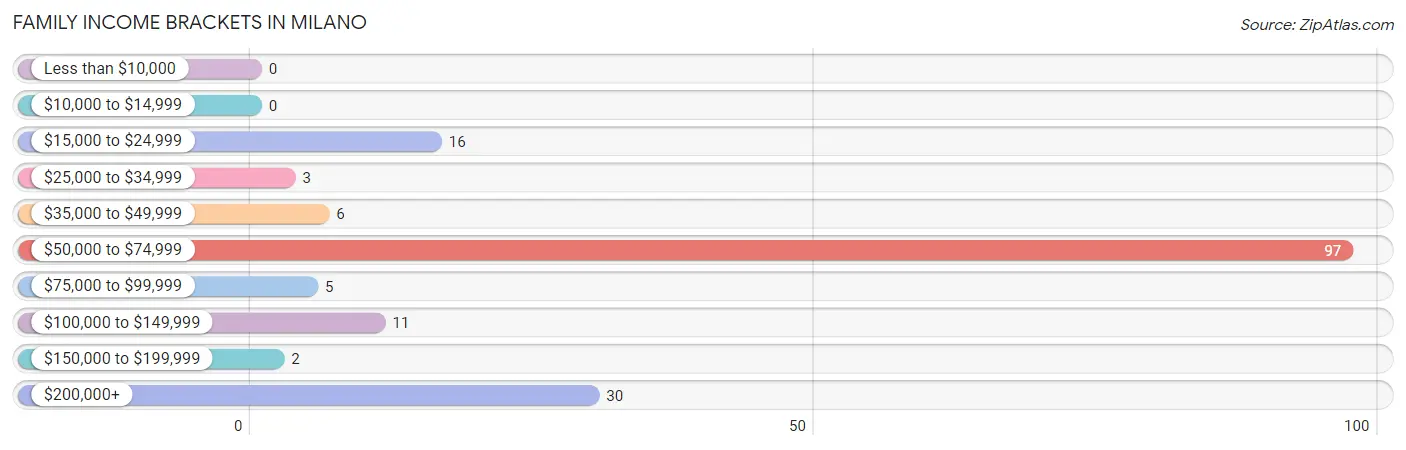
| Income Bracket | # Families | % Families |
| Less than $10,000 | 0 | 0.0% |
| $10,000 to $14,999 | 0 | 0.0% |
| $15,000 to $24,999 | 16 | 9.4% |
| $25,000 to $34,999 | 3 | 1.8% |
| $35,000 to $49,999 | 6 | 3.5% |
| $50,000 to $74,999 | 97 | 57.1% |
| $75,000 to $99,999 | 5 | 2.9% |
| $100,000 to $149,999 | 11 | 6.5% |
| $150,000 to $199,999 | 2 | 1.2% |
| $200,000+ | 30 | 17.6% |
Family Income by Famaliy Size in Milano
2-person families (102 | 60.0%) account for the highest median family income in Milano with $68,701 per family, while 2-person families (102 | 60.0%) have the highest median income of $34,350 per family member.
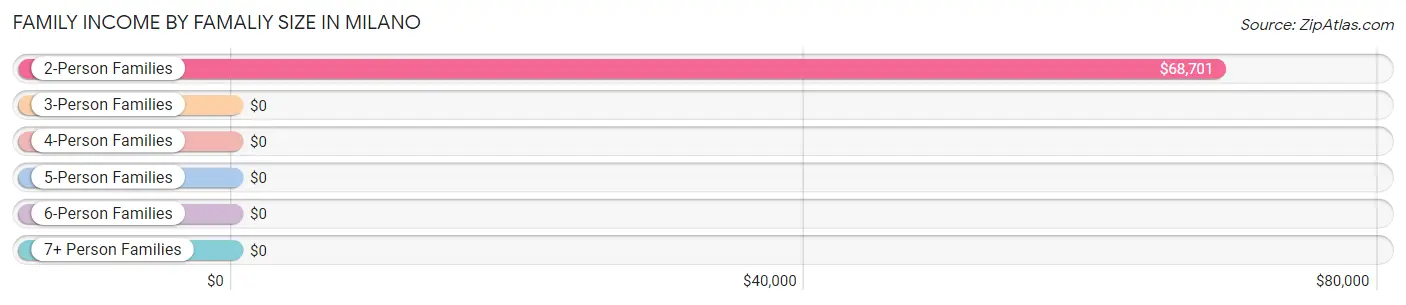
| Income Bracket | # Families | Median Income |
| 2-Person Families | 102 (60.0%) | $68,701 |
| 3-Person Families | 46 (27.1%) | $0 |
| 4-Person Families | 5 (2.9%) | $0 |
| 5-Person Families | 10 (5.9%) | $0 |
| 6-Person Families | 4 (2.4%) | $0 |
| 7+ Person Families | 3 (1.8%) | $0 |
| Total | 170 (100.0%) | $69,123 |
Family Income by Number of Earners in Milano
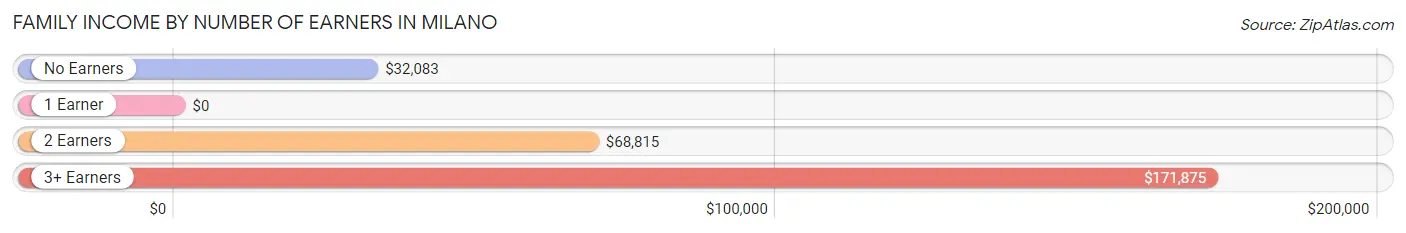
| Number of Earners | # Families | Median Income |
| No Earners | 9 (5.3%) | $32,083 |
| 1 Earner | 51 (30.0%) | $0 |
| 2 Earners | 105 (61.8%) | $68,815 |
| 3+ Earners | 5 (2.9%) | $171,875 |
| Total | 170 (100.0%) | $69,123 |
Household Income in Milano
Household Income Brackets in Milano
With 108 households falling in the category, the $50,000 to $74,999 income range is the most frequent in Milano, accounting for 45.2% of all households. In contrast, only 2 households (0.8%) fall into the $150,000 to $199,999 income bracket, making it the least populous group.
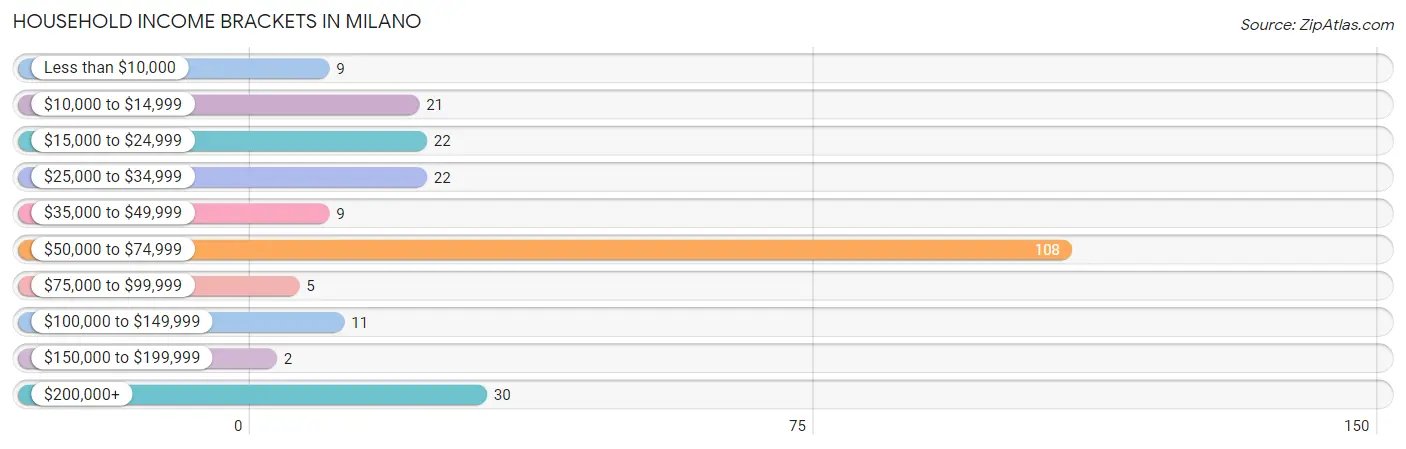
| Income Bracket | # Households | % Households |
| Less than $10,000 | 9 | 3.8% |
| $10,000 to $14,999 | 21 | 8.8% |
| $15,000 to $24,999 | 22 | 9.2% |
| $25,000 to $34,999 | 22 | 9.2% |
| $35,000 to $49,999 | 9 | 3.8% |
| $50,000 to $74,999 | 108 | 45.2% |
| $75,000 to $99,999 | 5 | 2.1% |
| $100,000 to $149,999 | 11 | 4.6% |
| $150,000 to $199,999 | 2 | 0.8% |
| $200,000+ | 30 | 12.6% |
Household Income by Householder Age in Milano
The median household income in Milano is $68,003, with the highest median household income of $68,912 found in the 45 to 64 years age bracket for the primary householder. A total of 135 households (56.5%) fall into this category. Meanwhile, the 15 to 24 years age bracket for the primary householder has the lowest median household income of $0, with 8 households (3.4%) in this group.
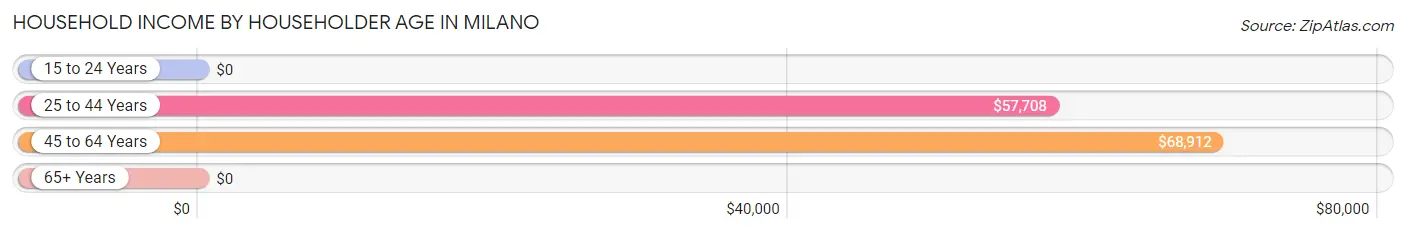
| Income Bracket | # Households | Median Income |
| 15 to 24 Years | 8 (3.4%) | $0 |
| 25 to 44 Years | 43 (18.0%) | $57,708 |
| 45 to 64 Years | 135 (56.5%) | $68,912 |
| 65+ Years | 53 (22.2%) | $0 |
| Total | 239 (100.0%) | $68,003 |
Poverty in Milano
Income Below Poverty by Sex and Age in Milano
With 7.4% poverty level for males and 18.5% for females among the residents of Milano, 65 to 74 year old males and 16 and 17 year old females are the most vulnerable to poverty, with 19 males (45.2%) and 6 females (100.0%) in their respective age groups living below the poverty level.
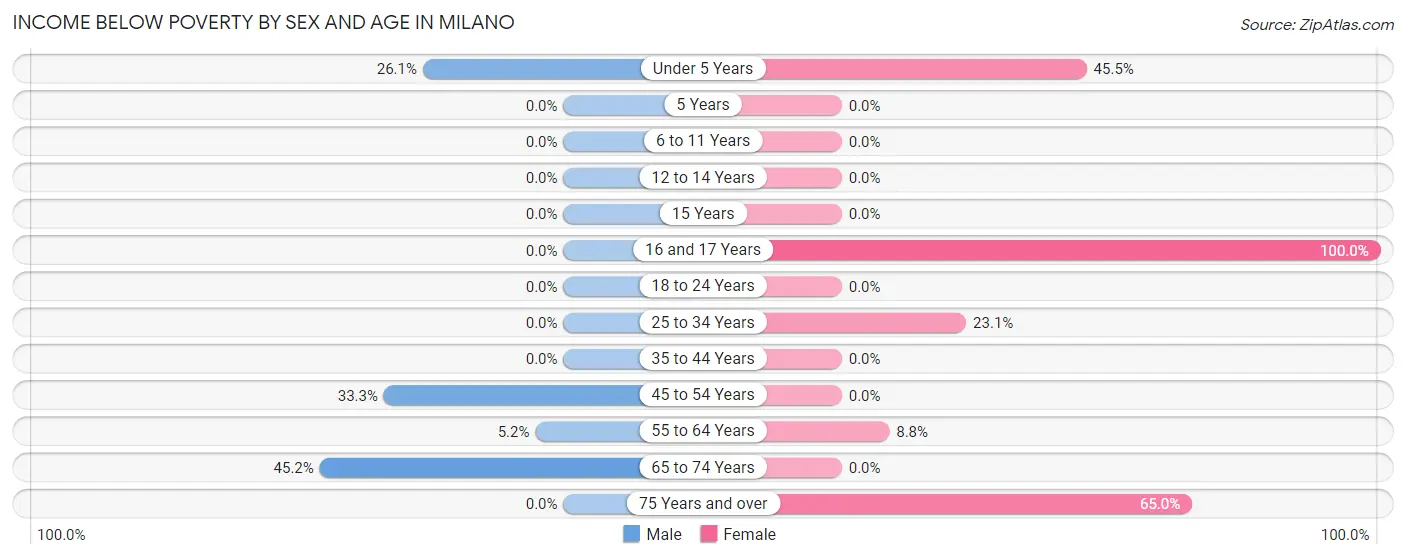
| Age Bracket | Male | Female |
| Under 5 Years | 6 (26.1%) | 5 (45.5%) |
| 5 Years | 0 (0.0%) | 0 (0.0%) |
| 6 to 11 Years | 0 (0.0%) | 0 (0.0%) |
| 12 to 14 Years | 0 (0.0%) | 0 (0.0%) |
| 15 Years | 0 (0.0%) | 0 (0.0%) |
| 16 and 17 Years | 0 (0.0%) | 6 (100.0%) |
| 18 to 24 Years | 0 (0.0%) | 0 (0.0%) |
| 25 to 34 Years | 0 (0.0%) | 3 (23.1%) |
| 35 to 44 Years | 0 (0.0%) | 0 (0.0%) |
| 45 to 54 Years | 3 (33.3%) | 0 (0.0%) |
| 55 to 64 Years | 5 (5.2%) | 3 (8.8%) |
| 65 to 74 Years | 19 (45.2%) | 0 (0.0%) |
| 75 Years and over | 0 (0.0%) | 13 (65.0%) |
| Total | 33 (7.4%) | 30 (18.5%) |
Income Above Poverty by Sex and Age in Milano
According to the poverty statistics in Milano, males aged 6 to 11 years and females aged 5 years are the age groups that are most secure financially, with 100.0% of males and 100.0% of females in these age groups living above the poverty line.
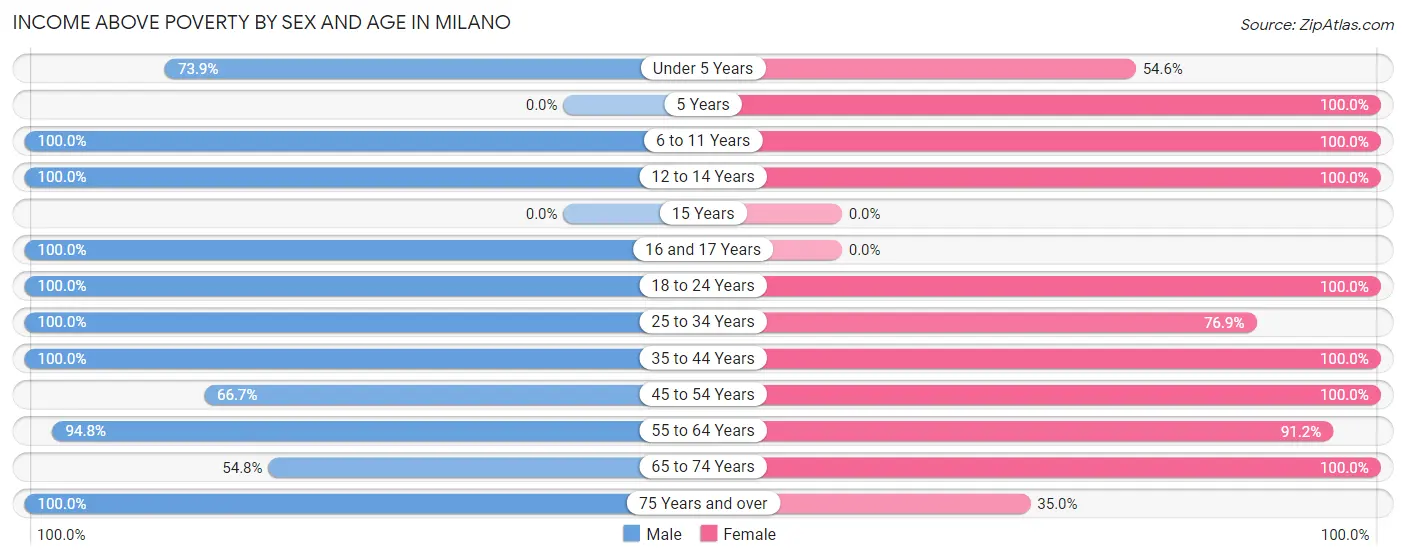
| Age Bracket | Male | Female |
| Under 5 Years | 17 (73.9%) | 6 (54.5%) |
| 5 Years | 0 (0.0%) | 4 (100.0%) |
| 6 to 11 Years | 67 (100.0%) | 2 (100.0%) |
| 12 to 14 Years | 8 (100.0%) | 3 (100.0%) |
| 15 Years | 0 (0.0%) | 0 (0.0%) |
| 16 and 17 Years | 10 (100.0%) | 0 (0.0%) |
| 18 to 24 Years | 122 (100.0%) | 14 (100.0%) |
| 25 to 34 Years | 30 (100.0%) | 10 (76.9%) |
| 35 to 44 Years | 35 (100.0%) | 20 (100.0%) |
| 45 to 54 Years | 6 (66.7%) | 31 (100.0%) |
| 55 to 64 Years | 91 (94.8%) | 31 (91.2%) |
| 65 to 74 Years | 23 (54.8%) | 4 (100.0%) |
| 75 Years and over | 4 (100.0%) | 7 (35.0%) |
| Total | 413 (92.6%) | 132 (81.5%) |
Income Below Poverty Among Married-Couple Families in Milano
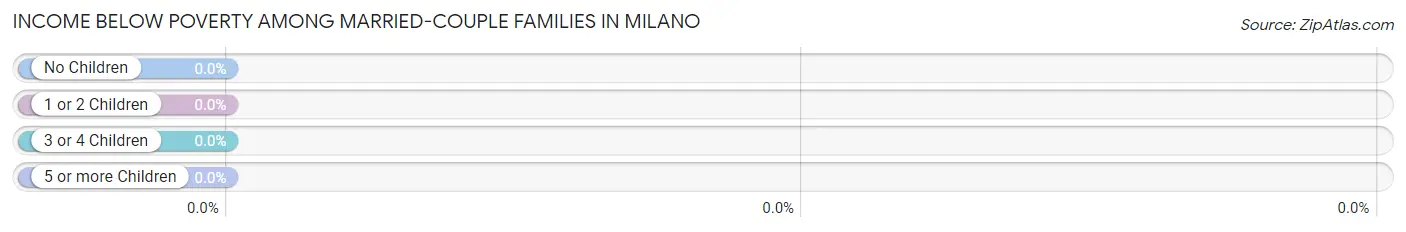
| Children | Above Poverty | Below Poverty |
| No Children | 29 (100.0%) | 0 (0.0%) |
| 1 or 2 Children | 23 (100.0%) | 0 (0.0%) |
| 3 or 4 Children | 6 (100.0%) | 0 (0.0%) |
| 5 or more Children | 3 (100.0%) | 0 (0.0%) |
| Total | 61 (100.0%) | 0 (0.0%) |
Income Below Poverty Among Single-Parent Households in Milano
According to the poverty data in Milano, 6.1% or 5 single-father households and 7.4% or 2 single-mother households are living below the poverty line. Among single-father households, those with 3 or 4 children have the highest poverty rate, with 5 households (100.0%) experiencing poverty. Likewise, among single-mother households, those with no children have the highest poverty rate, with 2 households (40.0%) falling below the poverty line.
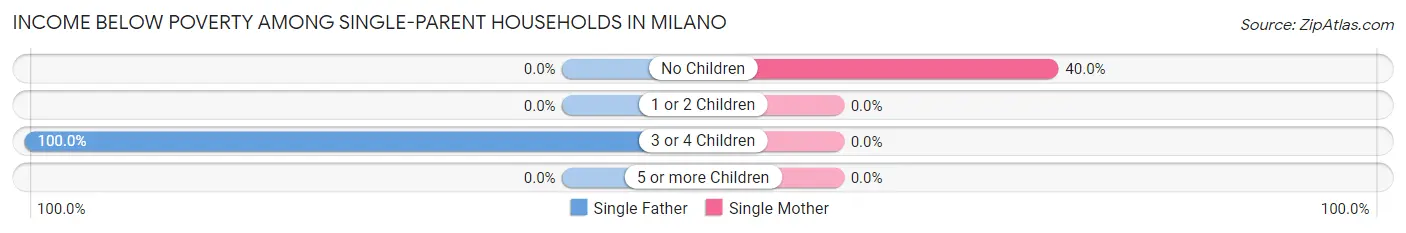
| Children | Single Father | Single Mother |
| No Children | 0 (0.0%) | 2 (40.0%) |
| 1 or 2 Children | 0 (0.0%) | 0 (0.0%) |
| 3 or 4 Children | 5 (100.0%) | 0 (0.0%) |
| 5 or more Children | 0 (0.0%) | 0 (0.0%) |
| Total | 5 (6.1%) | 2 (7.4%) |
Income Below Poverty Among Married-Couple vs Single-Parent Households in Milano
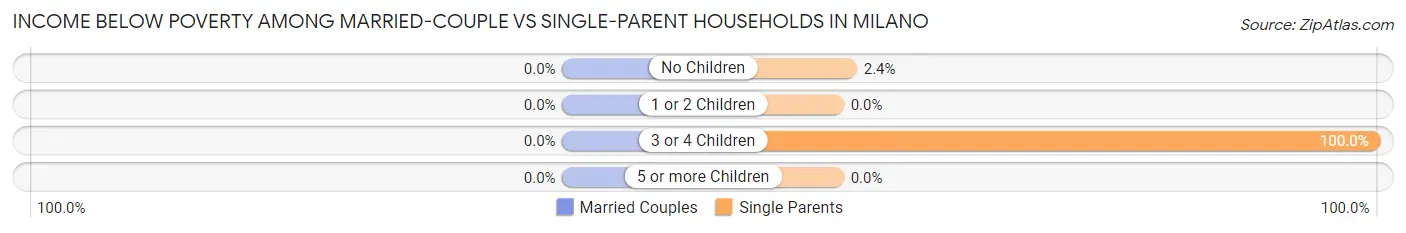
| Children | Married-Couple Families | Single-Parent Households |
| No Children | 0 (0.0%) | 2 (2.4%) |
| 1 or 2 Children | 0 (0.0%) | 0 (0.0%) |
| 3 or 4 Children | 0 (0.0%) | 5 (100.0%) |
| 5 or more Children | 0 (0.0%) | 0 (0.0%) |
| Total | 0 (0.0%) | 7 (6.4%) |
Race in Milano
The most populous races in Milano are White / Caucasian (384 | 63.2%), Black / African American (192 | 31.6%), and Hispanic or Latino (168 | 27.6%).
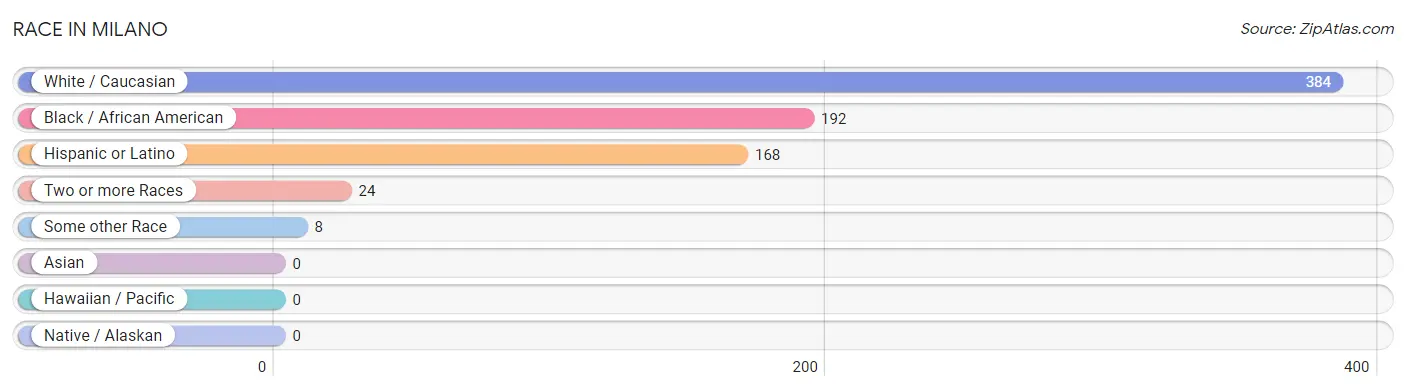
| Race | # Population | % Population |
| Asian | 0 | 0.0% |
| Black / African American | 192 | 31.6% |
| Hawaiian / Pacific | 0 | 0.0% |
| Hispanic or Latino | 168 | 27.6% |
| Native / Alaskan | 0 | 0.0% |
| White / Caucasian | 384 | 63.2% |
| Two or more Races | 24 | 4.0% |
| Some other Race | 8 | 1.3% |
| Total | 608 | 100.0% |
Ancestry in Milano
The most populous ancestries reported in Milano are Mexican (161 | 26.5%), American (33 | 5.4%), Irish (31 | 5.1%), English (30 | 4.9%), and German (22 | 3.6%), together accounting for 45.6% of all Milano residents.
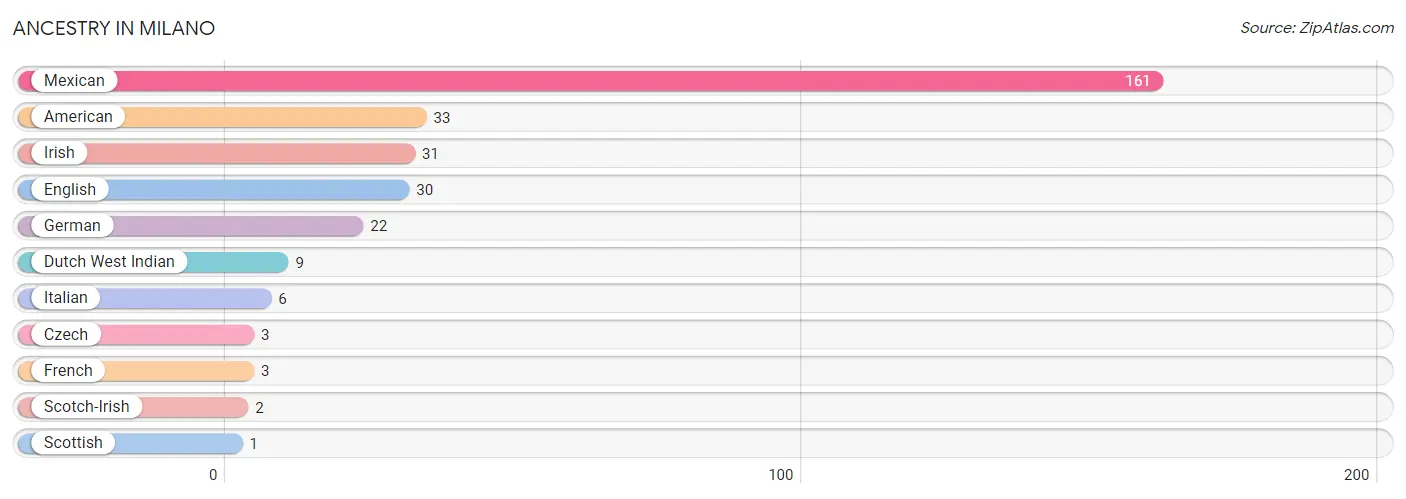
| Ancestry | # Population | % Population |
| American | 33 | 5.4% |
| Czech | 3 | 0.5% |
| Dutch West Indian | 9 | 1.5% |
| English | 30 | 4.9% |
| French | 3 | 0.5% |
| German | 22 | 3.6% |
| Irish | 31 | 5.1% |
| Italian | 6 | 1.0% |
| Mexican | 161 | 26.5% |
| Scotch-Irish | 2 | 0.3% |
| Scottish | 1 | 0.2% | View All 11 Rows |
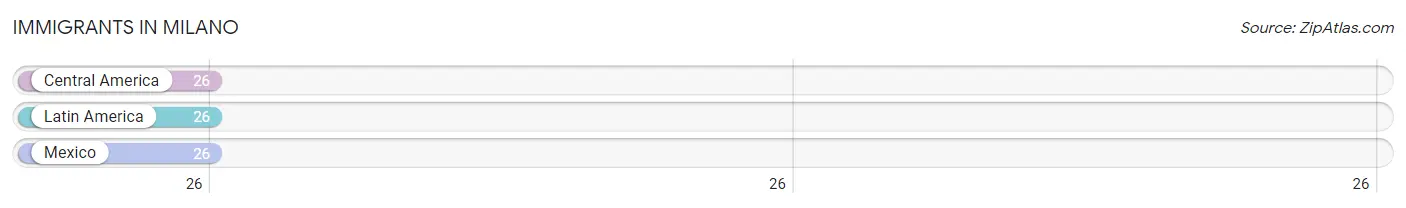
Immigrants in Milano
The most numerous immigrant groups reported in Milano came from Central America (26 | 4.3%), Latin America (26 | 4.3%), and Mexico (26 | 4.3%), together accounting for 12.8% of all Milano residents.
| Immigration Origin | # Population | % Population |
| Central America | 26 | 4.3% |
| Latin America | 26 | 4.3% |
| Mexico | 26 | 4.3% | View All 3 Rows |
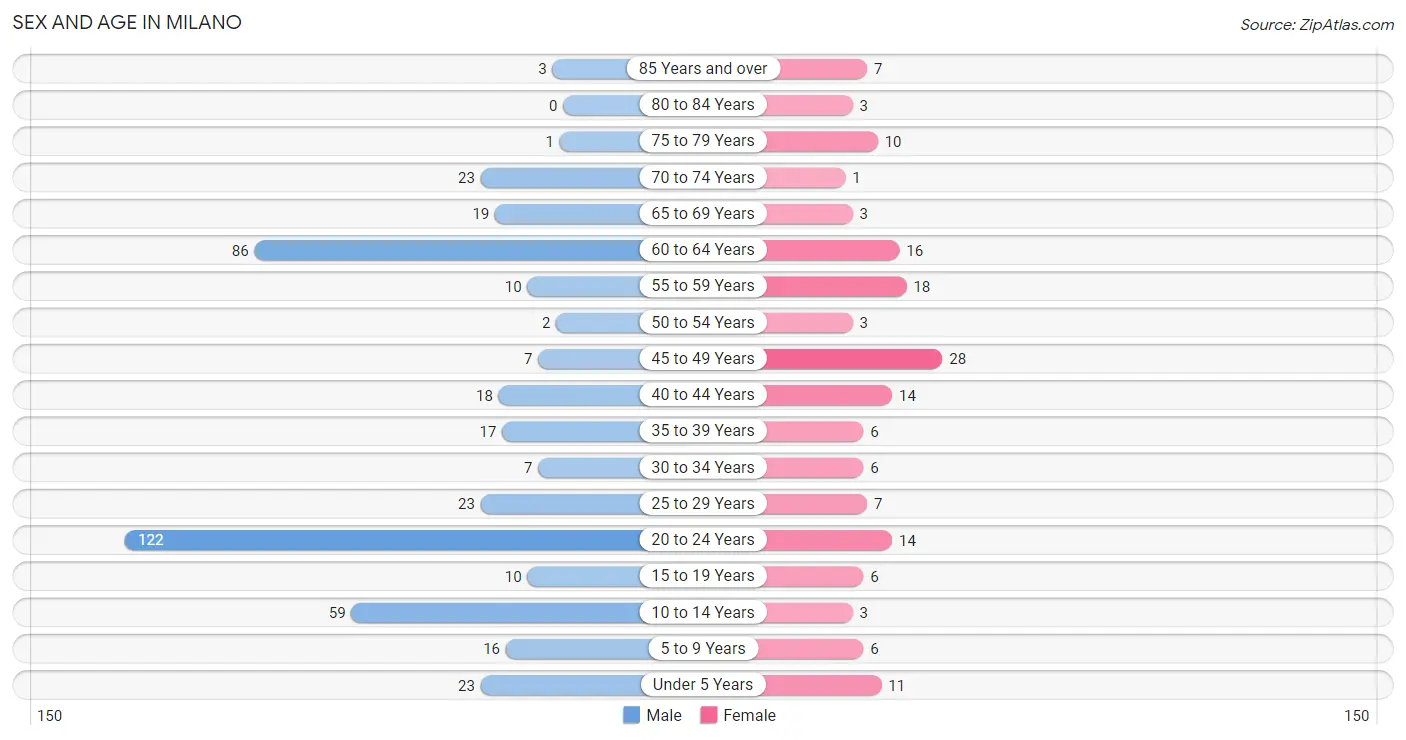
Sex and Age in Milano
Sex and Age in Milano
The most populous age groups in Milano are 20 to 24 Years (122 | 27.4%) for men and 45 to 49 Years (28 | 17.3%) for women.
| Age Bracket | Male | Female |
| Under 5 Years | 23 (5.2%) | 11 (6.8%) |
| 5 to 9 Years | 16 (3.6%) | 6 (3.7%) |
| 10 to 14 Years | 59 (13.2%) | 3 (1.8%) |
| 15 to 19 Years | 10 (2.2%) | 6 (3.7%) |
| 20 to 24 Years | 122 (27.4%) | 14 (8.6%) |
| 25 to 29 Years | 23 (5.2%) | 7 (4.3%) |
| 30 to 34 Years | 7 (1.6%) | 6 (3.7%) |
| 35 to 39 Years | 17 (3.8%) | 6 (3.7%) |
| 40 to 44 Years | 18 (4.0%) | 14 (8.6%) |
| 45 to 49 Years | 7 (1.6%) | 28 (17.3%) |
| 50 to 54 Years | 2 (0.4%) | 3 (1.8%) |
| 55 to 59 Years | 10 (2.2%) | 18 (11.1%) |
| 60 to 64 Years | 86 (19.3%) | 16 (9.9%) |
| 65 to 69 Years | 19 (4.3%) | 3 (1.8%) |
| 70 to 74 Years | 23 (5.2%) | 1 (0.6%) |
| 75 to 79 Years | 1 (0.2%) | 10 (6.2%) |
| 80 to 84 Years | 0 (0.0%) | 3 (1.8%) |
| 85 Years and over | 3 (0.7%) | 7 (4.3%) |
| Total | 446 (100.0%) | 162 (100.0%) |
Families and Households in Milano
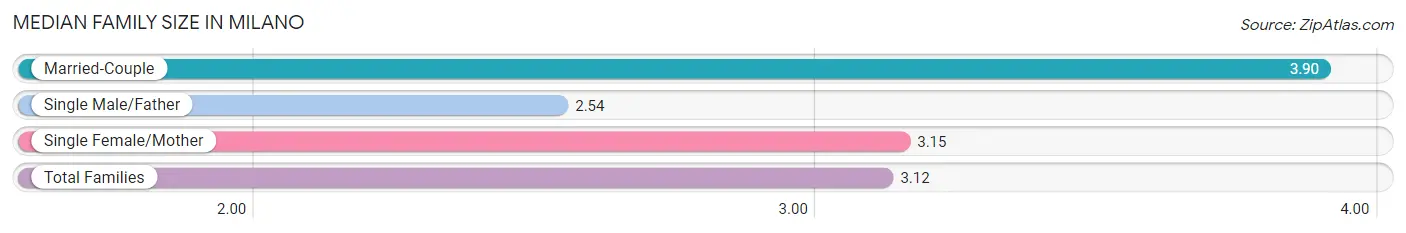
Median Family Size in Milano
The median family size in Milano is 3.12 persons per family, with married-couple families (61 | 35.9%) accounting for the largest median family size of 3.9 persons per family. On the other hand, single male/father families (82 | 48.2%) represent the smallest median family size with 2.54 persons per family.
| Family Type | # Families | Family Size |
| Married-Couple | 61 (35.9%) | 3.90 |
| Single Male/Father | 82 (48.2%) | 2.54 |
| Single Female/Mother | 27 (15.9%) | 3.15 |
| Total Families | 170 (100.0%) | 3.12 |
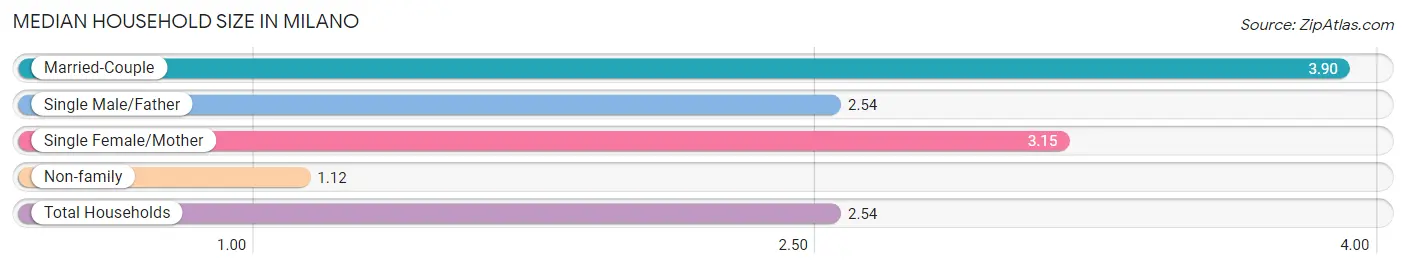
Median Household Size in Milano
The median household size in Milano is 2.54 persons per household, with married-couple households (61 | 25.5%) accounting for the largest median household size of 3.9 persons per household. non-family households (69 | 28.9%) represent the smallest median household size with 1.12 persons per household.
| Household Type | # Households | Household Size |
| Married-Couple | 61 (25.5%) | 3.90 |
| Single Male/Father | 82 (34.3%) | 2.54 |
| Single Female/Mother | 27 (11.3%) | 3.15 |
| Non-family | 69 (28.9%) | 1.12 |
| Total Households | 239 (100.0%) | 2.54 |
Household Size by Marriage Status in Milano
Out of a total of 239 households in Milano, 170 (71.1%) are family households, while 69 (28.9%) are nonfamily households. The most numerous type of family households are 2-person households, comprising 102, and the most common type of nonfamily households are 1-person households, comprising 63.
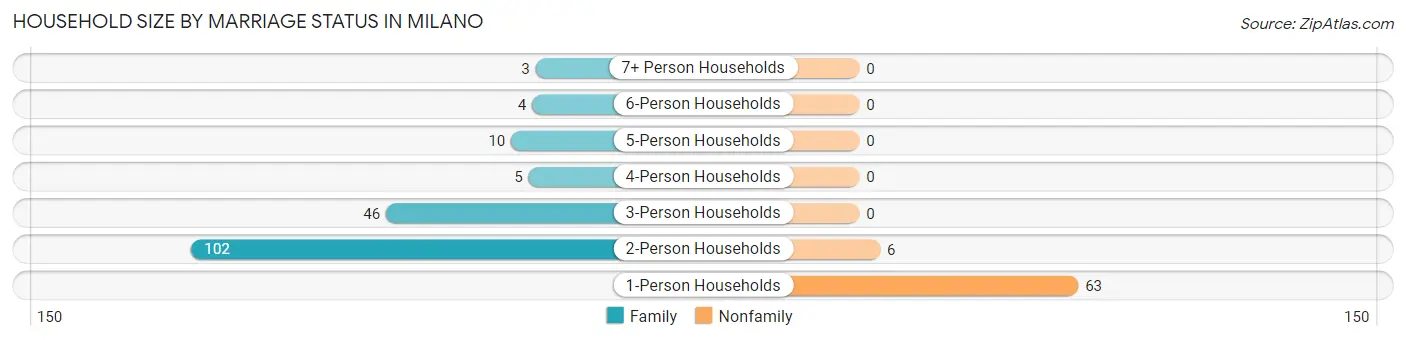
| Household Size | Family Households | Nonfamily Households |
| 1-Person Households | - | 63 (26.4%) |
| 2-Person Households | 102 (42.7%) | 6 (2.5%) |
| 3-Person Households | 46 (19.3%) | 0 (0.0%) |
| 4-Person Households | 5 (2.1%) | 0 (0.0%) |
| 5-Person Households | 10 (4.2%) | 0 (0.0%) |
| 6-Person Households | 4 (1.7%) | 0 (0.0%) |
| 7+ Person Households | 3 (1.3%) | 0 (0.0%) |
| Total | 170 (71.1%) | 69 (28.9%) |
Female Fertility in Milano
Fertility by Age in Milano
Average fertility rate in Milano is 60.0 births per 1,000 women. Women in the age bracket of 20 to 34 years have the highest fertility rate with 185.0 births per 1,000 women. Women in the age bracket of 20 to 34 years acount for 100.0% of all women with births.
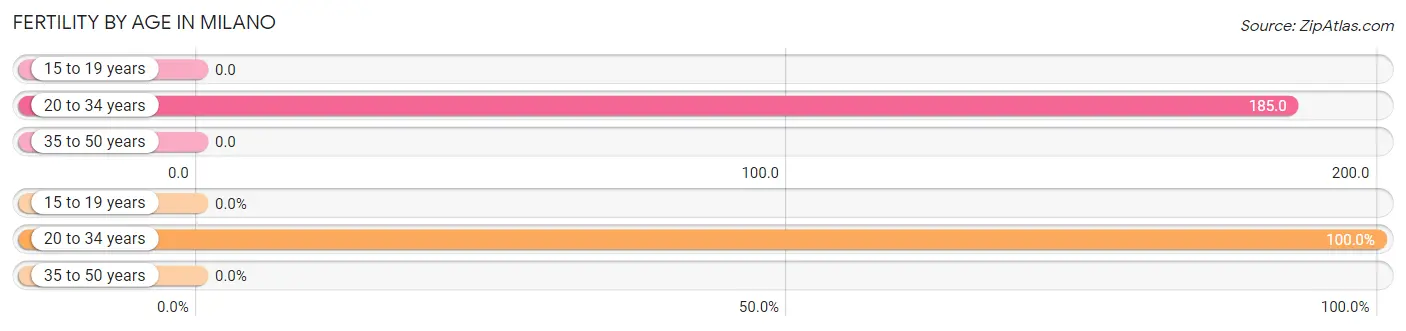
| Age Bracket | Women with Births | Births / 1,000 Women |
| 15 to 19 years | 0 (0.0%) | 0.0 |
| 20 to 34 years | 5 (100.0%) | 185.0 |
| 35 to 50 years | 0 (0.0%) | 0.0 |
| Total | 5 (100.0%) | 60.0 |
Fertility by Age by Marriage Status in Milano
40.0% of women with births (5) in Milano are married. The highest percentage of unmarried women with births falls into 20 to 34 years age bracket with 60.0% of them unmarried at the time of birth, while the lowest percentage of unmarried women with births belong to 20 to 34 years age bracket with 60.0% of them unmarried.
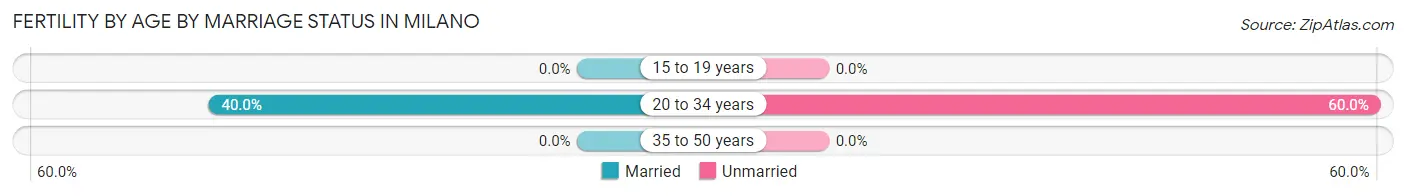
| Age Bracket | Married | Unmarried |
| 15 to 19 years | 0 (0.0%) | 0 (0.0%) |
| 20 to 34 years | 2 (40.0%) | 3 (60.0%) |
| 35 to 50 years | 0 (0.0%) | 0 (0.0%) |
| Total | 2 (40.0%) | 3 (60.0%) |
Fertility by Education in Milano
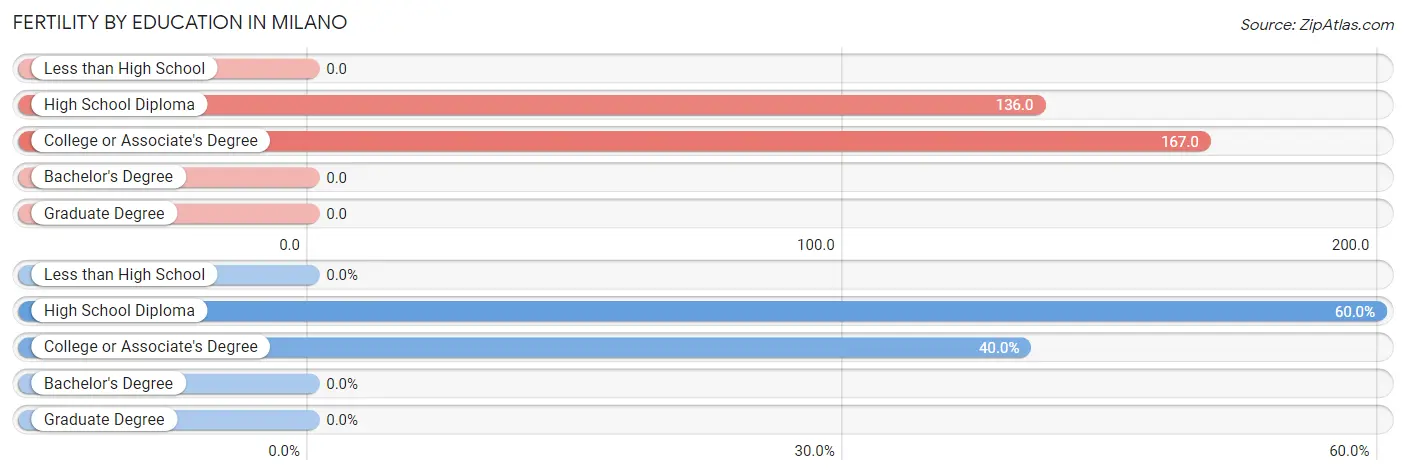
| Educational Attainment | Women with Births | Births / 1,000 Women |
| Less than High School | 0 (0.0%) | 0.0 |
| High School Diploma | 3 (60.0%) | 136.0 |
| College or Associate's Degree | 2 (40.0%) | 167.0 |
| Bachelor's Degree | 0 (0.0%) | 0.0 |
| Graduate Degree | 0 (0.0%) | 0.0 |
| Total | 5 (100.0%) | 60.0 |
Fertility by Education by Marriage Status in Milano
60.0% of women with births in Milano are unmarried. Women with the educational attainment of college or associate's degree are most likely to be married with 100.0% of them married at childbirth, while women with the educational attainment of high school diploma are least likely to be married with 100.0% of them unmarried at childbirth.
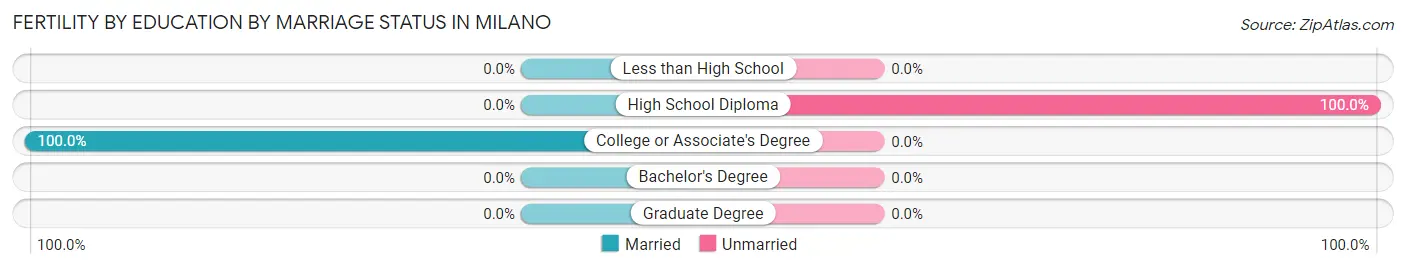
| Educational Attainment | Married | Unmarried |
| Less than High School | 0 (0.0%) | 0 (0.0%) |
| High School Diploma | 0 (0.0%) | 3 (100.0%) |
| College or Associate's Degree | 2 (100.0%) | 0 (0.0%) |
| Bachelor's Degree | 0 (0.0%) | 0 (0.0%) |
| Graduate Degree | 0 (0.0%) | 0 (0.0%) |
| Total | 2 (40.0%) | 3 (60.0%) |
Employment Characteristics in Milano
Employment by Class of Employer in Milano
Among the 352 employed individuals in Milano, private company employees (313 | 88.9%), not-for-profit organizations (17 | 4.8%), and local government employees (13 | 3.7%) make up the most common classes of employment.
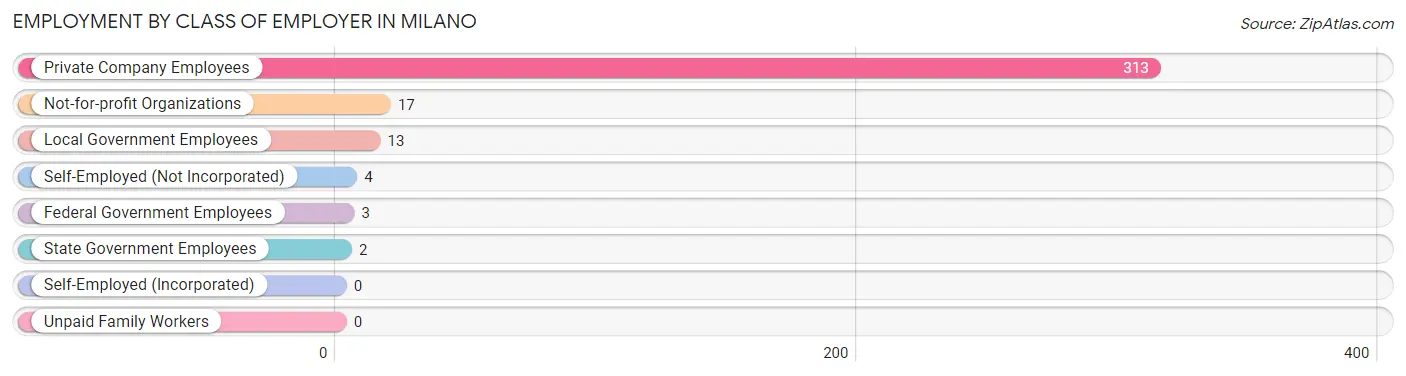
| Employer Class | # Employees | % Employees |
| Private Company Employees | 313 | 88.9% |
| Self-Employed (Incorporated) | 0 | 0.0% |
| Self-Employed (Not Incorporated) | 4 | 1.1% |
| Not-for-profit Organizations | 17 | 4.8% |
| Local Government Employees | 13 | 3.7% |
| State Government Employees | 2 | 0.6% |
| Federal Government Employees | 3 | 0.9% |
| Unpaid Family Workers | 0 | 0.0% |
| Total | 352 | 100.0% |
Employment Status by Age in Milano
According to the labor force statistics for Milano, out of the total population over 16 years of age (490), 73.1% or 358 individuals are in the labor force, with 1.7% or 6 of them unemployed. The age group with the highest labor force participation rate is 20 to 24 years, with 91.9% or 125 individuals in the labor force. Within the labor force, the 16 to 19 years age range has the highest percentage of unemployed individuals, with 100.0% or 3 of them being unemployed.
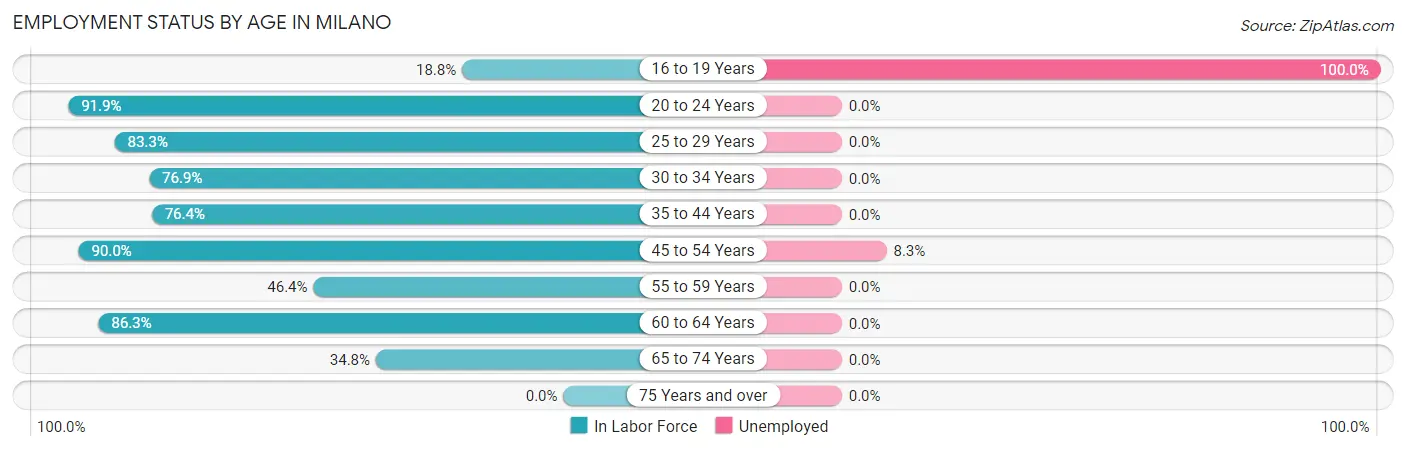
| Age Bracket | In Labor Force | Unemployed |
| 16 to 19 Years | 3 (18.8%) | 3 (100.0%) |
| 20 to 24 Years | 125 (91.9%) | 0 (0.0%) |
| 25 to 29 Years | 25 (83.3%) | 0 (0.0%) |
| 30 to 34 Years | 10 (76.9%) | 0 (0.0%) |
| 35 to 44 Years | 42 (76.4%) | 0 (0.0%) |
| 45 to 54 Years | 36 (90.0%) | 3 (8.3%) |
| 55 to 59 Years | 13 (46.4%) | 0 (0.0%) |
| 60 to 64 Years | 88 (86.3%) | 0 (0.0%) |
| 65 to 74 Years | 16 (34.8%) | 0 (0.0%) |
| 75 Years and over | 0 (0.0%) | 0 (0.0%) |
| Total | 358 (73.1%) | 6 (1.7%) |
Employment Status by Educational Attainment in Milano
According to labor force statistics for Milano, 79.9% of individuals (214) out of the total population between 25 and 64 years of age (268) are in the labor force, with 1.4% or 3 of them being unemployed. The group with the highest labor force participation rate are those with the educational attainment of college / associate degree, with 98.3% or 113 individuals in the labor force. Within the labor force, individuals with less than high school education have the highest percentage of unemployment, with 15.0% or 3 of them being unemployed.
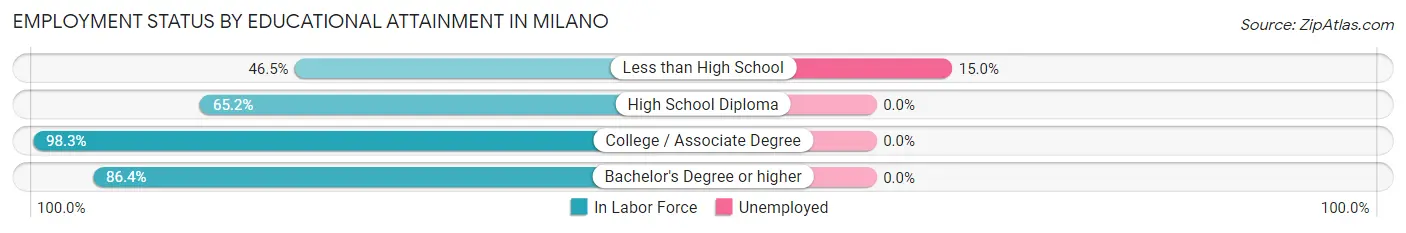
| Educational Attainment | In Labor Force | Unemployed |
| Less than High School | 20 (46.5%) | 6 (15.0%) |
| High School Diploma | 43 (65.2%) | 0 (0.0%) |
| College / Associate Degree | 113 (98.3%) | 0 (0.0%) |
| Bachelor's Degree or higher | 38 (86.4%) | 0 (0.0%) |
| Total | 214 (79.9%) | 4 (1.4%) |
Employment Occupations by Sex in Milano
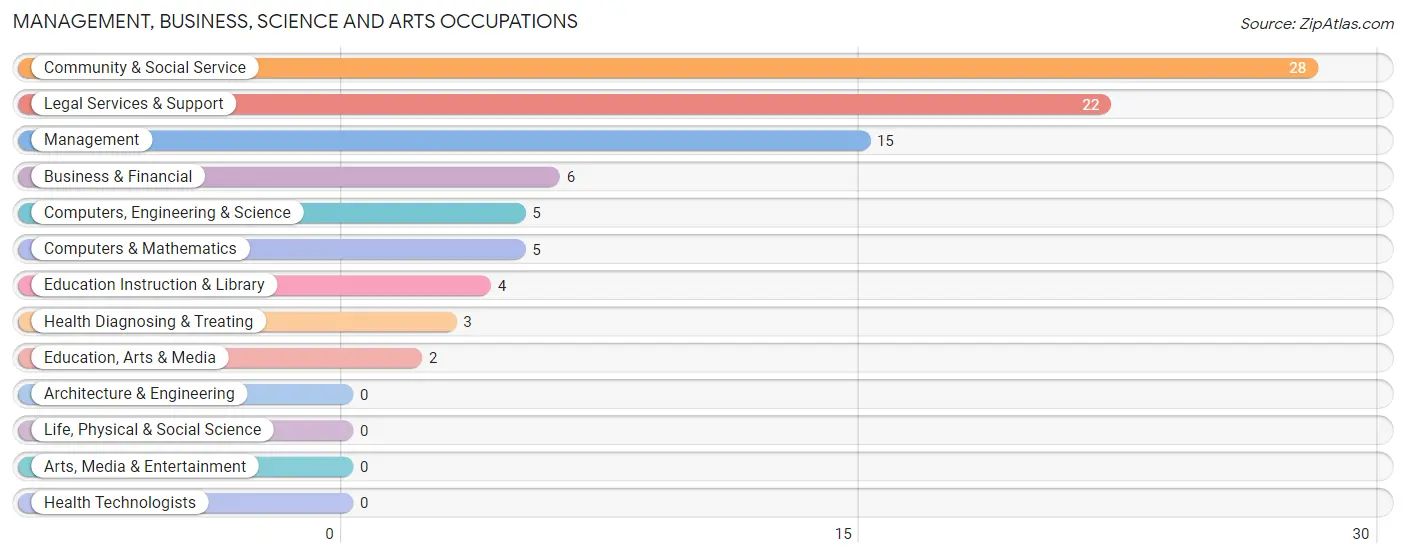
Management, Business, Science and Arts Occupations
The most common Management, Business, Science and Arts occupations in Milano are Community & Social Service (28 | 8.0%), Legal Services & Support (22 | 6.2%), Management (15 | 4.3%), Business & Financial (6 | 1.7%), and Computers, Engineering & Science (5 | 1.4%).
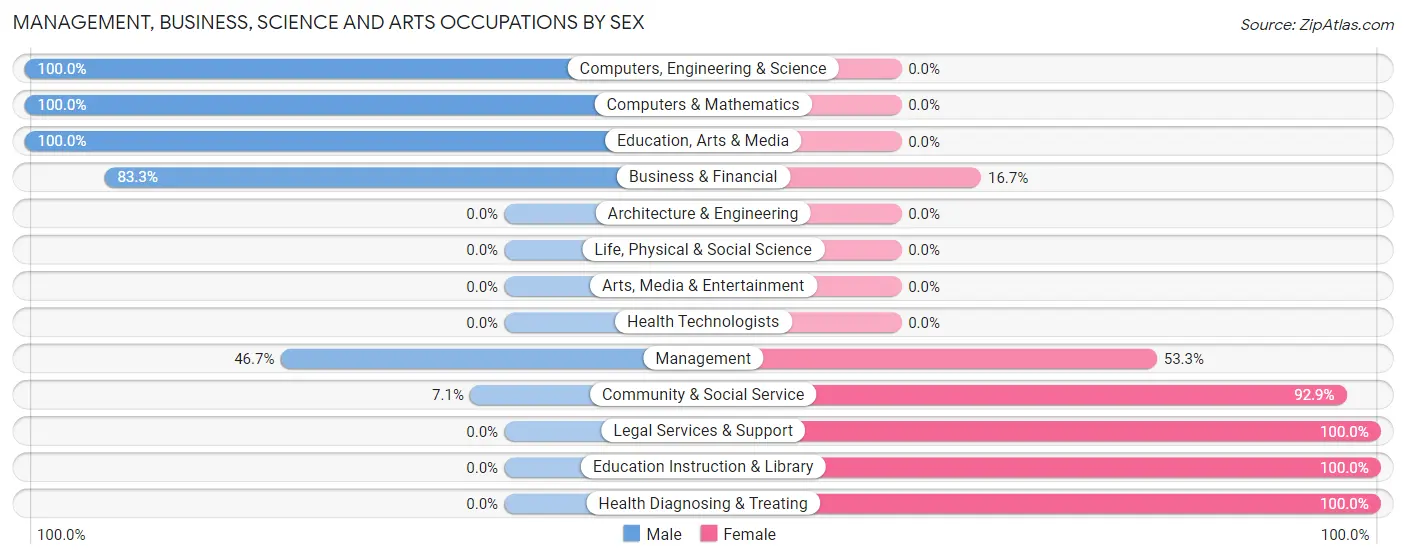
Management, Business, Science and Arts Occupations by Sex
Within the Management, Business, Science and Arts occupations in Milano, the most male-oriented occupations are Computers, Engineering & Science (100.0%), Computers & Mathematics (100.0%), and Education, Arts & Media (100.0%), while the most female-oriented occupations are Legal Services & Support (100.0%), Education Instruction & Library (100.0%), and Health Diagnosing & Treating (100.0%).
| Occupation | Male | Female |
| Management | 7 (46.7%) | 8 (53.3%) |
| Business & Financial | 5 (83.3%) | 1 (16.7%) |
| Computers, Engineering & Science | 5 (100.0%) | 0 (0.0%) |
| Computers & Mathematics | 5 (100.0%) | 0 (0.0%) |
| Architecture & Engineering | 0 (0.0%) | 0 (0.0%) |
| Life, Physical & Social Science | 0 (0.0%) | 0 (0.0%) |
| Community & Social Service | 2 (7.1%) | 26 (92.9%) |
| Education, Arts & Media | 2 (100.0%) | 0 (0.0%) |
| Legal Services & Support | 0 (0.0%) | 22 (100.0%) |
| Education Instruction & Library | 0 (0.0%) | 4 (100.0%) |
| Arts, Media & Entertainment | 0 (0.0%) | 0 (0.0%) |
| Health Diagnosing & Treating | 0 (0.0%) | 3 (100.0%) |
| Health Technologists | 0 (0.0%) | 0 (0.0%) |
| Total (Category) | 19 (33.3%) | 38 (66.7%) |
| Total (Overall) | 281 (79.8%) | 71 (20.2%) |
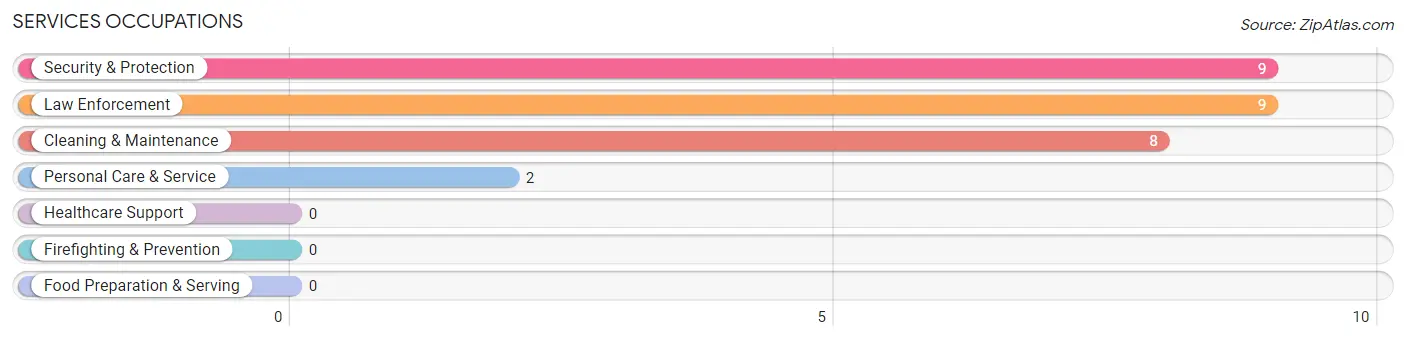
Services Occupations
The most common Services occupations in Milano are Security & Protection (9 | 2.6%), Law Enforcement (9 | 2.6%), Cleaning & Maintenance (8 | 2.3%), and Personal Care & Service (2 | 0.6%).
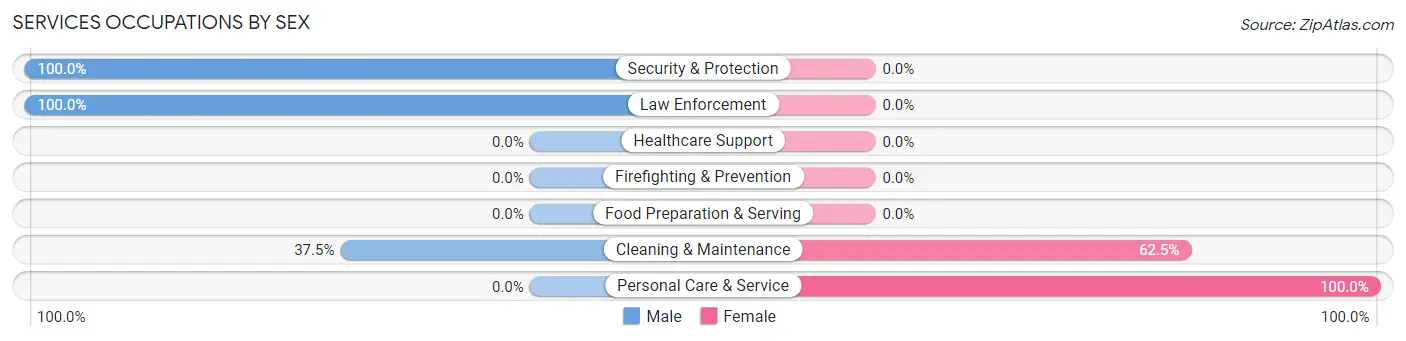
Services Occupations by Sex
Within the Services occupations in Milano, the most male-oriented occupations are Security & Protection (100.0%), Law Enforcement (100.0%), and Cleaning & Maintenance (37.5%), while the most female-oriented occupations are Personal Care & Service (100.0%), and Cleaning & Maintenance (62.5%).
| Occupation | Male | Female |
| Healthcare Support | 0 (0.0%) | 0 (0.0%) |
| Security & Protection | 9 (100.0%) | 0 (0.0%) |
| Firefighting & Prevention | 0 (0.0%) | 0 (0.0%) |
| Law Enforcement | 9 (100.0%) | 0 (0.0%) |
| Food Preparation & Serving | 0 (0.0%) | 0 (0.0%) |
| Cleaning & Maintenance | 3 (37.5%) | 5 (62.5%) |
| Personal Care & Service | 0 (0.0%) | 2 (100.0%) |
| Total (Category) | 12 (63.2%) | 7 (36.8%) |
| Total (Overall) | 281 (79.8%) | 71 (20.2%) |
Sales and Office Occupations
The most common Sales and Office occupations in Milano are Office & Administration (10 | 2.8%), and Sales & Related (8 | 2.3%).

Sales and Office Occupations by Sex

| Occupation | Male | Female |
| Sales & Related | 5 (62.5%) | 3 (37.5%) |
| Office & Administration | 0 (0.0%) | 10 (100.0%) |
| Total (Category) | 5 (27.8%) | 13 (72.2%) |
| Total (Overall) | 281 (79.8%) | 71 (20.2%) |
Natural Resources, Construction and Maintenance Occupations
The most common Natural Resources, Construction and Maintenance occupations in Milano are Installation, Maintenance & Repair (93 | 26.4%), Construction & Extraction (30 | 8.5%), and Farming, Fishing & Forestry (6 | 1.7%).
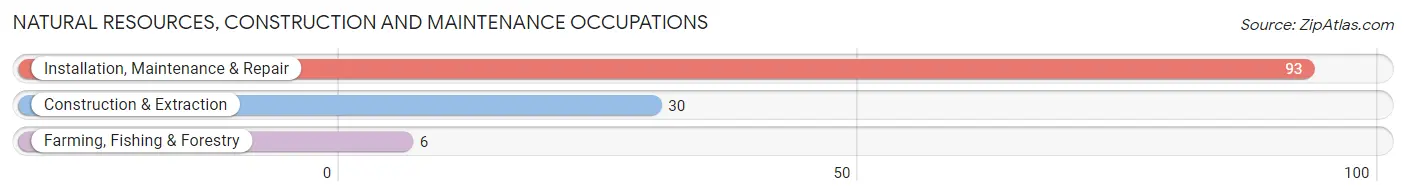
Natural Resources, Construction and Maintenance Occupations by Sex

| Occupation | Male | Female |
| Farming, Fishing & Forestry | 6 (100.0%) | 0 (0.0%) |
| Construction & Extraction | 30 (100.0%) | 0 (0.0%) |
| Installation, Maintenance & Repair | 93 (100.0%) | 0 (0.0%) |
| Total (Category) | 129 (100.0%) | 0 (0.0%) |
| Total (Overall) | 281 (79.8%) | 71 (20.2%) |
Production, Transportation and Moving Occupations
The most common Production, Transportation and Moving occupations in Milano are Material Moving (115 | 32.7%), Production (8 | 2.3%), and Transportation (6 | 1.7%).
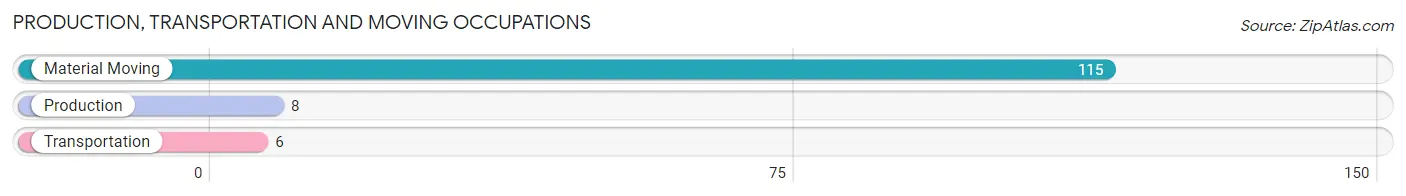
Production, Transportation and Moving Occupations by Sex
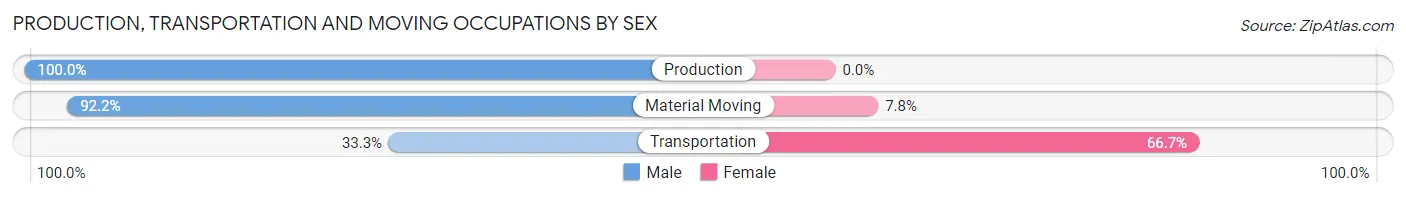
| Occupation | Male | Female |
| Production | 8 (100.0%) | 0 (0.0%) |
| Transportation | 2 (33.3%) | 4 (66.7%) |
| Material Moving | 106 (92.2%) | 9 (7.8%) |
| Total (Category) | 116 (89.9%) | 13 (10.1%) |
| Total (Overall) | 281 (79.8%) | 71 (20.2%) |
Employment Industries by Sex in Milano
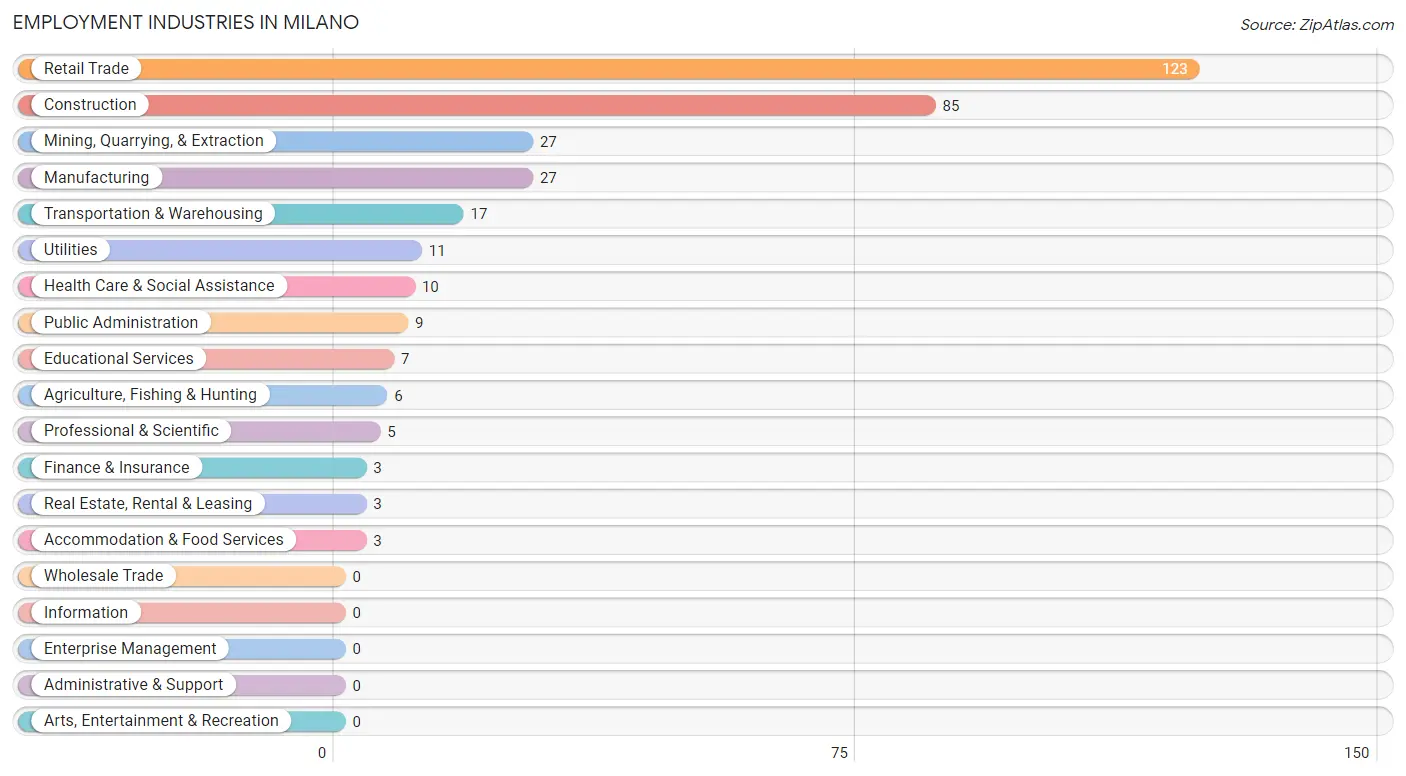
Employment Industries in Milano
The major employment industries in Milano include Retail Trade (123 | 34.9%), Construction (85 | 24.1%), Mining, Quarrying, & Extraction (27 | 7.7%), Manufacturing (27 | 7.7%), and Transportation & Warehousing (17 | 4.8%).
Employment Industries by Sex in Milano
The Milano industries that see more men than women are Agriculture, Fishing & Hunting (100.0%), Construction (100.0%), and Finance & Insurance (100.0%), whereas the industries that tend to have a higher number of women are Real Estate, Rental & Leasing (100.0%), Educational Services (100.0%), and Accommodation & Food Services (100.0%).
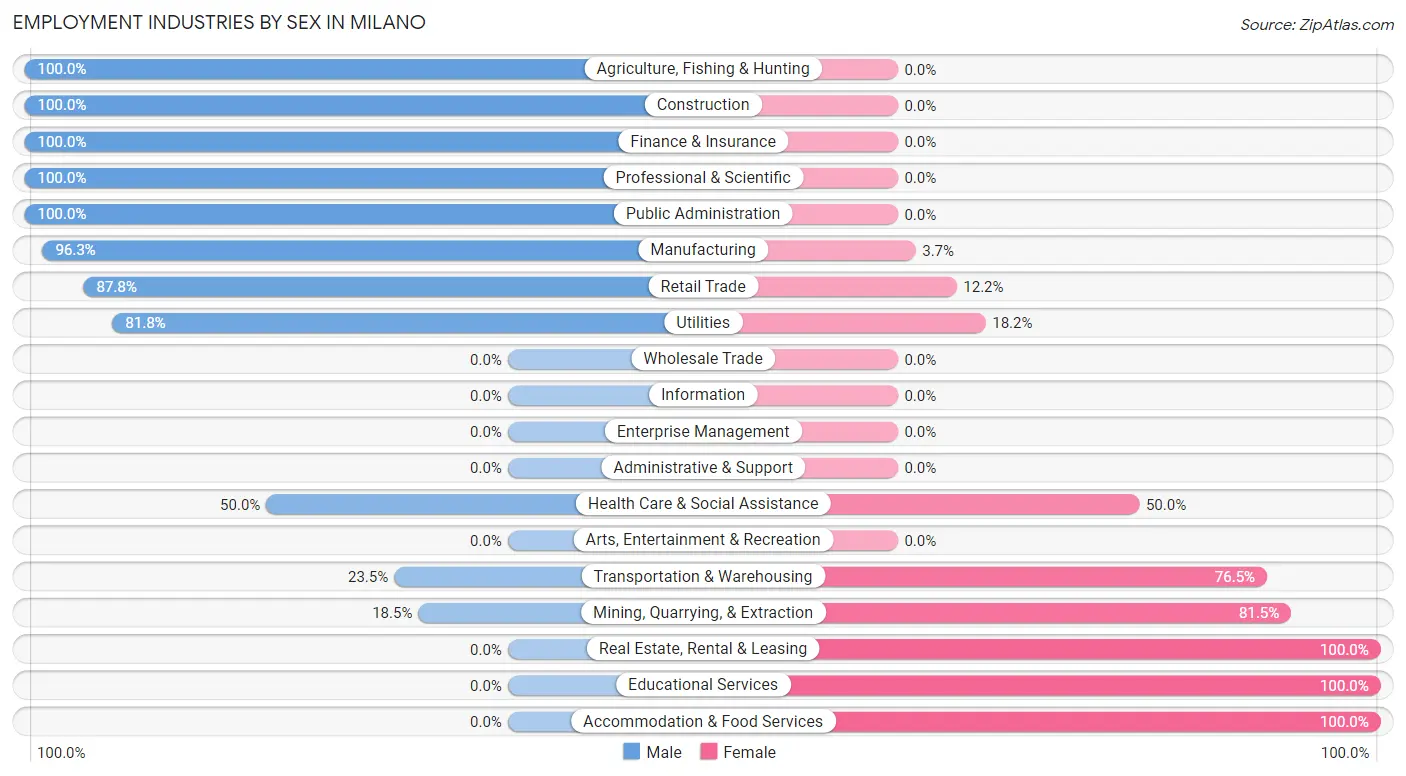
| Industry | Male | Female |
| Agriculture, Fishing & Hunting | 6 (100.0%) | 0 (0.0%) |
| Mining, Quarrying, & Extraction | 5 (18.5%) | 22 (81.5%) |
| Construction | 85 (100.0%) | 0 (0.0%) |
| Manufacturing | 26 (96.3%) | 1 (3.7%) |
| Wholesale Trade | 0 (0.0%) | 0 (0.0%) |
| Retail Trade | 108 (87.8%) | 15 (12.2%) |
| Transportation & Warehousing | 4 (23.5%) | 13 (76.5%) |
| Utilities | 9 (81.8%) | 2 (18.2%) |
| Information | 0 (0.0%) | 0 (0.0%) |
| Finance & Insurance | 3 (100.0%) | 0 (0.0%) |
| Real Estate, Rental & Leasing | 0 (0.0%) | 3 (100.0%) |
| Professional & Scientific | 5 (100.0%) | 0 (0.0%) |
| Enterprise Management | 0 (0.0%) | 0 (0.0%) |
| Administrative & Support | 0 (0.0%) | 0 (0.0%) |
| Educational Services | 0 (0.0%) | 7 (100.0%) |
| Health Care & Social Assistance | 5 (50.0%) | 5 (50.0%) |
| Arts, Entertainment & Recreation | 0 (0.0%) | 0 (0.0%) |
| Accommodation & Food Services | 0 (0.0%) | 3 (100.0%) |
| Public Administration | 9 (100.0%) | 0 (0.0%) |
| Total | 281 (79.8%) | 71 (20.2%) |
Education in Milano
School Enrollment in Milano
The most common levels of schooling among the 122 students in Milano are middle school (57 | 46.7%), college / undergraduate (21 | 17.2%), and elementary school (15 | 12.3%).
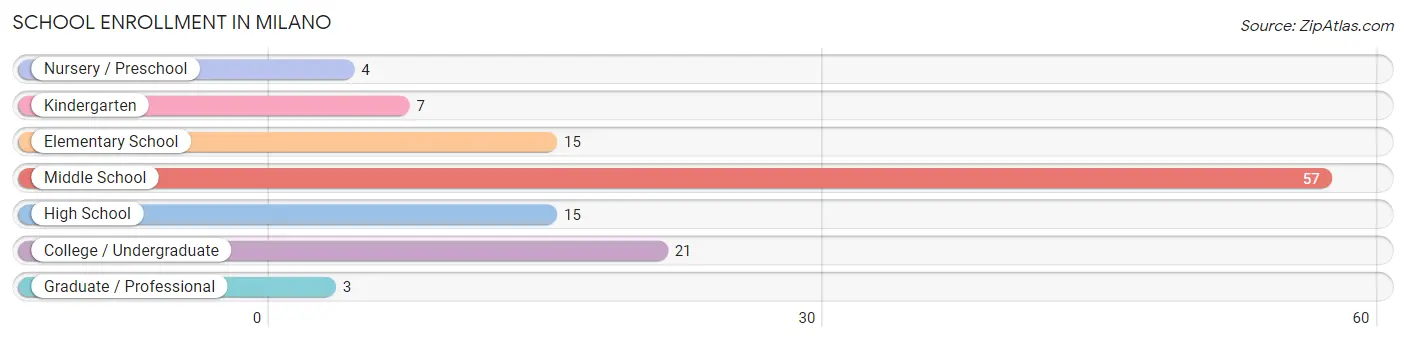
| School Level | # Students | % Students |
| Nursery / Preschool | 4 | 3.3% |
| Kindergarten | 7 | 5.7% |
| Elementary School | 15 | 12.3% |
| Middle School | 57 | 46.7% |
| High School | 15 | 12.3% |
| College / Undergraduate | 21 | 17.2% |
| Graduate / Professional | 3 | 2.5% |
| Total | 122 | 100.0% |
School Enrollment by Age by Funding Source in Milano
Out of a total of 122 students who are enrolled in schools in Milano, 54 (44.3%) attend a private institution, while the remaining 68 (55.7%) are enrolled in public schools. The age group of 10 to 14 year olds has the highest likelihood of being enrolled in private schools, with 51 (82.3% in the age bracket) enrolled. Conversely, the age group of 3 to 4 year olds has the lowest likelihood of being enrolled in a private school, with 4 (100.0% in the age bracket) attending a public institution.
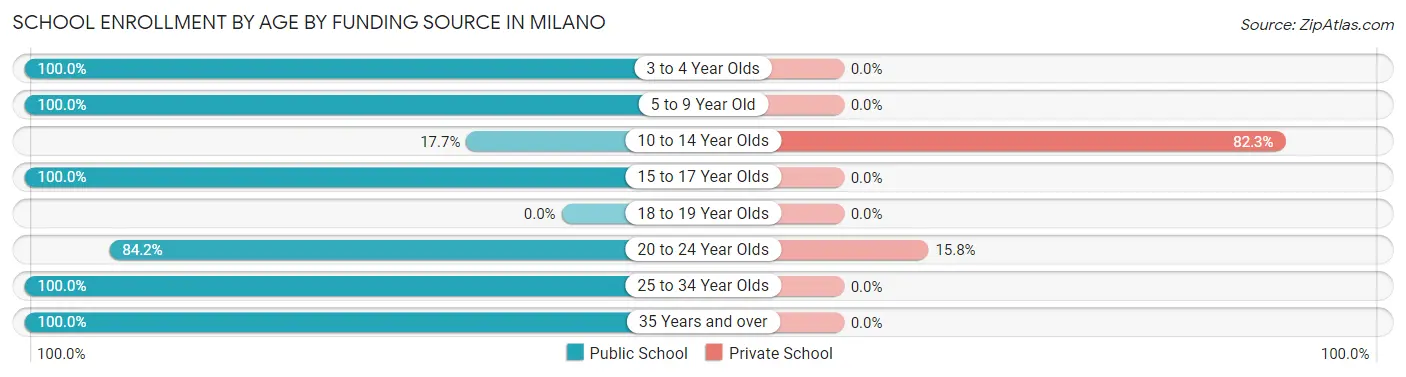
| Age Bracket | Public School | Private School |
| 3 to 4 Year Olds | 4 (100.0%) | 0 (0.0%) |
| 5 to 9 Year Old | 22 (100.0%) | 0 (0.0%) |
| 10 to 14 Year Olds | 11 (17.7%) | 51 (82.3%) |
| 15 to 17 Year Olds | 10 (100.0%) | 0 (0.0%) |
| 18 to 19 Year Olds | 0 (0.0%) | 0 (0.0%) |
| 20 to 24 Year Olds | 16 (84.2%) | 3 (15.8%) |
| 25 to 34 Year Olds | 2 (100.0%) | 0 (0.0%) |
| 35 Years and over | 3 (100.0%) | 0 (0.0%) |
| Total | 68 (55.7%) | 54 (44.3%) |
Educational Attainment by Field of Study in Milano
Social sciences (22 | 40.0%), business (10 | 18.2%), education (7 | 12.7%), engineering (6 | 10.9%), and liberal arts & history (4 | 7.3%) are the most common fields of study among 55 individuals in Milano who have obtained a bachelor's degree or higher.
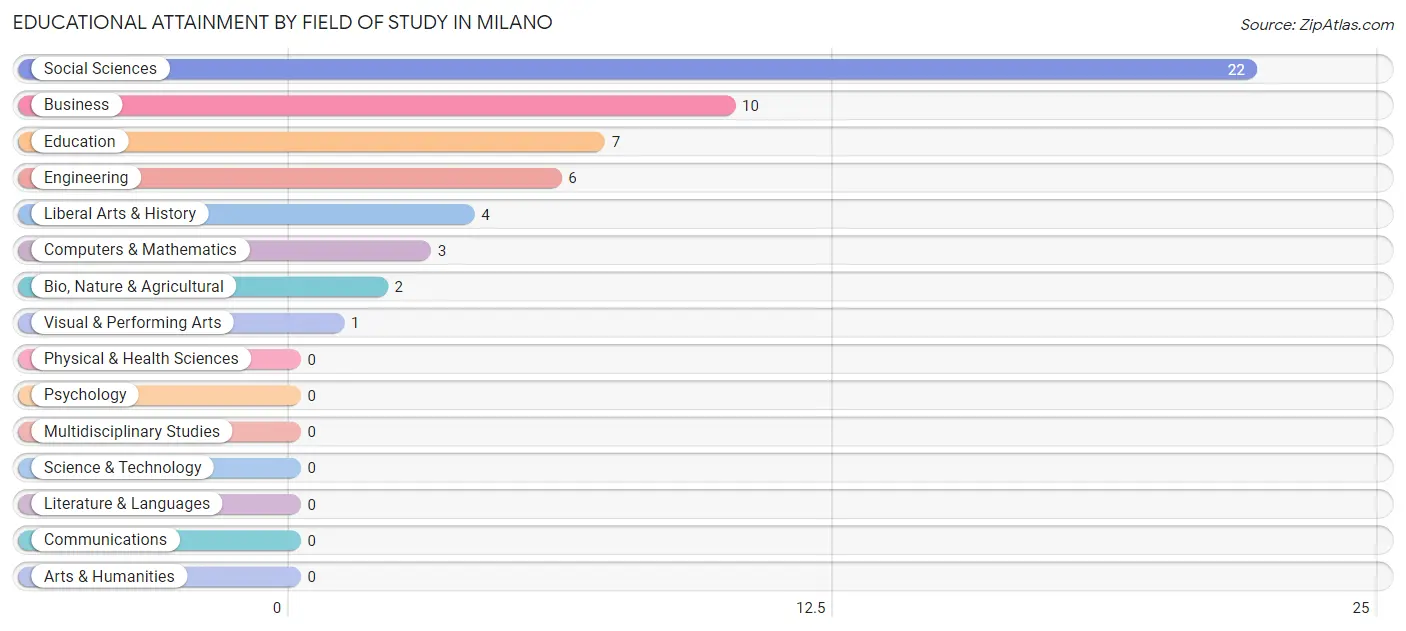
| Field of Study | # Graduates | % Graduates |
| Computers & Mathematics | 3 | 5.4% |
| Bio, Nature & Agricultural | 2 | 3.6% |
| Physical & Health Sciences | 0 | 0.0% |
| Psychology | 0 | 0.0% |
| Social Sciences | 22 | 40.0% |
| Engineering | 6 | 10.9% |
| Multidisciplinary Studies | 0 | 0.0% |
| Science & Technology | 0 | 0.0% |
| Business | 10 | 18.2% |
| Education | 7 | 12.7% |
| Literature & Languages | 0 | 0.0% |
| Liberal Arts & History | 4 | 7.3% |
| Visual & Performing Arts | 1 | 1.8% |
| Communications | 0 | 0.0% |
| Arts & Humanities | 0 | 0.0% |
| Total | 55 | 100.0% |
Transportation & Commute in Milano
Vehicle Availability by Sex in Milano
The most prevalent vehicle ownership categories in Milano are males with 2 vehicles (223, accounting for 79.4%) and females with 2 vehicles (15, making up 314.1%).
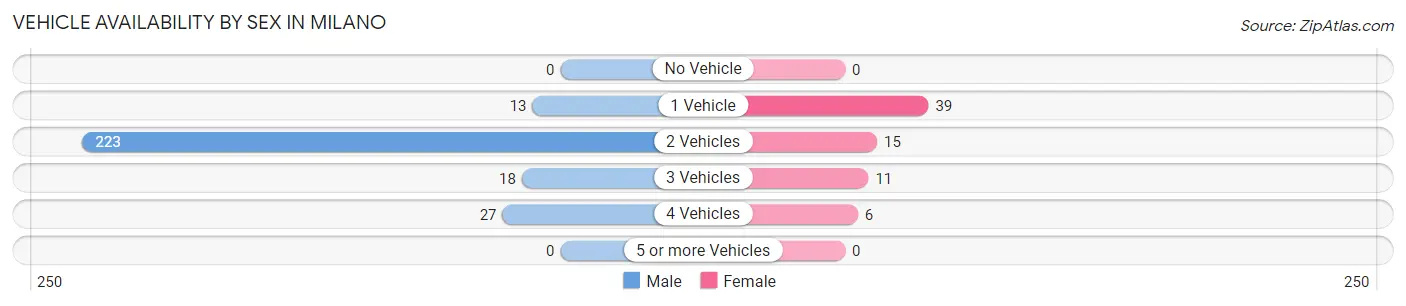
| Vehicles Available | Male | Female |
| No Vehicle | 0 (0.0%) | 0 (0.0%) |
| 1 Vehicle | 13 (4.6%) | 39 (54.9%) |
| 2 Vehicles | 223 (79.4%) | 15 (21.1%) |
| 3 Vehicles | 18 (6.4%) | 11 (15.5%) |
| 4 Vehicles | 27 (9.6%) | 6 (8.5%) |
| 5 or more Vehicles | 0 (0.0%) | 0 (0.0%) |
| Total | 281 (100.0%) | 71 (100.0%) |
Commute Time in Milano
The most frequently occuring commute durations in Milano are 20 to 24 minutes (215 commuters, 61.6%), less than 5 minutes (23 commuters, 6.6%), and 60 to 89 minutes (23 commuters, 6.6%).
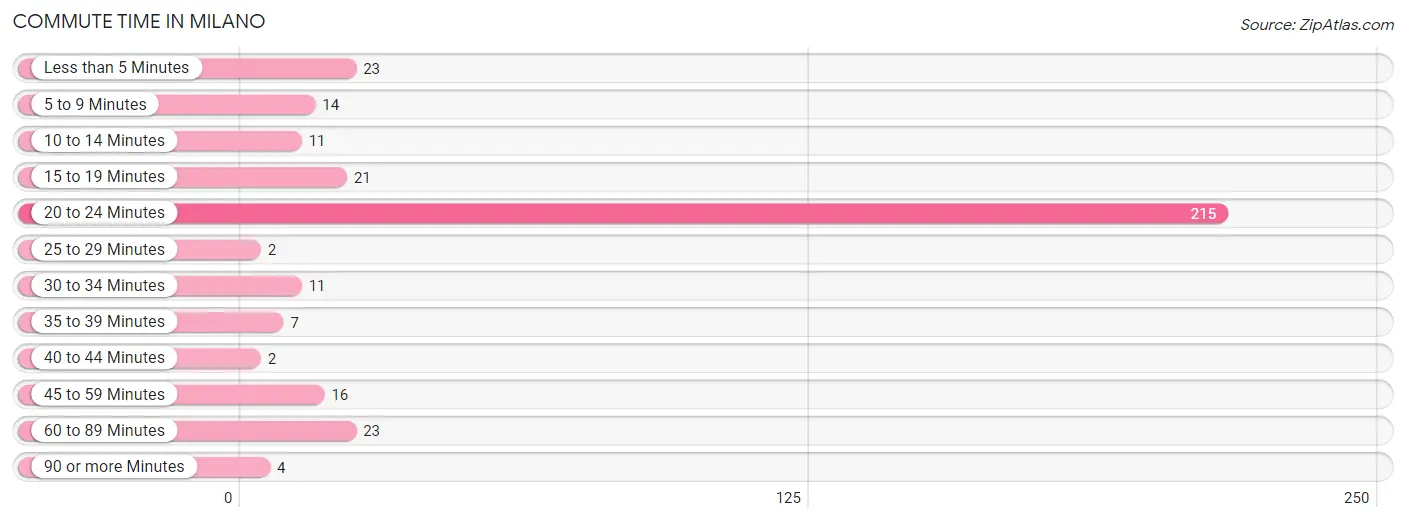
| Commute Time | # Commuters | % Commuters |
| Less than 5 Minutes | 23 | 6.6% |
| 5 to 9 Minutes | 14 | 4.0% |
| 10 to 14 Minutes | 11 | 3.2% |
| 15 to 19 Minutes | 21 | 6.0% |
| 20 to 24 Minutes | 215 | 61.6% |
| 25 to 29 Minutes | 2 | 0.6% |
| 30 to 34 Minutes | 11 | 3.2% |
| 35 to 39 Minutes | 7 | 2.0% |
| 40 to 44 Minutes | 2 | 0.6% |
| 45 to 59 Minutes | 16 | 4.6% |
| 60 to 89 Minutes | 23 | 6.6% |
| 90 or more Minutes | 4 | 1.1% |
Commute Time by Sex in Milano
The most common commute times in Milano are 20 to 24 minutes (189 commuters, 68.0%) for males and 20 to 24 minutes (26 commuters, 36.6%) for females.
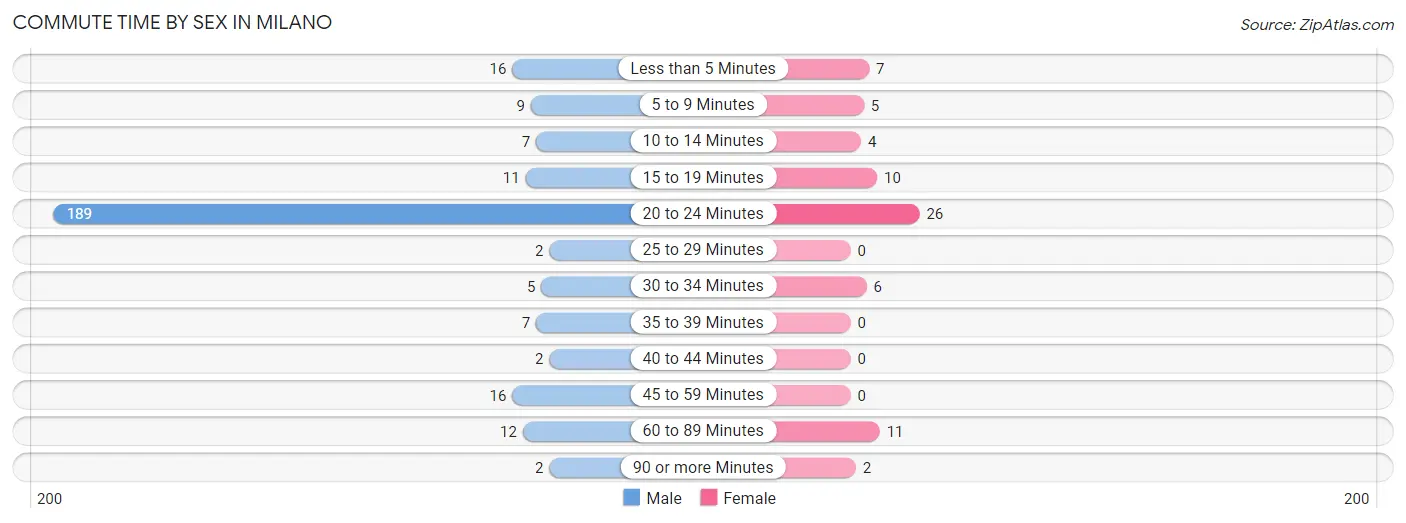
| Commute Time | Male | Female |
| Less than 5 Minutes | 16 (5.8%) | 7 (9.9%) |
| 5 to 9 Minutes | 9 (3.2%) | 5 (7.0%) |
| 10 to 14 Minutes | 7 (2.5%) | 4 (5.6%) |
| 15 to 19 Minutes | 11 (4.0%) | 10 (14.1%) |
| 20 to 24 Minutes | 189 (68.0%) | 26 (36.6%) |
| 25 to 29 Minutes | 2 (0.7%) | 0 (0.0%) |
| 30 to 34 Minutes | 5 (1.8%) | 6 (8.5%) |
| 35 to 39 Minutes | 7 (2.5%) | 0 (0.0%) |
| 40 to 44 Minutes | 2 (0.7%) | 0 (0.0%) |
| 45 to 59 Minutes | 16 (5.8%) | 0 (0.0%) |
| 60 to 89 Minutes | 12 (4.3%) | 11 (15.5%) |
| 90 or more Minutes | 2 (0.7%) | 2 (2.8%) |
Time of Departure to Work by Sex in Milano
The most frequent times of departure to work in Milano are 12:00 PM to 3:59 PM (115, 41.4%) for males and 8:00 AM to 8:29 AM (28, 39.4%) for females.
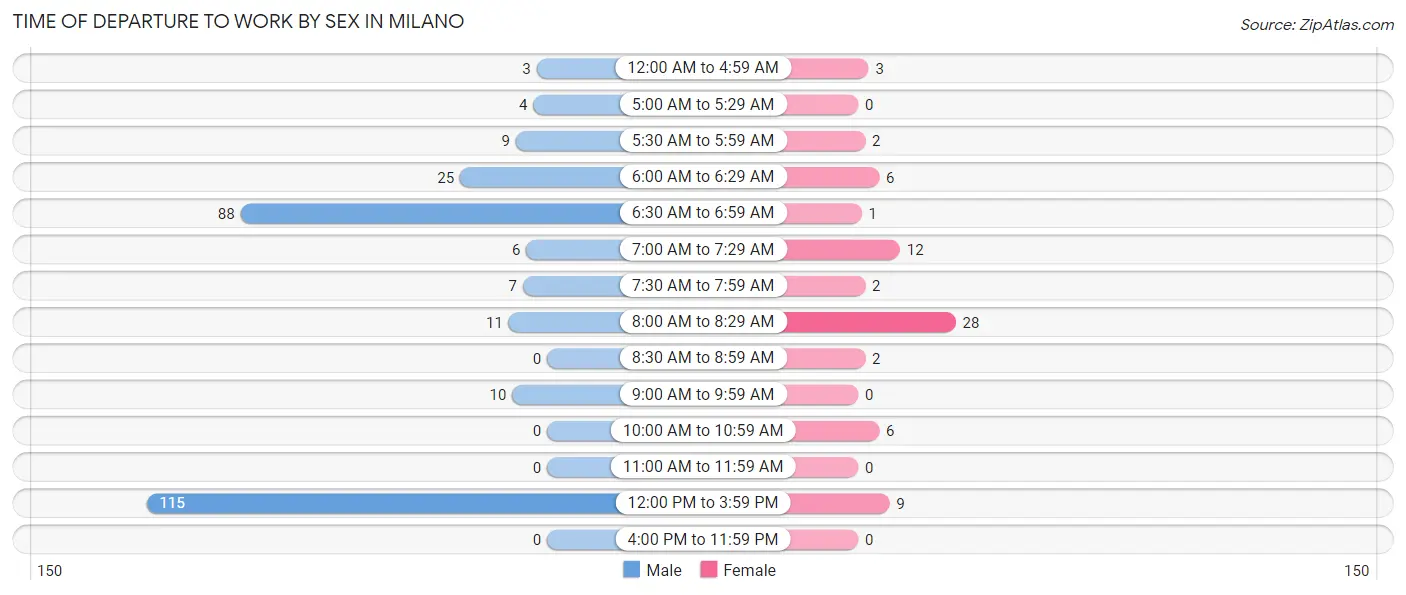
| Time of Departure | Male | Female |
| 12:00 AM to 4:59 AM | 3 (1.1%) | 3 (4.2%) |
| 5:00 AM to 5:29 AM | 4 (1.4%) | 0 (0.0%) |
| 5:30 AM to 5:59 AM | 9 (3.2%) | 2 (2.8%) |
| 6:00 AM to 6:29 AM | 25 (9.0%) | 6 (8.5%) |
| 6:30 AM to 6:59 AM | 88 (31.7%) | 1 (1.4%) |
| 7:00 AM to 7:29 AM | 6 (2.2%) | 12 (16.9%) |
| 7:30 AM to 7:59 AM | 7 (2.5%) | 2 (2.8%) |
| 8:00 AM to 8:29 AM | 11 (4.0%) | 28 (39.4%) |
| 8:30 AM to 8:59 AM | 0 (0.0%) | 2 (2.8%) |
| 9:00 AM to 9:59 AM | 10 (3.6%) | 0 (0.0%) |
| 10:00 AM to 10:59 AM | 0 (0.0%) | 6 (8.5%) |
| 11:00 AM to 11:59 AM | 0 (0.0%) | 0 (0.0%) |
| 12:00 PM to 3:59 PM | 115 (41.4%) | 9 (12.7%) |
| 4:00 PM to 11:59 PM | 0 (0.0%) | 0 (0.0%) |
| Total | 278 (100.0%) | 71 (100.0%) |
Housing Occupancy in Milano
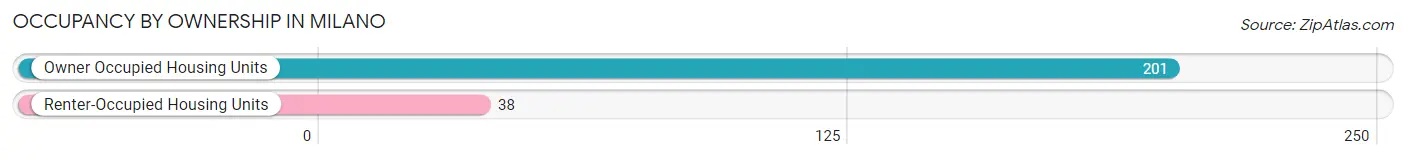
Occupancy by Ownership in Milano
Of the total 239 dwellings in Milano, owner-occupied units account for 201 (84.1%), while renter-occupied units make up 38 (15.9%).
| Occupancy | # Housing Units | % Housing Units |
| Owner Occupied Housing Units | 201 | 84.1% |
| Renter-Occupied Housing Units | 38 | 15.9% |
| Total Occupied Housing Units | 239 | 100.0% |
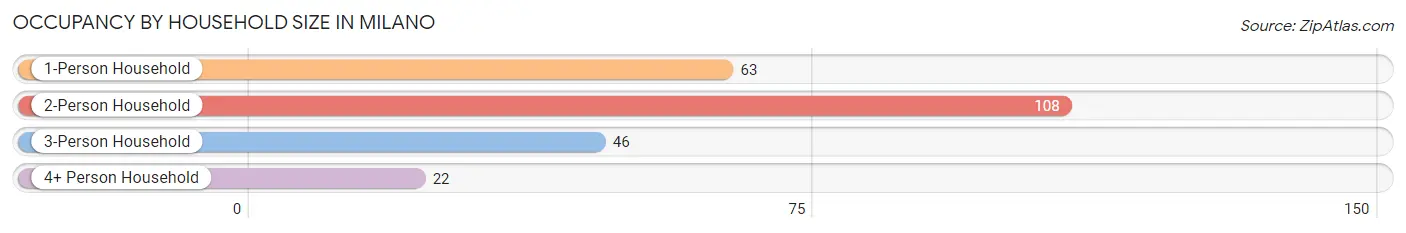
Occupancy by Household Size in Milano
| Household Size | # Housing Units | % Housing Units |
| 1-Person Household | 63 | 26.4% |
| 2-Person Household | 108 | 45.2% |
| 3-Person Household | 46 | 19.3% |
| 4+ Person Household | 22 | 9.2% |
| Total Housing Units | 239 | 100.0% |
Occupancy by Ownership by Household Size in Milano
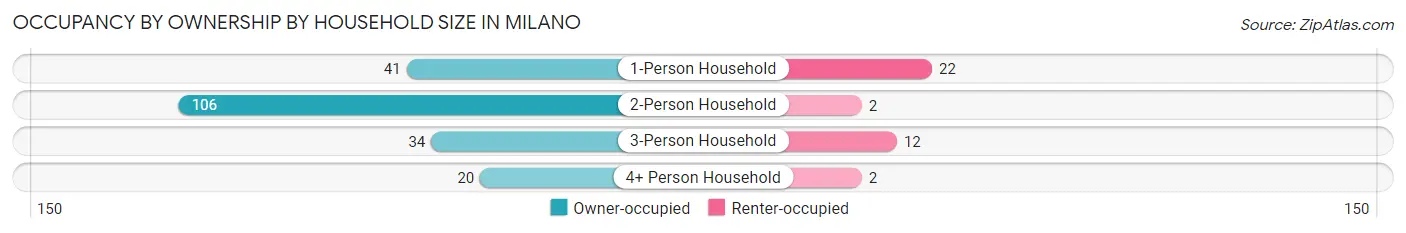
| Household Size | Owner-occupied | Renter-occupied |
| 1-Person Household | 41 (65.1%) | 22 (34.9%) |
| 2-Person Household | 106 (98.2%) | 2 (1.8%) |
| 3-Person Household | 34 (73.9%) | 12 (26.1%) |
| 4+ Person Household | 20 (90.9%) | 2 (9.1%) |
| Total Housing Units | 201 (84.1%) | 38 (15.9%) |
Occupancy by Educational Attainment in Milano
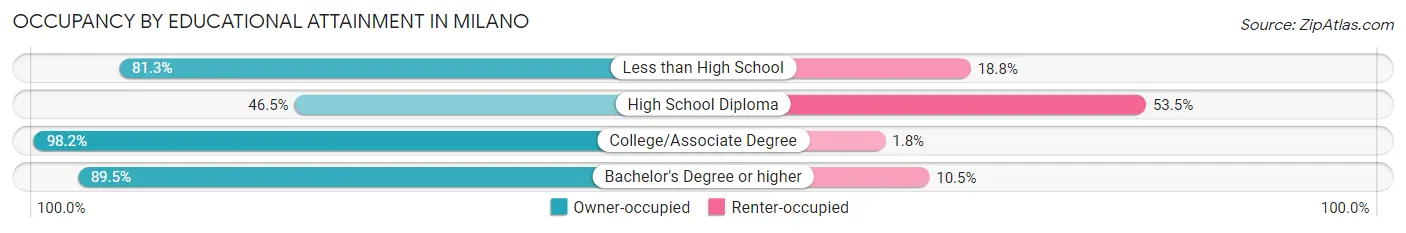
| Household Size | Owner-occupied | Renter-occupied |
| Less than High School | 39 (81.2%) | 9 (18.8%) |
| High School Diploma | 20 (46.5%) | 23 (53.5%) |
| College/Associate Degree | 108 (98.2%) | 2 (1.8%) |
| Bachelor's Degree or higher | 34 (89.5%) | 4 (10.5%) |
Occupancy by Age of Householder in Milano
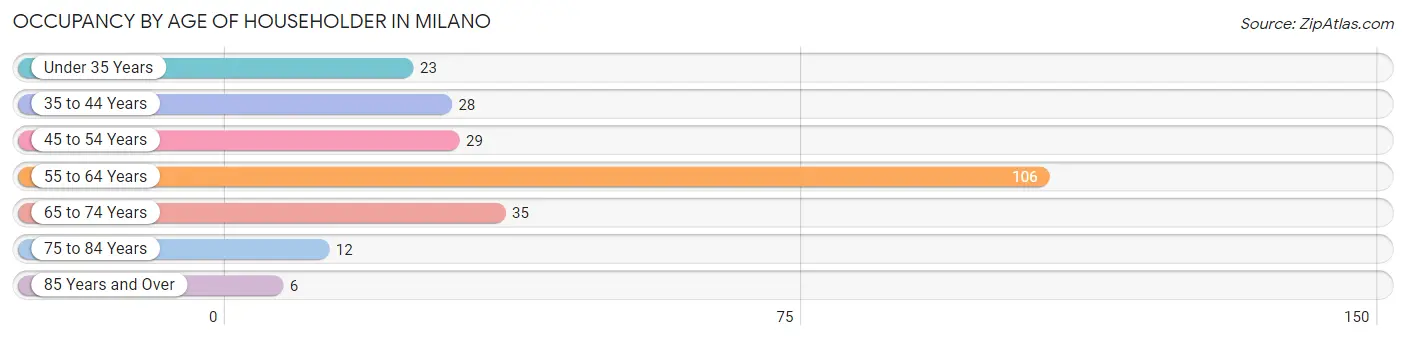
| Age Bracket | # Households | % Households |
| Under 35 Years | 23 | 9.6% |
| 35 to 44 Years | 28 | 11.7% |
| 45 to 54 Years | 29 | 12.1% |
| 55 to 64 Years | 106 | 44.4% |
| 65 to 74 Years | 35 | 14.6% |
| 75 to 84 Years | 12 | 5.0% |
| 85 Years and Over | 6 | 2.5% |
| Total | 239 | 100.0% |
Housing Finances in Milano
Median Income by Occupancy in Milano
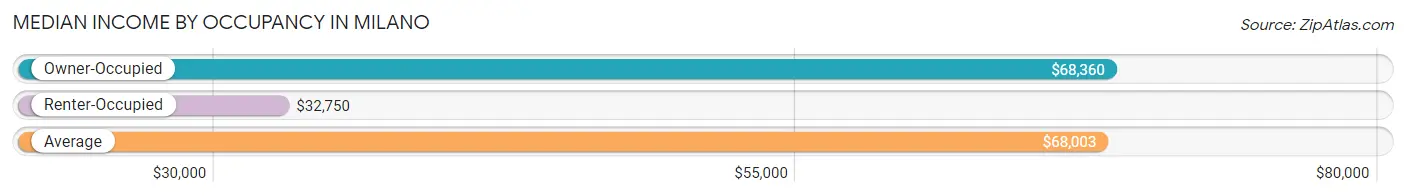
| Occupancy Type | # Households | Median Income |
| Owner-Occupied | 201 (84.1%) | $68,360 |
| Renter-Occupied | 38 (15.9%) | $32,750 |
| Average | 239 (100.0%) | $68,003 |
Occupancy by Householder Income Bracket in Milano
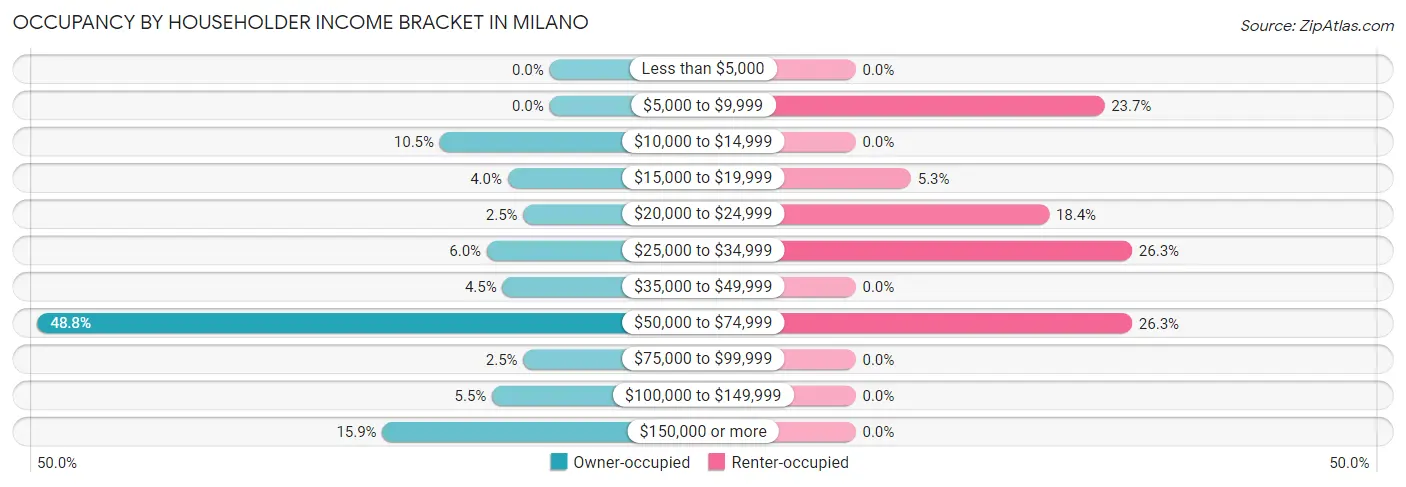
| Income Bracket | Owner-occupied | Renter-occupied |
| Less than $5,000 | 0 (0.0%) | 0 (0.0%) |
| $5,000 to $9,999 | 0 (0.0%) | 9 (23.7%) |
| $10,000 to $14,999 | 21 (10.4%) | 0 (0.0%) |
| $15,000 to $19,999 | 8 (4.0%) | 2 (5.3%) |
| $20,000 to $24,999 | 5 (2.5%) | 7 (18.4%) |
| $25,000 to $34,999 | 12 (6.0%) | 10 (26.3%) |
| $35,000 to $49,999 | 9 (4.5%) | 0 (0.0%) |
| $50,000 to $74,999 | 98 (48.8%) | 10 (26.3%) |
| $75,000 to $99,999 | 5 (2.5%) | 0 (0.0%) |
| $100,000 to $149,999 | 11 (5.5%) | 0 (0.0%) |
| $150,000 or more | 32 (15.9%) | 0 (0.0%) |
| Total | 201 (100.0%) | 38 (100.0%) |
Monthly Housing Cost Tiers in Milano
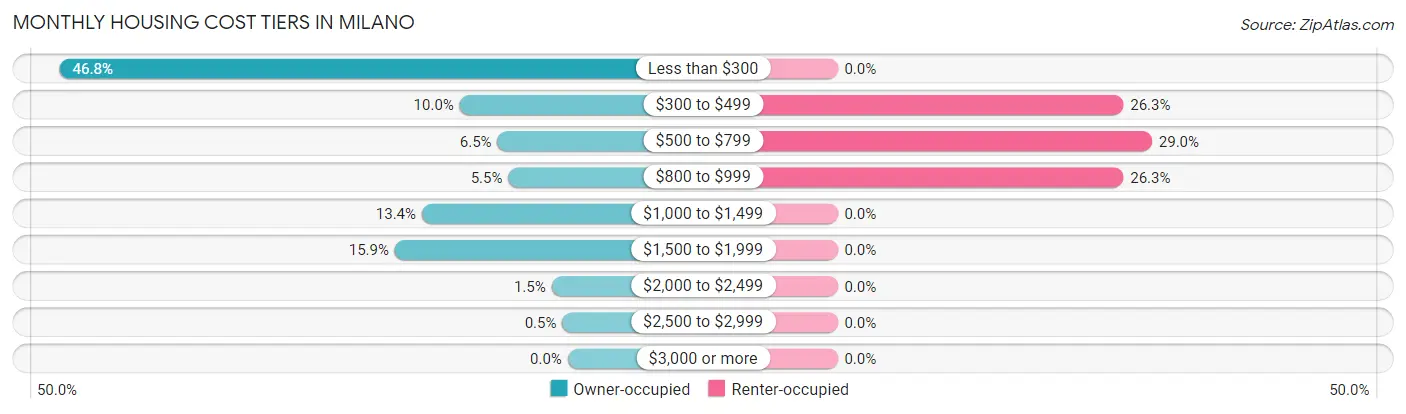
| Monthly Cost | Owner-occupied | Renter-occupied |
| Less than $300 | 94 (46.8%) | 0 (0.0%) |
| $300 to $499 | 20 (10.0%) | 10 (26.3%) |
| $500 to $799 | 13 (6.5%) | 11 (28.9%) |
| $800 to $999 | 11 (5.5%) | 10 (26.3%) |
| $1,000 to $1,499 | 27 (13.4%) | 0 (0.0%) |
| $1,500 to $1,999 | 32 (15.9%) | 0 (0.0%) |
| $2,000 to $2,499 | 3 (1.5%) | 0 (0.0%) |
| $2,500 to $2,999 | 1 (0.5%) | 0 (0.0%) |
| $3,000 or more | 0 (0.0%) | 0 (0.0%) |
| Total | 201 (100.0%) | 38 (100.0%) |
Physical Housing Characteristics in Milano
Housing Structures in Milano
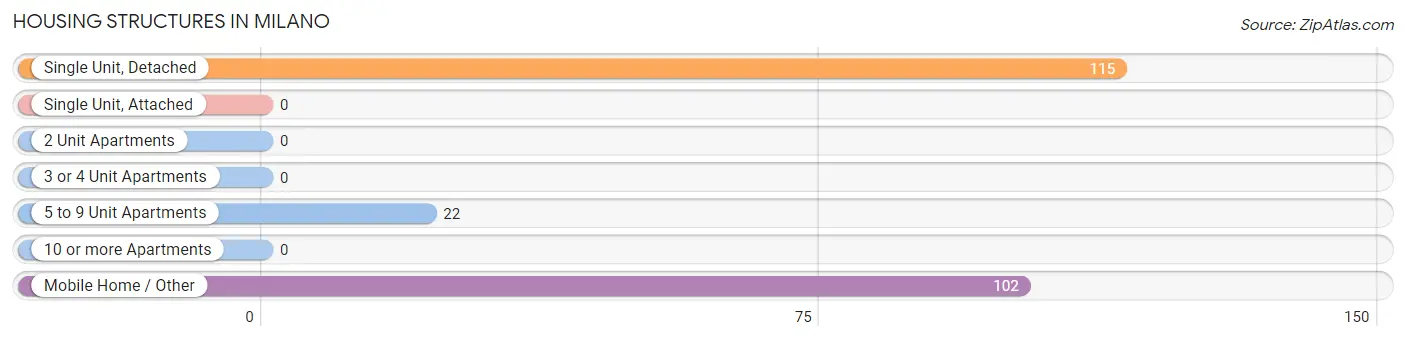
| Structure Type | # Housing Units | % Housing Units |
| Single Unit, Detached | 115 | 48.1% |
| Single Unit, Attached | 0 | 0.0% |
| 2 Unit Apartments | 0 | 0.0% |
| 3 or 4 Unit Apartments | 0 | 0.0% |
| 5 to 9 Unit Apartments | 22 | 9.2% |
| 10 or more Apartments | 0 | 0.0% |
| Mobile Home / Other | 102 | 42.7% |
| Total | 239 | 100.0% |
Housing Structures by Occupancy in Milano
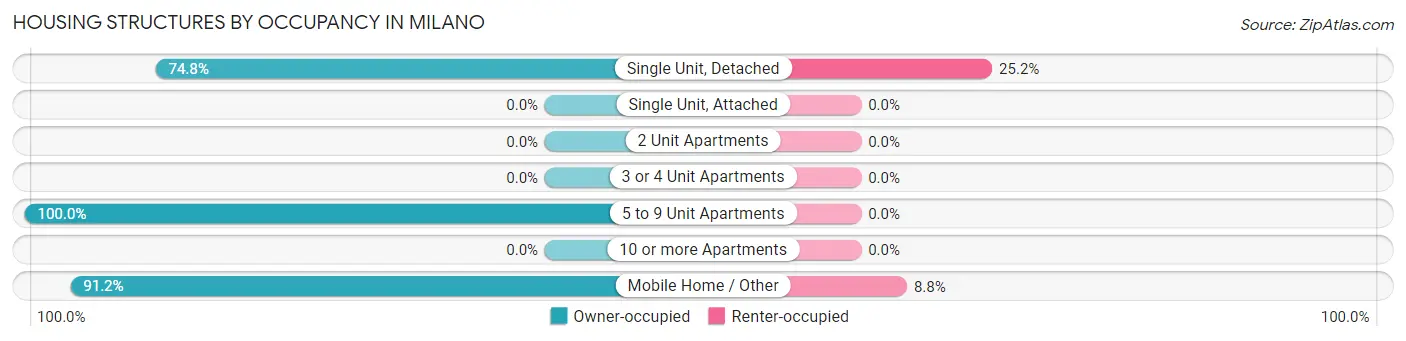
| Structure Type | Owner-occupied | Renter-occupied |
| Single Unit, Detached | 86 (74.8%) | 29 (25.2%) |
| Single Unit, Attached | 0 (0.0%) | 0 (0.0%) |
| 2 Unit Apartments | 0 (0.0%) | 0 (0.0%) |
| 3 or 4 Unit Apartments | 0 (0.0%) | 0 (0.0%) |
| 5 to 9 Unit Apartments | 22 (100.0%) | 0 (0.0%) |
| 10 or more Apartments | 0 (0.0%) | 0 (0.0%) |
| Mobile Home / Other | 93 (91.2%) | 9 (8.8%) |
| Total | 201 (84.1%) | 38 (15.9%) |
Housing Structures by Number of Rooms in Milano
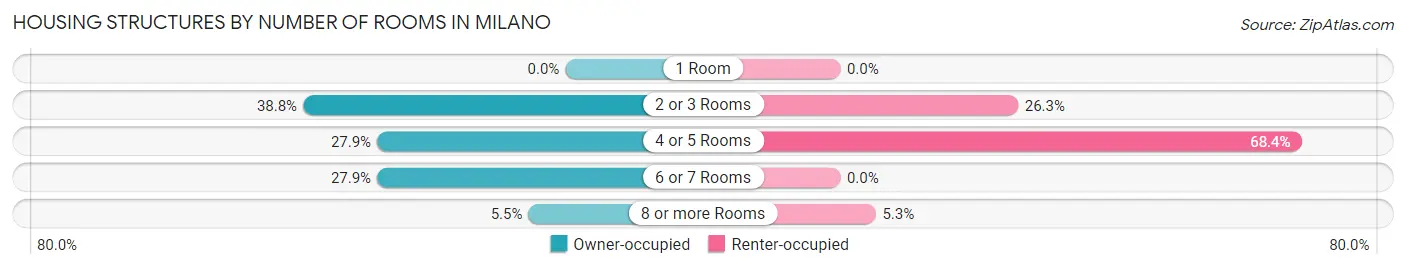
| Number of Rooms | Owner-occupied | Renter-occupied |
| 1 Room | 0 (0.0%) | 0 (0.0%) |
| 2 or 3 Rooms | 78 (38.8%) | 10 (26.3%) |
| 4 or 5 Rooms | 56 (27.9%) | 26 (68.4%) |
| 6 or 7 Rooms | 56 (27.9%) | 0 (0.0%) |
| 8 or more Rooms | 11 (5.5%) | 2 (5.3%) |
| Total | 201 (100.0%) | 38 (100.0%) |
Housing Structure by Heating Type in Milano
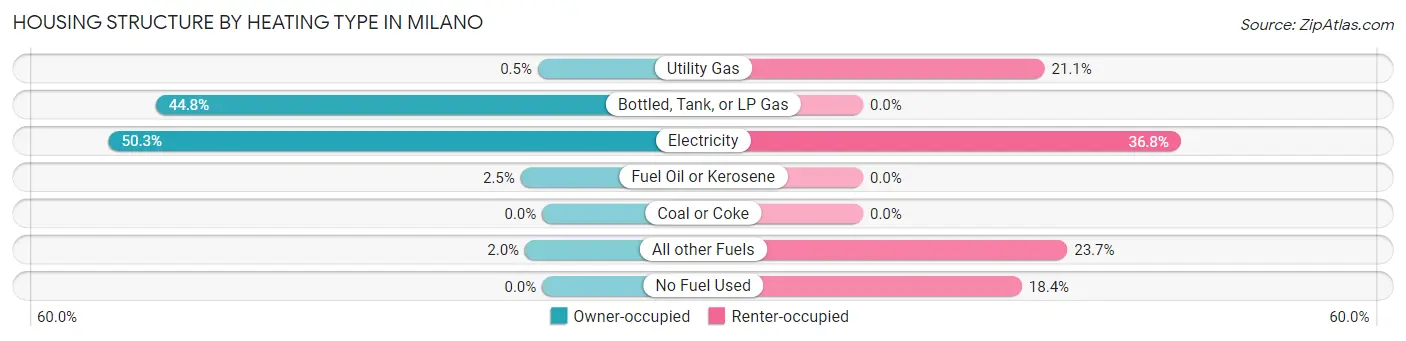
| Heating Type | Owner-occupied | Renter-occupied |
| Utility Gas | 1 (0.5%) | 8 (21.0%) |
| Bottled, Tank, or LP Gas | 90 (44.8%) | 0 (0.0%) |
| Electricity | 101 (50.2%) | 14 (36.8%) |
| Fuel Oil or Kerosene | 5 (2.5%) | 0 (0.0%) |
| Coal or Coke | 0 (0.0%) | 0 (0.0%) |
| All other Fuels | 4 (2.0%) | 9 (23.7%) |
| No Fuel Used | 0 (0.0%) | 7 (18.4%) |
| Total | 201 (100.0%) | 38 (100.0%) |
Household Vehicle Usage in Milano
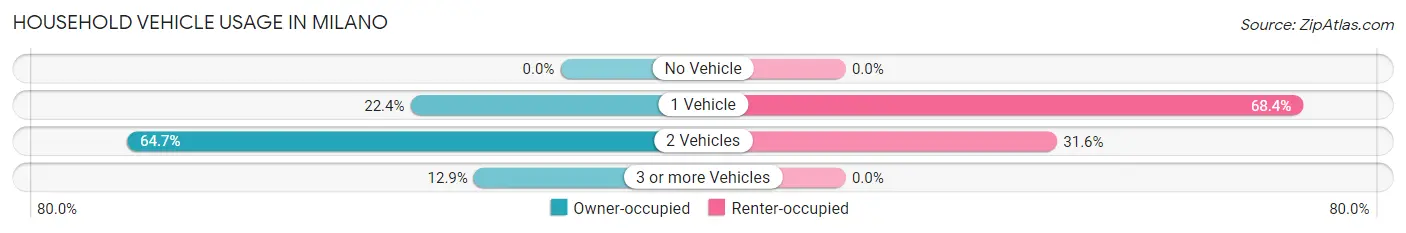
| Vehicles per Household | Owner-occupied | Renter-occupied |
| No Vehicle | 0 (0.0%) | 0 (0.0%) |
| 1 Vehicle | 45 (22.4%) | 26 (68.4%) |
| 2 Vehicles | 130 (64.7%) | 12 (31.6%) |
| 3 or more Vehicles | 26 (12.9%) | 0 (0.0%) |
| Total | 201 (100.0%) | 38 (100.0%) |
Real Estate & Mortgages in Milano
Real Estate and Mortgage Overview in Milano
| Characteristic | Without Mortgage | With Mortgage |
| Housing Units | 135 | 66 |
| Median Property Value | $9,999 | $0 |
| Median Household Income | $68,198 | $30 |
| Monthly Housing Costs | $194 | $0 |
| Real Estate Taxes | $517 | $0 |
Property Value by Mortgage Status in Milano
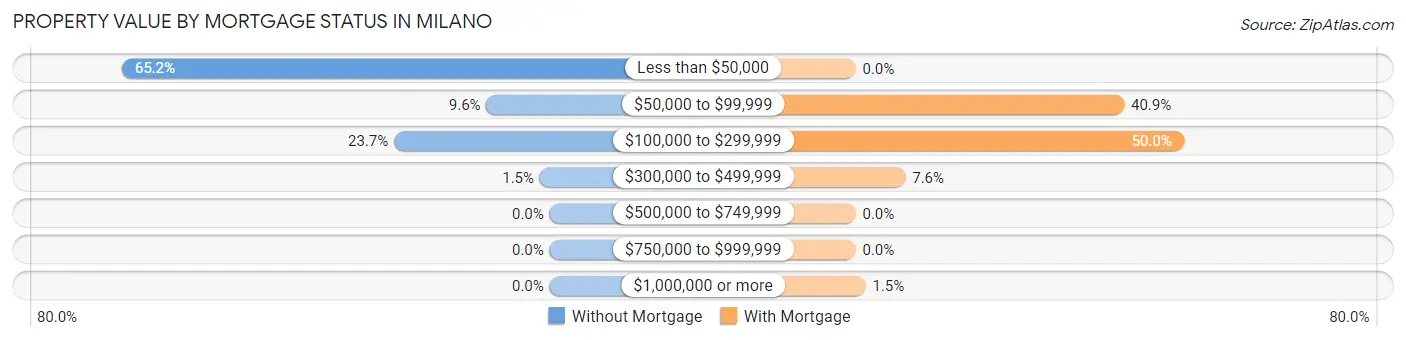
| Property Value | Without Mortgage | With Mortgage |
| Less than $50,000 | 88 (65.2%) | 0 (0.0%) |
| $50,000 to $99,999 | 13 (9.6%) | 27 (40.9%) |
| $100,000 to $299,999 | 32 (23.7%) | 33 (50.0%) |
| $300,000 to $499,999 | 2 (1.5%) | 5 (7.6%) |
| $500,000 to $749,999 | 0 (0.0%) | 0 (0.0%) |
| $750,000 to $999,999 | 0 (0.0%) | 0 (0.0%) |
| $1,000,000 or more | 0 (0.0%) | 1 (1.5%) |
| Total | 135 (100.0%) | 66 (100.0%) |
Household Income by Mortgage Status in Milano
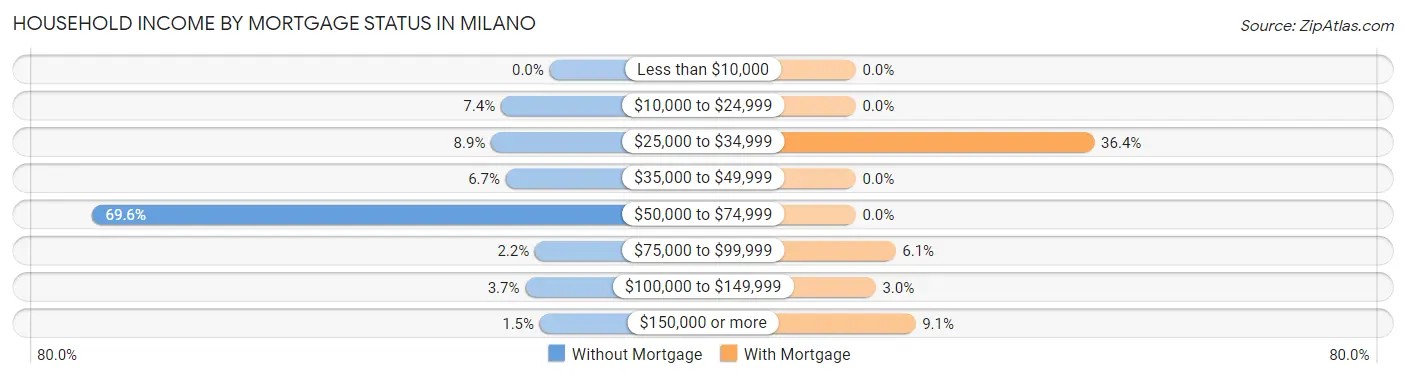
| Household Income | Without Mortgage | With Mortgage |
| Less than $10,000 | 0 (0.0%) | 0 (0.0%) |
| $10,000 to $24,999 | 10 (7.4%) | 0 (0.0%) |
| $25,000 to $34,999 | 12 (8.9%) | 24 (36.4%) |
| $35,000 to $49,999 | 9 (6.7%) | 0 (0.0%) |
| $50,000 to $74,999 | 94 (69.6%) | 0 (0.0%) |
| $75,000 to $99,999 | 3 (2.2%) | 4 (6.1%) |
| $100,000 to $149,999 | 5 (3.7%) | 2 (3.0%) |
| $150,000 or more | 2 (1.5%) | 6 (9.1%) |
| Total | 135 (100.0%) | 66 (100.0%) |
Property Value to Household Income Ratio in Milano
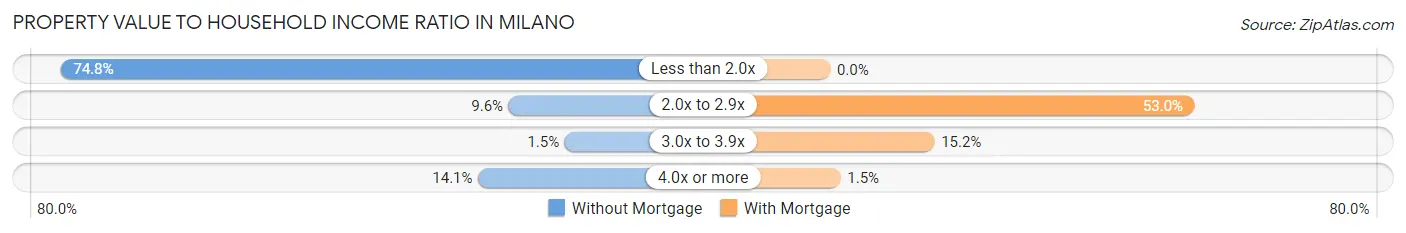
| Value-to-Income Ratio | Without Mortgage | With Mortgage |
| Less than 2.0x | 101 (74.8%) | 0 (0.0%) |
| 2.0x to 2.9x | 13 (9.6%) | 35 (53.0%) |
| 3.0x to 3.9x | 2 (1.5%) | 10 (15.1%) |
| 4.0x or more | 19 (14.1%) | 1 (1.5%) |
| Total | 135 (100.0%) | 66 (100.0%) |
Real Estate Taxes by Mortgage Status in Milano

| Property Taxes | Without Mortgage | With Mortgage |
| Less than $800 | 112 (83.0%) | 0 (0.0%) |
| $800 to $1,499 | 7 (5.2%) | 0 (0.0%) |
| $800 to $1,499 | 14 (10.4%) | 25 (37.9%) |
| Total | 135 (100.0%) | 66 (100.0%) |
Health & Disability in Milano
Health Insurance Coverage by Age in Milano
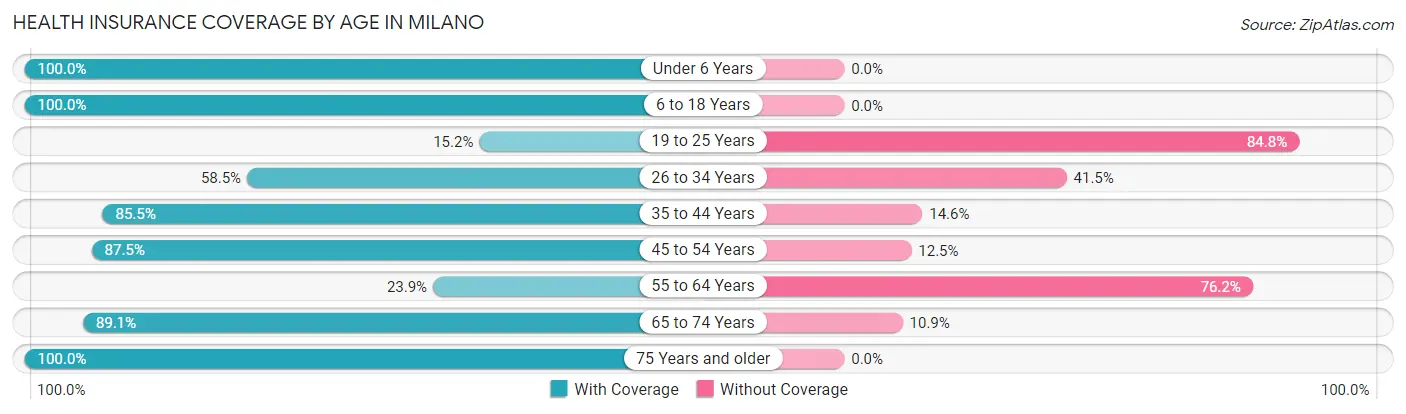
| Age Bracket | With Coverage | Without Coverage |
| Under 6 Years | 38 (100.0%) | 0 (0.0%) |
| 6 to 18 Years | 96 (100.0%) | 0 (0.0%) |
| 19 to 25 Years | 21 (15.2%) | 117 (84.8%) |
| 26 to 34 Years | 24 (58.5%) | 17 (41.5%) |
| 35 to 44 Years | 47 (85.5%) | 8 (14.5%) |
| 45 to 54 Years | 35 (87.5%) | 5 (12.5%) |
| 55 to 64 Years | 31 (23.8%) | 99 (76.1%) |
| 65 to 74 Years | 41 (89.1%) | 5 (10.9%) |
| 75 Years and older | 24 (100.0%) | 0 (0.0%) |
| Total | 357 (58.7%) | 251 (41.3%) |
Health Insurance Coverage by Citizenship Status in Milano

| Citizenship Status | With Coverage | Without Coverage |
| Native Born | 38 (100.0%) | 0 (0.0%) |
| Foreign Born, Citizen | 96 (100.0%) | 0 (0.0%) |
| Foreign Born, not a Citizen | 21 (15.2%) | 117 (84.8%) |
Health Insurance Coverage by Household Income in Milano
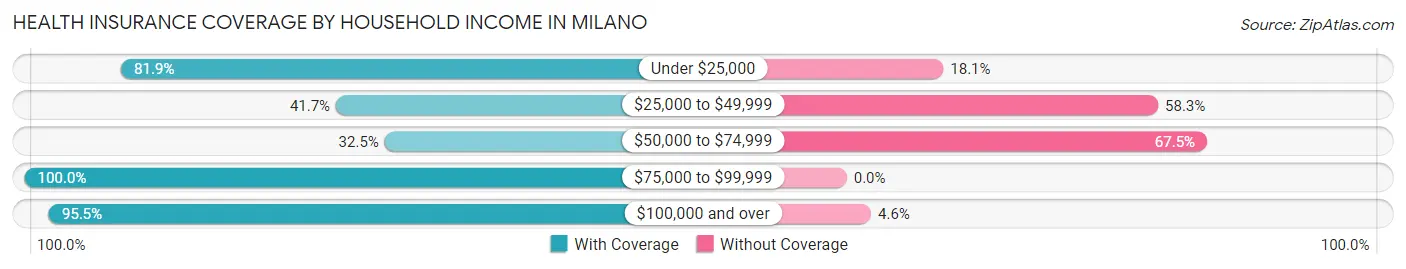
| Household Income | With Coverage | Without Coverage |
| Under $25,000 | 77 (81.9%) | 17 (18.1%) |
| $25,000 to $49,999 | 20 (41.7%) | 28 (58.3%) |
| $50,000 to $74,999 | 96 (32.5%) | 199 (67.5%) |
| $75,000 to $99,999 | 17 (100.0%) | 0 (0.0%) |
| $100,000 and over | 147 (95.5%) | 7 (4.5%) |
Public vs Private Health Insurance Coverage by Age in Milano
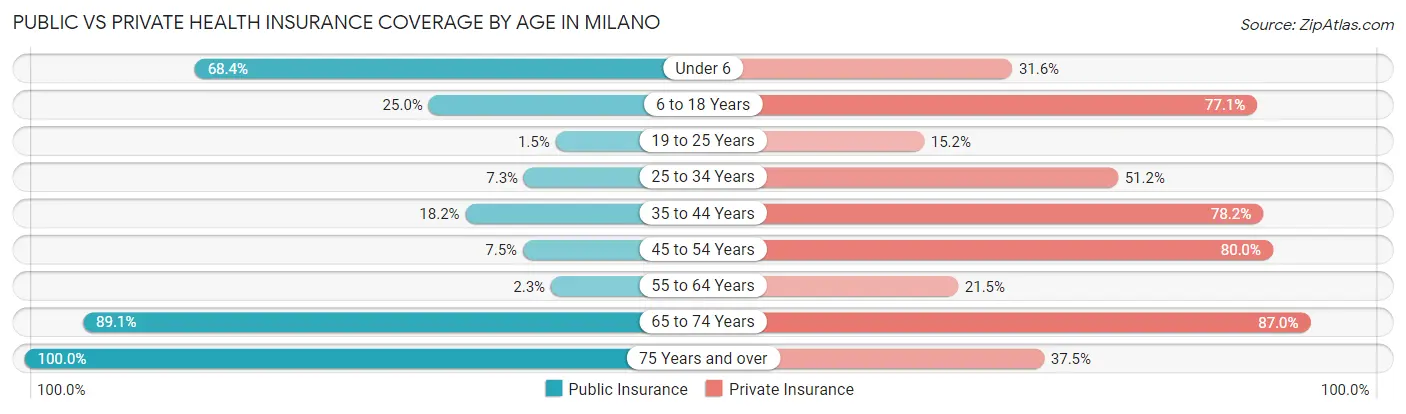
| Age Bracket | Public Insurance | Private Insurance |
| Under 6 | 26 (68.4%) | 12 (31.6%) |
| 6 to 18 Years | 24 (25.0%) | 74 (77.1%) |
| 19 to 25 Years | 2 (1.5%) | 21 (15.2%) |
| 25 to 34 Years | 3 (7.3%) | 21 (51.2%) |
| 35 to 44 Years | 10 (18.2%) | 43 (78.2%) |
| 45 to 54 Years | 3 (7.5%) | 32 (80.0%) |
| 55 to 64 Years | 3 (2.3%) | 28 (21.5%) |
| 65 to 74 Years | 41 (89.1%) | 40 (87.0%) |
| 75 Years and over | 24 (100.0%) | 9 (37.5%) |
| Total | 136 (22.4%) | 280 (46.1%) |
Disability Status by Sex by Age in Milano
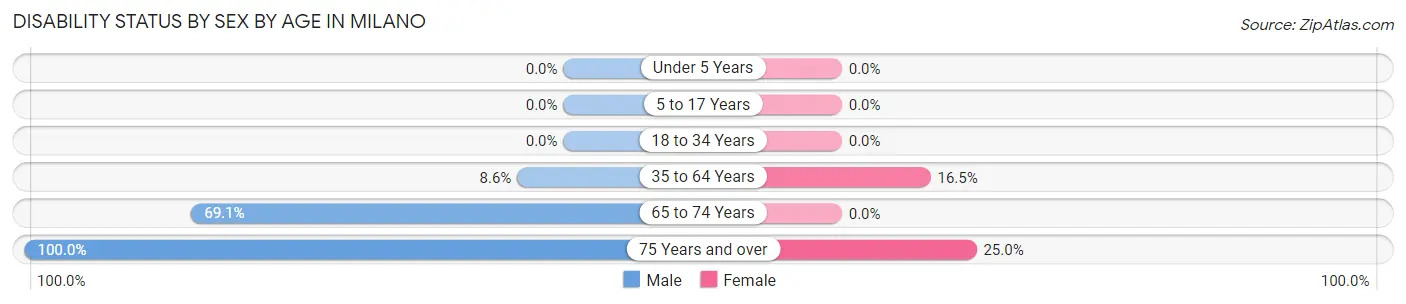
| Age Bracket | Male | Female |
| Under 5 Years | 0 (0.0%) | 0 (0.0%) |
| 5 to 17 Years | 0 (0.0%) | 0 (0.0%) |
| 18 to 34 Years | 0 (0.0%) | 0 (0.0%) |
| 35 to 64 Years | 12 (8.6%) | 14 (16.5%) |
| 65 to 74 Years | 29 (69.1%) | 0 (0.0%) |
| 75 Years and over | 4 (100.0%) | 5 (25.0%) |
Disability Class by Sex by Age in Milano
Disability Class: Hearing Difficulty
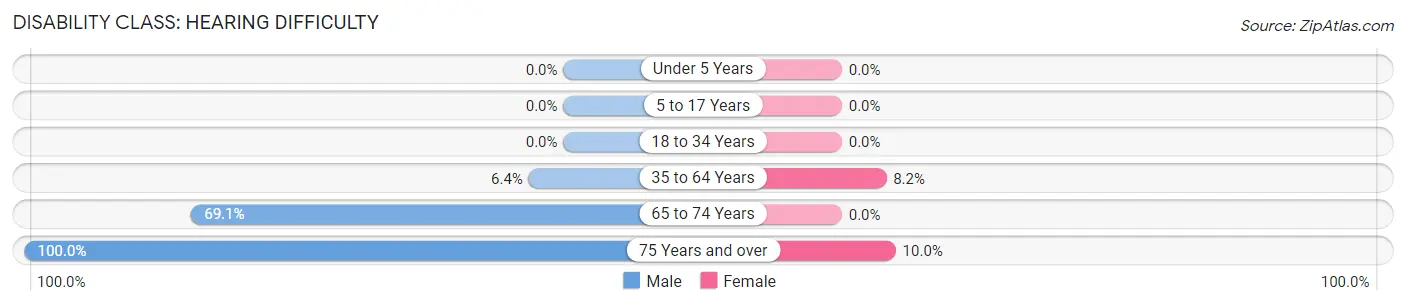
| Age Bracket | Male | Female |
| Under 5 Years | 0 (0.0%) | 0 (0.0%) |
| 5 to 17 Years | 0 (0.0%) | 0 (0.0%) |
| 18 to 34 Years | 0 (0.0%) | 0 (0.0%) |
| 35 to 64 Years | 9 (6.4%) | 7 (8.2%) |
| 65 to 74 Years | 29 (69.1%) | 0 (0.0%) |
| 75 Years and over | 4 (100.0%) | 2 (10.0%) |
Disability Class: Vision Difficulty
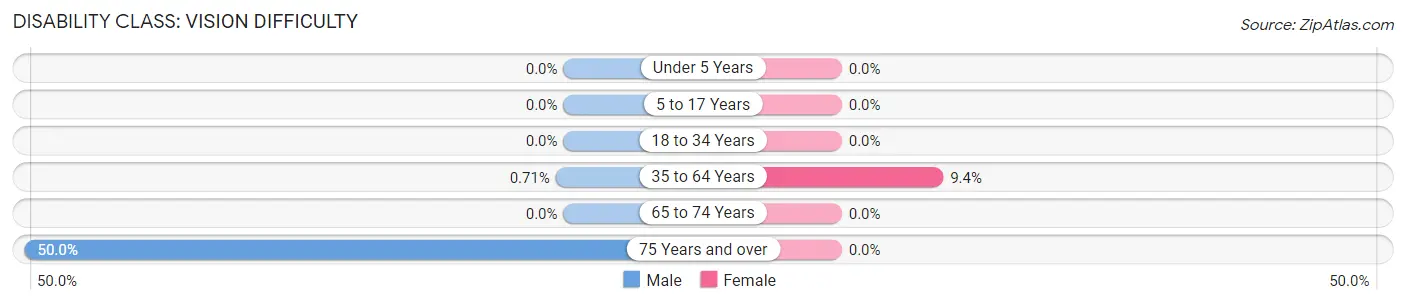
| Age Bracket | Male | Female |
| Under 5 Years | 0 (0.0%) | 0 (0.0%) |
| 5 to 17 Years | 0 (0.0%) | 0 (0.0%) |
| 18 to 34 Years | 0 (0.0%) | 0 (0.0%) |
| 35 to 64 Years | 1 (0.7%) | 8 (9.4%) |
| 65 to 74 Years | 0 (0.0%) | 0 (0.0%) |
| 75 Years and over | 2 (50.0%) | 0 (0.0%) |
Disability Class: Cognitive Difficulty
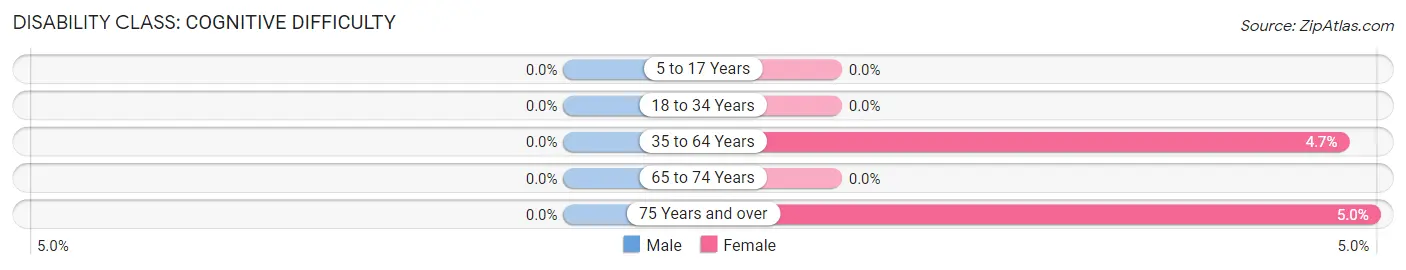
| Age Bracket | Male | Female |
| 5 to 17 Years | 0 (0.0%) | 0 (0.0%) |
| 18 to 34 Years | 0 (0.0%) | 0 (0.0%) |
| 35 to 64 Years | 0 (0.0%) | 4 (4.7%) |
| 65 to 74 Years | 0 (0.0%) | 0 (0.0%) |
| 75 Years and over | 0 (0.0%) | 1 (5.0%) |
Disability Class: Ambulatory Difficulty
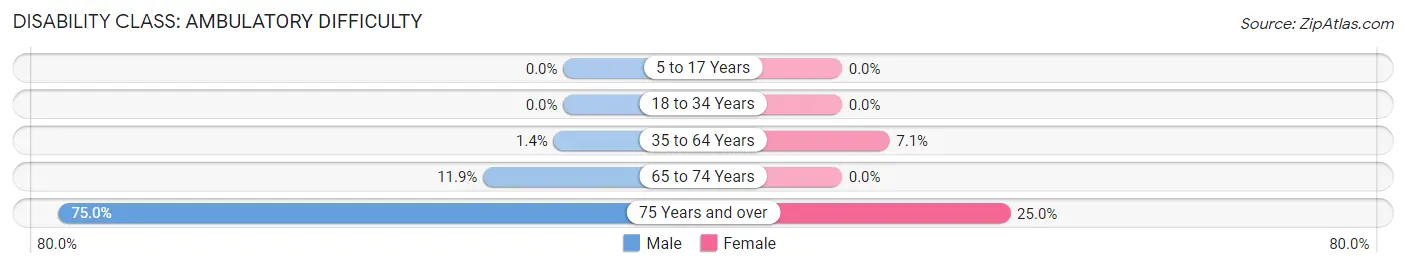
| Age Bracket | Male | Female |
| 5 to 17 Years | 0 (0.0%) | 0 (0.0%) |
| 18 to 34 Years | 0 (0.0%) | 0 (0.0%) |
| 35 to 64 Years | 2 (1.4%) | 6 (7.1%) |
| 65 to 74 Years | 5 (11.9%) | 0 (0.0%) |
| 75 Years and over | 3 (75.0%) | 5 (25.0%) |
Disability Class: Self-Care Difficulty
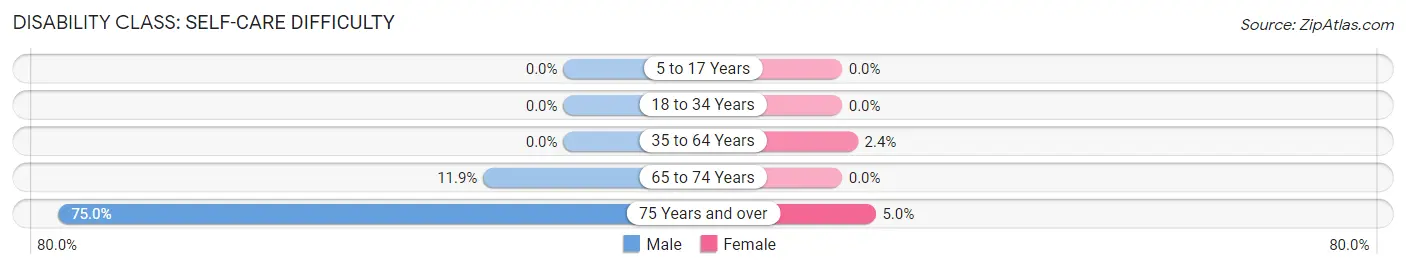
| Age Bracket | Male | Female |
| 5 to 17 Years | 0 (0.0%) | 0 (0.0%) |
| 18 to 34 Years | 0 (0.0%) | 0 (0.0%) |
| 35 to 64 Years | 0 (0.0%) | 2 (2.4%) |
| 65 to 74 Years | 5 (11.9%) | 0 (0.0%) |
| 75 Years and over | 3 (75.0%) | 1 (5.0%) |
Technology Access in Milano
Computing Device Access in Milano
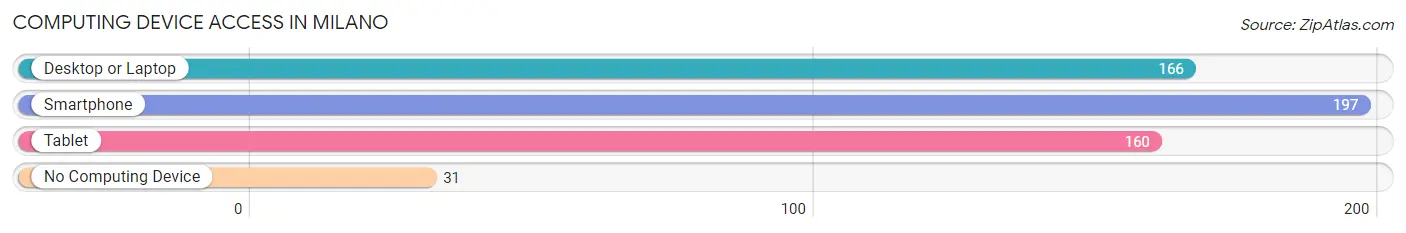
| Device Type | # Households | % Households |
| Desktop or Laptop | 166 | 69.5% |
| Smartphone | 197 | 82.4% |
| Tablet | 160 | 66.9% |
| No Computing Device | 31 | 13.0% |
| Total | 239 | 100.0% |
Internet Access in Milano
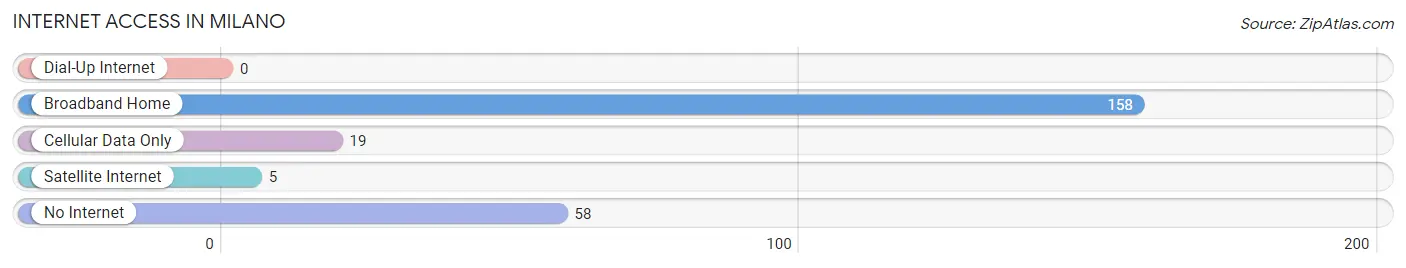
| Internet Type | # Households | % Households |
| Dial-Up Internet | 0 | 0.0% |
| Broadband Home | 158 | 66.1% |
| Cellular Data Only | 19 | 8.0% |
| Satellite Internet | 5 | 2.1% |
| No Internet | 58 | 24.3% |
| Total | 239 | 100.0% |
Milano Summary
Milano, Texas is a small town located in the heart of Central Texas. It is situated in the Milam County, which is part of the larger Brazos Valley region. The town is located about halfway between Austin and Houston, and is about an hour and a half drive from both cities. The population of Milano was estimated to be 1,092 in 2019.
History
Milano was founded in 1881 by a group of settlers from the nearby town of Cameron. The town was named after the Italian city of Milan, and was originally intended to be a stop on the Houston and Texas Central Railway. The town quickly grew, and by the early 1900s, it had become a thriving agricultural center. The town was home to several cotton gins, a cottonseed oil mill, and a number of other businesses.
In the early 1900s, Milano was also home to a number of churches, including the First Baptist Church, the First Methodist Church, and the First Presbyterian Church. The town also had a number of schools, including the Milano High School, which was established in 1910.
Geography
Milano is located in the heart of Central Texas, about halfway between Austin and Houston. The town is situated in the Milam County, which is part of the larger Brazos Valley region. The town is located on the banks of the Little River, which is a tributary of the Brazos River. The town is surrounded by rolling hills and farmland, and is located about 30 miles from the nearest major city, College Station.
Economy
The economy of Milano is largely based on agriculture. The town is home to several cotton gins, a cottonseed oil mill, and a number of other businesses. The town is also home to a number of small businesses, including restaurants, shops, and other services.
Demographics
As of 2019, the population of Milano was estimated to be 1,092. The town is predominantly white, with about 85% of the population identifying as white. The remaining 15% of the population is made up of African Americans, Hispanics, and other ethnicities. The median household income in Milano is $41,000, and the median home value is $90,000. The town has a poverty rate of about 17%, which is slightly higher than the national average.
Conclusion
Milano, Texas is a small town located in the heart of Central Texas. It is situated in the Milam County, which is part of the larger Brazos Valley region. The town is home to a number of businesses, including cotton gins, a cottonseed oil mill, and a number of other businesses. The town is predominantly white, with about 85% of the population identifying as white. The median household income in Milano is $41,000, and the median home value is $90,000. The town has a poverty rate of about 17%, which is slightly higher than the national average.
Common Questions
What is Per Capita Income in Milano?
Per Capita income in Milano is $39,480.
What is the Median Family Income in Milano?
Median Family Income in Milano is $69,123.
What is the Median Household income in Milano?
Median Household Income in Milano is $68,003.
What is Income or Wage Gap in Milano?
Income or Wage Gap in Milano is 25.8%.
Women in Milano earn 74.2 cents for every dollar earned by a man.
What is Inequality or Gini Index in Milano?
Inequality or Gini Index in Milano is 0.51.
What is the Total Population of Milano?
Total Population of Milano is 608.
What is the Total Male Population of Milano?
Total Male Population of Milano is 446.
What is the Total Female Population of Milano?
Total Female Population of Milano is 162.
What is the Ratio of Males per 100 Females in Milano?
There are 275.31 Males per 100 Females in Milano.
What is the Ratio of Females per 100 Males in Milano?
There are 36.32 Females per 100 Males in Milano.
What is the Median Population Age in Milano?
Median Population Age in Milano is 32.1 Years.
What is the Average Family Size in Milano
Average Family Size in Milano is 3.1 People.
What is the Average Household Size in Milano
Average Household Size in Milano is 2.5 People.
How Large is the Labor Force in Milano?
There are 358 People in the Labor Forcein in Milano.
What is the Percentage of People in the Labor Force in Milano?
73.1% of People are in the Labor Force in Milano.
What is the Unemployment Rate in Milano?
Unemployment Rate in Milano is 1.7%.