Milam, TX Map & Demographics
Milam Map
Milam Overview
$36,062
PER CAPITA INCOME
$46,477
AVG FAMILY INCOME
$43,011
AVG HOUSEHOLD INCOME
0.60
INEQUALITY / GINI INDEX
1,536
TOTAL POPULATION
846
MALE POPULATION
690
FEMALE POPULATION
122.61
MALES / 100 FEMALES
81.56
FEMALES / 100 MALES
46.4
MEDIAN AGE
2.9
AVG FAMILY SIZE
2.4
AVG HOUSEHOLD SIZE
555
LABOR FORCE [ PEOPLE ]
45.2%
PERCENT IN LABOR FORCE
6.1%
UNEMPLOYMENT RATE
Milam Zip Codes
Milam Area Codes
Income in Milam
Income Overview in Milam
Per Capita Income in Milam is $36,062, while median incomes of families and households are $46,477 and $43,011 respectively.
| Characteristic | Number | Measure |
| Per Capita Income | 1,536 | $36,062 |
| Median Family Income | 461 | $46,477 |
| Mean Family Income | 461 | $71,749 |
| Median Household Income | 635 | $43,011 |
| Mean Household Income | 635 | $83,831 |
| Income Deficit | 461 | $0 |
| Wage / Income Gap (%) | 1,536 | 0.00% |
| Wage / Income Gap ($) | 1,536 | 100.00¢ per $1 |
| Gini / Inequality Index | 1,536 | 0.60 |
Earnings by Sex in Milam
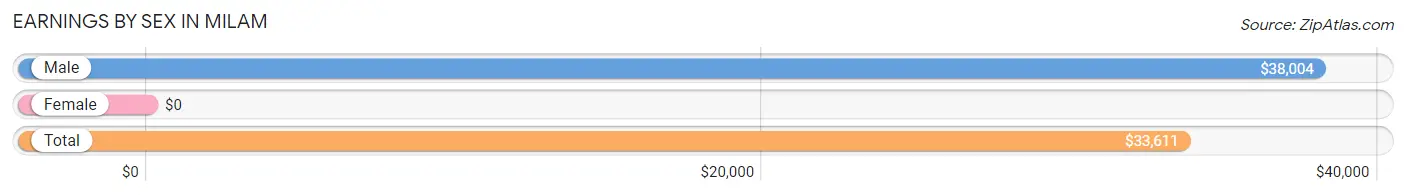
| Sex | Number | Average Earnings |
| Male | 369 (67.3%) | $38,004 |
| Female | 179 (32.7%) | $0 |
| Total | 548 (100.0%) | $33,611 |
Earnings by Sex by Income Bracket in Milam
The most common earnings brackets in Milam are $100,000+ for men (80 | 21.7%) and $40,000 to $44,999 for women (61 | 34.1%).
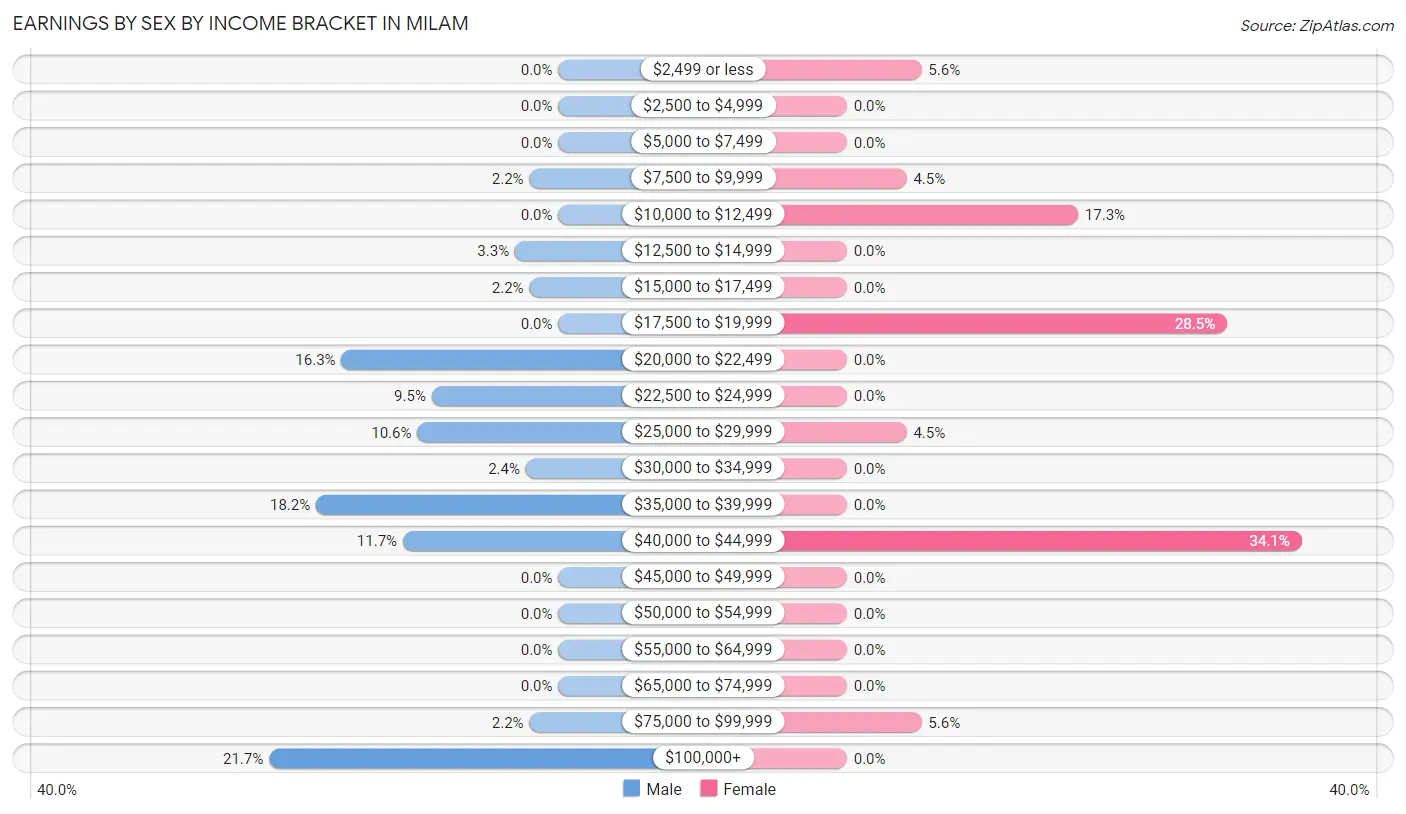
| Income | Male | Female |
| $2,499 or less | 0 (0.0%) | 10 (5.6%) |
| $2,500 to $4,999 | 0 (0.0%) | 0 (0.0%) |
| $5,000 to $7,499 | 0 (0.0%) | 0 (0.0%) |
| $7,500 to $9,999 | 8 (2.2%) | 8 (4.5%) |
| $10,000 to $12,499 | 0 (0.0%) | 31 (17.3%) |
| $12,500 to $14,999 | 12 (3.3%) | 0 (0.0%) |
| $15,000 to $17,499 | 8 (2.2%) | 0 (0.0%) |
| $17,500 to $19,999 | 0 (0.0%) | 51 (28.5%) |
| $20,000 to $22,499 | 60 (16.3%) | 0 (0.0%) |
| $22,500 to $24,999 | 35 (9.5%) | 0 (0.0%) |
| $25,000 to $29,999 | 39 (10.6%) | 8 (4.5%) |
| $30,000 to $34,999 | 9 (2.4%) | 0 (0.0%) |
| $35,000 to $39,999 | 67 (18.2%) | 0 (0.0%) |
| $40,000 to $44,999 | 43 (11.7%) | 61 (34.1%) |
| $45,000 to $49,999 | 0 (0.0%) | 0 (0.0%) |
| $50,000 to $54,999 | 0 (0.0%) | 0 (0.0%) |
| $55,000 to $64,999 | 0 (0.0%) | 0 (0.0%) |
| $65,000 to $74,999 | 0 (0.0%) | 0 (0.0%) |
| $75,000 to $99,999 | 8 (2.2%) | 10 (5.6%) |
| $100,000+ | 80 (21.7%) | 0 (0.0%) |
| Total | 369 (100.0%) | 179 (100.0%) |
Earnings by Sex by Educational Attainment in Milam
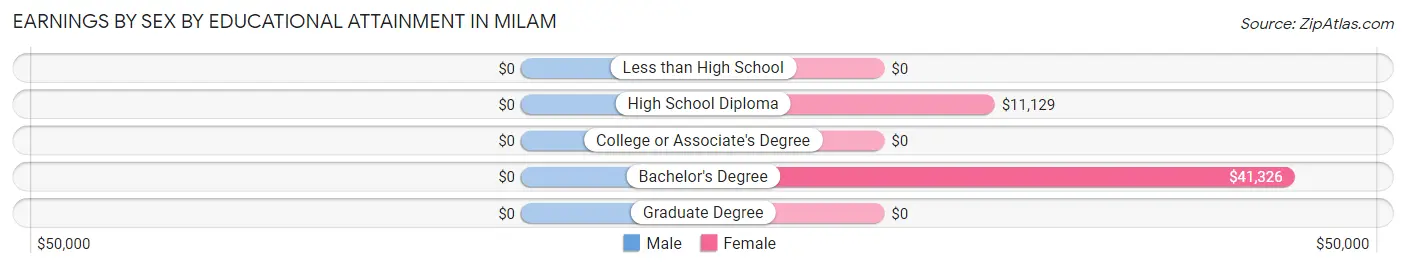
| Educational Attainment | Male Income | Female Income |
| Less than High School | - | - |
| High School Diploma | - | - |
| College or Associate's Degree | - | - |
| Bachelor's Degree | - | - |
| Graduate Degree | - | - |
| Total | $38,228 | $0 |
Family Income in Milam
Family Income Brackets in Milam
According to the Milam family income data, there are 119 families falling into the $50,000 to $74,999 income range, which is the most common income bracket and makes up 25.8% of all families.
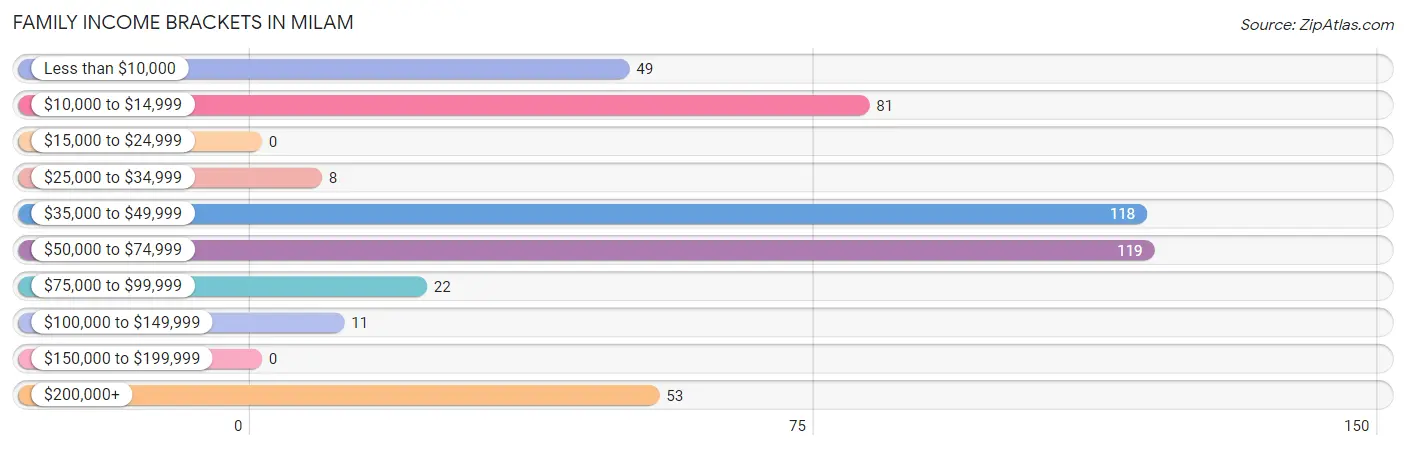
| Income Bracket | # Families | % Families |
| Less than $10,000 | 49 | 10.6% |
| $10,000 to $14,999 | 81 | 17.6% |
| $15,000 to $24,999 | 0 | 0.0% |
| $25,000 to $34,999 | 8 | 1.7% |
| $35,000 to $49,999 | 118 | 25.6% |
| $50,000 to $74,999 | 119 | 25.8% |
| $75,000 to $99,999 | 22 | 4.8% |
| $100,000 to $149,999 | 11 | 2.4% |
| $150,000 to $199,999 | 0 | 0.0% |
| $200,000+ | 53 | 11.5% |
Family Income by Famaliy Size in Milam
2-person families (303 | 65.7%) account for the highest median family income in Milam with $45,265 per family, while 2-person families (303 | 65.7%) have the highest median income of $22,632 per family member.
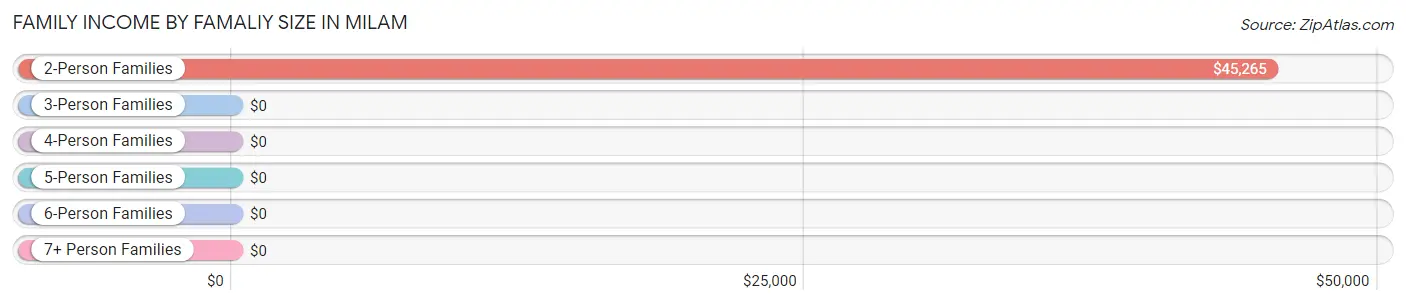
| Income Bracket | # Families | Median Income |
| 2-Person Families | 303 (65.7%) | $45,265 |
| 3-Person Families | 67 (14.5%) | $0 |
| 4-Person Families | 5 (1.1%) | $0 |
| 5-Person Families | 63 (13.7%) | $0 |
| 6-Person Families | 23 (5.0%) | $0 |
| 7+ Person Families | 0 (0.0%) | $0 |
| Total | 461 (100.0%) | $46,477 |
Family Income by Number of Earners in Milam
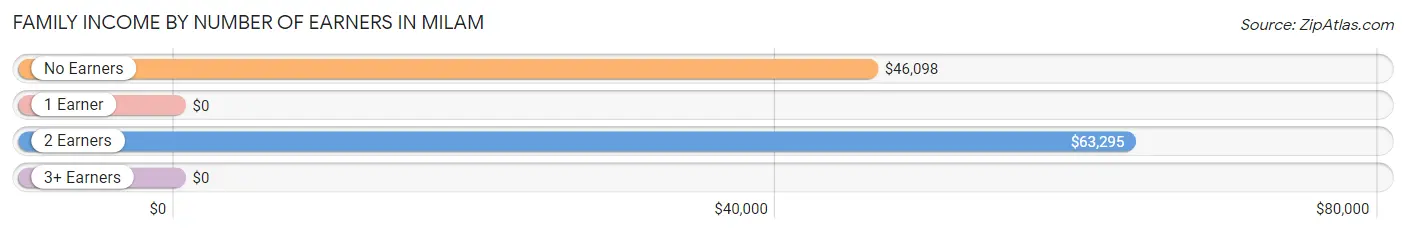
| Number of Earners | # Families | Median Income |
| No Earners | 223 (48.4%) | $46,098 |
| 1 Earner | 99 (21.5%) | $0 |
| 2 Earners | 139 (30.1%) | $63,295 |
| 3+ Earners | 0 (0.0%) | $0 |
| Total | 461 (100.0%) | $46,477 |
Household Income in Milam
Household Income Brackets in Milam
With 138 households falling in the category, the $35,000 to $49,999 income range is the most frequent in Milam, accounting for 21.7% of all households.
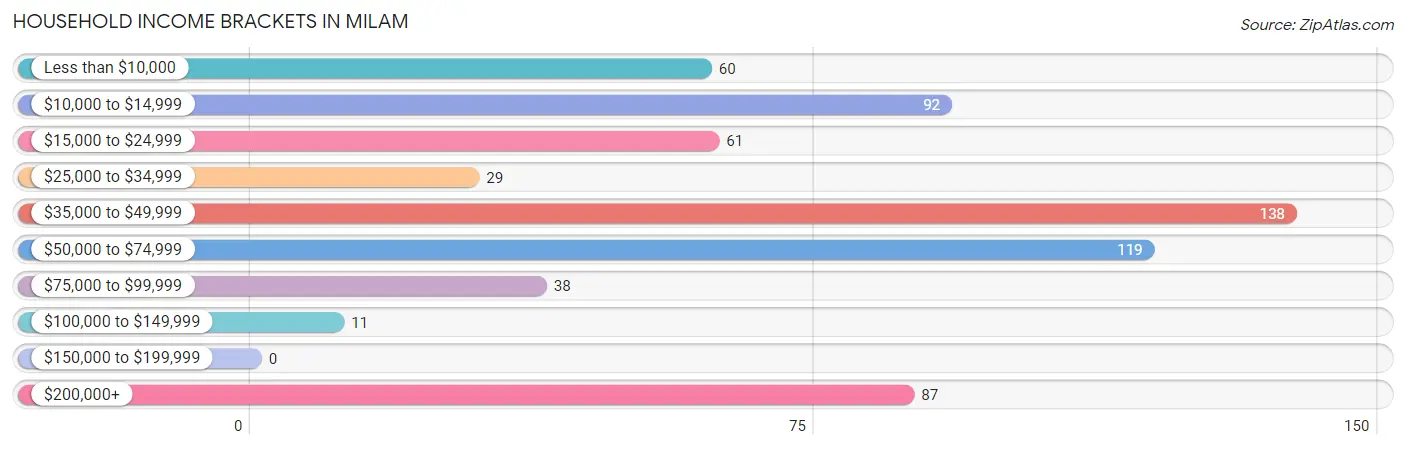
| Income Bracket | # Households | % Households |
| Less than $10,000 | 60 | 9.4% |
| $10,000 to $14,999 | 92 | 14.5% |
| $15,000 to $24,999 | 61 | 9.6% |
| $25,000 to $34,999 | 29 | 4.6% |
| $35,000 to $49,999 | 138 | 21.7% |
| $50,000 to $74,999 | 119 | 18.7% |
| $75,000 to $99,999 | 38 | 6.0% |
| $100,000 to $149,999 | 11 | 1.7% |
| $150,000 to $199,999 | 0 | 0.0% |
| $200,000+ | 87 | 13.7% |
Household Income by Householder Age in Milam
The median household income in Milam is $43,011, with the highest median household income of $46,061 found in the 65+ years age bracket for the primary householder. A total of 274 households (43.1%) fall into this category. Meanwhile, the 15 to 24 years age bracket for the primary householder has the lowest median household income of $0, with 12 households (1.9%) in this group.
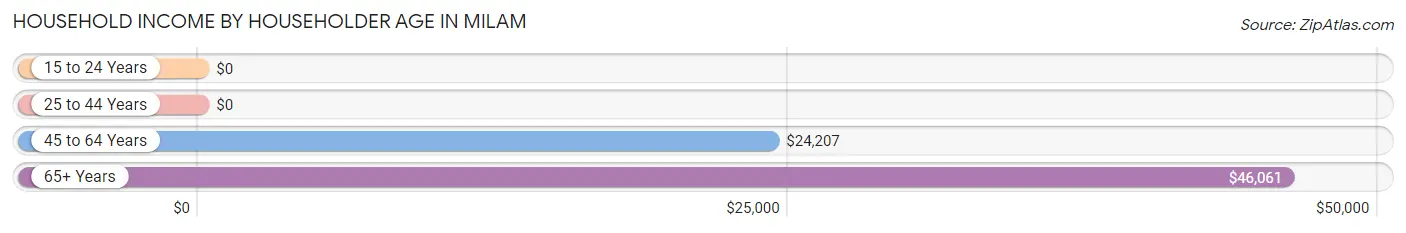
| Income Bracket | # Households | Median Income |
| 15 to 24 Years | 12 (1.9%) | $0 |
| 25 to 44 Years | 168 (26.5%) | $0 |
| 45 to 64 Years | 181 (28.5%) | $24,207 |
| 65+ Years | 274 (43.1%) | $46,061 |
| Total | 635 (100.0%) | $43,011 |
Poverty in Milam
Income Below Poverty by Sex and Age in Milam
With 16.2% poverty level for males and 25.7% for females among the residents of Milam, under 5 year old males and under 5 year old females are the most vulnerable to poverty, with 7 males (100.0%) and 6 females (100.0%) in their respective age groups living below the poverty level.
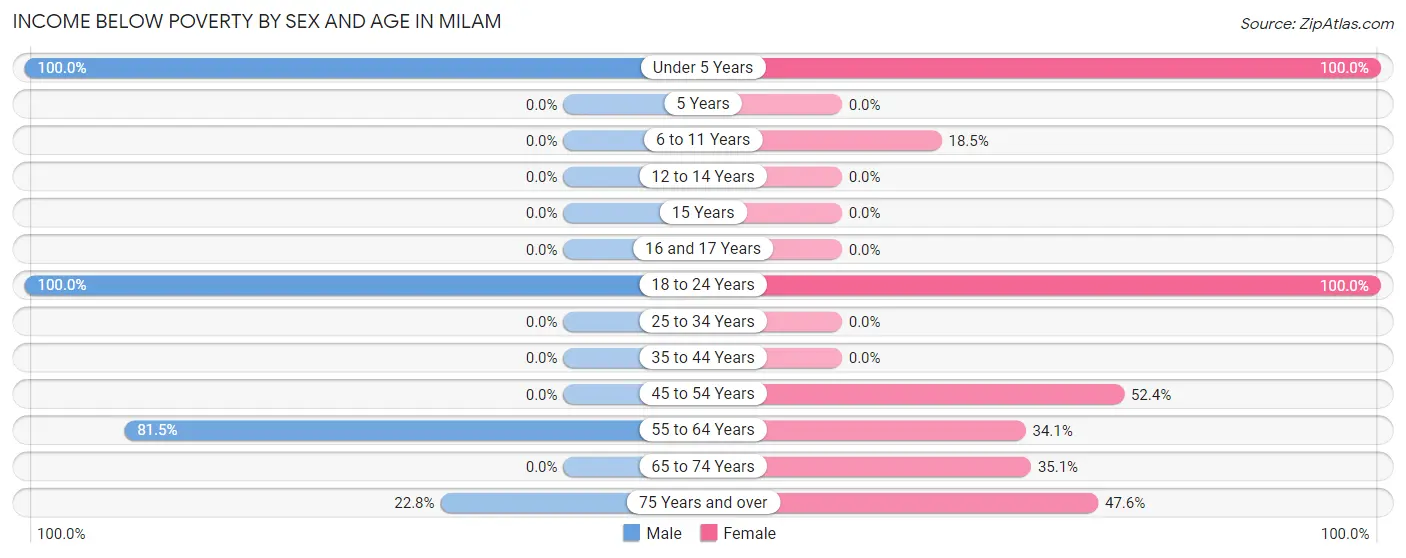
| Age Bracket | Male | Female |
| Under 5 Years | 7 (100.0%) | 6 (100.0%) |
| 5 Years | 0 (0.0%) | 0 (0.0%) |
| 6 to 11 Years | 0 (0.0%) | 5 (18.5%) |
| 12 to 14 Years | 0 (0.0%) | 0 (0.0%) |
| 15 Years | 0 (0.0%) | 0 (0.0%) |
| 16 and 17 Years | 0 (0.0%) | 0 (0.0%) |
| 18 to 24 Years | 12 (100.0%) | 29 (100.0%) |
| 25 to 34 Years | 0 (0.0%) | 0 (0.0%) |
| 35 to 44 Years | 0 (0.0%) | 0 (0.0%) |
| 45 to 54 Years | 0 (0.0%) | 11 (52.4%) |
| 55 to 64 Years | 97 (81.5%) | 44 (34.1%) |
| 65 to 74 Years | 0 (0.0%) | 33 (35.1%) |
| 75 Years and over | 21 (22.8%) | 49 (47.6%) |
| Total | 137 (16.2%) | 177 (25.7%) |
Income Above Poverty by Sex and Age in Milam
According to the poverty statistics in Milam, males aged 6 to 11 years and females aged 12 to 14 years are the age groups that are most secure financially, with 100.0% of males and 100.0% of females in these age groups living above the poverty line.
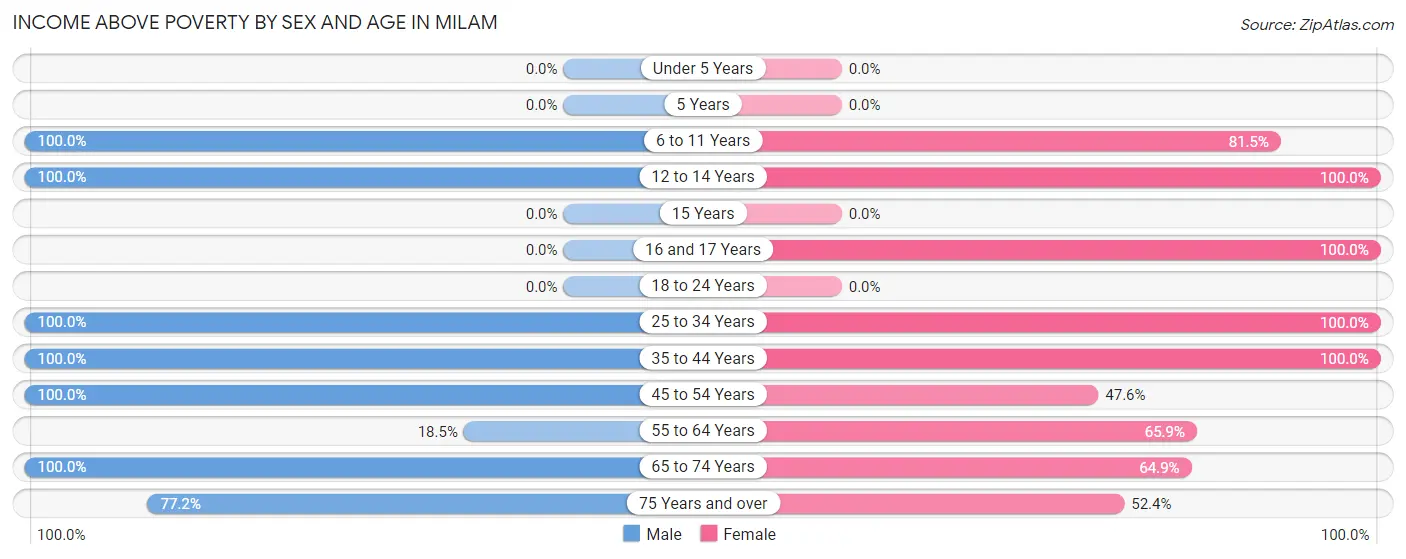
| Age Bracket | Male | Female |
| Under 5 Years | 0 (0.0%) | 0 (0.0%) |
| 5 Years | 0 (0.0%) | 0 (0.0%) |
| 6 to 11 Years | 38 (100.0%) | 22 (81.5%) |
| 12 to 14 Years | 101 (100.0%) | 129 (100.0%) |
| 15 Years | 0 (0.0%) | 0 (0.0%) |
| 16 and 17 Years | 0 (0.0%) | 31 (100.0%) |
| 18 to 24 Years | 0 (0.0%) | 0 (0.0%) |
| 25 to 34 Years | 172 (100.0%) | 33 (100.0%) |
| 35 to 44 Years | 66 (100.0%) | 88 (100.0%) |
| 45 to 54 Years | 138 (100.0%) | 10 (47.6%) |
| 55 to 64 Years | 22 (18.5%) | 85 (65.9%) |
| 65 to 74 Years | 101 (100.0%) | 61 (64.9%) |
| 75 Years and over | 71 (77.2%) | 54 (52.4%) |
| Total | 709 (83.8%) | 513 (74.4%) |
Income Below Poverty Among Married-Couple Families in Milam
The poverty statistics for married-couple families in Milam show that 20.3% or 81 of the total 400 families live below the poverty line. Families with no children have the highest poverty rate of 27.7%, comprising of 69 families. On the other hand, families with 1 or 2 children have the lowest poverty rate of 0.0%, which includes 0 families.
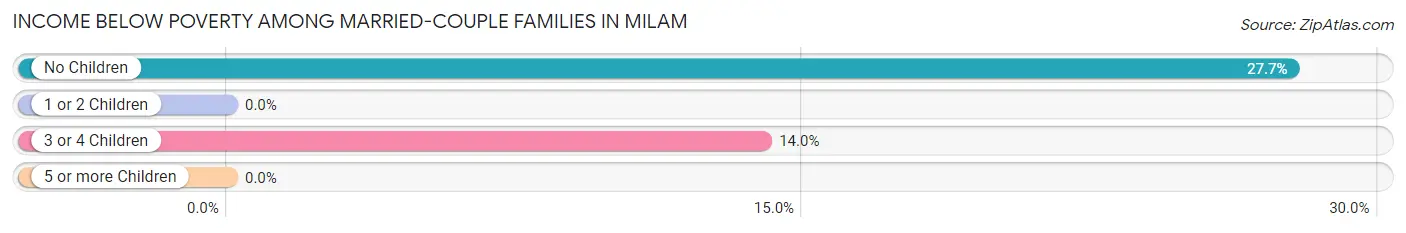
| Children | Above Poverty | Below Poverty |
| No Children | 180 (72.3%) | 69 (27.7%) |
| 1 or 2 Children | 65 (100.0%) | 0 (0.0%) |
| 3 or 4 Children | 74 (86.1%) | 12 (14.0%) |
| 5 or more Children | 0 (0.0%) | 0 (0.0%) |
| Total | 319 (79.7%) | 81 (20.3%) |
Income Below Poverty Among Single-Parent Households in Milam
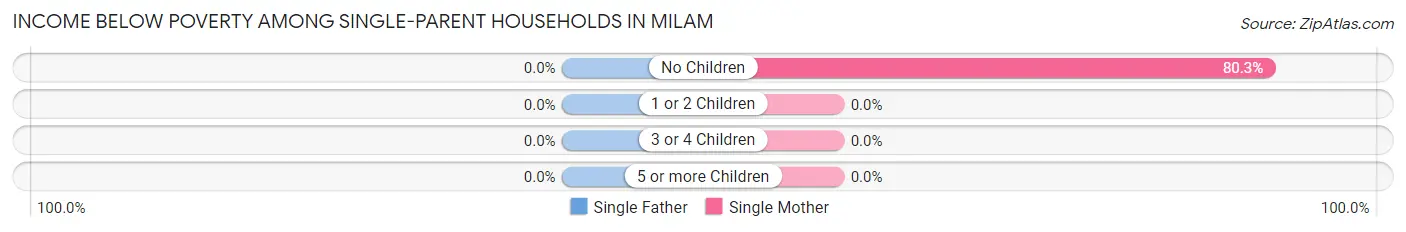
| Children | Single Father | Single Mother |
| No Children | 0 (0.0%) | 49 (80.3%) |
| 1 or 2 Children | 0 (0.0%) | 0 (0.0%) |
| 3 or 4 Children | 0 (0.0%) | 0 (0.0%) |
| 5 or more Children | 0 (0.0%) | 0 (0.0%) |
| Total | 0 (0.0%) | 49 (80.3%) |
Income Below Poverty Among Married-Couple vs Single-Parent Households in Milam
The poverty data for Milam shows that 81 of the married-couple family households (20.3%) and 49 of the single-parent households (80.3%) are living below the poverty level. Within the married-couple family households, those with no children have the highest poverty rate, with 69 households (27.7%) falling below the poverty line. Among the single-parent households, those with no children have the highest poverty rate, with 49 household (80.3%) living below poverty.
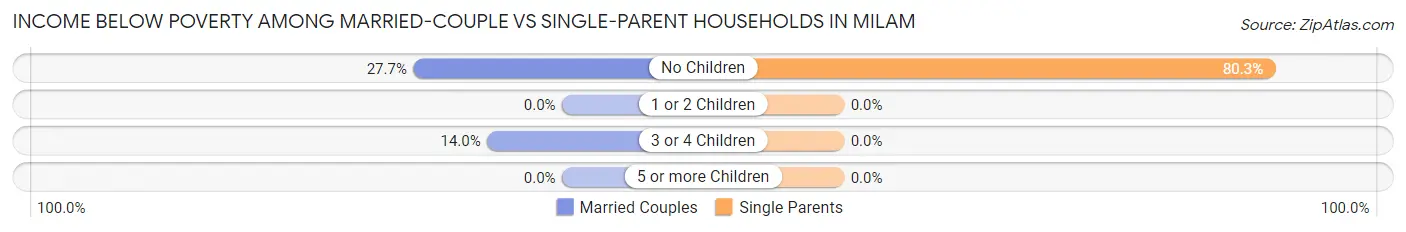
| Children | Married-Couple Families | Single-Parent Households |
| No Children | 69 (27.7%) | 49 (80.3%) |
| 1 or 2 Children | 0 (0.0%) | 0 (0.0%) |
| 3 or 4 Children | 12 (14.0%) | 0 (0.0%) |
| 5 or more Children | 0 (0.0%) | 0 (0.0%) |
| Total | 81 (20.3%) | 49 (80.3%) |
Race in Milam
The most populous races in Milam are White / Caucasian (1,407 | 91.6%), Hispanic or Latino (73 | 4.8%), and Asian (69 | 4.5%).
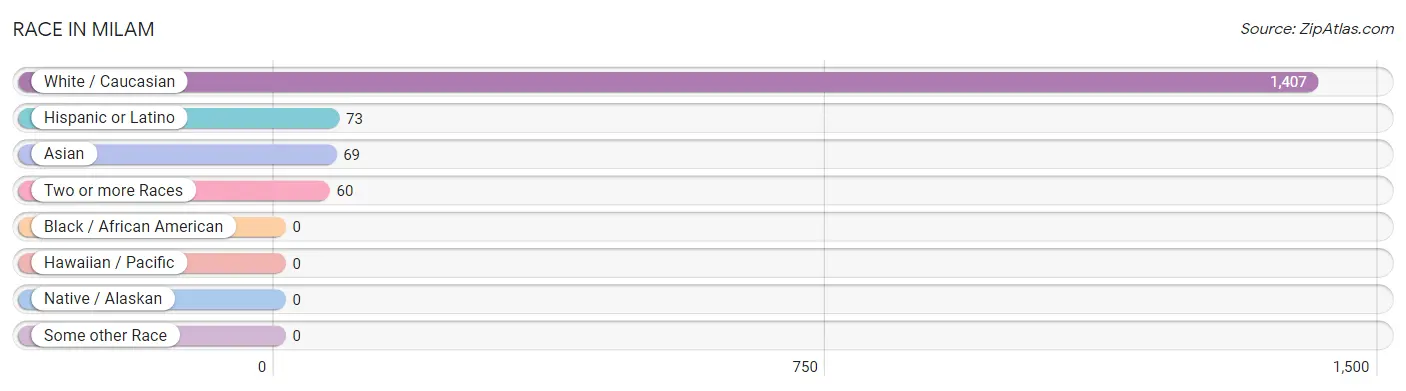
| Race | # Population | % Population |
| Asian | 69 | 4.5% |
| Black / African American | 0 | 0.0% |
| Hawaiian / Pacific | 0 | 0.0% |
| Hispanic or Latino | 73 | 4.8% |
| Native / Alaskan | 0 | 0.0% |
| White / Caucasian | 1,407 | 91.6% |
| Two or more Races | 60 | 3.9% |
| Some other Race | 0 | 0.0% |
| Total | 1,536 | 100.0% |
Ancestry in Milam
The most populous ancestries reported in Milam are American (287 | 18.7%), German (194 | 12.6%), Irish (193 | 12.6%), French Canadian (97 | 6.3%), and Korean (73 | 4.8%), together accounting for 54.9% of all Milam residents.
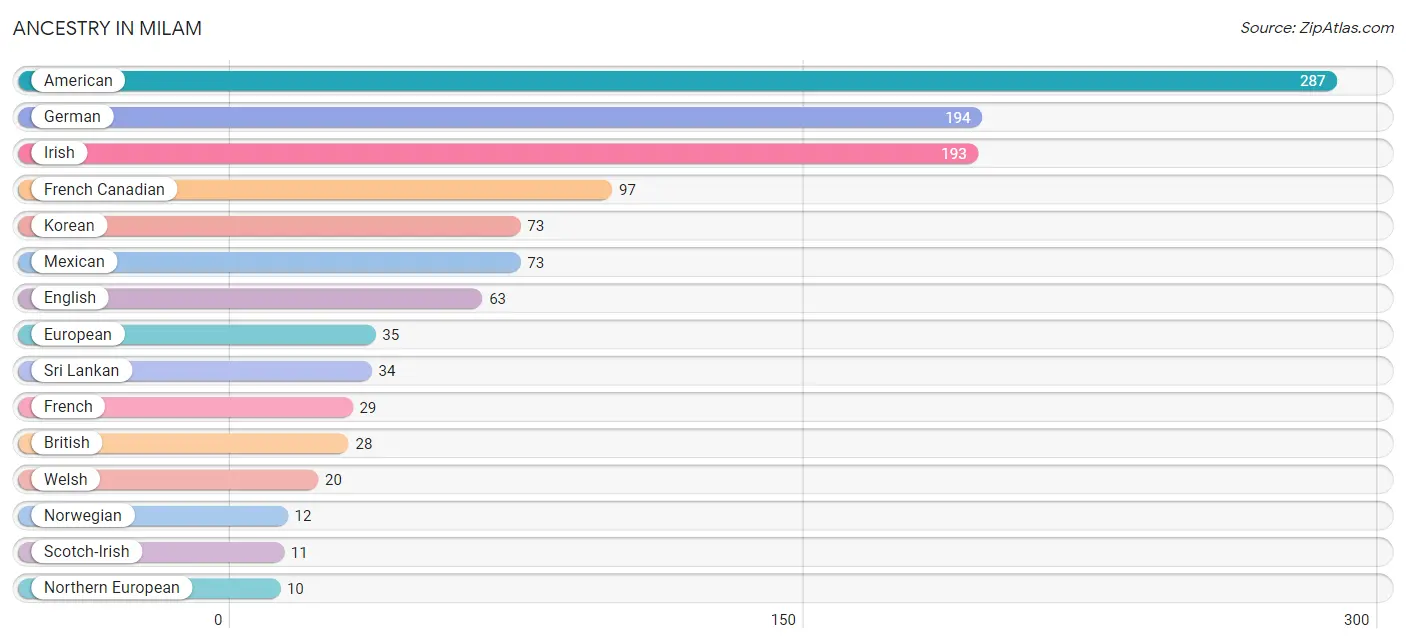
| Ancestry | # Population | % Population |
| American | 287 | 18.7% |
| British | 28 | 1.8% |
| Cherokee | 6 | 0.4% |
| English | 63 | 4.1% |
| European | 35 | 2.3% |
| French | 29 | 1.9% |
| French Canadian | 97 | 6.3% |
| German | 194 | 12.6% |
| Irish | 193 | 12.6% |
| Korean | 73 | 4.8% |
| Mexican | 73 | 4.8% |
| Northern European | 10 | 0.6% |
| Norwegian | 12 | 0.8% |
| Scotch-Irish | 11 | 0.7% |
| Scottish | 9 | 0.6% |
| Sri Lankan | 34 | 2.2% |
| Welsh | 20 | 1.3% | View All 17 Rows |
Immigrants in Milam
The most numerous immigrant groups reported in Milam came from Central America (35 | 2.3%), Latin America (35 | 2.3%), and Mexico (35 | 2.3%), together accounting for 6.8% of all Milam residents.
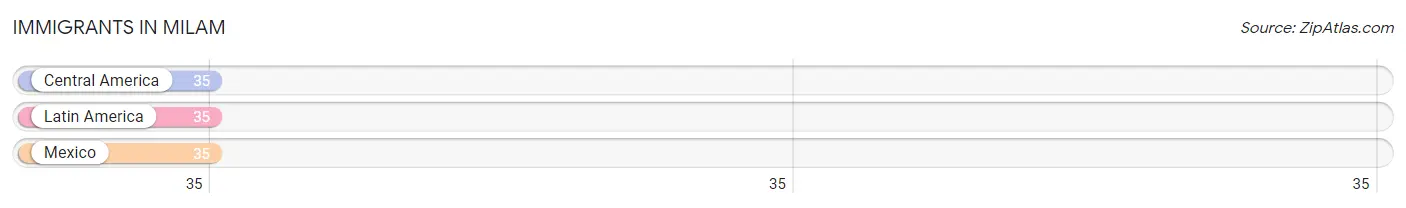
| Immigration Origin | # Population | % Population |
| Central America | 35 | 2.3% |
| Latin America | 35 | 2.3% |
| Mexico | 35 | 2.3% | View All 3 Rows |
Sex and Age in Milam
Sex and Age in Milam
The most populous age groups in Milam are 30 to 34 Years (172 | 20.3%) for men and 10 to 14 Years (129 | 18.7%) for women.
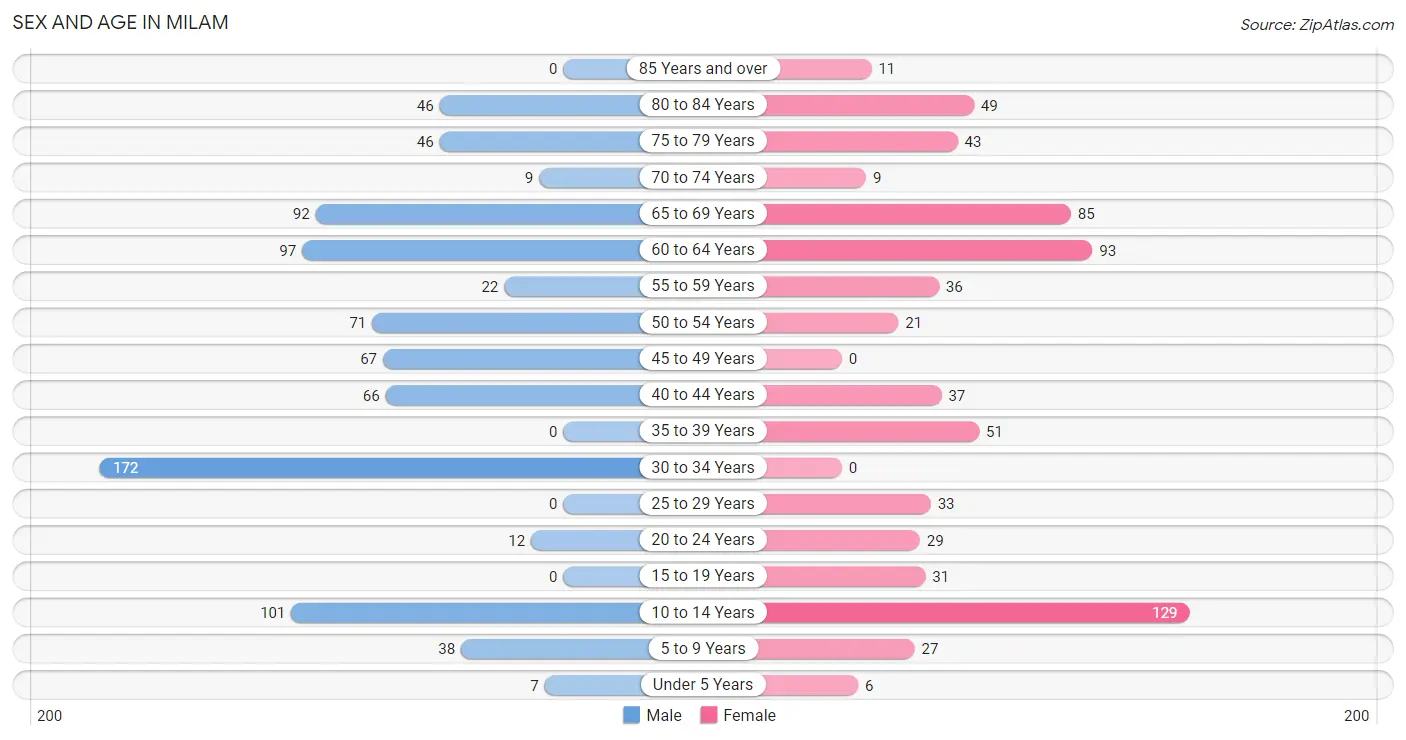
| Age Bracket | Male | Female |
| Under 5 Years | 7 (0.8%) | 6 (0.9%) |
| 5 to 9 Years | 38 (4.5%) | 27 (3.9%) |
| 10 to 14 Years | 101 (11.9%) | 129 (18.7%) |
| 15 to 19 Years | 0 (0.0%) | 31 (4.5%) |
| 20 to 24 Years | 12 (1.4%) | 29 (4.2%) |
| 25 to 29 Years | 0 (0.0%) | 33 (4.8%) |
| 30 to 34 Years | 172 (20.3%) | 0 (0.0%) |
| 35 to 39 Years | 0 (0.0%) | 51 (7.4%) |
| 40 to 44 Years | 66 (7.8%) | 37 (5.4%) |
| 45 to 49 Years | 67 (7.9%) | 0 (0.0%) |
| 50 to 54 Years | 71 (8.4%) | 21 (3.0%) |
| 55 to 59 Years | 22 (2.6%) | 36 (5.2%) |
| 60 to 64 Years | 97 (11.5%) | 93 (13.5%) |
| 65 to 69 Years | 92 (10.9%) | 85 (12.3%) |
| 70 to 74 Years | 9 (1.1%) | 9 (1.3%) |
| 75 to 79 Years | 46 (5.4%) | 43 (6.2%) |
| 80 to 84 Years | 46 (5.4%) | 49 (7.1%) |
| 85 Years and over | 0 (0.0%) | 11 (1.6%) |
| Total | 846 (100.0%) | 690 (100.0%) |
Families and Households in Milam
Median Family Size in Milam
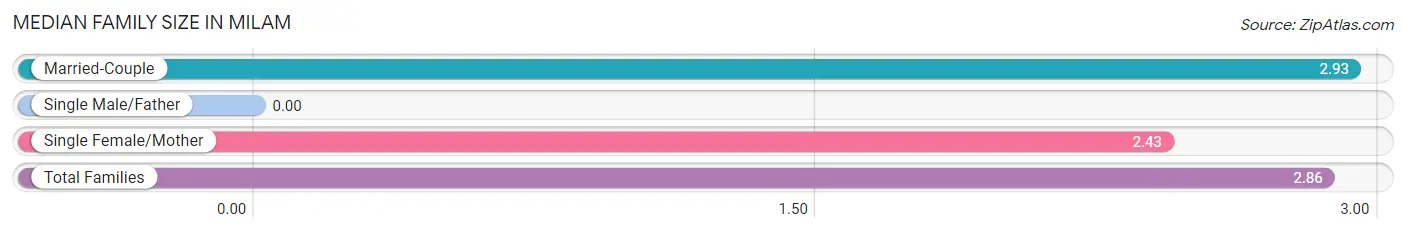
| Family Type | # Families | Family Size |
| Married-Couple | 400 (86.8%) | 2.93 |
| Single Male/Father | 0 (0.0%) | - |
| Single Female/Mother | 61 (13.2%) | 2.43 |
| Total Families | 461 (100.0%) | 2.86 |
Median Household Size in Milam
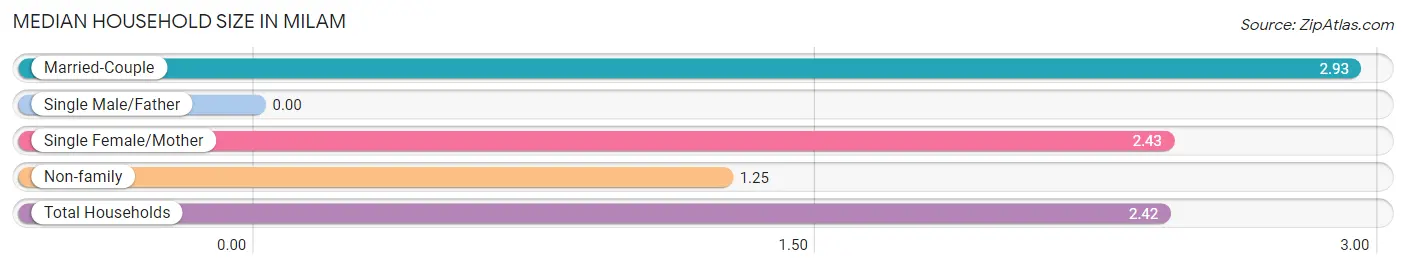
| Household Type | # Households | Household Size |
| Married-Couple | 400 (63.0%) | 2.93 |
| Single Male/Father | 0 (0.0%) | - |
| Single Female/Mother | 61 (9.6%) | 2.43 |
| Non-family | 174 (27.4%) | 1.25 |
| Total Households | 635 (100.0%) | 2.42 |
Household Size by Marriage Status in Milam
Out of a total of 635 households in Milam, 461 (72.6%) are family households, while 174 (27.4%) are nonfamily households. The most numerous type of family households are 2-person households, comprising 303, and the most common type of nonfamily households are 1-person households, comprising 131.
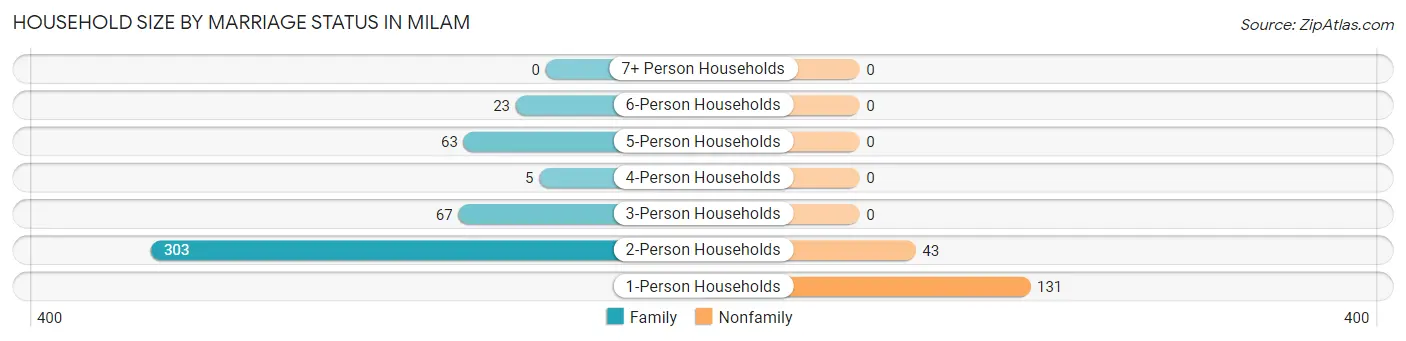
| Household Size | Family Households | Nonfamily Households |
| 1-Person Households | - | 131 (20.6%) |
| 2-Person Households | 303 (47.7%) | 43 (6.8%) |
| 3-Person Households | 67 (10.5%) | 0 (0.0%) |
| 4-Person Households | 5 (0.8%) | 0 (0.0%) |
| 5-Person Households | 63 (9.9%) | 0 (0.0%) |
| 6-Person Households | 23 (3.6%) | 0 (0.0%) |
| 7+ Person Households | 0 (0.0%) | 0 (0.0%) |
| Total | 461 (72.6%) | 174 (27.4%) |
Female Fertility in Milam
Fertility by Age in Milam
Average fertility rate in Milam is 35.0 births per 1,000 women. Women in the age bracket of 20 to 34 years have the highest fertility rate with 113.0 births per 1,000 women. Women in the age bracket of 20 to 34 years acount for 100.0% of all women with births.
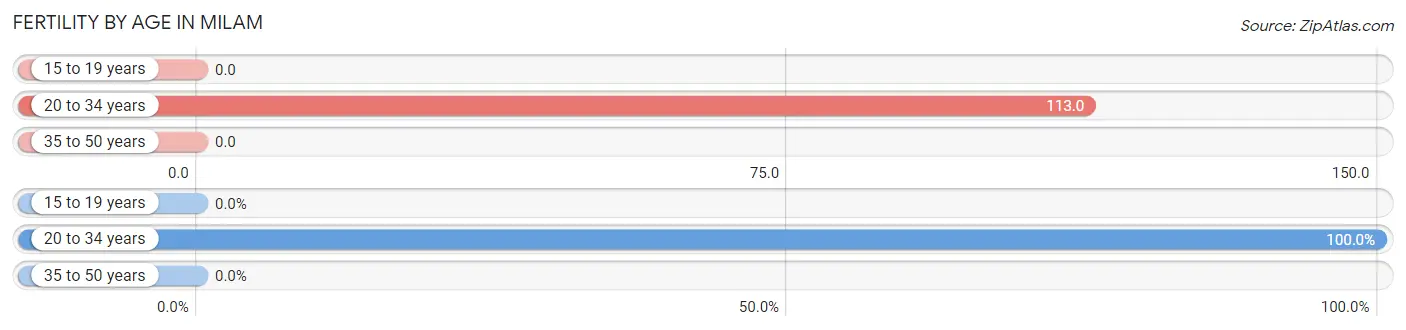
| Age Bracket | Women with Births | Births / 1,000 Women |
| 15 to 19 years | 0 (0.0%) | 0.0 |
| 20 to 34 years | 7 (100.0%) | 113.0 |
| 35 to 50 years | 0 (0.0%) | 0.0 |
| Total | 7 (100.0%) | 35.0 |
Fertility by Age by Marriage Status in Milam
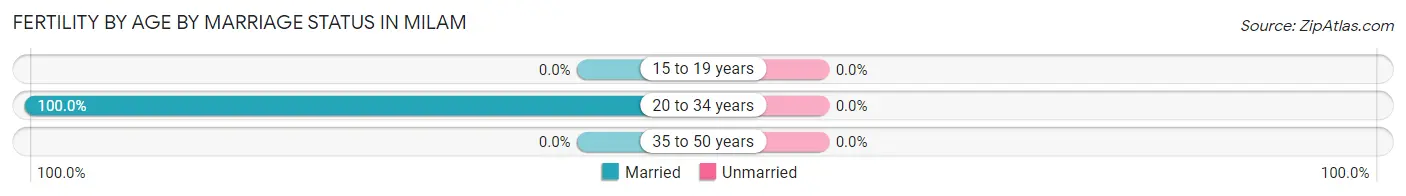
| Age Bracket | Married | Unmarried |
| 15 to 19 years | 0 (0.0%) | 0 (0.0%) |
| 20 to 34 years | 7 (100.0%) | 0 (0.0%) |
| 35 to 50 years | 0 (0.0%) | 0 (0.0%) |
| Total | 7 (100.0%) | 0 (0.0%) |
Fertility by Education in Milam
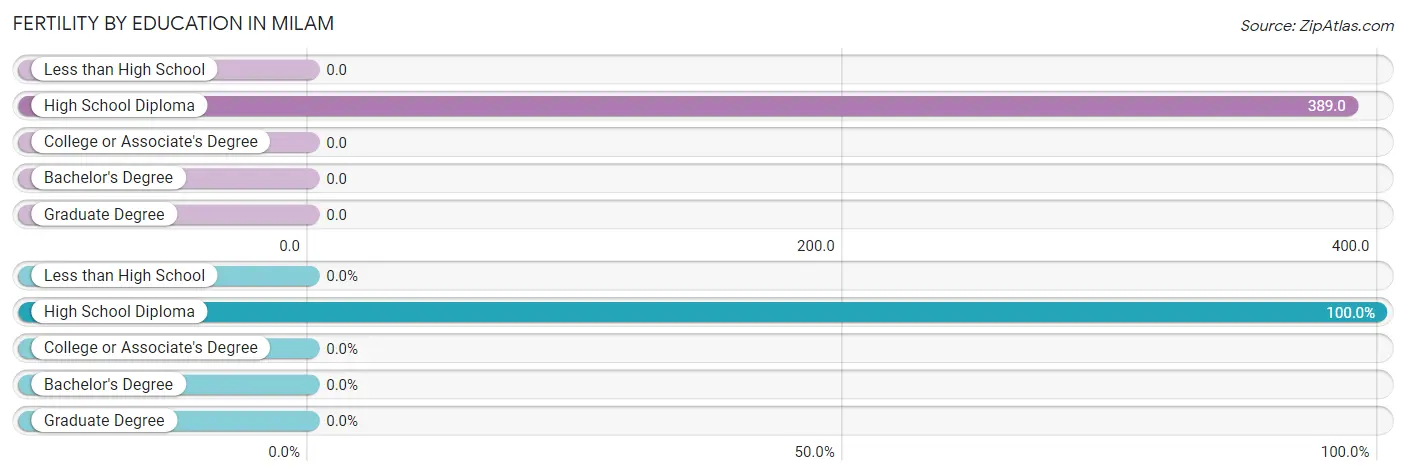
| Educational Attainment | Women with Births | Births / 1,000 Women |
| Less than High School | 0 (0.0%) | 0.0 |
| High School Diploma | 7 (100.0%) | 389.0 |
| College or Associate's Degree | 0 (0.0%) | 0.0 |
| Bachelor's Degree | 0 (0.0%) | 0.0 |
| Graduate Degree | 0 (0.0%) | 0.0 |
| Total | 7 (100.0%) | 35.0 |
Fertility by Education by Marriage Status in Milam
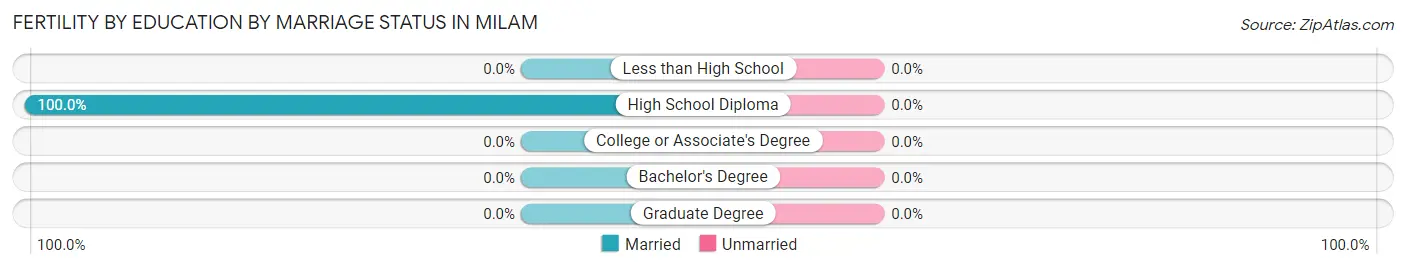
| Educational Attainment | Married | Unmarried |
| Less than High School | 0 (0.0%) | 0 (0.0%) |
| High School Diploma | 7 (100.0%) | 0 (0.0%) |
| College or Associate's Degree | 0 (0.0%) | 0 (0.0%) |
| Bachelor's Degree | 0 (0.0%) | 0 (0.0%) |
| Graduate Degree | 0 (0.0%) | 0 (0.0%) |
| Total | 7 (100.0%) | 0 (0.0%) |
Employment Characteristics in Milam
Employment by Class of Employer in Milam
Among the 478 employed individuals in Milam, private company employees (407 | 85.2%), self-employed (not incorporated) (27 | 5.7%), and local government employees (23 | 4.8%) make up the most common classes of employment.
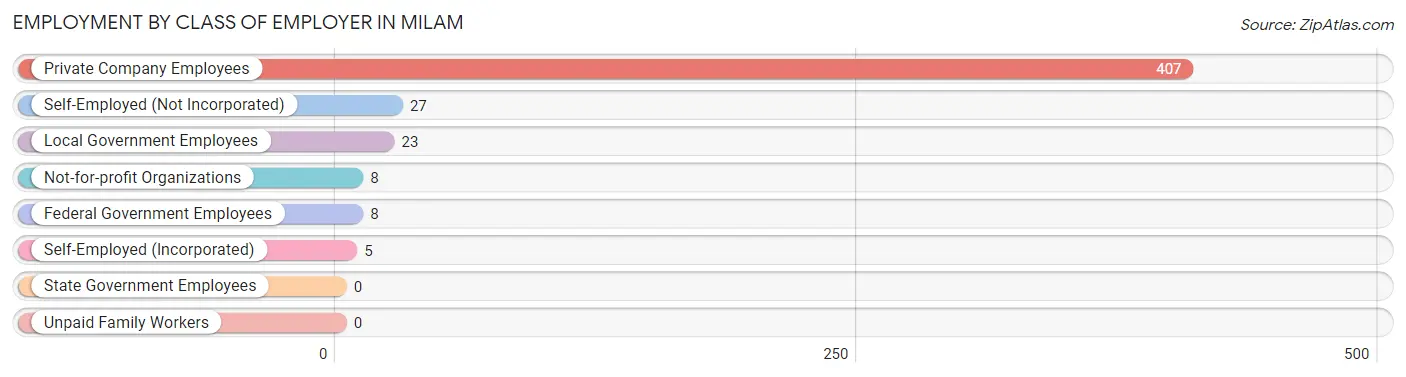
| Employer Class | # Employees | % Employees |
| Private Company Employees | 407 | 85.2% |
| Self-Employed (Incorporated) | 5 | 1.1% |
| Self-Employed (Not Incorporated) | 27 | 5.7% |
| Not-for-profit Organizations | 8 | 1.7% |
| Local Government Employees | 23 | 4.8% |
| State Government Employees | 0 | 0.0% |
| Federal Government Employees | 8 | 1.7% |
| Unpaid Family Workers | 0 | 0.0% |
| Total | 478 | 100.0% |
Employment Status by Age in Milam
According to the labor force statistics for Milam, out of the total population over 16 years of age (1,228), 45.2% or 555 individuals are in the labor force, with 6.1% or 34 of them unemployed. The age group with the highest labor force participation rate is 25 to 29 years, with 100.0% or 33 individuals in the labor force. Within the labor force, the 75 years and over age range has the highest percentage of unemployed individuals, with 100.0% or 12 of them being unemployed.
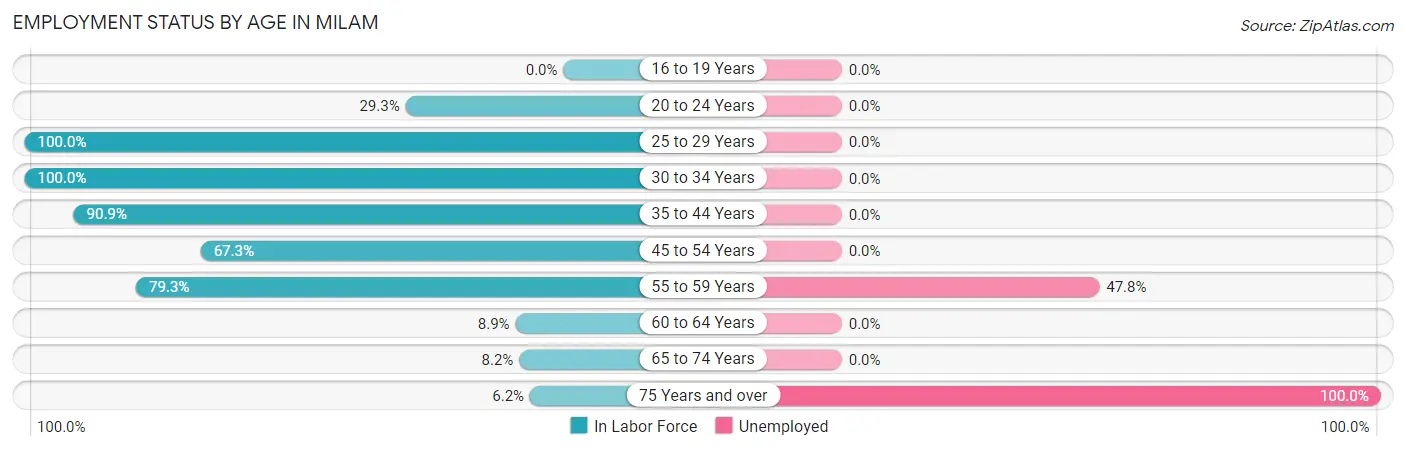
| Age Bracket | In Labor Force | Unemployed |
| 16 to 19 Years | 0 (0.0%) | 0 (0.0%) |
| 20 to 24 Years | 12 (29.3%) | 0 (0.0%) |
| 25 to 29 Years | 33 (100.0%) | 0 (0.0%) |
| 30 to 34 Years | 172 (100.0%) | 0 (0.0%) |
| 35 to 44 Years | 140 (90.9%) | 0 (0.0%) |
| 45 to 54 Years | 107 (67.3%) | 0 (0.0%) |
| 55 to 59 Years | 46 (79.3%) | 22 (47.8%) |
| 60 to 64 Years | 17 (8.9%) | 0 (0.0%) |
| 65 to 74 Years | 16 (8.2%) | 0 (0.0%) |
| 75 Years and over | 12 (6.2%) | 12 (100.0%) |
| Total | 555 (45.2%) | 34 (6.1%) |
Employment Status by Educational Attainment in Milam
According to labor force statistics for Milam, 67.2% of individuals (515) out of the total population between 25 and 64 years of age (766) are in the labor force, with 4.3% or 22 of them being unemployed. The group with the highest labor force participation rate are those with the educational attainment of less than high school, with 100.0% or 178 individuals in the labor force. Within the labor force, individuals with college / associate degree education have the highest percentage of unemployment, with 17.9% or 22 of them being unemployed.
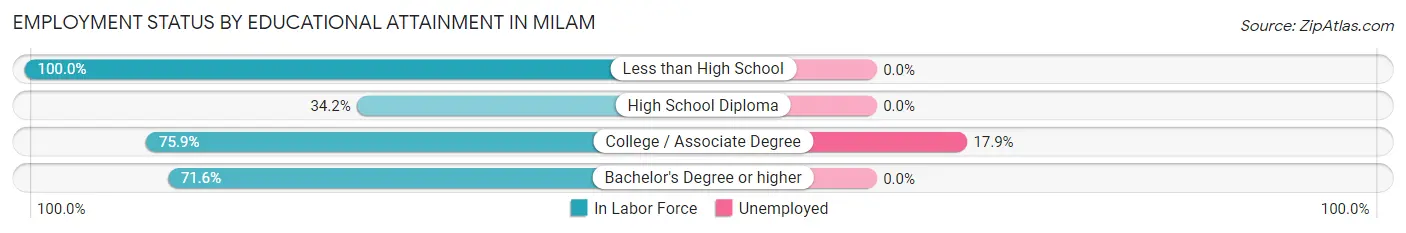
| Educational Attainment | In Labor Force | Unemployed |
| Less than High School | 178 (100.0%) | 0 (0.0%) |
| High School Diploma | 83 (34.2%) | 0 (0.0%) |
| College / Associate Degree | 123 (75.9%) | 29 (17.9%) |
| Bachelor's Degree or higher | 131 (71.6%) | 0 (0.0%) |
| Total | 515 (67.2%) | 33 (4.3%) |
Employment Occupations by Sex in Milam
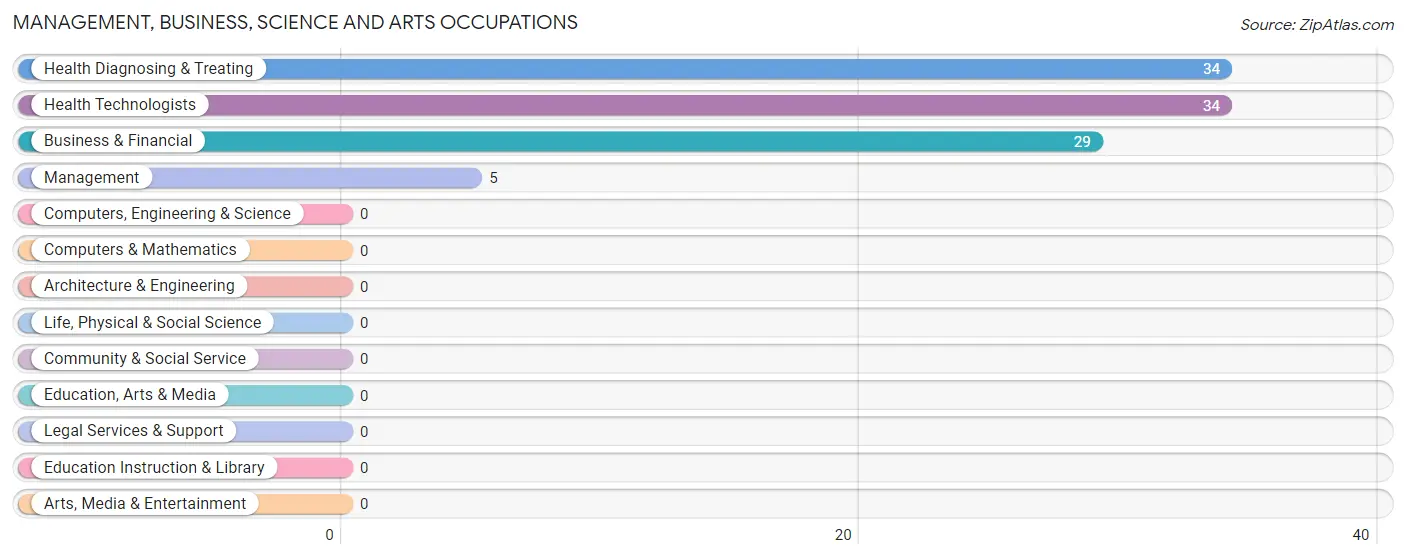
Management, Business, Science and Arts Occupations
The most common Management, Business, Science and Arts occupations in Milam are Health Diagnosing & Treating (34 | 6.5%), Health Technologists (34 | 6.5%), Business & Financial (29 | 5.6%), and Management (5 | 1.0%).
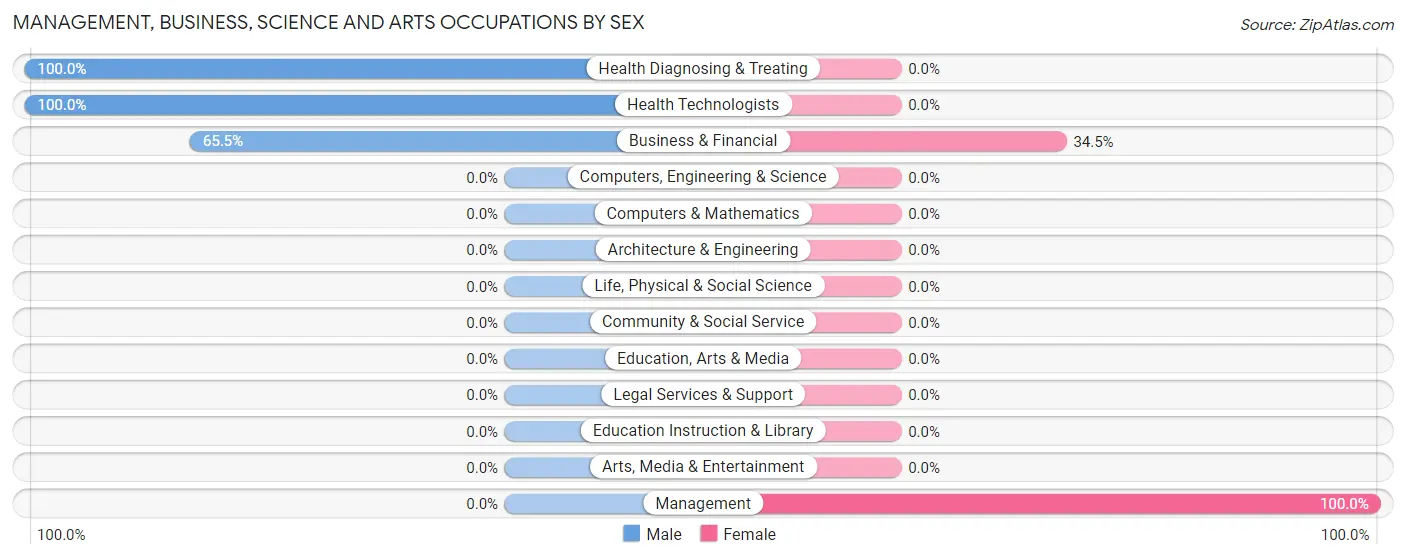
Management, Business, Science and Arts Occupations by Sex
Within the Management, Business, Science and Arts occupations in Milam, the most male-oriented occupations are Health Diagnosing & Treating (100.0%), Health Technologists (100.0%), and Business & Financial (65.5%), while the most female-oriented occupations are Management (100.0%), and Business & Financial (34.5%).
| Occupation | Male | Female |
| Management | 0 (0.0%) | 5 (100.0%) |
| Business & Financial | 19 (65.5%) | 10 (34.5%) |
| Computers, Engineering & Science | 0 (0.0%) | 0 (0.0%) |
| Computers & Mathematics | 0 (0.0%) | 0 (0.0%) |
| Architecture & Engineering | 0 (0.0%) | 0 (0.0%) |
| Life, Physical & Social Science | 0 (0.0%) | 0 (0.0%) |
| Community & Social Service | 0 (0.0%) | 0 (0.0%) |
| Education, Arts & Media | 0 (0.0%) | 0 (0.0%) |
| Legal Services & Support | 0 (0.0%) | 0 (0.0%) |
| Education Instruction & Library | 0 (0.0%) | 0 (0.0%) |
| Arts, Media & Entertainment | 0 (0.0%) | 0 (0.0%) |
| Health Diagnosing & Treating | 34 (100.0%) | 0 (0.0%) |
| Health Technologists | 34 (100.0%) | 0 (0.0%) |
| Total (Category) | 53 (77.9%) | 15 (22.1%) |
| Total (Overall) | 352 (67.6%) | 169 (32.4%) |
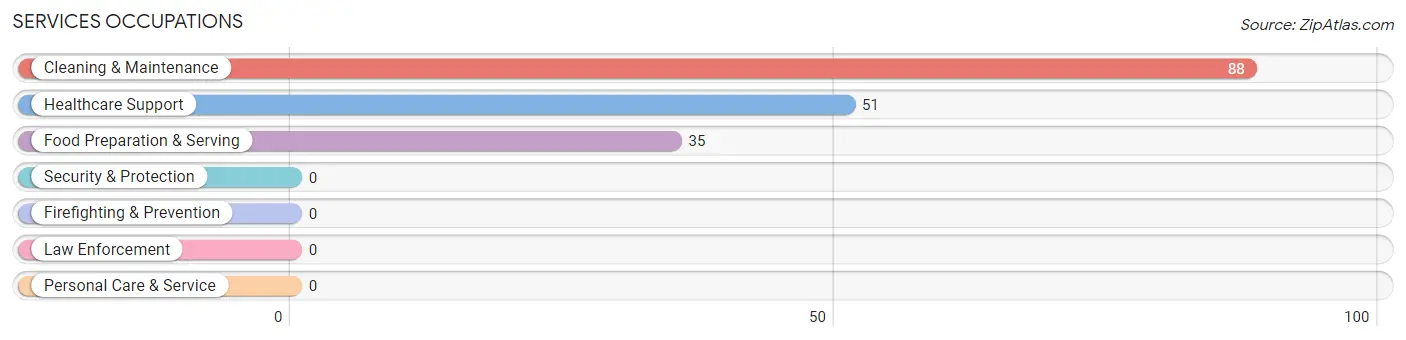
Services Occupations
The most common Services occupations in Milam are Cleaning & Maintenance (88 | 16.9%), Healthcare Support (51 | 9.8%), and Food Preparation & Serving (35 | 6.7%).
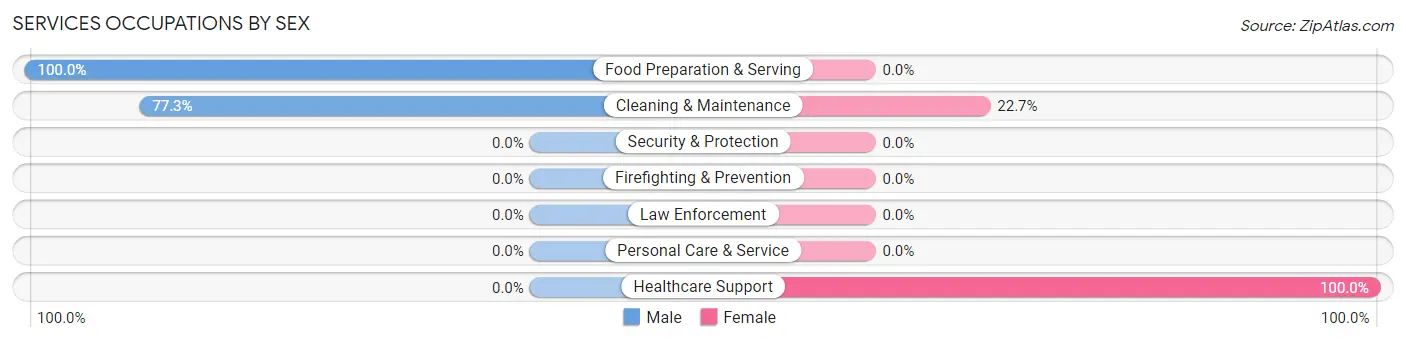
Services Occupations by Sex
Within the Services occupations in Milam, the most male-oriented occupations are Food Preparation & Serving (100.0%), and Cleaning & Maintenance (77.3%), while the most female-oriented occupations are Healthcare Support (100.0%), and Cleaning & Maintenance (22.7%).
| Occupation | Male | Female |
| Healthcare Support | 0 (0.0%) | 51 (100.0%) |
| Security & Protection | 0 (0.0%) | 0 (0.0%) |
| Firefighting & Prevention | 0 (0.0%) | 0 (0.0%) |
| Law Enforcement | 0 (0.0%) | 0 (0.0%) |
| Food Preparation & Serving | 35 (100.0%) | 0 (0.0%) |
| Cleaning & Maintenance | 68 (77.3%) | 20 (22.7%) |
| Personal Care & Service | 0 (0.0%) | 0 (0.0%) |
| Total (Category) | 103 (59.2%) | 71 (40.8%) |
| Total (Overall) | 352 (67.6%) | 169 (32.4%) |
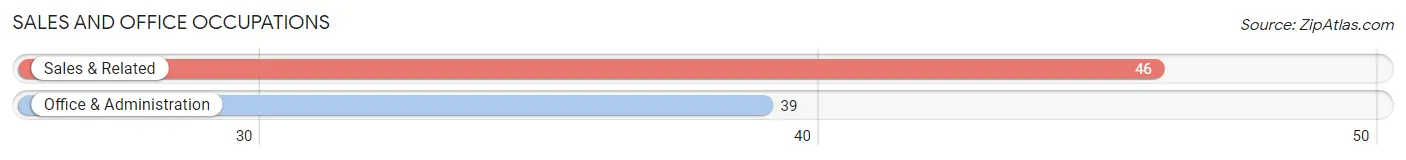
Sales and Office Occupations
The most common Sales and Office occupations in Milam are Sales & Related (46 | 8.8%), and Office & Administration (39 | 7.5%).
Sales and Office Occupations by Sex
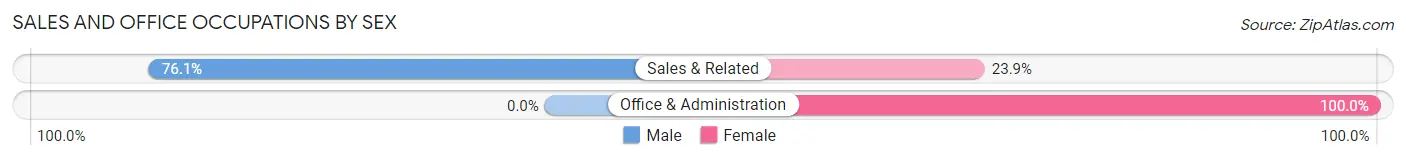
| Occupation | Male | Female |
| Sales & Related | 35 (76.1%) | 11 (23.9%) |
| Office & Administration | 0 (0.0%) | 39 (100.0%) |
| Total (Category) | 35 (41.2%) | 50 (58.8%) |
| Total (Overall) | 352 (67.6%) | 169 (32.4%) |
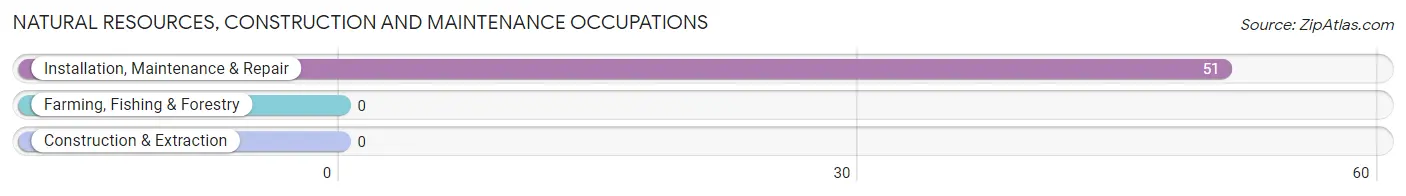
Natural Resources, Construction and Maintenance Occupations
The most common Natural Resources, Construction and Maintenance occupations in Milam are , and Installation, Maintenance & Repair (51 | 9.8%).
Natural Resources, Construction and Maintenance Occupations by Sex
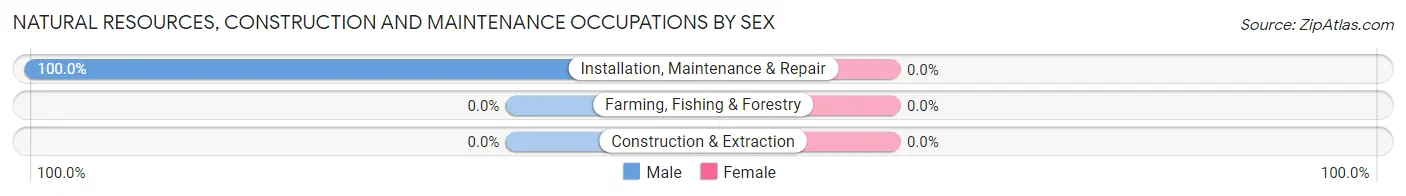
| Occupation | Male | Female |
| Farming, Fishing & Forestry | 0 (0.0%) | 0 (0.0%) |
| Construction & Extraction | 0 (0.0%) | 0 (0.0%) |
| Installation, Maintenance & Repair | 51 (100.0%) | 0 (0.0%) |
| Total (Category) | 51 (100.0%) | 0 (0.0%) |
| Total (Overall) | 352 (67.6%) | 169 (32.4%) |
Production, Transportation and Moving Occupations
The most common Production, Transportation and Moving occupations in Milam are Production (108 | 20.7%), and Material Moving (35 | 6.7%).
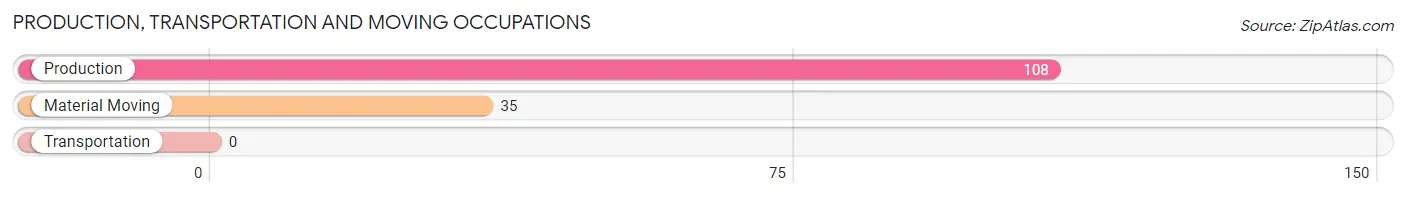
Production, Transportation and Moving Occupations by Sex
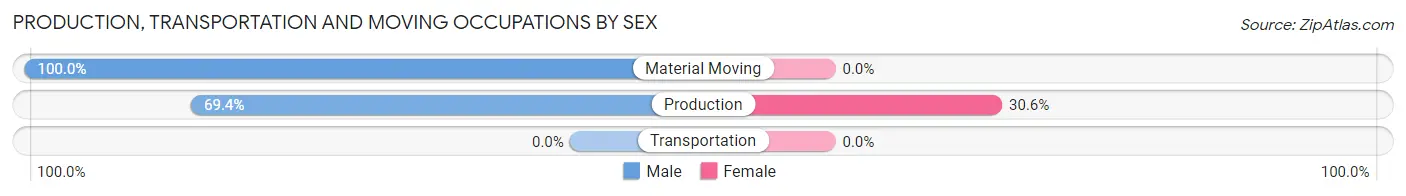
| Occupation | Male | Female |
| Production | 75 (69.4%) | 33 (30.6%) |
| Transportation | 0 (0.0%) | 0 (0.0%) |
| Material Moving | 35 (100.0%) | 0 (0.0%) |
| Total (Category) | 110 (76.9%) | 33 (23.1%) |
| Total (Overall) | 352 (67.6%) | 169 (32.4%) |
Employment Industries by Sex in Milam
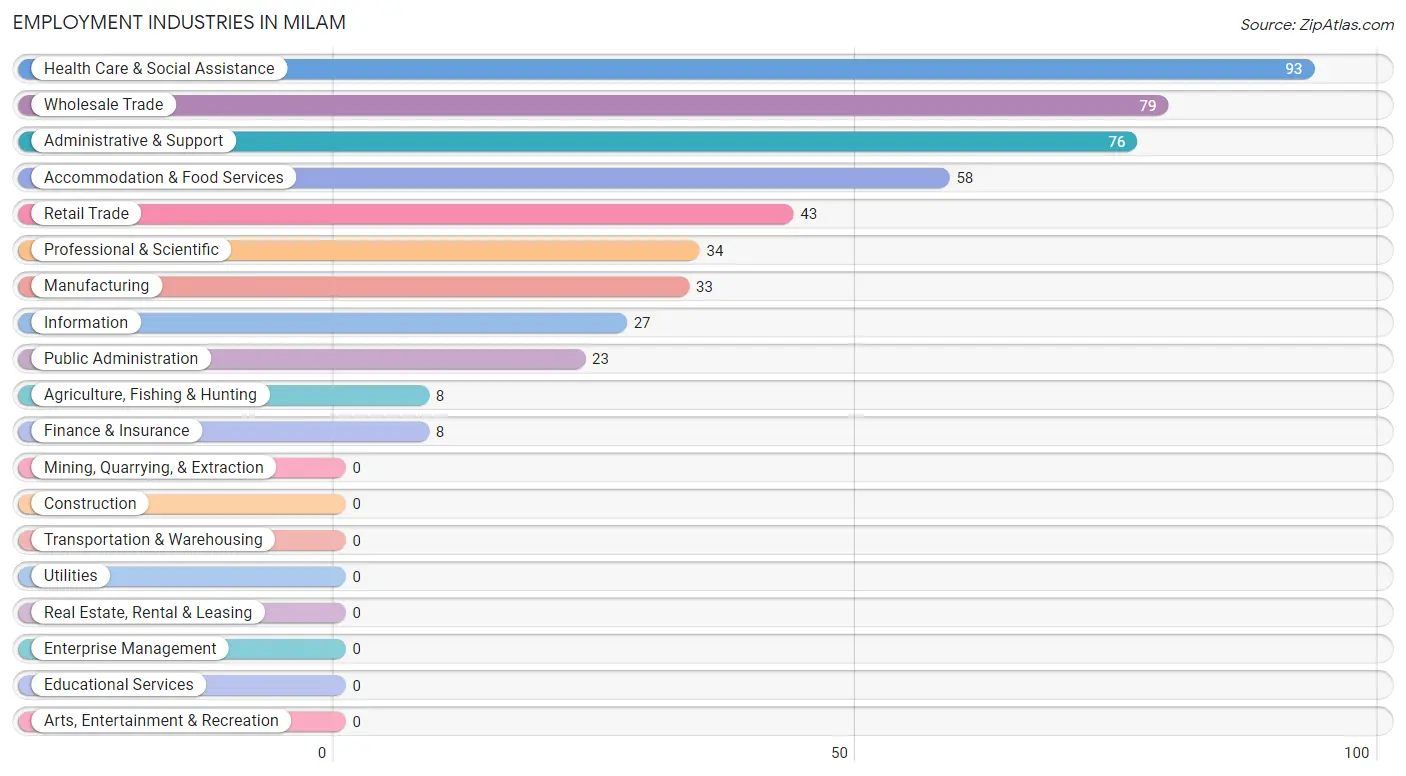
Employment Industries in Milam
The major employment industries in Milam include Health Care & Social Assistance (93 | 17.8%), Wholesale Trade (79 | 15.2%), Administrative & Support (76 | 14.6%), Accommodation & Food Services (58 | 11.1%), and Retail Trade (43 | 8.3%).
Employment Industries by Sex in Milam
The Milam industries that see more men than women are Agriculture, Fishing & Hunting (100.0%), Wholesale Trade (100.0%), and Retail Trade (100.0%), whereas the industries that tend to have a higher number of women are Manufacturing (100.0%), Finance & Insurance (100.0%), and Public Administration (100.0%).
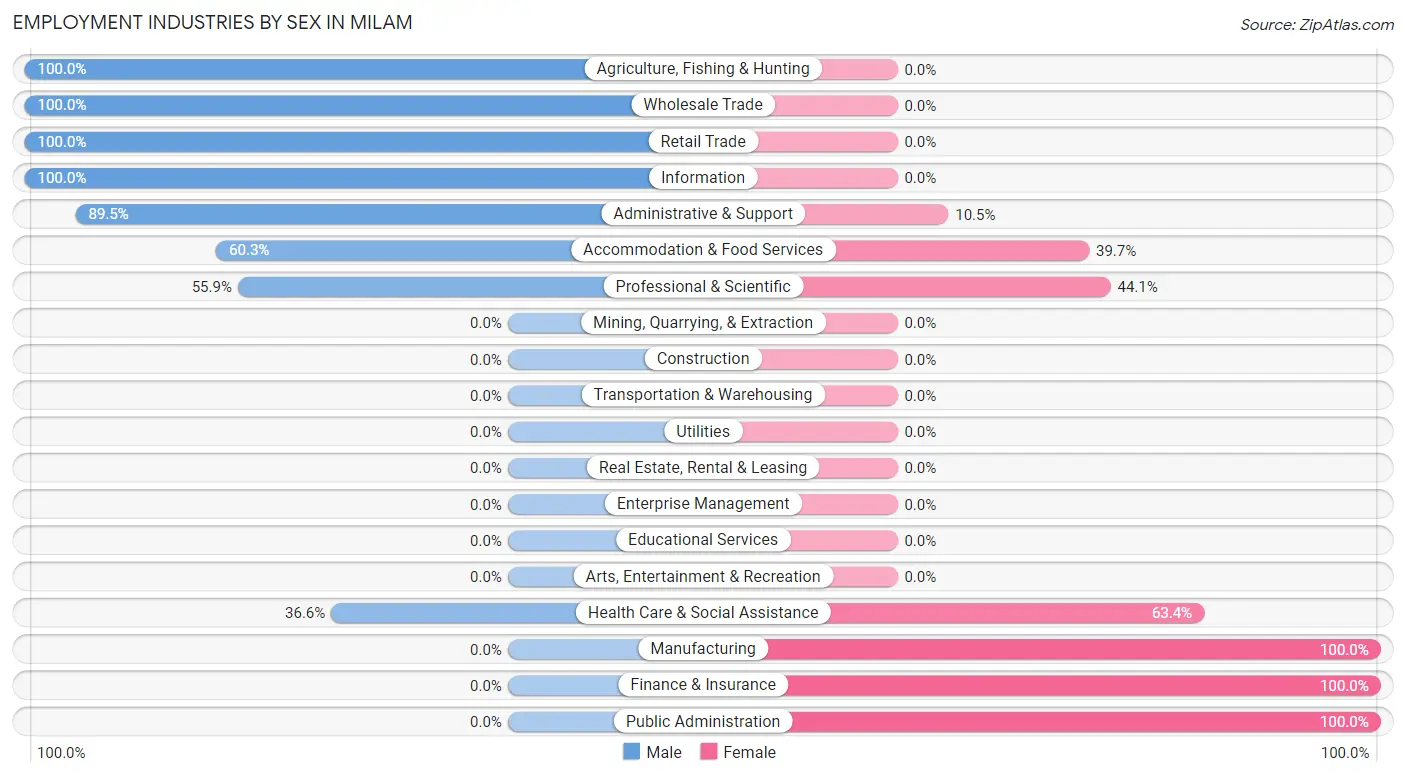
| Industry | Male | Female |
| Agriculture, Fishing & Hunting | 8 (100.0%) | 0 (0.0%) |
| Mining, Quarrying, & Extraction | 0 (0.0%) | 0 (0.0%) |
| Construction | 0 (0.0%) | 0 (0.0%) |
| Manufacturing | 0 (0.0%) | 33 (100.0%) |
| Wholesale Trade | 79 (100.0%) | 0 (0.0%) |
| Retail Trade | 43 (100.0%) | 0 (0.0%) |
| Transportation & Warehousing | 0 (0.0%) | 0 (0.0%) |
| Utilities | 0 (0.0%) | 0 (0.0%) |
| Information | 27 (100.0%) | 0 (0.0%) |
| Finance & Insurance | 0 (0.0%) | 8 (100.0%) |
| Real Estate, Rental & Leasing | 0 (0.0%) | 0 (0.0%) |
| Professional & Scientific | 19 (55.9%) | 15 (44.1%) |
| Enterprise Management | 0 (0.0%) | 0 (0.0%) |
| Administrative & Support | 68 (89.5%) | 8 (10.5%) |
| Educational Services | 0 (0.0%) | 0 (0.0%) |
| Health Care & Social Assistance | 34 (36.6%) | 59 (63.4%) |
| Arts, Entertainment & Recreation | 0 (0.0%) | 0 (0.0%) |
| Accommodation & Food Services | 35 (60.3%) | 23 (39.7%) |
| Public Administration | 0 (0.0%) | 23 (100.0%) |
| Total | 352 (67.6%) | 169 (32.4%) |
Education in Milam
School Enrollment in Milam
The most common levels of schooling among the 310 students in Milam are middle school (180 | 58.1%), high school (81 | 26.1%), and college / undergraduate (22 | 7.1%).
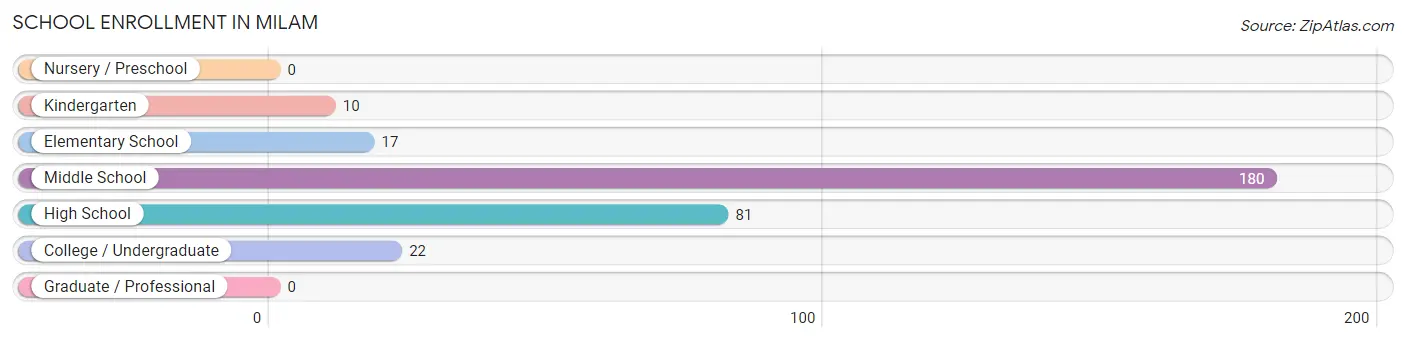
| School Level | # Students | % Students |
| Nursery / Preschool | 0 | 0.0% |
| Kindergarten | 10 | 3.2% |
| Elementary School | 17 | 5.5% |
| Middle School | 180 | 58.1% |
| High School | 81 | 26.1% |
| College / Undergraduate | 22 | 7.1% |
| Graduate / Professional | 0 | 0.0% |
| Total | 310 | 100.0% |
School Enrollment by Age by Funding Source in Milam
Out of a total of 310 students who are enrolled in schools in Milam, 22 (7.1%) attend a private institution, while the remaining 288 (92.9%) are enrolled in public schools. The age group of 20 to 24 year olds has the highest likelihood of being enrolled in private schools, with 22 (100.0% in the age bracket) enrolled. Conversely, the age group of 5 to 9 year old has the lowest likelihood of being enrolled in a private school, with 27 (100.0% in the age bracket) attending a public institution.
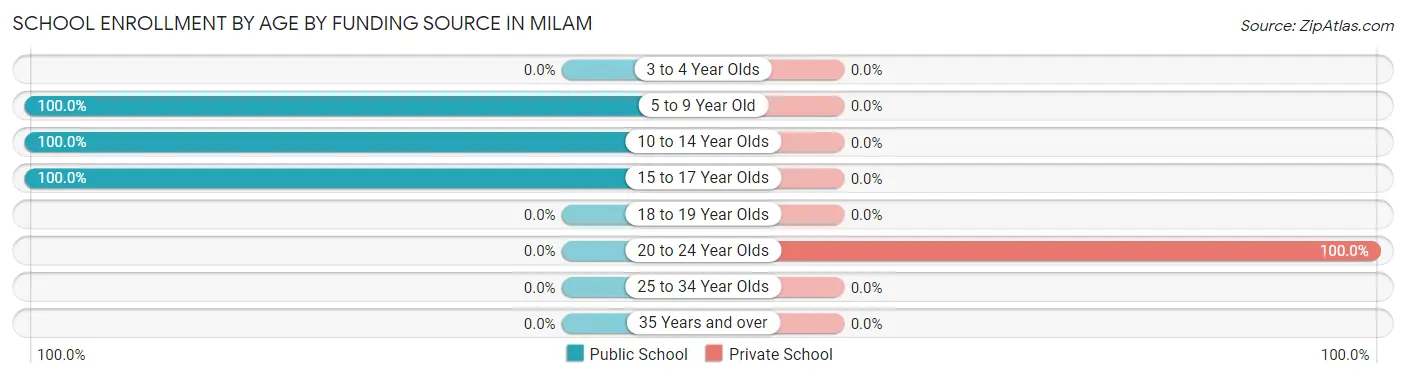
| Age Bracket | Public School | Private School |
| 3 to 4 Year Olds | 0 (0.0%) | 0 (0.0%) |
| 5 to 9 Year Old | 27 (100.0%) | 0 (0.0%) |
| 10 to 14 Year Olds | 230 (100.0%) | 0 (0.0%) |
| 15 to 17 Year Olds | 31 (100.0%) | 0 (0.0%) |
| 18 to 19 Year Olds | 0 (0.0%) | 0 (0.0%) |
| 20 to 24 Year Olds | 0 (0.0%) | 22 (100.0%) |
| 25 to 34 Year Olds | 0 (0.0%) | 0 (0.0%) |
| 35 Years and over | 0 (0.0%) | 0 (0.0%) |
| Total | 288 (92.9%) | 22 (7.1%) |
Educational Attainment by Field of Study in Milam
Education (79 | 26.7%), literature & languages (69 | 23.3%), business (62 | 20.9%), bio, nature & agricultural (52 | 17.6%), and science & technology (12 | 4.1%) are the most common fields of study among 296 individuals in Milam who have obtained a bachelor's degree or higher.
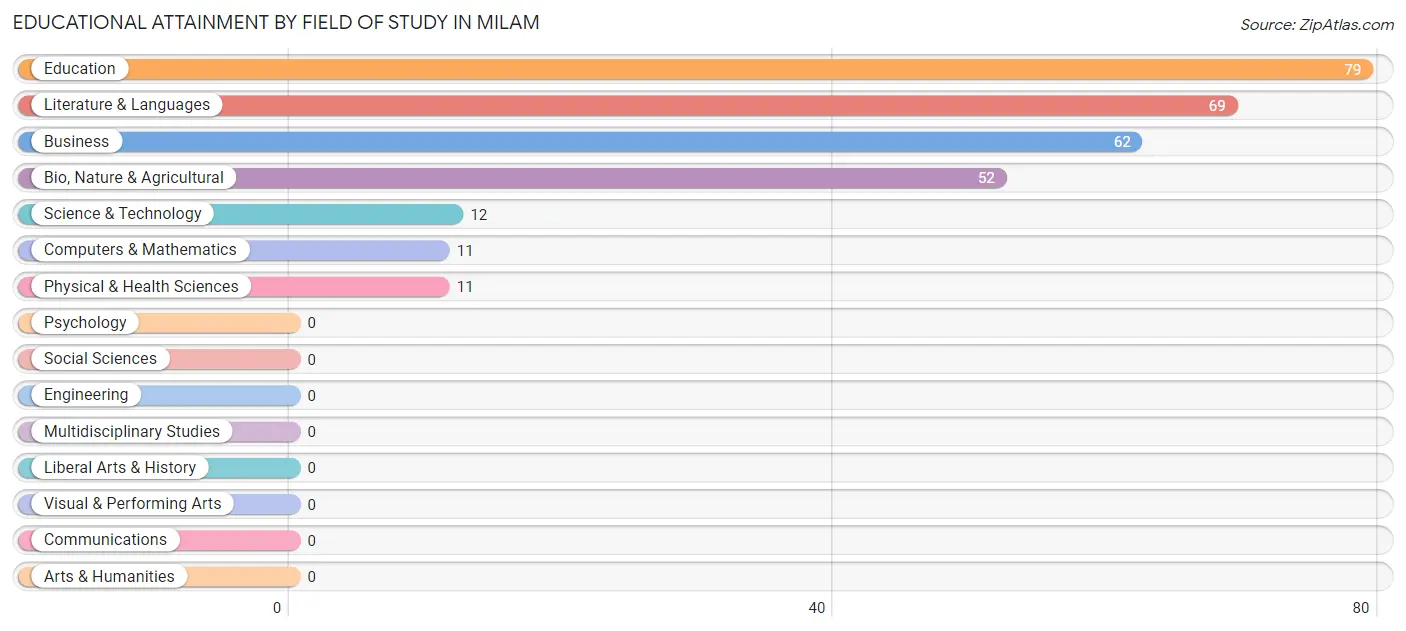
| Field of Study | # Graduates | % Graduates |
| Computers & Mathematics | 11 | 3.7% |
| Bio, Nature & Agricultural | 52 | 17.6% |
| Physical & Health Sciences | 11 | 3.7% |
| Psychology | 0 | 0.0% |
| Social Sciences | 0 | 0.0% |
| Engineering | 0 | 0.0% |
| Multidisciplinary Studies | 0 | 0.0% |
| Science & Technology | 12 | 4.1% |
| Business | 62 | 20.9% |
| Education | 79 | 26.7% |
| Literature & Languages | 69 | 23.3% |
| Liberal Arts & History | 0 | 0.0% |
| Visual & Performing Arts | 0 | 0.0% |
| Communications | 0 | 0.0% |
| Arts & Humanities | 0 | 0.0% |
| Total | 296 | 100.0% |
Transportation & Commute in Milam
Vehicle Availability by Sex in Milam
The most prevalent vehicle ownership categories in Milam are males with 2 vehicles (249, accounting for 78.5%) and females with 2 vehicles (83, making up 154.7%).
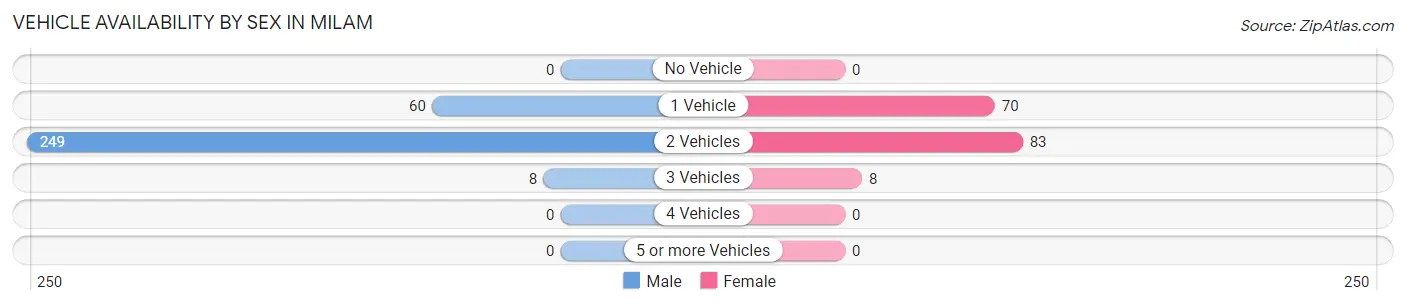
| Vehicles Available | Male | Female |
| No Vehicle | 0 (0.0%) | 0 (0.0%) |
| 1 Vehicle | 60 (18.9%) | 70 (43.5%) |
| 2 Vehicles | 249 (78.5%) | 83 (51.5%) |
| 3 Vehicles | 8 (2.5%) | 8 (5.0%) |
| 4 Vehicles | 0 (0.0%) | 0 (0.0%) |
| 5 or more Vehicles | 0 (0.0%) | 0 (0.0%) |
| Total | 317 (100.0%) | 161 (100.0%) |
Commute Time in Milam
The most frequently occuring commute durations in Milam are 15 to 19 minutes (169 commuters, 35.7%), 5 to 9 minutes (71 commuters, 15.0%), and 45 to 59 minutes (67 commuters, 14.2%).
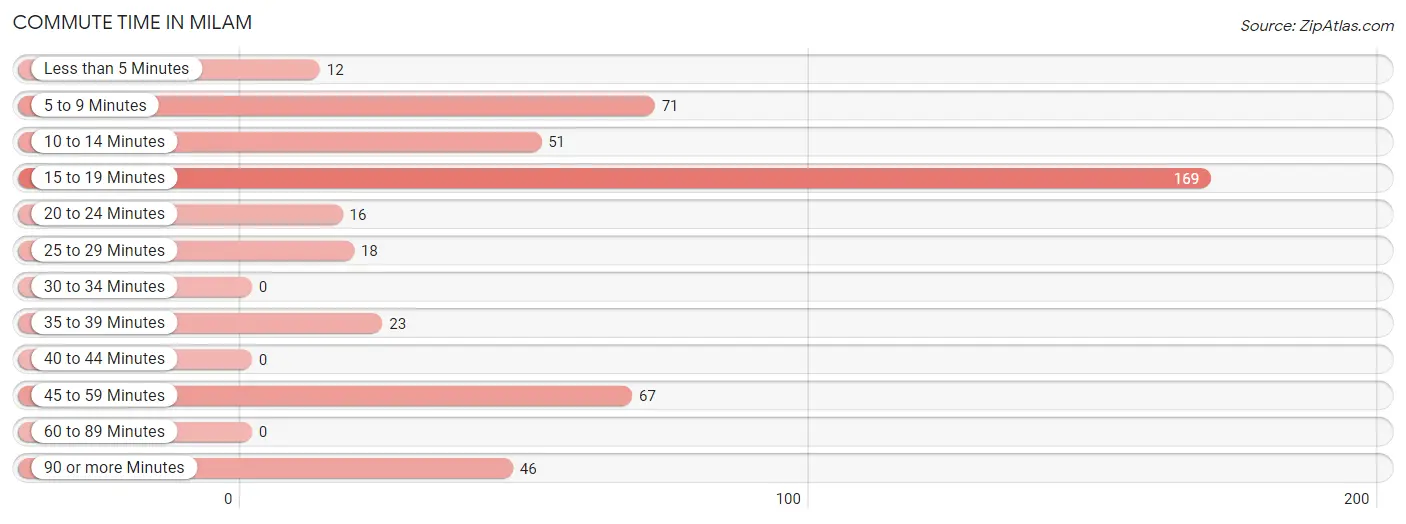
| Commute Time | # Commuters | % Commuters |
| Less than 5 Minutes | 12 | 2.5% |
| 5 to 9 Minutes | 71 | 15.0% |
| 10 to 14 Minutes | 51 | 10.8% |
| 15 to 19 Minutes | 169 | 35.7% |
| 20 to 24 Minutes | 16 | 3.4% |
| 25 to 29 Minutes | 18 | 3.8% |
| 30 to 34 Minutes | 0 | 0.0% |
| 35 to 39 Minutes | 23 | 4.9% |
| 40 to 44 Minutes | 0 | 0.0% |
| 45 to 59 Minutes | 67 | 14.2% |
| 60 to 89 Minutes | 0 | 0.0% |
| 90 or more Minutes | 46 | 9.7% |
Commute Time by Sex in Milam
The most common commute times in Milam are 15 to 19 minutes (73 commuters, 23.0%) for males and 15 to 19 minutes (96 commuters, 61.5%) for females.
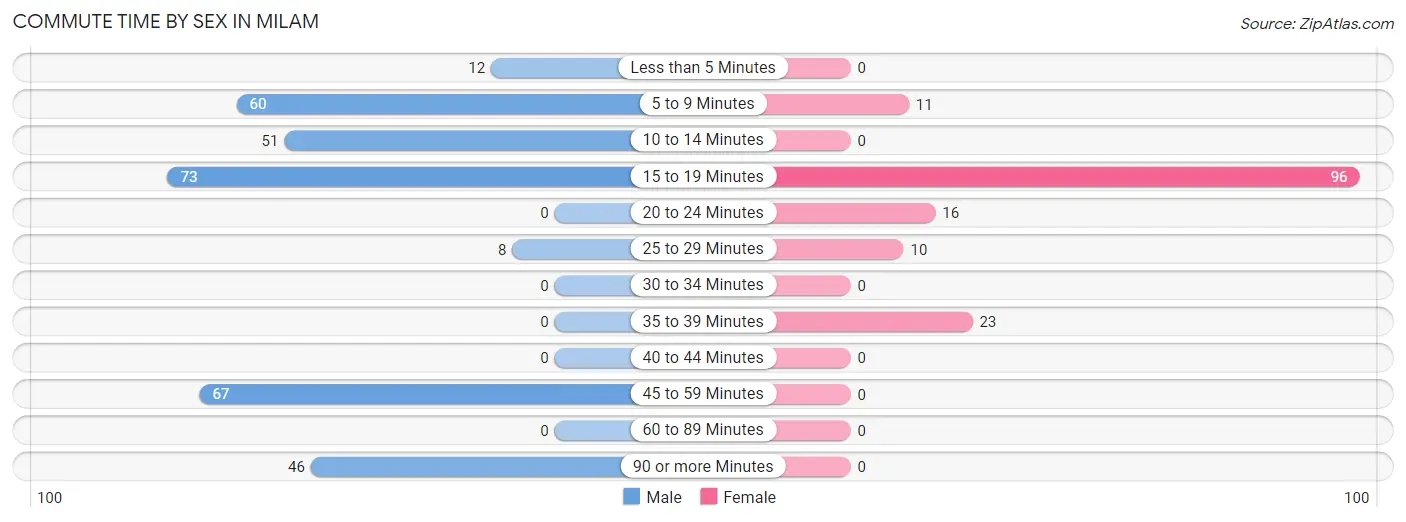
| Commute Time | Male | Female |
| Less than 5 Minutes | 12 (3.8%) | 0 (0.0%) |
| 5 to 9 Minutes | 60 (18.9%) | 11 (7.0%) |
| 10 to 14 Minutes | 51 (16.1%) | 0 (0.0%) |
| 15 to 19 Minutes | 73 (23.0%) | 96 (61.5%) |
| 20 to 24 Minutes | 0 (0.0%) | 16 (10.3%) |
| 25 to 29 Minutes | 8 (2.5%) | 10 (6.4%) |
| 30 to 34 Minutes | 0 (0.0%) | 0 (0.0%) |
| 35 to 39 Minutes | 0 (0.0%) | 23 (14.7%) |
| 40 to 44 Minutes | 0 (0.0%) | 0 (0.0%) |
| 45 to 59 Minutes | 67 (21.1%) | 0 (0.0%) |
| 60 to 89 Minutes | 0 (0.0%) | 0 (0.0%) |
| 90 or more Minutes | 46 (14.5%) | 0 (0.0%) |
Time of Departure to Work by Sex in Milam
The most frequent times of departure to work in Milam are 7:00 AM to 7:29 AM (99, 31.2%) for males and 7:00 AM to 7:29 AM (51, 32.7%) for females.
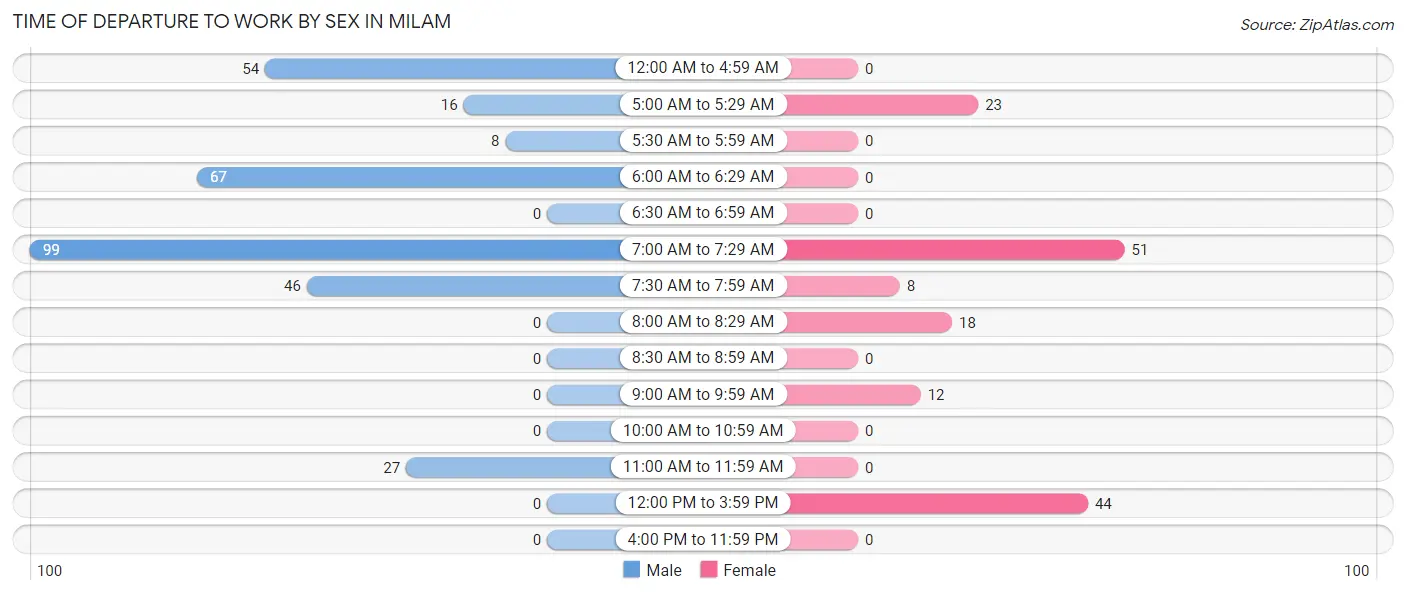
| Time of Departure | Male | Female |
| 12:00 AM to 4:59 AM | 54 (17.0%) | 0 (0.0%) |
| 5:00 AM to 5:29 AM | 16 (5.1%) | 23 (14.7%) |
| 5:30 AM to 5:59 AM | 8 (2.5%) | 0 (0.0%) |
| 6:00 AM to 6:29 AM | 67 (21.1%) | 0 (0.0%) |
| 6:30 AM to 6:59 AM | 0 (0.0%) | 0 (0.0%) |
| 7:00 AM to 7:29 AM | 99 (31.2%) | 51 (32.7%) |
| 7:30 AM to 7:59 AM | 46 (14.5%) | 8 (5.1%) |
| 8:00 AM to 8:29 AM | 0 (0.0%) | 18 (11.5%) |
| 8:30 AM to 8:59 AM | 0 (0.0%) | 0 (0.0%) |
| 9:00 AM to 9:59 AM | 0 (0.0%) | 12 (7.7%) |
| 10:00 AM to 10:59 AM | 0 (0.0%) | 0 (0.0%) |
| 11:00 AM to 11:59 AM | 27 (8.5%) | 0 (0.0%) |
| 12:00 PM to 3:59 PM | 0 (0.0%) | 44 (28.2%) |
| 4:00 PM to 11:59 PM | 0 (0.0%) | 0 (0.0%) |
| Total | 317 (100.0%) | 156 (100.0%) |
Housing Occupancy in Milam
Occupancy by Ownership in Milam
Of the total 635 dwellings in Milam, owner-occupied units account for 549 (86.5%), while renter-occupied units make up 86 (13.5%).
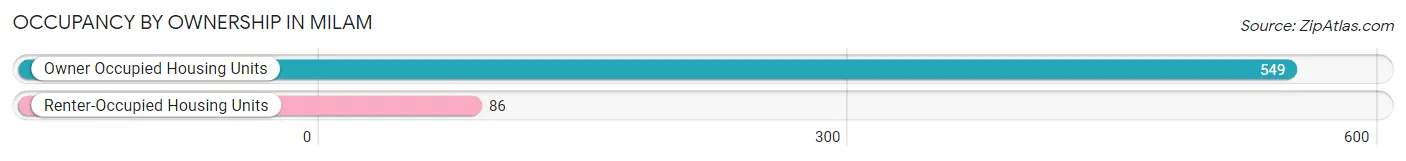
| Occupancy | # Housing Units | % Housing Units |
| Owner Occupied Housing Units | 549 | 86.5% |
| Renter-Occupied Housing Units | 86 | 13.5% |
| Total Occupied Housing Units | 635 | 100.0% |
Occupancy by Household Size in Milam
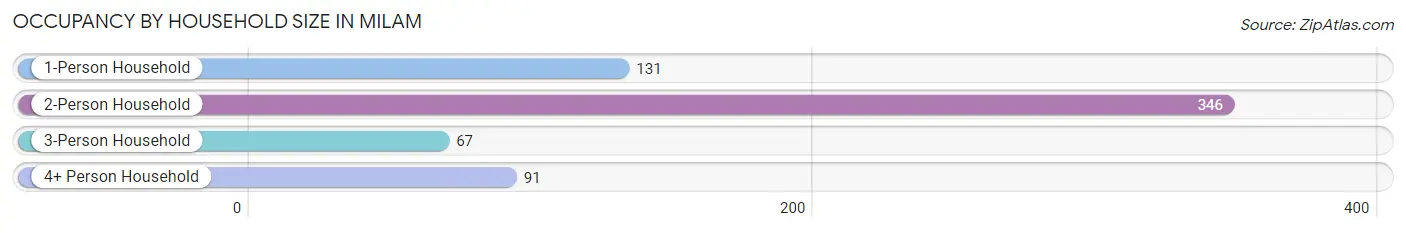
| Household Size | # Housing Units | % Housing Units |
| 1-Person Household | 131 | 20.6% |
| 2-Person Household | 346 | 54.5% |
| 3-Person Household | 67 | 10.5% |
| 4+ Person Household | 91 | 14.3% |
| Total Housing Units | 635 | 100.0% |
Occupancy by Ownership by Household Size in Milam
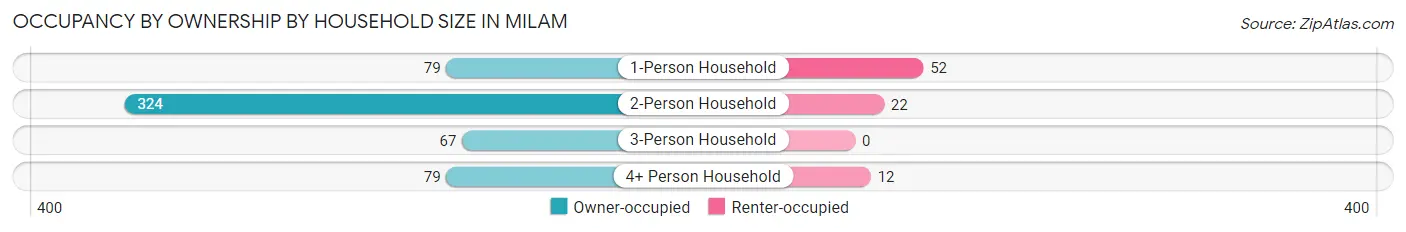
| Household Size | Owner-occupied | Renter-occupied |
| 1-Person Household | 79 (60.3%) | 52 (39.7%) |
| 2-Person Household | 324 (93.6%) | 22 (6.4%) |
| 3-Person Household | 67 (100.0%) | 0 (0.0%) |
| 4+ Person Household | 79 (86.8%) | 12 (13.2%) |
| Total Housing Units | 549 (86.5%) | 86 (13.5%) |
Occupancy by Educational Attainment in Milam
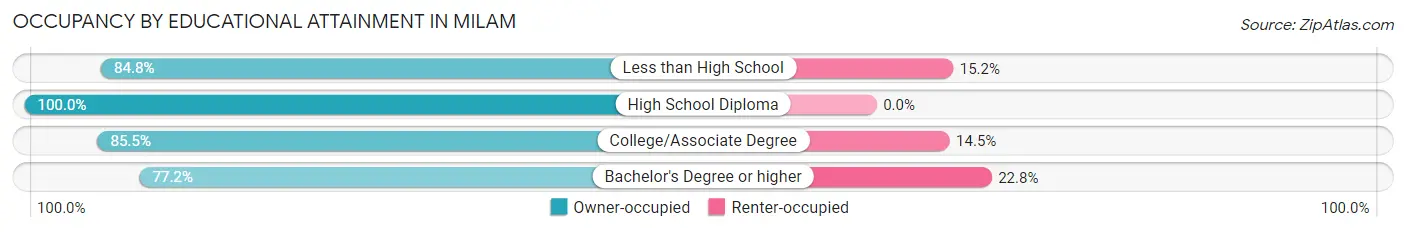
| Household Size | Owner-occupied | Renter-occupied |
| Less than High School | 67 (84.8%) | 12 (15.2%) |
| High School Diploma | 176 (100.0%) | 0 (0.0%) |
| College/Associate Degree | 130 (85.5%) | 22 (14.5%) |
| Bachelor's Degree or higher | 176 (77.2%) | 52 (22.8%) |
Occupancy by Age of Householder in Milam
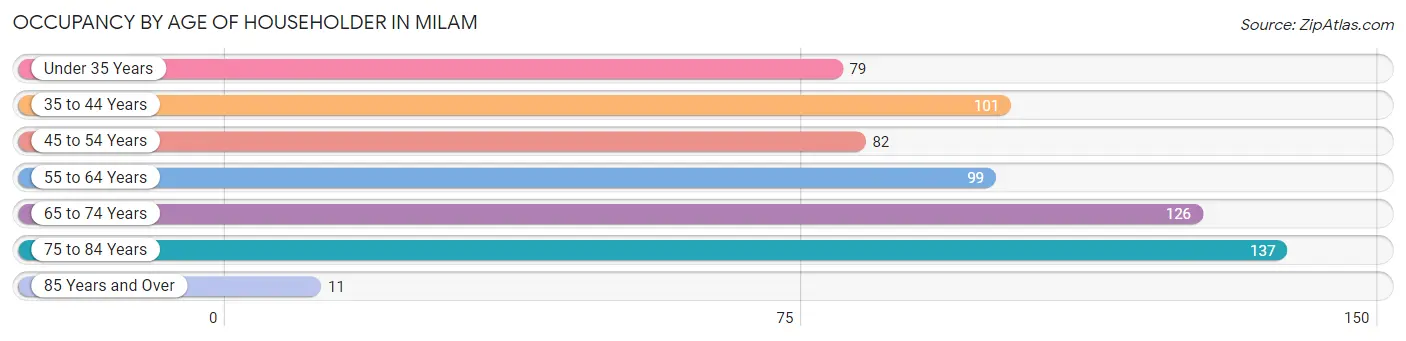
| Age Bracket | # Households | % Households |
| Under 35 Years | 79 | 12.4% |
| 35 to 44 Years | 101 | 15.9% |
| 45 to 54 Years | 82 | 12.9% |
| 55 to 64 Years | 99 | 15.6% |
| 65 to 74 Years | 126 | 19.8% |
| 75 to 84 Years | 137 | 21.6% |
| 85 Years and Over | 11 | 1.7% |
| Total | 635 | 100.0% |
Housing Finances in Milam
Median Income by Occupancy in Milam
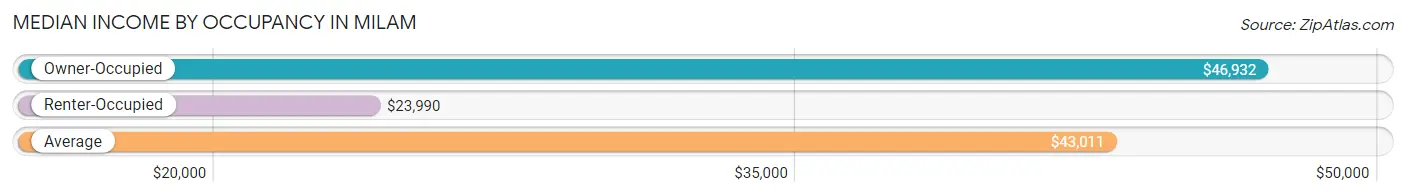
| Occupancy Type | # Households | Median Income |
| Owner-Occupied | 549 (86.5%) | $46,932 |
| Renter-Occupied | 86 (13.5%) | $23,990 |
| Average | 635 (100.0%) | $43,011 |
Occupancy by Householder Income Bracket in Milam
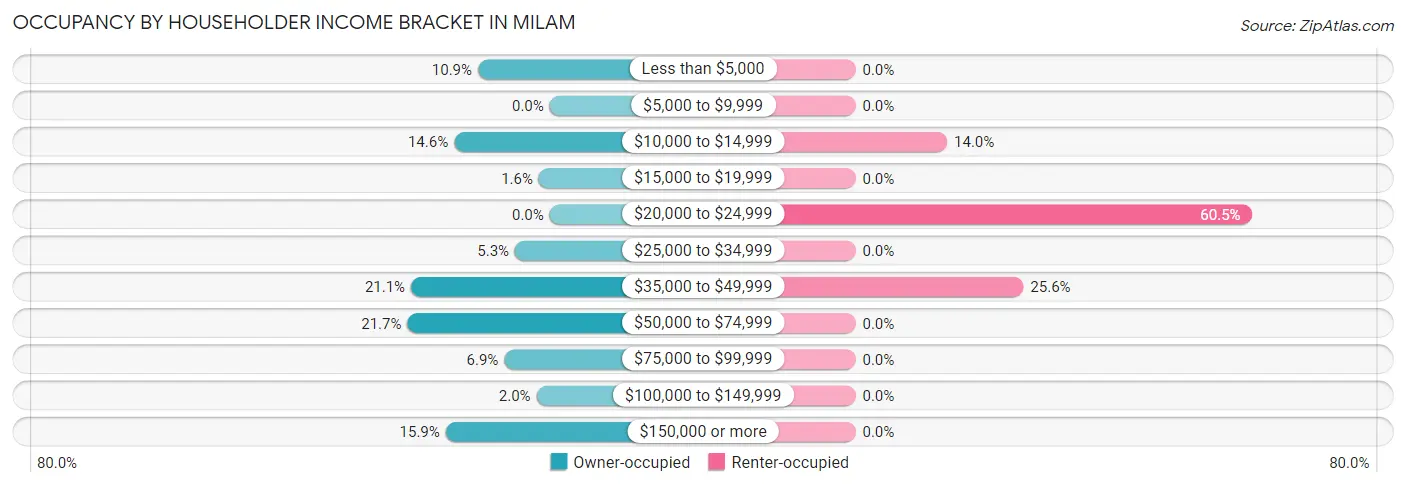
| Income Bracket | Owner-occupied | Renter-occupied |
| Less than $5,000 | 60 (10.9%) | 0 (0.0%) |
| $5,000 to $9,999 | 0 (0.0%) | 0 (0.0%) |
| $10,000 to $14,999 | 80 (14.6%) | 12 (14.0%) |
| $15,000 to $19,999 | 9 (1.6%) | 0 (0.0%) |
| $20,000 to $24,999 | 0 (0.0%) | 52 (60.5%) |
| $25,000 to $34,999 | 29 (5.3%) | 0 (0.0%) |
| $35,000 to $49,999 | 116 (21.1%) | 22 (25.6%) |
| $50,000 to $74,999 | 119 (21.7%) | 0 (0.0%) |
| $75,000 to $99,999 | 38 (6.9%) | 0 (0.0%) |
| $100,000 to $149,999 | 11 (2.0%) | 0 (0.0%) |
| $150,000 or more | 87 (15.9%) | 0 (0.0%) |
| Total | 549 (100.0%) | 86 (100.0%) |
Monthly Housing Cost Tiers in Milam
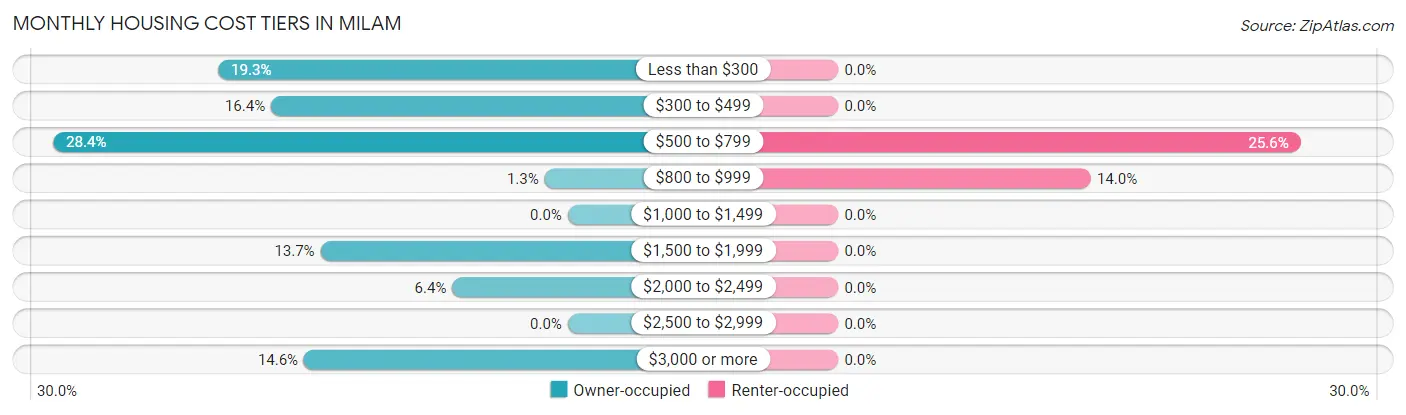
| Monthly Cost | Owner-occupied | Renter-occupied |
| Less than $300 | 106 (19.3%) | 0 (0.0%) |
| $300 to $499 | 90 (16.4%) | 0 (0.0%) |
| $500 to $799 | 156 (28.4%) | 22 (25.6%) |
| $800 to $999 | 7 (1.3%) | 12 (14.0%) |
| $1,000 to $1,499 | 0 (0.0%) | 0 (0.0%) |
| $1,500 to $1,999 | 75 (13.7%) | 0 (0.0%) |
| $2,000 to $2,499 | 35 (6.4%) | 0 (0.0%) |
| $2,500 to $2,999 | 0 (0.0%) | 0 (0.0%) |
| $3,000 or more | 80 (14.6%) | 0 (0.0%) |
| Total | 549 (100.0%) | 86 (100.0%) |
Physical Housing Characteristics in Milam
Housing Structures in Milam
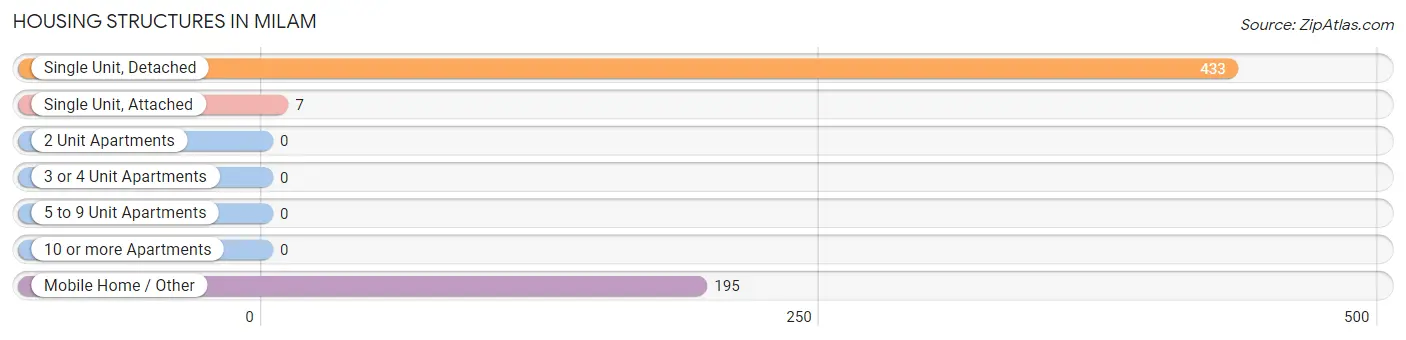
| Structure Type | # Housing Units | % Housing Units |
| Single Unit, Detached | 433 | 68.2% |
| Single Unit, Attached | 7 | 1.1% |
| 2 Unit Apartments | 0 | 0.0% |
| 3 or 4 Unit Apartments | 0 | 0.0% |
| 5 to 9 Unit Apartments | 0 | 0.0% |
| 10 or more Apartments | 0 | 0.0% |
| Mobile Home / Other | 195 | 30.7% |
| Total | 635 | 100.0% |
Housing Structures by Occupancy in Milam
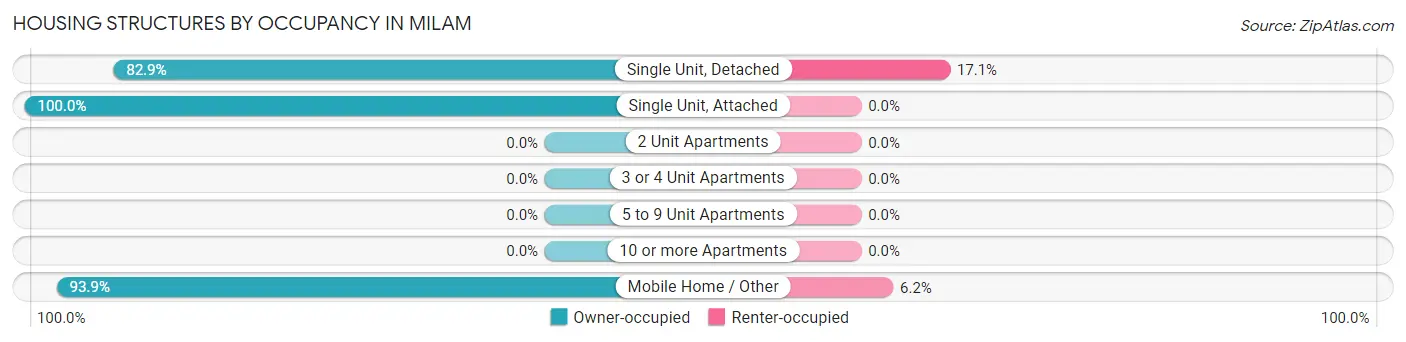
| Structure Type | Owner-occupied | Renter-occupied |
| Single Unit, Detached | 359 (82.9%) | 74 (17.1%) |
| Single Unit, Attached | 7 (100.0%) | 0 (0.0%) |
| 2 Unit Apartments | 0 (0.0%) | 0 (0.0%) |
| 3 or 4 Unit Apartments | 0 (0.0%) | 0 (0.0%) |
| 5 to 9 Unit Apartments | 0 (0.0%) | 0 (0.0%) |
| 10 or more Apartments | 0 (0.0%) | 0 (0.0%) |
| Mobile Home / Other | 183 (93.9%) | 12 (6.1%) |
| Total | 549 (86.5%) | 86 (13.5%) |
Housing Structures by Number of Rooms in Milam
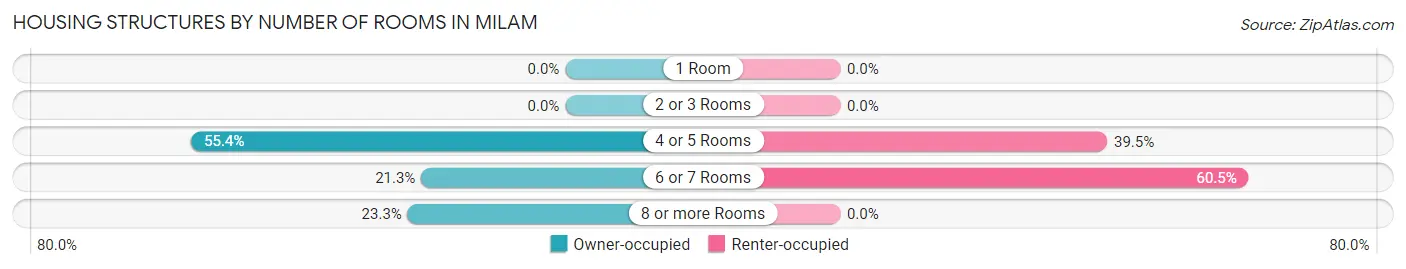
| Number of Rooms | Owner-occupied | Renter-occupied |
| 1 Room | 0 (0.0%) | 0 (0.0%) |
| 2 or 3 Rooms | 0 (0.0%) | 0 (0.0%) |
| 4 or 5 Rooms | 304 (55.4%) | 34 (39.5%) |
| 6 or 7 Rooms | 117 (21.3%) | 52 (60.5%) |
| 8 or more Rooms | 128 (23.3%) | 0 (0.0%) |
| Total | 549 (100.0%) | 86 (100.0%) |
Housing Structure by Heating Type in Milam
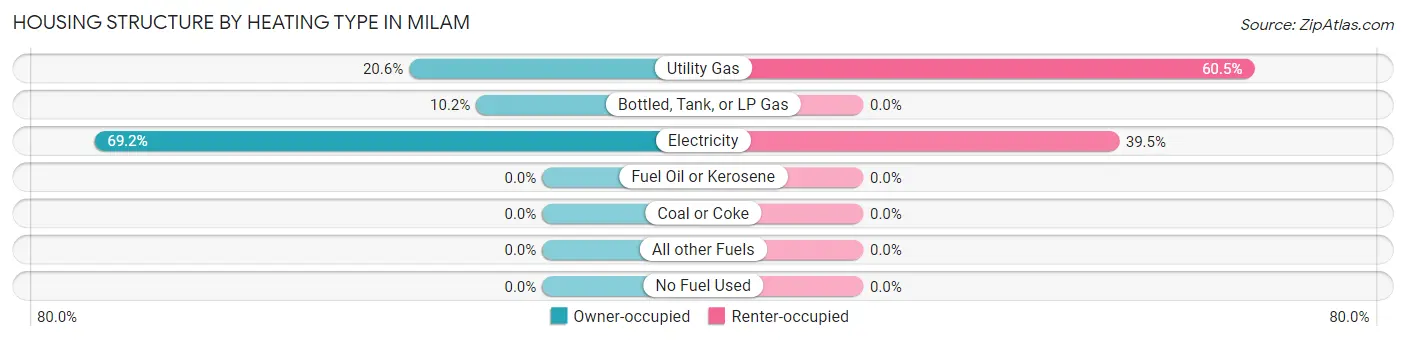
| Heating Type | Owner-occupied | Renter-occupied |
| Utility Gas | 113 (20.6%) | 52 (60.5%) |
| Bottled, Tank, or LP Gas | 56 (10.2%) | 0 (0.0%) |
| Electricity | 380 (69.2%) | 34 (39.5%) |
| Fuel Oil or Kerosene | 0 (0.0%) | 0 (0.0%) |
| Coal or Coke | 0 (0.0%) | 0 (0.0%) |
| All other Fuels | 0 (0.0%) | 0 (0.0%) |
| No Fuel Used | 0 (0.0%) | 0 (0.0%) |
| Total | 549 (100.0%) | 86 (100.0%) |
Household Vehicle Usage in Milam
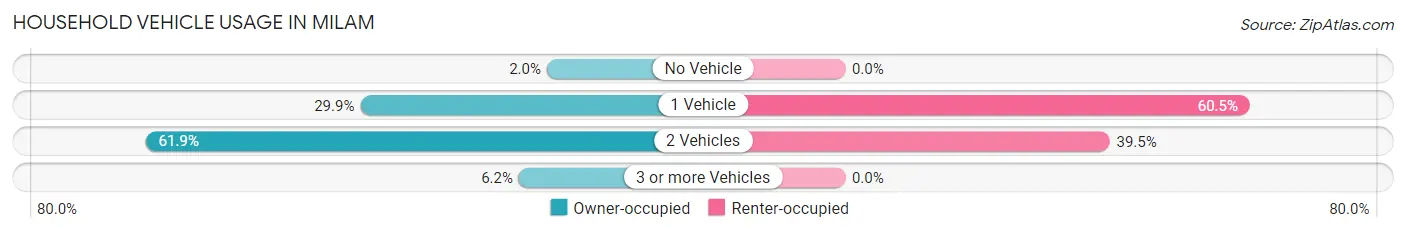
| Vehicles per Household | Owner-occupied | Renter-occupied |
| No Vehicle | 11 (2.0%) | 0 (0.0%) |
| 1 Vehicle | 164 (29.9%) | 52 (60.5%) |
| 2 Vehicles | 340 (61.9%) | 34 (39.5%) |
| 3 or more Vehicles | 34 (6.2%) | 0 (0.0%) |
| Total | 549 (100.0%) | 86 (100.0%) |
Real Estate & Mortgages in Milam
Real Estate and Mortgage Overview in Milam
| Characteristic | Without Mortgage | With Mortgage |
| Housing Units | 359 | 190 |
| Median Property Value | $107,200 | $295,500 |
| Median Household Income | $38,813 | $80 |
| Monthly Housing Costs | $475 | $80 |
| Real Estate Taxes | $907 | $0 |
Property Value by Mortgage Status in Milam
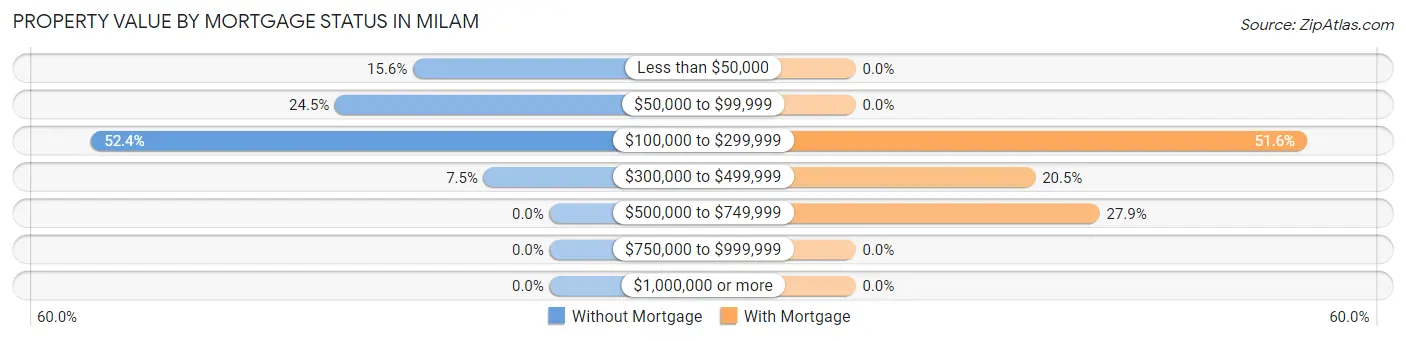
| Property Value | Without Mortgage | With Mortgage |
| Less than $50,000 | 56 (15.6%) | 0 (0.0%) |
| $50,000 to $99,999 | 88 (24.5%) | 0 (0.0%) |
| $100,000 to $299,999 | 188 (52.4%) | 98 (51.6%) |
| $300,000 to $499,999 | 27 (7.5%) | 39 (20.5%) |
| $500,000 to $749,999 | 0 (0.0%) | 53 (27.9%) |
| $750,000 to $999,999 | 0 (0.0%) | 0 (0.0%) |
| $1,000,000 or more | 0 (0.0%) | 0 (0.0%) |
| Total | 359 (100.0%) | 190 (100.0%) |
Household Income by Mortgage Status in Milam
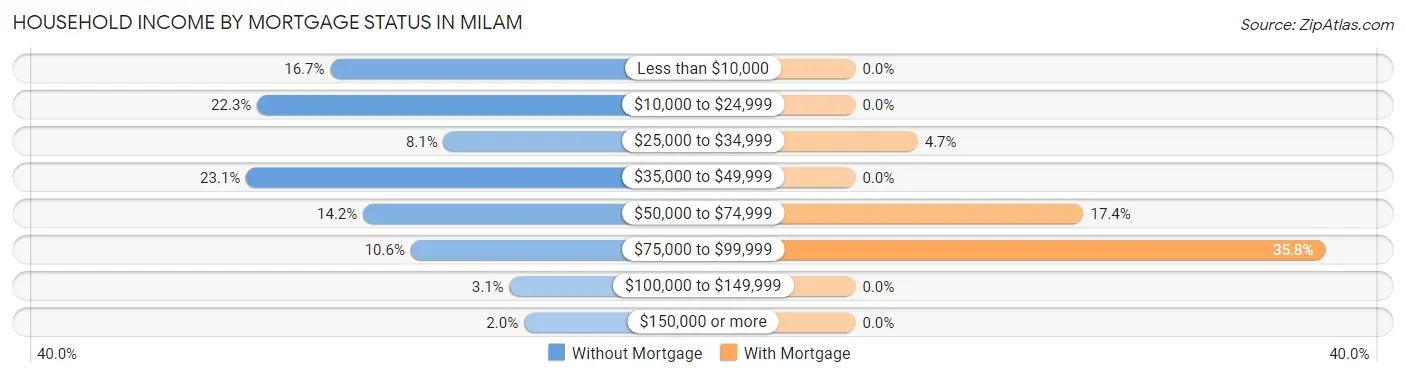
| Household Income | Without Mortgage | With Mortgage |
| Less than $10,000 | 60 (16.7%) | 0 (0.0%) |
| $10,000 to $24,999 | 80 (22.3%) | 0 (0.0%) |
| $25,000 to $34,999 | 29 (8.1%) | 9 (4.7%) |
| $35,000 to $49,999 | 83 (23.1%) | 0 (0.0%) |
| $50,000 to $74,999 | 51 (14.2%) | 33 (17.4%) |
| $75,000 to $99,999 | 38 (10.6%) | 68 (35.8%) |
| $100,000 to $149,999 | 11 (3.1%) | 0 (0.0%) |
| $150,000 or more | 7 (1.9%) | 0 (0.0%) |
| Total | 359 (100.0%) | 190 (100.0%) |
Property Value to Household Income Ratio in Milam
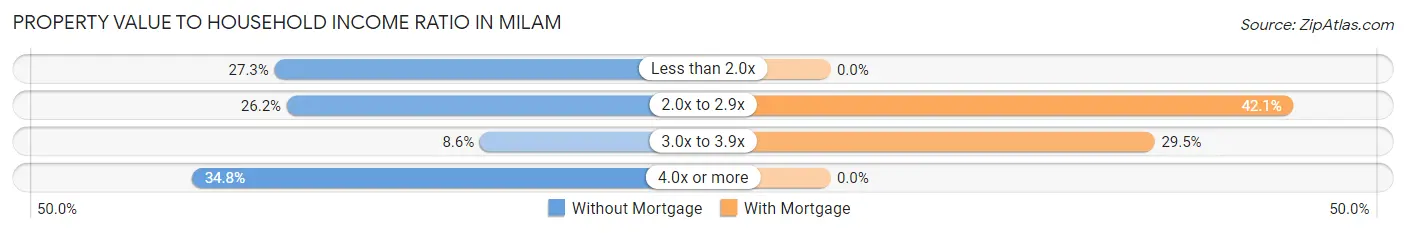
| Value-to-Income Ratio | Without Mortgage | With Mortgage |
| Less than 2.0x | 98 (27.3%) | 0 (0.0%) |
| 2.0x to 2.9x | 94 (26.2%) | 80 (42.1%) |
| 3.0x to 3.9x | 31 (8.6%) | 56 (29.5%) |
| 4.0x or more | 125 (34.8%) | 0 (0.0%) |
| Total | 359 (100.0%) | 190 (100.0%) |
Real Estate Taxes by Mortgage Status in Milam
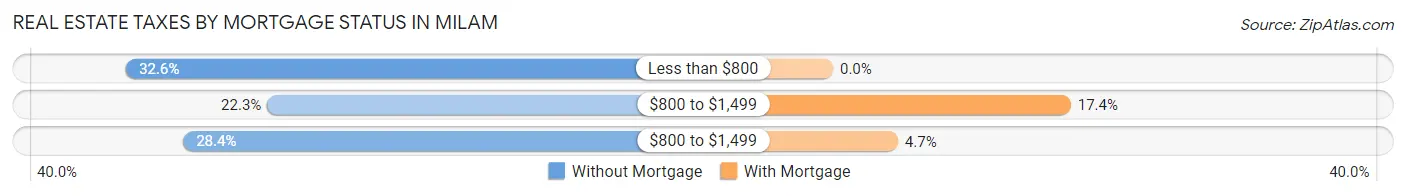
| Property Taxes | Without Mortgage | With Mortgage |
| Less than $800 | 117 (32.6%) | 0 (0.0%) |
| $800 to $1,499 | 80 (22.3%) | 33 (17.4%) |
| $800 to $1,499 | 102 (28.4%) | 9 (4.7%) |
| Total | 359 (100.0%) | 190 (100.0%) |
Health & Disability in Milam
Health Insurance Coverage by Age in Milam
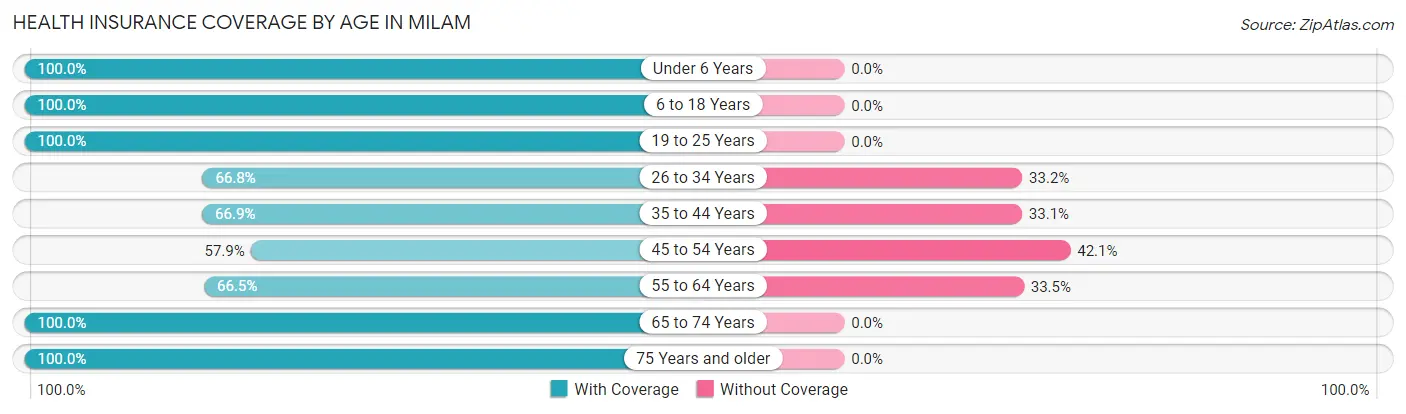
| Age Bracket | With Coverage | Without Coverage |
| Under 6 Years | 13 (100.0%) | 0 (0.0%) |
| 6 to 18 Years | 326 (100.0%) | 0 (0.0%) |
| 19 to 25 Years | 41 (100.0%) | 0 (0.0%) |
| 26 to 34 Years | 137 (66.8%) | 68 (33.2%) |
| 35 to 44 Years | 103 (66.9%) | 51 (33.1%) |
| 45 to 54 Years | 92 (57.9%) | 67 (42.1%) |
| 55 to 64 Years | 165 (66.5%) | 83 (33.5%) |
| 65 to 74 Years | 195 (100.0%) | 0 (0.0%) |
| 75 Years and older | 195 (100.0%) | 0 (0.0%) |
| Total | 1,267 (82.5%) | 269 (17.5%) |
Health Insurance Coverage by Citizenship Status in Milam
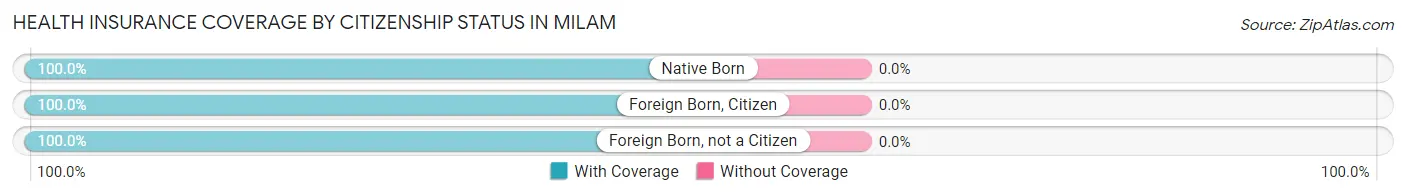
| Citizenship Status | With Coverage | Without Coverage |
| Native Born | 13 (100.0%) | 0 (0.0%) |
| Foreign Born, Citizen | 326 (100.0%) | 0 (0.0%) |
| Foreign Born, not a Citizen | 41 (100.0%) | 0 (0.0%) |
Health Insurance Coverage by Household Income in Milam
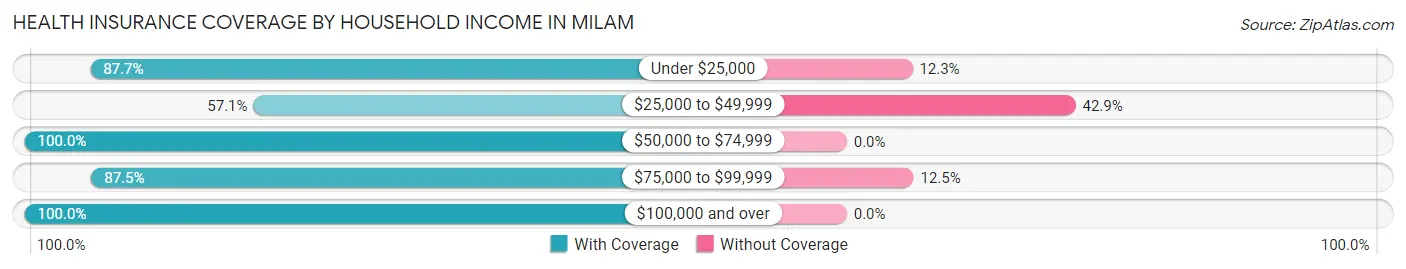
| Household Income | With Coverage | Without Coverage |
| Under $25,000 | 321 (87.7%) | 45 (12.3%) |
| $25,000 to $49,999 | 288 (57.1%) | 216 (42.9%) |
| $50,000 to $74,999 | 404 (100.0%) | 0 (0.0%) |
| $75,000 to $99,999 | 56 (87.5%) | 8 (12.5%) |
| $100,000 and over | 198 (100.0%) | 0 (0.0%) |
Public vs Private Health Insurance Coverage by Age in Milam
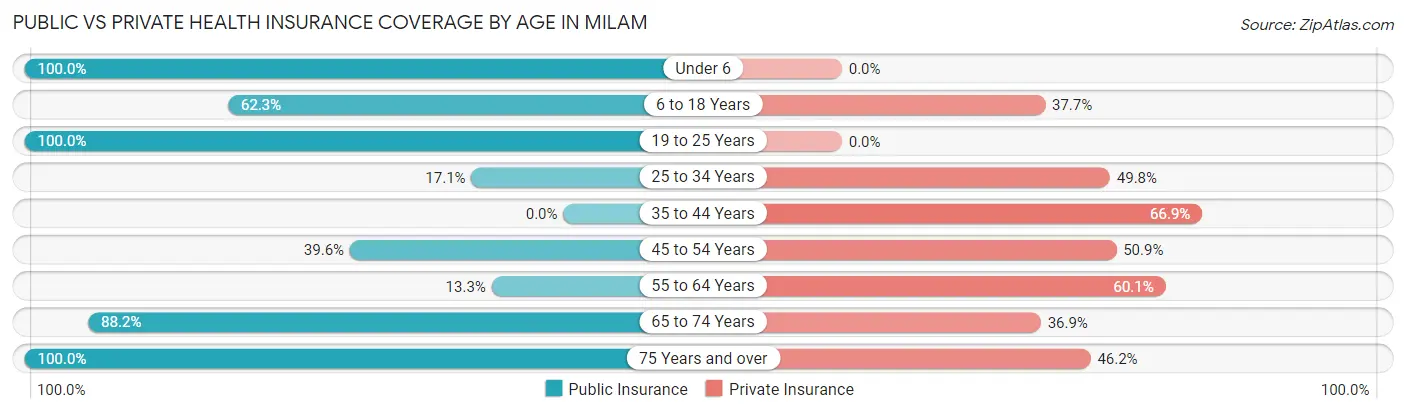
| Age Bracket | Public Insurance | Private Insurance |
| Under 6 | 13 (100.0%) | 0 (0.0%) |
| 6 to 18 Years | 203 (62.3%) | 123 (37.7%) |
| 19 to 25 Years | 41 (100.0%) | 0 (0.0%) |
| 25 to 34 Years | 35 (17.1%) | 102 (49.8%) |
| 35 to 44 Years | 0 (0.0%) | 103 (66.9%) |
| 45 to 54 Years | 63 (39.6%) | 81 (50.9%) |
| 55 to 64 Years | 33 (13.3%) | 149 (60.1%) |
| 65 to 74 Years | 172 (88.2%) | 72 (36.9%) |
| 75 Years and over | 195 (100.0%) | 90 (46.2%) |
| Total | 755 (49.1%) | 720 (46.9%) |
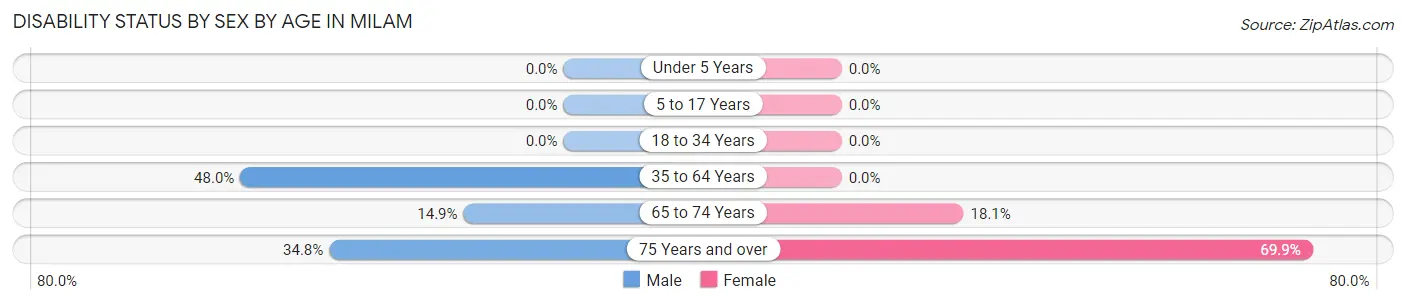
Disability Status by Sex by Age in Milam
| Age Bracket | Male | Female |
| Under 5 Years | 0 (0.0%) | 0 (0.0%) |
| 5 to 17 Years | 0 (0.0%) | 0 (0.0%) |
| 18 to 34 Years | 0 (0.0%) | 0 (0.0%) |
| 35 to 64 Years | 155 (48.0%) | 0 (0.0%) |
| 65 to 74 Years | 15 (14.8%) | 17 (18.1%) |
| 75 Years and over | 32 (34.8%) | 72 (69.9%) |
Disability Class by Sex by Age in Milam
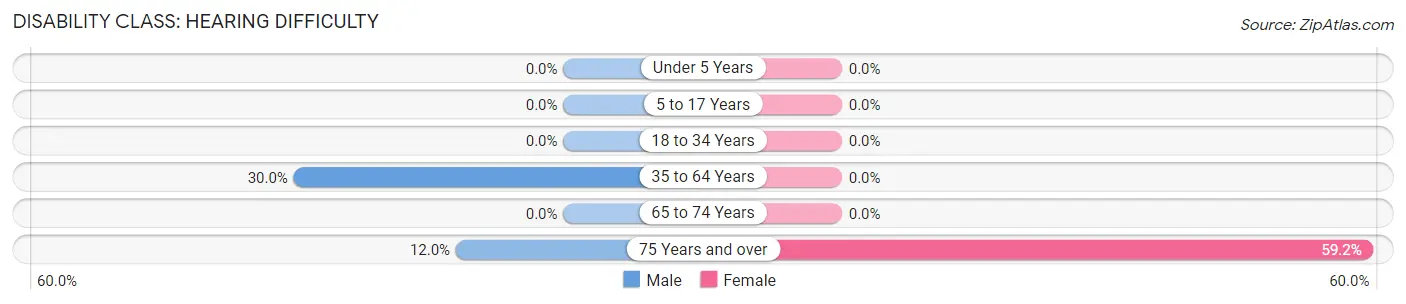
Disability Class: Hearing Difficulty
| Age Bracket | Male | Female |
| Under 5 Years | 0 (0.0%) | 0 (0.0%) |
| 5 to 17 Years | 0 (0.0%) | 0 (0.0%) |
| 18 to 34 Years | 0 (0.0%) | 0 (0.0%) |
| 35 to 64 Years | 97 (30.0%) | 0 (0.0%) |
| 65 to 74 Years | 0 (0.0%) | 0 (0.0%) |
| 75 Years and over | 11 (12.0%) | 61 (59.2%) |
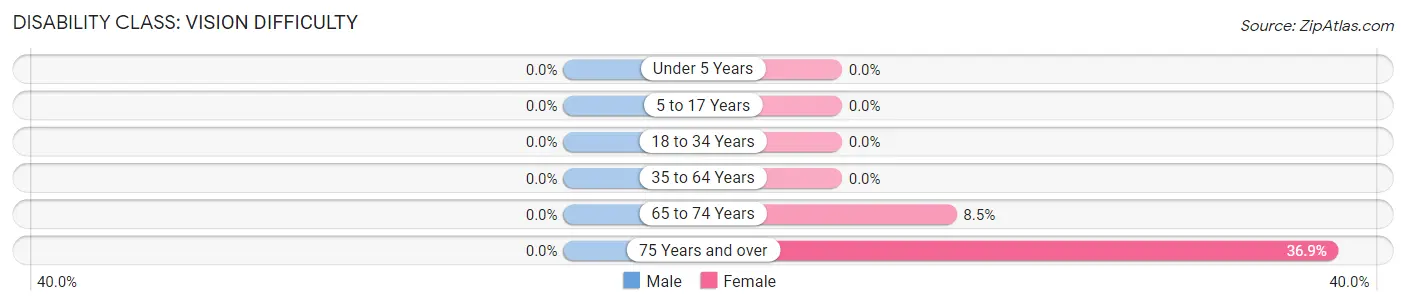
Disability Class: Vision Difficulty
| Age Bracket | Male | Female |
| Under 5 Years | 0 (0.0%) | 0 (0.0%) |
| 5 to 17 Years | 0 (0.0%) | 0 (0.0%) |
| 18 to 34 Years | 0 (0.0%) | 0 (0.0%) |
| 35 to 64 Years | 0 (0.0%) | 0 (0.0%) |
| 65 to 74 Years | 0 (0.0%) | 8 (8.5%) |
| 75 Years and over | 0 (0.0%) | 38 (36.9%) |
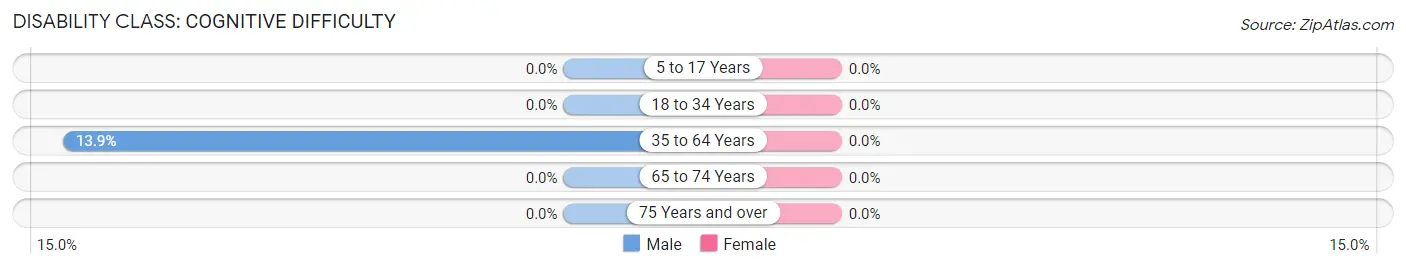
Disability Class: Cognitive Difficulty
| Age Bracket | Male | Female |
| 5 to 17 Years | 0 (0.0%) | 0 (0.0%) |
| 18 to 34 Years | 0 (0.0%) | 0 (0.0%) |
| 35 to 64 Years | 45 (13.9%) | 0 (0.0%) |
| 65 to 74 Years | 0 (0.0%) | 0 (0.0%) |
| 75 Years and over | 0 (0.0%) | 0 (0.0%) |
Disability Class: Ambulatory Difficulty
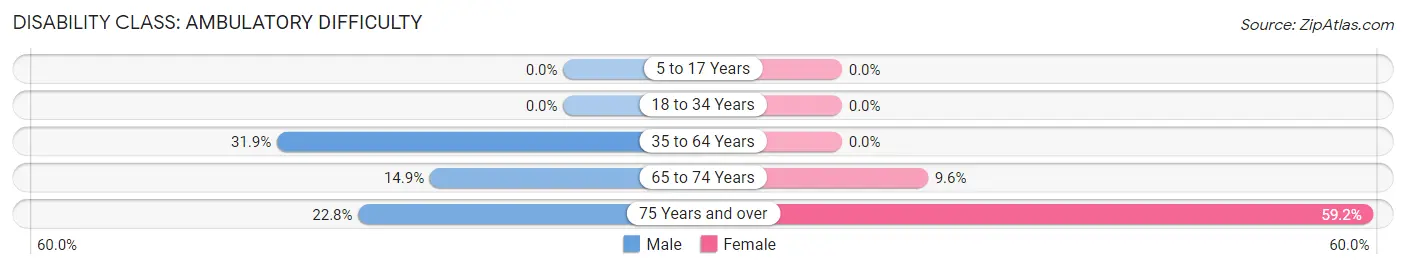
| Age Bracket | Male | Female |
| 5 to 17 Years | 0 (0.0%) | 0 (0.0%) |
| 18 to 34 Years | 0 (0.0%) | 0 (0.0%) |
| 35 to 64 Years | 103 (31.9%) | 0 (0.0%) |
| 65 to 74 Years | 15 (14.8%) | 9 (9.6%) |
| 75 Years and over | 21 (22.8%) | 61 (59.2%) |
Disability Class: Self-Care Difficulty
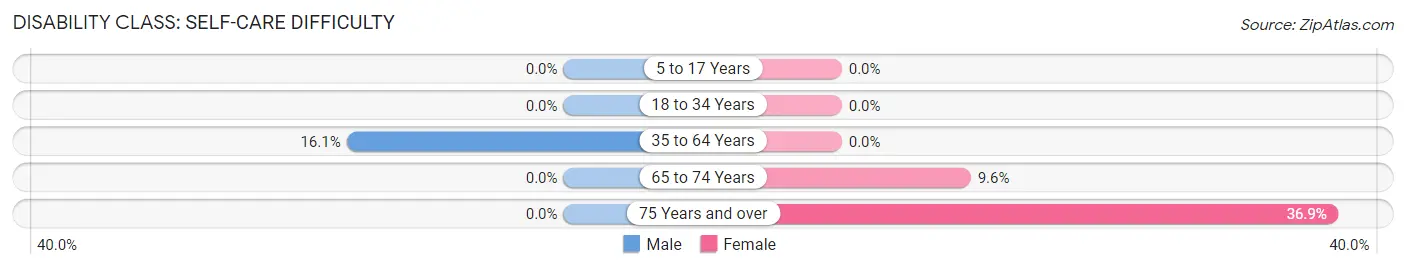
| Age Bracket | Male | Female |
| 5 to 17 Years | 0 (0.0%) | 0 (0.0%) |
| 18 to 34 Years | 0 (0.0%) | 0 (0.0%) |
| 35 to 64 Years | 52 (16.1%) | 0 (0.0%) |
| 65 to 74 Years | 0 (0.0%) | 9 (9.6%) |
| 75 Years and over | 0 (0.0%) | 38 (36.9%) |
Technology Access in Milam
Computing Device Access in Milam
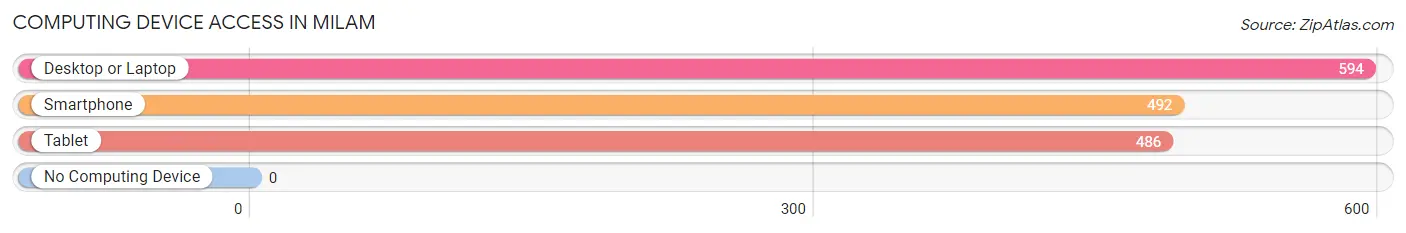
| Device Type | # Households | % Households |
| Desktop or Laptop | 594 | 93.5% |
| Smartphone | 492 | 77.5% |
| Tablet | 486 | 76.5% |
| No Computing Device | 0 | 0.0% |
| Total | 635 | 100.0% |
Internet Access in Milam
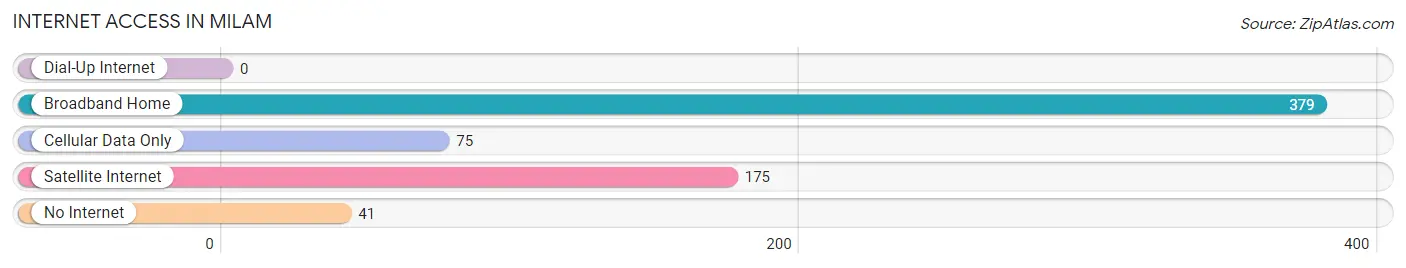
| Internet Type | # Households | % Households |
| Dial-Up Internet | 0 | 0.0% |
| Broadband Home | 379 | 59.7% |
| Cellular Data Only | 75 | 11.8% |
| Satellite Internet | 175 | 27.6% |
| No Internet | 41 | 6.5% |
| Total | 635 | 100.0% |
Milam Summary
Milam, Texas is a small town located in the eastern part of the state, about an hour and a half east of Austin. It is part of the larger Milam County, which is located in the heart of Central Texas. The town of Milam was founded in 1873 and has a population of just over 1,000 people.
Geography
Milam is located in the eastern part of Texas, about an hour and a half east of Austin. It is part of the larger Milam County, which is located in the heart of Central Texas. The town of Milam is situated on the banks of the Little River, which is a tributary of the Brazos River. The town is surrounded by rolling hills and is located in a region of Texas known as the Blackland Prairie. The area is known for its fertile soil and is home to a variety of crops, including cotton, corn, and wheat.
History
The town of Milam was founded in 1873 by a group of settlers from the nearby town of Cameron. The settlers were looking for a place to settle and start a new life, and they chose the area around the Little River. The town was named after Benjamin Milam, a hero of the Texas Revolution. The town quickly grew and by the early 1900s, it had become a thriving community with a population of over 1,000 people.
The town of Milam was an important stop on the Texas and New Orleans Railroad, which ran through the town from 1873 to the early 1900s. The railroad brought new people and businesses to the area, and the town quickly grew. In the early 1900s, the town was home to several businesses, including a cotton gin, a blacksmith shop, and a general store.
Economy
The economy of Milam is largely based on agriculture. The town is located in a region of Texas known for its fertile soil, and it is home to a variety of crops, including cotton, corn, and wheat. The town is also home to several small businesses, including a grocery store, a hardware store, and a few restaurants.
The town of Milam is also home to a few small manufacturing companies, including a furniture factory and a metal fabrication shop. The town is also home to a few small oil and gas companies, which are involved in the exploration and production of oil and gas in the area.
Demographics
As of the 2010 census, the population of Milam was 1,072. The town is predominantly white, with a population that is 97.2% white and 2.8% Hispanic or Latino. The median household income in Milam is $37,500, and the median age is 39. The town is home to a variety of religious denominations, including Baptist, Methodist, and Catholic.
Conclusion
Milam, Texas is a small town located in the eastern part of the state, about an hour and a half east of Austin. It is part of the larger Milam County, which is located in the heart of Central Texas. The town of Milam was founded in 1873 and has a population of just over 1,000 people. The economy of Milam is largely based on agriculture, and the town is home to a variety of small businesses. The population of Milam is predominantly white, with a median household income of $37,500 and a median age of 39.
Common Questions
What is Per Capita Income in Milam?
Per Capita income in Milam is $36,062.
What is the Median Family Income in Milam?
Median Family Income in Milam is $46,477.
What is the Median Household income in Milam?
Median Household Income in Milam is $43,011.
What is Inequality or Gini Index in Milam?
Inequality or Gini Index in Milam is 0.60.
What is the Total Population of Milam?
Total Population of Milam is 1,536.
What is the Total Male Population of Milam?
Total Male Population of Milam is 846.
What is the Total Female Population of Milam?
Total Female Population of Milam is 690.
What is the Ratio of Males per 100 Females in Milam?
There are 122.61 Males per 100 Females in Milam.
What is the Ratio of Females per 100 Males in Milam?
There are 81.56 Females per 100 Males in Milam.
What is the Median Population Age in Milam?
Median Population Age in Milam is 46.4 Years.
What is the Average Family Size in Milam
Average Family Size in Milam is 2.9 People.
What is the Average Household Size in Milam
Average Household Size in Milam is 2.4 People.
How Large is the Labor Force in Milam?
There are 555 People in the Labor Forcein in Milam.
What is the Percentage of People in the Labor Force in Milam?
45.2% of People are in the Labor Force in Milam.
What is the Unemployment Rate in Milam?
Unemployment Rate in Milam is 6.1%.