Miami, TX Map & Demographics
Miami Map
Miami Overview
$31,040
PER CAPITA INCOME
$80,417
AVG FAMILY INCOME
$62,500
AVG HOUSEHOLD INCOME
67.5%
WAGE / INCOME GAP [ % ]
32.5¢/ $1
WAGE / INCOME GAP [ $ ]
$4,000
FAMILY INCOME DEFICIT
0.37
INEQUALITY / GINI INDEX
496
TOTAL POPULATION
264
MALE POPULATION
232
FEMALE POPULATION
113.79
MALES / 100 FEMALES
87.88
FEMALES / 100 MALES
40.8
MEDIAN AGE
3.3
AVG FAMILY SIZE
2.5
AVG HOUSEHOLD SIZE
249
LABOR FORCE [ PEOPLE ]
66.9%
PERCENT IN LABOR FORCE
Miami Zip Codes
Miami Area Codes
Income in Miami
Income Overview in Miami
Per Capita Income in Miami is $31,040, while median incomes of families and households are $80,417 and $62,500 respectively.
| Characteristic | Number | Measure |
| Per Capita Income | 496 | $31,040 |
| Median Family Income | 121 | $80,417 |
| Mean Family Income | 121 | $83,621 |
| Median Household Income | 202 | $62,500 |
| Mean Household Income | 202 | $75,291 |
| Income Deficit | 121 | $4,000 |
| Wage / Income Gap (%) | 496 | 67.53% |
| Wage / Income Gap ($) | 496 | 32.47¢ per $1 |
| Gini / Inequality Index | 496 | 0.37 |
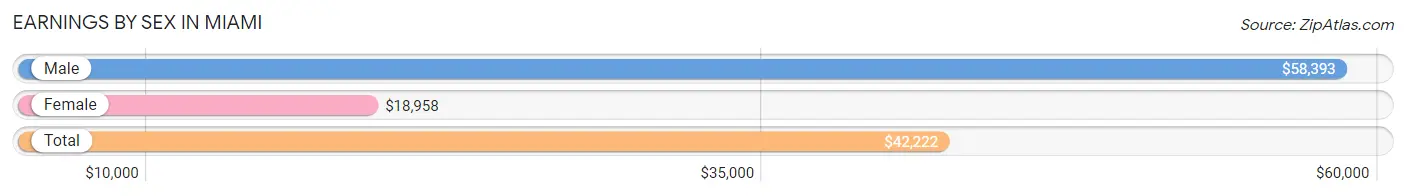
Earnings by Sex in Miami
Average Earnings in Miami are $42,222, $58,393 for men and $18,958 for women, a difference of 67.5%.
| Sex | Number | Average Earnings |
| Male | 139 (55.2%) | $58,393 |
| Female | 113 (44.8%) | $18,958 |
| Total | 252 (100.0%) | $42,222 |
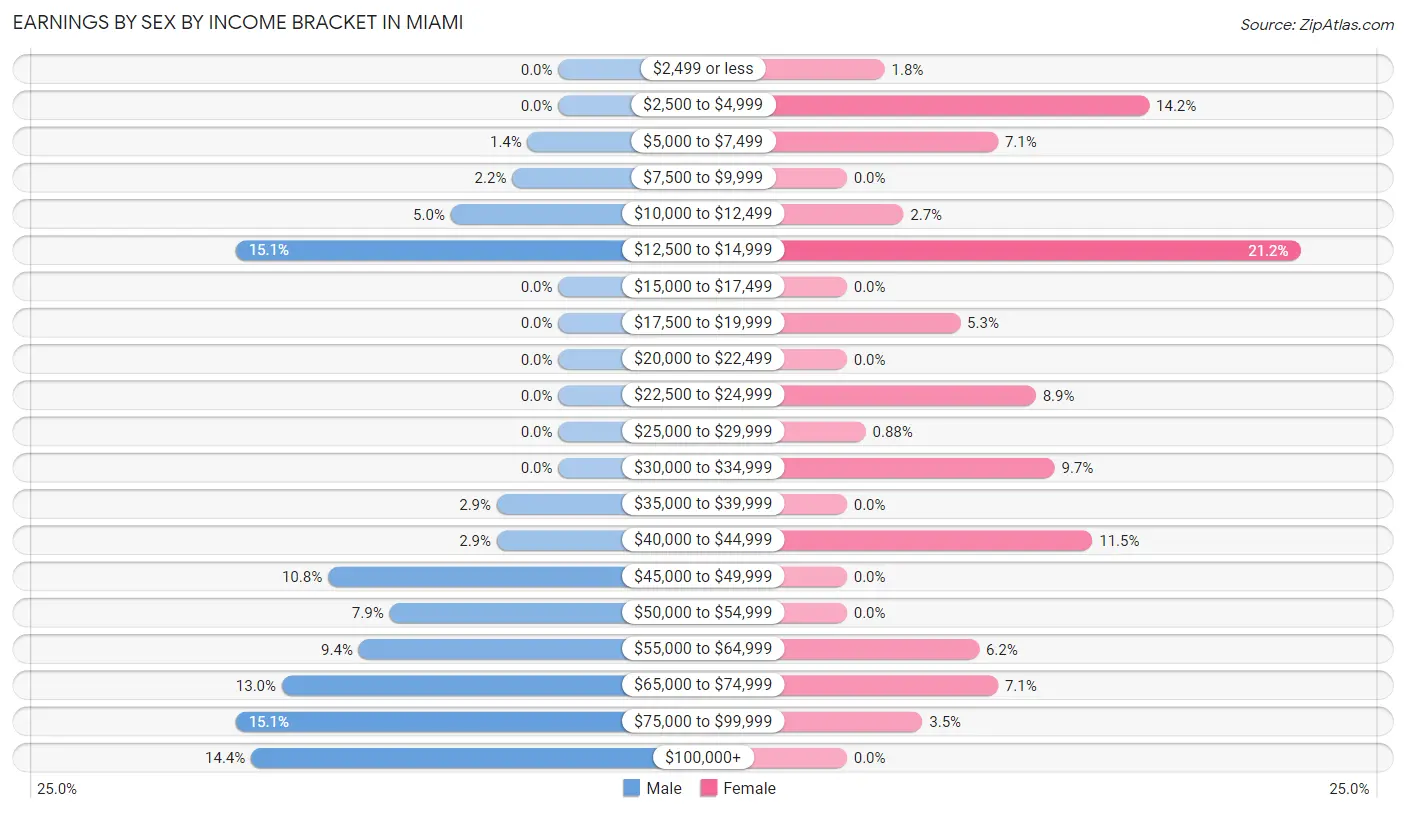
Earnings by Sex by Income Bracket in Miami
The most common earnings brackets in Miami are $12,500 to $14,999 for men (21 | 15.1%) and $12,500 to $14,999 for women (24 | 21.2%).
| Income | Male | Female |
| $2,499 or less | 0 (0.0%) | 2 (1.8%) |
| $2,500 to $4,999 | 0 (0.0%) | 16 (14.2%) |
| $5,000 to $7,499 | 2 (1.4%) | 8 (7.1%) |
| $7,500 to $9,999 | 3 (2.2%) | 0 (0.0%) |
| $10,000 to $12,499 | 7 (5.0%) | 3 (2.6%) |
| $12,500 to $14,999 | 21 (15.1%) | 24 (21.2%) |
| $15,000 to $17,499 | 0 (0.0%) | 0 (0.0%) |
| $17,500 to $19,999 | 0 (0.0%) | 6 (5.3%) |
| $20,000 to $22,499 | 0 (0.0%) | 0 (0.0%) |
| $22,500 to $24,999 | 0 (0.0%) | 10 (8.8%) |
| $25,000 to $29,999 | 0 (0.0%) | 1 (0.9%) |
| $30,000 to $34,999 | 0 (0.0%) | 11 (9.7%) |
| $35,000 to $39,999 | 4 (2.9%) | 0 (0.0%) |
| $40,000 to $44,999 | 4 (2.9%) | 13 (11.5%) |
| $45,000 to $49,999 | 15 (10.8%) | 0 (0.0%) |
| $50,000 to $54,999 | 11 (7.9%) | 0 (0.0%) |
| $55,000 to $64,999 | 13 (9.3%) | 7 (6.2%) |
| $65,000 to $74,999 | 18 (13.0%) | 8 (7.1%) |
| $75,000 to $99,999 | 21 (15.1%) | 4 (3.5%) |
| $100,000+ | 20 (14.4%) | 0 (0.0%) |
| Total | 139 (100.0%) | 113 (100.0%) |
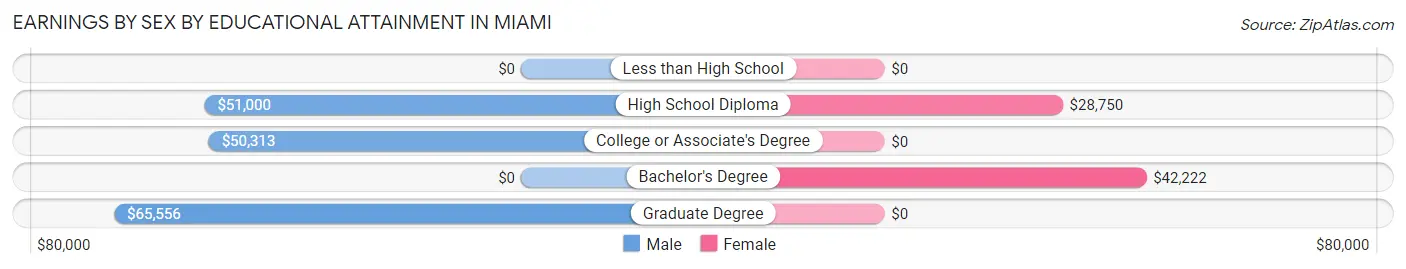
Earnings by Sex by Educational Attainment in Miami
Average earnings in Miami are $58,393 for men and $23,875 for women, a difference of 59.1%. Men with an educational attainment of graduate degree enjoy the highest average annual earnings of $65,556, while those with college or associate's degree education earn the least with $50,313. Women with an educational attainment of bachelor's degree earn the most with the average annual earnings of $42,222, while those with high school diploma education have the smallest earnings of $28,750.
| Educational Attainment | Male Income | Female Income |
| Less than High School | - | - |
| High School Diploma | $51,000 | $28,750 |
| College or Associate's Degree | $50,313 | $0 |
| Bachelor's Degree | - | - |
| Graduate Degree | $65,556 | $0 |
| Total | $58,393 | $23,875 |
Family Income in Miami
Family Income Brackets in Miami
According to the Miami family income data, there are 39 families falling into the $100,000 to $149,999 income range, which is the most common income bracket and makes up 32.2% of all families.
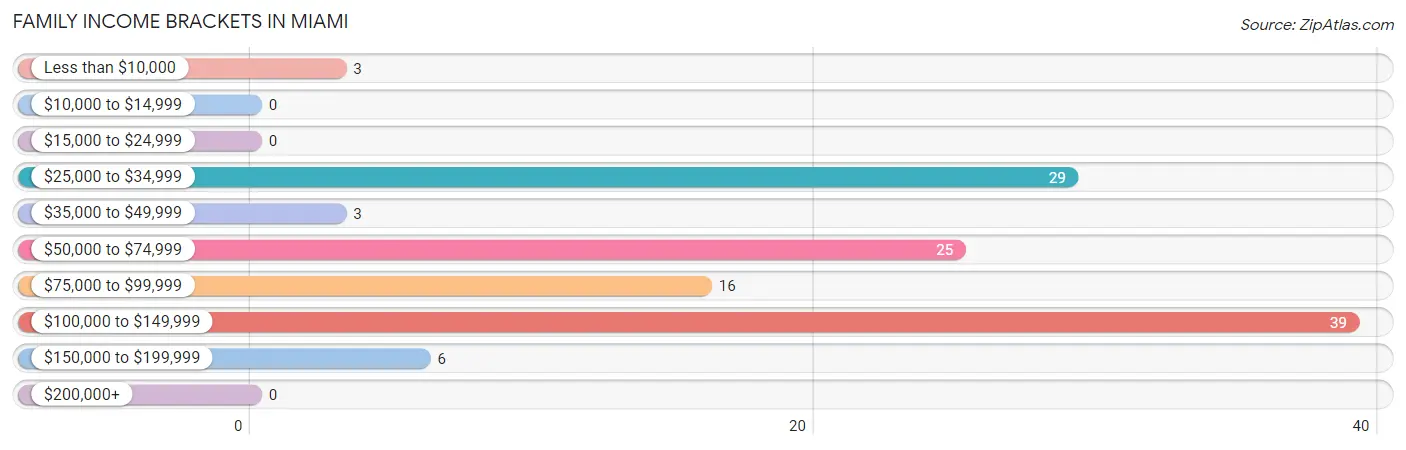
| Income Bracket | # Families | % Families |
| Less than $10,000 | 3 | 2.5% |
| $10,000 to $14,999 | 0 | 0.0% |
| $15,000 to $24,999 | 0 | 0.0% |
| $25,000 to $34,999 | 29 | 24.0% |
| $35,000 to $49,999 | 3 | 2.5% |
| $50,000 to $74,999 | 25 | 20.7% |
| $75,000 to $99,999 | 16 | 13.2% |
| $100,000 to $149,999 | 39 | 32.2% |
| $150,000 to $199,999 | 6 | 5.0% |
| $200,000+ | 0 | 0.0% |
Family Income by Famaliy Size in Miami
3-person families (8 | 6.6%) account for the highest median family income in Miami with $118,000 per family, while 3-person families (8 | 6.6%) have the highest median income of $39,333 per family member.
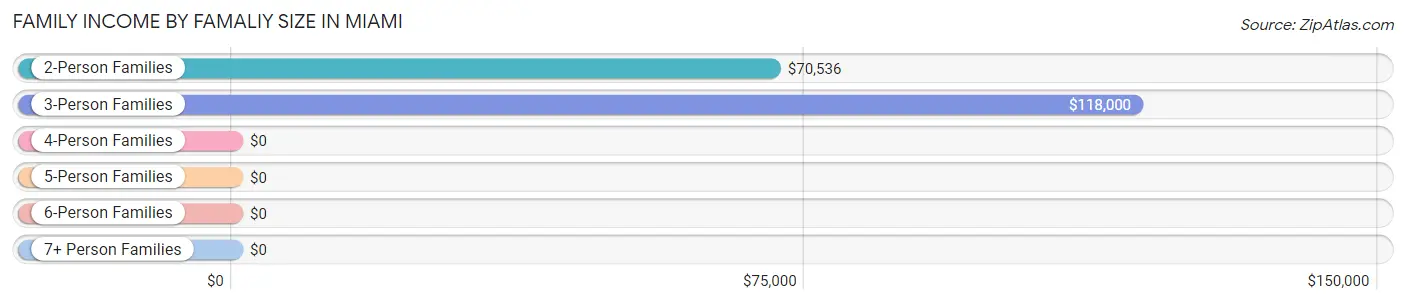
| Income Bracket | # Families | Median Income |
| 2-Person Families | 65 (53.7%) | $70,536 |
| 3-Person Families | 8 (6.6%) | $118,000 |
| 4-Person Families | 25 (20.7%) | $0 |
| 5-Person Families | 11 (9.1%) | $0 |
| 6-Person Families | 12 (9.9%) | $0 |
| 7+ Person Families | 0 (0.0%) | $0 |
| Total | 121 (100.0%) | $80,417 |
Family Income by Number of Earners in Miami
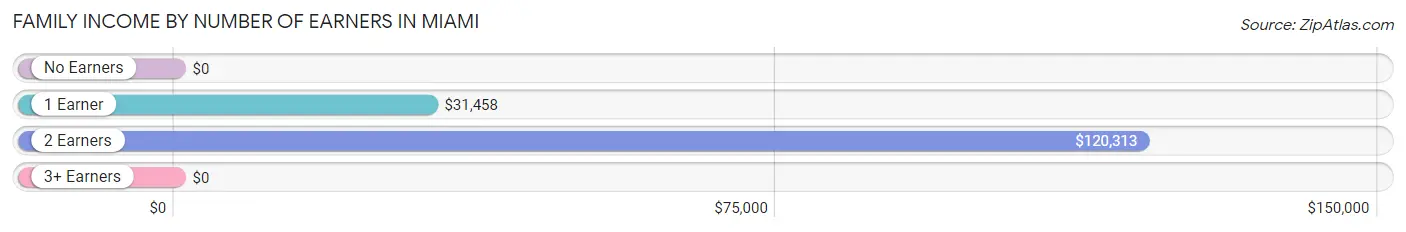
| Number of Earners | # Families | Median Income |
| No Earners | 6 (5.0%) | $0 |
| 1 Earner | 43 (35.5%) | $31,458 |
| 2 Earners | 65 (53.7%) | $120,313 |
| 3+ Earners | 7 (5.8%) | $0 |
| Total | 121 (100.0%) | $80,417 |
Household Income in Miami
Household Income Brackets in Miami
With 50 households falling in the category, the $25,000 to $34,999 income range is the most frequent in Miami, accounting for 24.7% of all households.
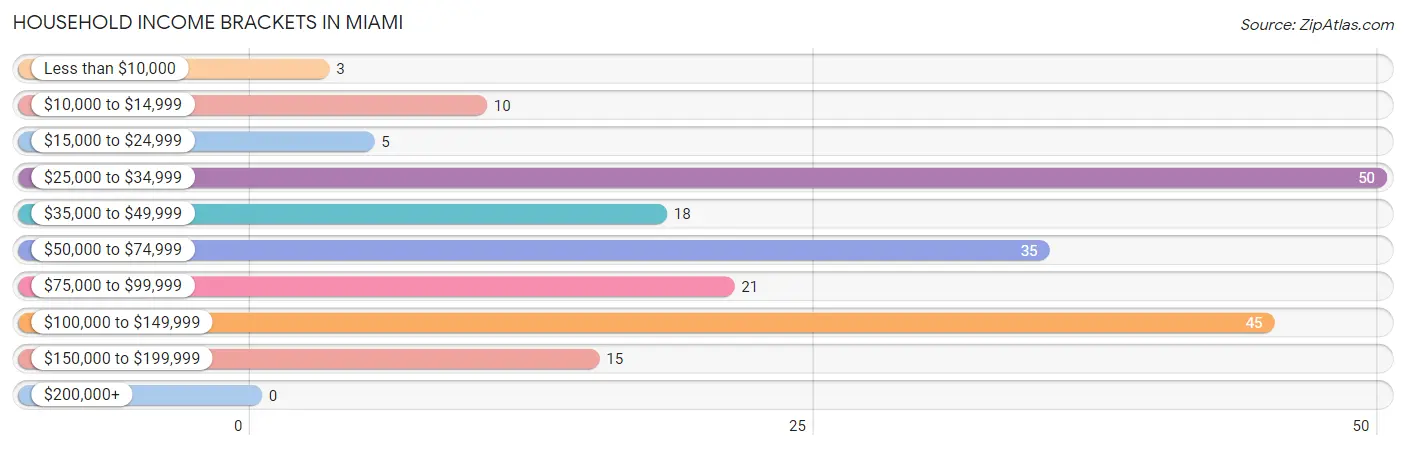
| Income Bracket | # Households | % Households |
| Less than $10,000 | 3 | 1.5% |
| $10,000 to $14,999 | 10 | 5.0% |
| $15,000 to $24,999 | 5 | 2.5% |
| $25,000 to $34,999 | 50 | 24.8% |
| $35,000 to $49,999 | 18 | 8.9% |
| $50,000 to $74,999 | 35 | 17.3% |
| $75,000 to $99,999 | 21 | 10.4% |
| $100,000 to $149,999 | 45 | 22.3% |
| $150,000 to $199,999 | 15 | 7.4% |
| $200,000+ | 0 | 0.0% |
Household Income by Householder Age in Miami
The median household income in Miami is $62,500, with the highest median household income of $99,464 found in the 25 to 44 years age bracket for the primary householder. A total of 69 households (34.2%) fall into this category. Meanwhile, the 15 to 24 years age bracket for the primary householder has the lowest median household income of $0, with 7 households (3.5%) in this group.
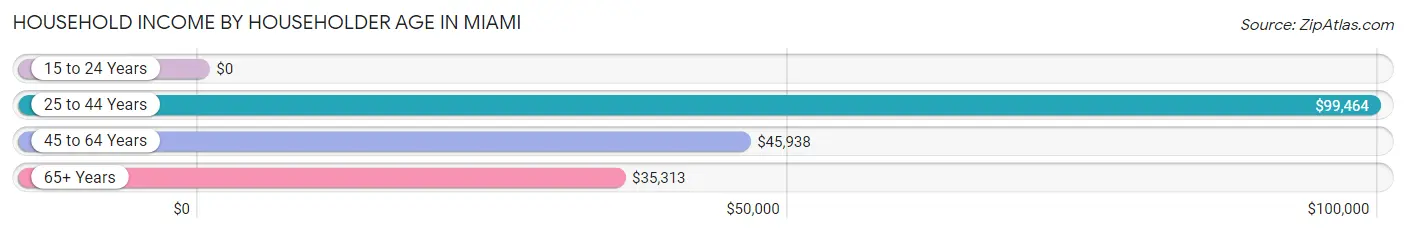
| Income Bracket | # Households | Median Income |
| 15 to 24 Years | 7 (3.5%) | $0 |
| 25 to 44 Years | 69 (34.2%) | $99,464 |
| 45 to 64 Years | 85 (42.1%) | $45,938 |
| 65+ Years | 41 (20.3%) | $35,313 |
| Total | 202 (100.0%) | $62,500 |
Poverty in Miami
Income Below Poverty by Sex and Age in Miami
With 21.9% poverty level for males and 21.1% for females among the residents of Miami, 12 to 14 year old males and 16 and 17 year old females are the most vulnerable to poverty, with 16 males (64.0%) and 16 females (100.0%) in their respective age groups living below the poverty level.
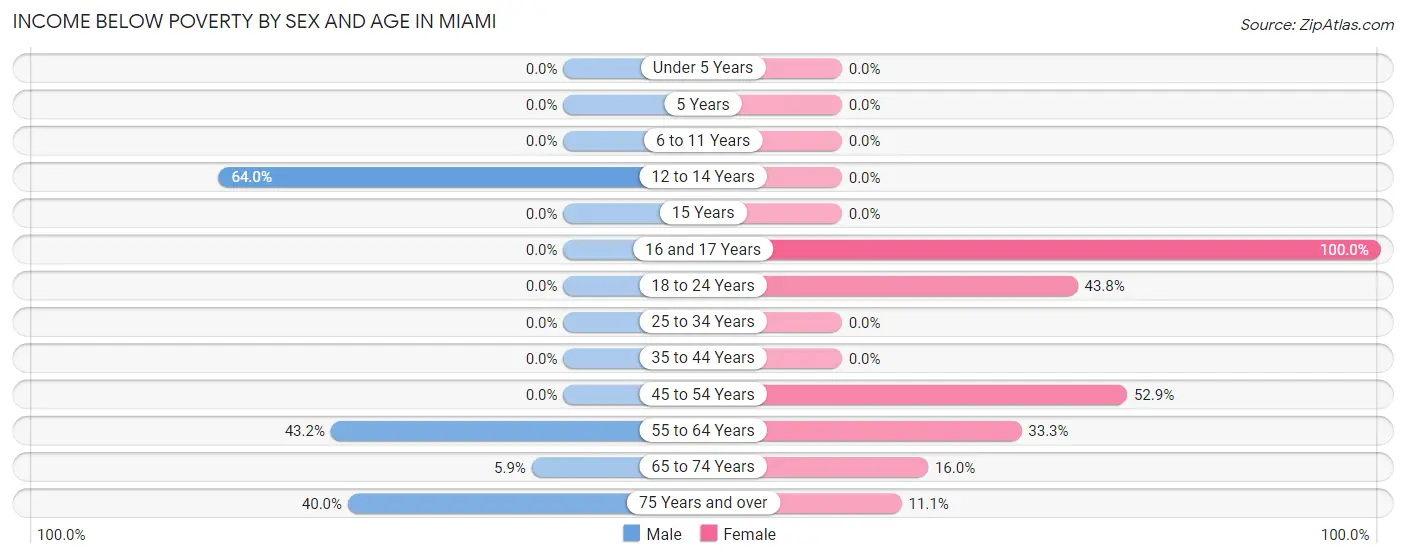
| Age Bracket | Male | Female |
| Under 5 Years | 0 (0.0%) | 0 (0.0%) |
| 5 Years | 0 (0.0%) | 0 (0.0%) |
| 6 to 11 Years | 0 (0.0%) | 0 (0.0%) |
| 12 to 14 Years | 16 (64.0%) | 0 (0.0%) |
| 15 Years | 0 (0.0%) | 0 (0.0%) |
| 16 and 17 Years | 0 (0.0%) | 16 (100.0%) |
| 18 to 24 Years | 0 (0.0%) | 7 (43.8%) |
| 25 to 34 Years | 0 (0.0%) | 0 (0.0%) |
| 35 to 44 Years | 0 (0.0%) | 0 (0.0%) |
| 45 to 54 Years | 0 (0.0%) | 9 (52.9%) |
| 55 to 64 Years | 38 (43.2%) | 11 (33.3%) |
| 65 to 74 Years | 1 (5.9%) | 4 (16.0%) |
| 75 Years and over | 2 (40.0%) | 2 (11.1%) |
| Total | 57 (21.9%) | 49 (21.1%) |
Income Above Poverty by Sex and Age in Miami
According to the poverty statistics in Miami, males aged 6 to 11 years and females aged under 5 years are the age groups that are most secure financially, with 100.0% of males and 100.0% of females in these age groups living above the poverty line.
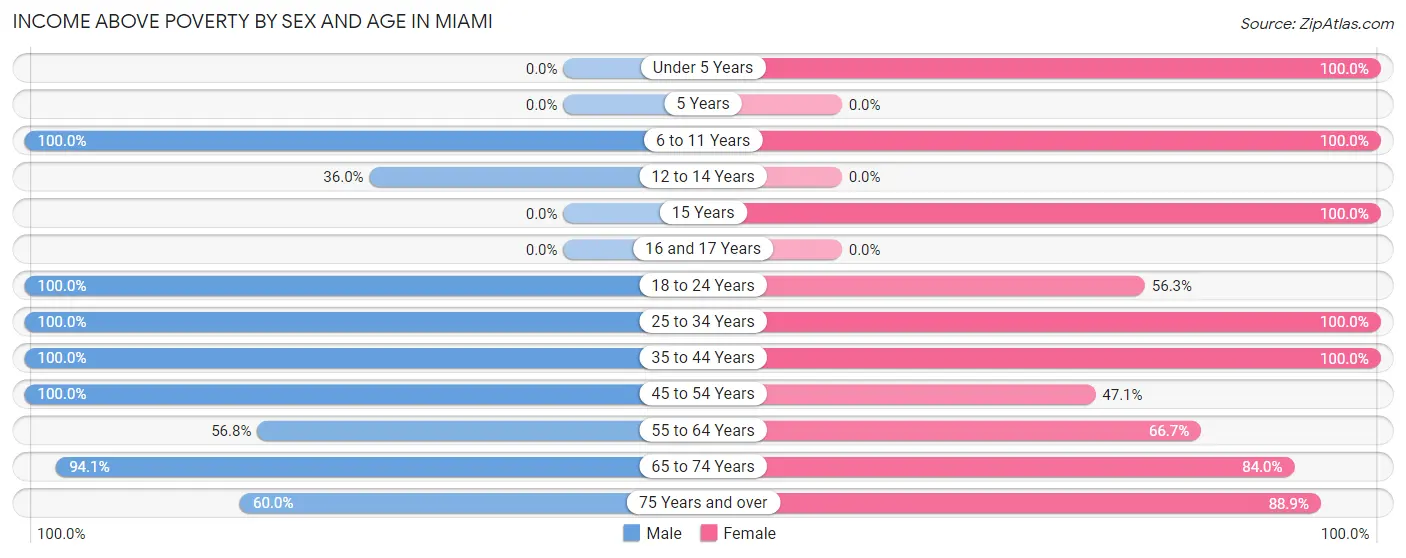
| Age Bracket | Male | Female |
| Under 5 Years | 0 (0.0%) | 19 (100.0%) |
| 5 Years | 0 (0.0%) | 0 (0.0%) |
| 6 to 11 Years | 41 (100.0%) | 34 (100.0%) |
| 12 to 14 Years | 9 (36.0%) | 0 (0.0%) |
| 15 Years | 0 (0.0%) | 1 (100.0%) |
| 16 and 17 Years | 0 (0.0%) | 0 (0.0%) |
| 18 to 24 Years | 4 (100.0%) | 9 (56.2%) |
| 25 to 34 Years | 8 (100.0%) | 15 (100.0%) |
| 35 to 44 Years | 60 (100.0%) | 38 (100.0%) |
| 45 to 54 Years | 12 (100.0%) | 8 (47.1%) |
| 55 to 64 Years | 50 (56.8%) | 22 (66.7%) |
| 65 to 74 Years | 16 (94.1%) | 21 (84.0%) |
| 75 Years and over | 3 (60.0%) | 16 (88.9%) |
| Total | 203 (78.1%) | 183 (78.9%) |
Income Below Poverty Among Married-Couple Families in Miami
The poverty statistics for married-couple families in Miami show that 13.1% or 14 of the total 107 families live below the poverty line. Families with 1 or 2 children have the highest poverty rate of 45.8%, comprising of 11 families. On the other hand, families with 3 or 4 children have the lowest poverty rate of 0.0%, which includes 0 families.
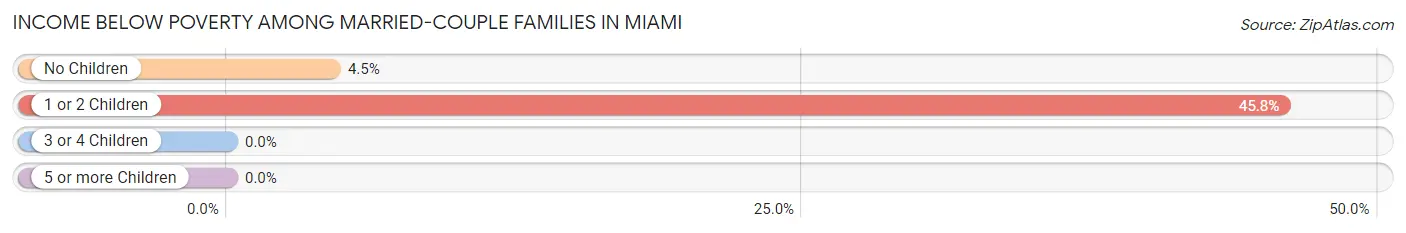
| Children | Above Poverty | Below Poverty |
| No Children | 64 (95.5%) | 3 (4.5%) |
| 1 or 2 Children | 13 (54.2%) | 11 (45.8%) |
| 3 or 4 Children | 16 (100.0%) | 0 (0.0%) |
| 5 or more Children | 0 (0.0%) | 0 (0.0%) |
| Total | 93 (86.9%) | 14 (13.1%) |
Income Below Poverty Among Single-Parent Households in Miami
| Children | Single Father | Single Mother |
| No Children | 0 (0.0%) | 0 (0.0%) |
| 1 or 2 Children | 0 (0.0%) | 0 (0.0%) |
| 3 or 4 Children | 0 (0.0%) | 0 (0.0%) |
| 5 or more Children | 0 (0.0%) | 0 (0.0%) |
| Total | 0 (0.0%) | 0 (0.0%) |
Income Below Poverty Among Married-Couple vs Single-Parent Households in Miami
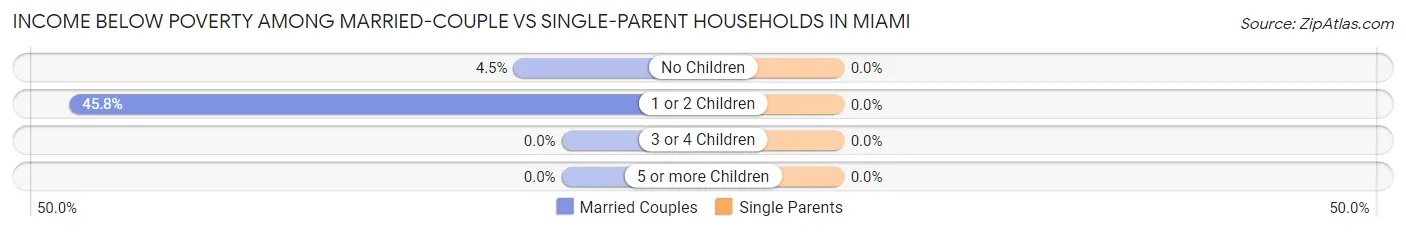
| Children | Married-Couple Families | Single-Parent Households |
| No Children | 3 (4.5%) | 0 (0.0%) |
| 1 or 2 Children | 11 (45.8%) | 0 (0.0%) |
| 3 or 4 Children | 0 (0.0%) | 0 (0.0%) |
| 5 or more Children | 0 (0.0%) | 0 (0.0%) |
| Total | 14 (13.1%) | 0 (0.0%) |
Race in Miami
The most populous races in Miami are White / Caucasian (488 | 98.4%), Hispanic or Latino (103 | 20.8%), and Two or more Races (8 | 1.6%).
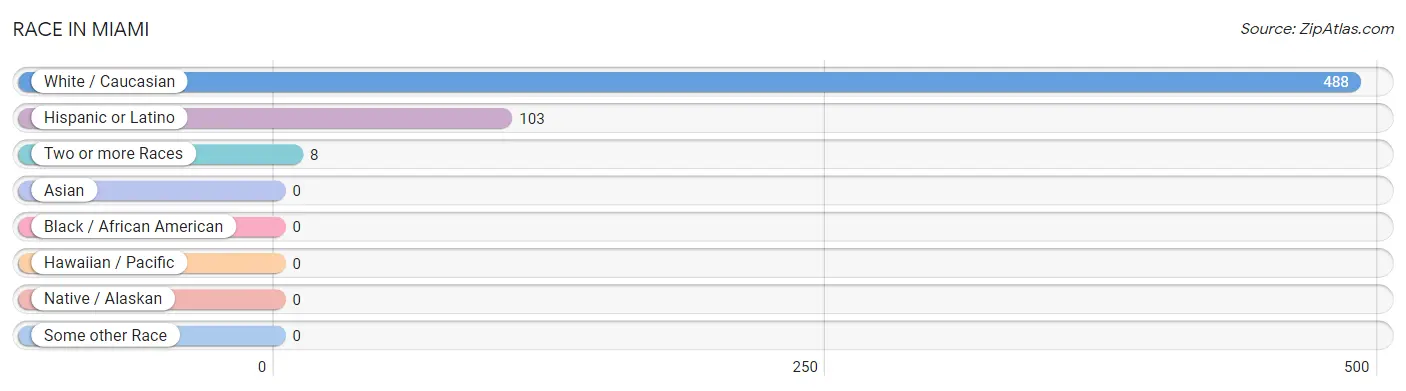
| Race | # Population | % Population |
| Asian | 0 | 0.0% |
| Black / African American | 0 | 0.0% |
| Hawaiian / Pacific | 0 | 0.0% |
| Hispanic or Latino | 103 | 20.8% |
| Native / Alaskan | 0 | 0.0% |
| White / Caucasian | 488 | 98.4% |
| Two or more Races | 8 | 1.6% |
| Some other Race | 0 | 0.0% |
| Total | 496 | 100.0% |
Ancestry in Miami
The most populous ancestries reported in Miami are Irish (112 | 22.6%), Spaniard (70 | 14.1%), German (40 | 8.1%), French (32 | 6.5%), and American (26 | 5.2%), together accounting for 56.4% of all Miami residents.
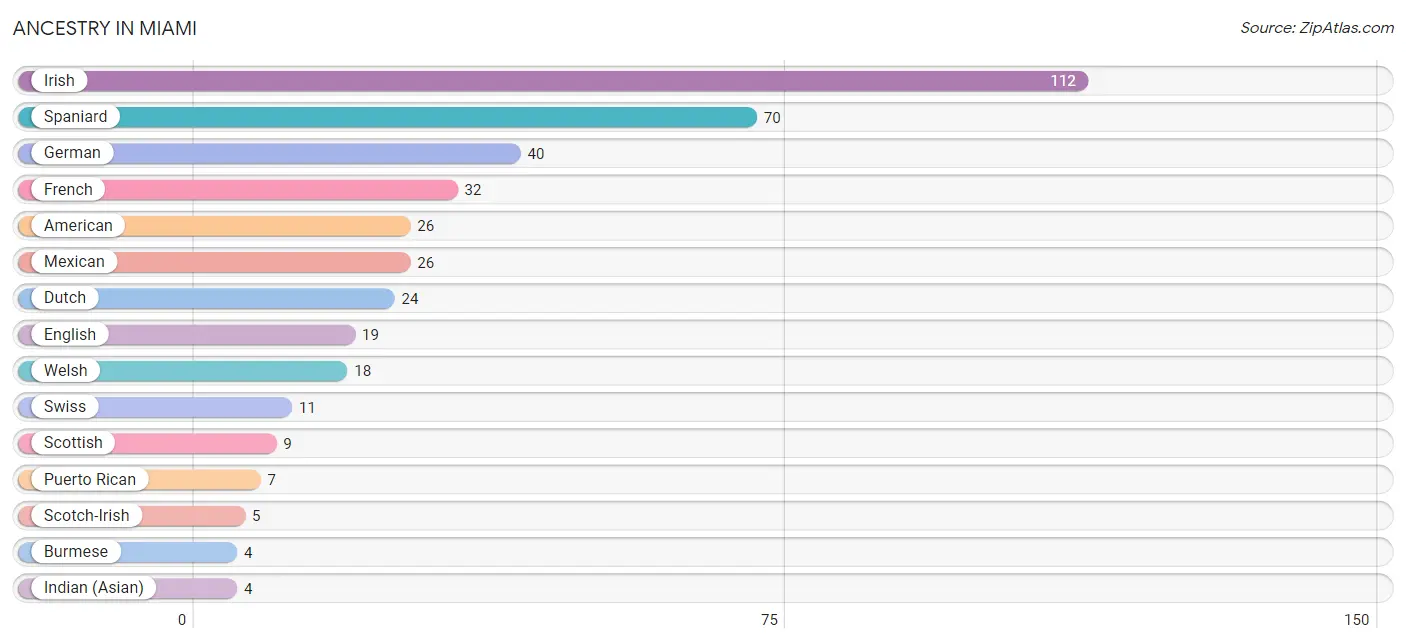
| Ancestry | # Population | % Population |
| American | 26 | 5.2% |
| Burmese | 4 | 0.8% |
| Dutch | 24 | 4.8% |
| English | 19 | 3.8% |
| French | 32 | 6.5% |
| German | 40 | 8.1% |
| Indian (Asian) | 4 | 0.8% |
| Irish | 112 | 22.6% |
| Korean | 4 | 0.8% |
| Mexican | 26 | 5.2% |
| Norwegian | 1 | 0.2% |
| Puerto Rican | 7 | 1.4% |
| Scandinavian | 1 | 0.2% |
| Scotch-Irish | 5 | 1.0% |
| Scottish | 9 | 1.8% |
| Spaniard | 70 | 14.1% |
| Swiss | 11 | 2.2% |
| Welsh | 18 | 3.6% | View All 18 Rows |
Immigrants in Miami

| Immigration Origin | # Population | % Population | View All 0 Rows |
Sex and Age in Miami
Sex and Age in Miami
The most populous age groups in Miami are 55 to 59 Years (63 | 23.9%) for men and 40 to 44 Years (29 | 12.5%) for women.
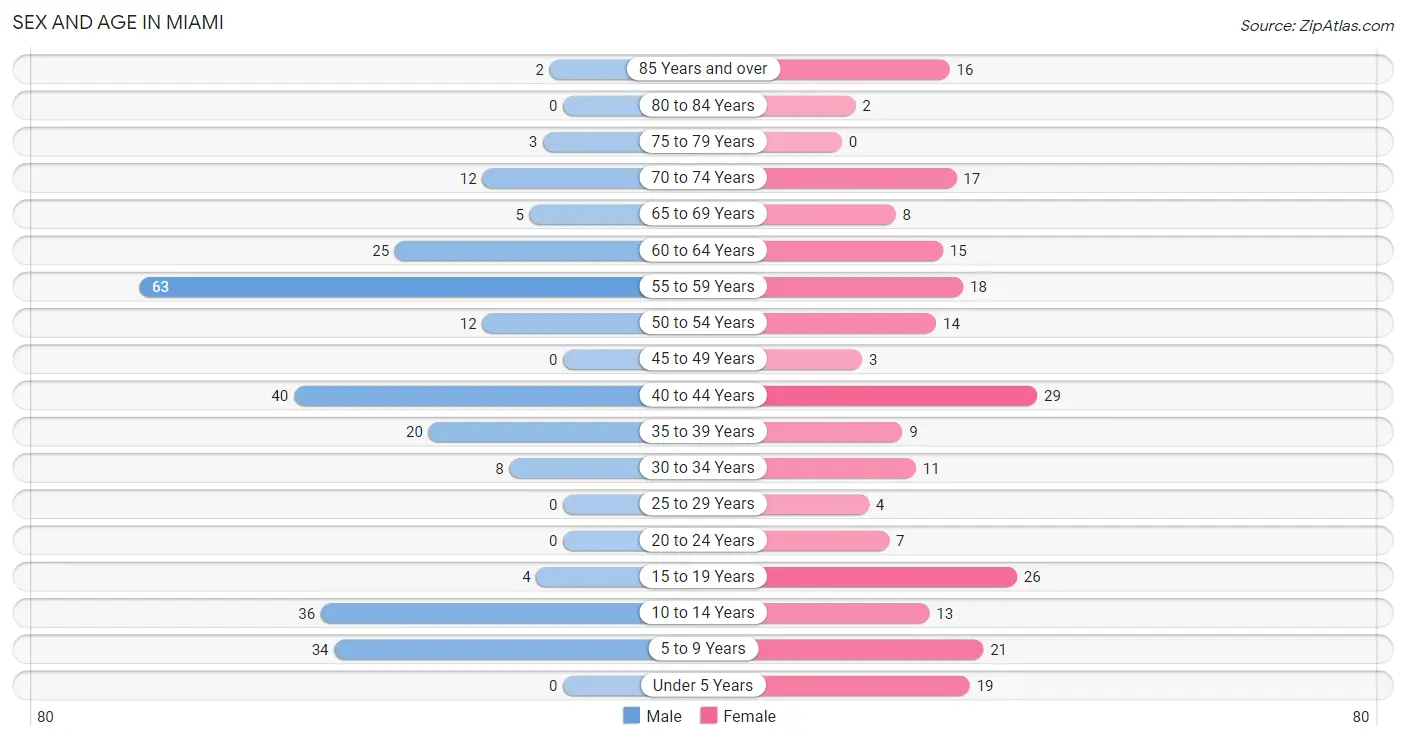
| Age Bracket | Male | Female |
| Under 5 Years | 0 (0.0%) | 19 (8.2%) |
| 5 to 9 Years | 34 (12.9%) | 21 (9.0%) |
| 10 to 14 Years | 36 (13.6%) | 13 (5.6%) |
| 15 to 19 Years | 4 (1.5%) | 26 (11.2%) |
| 20 to 24 Years | 0 (0.0%) | 7 (3.0%) |
| 25 to 29 Years | 0 (0.0%) | 4 (1.7%) |
| 30 to 34 Years | 8 (3.0%) | 11 (4.7%) |
| 35 to 39 Years | 20 (7.6%) | 9 (3.9%) |
| 40 to 44 Years | 40 (15.1%) | 29 (12.5%) |
| 45 to 49 Years | 0 (0.0%) | 3 (1.3%) |
| 50 to 54 Years | 12 (4.5%) | 14 (6.0%) |
| 55 to 59 Years | 63 (23.9%) | 18 (7.8%) |
| 60 to 64 Years | 25 (9.5%) | 15 (6.5%) |
| 65 to 69 Years | 5 (1.9%) | 8 (3.5%) |
| 70 to 74 Years | 12 (4.5%) | 17 (7.3%) |
| 75 to 79 Years | 3 (1.1%) | 0 (0.0%) |
| 80 to 84 Years | 0 (0.0%) | 2 (0.9%) |
| 85 Years and over | 2 (0.8%) | 16 (6.9%) |
| Total | 264 (100.0%) | 232 (100.0%) |
Families and Households in Miami
Median Family Size in Miami
The median family size in Miami is 3.30 persons per family, with married-couple families (107 | 88.4%) accounting for the largest median family size of 3.42 persons per family. On the other hand, single female/mother families (3 | 2.5%) represent the smallest median family size with 1.67 persons per family.
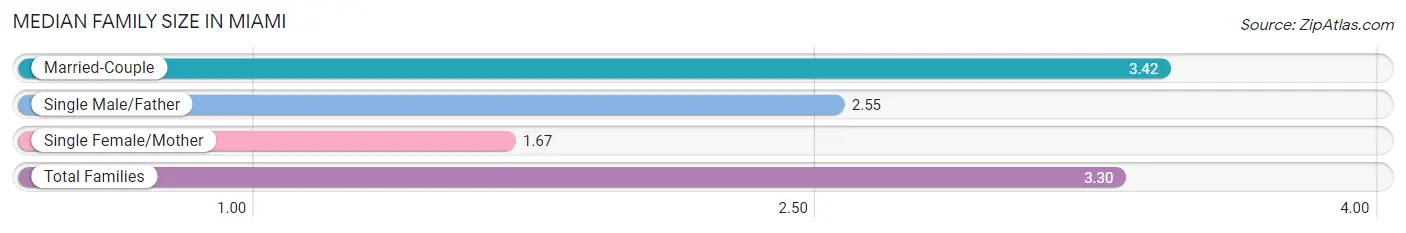
| Family Type | # Families | Family Size |
| Married-Couple | 107 (88.4%) | 3.42 |
| Single Male/Father | 11 (9.1%) | 2.55 |
| Single Female/Mother | 3 (2.5%) | 1.67 |
| Total Families | 121 (100.0%) | 3.30 |
Median Household Size in Miami
The median household size in Miami is 2.46 persons per household, with single male/father households (11 | 5.4%) accounting for the largest median household size of 3.55 persons per household. non-family households (81 | 40.1%) represent the smallest median household size with 1.06 persons per household.
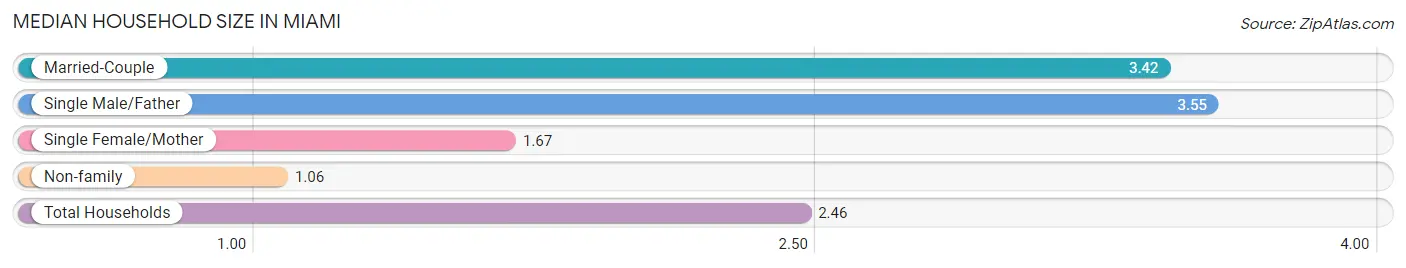
| Household Type | # Households | Household Size |
| Married-Couple | 107 (53.0%) | 3.42 |
| Single Male/Father | 11 (5.4%) | 3.55 |
| Single Female/Mother | 3 (1.5%) | 1.67 |
| Non-family | 81 (40.1%) | 1.06 |
| Total Households | 202 (100.0%) | 2.46 |
Household Size by Marriage Status in Miami
Out of a total of 202 households in Miami, 121 (59.9%) are family households, while 81 (40.1%) are nonfamily households. The most numerous type of family households are 2-person households, comprising 65, and the most common type of nonfamily households are 1-person households, comprising 76.
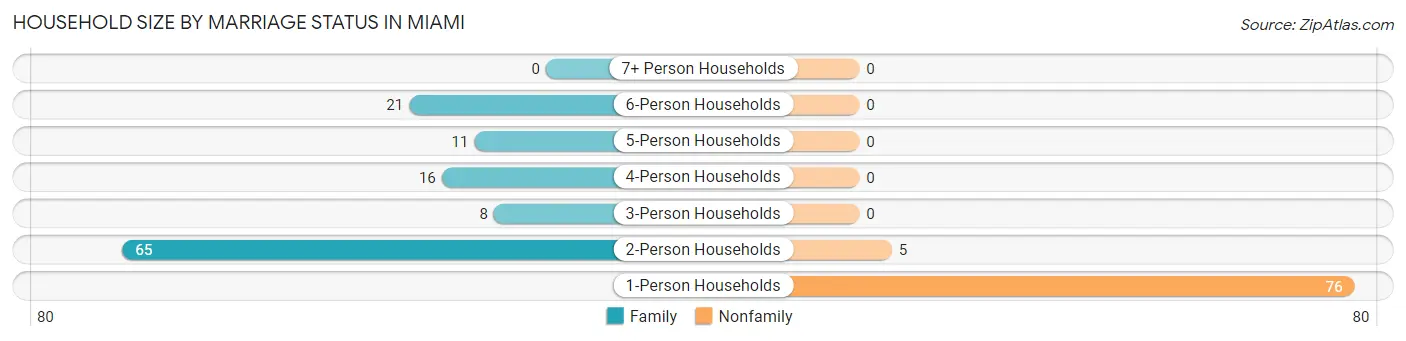
| Household Size | Family Households | Nonfamily Households |
| 1-Person Households | - | 76 (37.6%) |
| 2-Person Households | 65 (32.2%) | 5 (2.5%) |
| 3-Person Households | 8 (4.0%) | 0 (0.0%) |
| 4-Person Households | 16 (7.9%) | 0 (0.0%) |
| 5-Person Households | 11 (5.4%) | 0 (0.0%) |
| 6-Person Households | 21 (10.4%) | 0 (0.0%) |
| 7+ Person Households | 0 (0.0%) | 0 (0.0%) |
| Total | 121 (59.9%) | 81 (40.1%) |
Female Fertility in Miami
Fertility by Age in Miami
| Age Bracket | Women with Births | Births / 1,000 Women |
| 15 to 19 years | 0 (0.0%) | 0.0 |
| 20 to 34 years | 0 (0.0%) | 0.0 |
| 35 to 50 years | 0 (0.0%) | 0.0 |
| Total | 0 (0.0%) | 0.0 |
Fertility by Age by Marriage Status in Miami
| Age Bracket | Married | Unmarried |
| 15 to 19 years | 0 (0.0%) | 0 (0.0%) |
| 20 to 34 years | 0 (0.0%) | 0 (0.0%) |
| 35 to 50 years | 0 (0.0%) | 0 (0.0%) |
| Total | 0 (0.0%) | 0 (0.0%) |
Fertility by Education in Miami
| Educational Attainment | Women with Births | Births / 1,000 Women |
| Less than High School | 0 (0.0%) | 0.0 |
| High School Diploma | 0 (0.0%) | 0.0 |
| College or Associate's Degree | 0 (0.0%) | 0.0 |
| Bachelor's Degree | 0 (0.0%) | 0.0 |
| Graduate Degree | 0 (0.0%) | 0.0 |
| Total | 0 (0.0%) | 0.0 |
Fertility by Education by Marriage Status in Miami
| Educational Attainment | Married | Unmarried |
| Less than High School | 0 (0.0%) | 0 (0.0%) |
| High School Diploma | 0 (0.0%) | 0 (0.0%) |
| College or Associate's Degree | 0 (0.0%) | 0 (0.0%) |
| Bachelor's Degree | 0 (0.0%) | 0 (0.0%) |
| Graduate Degree | 0 (0.0%) | 0 (0.0%) |
| Total | 0 (0.0%) | 0 (0.0%) |
Employment Characteristics in Miami
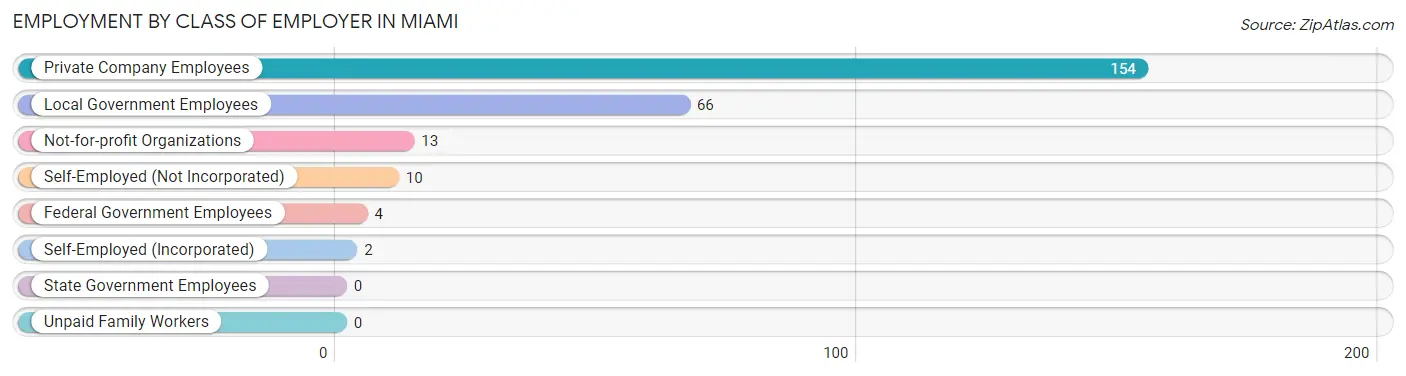
Employment by Class of Employer in Miami
Among the 249 employed individuals in Miami, private company employees (154 | 61.9%), local government employees (66 | 26.5%), and not-for-profit organizations (13 | 5.2%) make up the most common classes of employment.
| Employer Class | # Employees | % Employees |
| Private Company Employees | 154 | 61.9% |
| Self-Employed (Incorporated) | 2 | 0.8% |
| Self-Employed (Not Incorporated) | 10 | 4.0% |
| Not-for-profit Organizations | 13 | 5.2% |
| Local Government Employees | 66 | 26.5% |
| State Government Employees | 0 | 0.0% |
| Federal Government Employees | 4 | 1.6% |
| Unpaid Family Workers | 0 | 0.0% |
| Total | 249 | 100.0% |
Employment Status by Age in Miami
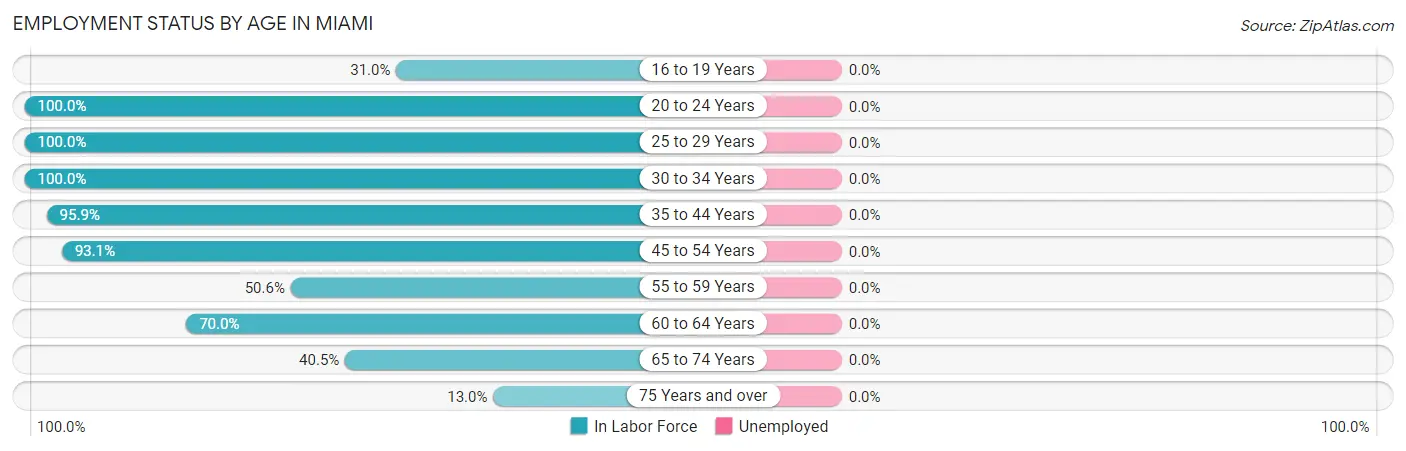
| Age Bracket | In Labor Force | Unemployed |
| 16 to 19 Years | 9 (31.0%) | 0 (0.0%) |
| 20 to 24 Years | 7 (100.0%) | 0 (0.0%) |
| 25 to 29 Years | 4 (100.0%) | 0 (0.0%) |
| 30 to 34 Years | 19 (100.0%) | 0 (0.0%) |
| 35 to 44 Years | 94 (95.9%) | 0 (0.0%) |
| 45 to 54 Years | 27 (93.1%) | 0 (0.0%) |
| 55 to 59 Years | 41 (50.6%) | 0 (0.0%) |
| 60 to 64 Years | 28 (70.0%) | 0 (0.0%) |
| 65 to 74 Years | 17 (40.5%) | 0 (0.0%) |
| 75 Years and over | 3 (13.0%) | 0 (0.0%) |
| Total | 249 (66.9%) | 0 (0.0%) |
Employment Status by Educational Attainment in Miami
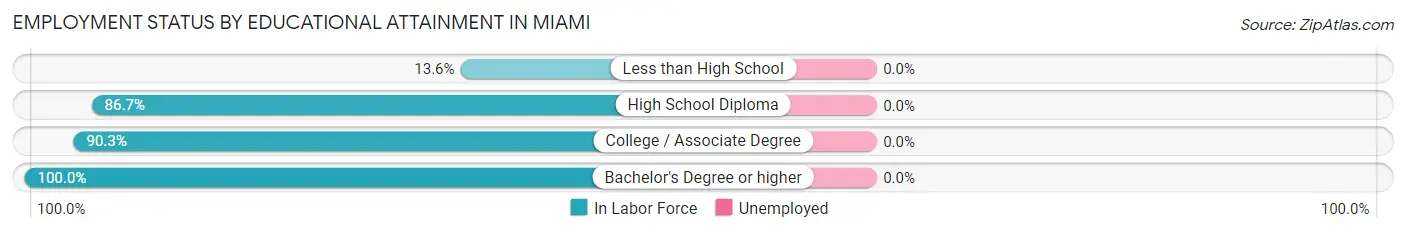
| Educational Attainment | In Labor Force | Unemployed |
| Less than High School | 6 (13.6%) | 0 (0.0%) |
| High School Diploma | 72 (86.7%) | 0 (0.0%) |
| College / Associate Degree | 84 (90.3%) | 0 (0.0%) |
| Bachelor's Degree or higher | 51 (100.0%) | 0 (0.0%) |
| Total | 213 (78.6%) | 0 (0.0%) |
Employment Occupations by Sex in Miami
Management, Business, Science and Arts Occupations
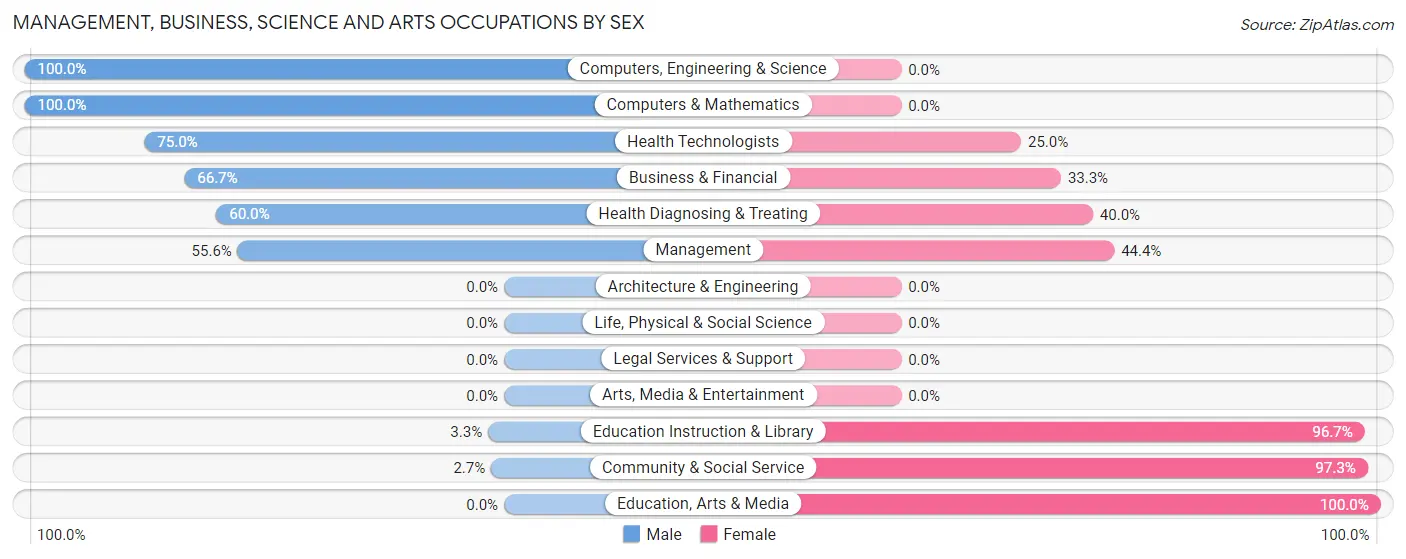
The most common Management, Business, Science and Arts occupations in Miami are Community & Social Service (37 | 14.9%), Education Instruction & Library (30 | 12.0%), Health Diagnosing & Treating (15 | 6.0%), Business & Financial (12 | 4.8%), and Health Technologists (12 | 4.8%).
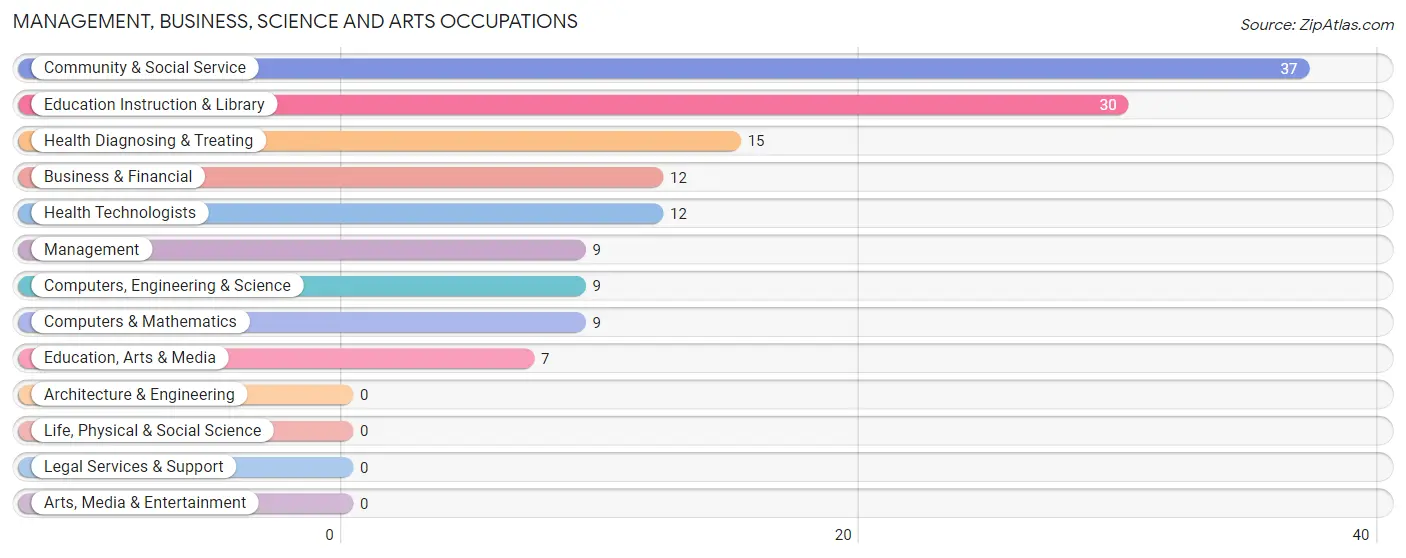
Management, Business, Science and Arts Occupations by Sex
Within the Management, Business, Science and Arts occupations in Miami, the most male-oriented occupations are Computers, Engineering & Science (100.0%), Computers & Mathematics (100.0%), and Health Technologists (75.0%), while the most female-oriented occupations are Education, Arts & Media (100.0%), Community & Social Service (97.3%), and Education Instruction & Library (96.7%).
| Occupation | Male | Female |
| Management | 5 (55.6%) | 4 (44.4%) |
| Business & Financial | 8 (66.7%) | 4 (33.3%) |
| Computers, Engineering & Science | 9 (100.0%) | 0 (0.0%) |
| Computers & Mathematics | 9 (100.0%) | 0 (0.0%) |
| Architecture & Engineering | 0 (0.0%) | 0 (0.0%) |
| Life, Physical & Social Science | 0 (0.0%) | 0 (0.0%) |
| Community & Social Service | 1 (2.7%) | 36 (97.3%) |
| Education, Arts & Media | 0 (0.0%) | 7 (100.0%) |
| Legal Services & Support | 0 (0.0%) | 0 (0.0%) |
| Education Instruction & Library | 1 (3.3%) | 29 (96.7%) |
| Arts, Media & Entertainment | 0 (0.0%) | 0 (0.0%) |
| Health Diagnosing & Treating | 9 (60.0%) | 6 (40.0%) |
| Health Technologists | 9 (75.0%) | 3 (25.0%) |
| Total (Category) | 32 (39.0%) | 50 (61.0%) |
| Total (Overall) | 136 (54.6%) | 113 (45.4%) |
Services Occupations
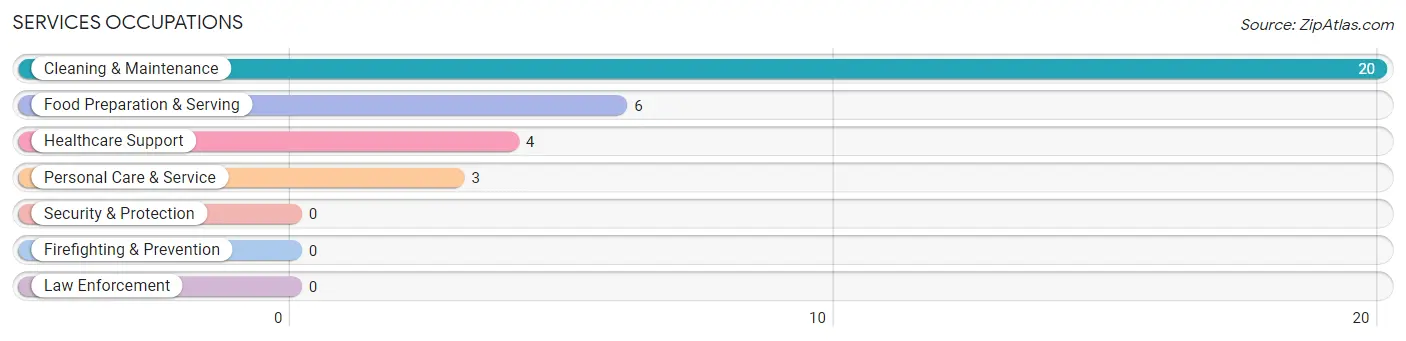
The most common Services occupations in Miami are Cleaning & Maintenance (20 | 8.0%), Food Preparation & Serving (6 | 2.4%), Healthcare Support (4 | 1.6%), and Personal Care & Service (3 | 1.2%).
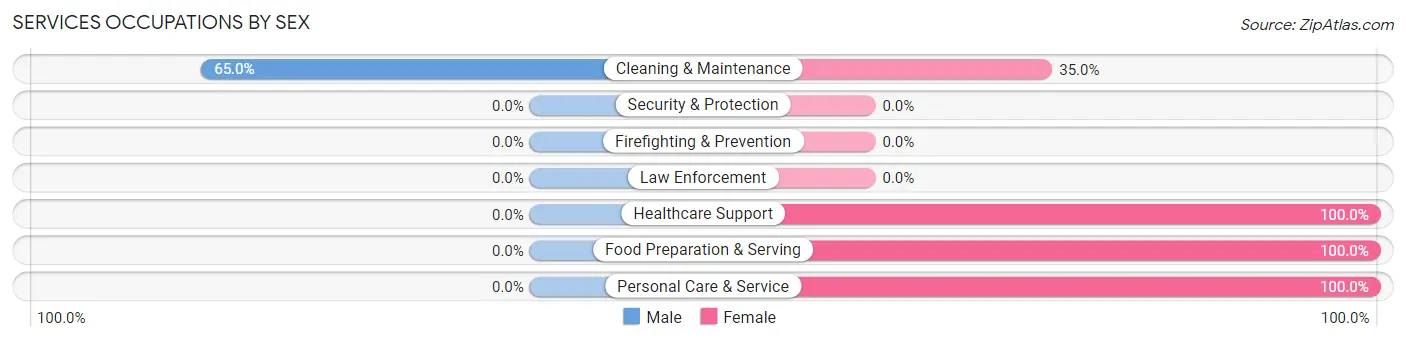
Services Occupations by Sex
| Occupation | Male | Female |
| Healthcare Support | 0 (0.0%) | 4 (100.0%) |
| Security & Protection | 0 (0.0%) | 0 (0.0%) |
| Firefighting & Prevention | 0 (0.0%) | 0 (0.0%) |
| Law Enforcement | 0 (0.0%) | 0 (0.0%) |
| Food Preparation & Serving | 0 (0.0%) | 6 (100.0%) |
| Cleaning & Maintenance | 13 (65.0%) | 7 (35.0%) |
| Personal Care & Service | 0 (0.0%) | 3 (100.0%) |
| Total (Category) | 13 (39.4%) | 20 (60.6%) |
| Total (Overall) | 136 (54.6%) | 113 (45.4%) |
Sales and Office Occupations
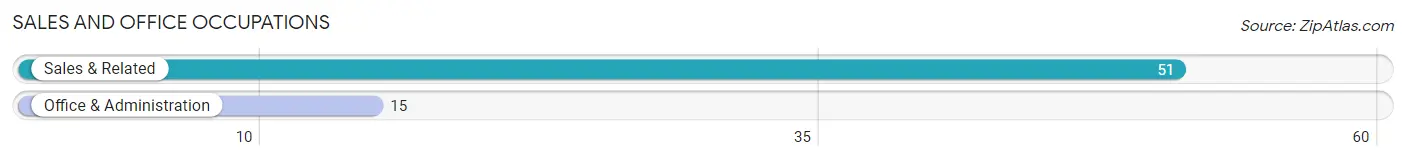
The most common Sales and Office occupations in Miami are Sales & Related (51 | 20.5%), and Office & Administration (15 | 6.0%).
Sales and Office Occupations by Sex

| Occupation | Male | Female |
| Sales & Related | 28 (54.9%) | 23 (45.1%) |
| Office & Administration | 0 (0.0%) | 15 (100.0%) |
| Total (Category) | 28 (42.4%) | 38 (57.6%) |
| Total (Overall) | 136 (54.6%) | 113 (45.4%) |
Natural Resources, Construction and Maintenance Occupations
The most common Natural Resources, Construction and Maintenance occupations in Miami are Construction & Extraction (12 | 4.8%), and Installation, Maintenance & Repair (11 | 4.4%).
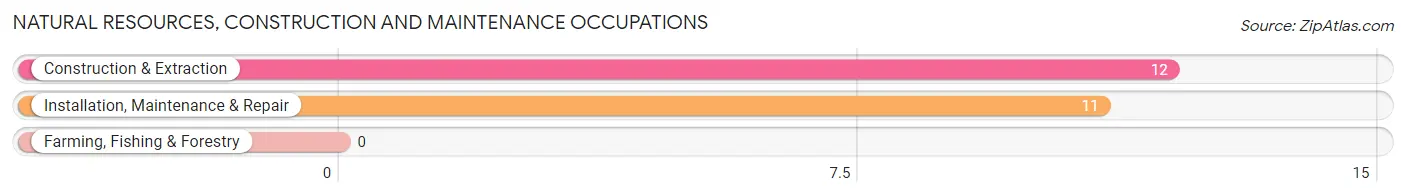
Natural Resources, Construction and Maintenance Occupations by Sex

| Occupation | Male | Female |
| Farming, Fishing & Forestry | 0 (0.0%) | 0 (0.0%) |
| Construction & Extraction | 12 (100.0%) | 0 (0.0%) |
| Installation, Maintenance & Repair | 11 (100.0%) | 0 (0.0%) |
| Total (Category) | 23 (100.0%) | 0 (0.0%) |
| Total (Overall) | 136 (54.6%) | 113 (45.4%) |
Production, Transportation and Moving Occupations
The most common Production, Transportation and Moving occupations in Miami are Production (21 | 8.4%), Material Moving (17 | 6.8%), and Transportation (7 | 2.8%).
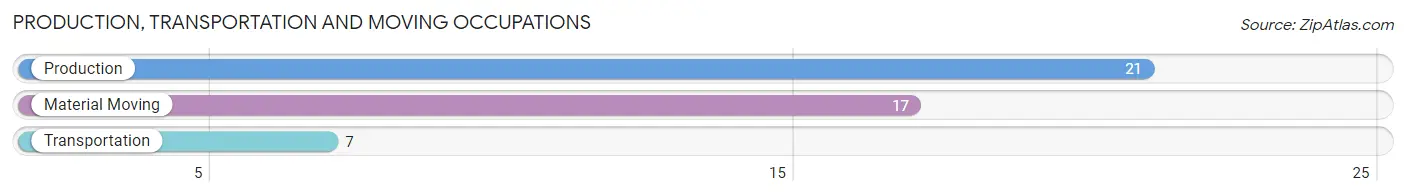
Production, Transportation and Moving Occupations by Sex
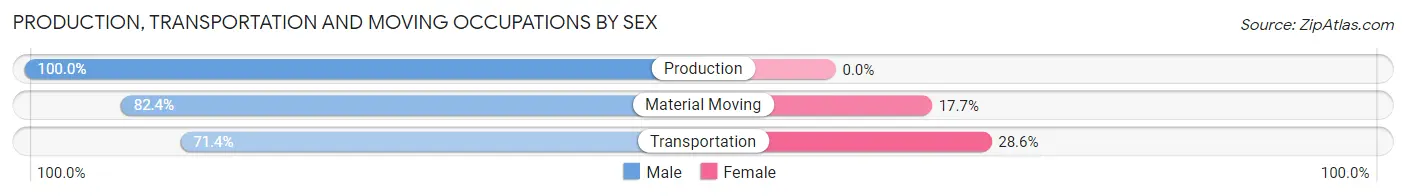
| Occupation | Male | Female |
| Production | 21 (100.0%) | 0 (0.0%) |
| Transportation | 5 (71.4%) | 2 (28.6%) |
| Material Moving | 14 (82.4%) | 3 (17.6%) |
| Total (Category) | 40 (88.9%) | 5 (11.1%) |
| Total (Overall) | 136 (54.6%) | 113 (45.4%) |
Employment Industries by Sex in Miami
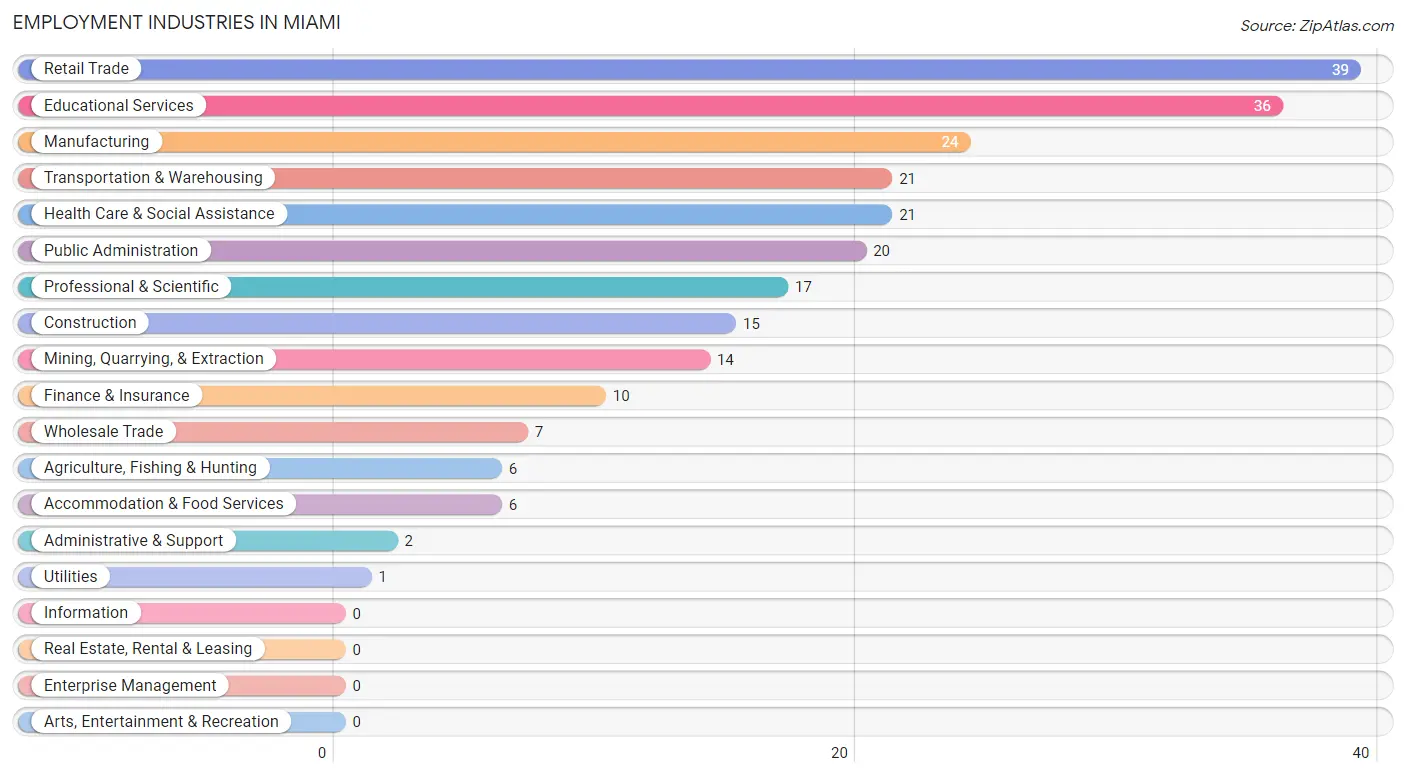
Employment Industries in Miami
The major employment industries in Miami include Retail Trade (39 | 15.7%), Educational Services (36 | 14.5%), Manufacturing (24 | 9.6%), Transportation & Warehousing (21 | 8.4%), and Health Care & Social Assistance (21 | 8.4%).
Employment Industries by Sex in Miami
The Miami industries that see more men than women are Agriculture, Fishing & Hunting (100.0%), Construction (100.0%), and Wholesale Trade (100.0%), whereas the industries that tend to have a higher number of women are Finance & Insurance (100.0%), Administrative & Support (100.0%), and Accommodation & Food Services (100.0%).
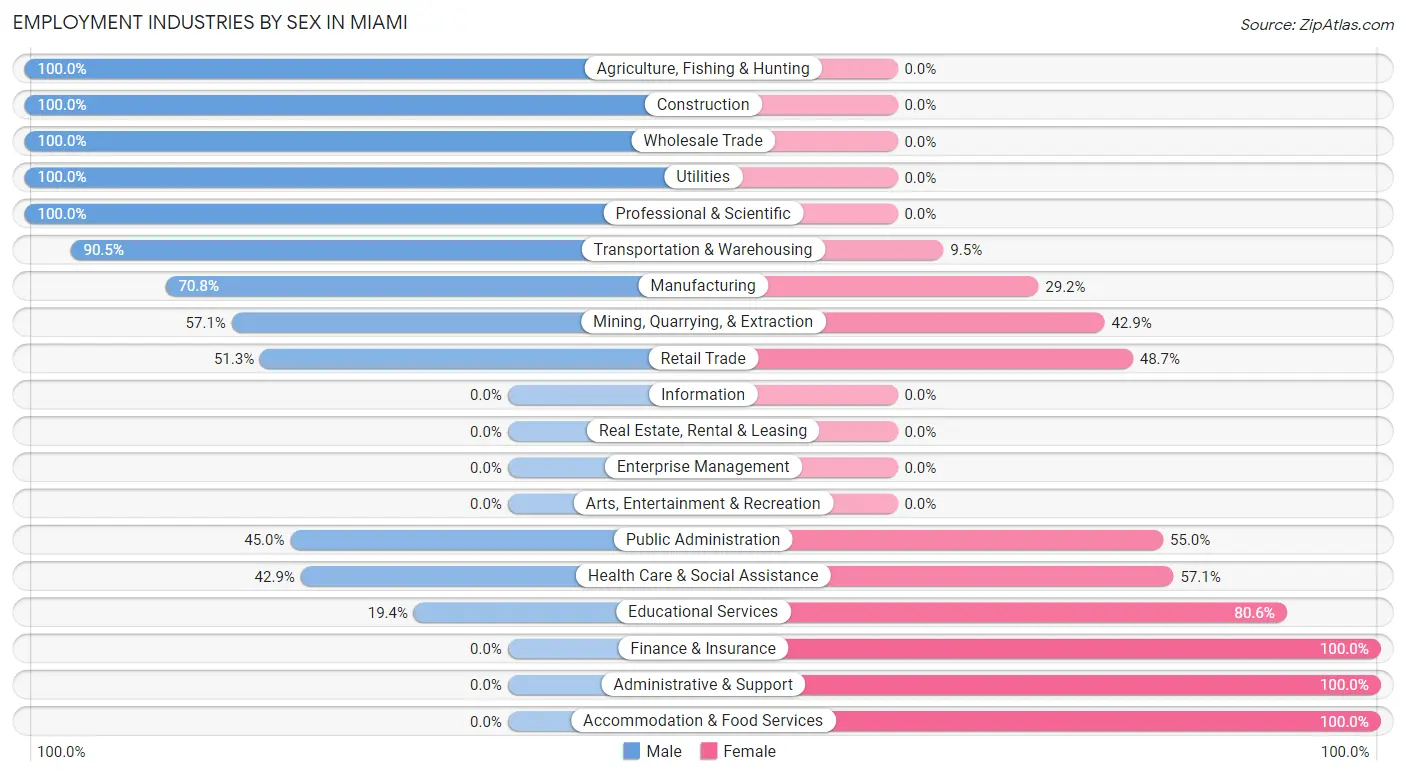
| Industry | Male | Female |
| Agriculture, Fishing & Hunting | 6 (100.0%) | 0 (0.0%) |
| Mining, Quarrying, & Extraction | 8 (57.1%) | 6 (42.9%) |
| Construction | 15 (100.0%) | 0 (0.0%) |
| Manufacturing | 17 (70.8%) | 7 (29.2%) |
| Wholesale Trade | 7 (100.0%) | 0 (0.0%) |
| Retail Trade | 20 (51.3%) | 19 (48.7%) |
| Transportation & Warehousing | 19 (90.5%) | 2 (9.5%) |
| Utilities | 1 (100.0%) | 0 (0.0%) |
| Information | 0 (0.0%) | 0 (0.0%) |
| Finance & Insurance | 0 (0.0%) | 10 (100.0%) |
| Real Estate, Rental & Leasing | 0 (0.0%) | 0 (0.0%) |
| Professional & Scientific | 17 (100.0%) | 0 (0.0%) |
| Enterprise Management | 0 (0.0%) | 0 (0.0%) |
| Administrative & Support | 0 (0.0%) | 2 (100.0%) |
| Educational Services | 7 (19.4%) | 29 (80.6%) |
| Health Care & Social Assistance | 9 (42.9%) | 12 (57.1%) |
| Arts, Entertainment & Recreation | 0 (0.0%) | 0 (0.0%) |
| Accommodation & Food Services | 0 (0.0%) | 6 (100.0%) |
| Public Administration | 9 (45.0%) | 11 (55.0%) |
| Total | 136 (54.6%) | 113 (45.4%) |
Education in Miami
School Enrollment in Miami
The most common levels of schooling among the 134 students in Miami are high school (49 | 36.6%), elementary school (39 | 29.1%), and middle school (30 | 22.4%).
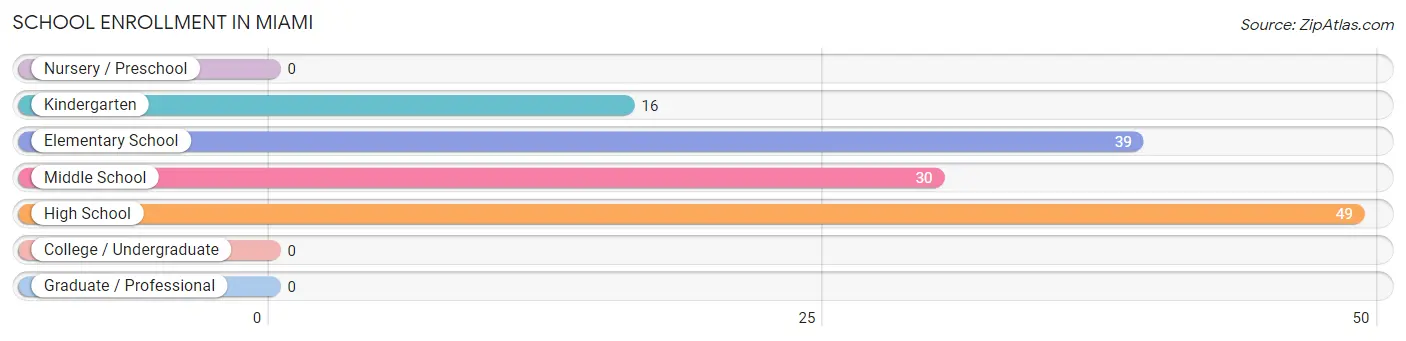
| School Level | # Students | % Students |
| Nursery / Preschool | 0 | 0.0% |
| Kindergarten | 16 | 11.9% |
| Elementary School | 39 | 29.1% |
| Middle School | 30 | 22.4% |
| High School | 49 | 36.6% |
| College / Undergraduate | 0 | 0.0% |
| Graduate / Professional | 0 | 0.0% |
| Total | 134 | 100.0% |
School Enrollment by Age by Funding Source in Miami
Out of a total of 134 students who are enrolled in schools in Miami, 3 (2.2%) attend a private institution, while the remaining 131 (97.8%) are enrolled in public schools. The age group of 10 to 14 year olds has the highest likelihood of being enrolled in private schools, with 3 (6.1% in the age bracket) enrolled. Conversely, the age group of 5 to 9 year old has the lowest likelihood of being enrolled in a private school, with 55 (100.0% in the age bracket) attending a public institution.
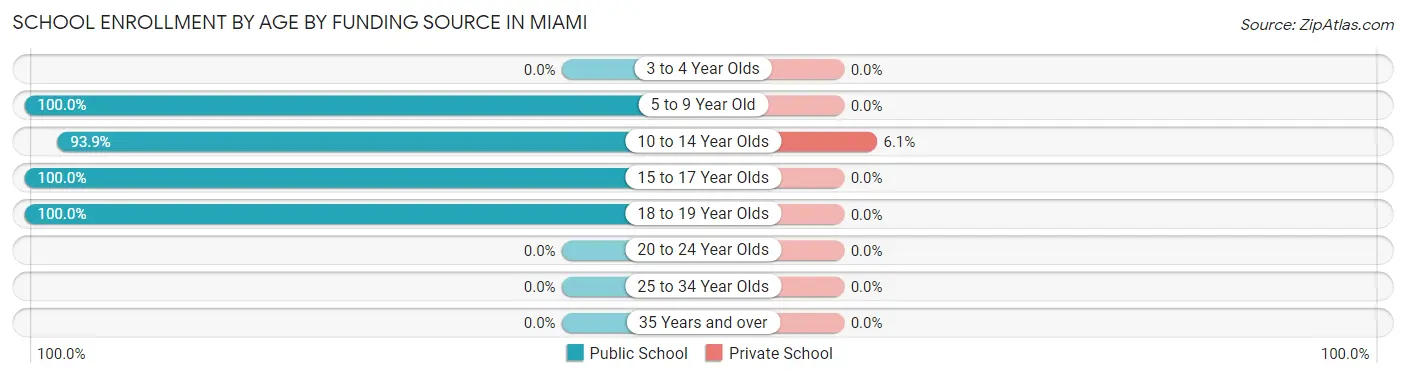
| Age Bracket | Public School | Private School |
| 3 to 4 Year Olds | 0 (0.0%) | 0 (0.0%) |
| 5 to 9 Year Old | 55 (100.0%) | 0 (0.0%) |
| 10 to 14 Year Olds | 46 (93.9%) | 3 (6.1%) |
| 15 to 17 Year Olds | 17 (100.0%) | 0 (0.0%) |
| 18 to 19 Year Olds | 13 (100.0%) | 0 (0.0%) |
| 20 to 24 Year Olds | 0 (0.0%) | 0 (0.0%) |
| 25 to 34 Year Olds | 0 (0.0%) | 0 (0.0%) |
| 35 Years and over | 0 (0.0%) | 0 (0.0%) |
| Total | 131 (97.8%) | 3 (2.2%) |
Educational Attainment by Field of Study in Miami
Business (28 | 38.4%), psychology (16 | 21.9%), education (14 | 19.2%), bio, nature & agricultural (5 | 6.9%), and communications (5 | 6.9%) are the most common fields of study among 73 individuals in Miami who have obtained a bachelor's degree or higher.
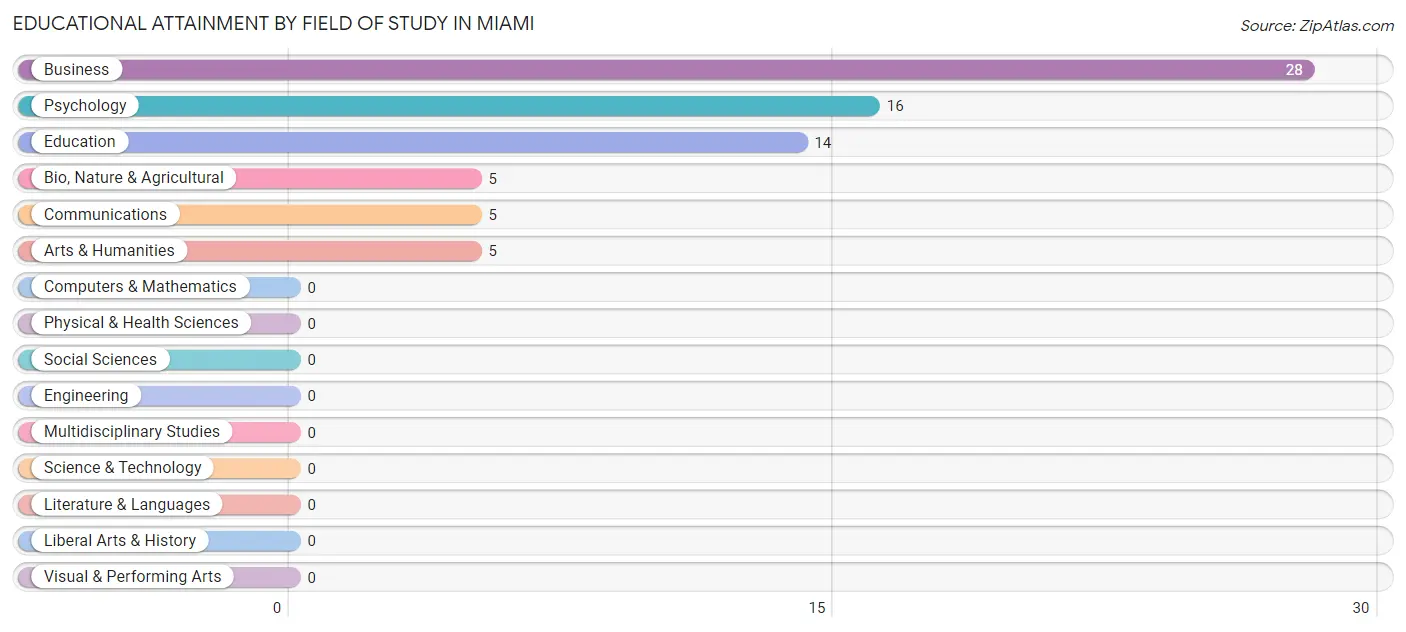
| Field of Study | # Graduates | % Graduates |
| Computers & Mathematics | 0 | 0.0% |
| Bio, Nature & Agricultural | 5 | 6.9% |
| Physical & Health Sciences | 0 | 0.0% |
| Psychology | 16 | 21.9% |
| Social Sciences | 0 | 0.0% |
| Engineering | 0 | 0.0% |
| Multidisciplinary Studies | 0 | 0.0% |
| Science & Technology | 0 | 0.0% |
| Business | 28 | 38.4% |
| Education | 14 | 19.2% |
| Literature & Languages | 0 | 0.0% |
| Liberal Arts & History | 0 | 0.0% |
| Visual & Performing Arts | 0 | 0.0% |
| Communications | 5 | 6.9% |
| Arts & Humanities | 5 | 6.9% |
| Total | 73 | 100.0% |
Transportation & Commute in Miami
Vehicle Availability by Sex in Miami
The most prevalent vehicle ownership categories in Miami are males with 2 vehicles (58, accounting for 42.6%) and females with 2 vehicles (42, making up 51.3%).
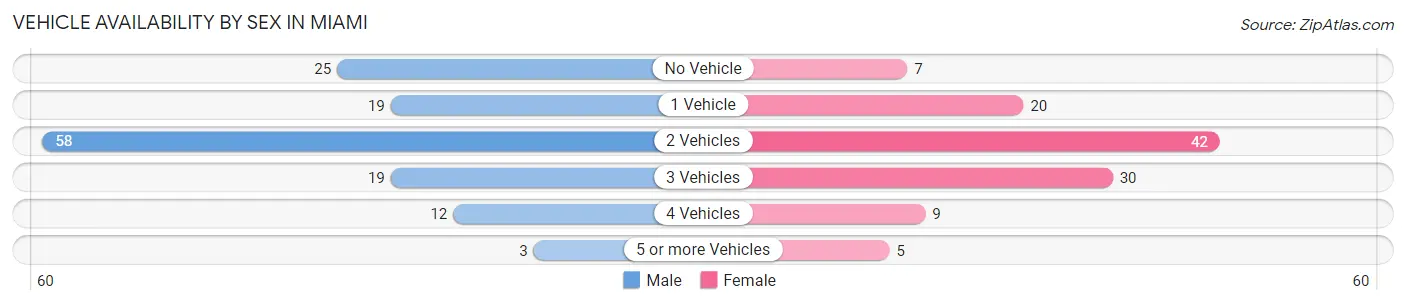
| Vehicles Available | Male | Female |
| No Vehicle | 25 (18.4%) | 7 (6.2%) |
| 1 Vehicle | 19 (14.0%) | 20 (17.7%) |
| 2 Vehicles | 58 (42.6%) | 42 (37.2%) |
| 3 Vehicles | 19 (14.0%) | 30 (26.6%) |
| 4 Vehicles | 12 (8.8%) | 9 (8.0%) |
| 5 or more Vehicles | 3 (2.2%) | 5 (4.4%) |
| Total | 136 (100.0%) | 113 (100.0%) |
Commute Time in Miami
The most frequently occuring commute durations in Miami are less than 5 minutes (88 commuters, 35.3%), 5 to 9 minutes (52 commuters, 20.9%), and 30 to 34 minutes (39 commuters, 15.7%).
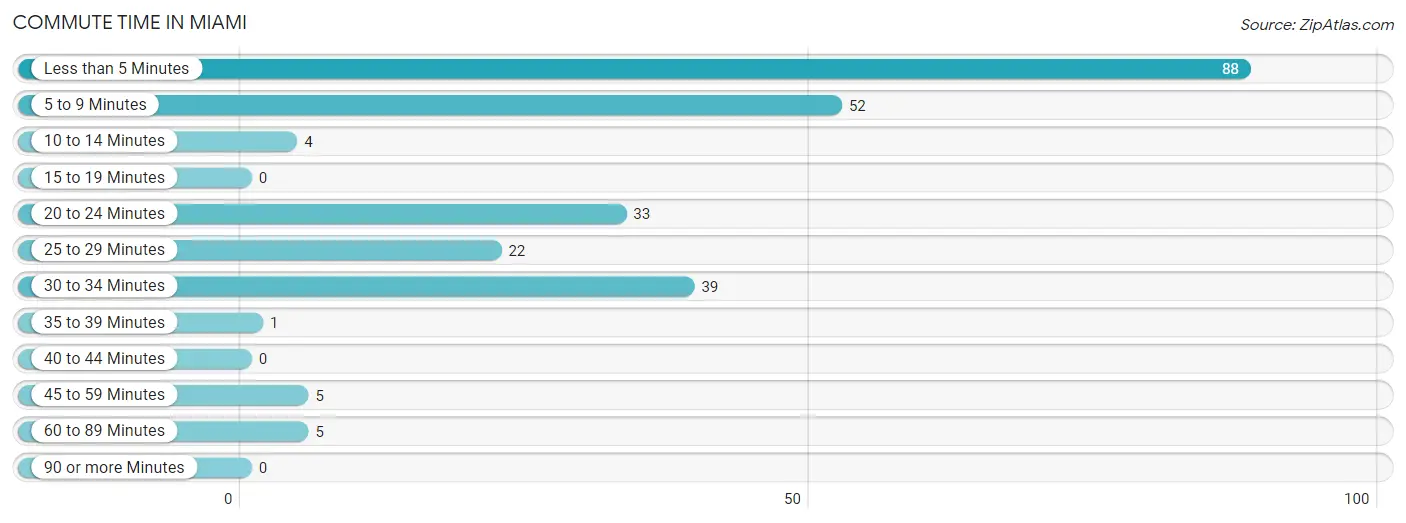
| Commute Time | # Commuters | % Commuters |
| Less than 5 Minutes | 88 | 35.3% |
| 5 to 9 Minutes | 52 | 20.9% |
| 10 to 14 Minutes | 4 | 1.6% |
| 15 to 19 Minutes | 0 | 0.0% |
| 20 to 24 Minutes | 33 | 13.3% |
| 25 to 29 Minutes | 22 | 8.8% |
| 30 to 34 Minutes | 39 | 15.7% |
| 35 to 39 Minutes | 1 | 0.4% |
| 40 to 44 Minutes | 0 | 0.0% |
| 45 to 59 Minutes | 5 | 2.0% |
| 60 to 89 Minutes | 5 | 2.0% |
| 90 or more Minutes | 0 | 0.0% |
Commute Time by Sex in Miami
The most common commute times in Miami are less than 5 minutes (40 commuters, 29.4%) for males and less than 5 minutes (48 commuters, 42.5%) for females.
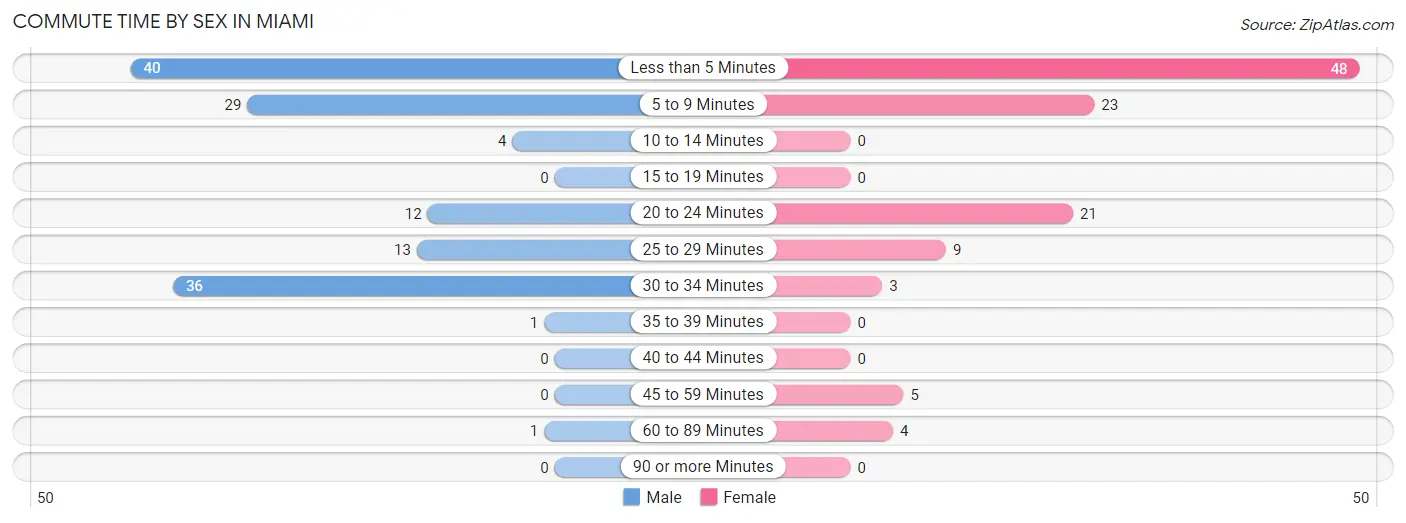
| Commute Time | Male | Female |
| Less than 5 Minutes | 40 (29.4%) | 48 (42.5%) |
| 5 to 9 Minutes | 29 (21.3%) | 23 (20.3%) |
| 10 to 14 Minutes | 4 (2.9%) | 0 (0.0%) |
| 15 to 19 Minutes | 0 (0.0%) | 0 (0.0%) |
| 20 to 24 Minutes | 12 (8.8%) | 21 (18.6%) |
| 25 to 29 Minutes | 13 (9.6%) | 9 (8.0%) |
| 30 to 34 Minutes | 36 (26.5%) | 3 (2.6%) |
| 35 to 39 Minutes | 1 (0.7%) | 0 (0.0%) |
| 40 to 44 Minutes | 0 (0.0%) | 0 (0.0%) |
| 45 to 59 Minutes | 0 (0.0%) | 5 (4.4%) |
| 60 to 89 Minutes | 1 (0.7%) | 4 (3.5%) |
| 90 or more Minutes | 0 (0.0%) | 0 (0.0%) |
Time of Departure to Work by Sex in Miami
The most frequent times of departure to work in Miami are 7:00 AM to 7:29 AM (47, 34.6%) for males and 7:00 AM to 7:29 AM (39, 34.5%) for females.
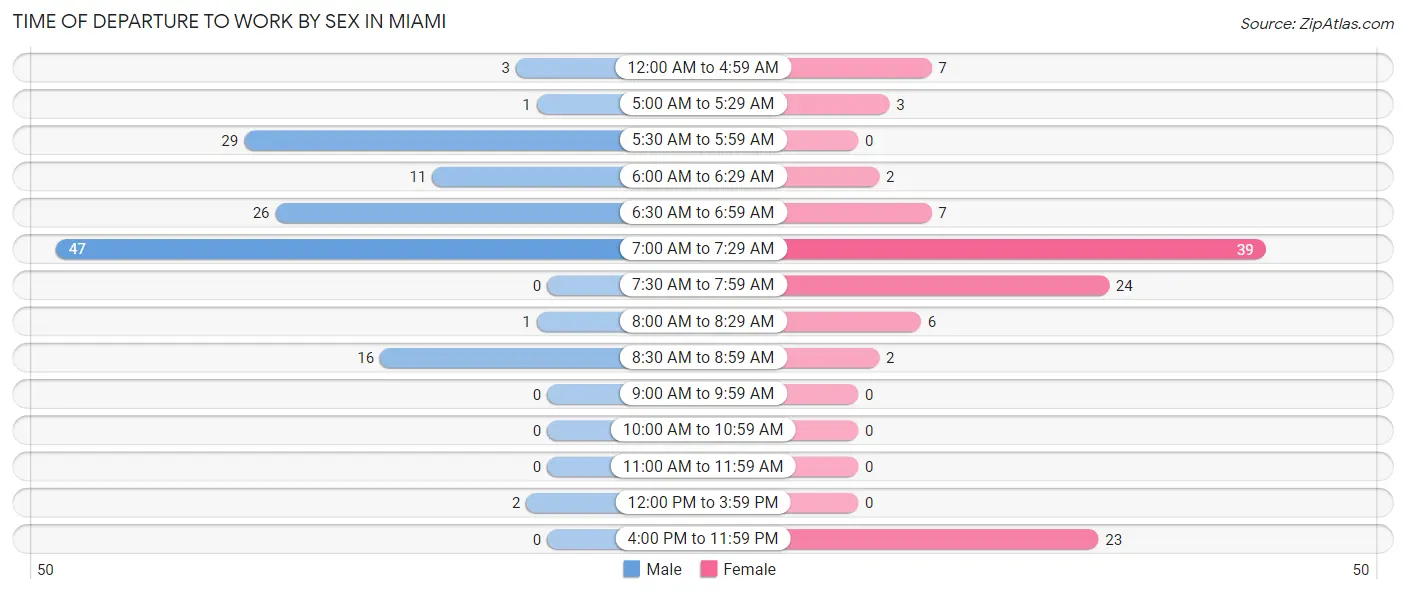
| Time of Departure | Male | Female |
| 12:00 AM to 4:59 AM | 3 (2.2%) | 7 (6.2%) |
| 5:00 AM to 5:29 AM | 1 (0.7%) | 3 (2.6%) |
| 5:30 AM to 5:59 AM | 29 (21.3%) | 0 (0.0%) |
| 6:00 AM to 6:29 AM | 11 (8.1%) | 2 (1.8%) |
| 6:30 AM to 6:59 AM | 26 (19.1%) | 7 (6.2%) |
| 7:00 AM to 7:29 AM | 47 (34.6%) | 39 (34.5%) |
| 7:30 AM to 7:59 AM | 0 (0.0%) | 24 (21.2%) |
| 8:00 AM to 8:29 AM | 1 (0.7%) | 6 (5.3%) |
| 8:30 AM to 8:59 AM | 16 (11.8%) | 2 (1.8%) |
| 9:00 AM to 9:59 AM | 0 (0.0%) | 0 (0.0%) |
| 10:00 AM to 10:59 AM | 0 (0.0%) | 0 (0.0%) |
| 11:00 AM to 11:59 AM | 0 (0.0%) | 0 (0.0%) |
| 12:00 PM to 3:59 PM | 2 (1.5%) | 0 (0.0%) |
| 4:00 PM to 11:59 PM | 0 (0.0%) | 23 (20.3%) |
| Total | 136 (100.0%) | 113 (100.0%) |
Housing Occupancy in Miami
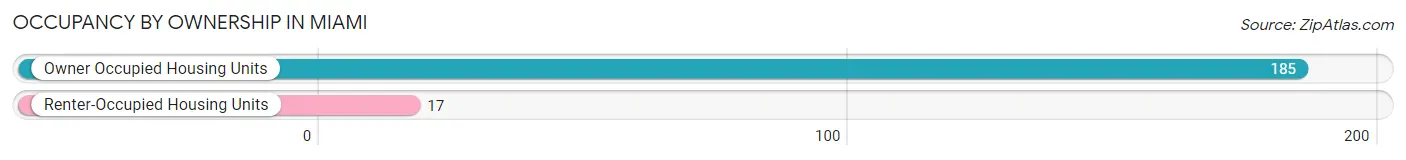
Occupancy by Ownership in Miami
Of the total 202 dwellings in Miami, owner-occupied units account for 185 (91.6%), while renter-occupied units make up 17 (8.4%).
| Occupancy | # Housing Units | % Housing Units |
| Owner Occupied Housing Units | 185 | 91.6% |
| Renter-Occupied Housing Units | 17 | 8.4% |
| Total Occupied Housing Units | 202 | 100.0% |
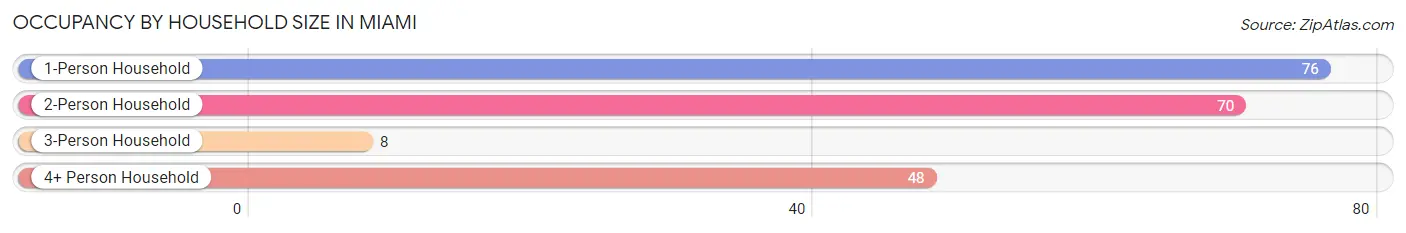
Occupancy by Household Size in Miami
| Household Size | # Housing Units | % Housing Units |
| 1-Person Household | 76 | 37.6% |
| 2-Person Household | 70 | 34.6% |
| 3-Person Household | 8 | 4.0% |
| 4+ Person Household | 48 | 23.8% |
| Total Housing Units | 202 | 100.0% |
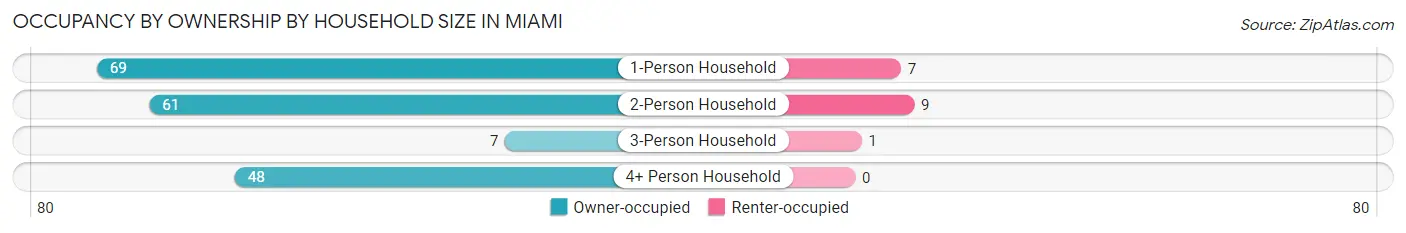
Occupancy by Ownership by Household Size in Miami
| Household Size | Owner-occupied | Renter-occupied |
| 1-Person Household | 69 (90.8%) | 7 (9.2%) |
| 2-Person Household | 61 (87.1%) | 9 (12.9%) |
| 3-Person Household | 7 (87.5%) | 1 (12.5%) |
| 4+ Person Household | 48 (100.0%) | 0 (0.0%) |
| Total Housing Units | 185 (91.6%) | 17 (8.4%) |
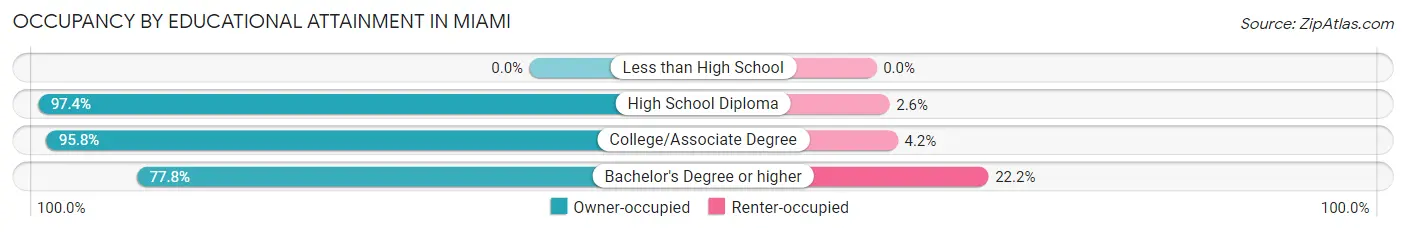
Occupancy by Educational Attainment in Miami
| Household Size | Owner-occupied | Renter-occupied |
| Less than High School | 0 (0.0%) | 0 (0.0%) |
| High School Diploma | 75 (97.4%) | 2 (2.6%) |
| College/Associate Degree | 68 (95.8%) | 3 (4.2%) |
| Bachelor's Degree or higher | 42 (77.8%) | 12 (22.2%) |
Occupancy by Age of Householder in Miami
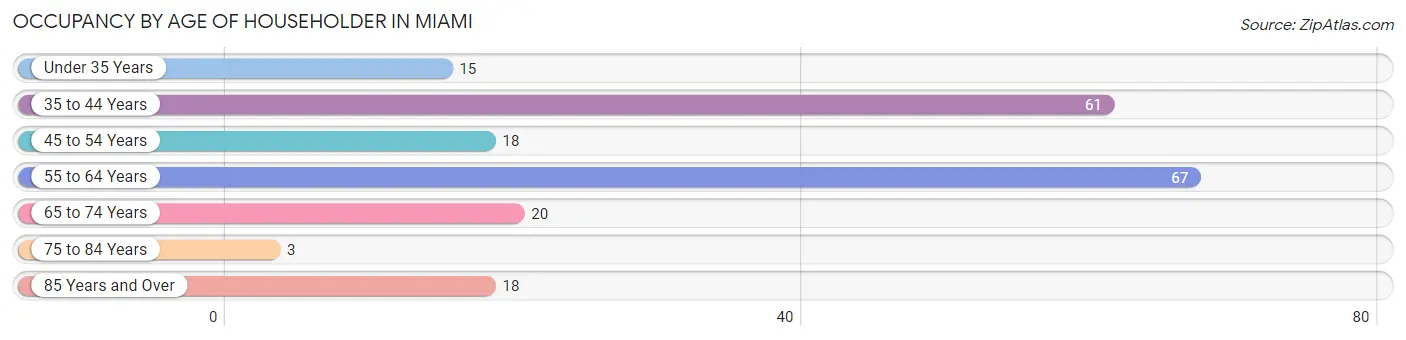
| Age Bracket | # Households | % Households |
| Under 35 Years | 15 | 7.4% |
| 35 to 44 Years | 61 | 30.2% |
| 45 to 54 Years | 18 | 8.9% |
| 55 to 64 Years | 67 | 33.2% |
| 65 to 74 Years | 20 | 9.9% |
| 75 to 84 Years | 3 | 1.5% |
| 85 Years and Over | 18 | 8.9% |
| Total | 202 | 100.0% |
Housing Finances in Miami
Median Income by Occupancy in Miami
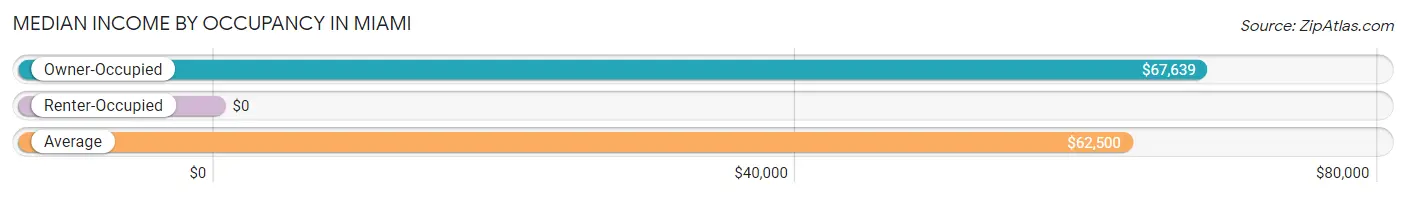
| Occupancy Type | # Households | Median Income |
| Owner-Occupied | 185 (91.6%) | $67,639 |
| Renter-Occupied | 17 (8.4%) | $0 |
| Average | 202 (100.0%) | $62,500 |
Occupancy by Householder Income Bracket in Miami
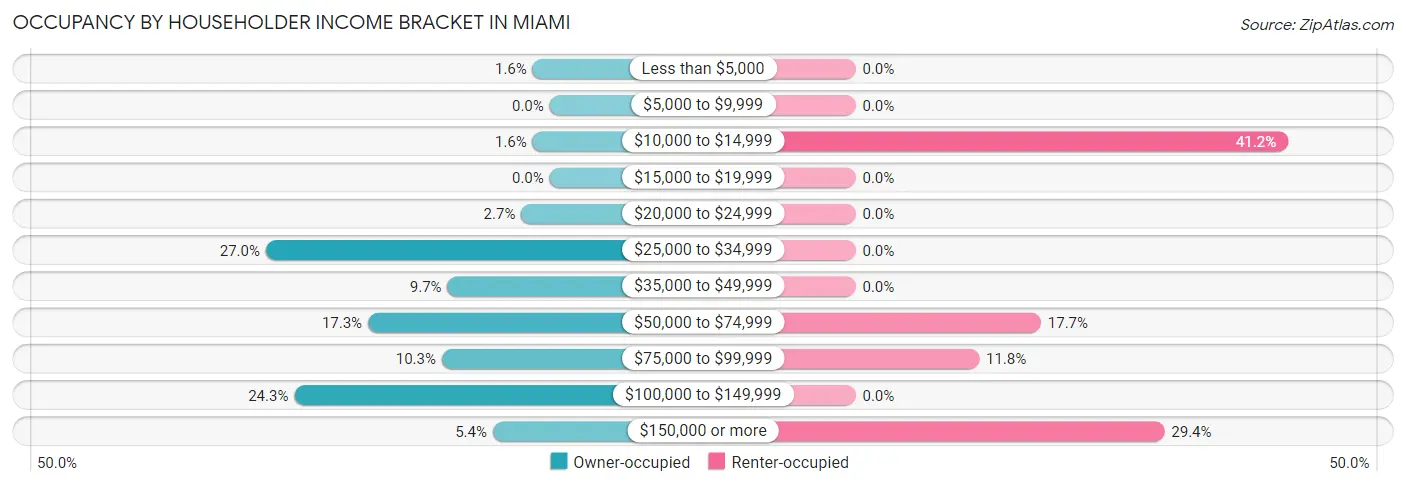
| Income Bracket | Owner-occupied | Renter-occupied |
| Less than $5,000 | 3 (1.6%) | 0 (0.0%) |
| $5,000 to $9,999 | 0 (0.0%) | 0 (0.0%) |
| $10,000 to $14,999 | 3 (1.6%) | 7 (41.2%) |
| $15,000 to $19,999 | 0 (0.0%) | 0 (0.0%) |
| $20,000 to $24,999 | 5 (2.7%) | 0 (0.0%) |
| $25,000 to $34,999 | 50 (27.0%) | 0 (0.0%) |
| $35,000 to $49,999 | 18 (9.7%) | 0 (0.0%) |
| $50,000 to $74,999 | 32 (17.3%) | 3 (17.6%) |
| $75,000 to $99,999 | 19 (10.3%) | 2 (11.8%) |
| $100,000 to $149,999 | 45 (24.3%) | 0 (0.0%) |
| $150,000 or more | 10 (5.4%) | 5 (29.4%) |
| Total | 185 (100.0%) | 17 (100.0%) |
Monthly Housing Cost Tiers in Miami
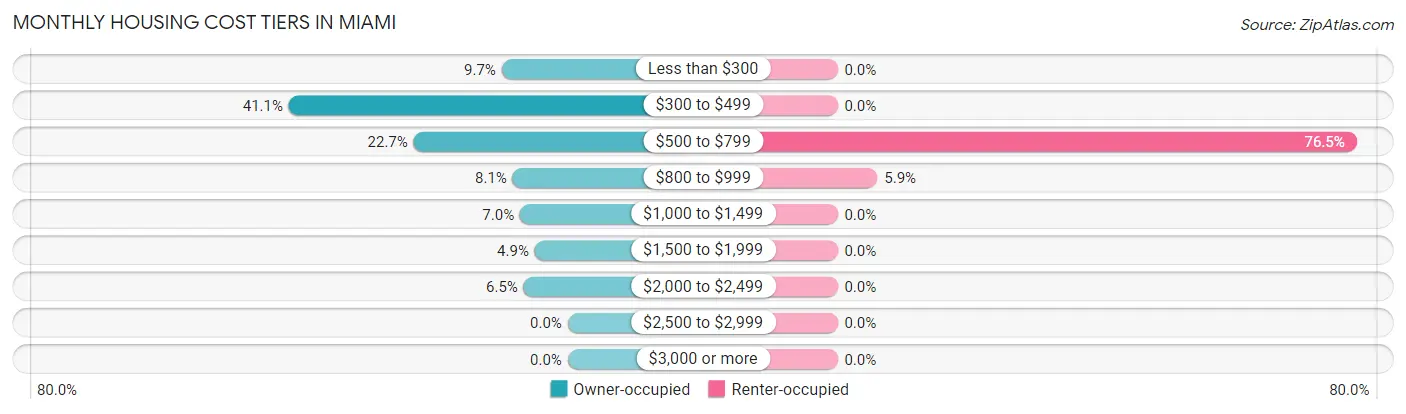
| Monthly Cost | Owner-occupied | Renter-occupied |
| Less than $300 | 18 (9.7%) | 0 (0.0%) |
| $300 to $499 | 76 (41.1%) | 0 (0.0%) |
| $500 to $799 | 42 (22.7%) | 13 (76.5%) |
| $800 to $999 | 15 (8.1%) | 1 (5.9%) |
| $1,000 to $1,499 | 13 (7.0%) | 0 (0.0%) |
| $1,500 to $1,999 | 9 (4.9%) | 0 (0.0%) |
| $2,000 to $2,499 | 12 (6.5%) | 0 (0.0%) |
| $2,500 to $2,999 | 0 (0.0%) | 0 (0.0%) |
| $3,000 or more | 0 (0.0%) | 0 (0.0%) |
| Total | 185 (100.0%) | 17 (100.0%) |
Physical Housing Characteristics in Miami
Housing Structures in Miami
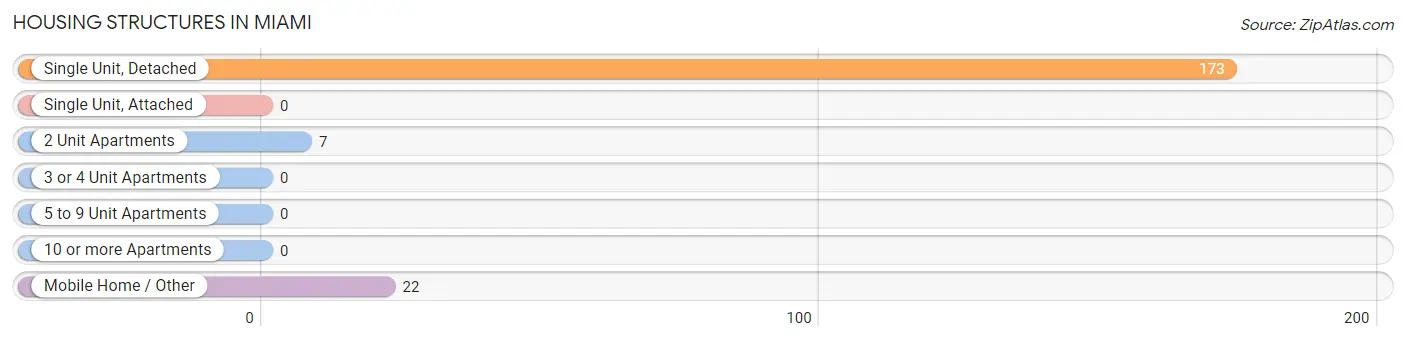
| Structure Type | # Housing Units | % Housing Units |
| Single Unit, Detached | 173 | 85.6% |
| Single Unit, Attached | 0 | 0.0% |
| 2 Unit Apartments | 7 | 3.5% |
| 3 or 4 Unit Apartments | 0 | 0.0% |
| 5 to 9 Unit Apartments | 0 | 0.0% |
| 10 or more Apartments | 0 | 0.0% |
| Mobile Home / Other | 22 | 10.9% |
| Total | 202 | 100.0% |
Housing Structures by Occupancy in Miami
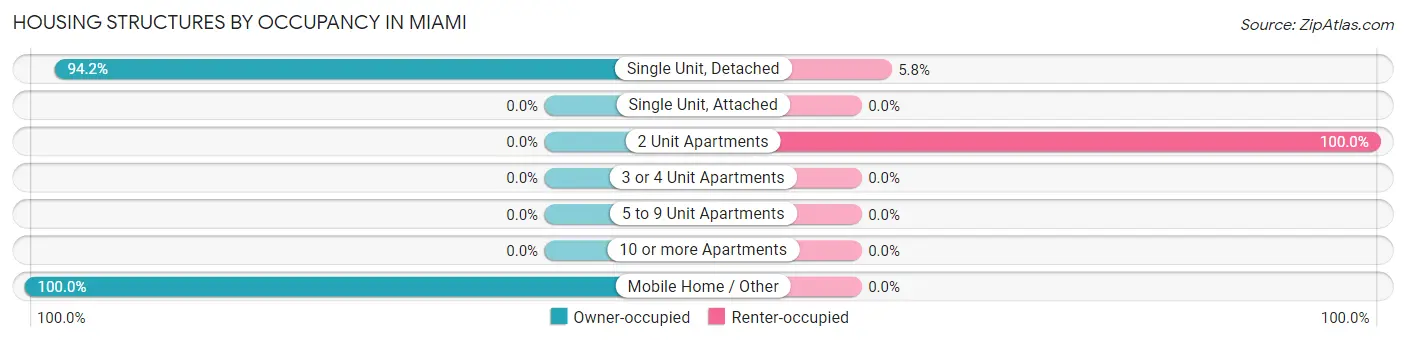
| Structure Type | Owner-occupied | Renter-occupied |
| Single Unit, Detached | 163 (94.2%) | 10 (5.8%) |
| Single Unit, Attached | 0 (0.0%) | 0 (0.0%) |
| 2 Unit Apartments | 0 (0.0%) | 7 (100.0%) |
| 3 or 4 Unit Apartments | 0 (0.0%) | 0 (0.0%) |
| 5 to 9 Unit Apartments | 0 (0.0%) | 0 (0.0%) |
| 10 or more Apartments | 0 (0.0%) | 0 (0.0%) |
| Mobile Home / Other | 22 (100.0%) | 0 (0.0%) |
| Total | 185 (91.6%) | 17 (8.4%) |
Housing Structures by Number of Rooms in Miami
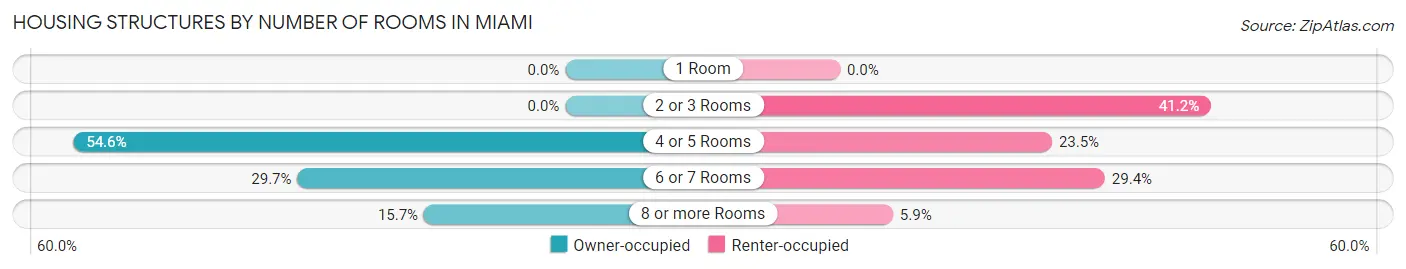
| Number of Rooms | Owner-occupied | Renter-occupied |
| 1 Room | 0 (0.0%) | 0 (0.0%) |
| 2 or 3 Rooms | 0 (0.0%) | 7 (41.2%) |
| 4 or 5 Rooms | 101 (54.6%) | 4 (23.5%) |
| 6 or 7 Rooms | 55 (29.7%) | 5 (29.4%) |
| 8 or more Rooms | 29 (15.7%) | 1 (5.9%) |
| Total | 185 (100.0%) | 17 (100.0%) |
Housing Structure by Heating Type in Miami
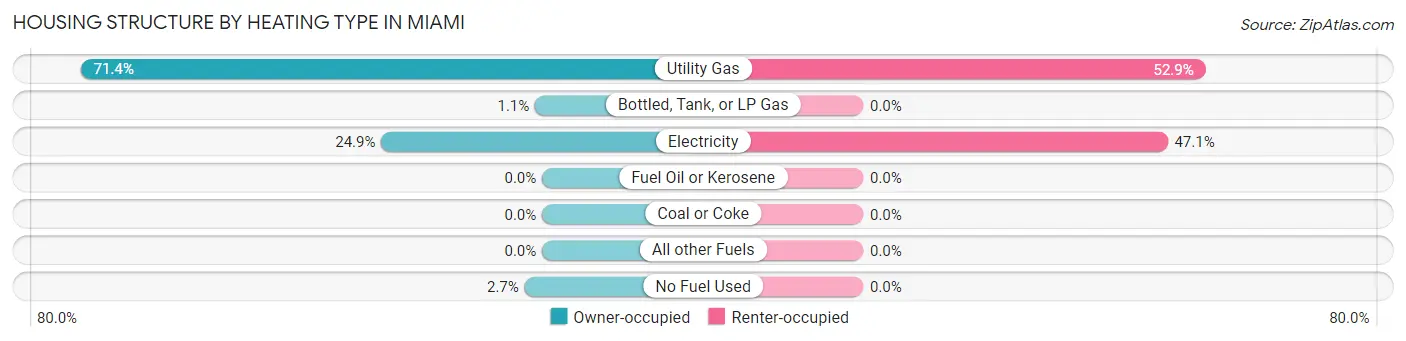
| Heating Type | Owner-occupied | Renter-occupied |
| Utility Gas | 132 (71.4%) | 9 (52.9%) |
| Bottled, Tank, or LP Gas | 2 (1.1%) | 0 (0.0%) |
| Electricity | 46 (24.9%) | 8 (47.1%) |
| Fuel Oil or Kerosene | 0 (0.0%) | 0 (0.0%) |
| Coal or Coke | 0 (0.0%) | 0 (0.0%) |
| All other Fuels | 0 (0.0%) | 0 (0.0%) |
| No Fuel Used | 5 (2.7%) | 0 (0.0%) |
| Total | 185 (100.0%) | 17 (100.0%) |
Household Vehicle Usage in Miami
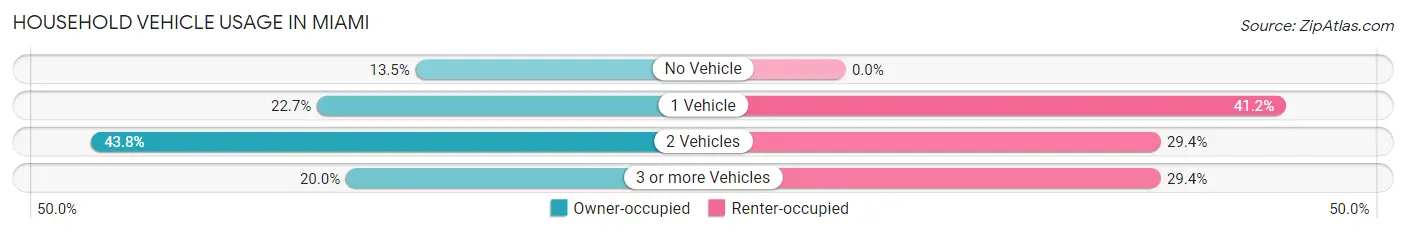
| Vehicles per Household | Owner-occupied | Renter-occupied |
| No Vehicle | 25 (13.5%) | 0 (0.0%) |
| 1 Vehicle | 42 (22.7%) | 7 (41.2%) |
| 2 Vehicles | 81 (43.8%) | 5 (29.4%) |
| 3 or more Vehicles | 37 (20.0%) | 5 (29.4%) |
| Total | 185 (100.0%) | 17 (100.0%) |
Real Estate & Mortgages in Miami
Real Estate and Mortgage Overview in Miami
| Characteristic | Without Mortgage | With Mortgage |
| Housing Units | 142 | 43 |
| Median Property Value | $91,300 | $169,600 |
| Median Household Income | $46,875 | $0 |
| Monthly Housing Costs | $426 | $0 |
| Real Estate Taxes | $1,000 | $0 |
Property Value by Mortgage Status in Miami
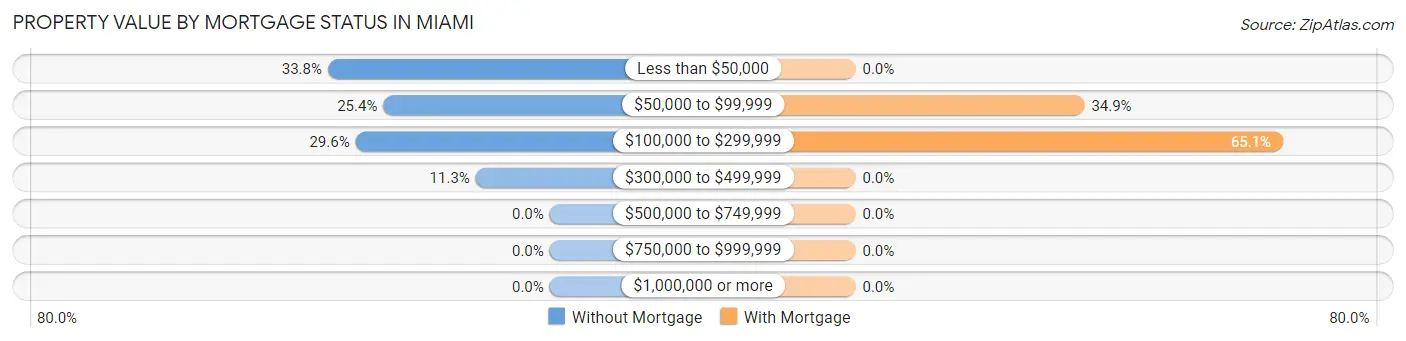
| Property Value | Without Mortgage | With Mortgage |
| Less than $50,000 | 48 (33.8%) | 0 (0.0%) |
| $50,000 to $99,999 | 36 (25.4%) | 15 (34.9%) |
| $100,000 to $299,999 | 42 (29.6%) | 28 (65.1%) |
| $300,000 to $499,999 | 16 (11.3%) | 0 (0.0%) |
| $500,000 to $749,999 | 0 (0.0%) | 0 (0.0%) |
| $750,000 to $999,999 | 0 (0.0%) | 0 (0.0%) |
| $1,000,000 or more | 0 (0.0%) | 0 (0.0%) |
| Total | 142 (100.0%) | 43 (100.0%) |
Household Income by Mortgage Status in Miami
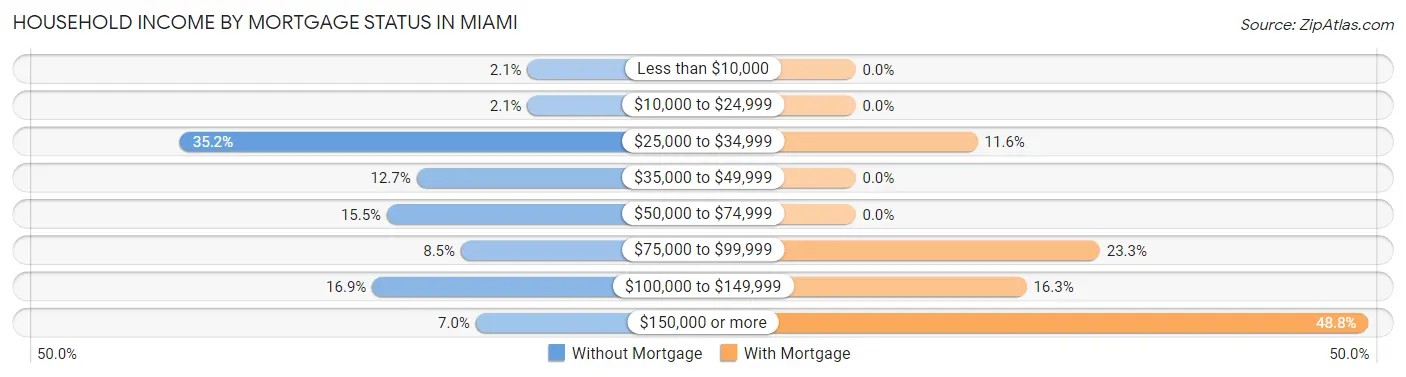
| Household Income | Without Mortgage | With Mortgage |
| Less than $10,000 | 3 (2.1%) | 0 (0.0%) |
| $10,000 to $24,999 | 3 (2.1%) | 0 (0.0%) |
| $25,000 to $34,999 | 50 (35.2%) | 5 (11.6%) |
| $35,000 to $49,999 | 18 (12.7%) | 0 (0.0%) |
| $50,000 to $74,999 | 22 (15.5%) | 0 (0.0%) |
| $75,000 to $99,999 | 12 (8.5%) | 10 (23.3%) |
| $100,000 to $149,999 | 24 (16.9%) | 7 (16.3%) |
| $150,000 or more | 10 (7.0%) | 21 (48.8%) |
| Total | 142 (100.0%) | 43 (100.0%) |
Property Value to Household Income Ratio in Miami
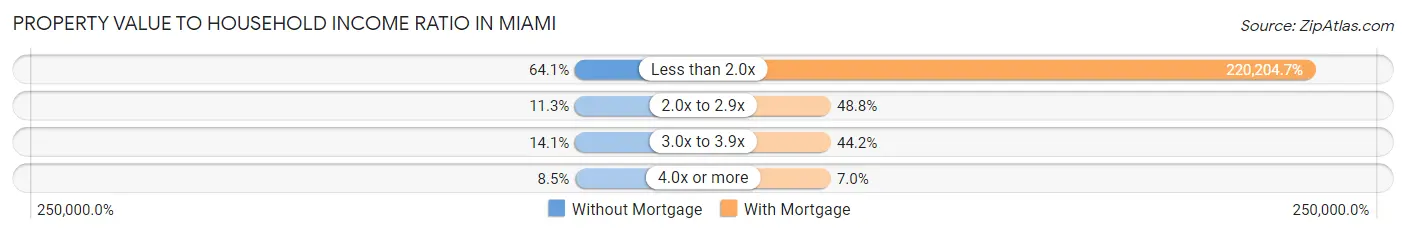
| Value-to-Income Ratio | Without Mortgage | With Mortgage |
| Less than 2.0x | 91 (64.1%) | 94,688 (220,204.6%) |
| 2.0x to 2.9x | 16 (11.3%) | 21 (48.8%) |
| 3.0x to 3.9x | 20 (14.1%) | 19 (44.2%) |
| 4.0x or more | 12 (8.5%) | 3 (7.0%) |
| Total | 142 (100.0%) | 43 (100.0%) |
Real Estate Taxes by Mortgage Status in Miami
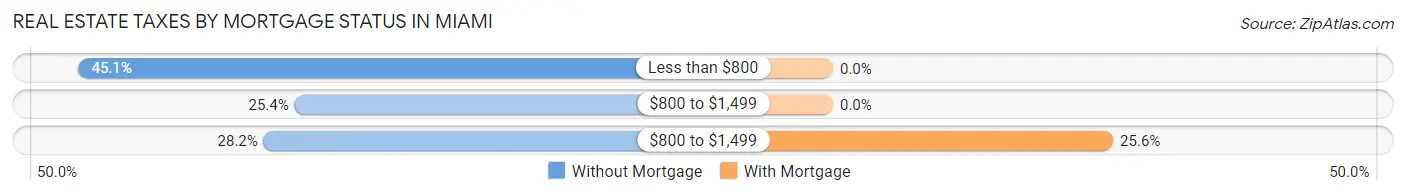
| Property Taxes | Without Mortgage | With Mortgage |
| Less than $800 | 64 (45.1%) | 0 (0.0%) |
| $800 to $1,499 | 36 (25.4%) | 0 (0.0%) |
| $800 to $1,499 | 40 (28.2%) | 11 (25.6%) |
| Total | 142 (100.0%) | 43 (100.0%) |
Health & Disability in Miami
Health Insurance Coverage by Age in Miami
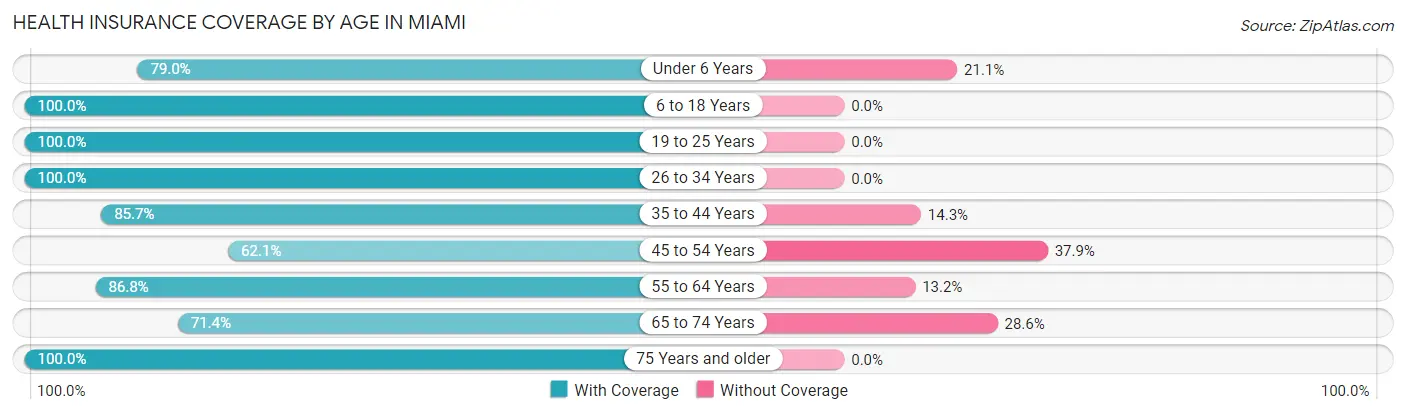
| Age Bracket | With Coverage | Without Coverage |
| Under 6 Years | 15 (78.9%) | 4 (21.0%) |
| 6 to 18 Years | 134 (100.0%) | 0 (0.0%) |
| 19 to 25 Years | 7 (100.0%) | 0 (0.0%) |
| 26 to 34 Years | 23 (100.0%) | 0 (0.0%) |
| 35 to 44 Years | 84 (85.7%) | 14 (14.3%) |
| 45 to 54 Years | 18 (62.1%) | 11 (37.9%) |
| 55 to 64 Years | 105 (86.8%) | 16 (13.2%) |
| 65 to 74 Years | 30 (71.4%) | 12 (28.6%) |
| 75 Years and older | 23 (100.0%) | 0 (0.0%) |
| Total | 439 (88.5%) | 57 (11.5%) |
Health Insurance Coverage by Citizenship Status in Miami
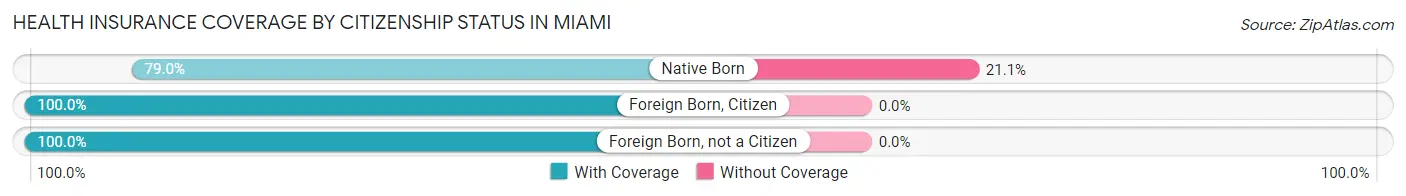
| Citizenship Status | With Coverage | Without Coverage |
| Native Born | 15 (78.9%) | 4 (21.0%) |
| Foreign Born, Citizen | 134 (100.0%) | 0 (0.0%) |
| Foreign Born, not a Citizen | 7 (100.0%) | 0 (0.0%) |
Health Insurance Coverage by Household Income in Miami
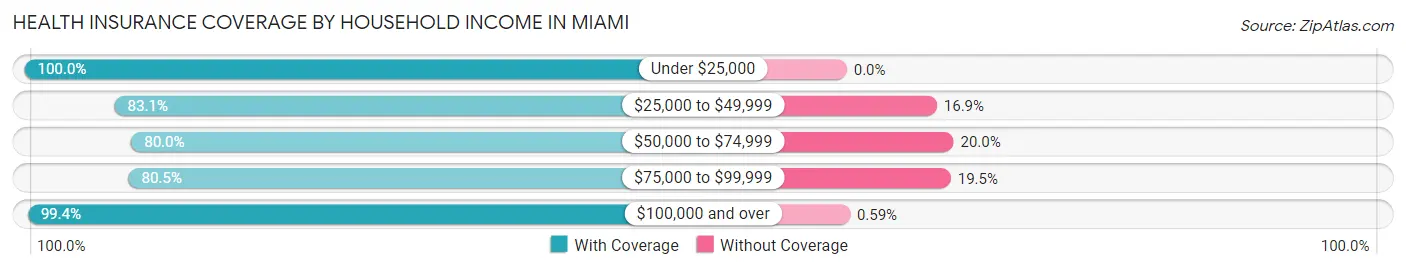
| Household Income | With Coverage | Without Coverage |
| Under $25,000 | 21 (100.0%) | 0 (0.0%) |
| $25,000 to $49,999 | 128 (83.1%) | 26 (16.9%) |
| $50,000 to $74,999 | 60 (80.0%) | 15 (20.0%) |
| $75,000 to $99,999 | 62 (80.5%) | 15 (19.5%) |
| $100,000 and over | 168 (99.4%) | 1 (0.6%) |
Public vs Private Health Insurance Coverage by Age in Miami
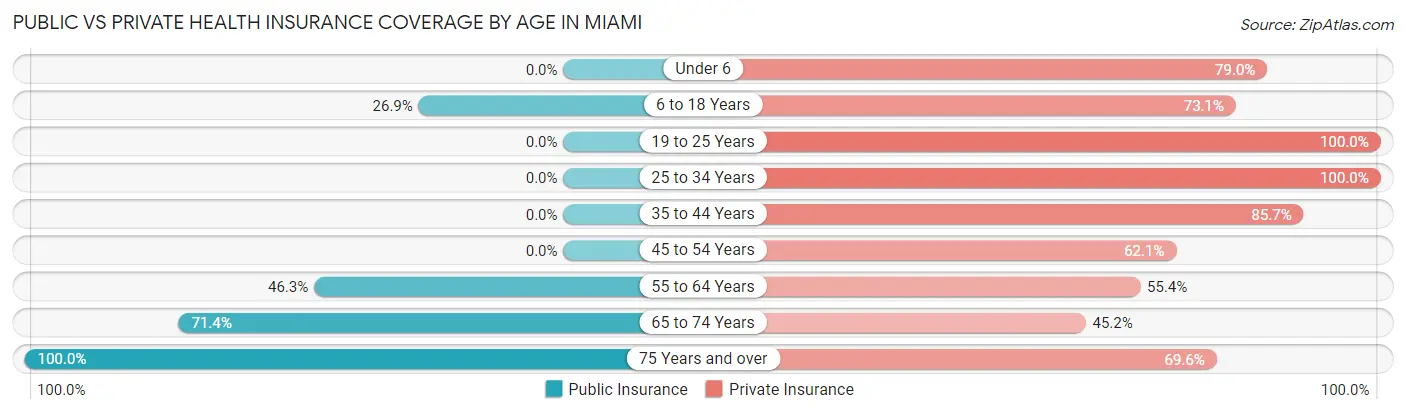
| Age Bracket | Public Insurance | Private Insurance |
| Under 6 | 0 (0.0%) | 15 (78.9%) |
| 6 to 18 Years | 36 (26.9%) | 98 (73.1%) |
| 19 to 25 Years | 0 (0.0%) | 7 (100.0%) |
| 25 to 34 Years | 0 (0.0%) | 23 (100.0%) |
| 35 to 44 Years | 0 (0.0%) | 84 (85.7%) |
| 45 to 54 Years | 0 (0.0%) | 18 (62.1%) |
| 55 to 64 Years | 56 (46.3%) | 67 (55.4%) |
| 65 to 74 Years | 30 (71.4%) | 19 (45.2%) |
| 75 Years and over | 23 (100.0%) | 16 (69.6%) |
| Total | 145 (29.2%) | 347 (70.0%) |
Disability Status by Sex by Age in Miami
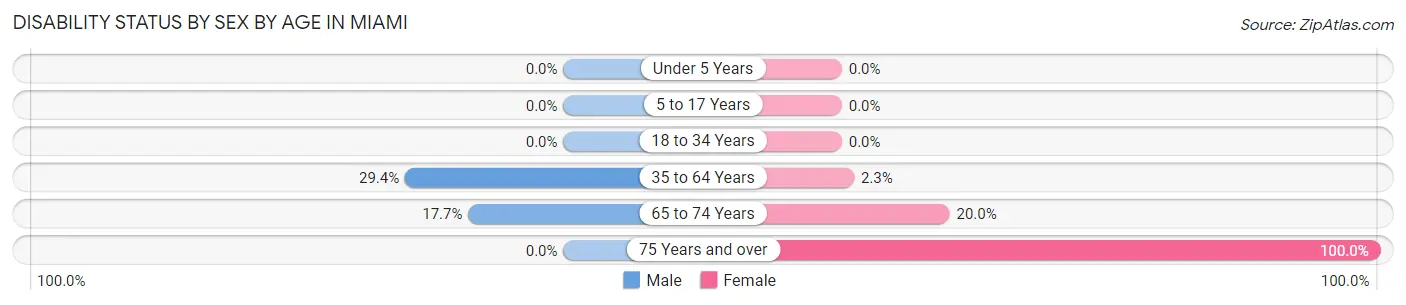
| Age Bracket | Male | Female |
| Under 5 Years | 0 (0.0%) | 0 (0.0%) |
| 5 to 17 Years | 0 (0.0%) | 0 (0.0%) |
| 18 to 34 Years | 0 (0.0%) | 0 (0.0%) |
| 35 to 64 Years | 47 (29.4%) | 2 (2.3%) |
| 65 to 74 Years | 3 (17.6%) | 5 (20.0%) |
| 75 Years and over | 0 (0.0%) | 18 (100.0%) |
Disability Class by Sex by Age in Miami
Disability Class: Hearing Difficulty
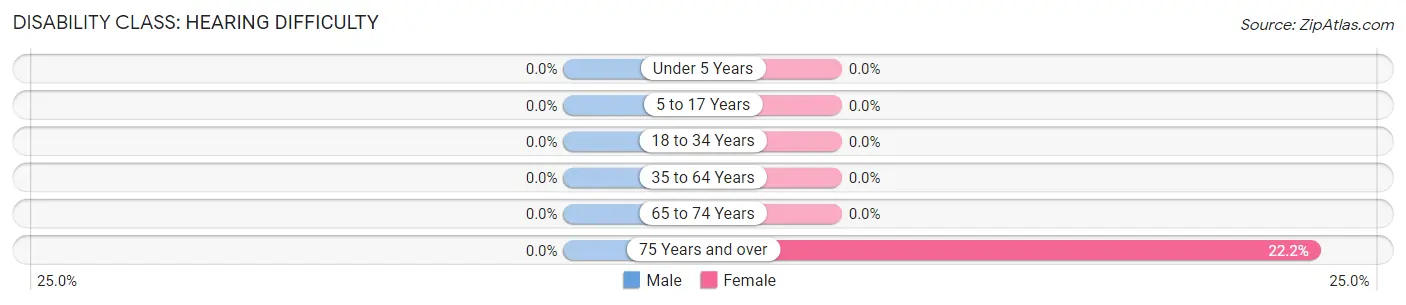
| Age Bracket | Male | Female |
| Under 5 Years | 0 (0.0%) | 0 (0.0%) |
| 5 to 17 Years | 0 (0.0%) | 0 (0.0%) |
| 18 to 34 Years | 0 (0.0%) | 0 (0.0%) |
| 35 to 64 Years | 0 (0.0%) | 0 (0.0%) |
| 65 to 74 Years | 0 (0.0%) | 0 (0.0%) |
| 75 Years and over | 0 (0.0%) | 4 (22.2%) |
Disability Class: Vision Difficulty
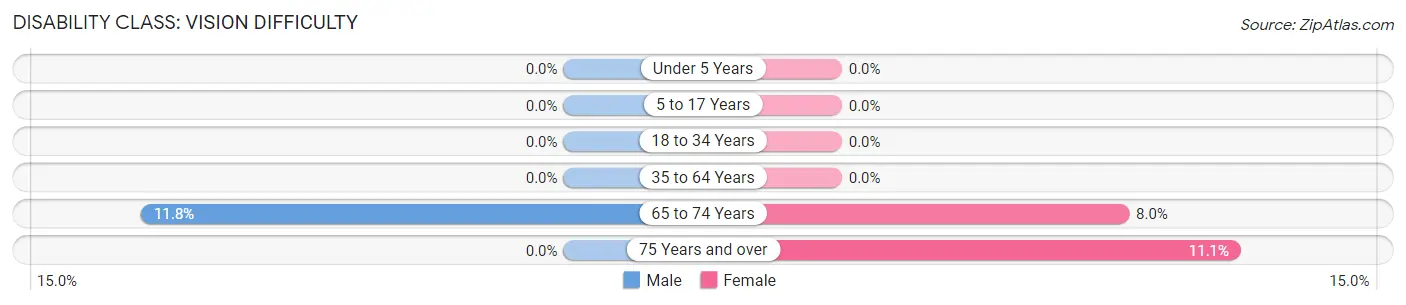
| Age Bracket | Male | Female |
| Under 5 Years | 0 (0.0%) | 0 (0.0%) |
| 5 to 17 Years | 0 (0.0%) | 0 (0.0%) |
| 18 to 34 Years | 0 (0.0%) | 0 (0.0%) |
| 35 to 64 Years | 0 (0.0%) | 0 (0.0%) |
| 65 to 74 Years | 2 (11.8%) | 2 (8.0%) |
| 75 Years and over | 0 (0.0%) | 2 (11.1%) |
Disability Class: Cognitive Difficulty
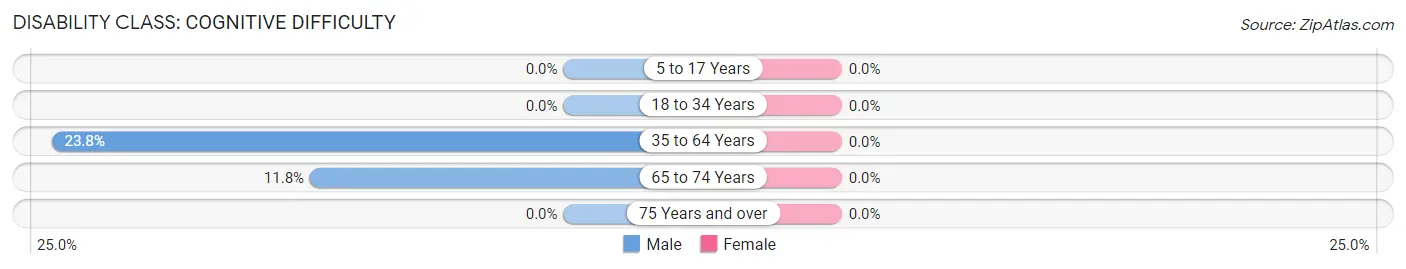
| Age Bracket | Male | Female |
| 5 to 17 Years | 0 (0.0%) | 0 (0.0%) |
| 18 to 34 Years | 0 (0.0%) | 0 (0.0%) |
| 35 to 64 Years | 38 (23.7%) | 0 (0.0%) |
| 65 to 74 Years | 2 (11.8%) | 0 (0.0%) |
| 75 Years and over | 0 (0.0%) | 0 (0.0%) |
Disability Class: Ambulatory Difficulty
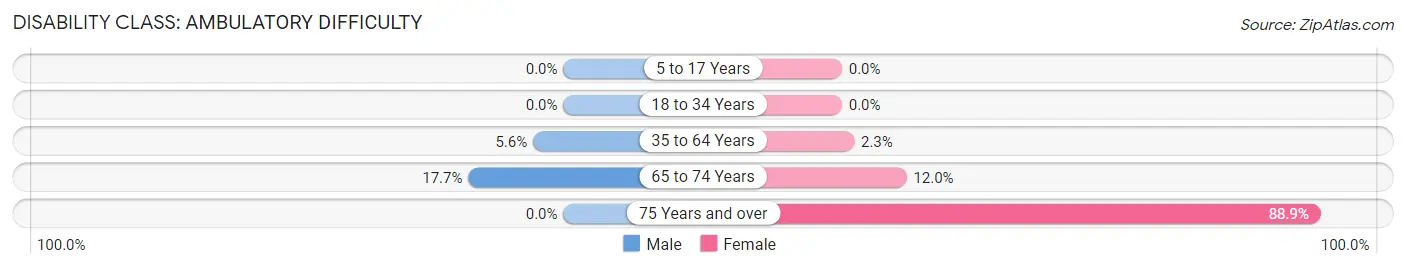
| Age Bracket | Male | Female |
| 5 to 17 Years | 0 (0.0%) | 0 (0.0%) |
| 18 to 34 Years | 0 (0.0%) | 0 (0.0%) |
| 35 to 64 Years | 9 (5.6%) | 2 (2.3%) |
| 65 to 74 Years | 3 (17.6%) | 3 (12.0%) |
| 75 Years and over | 0 (0.0%) | 16 (88.9%) |
Disability Class: Self-Care Difficulty
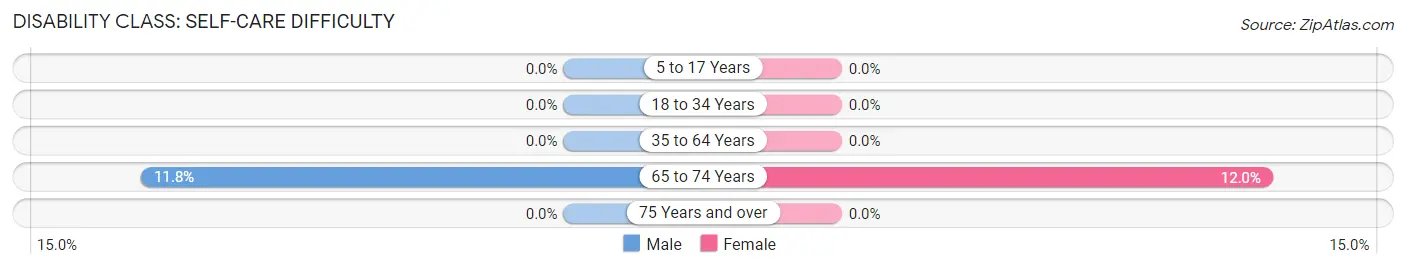
| Age Bracket | Male | Female |
| 5 to 17 Years | 0 (0.0%) | 0 (0.0%) |
| 18 to 34 Years | 0 (0.0%) | 0 (0.0%) |
| 35 to 64 Years | 0 (0.0%) | 0 (0.0%) |
| 65 to 74 Years | 2 (11.8%) | 3 (12.0%) |
| 75 Years and over | 0 (0.0%) | 0 (0.0%) |
Technology Access in Miami
Computing Device Access in Miami
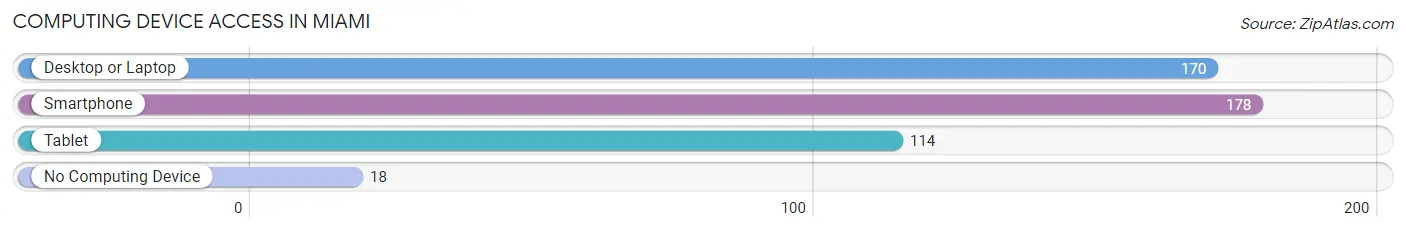
| Device Type | # Households | % Households |
| Desktop or Laptop | 170 | 84.2% |
| Smartphone | 178 | 88.1% |
| Tablet | 114 | 56.4% |
| No Computing Device | 18 | 8.9% |
| Total | 202 | 100.0% |
Internet Access in Miami
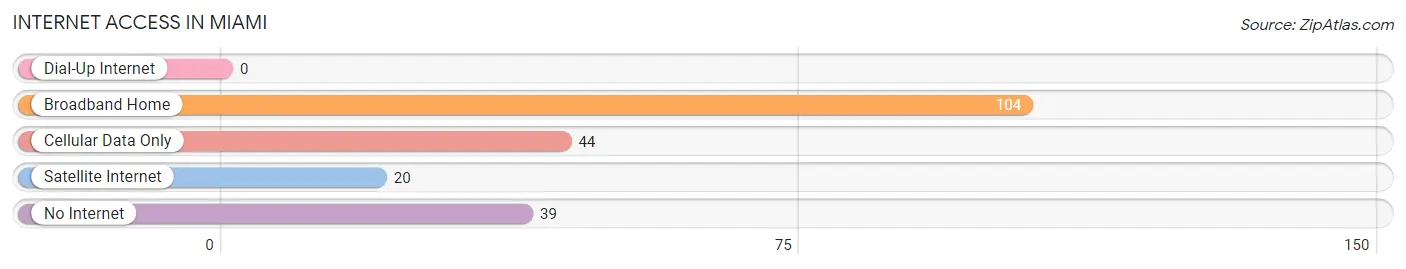
| Internet Type | # Households | % Households |
| Dial-Up Internet | 0 | 0.0% |
| Broadband Home | 104 | 51.5% |
| Cellular Data Only | 44 | 21.8% |
| Satellite Internet | 20 | 9.9% |
| No Internet | 39 | 19.3% |
| Total | 202 | 100.0% |
Miami Summary
Miami, Texas is a city located in the northeastern part of the state, in the county of Bowie. It is situated on the banks of the Red River, and is part of the Texarkana metropolitan area. The city has a population of approximately 8,000 people, and is the county seat of Bowie County.
History
The area that is now Miami was first settled in the early 1800s by a group of settlers from the United States. The settlement was originally known as “Rio de los Brazos”, and was located near the Red River. The settlement was later renamed “Miami”, after the Miami Indians who lived in the area.
In 1836, the Republic of Texas was formed, and the area became part of the new nation. In 1845, Texas was annexed by the United States, and the area became part of the state of Texas.
In 1876, the town of Miami was officially incorporated. The town was named after the Miami Indians, who had lived in the area for centuries.
In the late 1800s, the town began to grow and prosper. The economy was based on agriculture, and the town became a center for cotton production. The town also became a center for the timber industry, and the railroad was built to transport the timber to other parts of the state.
In the early 1900s, the town began to experience a period of growth and prosperity. The population increased, and the town became a center for business and industry. The town also became a center for education, with the establishment of several schools and colleges.
In the late 1900s, the town began to experience a period of decline. The economy shifted away from agriculture and timber, and the population began to decline. The town also experienced a period of racial tension, as the town was divided between white and black residents.
Geography
Miami is located in the northeastern part of the state, in the county of Bowie. It is situated on the banks of the Red River, and is part of the Texarkana metropolitan area. The city has a total area of 4.2 square miles, all of which is land.
The climate in Miami is classified as humid subtropical, with hot summers and mild winters. The average temperature in the summer is around 90 degrees Fahrenheit, and the average temperature in the winter is around 50 degrees Fahrenheit.
Economy
The economy of Miami is based primarily on agriculture and manufacturing. The city is home to several large agricultural operations, including cotton, soybeans, and wheat. The city is also home to several manufacturing companies, including a paper mill, a furniture factory, and a plastics factory.
The city is also home to several retail stores, restaurants, and other businesses. The city is also home to several educational institutions, including a community college and a technical college.
Demographics
As of the 2010 census, the population of Miami was 8,000 people. The racial makeup of the city was 79.3% White, 16.2% African American, 0.7% Native American, 0.7% Asian, 0.1% Pacific Islander, and 2.9% from other races. Hispanic or Latino of any race were 5.3% of the population.
The median income for a household in the city was $31,250, and the median income for a family was $37,500. The per capita income for the city was $17,845. About 17.2% of families and 20.3% of the population were below the poverty line, including 28.3% of those under age 18 and 11.7% of those age 65 or over.
Common Questions
What is Per Capita Income in Miami?
Per Capita income in Miami is $31,040.
What is the Median Family Income in Miami?
Median Family Income in Miami is $80,417.
What is the Median Household income in Miami?
Median Household Income in Miami is $62,500.
What is Income or Wage Gap in Miami?
Income or Wage Gap in Miami is 67.5%.
Women in Miami earn 32.5 cents for every dollar earned by a man.
What is Family Income Deficit in Miami?
Family Income Deficit in Miami is $4,000.
Families that are below poverty line in Miami earn $4,000 less on average than the poverty threshold level.
What is Inequality or Gini Index in Miami?
Inequality or Gini Index in Miami is 0.37.
What is the Total Population of Miami?
Total Population of Miami is 496.
What is the Total Male Population of Miami?
Total Male Population of Miami is 264.
What is the Total Female Population of Miami?
Total Female Population of Miami is 232.
What is the Ratio of Males per 100 Females in Miami?
There are 113.79 Males per 100 Females in Miami.
What is the Ratio of Females per 100 Males in Miami?
There are 87.88 Females per 100 Males in Miami.
What is the Median Population Age in Miami?
Median Population Age in Miami is 40.8 Years.
What is the Average Family Size in Miami
Average Family Size in Miami is 3.3 People.
What is the Average Household Size in Miami
Average Household Size in Miami is 2.5 People.
How Large is the Labor Force in Miami?
There are 249 People in the Labor Forcein in Miami.
What is the Percentage of People in the Labor Force in Miami?
66.9% of People are in the Labor Force in Miami.