Memphis, TX Map & Demographics
Memphis Map
Memphis Overview
$23,439
PER CAPITA INCOME
$50,335
AVG FAMILY INCOME
$43,901
AVG HOUSEHOLD INCOME
3.6%
WAGE / INCOME GAP [ % ]
96.4¢/ $1
WAGE / INCOME GAP [ $ ]
$16,115
FAMILY INCOME DEFICIT
0.44
INEQUALITY / GINI INDEX
2,130
TOTAL POPULATION
1,015
MALE POPULATION
1,115
FEMALE POPULATION
91.03
MALES / 100 FEMALES
109.85
FEMALES / 100 MALES
43.7
MEDIAN AGE
2.8
AVG FAMILY SIZE
2.4
AVG HOUSEHOLD SIZE
915
LABOR FORCE [ PEOPLE ]
54.5%
PERCENT IN LABOR FORCE
9.1%
UNEMPLOYMENT RATE
Memphis Zip Codes
Memphis Area Codes
Income in Memphis
Income Overview in Memphis
Per Capita Income in Memphis is $23,439, while median incomes of families and households are $50,335 and $43,901 respectively.
| Characteristic | Number | Measure |
| Per Capita Income | 2,130 | $23,439 |
| Median Family Income | 605 | $50,335 |
| Mean Family Income | 605 | $67,697 |
| Median Household Income | 877 | $43,901 |
| Mean Household Income | 877 | $59,083 |
| Income Deficit | 605 | $16,115 |
| Wage / Income Gap (%) | 2,130 | 3.61% |
| Wage / Income Gap ($) | 2,130 | 96.39¢ per $1 |
| Gini / Inequality Index | 2,130 | 0.44 |
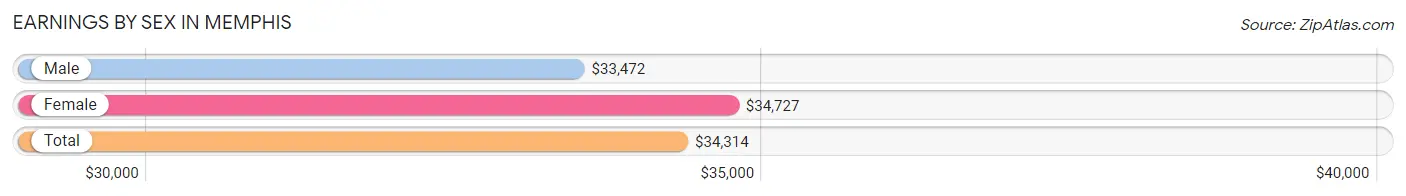
Earnings by Sex in Memphis
Average Earnings in Memphis are $34,314, $33,472 for men and $34,727 for women, a difference of 3.6%.
| Sex | Number | Average Earnings |
| Male | 431 (47.2%) | $33,472 |
| Female | 482 (52.8%) | $34,727 |
| Total | 913 (100.0%) | $34,314 |
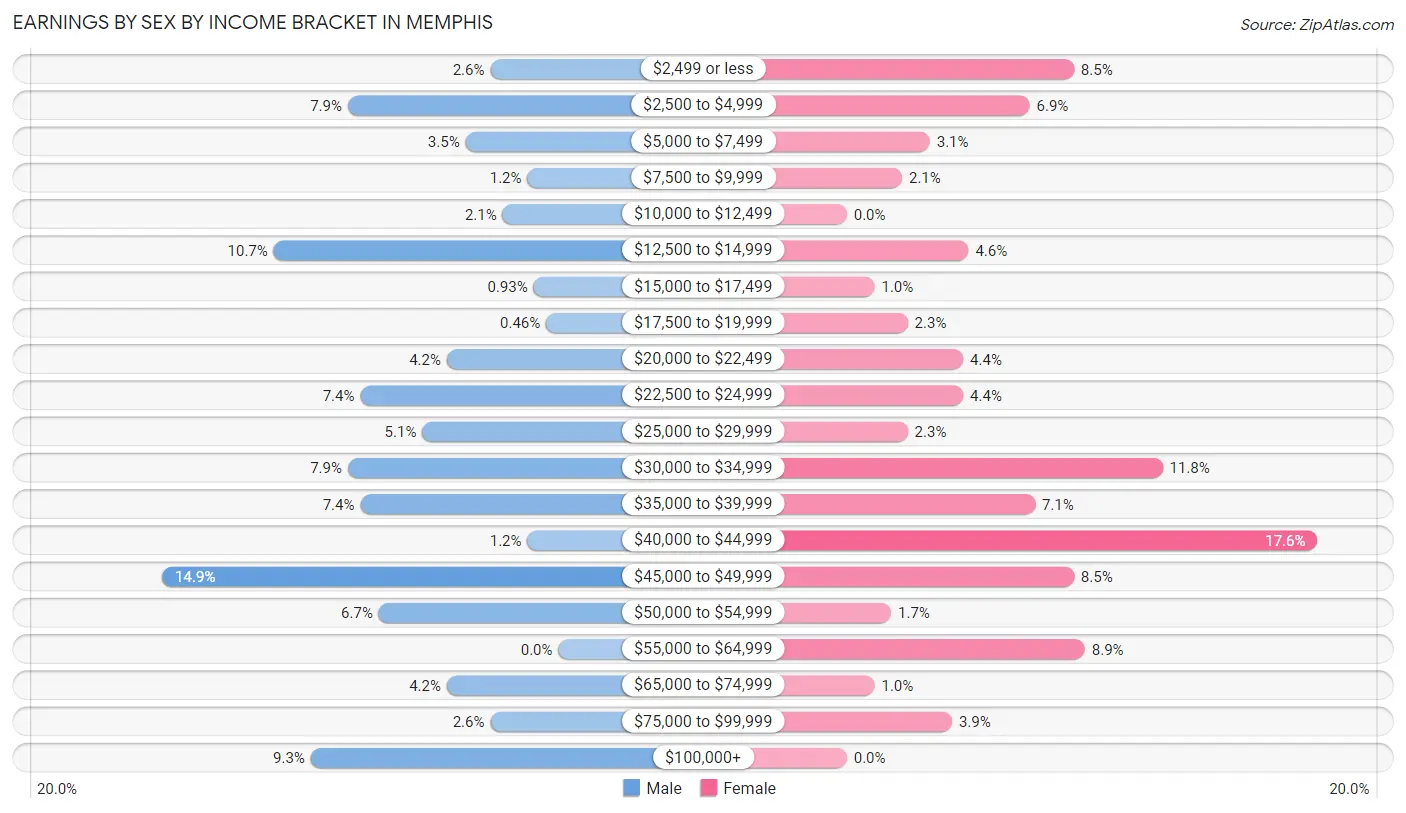
Earnings by Sex by Income Bracket in Memphis
The most common earnings brackets in Memphis are $45,000 to $49,999 for men (64 | 14.8%) and $40,000 to $44,999 for women (85 | 17.6%).
| Income | Male | Female |
| $2,499 or less | 11 (2.5%) | 41 (8.5%) |
| $2,500 to $4,999 | 34 (7.9%) | 33 (6.9%) |
| $5,000 to $7,499 | 15 (3.5%) | 15 (3.1%) |
| $7,500 to $9,999 | 5 (1.2%) | 10 (2.1%) |
| $10,000 to $12,499 | 9 (2.1%) | 0 (0.0%) |
| $12,500 to $14,999 | 46 (10.7%) | 22 (4.6%) |
| $15,000 to $17,499 | 4 (0.9%) | 5 (1.0%) |
| $17,500 to $19,999 | 2 (0.5%) | 11 (2.3%) |
| $20,000 to $22,499 | 18 (4.2%) | 21 (4.4%) |
| $22,500 to $24,999 | 32 (7.4%) | 21 (4.4%) |
| $25,000 to $29,999 | 22 (5.1%) | 11 (2.3%) |
| $30,000 to $34,999 | 34 (7.9%) | 57 (11.8%) |
| $35,000 to $39,999 | 32 (7.4%) | 34 (7.0%) |
| $40,000 to $44,999 | 5 (1.2%) | 85 (17.6%) |
| $45,000 to $49,999 | 64 (14.8%) | 41 (8.5%) |
| $50,000 to $54,999 | 29 (6.7%) | 8 (1.7%) |
| $55,000 to $64,999 | 0 (0.0%) | 43 (8.9%) |
| $65,000 to $74,999 | 18 (4.2%) | 5 (1.0%) |
| $75,000 to $99,999 | 11 (2.5%) | 19 (3.9%) |
| $100,000+ | 40 (9.3%) | 0 (0.0%) |
| Total | 431 (100.0%) | 482 (100.0%) |
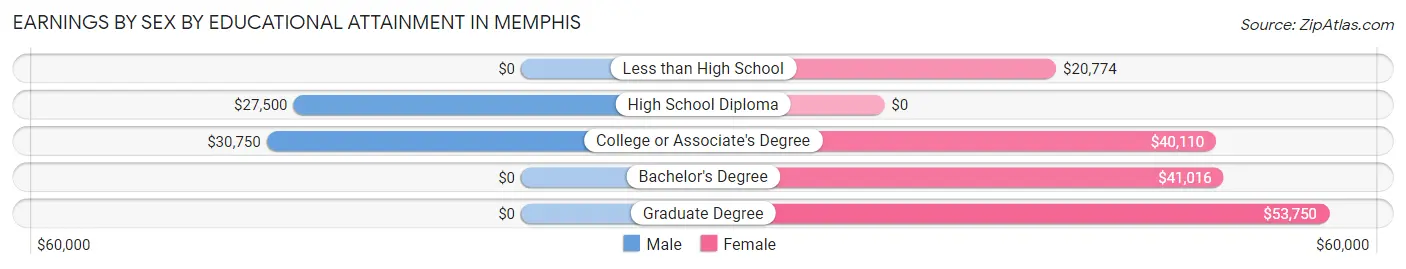
Earnings by Sex by Educational Attainment in Memphis
Average earnings in Memphis are $29,750 for men and $37,379 for women, a difference of 20.4%. Men with an educational attainment of college or associate's degree enjoy the highest average annual earnings of $30,750, while those with high school diploma education earn the least with $27,500. Women with an educational attainment of graduate degree earn the most with the average annual earnings of $53,750, while those with less than high school education have the smallest earnings of $20,774.
| Educational Attainment | Male Income | Female Income |
| Less than High School | - | - |
| High School Diploma | $27,500 | $0 |
| College or Associate's Degree | $30,750 | $40,110 |
| Bachelor's Degree | - | - |
| Graduate Degree | - | - |
| Total | $29,750 | $37,379 |
Family Income in Memphis
Family Income Brackets in Memphis
According to the Memphis family income data, there are 122 families falling into the $50,000 to $74,999 income range, which is the most common income bracket and makes up 20.2% of all families. Conversely, the less than $10,000 income bracket is the least frequent group with only 25 families (4.1%) belonging to this category.
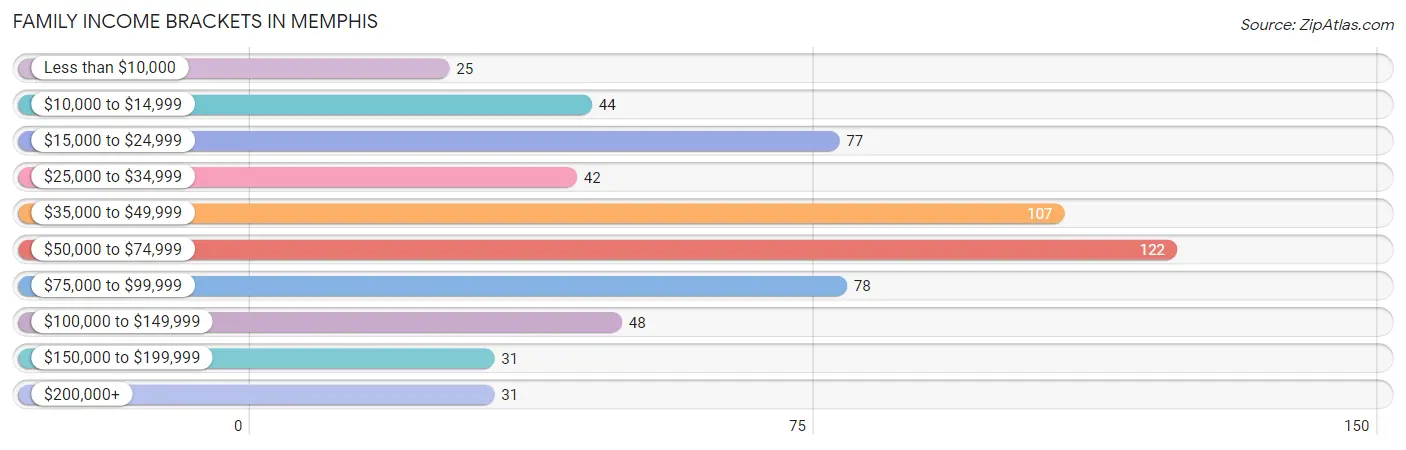
| Income Bracket | # Families | % Families |
| Less than $10,000 | 25 | 4.1% |
| $10,000 to $14,999 | 44 | 7.3% |
| $15,000 to $24,999 | 77 | 12.7% |
| $25,000 to $34,999 | 42 | 6.9% |
| $35,000 to $49,999 | 107 | 17.7% |
| $50,000 to $74,999 | 122 | 20.2% |
| $75,000 to $99,999 | 78 | 12.9% |
| $100,000 to $149,999 | 48 | 7.9% |
| $150,000 to $199,999 | 31 | 5.1% |
| $200,000+ | 31 | 5.1% |
Family Income by Famaliy Size in Memphis
5-person families (26 | 4.3%) account for the highest median family income in Memphis with $62,083 per family, while 2-person families (320 | 52.9%) have the highest median income of $25,714 per family member.
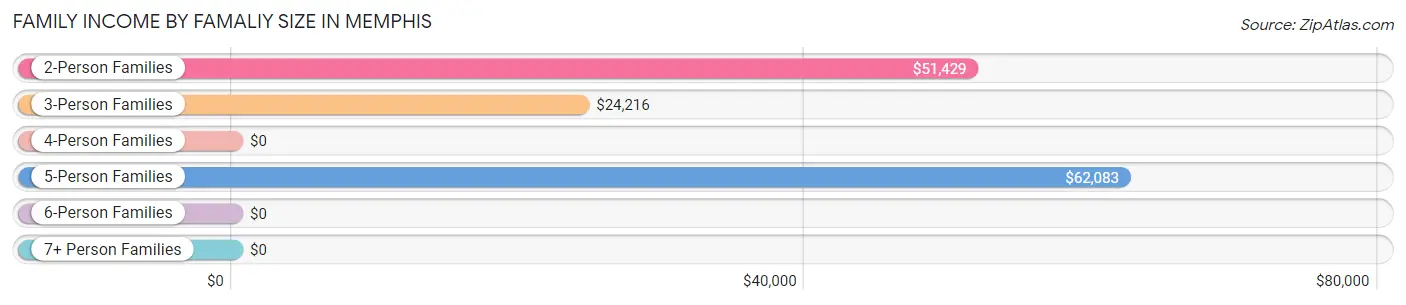
| Income Bracket | # Families | Median Income |
| 2-Person Families | 320 (52.9%) | $51,429 |
| 3-Person Families | 142 (23.5%) | $24,216 |
| 4-Person Families | 79 (13.1%) | $0 |
| 5-Person Families | 26 (4.3%) | $62,083 |
| 6-Person Families | 12 (2.0%) | $0 |
| 7+ Person Families | 26 (4.3%) | $0 |
| Total | 605 (100.0%) | $50,335 |
Family Income by Number of Earners in Memphis
The median family income in Memphis is $50,335, with families comprising 2 earners (181) having the highest median family income of $81,012, while families with no earners (128) have the lowest median family income of $24,825, accounting for 29.9% and 21.2% of families, respectively.
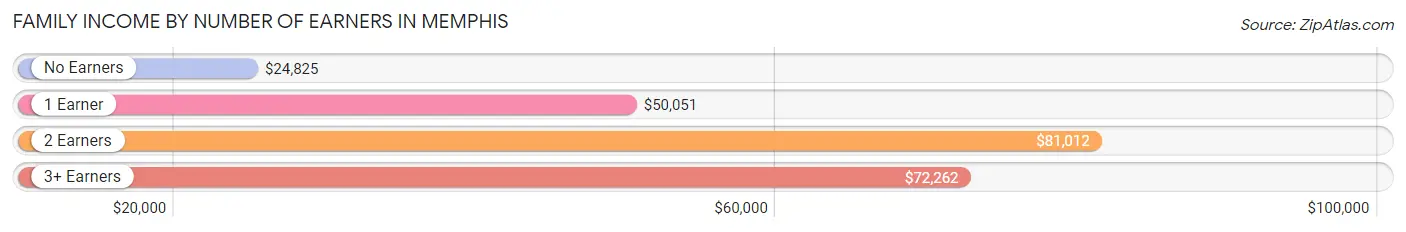
| Number of Earners | # Families | Median Income |
| No Earners | 128 (21.2%) | $24,825 |
| 1 Earner | 258 (42.6%) | $50,051 |
| 2 Earners | 181 (29.9%) | $81,012 |
| 3+ Earners | 38 (6.3%) | $72,262 |
| Total | 605 (100.0%) | $50,335 |
Household Income in Memphis
Household Income Brackets in Memphis
With 164 households falling in the category, the $15,000 to $24,999 income range is the most frequent in Memphis, accounting for 18.7% of all households. In contrast, only 31 households (3.5%) fall into the $150,000 to $199,999 income bracket, making it the least populous group.
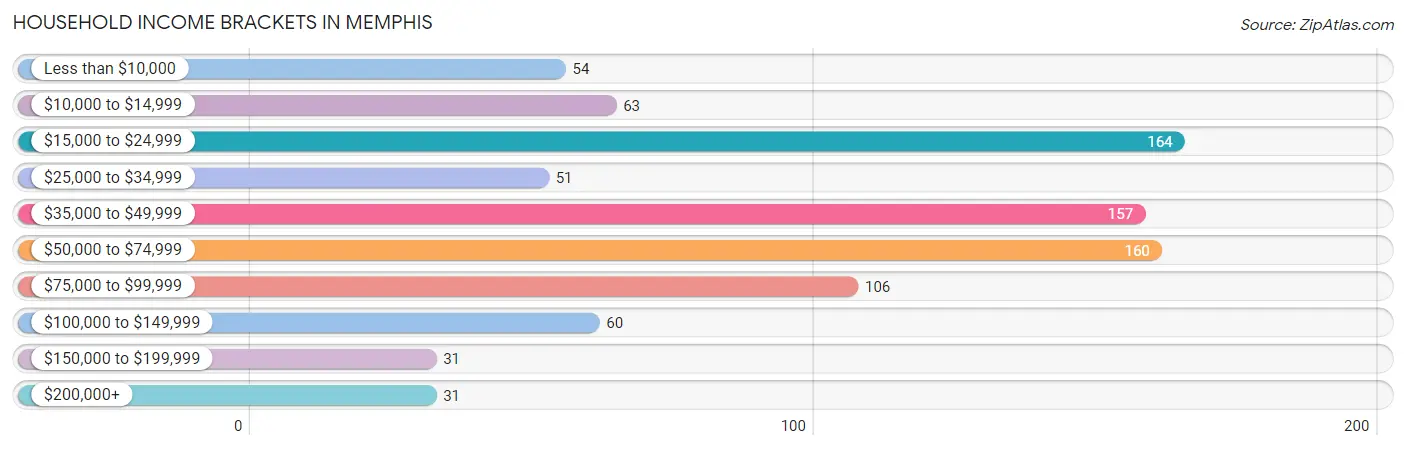
| Income Bracket | # Households | % Households |
| Less than $10,000 | 54 | 6.2% |
| $10,000 to $14,999 | 63 | 7.2% |
| $15,000 to $24,999 | 164 | 18.7% |
| $25,000 to $34,999 | 51 | 5.8% |
| $35,000 to $49,999 | 157 | 17.9% |
| $50,000 to $74,999 | 160 | 18.2% |
| $75,000 to $99,999 | 106 | 12.1% |
| $100,000 to $149,999 | 60 | 6.8% |
| $150,000 to $199,999 | 31 | 3.5% |
| $200,000+ | 31 | 3.5% |
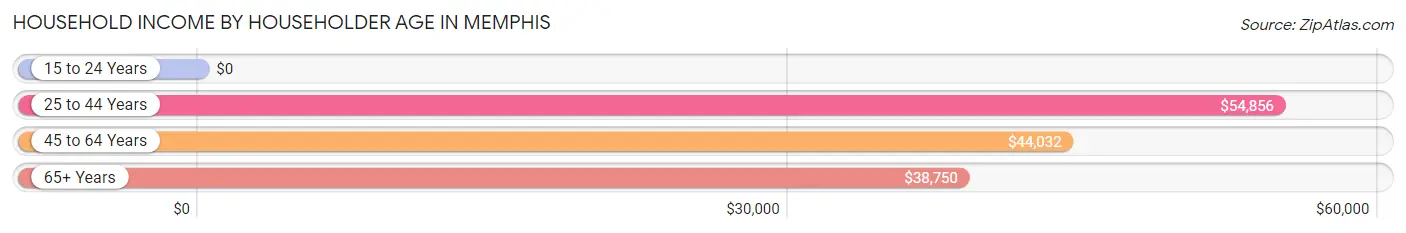
Household Income by Householder Age in Memphis
The median household income in Memphis is $43,901, with the highest median household income of $54,856 found in the 25 to 44 years age bracket for the primary householder. A total of 225 households (25.7%) fall into this category. Meanwhile, the 15 to 24 years age bracket for the primary householder has the lowest median household income of $0, with 48 households (5.5%) in this group.
| Income Bracket | # Households | Median Income |
| 15 to 24 Years | 48 (5.5%) | $0 |
| 25 to 44 Years | 225 (25.7%) | $54,856 |
| 45 to 64 Years | 356 (40.6%) | $44,032 |
| 65+ Years | 248 (28.3%) | $38,750 |
| Total | 877 (100.0%) | $43,901 |
Poverty in Memphis
Income Below Poverty by Sex and Age in Memphis
With 15.4% poverty level for males and 24.3% for females among the residents of Memphis, 5 year old males and 12 to 14 year old females are the most vulnerable to poverty, with 10 males (50.0%) and 22 females (71.0%) in their respective age groups living below the poverty level.
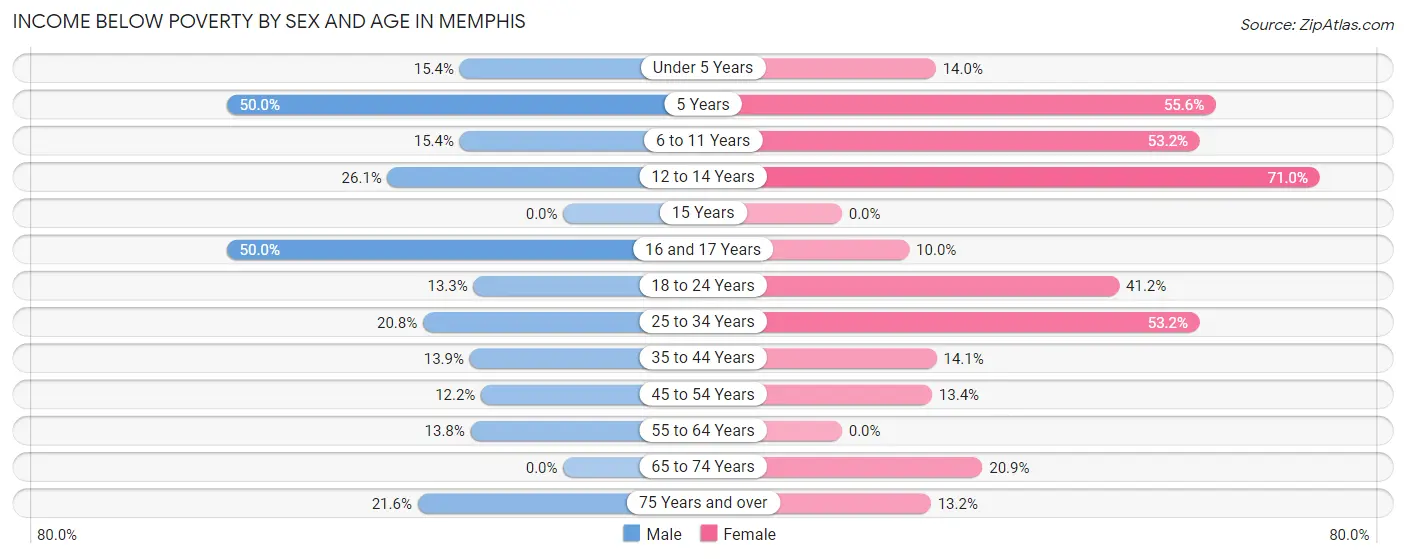
| Age Bracket | Male | Female |
| Under 5 Years | 10 (15.4%) | 6 (14.0%) |
| 5 Years | 10 (50.0%) | 5 (55.6%) |
| 6 to 11 Years | 10 (15.4%) | 67 (53.2%) |
| 12 to 14 Years | 12 (26.1%) | 22 (71.0%) |
| 15 Years | 0 (0.0%) | 0 (0.0%) |
| 16 and 17 Years | 10 (50.0%) | 3 (10.0%) |
| 18 to 24 Years | 14 (13.3%) | 28 (41.2%) |
| 25 to 34 Years | 20 (20.8%) | 59 (53.1%) |
| 35 to 44 Years | 10 (13.9%) | 19 (14.1%) |
| 45 to 54 Years | 15 (12.2%) | 19 (13.4%) |
| 55 to 64 Years | 23 (13.8%) | 0 (0.0%) |
| 65 to 74 Years | 0 (0.0%) | 34 (20.9%) |
| 75 Years and over | 16 (21.6%) | 7 (13.2%) |
| Total | 150 (15.4%) | 269 (24.3%) |
Income Above Poverty by Sex and Age in Memphis
According to the poverty statistics in Memphis, males aged 65 to 74 years and females aged 15 years are the age groups that are most secure financially, with 100.0% of males and 100.0% of females in these age groups living above the poverty line.
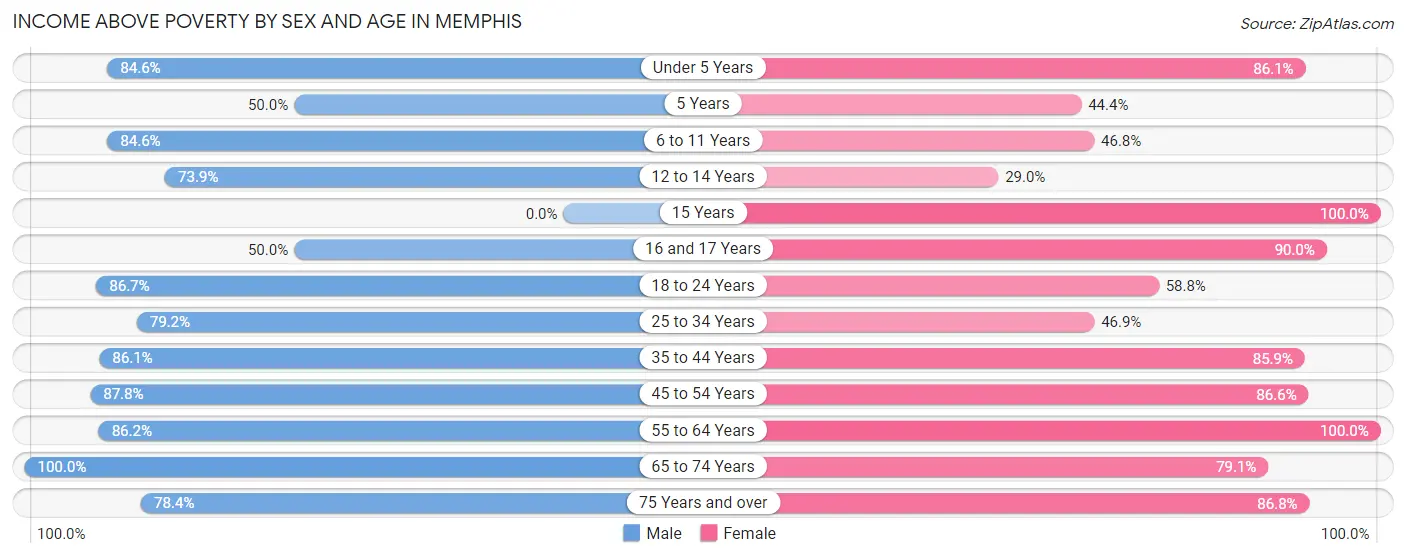
| Age Bracket | Male | Female |
| Under 5 Years | 55 (84.6%) | 37 (86.1%) |
| 5 Years | 10 (50.0%) | 4 (44.4%) |
| 6 to 11 Years | 55 (84.6%) | 59 (46.8%) |
| 12 to 14 Years | 34 (73.9%) | 9 (29.0%) |
| 15 Years | 0 (0.0%) | 47 (100.0%) |
| 16 and 17 Years | 10 (50.0%) | 27 (90.0%) |
| 18 to 24 Years | 91 (86.7%) | 40 (58.8%) |
| 25 to 34 Years | 76 (79.2%) | 52 (46.9%) |
| 35 to 44 Years | 62 (86.1%) | 116 (85.9%) |
| 45 to 54 Years | 108 (87.8%) | 123 (86.6%) |
| 55 to 64 Years | 144 (86.2%) | 148 (100.0%) |
| 65 to 74 Years | 119 (100.0%) | 129 (79.1%) |
| 75 Years and over | 58 (78.4%) | 46 (86.8%) |
| Total | 822 (84.6%) | 837 (75.7%) |
Income Below Poverty Among Married-Couple Families in Memphis
The poverty statistics for married-couple families in Memphis show that 12.3% or 46 of the total 373 families live below the poverty line. Families with 1 or 2 children have the highest poverty rate of 47.8%, comprising of 43 families. On the other hand, families with no children have the lowest poverty rate of 0.0%, which includes 0 families.
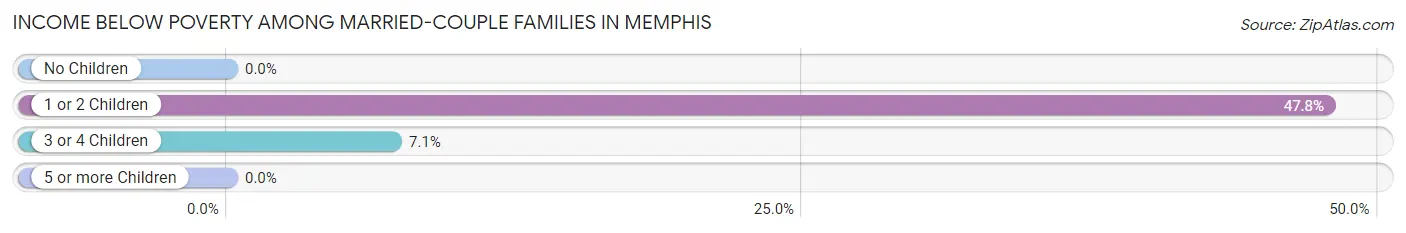
| Children | Above Poverty | Below Poverty |
| No Children | 241 (100.0%) | 0 (0.0%) |
| 1 or 2 Children | 47 (52.2%) | 43 (47.8%) |
| 3 or 4 Children | 39 (92.9%) | 3 (7.1%) |
| 5 or more Children | 0 (0.0%) | 0 (0.0%) |
| Total | 327 (87.7%) | 46 (12.3%) |
Income Below Poverty Among Single-Parent Households in Memphis
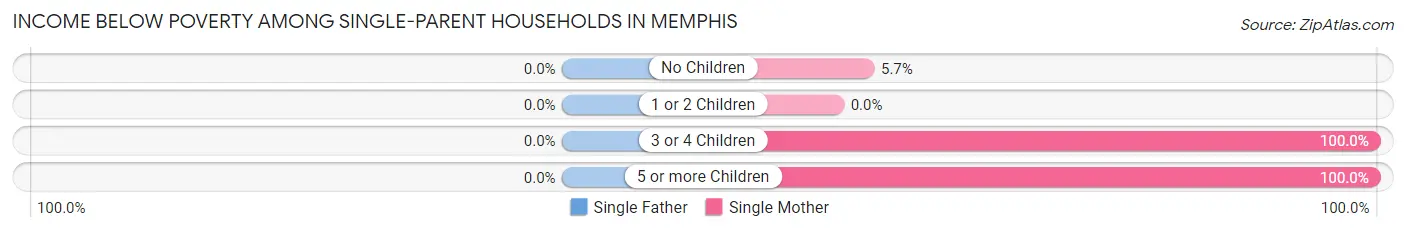
| Children | Single Father | Single Mother |
| No Children | 0 (0.0%) | 3 (5.7%) |
| 1 or 2 Children | 0 (0.0%) | 0 (0.0%) |
| 3 or 4 Children | 0 (0.0%) | 28 (100.0%) |
| 5 or more Children | 0 (0.0%) | 5 (100.0%) |
| Total | 0 (0.0%) | 36 (28.3%) |
Income Below Poverty Among Married-Couple vs Single-Parent Households in Memphis
The poverty data for Memphis shows that 46 of the married-couple family households (12.3%) and 36 of the single-parent households (15.5%) are living below the poverty level. Within the married-couple family households, those with 1 or 2 children have the highest poverty rate, with 43 households (47.8%) falling below the poverty line. Among the single-parent households, those with 3 or 4 children have the highest poverty rate, with 28 household (100.0%) living below poverty.
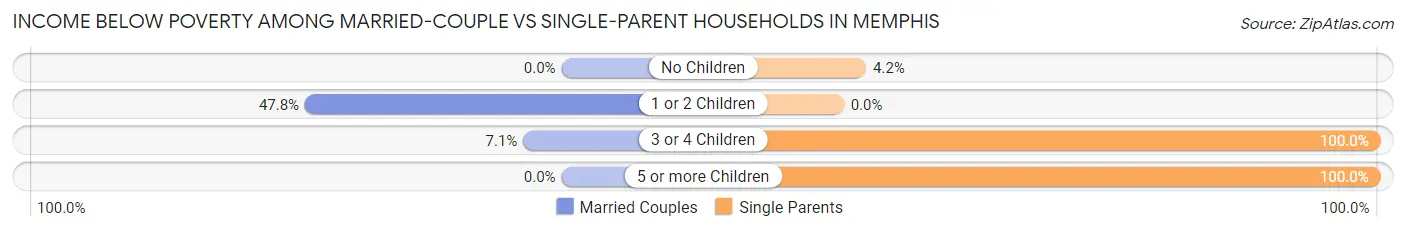
| Children | Married-Couple Families | Single-Parent Households |
| No Children | 0 (0.0%) | 3 (4.2%) |
| 1 or 2 Children | 43 (47.8%) | 0 (0.0%) |
| 3 or 4 Children | 3 (7.1%) | 28 (100.0%) |
| 5 or more Children | 0 (0.0%) | 5 (100.0%) |
| Total | 46 (12.3%) | 36 (15.5%) |
Race in Memphis
The most populous races in Memphis are White / Caucasian (1,412 | 66.3%), Hispanic or Latino (762 | 35.8%), and Two or more Races (346 | 16.2%).
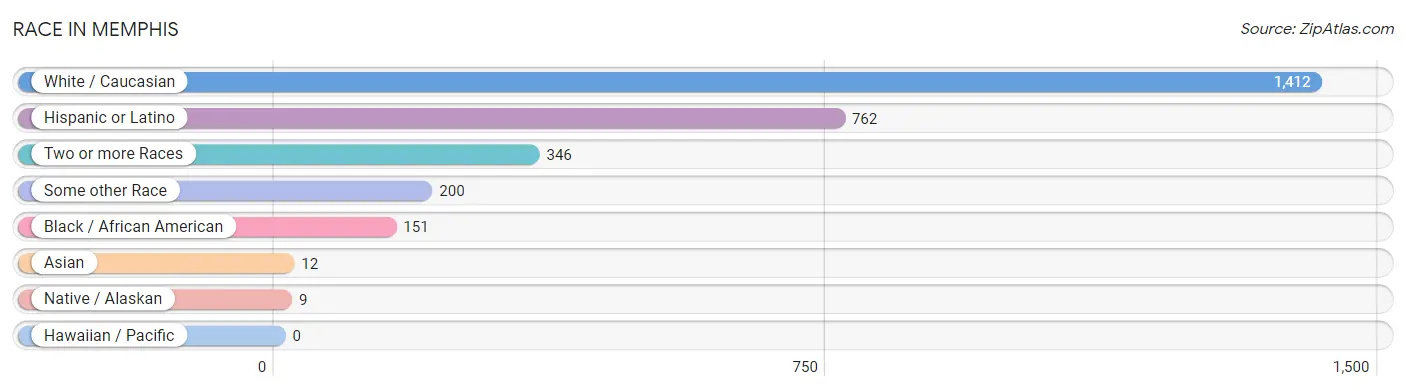
| Race | # Population | % Population |
| Asian | 12 | 0.6% |
| Black / African American | 151 | 7.1% |
| Hawaiian / Pacific | 0 | 0.0% |
| Hispanic or Latino | 762 | 35.8% |
| Native / Alaskan | 9 | 0.4% |
| White / Caucasian | 1,412 | 66.3% |
| Two or more Races | 346 | 16.2% |
| Some other Race | 200 | 9.4% |
| Total | 2,130 | 100.0% |
Ancestry in Memphis
The most populous ancestries reported in Memphis are Mexican (631 | 29.6%), English (288 | 13.5%), Irish (180 | 8.5%), German (154 | 7.2%), and American (87 | 4.1%), together accounting for 62.9% of all Memphis residents.
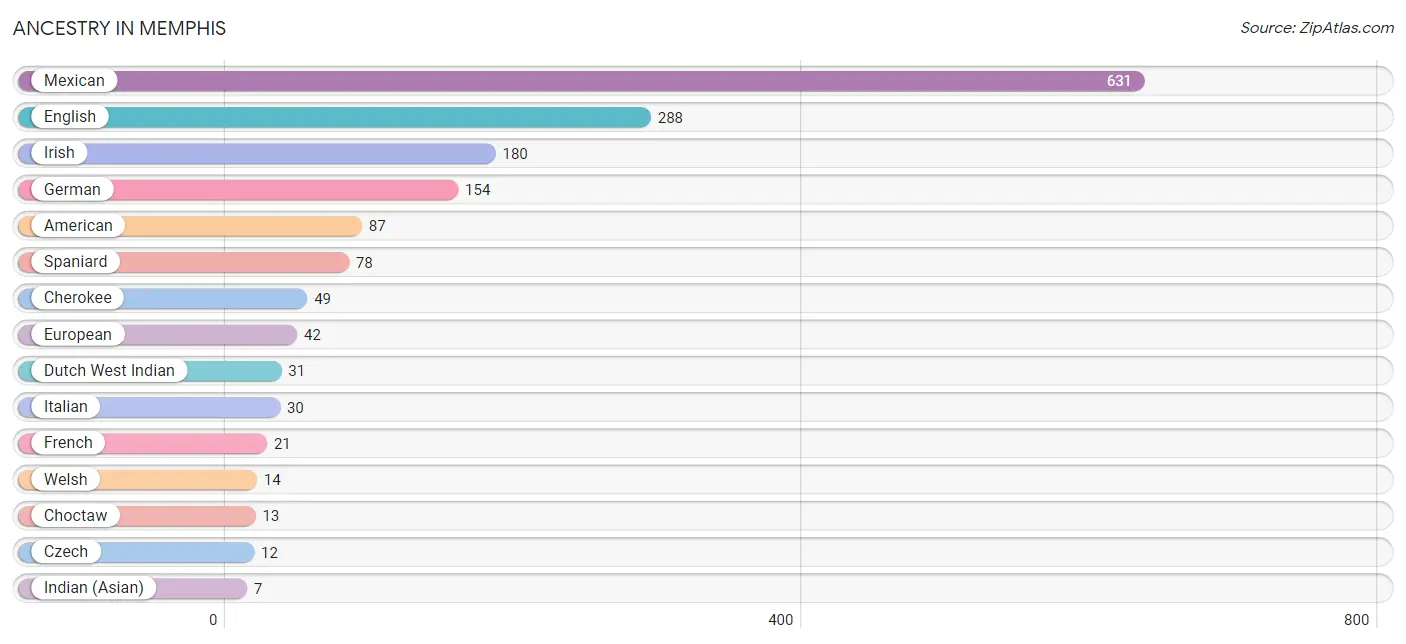
| Ancestry | # Population | % Population |
| American | 87 | 4.1% |
| British | 4 | 0.2% |
| Cherokee | 49 | 2.3% |
| Choctaw | 13 | 0.6% |
| Czech | 12 | 0.6% |
| Dutch West Indian | 31 | 1.5% |
| English | 288 | 13.5% |
| European | 42 | 2.0% |
| French | 21 | 1.0% |
| German | 154 | 7.2% |
| Indian (Asian) | 7 | 0.3% |
| Irish | 180 | 8.5% |
| Italian | 30 | 1.4% |
| Laotian | 3 | 0.1% |
| Mexican | 631 | 29.6% |
| Mexican American Indian | 7 | 0.3% |
| Polish | 3 | 0.1% |
| Russian | 7 | 0.3% |
| Scandinavian | 6 | 0.3% |
| Scottish | 4 | 0.2% |
| Spaniard | 78 | 3.7% |
| Sri Lankan | 7 | 0.3% |
| Welsh | 14 | 0.7% | View All 23 Rows |
Immigrants in Memphis
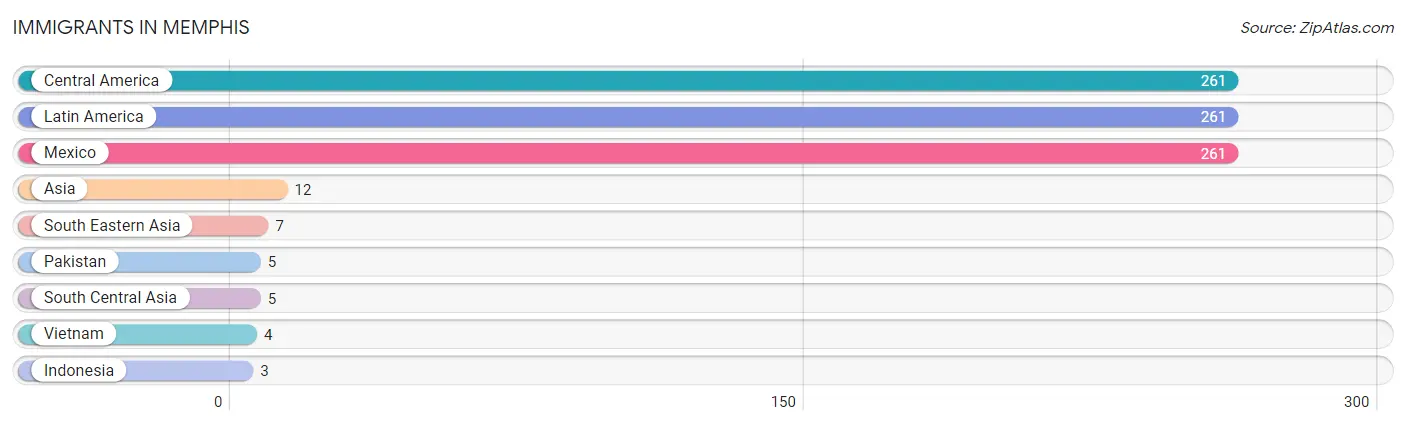
The most numerous immigrant groups reported in Memphis came from Central America (261 | 12.2%), Latin America (261 | 12.2%), Mexico (261 | 12.2%), Asia (12 | 0.6%), and South Eastern Asia (7 | 0.3%), together accounting for 37.6% of all Memphis residents.
| Immigration Origin | # Population | % Population |
| Asia | 12 | 0.6% |
| Central America | 261 | 12.2% |
| Indonesia | 3 | 0.1% |
| Latin America | 261 | 12.2% |
| Mexico | 261 | 12.2% |
| Pakistan | 5 | 0.2% |
| South Central Asia | 5 | 0.2% |
| South Eastern Asia | 7 | 0.3% |
| Vietnam | 4 | 0.2% | View All 9 Rows |
Sex and Age in Memphis
Sex and Age in Memphis
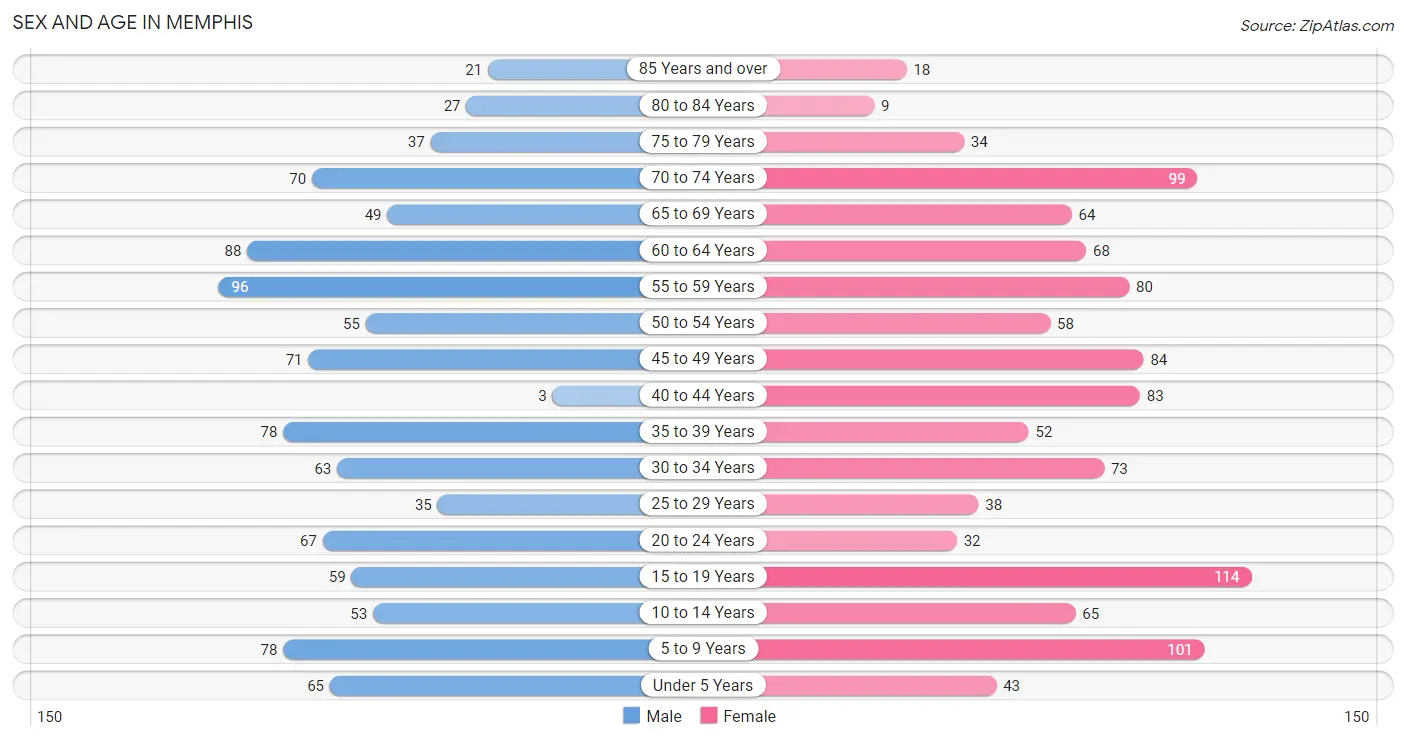
The most populous age groups in Memphis are 55 to 59 Years (96 | 9.5%) for men and 15 to 19 Years (114 | 10.2%) for women.
| Age Bracket | Male | Female |
| Under 5 Years | 65 (6.4%) | 43 (3.9%) |
| 5 to 9 Years | 78 (7.7%) | 101 (9.1%) |
| 10 to 14 Years | 53 (5.2%) | 65 (5.8%) |
| 15 to 19 Years | 59 (5.8%) | 114 (10.2%) |
| 20 to 24 Years | 67 (6.6%) | 32 (2.9%) |
| 25 to 29 Years | 35 (3.5%) | 38 (3.4%) |
| 30 to 34 Years | 63 (6.2%) | 73 (6.6%) |
| 35 to 39 Years | 78 (7.7%) | 52 (4.7%) |
| 40 to 44 Years | 3 (0.3%) | 83 (7.4%) |
| 45 to 49 Years | 71 (7.0%) | 84 (7.5%) |
| 50 to 54 Years | 55 (5.4%) | 58 (5.2%) |
| 55 to 59 Years | 96 (9.5%) | 80 (7.2%) |
| 60 to 64 Years | 88 (8.7%) | 68 (6.1%) |
| 65 to 69 Years | 49 (4.8%) | 64 (5.7%) |
| 70 to 74 Years | 70 (6.9%) | 99 (8.9%) |
| 75 to 79 Years | 37 (3.6%) | 34 (3.0%) |
| 80 to 84 Years | 27 (2.7%) | 9 (0.8%) |
| 85 Years and over | 21 (2.1%) | 18 (1.6%) |
| Total | 1,015 (100.0%) | 1,115 (100.0%) |
Families and Households in Memphis
Median Family Size in Memphis
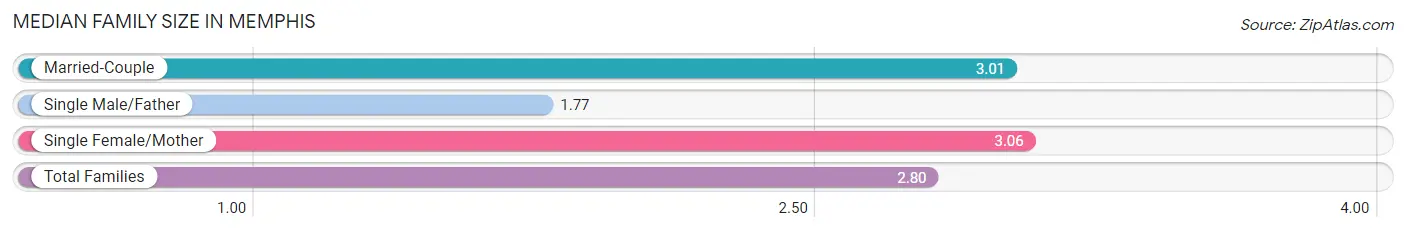
The median family size in Memphis is 2.80 persons per family, with single female/mother families (127 | 21.0%) accounting for the largest median family size of 3.06 persons per family. On the other hand, single male/father families (105 | 17.4%) represent the smallest median family size with 1.77 persons per family.
| Family Type | # Families | Family Size |
| Married-Couple | 373 (61.7%) | 3.01 |
| Single Male/Father | 105 (17.4%) | 1.77 |
| Single Female/Mother | 127 (21.0%) | 3.06 |
| Total Families | 605 (100.0%) | 2.80 |
Median Household Size in Memphis
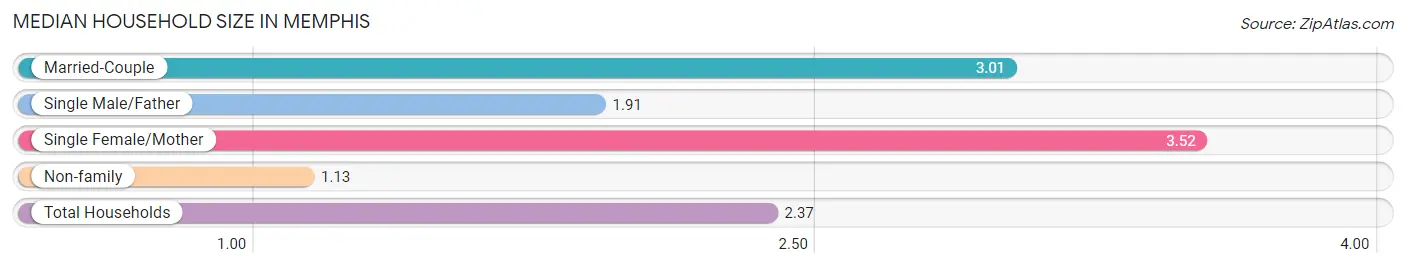
The median household size in Memphis is 2.37 persons per household, with single female/mother households (127 | 14.5%) accounting for the largest median household size of 3.52 persons per household. non-family households (272 | 31.0%) represent the smallest median household size with 1.13 persons per household.
| Household Type | # Households | Household Size |
| Married-Couple | 373 (42.5%) | 3.01 |
| Single Male/Father | 105 (12.0%) | 1.91 |
| Single Female/Mother | 127 (14.5%) | 3.52 |
| Non-family | 272 (31.0%) | 1.13 |
| Total Households | 877 (100.0%) | 2.37 |
Household Size by Marriage Status in Memphis
Out of a total of 877 households in Memphis, 605 (69.0%) are family households, while 272 (31.0%) are nonfamily households. The most numerous type of family households are 2-person households, comprising 259, and the most common type of nonfamily households are 1-person households, comprising 253.
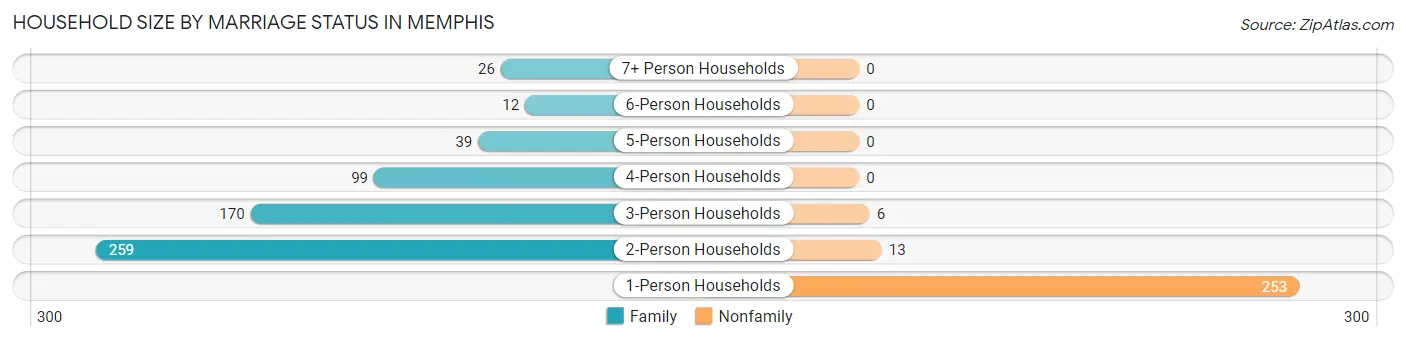
| Household Size | Family Households | Nonfamily Households |
| 1-Person Households | - | 253 (28.8%) |
| 2-Person Households | 259 (29.5%) | 13 (1.5%) |
| 3-Person Households | 170 (19.4%) | 6 (0.7%) |
| 4-Person Households | 99 (11.3%) | 0 (0.0%) |
| 5-Person Households | 39 (4.4%) | 0 (0.0%) |
| 6-Person Households | 12 (1.4%) | 0 (0.0%) |
| 7+ Person Households | 26 (3.0%) | 0 (0.0%) |
| Total | 605 (69.0%) | 272 (31.0%) |
Female Fertility in Memphis
Fertility by Age in Memphis
Average fertility rate in Memphis is 39.0 births per 1,000 women. Women in the age bracket of 35 to 50 years have the highest fertility rate with 61.0 births per 1,000 women. Women in the age bracket of 35 to 50 years acount for 73.7% of all women with births.
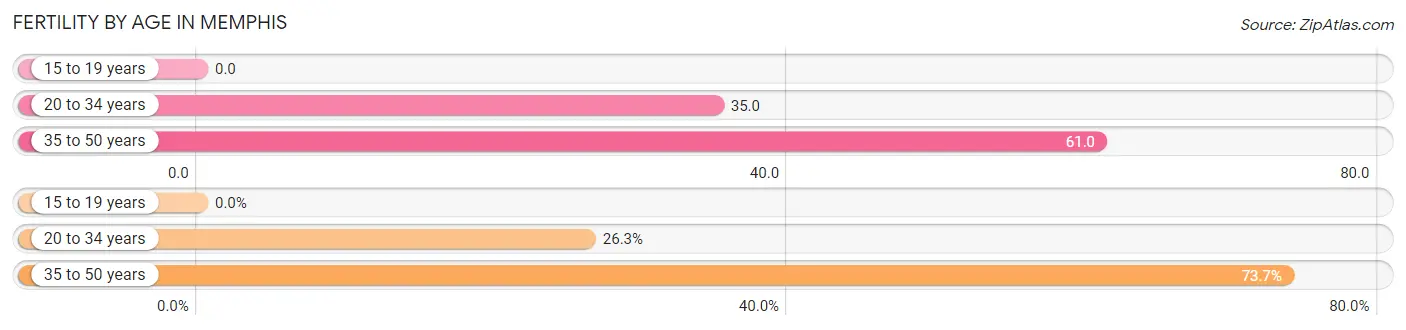
| Age Bracket | Women with Births | Births / 1,000 Women |
| 15 to 19 years | 0 (0.0%) | 0.0 |
| 20 to 34 years | 5 (26.3%) | 35.0 |
| 35 to 50 years | 14 (73.7%) | 61.0 |
| Total | 19 (100.0%) | 39.0 |
Fertility by Age by Marriage Status in Memphis
73.7% of women with births (19) in Memphis are married. The highest percentage of unmarried women with births falls into 20 to 34 years age bracket with 100.0% of them unmarried at the time of birth, while the lowest percentage of unmarried women with births belong to 35 to 50 years age bracket with 0.0% of them unmarried.
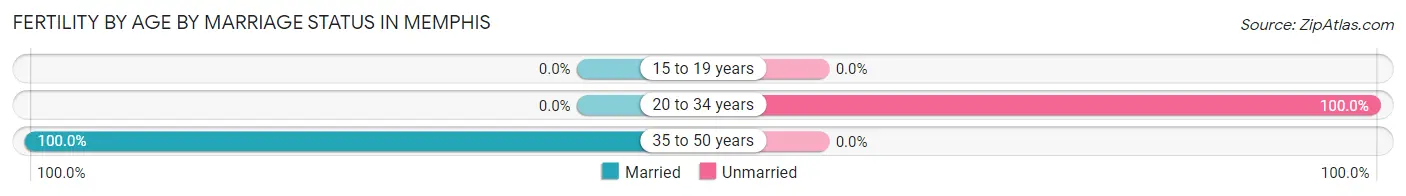
| Age Bracket | Married | Unmarried |
| 15 to 19 years | 0 (0.0%) | 0 (0.0%) |
| 20 to 34 years | 0 (0.0%) | 5 (100.0%) |
| 35 to 50 years | 14 (100.0%) | 0 (0.0%) |
| Total | 14 (73.7%) | 5 (26.3%) |
Fertility by Education in Memphis
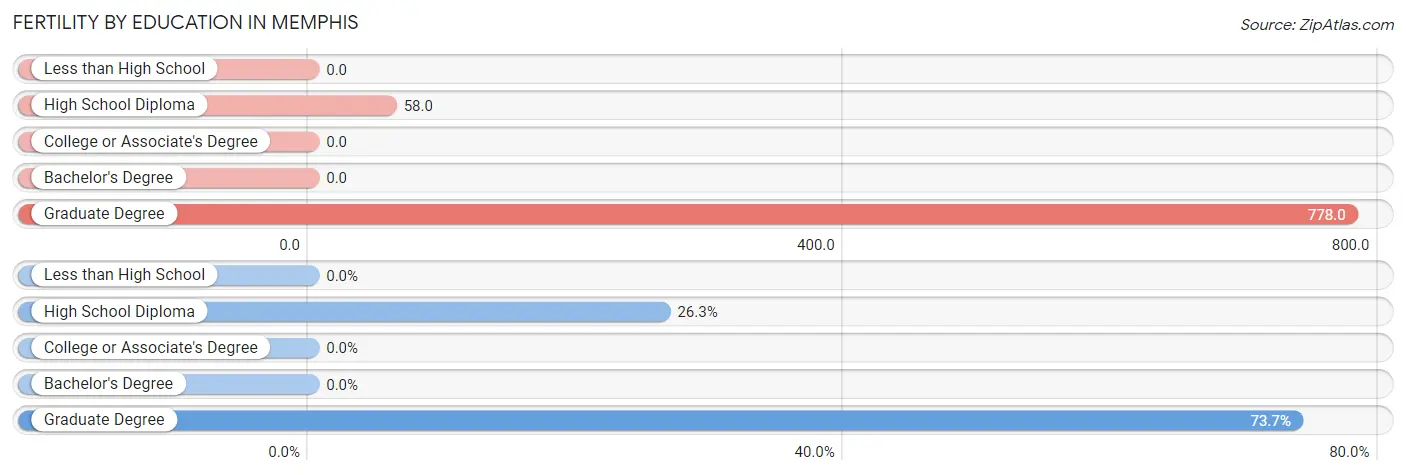
| Educational Attainment | Women with Births | Births / 1,000 Women |
| Less than High School | 0 (0.0%) | 0.0 |
| High School Diploma | 5 (26.3%) | 58.0 |
| College or Associate's Degree | 0 (0.0%) | 0.0 |
| Bachelor's Degree | 0 (0.0%) | 0.0 |
| Graduate Degree | 14 (73.7%) | 778.0 |
| Total | 19 (100.0%) | 39.0 |
Fertility by Education by Marriage Status in Memphis
26.3% of women with births in Memphis are unmarried. Women with the educational attainment of graduate degree are most likely to be married with 100.0% of them married at childbirth, while women with the educational attainment of high school diploma are least likely to be married with 100.0% of them unmarried at childbirth.
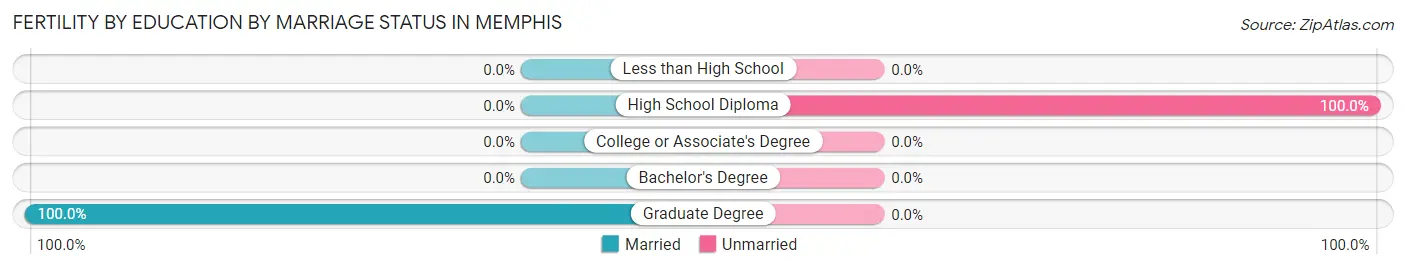
| Educational Attainment | Married | Unmarried |
| Less than High School | 0 (0.0%) | 0 (0.0%) |
| High School Diploma | 0 (0.0%) | 5 (100.0%) |
| College or Associate's Degree | 0 (0.0%) | 0 (0.0%) |
| Bachelor's Degree | 0 (0.0%) | 0 (0.0%) |
| Graduate Degree | 14 (100.0%) | 0 (0.0%) |
| Total | 14 (73.7%) | 5 (26.3%) |
Employment Characteristics in Memphis
Employment by Class of Employer in Memphis
Among the 821 employed individuals in Memphis, private company employees (418 | 50.9%), self-employed (not incorporated) (110 | 13.4%), and local government employees (90 | 11.0%) make up the most common classes of employment.
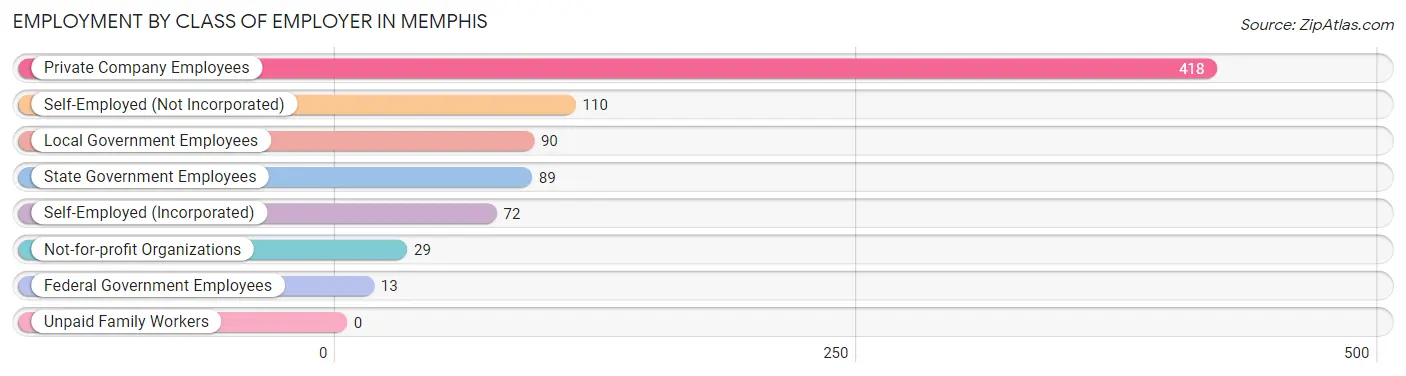
| Employer Class | # Employees | % Employees |
| Private Company Employees | 418 | 50.9% |
| Self-Employed (Incorporated) | 72 | 8.8% |
| Self-Employed (Not Incorporated) | 110 | 13.4% |
| Not-for-profit Organizations | 29 | 3.5% |
| Local Government Employees | 90 | 11.0% |
| State Government Employees | 89 | 10.8% |
| Federal Government Employees | 13 | 1.6% |
| Unpaid Family Workers | 0 | 0.0% |
| Total | 821 | 100.0% |
Employment Status by Age in Memphis
According to the labor force statistics for Memphis, out of the total population over 16 years of age (1,678), 54.5% or 915 individuals are in the labor force, with 9.1% or 83 of them unemployed. The age group with the highest labor force participation rate is 20 to 24 years, with 98.0% or 97 individuals in the labor force. Within the labor force, the 25 to 29 years age range has the highest percentage of unemployed individuals, with 31.8% or 21 of them being unemployed.
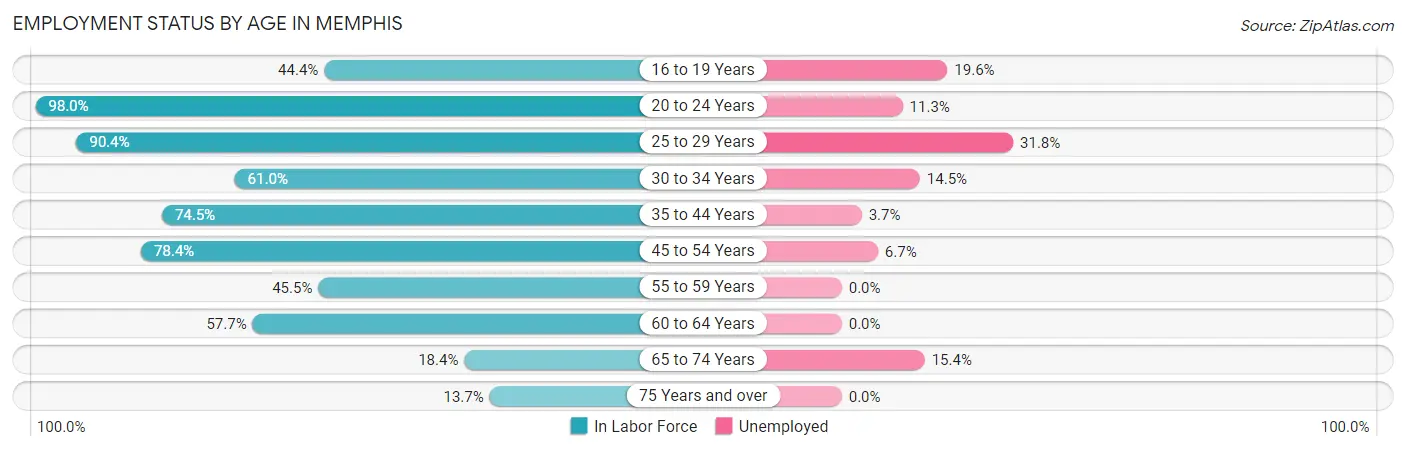
| Age Bracket | In Labor Force | Unemployed |
| 16 to 19 Years | 56 (44.4%) | 11 (19.6%) |
| 20 to 24 Years | 97 (98.0%) | 11 (11.3%) |
| 25 to 29 Years | 66 (90.4%) | 21 (31.8%) |
| 30 to 34 Years | 83 (61.0%) | 12 (14.5%) |
| 35 to 44 Years | 161 (74.5%) | 6 (3.7%) |
| 45 to 54 Years | 210 (78.4%) | 14 (6.7%) |
| 55 to 59 Years | 80 (45.5%) | 0 (0.0%) |
| 60 to 64 Years | 90 (57.7%) | 0 (0.0%) |
| 65 to 74 Years | 52 (18.4%) | 8 (15.4%) |
| 75 Years and over | 20 (13.7%) | 0 (0.0%) |
| Total | 915 (54.5%) | 83 (9.1%) |
Employment Status by Educational Attainment in Memphis
According to labor force statistics for Memphis, 67.3% of individuals (690) out of the total population between 25 and 64 years of age (1,025) are in the labor force, with 7.7% or 53 of them being unemployed. The group with the highest labor force participation rate are those with the educational attainment of bachelor's degree or higher, with 98.0% or 144 individuals in the labor force. Within the labor force, individuals with high school diploma education have the highest percentage of unemployment, with 16.7% or 29 of them being unemployed.
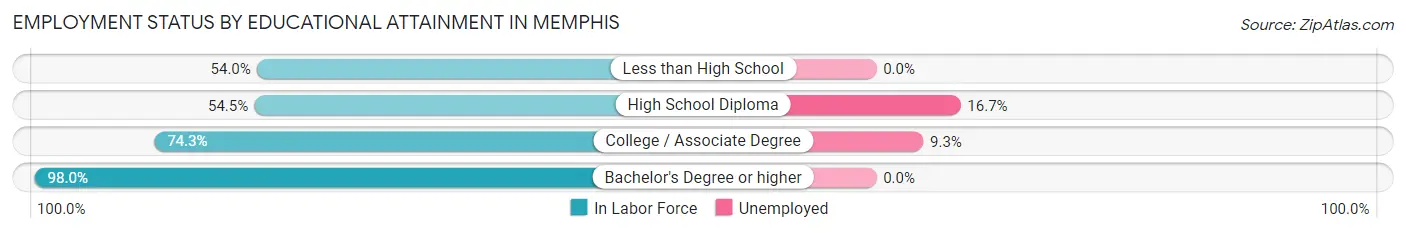
| Educational Attainment | In Labor Force | Unemployed |
| Less than High School | 115 (54.0%) | 0 (0.0%) |
| High School Diploma | 174 (54.5%) | 53 (16.7%) |
| College / Associate Degree | 257 (74.3%) | 32 (9.3%) |
| Bachelor's Degree or higher | 144 (98.0%) | 0 (0.0%) |
| Total | 690 (67.3%) | 79 (7.7%) |
Employment Occupations by Sex in Memphis
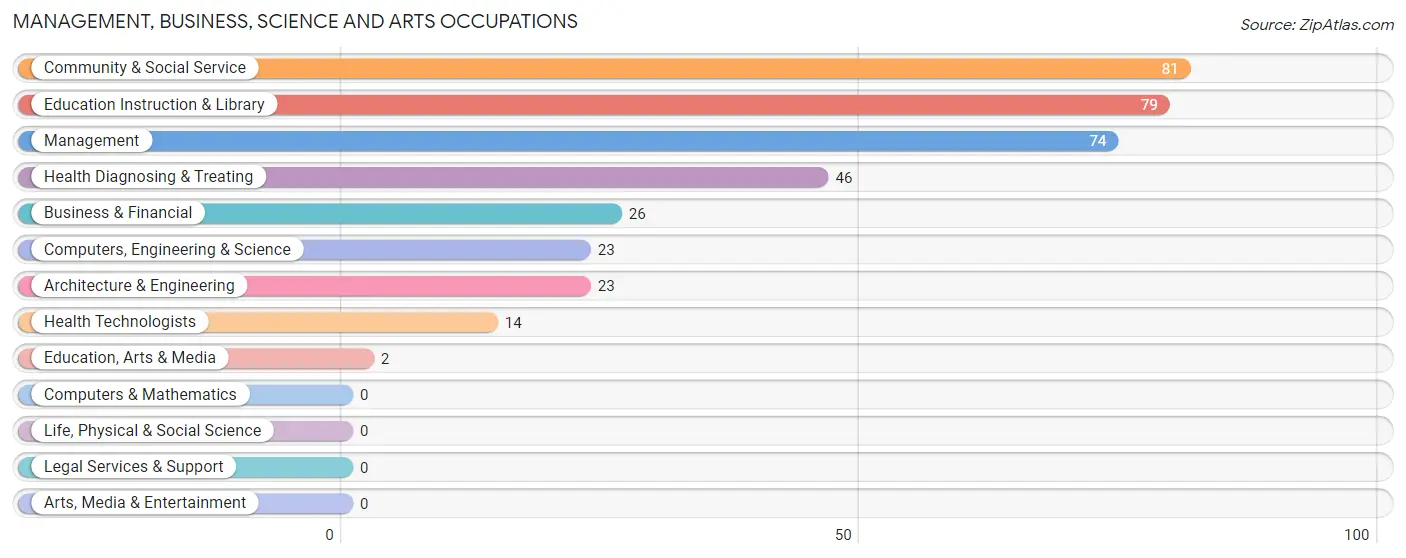
Management, Business, Science and Arts Occupations
The most common Management, Business, Science and Arts occupations in Memphis are Community & Social Service (81 | 9.7%), Education Instruction & Library (79 | 9.5%), Management (74 | 8.9%), Health Diagnosing & Treating (46 | 5.5%), and Business & Financial (26 | 3.1%).
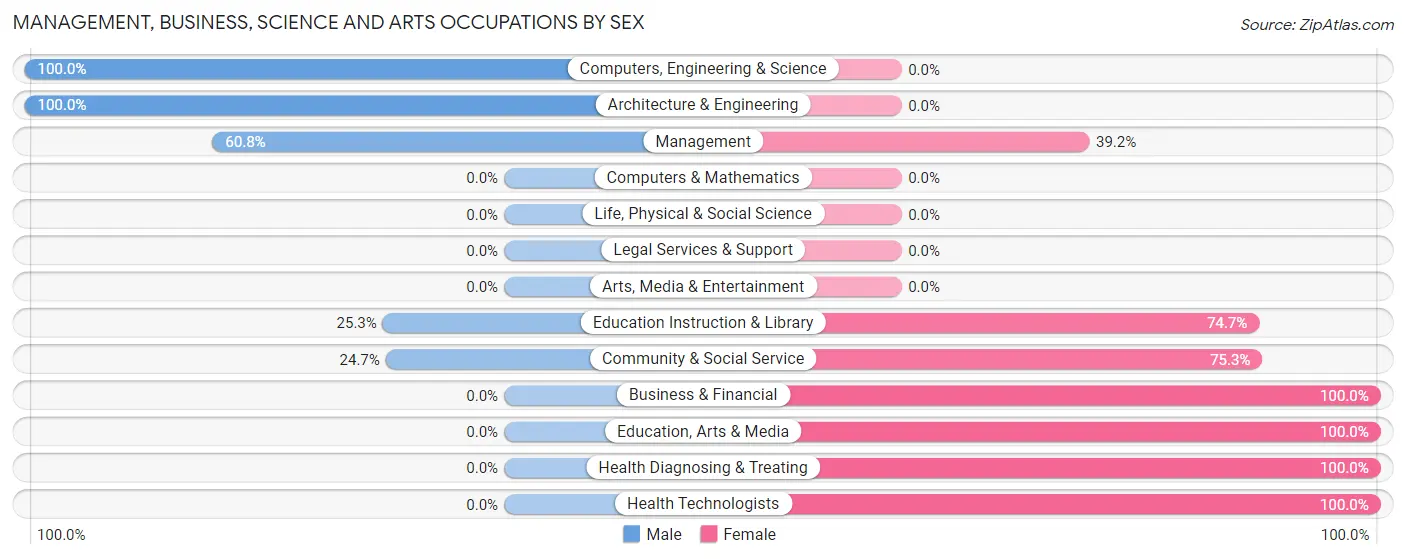
Management, Business, Science and Arts Occupations by Sex
Within the Management, Business, Science and Arts occupations in Memphis, the most male-oriented occupations are Computers, Engineering & Science (100.0%), Architecture & Engineering (100.0%), and Management (60.8%), while the most female-oriented occupations are Business & Financial (100.0%), Education, Arts & Media (100.0%), and Health Diagnosing & Treating (100.0%).
| Occupation | Male | Female |
| Management | 45 (60.8%) | 29 (39.2%) |
| Business & Financial | 0 (0.0%) | 26 (100.0%) |
| Computers, Engineering & Science | 23 (100.0%) | 0 (0.0%) |
| Computers & Mathematics | 0 (0.0%) | 0 (0.0%) |
| Architecture & Engineering | 23 (100.0%) | 0 (0.0%) |
| Life, Physical & Social Science | 0 (0.0%) | 0 (0.0%) |
| Community & Social Service | 20 (24.7%) | 61 (75.3%) |
| Education, Arts & Media | 0 (0.0%) | 2 (100.0%) |
| Legal Services & Support | 0 (0.0%) | 0 (0.0%) |
| Education Instruction & Library | 20 (25.3%) | 59 (74.7%) |
| Arts, Media & Entertainment | 0 (0.0%) | 0 (0.0%) |
| Health Diagnosing & Treating | 0 (0.0%) | 46 (100.0%) |
| Health Technologists | 0 (0.0%) | 14 (100.0%) |
| Total (Category) | 88 (35.2%) | 162 (64.8%) |
| Total (Overall) | 401 (48.2%) | 431 (51.8%) |
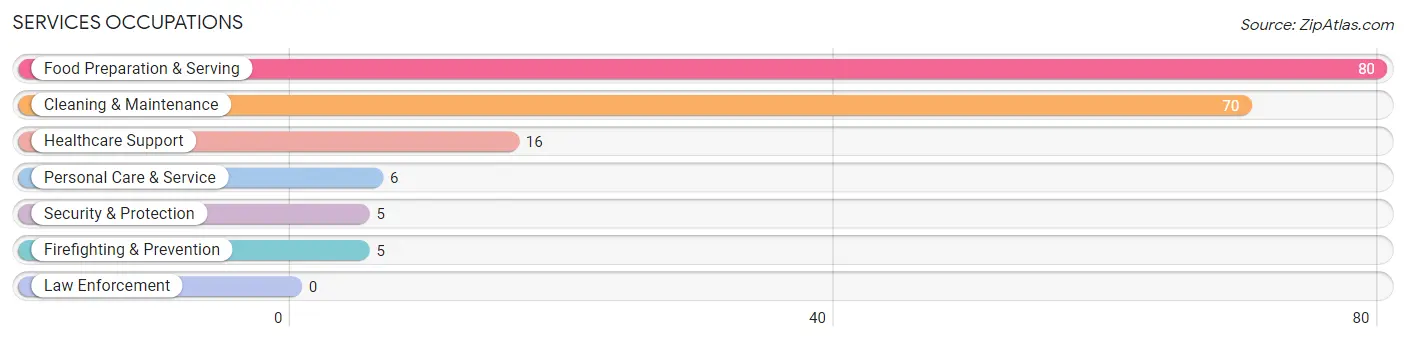
Services Occupations
The most common Services occupations in Memphis are Food Preparation & Serving (80 | 9.6%), Cleaning & Maintenance (70 | 8.4%), Healthcare Support (16 | 1.9%), Personal Care & Service (6 | 0.7%), and Security & Protection (5 | 0.6%).
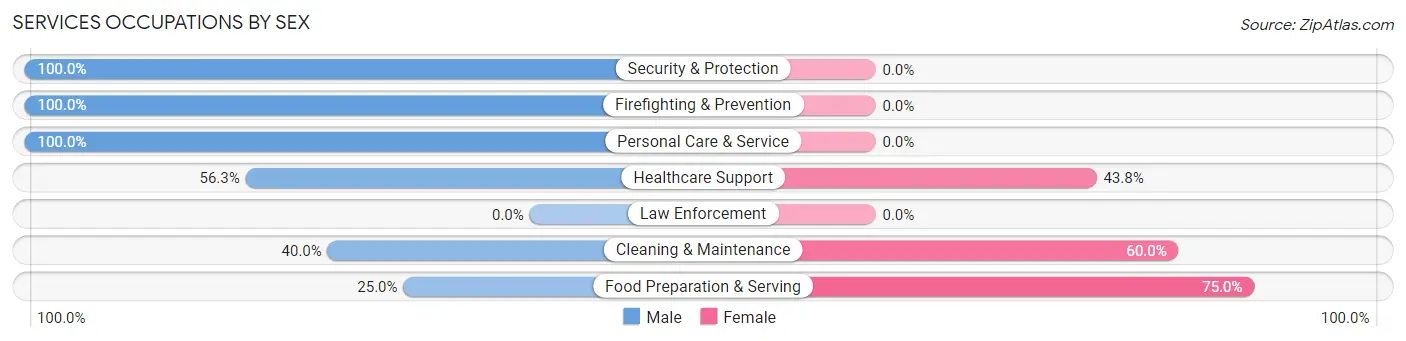
Services Occupations by Sex
Within the Services occupations in Memphis, the most male-oriented occupations are Security & Protection (100.0%), Firefighting & Prevention (100.0%), and Personal Care & Service (100.0%), while the most female-oriented occupations are Food Preparation & Serving (75.0%), Cleaning & Maintenance (60.0%), and Healthcare Support (43.8%).
| Occupation | Male | Female |
| Healthcare Support | 9 (56.2%) | 7 (43.8%) |
| Security & Protection | 5 (100.0%) | 0 (0.0%) |
| Firefighting & Prevention | 5 (100.0%) | 0 (0.0%) |
| Law Enforcement | 0 (0.0%) | 0 (0.0%) |
| Food Preparation & Serving | 20 (25.0%) | 60 (75.0%) |
| Cleaning & Maintenance | 28 (40.0%) | 42 (60.0%) |
| Personal Care & Service | 6 (100.0%) | 0 (0.0%) |
| Total (Category) | 68 (38.4%) | 109 (61.6%) |
| Total (Overall) | 401 (48.2%) | 431 (51.8%) |
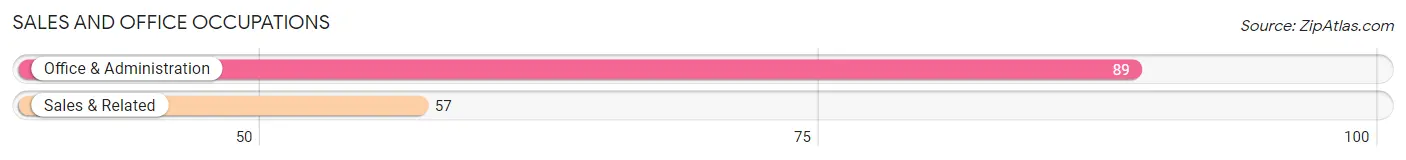
Sales and Office Occupations
The most common Sales and Office occupations in Memphis are Office & Administration (89 | 10.7%), and Sales & Related (57 | 6.9%).
Sales and Office Occupations by Sex
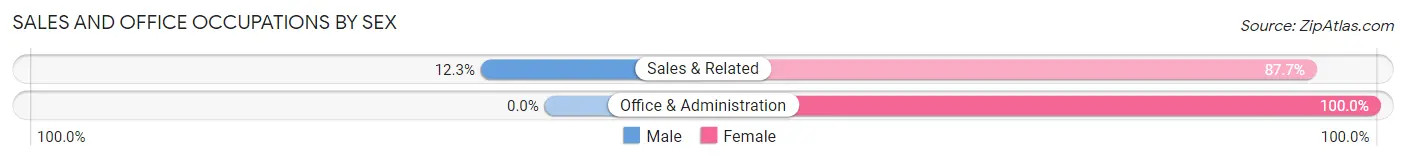
| Occupation | Male | Female |
| Sales & Related | 7 (12.3%) | 50 (87.7%) |
| Office & Administration | 0 (0.0%) | 89 (100.0%) |
| Total (Category) | 7 (4.8%) | 139 (95.2%) |
| Total (Overall) | 401 (48.2%) | 431 (51.8%) |
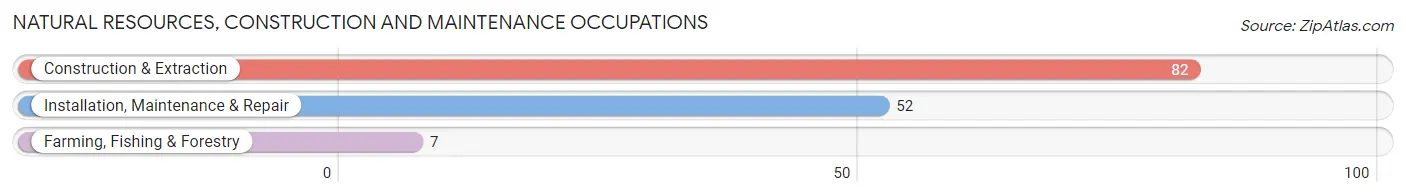
Natural Resources, Construction and Maintenance Occupations
The most common Natural Resources, Construction and Maintenance occupations in Memphis are Construction & Extraction (82 | 9.9%), Installation, Maintenance & Repair (52 | 6.2%), and Farming, Fishing & Forestry (7 | 0.8%).
Natural Resources, Construction and Maintenance Occupations by Sex
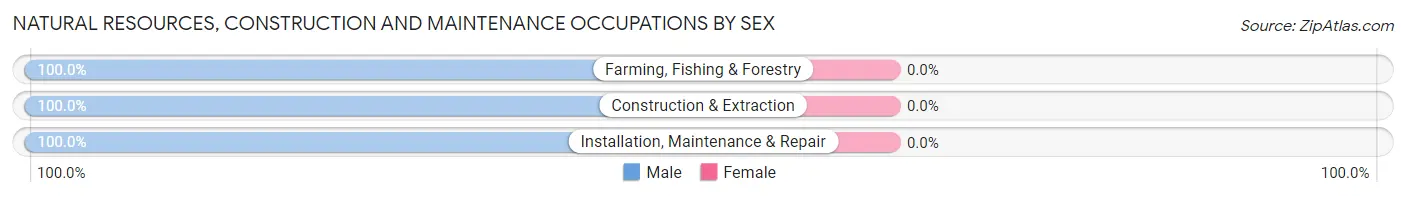
| Occupation | Male | Female |
| Farming, Fishing & Forestry | 7 (100.0%) | 0 (0.0%) |
| Construction & Extraction | 82 (100.0%) | 0 (0.0%) |
| Installation, Maintenance & Repair | 52 (100.0%) | 0 (0.0%) |
| Total (Category) | 141 (100.0%) | 0 (0.0%) |
| Total (Overall) | 401 (48.2%) | 431 (51.8%) |
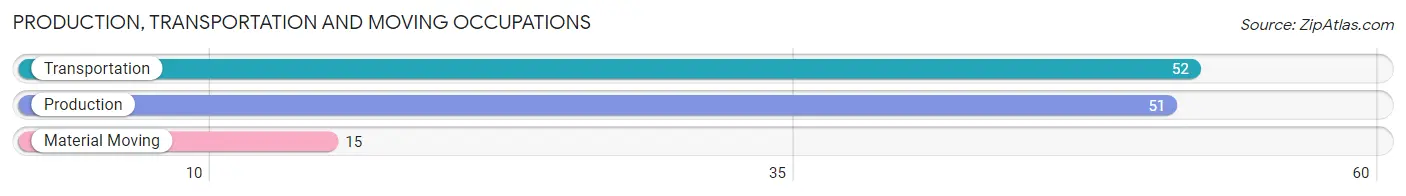
Production, Transportation and Moving Occupations
The most common Production, Transportation and Moving occupations in Memphis are Transportation (52 | 6.2%), Production (51 | 6.1%), and Material Moving (15 | 1.8%).
Production, Transportation and Moving Occupations by Sex
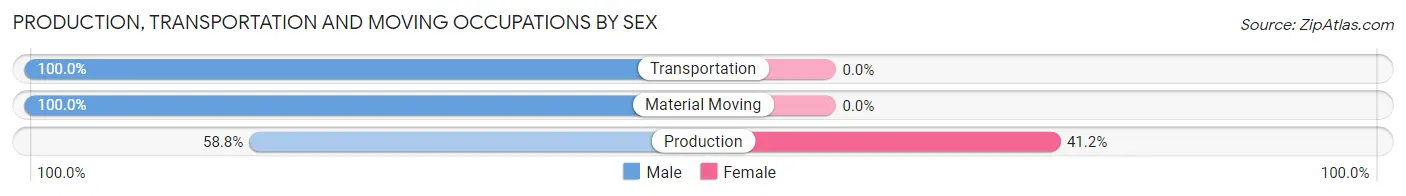
| Occupation | Male | Female |
| Production | 30 (58.8%) | 21 (41.2%) |
| Transportation | 52 (100.0%) | 0 (0.0%) |
| Material Moving | 15 (100.0%) | 0 (0.0%) |
| Total (Category) | 97 (82.2%) | 21 (17.8%) |
| Total (Overall) | 401 (48.2%) | 431 (51.8%) |
Employment Industries by Sex in Memphis
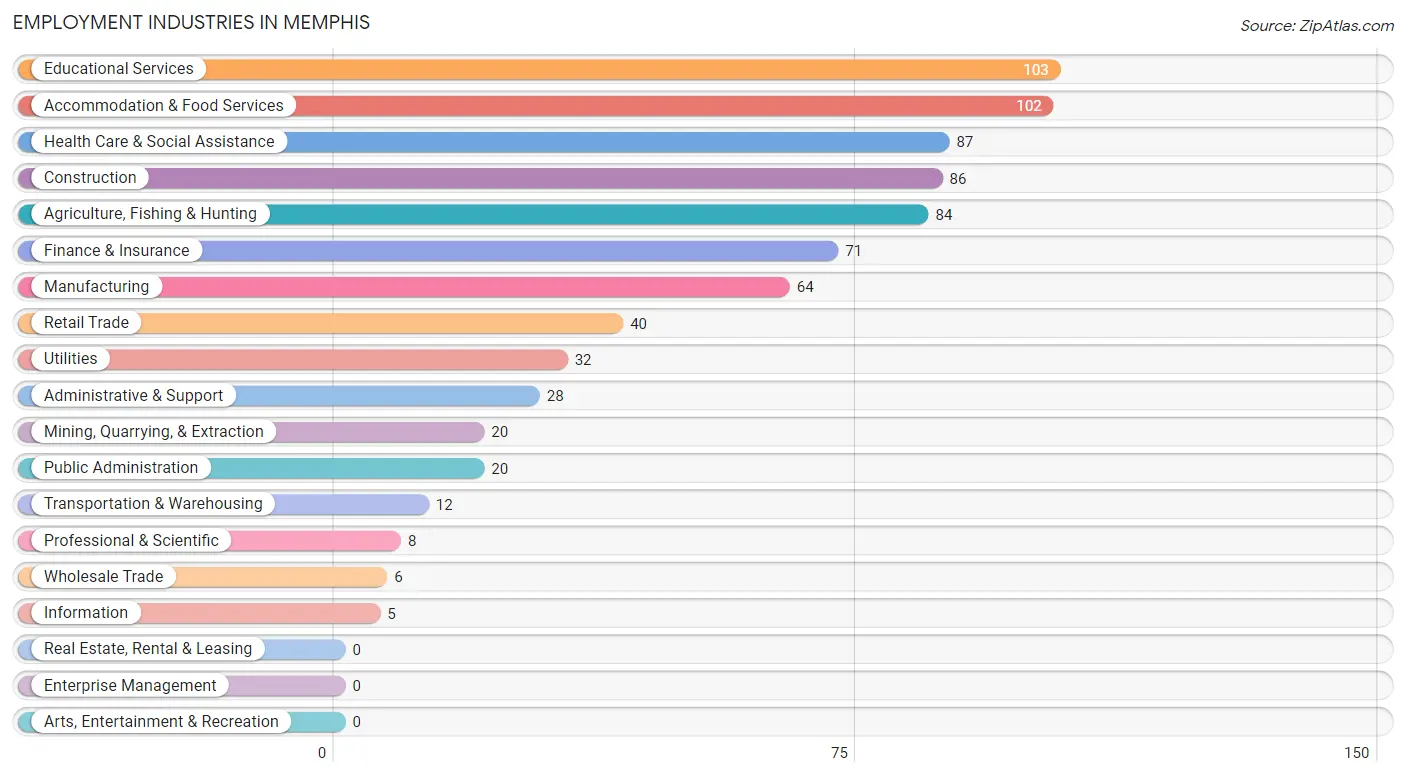
Employment Industries in Memphis
The major employment industries in Memphis include Educational Services (103 | 12.4%), Accommodation & Food Services (102 | 12.3%), Health Care & Social Assistance (87 | 10.5%), Construction (86 | 10.3%), and Agriculture, Fishing & Hunting (84 | 10.1%).
Employment Industries by Sex in Memphis
The Memphis industries that see more men than women are Mining, Quarrying, & Extraction (100.0%), Construction (100.0%), and Wholesale Trade (100.0%), whereas the industries that tend to have a higher number of women are Finance & Insurance (100.0%), Educational Services (80.6%), and Accommodation & Food Services (79.4%).
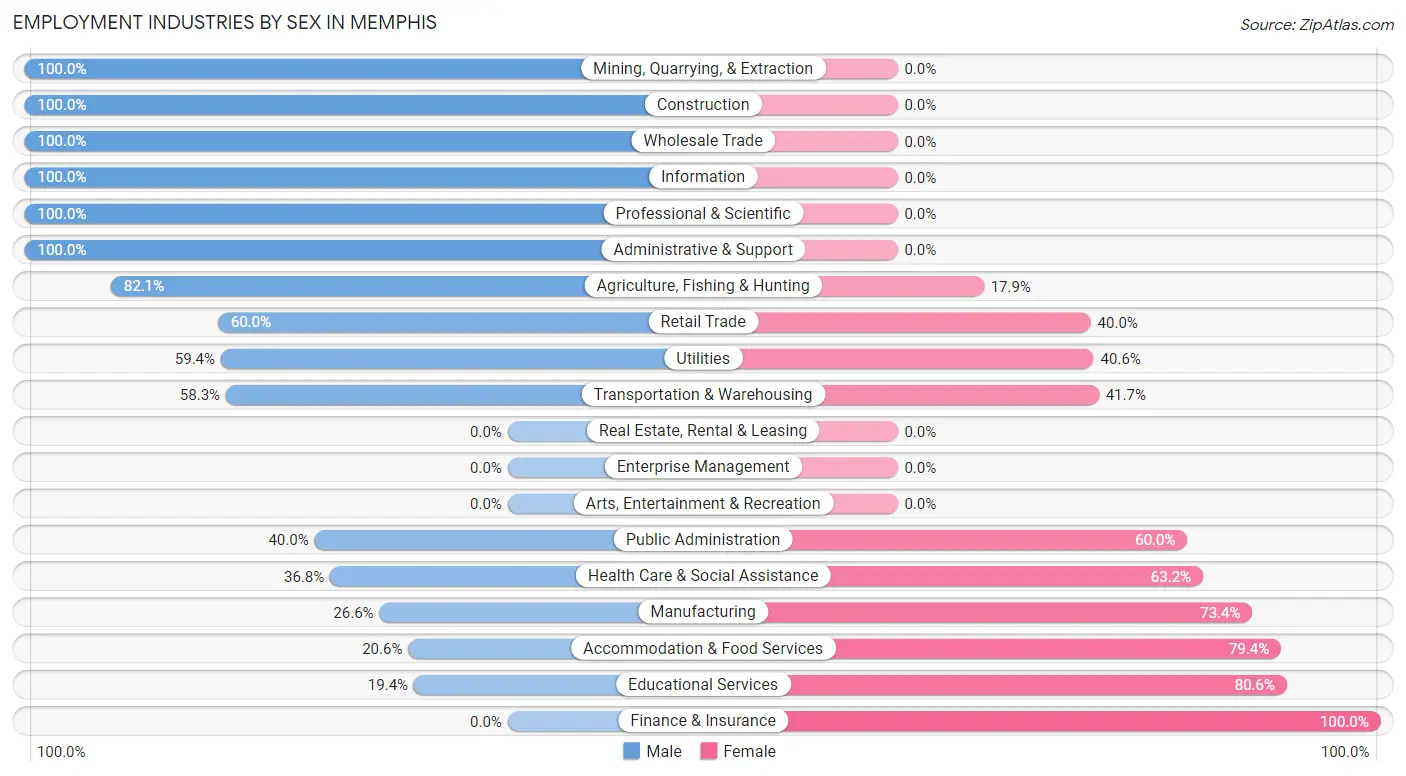
| Industry | Male | Female |
| Agriculture, Fishing & Hunting | 69 (82.1%) | 15 (17.9%) |
| Mining, Quarrying, & Extraction | 20 (100.0%) | 0 (0.0%) |
| Construction | 86 (100.0%) | 0 (0.0%) |
| Manufacturing | 17 (26.6%) | 47 (73.4%) |
| Wholesale Trade | 6 (100.0%) | 0 (0.0%) |
| Retail Trade | 24 (60.0%) | 16 (40.0%) |
| Transportation & Warehousing | 7 (58.3%) | 5 (41.7%) |
| Utilities | 19 (59.4%) | 13 (40.6%) |
| Information | 5 (100.0%) | 0 (0.0%) |
| Finance & Insurance | 0 (0.0%) | 71 (100.0%) |
| Real Estate, Rental & Leasing | 0 (0.0%) | 0 (0.0%) |
| Professional & Scientific | 8 (100.0%) | 0 (0.0%) |
| Enterprise Management | 0 (0.0%) | 0 (0.0%) |
| Administrative & Support | 28 (100.0%) | 0 (0.0%) |
| Educational Services | 20 (19.4%) | 83 (80.6%) |
| Health Care & Social Assistance | 32 (36.8%) | 55 (63.2%) |
| Arts, Entertainment & Recreation | 0 (0.0%) | 0 (0.0%) |
| Accommodation & Food Services | 21 (20.6%) | 81 (79.4%) |
| Public Administration | 8 (40.0%) | 12 (60.0%) |
| Total | 401 (48.2%) | 431 (51.8%) |
Education in Memphis
School Enrollment in Memphis
The most common levels of schooling among the 527 students in Memphis are elementary school (169 | 32.1%), high school (119 | 22.6%), and middle school (93 | 17.6%).
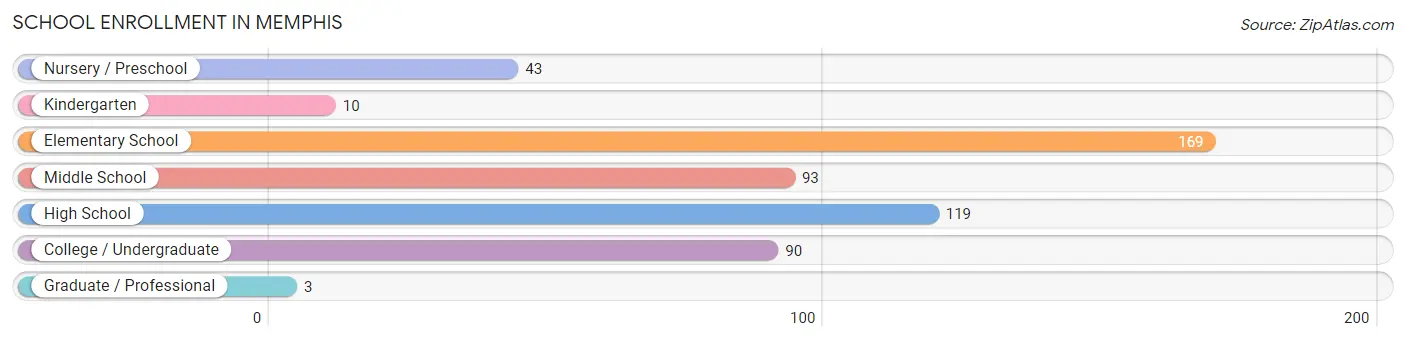
| School Level | # Students | % Students |
| Nursery / Preschool | 43 | 8.2% |
| Kindergarten | 10 | 1.9% |
| Elementary School | 169 | 32.1% |
| Middle School | 93 | 17.6% |
| High School | 119 | 22.6% |
| College / Undergraduate | 90 | 17.1% |
| Graduate / Professional | 3 | 0.6% |
| Total | 527 | 100.0% |
School Enrollment by Age by Funding Source in Memphis
Out of a total of 527 students who are enrolled in schools in Memphis, 17 (3.2%) attend a private institution, while the remaining 510 (96.8%) are enrolled in public schools. The age group of 35 years and over has the highest likelihood of being enrolled in private schools, with 7 (87.5% in the age bracket) enrolled. Conversely, the age group of 3 to 4 year olds has the lowest likelihood of being enrolled in a private school, with 29 (100.0% in the age bracket) attending a public institution.
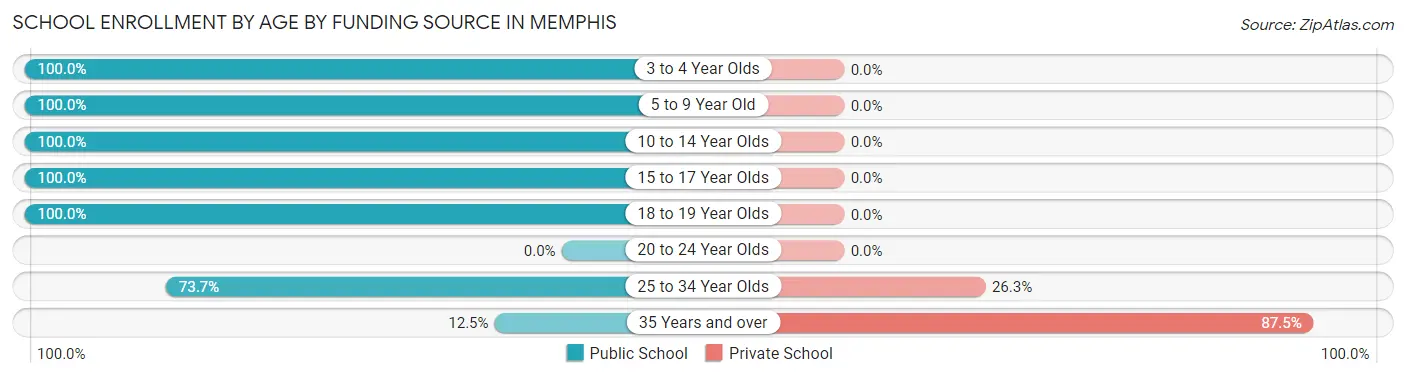
| Age Bracket | Public School | Private School |
| 3 to 4 Year Olds | 29 (100.0%) | 0 (0.0%) |
| 5 to 9 Year Old | 179 (100.0%) | 0 (0.0%) |
| 10 to 14 Year Olds | 118 (100.0%) | 0 (0.0%) |
| 15 to 17 Year Olds | 94 (100.0%) | 0 (0.0%) |
| 18 to 19 Year Olds | 61 (100.0%) | 0 (0.0%) |
| 20 to 24 Year Olds | 0 (0.0%) | 0 (0.0%) |
| 25 to 34 Year Olds | 28 (73.7%) | 10 (26.3%) |
| 35 Years and over | 1 (12.5%) | 7 (87.5%) |
| Total | 510 (96.8%) | 17 (3.2%) |
Educational Attainment by Field of Study in Memphis
Business (60 | 25.0%), education (52 | 21.7%), bio, nature & agricultural (45 | 18.8%), arts & humanities (22 | 9.2%), and engineering (16 | 6.7%) are the most common fields of study among 240 individuals in Memphis who have obtained a bachelor's degree or higher.
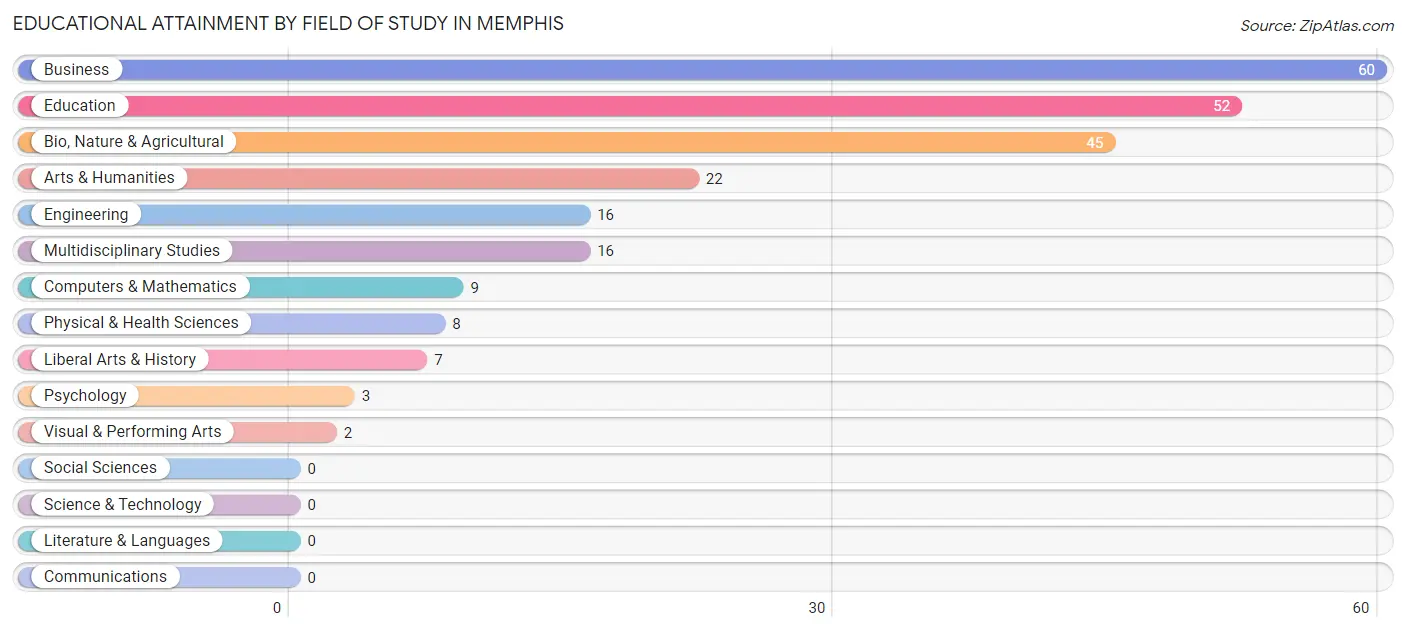
| Field of Study | # Graduates | % Graduates |
| Computers & Mathematics | 9 | 3.7% |
| Bio, Nature & Agricultural | 45 | 18.8% |
| Physical & Health Sciences | 8 | 3.3% |
| Psychology | 3 | 1.3% |
| Social Sciences | 0 | 0.0% |
| Engineering | 16 | 6.7% |
| Multidisciplinary Studies | 16 | 6.7% |
| Science & Technology | 0 | 0.0% |
| Business | 60 | 25.0% |
| Education | 52 | 21.7% |
| Literature & Languages | 0 | 0.0% |
| Liberal Arts & History | 7 | 2.9% |
| Visual & Performing Arts | 2 | 0.8% |
| Communications | 0 | 0.0% |
| Arts & Humanities | 22 | 9.2% |
| Total | 240 | 100.0% |
Transportation & Commute in Memphis
Vehicle Availability by Sex in Memphis
The most prevalent vehicle ownership categories in Memphis are males with 2 vehicles (124, accounting for 31.4%) and females with 2 vehicles (161, making up 29.1%).
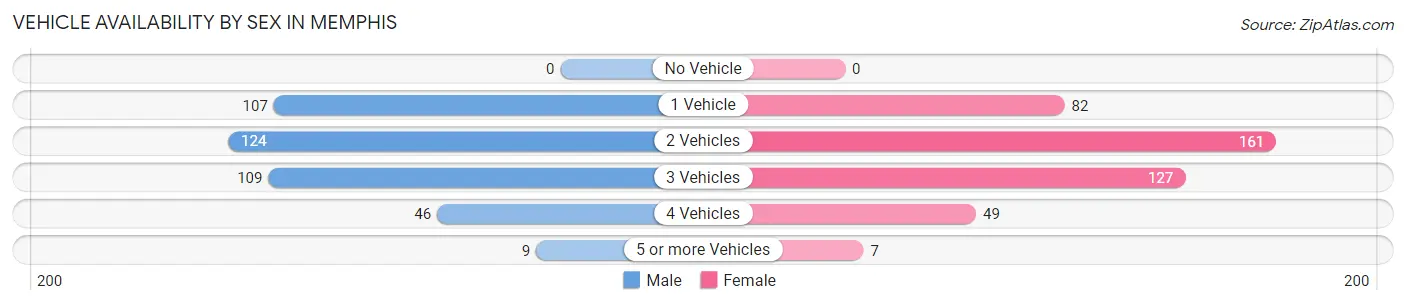
| Vehicles Available | Male | Female |
| No Vehicle | 0 (0.0%) | 0 (0.0%) |
| 1 Vehicle | 107 (27.1%) | 82 (19.3%) |
| 2 Vehicles | 124 (31.4%) | 161 (37.8%) |
| 3 Vehicles | 109 (27.6%) | 127 (29.8%) |
| 4 Vehicles | 46 (11.7%) | 49 (11.5%) |
| 5 or more Vehicles | 9 (2.3%) | 7 (1.6%) |
| Total | 395 (100.0%) | 426 (100.0%) |
Commute Time in Memphis
The most frequently occuring commute durations in Memphis are less than 5 minutes (244 commuters, 31.3%), 5 to 9 minutes (179 commuters, 23.0%), and 30 to 34 minutes (140 commuters, 17.9%).
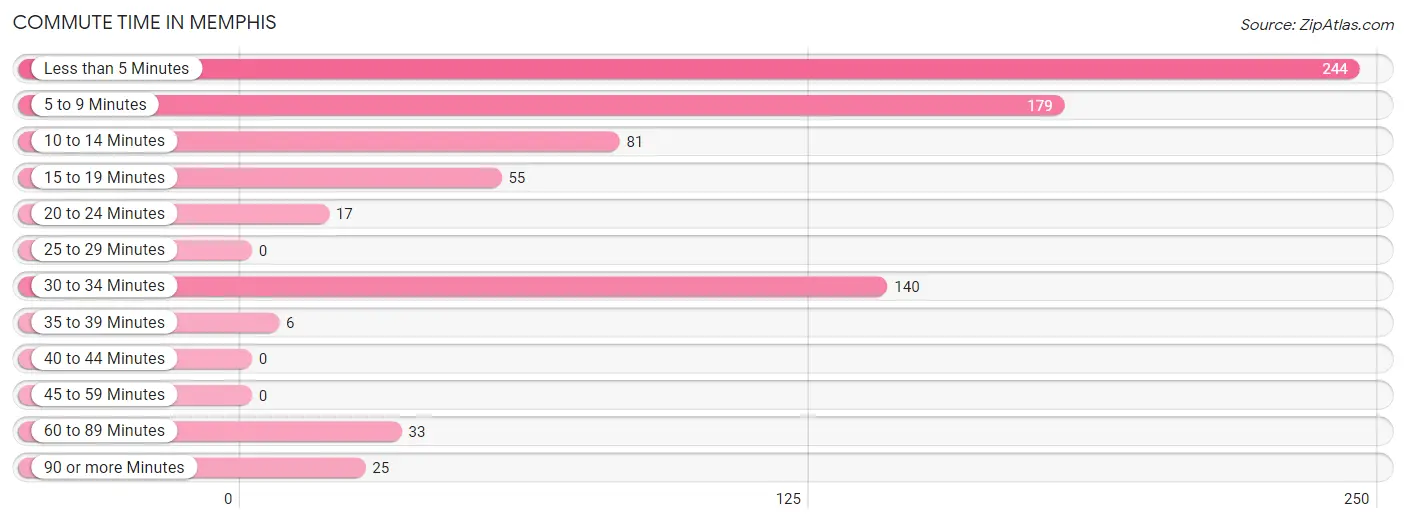
| Commute Time | # Commuters | % Commuters |
| Less than 5 Minutes | 244 | 31.3% |
| 5 to 9 Minutes | 179 | 23.0% |
| 10 to 14 Minutes | 81 | 10.4% |
| 15 to 19 Minutes | 55 | 7.0% |
| 20 to 24 Minutes | 17 | 2.2% |
| 25 to 29 Minutes | 0 | 0.0% |
| 30 to 34 Minutes | 140 | 17.9% |
| 35 to 39 Minutes | 6 | 0.8% |
| 40 to 44 Minutes | 0 | 0.0% |
| 45 to 59 Minutes | 0 | 0.0% |
| 60 to 89 Minutes | 33 | 4.2% |
| 90 or more Minutes | 25 | 3.2% |
Commute Time by Sex in Memphis
The most common commute times in Memphis are 30 to 34 minutes (98 commuters, 26.1%) for males and less than 5 minutes (206 commuters, 51.0%) for females.
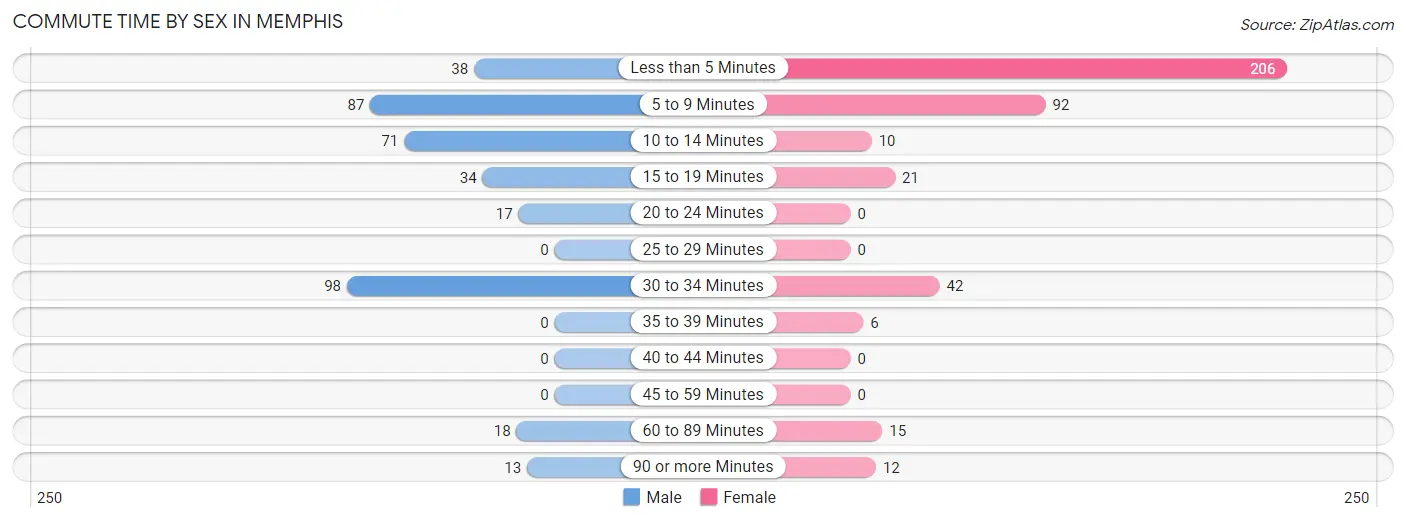
| Commute Time | Male | Female |
| Less than 5 Minutes | 38 (10.1%) | 206 (51.0%) |
| 5 to 9 Minutes | 87 (23.1%) | 92 (22.8%) |
| 10 to 14 Minutes | 71 (18.9%) | 10 (2.5%) |
| 15 to 19 Minutes | 34 (9.0%) | 21 (5.2%) |
| 20 to 24 Minutes | 17 (4.5%) | 0 (0.0%) |
| 25 to 29 Minutes | 0 (0.0%) | 0 (0.0%) |
| 30 to 34 Minutes | 98 (26.1%) | 42 (10.4%) |
| 35 to 39 Minutes | 0 (0.0%) | 6 (1.5%) |
| 40 to 44 Minutes | 0 (0.0%) | 0 (0.0%) |
| 45 to 59 Minutes | 0 (0.0%) | 0 (0.0%) |
| 60 to 89 Minutes | 18 (4.8%) | 15 (3.7%) |
| 90 or more Minutes | 13 (3.5%) | 12 (3.0%) |
Time of Departure to Work by Sex in Memphis
The most frequent times of departure to work in Memphis are 7:30 AM to 7:59 AM (67, 17.8%) for males and 8:00 AM to 8:29 AM (158, 39.1%) for females.
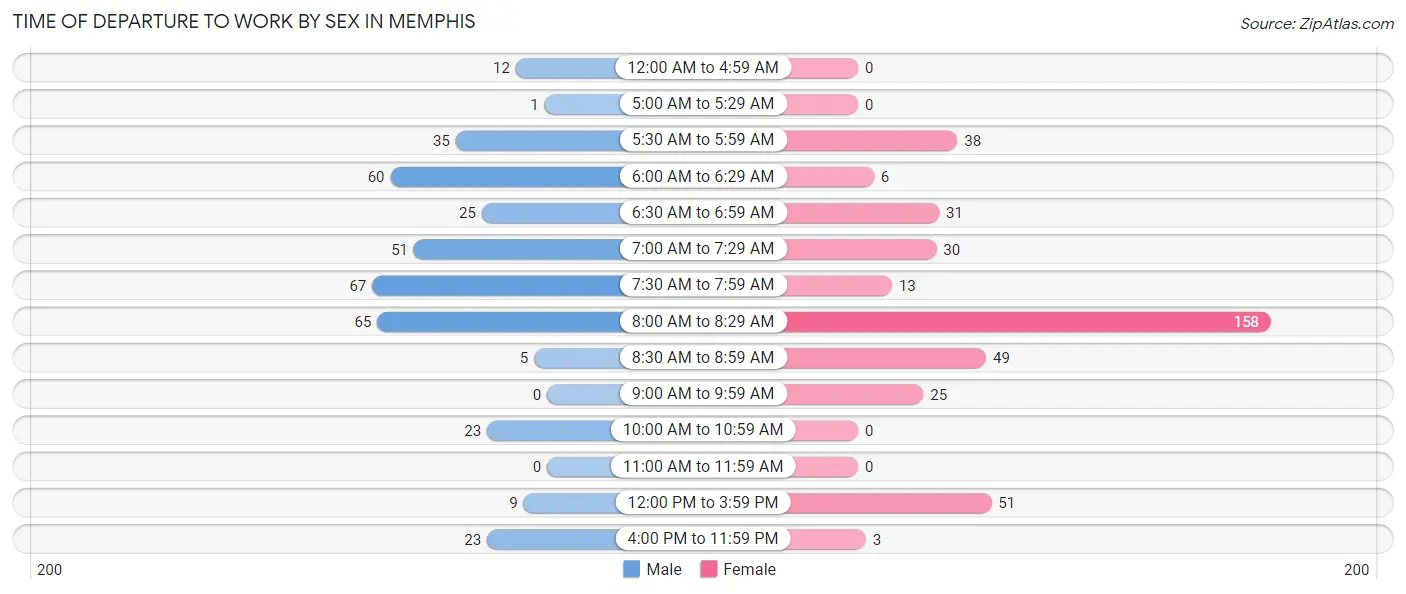
| Time of Departure | Male | Female |
| 12:00 AM to 4:59 AM | 12 (3.2%) | 0 (0.0%) |
| 5:00 AM to 5:29 AM | 1 (0.3%) | 0 (0.0%) |
| 5:30 AM to 5:59 AM | 35 (9.3%) | 38 (9.4%) |
| 6:00 AM to 6:29 AM | 60 (16.0%) | 6 (1.5%) |
| 6:30 AM to 6:59 AM | 25 (6.7%) | 31 (7.7%) |
| 7:00 AM to 7:29 AM | 51 (13.6%) | 30 (7.4%) |
| 7:30 AM to 7:59 AM | 67 (17.8%) | 13 (3.2%) |
| 8:00 AM to 8:29 AM | 65 (17.3%) | 158 (39.1%) |
| 8:30 AM to 8:59 AM | 5 (1.3%) | 49 (12.1%) |
| 9:00 AM to 9:59 AM | 0 (0.0%) | 25 (6.2%) |
| 10:00 AM to 10:59 AM | 23 (6.1%) | 0 (0.0%) |
| 11:00 AM to 11:59 AM | 0 (0.0%) | 0 (0.0%) |
| 12:00 PM to 3:59 PM | 9 (2.4%) | 51 (12.6%) |
| 4:00 PM to 11:59 PM | 23 (6.1%) | 3 (0.7%) |
| Total | 376 (100.0%) | 404 (100.0%) |
Housing Occupancy in Memphis
Occupancy by Ownership in Memphis
Of the total 877 dwellings in Memphis, owner-occupied units account for 598 (68.2%), while renter-occupied units make up 279 (31.8%).
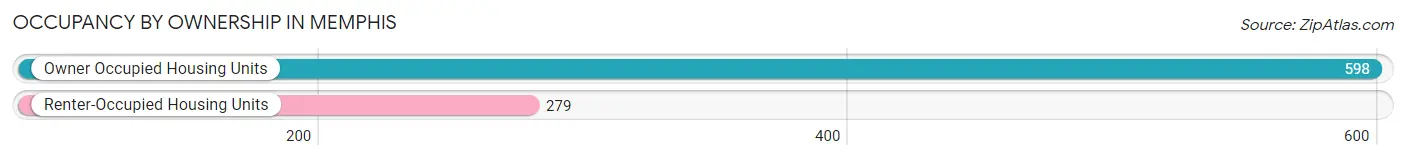
| Occupancy | # Housing Units | % Housing Units |
| Owner Occupied Housing Units | 598 | 68.2% |
| Renter-Occupied Housing Units | 279 | 31.8% |
| Total Occupied Housing Units | 877 | 100.0% |
Occupancy by Household Size in Memphis
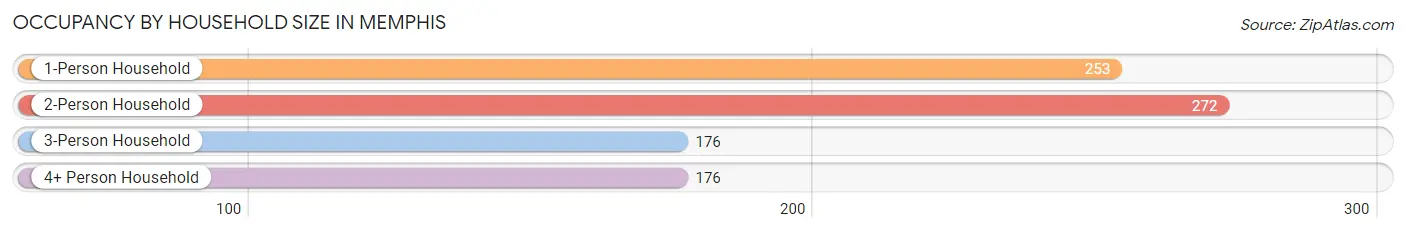
| Household Size | # Housing Units | % Housing Units |
| 1-Person Household | 253 | 28.8% |
| 2-Person Household | 272 | 31.0% |
| 3-Person Household | 176 | 20.1% |
| 4+ Person Household | 176 | 20.1% |
| Total Housing Units | 877 | 100.0% |
Occupancy by Ownership by Household Size in Memphis
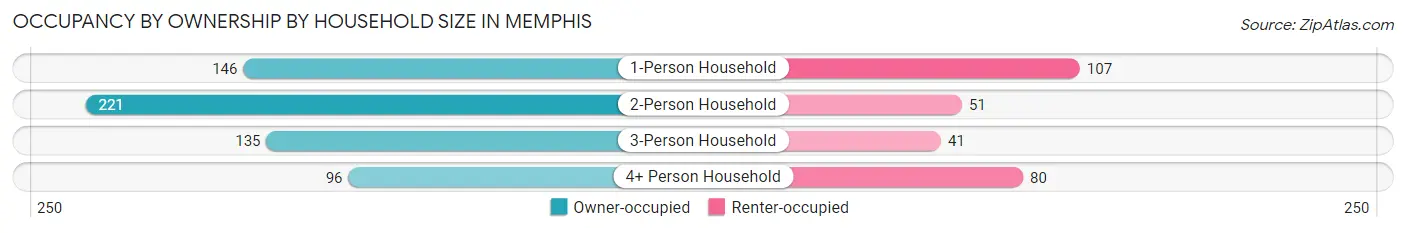
| Household Size | Owner-occupied | Renter-occupied |
| 1-Person Household | 146 (57.7%) | 107 (42.3%) |
| 2-Person Household | 221 (81.2%) | 51 (18.8%) |
| 3-Person Household | 135 (76.7%) | 41 (23.3%) |
| 4+ Person Household | 96 (54.5%) | 80 (45.5%) |
| Total Housing Units | 598 (68.2%) | 279 (31.8%) |
Occupancy by Educational Attainment in Memphis
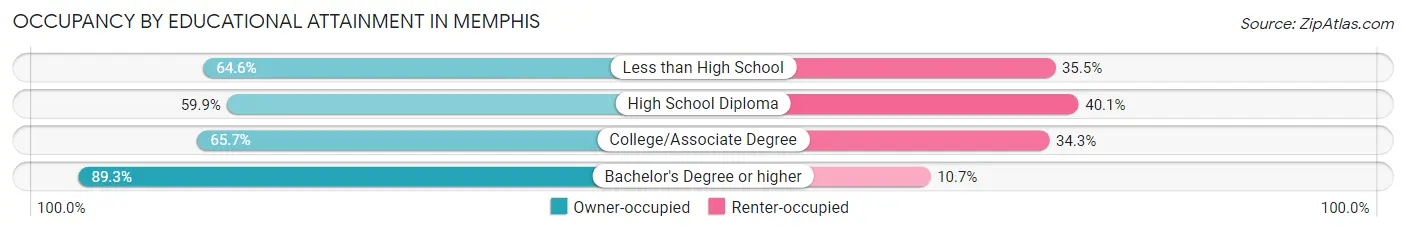
| Household Size | Owner-occupied | Renter-occupied |
| Less than High School | 122 (64.5%) | 67 (35.4%) |
| High School Diploma | 163 (59.9%) | 109 (40.1%) |
| College/Associate Degree | 163 (65.7%) | 85 (34.3%) |
| Bachelor's Degree or higher | 150 (89.3%) | 18 (10.7%) |
Occupancy by Age of Householder in Memphis
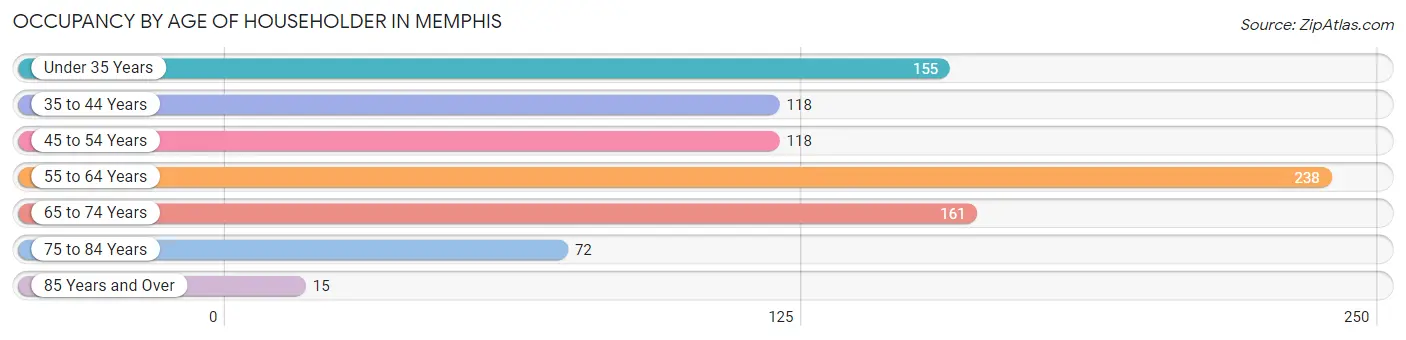
| Age Bracket | # Households | % Households |
| Under 35 Years | 155 | 17.7% |
| 35 to 44 Years | 118 | 13.5% |
| 45 to 54 Years | 118 | 13.5% |
| 55 to 64 Years | 238 | 27.1% |
| 65 to 74 Years | 161 | 18.4% |
| 75 to 84 Years | 72 | 8.2% |
| 85 Years and Over | 15 | 1.7% |
| Total | 877 | 100.0% |
Housing Finances in Memphis
Median Income by Occupancy in Memphis
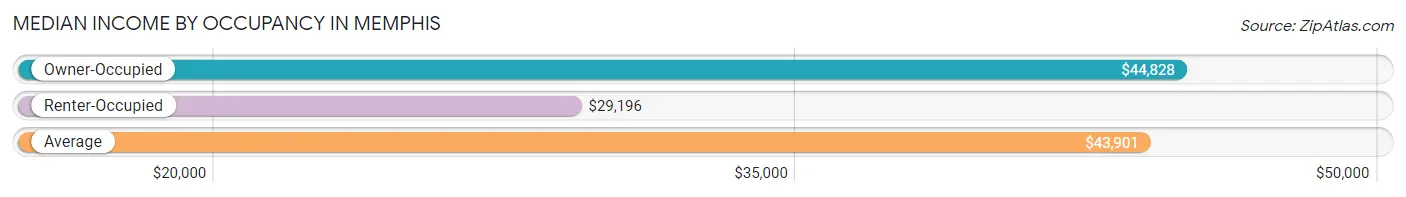
| Occupancy Type | # Households | Median Income |
| Owner-Occupied | 598 (68.2%) | $44,828 |
| Renter-Occupied | 279 (31.8%) | $29,196 |
| Average | 877 (100.0%) | $43,901 |
Occupancy by Householder Income Bracket in Memphis
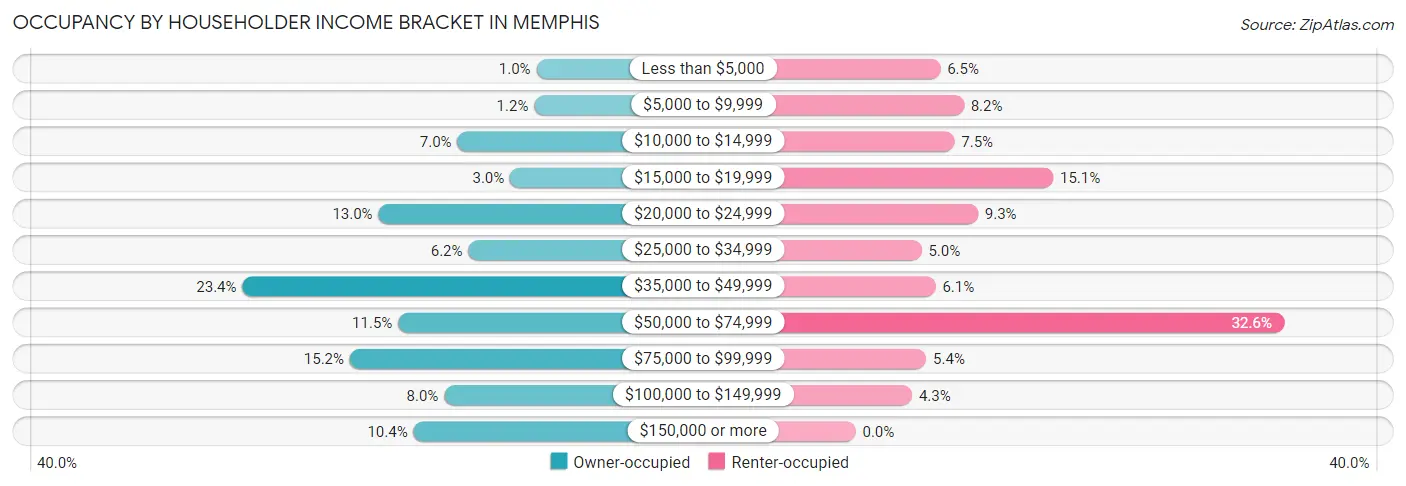
| Income Bracket | Owner-occupied | Renter-occupied |
| Less than $5,000 | 6 (1.0%) | 18 (6.5%) |
| $5,000 to $9,999 | 7 (1.2%) | 23 (8.2%) |
| $10,000 to $14,999 | 42 (7.0%) | 21 (7.5%) |
| $15,000 to $19,999 | 18 (3.0%) | 42 (15.0%) |
| $20,000 to $24,999 | 78 (13.0%) | 26 (9.3%) |
| $25,000 to $34,999 | 37 (6.2%) | 14 (5.0%) |
| $35,000 to $49,999 | 140 (23.4%) | 17 (6.1%) |
| $50,000 to $74,999 | 69 (11.5%) | 91 (32.6%) |
| $75,000 to $99,999 | 91 (15.2%) | 15 (5.4%) |
| $100,000 to $149,999 | 48 (8.0%) | 12 (4.3%) |
| $150,000 or more | 62 (10.4%) | 0 (0.0%) |
| Total | 598 (100.0%) | 279 (100.0%) |
Monthly Housing Cost Tiers in Memphis
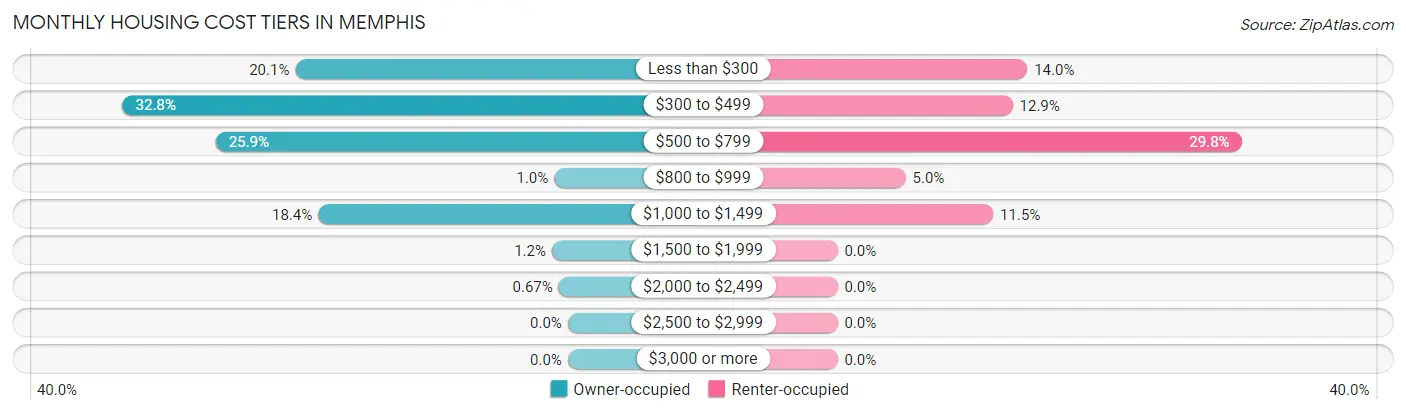
| Monthly Cost | Owner-occupied | Renter-occupied |
| Less than $300 | 120 (20.1%) | 39 (14.0%) |
| $300 to $499 | 196 (32.8%) | 36 (12.9%) |
| $500 to $799 | 155 (25.9%) | 83 (29.7%) |
| $800 to $999 | 6 (1.0%) | 14 (5.0%) |
| $1,000 to $1,499 | 110 (18.4%) | 32 (11.5%) |
| $1,500 to $1,999 | 7 (1.2%) | 0 (0.0%) |
| $2,000 to $2,499 | 4 (0.7%) | 0 (0.0%) |
| $2,500 to $2,999 | 0 (0.0%) | 0 (0.0%) |
| $3,000 or more | 0 (0.0%) | 0 (0.0%) |
| Total | 598 (100.0%) | 279 (100.0%) |
Physical Housing Characteristics in Memphis
Housing Structures in Memphis
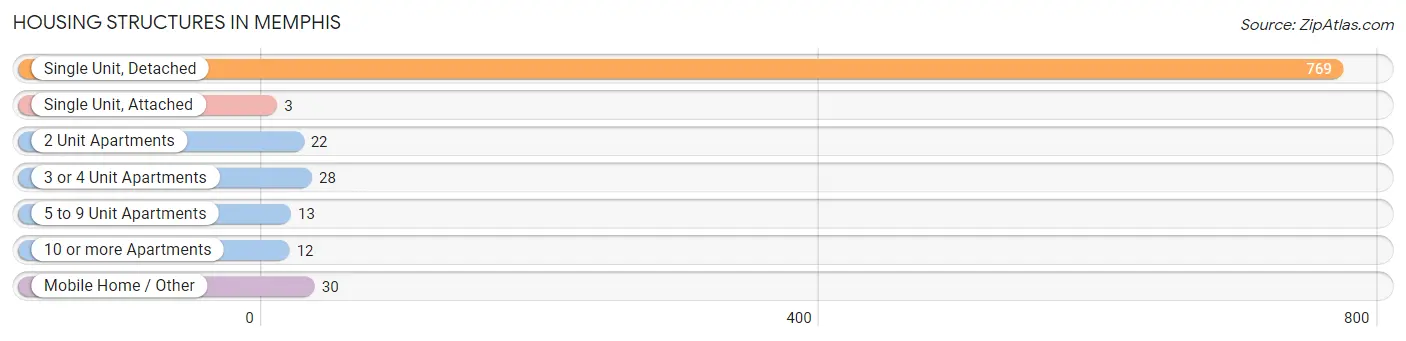
| Structure Type | # Housing Units | % Housing Units |
| Single Unit, Detached | 769 | 87.7% |
| Single Unit, Attached | 3 | 0.3% |
| 2 Unit Apartments | 22 | 2.5% |
| 3 or 4 Unit Apartments | 28 | 3.2% |
| 5 to 9 Unit Apartments | 13 | 1.5% |
| 10 or more Apartments | 12 | 1.4% |
| Mobile Home / Other | 30 | 3.4% |
| Total | 877 | 100.0% |
Housing Structures by Occupancy in Memphis
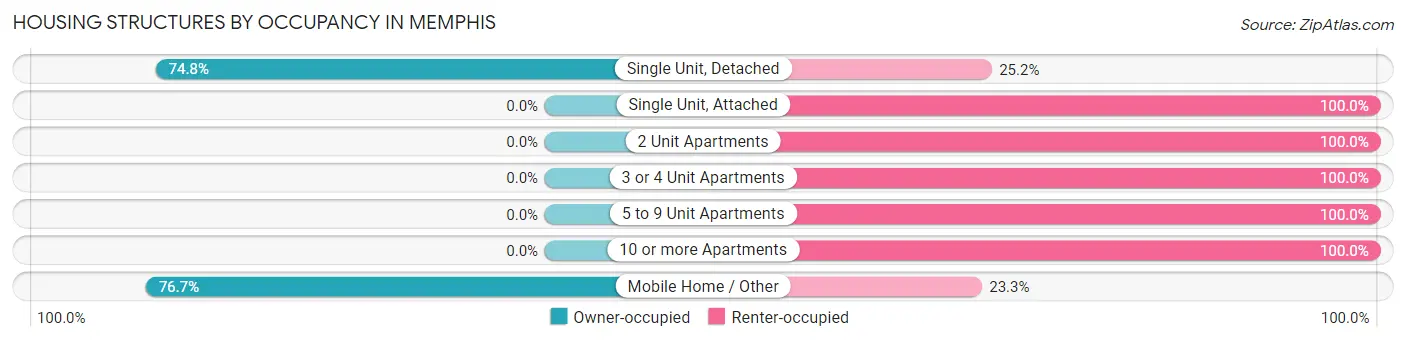
| Structure Type | Owner-occupied | Renter-occupied |
| Single Unit, Detached | 575 (74.8%) | 194 (25.2%) |
| Single Unit, Attached | 0 (0.0%) | 3 (100.0%) |
| 2 Unit Apartments | 0 (0.0%) | 22 (100.0%) |
| 3 or 4 Unit Apartments | 0 (0.0%) | 28 (100.0%) |
| 5 to 9 Unit Apartments | 0 (0.0%) | 13 (100.0%) |
| 10 or more Apartments | 0 (0.0%) | 12 (100.0%) |
| Mobile Home / Other | 23 (76.7%) | 7 (23.3%) |
| Total | 598 (68.2%) | 279 (31.8%) |
Housing Structures by Number of Rooms in Memphis
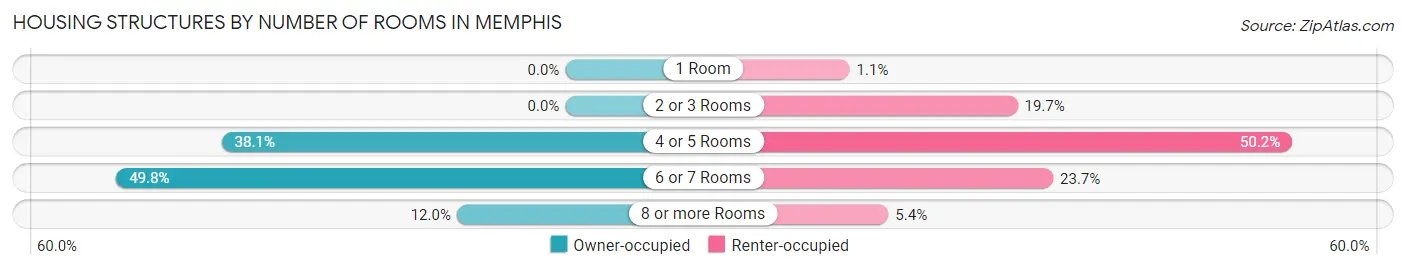
| Number of Rooms | Owner-occupied | Renter-occupied |
| 1 Room | 0 (0.0%) | 3 (1.1%) |
| 2 or 3 Rooms | 0 (0.0%) | 55 (19.7%) |
| 4 or 5 Rooms | 228 (38.1%) | 140 (50.2%) |
| 6 or 7 Rooms | 298 (49.8%) | 66 (23.7%) |
| 8 or more Rooms | 72 (12.0%) | 15 (5.4%) |
| Total | 598 (100.0%) | 279 (100.0%) |
Housing Structure by Heating Type in Memphis
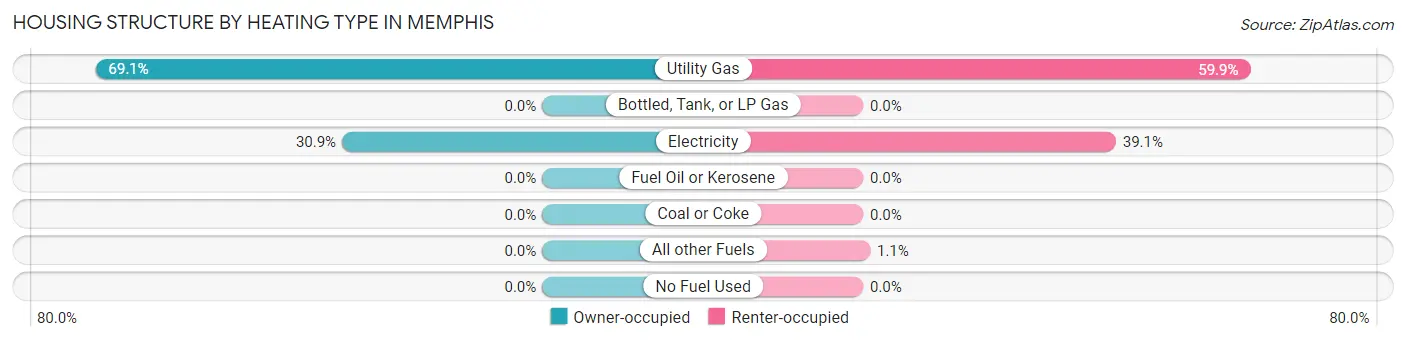
| Heating Type | Owner-occupied | Renter-occupied |
| Utility Gas | 413 (69.1%) | 167 (59.9%) |
| Bottled, Tank, or LP Gas | 0 (0.0%) | 0 (0.0%) |
| Electricity | 185 (30.9%) | 109 (39.1%) |
| Fuel Oil or Kerosene | 0 (0.0%) | 0 (0.0%) |
| Coal or Coke | 0 (0.0%) | 0 (0.0%) |
| All other Fuels | 0 (0.0%) | 3 (1.1%) |
| No Fuel Used | 0 (0.0%) | 0 (0.0%) |
| Total | 598 (100.0%) | 279 (100.0%) |
Household Vehicle Usage in Memphis
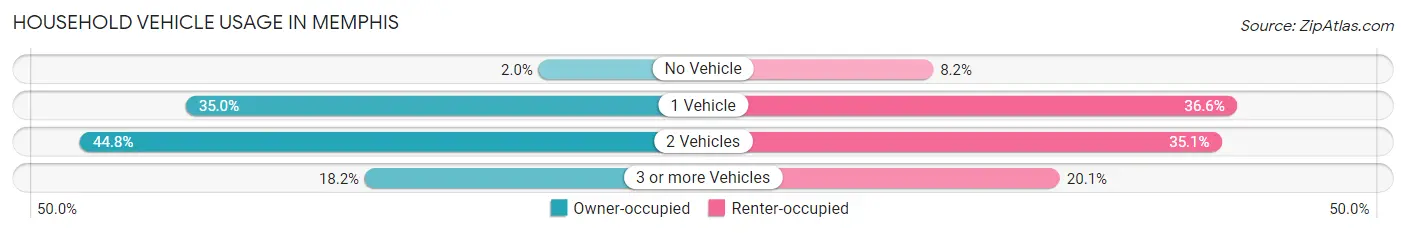
| Vehicles per Household | Owner-occupied | Renter-occupied |
| No Vehicle | 12 (2.0%) | 23 (8.2%) |
| 1 Vehicle | 209 (34.9%) | 102 (36.6%) |
| 2 Vehicles | 268 (44.8%) | 98 (35.1%) |
| 3 or more Vehicles | 109 (18.2%) | 56 (20.1%) |
| Total | 598 (100.0%) | 279 (100.0%) |
Real Estate & Mortgages in Memphis
Real Estate and Mortgage Overview in Memphis
| Characteristic | Without Mortgage | With Mortgage |
| Housing Units | 486 | 112 |
| Median Property Value | $61,000 | $104,700 |
| Median Household Income | $43,396 | $0 |
| Monthly Housing Costs | $434 | $0 |
| Real Estate Taxes | $1,098 | $35 |
Property Value by Mortgage Status in Memphis
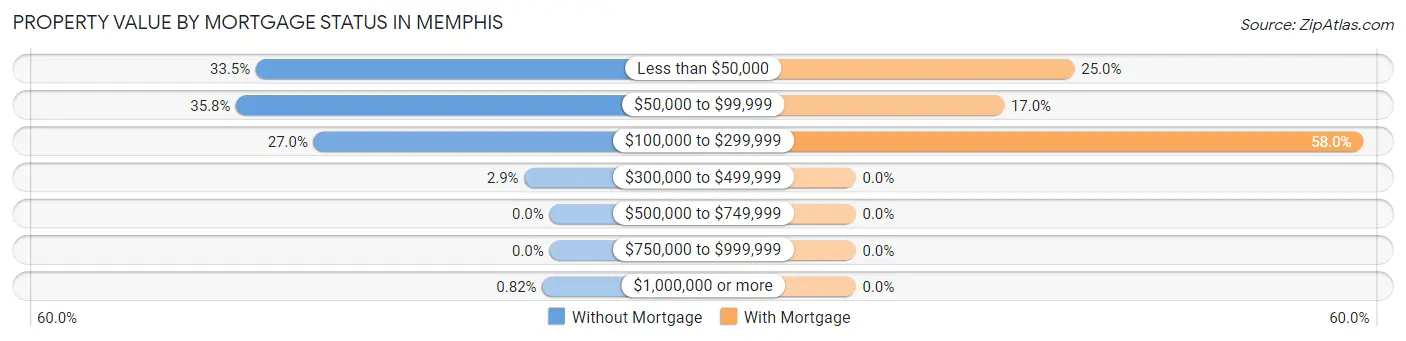
| Property Value | Without Mortgage | With Mortgage |
| Less than $50,000 | 163 (33.5%) | 28 (25.0%) |
| $50,000 to $99,999 | 174 (35.8%) | 19 (17.0%) |
| $100,000 to $299,999 | 131 (27.0%) | 65 (58.0%) |
| $300,000 to $499,999 | 14 (2.9%) | 0 (0.0%) |
| $500,000 to $749,999 | 0 (0.0%) | 0 (0.0%) |
| $750,000 to $999,999 | 0 (0.0%) | 0 (0.0%) |
| $1,000,000 or more | 4 (0.8%) | 0 (0.0%) |
| Total | 486 (100.0%) | 112 (100.0%) |
Household Income by Mortgage Status in Memphis
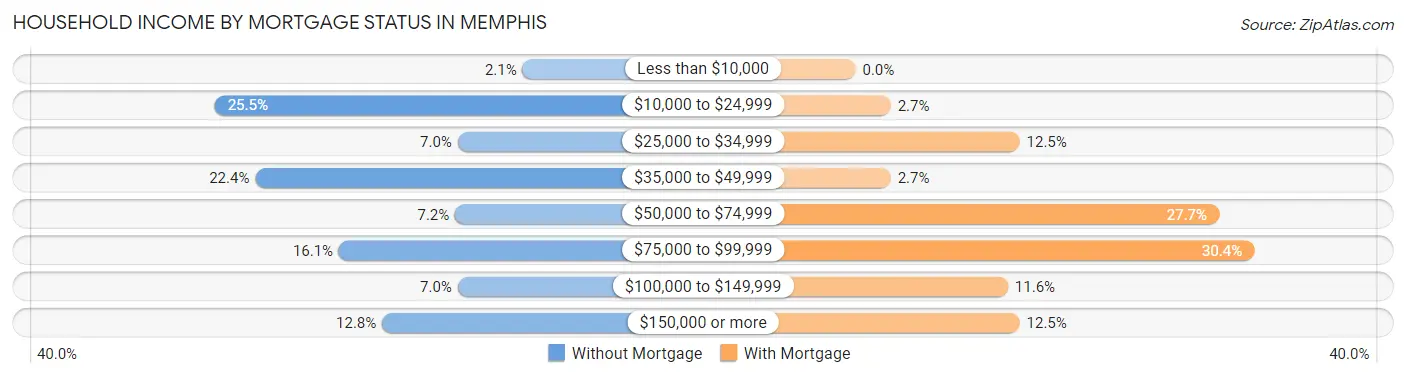
| Household Income | Without Mortgage | With Mortgage |
| Less than $10,000 | 10 (2.1%) | 0 (0.0%) |
| $10,000 to $24,999 | 124 (25.5%) | 3 (2.7%) |
| $25,000 to $34,999 | 34 (7.0%) | 14 (12.5%) |
| $35,000 to $49,999 | 109 (22.4%) | 3 (2.7%) |
| $50,000 to $74,999 | 35 (7.2%) | 31 (27.7%) |
| $75,000 to $99,999 | 78 (16.1%) | 34 (30.4%) |
| $100,000 to $149,999 | 34 (7.0%) | 13 (11.6%) |
| $150,000 or more | 62 (12.8%) | 14 (12.5%) |
| Total | 486 (100.0%) | 112 (100.0%) |
Property Value to Household Income Ratio in Memphis
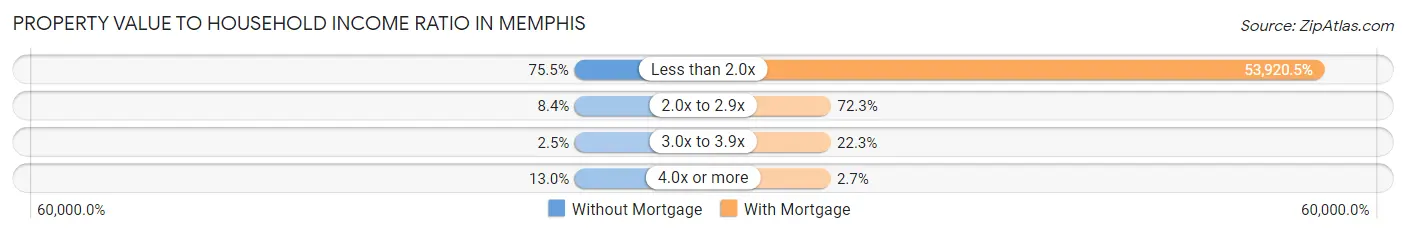
| Value-to-Income Ratio | Without Mortgage | With Mortgage |
| Less than 2.0x | 367 (75.5%) | 60,391 (53,920.5%) |
| 2.0x to 2.9x | 41 (8.4%) | 81 (72.3%) |
| 3.0x to 3.9x | 12 (2.5%) | 25 (22.3%) |
| 4.0x or more | 63 (13.0%) | 3 (2.7%) |
| Total | 486 (100.0%) | 112 (100.0%) |
Real Estate Taxes by Mortgage Status in Memphis
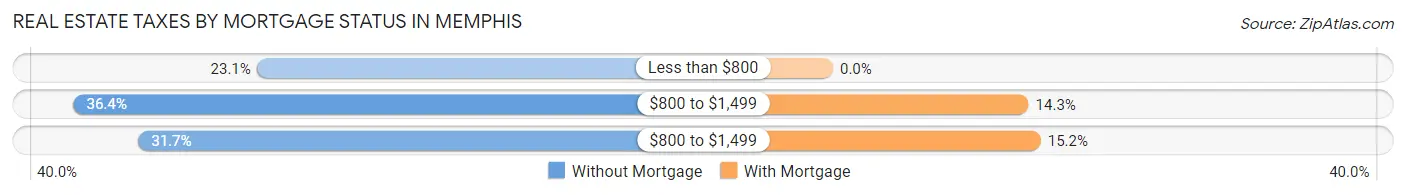
| Property Taxes | Without Mortgage | With Mortgage |
| Less than $800 | 112 (23.1%) | 0 (0.0%) |
| $800 to $1,499 | 177 (36.4%) | 16 (14.3%) |
| $800 to $1,499 | 154 (31.7%) | 17 (15.2%) |
| Total | 486 (100.0%) | 112 (100.0%) |
Health & Disability in Memphis
Health Insurance Coverage by Age in Memphis
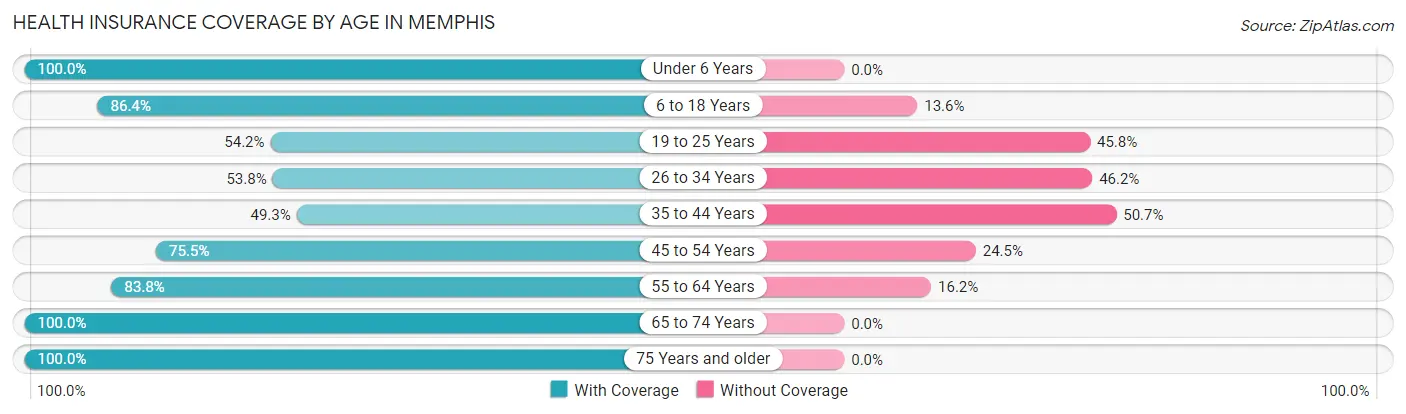
| Age Bracket | With Coverage | Without Coverage |
| Under 6 Years | 137 (100.0%) | 0 (0.0%) |
| 6 to 18 Years | 368 (86.4%) | 58 (13.6%) |
| 19 to 25 Years | 65 (54.2%) | 55 (45.8%) |
| 26 to 34 Years | 107 (53.8%) | 92 (46.2%) |
| 35 to 44 Years | 102 (49.3%) | 105 (50.7%) |
| 45 to 54 Years | 200 (75.5%) | 65 (24.5%) |
| 55 to 64 Years | 264 (83.8%) | 51 (16.2%) |
| 65 to 74 Years | 282 (100.0%) | 0 (0.0%) |
| 75 Years and older | 127 (100.0%) | 0 (0.0%) |
| Total | 1,652 (79.5%) | 426 (20.5%) |
Health Insurance Coverage by Citizenship Status in Memphis
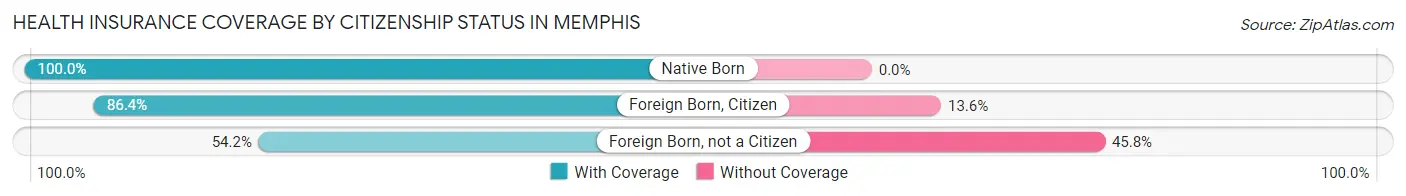
| Citizenship Status | With Coverage | Without Coverage |
| Native Born | 137 (100.0%) | 0 (0.0%) |
| Foreign Born, Citizen | 368 (86.4%) | 58 (13.6%) |
| Foreign Born, not a Citizen | 65 (54.2%) | 55 (45.8%) |
Health Insurance Coverage by Household Income in Memphis
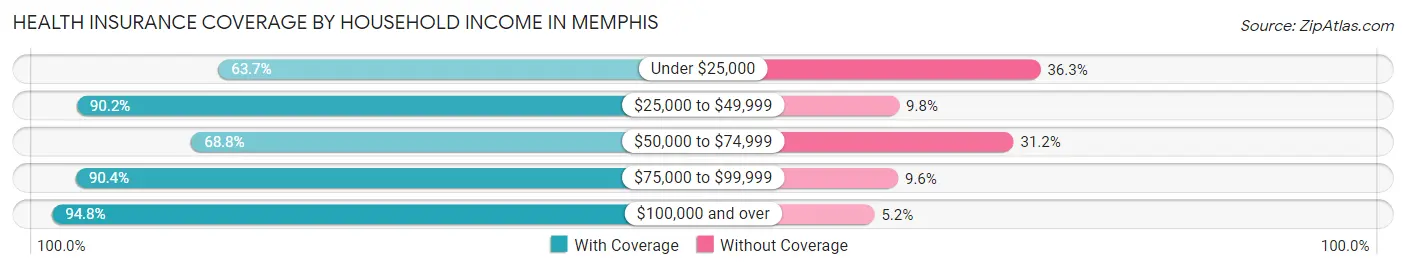
| Household Income | With Coverage | Without Coverage |
| Under $25,000 | 337 (63.7%) | 192 (36.3%) |
| $25,000 to $49,999 | 377 (90.2%) | 41 (9.8%) |
| $50,000 to $74,999 | 317 (68.8%) | 144 (31.2%) |
| $75,000 to $99,999 | 292 (90.4%) | 31 (9.6%) |
| $100,000 and over | 329 (94.8%) | 18 (5.2%) |
Public vs Private Health Insurance Coverage by Age in Memphis
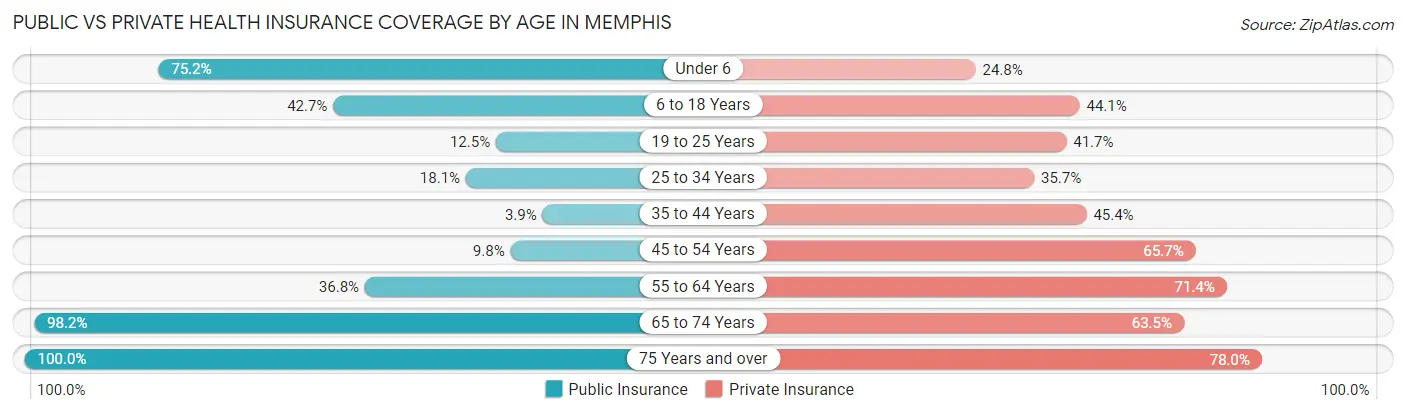
| Age Bracket | Public Insurance | Private Insurance |
| Under 6 | 103 (75.2%) | 34 (24.8%) |
| 6 to 18 Years | 182 (42.7%) | 188 (44.1%) |
| 19 to 25 Years | 15 (12.5%) | 50 (41.7%) |
| 25 to 34 Years | 36 (18.1%) | 71 (35.7%) |
| 35 to 44 Years | 8 (3.9%) | 94 (45.4%) |
| 45 to 54 Years | 26 (9.8%) | 174 (65.7%) |
| 55 to 64 Years | 116 (36.8%) | 225 (71.4%) |
| 65 to 74 Years | 277 (98.2%) | 179 (63.5%) |
| 75 Years and over | 127 (100.0%) | 99 (77.9%) |
| Total | 890 (42.8%) | 1,114 (53.6%) |
Disability Status by Sex by Age in Memphis
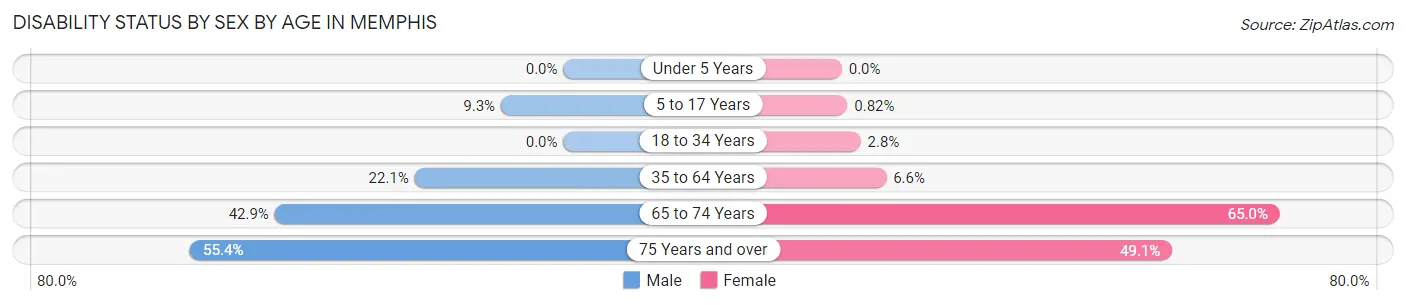
| Age Bracket | Male | Female |
| Under 5 Years | 0 (0.0%) | 0 (0.0%) |
| 5 to 17 Years | 14 (9.3%) | 2 (0.8%) |
| 18 to 34 Years | 0 (0.0%) | 5 (2.8%) |
| 35 to 64 Years | 80 (22.1%) | 28 (6.6%) |
| 65 to 74 Years | 51 (42.9%) | 106 (65.0%) |
| 75 Years and over | 41 (55.4%) | 26 (49.1%) |
Disability Class by Sex by Age in Memphis
Disability Class: Hearing Difficulty
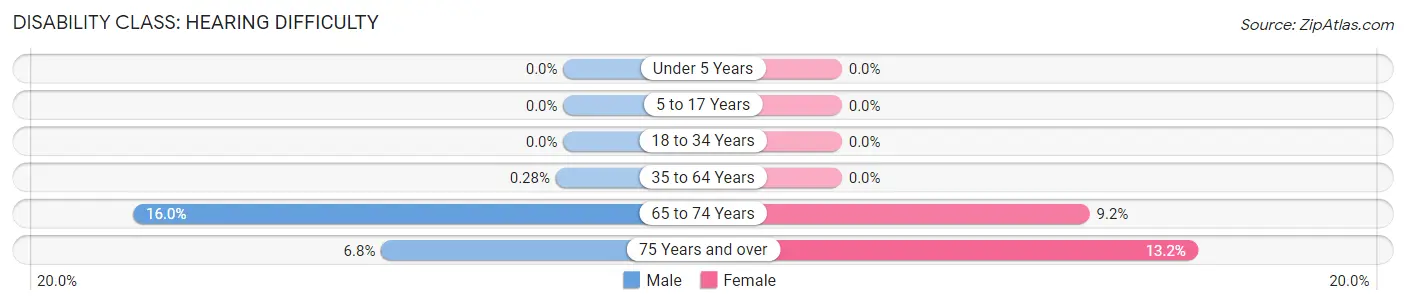
| Age Bracket | Male | Female |
| Under 5 Years | 0 (0.0%) | 0 (0.0%) |
| 5 to 17 Years | 0 (0.0%) | 0 (0.0%) |
| 18 to 34 Years | 0 (0.0%) | 0 (0.0%) |
| 35 to 64 Years | 1 (0.3%) | 0 (0.0%) |
| 65 to 74 Years | 19 (16.0%) | 15 (9.2%) |
| 75 Years and over | 5 (6.8%) | 7 (13.2%) |
Disability Class: Vision Difficulty
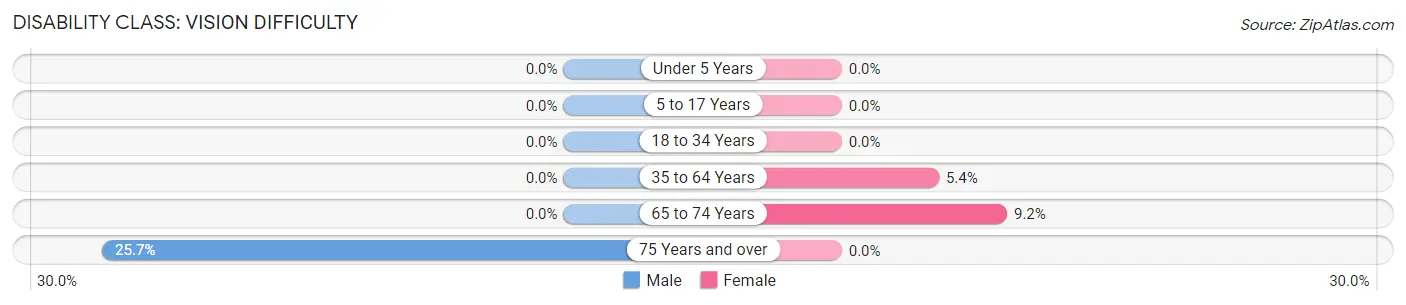
| Age Bracket | Male | Female |
| Under 5 Years | 0 (0.0%) | 0 (0.0%) |
| 5 to 17 Years | 0 (0.0%) | 0 (0.0%) |
| 18 to 34 Years | 0 (0.0%) | 0 (0.0%) |
| 35 to 64 Years | 0 (0.0%) | 23 (5.4%) |
| 65 to 74 Years | 0 (0.0%) | 15 (9.2%) |
| 75 Years and over | 19 (25.7%) | 0 (0.0%) |
Disability Class: Cognitive Difficulty
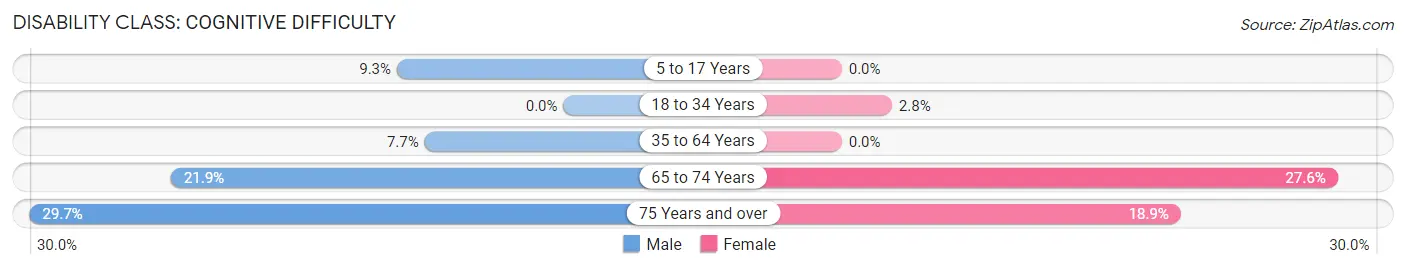
| Age Bracket | Male | Female |
| 5 to 17 Years | 14 (9.3%) | 0 (0.0%) |
| 18 to 34 Years | 0 (0.0%) | 5 (2.8%) |
| 35 to 64 Years | 28 (7.7%) | 0 (0.0%) |
| 65 to 74 Years | 26 (21.8%) | 45 (27.6%) |
| 75 Years and over | 22 (29.7%) | 10 (18.9%) |
Disability Class: Ambulatory Difficulty
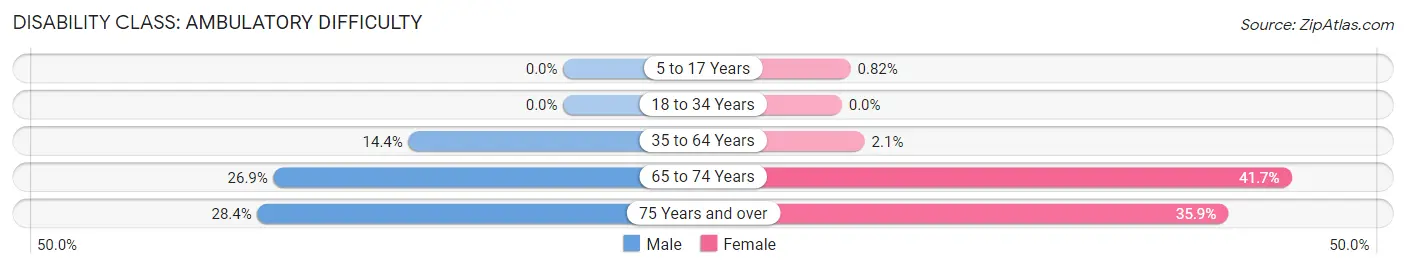
| Age Bracket | Male | Female |
| 5 to 17 Years | 0 (0.0%) | 2 (0.8%) |
| 18 to 34 Years | 0 (0.0%) | 0 (0.0%) |
| 35 to 64 Years | 52 (14.4%) | 9 (2.1%) |
| 65 to 74 Years | 32 (26.9%) | 68 (41.7%) |
| 75 Years and over | 21 (28.4%) | 19 (35.8%) |
Disability Class: Self-Care Difficulty
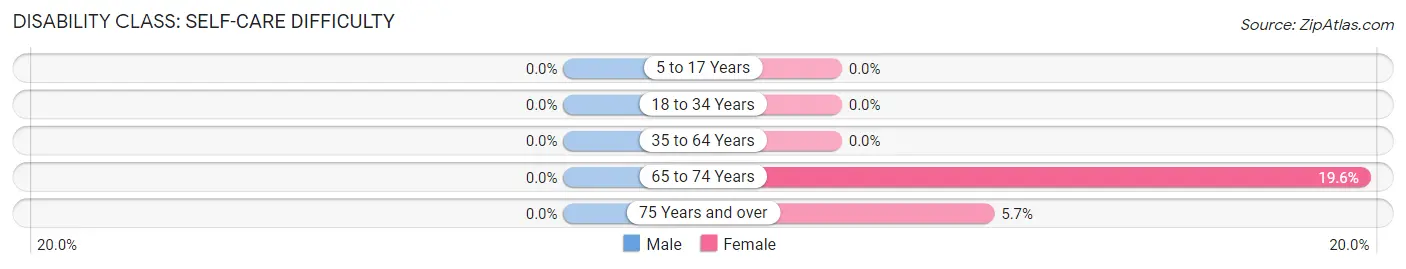
| Age Bracket | Male | Female |
| 5 to 17 Years | 0 (0.0%) | 0 (0.0%) |
| 18 to 34 Years | 0 (0.0%) | 0 (0.0%) |
| 35 to 64 Years | 0 (0.0%) | 0 (0.0%) |
| 65 to 74 Years | 0 (0.0%) | 32 (19.6%) |
| 75 Years and over | 0 (0.0%) | 3 (5.7%) |
Technology Access in Memphis
Computing Device Access in Memphis
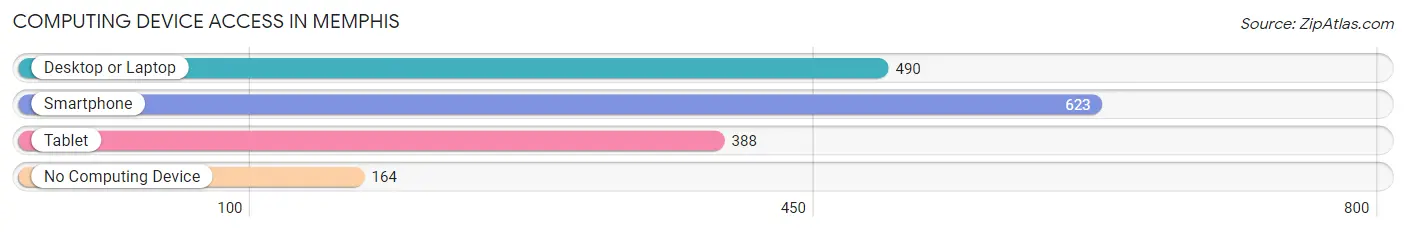
| Device Type | # Households | % Households |
| Desktop or Laptop | 490 | 55.9% |
| Smartphone | 623 | 71.0% |
| Tablet | 388 | 44.2% |
| No Computing Device | 164 | 18.7% |
| Total | 877 | 100.0% |
Internet Access in Memphis
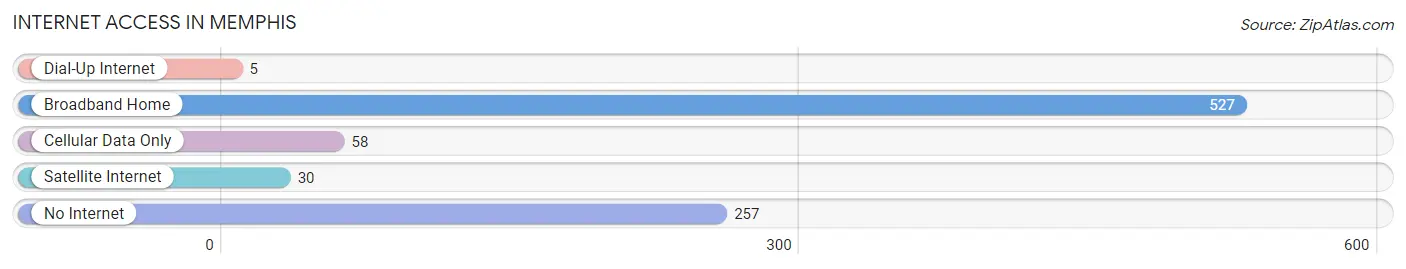
| Internet Type | # Households | % Households |
| Dial-Up Internet | 5 | 0.6% |
| Broadband Home | 527 | 60.1% |
| Cellular Data Only | 58 | 6.6% |
| Satellite Internet | 30 | 3.4% |
| No Internet | 257 | 29.3% |
| Total | 877 | 100.0% |
Memphis Summary
Memphis, Texas is a small town located in Hall County, Texas, United States. It is situated on the banks of the Red River, approximately 25 miles east of the Oklahoma border. The population of Memphis was 1,845 at the 2010 census.
Geography
Memphis is located at the intersection of U.S. Highway 287 and State Highway 256. It is situated on the banks of the Red River, approximately 25 miles east of the Oklahoma border. The town is located in the High Plains region of the Texas Panhandle, and is surrounded by flat, open terrain. The elevation of Memphis is 2,845 feet above sea level.
Climate
Memphis has a semi-arid climate, with hot summers and cold winters. The average annual temperature is 64°F, with an average high of 87°F in July and an average low of 37°F in January. The average annual precipitation is 19.5 inches, with the wettest month being May, when an average of 3.5 inches of rain falls.
Demographics
As of the 2010 census, there were 1,845 people, 717 households, and 486 families residing in Memphis. The population density was 545.3 people per square mile. The racial makeup of the town was 81.2% White, 0.2% African American, 0.7% Native American, 0.2% Asian, 0.1% Pacific Islander, 15.3% from other races, and 2.3% from two or more races. Hispanic or Latino of any race were 28.2% of the population.
Economy
The economy of Memphis is largely based on agriculture and ranching. The town is home to several large farms and ranches, as well as several small businesses. The town is also home to a number of oil and gas companies, as well as a few manufacturing companies.
The town is served by the Memphis Independent School District, which includes two elementary schools, one middle school, and one high school. The town is also home to a branch of the Hall County Library.
History
Memphis was founded in 1887 by a group of settlers from Arkansas. The town was named after the city of Memphis, Tennessee, and was incorporated in 1891. The town grew rapidly in the early 20th century, and by the 1920s, it had become a major center for cotton production.
In the 1950s, the town began to decline as the cotton industry moved away from the area. The town's population decreased steadily until the 1980s, when it began to stabilize. Today, Memphis is a small, rural town with a population of just over 1,800.
Common Questions
What is Per Capita Income in Memphis?
Per Capita income in Memphis is $23,439.
What is the Median Family Income in Memphis?
Median Family Income in Memphis is $50,335.
What is the Median Household income in Memphis?
Median Household Income in Memphis is $43,901.
What is Income or Wage Gap in Memphis?
Income or Wage Gap in Memphis is 3.6%.
Women in Memphis earn 96.4 cents for every dollar earned by a man.
What is Family Income Deficit in Memphis?
Family Income Deficit in Memphis is $16,115.
Families that are below poverty line in Memphis earn $16,115 less on average than the poverty threshold level.
What is Inequality or Gini Index in Memphis?
Inequality or Gini Index in Memphis is 0.44.
What is the Total Population of Memphis?
Total Population of Memphis is 2,130.
What is the Total Male Population of Memphis?
Total Male Population of Memphis is 1,015.
What is the Total Female Population of Memphis?
Total Female Population of Memphis is 1,115.
What is the Ratio of Males per 100 Females in Memphis?
There are 91.03 Males per 100 Females in Memphis.
What is the Ratio of Females per 100 Males in Memphis?
There are 109.85 Females per 100 Males in Memphis.
What is the Median Population Age in Memphis?
Median Population Age in Memphis is 43.7 Years.
What is the Average Family Size in Memphis
Average Family Size in Memphis is 2.8 People.
What is the Average Household Size in Memphis
Average Household Size in Memphis is 2.4 People.
How Large is the Labor Force in Memphis?
There are 915 People in the Labor Forcein in Memphis.
What is the Percentage of People in the Labor Force in Memphis?
54.5% of People are in the Labor Force in Memphis.
What is the Unemployment Rate in Memphis?
Unemployment Rate in Memphis is 9.1%.