Mauriceville, TX Map & Demographics
Mauriceville Map
Mauriceville Overview
$31,987
PER CAPITA INCOME
$82,813
AVG FAMILY INCOME
$68,190
AVG HOUSEHOLD INCOME
53.9%
WAGE / INCOME GAP [ % ]
46.1¢/ $1
WAGE / INCOME GAP [ $ ]
0.42
INEQUALITY / GINI INDEX
2,531
TOTAL POPULATION
1,144
MALE POPULATION
1,387
FEMALE POPULATION
82.48
MALES / 100 FEMALES
121.24
FEMALES / 100 MALES
39.0
MEDIAN AGE
3.0
AVG FAMILY SIZE
2.7
AVG HOUSEHOLD SIZE
1,183
LABOR FORCE [ PEOPLE ]
59.8%
PERCENT IN LABOR FORCE
8.2%
UNEMPLOYMENT RATE
Mauriceville Area Codes
Income in Mauriceville
Income Overview in Mauriceville
Per Capita Income in Mauriceville is $31,987, while median incomes of families and households are $82,813 and $68,190 respectively.
| Characteristic | Number | Measure |
| Per Capita Income | 2,531 | $31,987 |
| Median Family Income | 732 | $82,813 |
| Mean Family Income | 732 | $96,114 |
| Median Household Income | 942 | $68,190 |
| Mean Household Income | 942 | $85,023 |
| Income Deficit | 732 | $0 |
| Wage / Income Gap (%) | 2,531 | 53.90% |
| Wage / Income Gap ($) | 2,531 | 46.10¢ per $1 |
| Gini / Inequality Index | 2,531 | 0.42 |
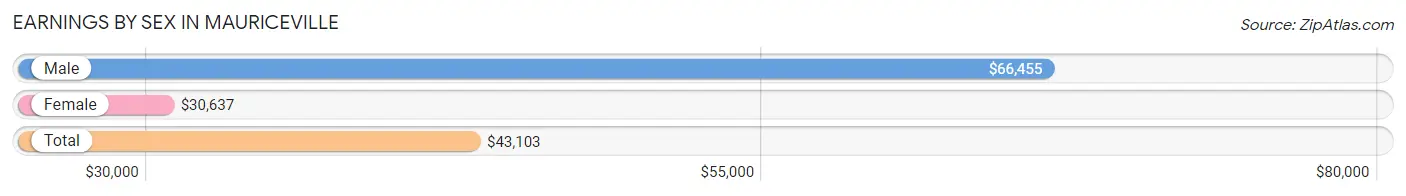
Earnings by Sex in Mauriceville
Average Earnings in Mauriceville are $43,103, $66,455 for men and $30,637 for women, a difference of 53.9%.
| Sex | Number | Average Earnings |
| Male | 583 (49.2%) | $66,455 |
| Female | 601 (50.8%) | $30,637 |
| Total | 1,184 (100.0%) | $43,103 |
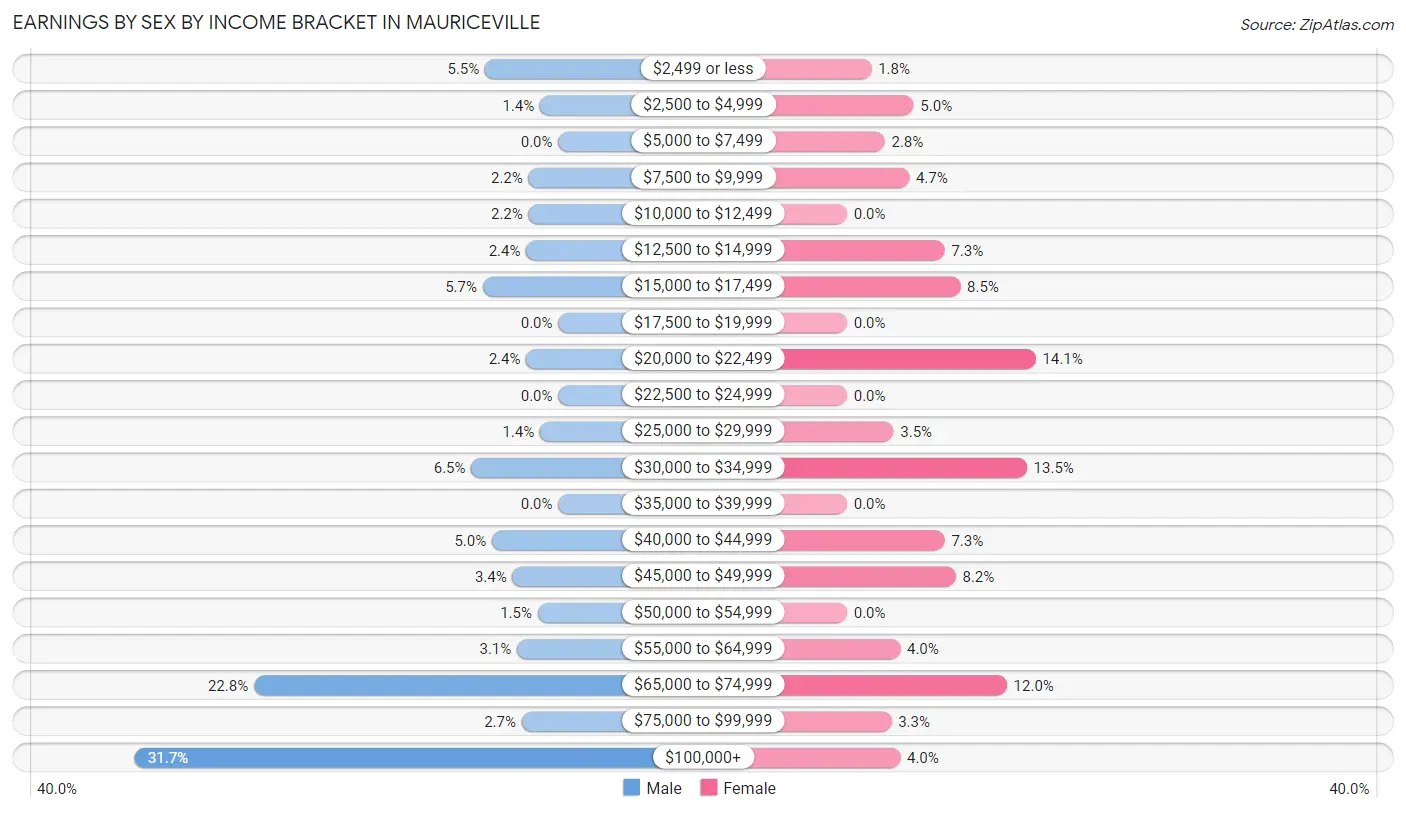
Earnings by Sex by Income Bracket in Mauriceville
The most common earnings brackets in Mauriceville are $100,000+ for men (185 | 31.7%) and $20,000 to $22,499 for women (85 | 14.1%).
| Income | Male | Female |
| $2,499 or less | 32 (5.5%) | 11 (1.8%) |
| $2,500 to $4,999 | 8 (1.4%) | 30 (5.0%) |
| $5,000 to $7,499 | 0 (0.0%) | 17 (2.8%) |
| $7,500 to $9,999 | 13 (2.2%) | 28 (4.7%) |
| $10,000 to $12,499 | 13 (2.2%) | 0 (0.0%) |
| $12,500 to $14,999 | 14 (2.4%) | 44 (7.3%) |
| $15,000 to $17,499 | 33 (5.7%) | 51 (8.5%) |
| $17,500 to $19,999 | 0 (0.0%) | 0 (0.0%) |
| $20,000 to $22,499 | 14 (2.4%) | 85 (14.1%) |
| $22,500 to $24,999 | 0 (0.0%) | 0 (0.0%) |
| $25,000 to $29,999 | 8 (1.4%) | 21 (3.5%) |
| $30,000 to $34,999 | 38 (6.5%) | 81 (13.5%) |
| $35,000 to $39,999 | 0 (0.0%) | 0 (0.0%) |
| $40,000 to $44,999 | 29 (5.0%) | 44 (7.3%) |
| $45,000 to $49,999 | 20 (3.4%) | 49 (8.2%) |
| $50,000 to $54,999 | 9 (1.5%) | 0 (0.0%) |
| $55,000 to $64,999 | 18 (3.1%) | 24 (4.0%) |
| $65,000 to $74,999 | 133 (22.8%) | 72 (12.0%) |
| $75,000 to $99,999 | 16 (2.7%) | 20 (3.3%) |
| $100,000+ | 185 (31.7%) | 24 (4.0%) |
| Total | 583 (100.0%) | 601 (100.0%) |
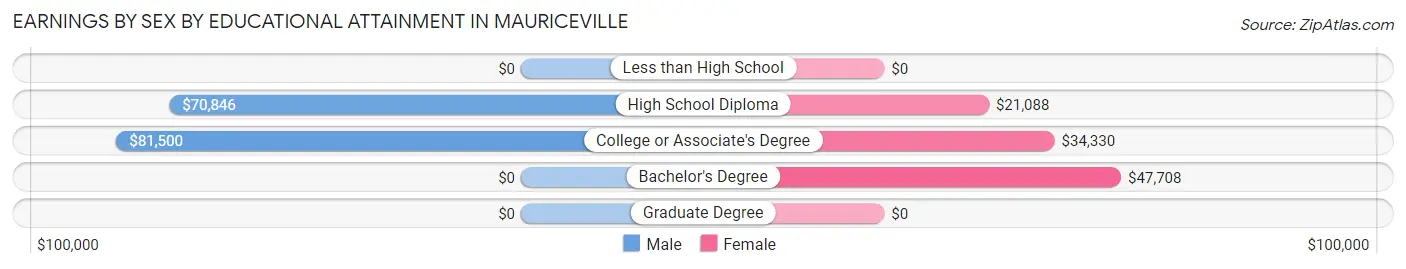
Earnings by Sex by Educational Attainment in Mauriceville
Average earnings in Mauriceville are $71,250 for men and $33,125 for women, a difference of 53.5%. Men with an educational attainment of college or associate's degree enjoy the highest average annual earnings of $81,500, while those with high school diploma education earn the least with $70,846. Women with an educational attainment of bachelor's degree earn the most with the average annual earnings of $47,708, while those with high school diploma education have the smallest earnings of $21,088.
| Educational Attainment | Male Income | Female Income |
| Less than High School | - | - |
| High School Diploma | $70,846 | $21,088 |
| College or Associate's Degree | $81,500 | $34,330 |
| Bachelor's Degree | - | - |
| Graduate Degree | - | - |
| Total | $71,250 | $33,125 |
Family Income in Mauriceville
Family Income Brackets in Mauriceville
According to the Mauriceville family income data, there are 156 families falling into the $100,000 to $149,999 income range, which is the most common income bracket and makes up 21.3% of all families. Conversely, the $15,000 to $24,999 income bracket is the least frequent group with only 11 families (1.5%) belonging to this category.
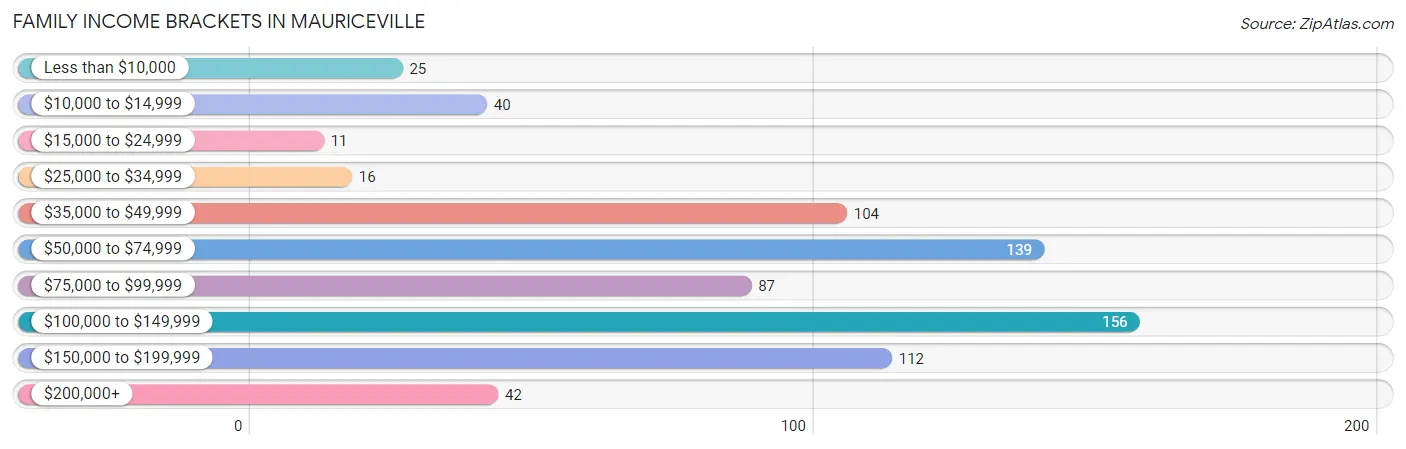
| Income Bracket | # Families | % Families |
| Less than $10,000 | 25 | 3.4% |
| $10,000 to $14,999 | 40 | 5.5% |
| $15,000 to $24,999 | 11 | 1.5% |
| $25,000 to $34,999 | 16 | 2.2% |
| $35,000 to $49,999 | 104 | 14.2% |
| $50,000 to $74,999 | 139 | 19.0% |
| $75,000 to $99,999 | 87 | 11.9% |
| $100,000 to $149,999 | 156 | 21.3% |
| $150,000 to $199,999 | 112 | 15.3% |
| $200,000+ | 42 | 5.7% |
Family Income by Famaliy Size in Mauriceville
5-person families (28 | 3.8%) account for the highest median family income in Mauriceville with $190,682 per family, while 3-person families (237 | 32.4%) have the highest median income of $42,043 per family member.
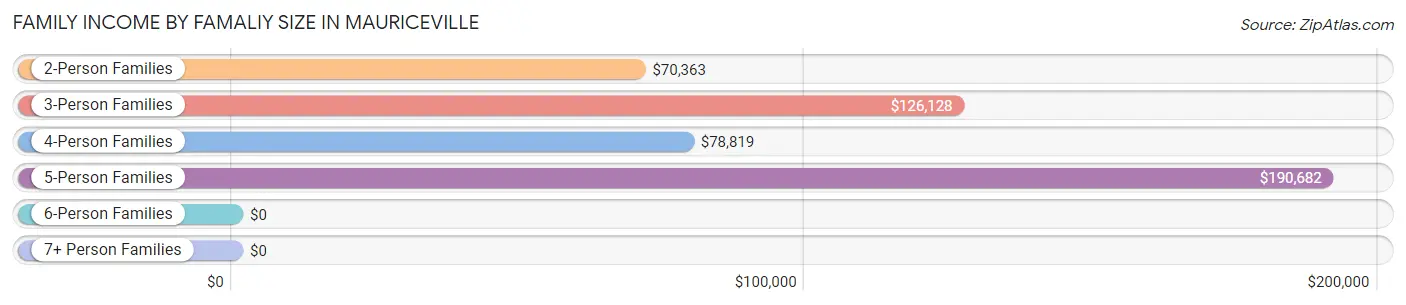
| Income Bracket | # Families | Median Income |
| 2-Person Families | 333 (45.5%) | $70,363 |
| 3-Person Families | 237 (32.4%) | $126,128 |
| 4-Person Families | 121 (16.5%) | $78,819 |
| 5-Person Families | 28 (3.8%) | $190,682 |
| 6-Person Families | 13 (1.8%) | $0 |
| 7+ Person Families | 0 (0.0%) | $0 |
| Total | 732 (100.0%) | $82,813 |
Family Income by Number of Earners in Mauriceville
The median family income in Mauriceville is $82,813, with families comprising 3+ earners (35) having the highest median family income of $136,146, while families with no earners (86) have the lowest median family income of $40,903, accounting for 4.8% and 11.7% of families, respectively.
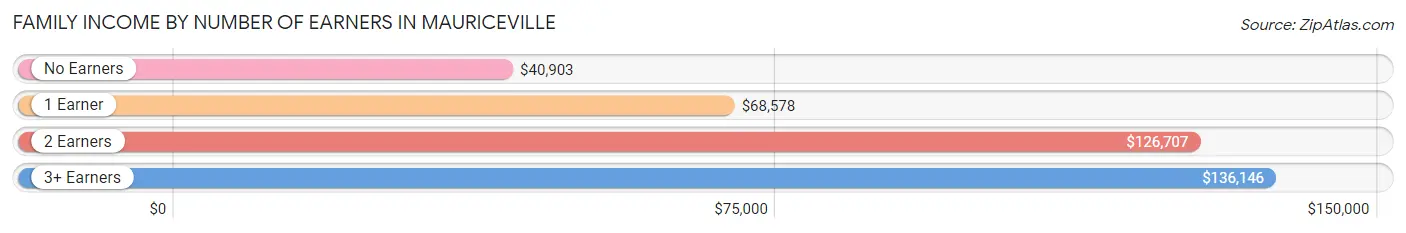
| Number of Earners | # Families | Median Income |
| No Earners | 86 (11.7%) | $40,903 |
| 1 Earner | 363 (49.6%) | $68,578 |
| 2 Earners | 248 (33.9%) | $126,707 |
| 3+ Earners | 35 (4.8%) | $136,146 |
| Total | 732 (100.0%) | $82,813 |
Household Income in Mauriceville
Household Income Brackets in Mauriceville
With 187 households falling in the category, the $50,000 to $74,999 income range is the most frequent in Mauriceville, accounting for 19.9% of all households. In contrast, only 27 households (2.9%) fall into the $25,000 to $34,999 income bracket, making it the least populous group.
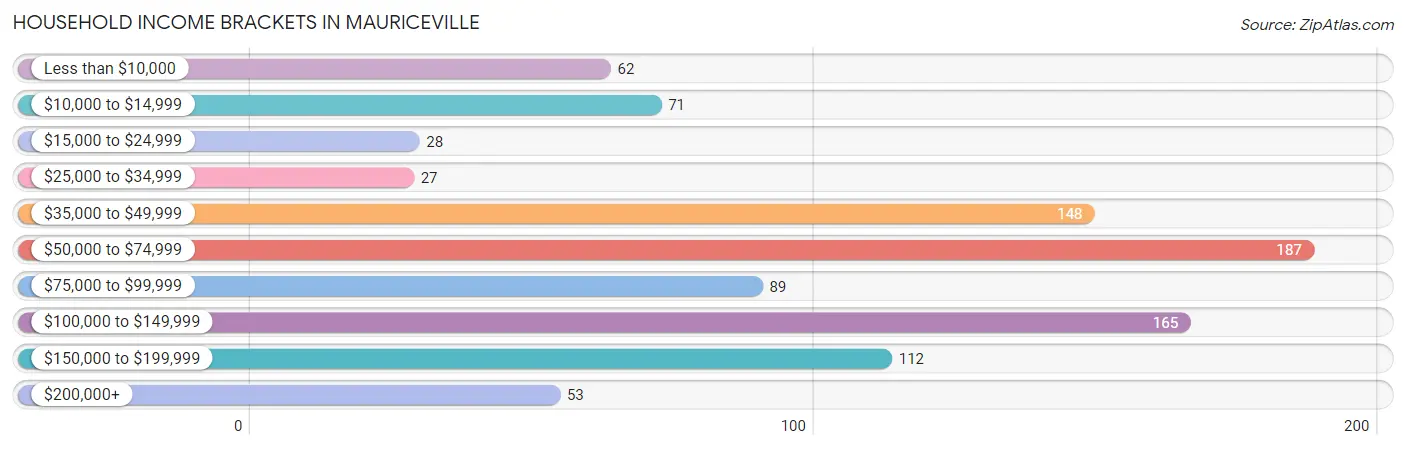
| Income Bracket | # Households | % Households |
| Less than $10,000 | 62 | 6.6% |
| $10,000 to $14,999 | 71 | 7.5% |
| $15,000 to $24,999 | 28 | 3.0% |
| $25,000 to $34,999 | 27 | 2.9% |
| $35,000 to $49,999 | 148 | 15.7% |
| $50,000 to $74,999 | 187 | 19.9% |
| $75,000 to $99,999 | 89 | 9.4% |
| $100,000 to $149,999 | 165 | 17.5% |
| $150,000 to $199,999 | 112 | 11.9% |
| $200,000+ | 53 | 5.6% |
Household Income by Householder Age in Mauriceville
The median household income in Mauriceville is $68,190, with the highest median household income of $105,893 found in the 45 to 64 years age bracket for the primary householder. A total of 352 households (37.4%) fall into this category. Meanwhile, the 15 to 24 years age bracket for the primary householder has the lowest median household income of $0, with 115 households (12.2%) in this group.
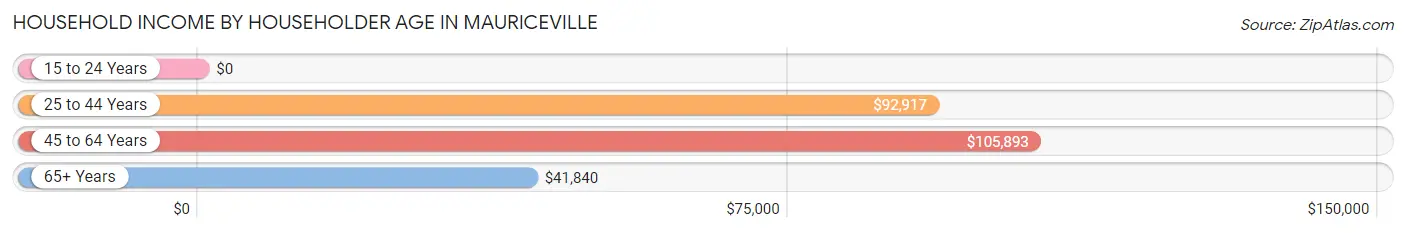
| Income Bracket | # Households | Median Income |
| 15 to 24 Years | 115 (12.2%) | $0 |
| 25 to 44 Years | 256 (27.2%) | $92,917 |
| 45 to 64 Years | 352 (37.4%) | $105,893 |
| 65+ Years | 219 (23.3%) | $41,840 |
| Total | 942 (100.0%) | $68,190 |
Poverty in Mauriceville
Income Below Poverty by Sex and Age in Mauriceville
With 12.7% poverty level for males and 19.8% for females among the residents of Mauriceville, 75 year old and over males and 15 year old females are the most vulnerable to poverty, with 19 males (26.0%) and 15 females (100.0%) in their respective age groups living below the poverty level.
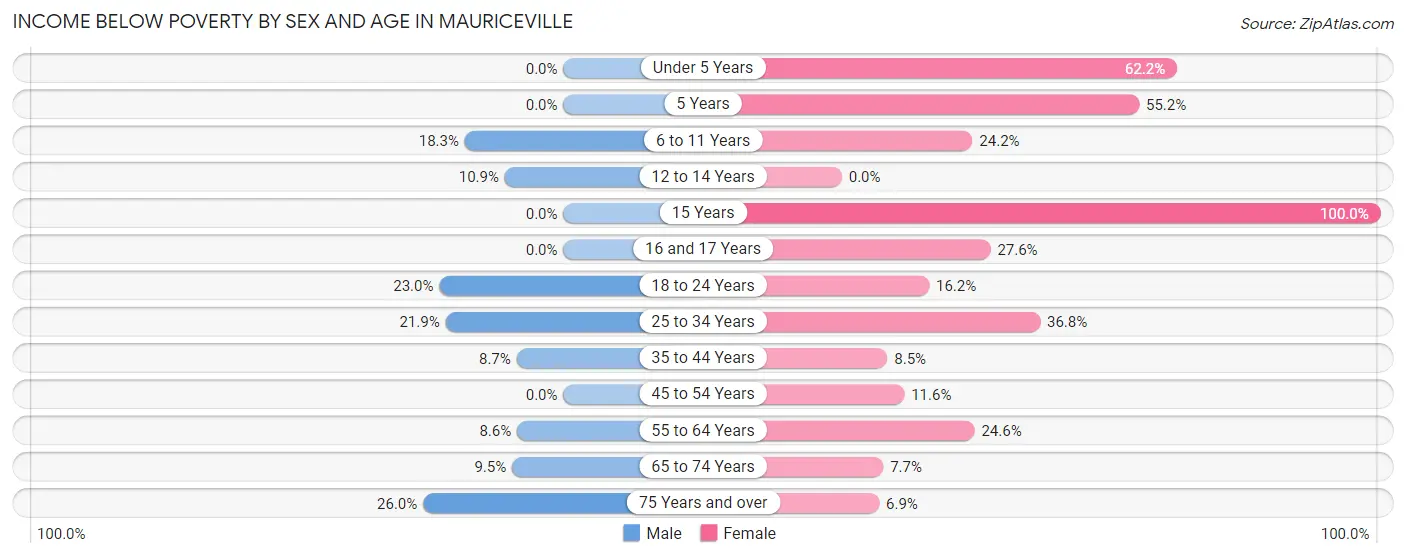
| Age Bracket | Male | Female |
| Under 5 Years | 0 (0.0%) | 28 (62.2%) |
| 5 Years | 0 (0.0%) | 32 (55.2%) |
| 6 to 11 Years | 15 (18.3%) | 32 (24.2%) |
| 12 to 14 Years | 15 (10.9%) | 0 (0.0%) |
| 15 Years | 0 (0.0%) | 15 (100.0%) |
| 16 and 17 Years | 0 (0.0%) | 16 (27.6%) |
| 18 to 24 Years | 38 (23.0%) | 17 (16.2%) |
| 25 to 34 Years | 14 (21.9%) | 39 (36.8%) |
| 35 to 44 Years | 13 (8.7%) | 23 (8.5%) |
| 45 to 54 Years | 0 (0.0%) | 19 (11.6%) |
| 55 to 64 Years | 22 (8.6%) | 33 (24.6%) |
| 65 to 74 Years | 8 (9.5%) | 7 (7.7%) |
| 75 Years and over | 19 (26.0%) | 11 (6.9%) |
| Total | 144 (12.7%) | 272 (19.8%) |
Income Above Poverty by Sex and Age in Mauriceville
According to the poverty statistics in Mauriceville, males aged under 5 years and females aged 12 to 14 years are the age groups that are most secure financially, with 100.0% of males and 100.0% of females in these age groups living above the poverty line.
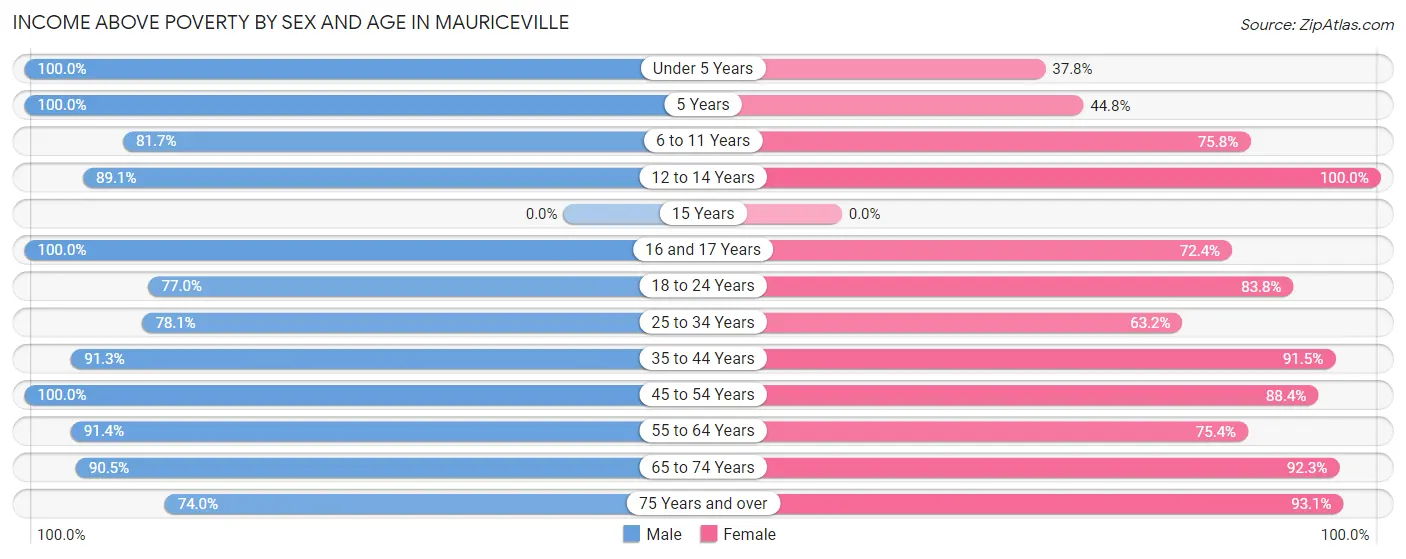
| Age Bracket | Male | Female |
| Under 5 Years | 11 (100.0%) | 17 (37.8%) |
| 5 Years | 12 (100.0%) | 26 (44.8%) |
| 6 to 11 Years | 67 (81.7%) | 100 (75.8%) |
| 12 to 14 Years | 123 (89.1%) | 38 (100.0%) |
| 15 Years | 0 (0.0%) | 0 (0.0%) |
| 16 and 17 Years | 41 (100.0%) | 42 (72.4%) |
| 18 to 24 Years | 127 (77.0%) | 88 (83.8%) |
| 25 to 34 Years | 50 (78.1%) | 67 (63.2%) |
| 35 to 44 Years | 137 (91.3%) | 249 (91.5%) |
| 45 to 54 Years | 57 (100.0%) | 145 (88.4%) |
| 55 to 64 Years | 234 (91.4%) | 101 (75.4%) |
| 65 to 74 Years | 76 (90.5%) | 84 (92.3%) |
| 75 Years and over | 54 (74.0%) | 148 (93.1%) |
| Total | 989 (87.3%) | 1,105 (80.2%) |
Income Below Poverty Among Married-Couple Families in Mauriceville
The poverty statistics for married-couple families in Mauriceville show that 3.6% or 19 of the total 522 families live below the poverty line. Families with no children have the highest poverty rate of 6.2%, comprising of 19 families. On the other hand, families with 1 or 2 children have the lowest poverty rate of 0.0%, which includes 0 families.
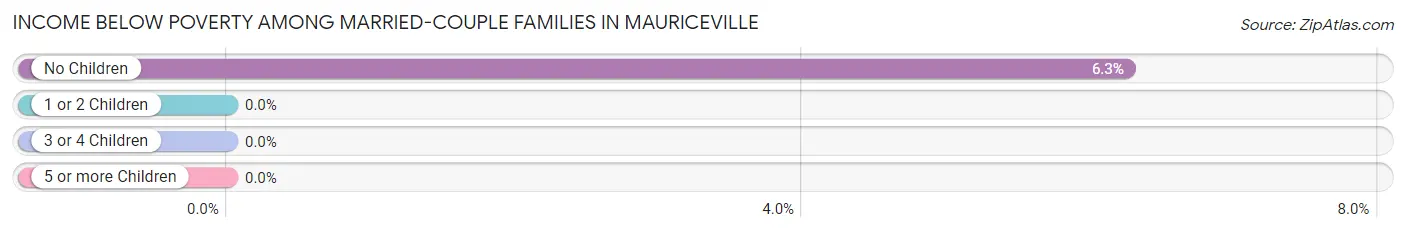
| Children | Above Poverty | Below Poverty |
| No Children | 285 (93.8%) | 19 (6.2%) |
| 1 or 2 Children | 194 (100.0%) | 0 (0.0%) |
| 3 or 4 Children | 24 (100.0%) | 0 (0.0%) |
| 5 or more Children | 0 (0.0%) | 0 (0.0%) |
| Total | 503 (96.4%) | 19 (3.6%) |
Income Below Poverty Among Single-Parent Households in Mauriceville
According to the poverty data in Mauriceville, 49.2% or 32 single-father households and 26.9% or 39 single-mother households are living below the poverty line. Among single-father households, those with no children have the highest poverty rate, with 32 households (57.1%) experiencing poverty. Likewise, among single-mother households, those with 3 or 4 children have the highest poverty rate, with 39 households (100.0%) falling below the poverty line.
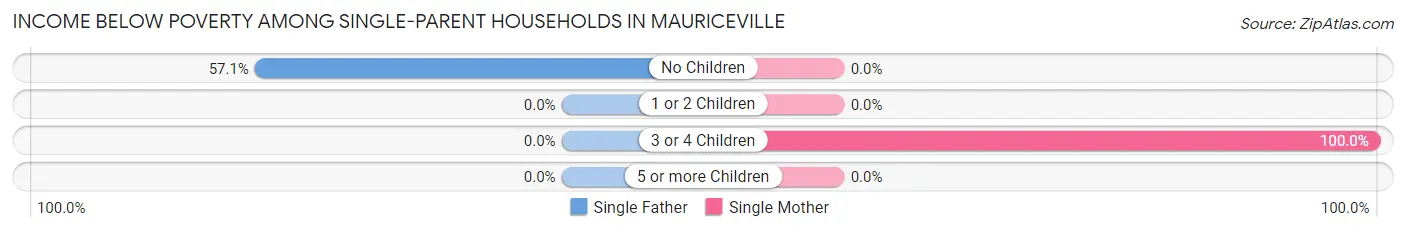
| Children | Single Father | Single Mother |
| No Children | 32 (57.1%) | 0 (0.0%) |
| 1 or 2 Children | 0 (0.0%) | 0 (0.0%) |
| 3 or 4 Children | 0 (0.0%) | 39 (100.0%) |
| 5 or more Children | 0 (0.0%) | 0 (0.0%) |
| Total | 32 (49.2%) | 39 (26.9%) |
Income Below Poverty Among Married-Couple vs Single-Parent Households in Mauriceville
The poverty data for Mauriceville shows that 19 of the married-couple family households (3.6%) and 71 of the single-parent households (33.8%) are living below the poverty level. Within the married-couple family households, those with no children have the highest poverty rate, with 19 households (6.2%) falling below the poverty line. Among the single-parent households, those with 3 or 4 children have the highest poverty rate, with 39 household (100.0%) living below poverty.
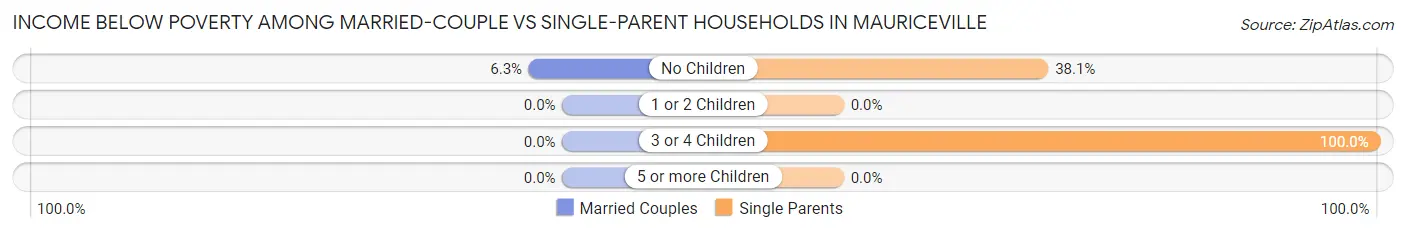
| Children | Married-Couple Families | Single-Parent Households |
| No Children | 19 (6.2%) | 32 (38.1%) |
| 1 or 2 Children | 0 (0.0%) | 0 (0.0%) |
| 3 or 4 Children | 0 (0.0%) | 39 (100.0%) |
| 5 or more Children | 0 (0.0%) | 0 (0.0%) |
| Total | 19 (3.6%) | 71 (33.8%) |
Race in Mauriceville
The most populous races in Mauriceville are White / Caucasian (2,347 | 92.7%), Hispanic or Latino (175 | 6.9%), and Two or more Races (159 | 6.3%).
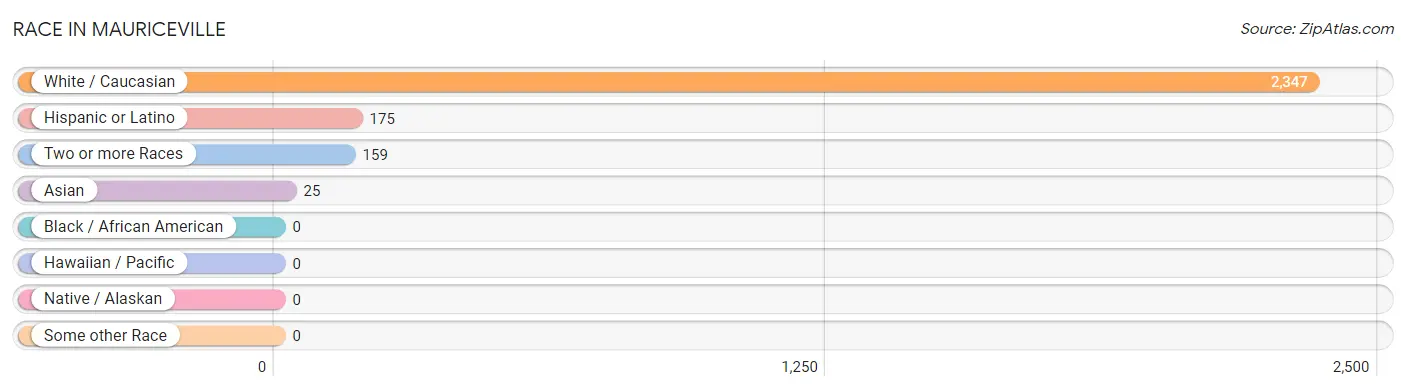
| Race | # Population | % Population |
| Asian | 25 | 1.0% |
| Black / African American | 0 | 0.0% |
| Hawaiian / Pacific | 0 | 0.0% |
| Hispanic or Latino | 175 | 6.9% |
| Native / Alaskan | 0 | 0.0% |
| White / Caucasian | 2,347 | 92.7% |
| Two or more Races | 159 | 6.3% |
| Some other Race | 0 | 0.0% |
| Total | 2,531 | 100.0% |
Ancestry in Mauriceville
The most populous ancestries reported in Mauriceville are French (328 | 13.0%), American (304 | 12.0%), German (283 | 11.2%), English (193 | 7.6%), and Mexican (145 | 5.7%), together accounting for 49.5% of all Mauriceville residents.
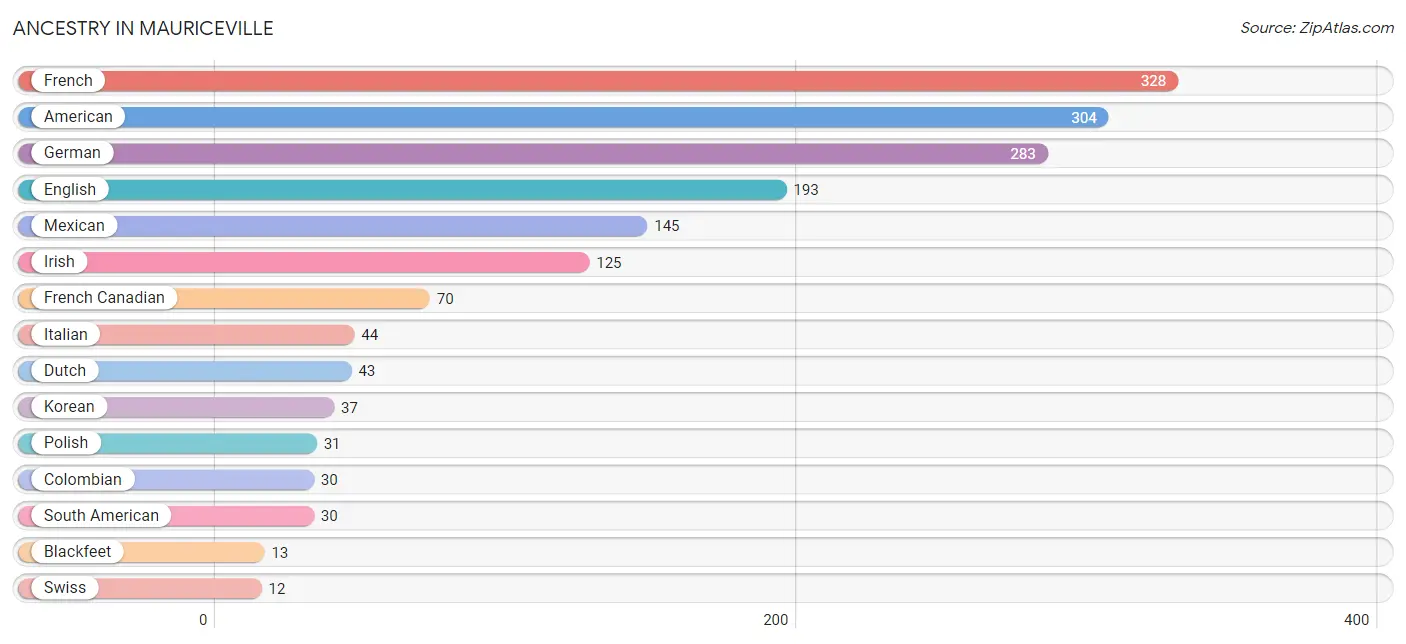
| Ancestry | # Population | % Population |
| American | 304 | 12.0% |
| Austrian | 2 | 0.1% |
| Blackfeet | 13 | 0.5% |
| Cajun | 8 | 0.3% |
| Canadian | 4 | 0.2% |
| Cherokee | 10 | 0.4% |
| Colombian | 30 | 1.2% |
| Dutch | 43 | 1.7% |
| English | 193 | 7.6% |
| French | 328 | 13.0% |
| French Canadian | 70 | 2.8% |
| German | 283 | 11.2% |
| Irish | 125 | 4.9% |
| Italian | 44 | 1.7% |
| Korean | 37 | 1.5% |
| Mexican | 145 | 5.7% |
| Polish | 31 | 1.2% |
| Scandinavian | 9 | 0.4% |
| Scottish | 9 | 0.4% |
| Serbian | 6 | 0.2% |
| South American | 30 | 1.2% |
| Swiss | 12 | 0.5% |
| Welsh | 5 | 0.2% | View All 23 Rows |
Immigrants in Mauriceville
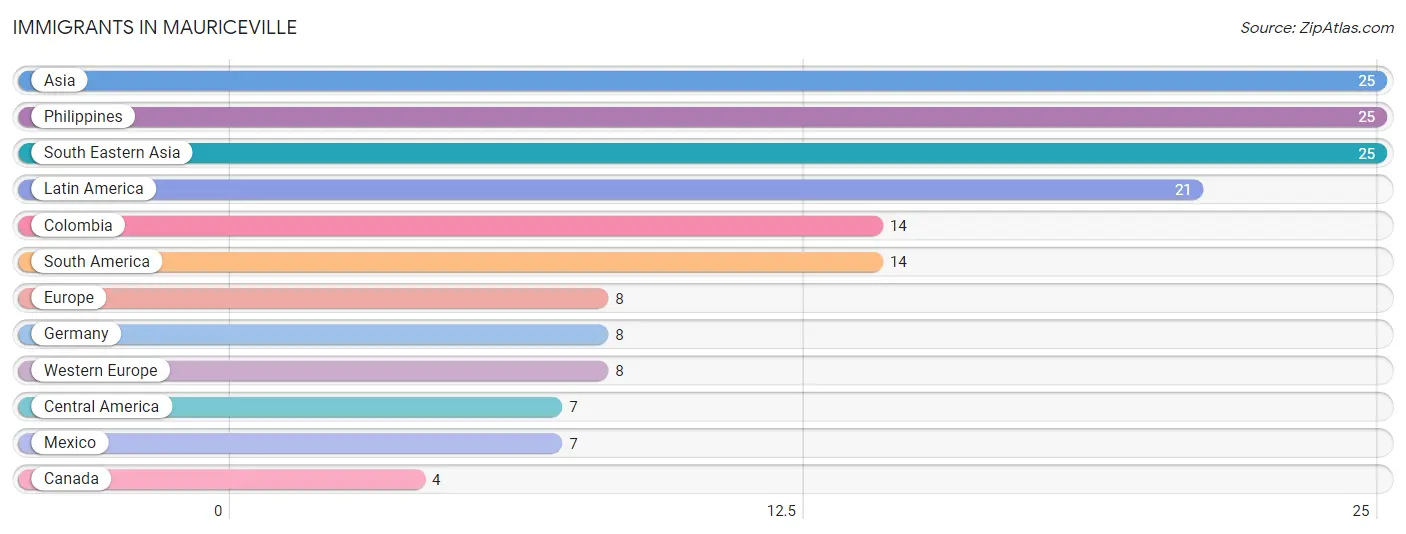
The most numerous immigrant groups reported in Mauriceville came from Asia (25 | 1.0%), Philippines (25 | 1.0%), South Eastern Asia (25 | 1.0%), Latin America (21 | 0.8%), and Colombia (14 | 0.5%), together accounting for 4.4% of all Mauriceville residents.
| Immigration Origin | # Population | % Population |
| Asia | 25 | 1.0% |
| Canada | 4 | 0.2% |
| Central America | 7 | 0.3% |
| Colombia | 14 | 0.5% |
| Europe | 8 | 0.3% |
| Germany | 8 | 0.3% |
| Latin America | 21 | 0.8% |
| Mexico | 7 | 0.3% |
| Philippines | 25 | 1.0% |
| South America | 14 | 0.5% |
| South Eastern Asia | 25 | 1.0% |
| Western Europe | 8 | 0.3% | View All 12 Rows |
Sex and Age in Mauriceville
Sex and Age in Mauriceville
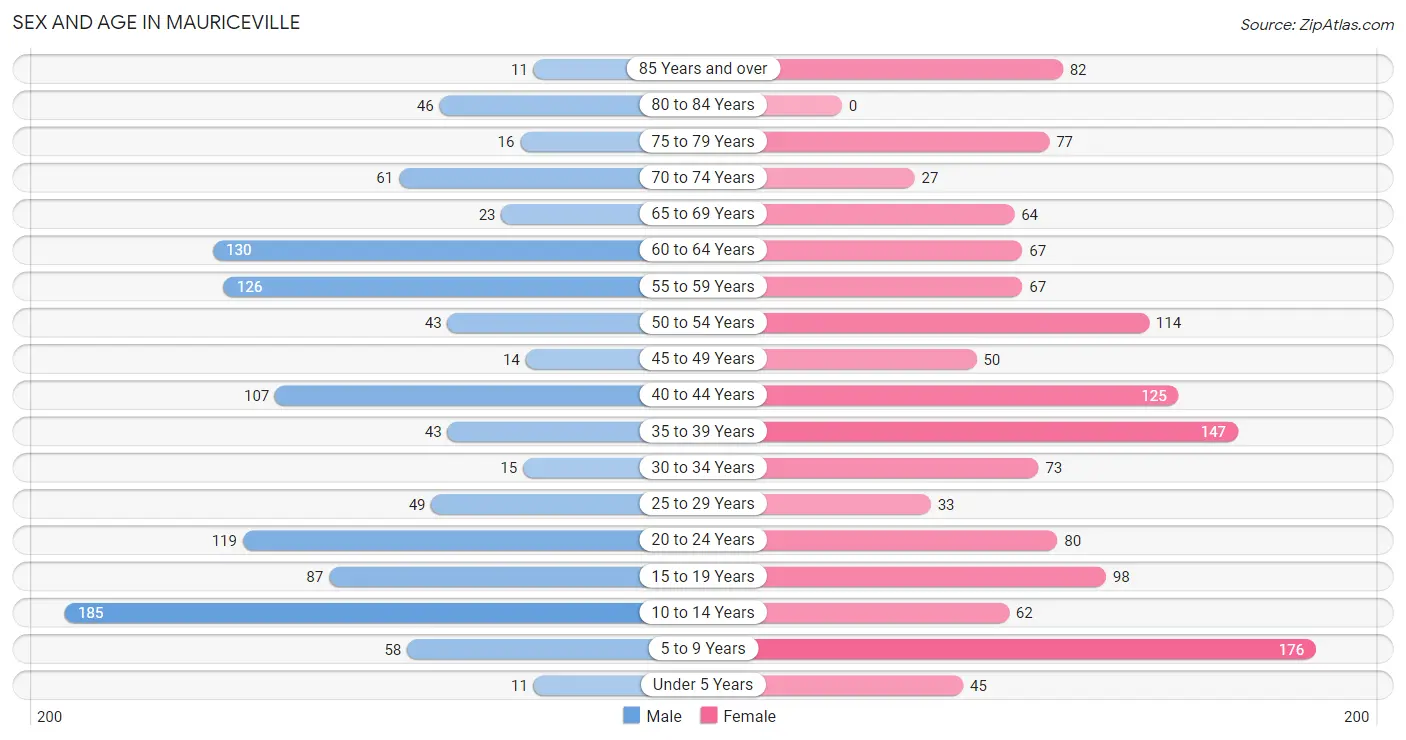
The most populous age groups in Mauriceville are 10 to 14 Years (185 | 16.2%) for men and 5 to 9 Years (176 | 12.7%) for women.
| Age Bracket | Male | Female |
| Under 5 Years | 11 (1.0%) | 45 (3.2%) |
| 5 to 9 Years | 58 (5.1%) | 176 (12.7%) |
| 10 to 14 Years | 185 (16.2%) | 62 (4.5%) |
| 15 to 19 Years | 87 (7.6%) | 98 (7.1%) |
| 20 to 24 Years | 119 (10.4%) | 80 (5.8%) |
| 25 to 29 Years | 49 (4.3%) | 33 (2.4%) |
| 30 to 34 Years | 15 (1.3%) | 73 (5.3%) |
| 35 to 39 Years | 43 (3.8%) | 147 (10.6%) |
| 40 to 44 Years | 107 (9.3%) | 125 (9.0%) |
| 45 to 49 Years | 14 (1.2%) | 50 (3.6%) |
| 50 to 54 Years | 43 (3.8%) | 114 (8.2%) |
| 55 to 59 Years | 126 (11.0%) | 67 (4.8%) |
| 60 to 64 Years | 130 (11.4%) | 67 (4.8%) |
| 65 to 69 Years | 23 (2.0%) | 64 (4.6%) |
| 70 to 74 Years | 61 (5.3%) | 27 (1.9%) |
| 75 to 79 Years | 16 (1.4%) | 77 (5.6%) |
| 80 to 84 Years | 46 (4.0%) | 0 (0.0%) |
| 85 Years and over | 11 (1.0%) | 82 (5.9%) |
| Total | 1,144 (100.0%) | 1,387 (100.0%) |
Families and Households in Mauriceville
Median Family Size in Mauriceville
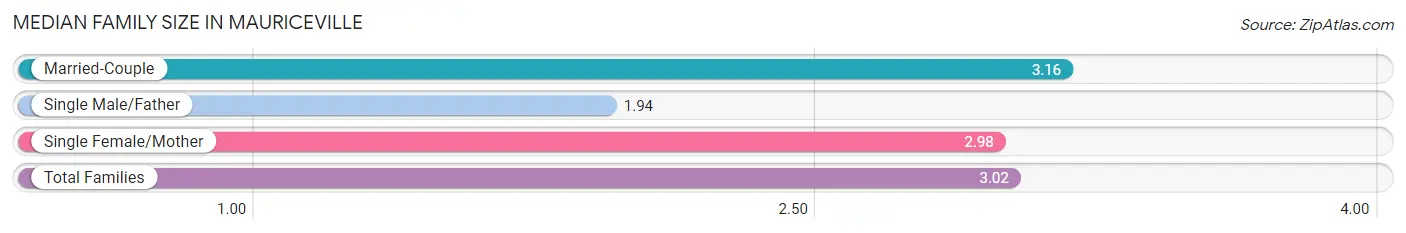
The median family size in Mauriceville is 3.02 persons per family, with married-couple families (522 | 71.3%) accounting for the largest median family size of 3.16 persons per family. On the other hand, single male/father families (65 | 8.9%) represent the smallest median family size with 1.94 persons per family.
| Family Type | # Families | Family Size |
| Married-Couple | 522 (71.3%) | 3.16 |
| Single Male/Father | 65 (8.9%) | 1.94 |
| Single Female/Mother | 145 (19.8%) | 2.98 |
| Total Families | 732 (100.0%) | 3.02 |
Median Household Size in Mauriceville
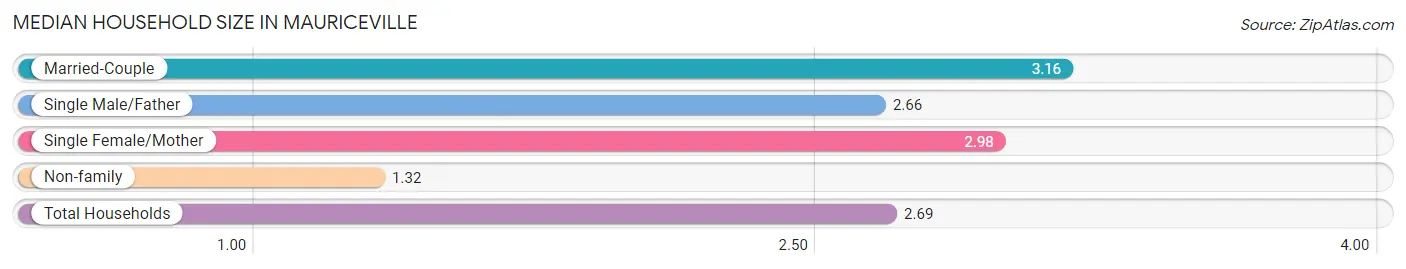
The median household size in Mauriceville is 2.69 persons per household, with married-couple households (522 | 55.4%) accounting for the largest median household size of 3.16 persons per household. non-family households (210 | 22.3%) represent the smallest median household size with 1.32 persons per household.
| Household Type | # Households | Household Size |
| Married-Couple | 522 (55.4%) | 3.16 |
| Single Male/Father | 65 (6.9%) | 2.66 |
| Single Female/Mother | 145 (15.4%) | 2.98 |
| Non-family | 210 (22.3%) | 1.32 |
| Total Households | 942 (100.0%) | 2.69 |
Household Size by Marriage Status in Mauriceville
Out of a total of 942 households in Mauriceville, 732 (77.7%) are family households, while 210 (22.3%) are nonfamily households. The most numerous type of family households are 2-person households, comprising 321, and the most common type of nonfamily households are 1-person households, comprising 171.
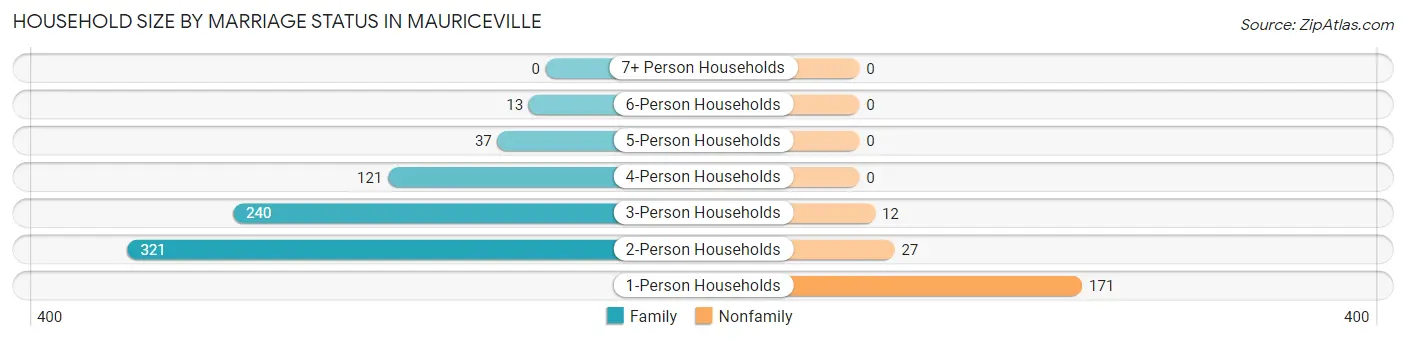
| Household Size | Family Households | Nonfamily Households |
| 1-Person Households | - | 171 (18.1%) |
| 2-Person Households | 321 (34.1%) | 27 (2.9%) |
| 3-Person Households | 240 (25.5%) | 12 (1.3%) |
| 4-Person Households | 121 (12.9%) | 0 (0.0%) |
| 5-Person Households | 37 (3.9%) | 0 (0.0%) |
| 6-Person Households | 13 (1.4%) | 0 (0.0%) |
| 7+ Person Households | 0 (0.0%) | 0 (0.0%) |
| Total | 732 (77.7%) | 210 (22.3%) |
Female Fertility in Mauriceville
Fertility by Age in Mauriceville
| Age Bracket | Women with Births | Births / 1,000 Women |
| 15 to 19 years | 0 (0.0%) | 0.0 |
| 20 to 34 years | 0 (0.0%) | 0.0 |
| 35 to 50 years | 0 (0.0%) | 0.0 |
| Total | 0 (0.0%) | 0.0 |
Fertility by Age by Marriage Status in Mauriceville
| Age Bracket | Married | Unmarried |
| 15 to 19 years | 0 (0.0%) | 0 (0.0%) |
| 20 to 34 years | 0 (0.0%) | 0 (0.0%) |
| 35 to 50 years | 0 (0.0%) | 0 (0.0%) |
| Total | 0 (0.0%) | 0 (0.0%) |
Fertility by Education in Mauriceville
| Educational Attainment | Women with Births | Births / 1,000 Women |
| Less than High School | 0 (0.0%) | 0.0 |
| High School Diploma | 0 (0.0%) | 0.0 |
| College or Associate's Degree | 0 (0.0%) | 0.0 |
| Bachelor's Degree | 0 (0.0%) | 0.0 |
| Graduate Degree | 0 (0.0%) | 0.0 |
| Total | 0 (0.0%) | 0.0 |
Fertility by Education by Marriage Status in Mauriceville
| Educational Attainment | Married | Unmarried |
| Less than High School | 0 (0.0%) | 0 (0.0%) |
| High School Diploma | 0 (0.0%) | 0 (0.0%) |
| College or Associate's Degree | 0 (0.0%) | 0 (0.0%) |
| Bachelor's Degree | 0 (0.0%) | 0 (0.0%) |
| Graduate Degree | 0 (0.0%) | 0 (0.0%) |
| Total | 0 (0.0%) | 0 (0.0%) |
Employment Characteristics in Mauriceville
Employment by Class of Employer in Mauriceville
Among the 1,058 employed individuals in Mauriceville, private company employees (801 | 75.7%), state government employees (90 | 8.5%), and local government employees (75 | 7.1%) make up the most common classes of employment.
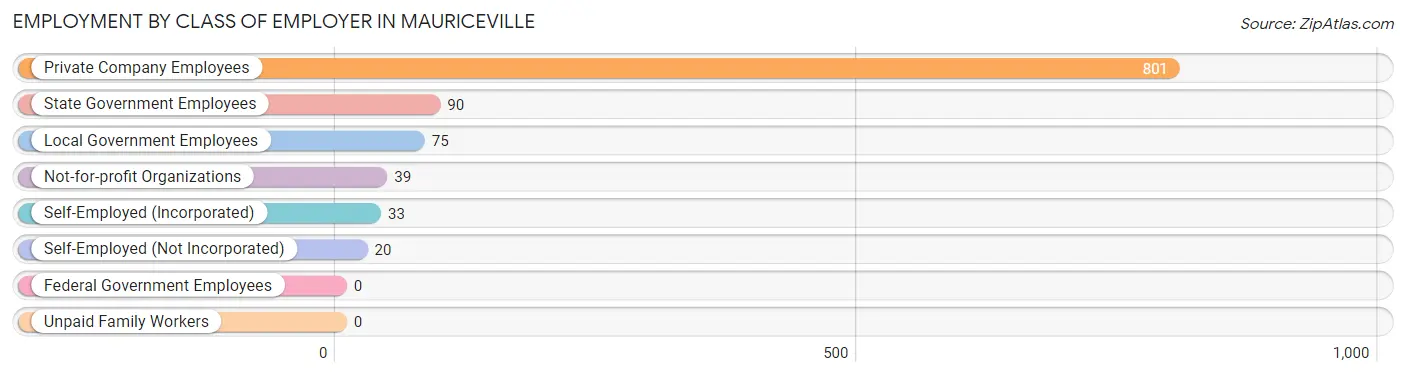
| Employer Class | # Employees | % Employees |
| Private Company Employees | 801 | 75.7% |
| Self-Employed (Incorporated) | 33 | 3.1% |
| Self-Employed (Not Incorporated) | 20 | 1.9% |
| Not-for-profit Organizations | 39 | 3.7% |
| Local Government Employees | 75 | 7.1% |
| State Government Employees | 90 | 8.5% |
| Federal Government Employees | 0 | 0.0% |
| Unpaid Family Workers | 0 | 0.0% |
| Total | 1,058 | 100.0% |
Employment Status by Age in Mauriceville
According to the labor force statistics for Mauriceville, out of the total population over 16 years of age (1,979), 59.8% or 1,183 individuals are in the labor force, with 8.2% or 97 of them unemployed. The age group with the highest labor force participation rate is 25 to 29 years, with 92.7% or 76 individuals in the labor force. Within the labor force, the 25 to 29 years age range has the highest percentage of unemployed individuals, with 39.5% or 30 of them being unemployed.
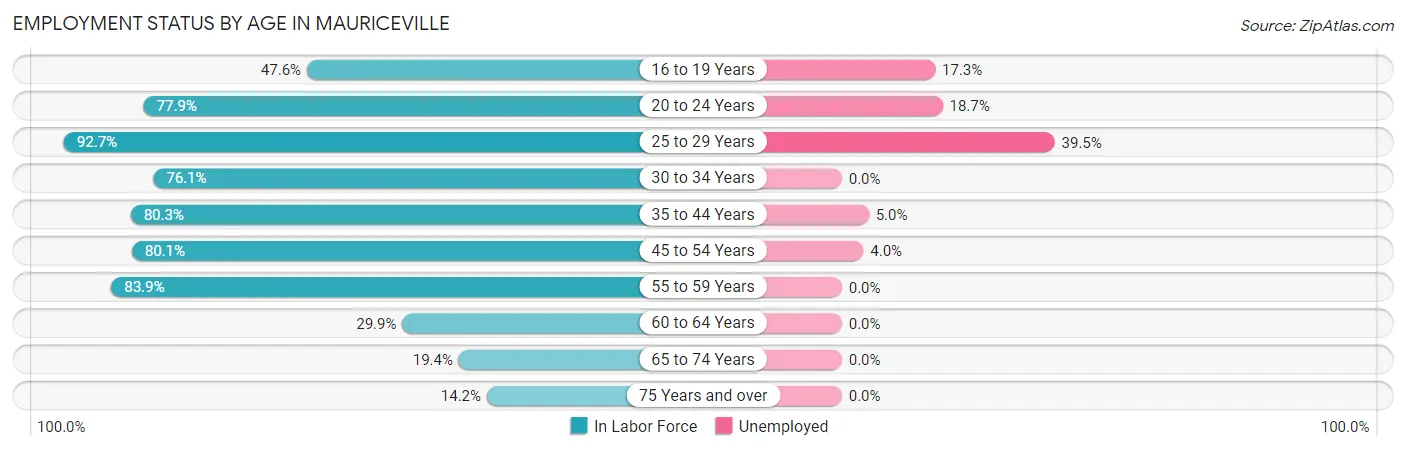
| Age Bracket | In Labor Force | Unemployed |
| 16 to 19 Years | 81 (47.6%) | 14 (17.3%) |
| 20 to 24 Years | 155 (77.9%) | 29 (18.7%) |
| 25 to 29 Years | 76 (92.7%) | 30 (39.5%) |
| 30 to 34 Years | 67 (76.1%) | 0 (0.0%) |
| 35 to 44 Years | 339 (80.3%) | 17 (5.0%) |
| 45 to 54 Years | 177 (80.1%) | 7 (4.0%) |
| 55 to 59 Years | 162 (83.9%) | 0 (0.0%) |
| 60 to 64 Years | 59 (29.9%) | 0 (0.0%) |
| 65 to 74 Years | 34 (19.4%) | 0 (0.0%) |
| 75 Years and over | 33 (14.2%) | 0 (0.0%) |
| Total | 1,183 (59.8%) | 97 (8.2%) |
Employment Status by Educational Attainment in Mauriceville
According to labor force statistics for Mauriceville, 73.2% of individuals (881) out of the total population between 25 and 64 years of age (1,203) are in the labor force, with 6.1% or 54 of them being unemployed. The group with the highest labor force participation rate are those with the educational attainment of bachelor's degree or higher, with 85.1% or 126 individuals in the labor force. Within the labor force, individuals with less than high school education have the highest percentage of unemployment, with 85.2% or 23 of them being unemployed.
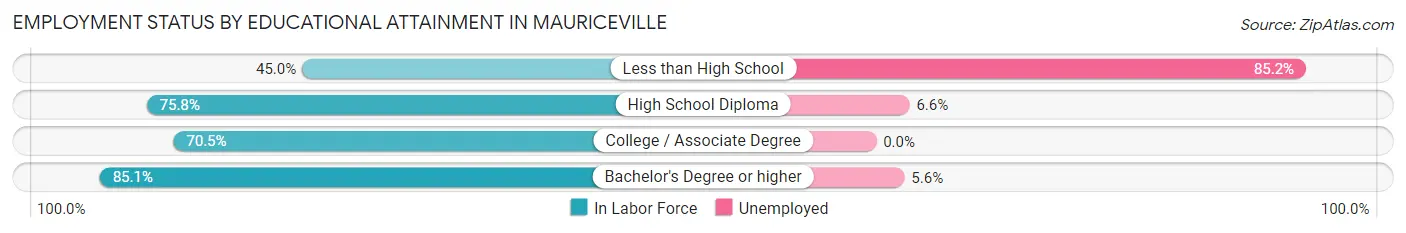
| Educational Attainment | In Labor Force | Unemployed |
| Less than High School | 27 (45.0%) | 51 (85.2%) |
| High School Diploma | 363 (75.8%) | 32 (6.6%) |
| College / Associate Degree | 364 (70.5%) | 0 (0.0%) |
| Bachelor's Degree or higher | 126 (85.1%) | 8 (5.6%) |
| Total | 881 (73.2%) | 73 (6.1%) |
Employment Occupations by Sex in Mauriceville
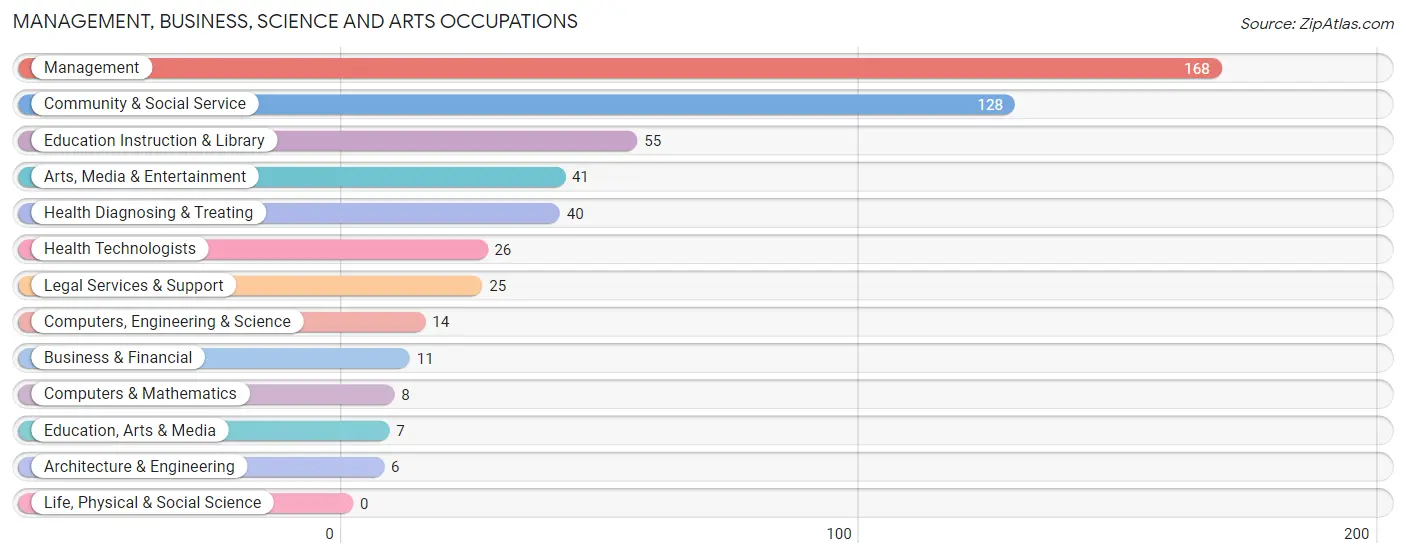
Management, Business, Science and Arts Occupations
The most common Management, Business, Science and Arts occupations in Mauriceville are Management (168 | 15.5%), Community & Social Service (128 | 11.8%), Education Instruction & Library (55 | 5.1%), Arts, Media & Entertainment (41 | 3.8%), and Health Diagnosing & Treating (40 | 3.7%).
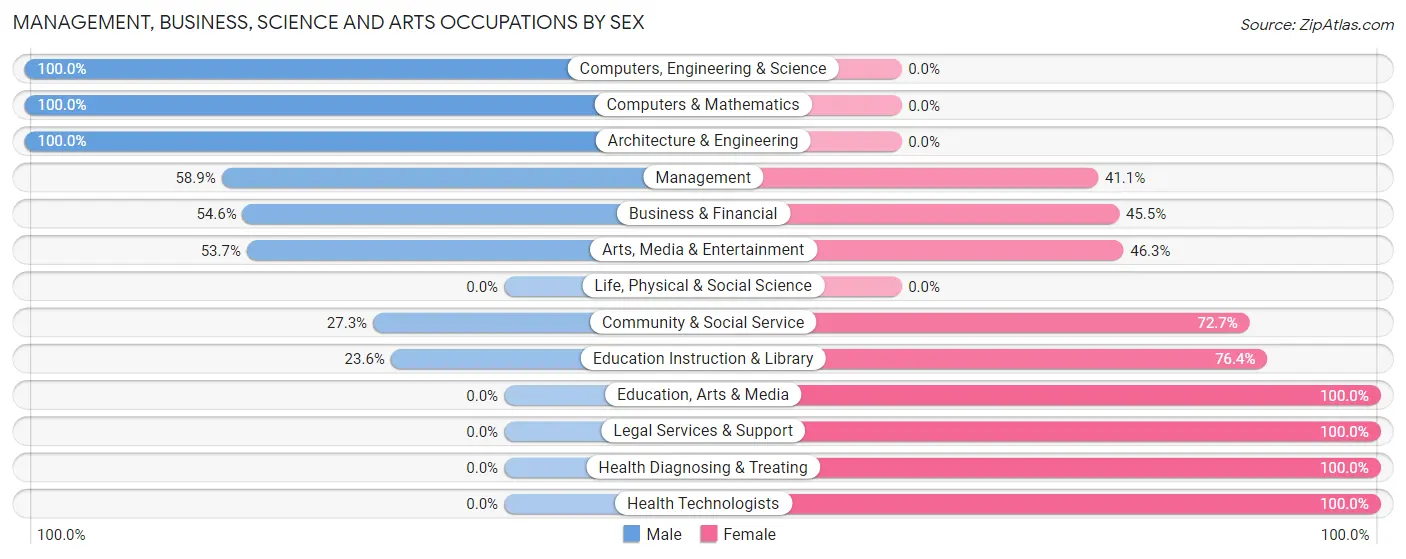
Management, Business, Science and Arts Occupations by Sex
Within the Management, Business, Science and Arts occupations in Mauriceville, the most male-oriented occupations are Computers, Engineering & Science (100.0%), Computers & Mathematics (100.0%), and Architecture & Engineering (100.0%), while the most female-oriented occupations are Education, Arts & Media (100.0%), Legal Services & Support (100.0%), and Health Diagnosing & Treating (100.0%).
| Occupation | Male | Female |
| Management | 99 (58.9%) | 69 (41.1%) |
| Business & Financial | 6 (54.5%) | 5 (45.5%) |
| Computers, Engineering & Science | 14 (100.0%) | 0 (0.0%) |
| Computers & Mathematics | 8 (100.0%) | 0 (0.0%) |
| Architecture & Engineering | 6 (100.0%) | 0 (0.0%) |
| Life, Physical & Social Science | 0 (0.0%) | 0 (0.0%) |
| Community & Social Service | 35 (27.3%) | 93 (72.7%) |
| Education, Arts & Media | 0 (0.0%) | 7 (100.0%) |
| Legal Services & Support | 0 (0.0%) | 25 (100.0%) |
| Education Instruction & Library | 13 (23.6%) | 42 (76.4%) |
| Arts, Media & Entertainment | 22 (53.7%) | 19 (46.3%) |
| Health Diagnosing & Treating | 0 (0.0%) | 40 (100.0%) |
| Health Technologists | 0 (0.0%) | 26 (100.0%) |
| Total (Category) | 154 (42.7%) | 207 (57.3%) |
| Total (Overall) | 510 (47.0%) | 576 (53.0%) |
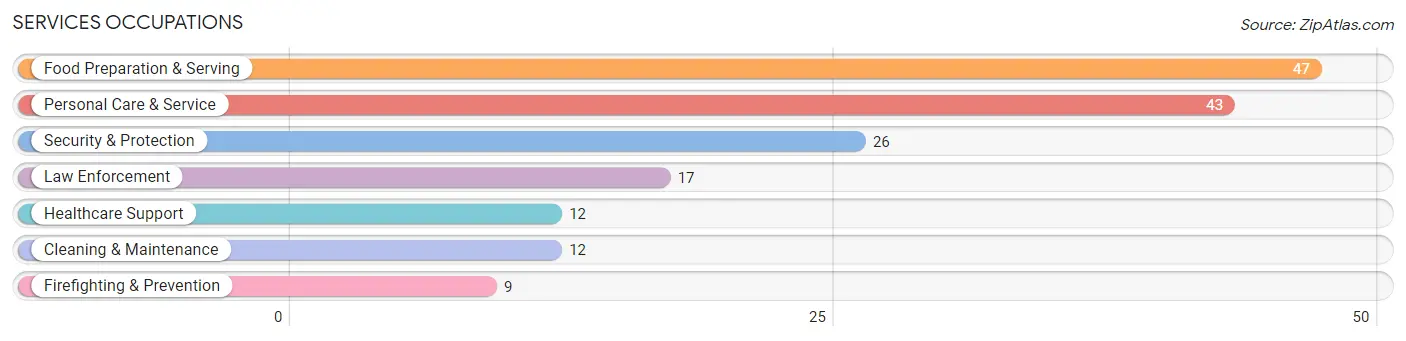
Services Occupations
The most common Services occupations in Mauriceville are Food Preparation & Serving (47 | 4.3%), Personal Care & Service (43 | 4.0%), Security & Protection (26 | 2.4%), Law Enforcement (17 | 1.6%), and Healthcare Support (12 | 1.1%).
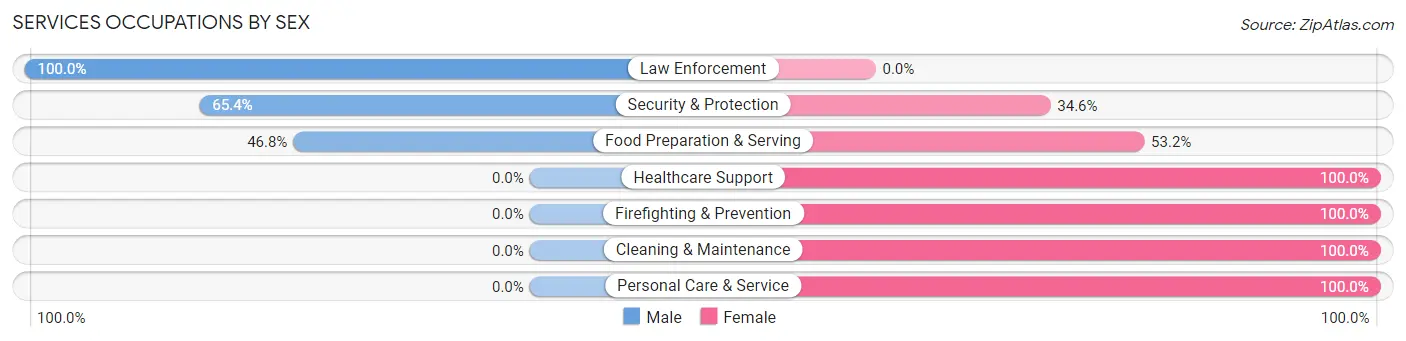
Services Occupations by Sex
Within the Services occupations in Mauriceville, the most male-oriented occupations are Law Enforcement (100.0%), Security & Protection (65.4%), and Food Preparation & Serving (46.8%), while the most female-oriented occupations are Healthcare Support (100.0%), Firefighting & Prevention (100.0%), and Cleaning & Maintenance (100.0%).
| Occupation | Male | Female |
| Healthcare Support | 0 (0.0%) | 12 (100.0%) |
| Security & Protection | 17 (65.4%) | 9 (34.6%) |
| Firefighting & Prevention | 0 (0.0%) | 9 (100.0%) |
| Law Enforcement | 17 (100.0%) | 0 (0.0%) |
| Food Preparation & Serving | 22 (46.8%) | 25 (53.2%) |
| Cleaning & Maintenance | 0 (0.0%) | 12 (100.0%) |
| Personal Care & Service | 0 (0.0%) | 43 (100.0%) |
| Total (Category) | 39 (27.9%) | 101 (72.1%) |
| Total (Overall) | 510 (47.0%) | 576 (53.0%) |
Sales and Office Occupations
The most common Sales and Office occupations in Mauriceville are Office & Administration (115 | 10.6%), and Sales & Related (83 | 7.6%).
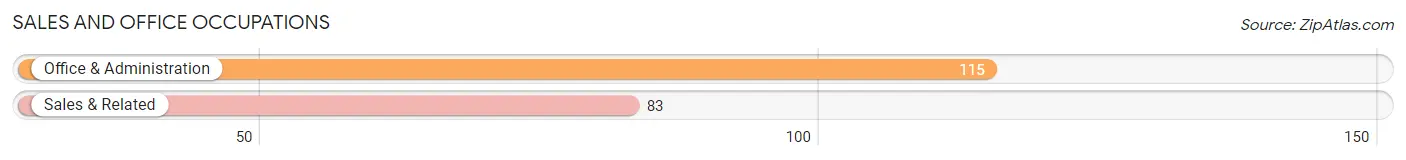
Sales and Office Occupations by Sex
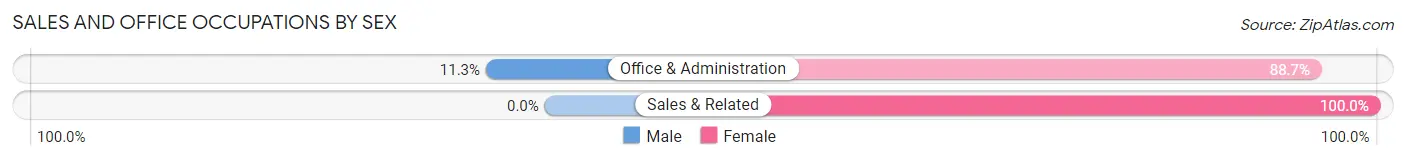
| Occupation | Male | Female |
| Sales & Related | 0 (0.0%) | 83 (100.0%) |
| Office & Administration | 13 (11.3%) | 102 (88.7%) |
| Total (Category) | 13 (6.6%) | 185 (93.4%) |
| Total (Overall) | 510 (47.0%) | 576 (53.0%) |
Natural Resources, Construction and Maintenance Occupations
The most common Natural Resources, Construction and Maintenance occupations in Mauriceville are Construction & Extraction (83 | 7.6%), and Installation, Maintenance & Repair (39 | 3.6%).
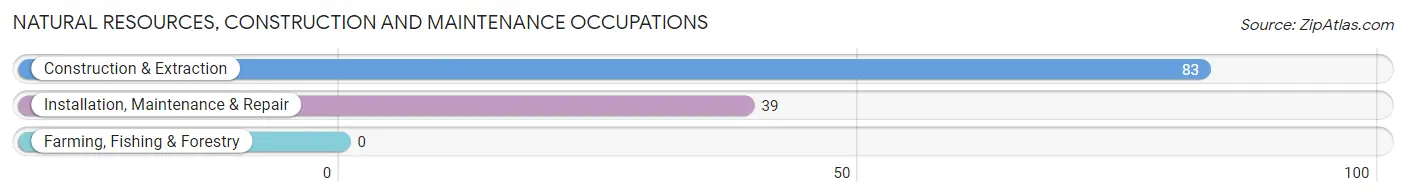
Natural Resources, Construction and Maintenance Occupations by Sex
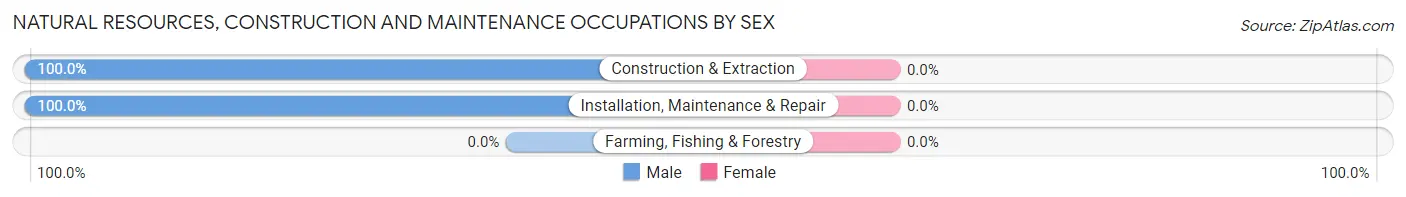
| Occupation | Male | Female |
| Farming, Fishing & Forestry | 0 (0.0%) | 0 (0.0%) |
| Construction & Extraction | 83 (100.0%) | 0 (0.0%) |
| Installation, Maintenance & Repair | 39 (100.0%) | 0 (0.0%) |
| Total (Category) | 122 (100.0%) | 0 (0.0%) |
| Total (Overall) | 510 (47.0%) | 576 (53.0%) |
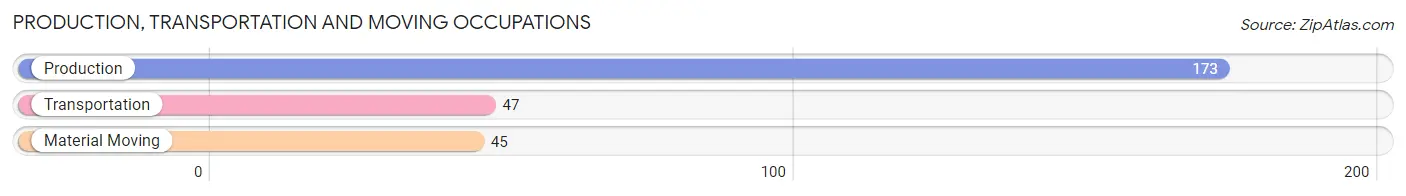
Production, Transportation and Moving Occupations
The most common Production, Transportation and Moving occupations in Mauriceville are Production (173 | 15.9%), Transportation (47 | 4.3%), and Material Moving (45 | 4.1%).
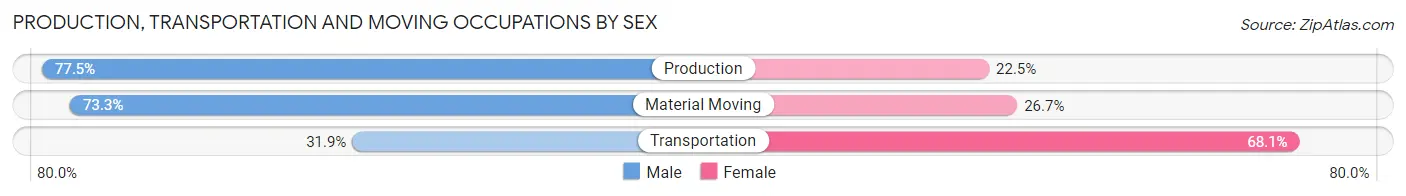
Production, Transportation and Moving Occupations by Sex
| Occupation | Male | Female |
| Production | 134 (77.5%) | 39 (22.5%) |
| Transportation | 15 (31.9%) | 32 (68.1%) |
| Material Moving | 33 (73.3%) | 12 (26.7%) |
| Total (Category) | 182 (68.7%) | 83 (31.3%) |
| Total (Overall) | 510 (47.0%) | 576 (53.0%) |
Employment Industries by Sex in Mauriceville
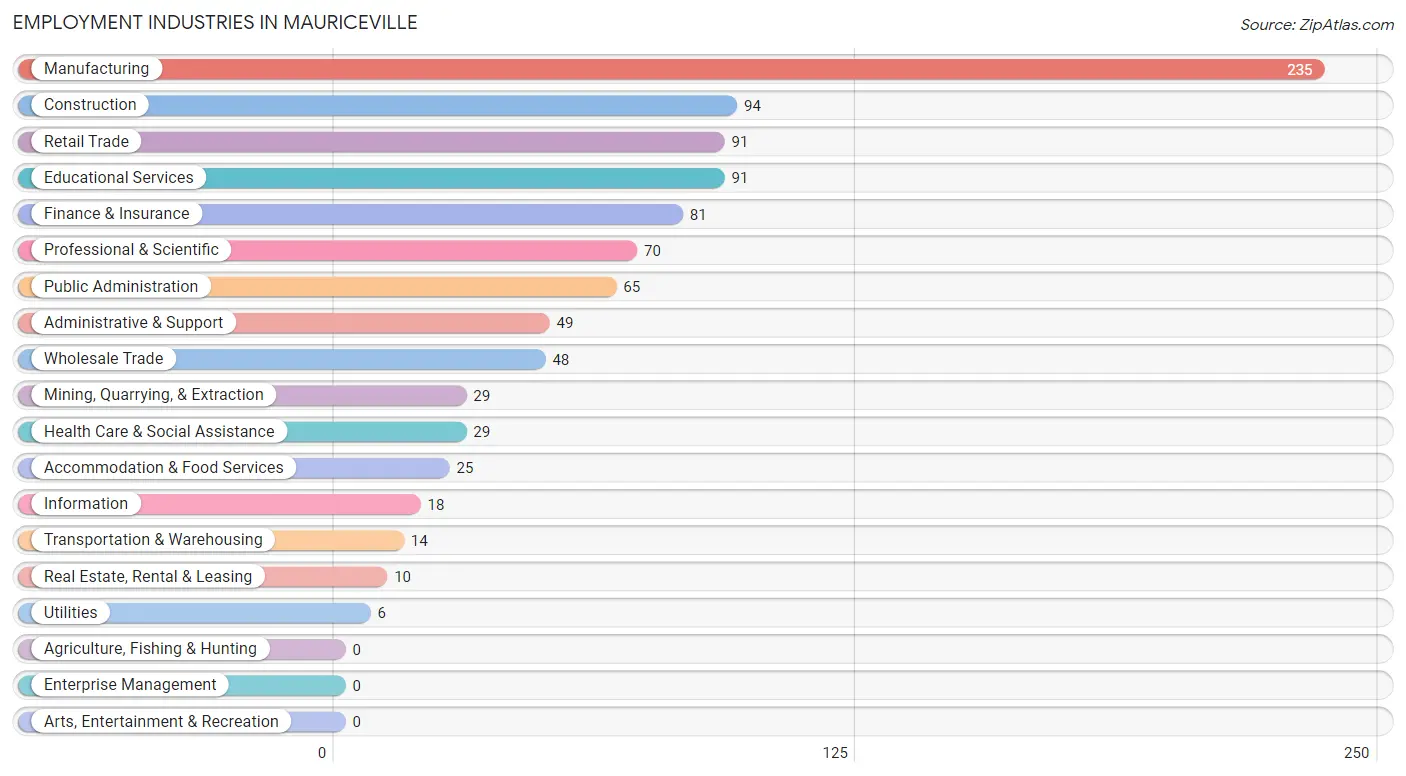
Employment Industries in Mauriceville
The major employment industries in Mauriceville include Manufacturing (235 | 21.6%), Construction (94 | 8.7%), Retail Trade (91 | 8.4%), Educational Services (91 | 8.4%), and Finance & Insurance (81 | 7.5%).
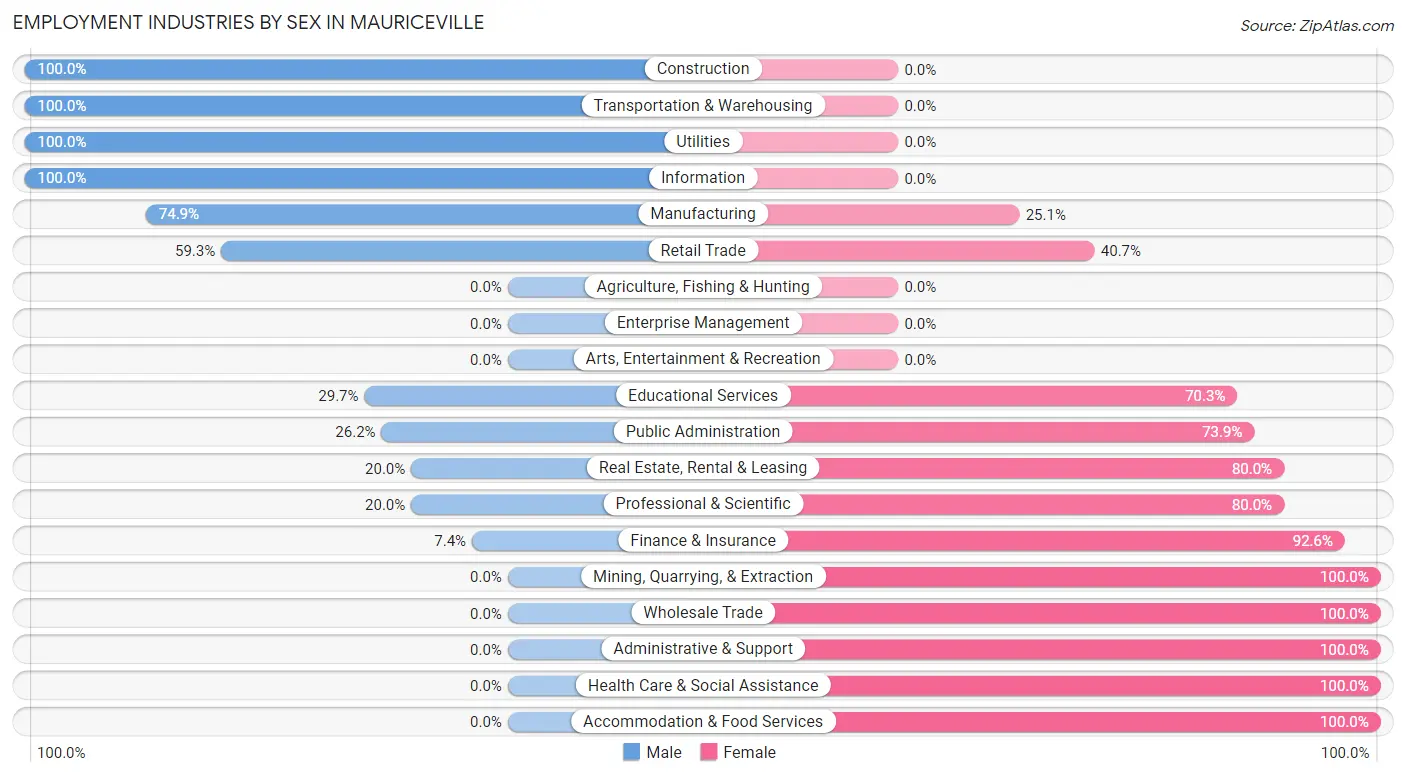
Employment Industries by Sex in Mauriceville
The Mauriceville industries that see more men than women are Construction (100.0%), Transportation & Warehousing (100.0%), and Utilities (100.0%), whereas the industries that tend to have a higher number of women are Mining, Quarrying, & Extraction (100.0%), Wholesale Trade (100.0%), and Administrative & Support (100.0%).
| Industry | Male | Female |
| Agriculture, Fishing & Hunting | 0 (0.0%) | 0 (0.0%) |
| Mining, Quarrying, & Extraction | 0 (0.0%) | 29 (100.0%) |
| Construction | 94 (100.0%) | 0 (0.0%) |
| Manufacturing | 176 (74.9%) | 59 (25.1%) |
| Wholesale Trade | 0 (0.0%) | 48 (100.0%) |
| Retail Trade | 54 (59.3%) | 37 (40.7%) |
| Transportation & Warehousing | 14 (100.0%) | 0 (0.0%) |
| Utilities | 6 (100.0%) | 0 (0.0%) |
| Information | 18 (100.0%) | 0 (0.0%) |
| Finance & Insurance | 6 (7.4%) | 75 (92.6%) |
| Real Estate, Rental & Leasing | 2 (20.0%) | 8 (80.0%) |
| Professional & Scientific | 14 (20.0%) | 56 (80.0%) |
| Enterprise Management | 0 (0.0%) | 0 (0.0%) |
| Administrative & Support | 0 (0.0%) | 49 (100.0%) |
| Educational Services | 27 (29.7%) | 64 (70.3%) |
| Health Care & Social Assistance | 0 (0.0%) | 29 (100.0%) |
| Arts, Entertainment & Recreation | 0 (0.0%) | 0 (0.0%) |
| Accommodation & Food Services | 0 (0.0%) | 25 (100.0%) |
| Public Administration | 17 (26.2%) | 48 (73.9%) |
| Total | 510 (47.0%) | 576 (53.0%) |
Education in Mauriceville
School Enrollment in Mauriceville
The most common levels of schooling among the 658 students in Mauriceville are middle school (193 | 29.3%), elementary school (179 | 27.2%), and high school (143 | 21.7%).
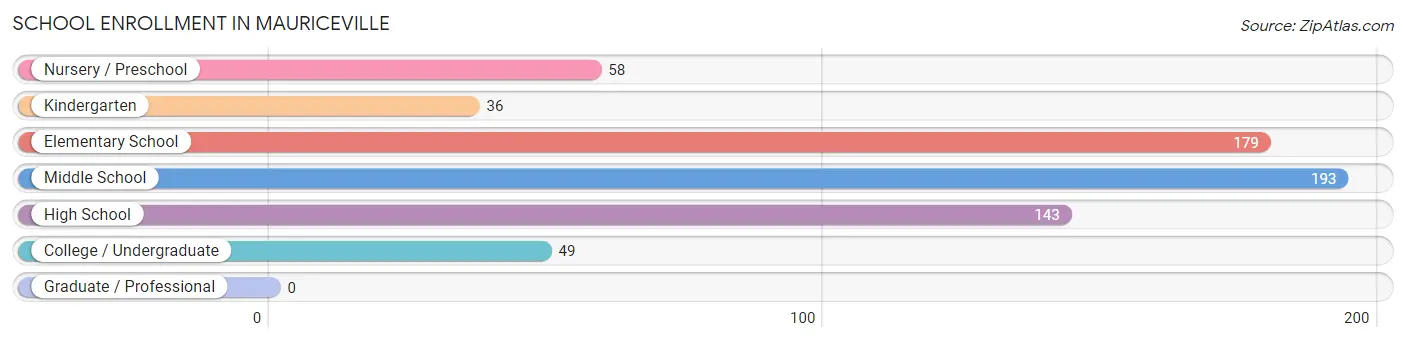
| School Level | # Students | % Students |
| Nursery / Preschool | 58 | 8.8% |
| Kindergarten | 36 | 5.5% |
| Elementary School | 179 | 27.2% |
| Middle School | 193 | 29.3% |
| High School | 143 | 21.7% |
| College / Undergraduate | 49 | 7.4% |
| Graduate / Professional | 0 | 0.0% |
| Total | 658 | 100.0% |
School Enrollment by Age by Funding Source in Mauriceville
Out of a total of 658 students who are enrolled in schools in Mauriceville, 88 (13.4%) attend a private institution, while the remaining 570 (86.6%) are enrolled in public schools. The age group of 18 to 19 year olds has the highest likelihood of being enrolled in private schools, with 32 (100.0% in the age bracket) enrolled. Conversely, the age group of 15 to 17 year olds has the lowest likelihood of being enrolled in a private school, with 114 (100.0% in the age bracket) attending a public institution.
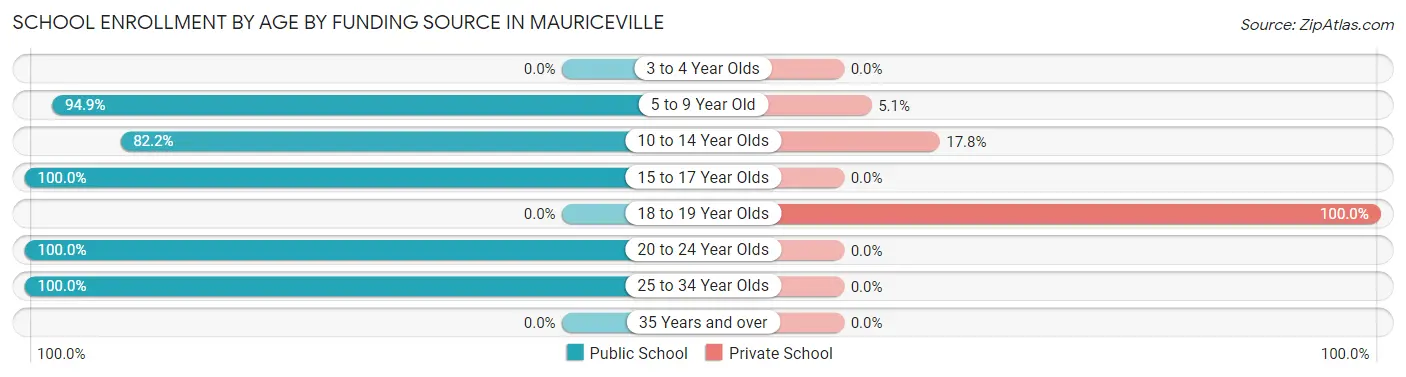
| Age Bracket | Public School | Private School |
| 3 to 4 Year Olds | 0 (0.0%) | 0 (0.0%) |
| 5 to 9 Year Old | 222 (94.9%) | 12 (5.1%) |
| 10 to 14 Year Olds | 203 (82.2%) | 44 (17.8%) |
| 15 to 17 Year Olds | 114 (100.0%) | 0 (0.0%) |
| 18 to 19 Year Olds | 0 (0.0%) | 32 (100.0%) |
| 20 to 24 Year Olds | 23 (100.0%) | 0 (0.0%) |
| 25 to 34 Year Olds | 8 (100.0%) | 0 (0.0%) |
| 35 Years and over | 0 (0.0%) | 0 (0.0%) |
| Total | 570 (86.6%) | 88 (13.4%) |
Educational Attainment by Field of Study in Mauriceville
Computers & mathematics (49 | 30.8%), business (39 | 24.5%), education (24 | 15.1%), communications (18 | 11.3%), and psychology (13 | 8.2%) are the most common fields of study among 159 individuals in Mauriceville who have obtained a bachelor's degree or higher.
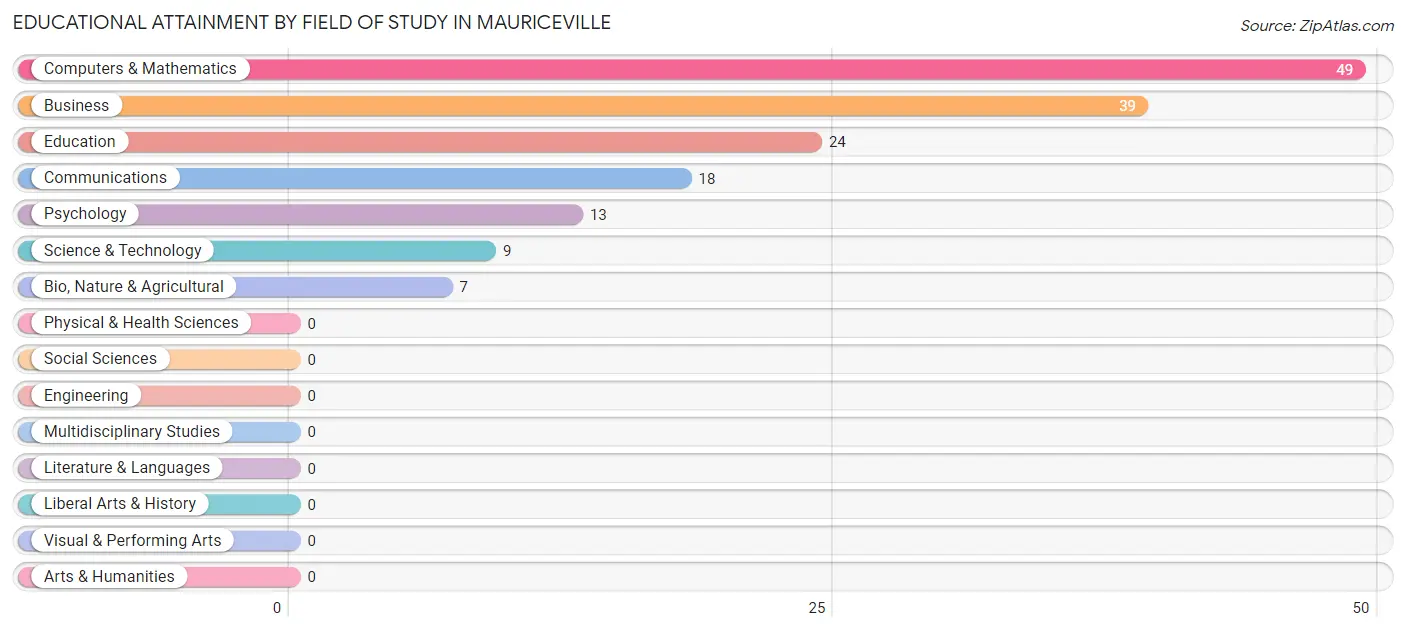
| Field of Study | # Graduates | % Graduates |
| Computers & Mathematics | 49 | 30.8% |
| Bio, Nature & Agricultural | 7 | 4.4% |
| Physical & Health Sciences | 0 | 0.0% |
| Psychology | 13 | 8.2% |
| Social Sciences | 0 | 0.0% |
| Engineering | 0 | 0.0% |
| Multidisciplinary Studies | 0 | 0.0% |
| Science & Technology | 9 | 5.7% |
| Business | 39 | 24.5% |
| Education | 24 | 15.1% |
| Literature & Languages | 0 | 0.0% |
| Liberal Arts & History | 0 | 0.0% |
| Visual & Performing Arts | 0 | 0.0% |
| Communications | 18 | 11.3% |
| Arts & Humanities | 0 | 0.0% |
| Total | 159 | 100.0% |
Transportation & Commute in Mauriceville
Vehicle Availability by Sex in Mauriceville
The most prevalent vehicle ownership categories in Mauriceville are males with 2 vehicles (225, accounting for 44.1%) and females with 2 vehicles (249, making up 41.1%).
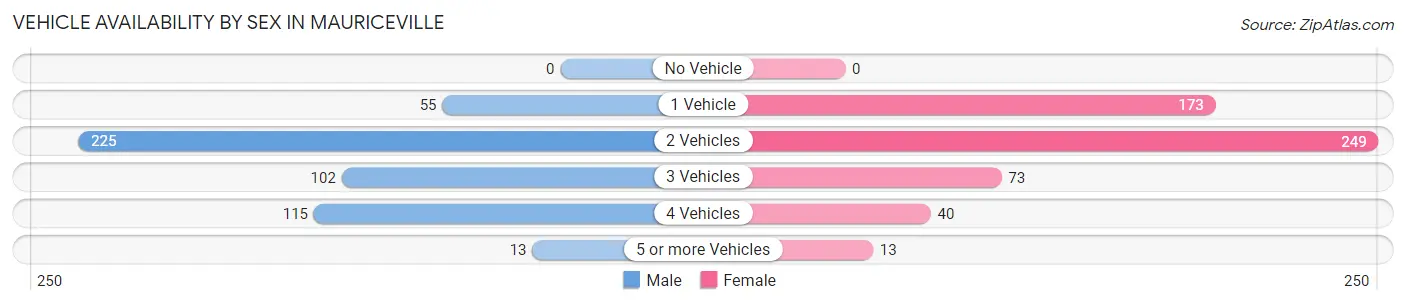
| Vehicles Available | Male | Female |
| No Vehicle | 0 (0.0%) | 0 (0.0%) |
| 1 Vehicle | 55 (10.8%) | 173 (31.6%) |
| 2 Vehicles | 225 (44.1%) | 249 (45.4%) |
| 3 Vehicles | 102 (20.0%) | 73 (13.3%) |
| 4 Vehicles | 115 (22.6%) | 40 (7.3%) |
| 5 or more Vehicles | 13 (2.5%) | 13 (2.4%) |
| Total | 510 (100.0%) | 548 (100.0%) |
Commute Time in Mauriceville
The most frequently occuring commute durations in Mauriceville are 20 to 24 minutes (241 commuters, 22.8%), 15 to 19 minutes (204 commuters, 19.3%), and 30 to 34 minutes (129 commuters, 12.2%).
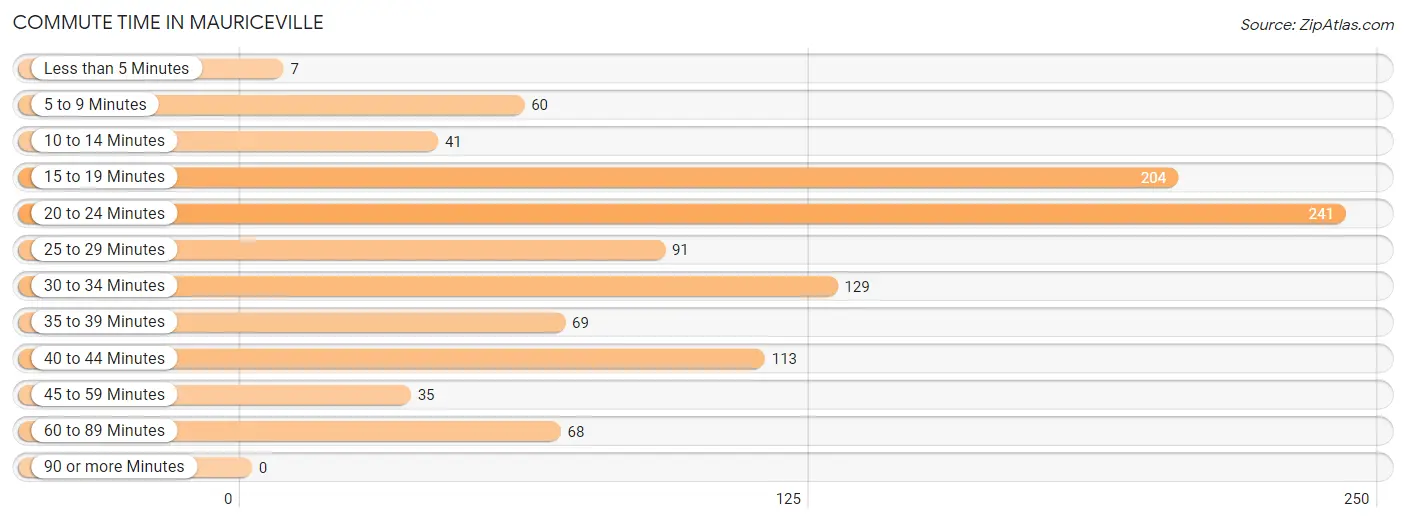
| Commute Time | # Commuters | % Commuters |
| Less than 5 Minutes | 7 | 0.7% |
| 5 to 9 Minutes | 60 | 5.7% |
| 10 to 14 Minutes | 41 | 3.9% |
| 15 to 19 Minutes | 204 | 19.3% |
| 20 to 24 Minutes | 241 | 22.8% |
| 25 to 29 Minutes | 91 | 8.6% |
| 30 to 34 Minutes | 129 | 12.2% |
| 35 to 39 Minutes | 69 | 6.5% |
| 40 to 44 Minutes | 113 | 10.7% |
| 45 to 59 Minutes | 35 | 3.3% |
| 60 to 89 Minutes | 68 | 6.4% |
| 90 or more Minutes | 0 | 0.0% |
Commute Time by Sex in Mauriceville
The most common commute times in Mauriceville are 20 to 24 minutes (138 commuters, 27.1%) for males and 15 to 19 minutes (122 commuters, 22.3%) for females.
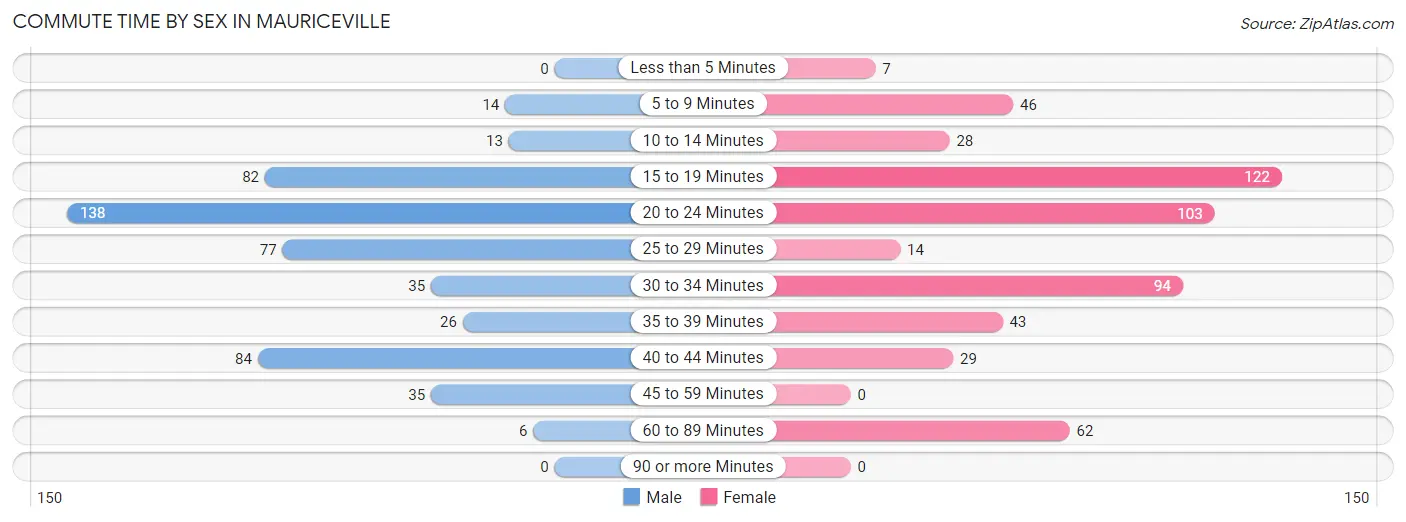
| Commute Time | Male | Female |
| Less than 5 Minutes | 0 (0.0%) | 7 (1.3%) |
| 5 to 9 Minutes | 14 (2.8%) | 46 (8.4%) |
| 10 to 14 Minutes | 13 (2.5%) | 28 (5.1%) |
| 15 to 19 Minutes | 82 (16.1%) | 122 (22.3%) |
| 20 to 24 Minutes | 138 (27.1%) | 103 (18.8%) |
| 25 to 29 Minutes | 77 (15.1%) | 14 (2.5%) |
| 30 to 34 Minutes | 35 (6.9%) | 94 (17.2%) |
| 35 to 39 Minutes | 26 (5.1%) | 43 (7.9%) |
| 40 to 44 Minutes | 84 (16.5%) | 29 (5.3%) |
| 45 to 59 Minutes | 35 (6.9%) | 0 (0.0%) |
| 60 to 89 Minutes | 6 (1.2%) | 62 (11.3%) |
| 90 or more Minutes | 0 (0.0%) | 0 (0.0%) |
Time of Departure to Work by Sex in Mauriceville
The most frequent times of departure to work in Mauriceville are 12:00 AM to 4:59 AM (164, 32.2%) for males and 7:00 AM to 7:29 AM (142, 25.9%) for females.
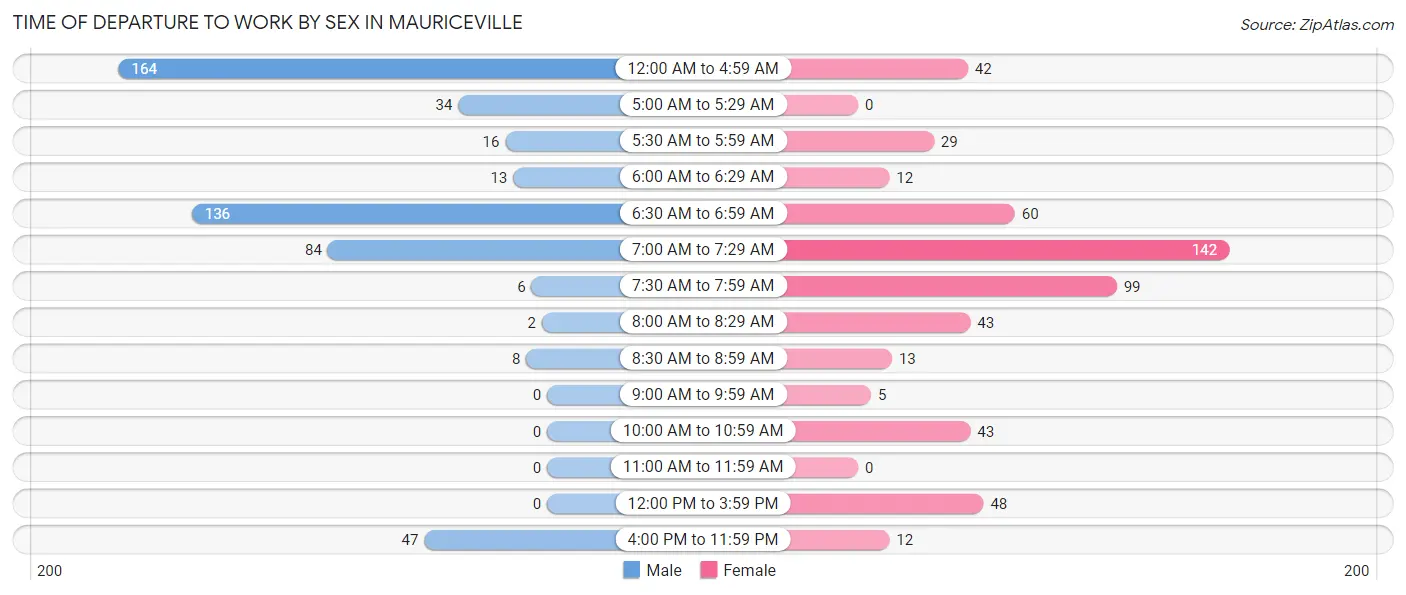
| Time of Departure | Male | Female |
| 12:00 AM to 4:59 AM | 164 (32.2%) | 42 (7.7%) |
| 5:00 AM to 5:29 AM | 34 (6.7%) | 0 (0.0%) |
| 5:30 AM to 5:59 AM | 16 (3.1%) | 29 (5.3%) |
| 6:00 AM to 6:29 AM | 13 (2.5%) | 12 (2.2%) |
| 6:30 AM to 6:59 AM | 136 (26.7%) | 60 (11.0%) |
| 7:00 AM to 7:29 AM | 84 (16.5%) | 142 (25.9%) |
| 7:30 AM to 7:59 AM | 6 (1.2%) | 99 (18.1%) |
| 8:00 AM to 8:29 AM | 2 (0.4%) | 43 (7.9%) |
| 8:30 AM to 8:59 AM | 8 (1.6%) | 13 (2.4%) |
| 9:00 AM to 9:59 AM | 0 (0.0%) | 5 (0.9%) |
| 10:00 AM to 10:59 AM | 0 (0.0%) | 43 (7.9%) |
| 11:00 AM to 11:59 AM | 0 (0.0%) | 0 (0.0%) |
| 12:00 PM to 3:59 PM | 0 (0.0%) | 48 (8.8%) |
| 4:00 PM to 11:59 PM | 47 (9.2%) | 12 (2.2%) |
| Total | 510 (100.0%) | 548 (100.0%) |
Housing Occupancy in Mauriceville
Occupancy by Ownership in Mauriceville
Of the total 942 dwellings in Mauriceville, owner-occupied units account for 662 (70.3%), while renter-occupied units make up 280 (29.7%).
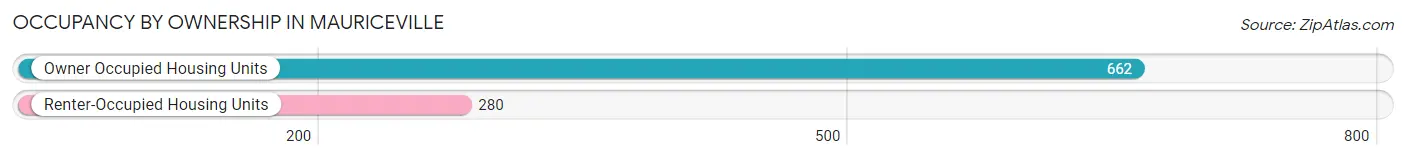
| Occupancy | # Housing Units | % Housing Units |
| Owner Occupied Housing Units | 662 | 70.3% |
| Renter-Occupied Housing Units | 280 | 29.7% |
| Total Occupied Housing Units | 942 | 100.0% |
Occupancy by Household Size in Mauriceville
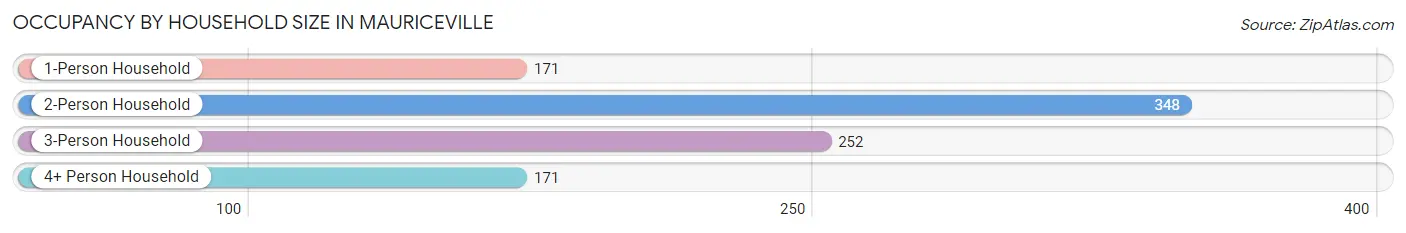
| Household Size | # Housing Units | % Housing Units |
| 1-Person Household | 171 | 18.1% |
| 2-Person Household | 348 | 36.9% |
| 3-Person Household | 252 | 26.8% |
| 4+ Person Household | 171 | 18.1% |
| Total Housing Units | 942 | 100.0% |
Occupancy by Ownership by Household Size in Mauriceville
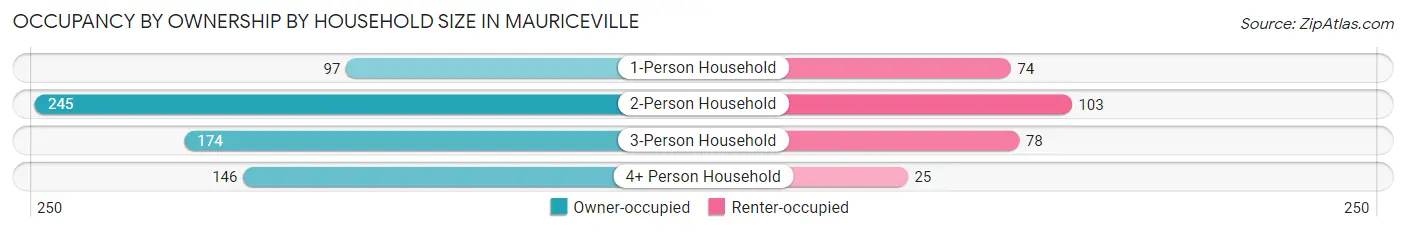
| Household Size | Owner-occupied | Renter-occupied |
| 1-Person Household | 97 (56.7%) | 74 (43.3%) |
| 2-Person Household | 245 (70.4%) | 103 (29.6%) |
| 3-Person Household | 174 (69.1%) | 78 (30.9%) |
| 4+ Person Household | 146 (85.4%) | 25 (14.6%) |
| Total Housing Units | 662 (70.3%) | 280 (29.7%) |
Occupancy by Educational Attainment in Mauriceville
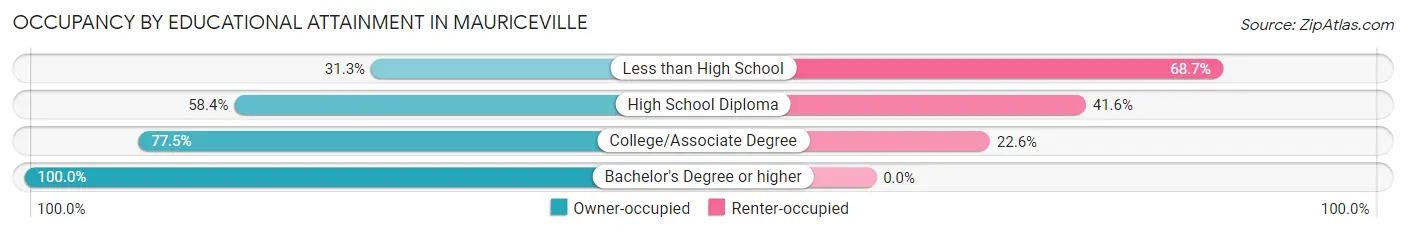
| Household Size | Owner-occupied | Renter-occupied |
| Less than High School | 21 (31.3%) | 46 (68.7%) |
| High School Diploma | 180 (58.4%) | 128 (41.6%) |
| College/Associate Degree | 364 (77.4%) | 106 (22.6%) |
| Bachelor's Degree or higher | 97 (100.0%) | 0 (0.0%) |
Occupancy by Age of Householder in Mauriceville
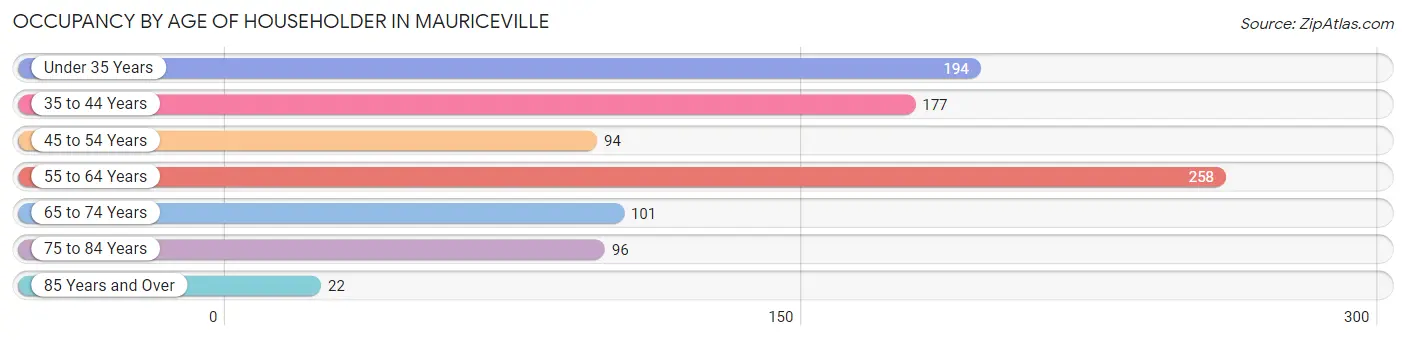
| Age Bracket | # Households | % Households |
| Under 35 Years | 194 | 20.6% |
| 35 to 44 Years | 177 | 18.8% |
| 45 to 54 Years | 94 | 10.0% |
| 55 to 64 Years | 258 | 27.4% |
| 65 to 74 Years | 101 | 10.7% |
| 75 to 84 Years | 96 | 10.2% |
| 85 Years and Over | 22 | 2.3% |
| Total | 942 | 100.0% |
Housing Finances in Mauriceville
Median Income by Occupancy in Mauriceville
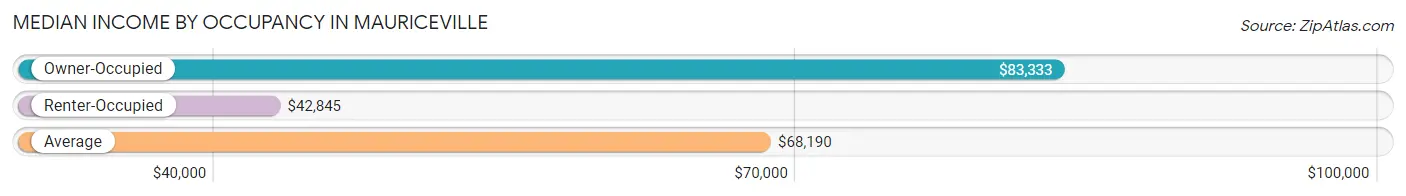
| Occupancy Type | # Households | Median Income |
| Owner-Occupied | 662 (70.3%) | $83,333 |
| Renter-Occupied | 280 (29.7%) | $42,845 |
| Average | 942 (100.0%) | $68,190 |
Occupancy by Householder Income Bracket in Mauriceville
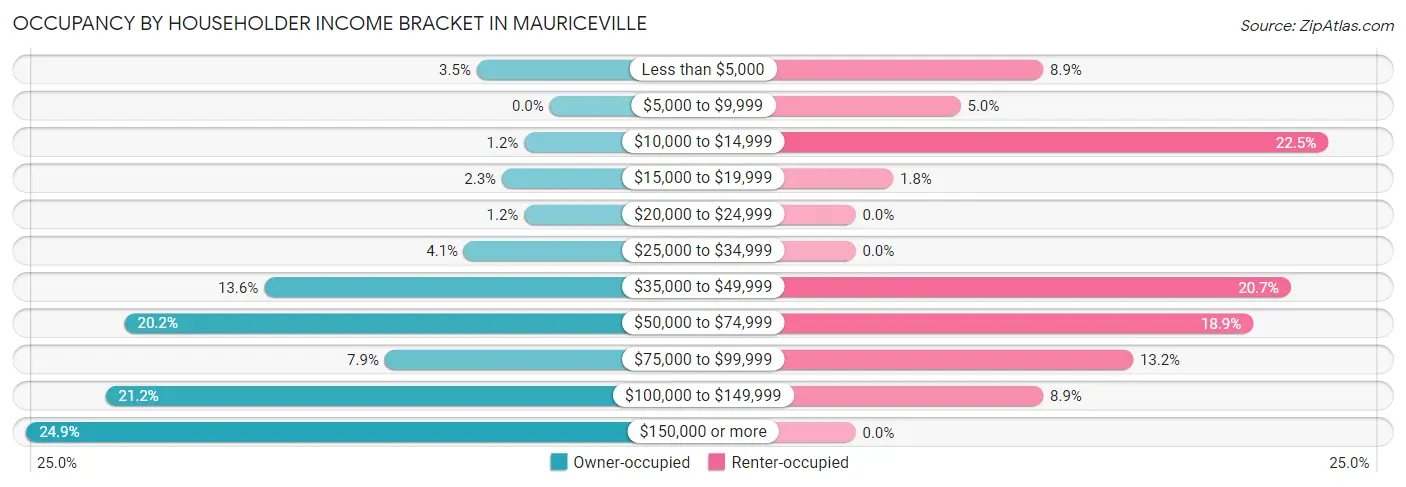
| Income Bracket | Owner-occupied | Renter-occupied |
| Less than $5,000 | 23 (3.5%) | 25 (8.9%) |
| $5,000 to $9,999 | 0 (0.0%) | 14 (5.0%) |
| $10,000 to $14,999 | 8 (1.2%) | 63 (22.5%) |
| $15,000 to $19,999 | 15 (2.3%) | 5 (1.8%) |
| $20,000 to $24,999 | 8 (1.2%) | 0 (0.0%) |
| $25,000 to $34,999 | 27 (4.1%) | 0 (0.0%) |
| $35,000 to $49,999 | 90 (13.6%) | 58 (20.7%) |
| $50,000 to $74,999 | 134 (20.2%) | 53 (18.9%) |
| $75,000 to $99,999 | 52 (7.9%) | 37 (13.2%) |
| $100,000 to $149,999 | 140 (21.1%) | 25 (8.9%) |
| $150,000 or more | 165 (24.9%) | 0 (0.0%) |
| Total | 662 (100.0%) | 280 (100.0%) |
Monthly Housing Cost Tiers in Mauriceville
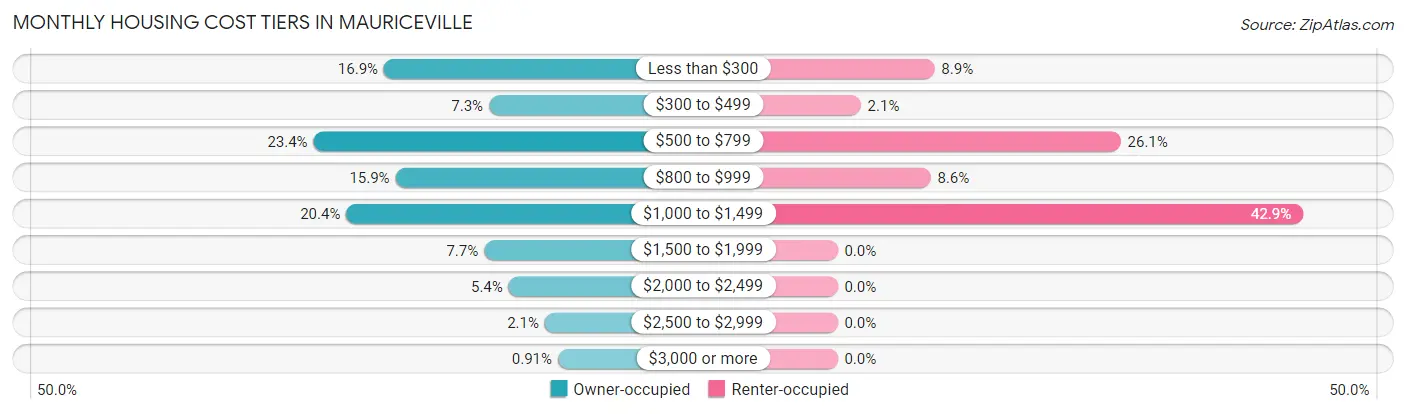
| Monthly Cost | Owner-occupied | Renter-occupied |
| Less than $300 | 112 (16.9%) | 25 (8.9%) |
| $300 to $499 | 48 (7.2%) | 6 (2.1%) |
| $500 to $799 | 155 (23.4%) | 73 (26.1%) |
| $800 to $999 | 105 (15.9%) | 24 (8.6%) |
| $1,000 to $1,499 | 135 (20.4%) | 120 (42.9%) |
| $1,500 to $1,999 | 51 (7.7%) | 0 (0.0%) |
| $2,000 to $2,499 | 36 (5.4%) | 0 (0.0%) |
| $2,500 to $2,999 | 14 (2.1%) | 0 (0.0%) |
| $3,000 or more | 6 (0.9%) | 0 (0.0%) |
| Total | 662 (100.0%) | 280 (100.0%) |
Physical Housing Characteristics in Mauriceville
Housing Structures in Mauriceville
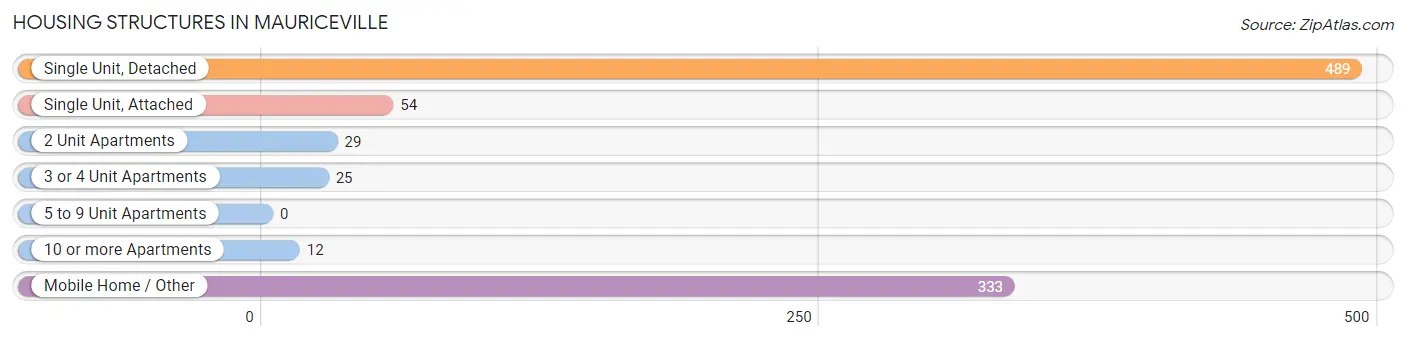
| Structure Type | # Housing Units | % Housing Units |
| Single Unit, Detached | 489 | 51.9% |
| Single Unit, Attached | 54 | 5.7% |
| 2 Unit Apartments | 29 | 3.1% |
| 3 or 4 Unit Apartments | 25 | 2.6% |
| 5 to 9 Unit Apartments | 0 | 0.0% |
| 10 or more Apartments | 12 | 1.3% |
| Mobile Home / Other | 333 | 35.3% |
| Total | 942 | 100.0% |
Housing Structures by Occupancy in Mauriceville
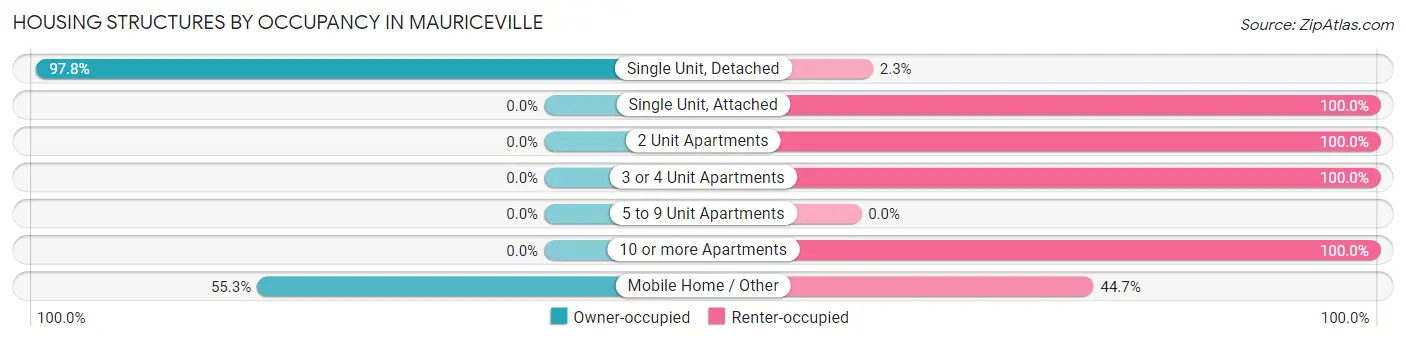
| Structure Type | Owner-occupied | Renter-occupied |
| Single Unit, Detached | 478 (97.8%) | 11 (2.2%) |
| Single Unit, Attached | 0 (0.0%) | 54 (100.0%) |
| 2 Unit Apartments | 0 (0.0%) | 29 (100.0%) |
| 3 or 4 Unit Apartments | 0 (0.0%) | 25 (100.0%) |
| 5 to 9 Unit Apartments | 0 (0.0%) | 0 (0.0%) |
| 10 or more Apartments | 0 (0.0%) | 12 (100.0%) |
| Mobile Home / Other | 184 (55.3%) | 149 (44.7%) |
| Total | 662 (70.3%) | 280 (29.7%) |
Housing Structures by Number of Rooms in Mauriceville
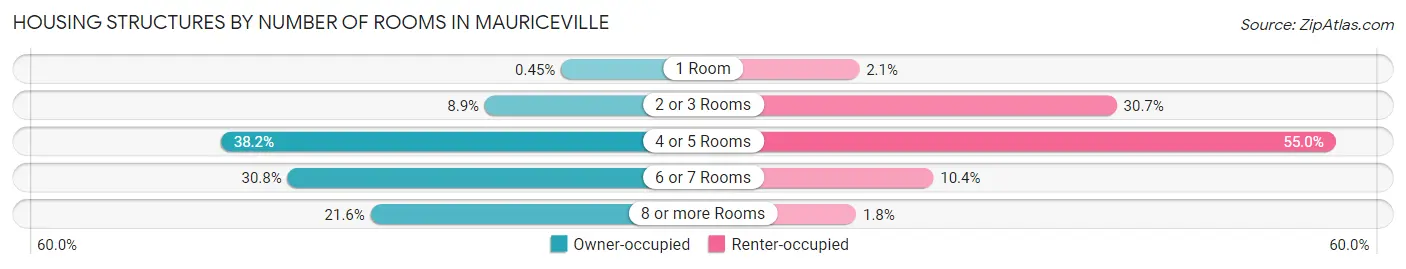
| Number of Rooms | Owner-occupied | Renter-occupied |
| 1 Room | 3 (0.4%) | 6 (2.1%) |
| 2 or 3 Rooms | 59 (8.9%) | 86 (30.7%) |
| 4 or 5 Rooms | 253 (38.2%) | 154 (55.0%) |
| 6 or 7 Rooms | 204 (30.8%) | 29 (10.4%) |
| 8 or more Rooms | 143 (21.6%) | 5 (1.8%) |
| Total | 662 (100.0%) | 280 (100.0%) |
Housing Structure by Heating Type in Mauriceville
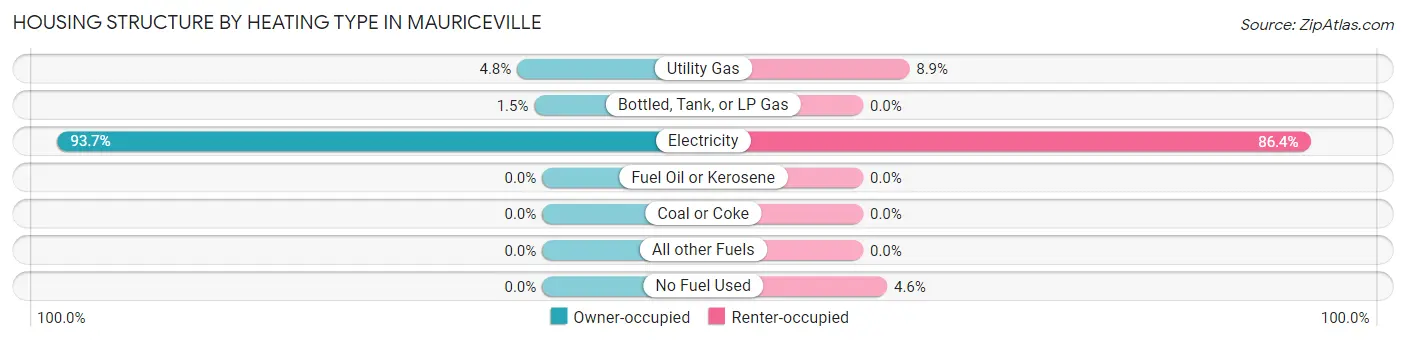
| Heating Type | Owner-occupied | Renter-occupied |
| Utility Gas | 32 (4.8%) | 25 (8.9%) |
| Bottled, Tank, or LP Gas | 10 (1.5%) | 0 (0.0%) |
| Electricity | 620 (93.7%) | 242 (86.4%) |
| Fuel Oil or Kerosene | 0 (0.0%) | 0 (0.0%) |
| Coal or Coke | 0 (0.0%) | 0 (0.0%) |
| All other Fuels | 0 (0.0%) | 0 (0.0%) |
| No Fuel Used | 0 (0.0%) | 13 (4.6%) |
| Total | 662 (100.0%) | 280 (100.0%) |
Household Vehicle Usage in Mauriceville
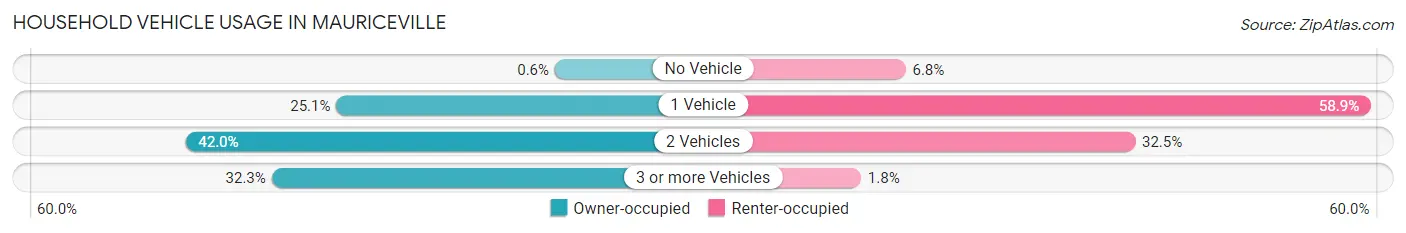
| Vehicles per Household | Owner-occupied | Renter-occupied |
| No Vehicle | 4 (0.6%) | 19 (6.8%) |
| 1 Vehicle | 166 (25.1%) | 165 (58.9%) |
| 2 Vehicles | 278 (42.0%) | 91 (32.5%) |
| 3 or more Vehicles | 214 (32.3%) | 5 (1.8%) |
| Total | 662 (100.0%) | 280 (100.0%) |
Real Estate & Mortgages in Mauriceville
Real Estate and Mortgage Overview in Mauriceville
| Characteristic | Without Mortgage | With Mortgage |
| Housing Units | 432 | 230 |
| Median Property Value | $185,400 | $169,400 |
| Median Household Income | $71,048 | $66 |
| Monthly Housing Costs | $643 | $6 |
| Real Estate Taxes | $1,693 | $0 |
Property Value by Mortgage Status in Mauriceville
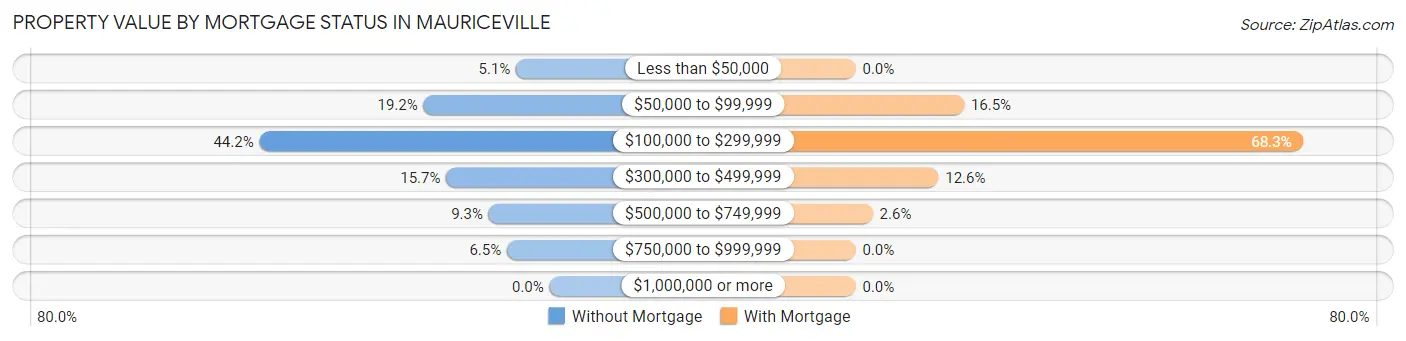
| Property Value | Without Mortgage | With Mortgage |
| Less than $50,000 | 22 (5.1%) | 0 (0.0%) |
| $50,000 to $99,999 | 83 (19.2%) | 38 (16.5%) |
| $100,000 to $299,999 | 191 (44.2%) | 157 (68.3%) |
| $300,000 to $499,999 | 68 (15.7%) | 29 (12.6%) |
| $500,000 to $749,999 | 40 (9.3%) | 6 (2.6%) |
| $750,000 to $999,999 | 28 (6.5%) | 0 (0.0%) |
| $1,000,000 or more | 0 (0.0%) | 0 (0.0%) |
| Total | 432 (100.0%) | 230 (100.0%) |
Household Income by Mortgage Status in Mauriceville
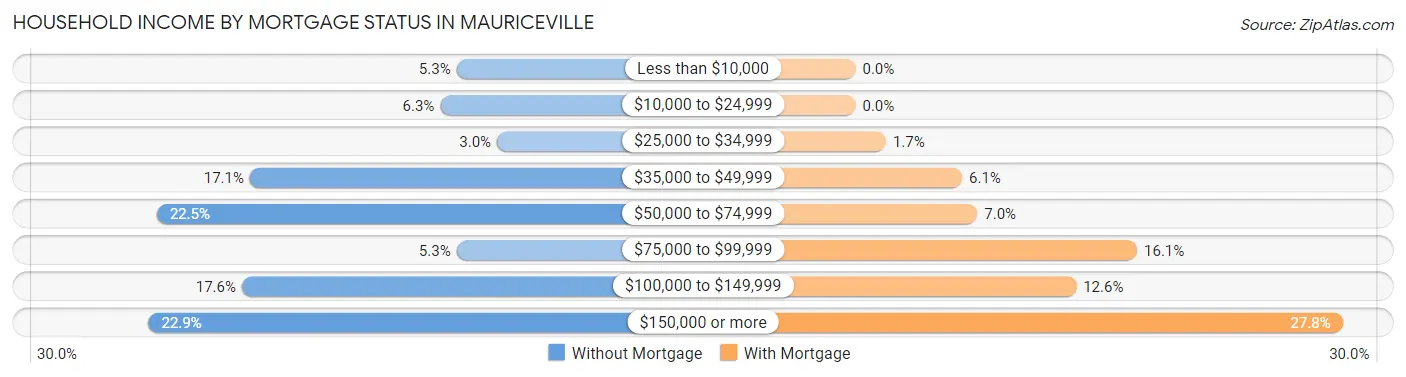
| Household Income | Without Mortgage | With Mortgage |
| Less than $10,000 | 23 (5.3%) | 0 (0.0%) |
| $10,000 to $24,999 | 27 (6.2%) | 0 (0.0%) |
| $25,000 to $34,999 | 13 (3.0%) | 4 (1.7%) |
| $35,000 to $49,999 | 74 (17.1%) | 14 (6.1%) |
| $50,000 to $74,999 | 97 (22.5%) | 16 (7.0%) |
| $75,000 to $99,999 | 23 (5.3%) | 37 (16.1%) |
| $100,000 to $149,999 | 76 (17.6%) | 29 (12.6%) |
| $150,000 or more | 99 (22.9%) | 64 (27.8%) |
| Total | 432 (100.0%) | 230 (100.0%) |
Property Value to Household Income Ratio in Mauriceville
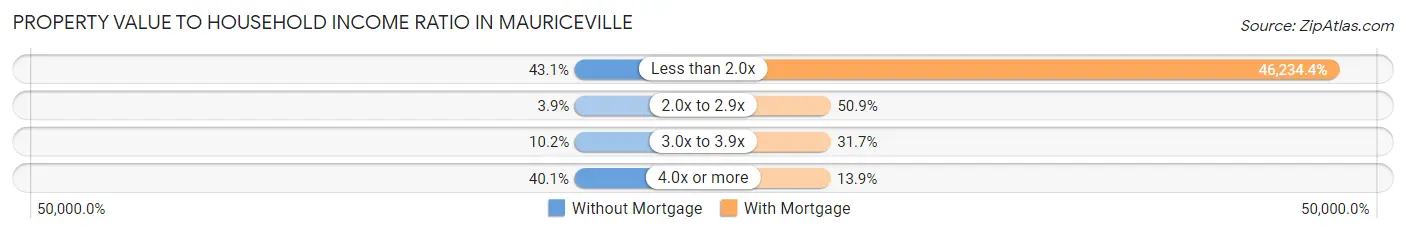
| Value-to-Income Ratio | Without Mortgage | With Mortgage |
| Less than 2.0x | 186 (43.1%) | 106,339 (46,234.4%) |
| 2.0x to 2.9x | 17 (3.9%) | 117 (50.9%) |
| 3.0x to 3.9x | 44 (10.2%) | 73 (31.7%) |
| 4.0x or more | 173 (40.1%) | 32 (13.9%) |
| Total | 432 (100.0%) | 230 (100.0%) |
Real Estate Taxes by Mortgage Status in Mauriceville
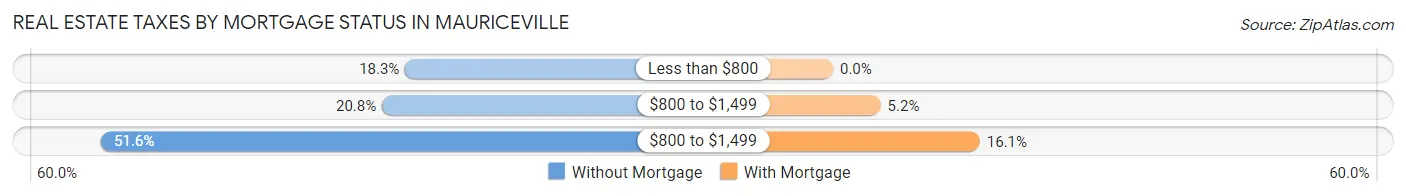
| Property Taxes | Without Mortgage | With Mortgage |
| Less than $800 | 79 (18.3%) | 0 (0.0%) |
| $800 to $1,499 | 90 (20.8%) | 12 (5.2%) |
| $800 to $1,499 | 223 (51.6%) | 37 (16.1%) |
| Total | 432 (100.0%) | 230 (100.0%) |
Health & Disability in Mauriceville
Health Insurance Coverage by Age in Mauriceville
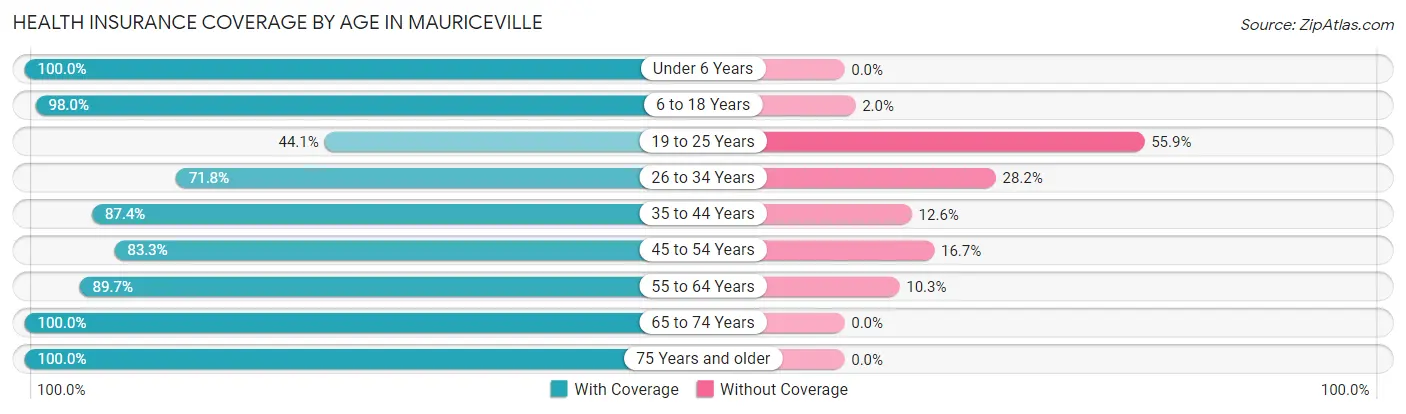
| Age Bracket | With Coverage | Without Coverage |
| Under 6 Years | 126 (100.0%) | 0 (0.0%) |
| 6 to 18 Years | 528 (98.0%) | 11 (2.0%) |
| 19 to 25 Years | 119 (44.1%) | 151 (55.9%) |
| 26 to 34 Years | 112 (71.8%) | 44 (28.2%) |
| 35 to 44 Years | 369 (87.4%) | 53 (12.6%) |
| 45 to 54 Years | 184 (83.3%) | 37 (16.7%) |
| 55 to 64 Years | 350 (89.7%) | 40 (10.3%) |
| 65 to 74 Years | 175 (100.0%) | 0 (0.0%) |
| 75 Years and older | 232 (100.0%) | 0 (0.0%) |
| Total | 2,195 (86.7%) | 336 (13.3%) |
Health Insurance Coverage by Citizenship Status in Mauriceville
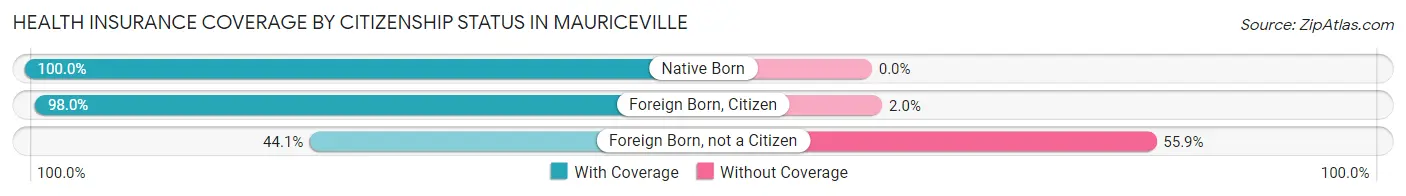
| Citizenship Status | With Coverage | Without Coverage |
| Native Born | 126 (100.0%) | 0 (0.0%) |
| Foreign Born, Citizen | 528 (98.0%) | 11 (2.0%) |
| Foreign Born, not a Citizen | 119 (44.1%) | 151 (55.9%) |
Health Insurance Coverage by Household Income in Mauriceville
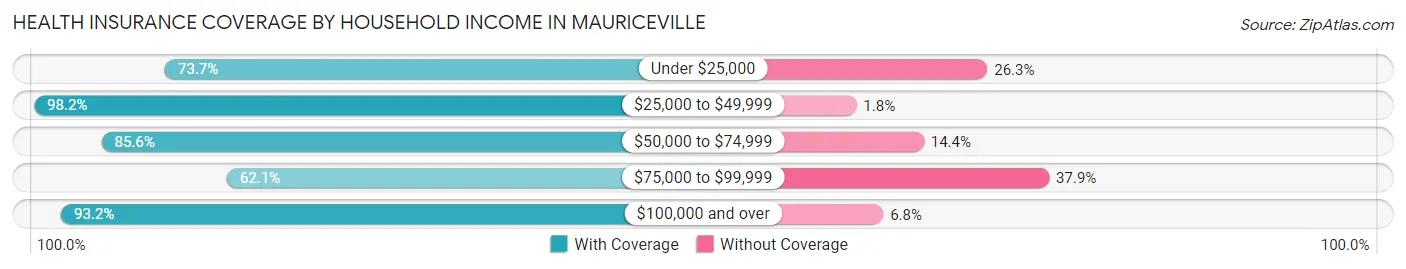
| Household Income | With Coverage | Without Coverage |
| Under $25,000 | 252 (73.7%) | 90 (26.3%) |
| $25,000 to $49,999 | 382 (98.2%) | 7 (1.8%) |
| $50,000 to $74,999 | 338 (85.6%) | 57 (14.4%) |
| $75,000 to $99,999 | 172 (62.1%) | 105 (37.9%) |
| $100,000 and over | 1,051 (93.2%) | 77 (6.8%) |
Public vs Private Health Insurance Coverage by Age in Mauriceville
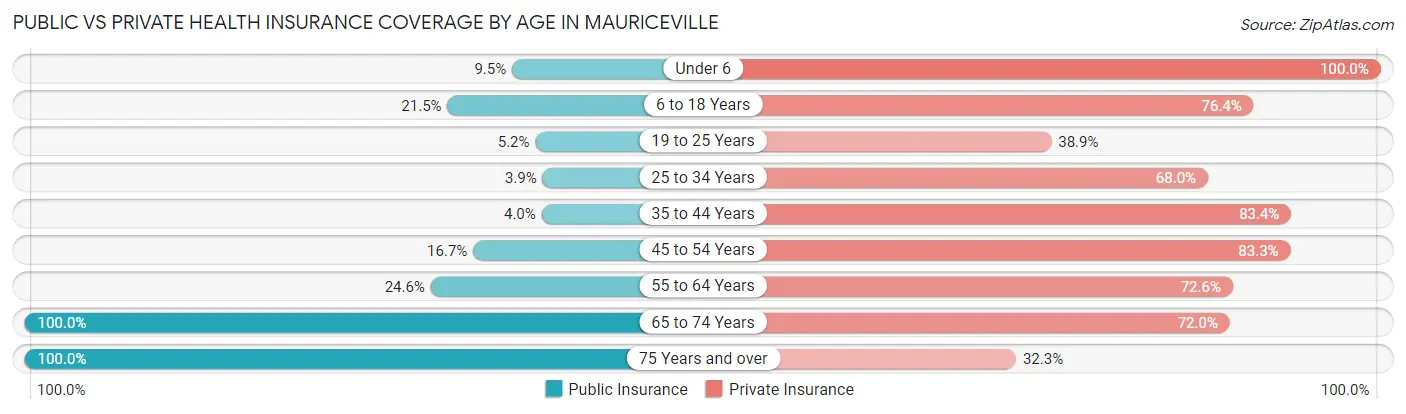
| Age Bracket | Public Insurance | Private Insurance |
| Under 6 | 12 (9.5%) | 126 (100.0%) |
| 6 to 18 Years | 116 (21.5%) | 412 (76.4%) |
| 19 to 25 Years | 14 (5.2%) | 105 (38.9%) |
| 25 to 34 Years | 6 (3.8%) | 106 (67.9%) |
| 35 to 44 Years | 17 (4.0%) | 352 (83.4%) |
| 45 to 54 Years | 37 (16.7%) | 184 (83.3%) |
| 55 to 64 Years | 96 (24.6%) | 283 (72.6%) |
| 65 to 74 Years | 175 (100.0%) | 126 (72.0%) |
| 75 Years and over | 232 (100.0%) | 75 (32.3%) |
| Total | 705 (27.9%) | 1,769 (69.9%) |
Disability Status by Sex by Age in Mauriceville
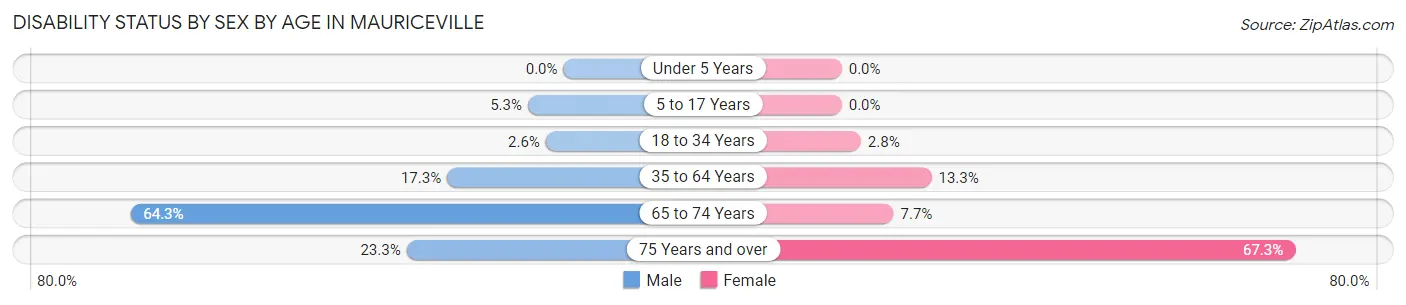
| Age Bracket | Male | Female |
| Under 5 Years | 0 (0.0%) | 0 (0.0%) |
| 5 to 17 Years | 15 (5.3%) | 0 (0.0%) |
| 18 to 34 Years | 6 (2.6%) | 6 (2.8%) |
| 35 to 64 Years | 80 (17.3%) | 76 (13.3%) |
| 65 to 74 Years | 54 (64.3%) | 7 (7.7%) |
| 75 Years and over | 17 (23.3%) | 107 (67.3%) |
Disability Class by Sex by Age in Mauriceville
Disability Class: Hearing Difficulty
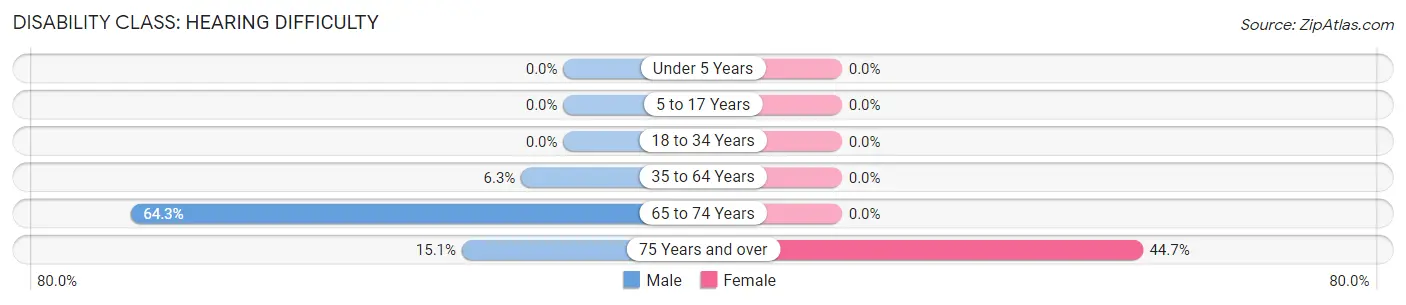
| Age Bracket | Male | Female |
| Under 5 Years | 0 (0.0%) | 0 (0.0%) |
| 5 to 17 Years | 0 (0.0%) | 0 (0.0%) |
| 18 to 34 Years | 0 (0.0%) | 0 (0.0%) |
| 35 to 64 Years | 29 (6.3%) | 0 (0.0%) |
| 65 to 74 Years | 54 (64.3%) | 0 (0.0%) |
| 75 Years and over | 11 (15.1%) | 71 (44.7%) |
Disability Class: Vision Difficulty
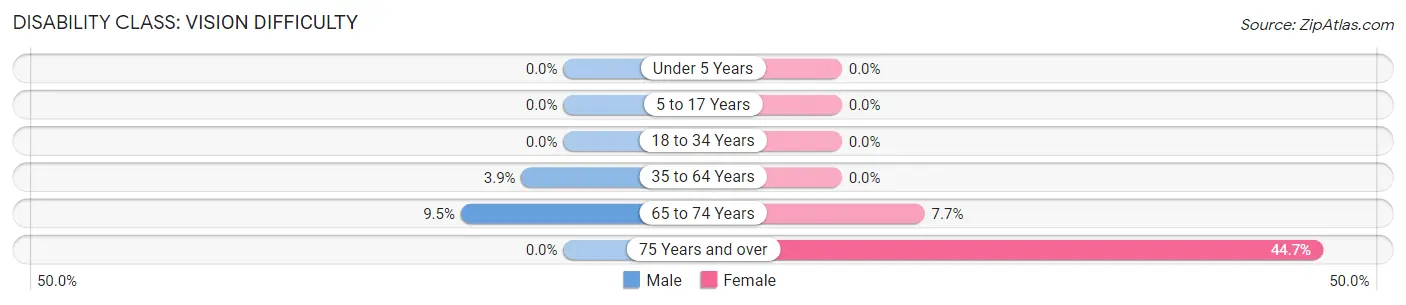
| Age Bracket | Male | Female |
| Under 5 Years | 0 (0.0%) | 0 (0.0%) |
| 5 to 17 Years | 0 (0.0%) | 0 (0.0%) |
| 18 to 34 Years | 0 (0.0%) | 0 (0.0%) |
| 35 to 64 Years | 18 (3.9%) | 0 (0.0%) |
| 65 to 74 Years | 8 (9.5%) | 7 (7.7%) |
| 75 Years and over | 0 (0.0%) | 71 (44.7%) |
Disability Class: Cognitive Difficulty
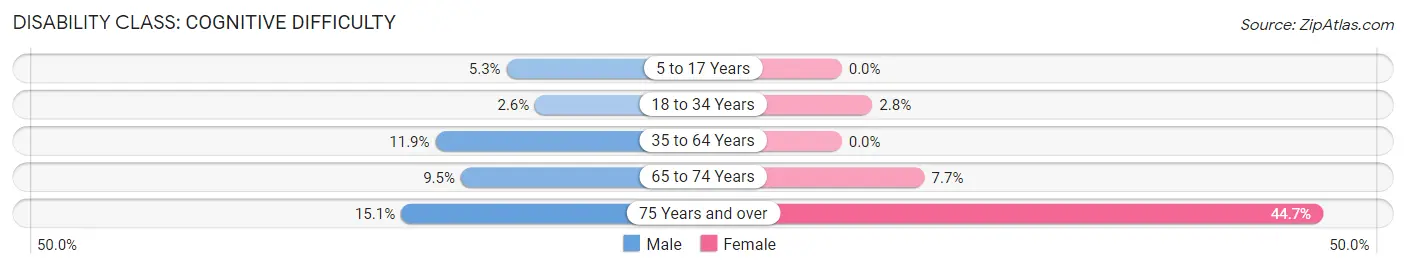
| Age Bracket | Male | Female |
| 5 to 17 Years | 15 (5.3%) | 0 (0.0%) |
| 18 to 34 Years | 6 (2.6%) | 6 (2.8%) |
| 35 to 64 Years | 55 (11.9%) | 0 (0.0%) |
| 65 to 74 Years | 8 (9.5%) | 7 (7.7%) |
| 75 Years and over | 11 (15.1%) | 71 (44.7%) |
Disability Class: Ambulatory Difficulty
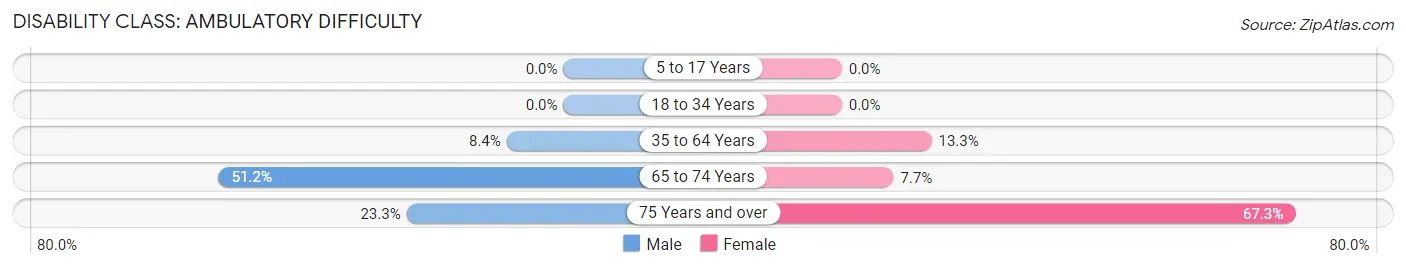
| Age Bracket | Male | Female |
| 5 to 17 Years | 0 (0.0%) | 0 (0.0%) |
| 18 to 34 Years | 0 (0.0%) | 0 (0.0%) |
| 35 to 64 Years | 39 (8.4%) | 76 (13.3%) |
| 65 to 74 Years | 43 (51.2%) | 7 (7.7%) |
| 75 Years and over | 17 (23.3%) | 107 (67.3%) |
Disability Class: Self-Care Difficulty
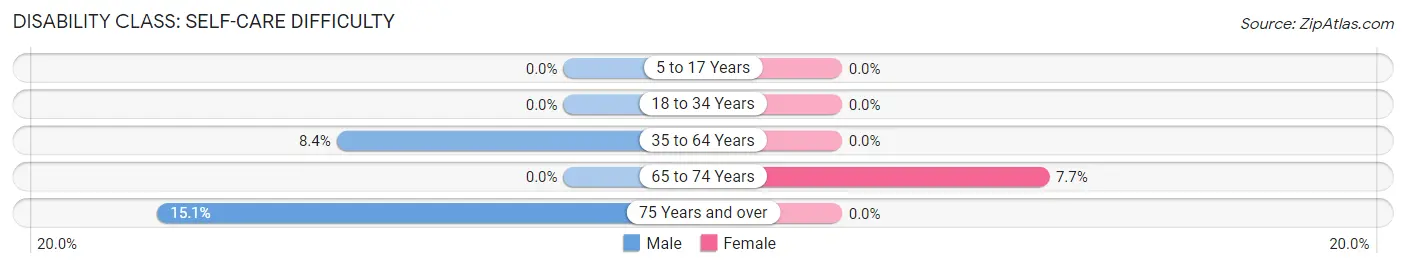
| Age Bracket | Male | Female |
| 5 to 17 Years | 0 (0.0%) | 0 (0.0%) |
| 18 to 34 Years | 0 (0.0%) | 0 (0.0%) |
| 35 to 64 Years | 39 (8.4%) | 0 (0.0%) |
| 65 to 74 Years | 0 (0.0%) | 7 (7.7%) |
| 75 Years and over | 11 (15.1%) | 0 (0.0%) |
Technology Access in Mauriceville
Computing Device Access in Mauriceville
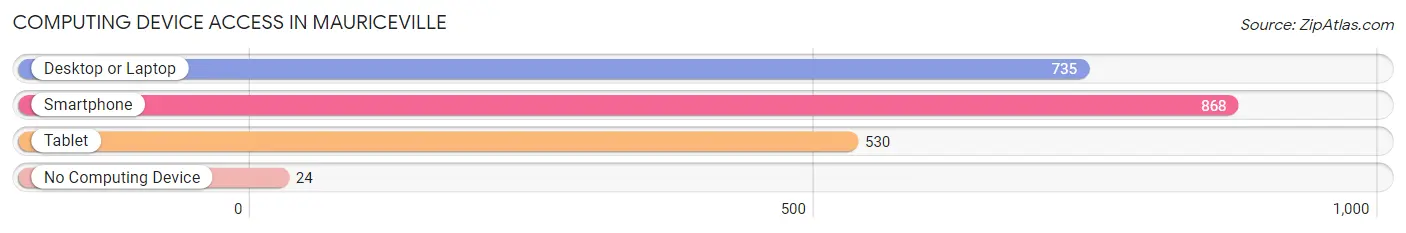
| Device Type | # Households | % Households |
| Desktop or Laptop | 735 | 78.0% |
| Smartphone | 868 | 92.1% |
| Tablet | 530 | 56.3% |
| No Computing Device | 24 | 2.5% |
| Total | 942 | 100.0% |
Internet Access in Mauriceville
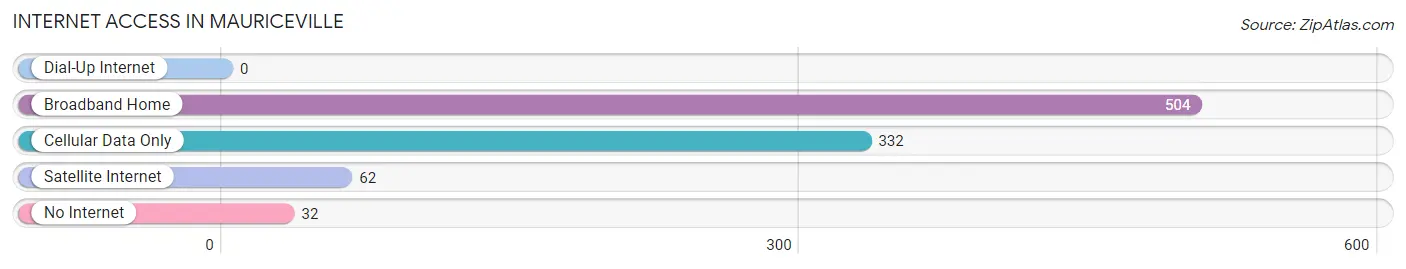
| Internet Type | # Households | % Households |
| Dial-Up Internet | 0 | 0.0% |
| Broadband Home | 504 | 53.5% |
| Cellular Data Only | 332 | 35.2% |
| Satellite Internet | 62 | 6.6% |
| No Internet | 32 | 3.4% |
| Total | 942 | 100.0% |
Mauriceville Summary
Mauriceville is a small unincorporated community located in Orange County, Texas, United States. It is situated approximately 10 miles north of the city of Orange and is part of the Beaumont–Port Arthur Metropolitan Statistical Area. The population of Mauriceville was estimated to be 1,845 in 2019.
History
Mauriceville was founded in 1883 by a group of French settlers led by Maurice LeBlanc. The settlers named the town after LeBlanc and established a post office in 1884. The town grew slowly but steadily over the years, and by the early 1900s, it had become a thriving agricultural community. The town was incorporated in 1912, and the first mayor was elected in 1913.
In the 1920s, the town began to experience a period of growth and prosperity. The population increased from around 500 in 1920 to over 1,000 by 1930. During this time, the town was home to several businesses, including a bank, a hotel, a general store, and a cotton gin.
In the 1940s, the town experienced a period of decline as many of its residents moved away in search of better economic opportunities. The population decreased from 1,000 in 1940 to just over 500 in 1950.
Geography
Mauriceville is located in Orange County, Texas, approximately 10 miles north of the city of Orange. It is situated at the intersection of State Highway 62 and Farm to Market Road 105. The town is surrounded by a number of small towns and rural communities, including Vidor, Pine Forest, and Rose City.
The terrain around Mauriceville is mostly flat, with some rolling hills in the area. The town is located in the Piney Woods region of East Texas, and the climate is humid subtropical. The average annual temperature is around 70°F, and the average annual precipitation is around 50 inches.
Economy
Mauriceville’s economy is largely based on agriculture. The town is home to several farms and ranches, and the surrounding area is known for its production of cotton, soybeans, and other crops. The town is also home to several small businesses, including a grocery store, a hardware store, and a few restaurants.
Demographics
As of the 2019 census, the population of Mauriceville was estimated to be 1,845. The racial makeup of the town was 79.2% White, 16.2% African American, 0.7% Native American, 0.7% Asian, and 3.2% from other races. The median household income was $45,938, and the median home value was $117,400.
Conclusion
Mauriceville is a small unincorporated community located in Orange County, Texas. It was founded in 1883 by a group of French settlers and has since grown into a thriving agricultural community. The town’s economy is largely based on agriculture, and the population is estimated to be 1,845. Mauriceville is a diverse community with a rich history and a bright future.
Common Questions
What is Per Capita Income in Mauriceville?
Per Capita income in Mauriceville is $31,987.
What is the Median Family Income in Mauriceville?
Median Family Income in Mauriceville is $82,813.
What is the Median Household income in Mauriceville?
Median Household Income in Mauriceville is $68,190.
What is Income or Wage Gap in Mauriceville?
Income or Wage Gap in Mauriceville is 53.9%.
Women in Mauriceville earn 46.1 cents for every dollar earned by a man.
What is Inequality or Gini Index in Mauriceville?
Inequality or Gini Index in Mauriceville is 0.42.
What is the Total Population of Mauriceville?
Total Population of Mauriceville is 2,531.
What is the Total Male Population of Mauriceville?
Total Male Population of Mauriceville is 1,144.
What is the Total Female Population of Mauriceville?
Total Female Population of Mauriceville is 1,387.
What is the Ratio of Males per 100 Females in Mauriceville?
There are 82.48 Males per 100 Females in Mauriceville.
What is the Ratio of Females per 100 Males in Mauriceville?
There are 121.24 Females per 100 Males in Mauriceville.
What is the Median Population Age in Mauriceville?
Median Population Age in Mauriceville is 39.0 Years.
What is the Average Family Size in Mauriceville
Average Family Size in Mauriceville is 3.0 People.
What is the Average Household Size in Mauriceville
Average Household Size in Mauriceville is 2.7 People.
How Large is the Labor Force in Mauriceville?
There are 1,183 People in the Labor Forcein in Mauriceville.
What is the Percentage of People in the Labor Force in Mauriceville?
59.8% of People are in the Labor Force in Mauriceville.
What is the Unemployment Rate in Mauriceville?
Unemployment Rate in Mauriceville is 8.2%.