Marble Falls, TX Map & Demographics
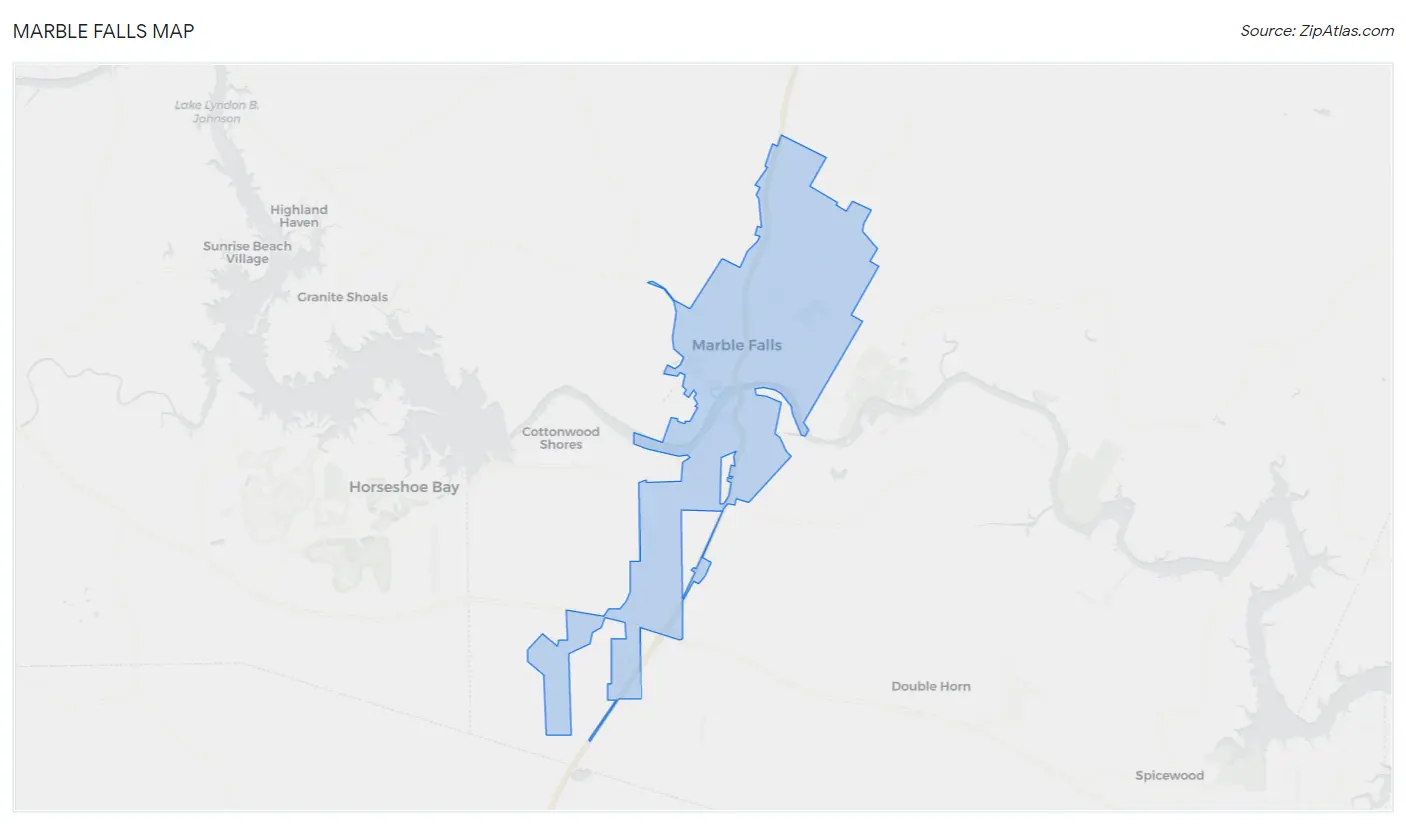
Marble Falls Map
Marble Falls Overview
$38,904
PER CAPITA INCOME
$57,404
AVG FAMILY INCOME
$53,789
AVG HOUSEHOLD INCOME
24.6%
WAGE / INCOME GAP [ % ]
75.4¢/ $1
WAGE / INCOME GAP [ $ ]
0.54
INEQUALITY / GINI INDEX
7,068
TOTAL POPULATION
3,796
MALE POPULATION
3,272
FEMALE POPULATION
116.01
MALES / 100 FEMALES
86.20
FEMALES / 100 MALES
36.8
MEDIAN AGE
3.2
AVG FAMILY SIZE
2.5
AVG HOUSEHOLD SIZE
3,703
LABOR FORCE [ PEOPLE ]
64.7%
PERCENT IN LABOR FORCE
4.2%
UNEMPLOYMENT RATE
Marble Falls Zip Codes
Marble Falls Area Codes
Income in Marble Falls
Income Overview in Marble Falls
Per Capita Income in Marble Falls is $38,904, while median incomes of families and households are $57,404 and $53,789 respectively.
| Characteristic | Number | Measure |
| Per Capita Income | 7,068 | $38,904 |
| Median Family Income | 1,658 | $57,404 |
| Mean Family Income | 1,658 | $125,930 |
| Median Household Income | 2,791 | $53,789 |
| Mean Household Income | 2,791 | $96,886 |
| Income Deficit | 1,658 | $0 |
| Wage / Income Gap (%) | 7,068 | 24.58% |
| Wage / Income Gap ($) | 7,068 | 75.42¢ per $1 |
| Gini / Inequality Index | 7,068 | 0.54 |
Earnings by Sex in Marble Falls
Average Earnings in Marble Falls are $28,750, $31,516 for men and $23,770 for women, a difference of 24.6%.
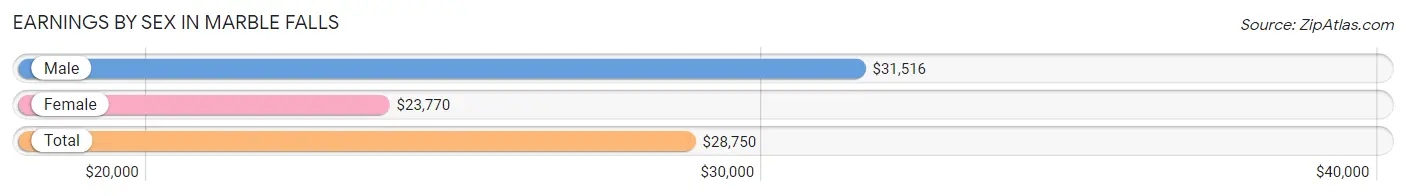
| Sex | Number | Average Earnings |
| Male | 2,222 (58.3%) | $31,516 |
| Female | 1,589 (41.7%) | $23,770 |
| Total | 3,811 (100.0%) | $28,750 |
Earnings by Sex by Income Bracket in Marble Falls
The most common earnings brackets in Marble Falls are $100,000+ for men (313 | 14.1%) and $17,500 to $19,999 for women (309 | 19.5%).
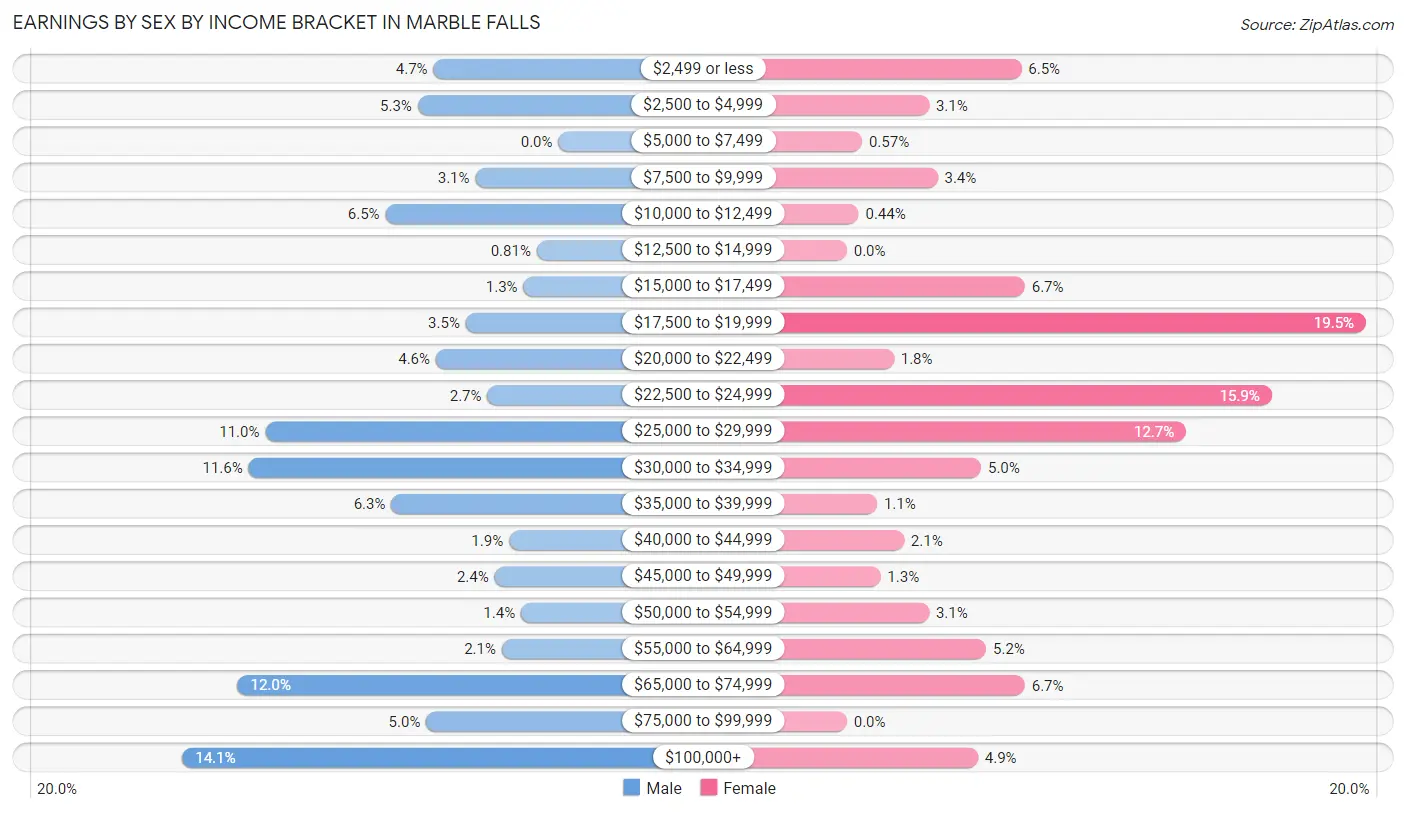
| Income | Male | Female |
| $2,499 or less | 104 (4.7%) | 104 (6.5%) |
| $2,500 to $4,999 | 117 (5.3%) | 49 (3.1%) |
| $5,000 to $7,499 | 0 (0.0%) | 9 (0.6%) |
| $7,500 to $9,999 | 69 (3.1%) | 54 (3.4%) |
| $10,000 to $12,499 | 144 (6.5%) | 7 (0.4%) |
| $12,500 to $14,999 | 18 (0.8%) | 0 (0.0%) |
| $15,000 to $17,499 | 29 (1.3%) | 106 (6.7%) |
| $17,500 to $19,999 | 77 (3.5%) | 309 (19.5%) |
| $20,000 to $22,499 | 102 (4.6%) | 28 (1.8%) |
| $22,500 to $24,999 | 59 (2.7%) | 253 (15.9%) |
| $25,000 to $29,999 | 244 (11.0%) | 202 (12.7%) |
| $30,000 to $34,999 | 258 (11.6%) | 80 (5.0%) |
| $35,000 to $39,999 | 139 (6.3%) | 18 (1.1%) |
| $40,000 to $44,999 | 41 (1.8%) | 34 (2.1%) |
| $45,000 to $49,999 | 53 (2.4%) | 20 (1.3%) |
| $50,000 to $54,999 | 31 (1.4%) | 49 (3.1%) |
| $55,000 to $64,999 | 47 (2.1%) | 83 (5.2%) |
| $65,000 to $74,999 | 267 (12.0%) | 106 (6.7%) |
| $75,000 to $99,999 | 110 (5.0%) | 0 (0.0%) |
| $100,000+ | 313 (14.1%) | 78 (4.9%) |
| Total | 2,222 (100.0%) | 1,589 (100.0%) |
Earnings by Sex by Educational Attainment in Marble Falls
Average earnings in Marble Falls are $37,295 for men and $23,079 for women, a difference of 38.1%. Men with an educational attainment of bachelor's degree enjoy the highest average annual earnings of $99,375, while those with high school diploma education earn the least with $28,058. Women with an educational attainment of graduate degree earn the most with the average annual earnings of $68,148, while those with high school diploma education have the smallest earnings of $18,946.
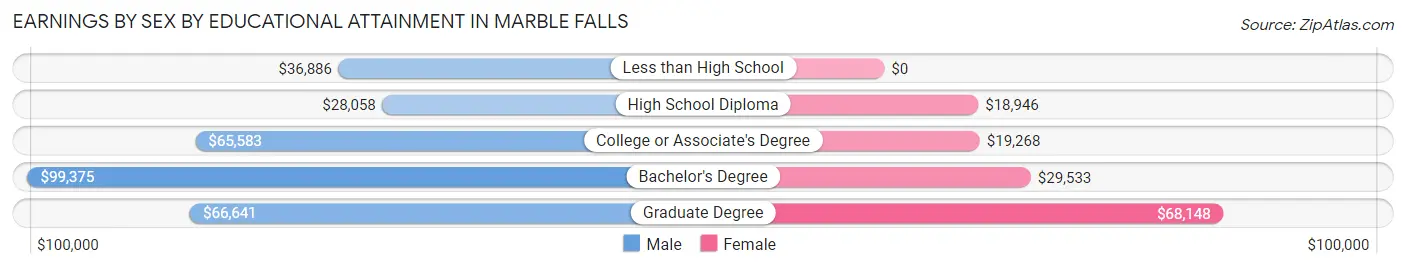
| Educational Attainment | Male Income | Female Income |
| Less than High School | $36,886 | $0 |
| High School Diploma | $28,058 | $18,946 |
| College or Associate's Degree | $65,583 | $19,268 |
| Bachelor's Degree | $99,375 | $29,533 |
| Graduate Degree | $66,641 | $68,148 |
| Total | $37,295 | $23,079 |
Family Income in Marble Falls
Family Income Brackets in Marble Falls
According to the Marble Falls family income data, there are 351 families falling into the $35,000 to $49,999 income range, which is the most common income bracket and makes up 21.2% of all families.
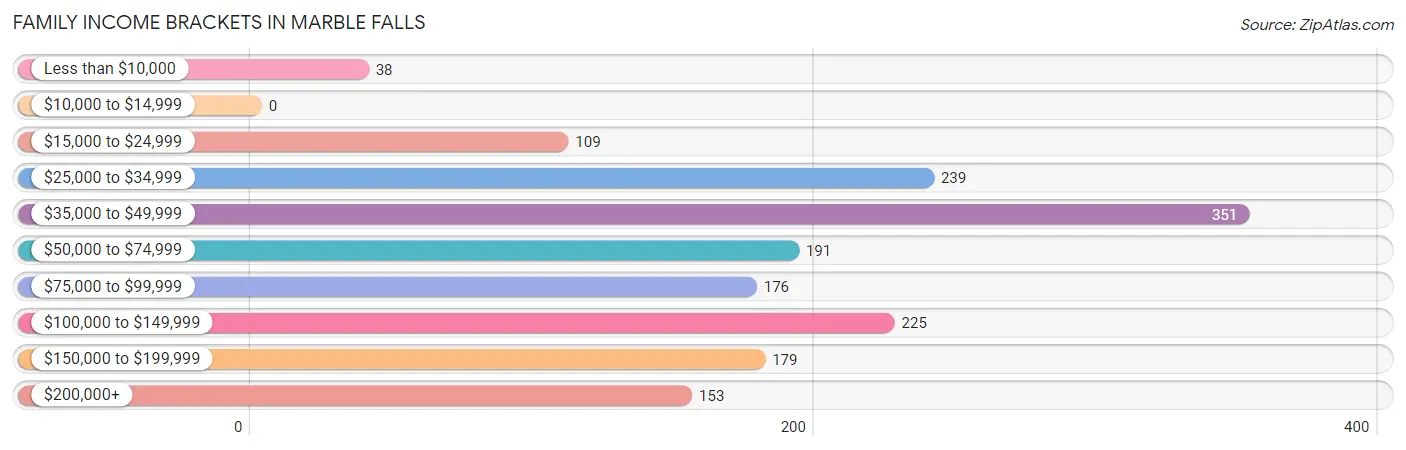
| Income Bracket | # Families | % Families |
| Less than $10,000 | 38 | 2.3% |
| $10,000 to $14,999 | 0 | 0.0% |
| $15,000 to $24,999 | 109 | 6.6% |
| $25,000 to $34,999 | 239 | 14.4% |
| $35,000 to $49,999 | 351 | 21.2% |
| $50,000 to $74,999 | 191 | 11.5% |
| $75,000 to $99,999 | 176 | 10.6% |
| $100,000 to $149,999 | 225 | 13.6% |
| $150,000 to $199,999 | 179 | 10.8% |
| $200,000+ | 153 | 9.2% |
Family Income by Famaliy Size in Marble Falls
5-person families (80 | 4.8%) account for the highest median family income in Marble Falls with $250,001 per family, while 5-person families (80 | 4.8%) have the highest median income of $50,000 per family member.
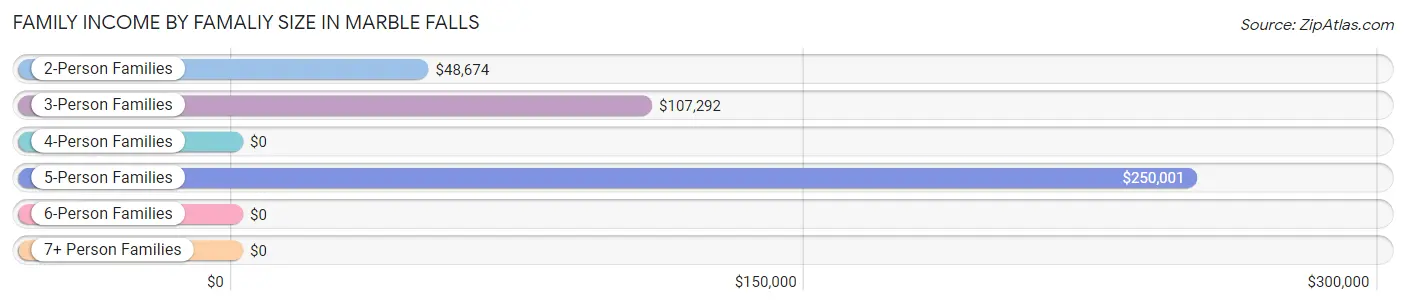
| Income Bracket | # Families | Median Income |
| 2-Person Families | 781 (47.1%) | $48,674 |
| 3-Person Families | 247 (14.9%) | $107,292 |
| 4-Person Families | 133 (8.0%) | $0 |
| 5-Person Families | 80 (4.8%) | $250,001 |
| 6-Person Families | 308 (18.6%) | $0 |
| 7+ Person Families | 109 (6.6%) | $0 |
| Total | 1,658 (100.0%) | $57,404 |
Family Income by Number of Earners in Marble Falls
The median family income in Marble Falls is $57,404, with families comprising 3+ earners (278) having the highest median family income of $162,232, while families with 1 earner (466) have the lowest median family income of $31,621, accounting for 16.8% and 28.1% of families, respectively.
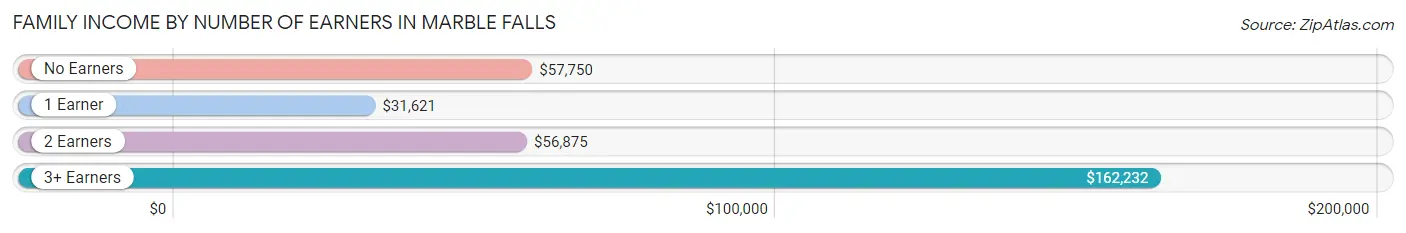
| Number of Earners | # Families | Median Income |
| No Earners | 225 (13.6%) | $57,750 |
| 1 Earner | 466 (28.1%) | $31,621 |
| 2 Earners | 689 (41.6%) | $56,875 |
| 3+ Earners | 278 (16.8%) | $162,232 |
| Total | 1,658 (100.0%) | $57,404 |
Household Income in Marble Falls
Household Income Brackets in Marble Falls
With 608 households falling in the category, the $50,000 to $74,999 income range is the most frequent in Marble Falls, accounting for 21.8% of all households. In contrast, only 28 households (1.0%) fall into the $10,000 to $14,999 income bracket, making it the least populous group.
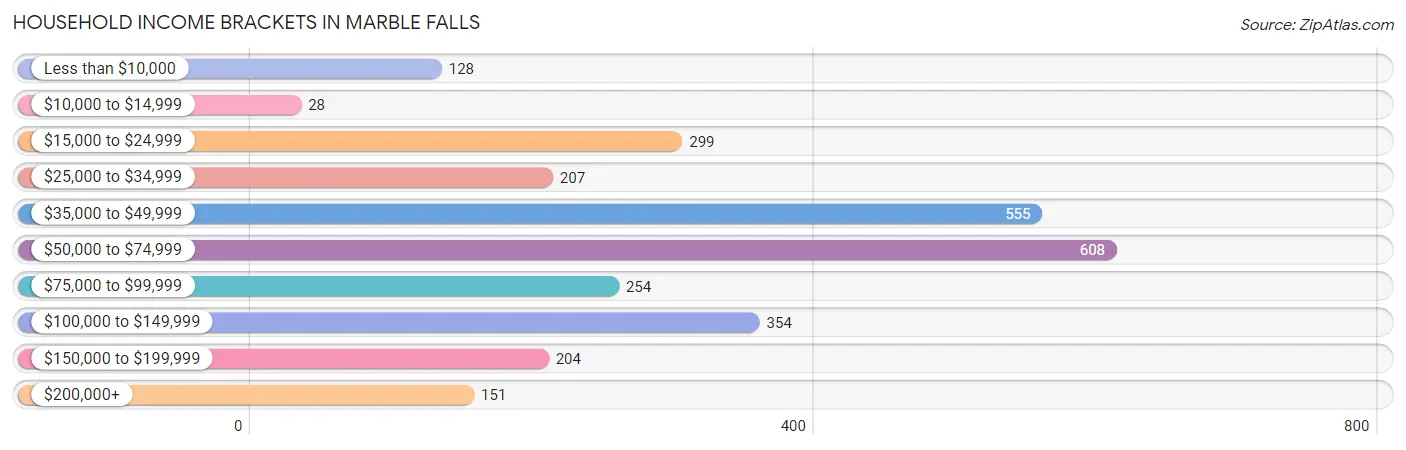
| Income Bracket | # Households | % Households |
| Less than $10,000 | 128 | 4.6% |
| $10,000 to $14,999 | 28 | 1.0% |
| $15,000 to $24,999 | 299 | 10.7% |
| $25,000 to $34,999 | 207 | 7.4% |
| $35,000 to $49,999 | 555 | 19.9% |
| $50,000 to $74,999 | 608 | 21.8% |
| $75,000 to $99,999 | 254 | 9.1% |
| $100,000 to $149,999 | 354 | 12.7% |
| $150,000 to $199,999 | 204 | 7.3% |
| $200,000+ | 151 | 5.4% |
Household Income by Householder Age in Marble Falls
The median household income in Marble Falls is $53,789, with the highest median household income of $89,375 found in the 45 to 64 years age bracket for the primary householder. A total of 809 households (29.0%) fall into this category. Meanwhile, the 65+ years age bracket for the primary householder has the lowest median household income of $37,500, with 988 households (35.4%) in this group.
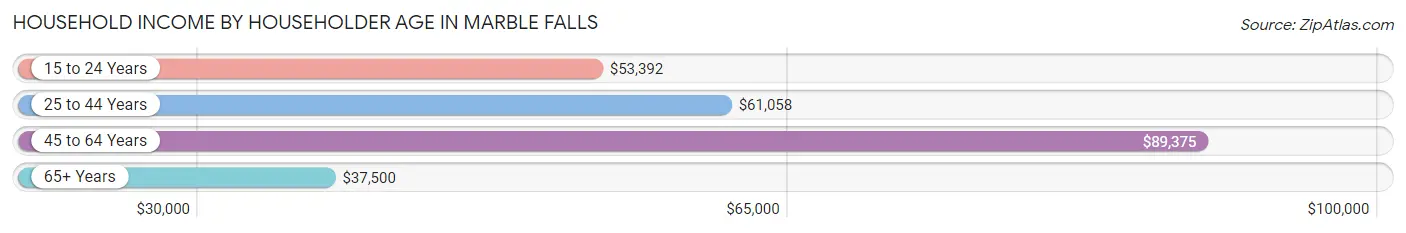
| Income Bracket | # Households | Median Income |
| 15 to 24 Years | 223 (8.0%) | $53,392 |
| 25 to 44 Years | 771 (27.6%) | $61,058 |
| 45 to 64 Years | 809 (29.0%) | $89,375 |
| 65+ Years | 988 (35.4%) | $37,500 |
| Total | 2,791 (100.0%) | $53,789 |
Poverty in Marble Falls
Income Below Poverty by Sex and Age in Marble Falls
With 7.3% poverty level for males and 11.4% for females among the residents of Marble Falls, 18 to 24 year old males and 5 year old females are the most vulnerable to poverty, with 144 males (34.7%) and 22 females (100.0%) in their respective age groups living below the poverty level.
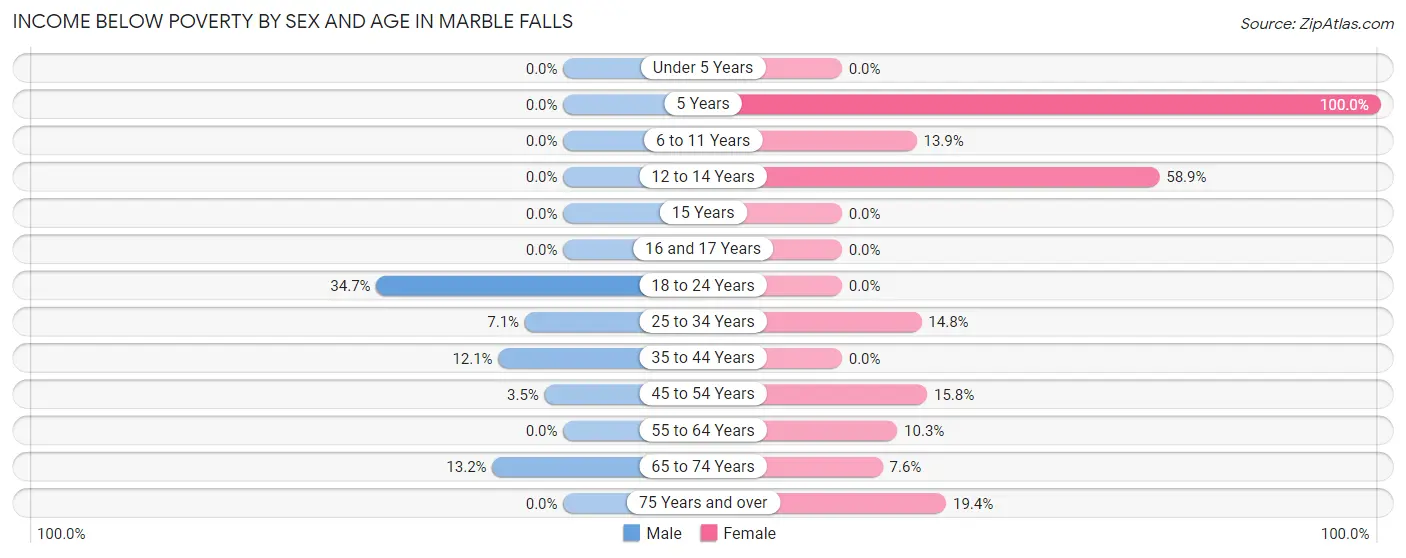
| Age Bracket | Male | Female |
| Under 5 Years | 0 (0.0%) | 0 (0.0%) |
| 5 Years | 0 (0.0%) | 22 (100.0%) |
| 6 to 11 Years | 0 (0.0%) | 48 (13.9%) |
| 12 to 14 Years | 0 (0.0%) | 33 (58.9%) |
| 15 Years | 0 (0.0%) | 0 (0.0%) |
| 16 and 17 Years | 0 (0.0%) | 0 (0.0%) |
| 18 to 24 Years | 144 (34.7%) | 0 (0.0%) |
| 25 to 34 Years | 32 (7.1%) | 51 (14.8%) |
| 35 to 44 Years | 53 (12.0%) | 0 (0.0%) |
| 45 to 54 Years | 7 (3.5%) | 38 (15.8%) |
| 55 to 64 Years | 0 (0.0%) | 52 (10.3%) |
| 65 to 74 Years | 42 (13.2%) | 21 (7.6%) |
| 75 Years and over | 0 (0.0%) | 101 (19.4%) |
| Total | 278 (7.3%) | 366 (11.4%) |
Income Above Poverty by Sex and Age in Marble Falls
According to the poverty statistics in Marble Falls, males aged under 5 years and females aged 15 years are the age groups that are most secure financially, with 100.0% of males and 100.0% of females in these age groups living above the poverty line.
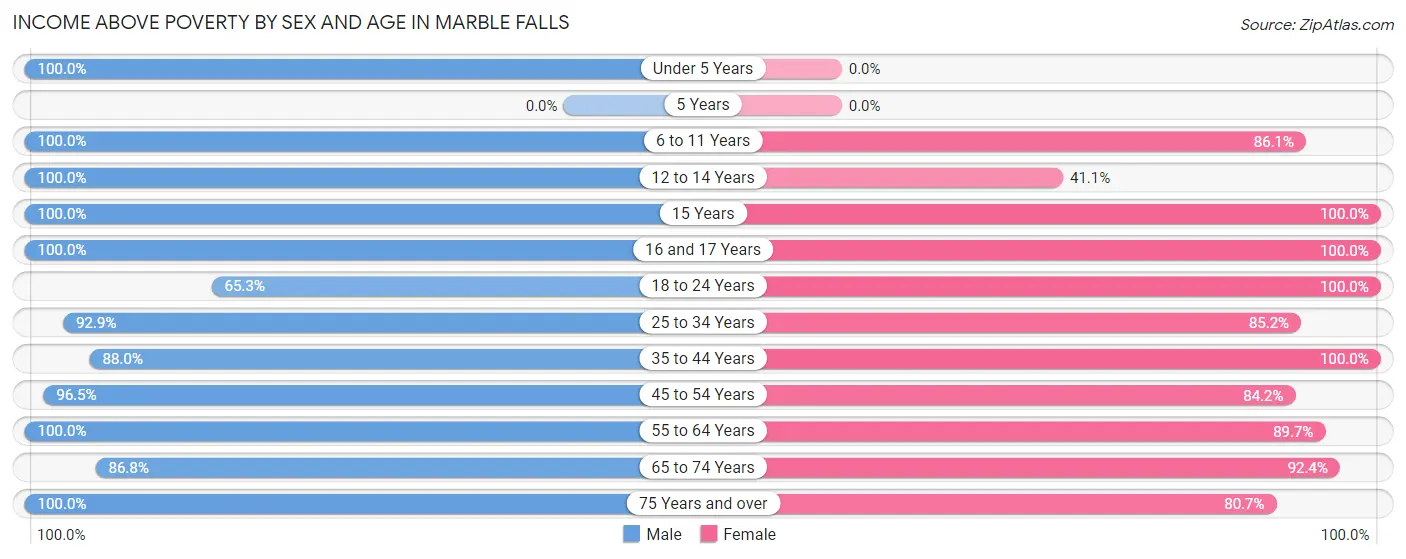
| Age Bracket | Male | Female |
| Under 5 Years | 321 (100.0%) | 0 (0.0%) |
| 5 Years | 0 (0.0%) | 0 (0.0%) |
| 6 to 11 Years | 339 (100.0%) | 298 (86.1%) |
| 12 to 14 Years | 183 (100.0%) | 23 (41.1%) |
| 15 Years | 69 (100.0%) | 9 (100.0%) |
| 16 and 17 Years | 269 (100.0%) | 36 (100.0%) |
| 18 to 24 Years | 271 (65.3%) | 309 (100.0%) |
| 25 to 34 Years | 417 (92.9%) | 294 (85.2%) |
| 35 to 44 Years | 387 (87.9%) | 556 (100.0%) |
| 45 to 54 Years | 195 (96.5%) | 202 (84.2%) |
| 55 to 64 Years | 597 (100.0%) | 454 (89.7%) |
| 65 to 74 Years | 277 (86.8%) | 256 (92.4%) |
| 75 Years and over | 177 (100.0%) | 421 (80.6%) |
| Total | 3,502 (92.6%) | 2,858 (88.6%) |
Income Below Poverty Among Married-Couple Families in Marble Falls
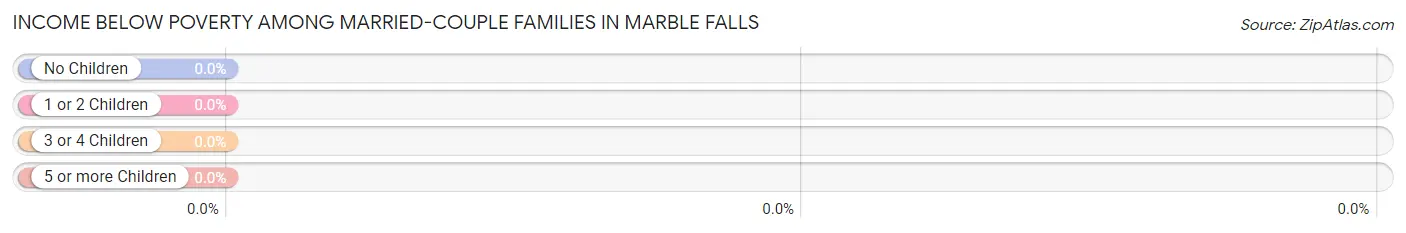
| Children | Above Poverty | Below Poverty |
| No Children | 438 (100.0%) | 0 (0.0%) |
| 1 or 2 Children | 253 (100.0%) | 0 (0.0%) |
| 3 or 4 Children | 417 (100.0%) | 0 (0.0%) |
| 5 or more Children | 0 (0.0%) | 0 (0.0%) |
| Total | 1,108 (100.0%) | 0 (0.0%) |
Income Below Poverty Among Single-Parent Households in Marble Falls
According to the poverty data in Marble Falls, 16.3% or 42 single-father households and 31.1% or 91 single-mother households are living below the poverty line. Among single-father households, those with no children have the highest poverty rate, with 21 households (29.2%) experiencing poverty. Likewise, among single-mother households, those with no children have the highest poverty rate, with 52 households (33.1%) falling below the poverty line.
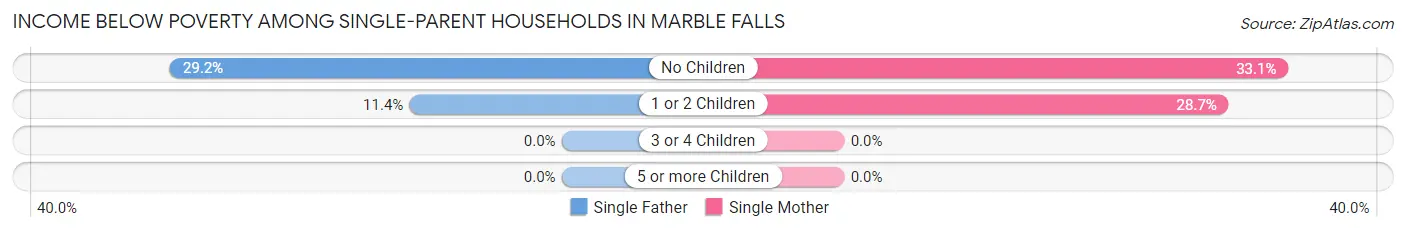
| Children | Single Father | Single Mother |
| No Children | 21 (29.2%) | 52 (33.1%) |
| 1 or 2 Children | 21 (11.4%) | 39 (28.7%) |
| 3 or 4 Children | 0 (0.0%) | 0 (0.0%) |
| 5 or more Children | 0 (0.0%) | 0 (0.0%) |
| Total | 42 (16.3%) | 91 (31.1%) |
Income Below Poverty Among Married-Couple vs Single-Parent Households in Marble Falls
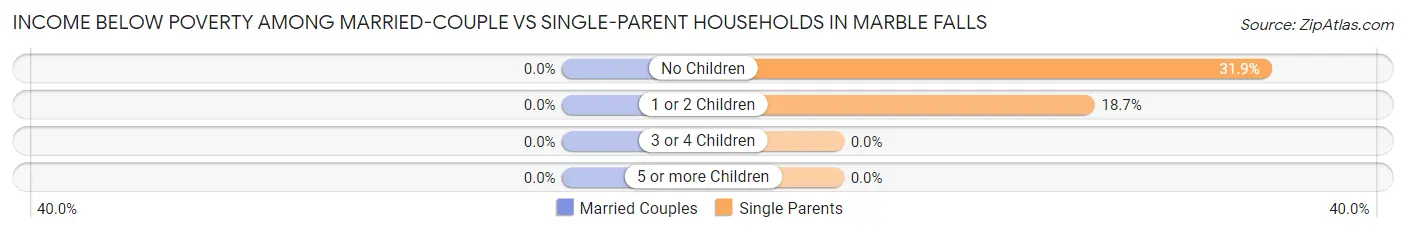
| Children | Married-Couple Families | Single-Parent Households |
| No Children | 0 (0.0%) | 73 (31.9%) |
| 1 or 2 Children | 0 (0.0%) | 60 (18.7%) |
| 3 or 4 Children | 0 (0.0%) | 0 (0.0%) |
| 5 or more Children | 0 (0.0%) | 0 (0.0%) |
| Total | 0 (0.0%) | 133 (24.2%) |
Race in Marble Falls
The most populous races in Marble Falls are White / Caucasian (5,943 | 84.1%), Hispanic or Latino (2,094 | 29.6%), and Two or more Races (683 | 9.7%).
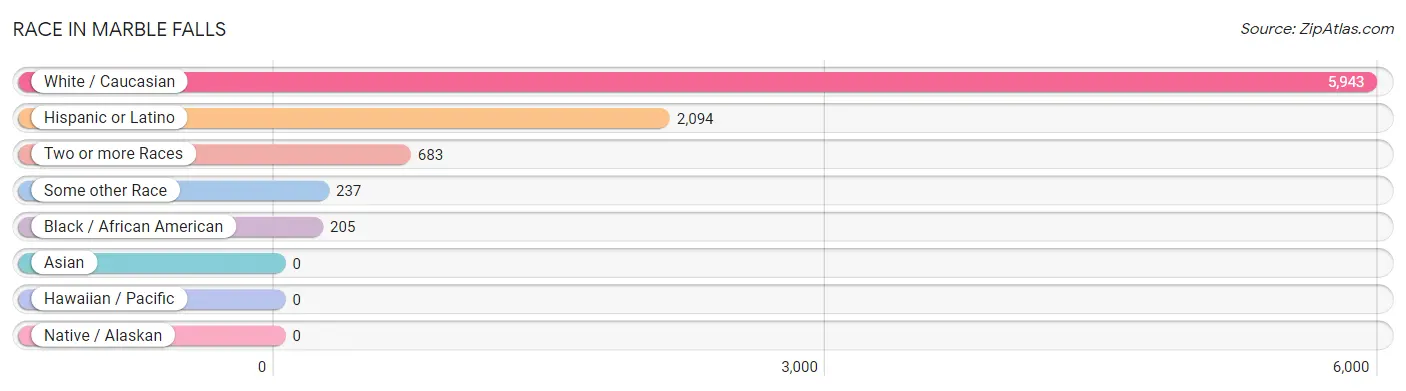
| Race | # Population | % Population |
| Asian | 0 | 0.0% |
| Black / African American | 205 | 2.9% |
| Hawaiian / Pacific | 0 | 0.0% |
| Hispanic or Latino | 2,094 | 29.6% |
| Native / Alaskan | 0 | 0.0% |
| White / Caucasian | 5,943 | 84.1% |
| Two or more Races | 683 | 9.7% |
| Some other Race | 237 | 3.4% |
| Total | 7,068 | 100.0% |
Ancestry in Marble Falls
The most populous ancestries reported in Marble Falls are Mexican (1,396 | 19.8%), English (937 | 13.3%), Irish (846 | 12.0%), German (694 | 9.8%), and Central American (578 | 8.2%), together accounting for 63.0% of all Marble Falls residents.
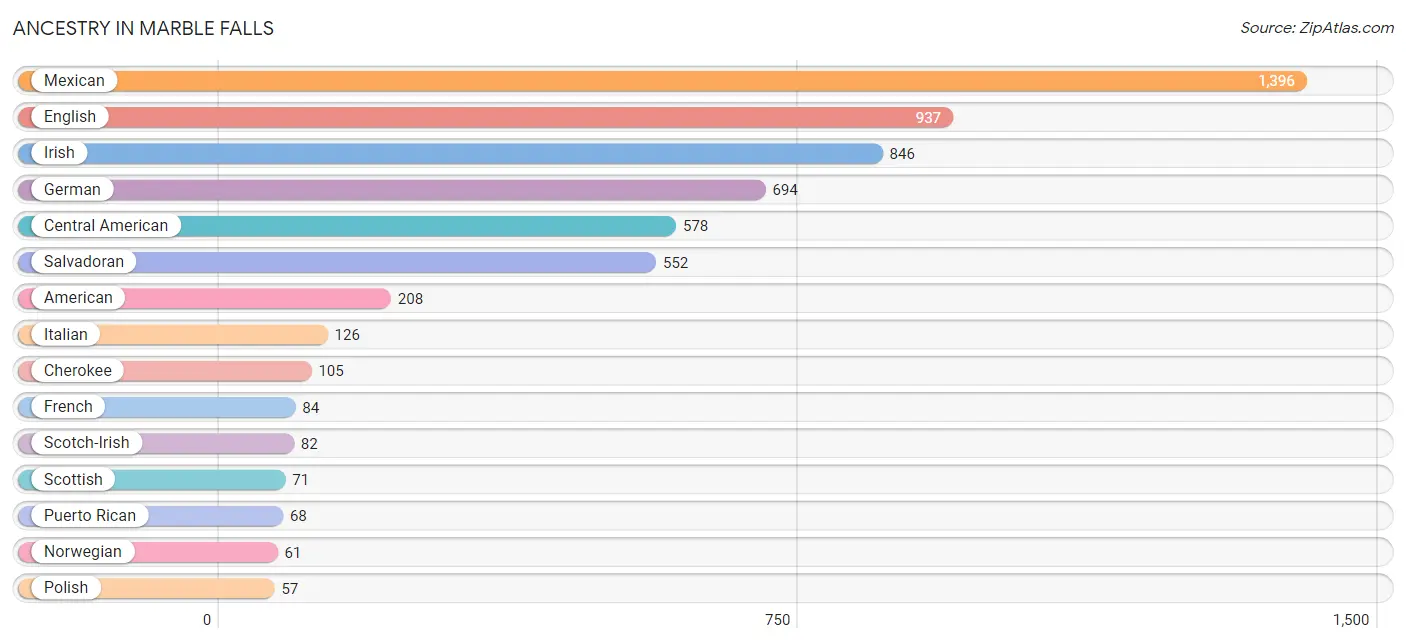
| Ancestry | # Population | % Population |
| American | 208 | 2.9% |
| Austrian | 10 | 0.1% |
| British | 47 | 0.7% |
| Central American | 578 | 8.2% |
| Cherokee | 105 | 1.5% |
| Comanche | 7 | 0.1% |
| Cuban | 21 | 0.3% |
| Dutch | 10 | 0.1% |
| English | 937 | 13.3% |
| European | 46 | 0.6% |
| French | 84 | 1.2% |
| German | 694 | 9.8% |
| Irish | 846 | 12.0% |
| Israeli | 12 | 0.2% |
| Italian | 126 | 1.8% |
| Korean | 19 | 0.3% |
| Mexican | 1,396 | 19.8% |
| Nicaraguan | 26 | 0.4% |
| Norwegian | 61 | 0.9% |
| Polish | 57 | 0.8% |
| Puerto Rican | 68 | 1.0% |
| Salvadoran | 552 | 7.8% |
| Scotch-Irish | 82 | 1.2% |
| Scottish | 71 | 1.0% |
| Spanish | 31 | 0.4% |
| Swedish | 9 | 0.1% |
| Swiss | 33 | 0.5% |
| Welsh | 26 | 0.4% | View All 28 Rows |
Immigrants in Marble Falls
The most numerous immigrant groups reported in Marble Falls came from Central America (653 | 9.2%), Latin America (653 | 9.2%), Mexico (509 | 7.2%), El Salvador (118 | 1.7%), and Nicaragua (26 | 0.4%), together accounting for 27.7% of all Marble Falls residents.
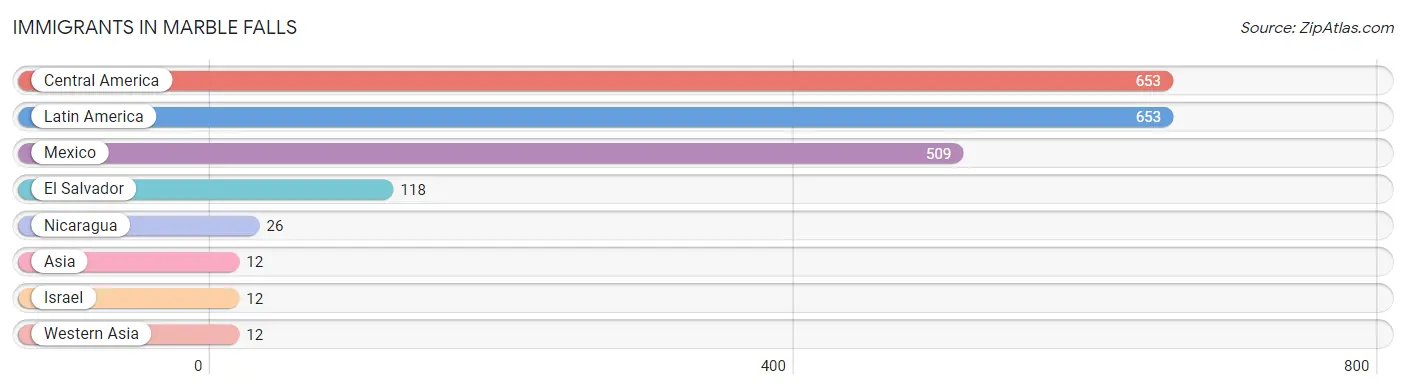
| Immigration Origin | # Population | % Population |
| Asia | 12 | 0.2% |
| Central America | 653 | 9.2% |
| El Salvador | 118 | 1.7% |
| Israel | 12 | 0.2% |
| Latin America | 653 | 9.2% |
| Mexico | 509 | 7.2% |
| Nicaragua | 26 | 0.4% |
| Western Asia | 12 | 0.2% | View All 8 Rows |
Sex and Age in Marble Falls
Sex and Age in Marble Falls
The most populous age groups in Marble Falls are 35 to 39 Years (421 | 11.1%) for men and 35 to 39 Years (337 | 10.3%) for women.
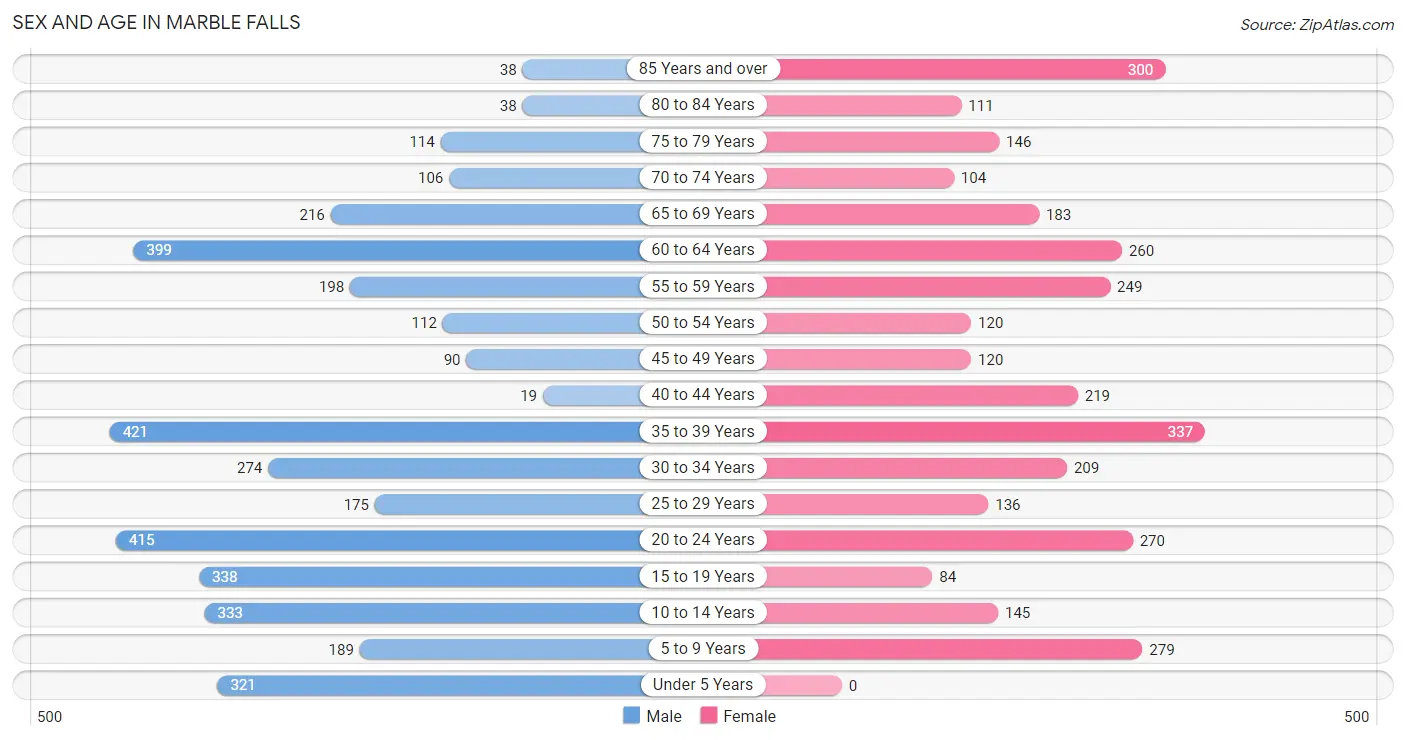
| Age Bracket | Male | Female |
| Under 5 Years | 321 (8.5%) | 0 (0.0%) |
| 5 to 9 Years | 189 (5.0%) | 279 (8.5%) |
| 10 to 14 Years | 333 (8.8%) | 145 (4.4%) |
| 15 to 19 Years | 338 (8.9%) | 84 (2.6%) |
| 20 to 24 Years | 415 (10.9%) | 270 (8.3%) |
| 25 to 29 Years | 175 (4.6%) | 136 (4.2%) |
| 30 to 34 Years | 274 (7.2%) | 209 (6.4%) |
| 35 to 39 Years | 421 (11.1%) | 337 (10.3%) |
| 40 to 44 Years | 19 (0.5%) | 219 (6.7%) |
| 45 to 49 Years | 90 (2.4%) | 120 (3.7%) |
| 50 to 54 Years | 112 (2.9%) | 120 (3.7%) |
| 55 to 59 Years | 198 (5.2%) | 249 (7.6%) |
| 60 to 64 Years | 399 (10.5%) | 260 (8.0%) |
| 65 to 69 Years | 216 (5.7%) | 183 (5.6%) |
| 70 to 74 Years | 106 (2.8%) | 104 (3.2%) |
| 75 to 79 Years | 114 (3.0%) | 146 (4.5%) |
| 80 to 84 Years | 38 (1.0%) | 111 (3.4%) |
| 85 Years and over | 38 (1.0%) | 300 (9.2%) |
| Total | 3,796 (100.0%) | 3,272 (100.0%) |
Families and Households in Marble Falls
Median Family Size in Marble Falls
The median family size in Marble Falls is 3.24 persons per family, with married-couple families (1,108 | 66.8%) accounting for the largest median family size of 3.63 persons per family. On the other hand, single male/father families (257 | 15.5%) represent the smallest median family size with 2.00 persons per family.
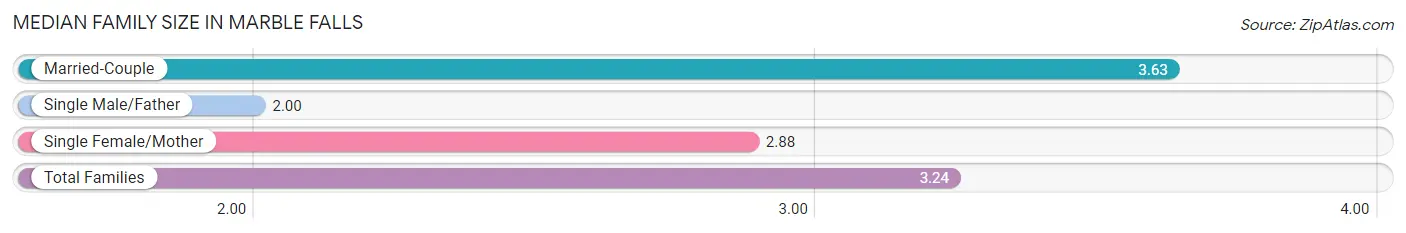
| Family Type | # Families | Family Size |
| Married-Couple | 1,108 (66.8%) | 3.63 |
| Single Male/Father | 257 (15.5%) | 2.00 |
| Single Female/Mother | 293 (17.7%) | 2.88 |
| Total Families | 1,658 (100.0%) | 3.24 |
Median Household Size in Marble Falls
The median household size in Marble Falls is 2.50 persons per household, with married-couple households (1,108 | 39.7%) accounting for the largest median household size of 3.63 persons per household. non-family households (1,133 | 40.6%) represent the smallest median household size with 1.21 persons per household.
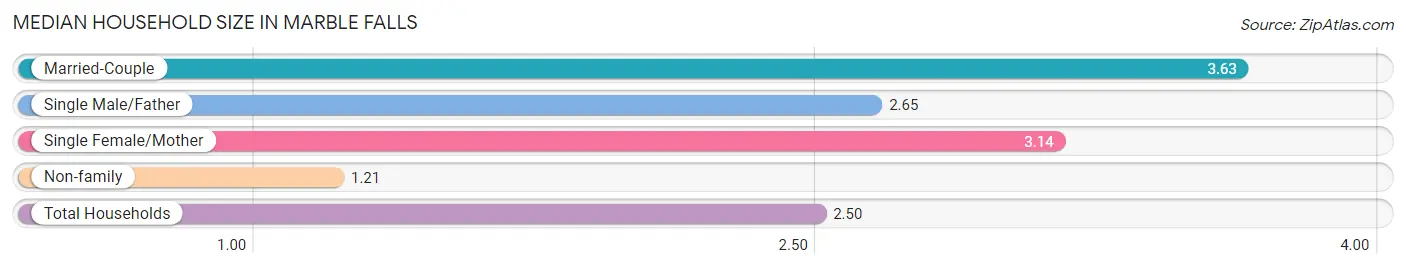
| Household Type | # Households | Household Size |
| Married-Couple | 1,108 (39.7%) | 3.63 |
| Single Male/Father | 257 (9.2%) | 2.65 |
| Single Female/Mother | 293 (10.5%) | 3.14 |
| Non-family | 1,133 (40.6%) | 1.21 |
| Total Households | 2,791 (100.0%) | 2.50 |
Household Size by Marriage Status in Marble Falls
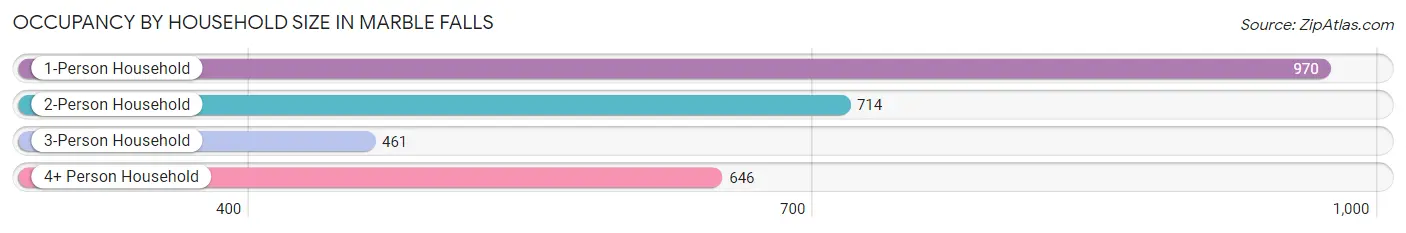
Out of a total of 2,791 households in Marble Falls, 1,658 (59.4%) are family households, while 1,133 (40.6%) are nonfamily households. The most numerous type of family households are 2-person households, comprising 593, and the most common type of nonfamily households are 1-person households, comprising 970.
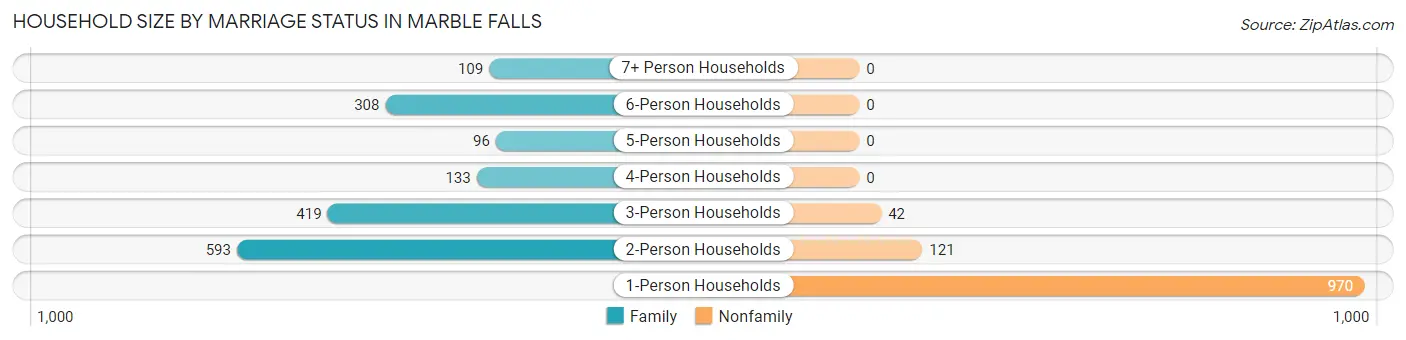
| Household Size | Family Households | Nonfamily Households |
| 1-Person Households | - | 970 (34.7%) |
| 2-Person Households | 593 (21.2%) | 121 (4.3%) |
| 3-Person Households | 419 (15.0%) | 42 (1.5%) |
| 4-Person Households | 133 (4.8%) | 0 (0.0%) |
| 5-Person Households | 96 (3.4%) | 0 (0.0%) |
| 6-Person Households | 308 (11.0%) | 0 (0.0%) |
| 7+ Person Households | 109 (3.9%) | 0 (0.0%) |
| Total | 1,658 (59.4%) | 1,133 (40.6%) |
Female Fertility in Marble Falls
Fertility by Age in Marble Falls
Average fertility rate in Marble Falls is 30.0 births per 1,000 women. Women in the age bracket of 35 to 50 years have the highest fertility rate with 33.0 births per 1,000 women. Women in the age bracket of 35 to 50 years acount for 53.7% of all women with births.
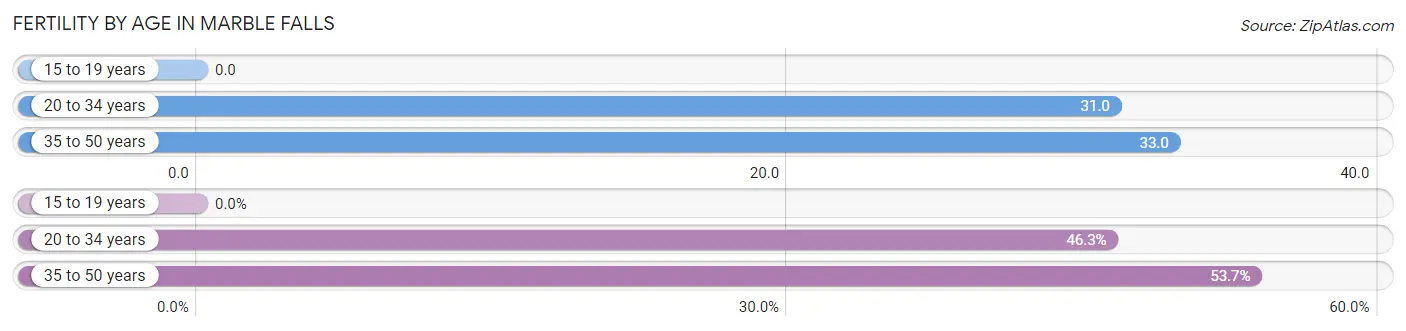
| Age Bracket | Women with Births | Births / 1,000 Women |
| 15 to 19 years | 0 (0.0%) | 0.0 |
| 20 to 34 years | 19 (46.3%) | 31.0 |
| 35 to 50 years | 22 (53.7%) | 33.0 |
| Total | 41 (100.0%) | 30.0 |
Fertility by Age by Marriage Status in Marble Falls
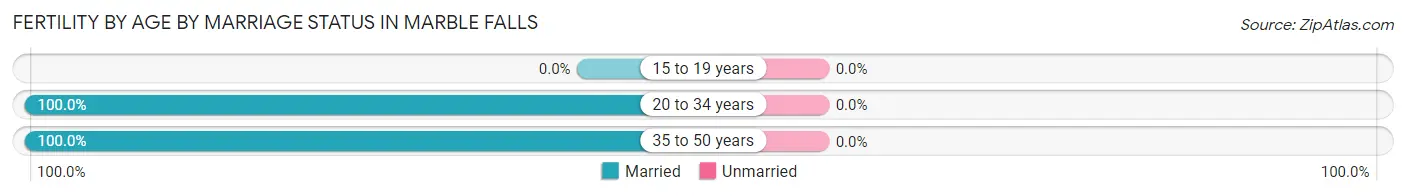
| Age Bracket | Married | Unmarried |
| 15 to 19 years | 0 (0.0%) | 0 (0.0%) |
| 20 to 34 years | 19 (100.0%) | 0 (0.0%) |
| 35 to 50 years | 22 (100.0%) | 0 (0.0%) |
| Total | 41 (100.0%) | 0 (0.0%) |
Fertility by Education in Marble Falls
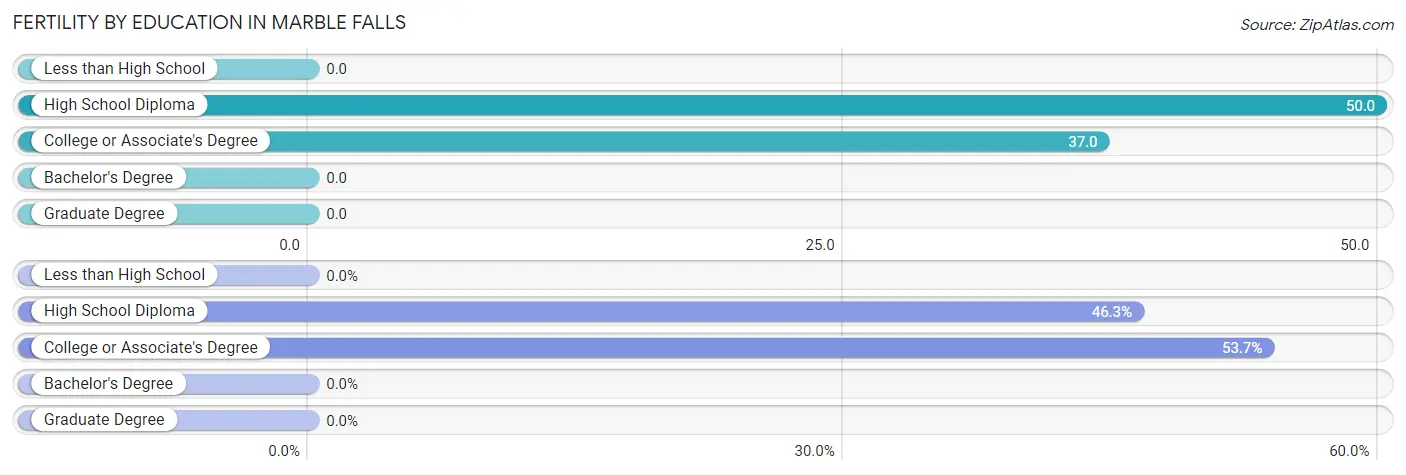
| Educational Attainment | Women with Births | Births / 1,000 Women |
| Less than High School | 0 (0.0%) | 0.0 |
| High School Diploma | 19 (46.3%) | 50.0 |
| College or Associate's Degree | 22 (53.7%) | 37.0 |
| Bachelor's Degree | 0 (0.0%) | 0.0 |
| Graduate Degree | 0 (0.0%) | 0.0 |
| Total | 41 (100.0%) | 30.0 |
Fertility by Education by Marriage Status in Marble Falls
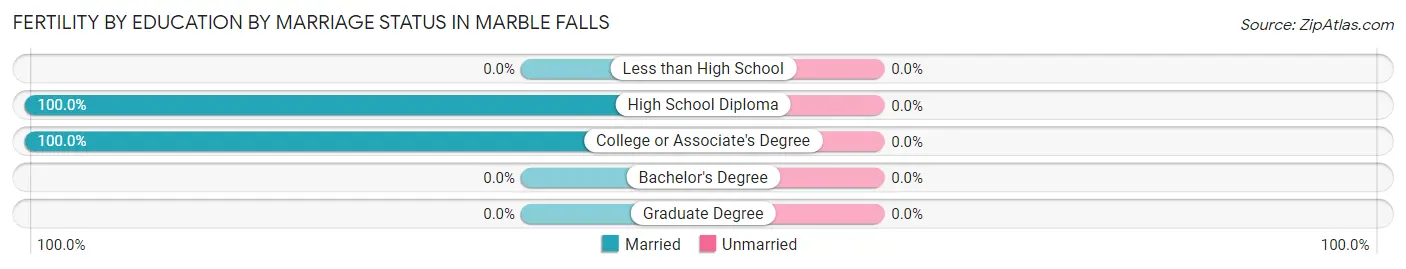
| Educational Attainment | Married | Unmarried |
| Less than High School | 0 (0.0%) | 0 (0.0%) |
| High School Diploma | 19 (100.0%) | 0 (0.0%) |
| College or Associate's Degree | 22 (100.0%) | 0 (0.0%) |
| Bachelor's Degree | 0 (0.0%) | 0 (0.0%) |
| Graduate Degree | 0 (0.0%) | 0 (0.0%) |
| Total | 41 (100.0%) | 0 (0.0%) |
Employment Characteristics in Marble Falls
Employment by Class of Employer in Marble Falls
Among the 3,510 employed individuals in Marble Falls, private company employees (1,775 | 50.6%), not-for-profit organizations (827 | 23.6%), and self-employed (incorporated) (322 | 9.2%) make up the most common classes of employment.
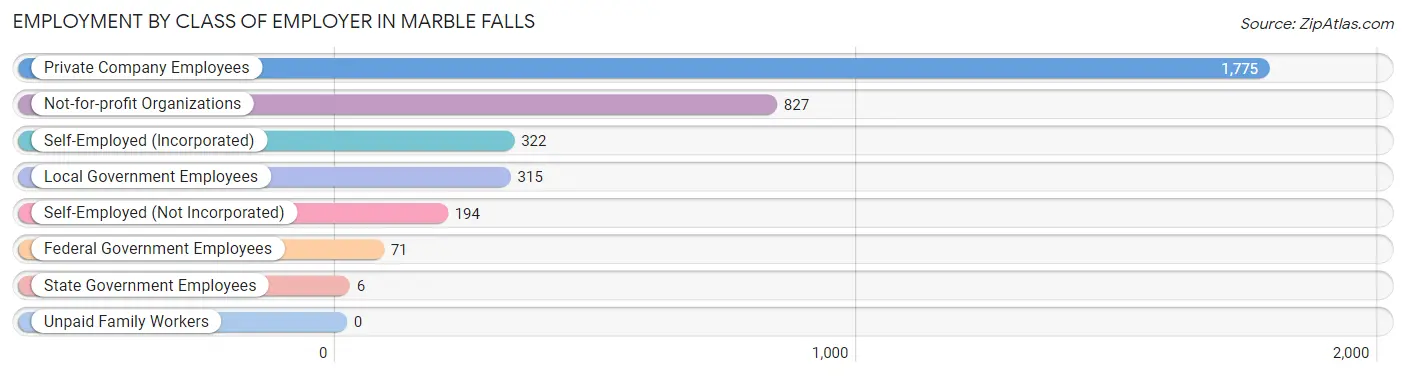
| Employer Class | # Employees | % Employees |
| Private Company Employees | 1,775 | 50.6% |
| Self-Employed (Incorporated) | 322 | 9.2% |
| Self-Employed (Not Incorporated) | 194 | 5.5% |
| Not-for-profit Organizations | 827 | 23.6% |
| Local Government Employees | 315 | 9.0% |
| State Government Employees | 6 | 0.2% |
| Federal Government Employees | 71 | 2.0% |
| Unpaid Family Workers | 0 | 0.0% |
| Total | 3,510 | 100.0% |
Employment Status by Age in Marble Falls
According to the labor force statistics for Marble Falls, out of the total population over 16 years of age (5,723), 64.7% or 3,703 individuals are in the labor force, with 4.2% or 156 of them unemployed. The age group with the highest labor force participation rate is 20 to 24 years, with 100.0% or 685 individuals in the labor force. Within the labor force, the 25 to 29 years age range has the highest percentage of unemployed individuals, with 13.3% or 38 of them being unemployed.
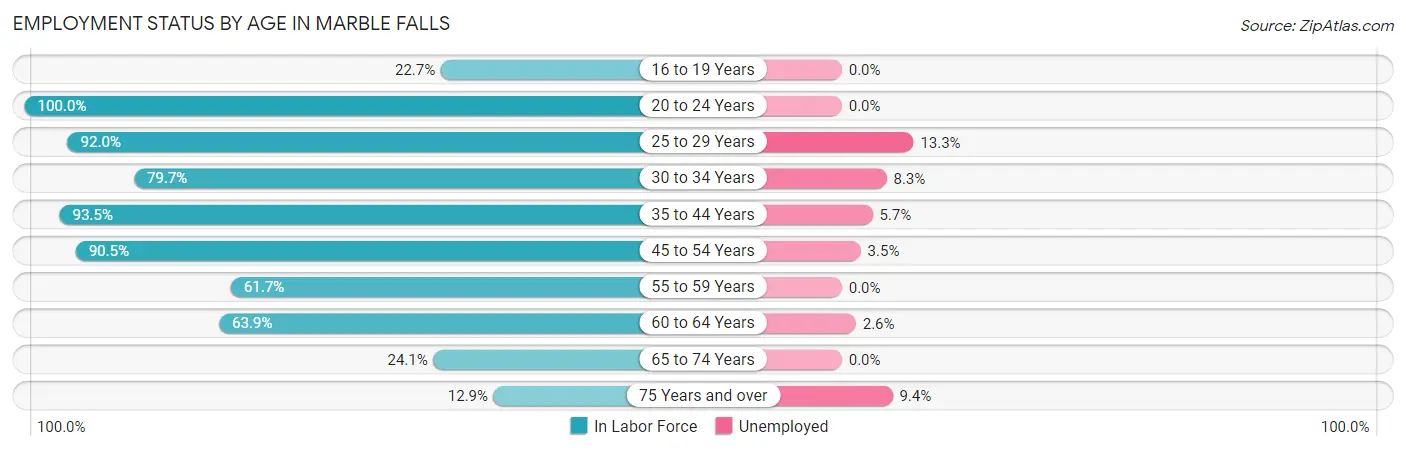
| Age Bracket | In Labor Force | Unemployed |
| 16 to 19 Years | 78 (22.7%) | 0 (0.0%) |
| 20 to 24 Years | 685 (100.0%) | 0 (0.0%) |
| 25 to 29 Years | 286 (92.0%) | 38 (13.3%) |
| 30 to 34 Years | 385 (79.7%) | 32 (8.3%) |
| 35 to 44 Years | 931 (93.5%) | 53 (5.7%) |
| 45 to 54 Years | 400 (90.5%) | 14 (3.5%) |
| 55 to 59 Years | 276 (61.7%) | 0 (0.0%) |
| 60 to 64 Years | 421 (63.9%) | 11 (2.6%) |
| 65 to 74 Years | 147 (24.1%) | 0 (0.0%) |
| 75 Years and over | 96 (12.9%) | 9 (9.4%) |
| Total | 3,703 (64.7%) | 156 (4.2%) |
Employment Status by Educational Attainment in Marble Falls
According to labor force statistics for Marble Falls, 80.9% of individuals (2,700) out of the total population between 25 and 64 years of age (3,338) are in the labor force, with 5.5% or 148 of them being unemployed. The group with the highest labor force participation rate are those with the educational attainment of college / associate degree, with 92.4% or 820 individuals in the labor force. Within the labor force, individuals with high school diploma education have the highest percentage of unemployment, with 13.4% or 85 of them being unemployed.
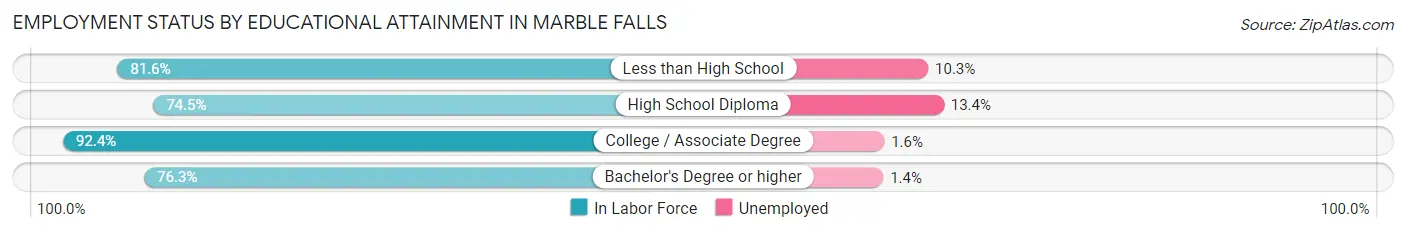
| Educational Attainment | In Labor Force | Unemployed |
| Less than High School | 368 (81.6%) | 46 (10.3%) |
| High School Diploma | 633 (74.5%) | 114 (13.4%) |
| College / Associate Degree | 820 (92.4%) | 14 (1.6%) |
| Bachelor's Degree or higher | 877 (76.3%) | 16 (1.4%) |
| Total | 2,700 (80.9%) | 184 (5.5%) |
Employment Occupations by Sex in Marble Falls
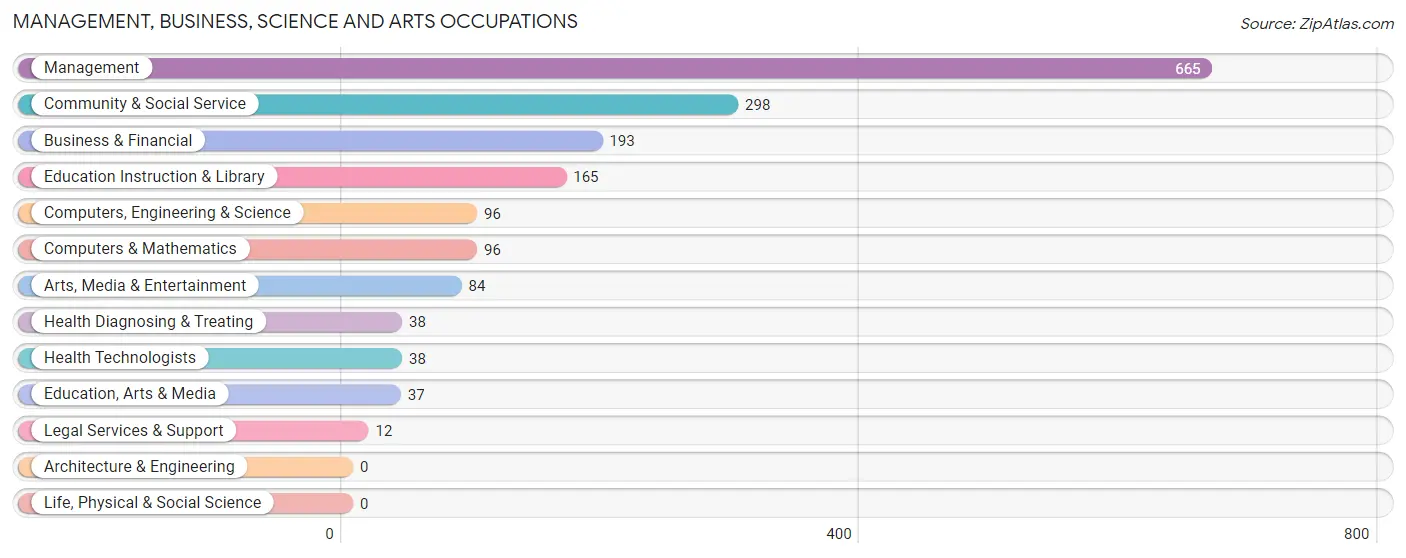
Management, Business, Science and Arts Occupations
The most common Management, Business, Science and Arts occupations in Marble Falls are Management (665 | 18.7%), Community & Social Service (298 | 8.4%), Business & Financial (193 | 5.4%), Education Instruction & Library (165 | 4.6%), and Computers, Engineering & Science (96 | 2.7%).
Management, Business, Science and Arts Occupations by Sex
Within the Management, Business, Science and Arts occupations in Marble Falls, the most male-oriented occupations are Computers, Engineering & Science (93.8%), Computers & Mathematics (93.8%), and Arts, Media & Entertainment (69.1%), while the most female-oriented occupations are Education, Arts & Media (100.0%), Legal Services & Support (100.0%), and Health Diagnosing & Treating (100.0%).
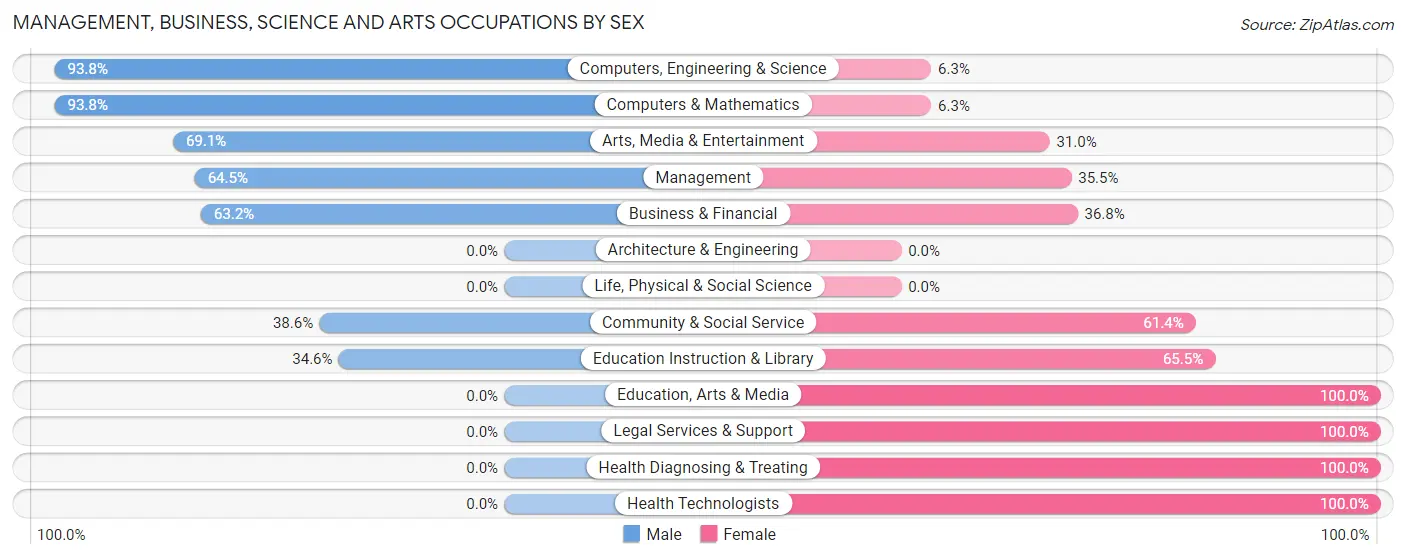
| Occupation | Male | Female |
| Management | 429 (64.5%) | 236 (35.5%) |
| Business & Financial | 122 (63.2%) | 71 (36.8%) |
| Computers, Engineering & Science | 90 (93.8%) | 6 (6.2%) |
| Computers & Mathematics | 90 (93.8%) | 6 (6.2%) |
| Architecture & Engineering | 0 (0.0%) | 0 (0.0%) |
| Life, Physical & Social Science | 0 (0.0%) | 0 (0.0%) |
| Community & Social Service | 115 (38.6%) | 183 (61.4%) |
| Education, Arts & Media | 0 (0.0%) | 37 (100.0%) |
| Legal Services & Support | 0 (0.0%) | 12 (100.0%) |
| Education Instruction & Library | 57 (34.5%) | 108 (65.4%) |
| Arts, Media & Entertainment | 58 (69.1%) | 26 (30.9%) |
| Health Diagnosing & Treating | 0 (0.0%) | 38 (100.0%) |
| Health Technologists | 0 (0.0%) | 38 (100.0%) |
| Total (Category) | 756 (58.6%) | 534 (41.4%) |
| Total (Overall) | 2,076 (58.5%) | 1,472 (41.5%) |
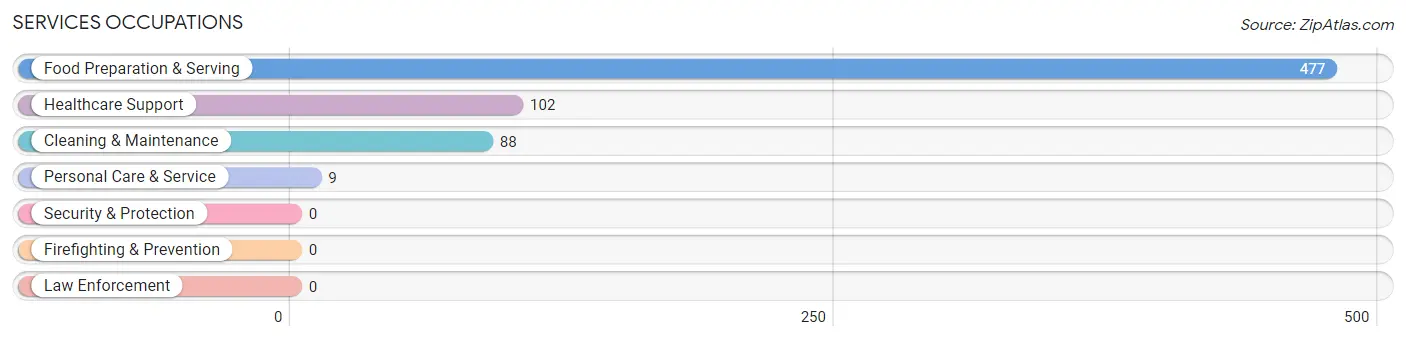
Services Occupations
The most common Services occupations in Marble Falls are Food Preparation & Serving (477 | 13.4%), Healthcare Support (102 | 2.9%), Cleaning & Maintenance (88 | 2.5%), and Personal Care & Service (9 | 0.3%).
Services Occupations by Sex
Within the Services occupations in Marble Falls, the most male-oriented occupations are Cleaning & Maintenance (65.9%), and Food Preparation & Serving (33.5%), while the most female-oriented occupations are Healthcare Support (100.0%), Personal Care & Service (100.0%), and Food Preparation & Serving (66.5%).
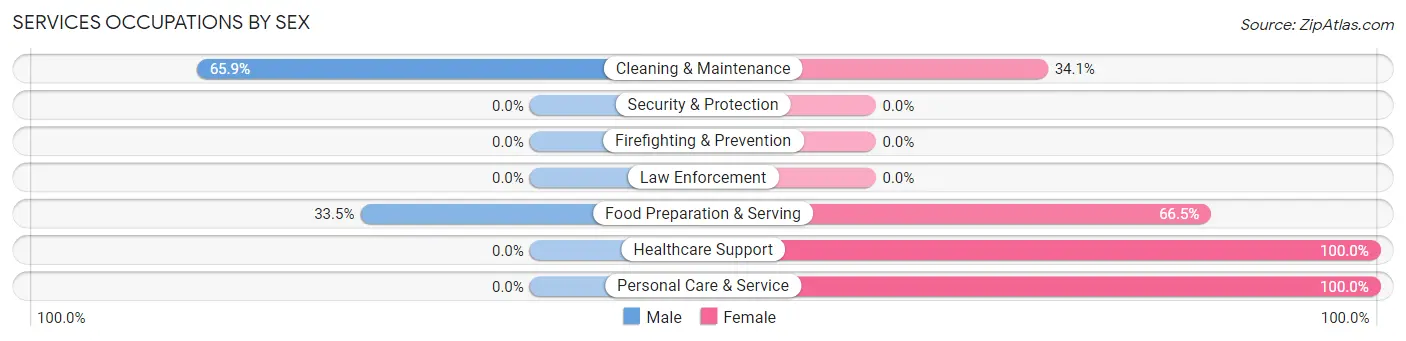
| Occupation | Male | Female |
| Healthcare Support | 0 (0.0%) | 102 (100.0%) |
| Security & Protection | 0 (0.0%) | 0 (0.0%) |
| Firefighting & Prevention | 0 (0.0%) | 0 (0.0%) |
| Law Enforcement | 0 (0.0%) | 0 (0.0%) |
| Food Preparation & Serving | 160 (33.5%) | 317 (66.5%) |
| Cleaning & Maintenance | 58 (65.9%) | 30 (34.1%) |
| Personal Care & Service | 0 (0.0%) | 9 (100.0%) |
| Total (Category) | 218 (32.3%) | 458 (67.7%) |
| Total (Overall) | 2,076 (58.5%) | 1,472 (41.5%) |
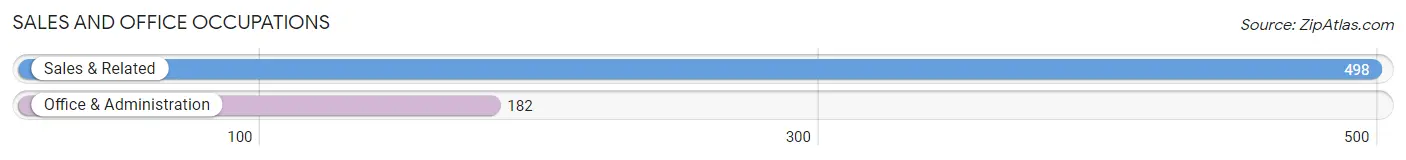
Sales and Office Occupations
The most common Sales and Office occupations in Marble Falls are Sales & Related (498 | 14.0%), and Office & Administration (182 | 5.1%).
Sales and Office Occupations by Sex
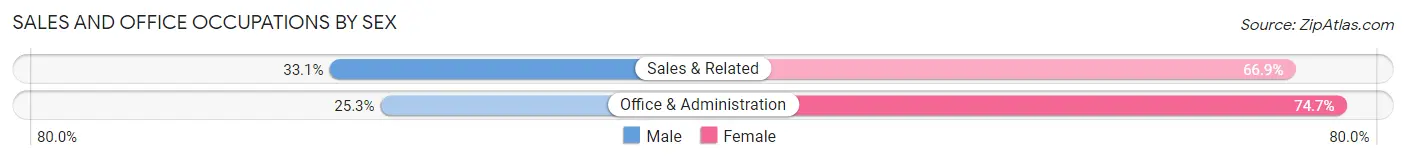
| Occupation | Male | Female |
| Sales & Related | 165 (33.1%) | 333 (66.9%) |
| Office & Administration | 46 (25.3%) | 136 (74.7%) |
| Total (Category) | 211 (31.0%) | 469 (69.0%) |
| Total (Overall) | 2,076 (58.5%) | 1,472 (41.5%) |
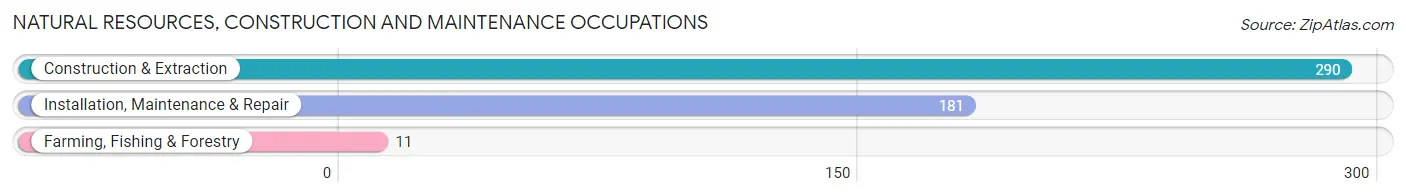
Natural Resources, Construction and Maintenance Occupations
The most common Natural Resources, Construction and Maintenance occupations in Marble Falls are Construction & Extraction (290 | 8.2%), Installation, Maintenance & Repair (181 | 5.1%), and Farming, Fishing & Forestry (11 | 0.3%).
Natural Resources, Construction and Maintenance Occupations by Sex
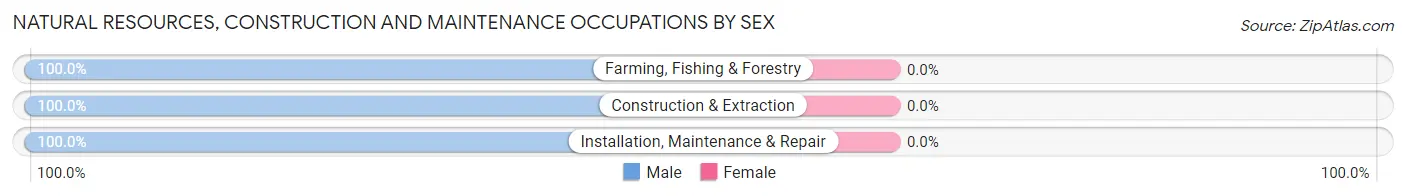
| Occupation | Male | Female |
| Farming, Fishing & Forestry | 11 (100.0%) | 0 (0.0%) |
| Construction & Extraction | 290 (100.0%) | 0 (0.0%) |
| Installation, Maintenance & Repair | 181 (100.0%) | 0 (0.0%) |
| Total (Category) | 482 (100.0%) | 0 (0.0%) |
| Total (Overall) | 2,076 (58.5%) | 1,472 (41.5%) |
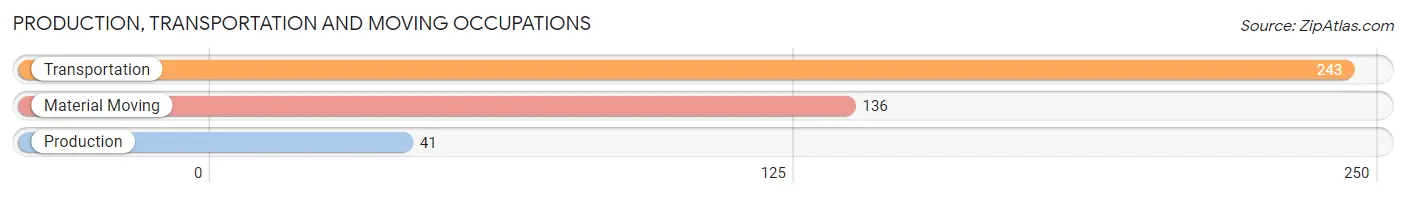
Production, Transportation and Moving Occupations
The most common Production, Transportation and Moving occupations in Marble Falls are Transportation (243 | 6.9%), Material Moving (136 | 3.8%), and Production (41 | 1.2%).
Production, Transportation and Moving Occupations by Sex
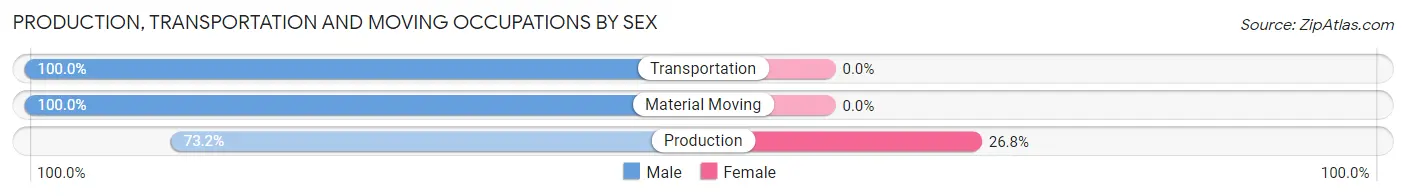
| Occupation | Male | Female |
| Production | 30 (73.2%) | 11 (26.8%) |
| Transportation | 243 (100.0%) | 0 (0.0%) |
| Material Moving | 136 (100.0%) | 0 (0.0%) |
| Total (Category) | 409 (97.4%) | 11 (2.6%) |
| Total (Overall) | 2,076 (58.5%) | 1,472 (41.5%) |
Employment Industries by Sex in Marble Falls
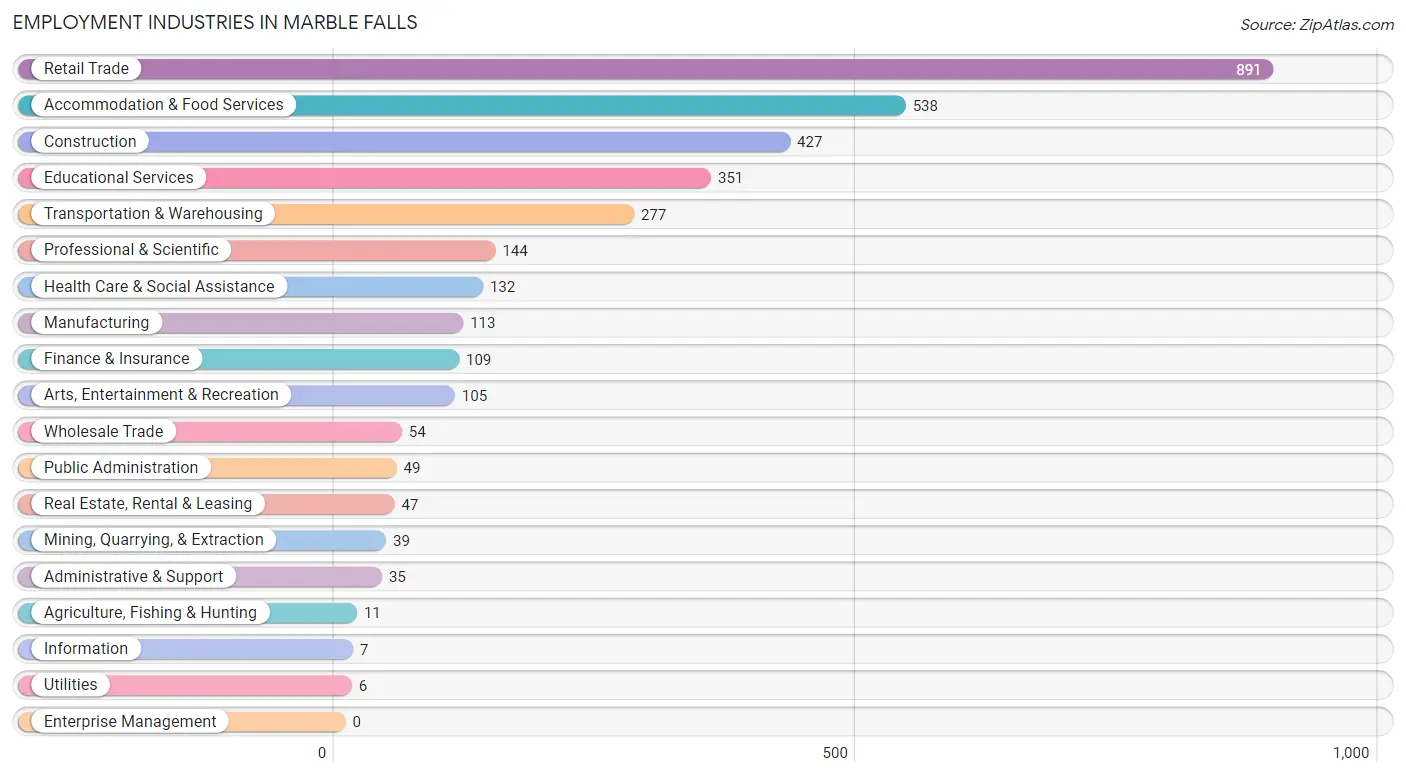
Employment Industries in Marble Falls
The major employment industries in Marble Falls include Retail Trade (891 | 25.1%), Accommodation & Food Services (538 | 15.2%), Construction (427 | 12.0%), Educational Services (351 | 9.9%), and Transportation & Warehousing (277 | 7.8%).
Employment Industries by Sex in Marble Falls
The Marble Falls industries that see more men than women are Agriculture, Fishing & Hunting (100.0%), Mining, Quarrying, & Extraction (100.0%), and Administrative & Support (100.0%), whereas the industries that tend to have a higher number of women are Utilities (100.0%), Information (100.0%), and Health Care & Social Assistance (100.0%).
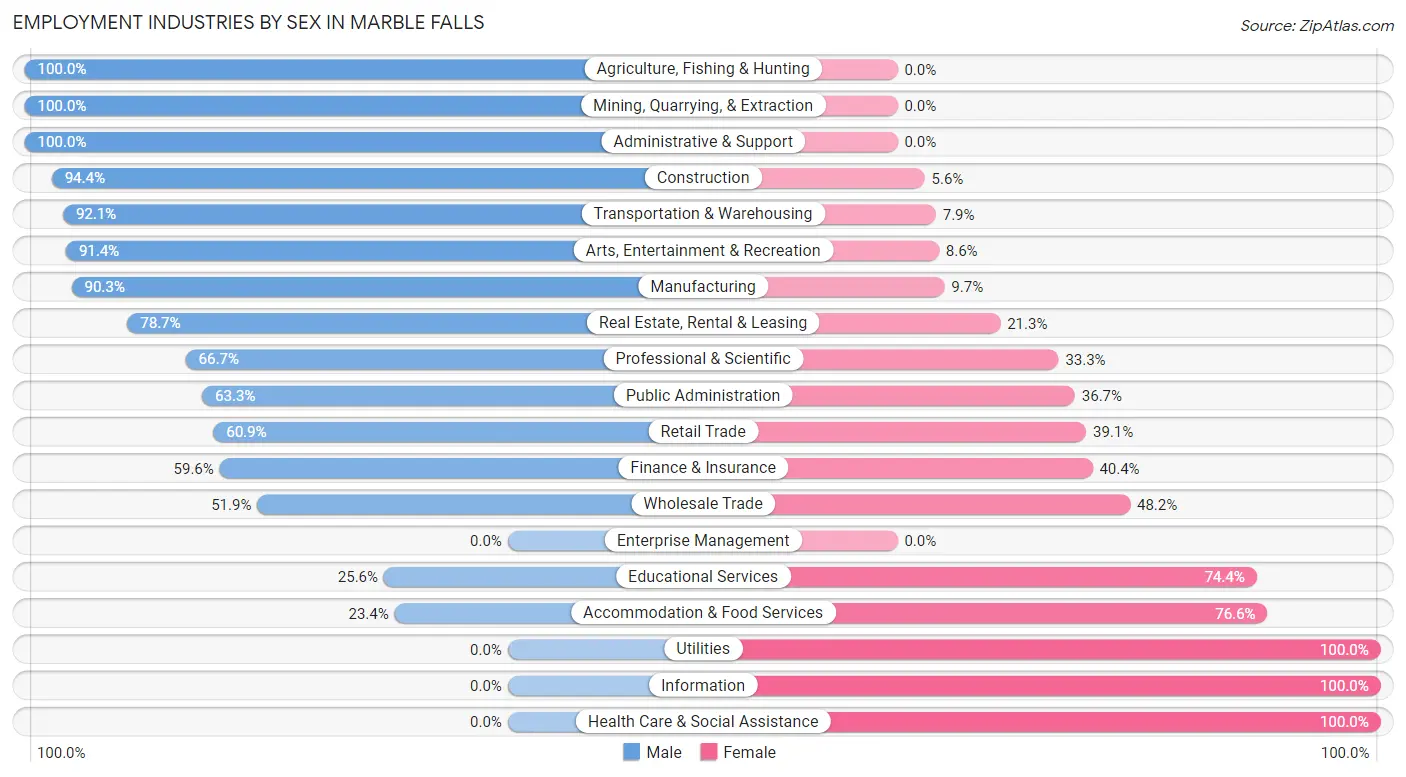
| Industry | Male | Female |
| Agriculture, Fishing & Hunting | 11 (100.0%) | 0 (0.0%) |
| Mining, Quarrying, & Extraction | 39 (100.0%) | 0 (0.0%) |
| Construction | 403 (94.4%) | 24 (5.6%) |
| Manufacturing | 102 (90.3%) | 11 (9.7%) |
| Wholesale Trade | 28 (51.8%) | 26 (48.1%) |
| Retail Trade | 543 (60.9%) | 348 (39.1%) |
| Transportation & Warehousing | 255 (92.1%) | 22 (7.9%) |
| Utilities | 0 (0.0%) | 6 (100.0%) |
| Information | 0 (0.0%) | 7 (100.0%) |
| Finance & Insurance | 65 (59.6%) | 44 (40.4%) |
| Real Estate, Rental & Leasing | 37 (78.7%) | 10 (21.3%) |
| Professional & Scientific | 96 (66.7%) | 48 (33.3%) |
| Enterprise Management | 0 (0.0%) | 0 (0.0%) |
| Administrative & Support | 35 (100.0%) | 0 (0.0%) |
| Educational Services | 90 (25.6%) | 261 (74.4%) |
| Health Care & Social Assistance | 0 (0.0%) | 132 (100.0%) |
| Arts, Entertainment & Recreation | 96 (91.4%) | 9 (8.6%) |
| Accommodation & Food Services | 126 (23.4%) | 412 (76.6%) |
| Public Administration | 31 (63.3%) | 18 (36.7%) |
| Total | 2,076 (58.5%) | 1,472 (41.5%) |
Education in Marble Falls
School Enrollment in Marble Falls
The most common levels of schooling among the 1,890 students in Marble Falls are elementary school (491 | 26.0%), middle school (435 | 23.0%), and high school (392 | 20.7%).
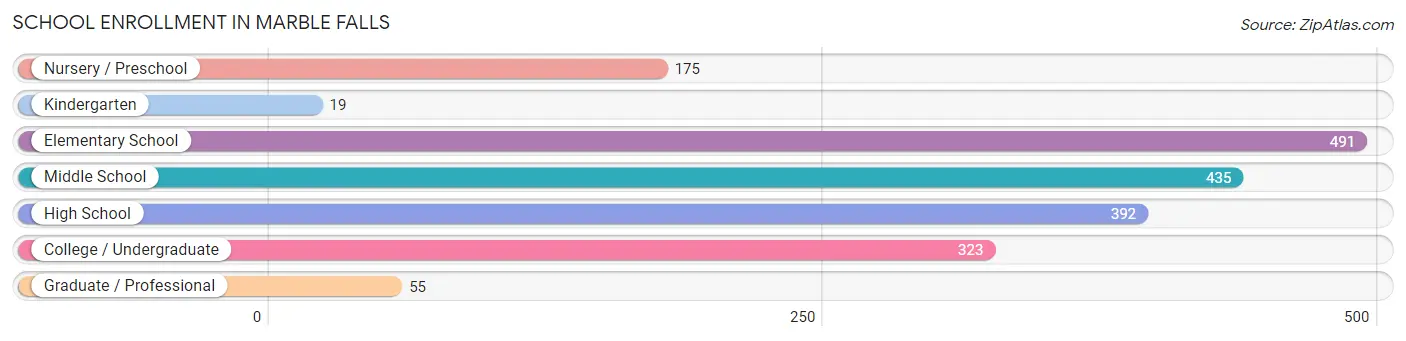
| School Level | # Students | % Students |
| Nursery / Preschool | 175 | 9.3% |
| Kindergarten | 19 | 1.0% |
| Elementary School | 491 | 26.0% |
| Middle School | 435 | 23.0% |
| High School | 392 | 20.7% |
| College / Undergraduate | 323 | 17.1% |
| Graduate / Professional | 55 | 2.9% |
| Total | 1,890 | 100.0% |
School Enrollment by Age by Funding Source in Marble Falls
Out of a total of 1,890 students who are enrolled in schools in Marble Falls, 204 (10.8%) attend a private institution, while the remaining 1,686 (89.2%) are enrolled in public schools. The age group of 18 to 19 year olds has the highest likelihood of being enrolled in private schools, with 9 (50.0% in the age bracket) enrolled. Conversely, the age group of 15 to 17 year olds has the lowest likelihood of being enrolled in a private school, with 383 (100.0% in the age bracket) attending a public institution.
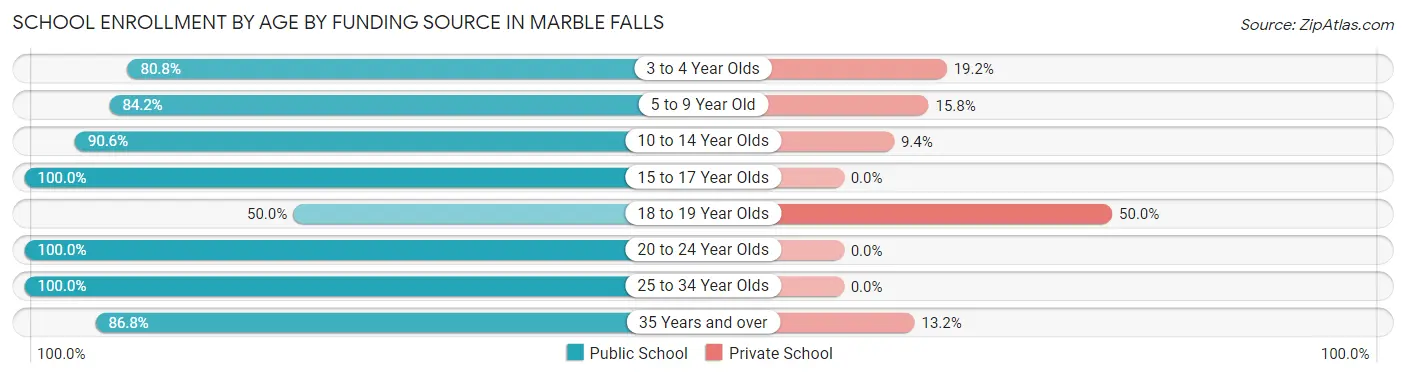
| Age Bracket | Public School | Private School |
| 3 to 4 Year Olds | 139 (80.8%) | 33 (19.2%) |
| 5 to 9 Year Old | 394 (84.2%) | 74 (15.8%) |
| 10 to 14 Year Olds | 416 (90.6%) | 43 (9.4%) |
| 15 to 17 Year Olds | 383 (100.0%) | 0 (0.0%) |
| 18 to 19 Year Olds | 9 (50.0%) | 9 (50.0%) |
| 20 to 24 Year Olds | 32 (100.0%) | 0 (0.0%) |
| 25 to 34 Year Olds | 17 (100.0%) | 0 (0.0%) |
| 35 Years and over | 296 (86.8%) | 45 (13.2%) |
| Total | 1,686 (89.2%) | 204 (10.8%) |
Educational Attainment by Field of Study in Marble Falls
Business (591 | 34.3%), education (404 | 23.4%), engineering (113 | 6.6%), social sciences (104 | 6.0%), and computers & mathematics (89 | 5.2%) are the most common fields of study among 1,723 individuals in Marble Falls who have obtained a bachelor's degree or higher.
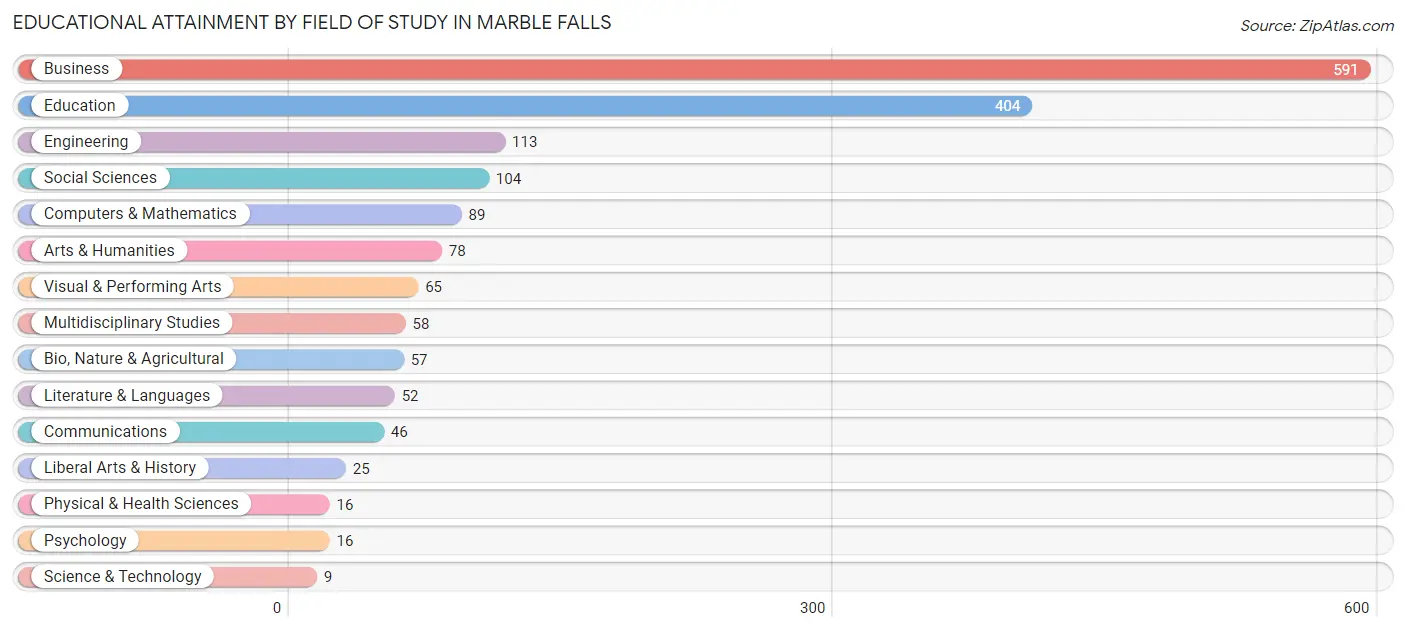
| Field of Study | # Graduates | % Graduates |
| Computers & Mathematics | 89 | 5.2% |
| Bio, Nature & Agricultural | 57 | 3.3% |
| Physical & Health Sciences | 16 | 0.9% |
| Psychology | 16 | 0.9% |
| Social Sciences | 104 | 6.0% |
| Engineering | 113 | 6.6% |
| Multidisciplinary Studies | 58 | 3.4% |
| Science & Technology | 9 | 0.5% |
| Business | 591 | 34.3% |
| Education | 404 | 23.4% |
| Literature & Languages | 52 | 3.0% |
| Liberal Arts & History | 25 | 1.5% |
| Visual & Performing Arts | 65 | 3.8% |
| Communications | 46 | 2.7% |
| Arts & Humanities | 78 | 4.5% |
| Total | 1,723 | 100.0% |
Transportation & Commute in Marble Falls
Vehicle Availability by Sex in Marble Falls
The most prevalent vehicle ownership categories in Marble Falls are males with 2 vehicles (853, accounting for 41.7%) and females with 2 vehicles (742, making up 58.6%).
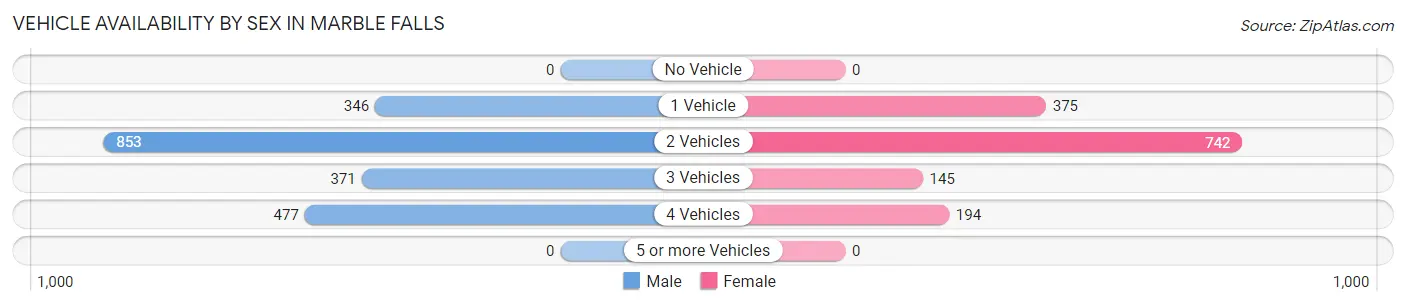
| Vehicles Available | Male | Female |
| No Vehicle | 0 (0.0%) | 0 (0.0%) |
| 1 Vehicle | 346 (16.9%) | 375 (25.8%) |
| 2 Vehicles | 853 (41.7%) | 742 (51.0%) |
| 3 Vehicles | 371 (18.1%) | 145 (10.0%) |
| 4 Vehicles | 477 (23.3%) | 194 (13.3%) |
| 5 or more Vehicles | 0 (0.0%) | 0 (0.0%) |
| Total | 2,047 (100.0%) | 1,456 (100.0%) |
Commute Time in Marble Falls
The most frequently occuring commute durations in Marble Falls are 5 to 9 minutes (1,248 commuters, 38.1%), 10 to 14 minutes (465 commuters, 14.2%), and 15 to 19 minutes (446 commuters, 13.6%).
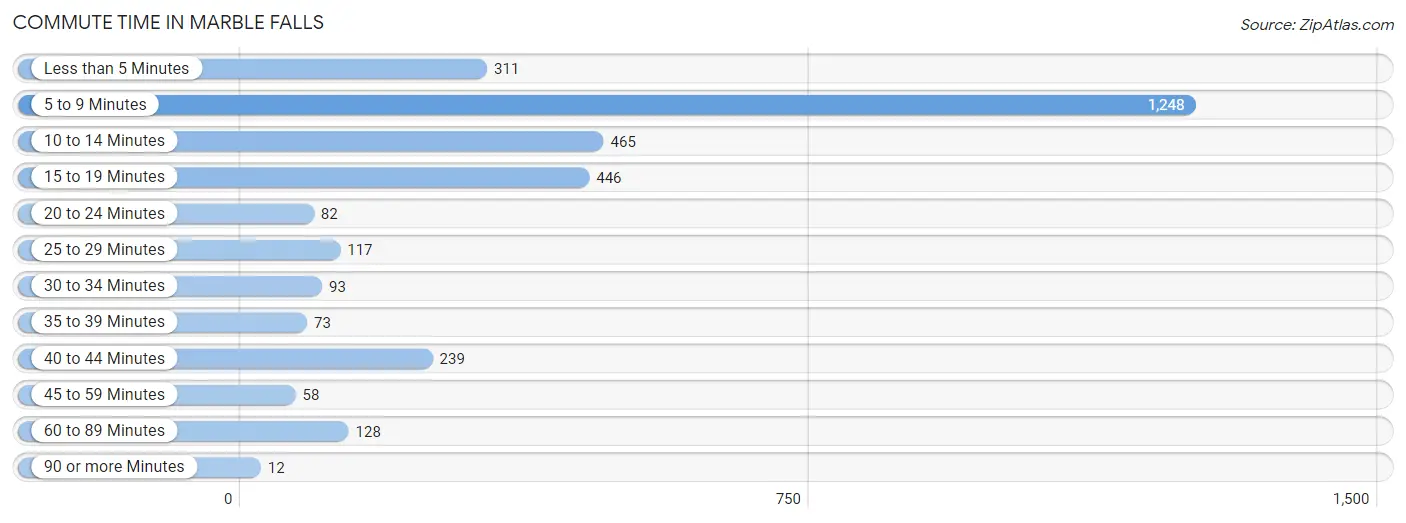
| Commute Time | # Commuters | % Commuters |
| Less than 5 Minutes | 311 | 9.5% |
| 5 to 9 Minutes | 1,248 | 38.1% |
| 10 to 14 Minutes | 465 | 14.2% |
| 15 to 19 Minutes | 446 | 13.6% |
| 20 to 24 Minutes | 82 | 2.5% |
| 25 to 29 Minutes | 117 | 3.6% |
| 30 to 34 Minutes | 93 | 2.8% |
| 35 to 39 Minutes | 73 | 2.2% |
| 40 to 44 Minutes | 239 | 7.3% |
| 45 to 59 Minutes | 58 | 1.8% |
| 60 to 89 Minutes | 128 | 3.9% |
| 90 or more Minutes | 12 | 0.4% |
Commute Time by Sex in Marble Falls
The most common commute times in Marble Falls are 5 to 9 minutes (742 commuters, 39.5%) for males and 5 to 9 minutes (506 commuters, 36.3%) for females.
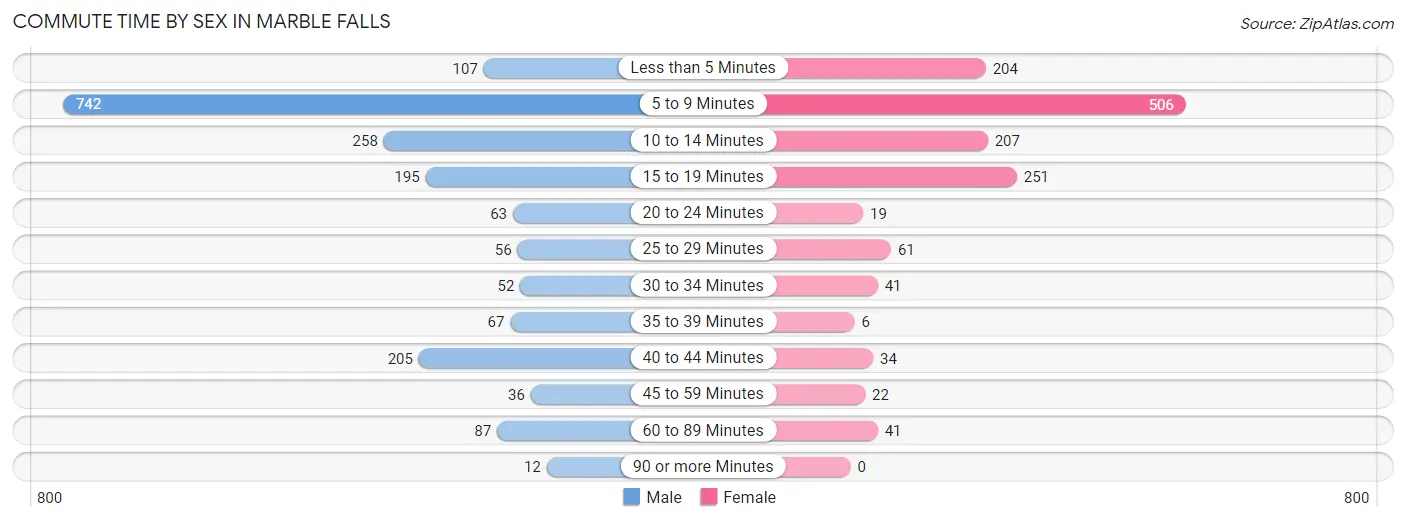
| Commute Time | Male | Female |
| Less than 5 Minutes | 107 (5.7%) | 204 (14.7%) |
| 5 to 9 Minutes | 742 (39.5%) | 506 (36.3%) |
| 10 to 14 Minutes | 258 (13.7%) | 207 (14.9%) |
| 15 to 19 Minutes | 195 (10.4%) | 251 (18.0%) |
| 20 to 24 Minutes | 63 (3.4%) | 19 (1.4%) |
| 25 to 29 Minutes | 56 (3.0%) | 61 (4.4%) |
| 30 to 34 Minutes | 52 (2.8%) | 41 (2.9%) |
| 35 to 39 Minutes | 67 (3.6%) | 6 (0.4%) |
| 40 to 44 Minutes | 205 (10.9%) | 34 (2.4%) |
| 45 to 59 Minutes | 36 (1.9%) | 22 (1.6%) |
| 60 to 89 Minutes | 87 (4.6%) | 41 (2.9%) |
| 90 or more Minutes | 12 (0.6%) | 0 (0.0%) |
Time of Departure to Work by Sex in Marble Falls
The most frequent times of departure to work in Marble Falls are 7:00 AM to 7:29 AM (440, 23.4%) for males and 7:00 AM to 7:29 AM (271, 19.5%) for females.
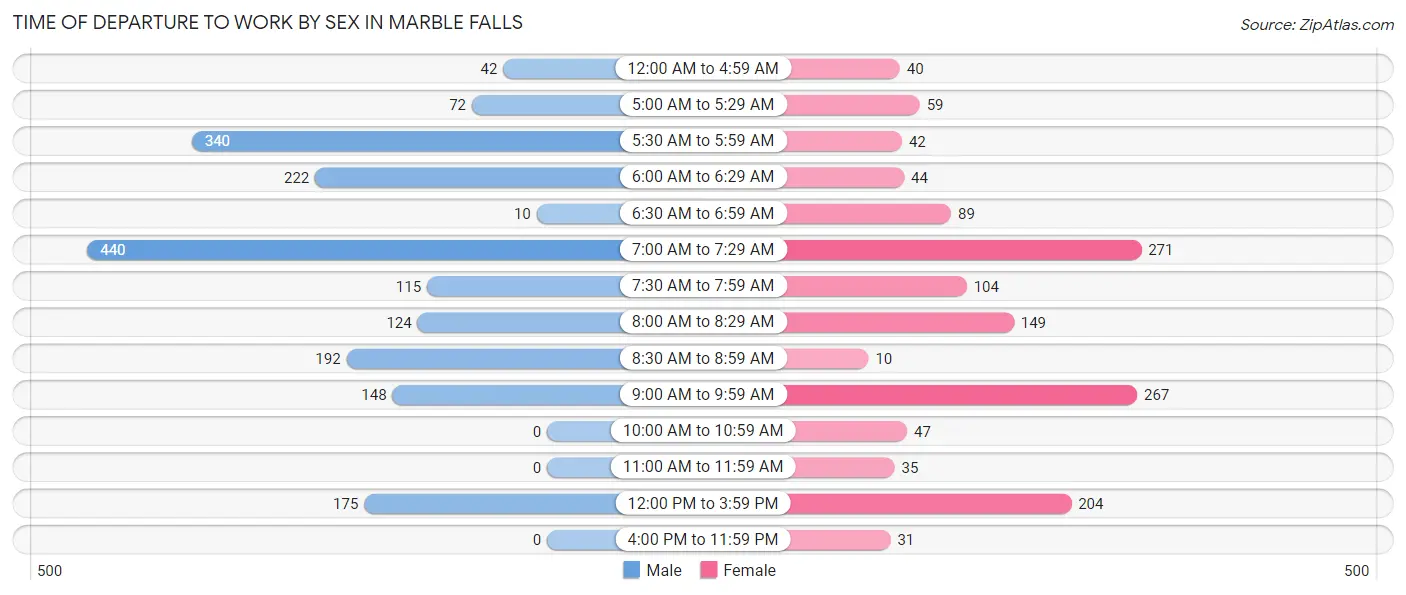
| Time of Departure | Male | Female |
| 12:00 AM to 4:59 AM | 42 (2.2%) | 40 (2.9%) |
| 5:00 AM to 5:29 AM | 72 (3.8%) | 59 (4.2%) |
| 5:30 AM to 5:59 AM | 340 (18.1%) | 42 (3.0%) |
| 6:00 AM to 6:29 AM | 222 (11.8%) | 44 (3.2%) |
| 6:30 AM to 6:59 AM | 10 (0.5%) | 89 (6.4%) |
| 7:00 AM to 7:29 AM | 440 (23.4%) | 271 (19.5%) |
| 7:30 AM to 7:59 AM | 115 (6.1%) | 104 (7.5%) |
| 8:00 AM to 8:29 AM | 124 (6.6%) | 149 (10.7%) |
| 8:30 AM to 8:59 AM | 192 (10.2%) | 10 (0.7%) |
| 9:00 AM to 9:59 AM | 148 (7.9%) | 267 (19.2%) |
| 10:00 AM to 10:59 AM | 0 (0.0%) | 47 (3.4%) |
| 11:00 AM to 11:59 AM | 0 (0.0%) | 35 (2.5%) |
| 12:00 PM to 3:59 PM | 175 (9.3%) | 204 (14.7%) |
| 4:00 PM to 11:59 PM | 0 (0.0%) | 31 (2.2%) |
| Total | 1,880 (100.0%) | 1,392 (100.0%) |
Housing Occupancy in Marble Falls
Occupancy by Ownership in Marble Falls
Of the total 2,791 dwellings in Marble Falls, owner-occupied units account for 1,322 (47.4%), while renter-occupied units make up 1,469 (52.6%).
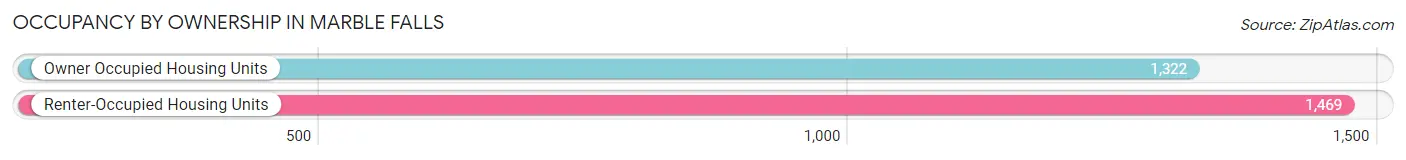
| Occupancy | # Housing Units | % Housing Units |
| Owner Occupied Housing Units | 1,322 | 47.4% |
| Renter-Occupied Housing Units | 1,469 | 52.6% |
| Total Occupied Housing Units | 2,791 | 100.0% |
Occupancy by Household Size in Marble Falls
| Household Size | # Housing Units | % Housing Units |
| 1-Person Household | 970 | 34.7% |
| 2-Person Household | 714 | 25.6% |
| 3-Person Household | 461 | 16.5% |
| 4+ Person Household | 646 | 23.2% |
| Total Housing Units | 2,791 | 100.0% |
Occupancy by Ownership by Household Size in Marble Falls
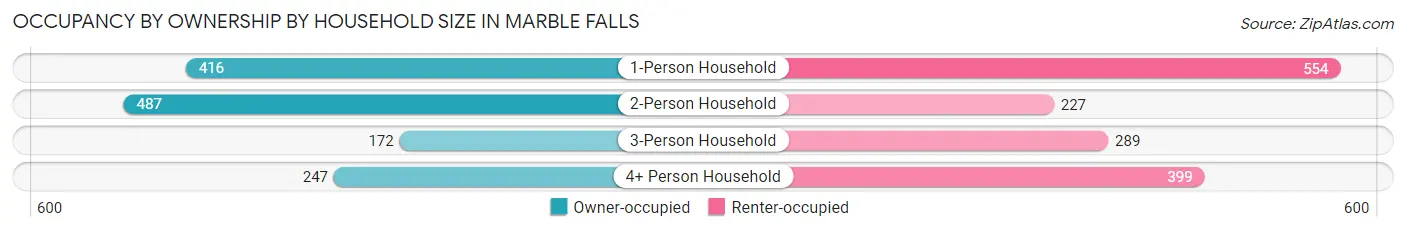
| Household Size | Owner-occupied | Renter-occupied |
| 1-Person Household | 416 (42.9%) | 554 (57.1%) |
| 2-Person Household | 487 (68.2%) | 227 (31.8%) |
| 3-Person Household | 172 (37.3%) | 289 (62.7%) |
| 4+ Person Household | 247 (38.2%) | 399 (61.8%) |
| Total Housing Units | 1,322 (47.4%) | 1,469 (52.6%) |
Occupancy by Educational Attainment in Marble Falls
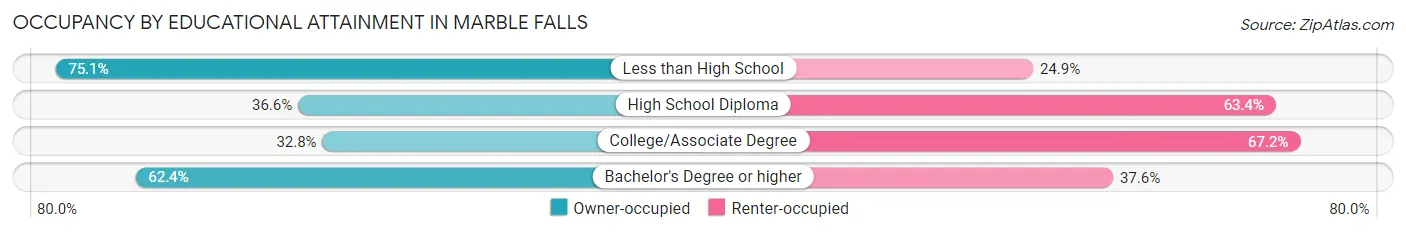
| Household Size | Owner-occupied | Renter-occupied |
| Less than High School | 145 (75.1%) | 48 (24.9%) |
| High School Diploma | 237 (36.6%) | 410 (63.4%) |
| College/Associate Degree | 307 (32.8%) | 630 (67.2%) |
| Bachelor's Degree or higher | 633 (62.4%) | 381 (37.6%) |
Occupancy by Age of Householder in Marble Falls
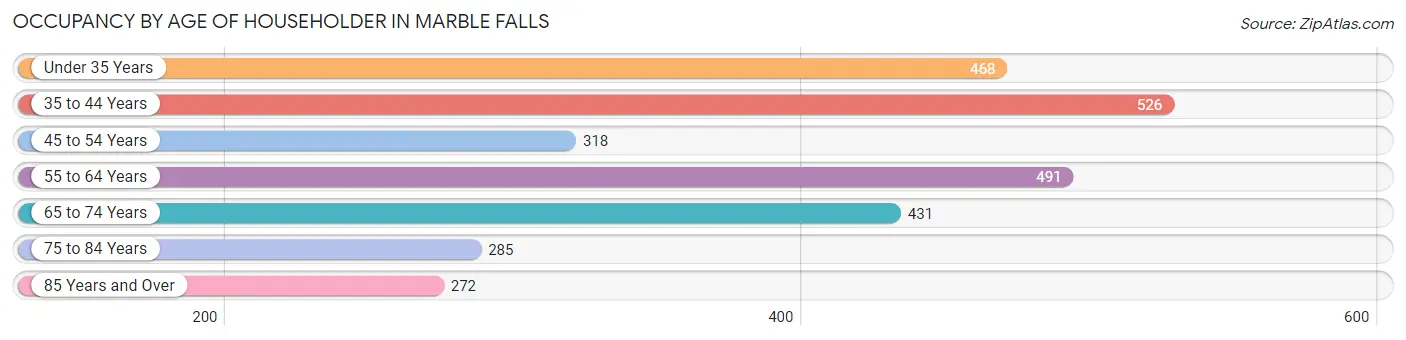
| Age Bracket | # Households | % Households |
| Under 35 Years | 468 | 16.8% |
| 35 to 44 Years | 526 | 18.9% |
| 45 to 54 Years | 318 | 11.4% |
| 55 to 64 Years | 491 | 17.6% |
| 65 to 74 Years | 431 | 15.4% |
| 75 to 84 Years | 285 | 10.2% |
| 85 Years and Over | 272 | 9.8% |
| Total | 2,791 | 100.0% |
Housing Finances in Marble Falls
Median Income by Occupancy in Marble Falls
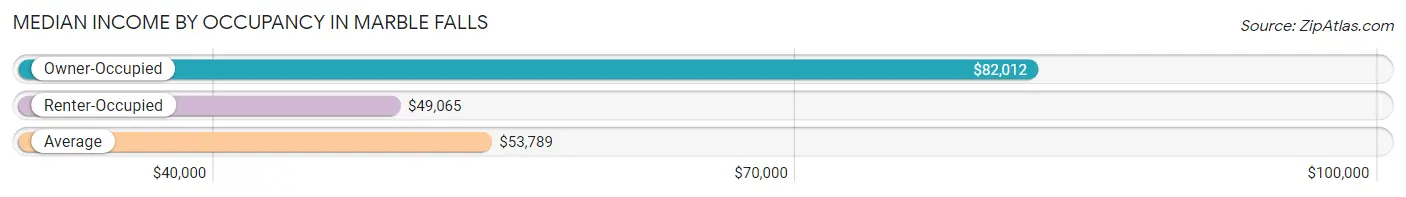
| Occupancy Type | # Households | Median Income |
| Owner-Occupied | 1,322 (47.4%) | $82,012 |
| Renter-Occupied | 1,469 (52.6%) | $49,065 |
| Average | 2,791 (100.0%) | $53,789 |
Occupancy by Householder Income Bracket in Marble Falls
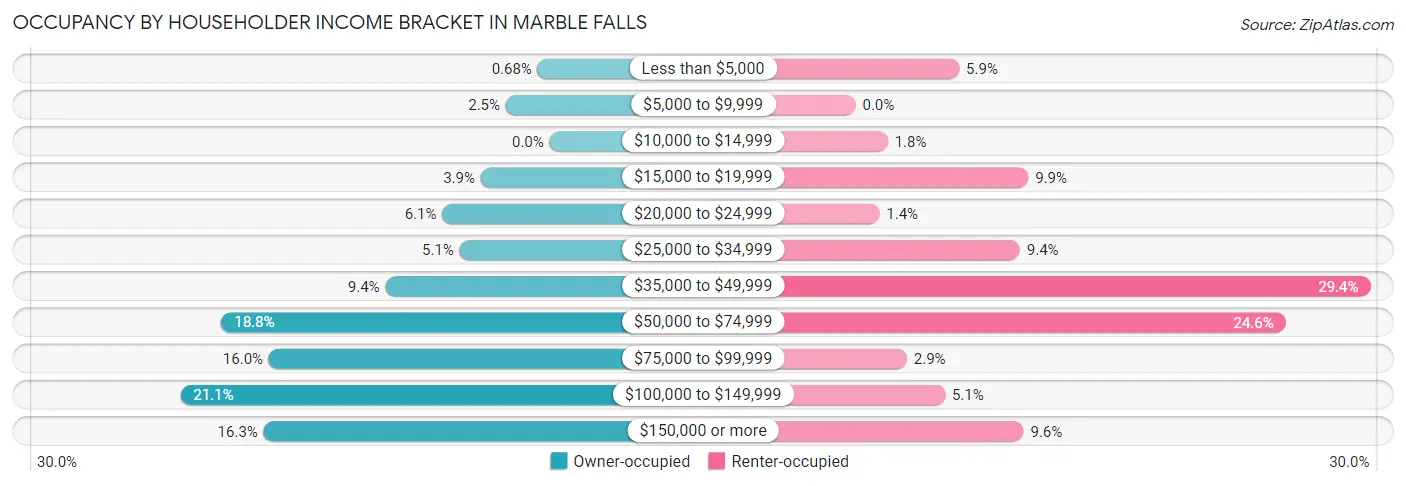
| Income Bracket | Owner-occupied | Renter-occupied |
| Less than $5,000 | 9 (0.7%) | 87 (5.9%) |
| $5,000 to $9,999 | 33 (2.5%) | 0 (0.0%) |
| $10,000 to $14,999 | 0 (0.0%) | 27 (1.8%) |
| $15,000 to $19,999 | 52 (3.9%) | 145 (9.9%) |
| $20,000 to $24,999 | 81 (6.1%) | 20 (1.4%) |
| $25,000 to $34,999 | 68 (5.1%) | 138 (9.4%) |
| $35,000 to $49,999 | 124 (9.4%) | 432 (29.4%) |
| $50,000 to $74,999 | 248 (18.8%) | 361 (24.6%) |
| $75,000 to $99,999 | 212 (16.0%) | 43 (2.9%) |
| $100,000 to $149,999 | 279 (21.1%) | 75 (5.1%) |
| $150,000 or more | 216 (16.3%) | 141 (9.6%) |
| Total | 1,322 (100.0%) | 1,469 (100.0%) |
Monthly Housing Cost Tiers in Marble Falls
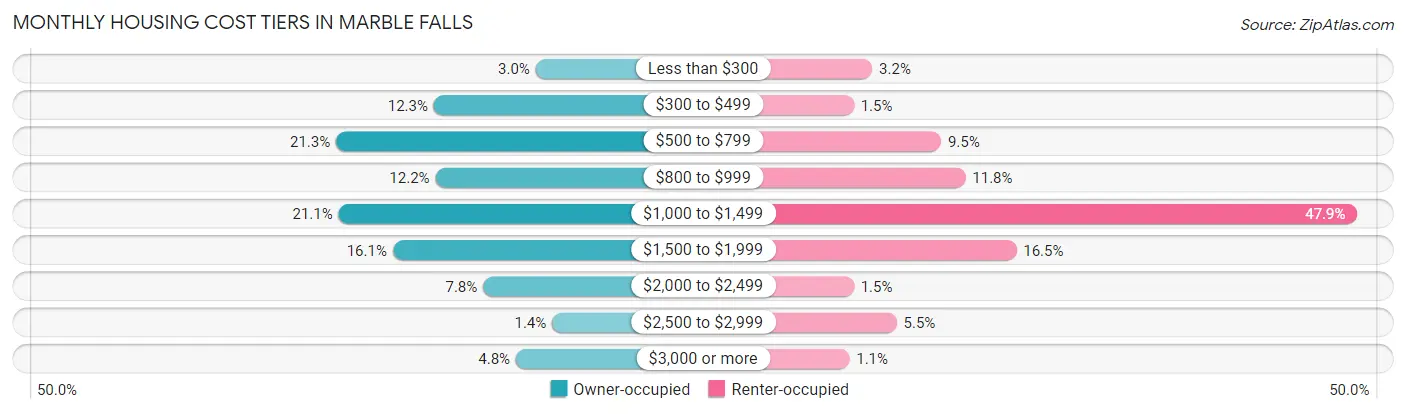
| Monthly Cost | Owner-occupied | Renter-occupied |
| Less than $300 | 39 (2.9%) | 47 (3.2%) |
| $300 to $499 | 163 (12.3%) | 22 (1.5%) |
| $500 to $799 | 282 (21.3%) | 140 (9.5%) |
| $800 to $999 | 161 (12.2%) | 173 (11.8%) |
| $1,000 to $1,499 | 279 (21.1%) | 703 (47.9%) |
| $1,500 to $1,999 | 213 (16.1%) | 242 (16.5%) |
| $2,000 to $2,499 | 103 (7.8%) | 22 (1.5%) |
| $2,500 to $2,999 | 19 (1.4%) | 80 (5.4%) |
| $3,000 or more | 63 (4.8%) | 16 (1.1%) |
| Total | 1,322 (100.0%) | 1,469 (100.0%) |
Physical Housing Characteristics in Marble Falls
Housing Structures in Marble Falls
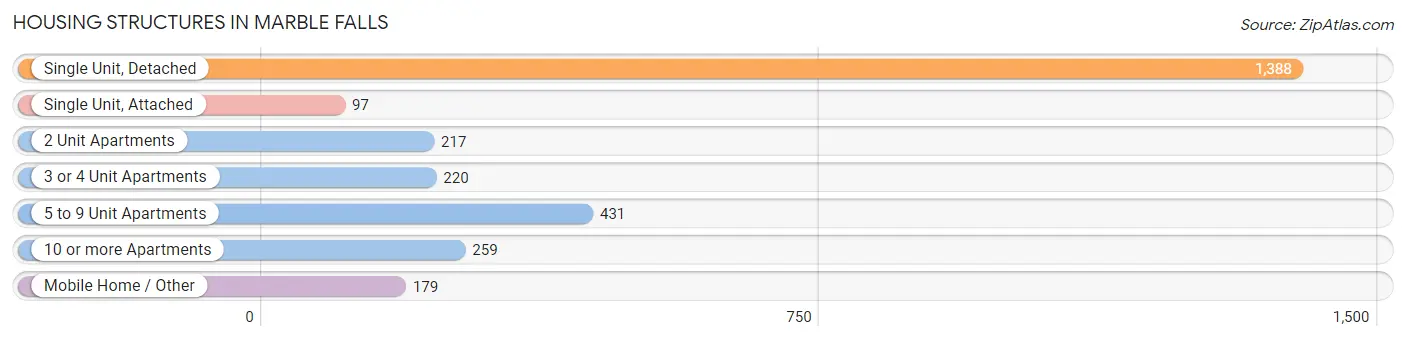
| Structure Type | # Housing Units | % Housing Units |
| Single Unit, Detached | 1,388 | 49.7% |
| Single Unit, Attached | 97 | 3.5% |
| 2 Unit Apartments | 217 | 7.8% |
| 3 or 4 Unit Apartments | 220 | 7.9% |
| 5 to 9 Unit Apartments | 431 | 15.4% |
| 10 or more Apartments | 259 | 9.3% |
| Mobile Home / Other | 179 | 6.4% |
| Total | 2,791 | 100.0% |
Housing Structures by Occupancy in Marble Falls
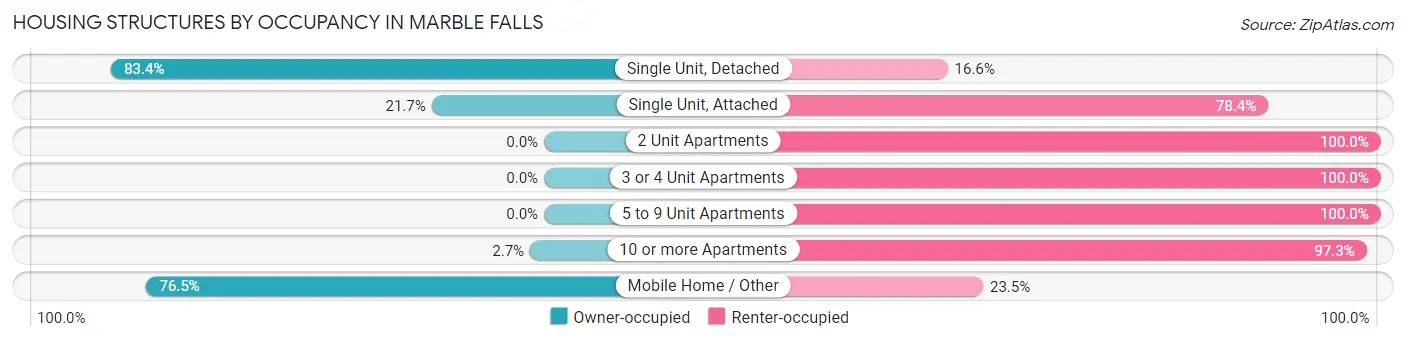
| Structure Type | Owner-occupied | Renter-occupied |
| Single Unit, Detached | 1,157 (83.4%) | 231 (16.6%) |
| Single Unit, Attached | 21 (21.6%) | 76 (78.3%) |
| 2 Unit Apartments | 0 (0.0%) | 217 (100.0%) |
| 3 or 4 Unit Apartments | 0 (0.0%) | 220 (100.0%) |
| 5 to 9 Unit Apartments | 0 (0.0%) | 431 (100.0%) |
| 10 or more Apartments | 7 (2.7%) | 252 (97.3%) |
| Mobile Home / Other | 137 (76.5%) | 42 (23.5%) |
| Total | 1,322 (47.4%) | 1,469 (52.6%) |
Housing Structures by Number of Rooms in Marble Falls
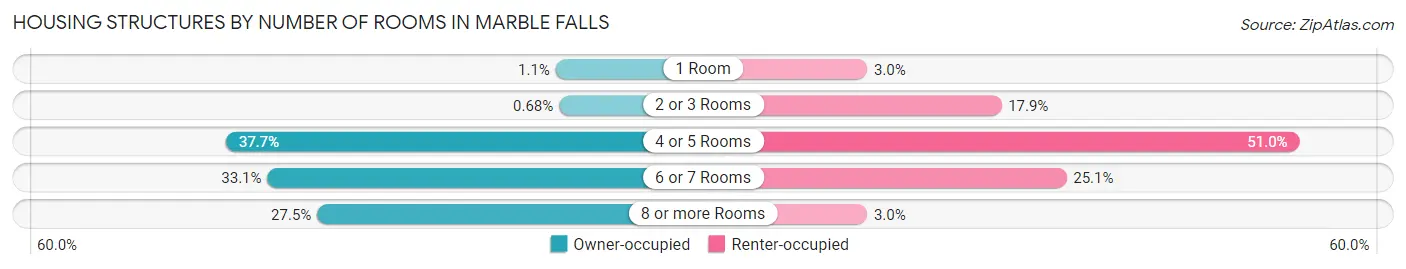
| Number of Rooms | Owner-occupied | Renter-occupied |
| 1 Room | 14 (1.1%) | 44 (3.0%) |
| 2 or 3 Rooms | 9 (0.7%) | 263 (17.9%) |
| 4 or 5 Rooms | 498 (37.7%) | 749 (51.0%) |
| 6 or 7 Rooms | 437 (33.1%) | 369 (25.1%) |
| 8 or more Rooms | 364 (27.5%) | 44 (3.0%) |
| Total | 1,322 (100.0%) | 1,469 (100.0%) |
Housing Structure by Heating Type in Marble Falls
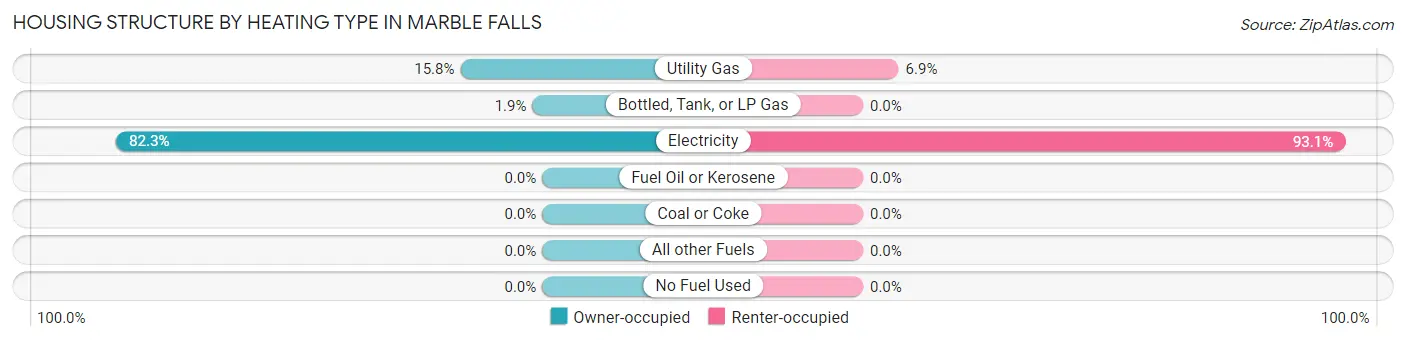
| Heating Type | Owner-occupied | Renter-occupied |
| Utility Gas | 209 (15.8%) | 101 (6.9%) |
| Bottled, Tank, or LP Gas | 25 (1.9%) | 0 (0.0%) |
| Electricity | 1,088 (82.3%) | 1,368 (93.1%) |
| Fuel Oil or Kerosene | 0 (0.0%) | 0 (0.0%) |
| Coal or Coke | 0 (0.0%) | 0 (0.0%) |
| All other Fuels | 0 (0.0%) | 0 (0.0%) |
| No Fuel Used | 0 (0.0%) | 0 (0.0%) |
| Total | 1,322 (100.0%) | 1,469 (100.0%) |
Household Vehicle Usage in Marble Falls
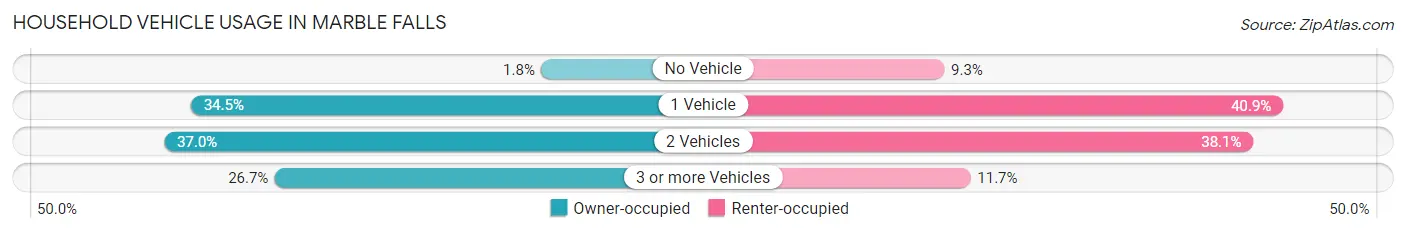
| Vehicles per Household | Owner-occupied | Renter-occupied |
| No Vehicle | 24 (1.8%) | 136 (9.3%) |
| 1 Vehicle | 456 (34.5%) | 601 (40.9%) |
| 2 Vehicles | 489 (37.0%) | 560 (38.1%) |
| 3 or more Vehicles | 353 (26.7%) | 172 (11.7%) |
| Total | 1,322 (100.0%) | 1,469 (100.0%) |
Real Estate & Mortgages in Marble Falls
Real Estate and Mortgage Overview in Marble Falls
| Characteristic | Without Mortgage | With Mortgage |
| Housing Units | 736 | 586 |
| Median Property Value | $256,700 | $280,300 |
| Median Household Income | $79,423 | $117 |
| Monthly Housing Costs | $674 | $63 |
| Real Estate Taxes | $3,859 | $0 |
Property Value by Mortgage Status in Marble Falls
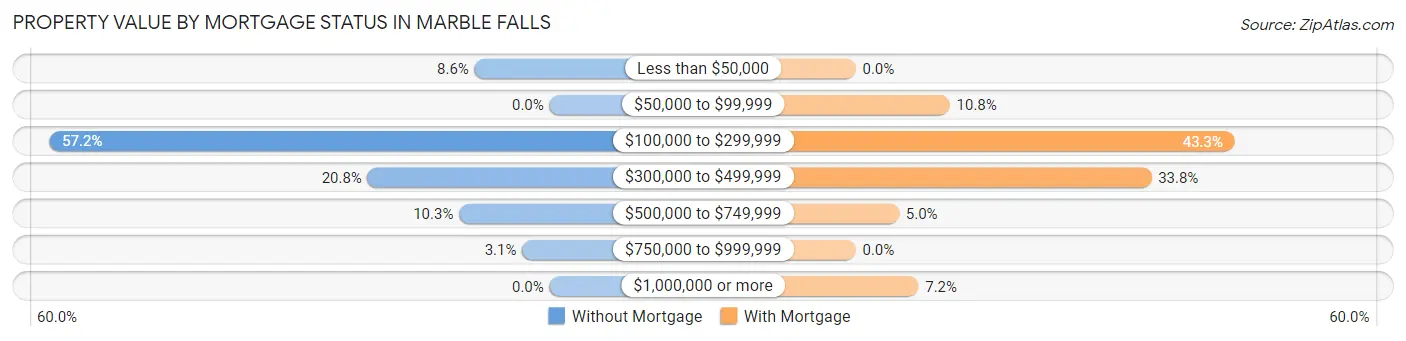
| Property Value | Without Mortgage | With Mortgage |
| Less than $50,000 | 63 (8.6%) | 0 (0.0%) |
| $50,000 to $99,999 | 0 (0.0%) | 63 (10.7%) |
| $100,000 to $299,999 | 421 (57.2%) | 254 (43.3%) |
| $300,000 to $499,999 | 153 (20.8%) | 198 (33.8%) |
| $500,000 to $749,999 | 76 (10.3%) | 29 (5.0%) |
| $750,000 to $999,999 | 23 (3.1%) | 0 (0.0%) |
| $1,000,000 or more | 0 (0.0%) | 42 (7.2%) |
| Total | 736 (100.0%) | 586 (100.0%) |
Household Income by Mortgage Status in Marble Falls
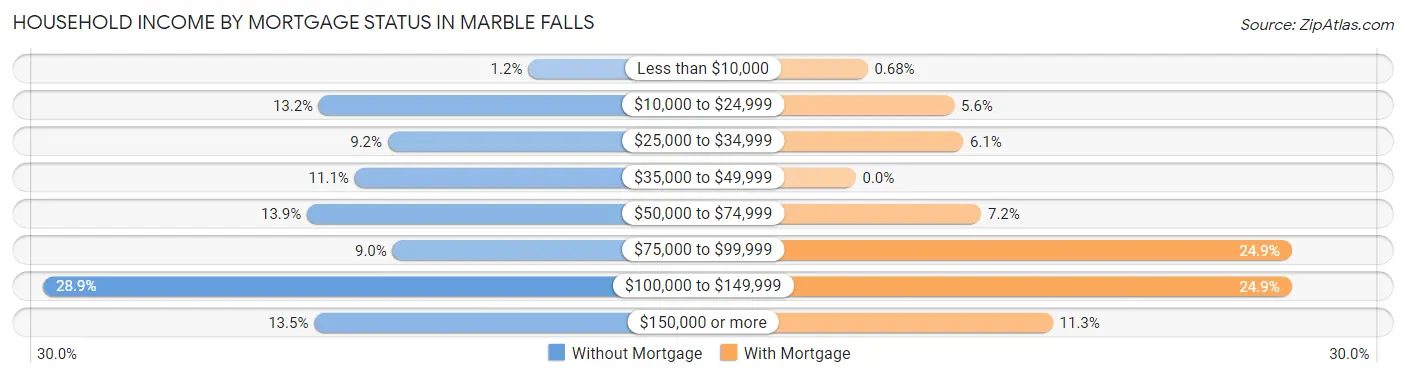
| Household Income | Without Mortgage | With Mortgage |
| Less than $10,000 | 9 (1.2%) | 4 (0.7%) |
| $10,000 to $24,999 | 97 (13.2%) | 33 (5.6%) |
| $25,000 to $34,999 | 68 (9.2%) | 36 (6.1%) |
| $35,000 to $49,999 | 82 (11.1%) | 0 (0.0%) |
| $50,000 to $74,999 | 102 (13.9%) | 42 (7.2%) |
| $75,000 to $99,999 | 66 (9.0%) | 146 (24.9%) |
| $100,000 to $149,999 | 213 (28.9%) | 146 (24.9%) |
| $150,000 or more | 99 (13.5%) | 66 (11.3%) |
| Total | 736 (100.0%) | 586 (100.0%) |
Property Value to Household Income Ratio in Marble Falls
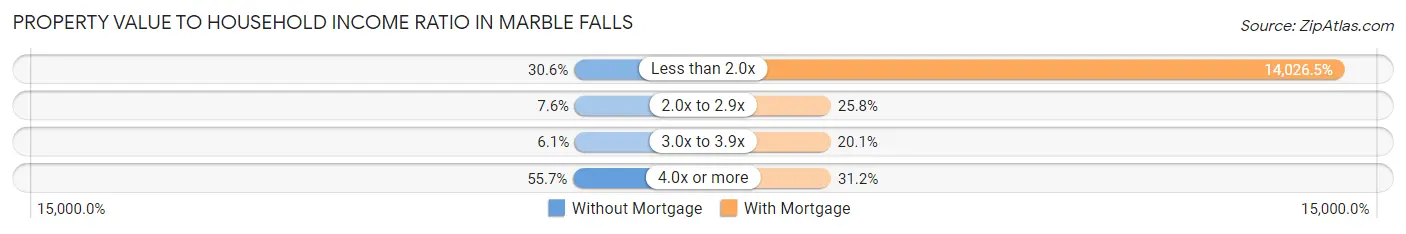
| Value-to-Income Ratio | Without Mortgage | With Mortgage |
| Less than 2.0x | 225 (30.6%) | 82,195 (14,026.4%) |
| 2.0x to 2.9x | 56 (7.6%) | 151 (25.8%) |
| 3.0x to 3.9x | 45 (6.1%) | 118 (20.1%) |
| 4.0x or more | 410 (55.7%) | 183 (31.2%) |
| Total | 736 (100.0%) | 586 (100.0%) |
Real Estate Taxes by Mortgage Status in Marble Falls
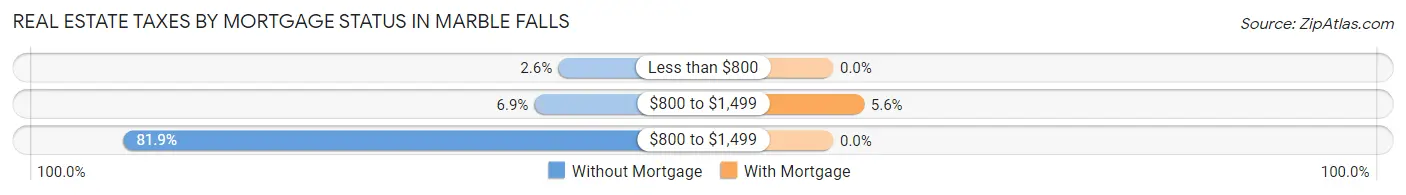
| Property Taxes | Without Mortgage | With Mortgage |
| Less than $800 | 19 (2.6%) | 0 (0.0%) |
| $800 to $1,499 | 51 (6.9%) | 33 (5.6%) |
| $800 to $1,499 | 603 (81.9%) | 0 (0.0%) |
| Total | 736 (100.0%) | 586 (100.0%) |
Health & Disability in Marble Falls
Health Insurance Coverage by Age in Marble Falls
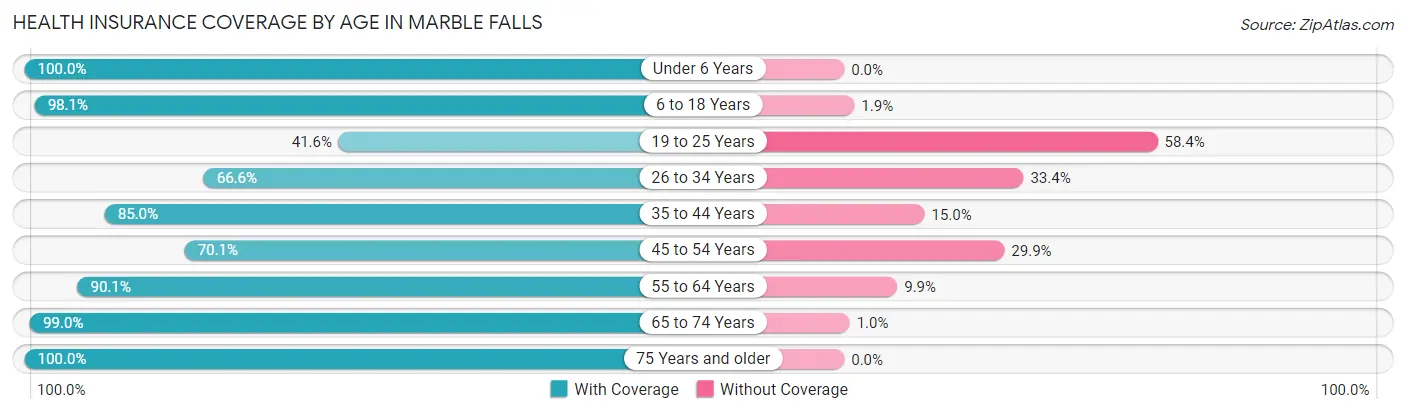
| Age Bracket | With Coverage | Without Coverage |
| Under 6 Years | 343 (100.0%) | 0 (0.0%) |
| 6 to 18 Years | 1,300 (98.1%) | 25 (1.9%) |
| 19 to 25 Years | 304 (41.6%) | 427 (58.4%) |
| 26 to 34 Years | 512 (66.6%) | 257 (33.4%) |
| 35 to 44 Years | 847 (85.0%) | 149 (15.0%) |
| 45 to 54 Years | 310 (70.1%) | 132 (29.9%) |
| 55 to 64 Years | 994 (90.1%) | 109 (9.9%) |
| 65 to 74 Years | 590 (99.0%) | 6 (1.0%) |
| 75 Years and older | 699 (100.0%) | 0 (0.0%) |
| Total | 5,899 (84.2%) | 1,105 (15.8%) |
Health Insurance Coverage by Citizenship Status in Marble Falls
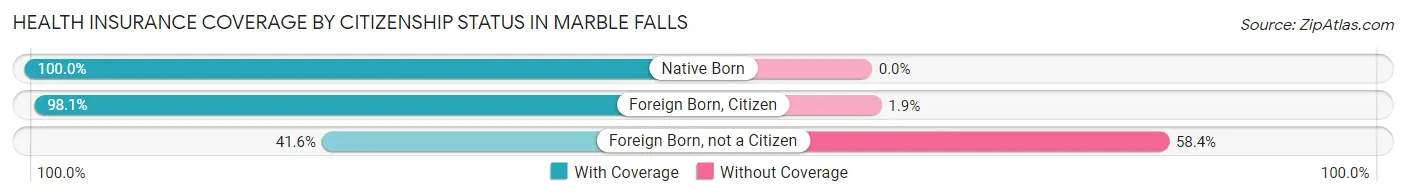
| Citizenship Status | With Coverage | Without Coverage |
| Native Born | 343 (100.0%) | 0 (0.0%) |
| Foreign Born, Citizen | 1,300 (98.1%) | 25 (1.9%) |
| Foreign Born, not a Citizen | 304 (41.6%) | 427 (58.4%) |
Health Insurance Coverage by Household Income in Marble Falls
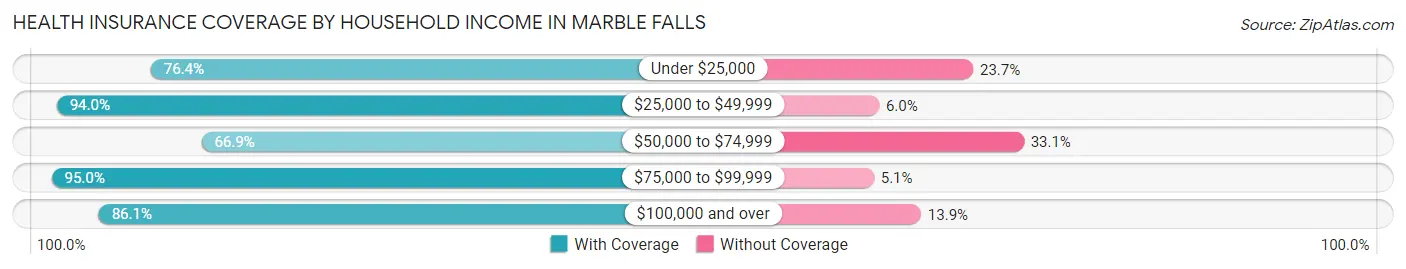
| Household Income | With Coverage | Without Coverage |
| Under $25,000 | 510 (76.3%) | 158 (23.6%) |
| $25,000 to $49,999 | 1,762 (94.0%) | 113 (6.0%) |
| $50,000 to $74,999 | 922 (66.9%) | 457 (33.1%) |
| $75,000 to $99,999 | 602 (95.0%) | 32 (5.1%) |
| $100,000 and over | 2,096 (86.1%) | 338 (13.9%) |
Public vs Private Health Insurance Coverage by Age in Marble Falls
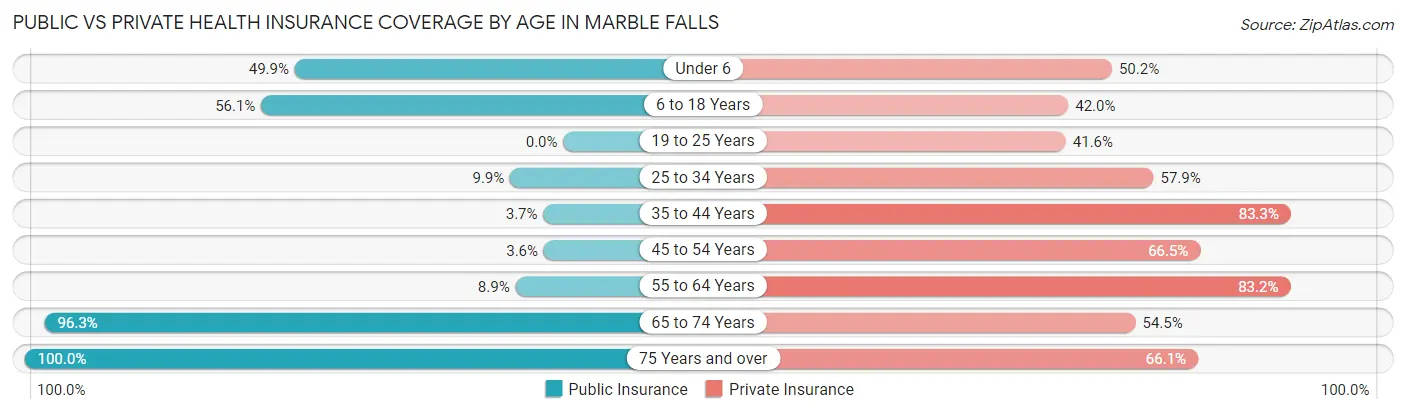
| Age Bracket | Public Insurance | Private Insurance |
| Under 6 | 171 (49.8%) | 172 (50.1%) |
| 6 to 18 Years | 743 (56.1%) | 557 (42.0%) |
| 19 to 25 Years | 0 (0.0%) | 304 (41.6%) |
| 25 to 34 Years | 76 (9.9%) | 445 (57.9%) |
| 35 to 44 Years | 37 (3.7%) | 830 (83.3%) |
| 45 to 54 Years | 16 (3.6%) | 294 (66.5%) |
| 55 to 64 Years | 98 (8.9%) | 918 (83.2%) |
| 65 to 74 Years | 574 (96.3%) | 325 (54.5%) |
| 75 Years and over | 699 (100.0%) | 462 (66.1%) |
| Total | 2,414 (34.5%) | 4,307 (61.5%) |
Disability Status by Sex by Age in Marble Falls
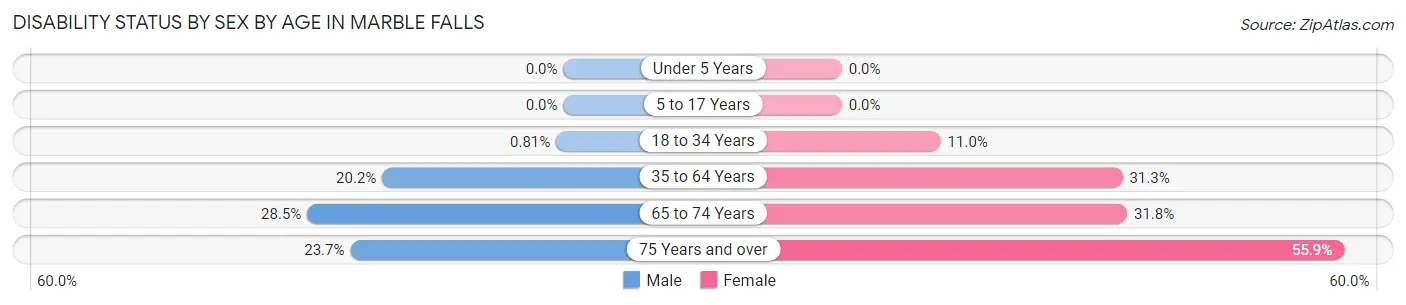
| Age Bracket | Male | Female |
| Under 5 Years | 0 (0.0%) | 0 (0.0%) |
| 5 to 17 Years | 0 (0.0%) | 0 (0.0%) |
| 18 to 34 Years | 7 (0.8%) | 72 (11.0%) |
| 35 to 64 Years | 250 (20.2%) | 407 (31.3%) |
| 65 to 74 Years | 91 (28.5%) | 88 (31.8%) |
| 75 Years and over | 42 (23.7%) | 292 (55.9%) |
Disability Class by Sex by Age in Marble Falls
Disability Class: Hearing Difficulty
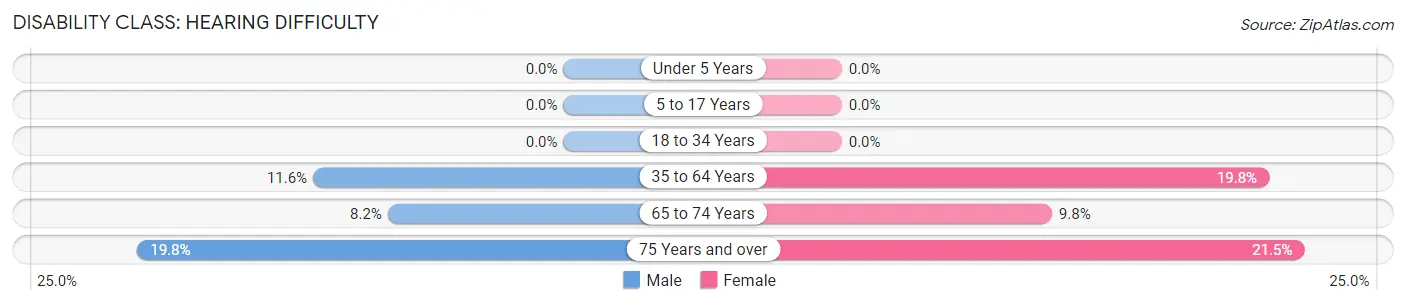
| Age Bracket | Male | Female |
| Under 5 Years | 0 (0.0%) | 0 (0.0%) |
| 5 to 17 Years | 0 (0.0%) | 0 (0.0%) |
| 18 to 34 Years | 0 (0.0%) | 0 (0.0%) |
| 35 to 64 Years | 144 (11.6%) | 258 (19.8%) |
| 65 to 74 Years | 26 (8.2%) | 27 (9.8%) |
| 75 Years and over | 35 (19.8%) | 112 (21.5%) |
Disability Class: Vision Difficulty
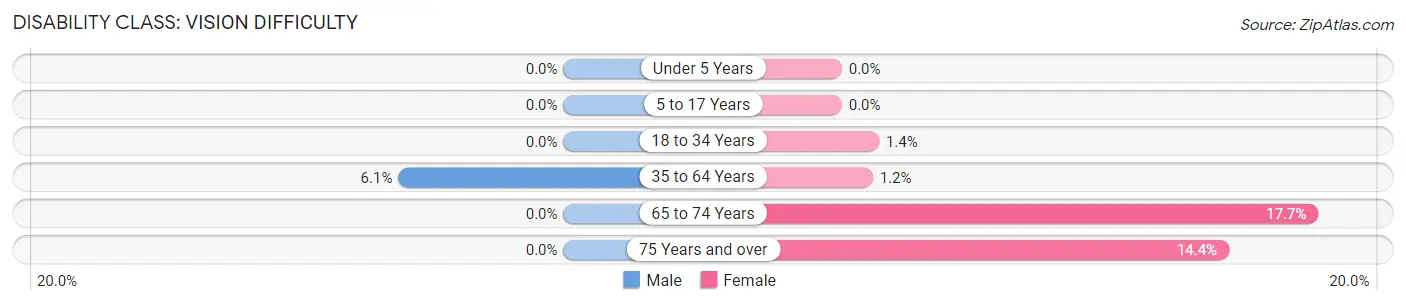
| Age Bracket | Male | Female |
| Under 5 Years | 0 (0.0%) | 0 (0.0%) |
| 5 to 17 Years | 0 (0.0%) | 0 (0.0%) |
| 18 to 34 Years | 0 (0.0%) | 9 (1.4%) |
| 35 to 64 Years | 76 (6.1%) | 15 (1.1%) |
| 65 to 74 Years | 0 (0.0%) | 49 (17.7%) |
| 75 Years and over | 0 (0.0%) | 75 (14.4%) |
Disability Class: Cognitive Difficulty
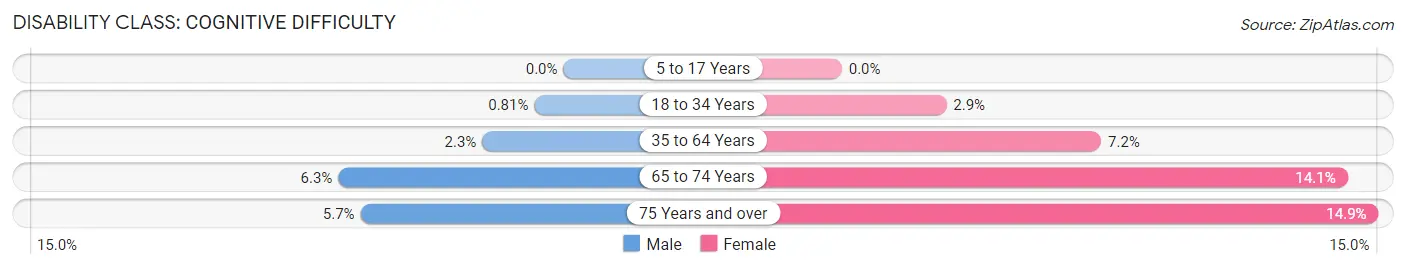
| Age Bracket | Male | Female |
| 5 to 17 Years | 0 (0.0%) | 0 (0.0%) |
| 18 to 34 Years | 7 (0.8%) | 19 (2.9%) |
| 35 to 64 Years | 28 (2.3%) | 94 (7.2%) |
| 65 to 74 Years | 20 (6.3%) | 39 (14.1%) |
| 75 Years and over | 10 (5.7%) | 78 (14.9%) |
Disability Class: Ambulatory Difficulty
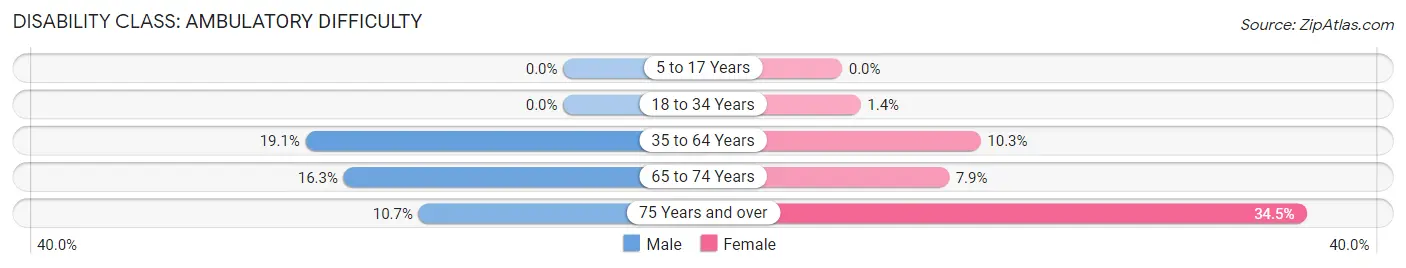
| Age Bracket | Male | Female |
| 5 to 17 Years | 0 (0.0%) | 0 (0.0%) |
| 18 to 34 Years | 0 (0.0%) | 9 (1.4%) |
| 35 to 64 Years | 237 (19.1%) | 134 (10.3%) |
| 65 to 74 Years | 52 (16.3%) | 22 (7.9%) |
| 75 Years and over | 19 (10.7%) | 180 (34.5%) |
Disability Class: Self-Care Difficulty
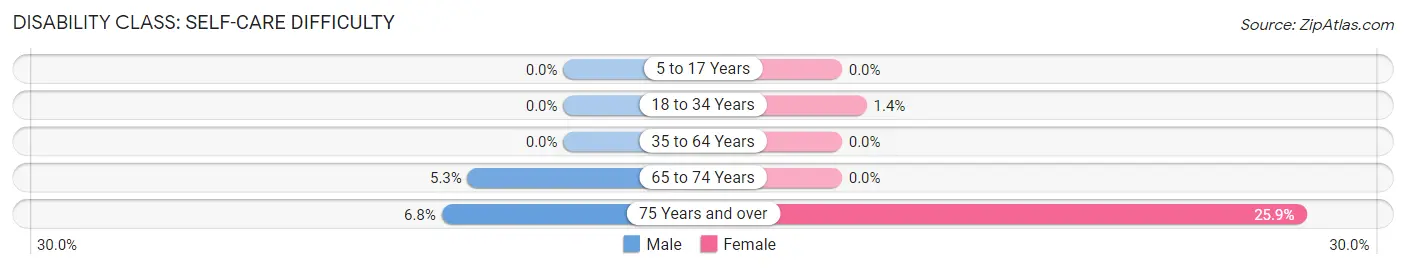
| Age Bracket | Male | Female |
| 5 to 17 Years | 0 (0.0%) | 0 (0.0%) |
| 18 to 34 Years | 0 (0.0%) | 9 (1.4%) |
| 35 to 64 Years | 0 (0.0%) | 0 (0.0%) |
| 65 to 74 Years | 17 (5.3%) | 0 (0.0%) |
| 75 Years and over | 12 (6.8%) | 135 (25.9%) |
Technology Access in Marble Falls
Computing Device Access in Marble Falls
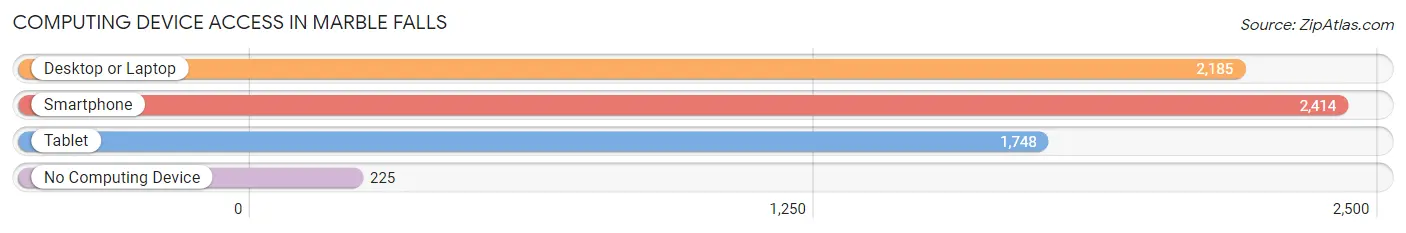
| Device Type | # Households | % Households |
| Desktop or Laptop | 2,185 | 78.3% |
| Smartphone | 2,414 | 86.5% |
| Tablet | 1,748 | 62.6% |
| No Computing Device | 225 | 8.1% |
| Total | 2,791 | 100.0% |
Internet Access in Marble Falls
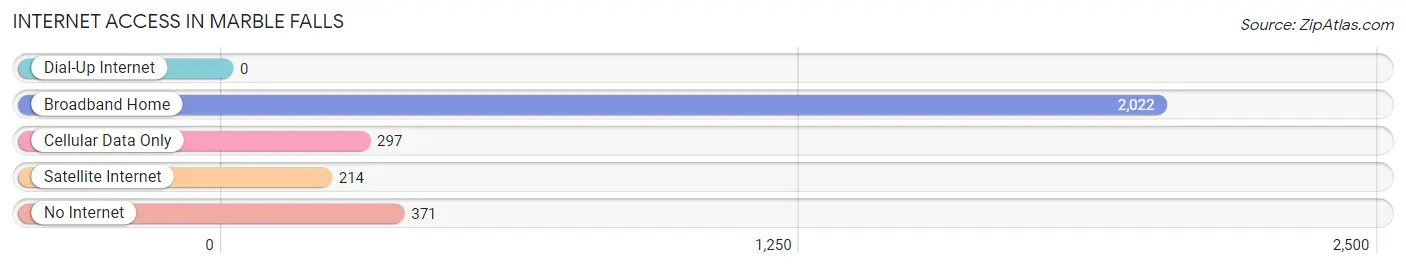
| Internet Type | # Households | % Households |
| Dial-Up Internet | 0 | 0.0% |
| Broadband Home | 2,022 | 72.5% |
| Cellular Data Only | 297 | 10.6% |
| Satellite Internet | 214 | 7.7% |
| No Internet | 371 | 13.3% |
| Total | 2,791 | 100.0% |
Marble Falls Summary
Marble Falls is a city located in Burnet County, Texas, United States. It is located about 65 miles northwest of Austin and 85 miles north of San Antonio. The population was 6,077 at the 2010 census.
History
Marble Falls was founded in 1887 by Adam Rankin Johnson, a former Confederate soldier. Johnson named the city after the nearby falls of the Colorado River, which were made of limestone and marble. The city was incorporated in 1887 and was the first city in Burnet County.
The city was a popular tourist destination in the early 20th century, with many visitors coming to see the falls. The city was also home to a number of resorts, including the Marble Falls Hotel, which was built in 1891.
In the 1920s, the city began to experience a period of growth and development. The city was home to a number of businesses, including a cotton gin, a flour mill, a sawmill, and a brick factory. The city also had a number of churches, schools, and a hospital.
In the 1950s, the city began to experience a period of decline. The city's population decreased and many businesses closed. In the 1970s, the city began to experience a period of revitalization. The city was home to a number of new businesses, including a shopping center, a movie theater, and a number of restaurants.
Geography
Marble Falls is located at 30°34'25" North, 98°17'17" West (30.573611, -98.288056). The city is located in the Hill Country region of Texas. The city is situated on the banks of the Colorado River. The city is surrounded by rolling hills and is located near Lake Marble Falls.
The city has a total area of 8.2 square miles, of which 8.1 square miles is land and 0.1 square miles is water.
Economy
Marble Falls is home to a number of businesses, including a number of restaurants, retail stores, and a number of manufacturing companies. The city is also home to a number of medical facilities, including a hospital and a number of clinics.
The city is also home to a number of tourist attractions, including the Marble Falls Museum of History, the Marble Falls Visitor Center, and the Marble Falls Historic District.
Demographics
As of the 2010 census, the population of Marble Falls was 6,077. The racial makeup of the city was 79.2% White, 11.3% African American, 0.7% Native American, 0.7% Asian, 0.1% Pacific Islander, 6.2% from other races, and 2.0% from two or more races. Hispanic or Latino of any race were 16.3% of the population.
The median income for a household in the city was $37,917, and the median income for a family was $45,938. The per capita income for the city was $20,945. About 14.3% of families and 17.7% of the population were below the poverty line, including 25.2% of those under age 18 and 11.2% of those age 65 or over.
Common Questions
What is Per Capita Income in Marble Falls?
Per Capita income in Marble Falls is $38,904.
What is the Median Family Income in Marble Falls?
Median Family Income in Marble Falls is $57,404.
What is the Median Household income in Marble Falls?
Median Household Income in Marble Falls is $53,789.
What is Income or Wage Gap in Marble Falls?
Income or Wage Gap in Marble Falls is 24.6%.
Women in Marble Falls earn 75.4 cents for every dollar earned by a man.
What is Inequality or Gini Index in Marble Falls?
Inequality or Gini Index in Marble Falls is 0.54.
What is the Total Population of Marble Falls?
Total Population of Marble Falls is 7,068.
What is the Total Male Population of Marble Falls?
Total Male Population of Marble Falls is 3,796.
What is the Total Female Population of Marble Falls?
Total Female Population of Marble Falls is 3,272.
What is the Ratio of Males per 100 Females in Marble Falls?
There are 116.01 Males per 100 Females in Marble Falls.
What is the Ratio of Females per 100 Males in Marble Falls?
There are 86.20 Females per 100 Males in Marble Falls.
What is the Median Population Age in Marble Falls?
Median Population Age in Marble Falls is 36.8 Years.
What is the Average Family Size in Marble Falls
Average Family Size in Marble Falls is 3.2 People.
What is the Average Household Size in Marble Falls
Average Household Size in Marble Falls is 2.5 People.
How Large is the Labor Force in Marble Falls?
There are 3,703 People in the Labor Forcein in Marble Falls.
What is the Percentage of People in the Labor Force in Marble Falls?
64.7% of People are in the Labor Force in Marble Falls.
What is the Unemployment Rate in Marble Falls?
Unemployment Rate in Marble Falls is 4.2%.