Manchaca, TX Map & Demographics
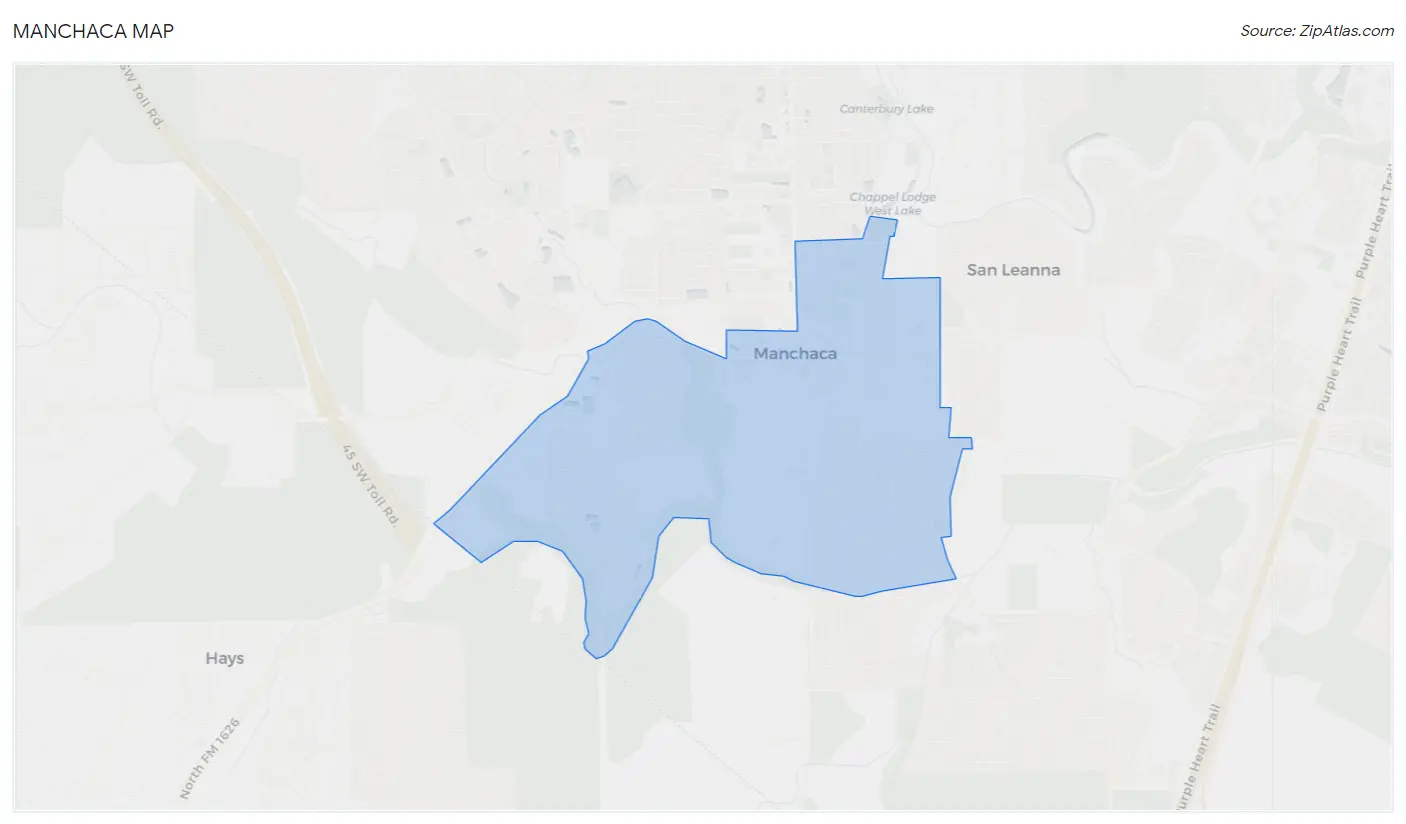
Manchaca Map
Manchaca Overview
$52,842
PER CAPITA INCOME
$157,375
AVG FAMILY INCOME
$124,491
AVG HOUSEHOLD INCOME
31.4%
WAGE / INCOME GAP [ % ]
68.6¢/ $1
WAGE / INCOME GAP [ $ ]
0.37
INEQUALITY / GINI INDEX
2,041
TOTAL POPULATION
1,069
MALE POPULATION
972
FEMALE POPULATION
109.98
MALES / 100 FEMALES
90.93
FEMALES / 100 MALES
35.8
MEDIAN AGE
3.4
AVG FAMILY SIZE
2.9
AVG HOUSEHOLD SIZE
1,177
LABOR FORCE [ PEOPLE ]
73.0%
PERCENT IN LABOR FORCE
Manchaca Zip Codes
Manchaca Area Codes
Income in Manchaca
Income Overview in Manchaca
Per Capita Income in Manchaca is $52,842, while median incomes of families and households are $157,375 and $124,491 respectively.
| Characteristic | Number | Measure |
| Per Capita Income | 2,041 | $52,842 |
| Median Family Income | 511 | $157,375 |
| Mean Family Income | 511 | $179,057 |
| Median Household Income | 710 | $124,491 |
| Mean Household Income | 710 | $150,323 |
| Income Deficit | 511 | $0 |
| Wage / Income Gap (%) | 2,041 | 31.36% |
| Wage / Income Gap ($) | 2,041 | 68.64¢ per $1 |
| Gini / Inequality Index | 2,041 | 0.37 |
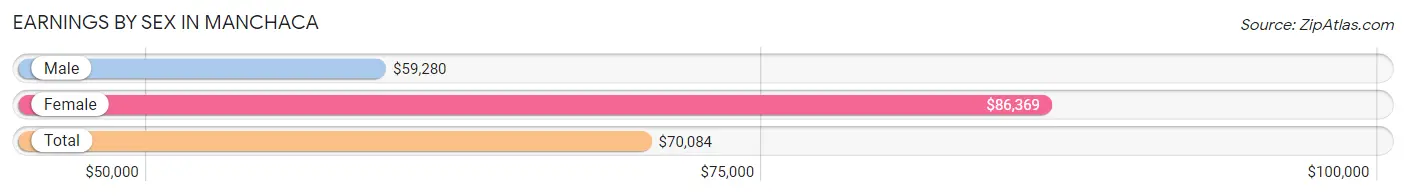
Earnings by Sex in Manchaca
Average Earnings in Manchaca are $70,084, $59,280 for men and $86,369 for women, a difference of 31.4%.
| Sex | Number | Average Earnings |
| Male | 629 (52.6%) | $59,280 |
| Female | 566 (47.4%) | $86,369 |
| Total | 1,195 (100.0%) | $70,084 |
Earnings by Sex by Income Bracket in Manchaca
The most common earnings brackets in Manchaca are $65,000 to $74,999 for men (123 | 19.6%) and $100,000+ for women (204 | 36.0%).

| Income | Male | Female |
| $2,499 or less | 0 (0.0%) | 0 (0.0%) |
| $2,500 to $4,999 | 2 (0.3%) | 28 (5.0%) |
| $5,000 to $7,499 | 0 (0.0%) | 0 (0.0%) |
| $7,500 to $9,999 | 26 (4.1%) | 0 (0.0%) |
| $10,000 to $12,499 | 31 (4.9%) | 0 (0.0%) |
| $12,500 to $14,999 | 0 (0.0%) | 0 (0.0%) |
| $15,000 to $17,499 | 0 (0.0%) | 18 (3.2%) |
| $17,500 to $19,999 | 0 (0.0%) | 0 (0.0%) |
| $20,000 to $22,499 | 0 (0.0%) | 0 (0.0%) |
| $22,500 to $24,999 | 0 (0.0%) | 0 (0.0%) |
| $25,000 to $29,999 | 17 (2.7%) | 37 (6.5%) |
| $30,000 to $34,999 | 66 (10.5%) | 0 (0.0%) |
| $35,000 to $39,999 | 92 (14.6%) | 0 (0.0%) |
| $40,000 to $44,999 | 0 (0.0%) | 59 (10.4%) |
| $45,000 to $49,999 | 26 (4.1%) | 61 (10.8%) |
| $50,000 to $54,999 | 0 (0.0%) | 16 (2.8%) |
| $55,000 to $64,999 | 75 (11.9%) | 41 (7.2%) |
| $65,000 to $74,999 | 123 (19.6%) | 0 (0.0%) |
| $75,000 to $99,999 | 107 (17.0%) | 102 (18.0%) |
| $100,000+ | 64 (10.2%) | 204 (36.0%) |
| Total | 629 (100.0%) | 566 (100.0%) |
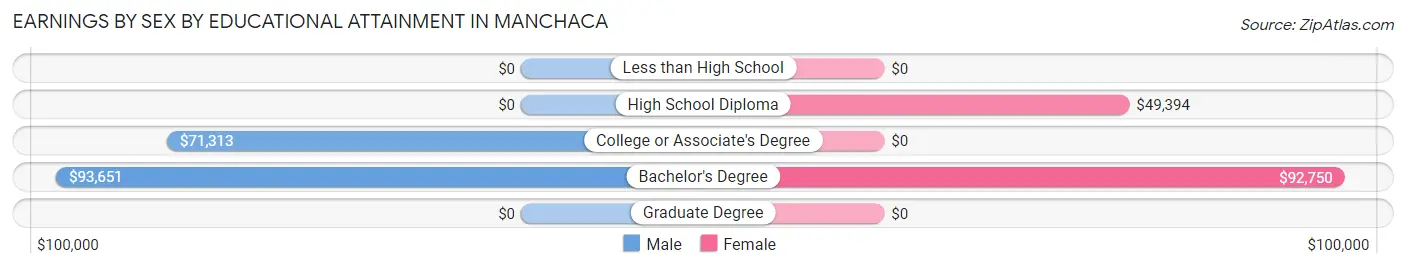
Earnings by Sex by Educational Attainment in Manchaca
Average earnings in Manchaca are $62,159 for men and $90,750 for women, a difference of 31.5%. Men with an educational attainment of bachelor's degree enjoy the highest average annual earnings of $93,651, while those with college or associate's degree education earn the least with $71,313. Women with an educational attainment of bachelor's degree earn the most with the average annual earnings of $92,750, while those with high school diploma education have the smallest earnings of $49,394.
| Educational Attainment | Male Income | Female Income |
| Less than High School | - | - |
| High School Diploma | - | - |
| College or Associate's Degree | $71,313 | $0 |
| Bachelor's Degree | $93,651 | $92,750 |
| Graduate Degree | - | - |
| Total | $62,159 | $90,750 |
Family Income in Manchaca
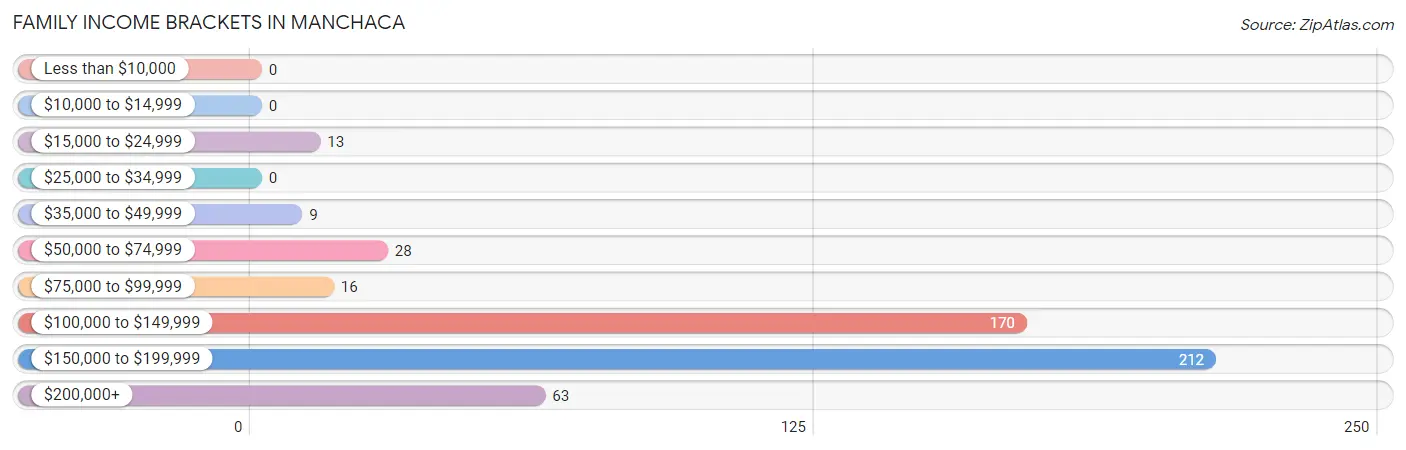
Family Income Brackets in Manchaca
According to the Manchaca family income data, there are 212 families falling into the $150,000 to $199,999 income range, which is the most common income bracket and makes up 41.5% of all families.
| Income Bracket | # Families | % Families |
| Less than $10,000 | 0 | 0.0% |
| $10,000 to $14,999 | 0 | 0.0% |
| $15,000 to $24,999 | 13 | 2.5% |
| $25,000 to $34,999 | 0 | 0.0% |
| $35,000 to $49,999 | 9 | 1.8% |
| $50,000 to $74,999 | 28 | 5.5% |
| $75,000 to $99,999 | 16 | 3.1% |
| $100,000 to $149,999 | 170 | 33.3% |
| $150,000 to $199,999 | 212 | 41.5% |
| $200,000+ | 63 | 12.3% |
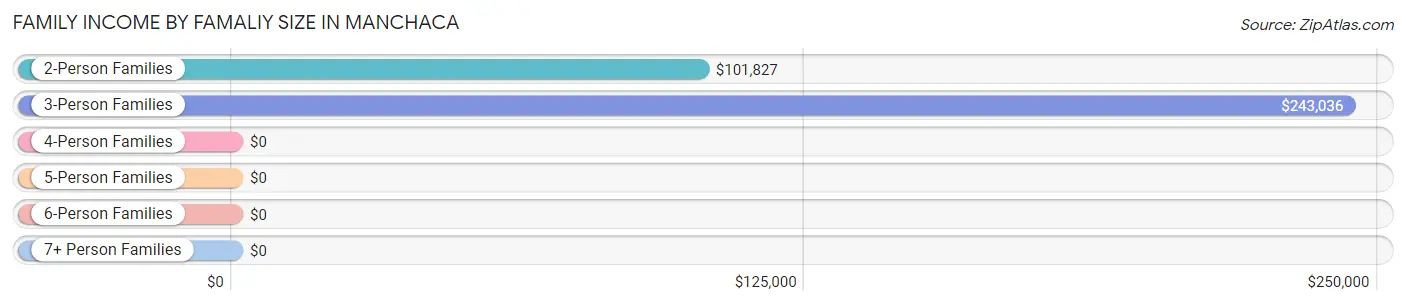
Family Income by Famaliy Size in Manchaca
3-person families (74 | 14.5%) account for the highest median family income in Manchaca with $243,036 per family, while 3-person families (74 | 14.5%) have the highest median income of $81,012 per family member.
| Income Bracket | # Families | Median Income |
| 2-Person Families | 227 (44.4%) | $101,827 |
| 3-Person Families | 74 (14.5%) | $243,036 |
| 4-Person Families | 80 (15.7%) | $0 |
| 5-Person Families | 38 (7.4%) | $0 |
| 6-Person Families | 92 (18.0%) | $0 |
| 7+ Person Families | 0 (0.0%) | $0 |
| Total | 511 (100.0%) | $157,375 |
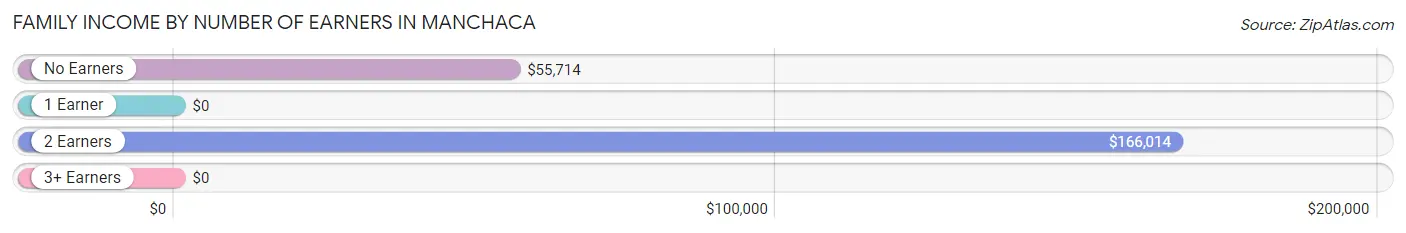
Family Income by Number of Earners in Manchaca
| Number of Earners | # Families | Median Income |
| No Earners | 60 (11.7%) | $55,714 |
| 1 Earner | 42 (8.2%) | $0 |
| 2 Earners | 364 (71.2%) | $166,014 |
| 3+ Earners | 45 (8.8%) | $0 |
| Total | 511 (100.0%) | $157,375 |
Household Income in Manchaca
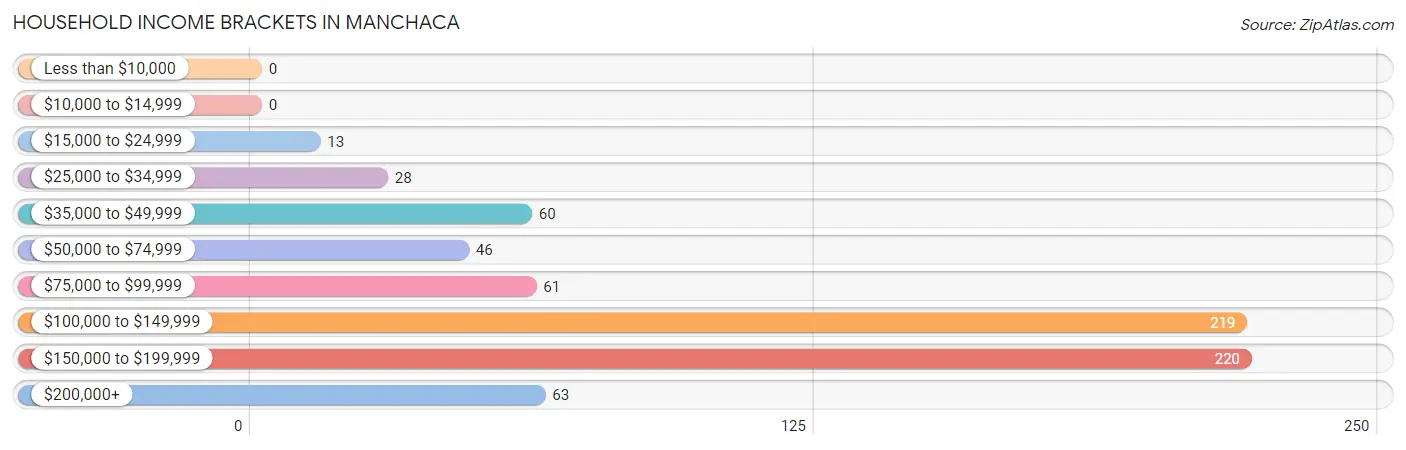
Household Income Brackets in Manchaca
With 220 households falling in the category, the $150,000 to $199,999 income range is the most frequent in Manchaca, accounting for 31.0% of all households.
| Income Bracket | # Households | % Households |
| Less than $10,000 | 0 | 0.0% |
| $10,000 to $14,999 | 0 | 0.0% |
| $15,000 to $24,999 | 13 | 1.8% |
| $25,000 to $34,999 | 28 | 3.9% |
| $35,000 to $49,999 | 60 | 8.5% |
| $50,000 to $74,999 | 46 | 6.5% |
| $75,000 to $99,999 | 61 | 8.6% |
| $100,000 to $149,999 | 219 | 30.8% |
| $150,000 to $199,999 | 220 | 31.0% |
| $200,000+ | 63 | 8.9% |
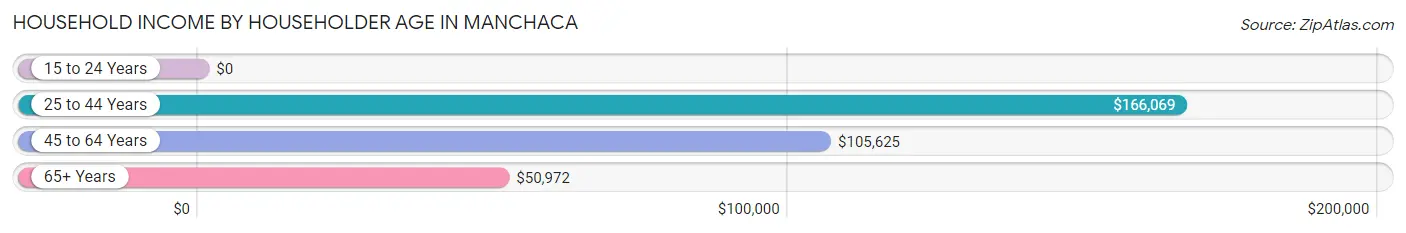
Household Income by Householder Age in Manchaca
The median household income in Manchaca is $124,491, with the highest median household income of $166,069 found in the 25 to 44 years age bracket for the primary householder. A total of 399 households (56.2%) fall into this category.
| Income Bracket | # Households | Median Income |
| 15 to 24 Years | 0 (0.0%) | $0 |
| 25 to 44 Years | 399 (56.2%) | $166,069 |
| 45 to 64 Years | 197 (27.8%) | $105,625 |
| 65+ Years | 114 (16.1%) | $50,972 |
| Total | 710 (100.0%) | $124,491 |
Poverty in Manchaca
Income Below Poverty by Sex and Age in Manchaca
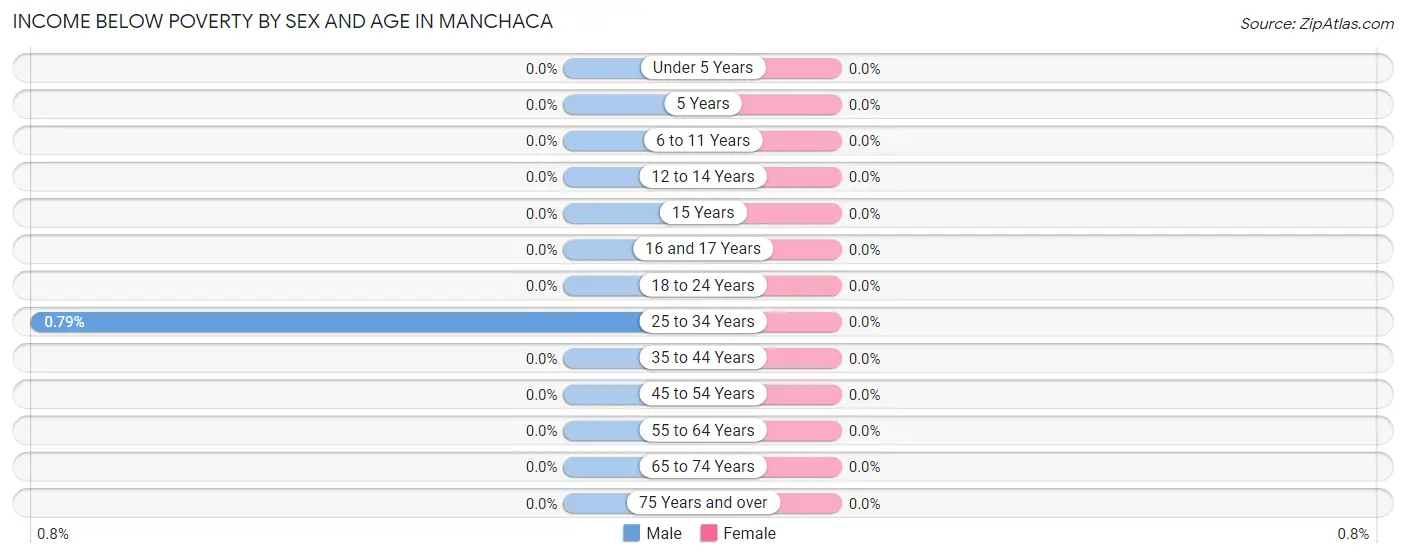
| Age Bracket | Male | Female |
| Under 5 Years | 0 (0.0%) | 0 (0.0%) |
| 5 Years | 0 (0.0%) | 0 (0.0%) |
| 6 to 11 Years | 0 (0.0%) | 0 (0.0%) |
| 12 to 14 Years | 0 (0.0%) | 0 (0.0%) |
| 15 Years | 0 (0.0%) | 0 (0.0%) |
| 16 and 17 Years | 0 (0.0%) | 0 (0.0%) |
| 18 to 24 Years | 0 (0.0%) | 0 (0.0%) |
| 25 to 34 Years | 2 (0.8%) | 0 (0.0%) |
| 35 to 44 Years | 0 (0.0%) | 0 (0.0%) |
| 45 to 54 Years | 0 (0.0%) | 0 (0.0%) |
| 55 to 64 Years | 0 (0.0%) | 0 (0.0%) |
| 65 to 74 Years | 0 (0.0%) | 0 (0.0%) |
| 75 Years and over | 0 (0.0%) | 0 (0.0%) |
| Total | 2 (0.2%) | 0 (0.0%) |
Income Above Poverty by Sex and Age in Manchaca
According to the poverty statistics in Manchaca, males aged under 5 years and females aged under 5 years are the age groups that are most secure financially, with 100.0% of males and 100.0% of females in these age groups living above the poverty line.
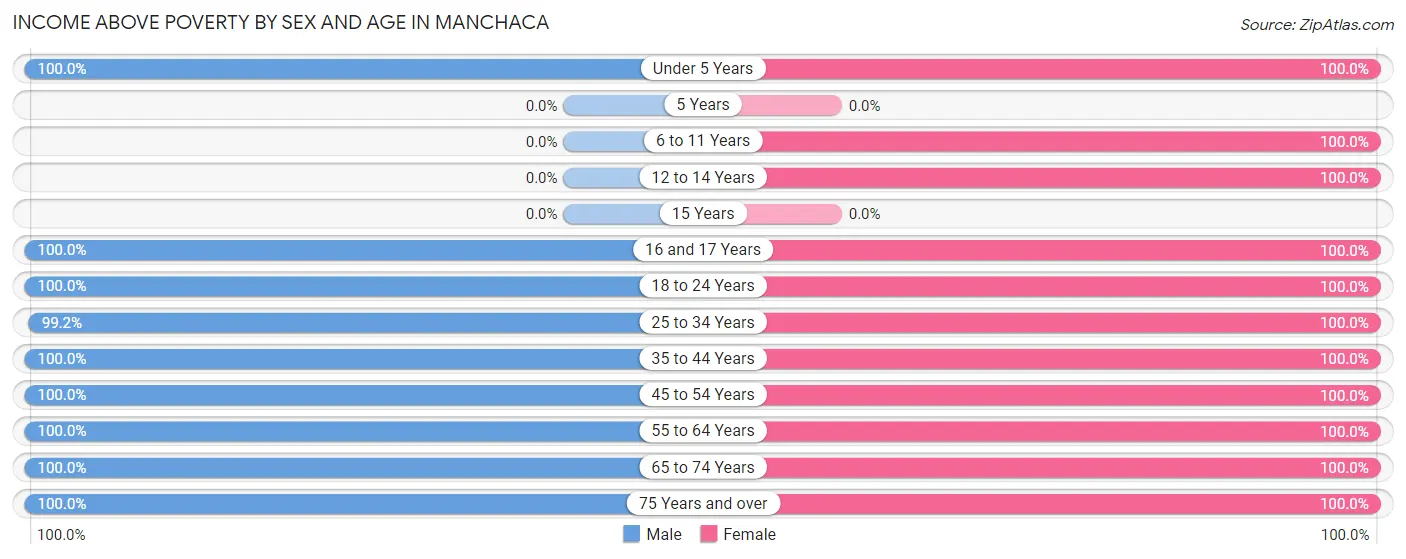
| Age Bracket | Male | Female |
| Under 5 Years | 273 (100.0%) | 76 (100.0%) |
| 5 Years | 0 (0.0%) | 0 (0.0%) |
| 6 to 11 Years | 0 (0.0%) | 49 (100.0%) |
| 12 to 14 Years | 0 (0.0%) | 31 (100.0%) |
| 15 Years | 0 (0.0%) | 0 (0.0%) |
| 16 and 17 Years | 97 (100.0%) | 28 (100.0%) |
| 18 to 24 Years | 38 (100.0%) | 28 (100.0%) |
| 25 to 34 Years | 250 (99.2%) | 120 (100.0%) |
| 35 to 44 Years | 145 (100.0%) | 229 (100.0%) |
| 45 to 54 Years | 106 (100.0%) | 220 (100.0%) |
| 55 to 64 Years | 99 (100.0%) | 75 (100.0%) |
| 65 to 74 Years | 29 (100.0%) | 98 (100.0%) |
| 75 Years and over | 30 (100.0%) | 18 (100.0%) |
| Total | 1,067 (99.8%) | 972 (100.0%) |
Income Below Poverty Among Married-Couple Families in Manchaca
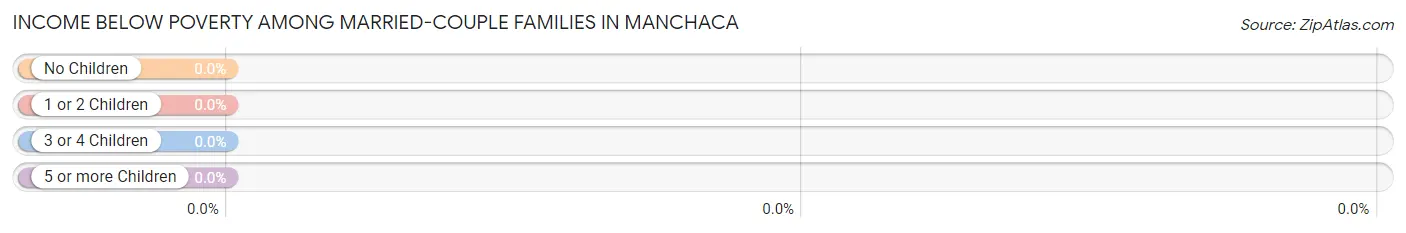
| Children | Above Poverty | Below Poverty |
| No Children | 189 (100.0%) | 0 (0.0%) |
| 1 or 2 Children | 160 (100.0%) | 0 (0.0%) |
| 3 or 4 Children | 92 (100.0%) | 0 (0.0%) |
| 5 or more Children | 0 (0.0%) | 0 (0.0%) |
| Total | 441 (100.0%) | 0 (0.0%) |
Income Below Poverty Among Single-Parent Households in Manchaca
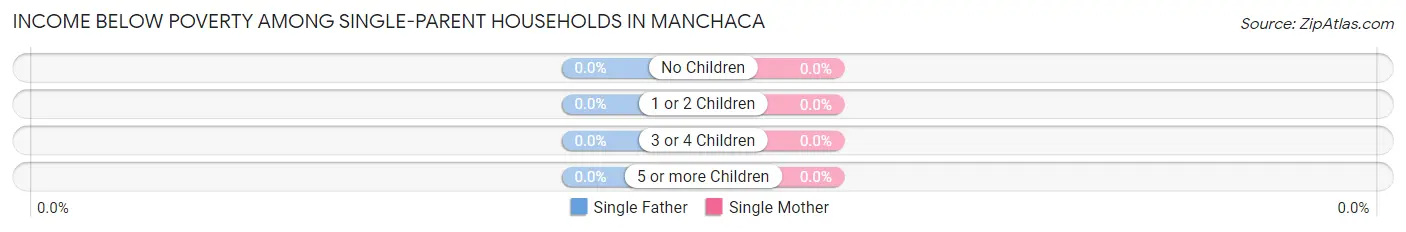
| Children | Single Father | Single Mother |
| No Children | 0 (0.0%) | 0 (0.0%) |
| 1 or 2 Children | 0 (0.0%) | 0 (0.0%) |
| 3 or 4 Children | 0 (0.0%) | 0 (0.0%) |
| 5 or more Children | 0 (0.0%) | 0 (0.0%) |
| Total | 0 (0.0%) | 0 (0.0%) |
Income Below Poverty Among Married-Couple vs Single-Parent Households in Manchaca
| Children | Married-Couple Families | Single-Parent Households |
| No Children | 0 (0.0%) | 0 (0.0%) |
| 1 or 2 Children | 0 (0.0%) | 0 (0.0%) |
| 3 or 4 Children | 0 (0.0%) | 0 (0.0%) |
| 5 or more Children | 0 (0.0%) | 0 (0.0%) |
| Total | 0 (0.0%) | 0 (0.0%) |
Race in Manchaca
The most populous races in Manchaca are White / Caucasian (1,524 | 74.7%), Hispanic or Latino (759 | 37.2%), and Two or more Races (323 | 15.8%).
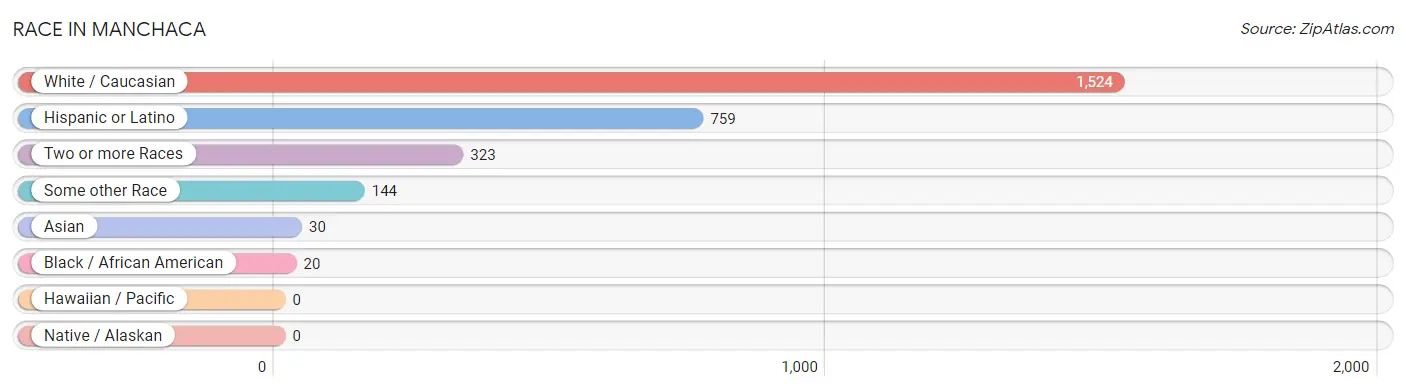
| Race | # Population | % Population |
| Asian | 30 | 1.5% |
| Black / African American | 20 | 1.0% |
| Hawaiian / Pacific | 0 | 0.0% |
| Hispanic or Latino | 759 | 37.2% |
| Native / Alaskan | 0 | 0.0% |
| White / Caucasian | 1,524 | 74.7% |
| Two or more Races | 323 | 15.8% |
| Some other Race | 144 | 7.1% |
| Total | 2,041 | 100.0% |
Ancestry in Manchaca
The most populous ancestries reported in Manchaca are Mexican (759 | 37.2%), German (377 | 18.5%), French (188 | 9.2%), English (154 | 7.5%), and Cherokee (144 | 7.1%), together accounting for 79.5% of all Manchaca residents.
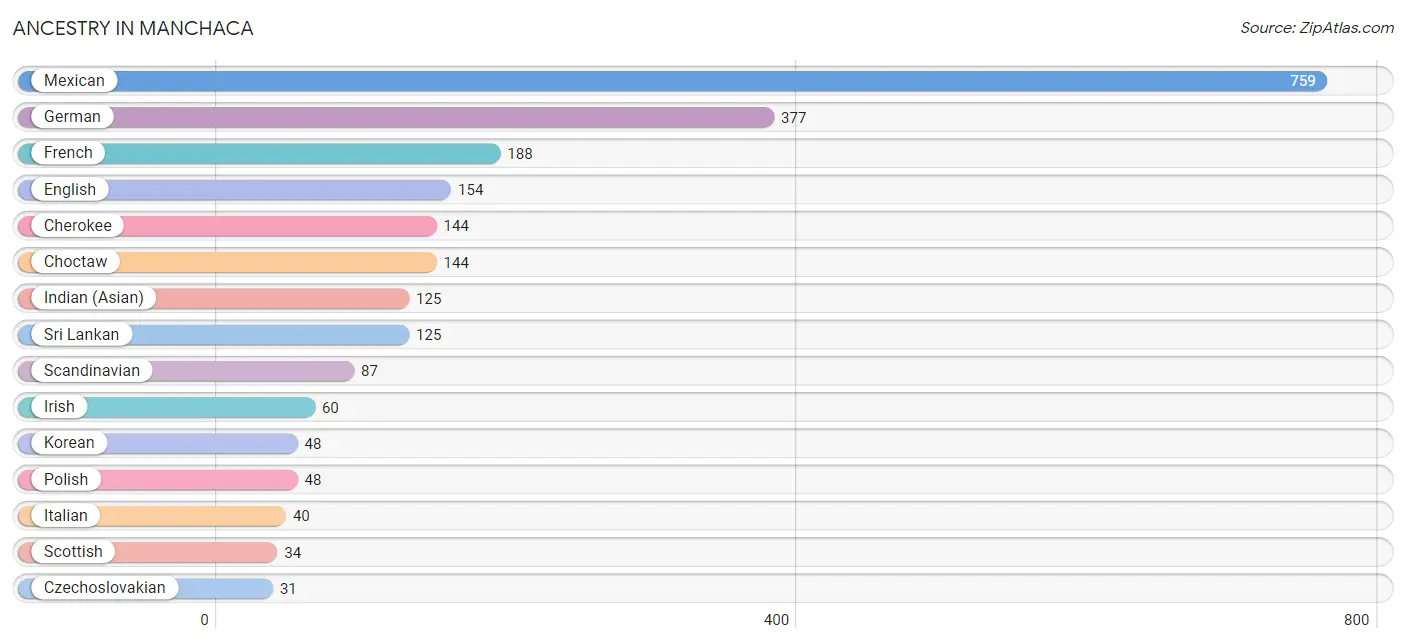
| Ancestry | # Population | % Population |
| American | 8 | 0.4% |
| British | 18 | 0.9% |
| Cherokee | 144 | 7.1% |
| Choctaw | 144 | 7.1% |
| Czech | 8 | 0.4% |
| Czechoslovakian | 31 | 1.5% |
| English | 154 | 7.5% |
| French | 188 | 9.2% |
| German | 377 | 18.5% |
| Indian (Asian) | 125 | 6.1% |
| Irish | 60 | 2.9% |
| Italian | 40 | 2.0% |
| Korean | 48 | 2.4% |
| Mexican | 759 | 37.2% |
| Mexican American Indian | 10 | 0.5% |
| Polish | 48 | 2.4% |
| Russian | 16 | 0.8% |
| Scandinavian | 87 | 4.3% |
| Scottish | 34 | 1.7% |
| Sri Lankan | 125 | 6.1% |
| Ukrainian | 17 | 0.8% | View All 21 Rows |
Immigrants in Manchaca
The most numerous immigrant groups reported in Manchaca came from Central America (256 | 12.5%), Latin America (256 | 12.5%), Nicaragua (204 | 10.0%), Mexico (52 | 2.5%), and Asia (30 | 1.5%), together accounting for 39.1% of all Manchaca residents.
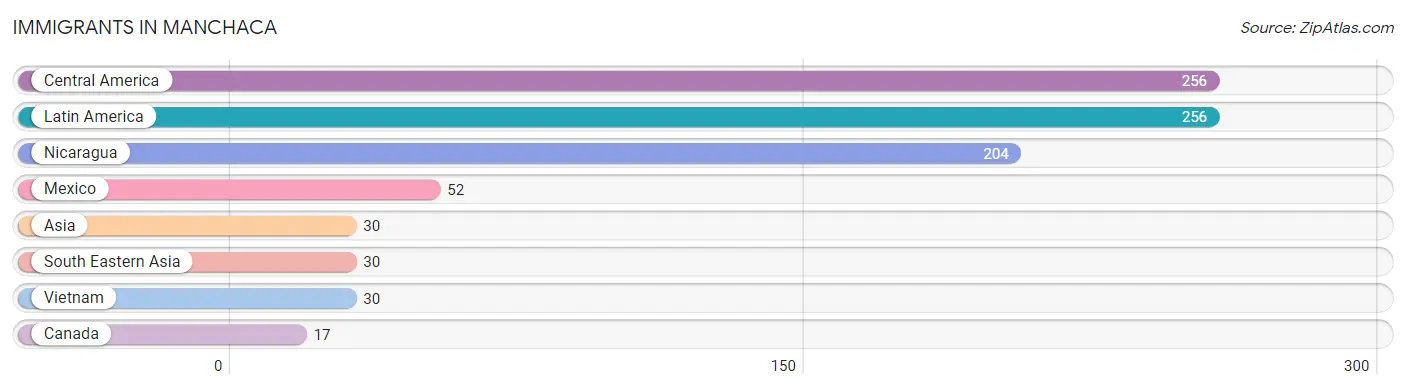
| Immigration Origin | # Population | % Population |
| Asia | 30 | 1.5% |
| Canada | 17 | 0.8% |
| Central America | 256 | 12.5% |
| Latin America | 256 | 12.5% |
| Mexico | 52 | 2.5% |
| Nicaragua | 204 | 10.0% |
| South Eastern Asia | 30 | 1.5% |
| Vietnam | 30 | 1.5% | View All 8 Rows |
Sex and Age in Manchaca
Sex and Age in Manchaca
The most populous age groups in Manchaca are Under 5 Years (273 | 25.5%) for men and 35 to 39 Years (168 | 17.3%) for women.
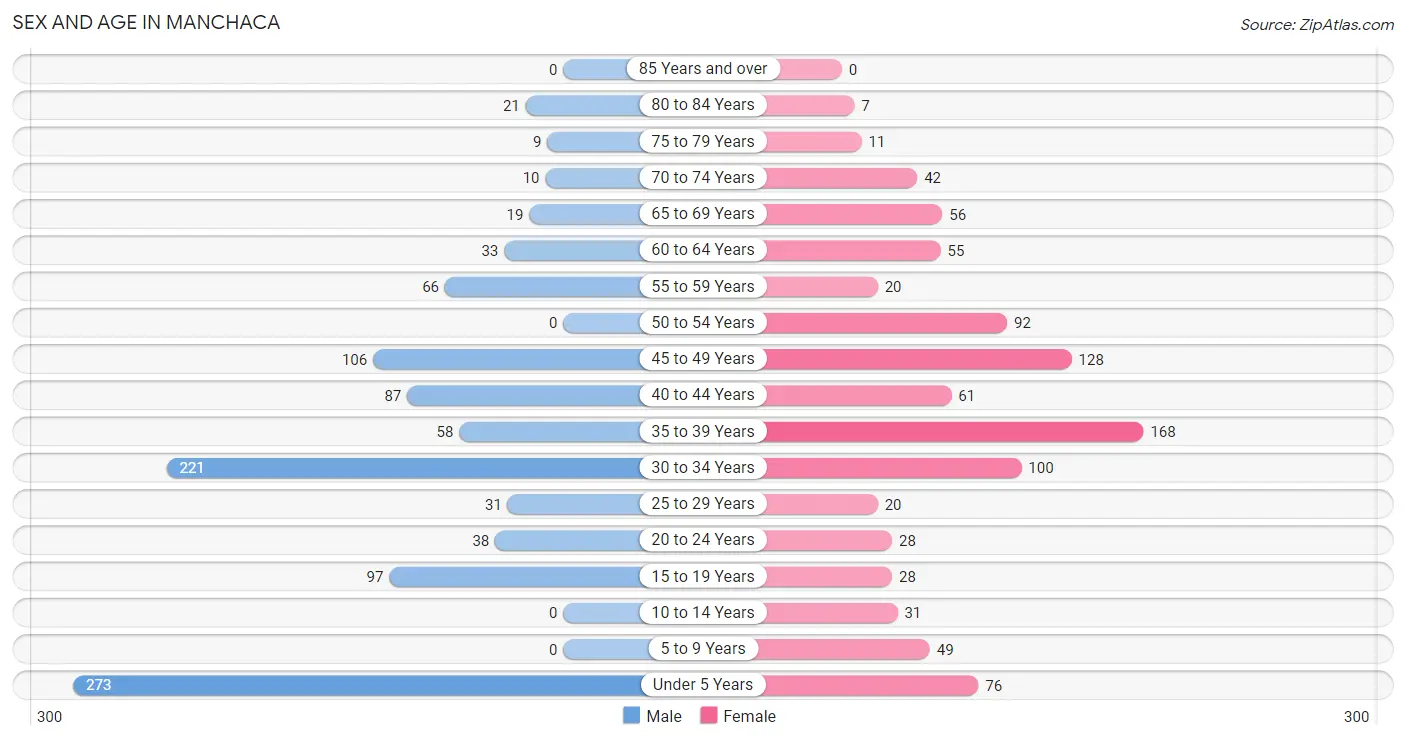
| Age Bracket | Male | Female |
| Under 5 Years | 273 (25.5%) | 76 (7.8%) |
| 5 to 9 Years | 0 (0.0%) | 49 (5.0%) |
| 10 to 14 Years | 0 (0.0%) | 31 (3.2%) |
| 15 to 19 Years | 97 (9.1%) | 28 (2.9%) |
| 20 to 24 Years | 38 (3.5%) | 28 (2.9%) |
| 25 to 29 Years | 31 (2.9%) | 20 (2.1%) |
| 30 to 34 Years | 221 (20.7%) | 100 (10.3%) |
| 35 to 39 Years | 58 (5.4%) | 168 (17.3%) |
| 40 to 44 Years | 87 (8.1%) | 61 (6.3%) |
| 45 to 49 Years | 106 (9.9%) | 128 (13.2%) |
| 50 to 54 Years | 0 (0.0%) | 92 (9.5%) |
| 55 to 59 Years | 66 (6.2%) | 20 (2.1%) |
| 60 to 64 Years | 33 (3.1%) | 55 (5.7%) |
| 65 to 69 Years | 19 (1.8%) | 56 (5.8%) |
| 70 to 74 Years | 10 (0.9%) | 42 (4.3%) |
| 75 to 79 Years | 9 (0.8%) | 11 (1.1%) |
| 80 to 84 Years | 21 (2.0%) | 7 (0.7%) |
| 85 Years and over | 0 (0.0%) | 0 (0.0%) |
| Total | 1,069 (100.0%) | 972 (100.0%) |
Families and Households in Manchaca
Median Family Size in Manchaca
The median family size in Manchaca is 3.42 persons per family, with married-couple families (441 | 86.3%) accounting for the largest median family size of 3.65 persons per family. On the other hand, single female/mother families (62 | 12.1%) represent the smallest median family size with 1.98 persons per family.
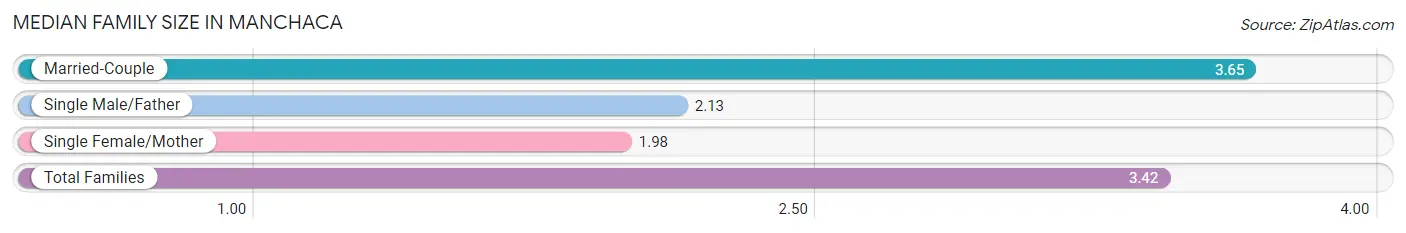
| Family Type | # Families | Family Size |
| Married-Couple | 441 (86.3%) | 3.65 |
| Single Male/Father | 8 (1.6%) | 2.13 |
| Single Female/Mother | 62 (12.1%) | 1.98 |
| Total Families | 511 (100.0%) | 3.42 |
Median Household Size in Manchaca
The median household size in Manchaca is 2.87 persons per household, with married-couple households (441 | 62.1%) accounting for the largest median household size of 3.65 persons per household. non-family households (199 | 28.0%) represent the smallest median household size with 1.42 persons per household.
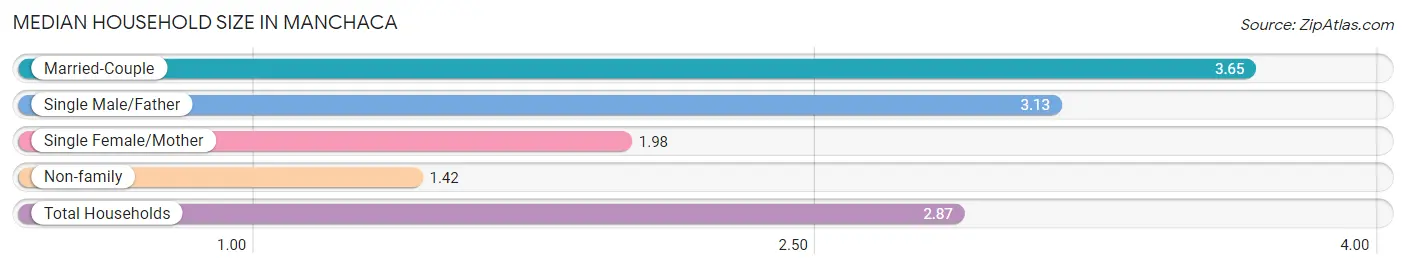
| Household Type | # Households | Household Size |
| Married-Couple | 441 (62.1%) | 3.65 |
| Single Male/Father | 8 (1.1%) | 3.13 |
| Single Female/Mother | 62 (8.7%) | 1.98 |
| Non-family | 199 (28.0%) | 1.42 |
| Total Households | 710 (100.0%) | 2.87 |
Household Size by Marriage Status in Manchaca
Out of a total of 710 households in Manchaca, 511 (72.0%) are family households, while 199 (28.0%) are nonfamily households. The most numerous type of family households are 2-person households, comprising 219, and the most common type of nonfamily households are 1-person households, comprising 155.
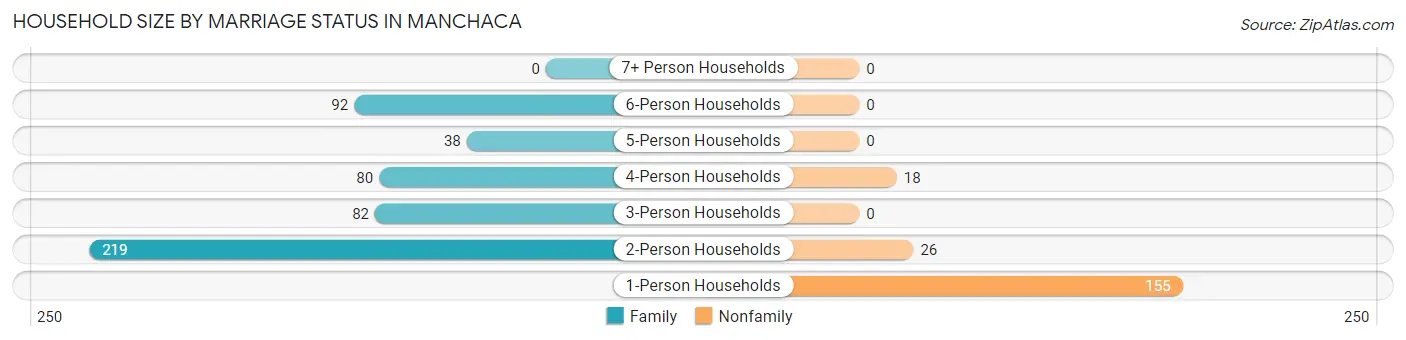
| Household Size | Family Households | Nonfamily Households |
| 1-Person Households | - | 155 (21.8%) |
| 2-Person Households | 219 (30.8%) | 26 (3.7%) |
| 3-Person Households | 82 (11.6%) | 0 (0.0%) |
| 4-Person Households | 80 (11.3%) | 18 (2.5%) |
| 5-Person Households | 38 (5.3%) | 0 (0.0%) |
| 6-Person Households | 92 (13.0%) | 0 (0.0%) |
| 7+ Person Households | 0 (0.0%) | 0 (0.0%) |
| Total | 511 (72.0%) | 199 (28.0%) |
Female Fertility in Manchaca
Fertility by Age in Manchaca
| Age Bracket | Women with Births | Births / 1,000 Women |
| 15 to 19 years | 0 (0.0%) | 0.0 |
| 20 to 34 years | 0 (0.0%) | 0.0 |
| 35 to 50 years | 0 (0.0%) | 0.0 |
| Total | 0 (0.0%) | 0.0 |
Fertility by Age by Marriage Status in Manchaca
| Age Bracket | Married | Unmarried |
| 15 to 19 years | 0 (0.0%) | 0 (0.0%) |
| 20 to 34 years | 0 (0.0%) | 0 (0.0%) |
| 35 to 50 years | 0 (0.0%) | 0 (0.0%) |
| Total | 0 (0.0%) | 0 (0.0%) |
Fertility by Education in Manchaca
| Educational Attainment | Women with Births | Births / 1,000 Women |
| Less than High School | 0 (0.0%) | 0.0 |
| High School Diploma | 0 (0.0%) | 0.0 |
| College or Associate's Degree | 0 (0.0%) | 0.0 |
| Bachelor's Degree | 0 (0.0%) | 0.0 |
| Graduate Degree | 0 (0.0%) | 0.0 |
| Total | 0 (0.0%) | 0.0 |
Fertility by Education by Marriage Status in Manchaca
| Educational Attainment | Married | Unmarried |
| Less than High School | 0 (0.0%) | 0 (0.0%) |
| High School Diploma | 0 (0.0%) | 0 (0.0%) |
| College or Associate's Degree | 0 (0.0%) | 0 (0.0%) |
| Bachelor's Degree | 0 (0.0%) | 0 (0.0%) |
| Graduate Degree | 0 (0.0%) | 0 (0.0%) |
| Total | 0 (0.0%) | 0 (0.0%) |
Employment Characteristics in Manchaca
Employment by Class of Employer in Manchaca
Among the 1,130 employed individuals in Manchaca, private company employees (726 | 64.2%), self-employed (not incorporated) (162 | 14.3%), and local government employees (93 | 8.2%) make up the most common classes of employment.
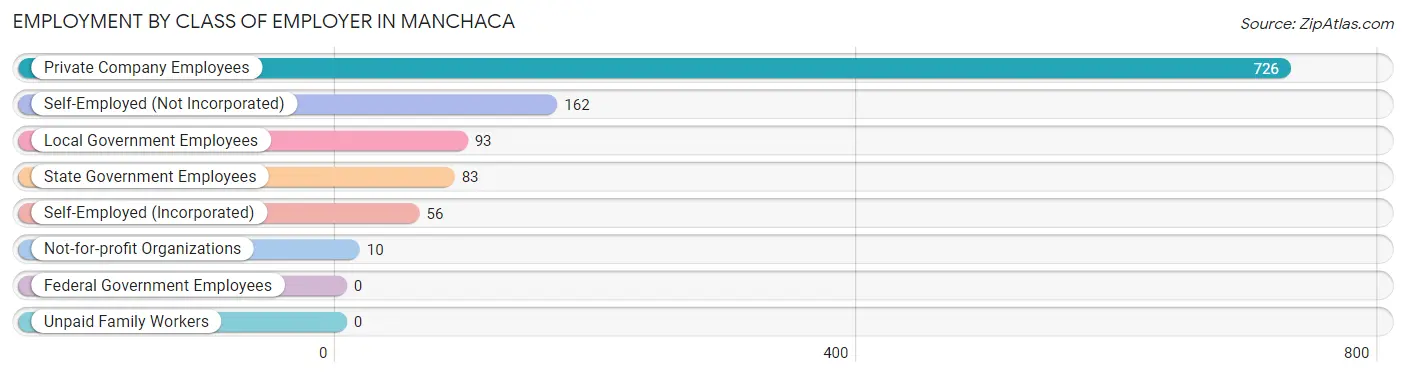
| Employer Class | # Employees | % Employees |
| Private Company Employees | 726 | 64.2% |
| Self-Employed (Incorporated) | 56 | 5.0% |
| Self-Employed (Not Incorporated) | 162 | 14.3% |
| Not-for-profit Organizations | 10 | 0.9% |
| Local Government Employees | 93 | 8.2% |
| State Government Employees | 83 | 7.3% |
| Federal Government Employees | 0 | 0.0% |
| Unpaid Family Workers | 0 | 0.0% |
| Total | 1,130 | 100.0% |
Employment Status by Age in Manchaca
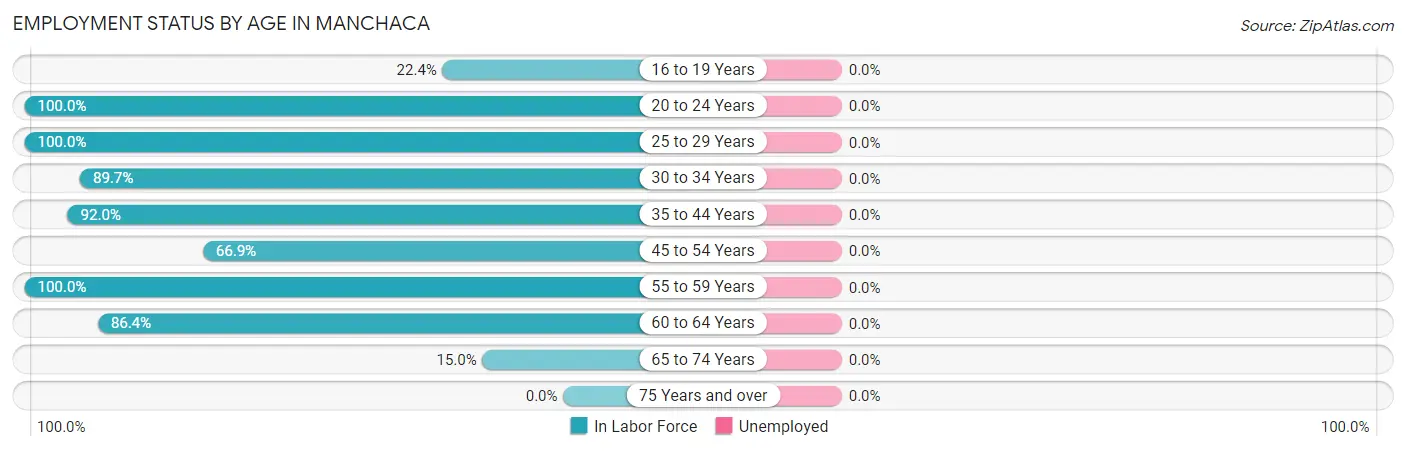
| Age Bracket | In Labor Force | Unemployed |
| 16 to 19 Years | 28 (22.4%) | 0 (0.0%) |
| 20 to 24 Years | 66 (100.0%) | 0 (0.0%) |
| 25 to 29 Years | 51 (100.0%) | 0 (0.0%) |
| 30 to 34 Years | 288 (89.7%) | 0 (0.0%) |
| 35 to 44 Years | 344 (92.0%) | 0 (0.0%) |
| 45 to 54 Years | 218 (66.9%) | 0 (0.0%) |
| 55 to 59 Years | 86 (100.0%) | 0 (0.0%) |
| 60 to 64 Years | 76 (86.4%) | 0 (0.0%) |
| 65 to 74 Years | 19 (15.0%) | 0 (0.0%) |
| 75 Years and over | 0 (0.0%) | 0 (0.0%) |
| Total | 1,177 (73.0%) | 0 (0.0%) |
Employment Status by Educational Attainment in Manchaca
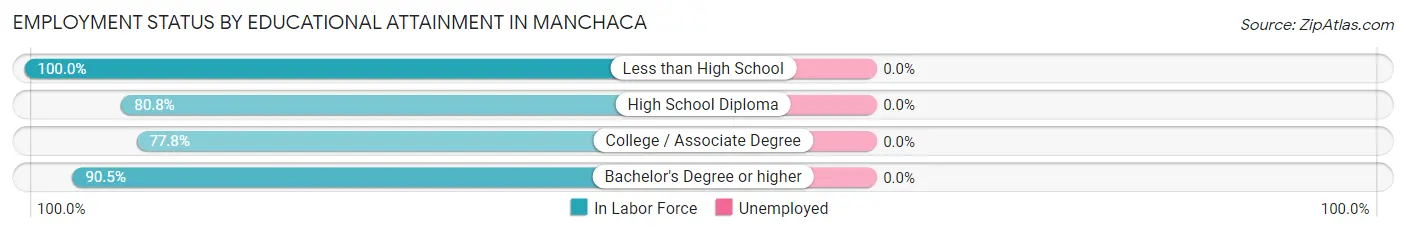
| Educational Attainment | In Labor Force | Unemployed |
| Less than High School | 141 (100.0%) | 0 (0.0%) |
| High School Diploma | 126 (80.8%) | 0 (0.0%) |
| College / Associate Degree | 385 (77.8%) | 0 (0.0%) |
| Bachelor's Degree or higher | 411 (90.5%) | 0 (0.0%) |
| Total | 1,063 (85.3%) | 0 (0.0%) |
Employment Occupations by Sex in Manchaca
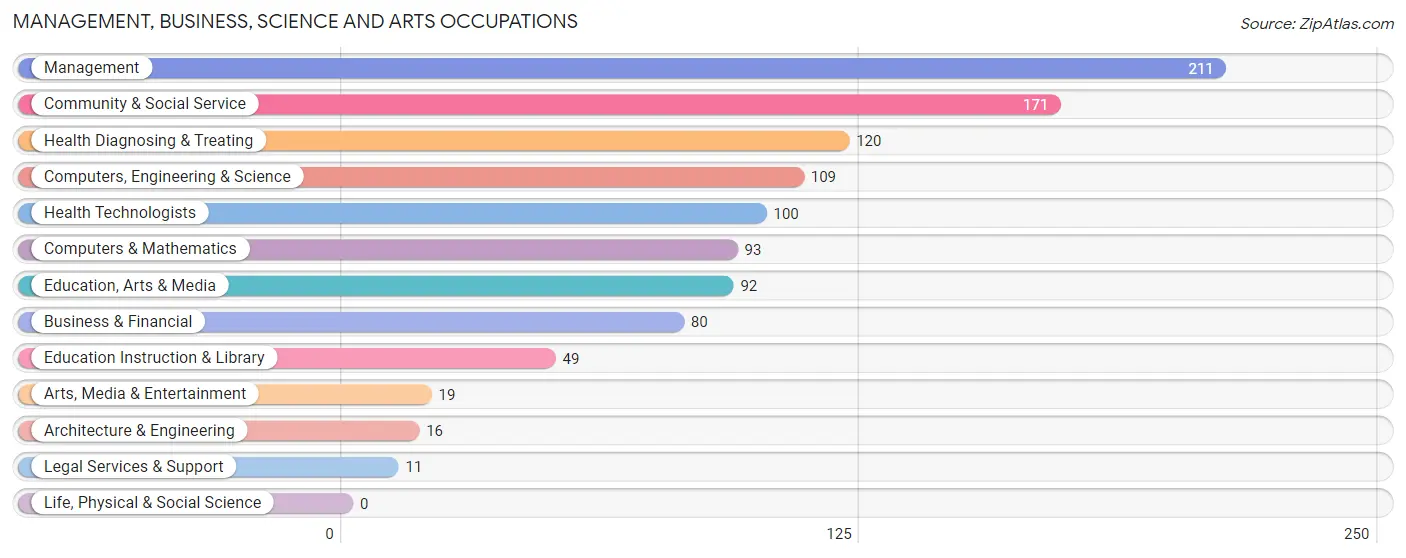
Management, Business, Science and Arts Occupations
The most common Management, Business, Science and Arts occupations in Manchaca are Management (211 | 17.9%), Community & Social Service (171 | 14.5%), Health Diagnosing & Treating (120 | 10.2%), Computers, Engineering & Science (109 | 9.3%), and Health Technologists (100 | 8.5%).
Management, Business, Science and Arts Occupations by Sex
Within the Management, Business, Science and Arts occupations in Manchaca, the most male-oriented occupations are Architecture & Engineering (100.0%), Education, Arts & Media (100.0%), and Legal Services & Support (100.0%), while the most female-oriented occupations are Business & Financial (82.5%), Health Diagnosing & Treating (74.2%), and Health Technologists (69.0%).
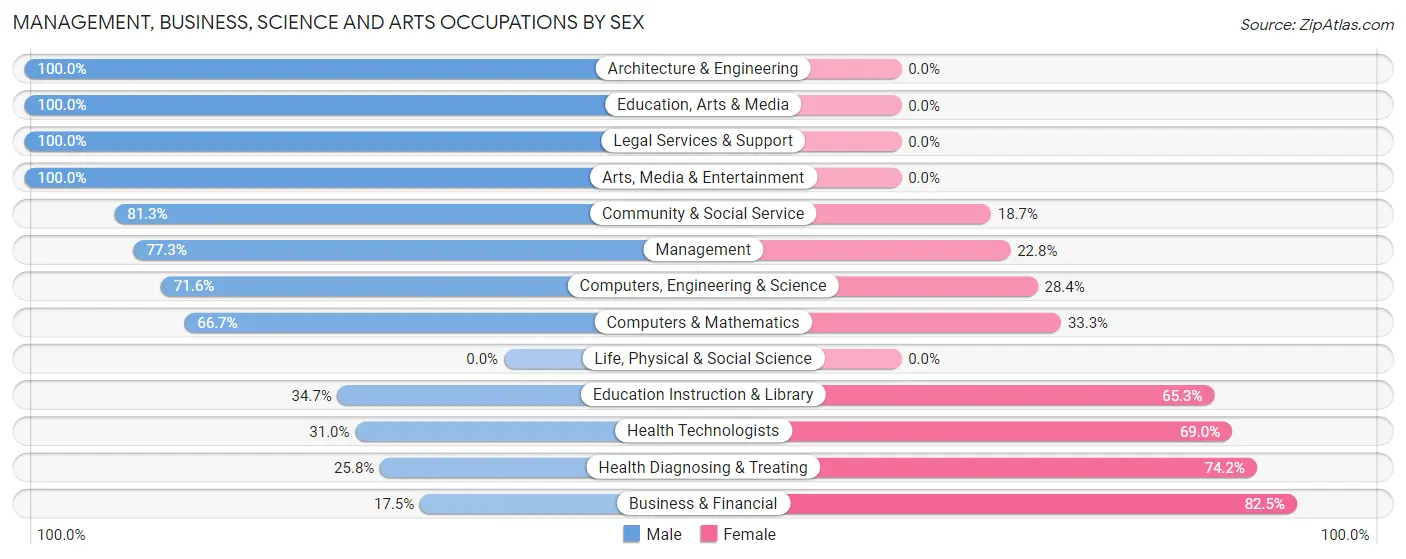
| Occupation | Male | Female |
| Management | 163 (77.2%) | 48 (22.8%) |
| Business & Financial | 14 (17.5%) | 66 (82.5%) |
| Computers, Engineering & Science | 78 (71.6%) | 31 (28.4%) |
| Computers & Mathematics | 62 (66.7%) | 31 (33.3%) |
| Architecture & Engineering | 16 (100.0%) | 0 (0.0%) |
| Life, Physical & Social Science | 0 (0.0%) | 0 (0.0%) |
| Community & Social Service | 139 (81.3%) | 32 (18.7%) |
| Education, Arts & Media | 92 (100.0%) | 0 (0.0%) |
| Legal Services & Support | 11 (100.0%) | 0 (0.0%) |
| Education Instruction & Library | 17 (34.7%) | 32 (65.3%) |
| Arts, Media & Entertainment | 19 (100.0%) | 0 (0.0%) |
| Health Diagnosing & Treating | 31 (25.8%) | 89 (74.2%) |
| Health Technologists | 31 (31.0%) | 69 (69.0%) |
| Total (Category) | 425 (61.5%) | 266 (38.5%) |
| Total (Overall) | 627 (53.3%) | 549 (46.7%) |
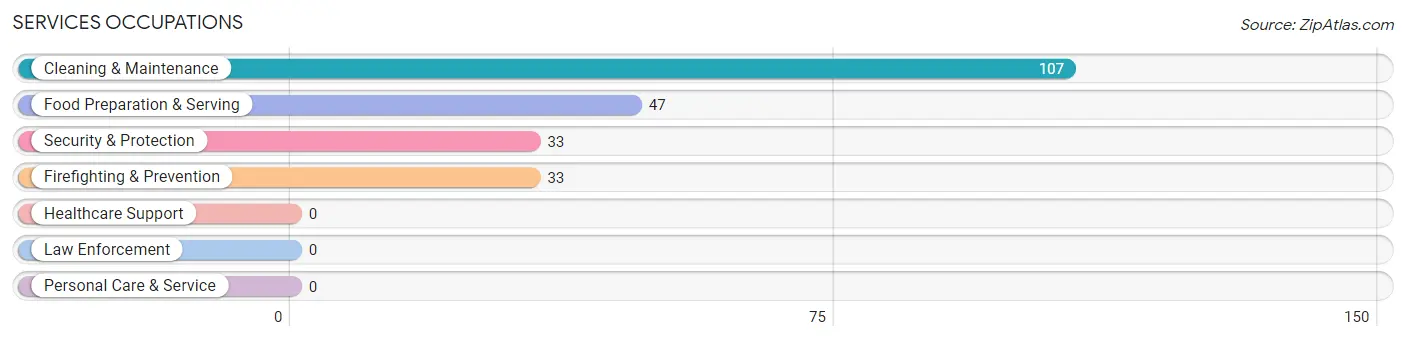
Services Occupations
The most common Services occupations in Manchaca are Cleaning & Maintenance (107 | 9.1%), Food Preparation & Serving (47 | 4.0%), Security & Protection (33 | 2.8%), and Firefighting & Prevention (33 | 2.8%).
Services Occupations by Sex
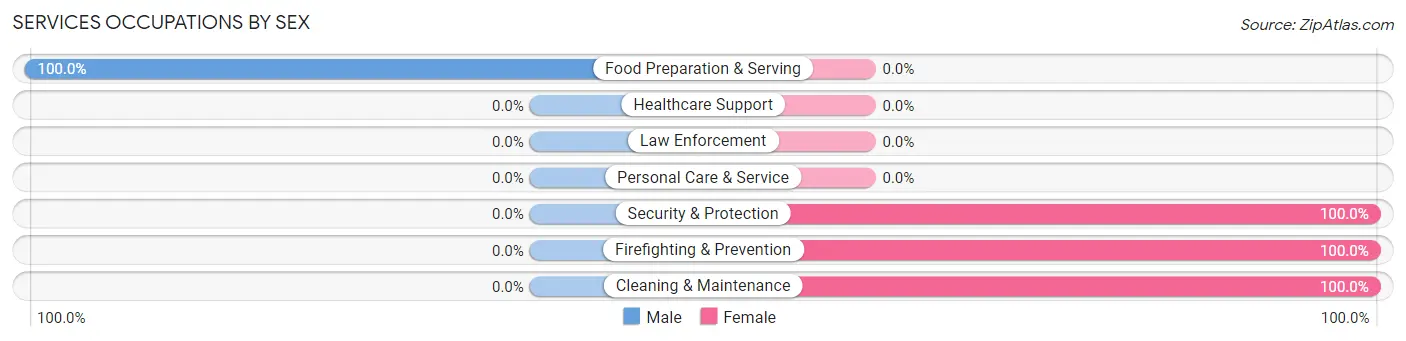
| Occupation | Male | Female |
| Healthcare Support | 0 (0.0%) | 0 (0.0%) |
| Security & Protection | 0 (0.0%) | 33 (100.0%) |
| Firefighting & Prevention | 0 (0.0%) | 33 (100.0%) |
| Law Enforcement | 0 (0.0%) | 0 (0.0%) |
| Food Preparation & Serving | 47 (100.0%) | 0 (0.0%) |
| Cleaning & Maintenance | 0 (0.0%) | 107 (100.0%) |
| Personal Care & Service | 0 (0.0%) | 0 (0.0%) |
| Total (Category) | 47 (25.1%) | 140 (74.9%) |
| Total (Overall) | 627 (53.3%) | 549 (46.7%) |
Sales and Office Occupations
The most common Sales and Office occupations in Manchaca are Office & Administration (90 | 7.6%), and Sales & Related (62 | 5.3%).

Sales and Office Occupations by Sex
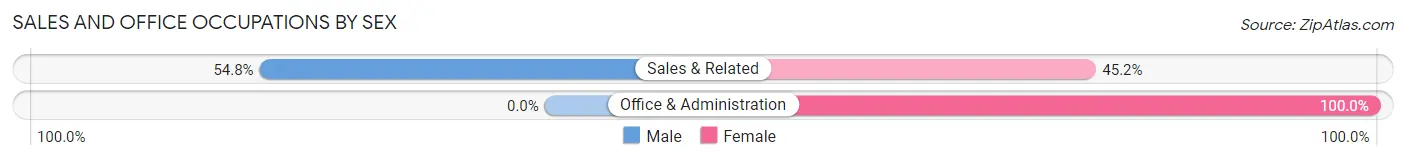
| Occupation | Male | Female |
| Sales & Related | 34 (54.8%) | 28 (45.2%) |
| Office & Administration | 0 (0.0%) | 90 (100.0%) |
| Total (Category) | 34 (22.4%) | 118 (77.6%) |
| Total (Overall) | 627 (53.3%) | 549 (46.7%) |
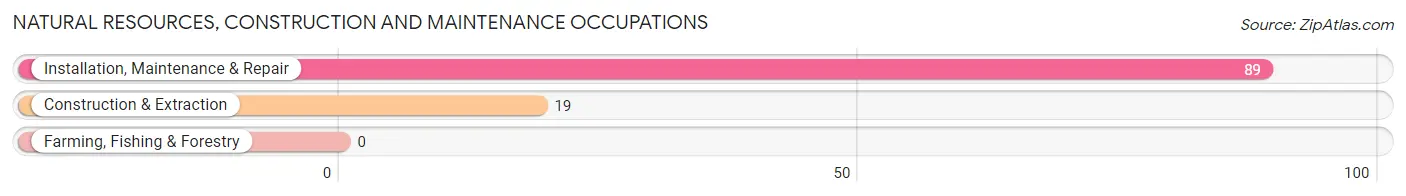
Natural Resources, Construction and Maintenance Occupations
The most common Natural Resources, Construction and Maintenance occupations in Manchaca are Installation, Maintenance & Repair (89 | 7.6%), and Construction & Extraction (19 | 1.6%).
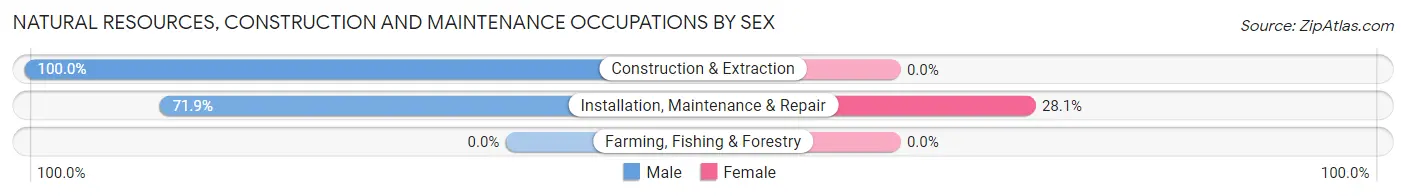
Natural Resources, Construction and Maintenance Occupations by Sex
| Occupation | Male | Female |
| Farming, Fishing & Forestry | 0 (0.0%) | 0 (0.0%) |
| Construction & Extraction | 19 (100.0%) | 0 (0.0%) |
| Installation, Maintenance & Repair | 64 (71.9%) | 25 (28.1%) |
| Total (Category) | 83 (76.8%) | 25 (23.2%) |
| Total (Overall) | 627 (53.3%) | 549 (46.7%) |
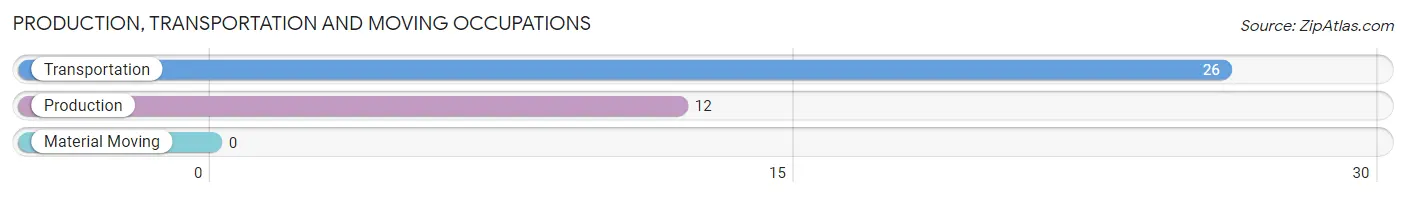
Production, Transportation and Moving Occupations
The most common Production, Transportation and Moving occupations in Manchaca are Transportation (26 | 2.2%), and Production (12 | 1.0%).
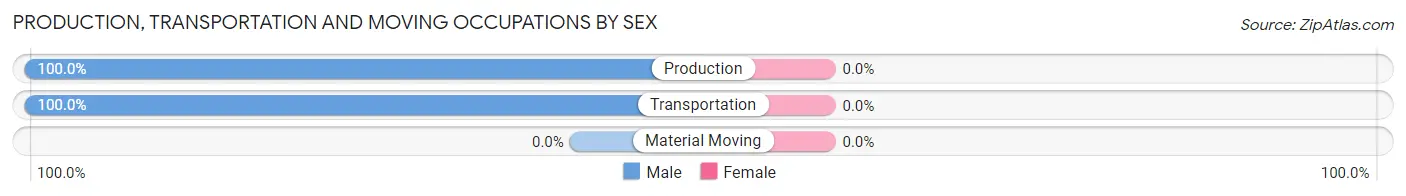
Production, Transportation and Moving Occupations by Sex
| Occupation | Male | Female |
| Production | 12 (100.0%) | 0 (0.0%) |
| Transportation | 26 (100.0%) | 0 (0.0%) |
| Material Moving | 0 (0.0%) | 0 (0.0%) |
| Total (Category) | 38 (100.0%) | 0 (0.0%) |
| Total (Overall) | 627 (53.3%) | 549 (46.7%) |
Employment Industries by Sex in Manchaca
Employment Industries in Manchaca
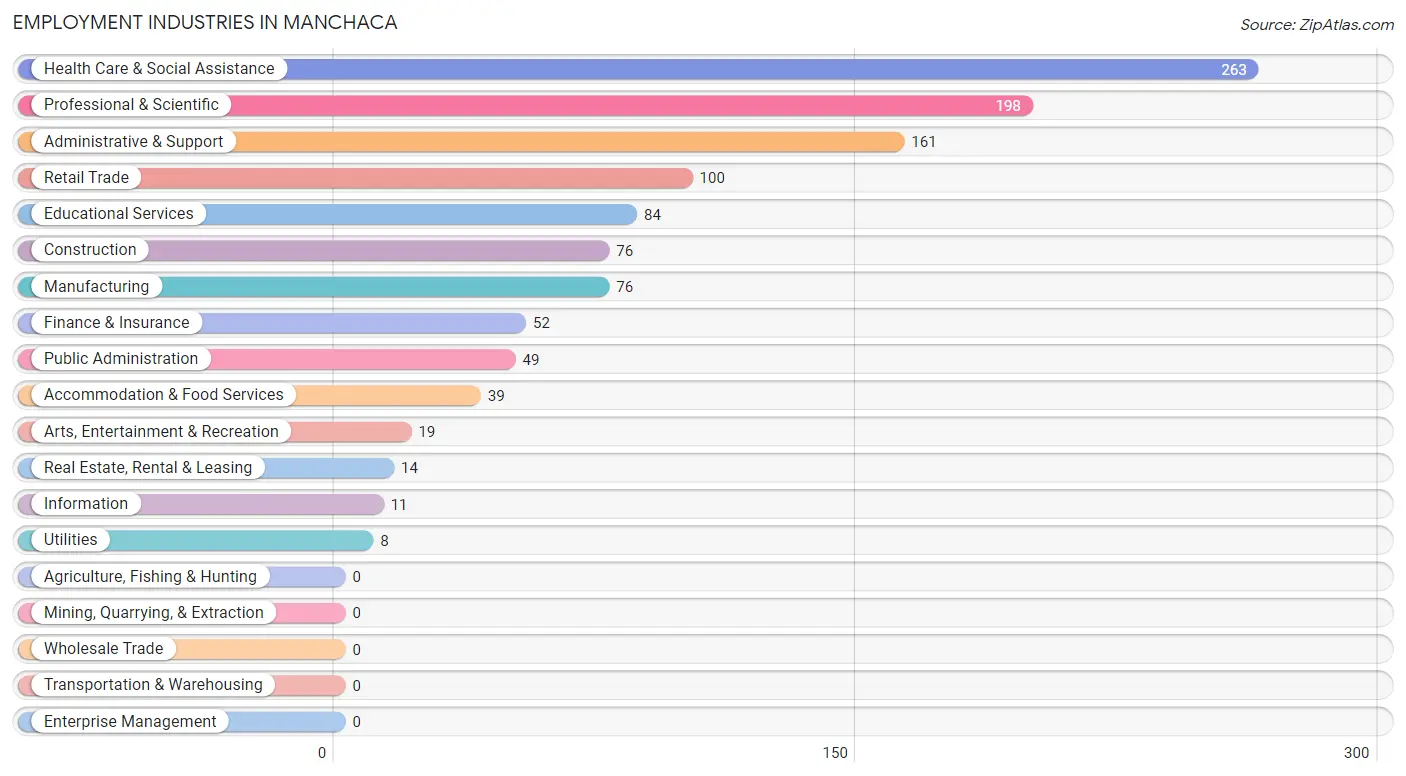
The major employment industries in Manchaca include Health Care & Social Assistance (263 | 22.4%), Professional & Scientific (198 | 16.8%), Administrative & Support (161 | 13.7%), Retail Trade (100 | 8.5%), and Educational Services (84 | 7.1%).
Employment Industries by Sex in Manchaca
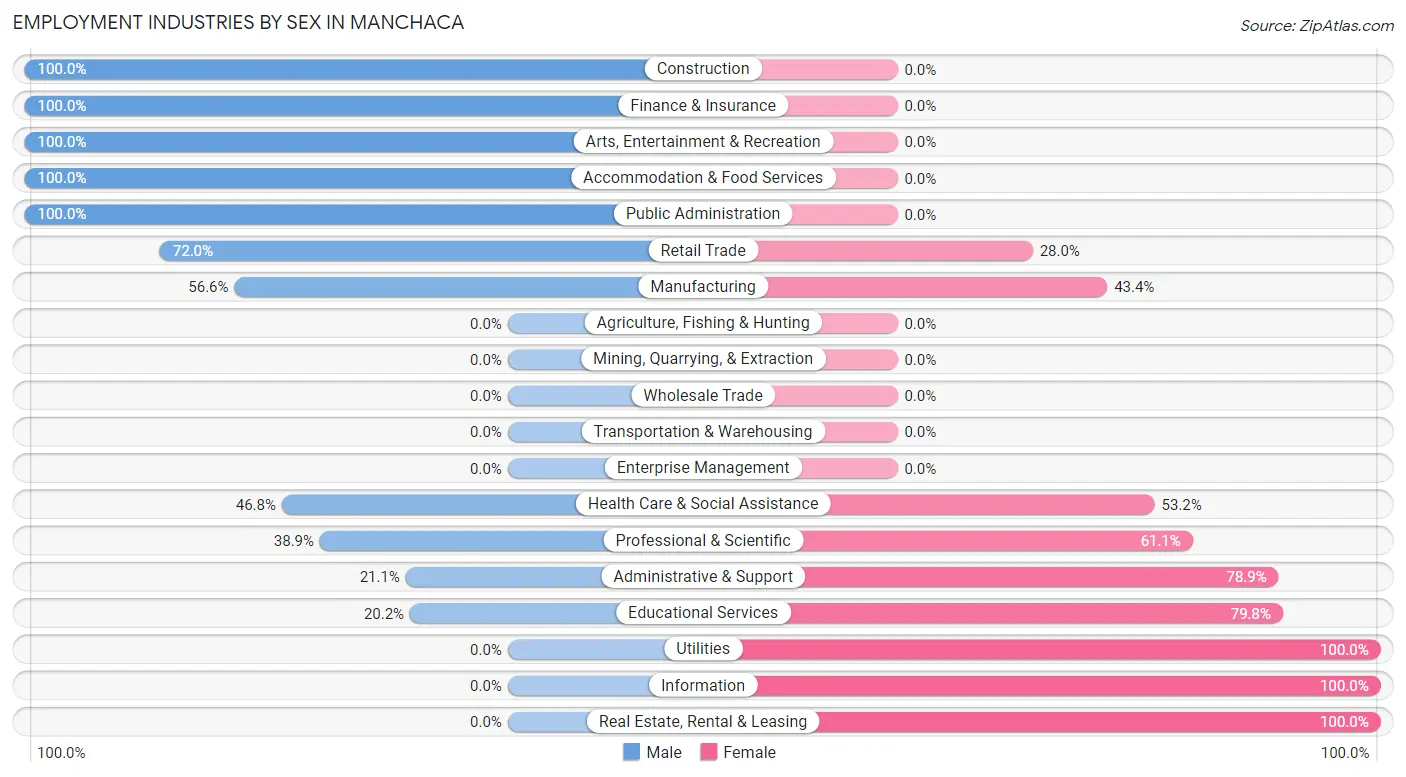
The Manchaca industries that see more men than women are Construction (100.0%), Finance & Insurance (100.0%), and Arts, Entertainment & Recreation (100.0%), whereas the industries that tend to have a higher number of women are Utilities (100.0%), Information (100.0%), and Real Estate, Rental & Leasing (100.0%).
| Industry | Male | Female |
| Agriculture, Fishing & Hunting | 0 (0.0%) | 0 (0.0%) |
| Mining, Quarrying, & Extraction | 0 (0.0%) | 0 (0.0%) |
| Construction | 76 (100.0%) | 0 (0.0%) |
| Manufacturing | 43 (56.6%) | 33 (43.4%) |
| Wholesale Trade | 0 (0.0%) | 0 (0.0%) |
| Retail Trade | 72 (72.0%) | 28 (28.0%) |
| Transportation & Warehousing | 0 (0.0%) | 0 (0.0%) |
| Utilities | 0 (0.0%) | 8 (100.0%) |
| Information | 0 (0.0%) | 11 (100.0%) |
| Finance & Insurance | 52 (100.0%) | 0 (0.0%) |
| Real Estate, Rental & Leasing | 0 (0.0%) | 14 (100.0%) |
| Professional & Scientific | 77 (38.9%) | 121 (61.1%) |
| Enterprise Management | 0 (0.0%) | 0 (0.0%) |
| Administrative & Support | 34 (21.1%) | 127 (78.9%) |
| Educational Services | 17 (20.2%) | 67 (79.8%) |
| Health Care & Social Assistance | 123 (46.8%) | 140 (53.2%) |
| Arts, Entertainment & Recreation | 19 (100.0%) | 0 (0.0%) |
| Accommodation & Food Services | 39 (100.0%) | 0 (0.0%) |
| Public Administration | 49 (100.0%) | 0 (0.0%) |
| Total | 627 (53.3%) | 549 (46.7%) |
Education in Manchaca
School Enrollment in Manchaca
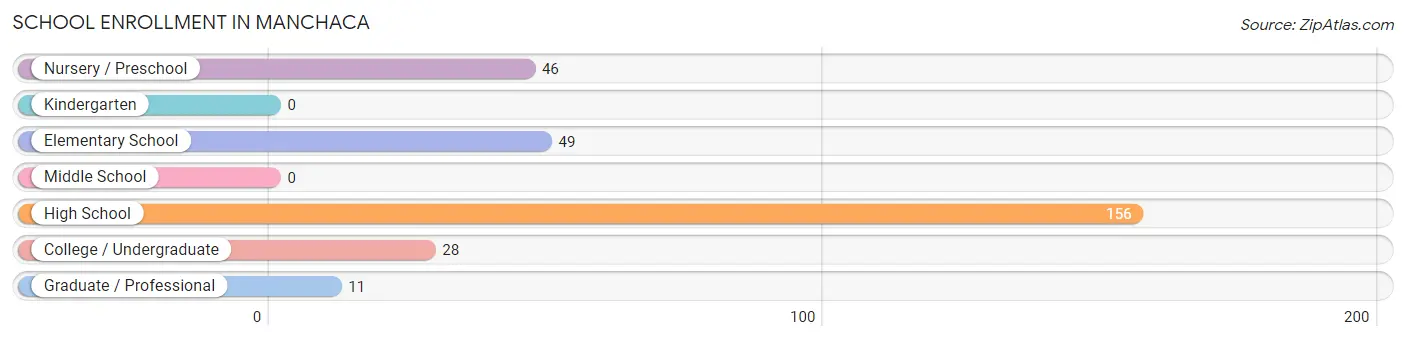
The most common levels of schooling among the 290 students in Manchaca are high school (156 | 53.8%), elementary school (49 | 16.9%), and nursery / preschool (46 | 15.9%).
| School Level | # Students | % Students |
| Nursery / Preschool | 46 | 15.9% |
| Kindergarten | 0 | 0.0% |
| Elementary School | 49 | 16.9% |
| Middle School | 0 | 0.0% |
| High School | 156 | 53.8% |
| College / Undergraduate | 28 | 9.7% |
| Graduate / Professional | 11 | 3.8% |
| Total | 290 | 100.0% |
School Enrollment by Age by Funding Source in Manchaca
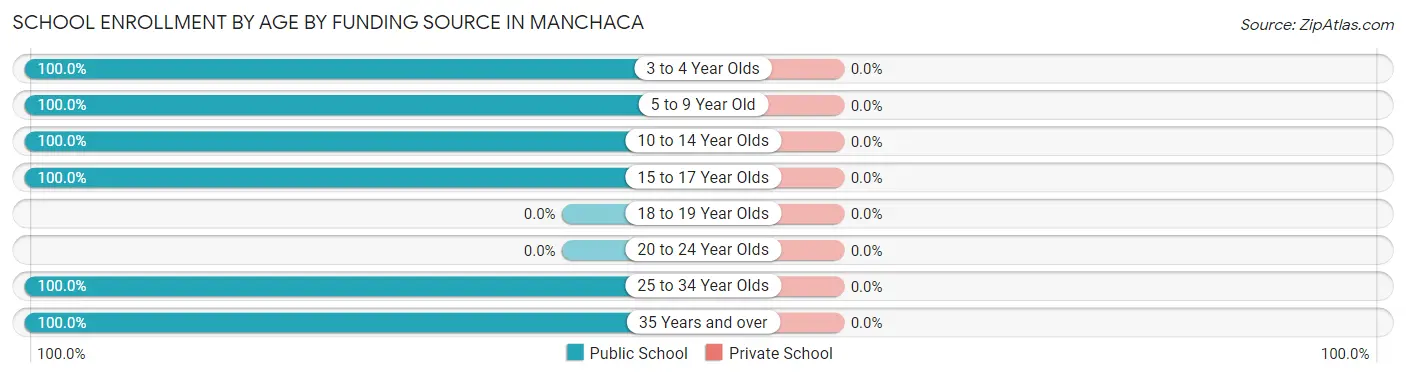
| Age Bracket | Public School | Private School |
| 3 to 4 Year Olds | 46 (100.0%) | 0 (0.0%) |
| 5 to 9 Year Old | 49 (100.0%) | 0 (0.0%) |
| 10 to 14 Year Olds | 31 (100.0%) | 0 (0.0%) |
| 15 to 17 Year Olds | 125 (100.0%) | 0 (0.0%) |
| 18 to 19 Year Olds | 0 (0.0%) | 0 (0.0%) |
| 20 to 24 Year Olds | 0 (0.0%) | 0 (0.0%) |
| 25 to 34 Year Olds | 11 (100.0%) | 0 (0.0%) |
| 35 Years and over | 28 (100.0%) | 0 (0.0%) |
| Total | 290 (100.0%) | 0 (0.0%) |
Educational Attainment by Field of Study in Manchaca
Literature & languages (102 | 20.9%), science & technology (73 | 15.0%), business (66 | 13.6%), education (66 | 13.6%), and social sciences (45 | 9.2%) are the most common fields of study among 487 individuals in Manchaca who have obtained a bachelor's degree or higher.
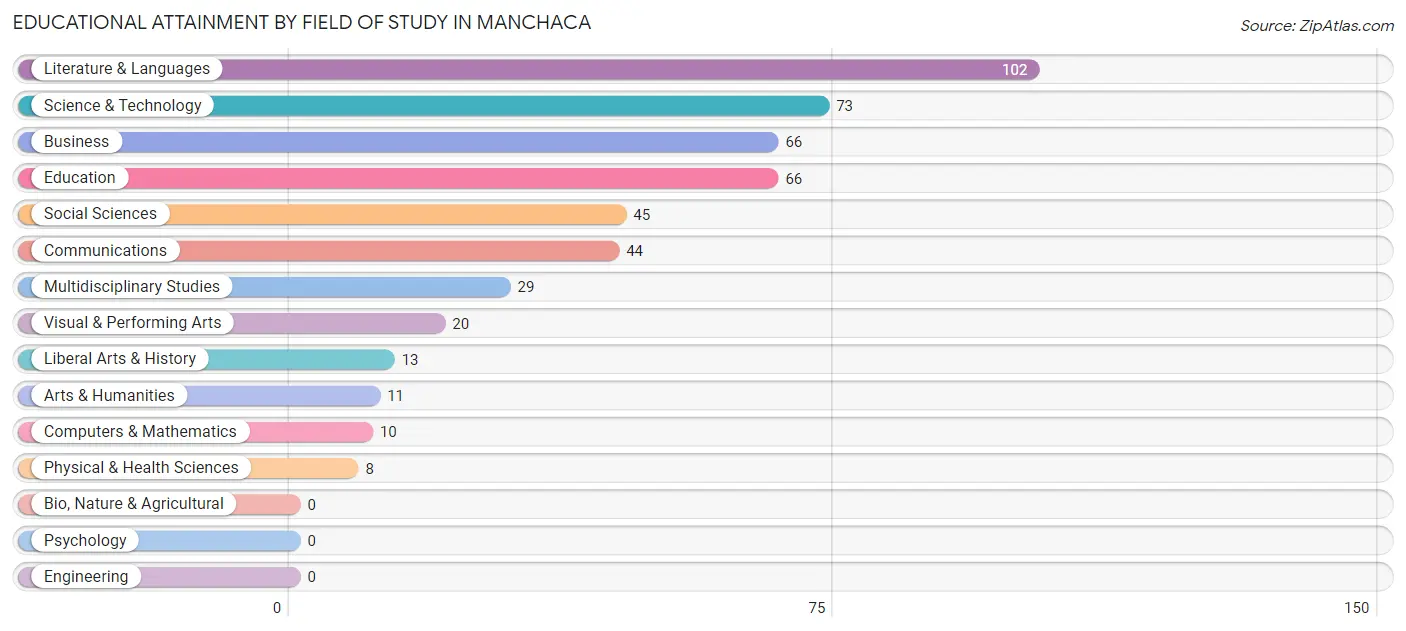
| Field of Study | # Graduates | % Graduates |
| Computers & Mathematics | 10 | 2.1% |
| Bio, Nature & Agricultural | 0 | 0.0% |
| Physical & Health Sciences | 8 | 1.6% |
| Psychology | 0 | 0.0% |
| Social Sciences | 45 | 9.2% |
| Engineering | 0 | 0.0% |
| Multidisciplinary Studies | 29 | 5.9% |
| Science & Technology | 73 | 15.0% |
| Business | 66 | 13.6% |
| Education | 66 | 13.6% |
| Literature & Languages | 102 | 20.9% |
| Liberal Arts & History | 13 | 2.7% |
| Visual & Performing Arts | 20 | 4.1% |
| Communications | 44 | 9.0% |
| Arts & Humanities | 11 | 2.3% |
| Total | 487 | 100.0% |
Transportation & Commute in Manchaca
Vehicle Availability by Sex in Manchaca
The most prevalent vehicle ownership categories in Manchaca are males with 2 vehicles (377, accounting for 64.0%) and females with 2 vehicles (408, making up 69.7%).
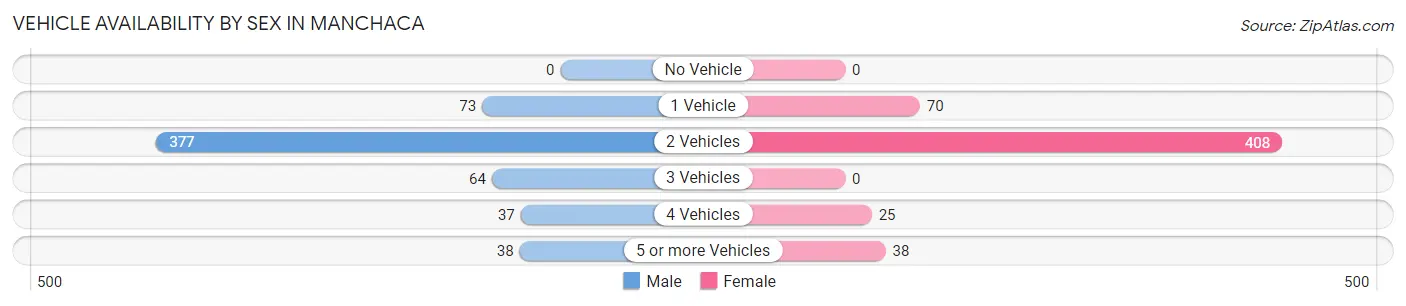
| Vehicles Available | Male | Female |
| No Vehicle | 0 (0.0%) | 0 (0.0%) |
| 1 Vehicle | 73 (12.4%) | 70 (12.9%) |
| 2 Vehicles | 377 (64.0%) | 408 (75.4%) |
| 3 Vehicles | 64 (10.9%) | 0 (0.0%) |
| 4 Vehicles | 37 (6.3%) | 25 (4.6%) |
| 5 or more Vehicles | 38 (6.5%) | 38 (7.0%) |
| Total | 589 (100.0%) | 541 (100.0%) |
Commute Time in Manchaca
The most frequently occuring commute durations in Manchaca are 20 to 24 minutes (207 commuters, 24.2%), 60 to 89 minutes (155 commuters, 18.1%), and 30 to 34 minutes (144 commuters, 16.9%).
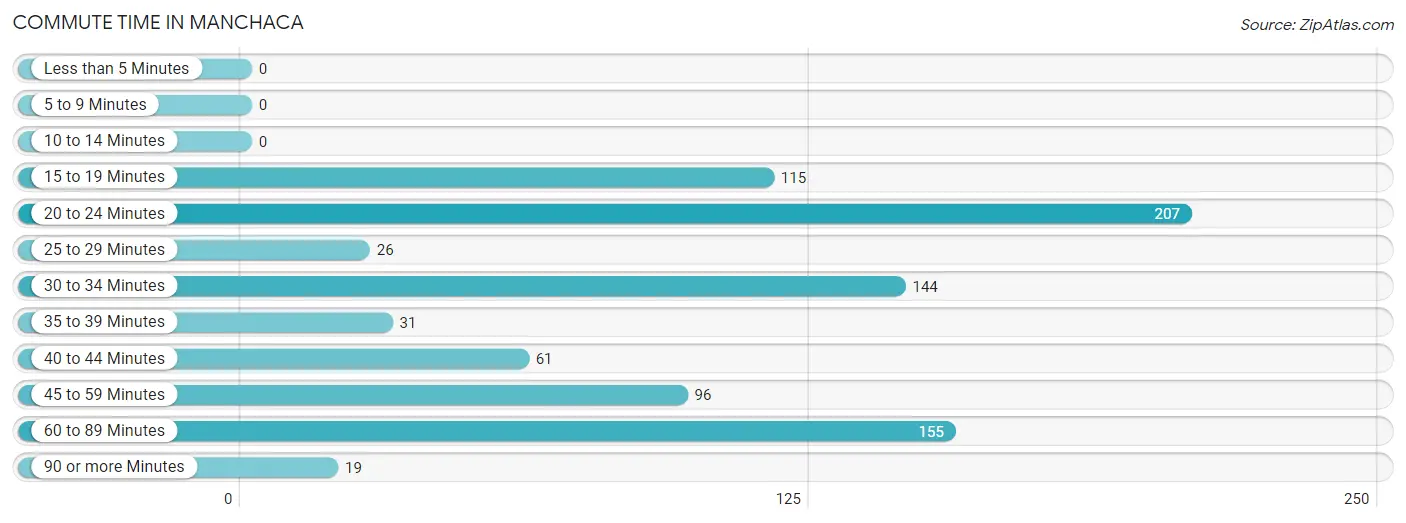
| Commute Time | # Commuters | % Commuters |
| Less than 5 Minutes | 0 | 0.0% |
| 5 to 9 Minutes | 0 | 0.0% |
| 10 to 14 Minutes | 0 | 0.0% |
| 15 to 19 Minutes | 115 | 13.5% |
| 20 to 24 Minutes | 207 | 24.2% |
| 25 to 29 Minutes | 26 | 3.0% |
| 30 to 34 Minutes | 144 | 16.9% |
| 35 to 39 Minutes | 31 | 3.6% |
| 40 to 44 Minutes | 61 | 7.1% |
| 45 to 59 Minutes | 96 | 11.2% |
| 60 to 89 Minutes | 155 | 18.1% |
| 90 or more Minutes | 19 | 2.2% |
Commute Time by Sex in Manchaca
The most common commute times in Manchaca are 30 to 34 minutes (126 commuters, 29.1%) for males and 20 to 24 minutes (135 commuters, 32.1%) for females.
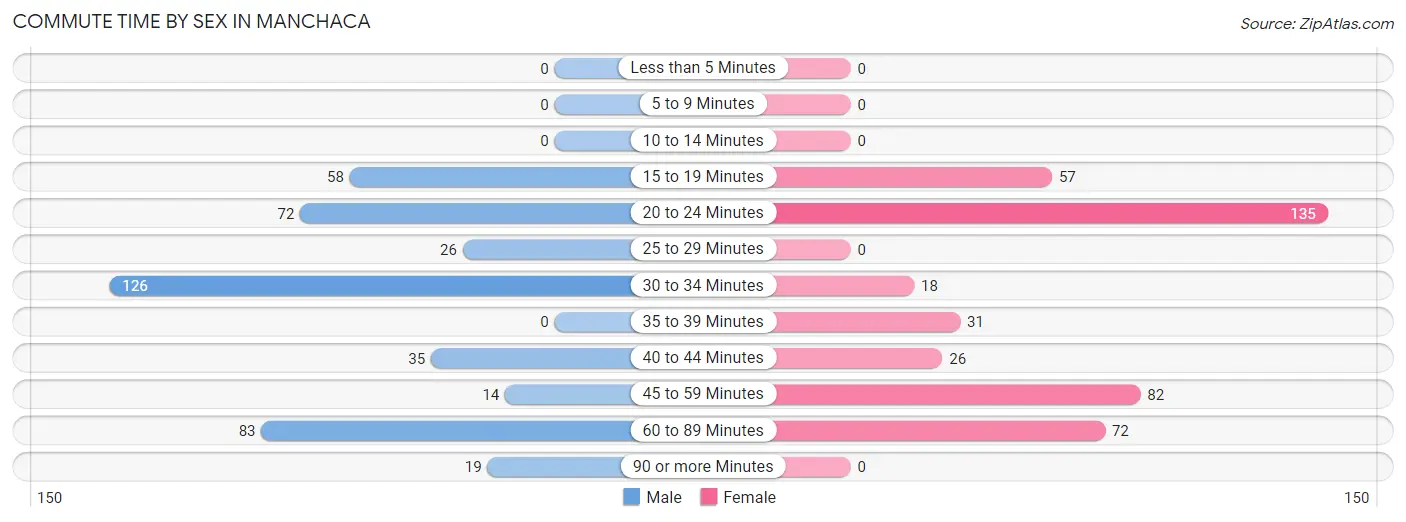
| Commute Time | Male | Female |
| Less than 5 Minutes | 0 (0.0%) | 0 (0.0%) |
| 5 to 9 Minutes | 0 (0.0%) | 0 (0.0%) |
| 10 to 14 Minutes | 0 (0.0%) | 0 (0.0%) |
| 15 to 19 Minutes | 58 (13.4%) | 57 (13.5%) |
| 20 to 24 Minutes | 72 (16.6%) | 135 (32.1%) |
| 25 to 29 Minutes | 26 (6.0%) | 0 (0.0%) |
| 30 to 34 Minutes | 126 (29.1%) | 18 (4.3%) |
| 35 to 39 Minutes | 0 (0.0%) | 31 (7.4%) |
| 40 to 44 Minutes | 35 (8.1%) | 26 (6.2%) |
| 45 to 59 Minutes | 14 (3.2%) | 82 (19.5%) |
| 60 to 89 Minutes | 83 (19.2%) | 72 (17.1%) |
| 90 or more Minutes | 19 (4.4%) | 0 (0.0%) |
Time of Departure to Work by Sex in Manchaca
The most frequent times of departure to work in Manchaca are 7:00 AM to 7:29 AM (117, 27.0%) for males and 7:00 AM to 7:29 AM (194, 46.1%) for females.
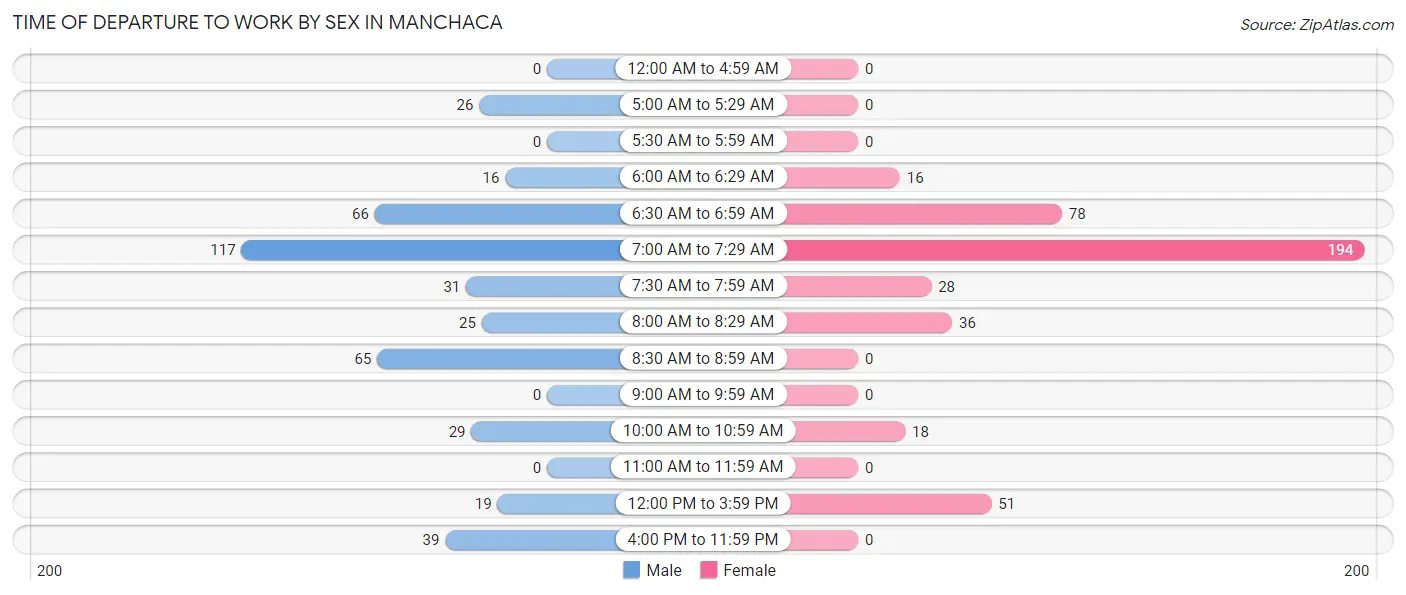
| Time of Departure | Male | Female |
| 12:00 AM to 4:59 AM | 0 (0.0%) | 0 (0.0%) |
| 5:00 AM to 5:29 AM | 26 (6.0%) | 0 (0.0%) |
| 5:30 AM to 5:59 AM | 0 (0.0%) | 0 (0.0%) |
| 6:00 AM to 6:29 AM | 16 (3.7%) | 16 (3.8%) |
| 6:30 AM to 6:59 AM | 66 (15.2%) | 78 (18.5%) |
| 7:00 AM to 7:29 AM | 117 (27.0%) | 194 (46.1%) |
| 7:30 AM to 7:59 AM | 31 (7.2%) | 28 (6.7%) |
| 8:00 AM to 8:29 AM | 25 (5.8%) | 36 (8.6%) |
| 8:30 AM to 8:59 AM | 65 (15.0%) | 0 (0.0%) |
| 9:00 AM to 9:59 AM | 0 (0.0%) | 0 (0.0%) |
| 10:00 AM to 10:59 AM | 29 (6.7%) | 18 (4.3%) |
| 11:00 AM to 11:59 AM | 0 (0.0%) | 0 (0.0%) |
| 12:00 PM to 3:59 PM | 19 (4.4%) | 51 (12.1%) |
| 4:00 PM to 11:59 PM | 39 (9.0%) | 0 (0.0%) |
| Total | 433 (100.0%) | 421 (100.0%) |
Housing Occupancy in Manchaca
Occupancy by Ownership in Manchaca
Of the total 710 dwellings in Manchaca, owner-occupied units account for 542 (76.3%), while renter-occupied units make up 168 (23.7%).
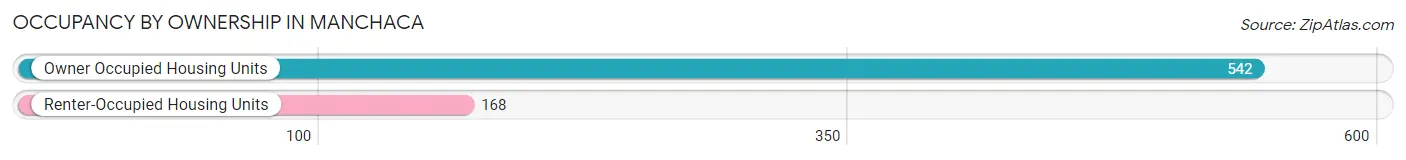
| Occupancy | # Housing Units | % Housing Units |
| Owner Occupied Housing Units | 542 | 76.3% |
| Renter-Occupied Housing Units | 168 | 23.7% |
| Total Occupied Housing Units | 710 | 100.0% |
Occupancy by Household Size in Manchaca
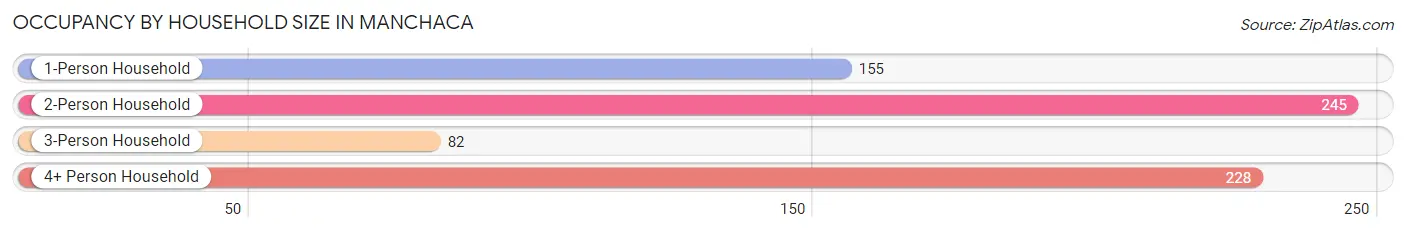
| Household Size | # Housing Units | % Housing Units |
| 1-Person Household | 155 | 21.8% |
| 2-Person Household | 245 | 34.5% |
| 3-Person Household | 82 | 11.6% |
| 4+ Person Household | 228 | 32.1% |
| Total Housing Units | 710 | 100.0% |
Occupancy by Ownership by Household Size in Manchaca
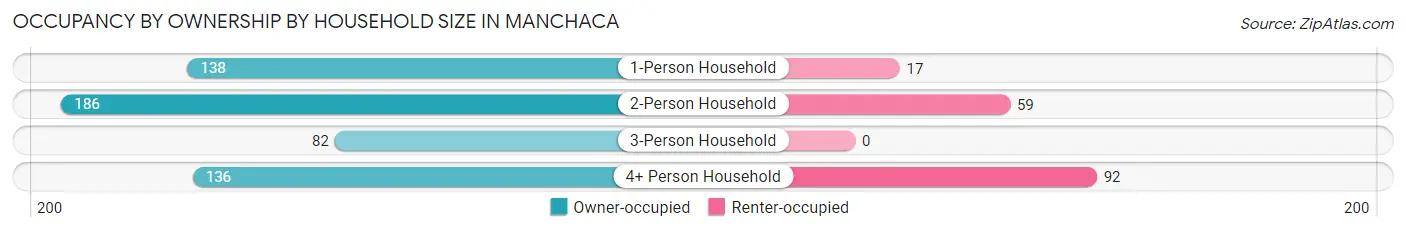
| Household Size | Owner-occupied | Renter-occupied |
| 1-Person Household | 138 (89.0%) | 17 (11.0%) |
| 2-Person Household | 186 (75.9%) | 59 (24.1%) |
| 3-Person Household | 82 (100.0%) | 0 (0.0%) |
| 4+ Person Household | 136 (59.7%) | 92 (40.4%) |
| Total Housing Units | 542 (76.3%) | 168 (23.7%) |
Occupancy by Educational Attainment in Manchaca
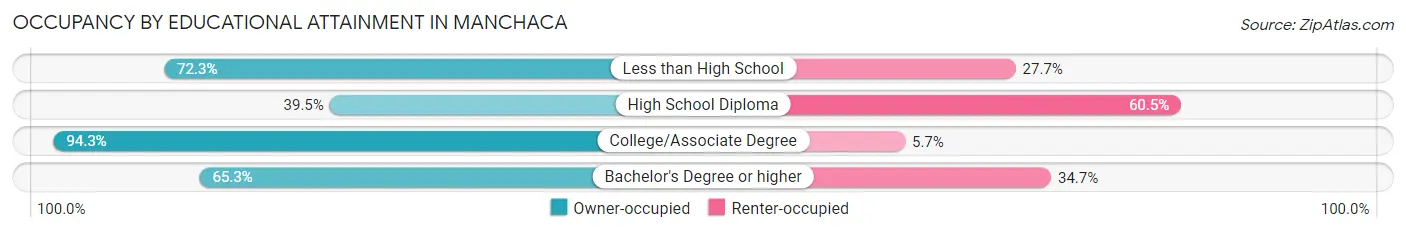
| Household Size | Owner-occupied | Renter-occupied |
| Less than High School | 34 (72.3%) | 13 (27.7%) |
| High School Diploma | 17 (39.5%) | 26 (60.5%) |
| College/Associate Degree | 280 (94.3%) | 17 (5.7%) |
| Bachelor's Degree or higher | 211 (65.3%) | 112 (34.7%) |
Occupancy by Age of Householder in Manchaca
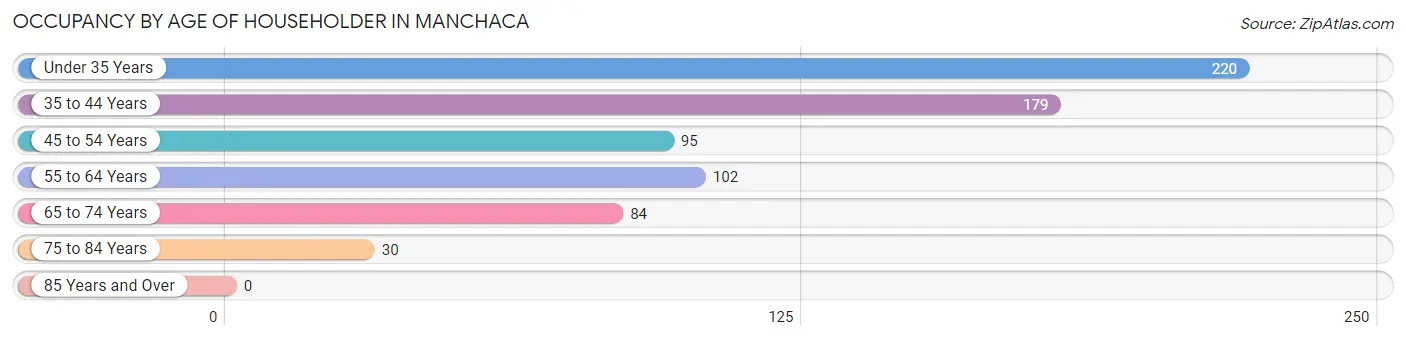
| Age Bracket | # Households | % Households |
| Under 35 Years | 220 | 31.0% |
| 35 to 44 Years | 179 | 25.2% |
| 45 to 54 Years | 95 | 13.4% |
| 55 to 64 Years | 102 | 14.4% |
| 65 to 74 Years | 84 | 11.8% |
| 75 to 84 Years | 30 | 4.2% |
| 85 Years and Over | 0 | 0.0% |
| Total | 710 | 100.0% |
Housing Finances in Manchaca
Median Income by Occupancy in Manchaca
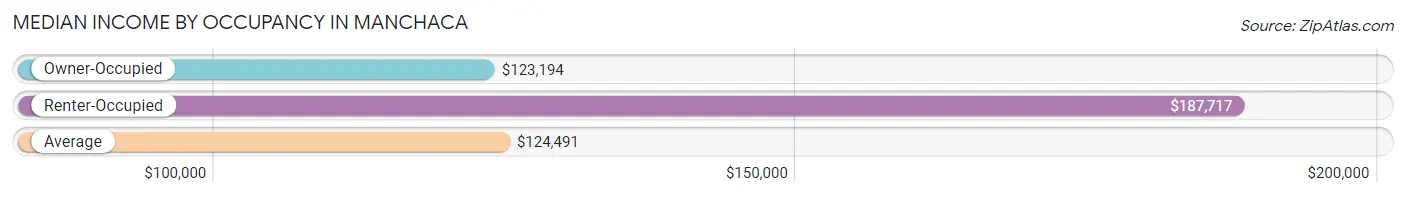
| Occupancy Type | # Households | Median Income |
| Owner-Occupied | 542 (76.3%) | $123,194 |
| Renter-Occupied | 168 (23.7%) | $187,717 |
| Average | 710 (100.0%) | $124,491 |
Occupancy by Householder Income Bracket in Manchaca
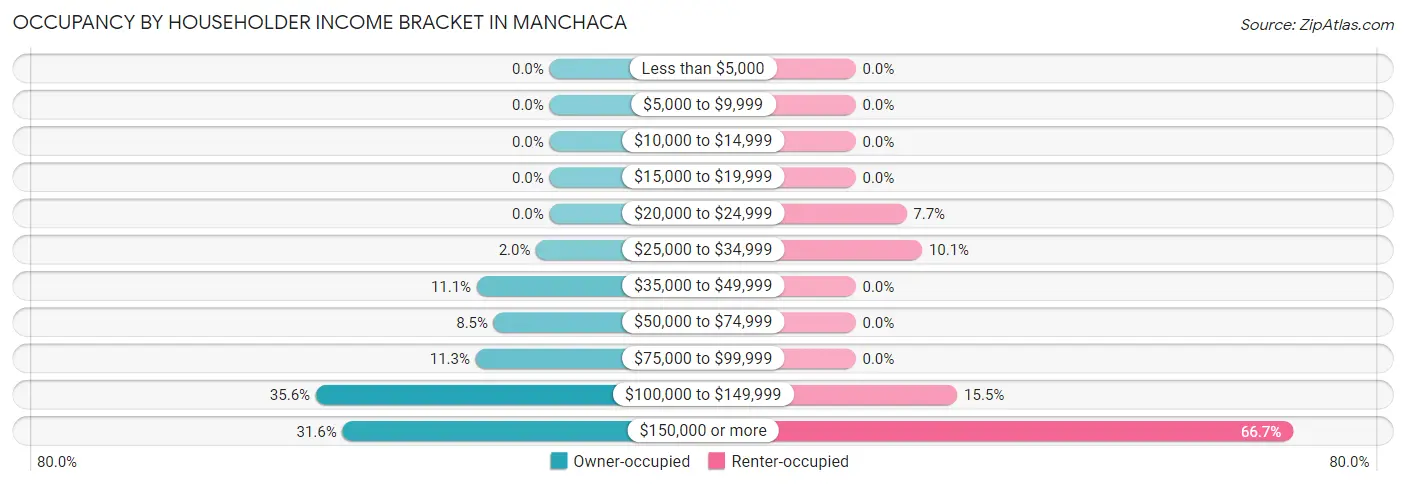
| Income Bracket | Owner-occupied | Renter-occupied |
| Less than $5,000 | 0 (0.0%) | 0 (0.0%) |
| $5,000 to $9,999 | 0 (0.0%) | 0 (0.0%) |
| $10,000 to $14,999 | 0 (0.0%) | 0 (0.0%) |
| $15,000 to $19,999 | 0 (0.0%) | 0 (0.0%) |
| $20,000 to $24,999 | 0 (0.0%) | 13 (7.7%) |
| $25,000 to $34,999 | 11 (2.0%) | 17 (10.1%) |
| $35,000 to $49,999 | 60 (11.1%) | 0 (0.0%) |
| $50,000 to $74,999 | 46 (8.5%) | 0 (0.0%) |
| $75,000 to $99,999 | 61 (11.3%) | 0 (0.0%) |
| $100,000 to $149,999 | 193 (35.6%) | 26 (15.5%) |
| $150,000 or more | 171 (31.6%) | 112 (66.7%) |
| Total | 542 (100.0%) | 168 (100.0%) |
Monthly Housing Cost Tiers in Manchaca
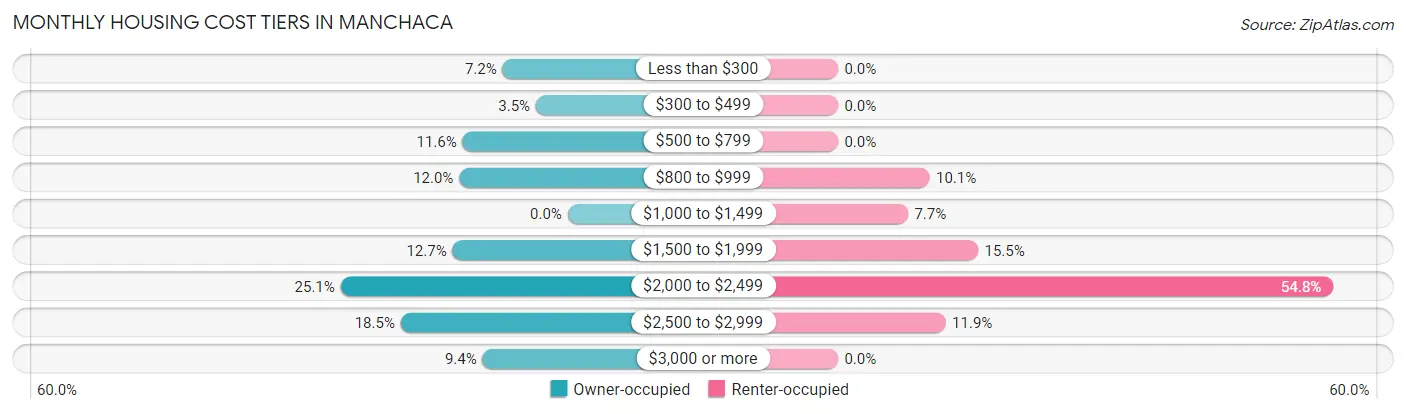
| Monthly Cost | Owner-occupied | Renter-occupied |
| Less than $300 | 39 (7.2%) | 0 (0.0%) |
| $300 to $499 | 19 (3.5%) | 0 (0.0%) |
| $500 to $799 | 63 (11.6%) | 0 (0.0%) |
| $800 to $999 | 65 (12.0%) | 17 (10.1%) |
| $1,000 to $1,499 | 0 (0.0%) | 13 (7.7%) |
| $1,500 to $1,999 | 69 (12.7%) | 26 (15.5%) |
| $2,000 to $2,499 | 136 (25.1%) | 92 (54.8%) |
| $2,500 to $2,999 | 100 (18.4%) | 20 (11.9%) |
| $3,000 or more | 51 (9.4%) | 0 (0.0%) |
| Total | 542 (100.0%) | 168 (100.0%) |
Physical Housing Characteristics in Manchaca
Housing Structures in Manchaca
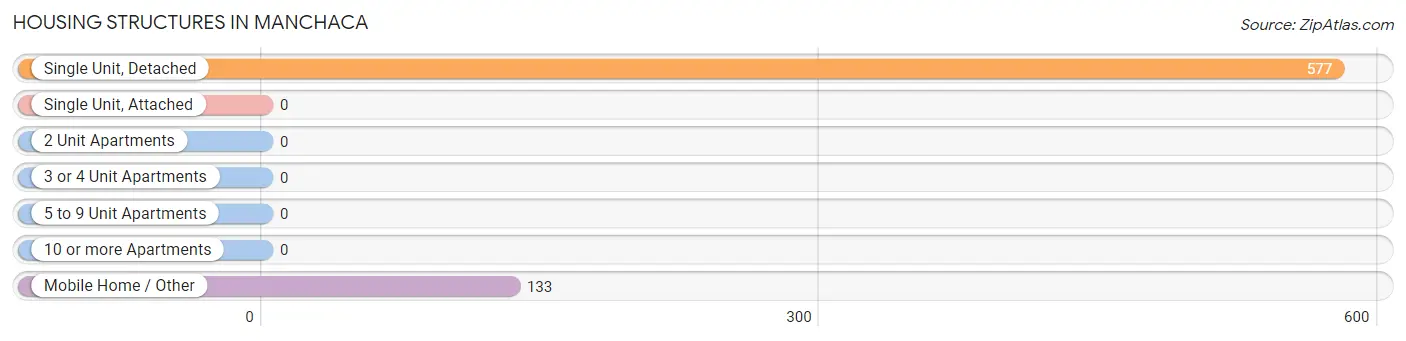
| Structure Type | # Housing Units | % Housing Units |
| Single Unit, Detached | 577 | 81.3% |
| Single Unit, Attached | 0 | 0.0% |
| 2 Unit Apartments | 0 | 0.0% |
| 3 or 4 Unit Apartments | 0 | 0.0% |
| 5 to 9 Unit Apartments | 0 | 0.0% |
| 10 or more Apartments | 0 | 0.0% |
| Mobile Home / Other | 133 | 18.7% |
| Total | 710 | 100.0% |
Housing Structures by Occupancy in Manchaca
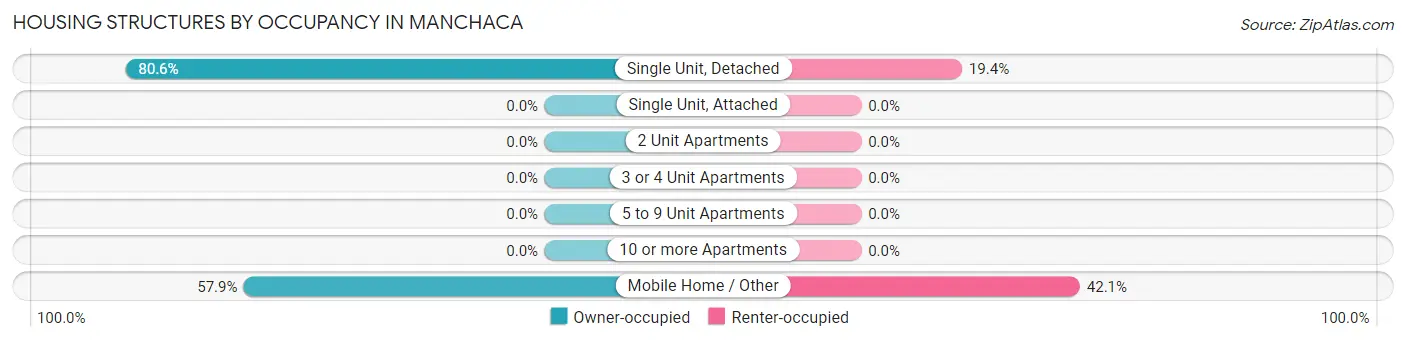
| Structure Type | Owner-occupied | Renter-occupied |
| Single Unit, Detached | 465 (80.6%) | 112 (19.4%) |
| Single Unit, Attached | 0 (0.0%) | 0 (0.0%) |
| 2 Unit Apartments | 0 (0.0%) | 0 (0.0%) |
| 3 or 4 Unit Apartments | 0 (0.0%) | 0 (0.0%) |
| 5 to 9 Unit Apartments | 0 (0.0%) | 0 (0.0%) |
| 10 or more Apartments | 0 (0.0%) | 0 (0.0%) |
| Mobile Home / Other | 77 (57.9%) | 56 (42.1%) |
| Total | 542 (76.3%) | 168 (23.7%) |
Housing Structures by Number of Rooms in Manchaca
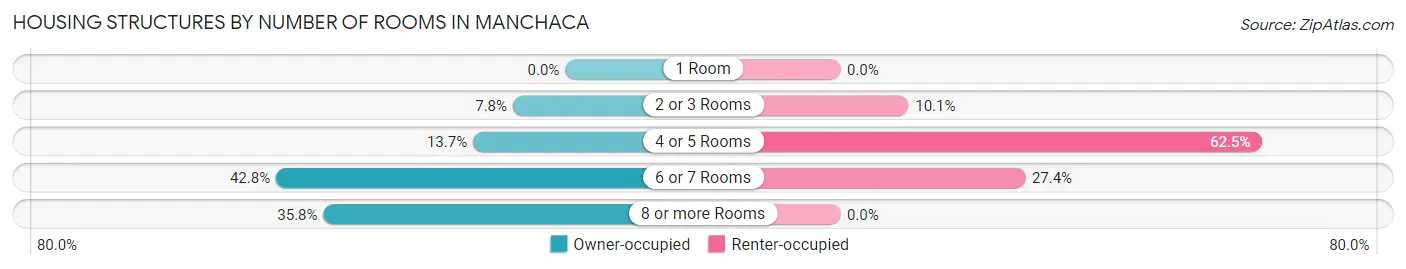
| Number of Rooms | Owner-occupied | Renter-occupied |
| 1 Room | 0 (0.0%) | 0 (0.0%) |
| 2 or 3 Rooms | 42 (7.7%) | 17 (10.1%) |
| 4 or 5 Rooms | 74 (13.7%) | 105 (62.5%) |
| 6 or 7 Rooms | 232 (42.8%) | 46 (27.4%) |
| 8 or more Rooms | 194 (35.8%) | 0 (0.0%) |
| Total | 542 (100.0%) | 168 (100.0%) |
Housing Structure by Heating Type in Manchaca
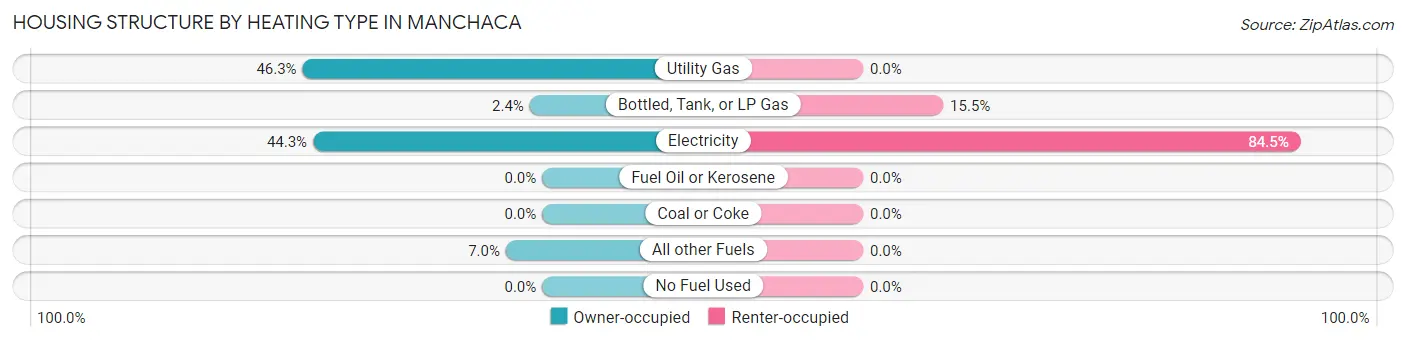
| Heating Type | Owner-occupied | Renter-occupied |
| Utility Gas | 251 (46.3%) | 0 (0.0%) |
| Bottled, Tank, or LP Gas | 13 (2.4%) | 26 (15.5%) |
| Electricity | 240 (44.3%) | 142 (84.5%) |
| Fuel Oil or Kerosene | 0 (0.0%) | 0 (0.0%) |
| Coal or Coke | 0 (0.0%) | 0 (0.0%) |
| All other Fuels | 38 (7.0%) | 0 (0.0%) |
| No Fuel Used | 0 (0.0%) | 0 (0.0%) |
| Total | 542 (100.0%) | 168 (100.0%) |
Household Vehicle Usage in Manchaca
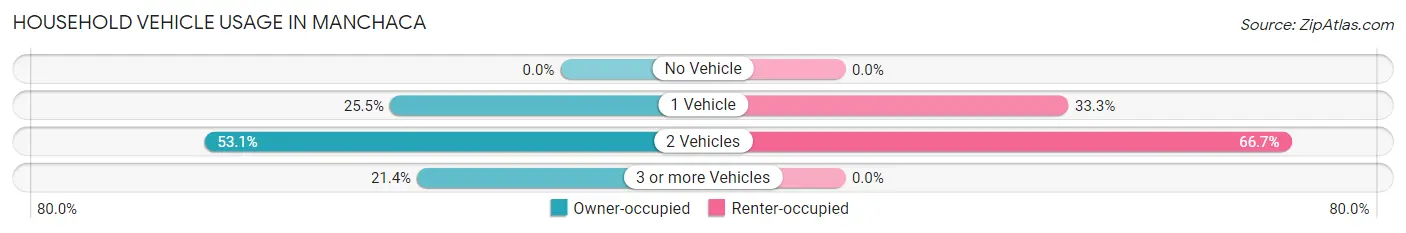
| Vehicles per Household | Owner-occupied | Renter-occupied |
| No Vehicle | 0 (0.0%) | 0 (0.0%) |
| 1 Vehicle | 138 (25.5%) | 56 (33.3%) |
| 2 Vehicles | 288 (53.1%) | 112 (66.7%) |
| 3 or more Vehicles | 116 (21.4%) | 0 (0.0%) |
| Total | 542 (100.0%) | 168 (100.0%) |
Real Estate & Mortgages in Manchaca
Real Estate and Mortgage Overview in Manchaca
| Characteristic | Without Mortgage | With Mortgage |
| Housing Units | 186 | 356 |
| Median Property Value | $506,100 | $508,200 |
| Median Household Income | $122,546 | $139 |
| Monthly Housing Costs | $588 | $51 |
| Real Estate Taxes | $4,585 | $0 |
Property Value by Mortgage Status in Manchaca
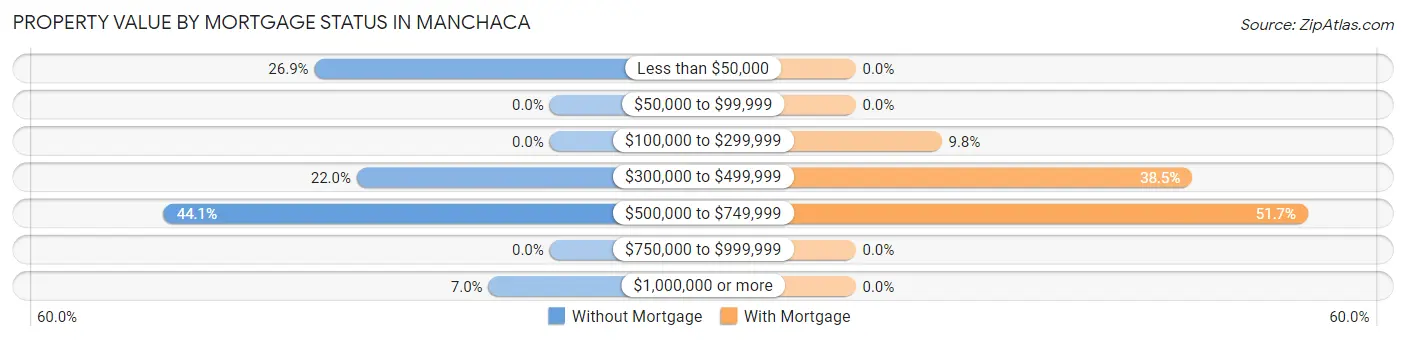
| Property Value | Without Mortgage | With Mortgage |
| Less than $50,000 | 50 (26.9%) | 0 (0.0%) |
| $50,000 to $99,999 | 0 (0.0%) | 0 (0.0%) |
| $100,000 to $299,999 | 0 (0.0%) | 35 (9.8%) |
| $300,000 to $499,999 | 41 (22.0%) | 137 (38.5%) |
| $500,000 to $749,999 | 82 (44.1%) | 184 (51.7%) |
| $750,000 to $999,999 | 0 (0.0%) | 0 (0.0%) |
| $1,000,000 or more | 13 (7.0%) | 0 (0.0%) |
| Total | 186 (100.0%) | 356 (100.0%) |
Household Income by Mortgage Status in Manchaca
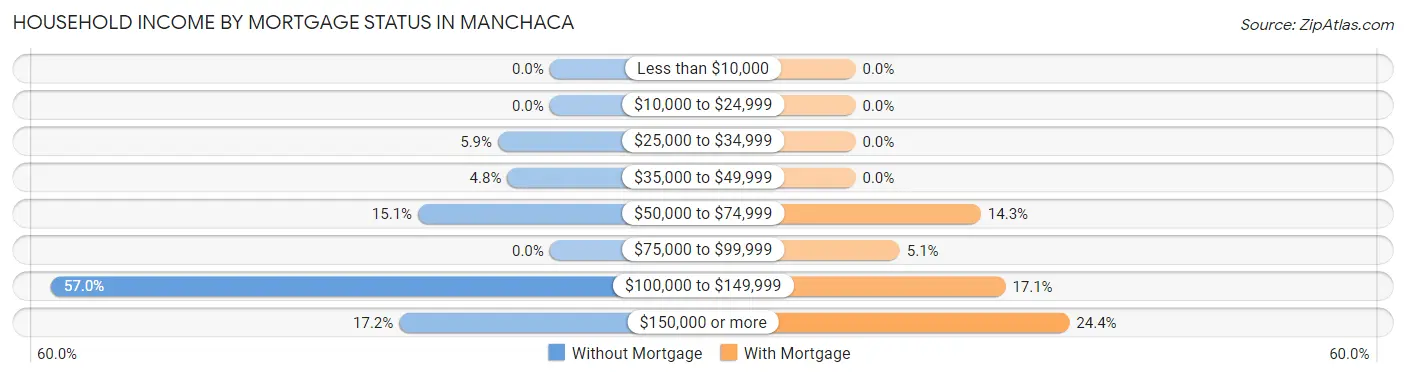
| Household Income | Without Mortgage | With Mortgage |
| Less than $10,000 | 0 (0.0%) | 0 (0.0%) |
| $10,000 to $24,999 | 0 (0.0%) | 0 (0.0%) |
| $25,000 to $34,999 | 11 (5.9%) | 0 (0.0%) |
| $35,000 to $49,999 | 9 (4.8%) | 0 (0.0%) |
| $50,000 to $74,999 | 28 (15.0%) | 51 (14.3%) |
| $75,000 to $99,999 | 0 (0.0%) | 18 (5.1%) |
| $100,000 to $149,999 | 106 (57.0%) | 61 (17.1%) |
| $150,000 or more | 32 (17.2%) | 87 (24.4%) |
| Total | 186 (100.0%) | 356 (100.0%) |
Property Value to Household Income Ratio in Manchaca
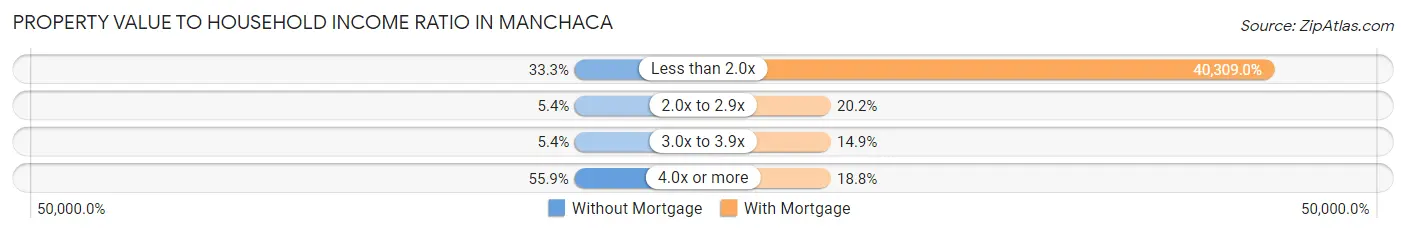
| Value-to-Income Ratio | Without Mortgage | With Mortgage |
| Less than 2.0x | 62 (33.3%) | 143,500 (40,309.0%) |
| 2.0x to 2.9x | 10 (5.4%) | 72 (20.2%) |
| 3.0x to 3.9x | 10 (5.4%) | 53 (14.9%) |
| 4.0x or more | 104 (55.9%) | 67 (18.8%) |
| Total | 186 (100.0%) | 356 (100.0%) |
Real Estate Taxes by Mortgage Status in Manchaca
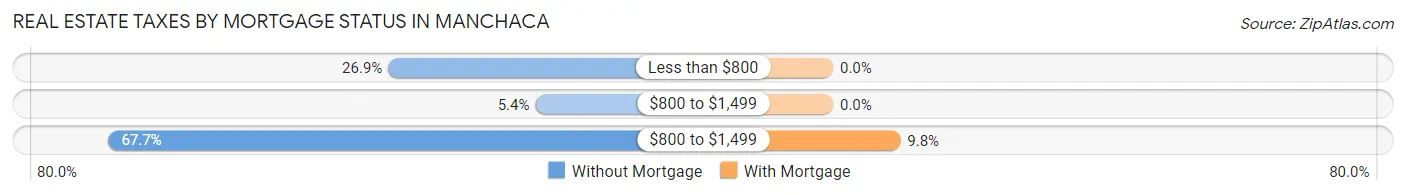
| Property Taxes | Without Mortgage | With Mortgage |
| Less than $800 | 50 (26.9%) | 0 (0.0%) |
| $800 to $1,499 | 10 (5.4%) | 0 (0.0%) |
| $800 to $1,499 | 126 (67.7%) | 35 (9.8%) |
| Total | 186 (100.0%) | 356 (100.0%) |
Health & Disability in Manchaca
Health Insurance Coverage by Age in Manchaca
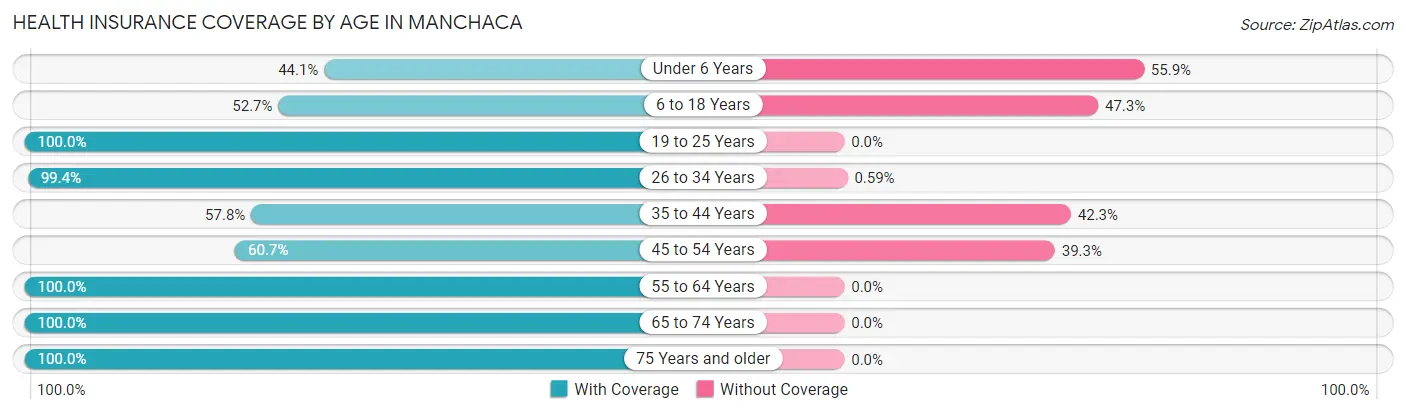
| Age Bracket | With Coverage | Without Coverage |
| Under 6 Years | 154 (44.1%) | 195 (55.9%) |
| 6 to 18 Years | 108 (52.7%) | 97 (47.3%) |
| 19 to 25 Years | 97 (100.0%) | 0 (0.0%) |
| 26 to 34 Years | 339 (99.4%) | 2 (0.6%) |
| 35 to 44 Years | 216 (57.8%) | 158 (42.2%) |
| 45 to 54 Years | 198 (60.7%) | 128 (39.3%) |
| 55 to 64 Years | 174 (100.0%) | 0 (0.0%) |
| 65 to 74 Years | 127 (100.0%) | 0 (0.0%) |
| 75 Years and older | 48 (100.0%) | 0 (0.0%) |
| Total | 1,461 (71.6%) | 580 (28.4%) |
Health Insurance Coverage by Citizenship Status in Manchaca
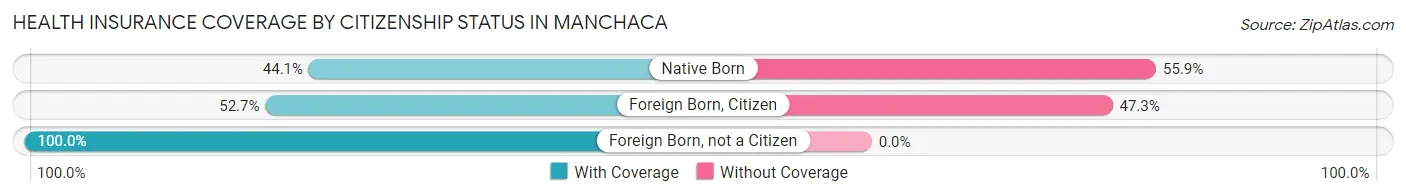
| Citizenship Status | With Coverage | Without Coverage |
| Native Born | 154 (44.1%) | 195 (55.9%) |
| Foreign Born, Citizen | 108 (52.7%) | 97 (47.3%) |
| Foreign Born, not a Citizen | 97 (100.0%) | 0 (0.0%) |
Health Insurance Coverage by Household Income in Manchaca
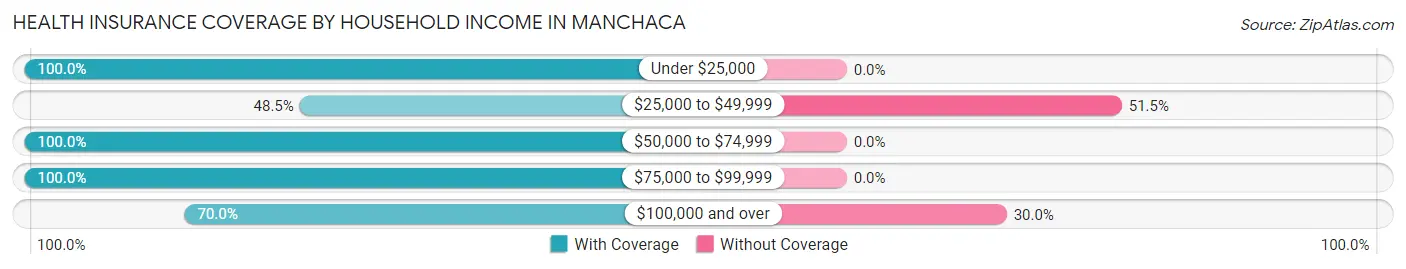
| Household Income | With Coverage | Without Coverage |
| Under $25,000 | 27 (100.0%) | 0 (0.0%) |
| $25,000 to $49,999 | 48 (48.5%) | 51 (51.5%) |
| $50,000 to $74,999 | 76 (100.0%) | 0 (0.0%) |
| $75,000 to $99,999 | 78 (100.0%) | 0 (0.0%) |
| $100,000 and over | 1,232 (70.0%) | 527 (30.0%) |
Public vs Private Health Insurance Coverage by Age in Manchaca
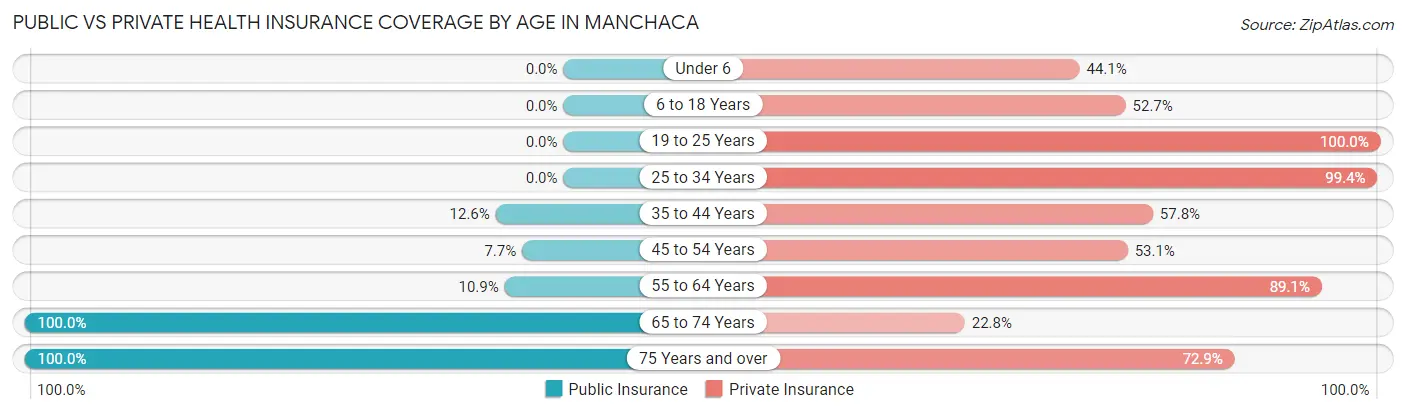
| Age Bracket | Public Insurance | Private Insurance |
| Under 6 | 0 (0.0%) | 154 (44.1%) |
| 6 to 18 Years | 0 (0.0%) | 108 (52.7%) |
| 19 to 25 Years | 0 (0.0%) | 97 (100.0%) |
| 25 to 34 Years | 0 (0.0%) | 339 (99.4%) |
| 35 to 44 Years | 47 (12.6%) | 216 (57.8%) |
| 45 to 54 Years | 25 (7.7%) | 173 (53.1%) |
| 55 to 64 Years | 19 (10.9%) | 155 (89.1%) |
| 65 to 74 Years | 127 (100.0%) | 29 (22.8%) |
| 75 Years and over | 48 (100.0%) | 35 (72.9%) |
| Total | 266 (13.0%) | 1,306 (64.0%) |
Disability Status by Sex by Age in Manchaca
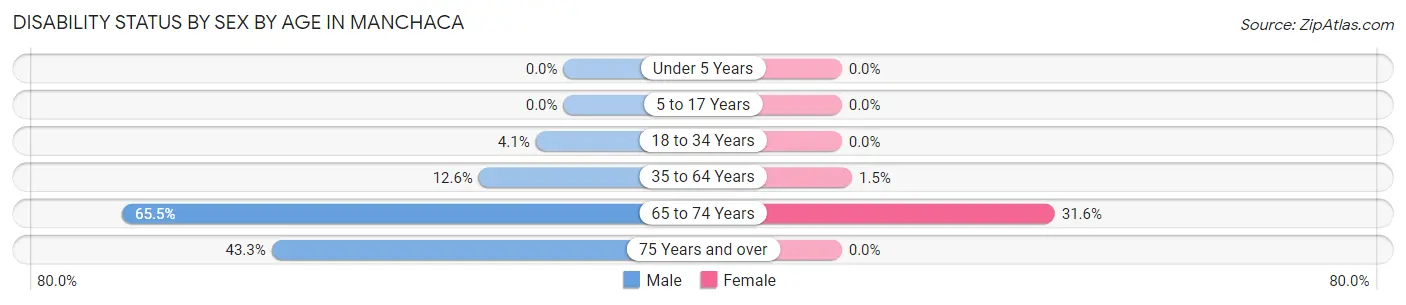
| Age Bracket | Male | Female |
| Under 5 Years | 0 (0.0%) | 0 (0.0%) |
| 5 to 17 Years | 0 (0.0%) | 0 (0.0%) |
| 18 to 34 Years | 12 (4.1%) | 0 (0.0%) |
| 35 to 64 Years | 44 (12.6%) | 8 (1.5%) |
| 65 to 74 Years | 19 (65.5%) | 31 (31.6%) |
| 75 Years and over | 13 (43.3%) | 0 (0.0%) |
Disability Class by Sex by Age in Manchaca
Disability Class: Hearing Difficulty
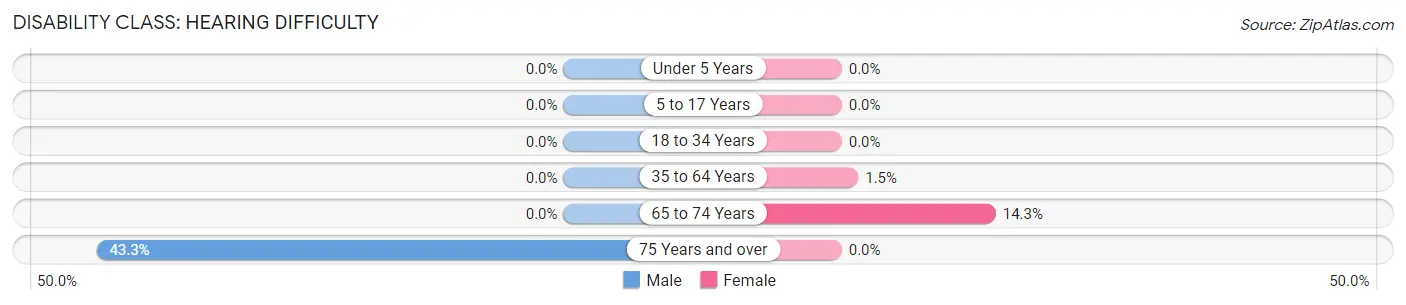
| Age Bracket | Male | Female |
| Under 5 Years | 0 (0.0%) | 0 (0.0%) |
| 5 to 17 Years | 0 (0.0%) | 0 (0.0%) |
| 18 to 34 Years | 0 (0.0%) | 0 (0.0%) |
| 35 to 64 Years | 0 (0.0%) | 8 (1.5%) |
| 65 to 74 Years | 0 (0.0%) | 14 (14.3%) |
| 75 Years and over | 13 (43.3%) | 0 (0.0%) |
Disability Class: Vision Difficulty
| Age Bracket | Male | Female |
| Under 5 Years | 0 (0.0%) | 0 (0.0%) |
| 5 to 17 Years | 0 (0.0%) | 0 (0.0%) |
| 18 to 34 Years | 0 (0.0%) | 0 (0.0%) |
| 35 to 64 Years | 0 (0.0%) | 0 (0.0%) |
| 65 to 74 Years | 0 (0.0%) | 0 (0.0%) |
| 75 Years and over | 0 (0.0%) | 0 (0.0%) |
Disability Class: Cognitive Difficulty
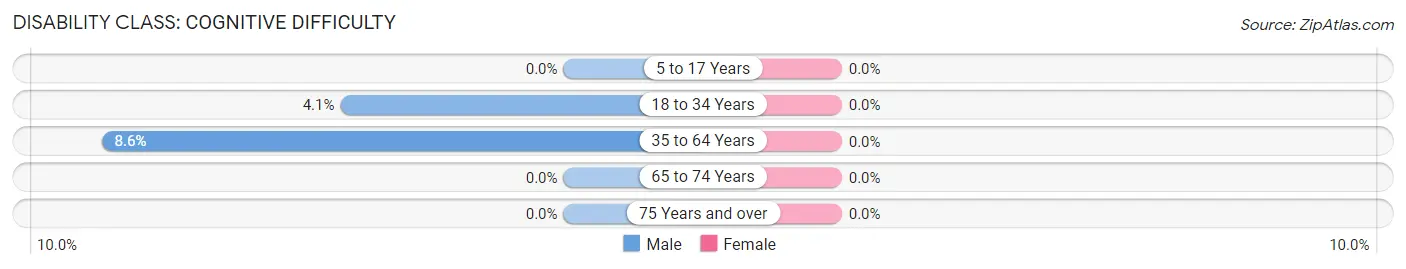
| Age Bracket | Male | Female |
| 5 to 17 Years | 0 (0.0%) | 0 (0.0%) |
| 18 to 34 Years | 12 (4.1%) | 0 (0.0%) |
| 35 to 64 Years | 30 (8.6%) | 0 (0.0%) |
| 65 to 74 Years | 0 (0.0%) | 0 (0.0%) |
| 75 Years and over | 0 (0.0%) | 0 (0.0%) |
Disability Class: Ambulatory Difficulty
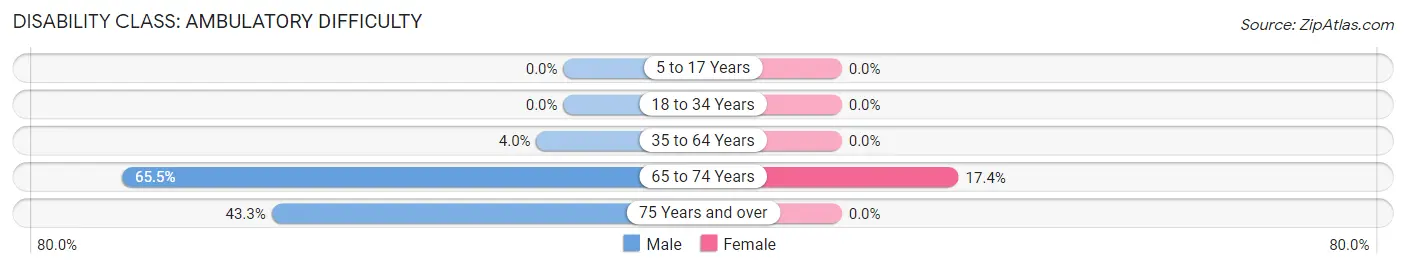
| Age Bracket | Male | Female |
| 5 to 17 Years | 0 (0.0%) | 0 (0.0%) |
| 18 to 34 Years | 0 (0.0%) | 0 (0.0%) |
| 35 to 64 Years | 14 (4.0%) | 0 (0.0%) |
| 65 to 74 Years | 19 (65.5%) | 17 (17.3%) |
| 75 Years and over | 13 (43.3%) | 0 (0.0%) |
Disability Class: Self-Care Difficulty
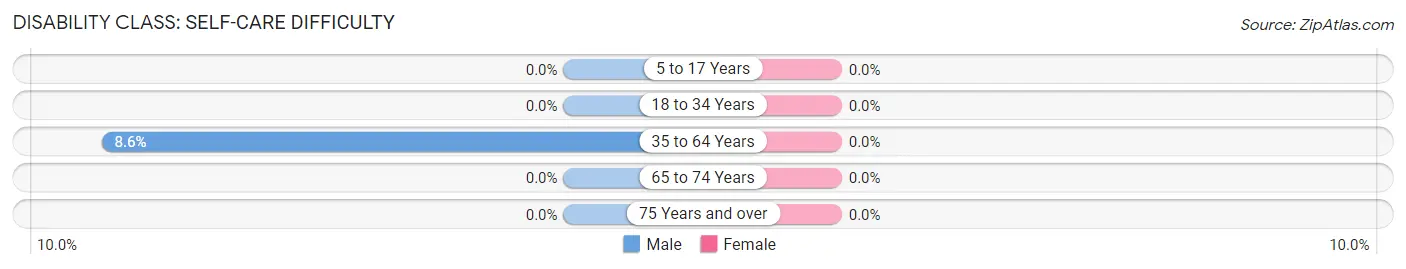
| Age Bracket | Male | Female |
| 5 to 17 Years | 0 (0.0%) | 0 (0.0%) |
| 18 to 34 Years | 0 (0.0%) | 0 (0.0%) |
| 35 to 64 Years | 30 (8.6%) | 0 (0.0%) |
| 65 to 74 Years | 0 (0.0%) | 0 (0.0%) |
| 75 Years and over | 0 (0.0%) | 0 (0.0%) |
Technology Access in Manchaca
Computing Device Access in Manchaca
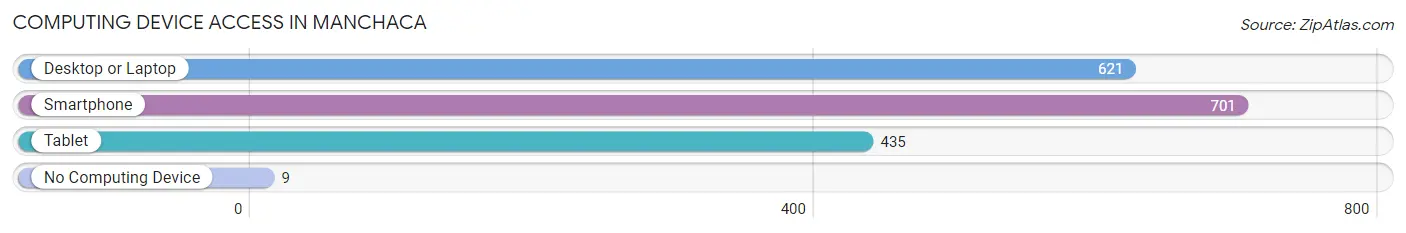
| Device Type | # Households | % Households |
| Desktop or Laptop | 621 | 87.5% |
| Smartphone | 701 | 98.7% |
| Tablet | 435 | 61.3% |
| No Computing Device | 9 | 1.3% |
| Total | 710 | 100.0% |
Internet Access in Manchaca
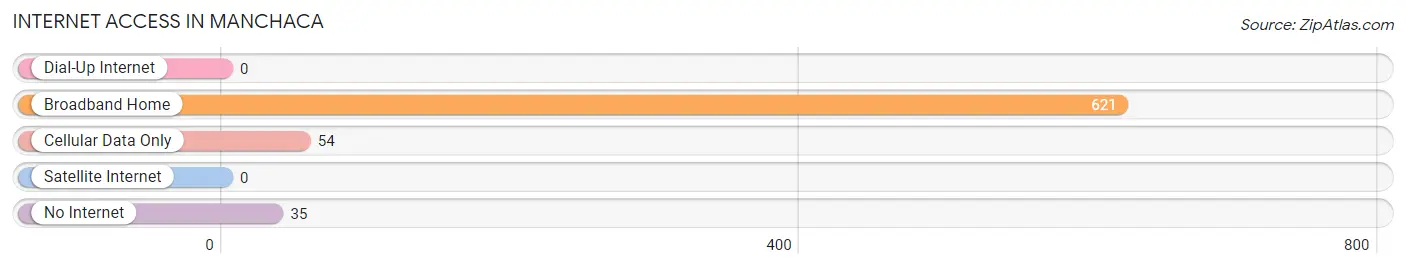
| Internet Type | # Households | % Households |
| Dial-Up Internet | 0 | 0.0% |
| Broadband Home | 621 | 87.5% |
| Cellular Data Only | 54 | 7.6% |
| Satellite Internet | 0 | 0.0% |
| No Internet | 35 | 4.9% |
| Total | 710 | 100.0% |
Manchaca Summary
Manchaca is a small unincorporated community located in Travis County, Texas, United States. It is situated about 15 miles south of Austin, the state capital. The population of Manchaca was estimated to be 1,845 in 2019.
History
Manchaca was founded in 1848 by a group of settlers from the nearby town of Hornsby Bend. The town was named after a local creek, which was named after a Comanche chief named Manchaca. The town was originally a farming community, but it soon became a popular stop on the Chisholm Trail, which was used by cowboys to drive cattle from Texas to Kansas.
In the late 19th century, Manchaca became a popular destination for tourists, who came to enjoy the area's natural beauty and to take advantage of the nearby mineral springs. The town also became a popular spot for picnics and other outdoor activities.
In the early 20th century, Manchaca began to experience a period of growth and development. The town was incorporated in 1911, and the first post office was established in 1912. The town also saw the construction of a number of churches, schools, and businesses.
Geography
Manchaca is located in Travis County, Texas, about 15 miles south of Austin. The town is situated on the banks of Manchaca Creek, which flows through the area. The terrain is mostly flat, with some rolling hills. The climate is generally mild, with hot summers and mild winters.
Economy
Manchaca's economy is largely based on agriculture and tourism. The town is home to several farms, which produce a variety of crops, including corn, cotton, and hay. The town is also home to several wineries, which produce a variety of wines.
Tourism is also an important part of the local economy. The town is home to several parks and recreational areas, which attract visitors from all over the state. The town is also home to several restaurants, bars, and shops, which cater to both locals and tourists.
Demographics
As of 2019, the population of Manchaca was estimated to be 1,845. The racial makeup of the town was 79.3% White, 11.2% Hispanic or Latino, 5.2% African American, and 4.3% other. The median household income was $60,945, and the median home value was $220,000.
Conclusion
Manchaca is a small unincorporated community located in Travis County, Texas, United States. It is situated about 15 miles south of Austin, the state capital. The population of Manchaca was estimated to be 1,845 in 2019. The town is situated on the banks of Manchaca Creek, and the terrain is mostly flat, with some rolling hills. The economy of Manchaca is largely based on agriculture and tourism. The racial makeup of the town was 79.3% White, 11.2% Hispanic or Latino, 5.2% African American, and 4.3% other. The median household income was $60,945, and the median home value was $220,000.
Common Questions
What is Per Capita Income in Manchaca?
Per Capita income in Manchaca is $52,842.
What is the Median Family Income in Manchaca?
Median Family Income in Manchaca is $157,375.
What is the Median Household income in Manchaca?
Median Household Income in Manchaca is $124,491.
What is Income or Wage Gap in Manchaca?
Income or Wage Gap in Manchaca is 31.4%.
Women in Manchaca earn 68.6 cents for every dollar earned by a man.
What is Inequality or Gini Index in Manchaca?
Inequality or Gini Index in Manchaca is 0.37.
What is the Total Population of Manchaca?
Total Population of Manchaca is 2,041.
What is the Total Male Population of Manchaca?
Total Male Population of Manchaca is 1,069.
What is the Total Female Population of Manchaca?
Total Female Population of Manchaca is 972.
What is the Ratio of Males per 100 Females in Manchaca?
There are 109.98 Males per 100 Females in Manchaca.
What is the Ratio of Females per 100 Males in Manchaca?
There are 90.93 Females per 100 Males in Manchaca.
What is the Median Population Age in Manchaca?
Median Population Age in Manchaca is 35.8 Years.
What is the Average Family Size in Manchaca
Average Family Size in Manchaca is 3.4 People.
What is the Average Household Size in Manchaca
Average Household Size in Manchaca is 2.9 People.
How Large is the Labor Force in Manchaca?
There are 1,177 People in the Labor Forcein in Manchaca.
What is the Percentage of People in the Labor Force in Manchaca?
73.0% of People are in the Labor Force in Manchaca.