Lytle, TX Map & Demographics
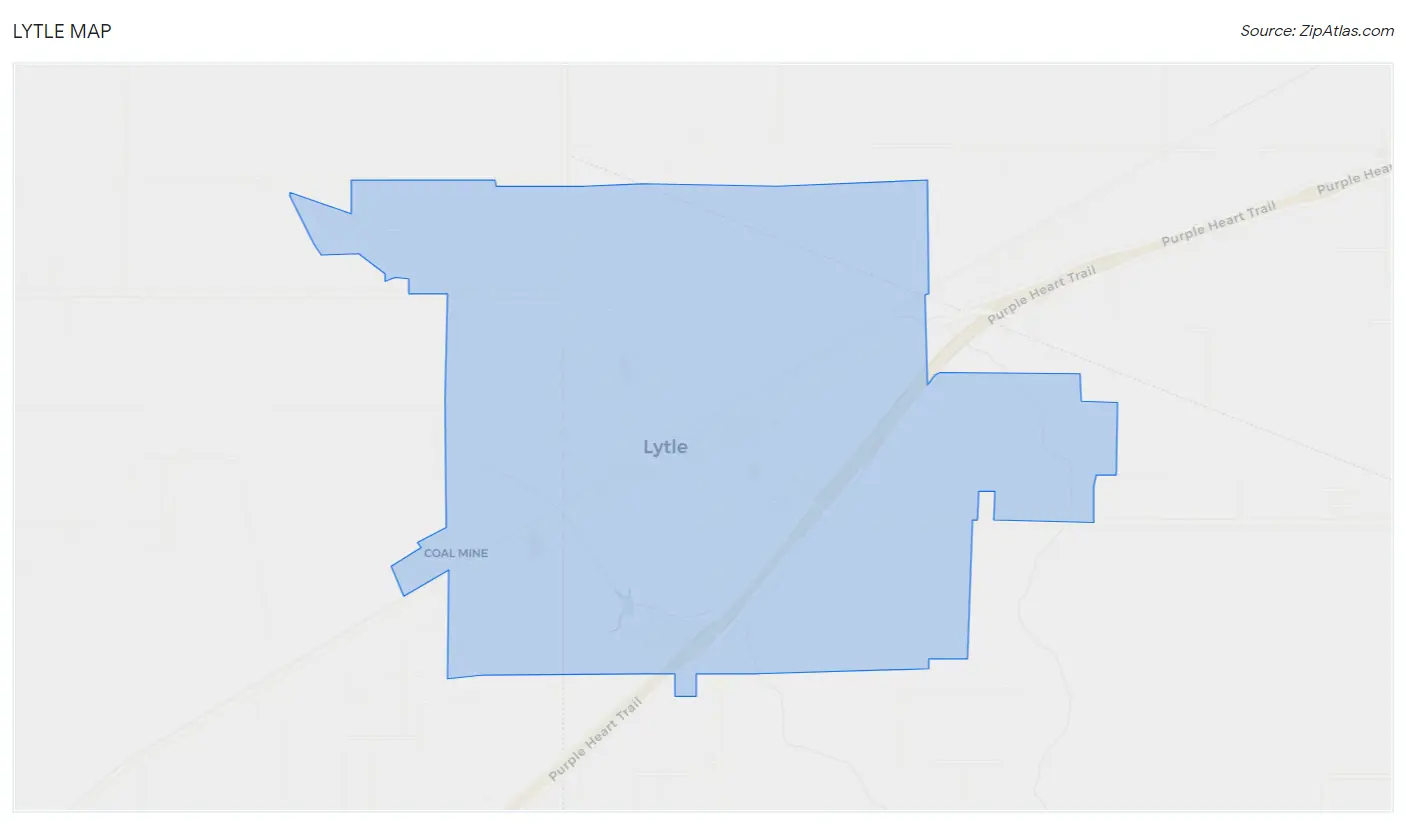
Lytle Map
Lytle Overview
$27,849
PER CAPITA INCOME
$65,761
AVG FAMILY INCOME
$51,875
AVG HOUSEHOLD INCOME
44.9%
WAGE / INCOME GAP [ % ]
55.1¢/ $1
WAGE / INCOME GAP [ $ ]
0.39
INEQUALITY / GINI INDEX
2,262
TOTAL POPULATION
1,150
MALE POPULATION
1,112
FEMALE POPULATION
103.42
MALES / 100 FEMALES
96.70
FEMALES / 100 MALES
38.8
MEDIAN AGE
3.0
AVG FAMILY SIZE
2.8
AVG HOUSEHOLD SIZE
1,020
LABOR FORCE [ PEOPLE ]
54.5%
PERCENT IN LABOR FORCE
6.4%
UNEMPLOYMENT RATE
Lytle Zip Codes
Lytle Area Codes
Income in Lytle
Income Overview in Lytle
Per Capita Income in Lytle is $27,849, while median incomes of families and households are $65,761 and $51,875 respectively.
| Characteristic | Number | Measure |
| Per Capita Income | 2,262 | $27,849 |
| Median Family Income | 610 | $65,761 |
| Mean Family Income | 610 | $80,784 |
| Median Household Income | 773 | $51,875 |
| Mean Household Income | 773 | $73,987 |
| Income Deficit | 610 | $0 |
| Wage / Income Gap (%) | 2,262 | 44.86% |
| Wage / Income Gap ($) | 2,262 | 55.14¢ per $1 |
| Gini / Inequality Index | 2,262 | 0.39 |
Earnings by Sex in Lytle
Average Earnings in Lytle are $30,859, $42,708 for men and $23,548 for women, a difference of 44.9%.
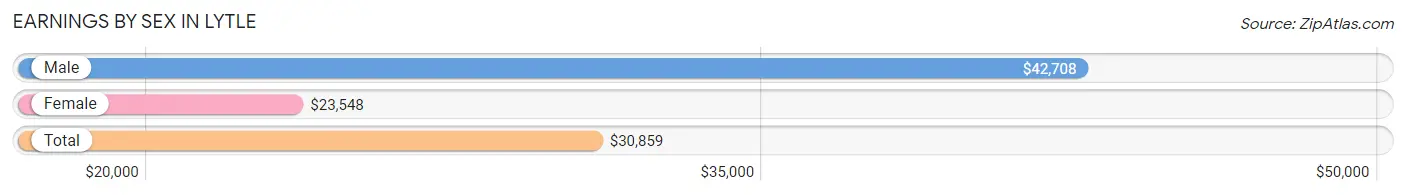
| Sex | Number | Average Earnings |
| Male | 499 (44.8%) | $42,708 |
| Female | 614 (55.2%) | $23,548 |
| Total | 1,113 (100.0%) | $30,859 |
Earnings by Sex by Income Bracket in Lytle
The most common earnings brackets in Lytle are $40,000 to $44,999 for men (72 | 14.4%) and $22,500 to $24,999 for women (136 | 22.2%).
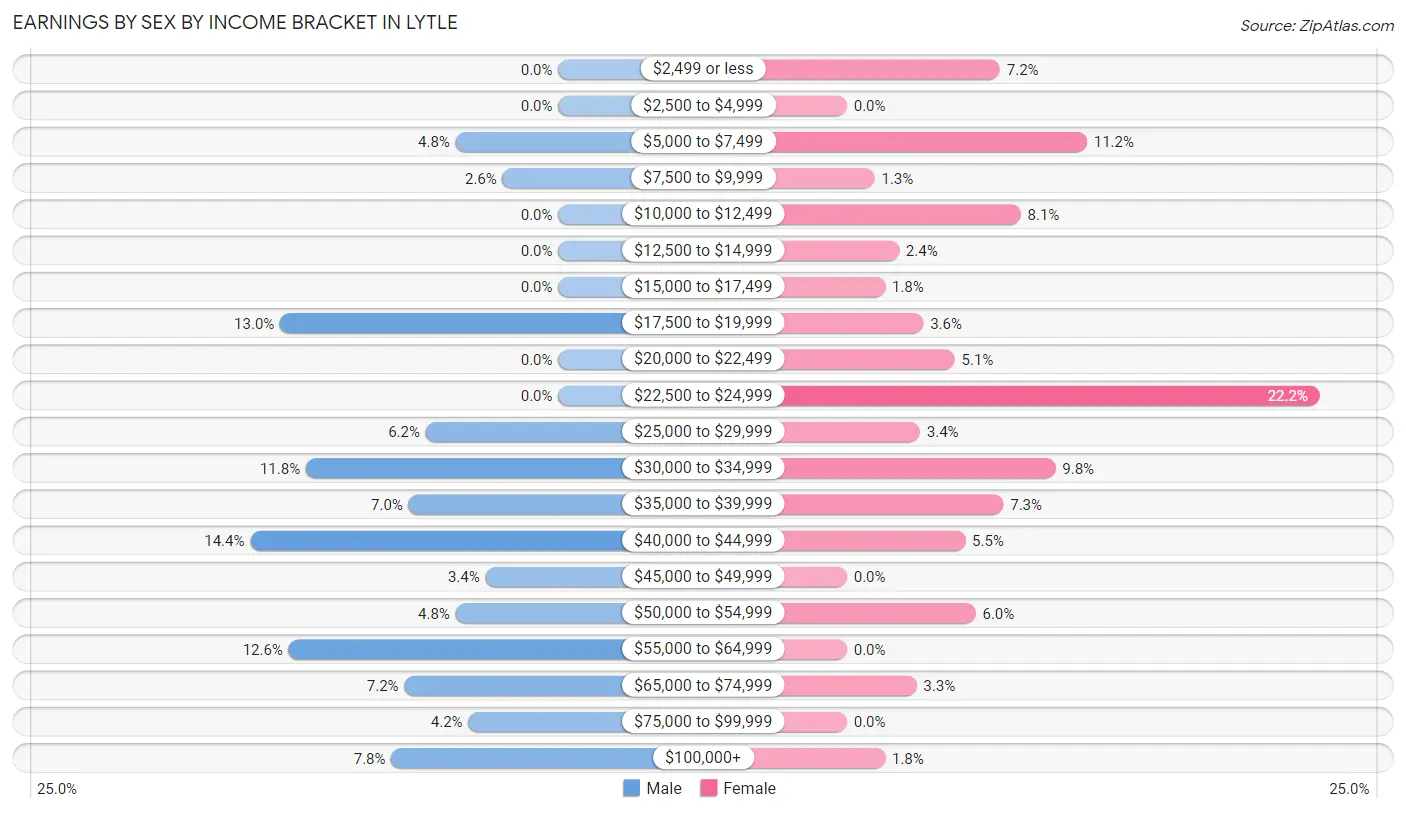
| Income | Male | Female |
| $2,499 or less | 0 (0.0%) | 44 (7.2%) |
| $2,500 to $4,999 | 0 (0.0%) | 0 (0.0%) |
| $5,000 to $7,499 | 24 (4.8%) | 69 (11.2%) |
| $7,500 to $9,999 | 13 (2.6%) | 8 (1.3%) |
| $10,000 to $12,499 | 0 (0.0%) | 50 (8.1%) |
| $12,500 to $14,999 | 0 (0.0%) | 15 (2.4%) |
| $15,000 to $17,499 | 0 (0.0%) | 11 (1.8%) |
| $17,500 to $19,999 | 65 (13.0%) | 22 (3.6%) |
| $20,000 to $22,499 | 0 (0.0%) | 31 (5.1%) |
| $22,500 to $24,999 | 0 (0.0%) | 136 (22.2%) |
| $25,000 to $29,999 | 31 (6.2%) | 21 (3.4%) |
| $30,000 to $34,999 | 59 (11.8%) | 60 (9.8%) |
| $35,000 to $39,999 | 35 (7.0%) | 45 (7.3%) |
| $40,000 to $44,999 | 72 (14.4%) | 34 (5.5%) |
| $45,000 to $49,999 | 17 (3.4%) | 0 (0.0%) |
| $50,000 to $54,999 | 24 (4.8%) | 37 (6.0%) |
| $55,000 to $64,999 | 63 (12.6%) | 0 (0.0%) |
| $65,000 to $74,999 | 36 (7.2%) | 20 (3.3%) |
| $75,000 to $99,999 | 21 (4.2%) | 0 (0.0%) |
| $100,000+ | 39 (7.8%) | 11 (1.8%) |
| Total | 499 (100.0%) | 614 (100.0%) |
Earnings by Sex by Educational Attainment in Lytle
Average earnings in Lytle are $43,681 for men and $24,200 for women, a difference of 44.6%. Men with an educational attainment of college or associate's degree enjoy the highest average annual earnings of $44,651, while those with high school diploma education earn the least with $28,306. Women with an educational attainment of bachelor's degree earn the most with the average annual earnings of $53,424, while those with graduate degree education have the smallest earnings of $17,273.
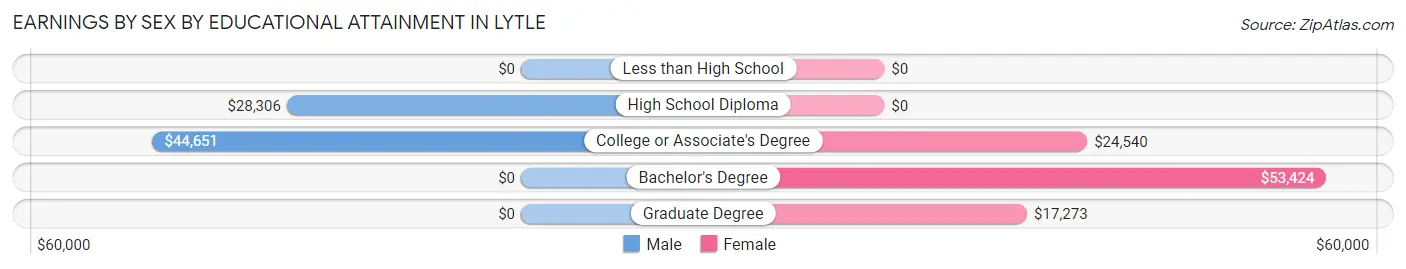
| Educational Attainment | Male Income | Female Income |
| Less than High School | - | - |
| High School Diploma | $28,306 | $0 |
| College or Associate's Degree | $44,651 | $24,540 |
| Bachelor's Degree | - | - |
| Graduate Degree | - | - |
| Total | $43,681 | $24,200 |
Family Income in Lytle
Family Income Brackets in Lytle
According to the Lytle family income data, there are 146 families falling into the $50,000 to $74,999 income range, which is the most common income bracket and makes up 23.9% of all families.
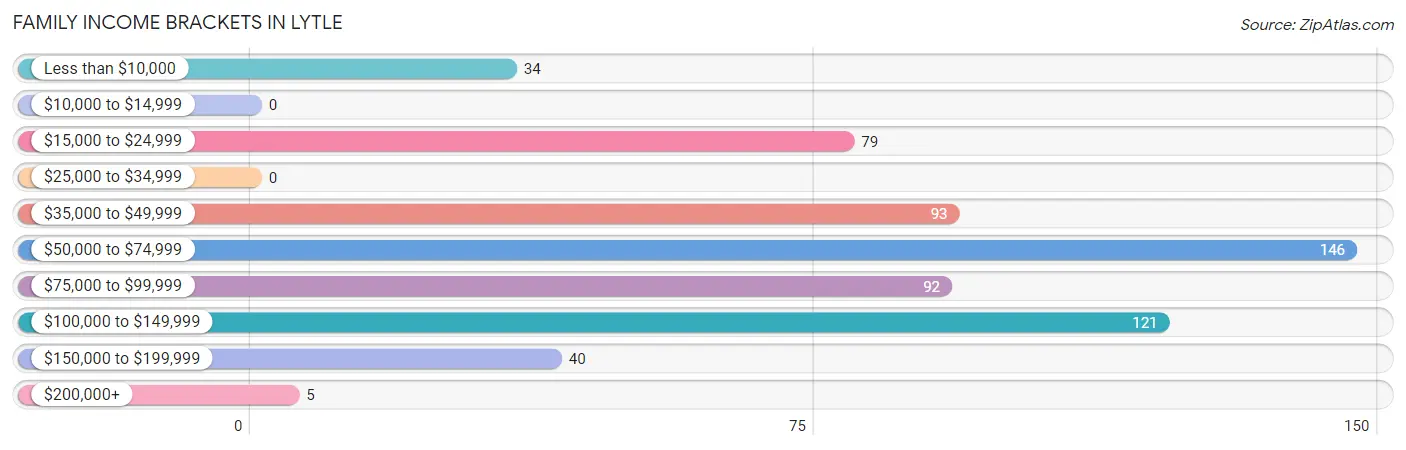
| Income Bracket | # Families | % Families |
| Less than $10,000 | 34 | 5.6% |
| $10,000 to $14,999 | 0 | 0.0% |
| $15,000 to $24,999 | 79 | 13.0% |
| $25,000 to $34,999 | 0 | 0.0% |
| $35,000 to $49,999 | 93 | 15.2% |
| $50,000 to $74,999 | 146 | 23.9% |
| $75,000 to $99,999 | 92 | 15.1% |
| $100,000 to $149,999 | 121 | 19.8% |
| $150,000 to $199,999 | 40 | 6.6% |
| $200,000+ | 5 | 0.8% |
Family Income by Famaliy Size in Lytle
4-person families (65 | 10.7%) account for the highest median family income in Lytle with $120,729 per family, while 2-person families (372 | 61.0%) have the highest median income of $32,826 per family member.
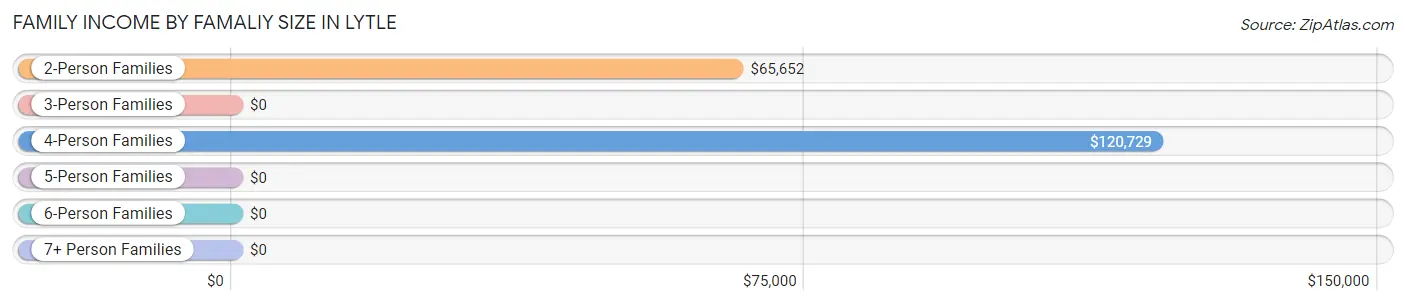
| Income Bracket | # Families | Median Income |
| 2-Person Families | 372 (61.0%) | $65,652 |
| 3-Person Families | 138 (22.6%) | $0 |
| 4-Person Families | 65 (10.7%) | $120,729 |
| 5-Person Families | 21 (3.4%) | $0 |
| 6-Person Families | 14 (2.3%) | $0 |
| 7+ Person Families | 0 (0.0%) | $0 |
| Total | 610 (100.0%) | $65,761 |
Family Income by Number of Earners in Lytle
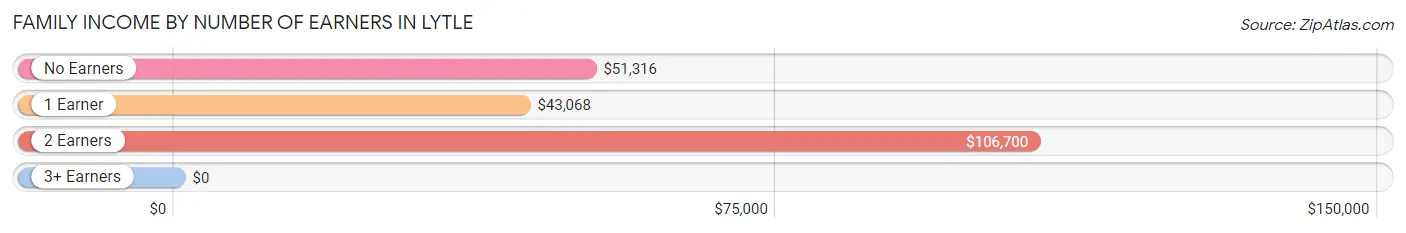
| Number of Earners | # Families | Median Income |
| No Earners | 120 (19.7%) | $51,316 |
| 1 Earner | 241 (39.5%) | $43,068 |
| 2 Earners | 222 (36.4%) | $106,700 |
| 3+ Earners | 27 (4.4%) | $0 |
| Total | 610 (100.0%) | $65,761 |
Household Income in Lytle
Household Income Brackets in Lytle
With 251 households falling in the category, the $35,000 to $49,999 income range is the most frequent in Lytle, accounting for 32.5% of all households. In contrast, only 5 households (0.6%) fall into the $200,000+ income bracket, making it the least populous group.
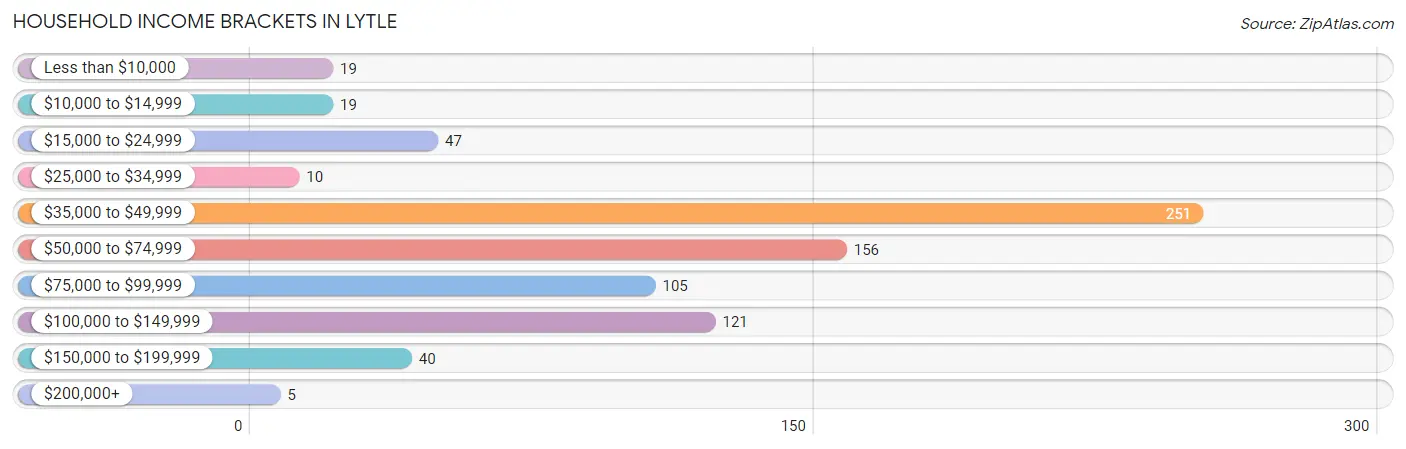
| Income Bracket | # Households | % Households |
| Less than $10,000 | 19 | 2.5% |
| $10,000 to $14,999 | 19 | 2.5% |
| $15,000 to $24,999 | 47 | 6.1% |
| $25,000 to $34,999 | 10 | 1.3% |
| $35,000 to $49,999 | 251 | 32.5% |
| $50,000 to $74,999 | 156 | 20.2% |
| $75,000 to $99,999 | 105 | 13.6% |
| $100,000 to $149,999 | 121 | 15.7% |
| $150,000 to $199,999 | 40 | 5.2% |
| $200,000+ | 5 | 0.6% |
Household Income by Householder Age in Lytle
The median household income in Lytle is $51,875, with the highest median household income of $74,750 found in the 45 to 64 years age bracket for the primary householder. A total of 345 households (44.6%) fall into this category.
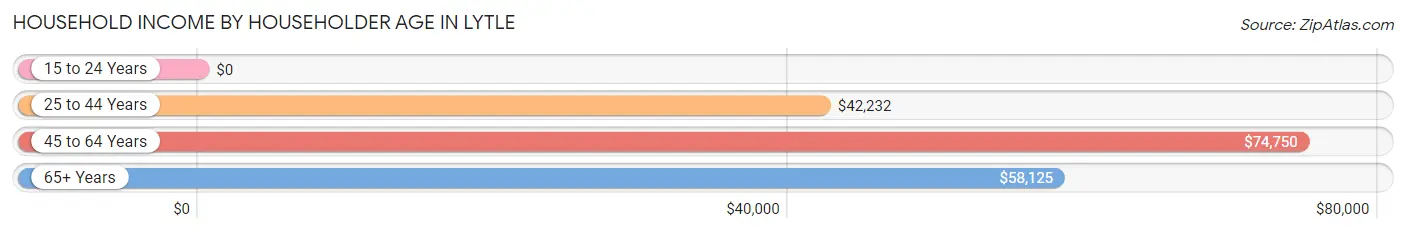
| Income Bracket | # Households | Median Income |
| 15 to 24 Years | 0 (0.0%) | $0 |
| 25 to 44 Years | 210 (27.2%) | $42,232 |
| 45 to 64 Years | 345 (44.6%) | $74,750 |
| 65+ Years | 218 (28.2%) | $58,125 |
| Total | 773 (100.0%) | $51,875 |
Poverty in Lytle
Income Below Poverty by Sex and Age in Lytle
With 14.4% poverty level for males and 11.4% for females among the residents of Lytle, 6 to 11 year old males and 16 and 17 year old females are the most vulnerable to poverty, with 47 males (100.0%) and 18 females (100.0%) in their respective age groups living below the poverty level.
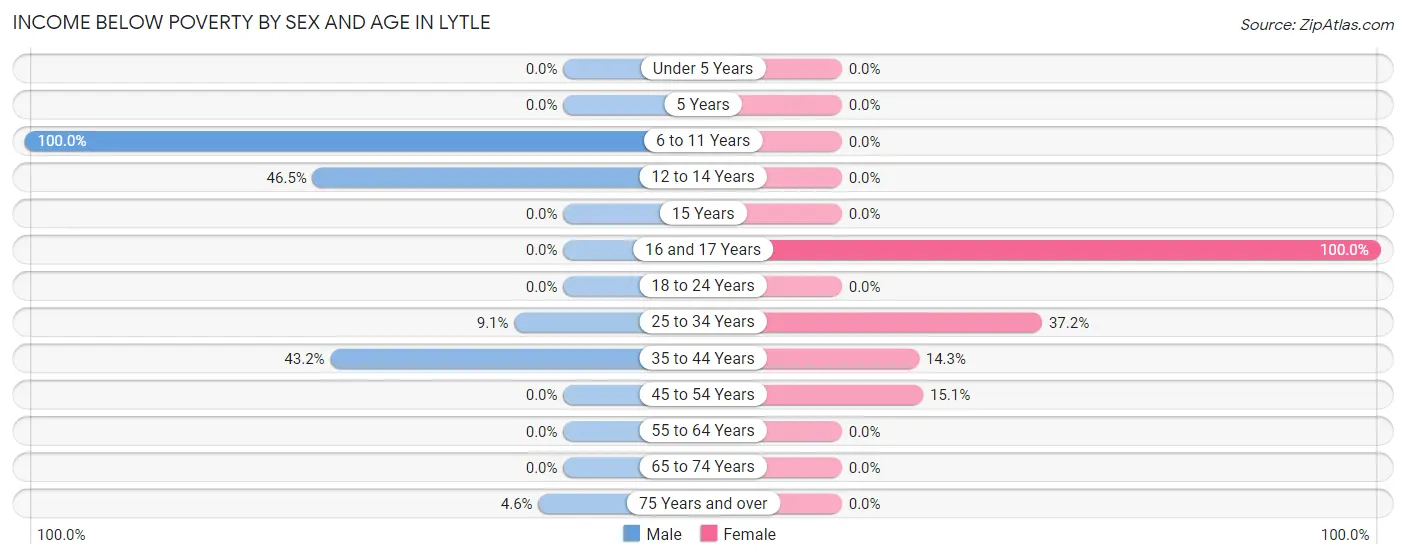
| Age Bracket | Male | Female |
| Under 5 Years | 0 (0.0%) | 0 (0.0%) |
| 5 Years | 0 (0.0%) | 0 (0.0%) |
| 6 to 11 Years | 47 (100.0%) | 0 (0.0%) |
| 12 to 14 Years | 47 (46.5%) | 0 (0.0%) |
| 15 Years | 0 (0.0%) | 0 (0.0%) |
| 16 and 17 Years | 0 (0.0%) | 18 (100.0%) |
| 18 to 24 Years | 0 (0.0%) | 0 (0.0%) |
| 25 to 34 Years | 16 (9.1%) | 68 (37.2%) |
| 35 to 44 Years | 48 (43.2%) | 15 (14.3%) |
| 45 to 54 Years | 0 (0.0%) | 19 (15.1%) |
| 55 to 64 Years | 0 (0.0%) | 0 (0.0%) |
| 65 to 74 Years | 0 (0.0%) | 0 (0.0%) |
| 75 Years and over | 3 (4.6%) | 0 (0.0%) |
| Total | 161 (14.4%) | 120 (11.4%) |
Income Above Poverty by Sex and Age in Lytle
According to the poverty statistics in Lytle, males aged under 5 years and females aged 6 to 11 years are the age groups that are most secure financially, with 100.0% of males and 100.0% of females in these age groups living above the poverty line.
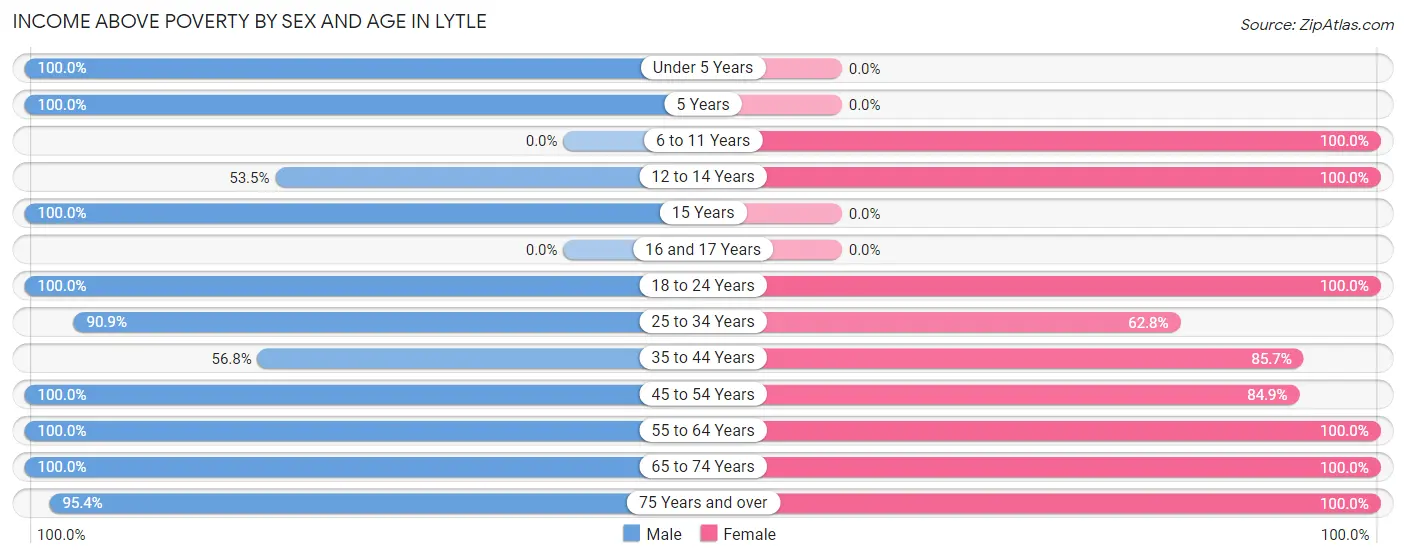
| Age Bracket | Male | Female |
| Under 5 Years | 38 (100.0%) | 0 (0.0%) |
| 5 Years | 22 (100.0%) | 0 (0.0%) |
| 6 to 11 Years | 0 (0.0%) | 111 (100.0%) |
| 12 to 14 Years | 54 (53.5%) | 24 (100.0%) |
| 15 Years | 29 (100.0%) | 0 (0.0%) |
| 16 and 17 Years | 0 (0.0%) | 0 (0.0%) |
| 18 to 24 Years | 83 (100.0%) | 141 (100.0%) |
| 25 to 34 Years | 160 (90.9%) | 115 (62.8%) |
| 35 to 44 Years | 63 (56.8%) | 90 (85.7%) |
| 45 to 54 Years | 167 (100.0%) | 107 (84.9%) |
| 55 to 64 Years | 172 (100.0%) | 171 (100.0%) |
| 65 to 74 Years | 110 (100.0%) | 125 (100.0%) |
| 75 Years and over | 62 (95.4%) | 50 (100.0%) |
| Total | 960 (85.6%) | 934 (88.6%) |
Income Below Poverty Among Married-Couple Families in Lytle
| Children | Above Poverty | Below Poverty |
| No Children | 282 (100.0%) | 0 (0.0%) |
| 1 or 2 Children | 82 (100.0%) | 0 (0.0%) |
| 3 or 4 Children | 21 (100.0%) | 0 (0.0%) |
| 5 or more Children | 0 (0.0%) | 0 (0.0%) |
| Total | 385 (100.0%) | 0 (0.0%) |
Income Below Poverty Among Single-Parent Households in Lytle
According to the poverty data in Lytle, 35.0% or 48 single-father households and 38.6% or 34 single-mother households are living below the poverty line. Among single-father households, those with 1 or 2 children have the highest poverty rate, with 48 households (66.7%) experiencing poverty. Likewise, among single-mother households, those with 1 or 2 children have the highest poverty rate, with 15 households (62.5%) falling below the poverty line.
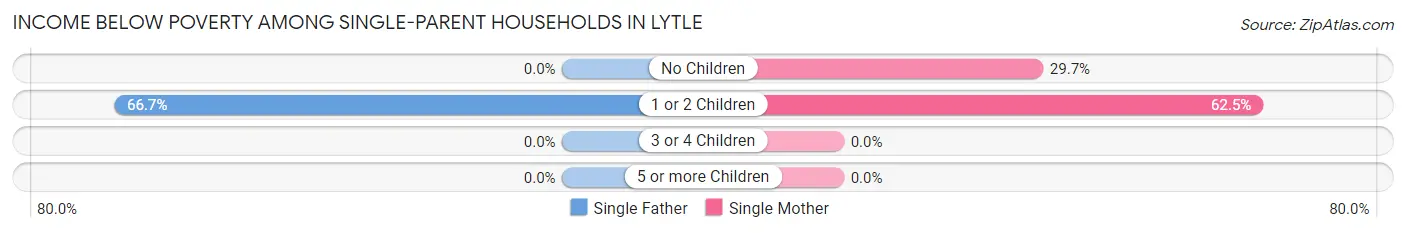
| Children | Single Father | Single Mother |
| No Children | 0 (0.0%) | 19 (29.7%) |
| 1 or 2 Children | 48 (66.7%) | 15 (62.5%) |
| 3 or 4 Children | 0 (0.0%) | 0 (0.0%) |
| 5 or more Children | 0 (0.0%) | 0 (0.0%) |
| Total | 48 (35.0%) | 34 (38.6%) |
Income Below Poverty Among Married-Couple vs Single-Parent Households in Lytle
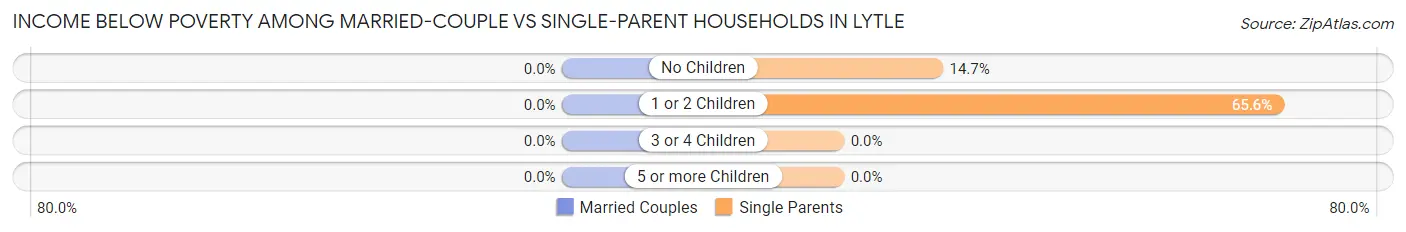
| Children | Married-Couple Families | Single-Parent Households |
| No Children | 0 (0.0%) | 19 (14.7%) |
| 1 or 2 Children | 0 (0.0%) | 63 (65.6%) |
| 3 or 4 Children | 0 (0.0%) | 0 (0.0%) |
| 5 or more Children | 0 (0.0%) | 0 (0.0%) |
| Total | 0 (0.0%) | 82 (36.4%) |
Race in Lytle
The most populous races in Lytle are White / Caucasian (1,975 | 87.3%), Hispanic or Latino (1,530 | 67.6%), and Two or more Races (221 | 9.8%).
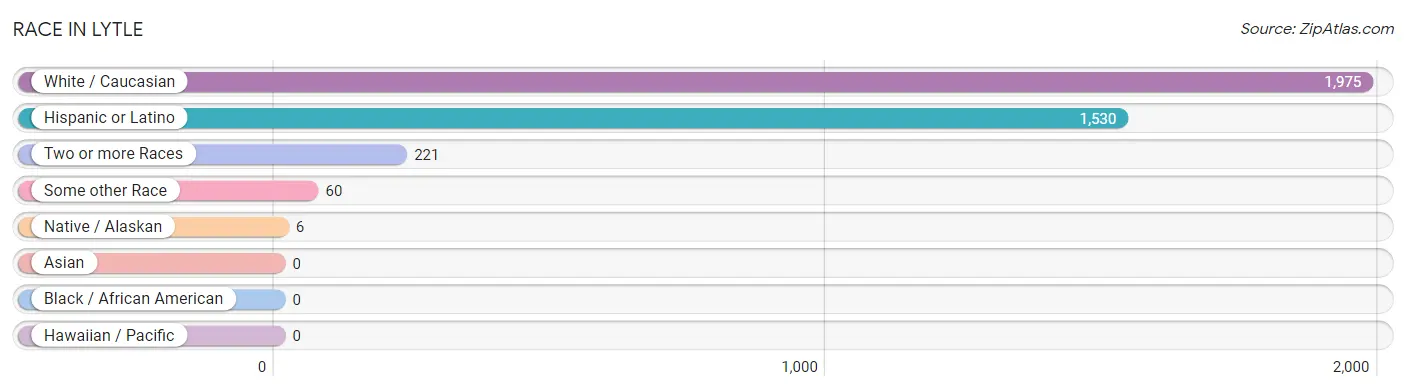
| Race | # Population | % Population |
| Asian | 0 | 0.0% |
| Black / African American | 0 | 0.0% |
| Hawaiian / Pacific | 0 | 0.0% |
| Hispanic or Latino | 1,530 | 67.6% |
| Native / Alaskan | 6 | 0.3% |
| White / Caucasian | 1,975 | 87.3% |
| Two or more Races | 221 | 9.8% |
| Some other Race | 60 | 2.6% |
| Total | 2,262 | 100.0% |
Ancestry in Lytle
The most populous ancestries reported in Lytle are Mexican (1,393 | 61.6%), German (335 | 14.8%), Irish (201 | 8.9%), English (83 | 3.7%), and American (69 | 3.0%), together accounting for 92.0% of all Lytle residents.
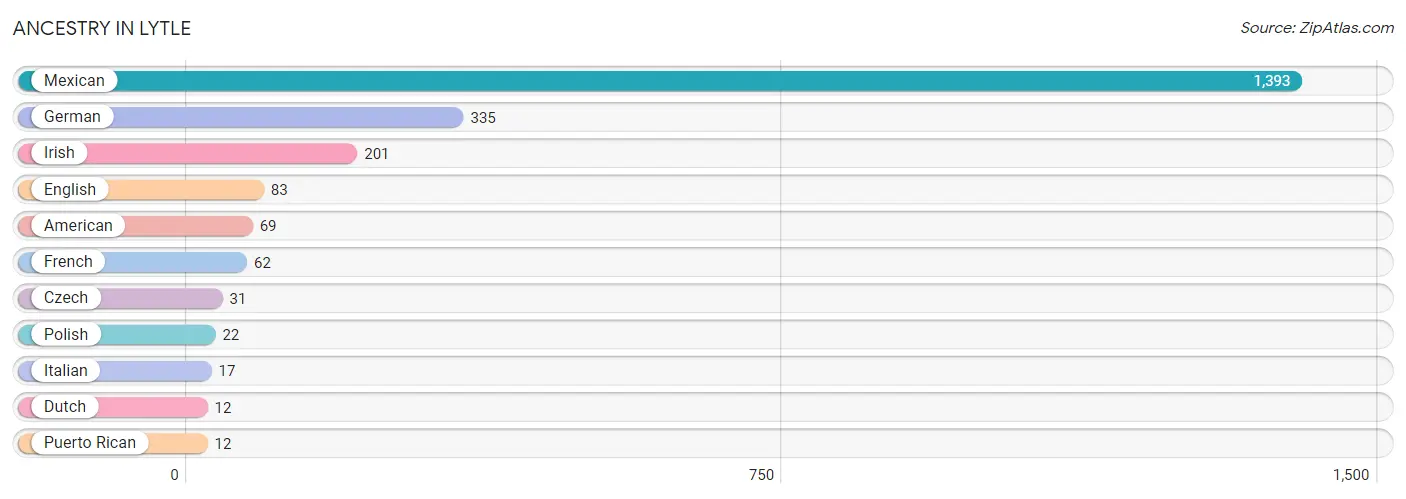
| Ancestry | # Population | % Population |
| American | 69 | 3.0% |
| Czech | 31 | 1.4% |
| Dutch | 12 | 0.5% |
| English | 83 | 3.7% |
| French | 62 | 2.7% |
| German | 335 | 14.8% |
| Irish | 201 | 8.9% |
| Italian | 17 | 0.7% |
| Mexican | 1,393 | 61.6% |
| Polish | 22 | 1.0% |
| Puerto Rican | 12 | 0.5% | View All 11 Rows |
Immigrants in Lytle
The most numerous immigrant groups reported in Lytle came from Central America (34 | 1.5%), Latin America (34 | 1.5%), Mexico (34 | 1.5%), Europe (8 | 0.4%), and France (8 | 0.4%), together accounting for 5.2% of all Lytle residents.
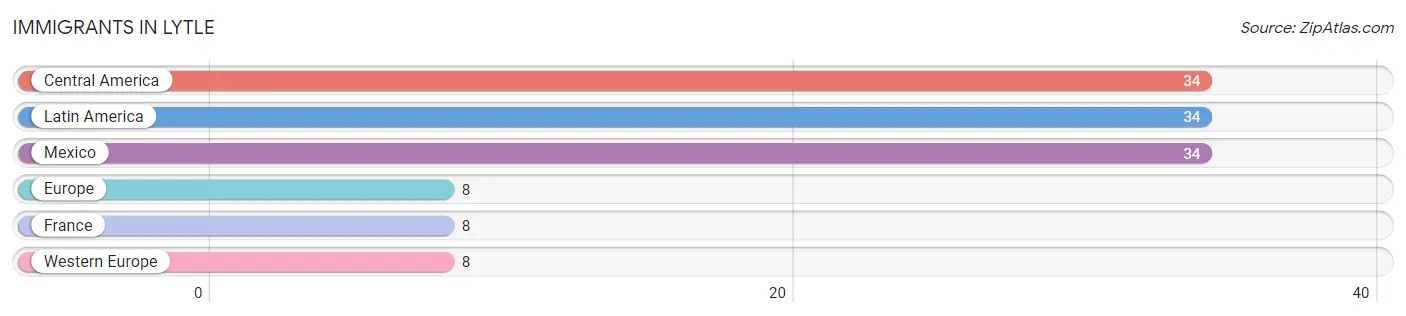
| Immigration Origin | # Population | % Population |
| Central America | 34 | 1.5% |
| Europe | 8 | 0.4% |
| France | 8 | 0.4% |
| Latin America | 34 | 1.5% |
| Mexico | 34 | 1.5% |
| Western Europe | 8 | 0.4% | View All 6 Rows |
Sex and Age in Lytle
Sex and Age in Lytle
The most populous age groups in Lytle are 55 to 59 Years (114 | 9.9%) for men and 20 to 24 Years (121 | 10.9%) for women.
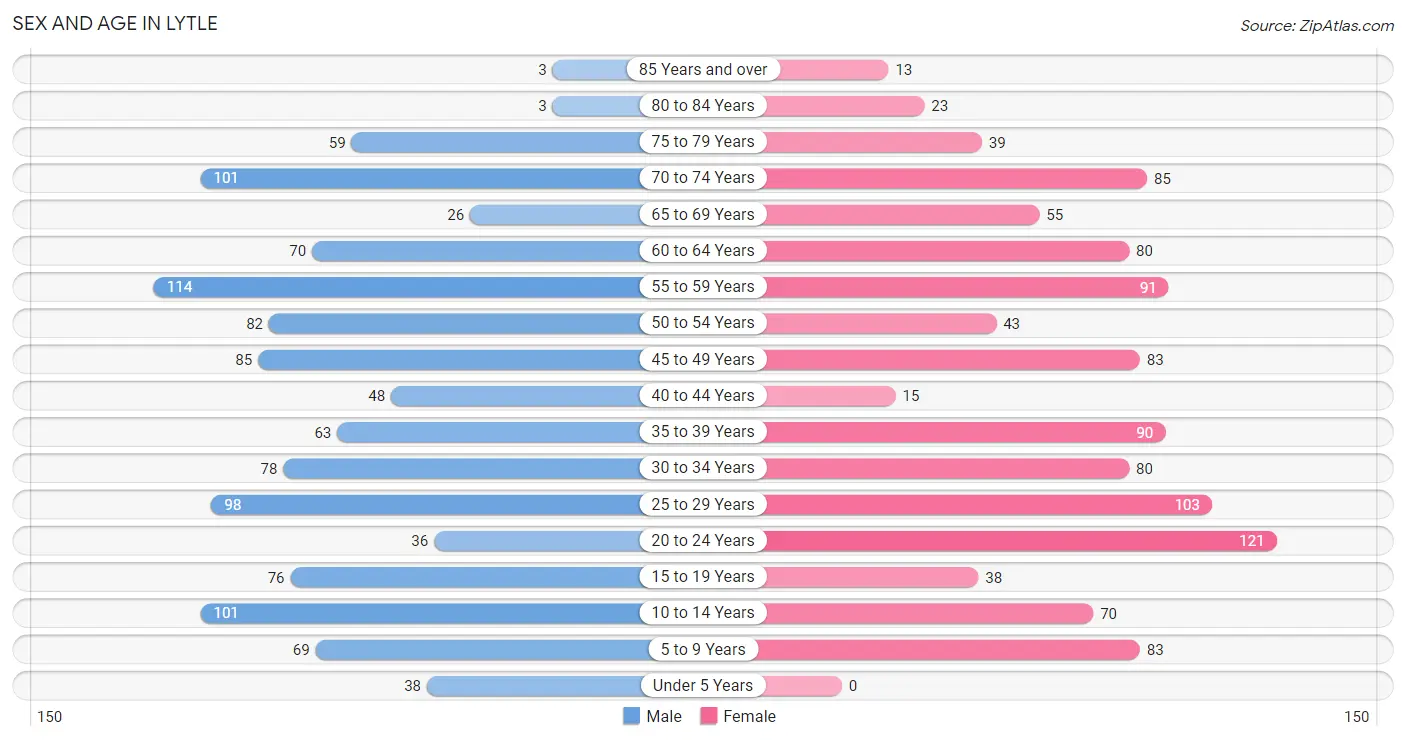
| Age Bracket | Male | Female |
| Under 5 Years | 38 (3.3%) | 0 (0.0%) |
| 5 to 9 Years | 69 (6.0%) | 83 (7.5%) |
| 10 to 14 Years | 101 (8.8%) | 70 (6.3%) |
| 15 to 19 Years | 76 (6.6%) | 38 (3.4%) |
| 20 to 24 Years | 36 (3.1%) | 121 (10.9%) |
| 25 to 29 Years | 98 (8.5%) | 103 (9.3%) |
| 30 to 34 Years | 78 (6.8%) | 80 (7.2%) |
| 35 to 39 Years | 63 (5.5%) | 90 (8.1%) |
| 40 to 44 Years | 48 (4.2%) | 15 (1.3%) |
| 45 to 49 Years | 85 (7.4%) | 83 (7.5%) |
| 50 to 54 Years | 82 (7.1%) | 43 (3.9%) |
| 55 to 59 Years | 114 (9.9%) | 91 (8.2%) |
| 60 to 64 Years | 70 (6.1%) | 80 (7.2%) |
| 65 to 69 Years | 26 (2.3%) | 55 (5.0%) |
| 70 to 74 Years | 101 (8.8%) | 85 (7.6%) |
| 75 to 79 Years | 59 (5.1%) | 39 (3.5%) |
| 80 to 84 Years | 3 (0.3%) | 23 (2.1%) |
| 85 Years and over | 3 (0.3%) | 13 (1.2%) |
| Total | 1,150 (100.0%) | 1,112 (100.0%) |
Families and Households in Lytle
Median Family Size in Lytle
The median family size in Lytle is 3.05 persons per family, with single male/father families (137 | 22.5%) accounting for the largest median family size of 3.2 persons per family. On the other hand, single female/mother families (88 | 14.4%) represent the smallest median family size with 2.85 persons per family.
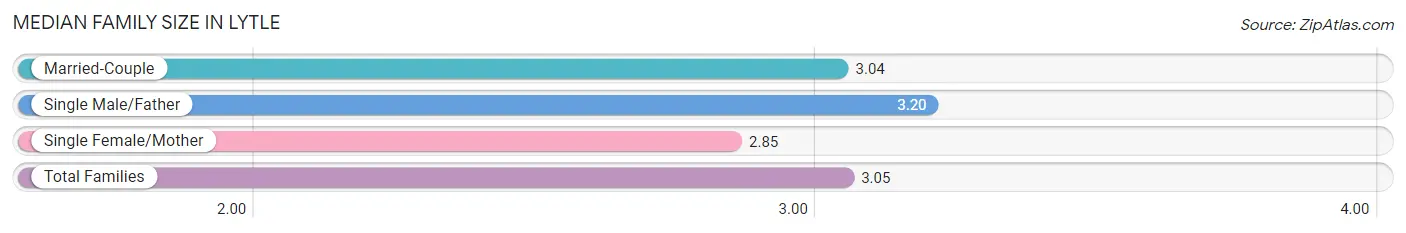
| Family Type | # Families | Family Size |
| Married-Couple | 385 (63.1%) | 3.04 |
| Single Male/Father | 137 (22.5%) | 3.20 |
| Single Female/Mother | 88 (14.4%) | 2.85 |
| Total Families | 610 (100.0%) | 3.05 |
Median Household Size in Lytle
The median household size in Lytle is 2.84 persons per household, with single male/father households (137 | 17.7%) accounting for the largest median household size of 4.15 persons per household. non-family households (163 | 21.1%) represent the smallest median household size with 1.10 persons per household.
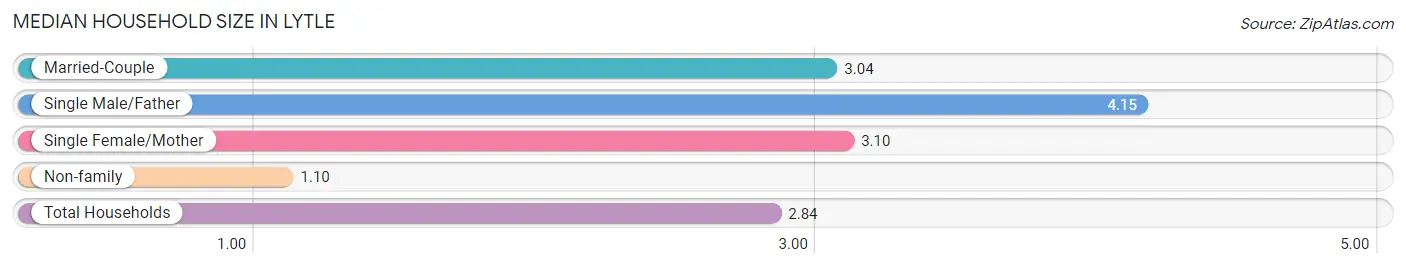
| Household Type | # Households | Household Size |
| Married-Couple | 385 (49.8%) | 3.04 |
| Single Male/Father | 137 (17.7%) | 4.15 |
| Single Female/Mother | 88 (11.4%) | 3.10 |
| Non-family | 163 (21.1%) | 1.10 |
| Total Households | 773 (100.0%) | 2.84 |
Household Size by Marriage Status in Lytle
Out of a total of 773 households in Lytle, 610 (78.9%) are family households, while 163 (21.1%) are nonfamily households. The most numerous type of family households are 2-person households, comprising 353, and the most common type of nonfamily households are 1-person households, comprising 144.
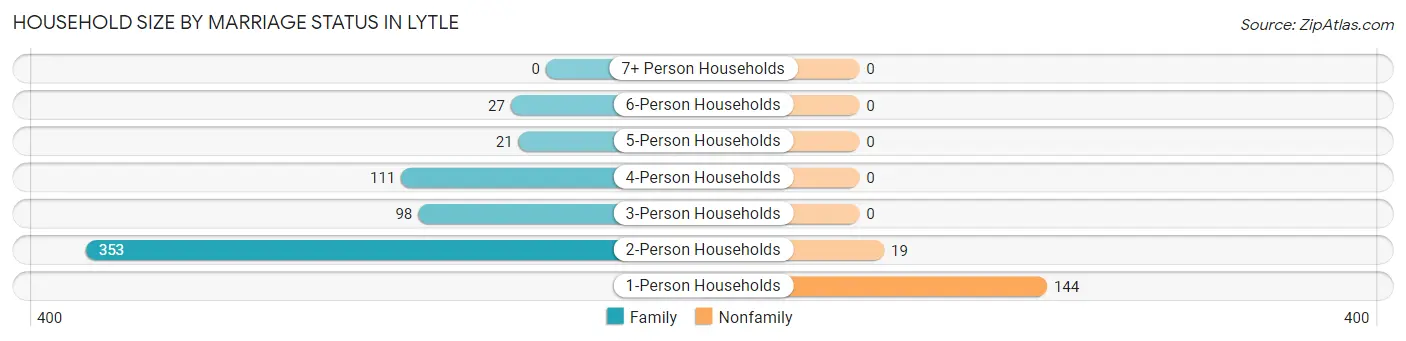
| Household Size | Family Households | Nonfamily Households |
| 1-Person Households | - | 144 (18.6%) |
| 2-Person Households | 353 (45.7%) | 19 (2.5%) |
| 3-Person Households | 98 (12.7%) | 0 (0.0%) |
| 4-Person Households | 111 (14.4%) | 0 (0.0%) |
| 5-Person Households | 21 (2.7%) | 0 (0.0%) |
| 6-Person Households | 27 (3.5%) | 0 (0.0%) |
| 7+ Person Households | 0 (0.0%) | 0 (0.0%) |
| Total | 610 (78.9%) | 163 (21.1%) |
Female Fertility in Lytle
Fertility by Age in Lytle
| Age Bracket | Women with Births | Births / 1,000 Women |
| 15 to 19 years | 0 (0.0%) | 0.0 |
| 20 to 34 years | 0 (0.0%) | 0.0 |
| 35 to 50 years | 0 (0.0%) | 0.0 |
| Total | 0 (0.0%) | 0.0 |
Fertility by Age by Marriage Status in Lytle
| Age Bracket | Married | Unmarried |
| 15 to 19 years | 0 (0.0%) | 0 (0.0%) |
| 20 to 34 years | 0 (0.0%) | 0 (0.0%) |
| 35 to 50 years | 0 (0.0%) | 0 (0.0%) |
| Total | 0 (0.0%) | 0 (0.0%) |
Fertility by Education in Lytle
| Educational Attainment | Women with Births | Births / 1,000 Women |
| Less than High School | 0 (0.0%) | 0.0 |
| High School Diploma | 0 (0.0%) | 0.0 |
| College or Associate's Degree | 0 (0.0%) | 0.0 |
| Bachelor's Degree | 0 (0.0%) | 0.0 |
| Graduate Degree | 0 (0.0%) | 0.0 |
| Total | 0 (0.0%) | 0.0 |
Fertility by Education by Marriage Status in Lytle
| Educational Attainment | Married | Unmarried |
| Less than High School | 0 (0.0%) | 0 (0.0%) |
| High School Diploma | 0 (0.0%) | 0 (0.0%) |
| College or Associate's Degree | 0 (0.0%) | 0 (0.0%) |
| Bachelor's Degree | 0 (0.0%) | 0 (0.0%) |
| Graduate Degree | 0 (0.0%) | 0 (0.0%) |
| Total | 0 (0.0%) | 0 (0.0%) |
Employment Characteristics in Lytle
Employment by Class of Employer in Lytle
Among the 936 employed individuals in Lytle, private company employees (549 | 58.7%), local government employees (179 | 19.1%), and self-employed (not incorporated) (91 | 9.7%) make up the most common classes of employment.
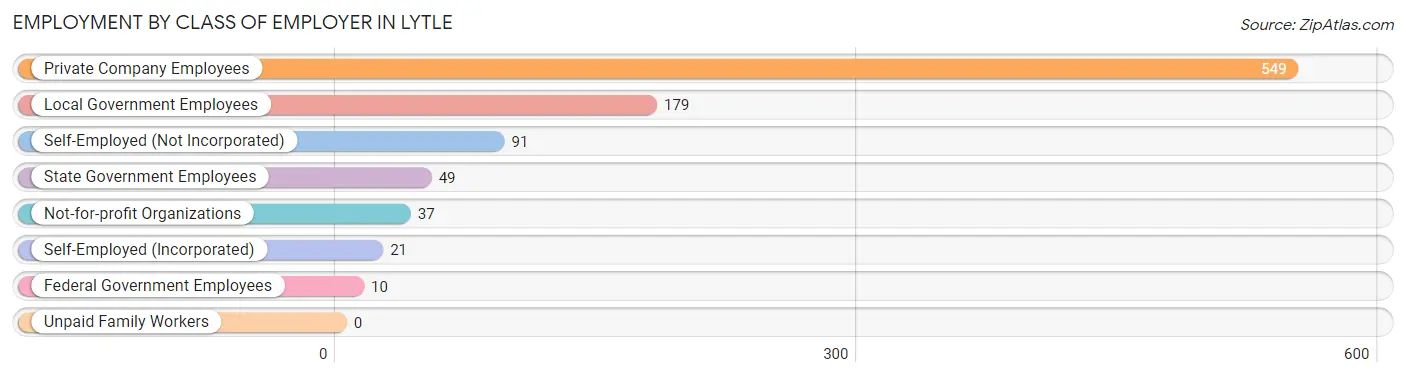
| Employer Class | # Employees | % Employees |
| Private Company Employees | 549 | 58.7% |
| Self-Employed (Incorporated) | 21 | 2.2% |
| Self-Employed (Not Incorporated) | 91 | 9.7% |
| Not-for-profit Organizations | 37 | 4.0% |
| Local Government Employees | 179 | 19.1% |
| State Government Employees | 49 | 5.2% |
| Federal Government Employees | 10 | 1.1% |
| Unpaid Family Workers | 0 | 0.0% |
| Total | 936 | 100.0% |
Employment Status by Age in Lytle
According to the labor force statistics for Lytle, out of the total population over 16 years of age (1,872), 54.5% or 1,020 individuals are in the labor force, with 6.4% or 65 of them unemployed. The age group with the highest labor force participation rate is 30 to 34 years, with 91.8% or 145 individuals in the labor force. Within the labor force, the 35 to 44 years age range has the highest percentage of unemployed individuals, with 27.0% or 48 of them being unemployed.
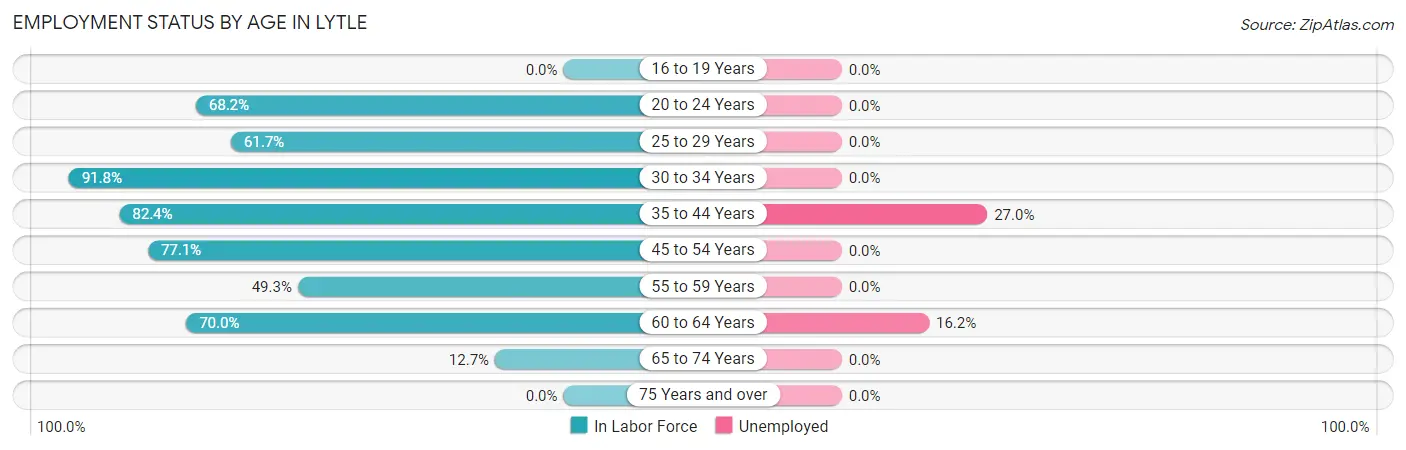
| Age Bracket | In Labor Force | Unemployed |
| 16 to 19 Years | 0 (0.0%) | 0 (0.0%) |
| 20 to 24 Years | 107 (68.2%) | 0 (0.0%) |
| 25 to 29 Years | 124 (61.7%) | 0 (0.0%) |
| 30 to 34 Years | 145 (91.8%) | 0 (0.0%) |
| 35 to 44 Years | 178 (82.4%) | 48 (27.0%) |
| 45 to 54 Years | 226 (77.1%) | 0 (0.0%) |
| 55 to 59 Years | 101 (49.3%) | 0 (0.0%) |
| 60 to 64 Years | 105 (70.0%) | 17 (16.2%) |
| 65 to 74 Years | 34 (12.7%) | 0 (0.0%) |
| 75 Years and over | 0 (0.0%) | 0 (0.0%) |
| Total | 1,020 (54.5%) | 65 (6.4%) |
Employment Status by Educational Attainment in Lytle
According to labor force statistics for Lytle, 71.9% of individuals (879) out of the total population between 25 and 64 years of age (1,223) are in the labor force, with 7.4% or 65 of them being unemployed. The group with the highest labor force participation rate are those with the educational attainment of bachelor's degree or higher, with 83.1% or 162 individuals in the labor force. Within the labor force, individuals with high school diploma education have the highest percentage of unemployment, with 15.7% or 48 of them being unemployed.
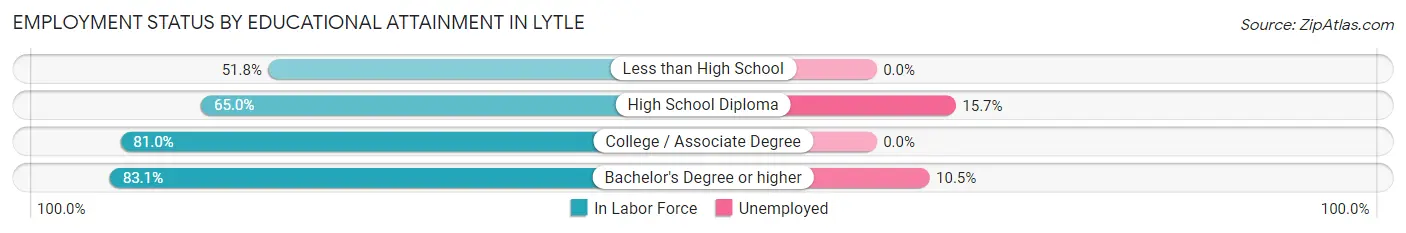
| Educational Attainment | In Labor Force | Unemployed |
| Less than High School | 71 (51.8%) | 0 (0.0%) |
| High School Diploma | 306 (65.0%) | 74 (15.7%) |
| College / Associate Degree | 340 (81.0%) | 0 (0.0%) |
| Bachelor's Degree or higher | 162 (83.1%) | 20 (10.5%) |
| Total | 879 (71.9%) | 91 (7.4%) |
Employment Occupations by Sex in Lytle
Management, Business, Science and Arts Occupations
The most common Management, Business, Science and Arts occupations in Lytle are Management (139 | 14.5%), Health Diagnosing & Treating (61 | 6.4%), Business & Financial (51 | 5.3%), Community & Social Service (24 | 2.5%), and Education Instruction & Library (17 | 1.8%).
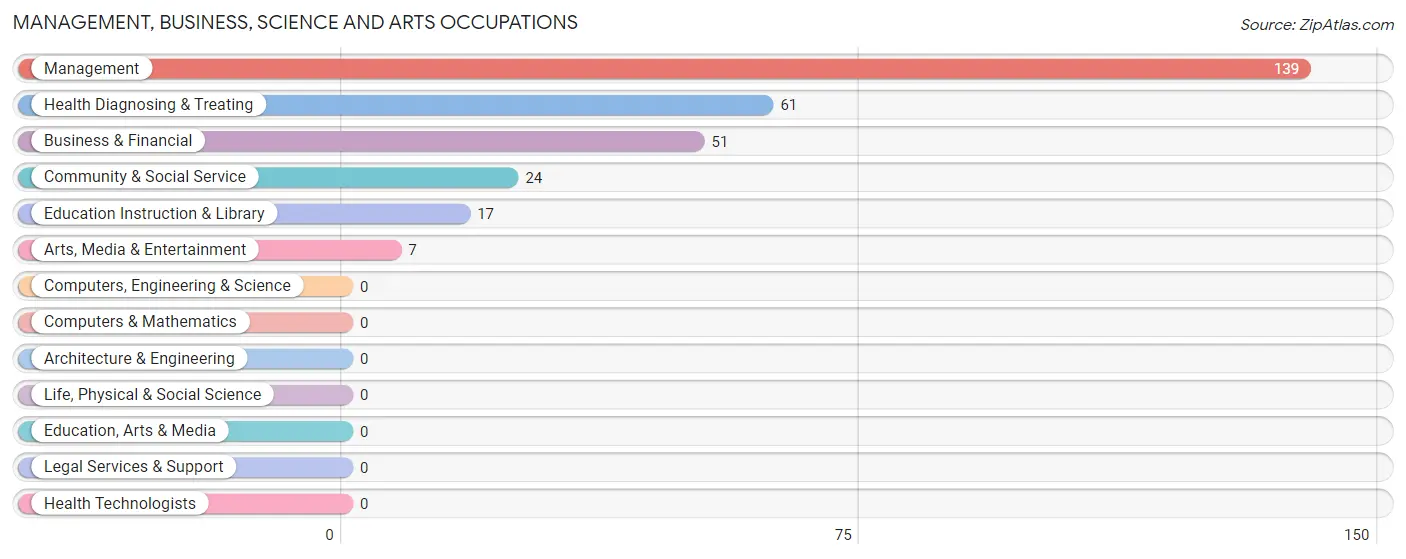
Management, Business, Science and Arts Occupations by Sex
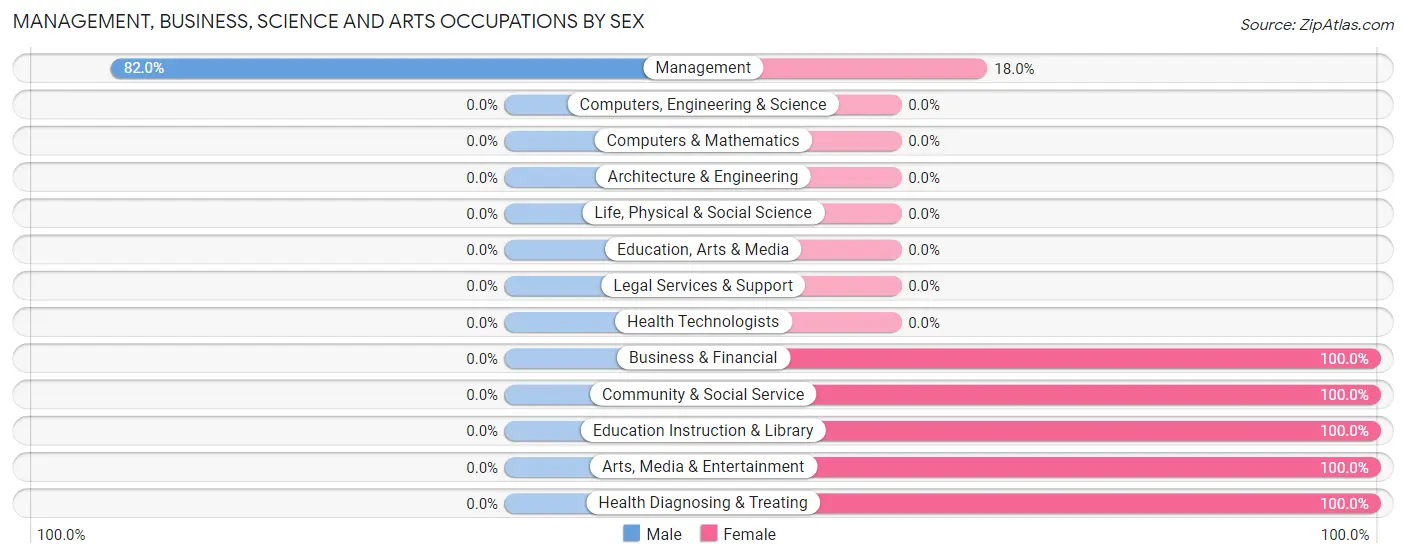
| Occupation | Male | Female |
| Management | 114 (82.0%) | 25 (18.0%) |
| Business & Financial | 0 (0.0%) | 51 (100.0%) |
| Computers, Engineering & Science | 0 (0.0%) | 0 (0.0%) |
| Computers & Mathematics | 0 (0.0%) | 0 (0.0%) |
| Architecture & Engineering | 0 (0.0%) | 0 (0.0%) |
| Life, Physical & Social Science | 0 (0.0%) | 0 (0.0%) |
| Community & Social Service | 0 (0.0%) | 24 (100.0%) |
| Education, Arts & Media | 0 (0.0%) | 0 (0.0%) |
| Legal Services & Support | 0 (0.0%) | 0 (0.0%) |
| Education Instruction & Library | 0 (0.0%) | 17 (100.0%) |
| Arts, Media & Entertainment | 0 (0.0%) | 7 (100.0%) |
| Health Diagnosing & Treating | 0 (0.0%) | 61 (100.0%) |
| Health Technologists | 0 (0.0%) | 0 (0.0%) |
| Total (Category) | 114 (41.4%) | 161 (58.6%) |
| Total (Overall) | 414 (43.3%) | 541 (56.7%) |
Services Occupations
The most common Services occupations in Lytle are Security & Protection (72 | 7.5%), Law Enforcement (72 | 7.5%), Healthcare Support (62 | 6.5%), and Cleaning & Maintenance (33 | 3.5%).
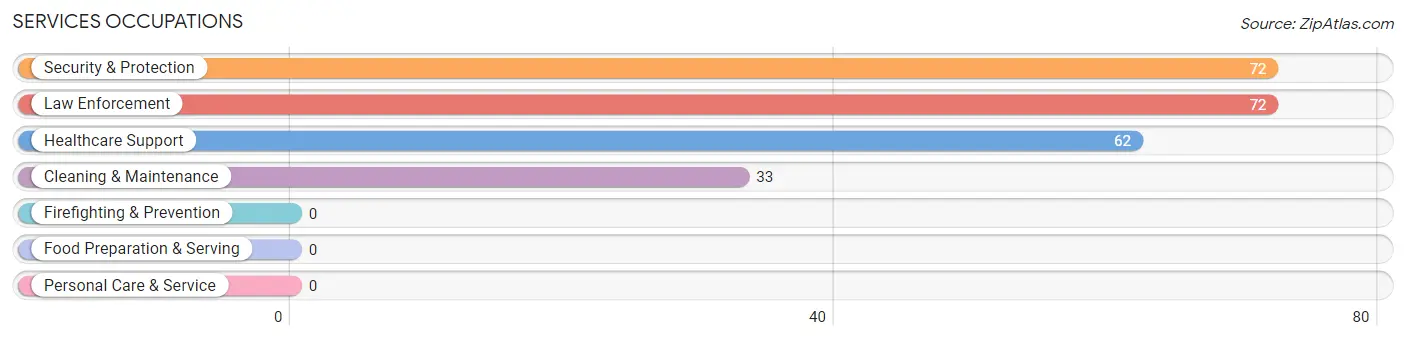
Services Occupations by Sex
Within the Services occupations in Lytle, the most male-oriented occupations are Security & Protection (100.0%), Law Enforcement (100.0%), and Cleaning & Maintenance (57.6%), while the most female-oriented occupations are Healthcare Support (100.0%), and Cleaning & Maintenance (42.4%).
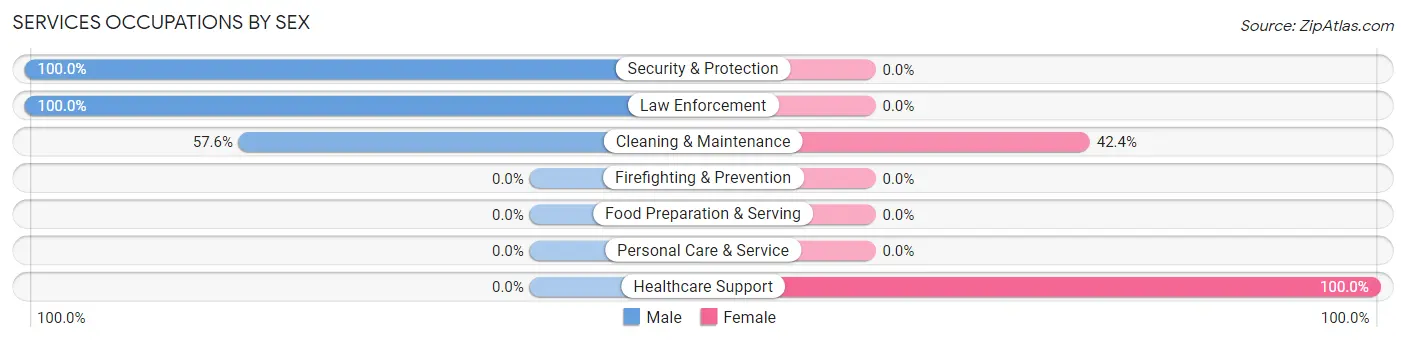
| Occupation | Male | Female |
| Healthcare Support | 0 (0.0%) | 62 (100.0%) |
| Security & Protection | 72 (100.0%) | 0 (0.0%) |
| Firefighting & Prevention | 0 (0.0%) | 0 (0.0%) |
| Law Enforcement | 72 (100.0%) | 0 (0.0%) |
| Food Preparation & Serving | 0 (0.0%) | 0 (0.0%) |
| Cleaning & Maintenance | 19 (57.6%) | 14 (42.4%) |
| Personal Care & Service | 0 (0.0%) | 0 (0.0%) |
| Total (Category) | 91 (54.5%) | 76 (45.5%) |
| Total (Overall) | 414 (43.3%) | 541 (56.7%) |
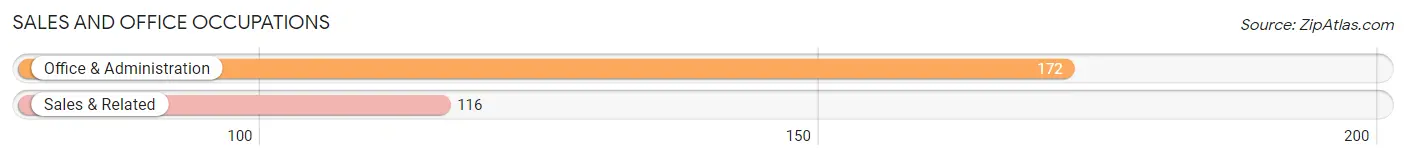
Sales and Office Occupations
The most common Sales and Office occupations in Lytle are Office & Administration (172 | 18.0%), and Sales & Related (116 | 12.1%).
Sales and Office Occupations by Sex
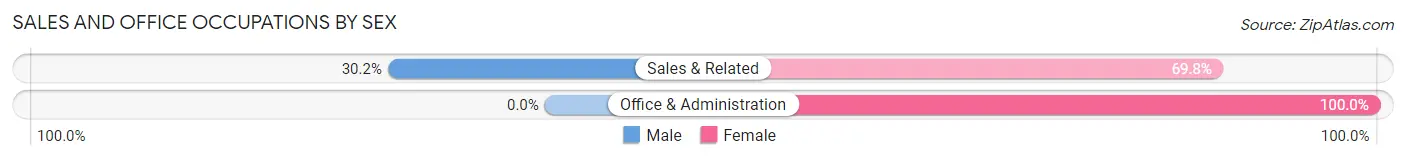
| Occupation | Male | Female |
| Sales & Related | 35 (30.2%) | 81 (69.8%) |
| Office & Administration | 0 (0.0%) | 172 (100.0%) |
| Total (Category) | 35 (12.1%) | 253 (87.8%) |
| Total (Overall) | 414 (43.3%) | 541 (56.7%) |
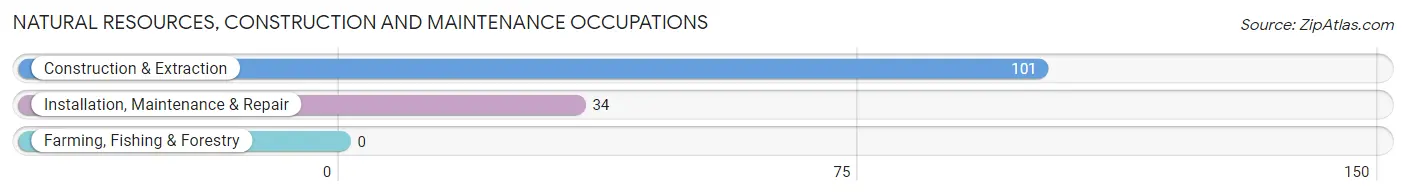
Natural Resources, Construction and Maintenance Occupations
The most common Natural Resources, Construction and Maintenance occupations in Lytle are Construction & Extraction (101 | 10.6%), and Installation, Maintenance & Repair (34 | 3.6%).
Natural Resources, Construction and Maintenance Occupations by Sex
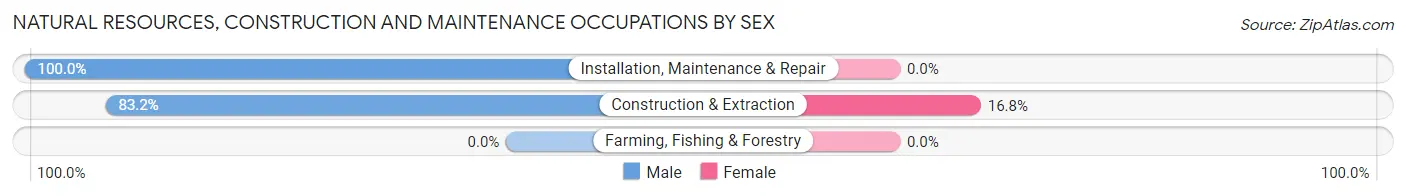
| Occupation | Male | Female |
| Farming, Fishing & Forestry | 0 (0.0%) | 0 (0.0%) |
| Construction & Extraction | 84 (83.2%) | 17 (16.8%) |
| Installation, Maintenance & Repair | 34 (100.0%) | 0 (0.0%) |
| Total (Category) | 118 (87.4%) | 17 (12.6%) |
| Total (Overall) | 414 (43.3%) | 541 (56.7%) |
Production, Transportation and Moving Occupations
The most common Production, Transportation and Moving occupations in Lytle are Transportation (34 | 3.6%), Material Moving (32 | 3.4%), and Production (24 | 2.5%).
Production, Transportation and Moving Occupations by Sex
| Occupation | Male | Female |
| Production | 24 (100.0%) | 0 (0.0%) |
| Transportation | 0 (0.0%) | 34 (100.0%) |
| Material Moving | 32 (100.0%) | 0 (0.0%) |
| Total (Category) | 56 (62.2%) | 34 (37.8%) |
| Total (Overall) | 414 (43.3%) | 541 (56.7%) |
Employment Industries by Sex in Lytle
Employment Industries in Lytle
The major employment industries in Lytle include Retail Trade (181 | 19.0%), Construction (132 | 13.8%), Manufacturing (131 | 13.7%), Educational Services (105 | 11.0%), and Public Administration (88 | 9.2%).
Employment Industries by Sex in Lytle
The Lytle industries that see more men than women are Mining, Quarrying, & Extraction (100.0%), Utilities (100.0%), and Arts, Entertainment & Recreation (100.0%), whereas the industries that tend to have a higher number of women are Wholesale Trade (100.0%), Transportation & Warehousing (100.0%), and Finance & Insurance (100.0%).
| Industry | Male | Female |
| Agriculture, Fishing & Hunting | 0 (0.0%) | 0 (0.0%) |
| Mining, Quarrying, & Extraction | 22 (100.0%) | 0 (0.0%) |
| Construction | 115 (87.1%) | 17 (12.9%) |
| Manufacturing | 21 (16.0%) | 110 (84.0%) |
| Wholesale Trade | 0 (0.0%) | 14 (100.0%) |
| Retail Trade | 82 (45.3%) | 99 (54.7%) |
| Transportation & Warehousing | 0 (0.0%) | 6 (100.0%) |
| Utilities | 16 (100.0%) | 0 (0.0%) |
| Information | 0 (0.0%) | 0 (0.0%) |
| Finance & Insurance | 0 (0.0%) | 23 (100.0%) |
| Real Estate, Rental & Leasing | 0 (0.0%) | 20 (100.0%) |
| Professional & Scientific | 8 (11.6%) | 61 (88.4%) |
| Enterprise Management | 0 (0.0%) | 0 (0.0%) |
| Administrative & Support | 0 (0.0%) | 7 (100.0%) |
| Educational Services | 17 (16.2%) | 88 (83.8%) |
| Health Care & Social Assistance | 16 (20.8%) | 61 (79.2%) |
| Arts, Entertainment & Recreation | 19 (100.0%) | 0 (0.0%) |
| Accommodation & Food Services | 21 (52.5%) | 19 (47.5%) |
| Public Administration | 72 (81.8%) | 16 (18.2%) |
| Total | 414 (43.3%) | 541 (56.7%) |
Education in Lytle
School Enrollment in Lytle
The most common levels of schooling among the 529 students in Lytle are middle school (197 | 37.2%), elementary school (104 | 19.7%), and college / undergraduate (93 | 17.6%).
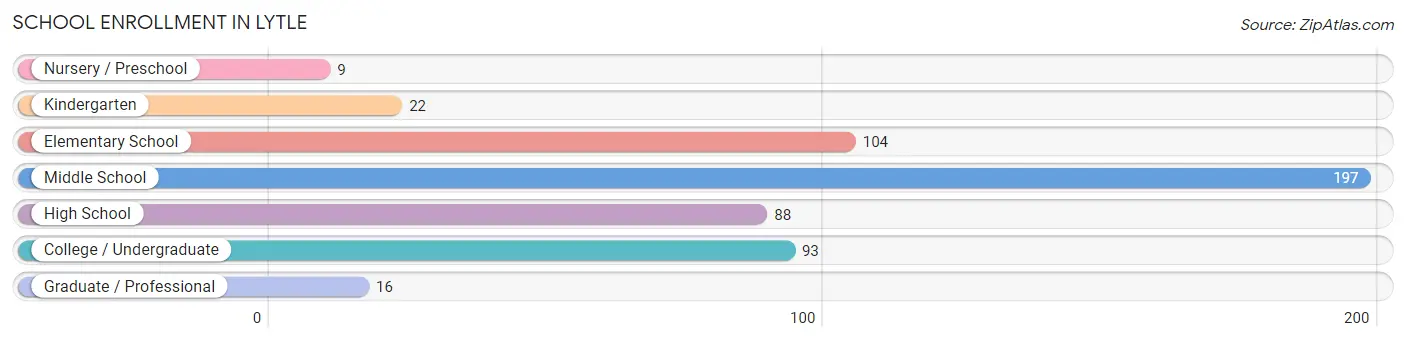
| School Level | # Students | % Students |
| Nursery / Preschool | 9 | 1.7% |
| Kindergarten | 22 | 4.2% |
| Elementary School | 104 | 19.7% |
| Middle School | 197 | 37.2% |
| High School | 88 | 16.6% |
| College / Undergraduate | 93 | 17.6% |
| Graduate / Professional | 16 | 3.0% |
| Total | 529 | 100.0% |
School Enrollment by Age by Funding Source in Lytle
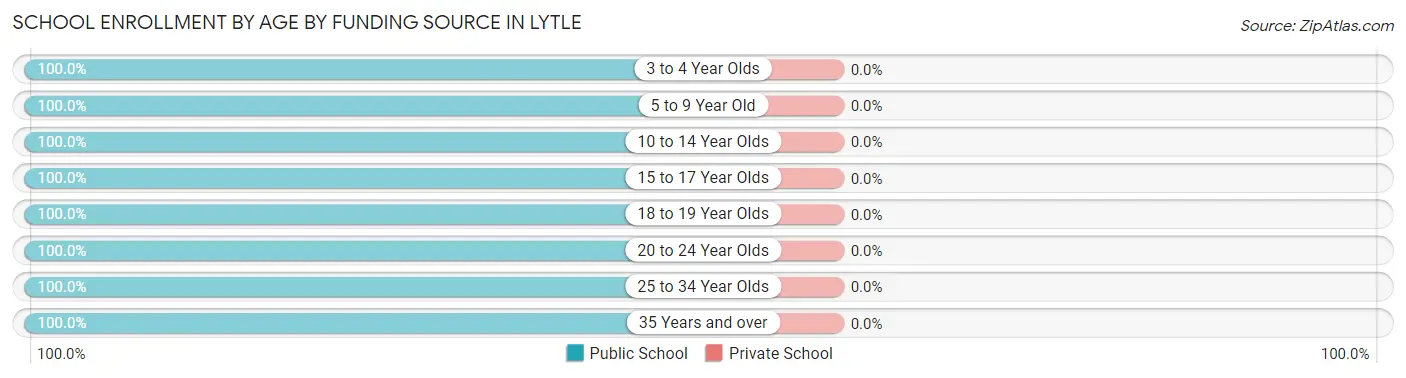
| Age Bracket | Public School | Private School |
| 3 to 4 Year Olds | 9 (100.0%) | 0 (0.0%) |
| 5 to 9 Year Old | 152 (100.0%) | 0 (0.0%) |
| 10 to 14 Year Olds | 171 (100.0%) | 0 (0.0%) |
| 15 to 17 Year Olds | 47 (100.0%) | 0 (0.0%) |
| 18 to 19 Year Olds | 44 (100.0%) | 0 (0.0%) |
| 20 to 24 Year Olds | 59 (100.0%) | 0 (0.0%) |
| 25 to 34 Year Olds | 31 (100.0%) | 0 (0.0%) |
| 35 Years and over | 16 (100.0%) | 0 (0.0%) |
| Total | 529 (100.0%) | 0 (0.0%) |
Educational Attainment by Field of Study in Lytle
Education (55 | 21.9%), business (46 | 18.3%), engineering (34 | 13.6%), liberal arts & history (32 | 12.8%), and science & technology (30 | 11.9%) are the most common fields of study among 251 individuals in Lytle who have obtained a bachelor's degree or higher.
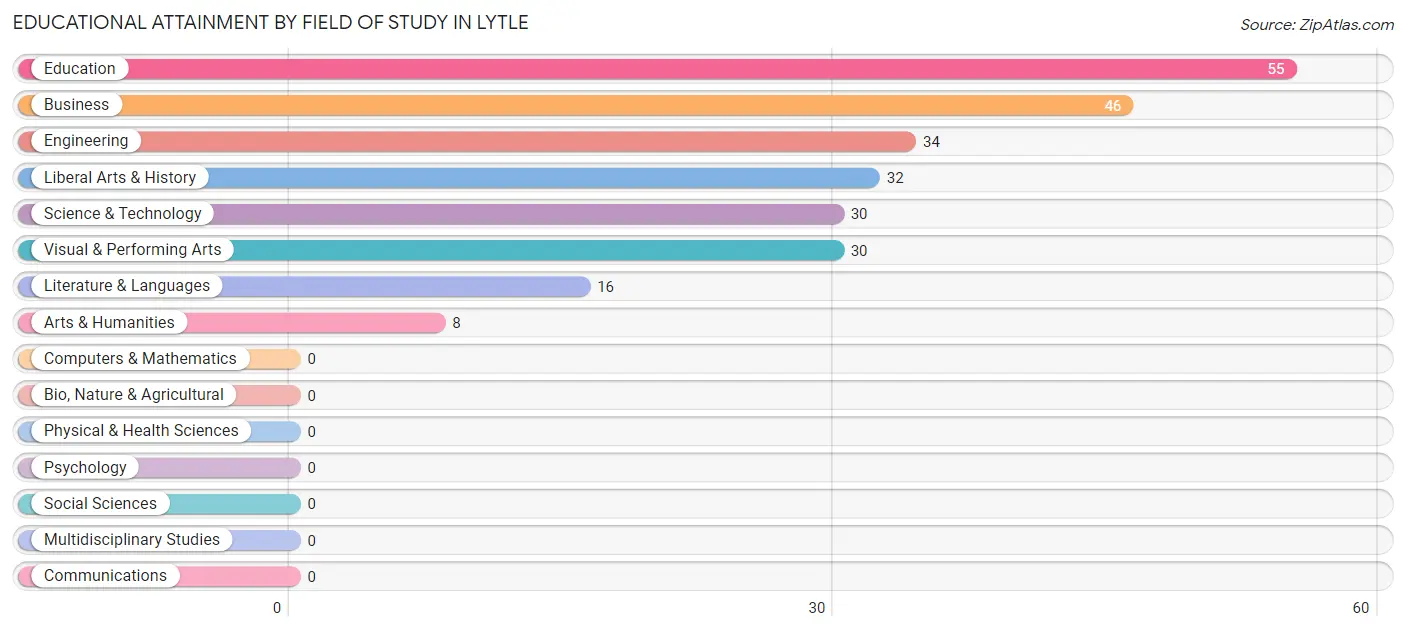
| Field of Study | # Graduates | % Graduates |
| Computers & Mathematics | 0 | 0.0% |
| Bio, Nature & Agricultural | 0 | 0.0% |
| Physical & Health Sciences | 0 | 0.0% |
| Psychology | 0 | 0.0% |
| Social Sciences | 0 | 0.0% |
| Engineering | 34 | 13.6% |
| Multidisciplinary Studies | 0 | 0.0% |
| Science & Technology | 30 | 11.9% |
| Business | 46 | 18.3% |
| Education | 55 | 21.9% |
| Literature & Languages | 16 | 6.4% |
| Liberal Arts & History | 32 | 12.8% |
| Visual & Performing Arts | 30 | 11.9% |
| Communications | 0 | 0.0% |
| Arts & Humanities | 8 | 3.2% |
| Total | 251 | 100.0% |
Transportation & Commute in Lytle
Vehicle Availability by Sex in Lytle
The most prevalent vehicle ownership categories in Lytle are males with 2 vehicles (180, accounting for 43.5%) and females with 2 vehicles (222, making up 34.5%).
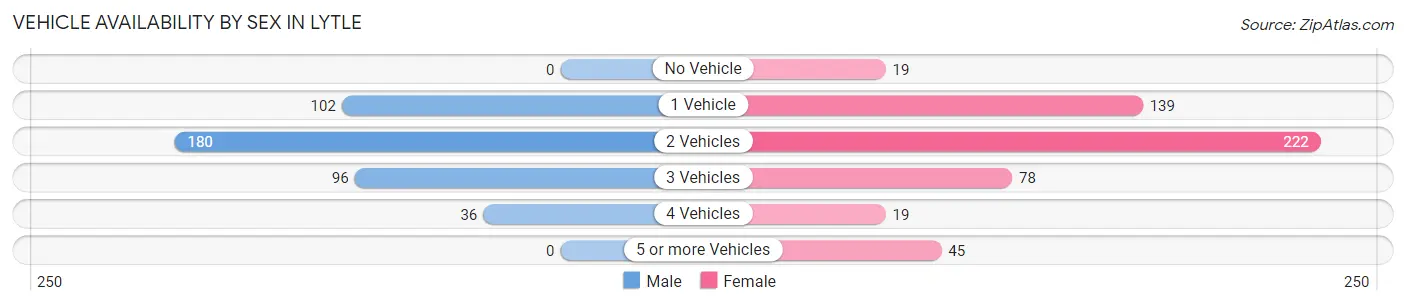
| Vehicles Available | Male | Female |
| No Vehicle | 0 (0.0%) | 19 (3.6%) |
| 1 Vehicle | 102 (24.6%) | 139 (26.6%) |
| 2 Vehicles | 180 (43.5%) | 222 (42.5%) |
| 3 Vehicles | 96 (23.2%) | 78 (14.9%) |
| 4 Vehicles | 36 (8.7%) | 19 (3.6%) |
| 5 or more Vehicles | 0 (0.0%) | 45 (8.6%) |
| Total | 414 (100.0%) | 522 (100.0%) |
Commute Time in Lytle
The most frequently occuring commute durations in Lytle are less than 5 minutes (126 commuters, 14.5%), 30 to 34 minutes (123 commuters, 14.1%), and 5 to 9 minutes (107 commuters, 12.3%).
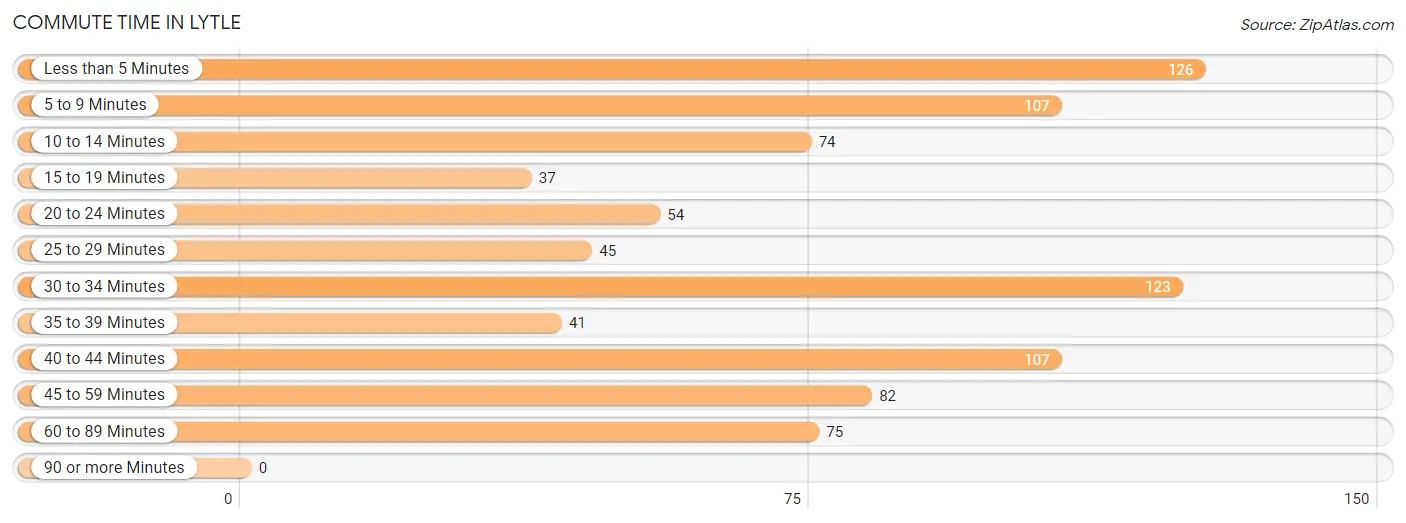
| Commute Time | # Commuters | % Commuters |
| Less than 5 Minutes | 126 | 14.5% |
| 5 to 9 Minutes | 107 | 12.3% |
| 10 to 14 Minutes | 74 | 8.5% |
| 15 to 19 Minutes | 37 | 4.3% |
| 20 to 24 Minutes | 54 | 6.2% |
| 25 to 29 Minutes | 45 | 5.2% |
| 30 to 34 Minutes | 123 | 14.1% |
| 35 to 39 Minutes | 41 | 4.7% |
| 40 to 44 Minutes | 107 | 12.3% |
| 45 to 59 Minutes | 82 | 9.4% |
| 60 to 89 Minutes | 75 | 8.6% |
| 90 or more Minutes | 0 | 0.0% |
Commute Time by Sex in Lytle
The most common commute times in Lytle are 45 to 59 minutes (71 commuters, 17.9%) for males and 5 to 9 minutes (107 commuters, 22.6%) for females.
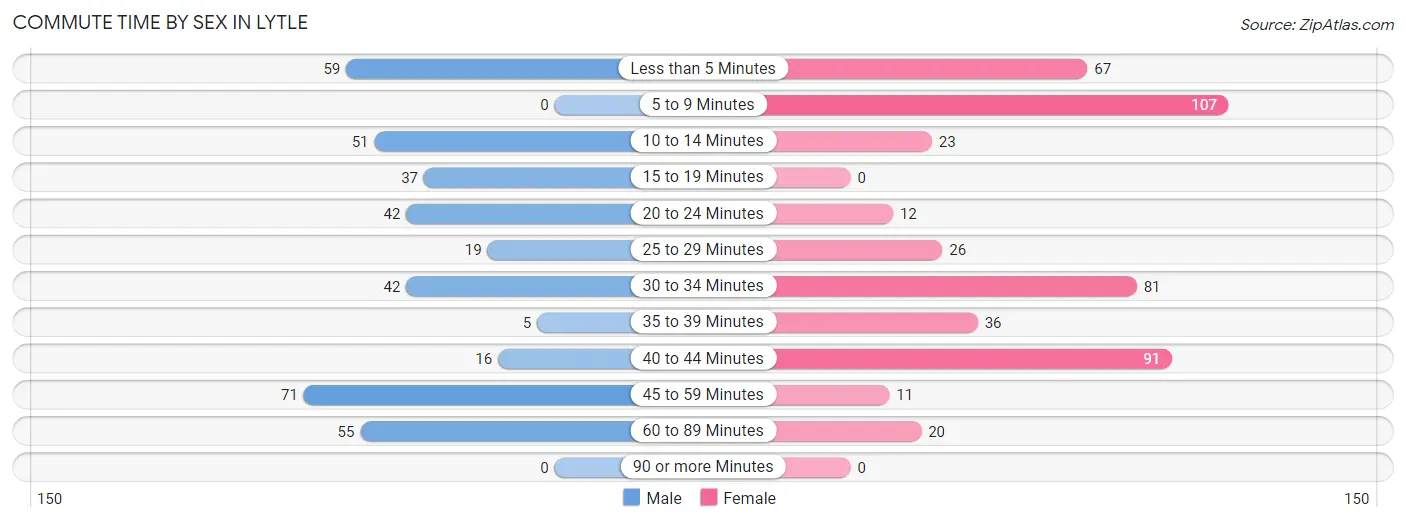
| Commute Time | Male | Female |
| Less than 5 Minutes | 59 (14.9%) | 67 (14.1%) |
| 5 to 9 Minutes | 0 (0.0%) | 107 (22.6%) |
| 10 to 14 Minutes | 51 (12.9%) | 23 (4.9%) |
| 15 to 19 Minutes | 37 (9.3%) | 0 (0.0%) |
| 20 to 24 Minutes | 42 (10.6%) | 12 (2.5%) |
| 25 to 29 Minutes | 19 (4.8%) | 26 (5.5%) |
| 30 to 34 Minutes | 42 (10.6%) | 81 (17.1%) |
| 35 to 39 Minutes | 5 (1.3%) | 36 (7.6%) |
| 40 to 44 Minutes | 16 (4.0%) | 91 (19.2%) |
| 45 to 59 Minutes | 71 (17.9%) | 11 (2.3%) |
| 60 to 89 Minutes | 55 (13.9%) | 20 (4.2%) |
| 90 or more Minutes | 0 (0.0%) | 0 (0.0%) |
Time of Departure to Work by Sex in Lytle
The most frequent times of departure to work in Lytle are 4:00 PM to 11:59 PM (96, 24.2%) for males and 6:00 AM to 6:29 AM (124, 26.2%) for females.
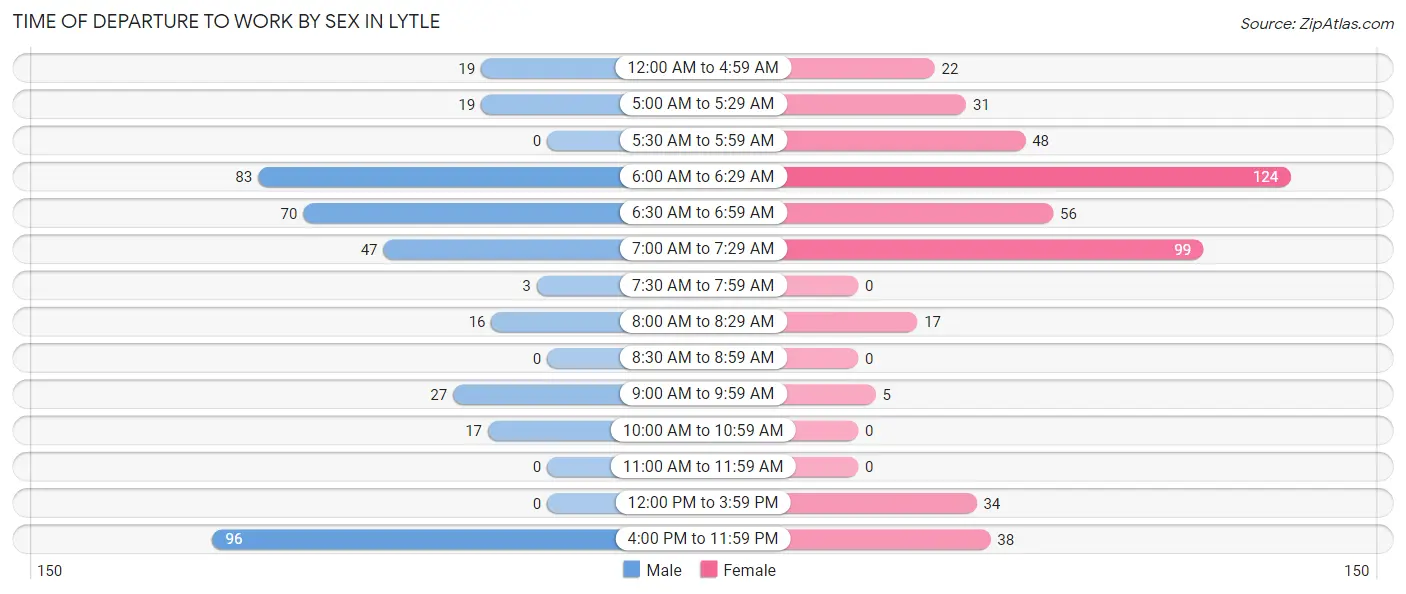
| Time of Departure | Male | Female |
| 12:00 AM to 4:59 AM | 19 (4.8%) | 22 (4.6%) |
| 5:00 AM to 5:29 AM | 19 (4.8%) | 31 (6.5%) |
| 5:30 AM to 5:59 AM | 0 (0.0%) | 48 (10.1%) |
| 6:00 AM to 6:29 AM | 83 (20.9%) | 124 (26.2%) |
| 6:30 AM to 6:59 AM | 70 (17.6%) | 56 (11.8%) |
| 7:00 AM to 7:29 AM | 47 (11.8%) | 99 (20.9%) |
| 7:30 AM to 7:59 AM | 3 (0.8%) | 0 (0.0%) |
| 8:00 AM to 8:29 AM | 16 (4.0%) | 17 (3.6%) |
| 8:30 AM to 8:59 AM | 0 (0.0%) | 0 (0.0%) |
| 9:00 AM to 9:59 AM | 27 (6.8%) | 5 (1.1%) |
| 10:00 AM to 10:59 AM | 17 (4.3%) | 0 (0.0%) |
| 11:00 AM to 11:59 AM | 0 (0.0%) | 0 (0.0%) |
| 12:00 PM to 3:59 PM | 0 (0.0%) | 34 (7.2%) |
| 4:00 PM to 11:59 PM | 96 (24.2%) | 38 (8.0%) |
| Total | 397 (100.0%) | 474 (100.0%) |
Housing Occupancy in Lytle
Occupancy by Ownership in Lytle
Of the total 773 dwellings in Lytle, owner-occupied units account for 524 (67.8%), while renter-occupied units make up 249 (32.2%).
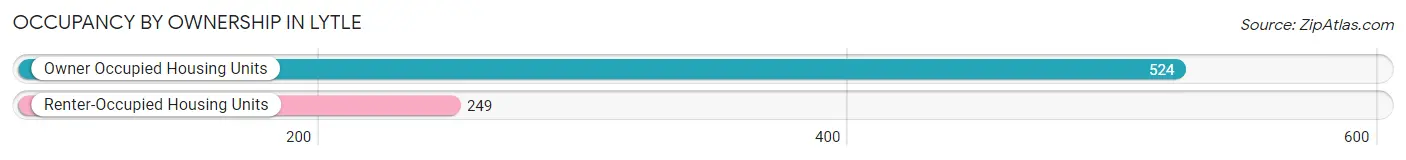
| Occupancy | # Housing Units | % Housing Units |
| Owner Occupied Housing Units | 524 | 67.8% |
| Renter-Occupied Housing Units | 249 | 32.2% |
| Total Occupied Housing Units | 773 | 100.0% |
Occupancy by Household Size in Lytle
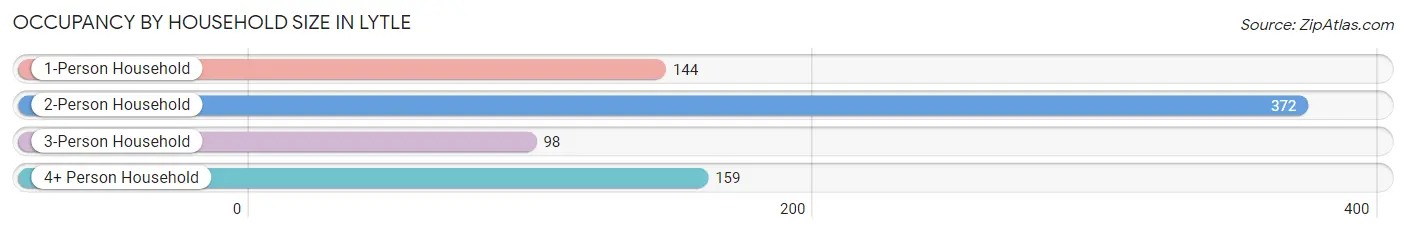
| Household Size | # Housing Units | % Housing Units |
| 1-Person Household | 144 | 18.6% |
| 2-Person Household | 372 | 48.1% |
| 3-Person Household | 98 | 12.7% |
| 4+ Person Household | 159 | 20.6% |
| Total Housing Units | 773 | 100.0% |
Occupancy by Ownership by Household Size in Lytle
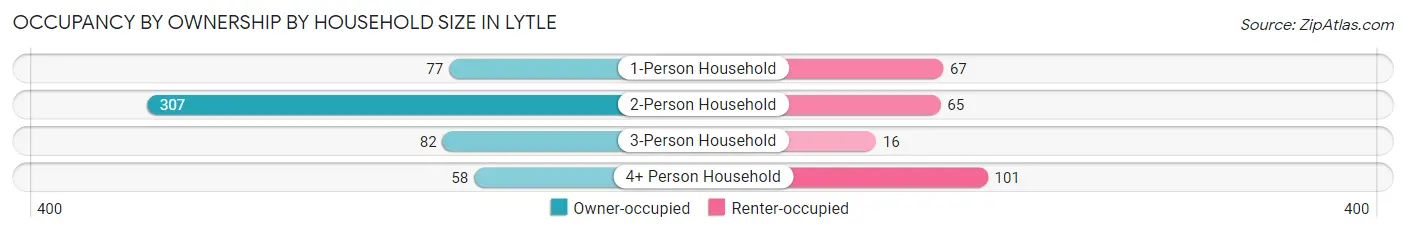
| Household Size | Owner-occupied | Renter-occupied |
| 1-Person Household | 77 (53.5%) | 67 (46.5%) |
| 2-Person Household | 307 (82.5%) | 65 (17.5%) |
| 3-Person Household | 82 (83.7%) | 16 (16.3%) |
| 4+ Person Household | 58 (36.5%) | 101 (63.5%) |
| Total Housing Units | 524 (67.8%) | 249 (32.2%) |
Occupancy by Educational Attainment in Lytle
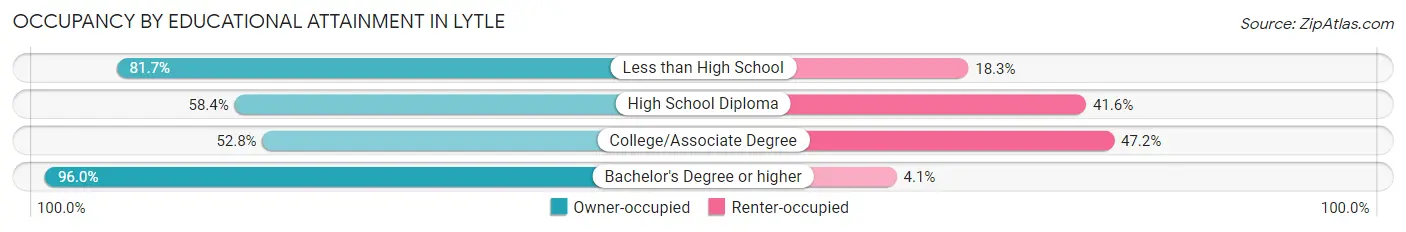
| Household Size | Owner-occupied | Renter-occupied |
| Less than High School | 94 (81.7%) | 21 (18.3%) |
| High School Diploma | 195 (58.4%) | 139 (41.6%) |
| College/Associate Degree | 93 (52.8%) | 83 (47.2%) |
| Bachelor's Degree or higher | 142 (96.0%) | 6 (4.1%) |
Occupancy by Age of Householder in Lytle
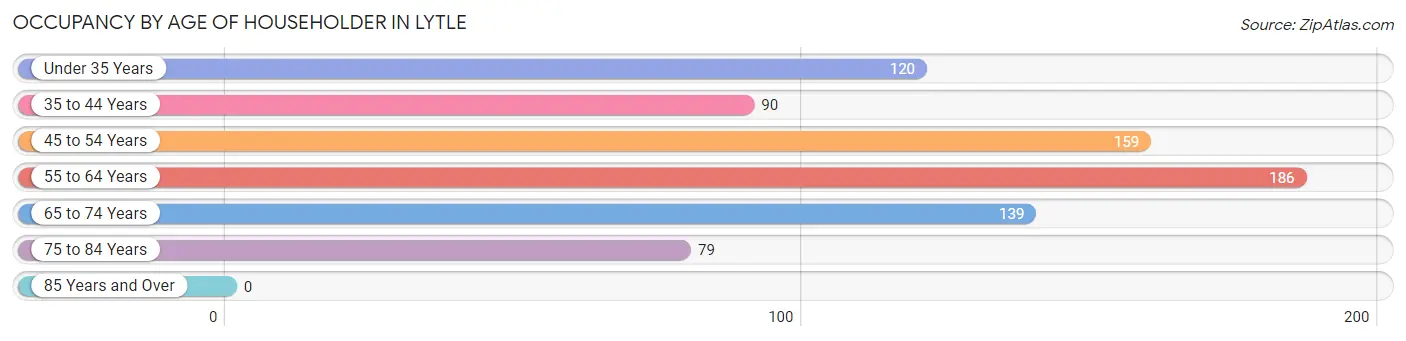
| Age Bracket | # Households | % Households |
| Under 35 Years | 120 | 15.5% |
| 35 to 44 Years | 90 | 11.6% |
| 45 to 54 Years | 159 | 20.6% |
| 55 to 64 Years | 186 | 24.1% |
| 65 to 74 Years | 139 | 18.0% |
| 75 to 84 Years | 79 | 10.2% |
| 85 Years and Over | 0 | 0.0% |
| Total | 773 | 100.0% |
Housing Finances in Lytle
Median Income by Occupancy in Lytle
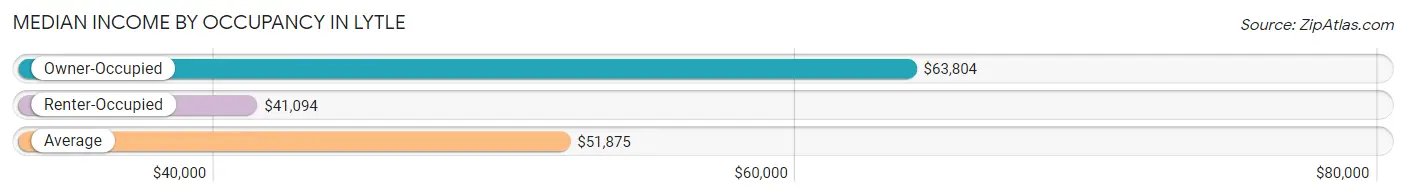
| Occupancy Type | # Households | Median Income |
| Owner-Occupied | 524 (67.8%) | $63,804 |
| Renter-Occupied | 249 (32.2%) | $41,094 |
| Average | 773 (100.0%) | $51,875 |
Occupancy by Householder Income Bracket in Lytle
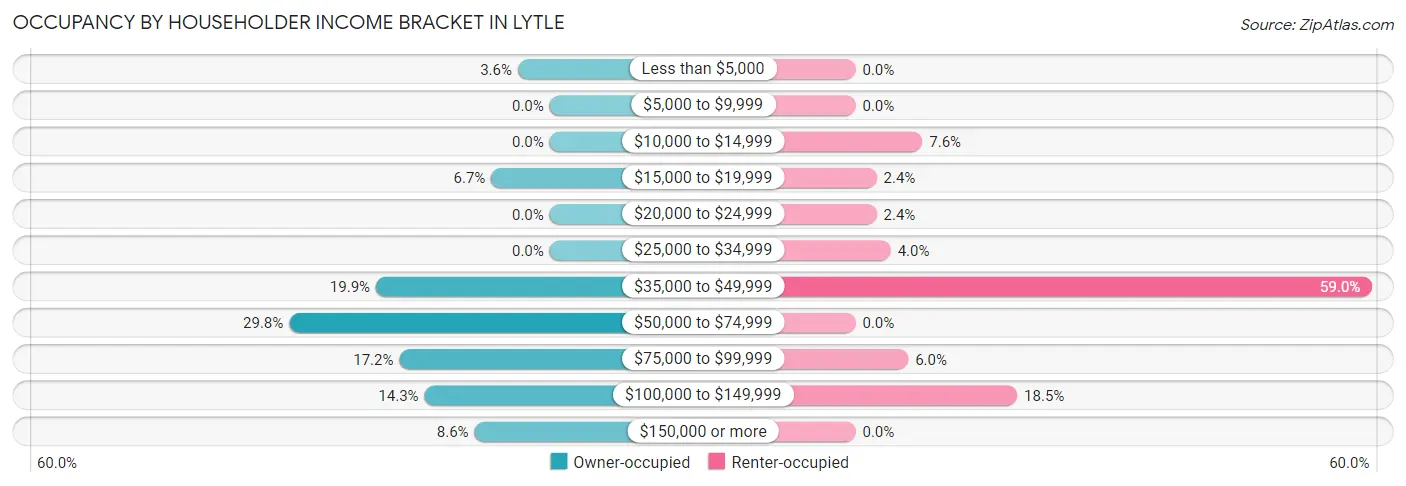
| Income Bracket | Owner-occupied | Renter-occupied |
| Less than $5,000 | 19 (3.6%) | 0 (0.0%) |
| $5,000 to $9,999 | 0 (0.0%) | 0 (0.0%) |
| $10,000 to $14,999 | 0 (0.0%) | 19 (7.6%) |
| $15,000 to $19,999 | 35 (6.7%) | 6 (2.4%) |
| $20,000 to $24,999 | 0 (0.0%) | 6 (2.4%) |
| $25,000 to $34,999 | 0 (0.0%) | 10 (4.0%) |
| $35,000 to $49,999 | 104 (19.9%) | 147 (59.0%) |
| $50,000 to $74,999 | 156 (29.8%) | 0 (0.0%) |
| $75,000 to $99,999 | 90 (17.2%) | 15 (6.0%) |
| $100,000 to $149,999 | 75 (14.3%) | 46 (18.5%) |
| $150,000 or more | 45 (8.6%) | 0 (0.0%) |
| Total | 524 (100.0%) | 249 (100.0%) |
Monthly Housing Cost Tiers in Lytle
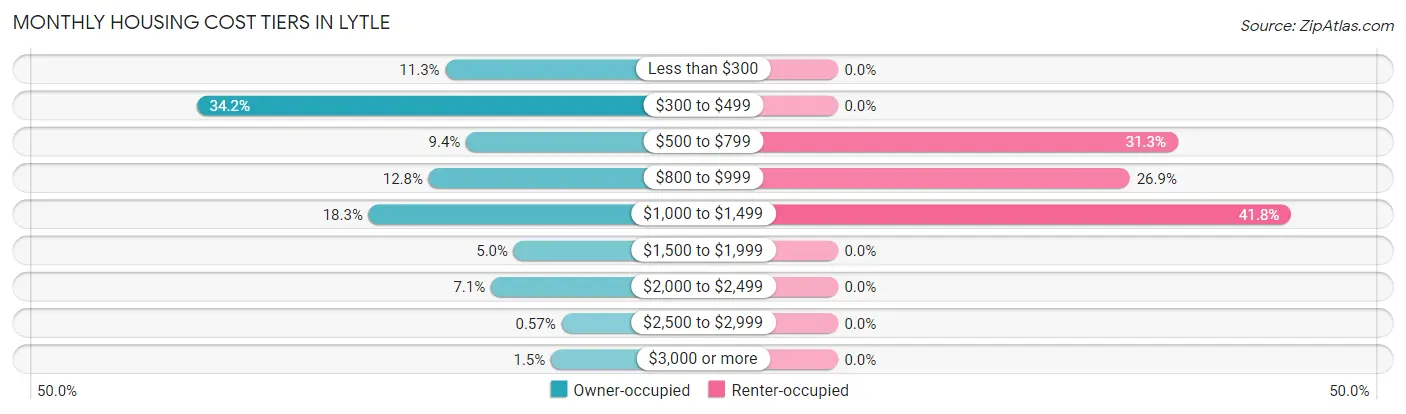
| Monthly Cost | Owner-occupied | Renter-occupied |
| Less than $300 | 59 (11.3%) | 0 (0.0%) |
| $300 to $499 | 179 (34.2%) | 0 (0.0%) |
| $500 to $799 | 49 (9.3%) | 78 (31.3%) |
| $800 to $999 | 67 (12.8%) | 67 (26.9%) |
| $1,000 to $1,499 | 96 (18.3%) | 104 (41.8%) |
| $1,500 to $1,999 | 26 (5.0%) | 0 (0.0%) |
| $2,000 to $2,499 | 37 (7.1%) | 0 (0.0%) |
| $2,500 to $2,999 | 3 (0.6%) | 0 (0.0%) |
| $3,000 or more | 8 (1.5%) | 0 (0.0%) |
| Total | 524 (100.0%) | 249 (100.0%) |
Physical Housing Characteristics in Lytle
Housing Structures in Lytle
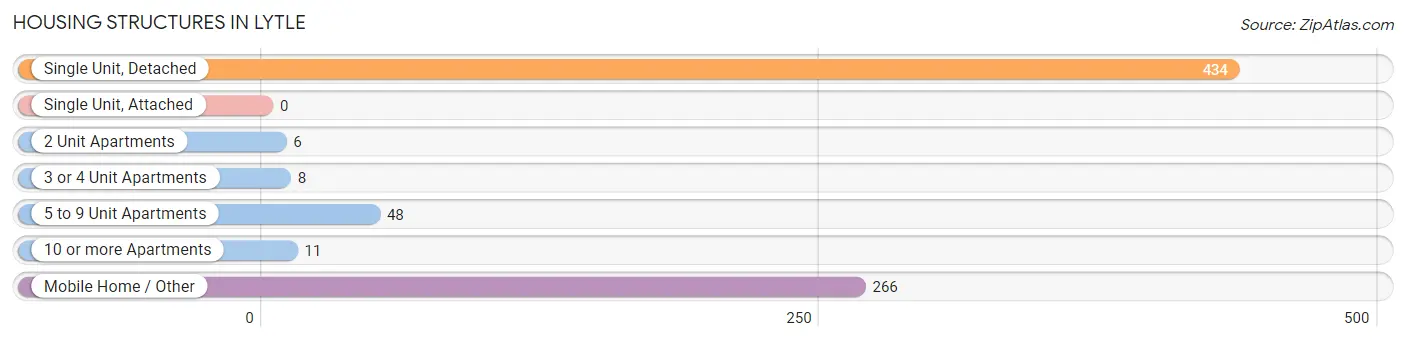
| Structure Type | # Housing Units | % Housing Units |
| Single Unit, Detached | 434 | 56.1% |
| Single Unit, Attached | 0 | 0.0% |
| 2 Unit Apartments | 6 | 0.8% |
| 3 or 4 Unit Apartments | 8 | 1.0% |
| 5 to 9 Unit Apartments | 48 | 6.2% |
| 10 or more Apartments | 11 | 1.4% |
| Mobile Home / Other | 266 | 34.4% |
| Total | 773 | 100.0% |
Housing Structures by Occupancy in Lytle
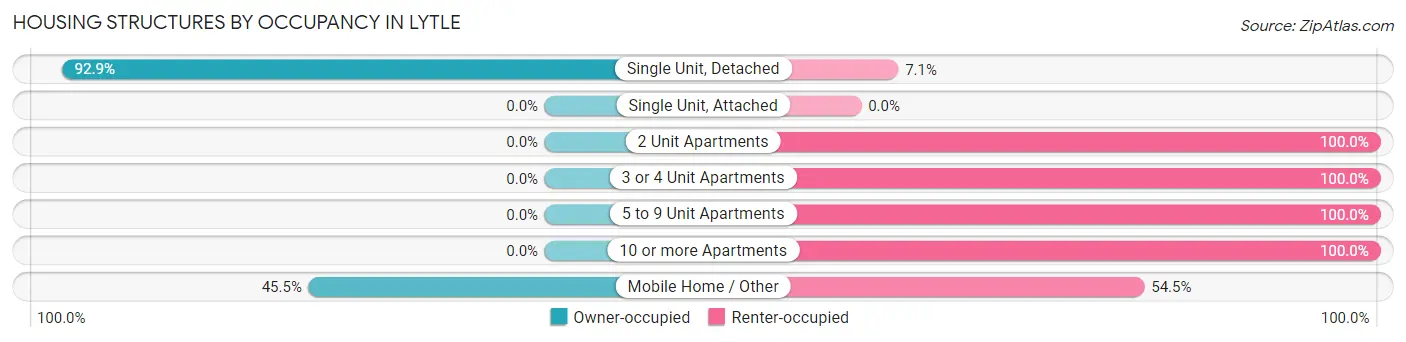
| Structure Type | Owner-occupied | Renter-occupied |
| Single Unit, Detached | 403 (92.9%) | 31 (7.1%) |
| Single Unit, Attached | 0 (0.0%) | 0 (0.0%) |
| 2 Unit Apartments | 0 (0.0%) | 6 (100.0%) |
| 3 or 4 Unit Apartments | 0 (0.0%) | 8 (100.0%) |
| 5 to 9 Unit Apartments | 0 (0.0%) | 48 (100.0%) |
| 10 or more Apartments | 0 (0.0%) | 11 (100.0%) |
| Mobile Home / Other | 121 (45.5%) | 145 (54.5%) |
| Total | 524 (67.8%) | 249 (32.2%) |
Housing Structures by Number of Rooms in Lytle
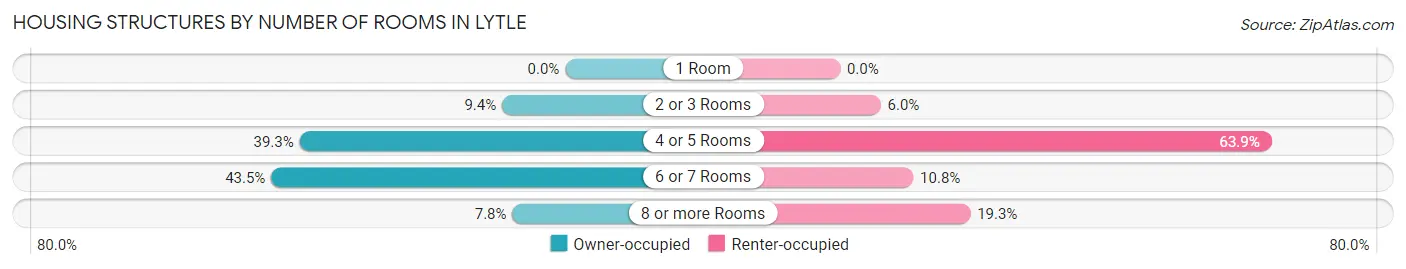
| Number of Rooms | Owner-occupied | Renter-occupied |
| 1 Room | 0 (0.0%) | 0 (0.0%) |
| 2 or 3 Rooms | 49 (9.3%) | 15 (6.0%) |
| 4 or 5 Rooms | 206 (39.3%) | 159 (63.9%) |
| 6 or 7 Rooms | 228 (43.5%) | 27 (10.8%) |
| 8 or more Rooms | 41 (7.8%) | 48 (19.3%) |
| Total | 524 (100.0%) | 249 (100.0%) |
Housing Structure by Heating Type in Lytle
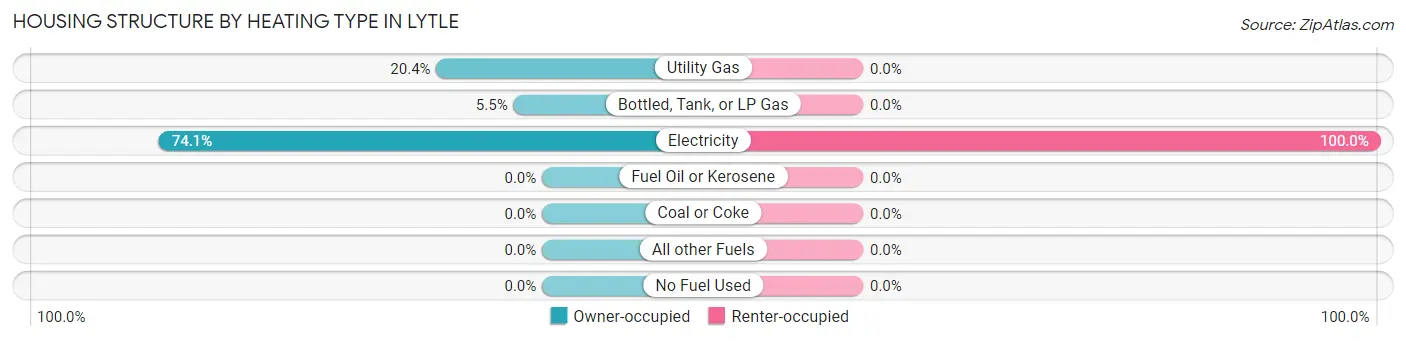
| Heating Type | Owner-occupied | Renter-occupied |
| Utility Gas | 107 (20.4%) | 0 (0.0%) |
| Bottled, Tank, or LP Gas | 29 (5.5%) | 0 (0.0%) |
| Electricity | 388 (74.1%) | 249 (100.0%) |
| Fuel Oil or Kerosene | 0 (0.0%) | 0 (0.0%) |
| Coal or Coke | 0 (0.0%) | 0 (0.0%) |
| All other Fuels | 0 (0.0%) | 0 (0.0%) |
| No Fuel Used | 0 (0.0%) | 0 (0.0%) |
| Total | 524 (100.0%) | 249 (100.0%) |
Household Vehicle Usage in Lytle
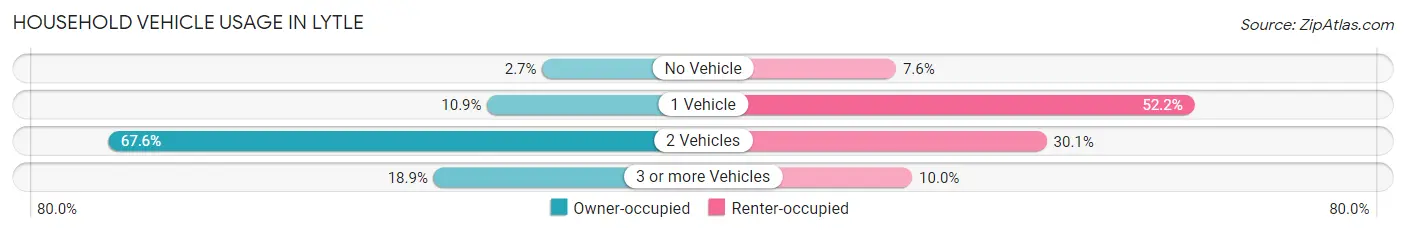
| Vehicles per Household | Owner-occupied | Renter-occupied |
| No Vehicle | 14 (2.7%) | 19 (7.6%) |
| 1 Vehicle | 57 (10.9%) | 130 (52.2%) |
| 2 Vehicles | 354 (67.6%) | 75 (30.1%) |
| 3 or more Vehicles | 99 (18.9%) | 25 (10.0%) |
| Total | 524 (100.0%) | 249 (100.0%) |
Real Estate & Mortgages in Lytle
Real Estate and Mortgage Overview in Lytle
| Characteristic | Without Mortgage | With Mortgage |
| Housing Units | 274 | 250 |
| Median Property Value | $100,400 | $156,000 |
| Median Household Income | $51,447 | $40 |
| Monthly Housing Costs | $423 | $8 |
| Real Estate Taxes | $1,449 | $26 |
Property Value by Mortgage Status in Lytle
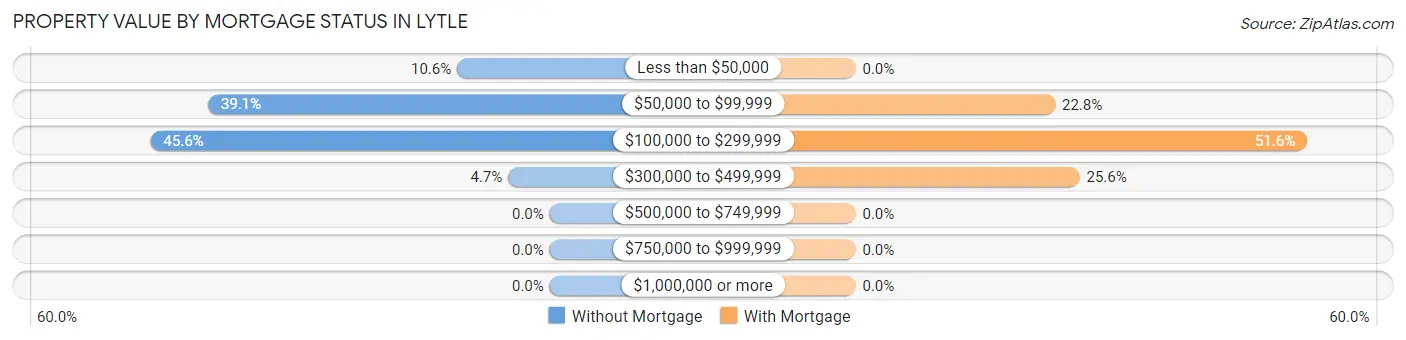
| Property Value | Without Mortgage | With Mortgage |
| Less than $50,000 | 29 (10.6%) | 0 (0.0%) |
| $50,000 to $99,999 | 107 (39.1%) | 57 (22.8%) |
| $100,000 to $299,999 | 125 (45.6%) | 129 (51.6%) |
| $300,000 to $499,999 | 13 (4.7%) | 64 (25.6%) |
| $500,000 to $749,999 | 0 (0.0%) | 0 (0.0%) |
| $750,000 to $999,999 | 0 (0.0%) | 0 (0.0%) |
| $1,000,000 or more | 0 (0.0%) | 0 (0.0%) |
| Total | 274 (100.0%) | 250 (100.0%) |
Household Income by Mortgage Status in Lytle
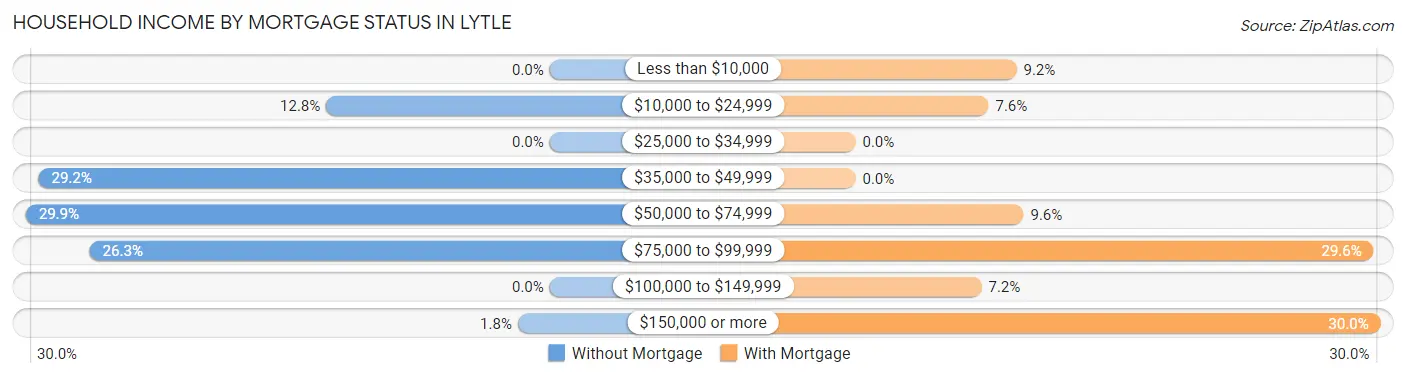
| Household Income | Without Mortgage | With Mortgage |
| Less than $10,000 | 0 (0.0%) | 23 (9.2%) |
| $10,000 to $24,999 | 35 (12.8%) | 19 (7.6%) |
| $25,000 to $34,999 | 0 (0.0%) | 0 (0.0%) |
| $35,000 to $49,999 | 80 (29.2%) | 0 (0.0%) |
| $50,000 to $74,999 | 82 (29.9%) | 24 (9.6%) |
| $75,000 to $99,999 | 72 (26.3%) | 74 (29.6%) |
| $100,000 to $149,999 | 0 (0.0%) | 18 (7.2%) |
| $150,000 or more | 5 (1.8%) | 75 (30.0%) |
| Total | 274 (100.0%) | 250 (100.0%) |
Property Value to Household Income Ratio in Lytle
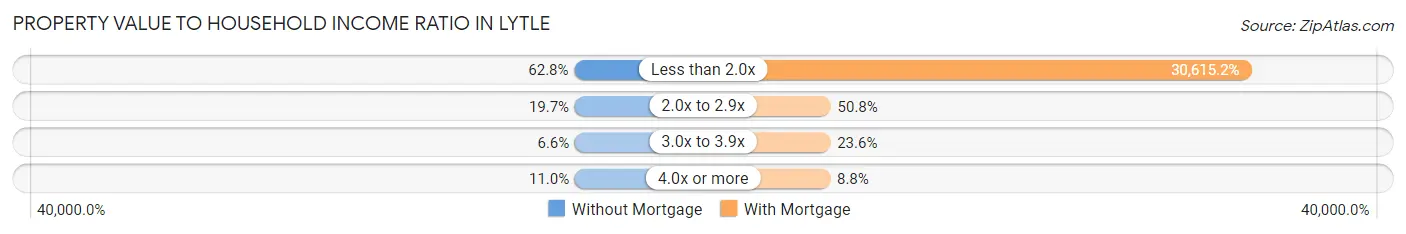
| Value-to-Income Ratio | Without Mortgage | With Mortgage |
| Less than 2.0x | 172 (62.8%) | 76,538 (30,615.2%) |
| 2.0x to 2.9x | 54 (19.7%) | 127 (50.8%) |
| 3.0x to 3.9x | 18 (6.6%) | 59 (23.6%) |
| 4.0x or more | 30 (11.0%) | 22 (8.8%) |
| Total | 274 (100.0%) | 250 (100.0%) |
Real Estate Taxes by Mortgage Status in Lytle
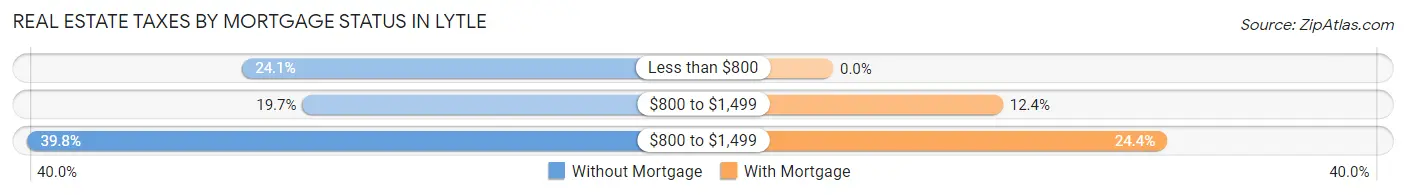
| Property Taxes | Without Mortgage | With Mortgage |
| Less than $800 | 66 (24.1%) | 0 (0.0%) |
| $800 to $1,499 | 54 (19.7%) | 31 (12.4%) |
| $800 to $1,499 | 109 (39.8%) | 61 (24.4%) |
| Total | 274 (100.0%) | 250 (100.0%) |
Health & Disability in Lytle
Health Insurance Coverage by Age in Lytle
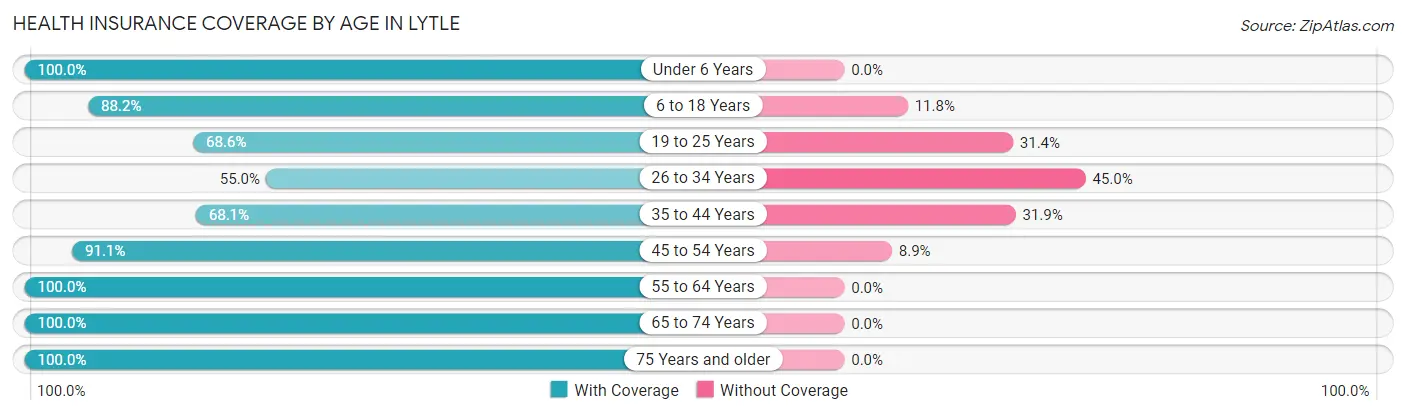
| Age Bracket | With Coverage | Without Coverage |
| Under 6 Years | 60 (100.0%) | 0 (0.0%) |
| 6 to 18 Years | 328 (88.2%) | 44 (11.8%) |
| 19 to 25 Years | 144 (68.6%) | 66 (31.4%) |
| 26 to 34 Years | 192 (55.0%) | 157 (45.0%) |
| 35 to 44 Years | 147 (68.1%) | 69 (31.9%) |
| 45 to 54 Years | 267 (91.1%) | 26 (8.9%) |
| 55 to 64 Years | 343 (100.0%) | 0 (0.0%) |
| 65 to 74 Years | 235 (100.0%) | 0 (0.0%) |
| 75 Years and older | 115 (100.0%) | 0 (0.0%) |
| Total | 1,831 (83.5%) | 362 (16.5%) |
Health Insurance Coverage by Citizenship Status in Lytle
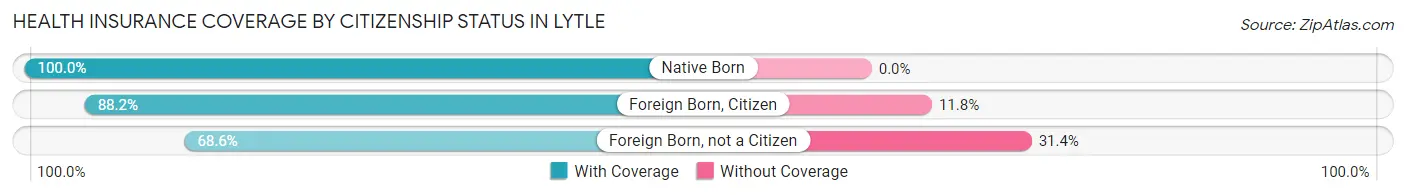
| Citizenship Status | With Coverage | Without Coverage |
| Native Born | 60 (100.0%) | 0 (0.0%) |
| Foreign Born, Citizen | 328 (88.2%) | 44 (11.8%) |
| Foreign Born, not a Citizen | 144 (68.6%) | 66 (31.4%) |
Health Insurance Coverage by Household Income in Lytle
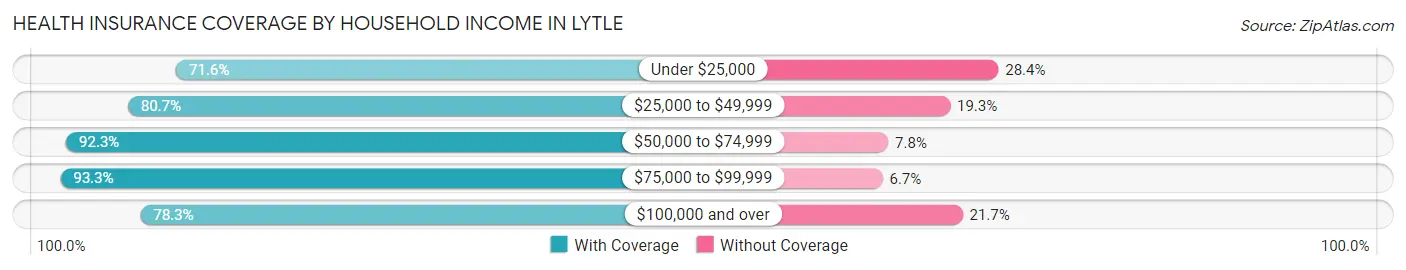
| Household Income | With Coverage | Without Coverage |
| Under $25,000 | 111 (71.6%) | 44 (28.4%) |
| $25,000 to $49,999 | 584 (80.7%) | 140 (19.3%) |
| $50,000 to $74,999 | 381 (92.2%) | 32 (7.7%) |
| $75,000 to $99,999 | 307 (93.3%) | 22 (6.7%) |
| $100,000 and over | 448 (78.3%) | 124 (21.7%) |
Public vs Private Health Insurance Coverage by Age in Lytle
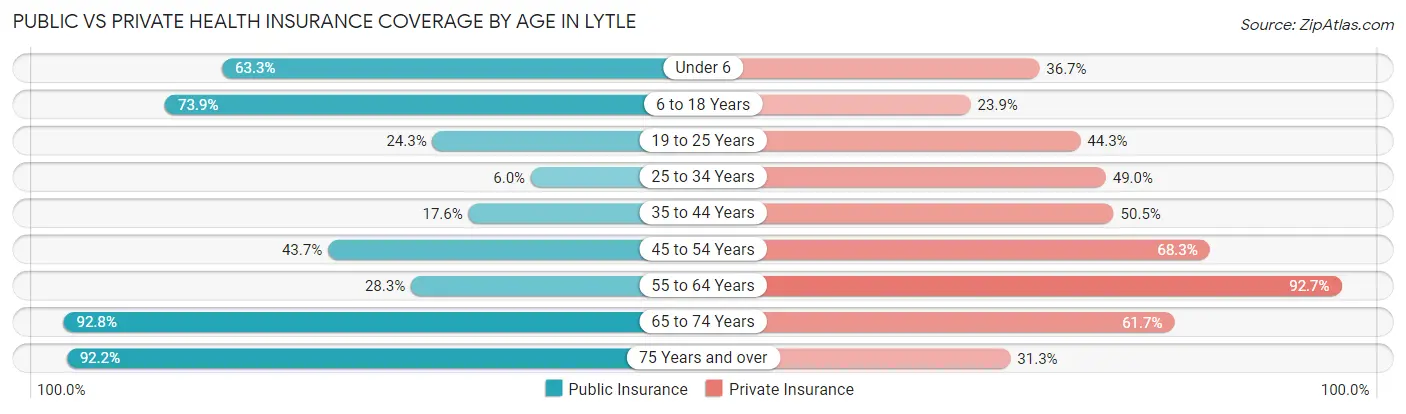
| Age Bracket | Public Insurance | Private Insurance |
| Under 6 | 38 (63.3%) | 22 (36.7%) |
| 6 to 18 Years | 275 (73.9%) | 89 (23.9%) |
| 19 to 25 Years | 51 (24.3%) | 93 (44.3%) |
| 25 to 34 Years | 21 (6.0%) | 171 (49.0%) |
| 35 to 44 Years | 38 (17.6%) | 109 (50.5%) |
| 45 to 54 Years | 128 (43.7%) | 200 (68.3%) |
| 55 to 64 Years | 97 (28.3%) | 318 (92.7%) |
| 65 to 74 Years | 218 (92.8%) | 145 (61.7%) |
| 75 Years and over | 106 (92.2%) | 36 (31.3%) |
| Total | 972 (44.3%) | 1,183 (53.9%) |
Disability Status by Sex by Age in Lytle
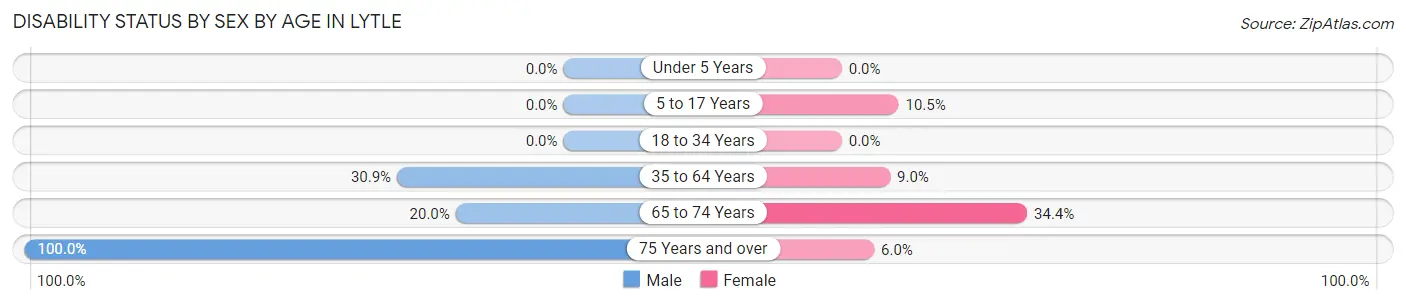
| Age Bracket | Male | Female |
| Under 5 Years | 0 (0.0%) | 0 (0.0%) |
| 5 to 17 Years | 0 (0.0%) | 18 (10.5%) |
| 18 to 34 Years | 0 (0.0%) | 0 (0.0%) |
| 35 to 64 Years | 139 (30.9%) | 36 (9.0%) |
| 65 to 74 Years | 22 (20.0%) | 43 (34.4%) |
| 75 Years and over | 65 (100.0%) | 3 (6.0%) |
Disability Class by Sex by Age in Lytle
Disability Class: Hearing Difficulty
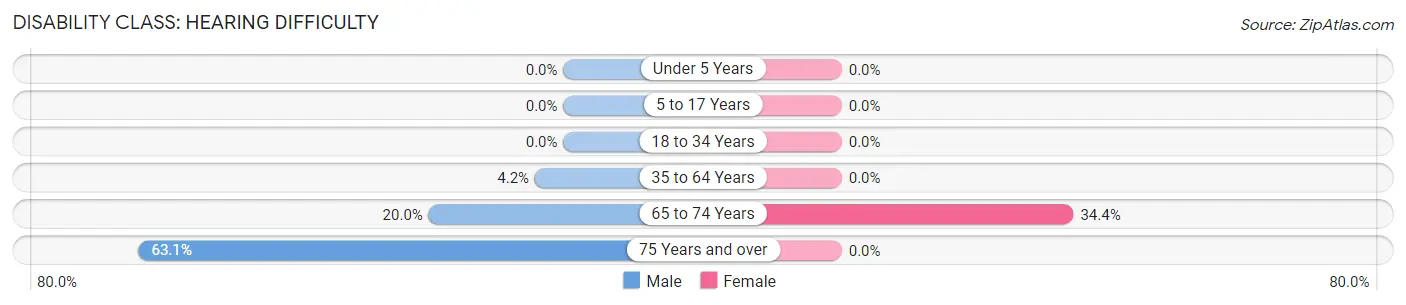
| Age Bracket | Male | Female |
| Under 5 Years | 0 (0.0%) | 0 (0.0%) |
| 5 to 17 Years | 0 (0.0%) | 0 (0.0%) |
| 18 to 34 Years | 0 (0.0%) | 0 (0.0%) |
| 35 to 64 Years | 19 (4.2%) | 0 (0.0%) |
| 65 to 74 Years | 22 (20.0%) | 43 (34.4%) |
| 75 Years and over | 41 (63.1%) | 0 (0.0%) |
Disability Class: Vision Difficulty
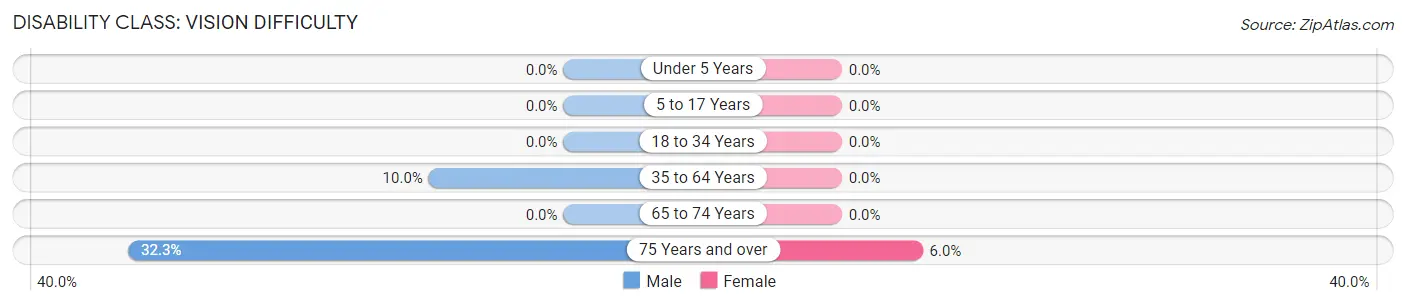
| Age Bracket | Male | Female |
| Under 5 Years | 0 (0.0%) | 0 (0.0%) |
| 5 to 17 Years | 0 (0.0%) | 0 (0.0%) |
| 18 to 34 Years | 0 (0.0%) | 0 (0.0%) |
| 35 to 64 Years | 45 (10.0%) | 0 (0.0%) |
| 65 to 74 Years | 0 (0.0%) | 0 (0.0%) |
| 75 Years and over | 21 (32.3%) | 3 (6.0%) |
Disability Class: Cognitive Difficulty
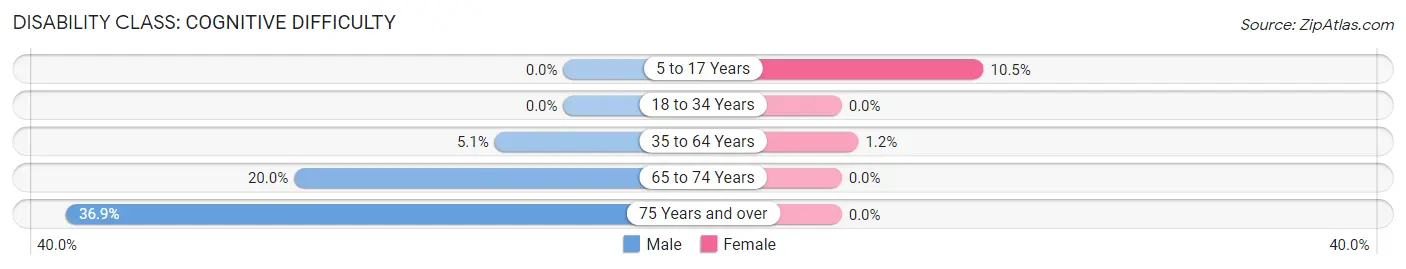
| Age Bracket | Male | Female |
| 5 to 17 Years | 0 (0.0%) | 18 (10.5%) |
| 18 to 34 Years | 0 (0.0%) | 0 (0.0%) |
| 35 to 64 Years | 23 (5.1%) | 5 (1.2%) |
| 65 to 74 Years | 22 (20.0%) | 0 (0.0%) |
| 75 Years and over | 24 (36.9%) | 0 (0.0%) |
Disability Class: Ambulatory Difficulty
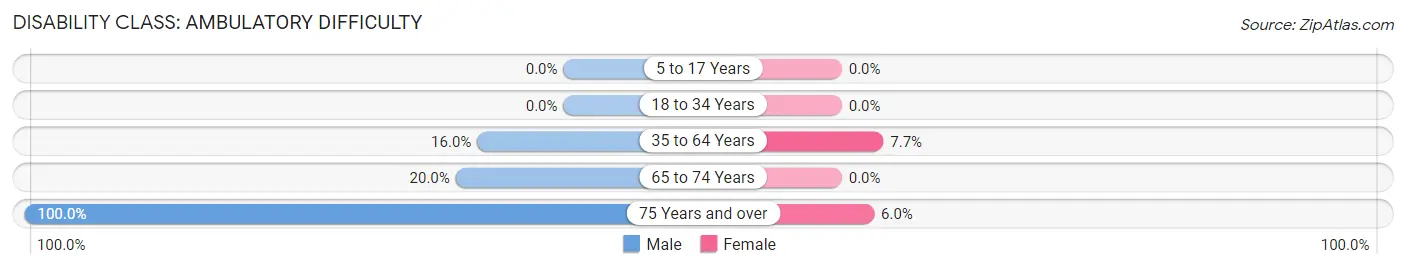
| Age Bracket | Male | Female |
| 5 to 17 Years | 0 (0.0%) | 0 (0.0%) |
| 18 to 34 Years | 0 (0.0%) | 0 (0.0%) |
| 35 to 64 Years | 72 (16.0%) | 31 (7.7%) |
| 65 to 74 Years | 22 (20.0%) | 0 (0.0%) |
| 75 Years and over | 65 (100.0%) | 3 (6.0%) |
Disability Class: Self-Care Difficulty
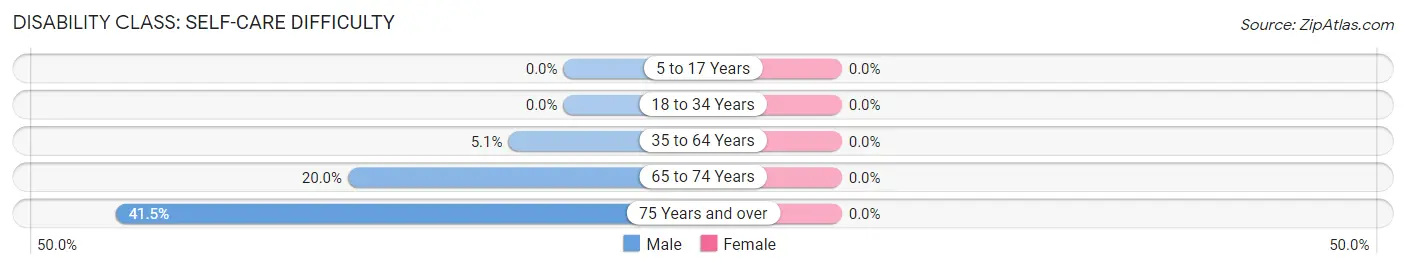
| Age Bracket | Male | Female |
| 5 to 17 Years | 0 (0.0%) | 0 (0.0%) |
| 18 to 34 Years | 0 (0.0%) | 0 (0.0%) |
| 35 to 64 Years | 23 (5.1%) | 0 (0.0%) |
| 65 to 74 Years | 22 (20.0%) | 0 (0.0%) |
| 75 Years and over | 27 (41.5%) | 0 (0.0%) |
Technology Access in Lytle
Computing Device Access in Lytle
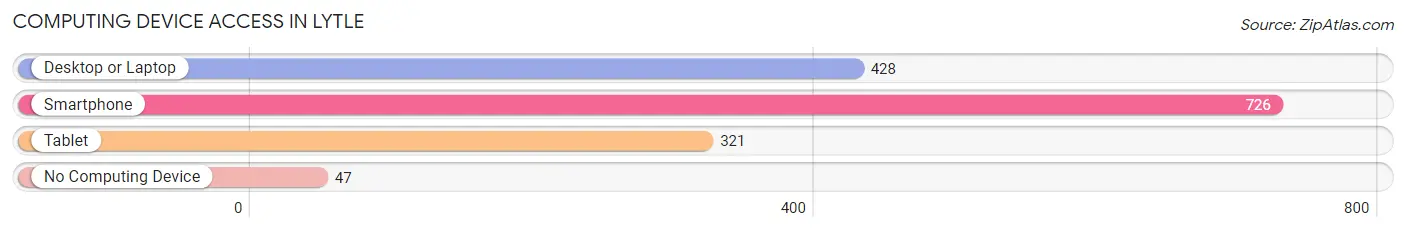
| Device Type | # Households | % Households |
| Desktop or Laptop | 428 | 55.4% |
| Smartphone | 726 | 93.9% |
| Tablet | 321 | 41.5% |
| No Computing Device | 47 | 6.1% |
| Total | 773 | 100.0% |
Internet Access in Lytle
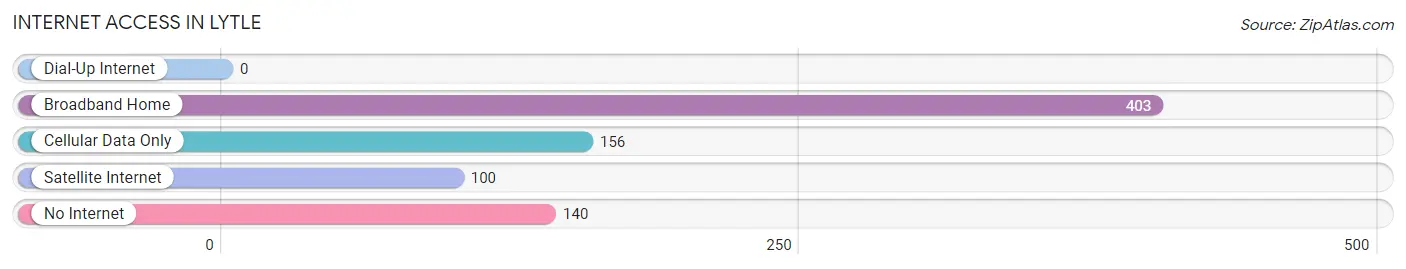
| Internet Type | # Households | % Households |
| Dial-Up Internet | 0 | 0.0% |
| Broadband Home | 403 | 52.1% |
| Cellular Data Only | 156 | 20.2% |
| Satellite Internet | 100 | 12.9% |
| No Internet | 140 | 18.1% |
| Total | 773 | 100.0% |
Lytle Summary
Lytle, Texas is a small town located in Atascosa County, Texas, United States. It is situated on the banks of the Medina River, about 25 miles southwest of San Antonio. The population of Lytle was 2,819 at the 2010 census, up from 2,541 at the 2000 census.
History
The area that is now Lytle was first settled in the early 1800s by German and Irish immigrants. The town was originally known as “Lytle’s Crossing”, named after the Lytle family who owned the land. The town was officially established in 1881 when the San Antonio and Aransas Pass Railway built a line through the area. The town was renamed Lytle in 1882, and the post office was established the same year.
In the early 1900s, Lytle was a thriving agricultural community, with cotton, corn, and sorghum being the main crops. The town also had a number of businesses, including a bank, a hotel, a general store, and a blacksmith shop.
In the 1950s, Lytle began to experience a decline in population as people moved away to larger cities. The decline continued until the late 1990s, when the population began to slowly increase again.
Geography
Lytle is located at 29°19'25" North, 98°37'45" West (29.323889, -98.629167). It is situated on the banks of the Medina River, about 25 miles southwest of San Antonio.
The town has a total area of 2.2 square miles, all of which is land. The terrain is mostly flat, with some rolling hills.
Economy
The economy of Lytle is largely based on agriculture. Cotton, corn, and sorghum are the main crops, and there are also some cattle ranches in the area.
The town also has a number of small businesses, including a grocery store, a hardware store, a pharmacy, and a few restaurants.
Demographics
As of the 2010 census, there were 2,819 people, 990 households, and 745 families residing in Lytle. The population density was 1,279.2 people per square mile. The racial makeup of the town was 81.2% White, 0.7% African American, 0.4% Native American, 0.2% Asian, 0.1% Pacific Islander, 15.3% from other races, and 2.1% from two or more races. Hispanic or Latino of any race were 44.2% of the population.
The median income for a household in Lytle was $37,917, and the median income for a family was $45,000. The per capita income for the town was $17,845. About 17.2% of families and 20.2% of the population were below the poverty line, including 28.2% of those under age 18 and 11.2% of those age 65 or over.
Common Questions
What is Per Capita Income in Lytle?
Per Capita income in Lytle is $27,849.
What is the Median Family Income in Lytle?
Median Family Income in Lytle is $65,761.
What is the Median Household income in Lytle?
Median Household Income in Lytle is $51,875.
What is Income or Wage Gap in Lytle?
Income or Wage Gap in Lytle is 44.9%.
Women in Lytle earn 55.1 cents for every dollar earned by a man.
What is Inequality or Gini Index in Lytle?
Inequality or Gini Index in Lytle is 0.39.
What is the Total Population of Lytle?
Total Population of Lytle is 2,262.
What is the Total Male Population of Lytle?
Total Male Population of Lytle is 1,150.
What is the Total Female Population of Lytle?
Total Female Population of Lytle is 1,112.
What is the Ratio of Males per 100 Females in Lytle?
There are 103.42 Males per 100 Females in Lytle.
What is the Ratio of Females per 100 Males in Lytle?
There are 96.70 Females per 100 Males in Lytle.
What is the Median Population Age in Lytle?
Median Population Age in Lytle is 38.8 Years.
What is the Average Family Size in Lytle
Average Family Size in Lytle is 3.0 People.
What is the Average Household Size in Lytle
Average Household Size in Lytle is 2.8 People.
How Large is the Labor Force in Lytle?
There are 1,020 People in the Labor Forcein in Lytle.
What is the Percentage of People in the Labor Force in Lytle?
54.5% of People are in the Labor Force in Lytle.
What is the Unemployment Rate in Lytle?
Unemployment Rate in Lytle is 6.4%.