Lyford, TX Map & Demographics
Lyford Map
Lyford Overview
$17,869
PER CAPITA INCOME
$55,156
AVG FAMILY INCOME
$39,300
AVG HOUSEHOLD INCOME
34.1%
WAGE / INCOME GAP [ % ]
65.9¢/ $1
WAGE / INCOME GAP [ $ ]
0.45
INEQUALITY / GINI INDEX
2,540
TOTAL POPULATION
1,224
MALE POPULATION
1,316
FEMALE POPULATION
93.01
MALES / 100 FEMALES
107.52
FEMALES / 100 MALES
35.1
MEDIAN AGE
4.6
AVG FAMILY SIZE
3.7
AVG HOUSEHOLD SIZE
1,066
LABOR FORCE [ PEOPLE ]
52.8%
PERCENT IN LABOR FORCE
5.5%
UNEMPLOYMENT RATE
Lyford Zip Codes
Lyford Area Codes
Income in Lyford
Income Overview in Lyford
Per Capita Income in Lyford is $17,869, while median incomes of families and households are $55,156 and $39,300 respectively.
| Characteristic | Number | Measure |
| Per Capita Income | 2,540 | $17,869 |
| Median Family Income | 497 | $55,156 |
| Mean Family Income | 497 | $64,080 |
| Median Household Income | 690 | $39,300 |
| Mean Household Income | 690 | $54,563 |
| Income Deficit | 497 | $0 |
| Wage / Income Gap (%) | 2,540 | 34.13% |
| Wage / Income Gap ($) | 2,540 | 65.87¢ per $1 |
| Gini / Inequality Index | 2,540 | 0.45 |
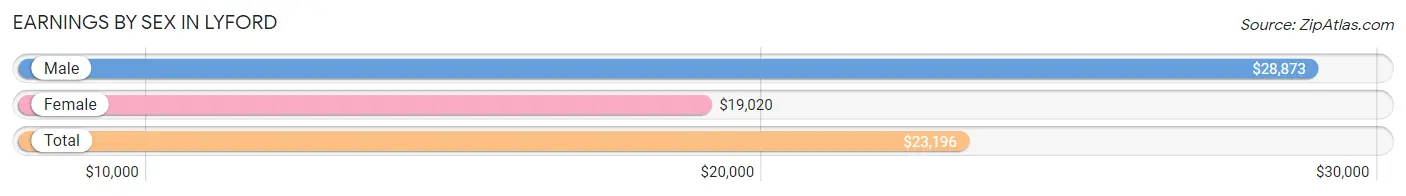
Earnings by Sex in Lyford
Average Earnings in Lyford are $23,196, $28,873 for men and $19,020 for women, a difference of 34.1%.
| Sex | Number | Average Earnings |
| Male | 573 (51.7%) | $28,873 |
| Female | 535 (48.3%) | $19,020 |
| Total | 1,108 (100.0%) | $23,196 |
Earnings by Sex by Income Bracket in Lyford
The most common earnings brackets in Lyford are $10,000 to $12,499 for men (110 | 19.2%) and $22,500 to $24,999 for women (77 | 14.4%).
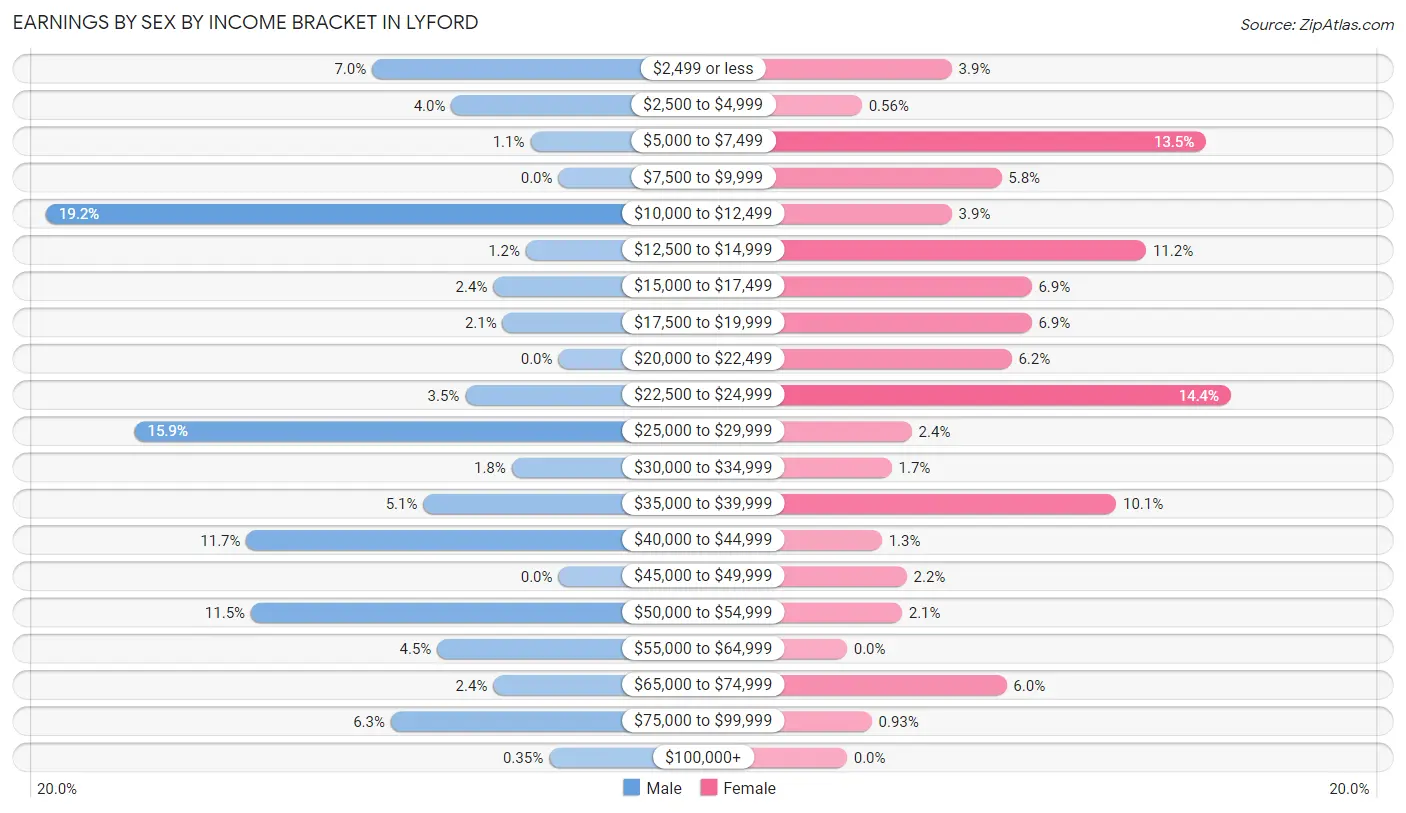
| Income | Male | Female |
| $2,499 or less | 40 (7.0%) | 21 (3.9%) |
| $2,500 to $4,999 | 23 (4.0%) | 3 (0.6%) |
| $5,000 to $7,499 | 6 (1.1%) | 72 (13.5%) |
| $7,500 to $9,999 | 0 (0.0%) | 31 (5.8%) |
| $10,000 to $12,499 | 110 (19.2%) | 21 (3.9%) |
| $12,500 to $14,999 | 7 (1.2%) | 60 (11.2%) |
| $15,000 to $17,499 | 14 (2.4%) | 37 (6.9%) |
| $17,500 to $19,999 | 12 (2.1%) | 37 (6.9%) |
| $20,000 to $22,499 | 0 (0.0%) | 33 (6.2%) |
| $22,500 to $24,999 | 20 (3.5%) | 77 (14.4%) |
| $25,000 to $29,999 | 91 (15.9%) | 13 (2.4%) |
| $30,000 to $34,999 | 10 (1.8%) | 9 (1.7%) |
| $35,000 to $39,999 | 29 (5.1%) | 54 (10.1%) |
| $40,000 to $44,999 | 67 (11.7%) | 7 (1.3%) |
| $45,000 to $49,999 | 0 (0.0%) | 12 (2.2%) |
| $50,000 to $54,999 | 66 (11.5%) | 11 (2.1%) |
| $55,000 to $64,999 | 26 (4.5%) | 0 (0.0%) |
| $65,000 to $74,999 | 14 (2.4%) | 32 (6.0%) |
| $75,000 to $99,999 | 36 (6.3%) | 5 (0.9%) |
| $100,000+ | 2 (0.4%) | 0 (0.0%) |
| Total | 573 (100.0%) | 535 (100.0%) |
Earnings by Sex by Educational Attainment in Lyford
Average earnings in Lyford are $30,250 for men and $19,595 for women, a difference of 35.2%. Men with an educational attainment of bachelor's degree enjoy the highest average annual earnings of $41,450, while those with less than high school education earn the least with $29,310. Women with an educational attainment of bachelor's degree earn the most with the average annual earnings of $72,578, while those with high school diploma education have the smallest earnings of $8,992.
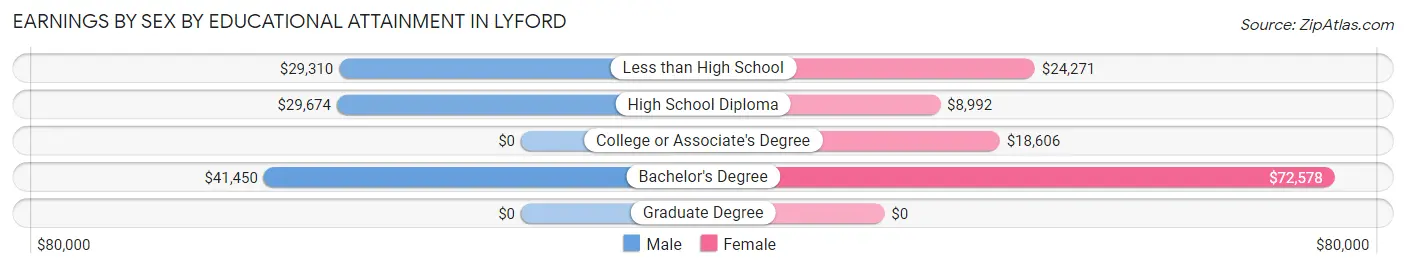
| Educational Attainment | Male Income | Female Income |
| Less than High School | $29,310 | $24,271 |
| High School Diploma | $29,674 | $8,992 |
| College or Associate's Degree | - | - |
| Bachelor's Degree | $41,450 | $72,578 |
| Graduate Degree | - | - |
| Total | $30,250 | $19,595 |
Family Income in Lyford
Family Income Brackets in Lyford
According to the Lyford family income data, there are 124 families falling into the $100,000 to $149,999 income range, which is the most common income bracket and makes up 24.9% of all families.
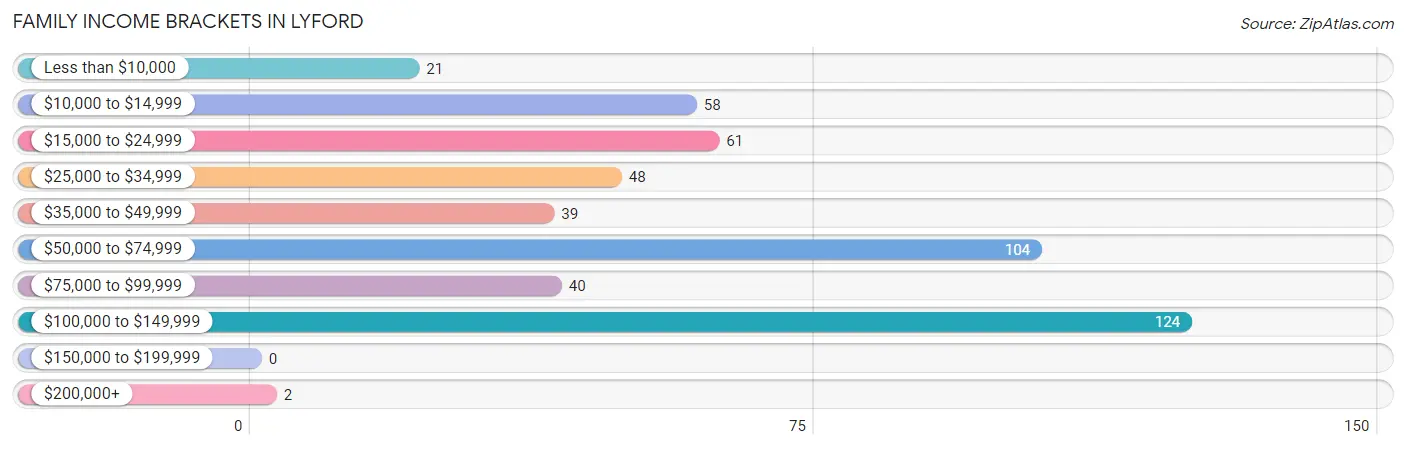
| Income Bracket | # Families | % Families |
| Less than $10,000 | 21 | 4.2% |
| $10,000 to $14,999 | 58 | 11.7% |
| $15,000 to $24,999 | 61 | 12.3% |
| $25,000 to $34,999 | 48 | 9.7% |
| $35,000 to $49,999 | 39 | 7.8% |
| $50,000 to $74,999 | 104 | 20.9% |
| $75,000 to $99,999 | 40 | 8.0% |
| $100,000 to $149,999 | 124 | 24.9% |
| $150,000 to $199,999 | 0 | 0.0% |
| $200,000+ | 2 | 0.4% |
Family Income by Famaliy Size in Lyford
7+ person families (42 | 8.5%) account for the highest median family income in Lyford with $102,976 per family, while 4-person families (114 | 22.9%) have the highest median income of $20,833 per family member.
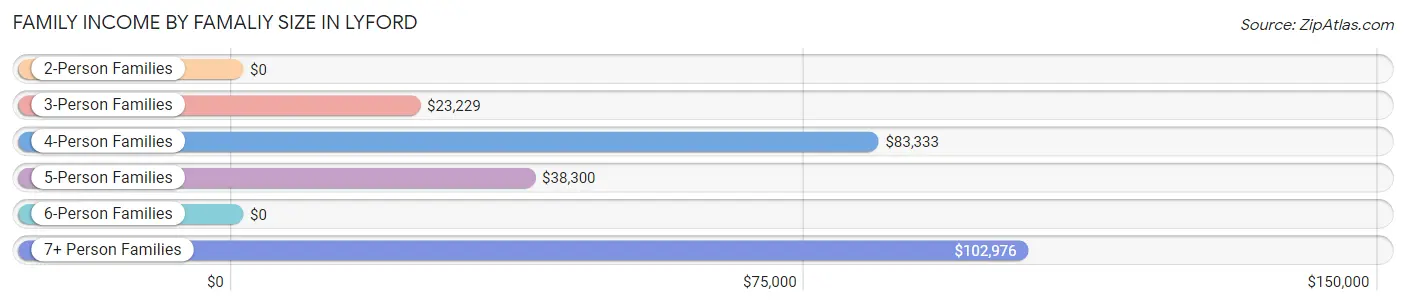
| Income Bracket | # Families | Median Income |
| 2-Person Families | 158 (31.8%) | $0 |
| 3-Person Families | 85 (17.1%) | $23,229 |
| 4-Person Families | 114 (22.9%) | $83,333 |
| 5-Person Families | 90 (18.1%) | $38,300 |
| 6-Person Families | 8 (1.6%) | $0 |
| 7+ Person Families | 42 (8.5%) | $102,976 |
| Total | 497 (100.0%) | $55,156 |
Family Income by Number of Earners in Lyford
The median family income in Lyford is $55,156, with families comprising 3+ earners (78) having the highest median family income of $103,456, while families with no earners (88) have the lowest median family income of $13,214, accounting for 15.7% and 17.7% of families, respectively.
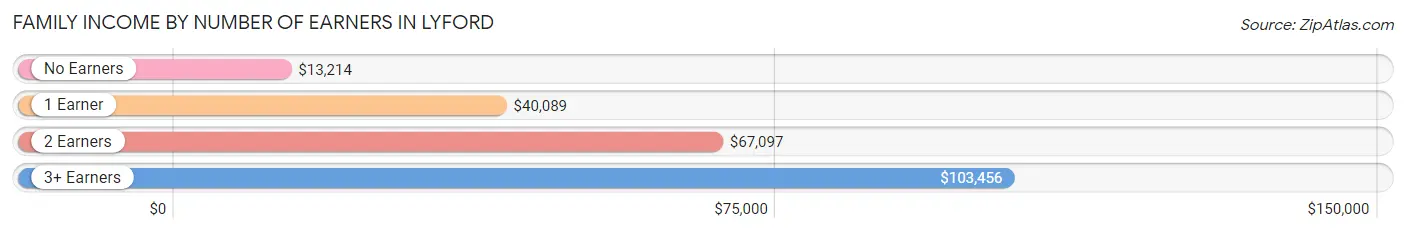
| Number of Earners | # Families | Median Income |
| No Earners | 88 (17.7%) | $13,214 |
| 1 Earner | 203 (40.8%) | $40,089 |
| 2 Earners | 128 (25.8%) | $67,097 |
| 3+ Earners | 78 (15.7%) | $103,456 |
| Total | 497 (100.0%) | $55,156 |
Household Income in Lyford
Household Income Brackets in Lyford
With 129 households falling in the category, the $10,000 to $14,999 income range is the most frequent in Lyford, accounting for 18.7% of all households.
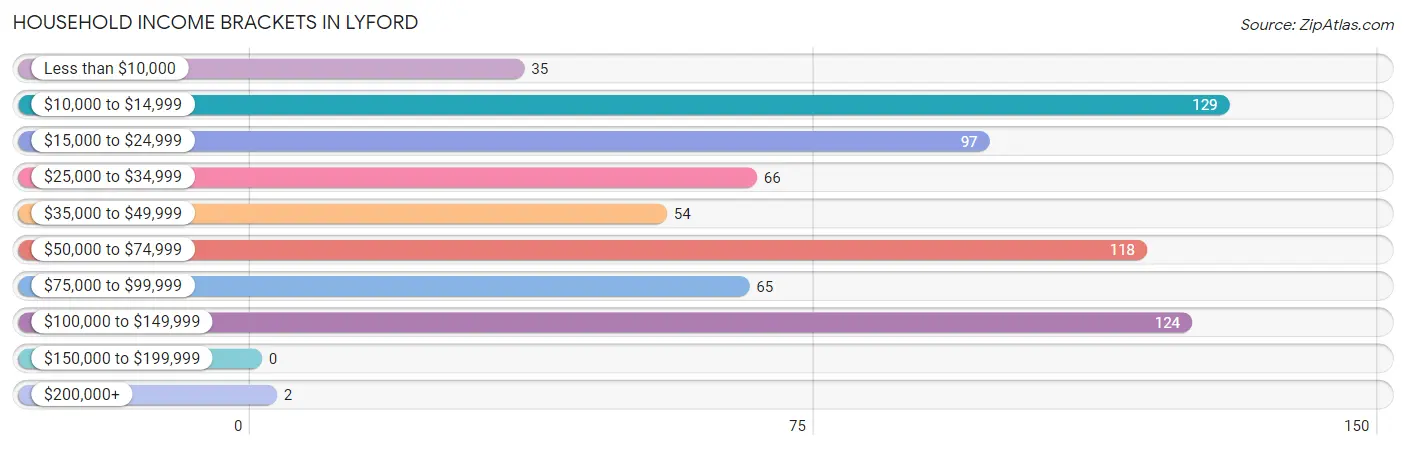
| Income Bracket | # Households | % Households |
| Less than $10,000 | 35 | 5.1% |
| $10,000 to $14,999 | 129 | 18.7% |
| $15,000 to $24,999 | 97 | 14.1% |
| $25,000 to $34,999 | 66 | 9.6% |
| $35,000 to $49,999 | 54 | 7.8% |
| $50,000 to $74,999 | 118 | 17.1% |
| $75,000 to $99,999 | 65 | 9.4% |
| $100,000 to $149,999 | 124 | 18.0% |
| $150,000 to $199,999 | 0 | 0.0% |
| $200,000+ | 2 | 0.3% |
Household Income by Householder Age in Lyford
The median household income in Lyford is $39,300, with the highest median household income of $54,500 found in the 45 to 64 years age bracket for the primary householder. A total of 312 households (45.2%) fall into this category.
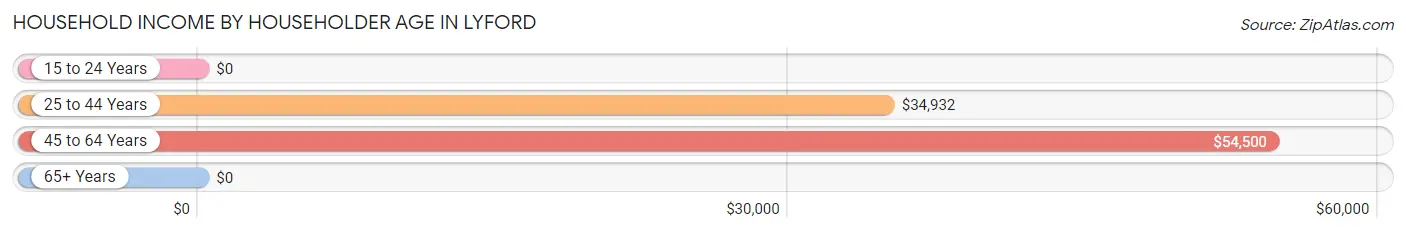
| Income Bracket | # Households | Median Income |
| 15 to 24 Years | 0 (0.0%) | $0 |
| 25 to 44 Years | 162 (23.5%) | $34,932 |
| 45 to 64 Years | 312 (45.2%) | $54,500 |
| 65+ Years | 216 (31.3%) | $0 |
| Total | 690 (100.0%) | $39,300 |
Poverty in Lyford
Income Below Poverty by Sex and Age in Lyford
With 14.9% poverty level for males and 15.6% for females among the residents of Lyford, 55 to 64 year old males and 15 year old females are the most vulnerable to poverty, with 54 males (55.7%) and 17 females (100.0%) in their respective age groups living below the poverty level.
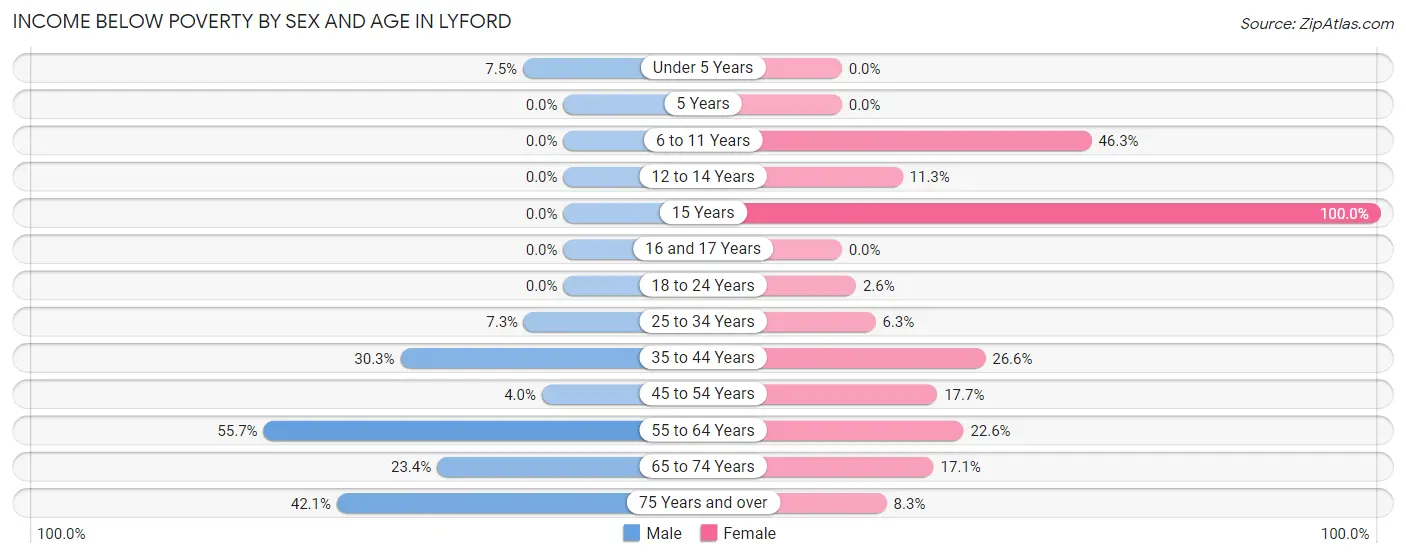
| Age Bracket | Male | Female |
| Under 5 Years | 6 (7.5%) | 0 (0.0%) |
| 5 Years | 0 (0.0%) | 0 (0.0%) |
| 6 to 11 Years | 0 (0.0%) | 19 (46.3%) |
| 12 to 14 Years | 0 (0.0%) | 14 (11.3%) |
| 15 Years | 0 (0.0%) | 17 (100.0%) |
| 16 and 17 Years | 0 (0.0%) | 0 (0.0%) |
| 18 to 24 Years | 0 (0.0%) | 3 (2.6%) |
| 25 to 34 Years | 21 (7.3%) | 11 (6.2%) |
| 35 to 44 Years | 36 (30.2%) | 45 (26.6%) |
| 45 to 54 Years | 6 (4.0%) | 34 (17.7%) |
| 55 to 64 Years | 54 (55.7%) | 35 (22.6%) |
| 65 to 74 Years | 15 (23.4%) | 15 (17.1%) |
| 75 Years and over | 45 (42.1%) | 11 (8.3%) |
| Total | 183 (14.9%) | 204 (15.6%) |
Income Above Poverty by Sex and Age in Lyford
According to the poverty statistics in Lyford, males aged 5 years and females aged under 5 years are the age groups that are most secure financially, with 100.0% of males and 100.0% of females in these age groups living above the poverty line.
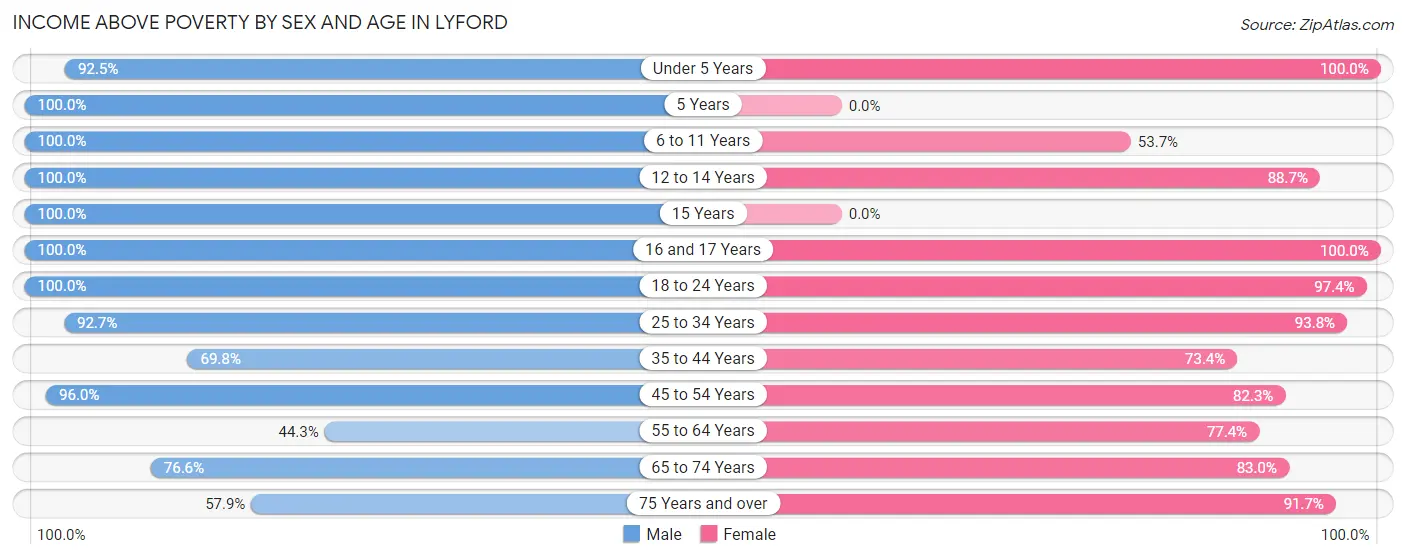
| Age Bracket | Male | Female |
| Under 5 Years | 74 (92.5%) | 79 (100.0%) |
| 5 Years | 45 (100.0%) | 0 (0.0%) |
| 6 to 11 Years | 56 (100.0%) | 22 (53.7%) |
| 12 to 14 Years | 68 (100.0%) | 110 (88.7%) |
| 15 Years | 5 (100.0%) | 0 (0.0%) |
| 16 and 17 Years | 75 (100.0%) | 22 (100.0%) |
| 18 to 24 Years | 71 (100.0%) | 111 (97.4%) |
| 25 to 34 Years | 266 (92.7%) | 165 (93.8%) |
| 35 to 44 Years | 83 (69.8%) | 124 (73.4%) |
| 45 to 54 Years | 144 (96.0%) | 158 (82.3%) |
| 55 to 64 Years | 43 (44.3%) | 120 (77.4%) |
| 65 to 74 Years | 49 (76.6%) | 73 (83.0%) |
| 75 Years and over | 62 (57.9%) | 121 (91.7%) |
| Total | 1,041 (85.1%) | 1,105 (84.4%) |
Income Below Poverty Among Married-Couple Families in Lyford
The poverty statistics for married-couple families in Lyford show that 20.5% or 72 of the total 351 families live below the poverty line. Families with no children have the highest poverty rate of 37.1%, comprising of 72 families. On the other hand, families with 1 or 2 children have the lowest poverty rate of 0.0%, which includes 0 families.
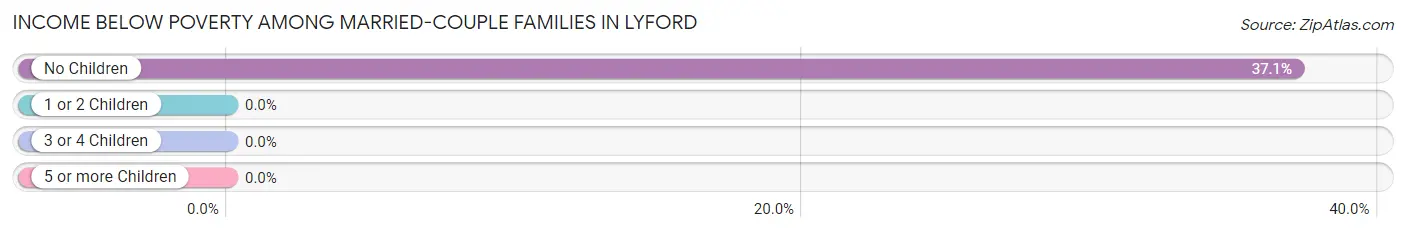
| Children | Above Poverty | Below Poverty |
| No Children | 122 (62.9%) | 72 (37.1%) |
| 1 or 2 Children | 86 (100.0%) | 0 (0.0%) |
| 3 or 4 Children | 50 (100.0%) | 0 (0.0%) |
| 5 or more Children | 21 (100.0%) | 0 (0.0%) |
| Total | 279 (79.5%) | 72 (20.5%) |
Income Below Poverty Among Single-Parent Households in Lyford
According to the poverty data in Lyford, 26.1% or 6 single-father households and 31.7% or 39 single-mother households are living below the poverty line. Among single-father households, those with no children have the highest poverty rate, with 6 households (66.7%) experiencing poverty. Likewise, among single-mother households, those with 1 or 2 children have the highest poverty rate, with 39 households (59.1%) falling below the poverty line.
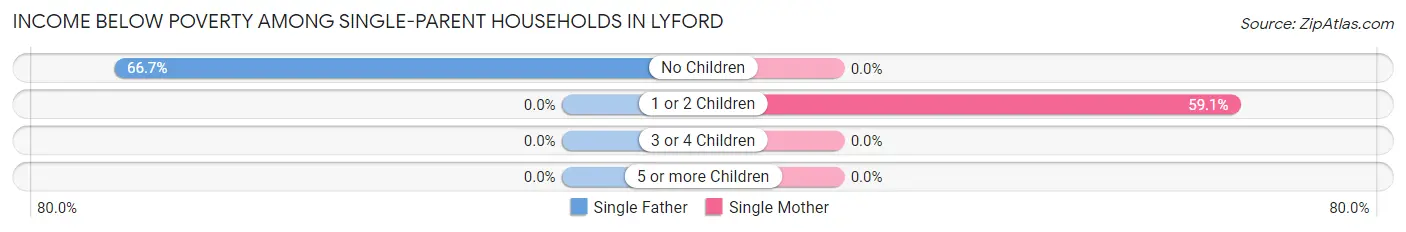
| Children | Single Father | Single Mother |
| No Children | 6 (66.7%) | 0 (0.0%) |
| 1 or 2 Children | 0 (0.0%) | 39 (59.1%) |
| 3 or 4 Children | 0 (0.0%) | 0 (0.0%) |
| 5 or more Children | 0 (0.0%) | 0 (0.0%) |
| Total | 6 (26.1%) | 39 (31.7%) |
Income Below Poverty Among Married-Couple vs Single-Parent Households in Lyford
The poverty data for Lyford shows that 72 of the married-couple family households (20.5%) and 45 of the single-parent households (30.8%) are living below the poverty level. Within the married-couple family households, those with no children have the highest poverty rate, with 72 households (37.1%) falling below the poverty line. Among the single-parent households, those with 1 or 2 children have the highest poverty rate, with 39 household (48.7%) living below poverty.
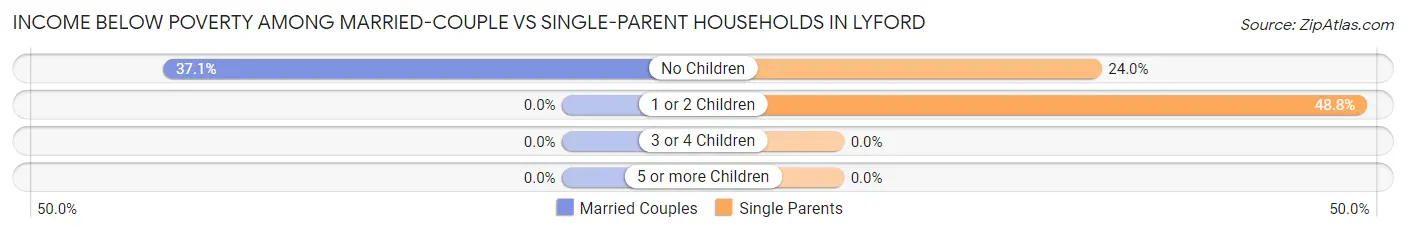
| Children | Married-Couple Families | Single-Parent Households |
| No Children | 72 (37.1%) | 6 (24.0%) |
| 1 or 2 Children | 0 (0.0%) | 39 (48.7%) |
| 3 or 4 Children | 0 (0.0%) | 0 (0.0%) |
| 5 or more Children | 0 (0.0%) | 0 (0.0%) |
| Total | 72 (20.5%) | 45 (30.8%) |
Race in Lyford
The most populous races in Lyford are Hispanic or Latino (2,451 | 96.5%), White / Caucasian (2,053 | 80.8%), and Two or more Races (381 | 15.0%).
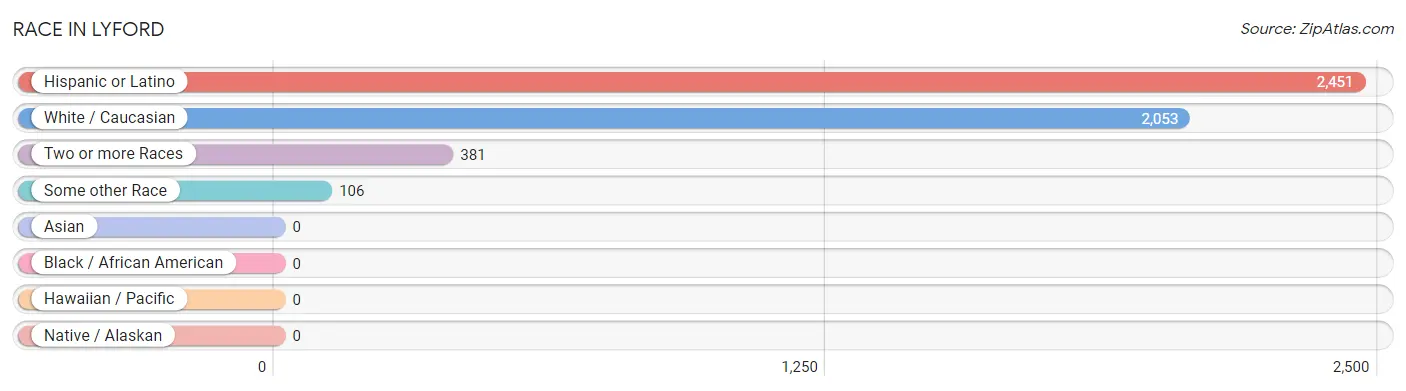
| Race | # Population | % Population |
| Asian | 0 | 0.0% |
| Black / African American | 0 | 0.0% |
| Hawaiian / Pacific | 0 | 0.0% |
| Hispanic or Latino | 2,451 | 96.5% |
| Native / Alaskan | 0 | 0.0% |
| White / Caucasian | 2,053 | 80.8% |
| Two or more Races | 381 | 15.0% |
| Some other Race | 106 | 4.2% |
| Total | 2,540 | 100.0% |
Ancestry in Lyford
The most populous ancestries reported in Lyford are Mexican (2,302 | 90.6%), English (36 | 1.4%), American (25 | 1.0%), Korean (25 | 1.0%), and French (13 | 0.5%), together accounting for 94.5% of all Lyford residents.
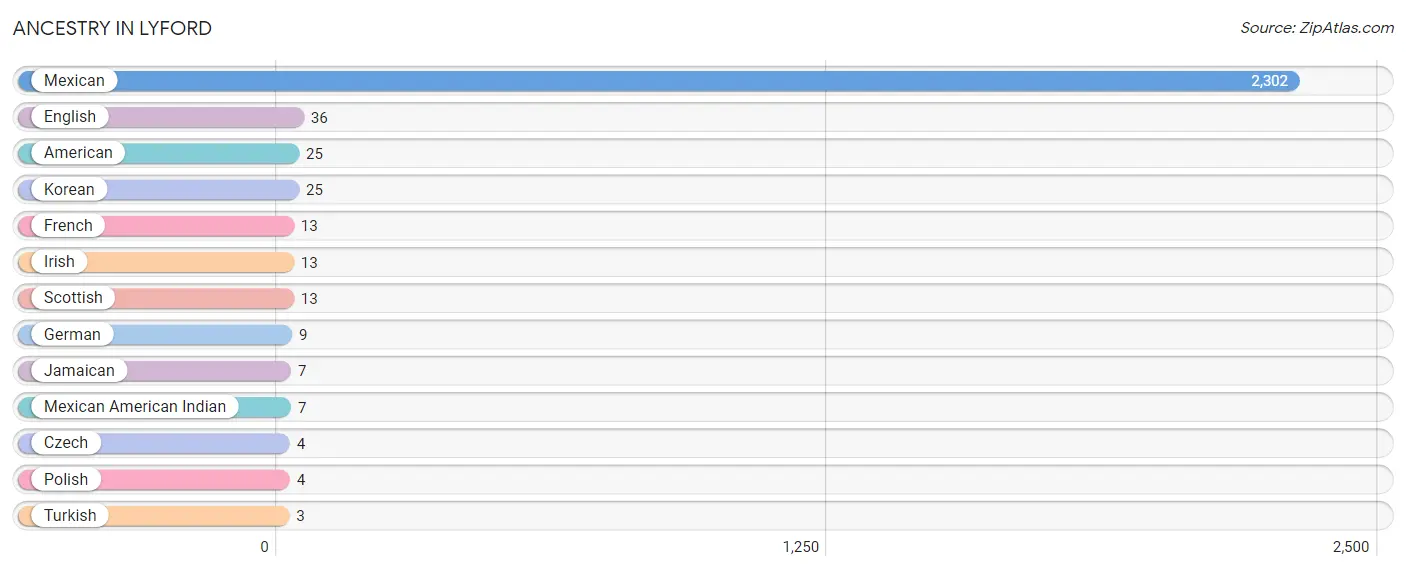
| Ancestry | # Population | % Population |
| American | 25 | 1.0% |
| Czech | 4 | 0.2% |
| English | 36 | 1.4% |
| French | 13 | 0.5% |
| German | 9 | 0.4% |
| Irish | 13 | 0.5% |
| Jamaican | 7 | 0.3% |
| Korean | 25 | 1.0% |
| Mexican | 2,302 | 90.6% |
| Mexican American Indian | 7 | 0.3% |
| Polish | 4 | 0.2% |
| Scottish | 13 | 0.5% |
| Turkish | 3 | 0.1% | View All 13 Rows |
Immigrants in Lyford
The most numerous immigrant groups reported in Lyford came from Central America (317 | 12.5%), Latin America (317 | 12.5%), Mexico (317 | 12.5%), Asia (3 | 0.1%), and Turkey (3 | 0.1%), together accounting for 37.7% of all Lyford residents.
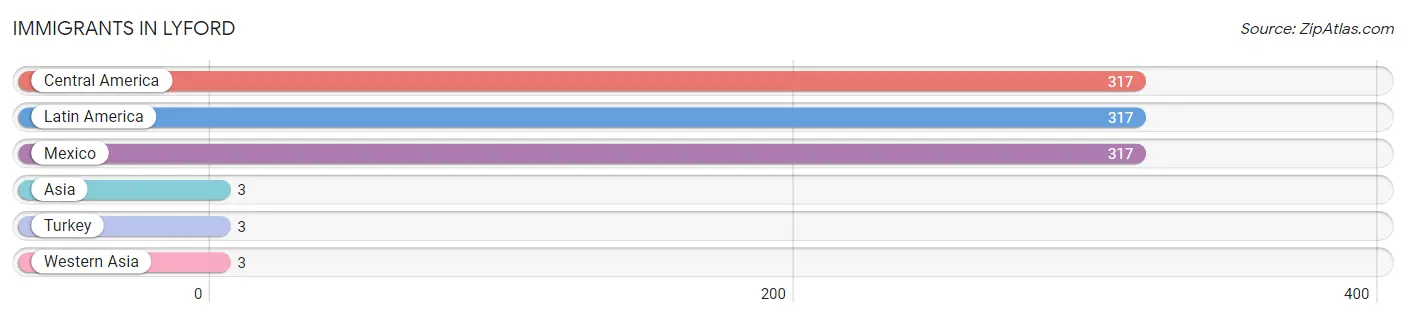
| Immigration Origin | # Population | % Population |
| Asia | 3 | 0.1% |
| Central America | 317 | 12.5% |
| Latin America | 317 | 12.5% |
| Mexico | 317 | 12.5% |
| Turkey | 3 | 0.1% |
| Western Asia | 3 | 0.1% | View All 6 Rows |
Sex and Age in Lyford
Sex and Age in Lyford
The most populous age groups in Lyford are 25 to 29 Years (232 | 19.0%) for men and 25 to 29 Years (146 | 11.1%) for women.
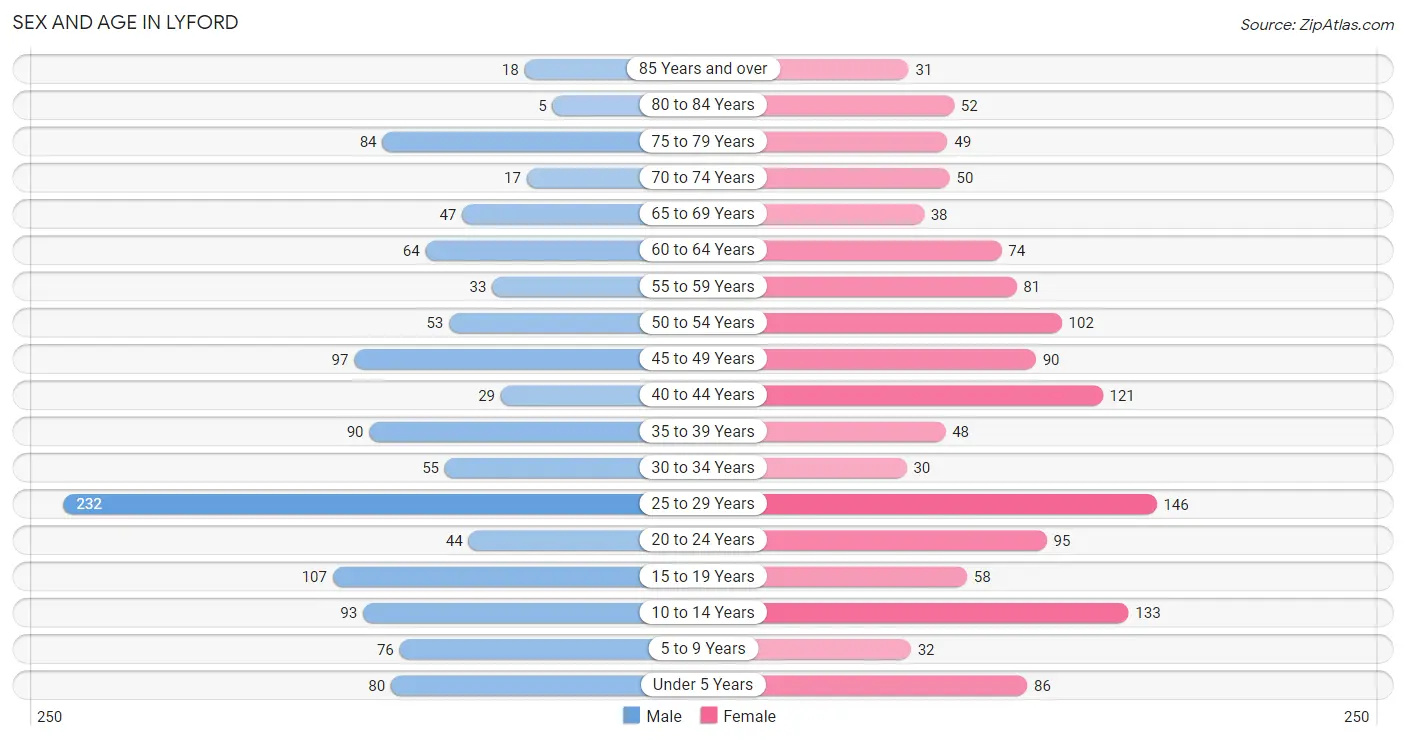
| Age Bracket | Male | Female |
| Under 5 Years | 80 (6.5%) | 86 (6.5%) |
| 5 to 9 Years | 76 (6.2%) | 32 (2.4%) |
| 10 to 14 Years | 93 (7.6%) | 133 (10.1%) |
| 15 to 19 Years | 107 (8.7%) | 58 (4.4%) |
| 20 to 24 Years | 44 (3.6%) | 95 (7.2%) |
| 25 to 29 Years | 232 (19.0%) | 146 (11.1%) |
| 30 to 34 Years | 55 (4.5%) | 30 (2.3%) |
| 35 to 39 Years | 90 (7.3%) | 48 (3.6%) |
| 40 to 44 Years | 29 (2.4%) | 121 (9.2%) |
| 45 to 49 Years | 97 (7.9%) | 90 (6.8%) |
| 50 to 54 Years | 53 (4.3%) | 102 (7.7%) |
| 55 to 59 Years | 33 (2.7%) | 81 (6.2%) |
| 60 to 64 Years | 64 (5.2%) | 74 (5.6%) |
| 65 to 69 Years | 47 (3.8%) | 38 (2.9%) |
| 70 to 74 Years | 17 (1.4%) | 50 (3.8%) |
| 75 to 79 Years | 84 (6.9%) | 49 (3.7%) |
| 80 to 84 Years | 5 (0.4%) | 52 (4.0%) |
| 85 Years and over | 18 (1.5%) | 31 (2.4%) |
| Total | 1,224 (100.0%) | 1,316 (100.0%) |
Families and Households in Lyford
Median Family Size in Lyford
The median family size in Lyford is 4.64 persons per family, with married-couple families (351 | 70.6%) accounting for the largest median family size of 4.79 persons per family. On the other hand, single male/father families (23 | 4.6%) represent the smallest median family size with 3.70 persons per family.
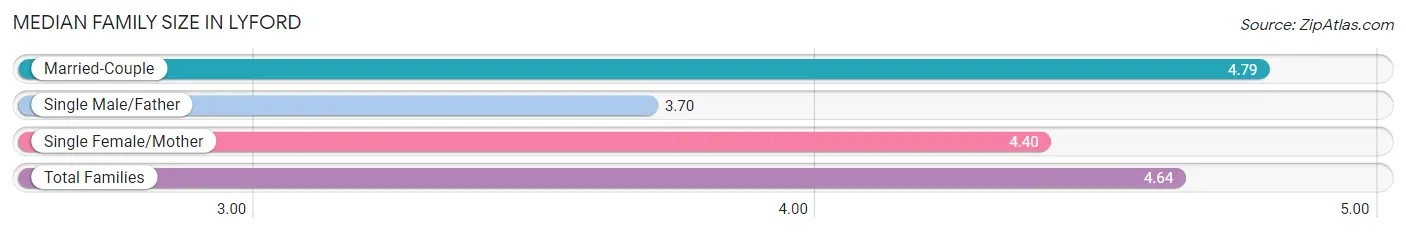
| Family Type | # Families | Family Size |
| Married-Couple | 351 (70.6%) | 4.79 |
| Single Male/Father | 23 (4.6%) | 3.70 |
| Single Female/Mother | 123 (24.7%) | 4.40 |
| Total Families | 497 (100.0%) | 4.64 |
Median Household Size in Lyford
The median household size in Lyford is 3.68 persons per household, with married-couple households (351 | 50.9%) accounting for the largest median household size of 4.79 persons per household. non-family households (193 | 28.0%) represent the smallest median household size with 1.13 persons per household.
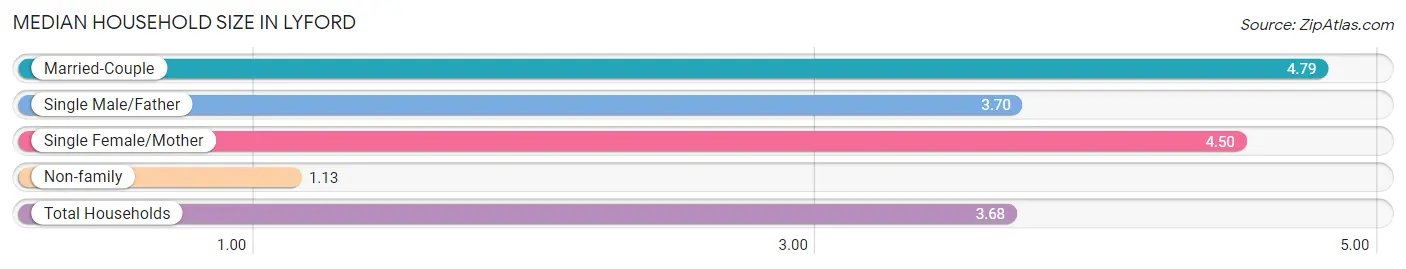
| Household Type | # Households | Household Size |
| Married-Couple | 351 (50.9%) | 4.79 |
| Single Male/Father | 23 (3.3%) | 3.70 |
| Single Female/Mother | 123 (17.8%) | 4.50 |
| Non-family | 193 (28.0%) | 1.13 |
| Total Households | 690 (100.0%) | 3.68 |
Household Size by Marriage Status in Lyford
Out of a total of 690 households in Lyford, 497 (72.0%) are family households, while 193 (28.0%) are nonfamily households. The most numerous type of family households are 2-person households, comprising 158, and the most common type of nonfamily households are 1-person households, comprising 154.
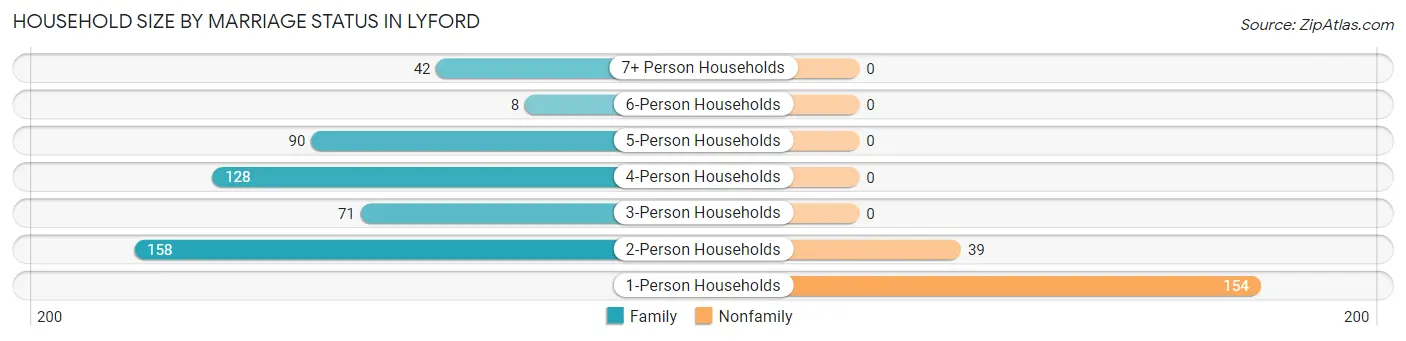
| Household Size | Family Households | Nonfamily Households |
| 1-Person Households | - | 154 (22.3%) |
| 2-Person Households | 158 (22.9%) | 39 (5.7%) |
| 3-Person Households | 71 (10.3%) | 0 (0.0%) |
| 4-Person Households | 128 (18.5%) | 0 (0.0%) |
| 5-Person Households | 90 (13.0%) | 0 (0.0%) |
| 6-Person Households | 8 (1.2%) | 0 (0.0%) |
| 7+ Person Households | 42 (6.1%) | 0 (0.0%) |
| Total | 497 (72.0%) | 193 (28.0%) |
Female Fertility in Lyford
Fertility by Age in Lyford
Average fertility rate in Lyford is 66.0 births per 1,000 women. Women in the age bracket of 20 to 34 years have the highest fertility rate with 155.0 births per 1,000 women. Women in the age bracket of 20 to 34 years acount for 100.0% of all women with births.
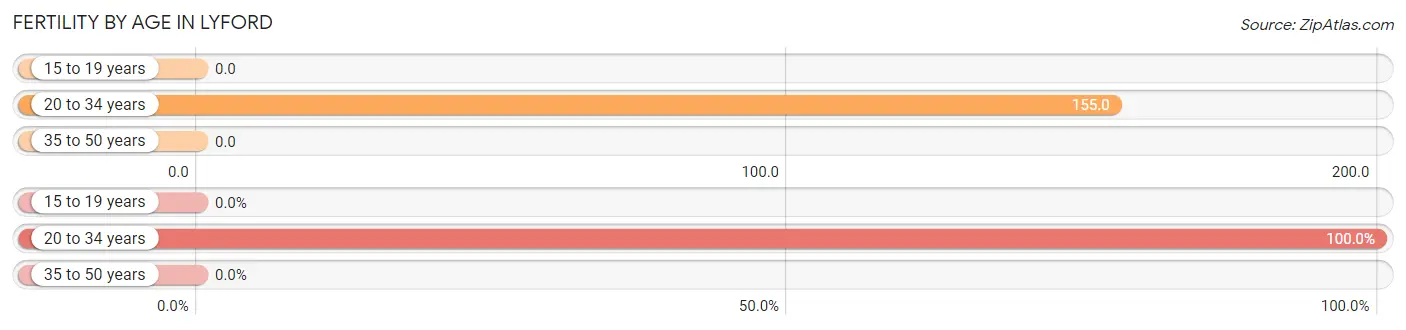
| Age Bracket | Women with Births | Births / 1,000 Women |
| 15 to 19 years | 0 (0.0%) | 0.0 |
| 20 to 34 years | 42 (100.0%) | 155.0 |
| 35 to 50 years | 0 (0.0%) | 0.0 |
| Total | 42 (100.0%) | 66.0 |
Fertility by Age by Marriage Status in Lyford
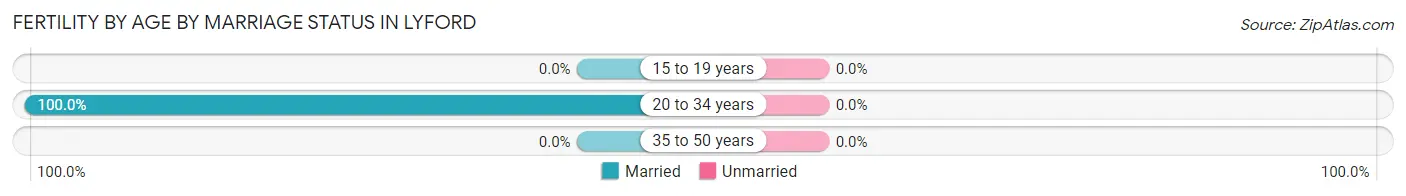
| Age Bracket | Married | Unmarried |
| 15 to 19 years | 0 (0.0%) | 0 (0.0%) |
| 20 to 34 years | 42 (100.0%) | 0 (0.0%) |
| 35 to 50 years | 0 (0.0%) | 0 (0.0%) |
| Total | 42 (100.0%) | 0 (0.0%) |
Fertility by Education in Lyford
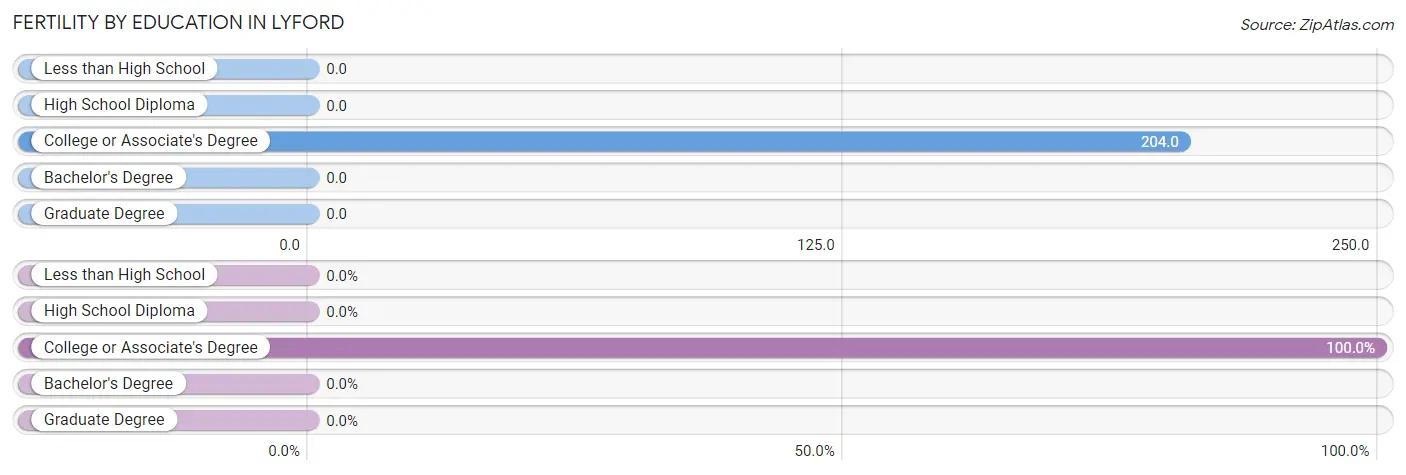
| Educational Attainment | Women with Births | Births / 1,000 Women |
| Less than High School | 0 (0.0%) | 0.0 |
| High School Diploma | 0 (0.0%) | 0.0 |
| College or Associate's Degree | 42 (100.0%) | 204.0 |
| Bachelor's Degree | 0 (0.0%) | 0.0 |
| Graduate Degree | 0 (0.0%) | 0.0 |
| Total | 42 (100.0%) | 66.0 |
Fertility by Education by Marriage Status in Lyford
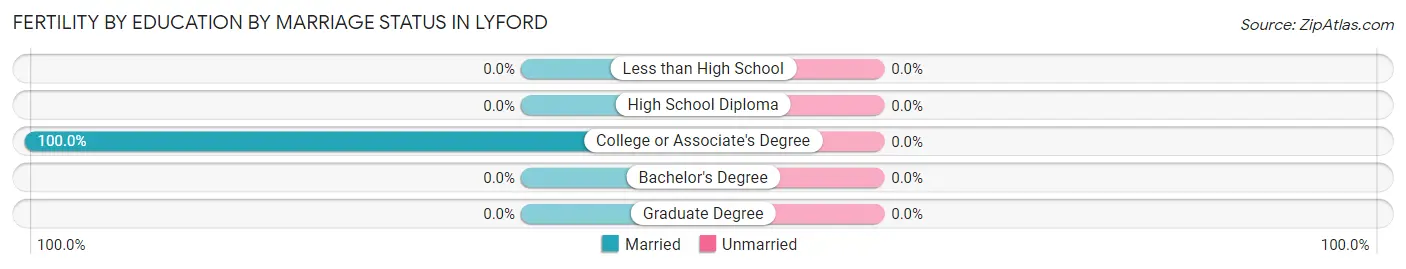
| Educational Attainment | Married | Unmarried |
| Less than High School | 0 (0.0%) | 0 (0.0%) |
| High School Diploma | 0 (0.0%) | 0 (0.0%) |
| College or Associate's Degree | 42 (100.0%) | 0 (0.0%) |
| Bachelor's Degree | 0 (0.0%) | 0 (0.0%) |
| Graduate Degree | 0 (0.0%) | 0 (0.0%) |
| Total | 42 (100.0%) | 0 (0.0%) |
Employment Characteristics in Lyford
Employment by Class of Employer in Lyford
Among the 1,007 employed individuals in Lyford, private company employees (791 | 78.5%), local government employees (82 | 8.1%), and self-employed (not incorporated) (66 | 6.6%) make up the most common classes of employment.
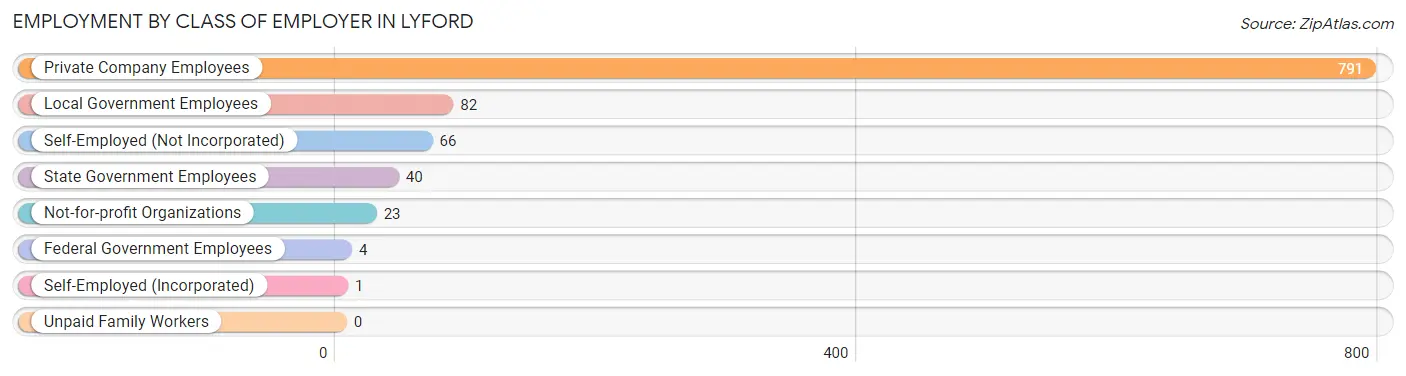
| Employer Class | # Employees | % Employees |
| Private Company Employees | 791 | 78.5% |
| Self-Employed (Incorporated) | 1 | 0.1% |
| Self-Employed (Not Incorporated) | 66 | 6.6% |
| Not-for-profit Organizations | 23 | 2.3% |
| Local Government Employees | 82 | 8.1% |
| State Government Employees | 40 | 4.0% |
| Federal Government Employees | 4 | 0.4% |
| Unpaid Family Workers | 0 | 0.0% |
| Total | 1,007 | 100.0% |
Employment Status by Age in Lyford
According to the labor force statistics for Lyford, out of the total population over 16 years of age (2,018), 52.8% or 1,066 individuals are in the labor force, with 5.5% or 59 of them unemployed. The age group with the highest labor force participation rate is 30 to 34 years, with 88.2% or 75 individuals in the labor force. Within the labor force, the 30 to 34 years age range has the highest percentage of unemployed individuals, with 16.0% or 12 of them being unemployed.
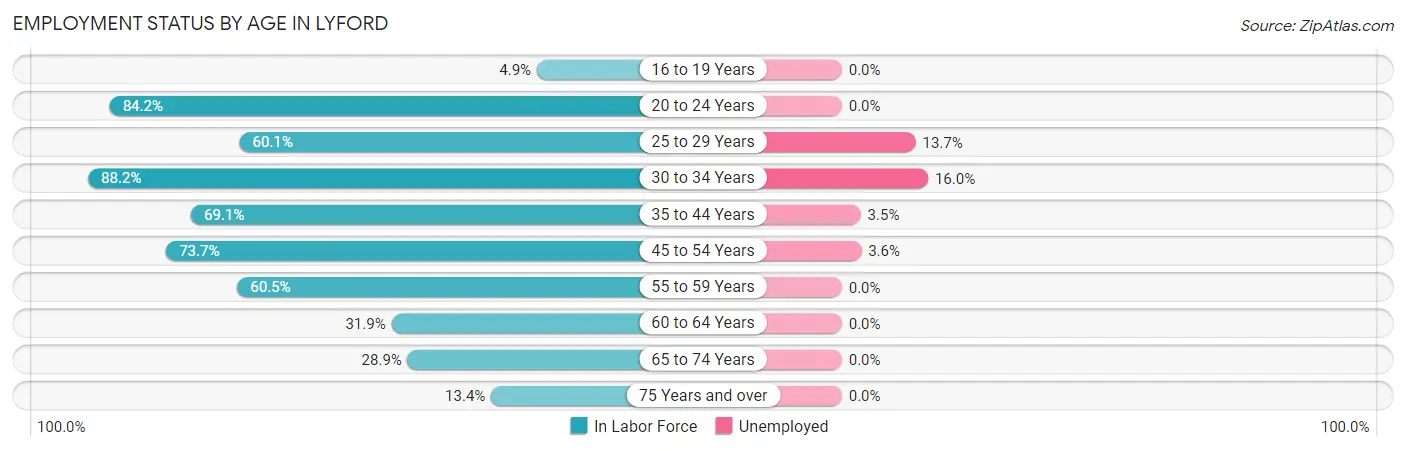
| Age Bracket | In Labor Force | Unemployed |
| 16 to 19 Years | 7 (4.9%) | 0 (0.0%) |
| 20 to 24 Years | 117 (84.2%) | 0 (0.0%) |
| 25 to 29 Years | 227 (60.1%) | 31 (13.7%) |
| 30 to 34 Years | 75 (88.2%) | 12 (16.0%) |
| 35 to 44 Years | 199 (69.1%) | 7 (3.5%) |
| 45 to 54 Years | 252 (73.7%) | 9 (3.6%) |
| 55 to 59 Years | 69 (60.5%) | 0 (0.0%) |
| 60 to 64 Years | 44 (31.9%) | 0 (0.0%) |
| 65 to 74 Years | 44 (28.9%) | 0 (0.0%) |
| 75 Years and over | 32 (13.4%) | 0 (0.0%) |
| Total | 1,066 (52.8%) | 59 (5.5%) |
Employment Status by Educational Attainment in Lyford
According to labor force statistics for Lyford, 64.4% of individuals (866) out of the total population between 25 and 64 years of age (1,345) are in the labor force, with 6.8% or 59 of them being unemployed. The group with the highest labor force participation rate are those with the educational attainment of college / associate degree, with 84.8% or 235 individuals in the labor force. Within the labor force, individuals with high school diploma education have the highest percentage of unemployment, with 12.7% or 43 of them being unemployed.
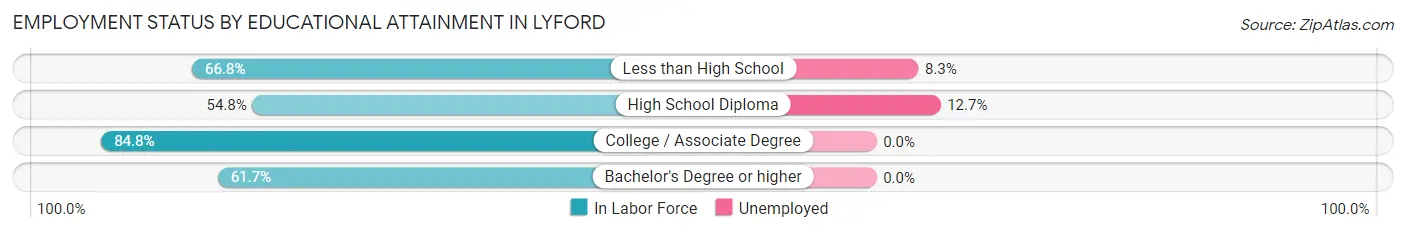
| Educational Attainment | In Labor Force | Unemployed |
| Less than High School | 193 (66.8%) | 24 (8.3%) |
| High School Diploma | 338 (54.8%) | 78 (12.7%) |
| College / Associate Degree | 235 (84.8%) | 0 (0.0%) |
| Bachelor's Degree or higher | 100 (61.7%) | 0 (0.0%) |
| Total | 866 (64.4%) | 91 (6.8%) |
Employment Occupations by Sex in Lyford
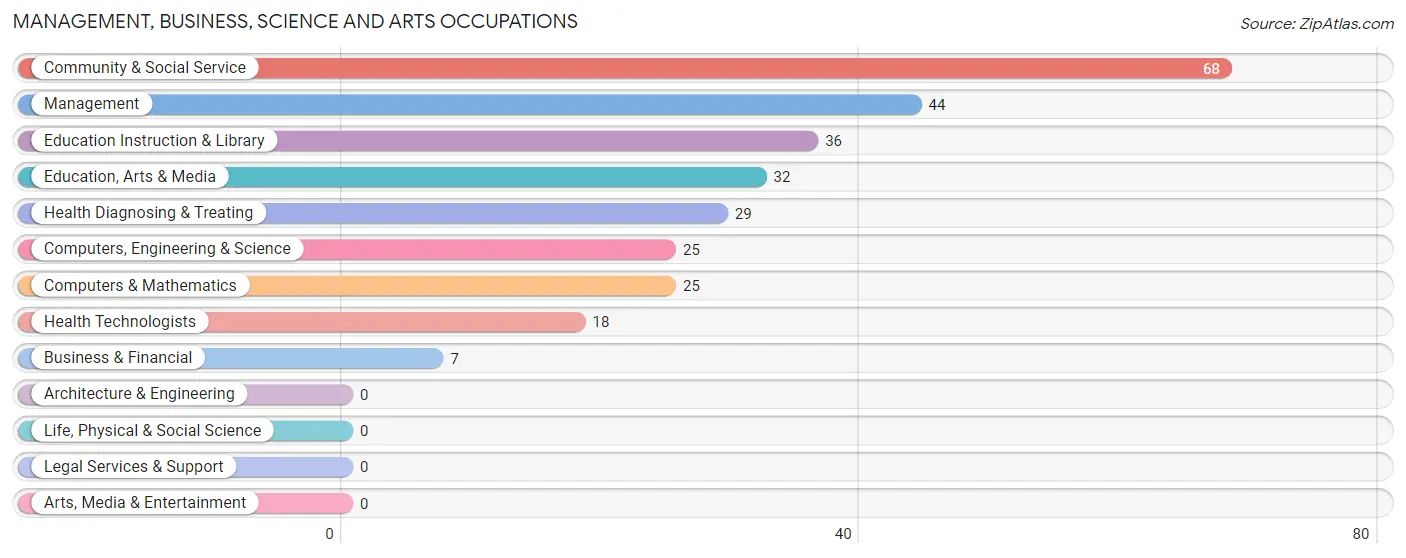
Management, Business, Science and Arts Occupations
The most common Management, Business, Science and Arts occupations in Lyford are Community & Social Service (68 | 6.8%), Management (44 | 4.4%), Education Instruction & Library (36 | 3.6%), Education, Arts & Media (32 | 3.2%), and Health Diagnosing & Treating (29 | 2.9%).
Management, Business, Science and Arts Occupations by Sex
Within the Management, Business, Science and Arts occupations in Lyford, the most male-oriented occupations are Computers, Engineering & Science (100.0%), Computers & Mathematics (100.0%), and Management (52.3%), while the most female-oriented occupations are Business & Financial (100.0%), Education, Arts & Media (100.0%), and Health Technologists (100.0%).
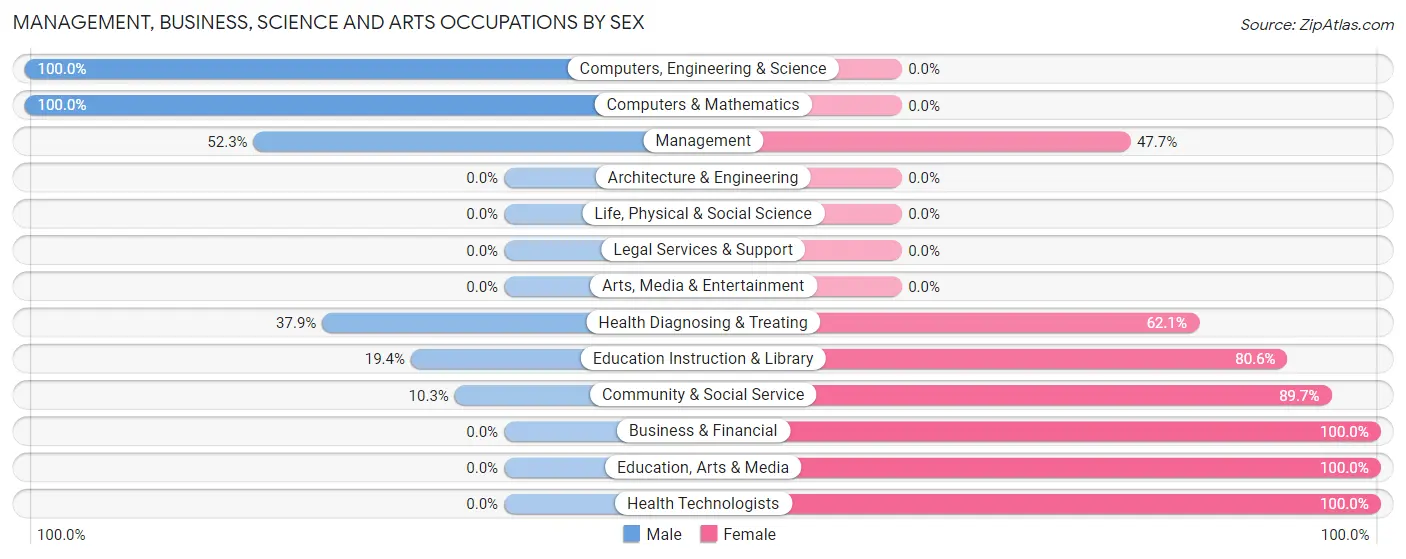
| Occupation | Male | Female |
| Management | 23 (52.3%) | 21 (47.7%) |
| Business & Financial | 0 (0.0%) | 7 (100.0%) |
| Computers, Engineering & Science | 25 (100.0%) | 0 (0.0%) |
| Computers & Mathematics | 25 (100.0%) | 0 (0.0%) |
| Architecture & Engineering | 0 (0.0%) | 0 (0.0%) |
| Life, Physical & Social Science | 0 (0.0%) | 0 (0.0%) |
| Community & Social Service | 7 (10.3%) | 61 (89.7%) |
| Education, Arts & Media | 0 (0.0%) | 32 (100.0%) |
| Legal Services & Support | 0 (0.0%) | 0 (0.0%) |
| Education Instruction & Library | 7 (19.4%) | 29 (80.6%) |
| Arts, Media & Entertainment | 0 (0.0%) | 0 (0.0%) |
| Health Diagnosing & Treating | 11 (37.9%) | 18 (62.1%) |
| Health Technologists | 0 (0.0%) | 18 (100.0%) |
| Total (Category) | 66 (38.2%) | 107 (61.9%) |
| Total (Overall) | 540 (53.6%) | 467 (46.4%) |
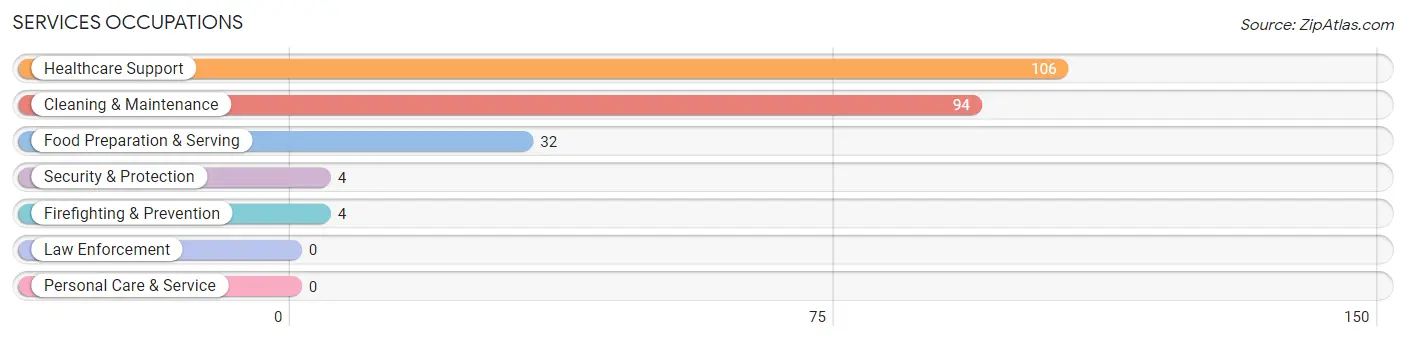
Services Occupations
The most common Services occupations in Lyford are Healthcare Support (106 | 10.5%), Cleaning & Maintenance (94 | 9.3%), Food Preparation & Serving (32 | 3.2%), Security & Protection (4 | 0.4%), and Firefighting & Prevention (4 | 0.4%).
Services Occupations by Sex
Within the Services occupations in Lyford, the most male-oriented occupations are Security & Protection (100.0%), Firefighting & Prevention (100.0%), and Cleaning & Maintenance (89.4%), while the most female-oriented occupations are Healthcare Support (100.0%), Food Preparation & Serving (62.5%), and Cleaning & Maintenance (10.6%).
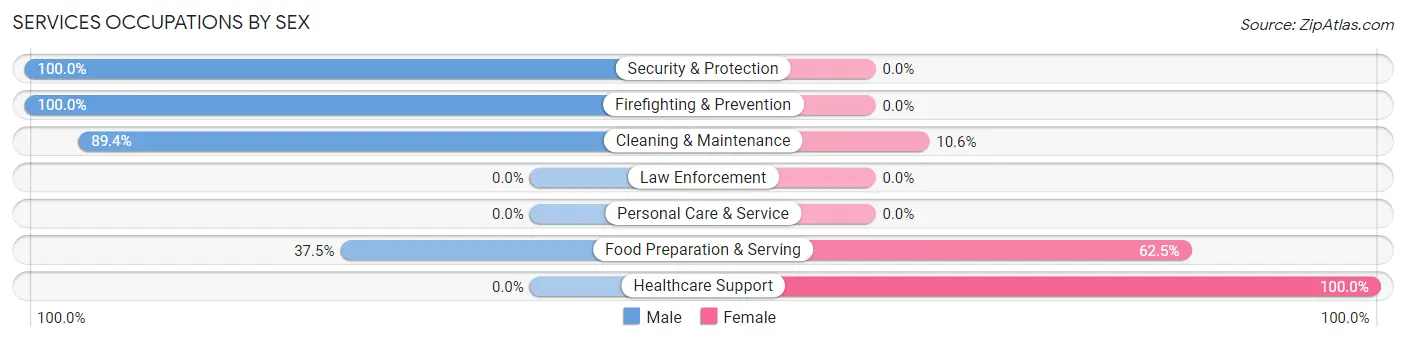
| Occupation | Male | Female |
| Healthcare Support | 0 (0.0%) | 106 (100.0%) |
| Security & Protection | 4 (100.0%) | 0 (0.0%) |
| Firefighting & Prevention | 4 (100.0%) | 0 (0.0%) |
| Law Enforcement | 0 (0.0%) | 0 (0.0%) |
| Food Preparation & Serving | 12 (37.5%) | 20 (62.5%) |
| Cleaning & Maintenance | 84 (89.4%) | 10 (10.6%) |
| Personal Care & Service | 0 (0.0%) | 0 (0.0%) |
| Total (Category) | 100 (42.4%) | 136 (57.6%) |
| Total (Overall) | 540 (53.6%) | 467 (46.4%) |
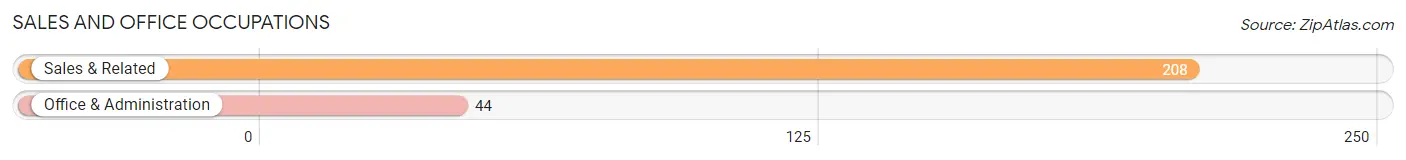
Sales and Office Occupations
The most common Sales and Office occupations in Lyford are Sales & Related (208 | 20.7%), and Office & Administration (44 | 4.4%).
Sales and Office Occupations by Sex
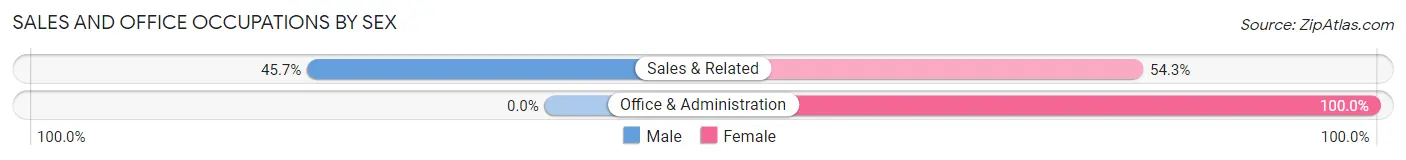
| Occupation | Male | Female |
| Sales & Related | 95 (45.7%) | 113 (54.3%) |
| Office & Administration | 0 (0.0%) | 44 (100.0%) |
| Total (Category) | 95 (37.7%) | 157 (62.3%) |
| Total (Overall) | 540 (53.6%) | 467 (46.4%) |
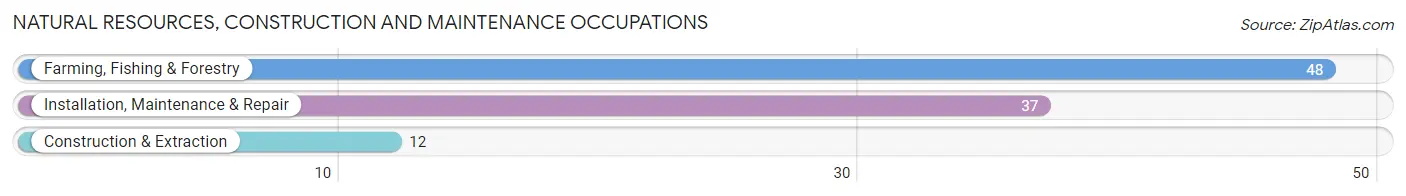
Natural Resources, Construction and Maintenance Occupations
The most common Natural Resources, Construction and Maintenance occupations in Lyford are Farming, Fishing & Forestry (48 | 4.8%), Installation, Maintenance & Repair (37 | 3.7%), and Construction & Extraction (12 | 1.2%).
Natural Resources, Construction and Maintenance Occupations by Sex
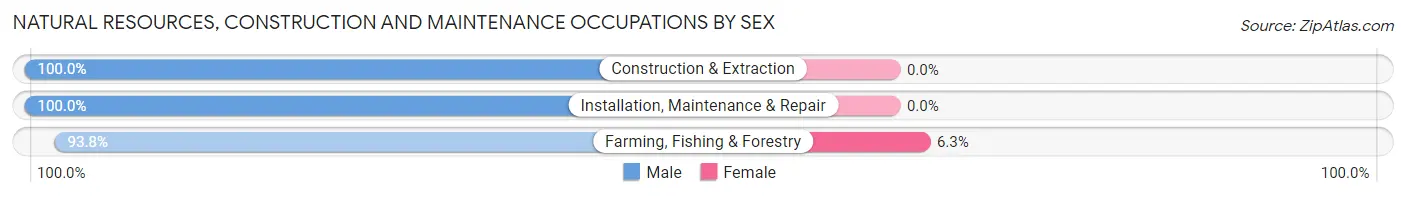
| Occupation | Male | Female |
| Farming, Fishing & Forestry | 45 (93.8%) | 3 (6.2%) |
| Construction & Extraction | 12 (100.0%) | 0 (0.0%) |
| Installation, Maintenance & Repair | 37 (100.0%) | 0 (0.0%) |
| Total (Category) | 94 (96.9%) | 3 (3.1%) |
| Total (Overall) | 540 (53.6%) | 467 (46.4%) |
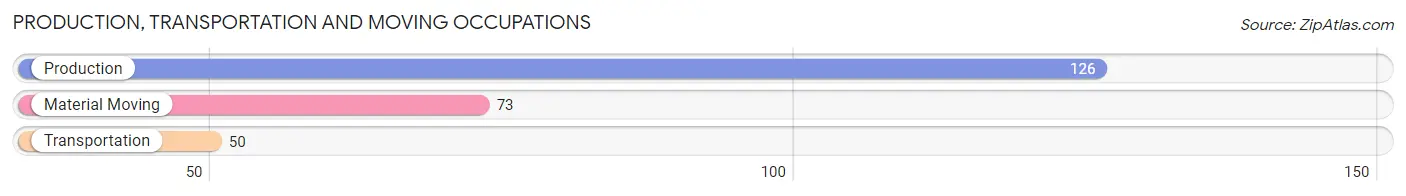
Production, Transportation and Moving Occupations
The most common Production, Transportation and Moving occupations in Lyford are Production (126 | 12.5%), Material Moving (73 | 7.2%), and Transportation (50 | 5.0%).
Production, Transportation and Moving Occupations by Sex
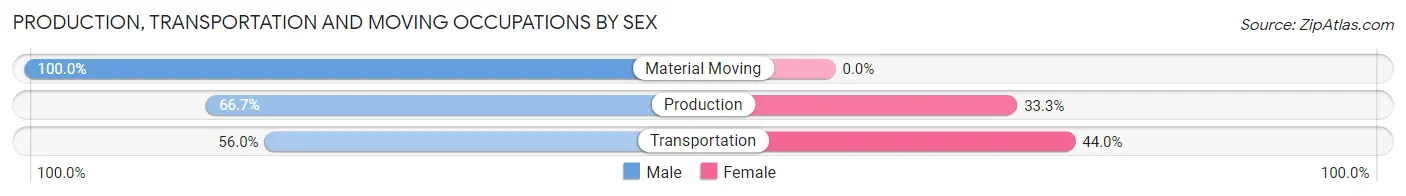
| Occupation | Male | Female |
| Production | 84 (66.7%) | 42 (33.3%) |
| Transportation | 28 (56.0%) | 22 (44.0%) |
| Material Moving | 73 (100.0%) | 0 (0.0%) |
| Total (Category) | 185 (74.3%) | 64 (25.7%) |
| Total (Overall) | 540 (53.6%) | 467 (46.4%) |
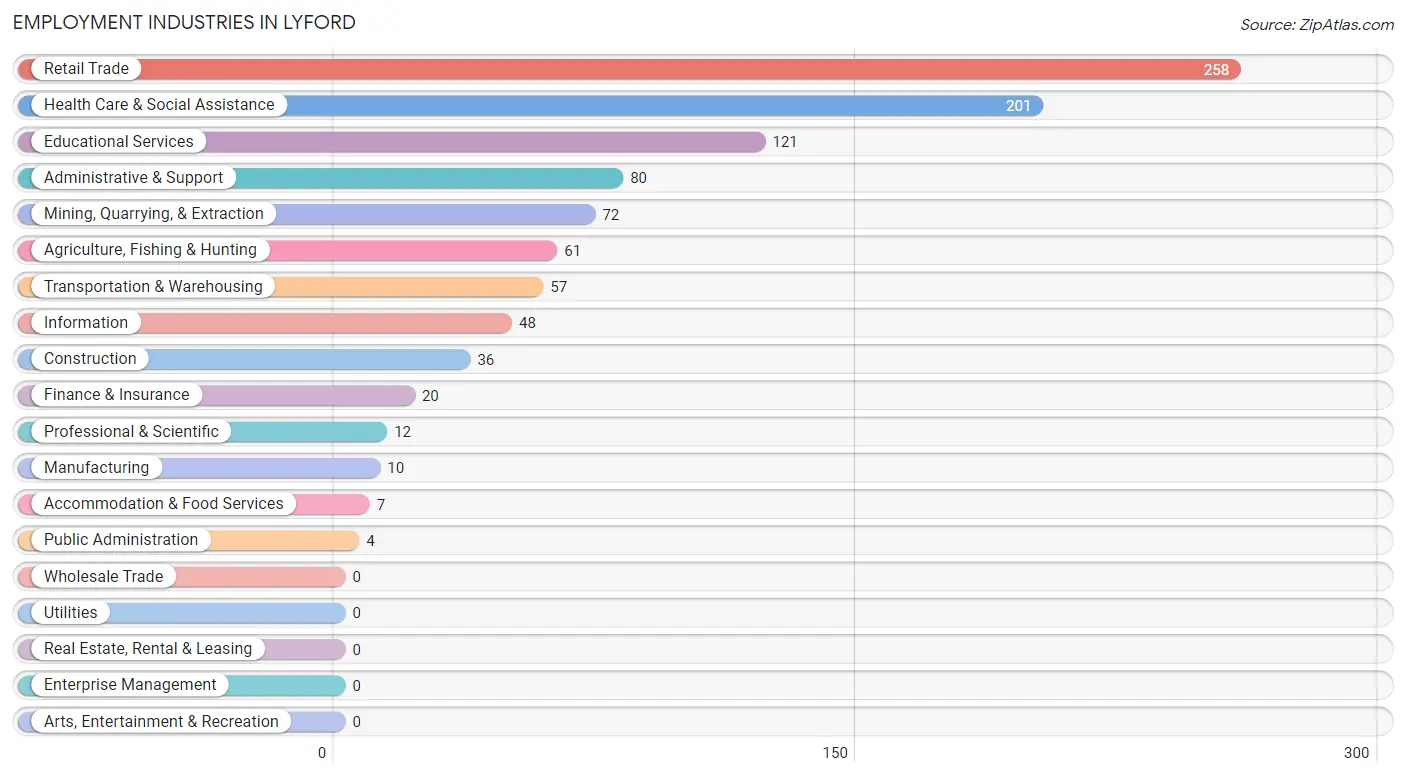
Employment Industries by Sex in Lyford
Employment Industries in Lyford
The major employment industries in Lyford include Retail Trade (258 | 25.6%), Health Care & Social Assistance (201 | 20.0%), Educational Services (121 | 12.0%), Administrative & Support (80 | 7.9%), and Mining, Quarrying, & Extraction (72 | 7.1%).
Employment Industries by Sex in Lyford
The Lyford industries that see more men than women are Mining, Quarrying, & Extraction (100.0%), Construction (100.0%), and Manufacturing (100.0%), whereas the industries that tend to have a higher number of women are Finance & Insurance (100.0%), Professional & Scientific (100.0%), and Health Care & Social Assistance (94.5%).
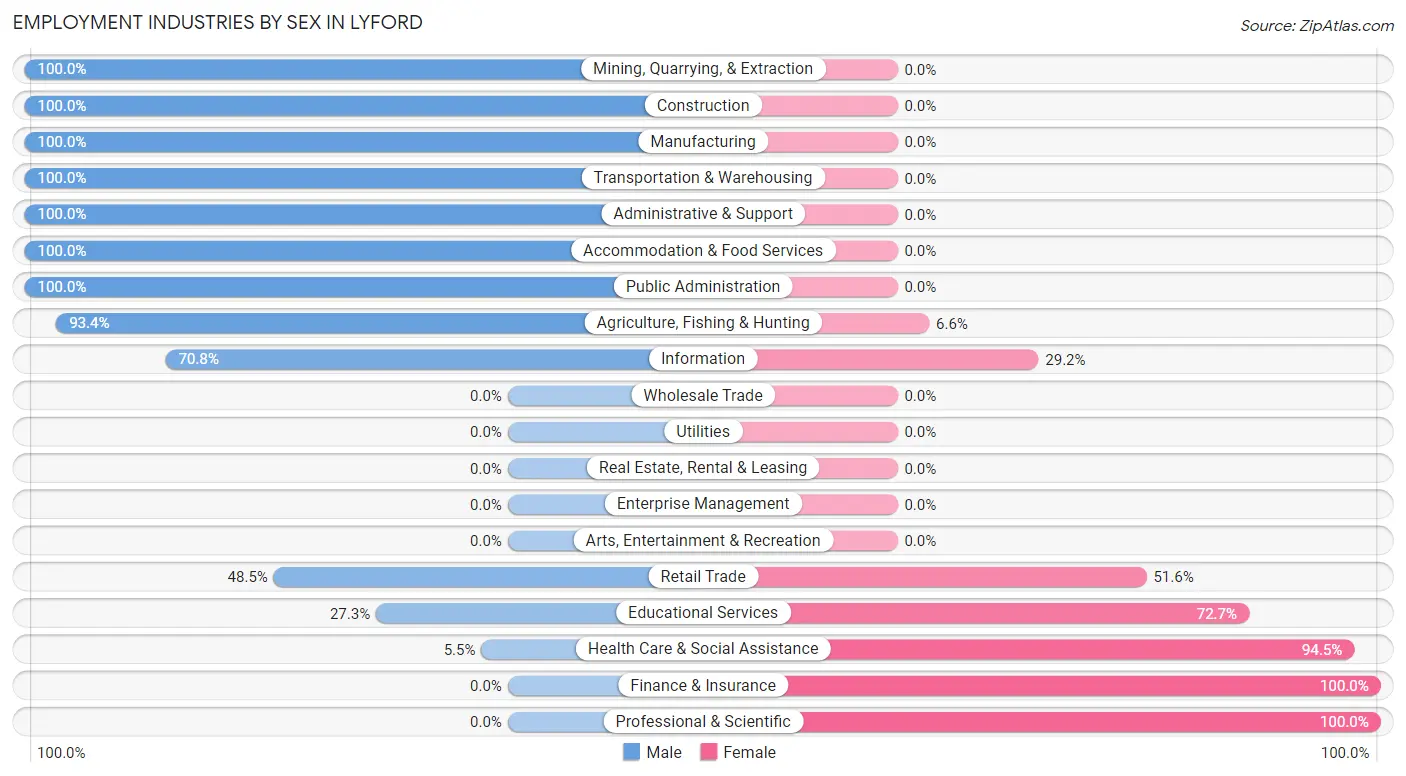
| Industry | Male | Female |
| Agriculture, Fishing & Hunting | 57 (93.4%) | 4 (6.6%) |
| Mining, Quarrying, & Extraction | 72 (100.0%) | 0 (0.0%) |
| Construction | 36 (100.0%) | 0 (0.0%) |
| Manufacturing | 10 (100.0%) | 0 (0.0%) |
| Wholesale Trade | 0 (0.0%) | 0 (0.0%) |
| Retail Trade | 125 (48.4%) | 133 (51.5%) |
| Transportation & Warehousing | 57 (100.0%) | 0 (0.0%) |
| Utilities | 0 (0.0%) | 0 (0.0%) |
| Information | 34 (70.8%) | 14 (29.2%) |
| Finance & Insurance | 0 (0.0%) | 20 (100.0%) |
| Real Estate, Rental & Leasing | 0 (0.0%) | 0 (0.0%) |
| Professional & Scientific | 0 (0.0%) | 12 (100.0%) |
| Enterprise Management | 0 (0.0%) | 0 (0.0%) |
| Administrative & Support | 80 (100.0%) | 0 (0.0%) |
| Educational Services | 33 (27.3%) | 88 (72.7%) |
| Health Care & Social Assistance | 11 (5.5%) | 190 (94.5%) |
| Arts, Entertainment & Recreation | 0 (0.0%) | 0 (0.0%) |
| Accommodation & Food Services | 7 (100.0%) | 0 (0.0%) |
| Public Administration | 4 (100.0%) | 0 (0.0%) |
| Total | 540 (53.6%) | 467 (46.4%) |
Education in Lyford
School Enrollment in Lyford
The most common levels of schooling among the 535 students in Lyford are high school (155 | 29.0%), middle school (130 | 24.3%), and college / undergraduate (92 | 17.2%).
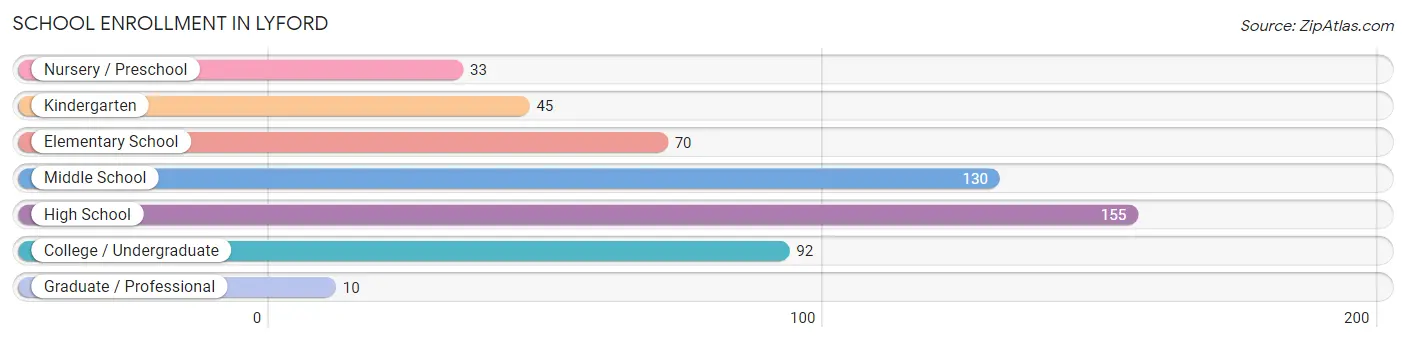
| School Level | # Students | % Students |
| Nursery / Preschool | 33 | 6.2% |
| Kindergarten | 45 | 8.4% |
| Elementary School | 70 | 13.1% |
| Middle School | 130 | 24.3% |
| High School | 155 | 29.0% |
| College / Undergraduate | 92 | 17.2% |
| Graduate / Professional | 10 | 1.9% |
| Total | 535 | 100.0% |
School Enrollment by Age by Funding Source in Lyford
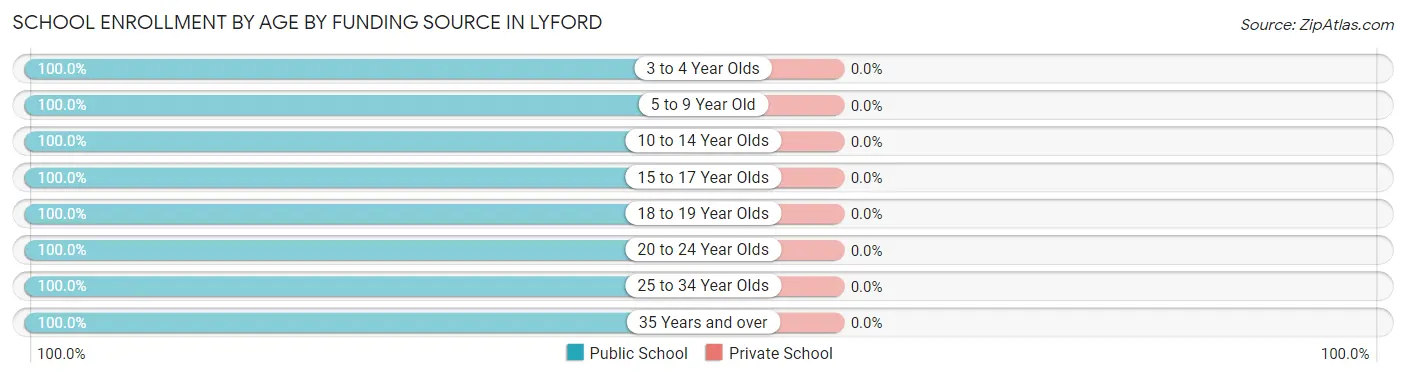
| Age Bracket | Public School | Private School |
| 3 to 4 Year Olds | 33 (100.0%) | 0 (0.0%) |
| 5 to 9 Year Old | 90 (100.0%) | 0 (0.0%) |
| 10 to 14 Year Olds | 168 (100.0%) | 0 (0.0%) |
| 15 to 17 Year Olds | 119 (100.0%) | 0 (0.0%) |
| 18 to 19 Year Olds | 39 (100.0%) | 0 (0.0%) |
| 20 to 24 Year Olds | 70 (100.0%) | 0 (0.0%) |
| 25 to 34 Year Olds | 10 (100.0%) | 0 (0.0%) |
| 35 Years and over | 6 (100.0%) | 0 (0.0%) |
| Total | 535 (100.0%) | 0 (0.0%) |
Educational Attainment by Field of Study in Lyford
Education (94 | 35.3%), literature & languages (36 | 13.5%), arts & humanities (33 | 12.4%), engineering (25 | 9.4%), and social sciences (20 | 7.5%) are the most common fields of study among 266 individuals in Lyford who have obtained a bachelor's degree or higher.
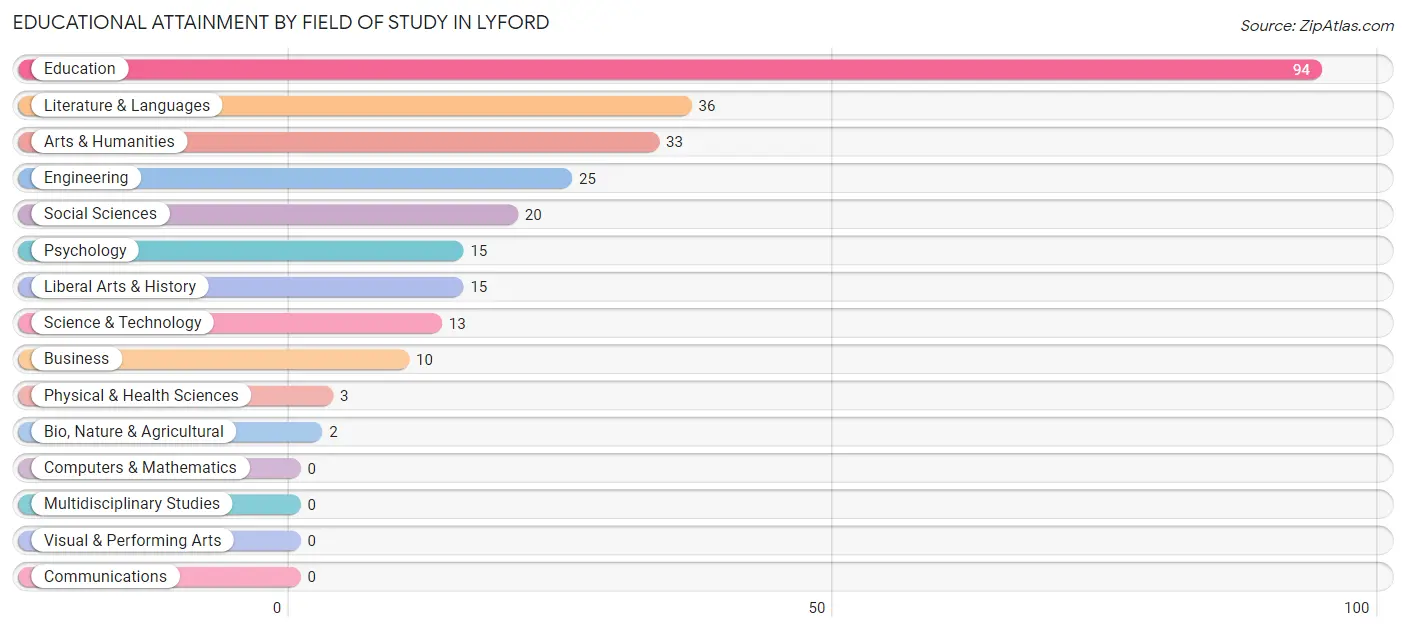
| Field of Study | # Graduates | % Graduates |
| Computers & Mathematics | 0 | 0.0% |
| Bio, Nature & Agricultural | 2 | 0.7% |
| Physical & Health Sciences | 3 | 1.1% |
| Psychology | 15 | 5.6% |
| Social Sciences | 20 | 7.5% |
| Engineering | 25 | 9.4% |
| Multidisciplinary Studies | 0 | 0.0% |
| Science & Technology | 13 | 4.9% |
| Business | 10 | 3.8% |
| Education | 94 | 35.3% |
| Literature & Languages | 36 | 13.5% |
| Liberal Arts & History | 15 | 5.6% |
| Visual & Performing Arts | 0 | 0.0% |
| Communications | 0 | 0.0% |
| Arts & Humanities | 33 | 12.4% |
| Total | 266 | 100.0% |
Transportation & Commute in Lyford
Vehicle Availability by Sex in Lyford
The most prevalent vehicle ownership categories in Lyford are males with 2 vehicles (188, accounting for 34.8%) and females with 2 vehicles (174, making up 40.5%).
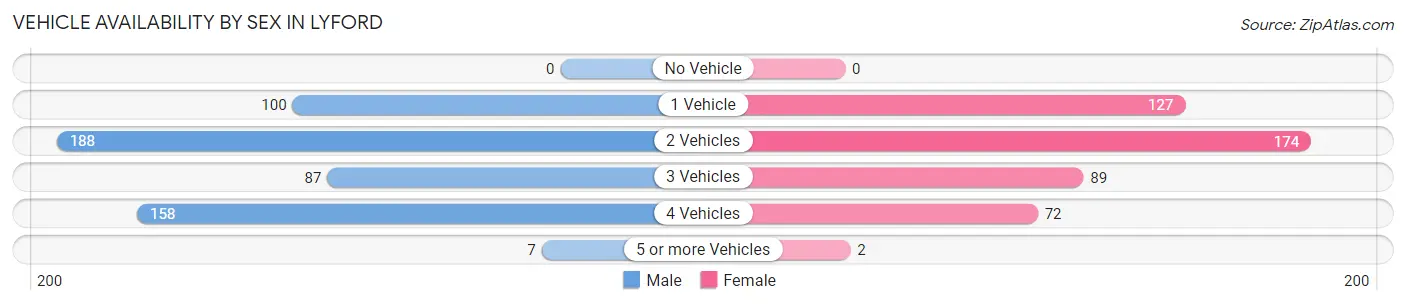
| Vehicles Available | Male | Female |
| No Vehicle | 0 (0.0%) | 0 (0.0%) |
| 1 Vehicle | 100 (18.5%) | 127 (27.4%) |
| 2 Vehicles | 188 (34.8%) | 174 (37.5%) |
| 3 Vehicles | 87 (16.1%) | 89 (19.2%) |
| 4 Vehicles | 158 (29.3%) | 72 (15.5%) |
| 5 or more Vehicles | 7 (1.3%) | 2 (0.4%) |
| Total | 540 (100.0%) | 464 (100.0%) |
Commute Time in Lyford
The most frequently occuring commute durations in Lyford are 10 to 14 minutes (175 commuters, 17.8%), 5 to 9 minutes (167 commuters, 17.0%), and 20 to 24 minutes (133 commuters, 13.5%).
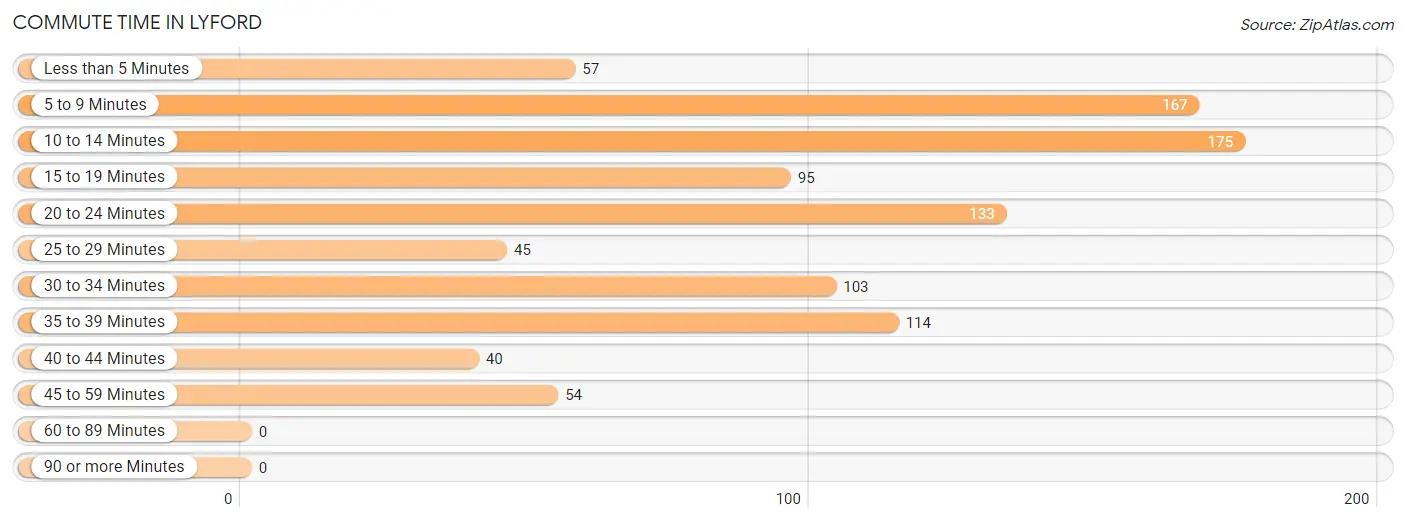
| Commute Time | # Commuters | % Commuters |
| Less than 5 Minutes | 57 | 5.8% |
| 5 to 9 Minutes | 167 | 17.0% |
| 10 to 14 Minutes | 175 | 17.8% |
| 15 to 19 Minutes | 95 | 9.7% |
| 20 to 24 Minutes | 133 | 13.5% |
| 25 to 29 Minutes | 45 | 4.6% |
| 30 to 34 Minutes | 103 | 10.5% |
| 35 to 39 Minutes | 114 | 11.6% |
| 40 to 44 Minutes | 40 | 4.1% |
| 45 to 59 Minutes | 54 | 5.5% |
| 60 to 89 Minutes | 0 | 0.0% |
| 90 or more Minutes | 0 | 0.0% |
Commute Time by Sex in Lyford
The most common commute times in Lyford are 35 to 39 minutes (114 commuters, 21.1%) for males and 5 to 9 minutes (127 commuters, 28.7%) for females.
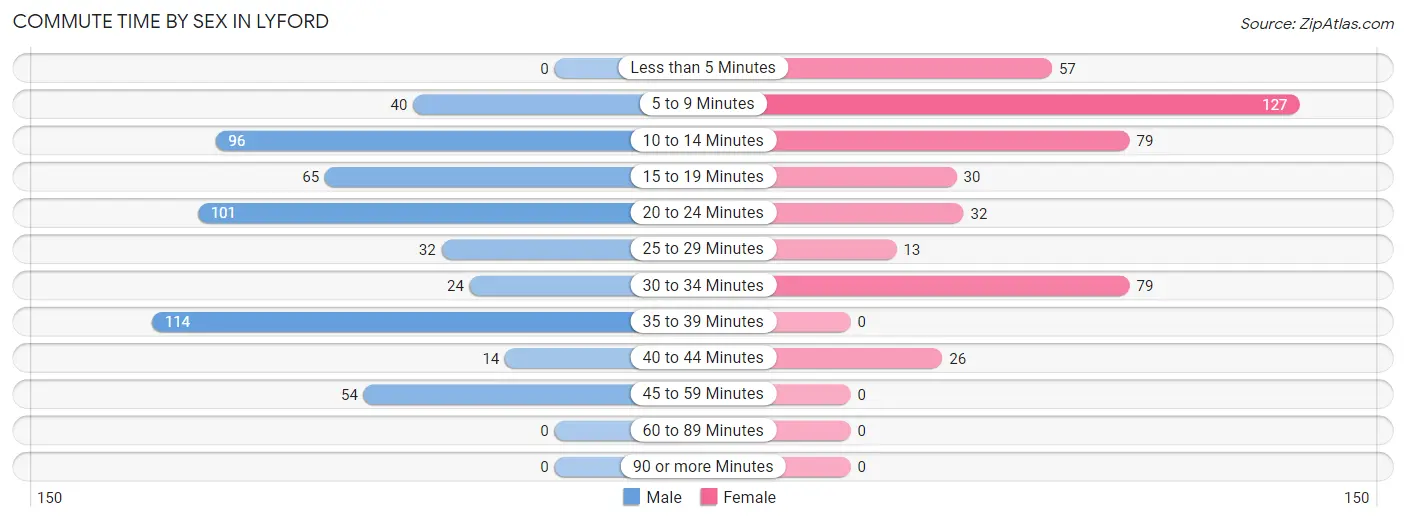
| Commute Time | Male | Female |
| Less than 5 Minutes | 0 (0.0%) | 57 (12.9%) |
| 5 to 9 Minutes | 40 (7.4%) | 127 (28.7%) |
| 10 to 14 Minutes | 96 (17.8%) | 79 (17.8%) |
| 15 to 19 Minutes | 65 (12.0%) | 30 (6.8%) |
| 20 to 24 Minutes | 101 (18.7%) | 32 (7.2%) |
| 25 to 29 Minutes | 32 (5.9%) | 13 (2.9%) |
| 30 to 34 Minutes | 24 (4.4%) | 79 (17.8%) |
| 35 to 39 Minutes | 114 (21.1%) | 0 (0.0%) |
| 40 to 44 Minutes | 14 (2.6%) | 26 (5.9%) |
| 45 to 59 Minutes | 54 (10.0%) | 0 (0.0%) |
| 60 to 89 Minutes | 0 (0.0%) | 0 (0.0%) |
| 90 or more Minutes | 0 (0.0%) | 0 (0.0%) |
Time of Departure to Work by Sex in Lyford
The most frequent times of departure to work in Lyford are 12:00 PM to 3:59 PM (146, 27.0%) for males and 7:30 AM to 7:59 AM (117, 26.4%) for females.
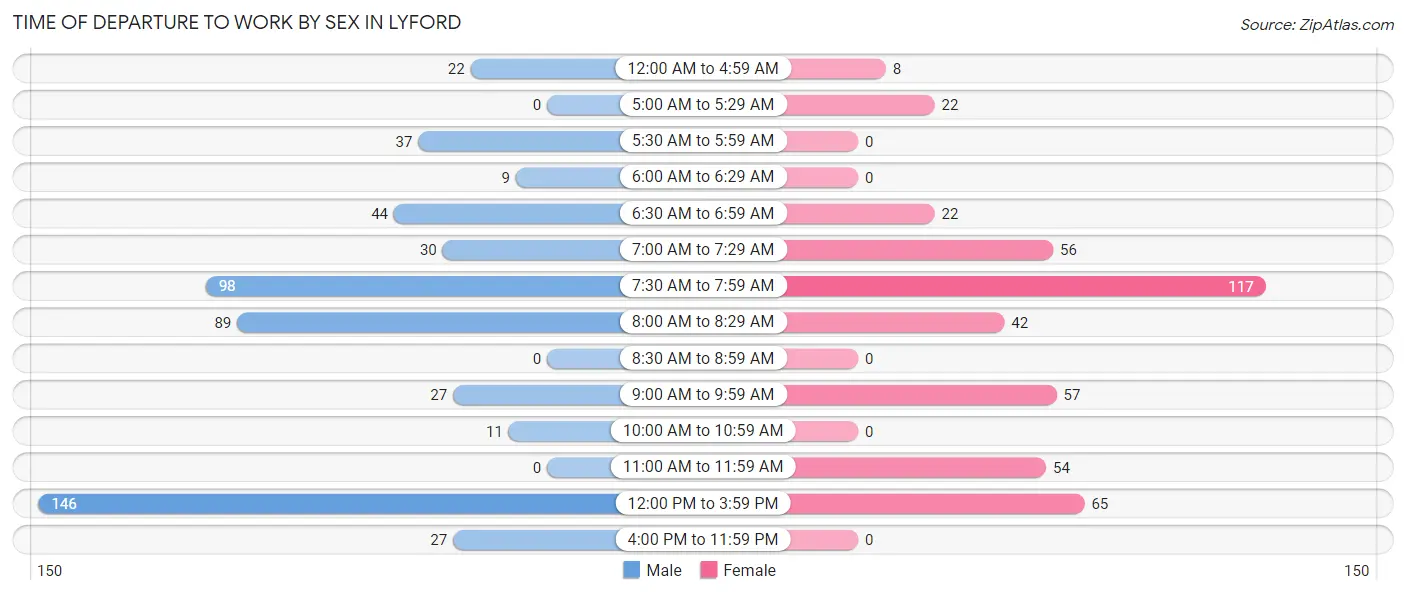
| Time of Departure | Male | Female |
| 12:00 AM to 4:59 AM | 22 (4.1%) | 8 (1.8%) |
| 5:00 AM to 5:29 AM | 0 (0.0%) | 22 (5.0%) |
| 5:30 AM to 5:59 AM | 37 (6.9%) | 0 (0.0%) |
| 6:00 AM to 6:29 AM | 9 (1.7%) | 0 (0.0%) |
| 6:30 AM to 6:59 AM | 44 (8.2%) | 22 (5.0%) |
| 7:00 AM to 7:29 AM | 30 (5.6%) | 56 (12.6%) |
| 7:30 AM to 7:59 AM | 98 (18.1%) | 117 (26.4%) |
| 8:00 AM to 8:29 AM | 89 (16.5%) | 42 (9.5%) |
| 8:30 AM to 8:59 AM | 0 (0.0%) | 0 (0.0%) |
| 9:00 AM to 9:59 AM | 27 (5.0%) | 57 (12.9%) |
| 10:00 AM to 10:59 AM | 11 (2.0%) | 0 (0.0%) |
| 11:00 AM to 11:59 AM | 0 (0.0%) | 54 (12.2%) |
| 12:00 PM to 3:59 PM | 146 (27.0%) | 65 (14.7%) |
| 4:00 PM to 11:59 PM | 27 (5.0%) | 0 (0.0%) |
| Total | 540 (100.0%) | 443 (100.0%) |
Housing Occupancy in Lyford
Occupancy by Ownership in Lyford
Of the total 690 dwellings in Lyford, owner-occupied units account for 463 (67.1%), while renter-occupied units make up 227 (32.9%).
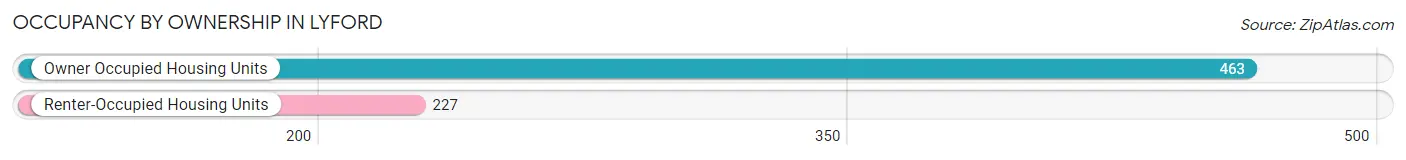
| Occupancy | # Housing Units | % Housing Units |
| Owner Occupied Housing Units | 463 | 67.1% |
| Renter-Occupied Housing Units | 227 | 32.9% |
| Total Occupied Housing Units | 690 | 100.0% |
Occupancy by Household Size in Lyford
| Household Size | # Housing Units | % Housing Units |
| 1-Person Household | 154 | 22.3% |
| 2-Person Household | 197 | 28.5% |
| 3-Person Household | 71 | 10.3% |
| 4+ Person Household | 268 | 38.8% |
| Total Housing Units | 690 | 100.0% |
Occupancy by Ownership by Household Size in Lyford
| Household Size | Owner-occupied | Renter-occupied |
| 1-Person Household | 80 (51.9%) | 74 (48.0%) |
| 2-Person Household | 136 (69.0%) | 61 (31.0%) |
| 3-Person Household | 37 (52.1%) | 34 (47.9%) |
| 4+ Person Household | 210 (78.4%) | 58 (21.6%) |
| Total Housing Units | 463 (67.1%) | 227 (32.9%) |
Occupancy by Educational Attainment in Lyford
| Household Size | Owner-occupied | Renter-occupied |
| Less than High School | 119 (74.8%) | 40 (25.2%) |
| High School Diploma | 165 (69.9%) | 71 (30.1%) |
| College/Associate Degree | 109 (60.9%) | 70 (39.1%) |
| Bachelor's Degree or higher | 70 (60.3%) | 46 (39.7%) |
Occupancy by Age of Householder in Lyford
| Age Bracket | # Households | % Households |
| Under 35 Years | 22 | 3.2% |
| 35 to 44 Years | 140 | 20.3% |
| 45 to 54 Years | 160 | 23.2% |
| 55 to 64 Years | 152 | 22.0% |
| 65 to 74 Years | 92 | 13.3% |
| 75 to 84 Years | 75 | 10.9% |
| 85 Years and Over | 49 | 7.1% |
| Total | 690 | 100.0% |
Housing Finances in Lyford
Median Income by Occupancy in Lyford
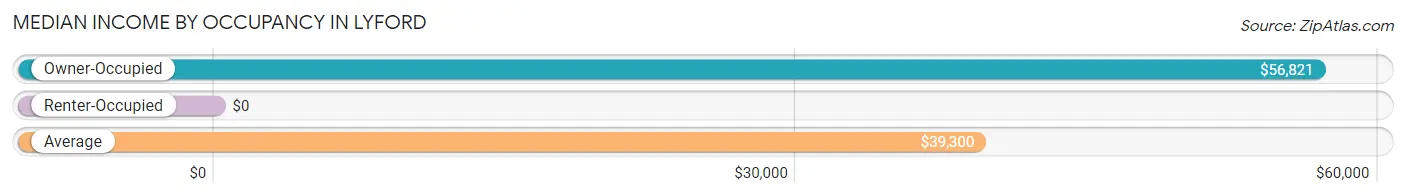
| Occupancy Type | # Households | Median Income |
| Owner-Occupied | 463 (67.1%) | $56,821 |
| Renter-Occupied | 227 (32.9%) | $0 |
| Average | 690 (100.0%) | $39,300 |
Occupancy by Householder Income Bracket in Lyford
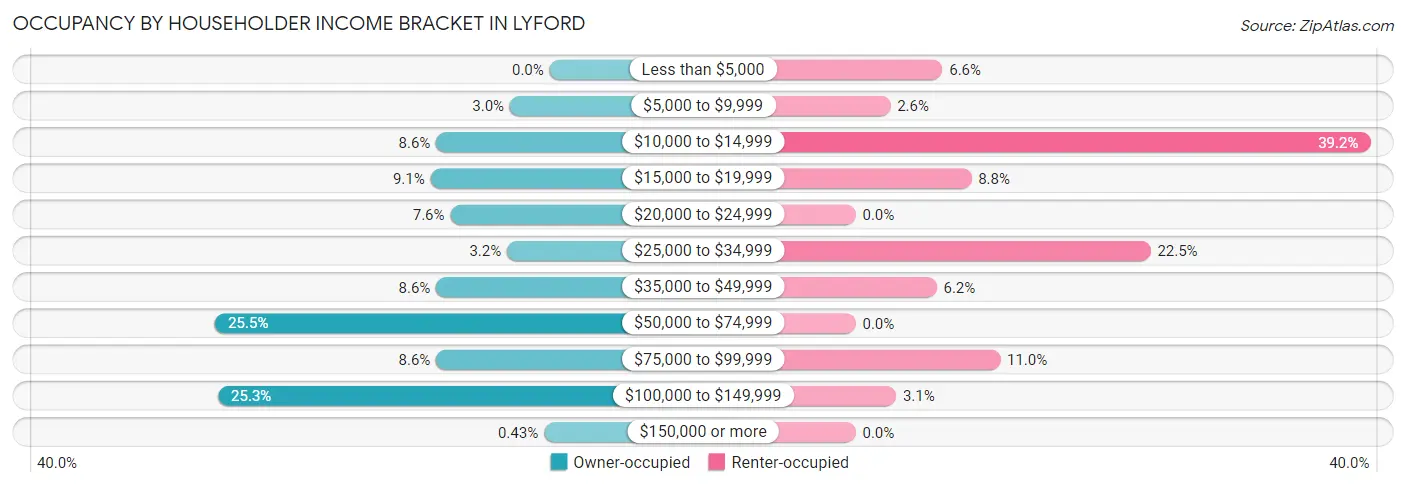
| Income Bracket | Owner-occupied | Renter-occupied |
| Less than $5,000 | 0 (0.0%) | 15 (6.6%) |
| $5,000 to $9,999 | 14 (3.0%) | 6 (2.6%) |
| $10,000 to $14,999 | 40 (8.6%) | 89 (39.2%) |
| $15,000 to $19,999 | 42 (9.1%) | 20 (8.8%) |
| $20,000 to $24,999 | 35 (7.6%) | 0 (0.0%) |
| $25,000 to $34,999 | 15 (3.2%) | 51 (22.5%) |
| $35,000 to $49,999 | 40 (8.6%) | 14 (6.2%) |
| $50,000 to $74,999 | 118 (25.5%) | 0 (0.0%) |
| $75,000 to $99,999 | 40 (8.6%) | 25 (11.0%) |
| $100,000 to $149,999 | 117 (25.3%) | 7 (3.1%) |
| $150,000 or more | 2 (0.4%) | 0 (0.0%) |
| Total | 463 (100.0%) | 227 (100.0%) |
Monthly Housing Cost Tiers in Lyford
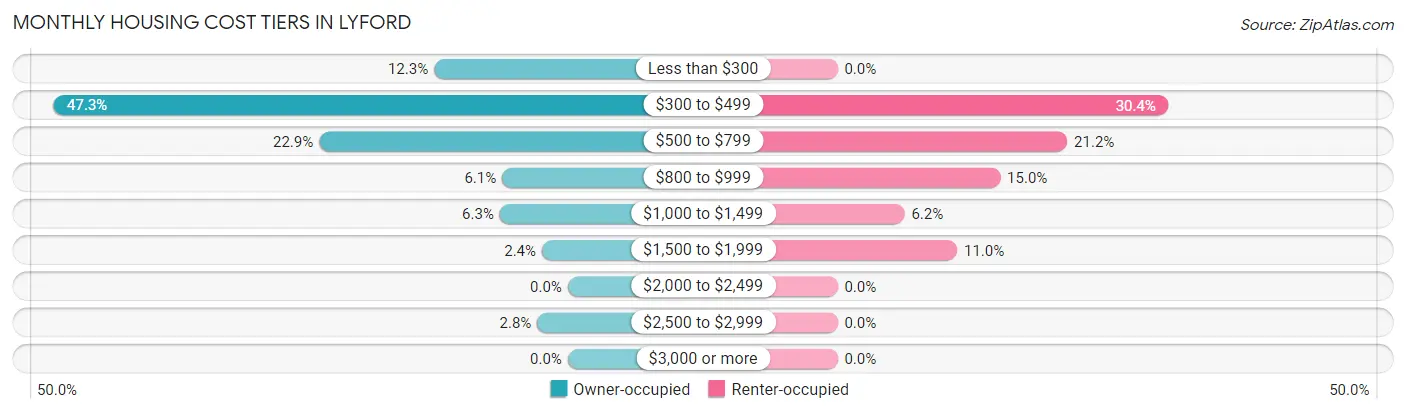
| Monthly Cost | Owner-occupied | Renter-occupied |
| Less than $300 | 57 (12.3%) | 0 (0.0%) |
| $300 to $499 | 219 (47.3%) | 69 (30.4%) |
| $500 to $799 | 106 (22.9%) | 48 (21.1%) |
| $800 to $999 | 28 (6.0%) | 34 (15.0%) |
| $1,000 to $1,499 | 29 (6.3%) | 14 (6.2%) |
| $1,500 to $1,999 | 11 (2.4%) | 25 (11.0%) |
| $2,000 to $2,499 | 0 (0.0%) | 0 (0.0%) |
| $2,500 to $2,999 | 13 (2.8%) | 0 (0.0%) |
| $3,000 or more | 0 (0.0%) | 0 (0.0%) |
| Total | 463 (100.0%) | 227 (100.0%) |
Physical Housing Characteristics in Lyford
Housing Structures in Lyford
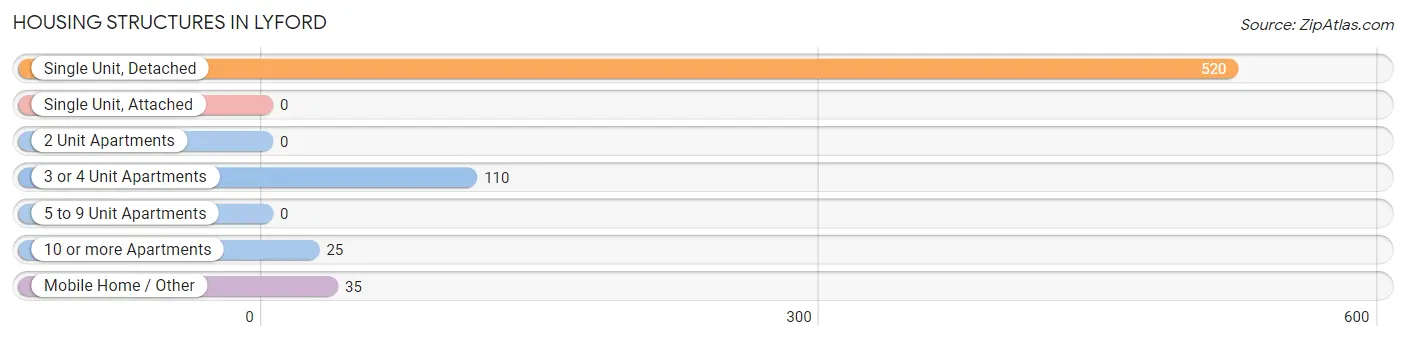
| Structure Type | # Housing Units | % Housing Units |
| Single Unit, Detached | 520 | 75.4% |
| Single Unit, Attached | 0 | 0.0% |
| 2 Unit Apartments | 0 | 0.0% |
| 3 or 4 Unit Apartments | 110 | 15.9% |
| 5 to 9 Unit Apartments | 0 | 0.0% |
| 10 or more Apartments | 25 | 3.6% |
| Mobile Home / Other | 35 | 5.1% |
| Total | 690 | 100.0% |
Housing Structures by Occupancy in Lyford
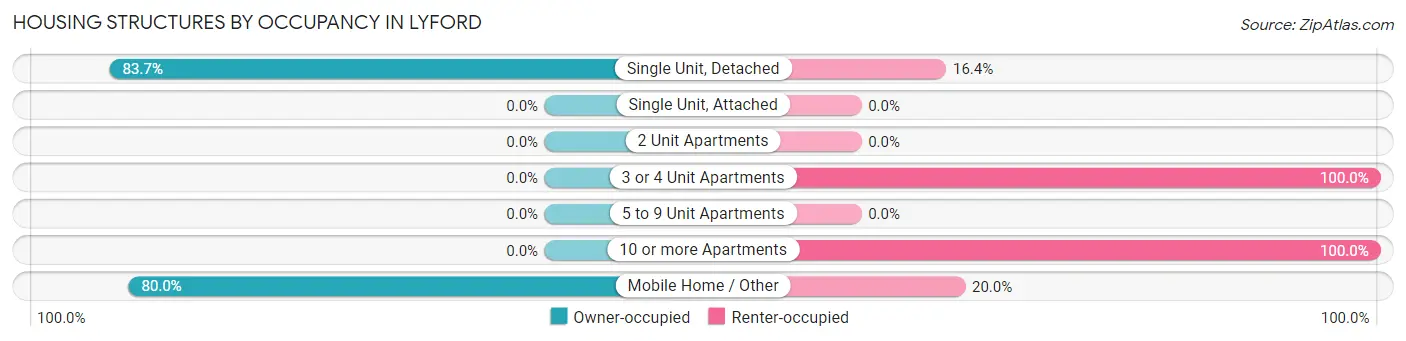
| Structure Type | Owner-occupied | Renter-occupied |
| Single Unit, Detached | 435 (83.7%) | 85 (16.4%) |
| Single Unit, Attached | 0 (0.0%) | 0 (0.0%) |
| 2 Unit Apartments | 0 (0.0%) | 0 (0.0%) |
| 3 or 4 Unit Apartments | 0 (0.0%) | 110 (100.0%) |
| 5 to 9 Unit Apartments | 0 (0.0%) | 0 (0.0%) |
| 10 or more Apartments | 0 (0.0%) | 25 (100.0%) |
| Mobile Home / Other | 28 (80.0%) | 7 (20.0%) |
| Total | 463 (67.1%) | 227 (32.9%) |
Housing Structures by Number of Rooms in Lyford
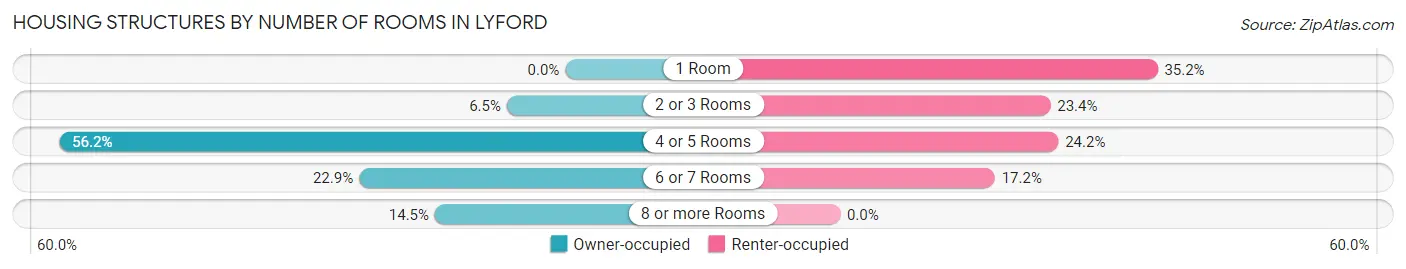
| Number of Rooms | Owner-occupied | Renter-occupied |
| 1 Room | 0 (0.0%) | 80 (35.2%) |
| 2 or 3 Rooms | 30 (6.5%) | 53 (23.4%) |
| 4 or 5 Rooms | 260 (56.2%) | 55 (24.2%) |
| 6 or 7 Rooms | 106 (22.9%) | 39 (17.2%) |
| 8 or more Rooms | 67 (14.5%) | 0 (0.0%) |
| Total | 463 (100.0%) | 227 (100.0%) |
Housing Structure by Heating Type in Lyford
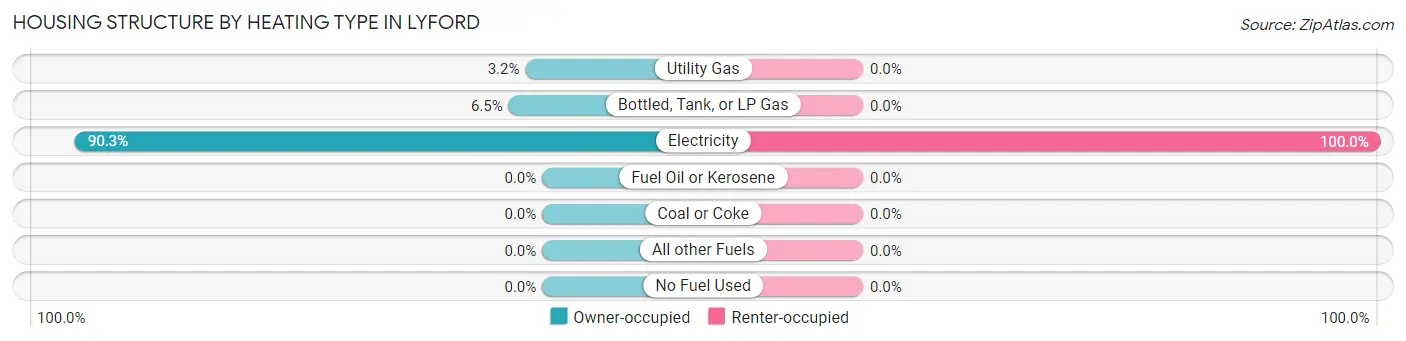
| Heating Type | Owner-occupied | Renter-occupied |
| Utility Gas | 15 (3.2%) | 0 (0.0%) |
| Bottled, Tank, or LP Gas | 30 (6.5%) | 0 (0.0%) |
| Electricity | 418 (90.3%) | 227 (100.0%) |
| Fuel Oil or Kerosene | 0 (0.0%) | 0 (0.0%) |
| Coal or Coke | 0 (0.0%) | 0 (0.0%) |
| All other Fuels | 0 (0.0%) | 0 (0.0%) |
| No Fuel Used | 0 (0.0%) | 0 (0.0%) |
| Total | 463 (100.0%) | 227 (100.0%) |
Household Vehicle Usage in Lyford
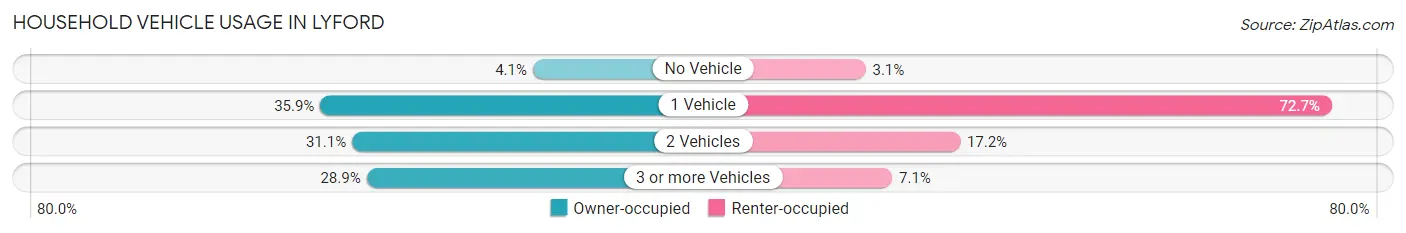
| Vehicles per Household | Owner-occupied | Renter-occupied |
| No Vehicle | 19 (4.1%) | 7 (3.1%) |
| 1 Vehicle | 166 (35.8%) | 165 (72.7%) |
| 2 Vehicles | 144 (31.1%) | 39 (17.2%) |
| 3 or more Vehicles | 134 (28.9%) | 16 (7.0%) |
| Total | 463 (100.0%) | 227 (100.0%) |
Real Estate & Mortgages in Lyford
Real Estate and Mortgage Overview in Lyford
| Characteristic | Without Mortgage | With Mortgage |
| Housing Units | 382 | 81 |
| Median Property Value | $55,100 | $128,100 |
| Median Household Income | $55,114 | $2 |
| Monthly Housing Costs | $396 | $0 |
| Real Estate Taxes | $1,037 | $0 |
Property Value by Mortgage Status in Lyford
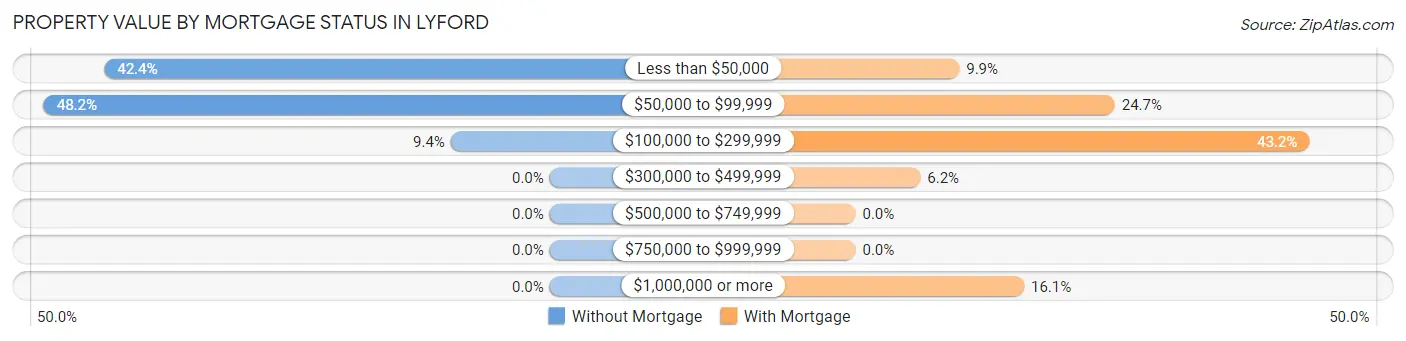
| Property Value | Without Mortgage | With Mortgage |
| Less than $50,000 | 162 (42.4%) | 8 (9.9%) |
| $50,000 to $99,999 | 184 (48.2%) | 20 (24.7%) |
| $100,000 to $299,999 | 36 (9.4%) | 35 (43.2%) |
| $300,000 to $499,999 | 0 (0.0%) | 5 (6.2%) |
| $500,000 to $749,999 | 0 (0.0%) | 0 (0.0%) |
| $750,000 to $999,999 | 0 (0.0%) | 0 (0.0%) |
| $1,000,000 or more | 0 (0.0%) | 13 (16.1%) |
| Total | 382 (100.0%) | 81 (100.0%) |
Household Income by Mortgage Status in Lyford
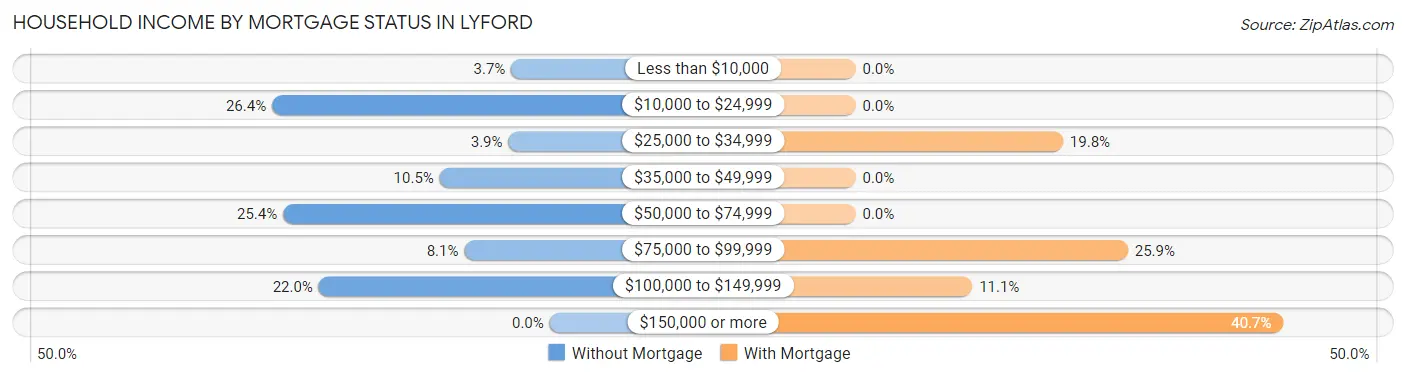
| Household Income | Without Mortgage | With Mortgage |
| Less than $10,000 | 14 (3.7%) | 0 (0.0%) |
| $10,000 to $24,999 | 101 (26.4%) | 0 (0.0%) |
| $25,000 to $34,999 | 15 (3.9%) | 16 (19.8%) |
| $35,000 to $49,999 | 40 (10.5%) | 0 (0.0%) |
| $50,000 to $74,999 | 97 (25.4%) | 0 (0.0%) |
| $75,000 to $99,999 | 31 (8.1%) | 21 (25.9%) |
| $100,000 to $149,999 | 84 (22.0%) | 9 (11.1%) |
| $150,000 or more | 0 (0.0%) | 33 (40.7%) |
| Total | 382 (100.0%) | 81 (100.0%) |
Property Value to Household Income Ratio in Lyford
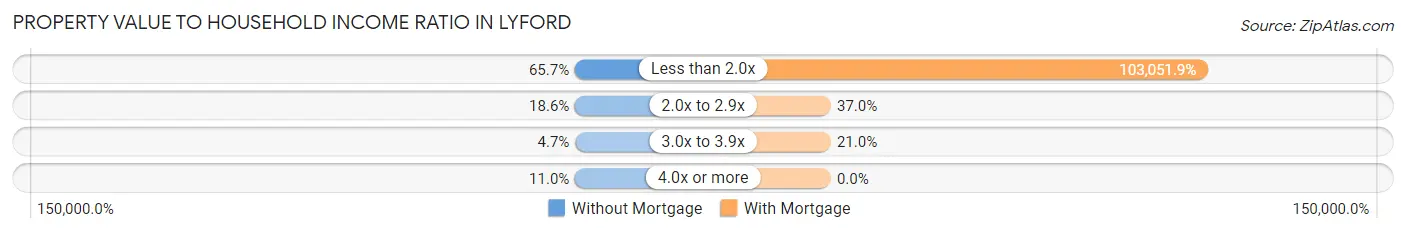
| Value-to-Income Ratio | Without Mortgage | With Mortgage |
| Less than 2.0x | 251 (65.7%) | 83,472 (103,051.8%) |
| 2.0x to 2.9x | 71 (18.6%) | 30 (37.0%) |
| 3.0x to 3.9x | 18 (4.7%) | 17 (21.0%) |
| 4.0x or more | 42 (11.0%) | 0 (0.0%) |
| Total | 382 (100.0%) | 81 (100.0%) |
Real Estate Taxes by Mortgage Status in Lyford
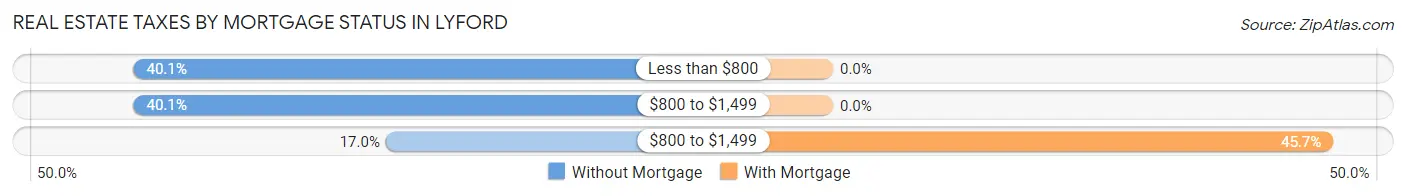
| Property Taxes | Without Mortgage | With Mortgage |
| Less than $800 | 153 (40.1%) | 0 (0.0%) |
| $800 to $1,499 | 153 (40.1%) | 0 (0.0%) |
| $800 to $1,499 | 65 (17.0%) | 37 (45.7%) |
| Total | 382 (100.0%) | 81 (100.0%) |
Health & Disability in Lyford
Health Insurance Coverage by Age in Lyford
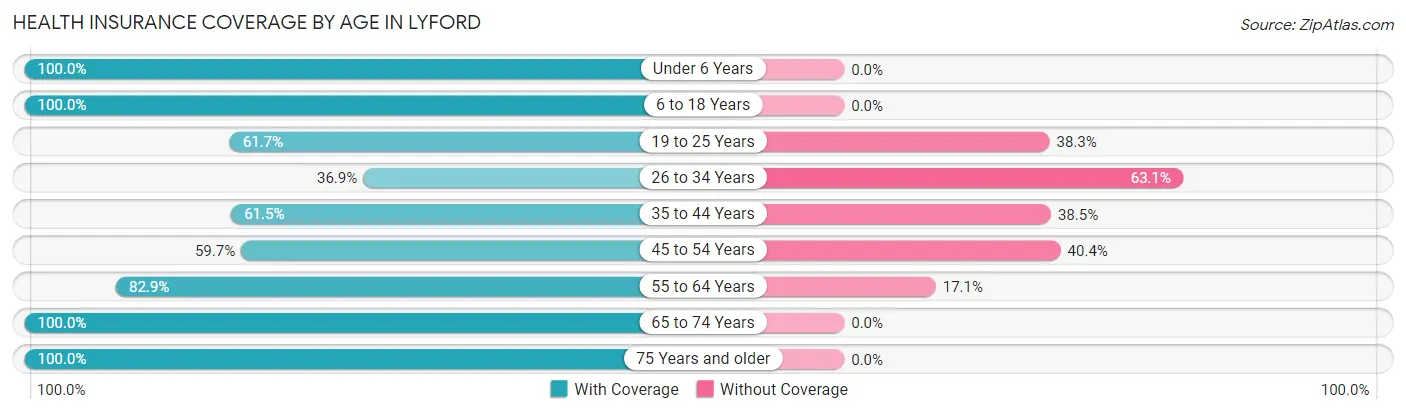
| Age Bracket | With Coverage | Without Coverage |
| Under 6 Years | 211 (100.0%) | 0 (0.0%) |
| 6 to 18 Years | 447 (100.0%) | 0 (0.0%) |
| 19 to 25 Years | 150 (61.7%) | 93 (38.3%) |
| 26 to 34 Years | 135 (36.9%) | 231 (63.1%) |
| 35 to 44 Years | 177 (61.5%) | 111 (38.5%) |
| 45 to 54 Years | 204 (59.7%) | 138 (40.4%) |
| 55 to 64 Years | 209 (82.9%) | 43 (17.1%) |
| 65 to 74 Years | 152 (100.0%) | 0 (0.0%) |
| 75 Years and older | 239 (100.0%) | 0 (0.0%) |
| Total | 1,924 (75.7%) | 616 (24.2%) |
Health Insurance Coverage by Citizenship Status in Lyford
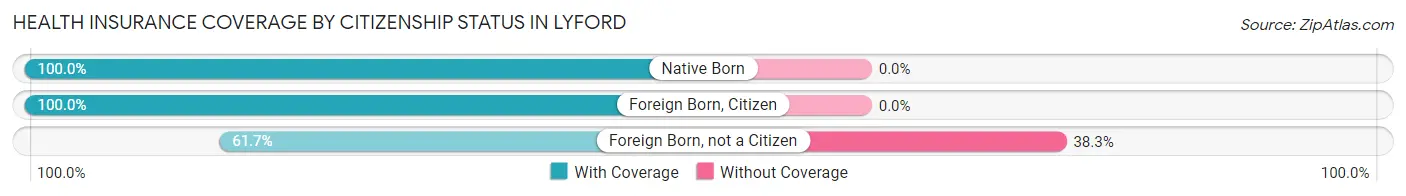
| Citizenship Status | With Coverage | Without Coverage |
| Native Born | 211 (100.0%) | 0 (0.0%) |
| Foreign Born, Citizen | 447 (100.0%) | 0 (0.0%) |
| Foreign Born, not a Citizen | 150 (61.7%) | 93 (38.3%) |
Health Insurance Coverage by Household Income in Lyford
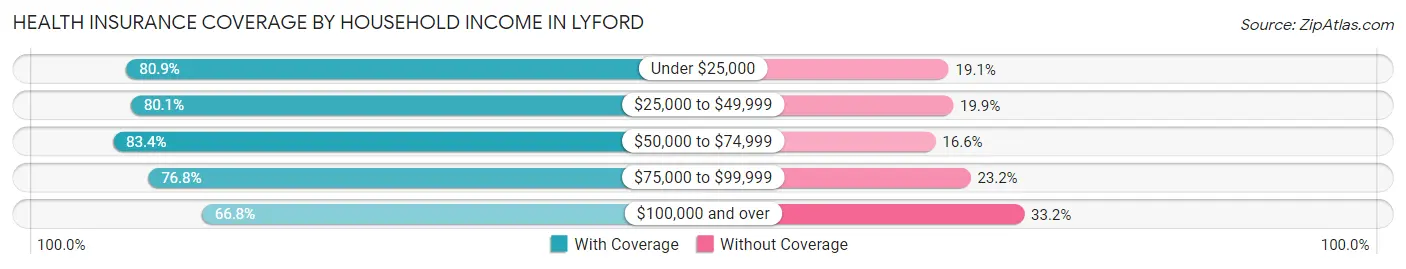
| Household Income | With Coverage | Without Coverage |
| Under $25,000 | 369 (80.9%) | 87 (19.1%) |
| $25,000 to $49,999 | 326 (80.1%) | 81 (19.9%) |
| $50,000 to $74,999 | 412 (83.4%) | 82 (16.6%) |
| $75,000 to $99,999 | 199 (76.8%) | 60 (23.2%) |
| $100,000 and over | 615 (66.8%) | 306 (33.2%) |
Public vs Private Health Insurance Coverage by Age in Lyford
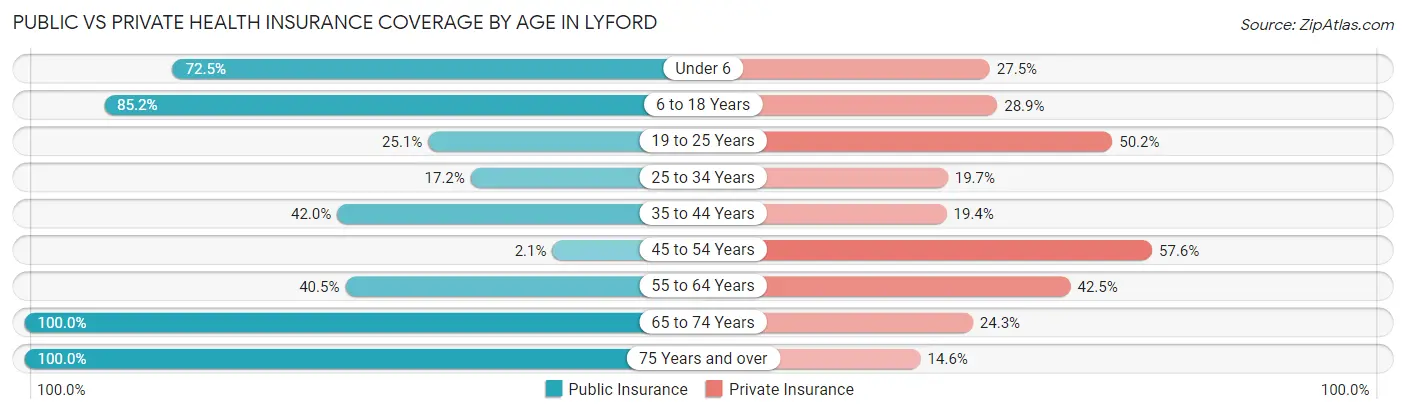
| Age Bracket | Public Insurance | Private Insurance |
| Under 6 | 153 (72.5%) | 58 (27.5%) |
| 6 to 18 Years | 381 (85.2%) | 129 (28.9%) |
| 19 to 25 Years | 61 (25.1%) | 122 (50.2%) |
| 25 to 34 Years | 63 (17.2%) | 72 (19.7%) |
| 35 to 44 Years | 121 (42.0%) | 56 (19.4%) |
| 45 to 54 Years | 7 (2.1%) | 197 (57.6%) |
| 55 to 64 Years | 102 (40.5%) | 107 (42.5%) |
| 65 to 74 Years | 152 (100.0%) | 37 (24.3%) |
| 75 Years and over | 239 (100.0%) | 35 (14.6%) |
| Total | 1,279 (50.3%) | 813 (32.0%) |
Disability Status by Sex by Age in Lyford
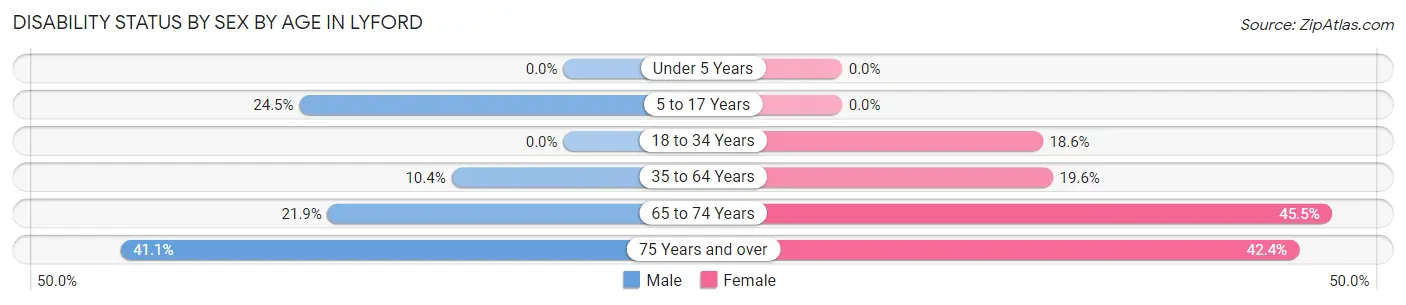
| Age Bracket | Male | Female |
| Under 5 Years | 0 (0.0%) | 0 (0.0%) |
| 5 to 17 Years | 61 (24.5%) | 0 (0.0%) |
| 18 to 34 Years | 0 (0.0%) | 54 (18.6%) |
| 35 to 64 Years | 38 (10.4%) | 101 (19.6%) |
| 65 to 74 Years | 14 (21.9%) | 40 (45.5%) |
| 75 Years and over | 44 (41.1%) | 56 (42.4%) |
Disability Class by Sex by Age in Lyford
Disability Class: Hearing Difficulty
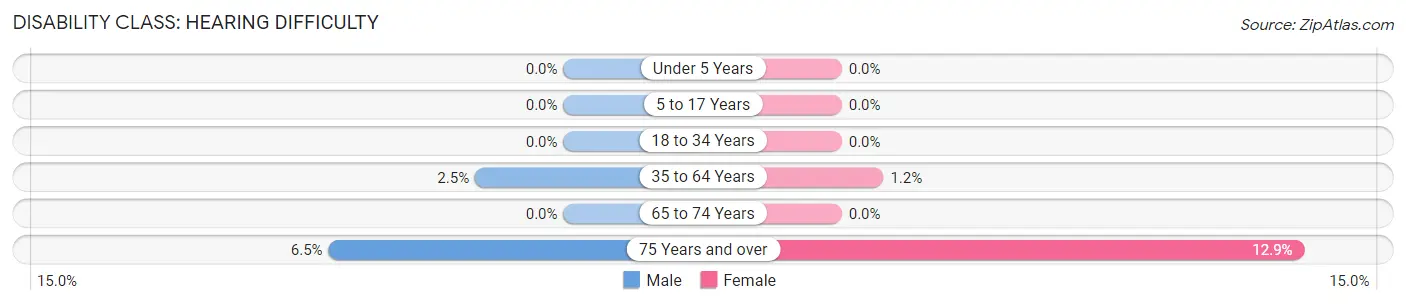
| Age Bracket | Male | Female |
| Under 5 Years | 0 (0.0%) | 0 (0.0%) |
| 5 to 17 Years | 0 (0.0%) | 0 (0.0%) |
| 18 to 34 Years | 0 (0.0%) | 0 (0.0%) |
| 35 to 64 Years | 9 (2.5%) | 6 (1.2%) |
| 65 to 74 Years | 0 (0.0%) | 0 (0.0%) |
| 75 Years and over | 7 (6.5%) | 17 (12.9%) |
Disability Class: Vision Difficulty
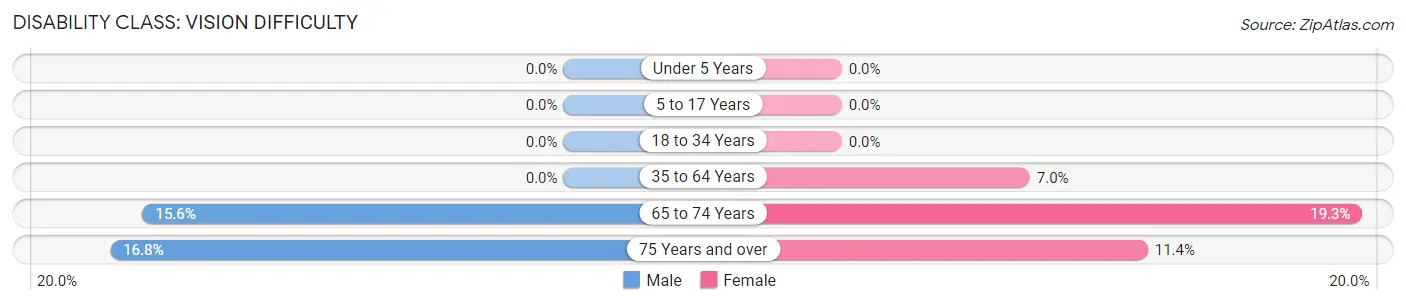
| Age Bracket | Male | Female |
| Under 5 Years | 0 (0.0%) | 0 (0.0%) |
| 5 to 17 Years | 0 (0.0%) | 0 (0.0%) |
| 18 to 34 Years | 0 (0.0%) | 0 (0.0%) |
| 35 to 64 Years | 0 (0.0%) | 36 (7.0%) |
| 65 to 74 Years | 10 (15.6%) | 17 (19.3%) |
| 75 Years and over | 18 (16.8%) | 15 (11.4%) |
Disability Class: Cognitive Difficulty
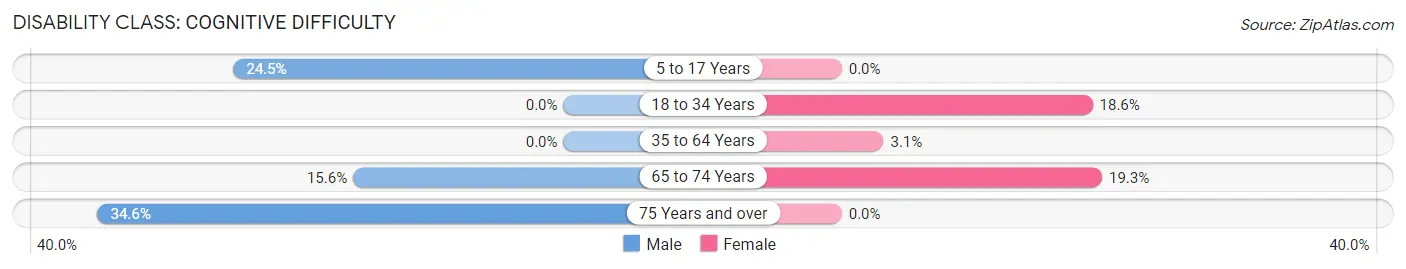
| Age Bracket | Male | Female |
| 5 to 17 Years | 61 (24.5%) | 0 (0.0%) |
| 18 to 34 Years | 0 (0.0%) | 54 (18.6%) |
| 35 to 64 Years | 0 (0.0%) | 16 (3.1%) |
| 65 to 74 Years | 10 (15.6%) | 17 (19.3%) |
| 75 Years and over | 37 (34.6%) | 0 (0.0%) |
Disability Class: Ambulatory Difficulty
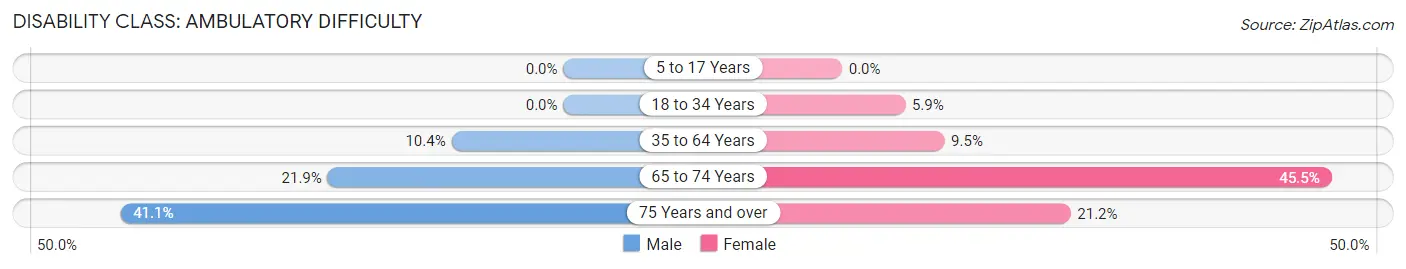
| Age Bracket | Male | Female |
| 5 to 17 Years | 0 (0.0%) | 0 (0.0%) |
| 18 to 34 Years | 0 (0.0%) | 17 (5.9%) |
| 35 to 64 Years | 38 (10.4%) | 49 (9.5%) |
| 65 to 74 Years | 14 (21.9%) | 40 (45.5%) |
| 75 Years and over | 44 (41.1%) | 28 (21.2%) |
Disability Class: Self-Care Difficulty
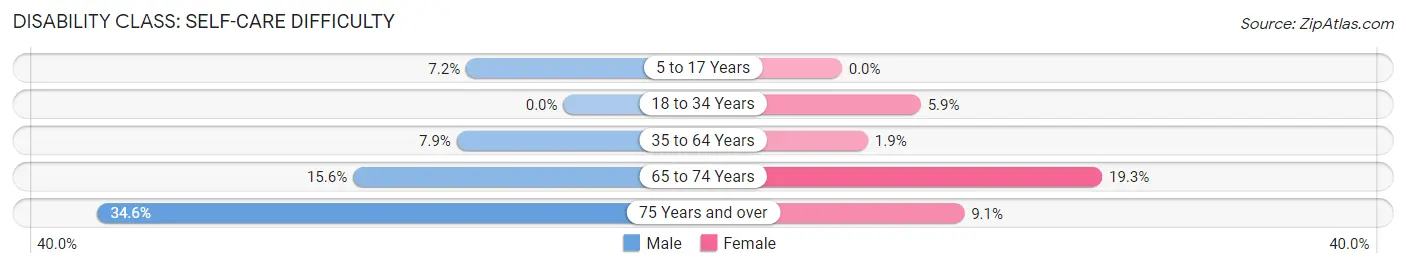
| Age Bracket | Male | Female |
| 5 to 17 Years | 18 (7.2%) | 0 (0.0%) |
| 18 to 34 Years | 0 (0.0%) | 17 (5.9%) |
| 35 to 64 Years | 29 (7.9%) | 10 (1.9%) |
| 65 to 74 Years | 10 (15.6%) | 17 (19.3%) |
| 75 Years and over | 37 (34.6%) | 12 (9.1%) |
Technology Access in Lyford
Computing Device Access in Lyford
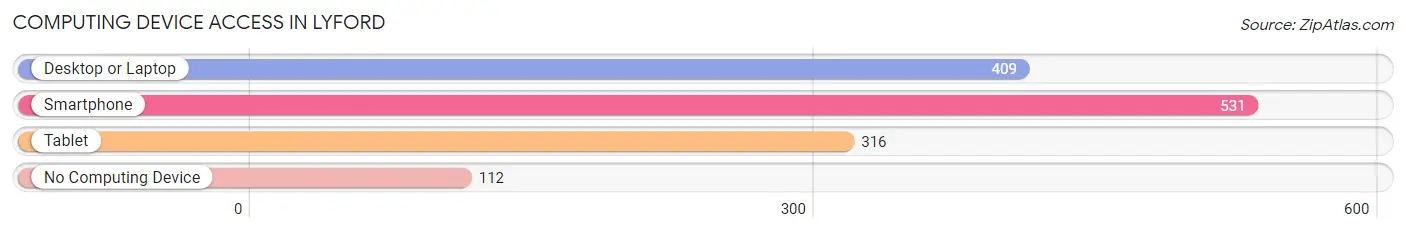
| Device Type | # Households | % Households |
| Desktop or Laptop | 409 | 59.3% |
| Smartphone | 531 | 77.0% |
| Tablet | 316 | 45.8% |
| No Computing Device | 112 | 16.2% |
| Total | 690 | 100.0% |
Internet Access in Lyford
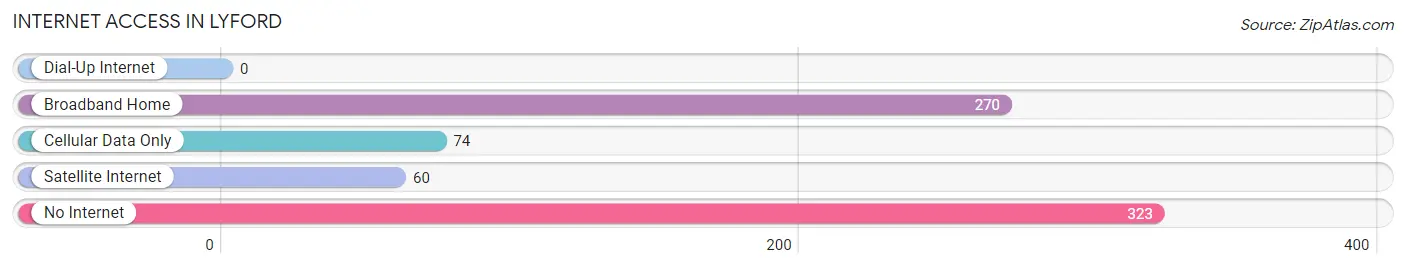
| Internet Type | # Households | % Households |
| Dial-Up Internet | 0 | 0.0% |
| Broadband Home | 270 | 39.1% |
| Cellular Data Only | 74 | 10.7% |
| Satellite Internet | 60 | 8.7% |
| No Internet | 323 | 46.8% |
| Total | 690 | 100.0% |
Lyford Summary
Lyford is a small city located in Willacy County, Texas. It is situated on the western edge of the Rio Grande Valley, approximately 30 miles north of the Mexican border. The city has a population of approximately 2,500 people and is part of the McAllen-Edinburg-Mission Metropolitan Statistical Area.
History
The area that is now Lyford was originally inhabited by the Karankawa Indians. The first European settlers arrived in the area in the late 1800s, and the town was officially established in 1909. The town was named after a local rancher, John Lyford, who owned a large amount of land in the area.
In the early 1900s, Lyford was a small farming community. The town was home to a cotton gin, a blacksmith shop, and a few stores. The town also had a post office, a school, and a church.
In the 1950s, the town began to grow as the population increased and new businesses opened. The town was incorporated in 1959, and the population continued to grow throughout the 1960s and 1970s.
Geography
Lyford is located in Willacy County, Texas, approximately 30 miles north of the Mexican border. The city is situated on the western edge of the Rio Grande Valley, and is surrounded by farmland and ranches. The city has a total area of 1.3 square miles, all of which is land.
The climate in Lyford is subtropical, with hot summers and mild winters. The average temperature in the summer is around 90 degrees Fahrenheit, and the average temperature in the winter is around 60 degrees Fahrenheit.
Economy
The economy of Lyford is largely based on agriculture. The town is home to several large farms and ranches, and the surrounding area is known for its production of cotton, sorghum, and other crops.
The town is also home to several small businesses, including restaurants, convenience stores, and auto repair shops. The town is also home to a few manufacturing companies, including a plastics factory and a furniture factory.
Demographics
As of the 2010 census, the population of Lyford was 2,500. The racial makeup of the town was 79.2% White, 0.4% African American, 0.2% Native American, 0.2% Asian, 0.1% Pacific Islander, 17.7% from other races, and 2.4% from two or more races. Hispanic or Latino of any race were 97.2% of the population.
The median household income in Lyford was $25,000, and the median family income was $30,000. The per capita income was $12,000. About 24.2% of the population was below the poverty line.
Lyford is a small town with a rich history and a diverse population. The town is home to a variety of businesses, and the surrounding area is known for its agricultural production. The town is also home to a number of small businesses, and the population is largely Hispanic or Latino.
Common Questions
What is Per Capita Income in Lyford?
Per Capita income in Lyford is $17,869.
What is the Median Family Income in Lyford?
Median Family Income in Lyford is $55,156.
What is the Median Household income in Lyford?
Median Household Income in Lyford is $39,300.
What is Income or Wage Gap in Lyford?
Income or Wage Gap in Lyford is 34.1%.
Women in Lyford earn 65.9 cents for every dollar earned by a man.
What is Inequality or Gini Index in Lyford?
Inequality or Gini Index in Lyford is 0.45.
What is the Total Population of Lyford?
Total Population of Lyford is 2,540.
What is the Total Male Population of Lyford?
Total Male Population of Lyford is 1,224.
What is the Total Female Population of Lyford?
Total Female Population of Lyford is 1,316.
What is the Ratio of Males per 100 Females in Lyford?
There are 93.01 Males per 100 Females in Lyford.
What is the Ratio of Females per 100 Males in Lyford?
There are 107.52 Females per 100 Males in Lyford.
What is the Median Population Age in Lyford?
Median Population Age in Lyford is 35.1 Years.
What is the Average Family Size in Lyford
Average Family Size in Lyford is 4.6 People.
What is the Average Household Size in Lyford
Average Household Size in Lyford is 3.7 People.
How Large is the Labor Force in Lyford?
There are 1,066 People in the Labor Forcein in Lyford.
What is the Percentage of People in the Labor Force in Lyford?
52.8% of People are in the Labor Force in Lyford.
What is the Unemployment Rate in Lyford?
Unemployment Rate in Lyford is 5.5%.