Los Fresnos, TX Map & Demographics
Los Fresnos Map
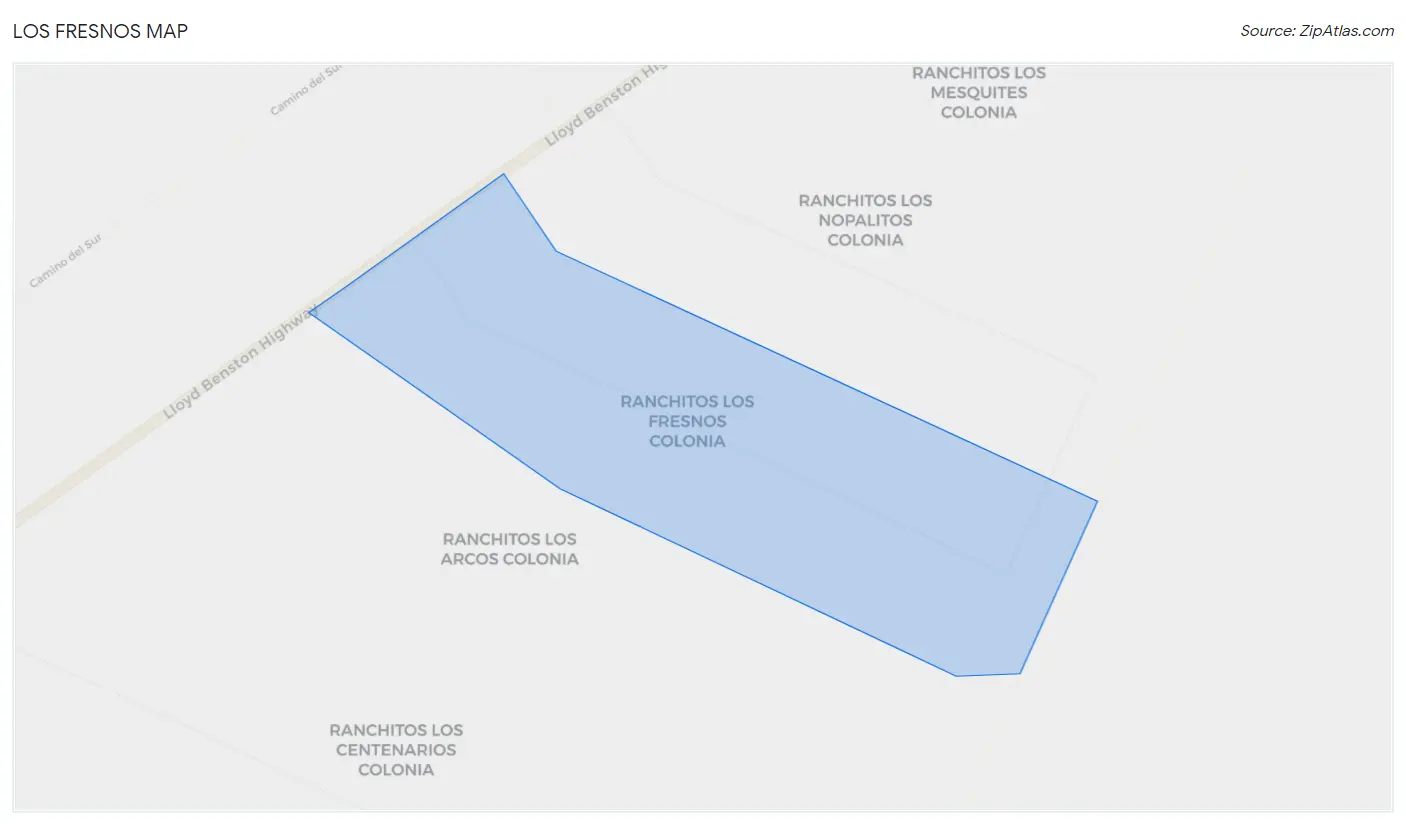
Los Fresnos Overview
$18,801
PER CAPITA INCOME
25.8%
WAGE / INCOME GAP [ % ]
74.2¢/ $1
WAGE / INCOME GAP [ $ ]
0.21
INEQUALITY / GINI INDEX
197
TOTAL POPULATION
133
MALE POPULATION
64
FEMALE POPULATION
207.81
MALES / 100 FEMALES
48.12
FEMALES / 100 MALES
18.4
MEDIAN AGE
7.0
AVG FAMILY SIZE
7.0
AVG HOUSEHOLD SIZE
54
LABOR FORCE [ PEOPLE ]
52.4%
PERCENT IN LABOR FORCE
Los Fresnos Zip Codes
Los Fresnos Area Codes
Income in Los Fresnos
Income Overview in Los Fresnos
| Characteristic | Number | Measure |
| Per Capita Income | 197 | $18,801 |
| Median Family Income | 28 | $0 |
| Mean Family Income | 28 | $0 |
| Median Household Income | 28 | $0 |
| Mean Household Income | 28 | $0 |
| Income Deficit | 28 | $0 |
| Wage / Income Gap (%) | 197 | 25.80% |
| Wage / Income Gap ($) | 197 | 74.20¢ per $1 |
| Gini / Inequality Index | 197 | 0.21 |
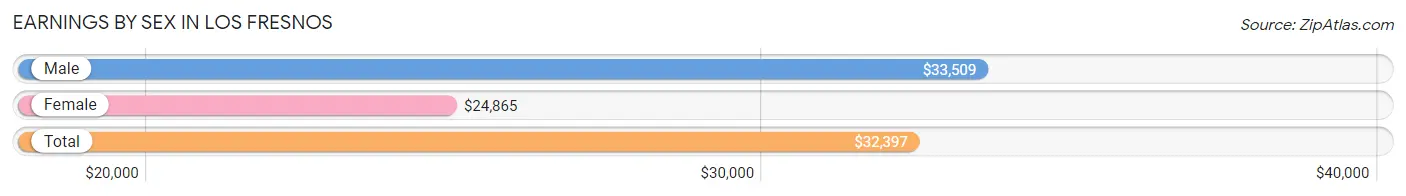
Earnings by Sex in Los Fresnos
Average Earnings in Los Fresnos are $32,397, $33,509 for men and $24,865 for women, a difference of 25.8%.
| Sex | Number | Average Earnings |
| Male | 43 (65.1%) | $33,509 |
| Female | 23 (34.8%) | $24,865 |
| Total | 66 (100.0%) | $32,397 |
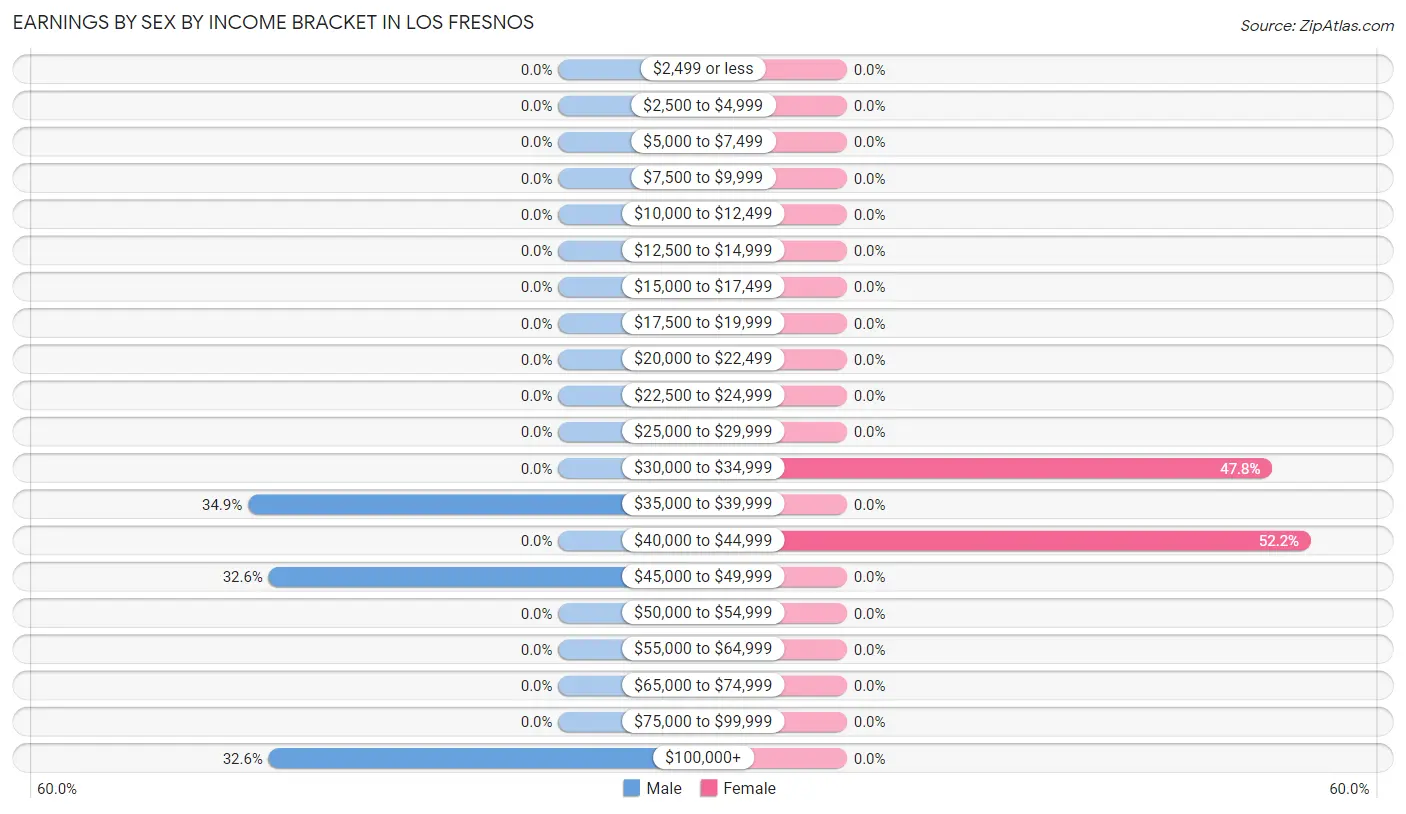
Earnings by Sex by Income Bracket in Los Fresnos
The most common earnings brackets in Los Fresnos are $35,000 to $39,999 for men (15 | 34.9%) and $40,000 to $44,999 for women (12 | 52.2%).
| Income | Male | Female |
| $2,499 or less | 0 (0.0%) | 0 (0.0%) |
| $2,500 to $4,999 | 0 (0.0%) | 0 (0.0%) |
| $5,000 to $7,499 | 0 (0.0%) | 0 (0.0%) |
| $7,500 to $9,999 | 0 (0.0%) | 0 (0.0%) |
| $10,000 to $12,499 | 0 (0.0%) | 0 (0.0%) |
| $12,500 to $14,999 | 0 (0.0%) | 0 (0.0%) |
| $15,000 to $17,499 | 0 (0.0%) | 0 (0.0%) |
| $17,500 to $19,999 | 0 (0.0%) | 0 (0.0%) |
| $20,000 to $22,499 | 0 (0.0%) | 0 (0.0%) |
| $22,500 to $24,999 | 0 (0.0%) | 0 (0.0%) |
| $25,000 to $29,999 | 0 (0.0%) | 0 (0.0%) |
| $30,000 to $34,999 | 0 (0.0%) | 11 (47.8%) |
| $35,000 to $39,999 | 15 (34.9%) | 0 (0.0%) |
| $40,000 to $44,999 | 0 (0.0%) | 12 (52.2%) |
| $45,000 to $49,999 | 14 (32.6%) | 0 (0.0%) |
| $50,000 to $54,999 | 0 (0.0%) | 0 (0.0%) |
| $55,000 to $64,999 | 0 (0.0%) | 0 (0.0%) |
| $65,000 to $74,999 | 0 (0.0%) | 0 (0.0%) |
| $75,000 to $99,999 | 0 (0.0%) | 0 (0.0%) |
| $100,000+ | 14 (32.6%) | 0 (0.0%) |
| Total | 43 (100.0%) | 23 (100.0%) |
Earnings by Sex by Educational Attainment in Los Fresnos
| Educational Attainment | Male Income | Female Income |
| Less than High School | - | - |
| High School Diploma | - | - |
| College or Associate's Degree | - | - |
| Bachelor's Degree | - | - |
| Graduate Degree | - | - |
| Total | $46,161 | $0 |
Family Income in Los Fresnos
Family Income Brackets in Los Fresnos
According to the Los Fresnos family income data, there are 14 families falling into the $75,000 to $99,999 income range, which is the most common income bracket and makes up 50.0% of all families.
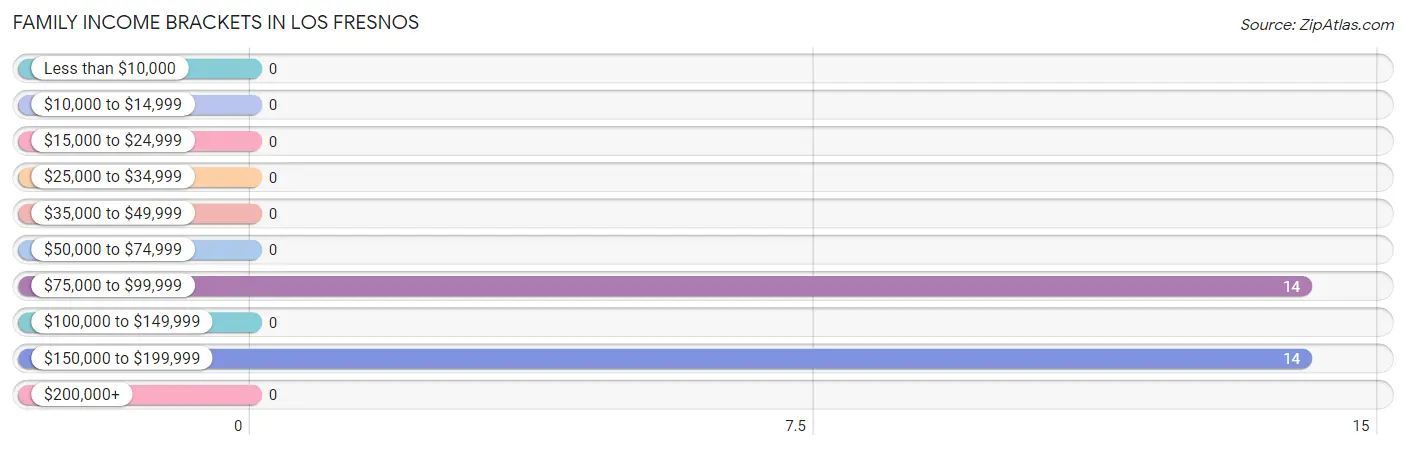
| Income Bracket | # Families | % Families |
| Less than $10,000 | 0 | 0.0% |
| $10,000 to $14,999 | 0 | 0.0% |
| $15,000 to $24,999 | 0 | 0.0% |
| $25,000 to $34,999 | 0 | 0.0% |
| $35,000 to $49,999 | 0 | 0.0% |
| $50,000 to $74,999 | 0 | 0.0% |
| $75,000 to $99,999 | 14 | 50.0% |
| $100,000 to $149,999 | 0 | 0.0% |
| $150,000 to $199,999 | 14 | 50.0% |
| $200,000+ | 0 | 0.0% |
Family Income by Famaliy Size in Los Fresnos
| Income Bracket | # Families | Median Income |
| 2-Person Families | 0 (0.0%) | $0 |
| 3-Person Families | 0 (0.0%) | $0 |
| 4-Person Families | 0 (0.0%) | $0 |
| 5-Person Families | 14 (50.0%) | $0 |
| 6-Person Families | 0 (0.0%) | $0 |
| 7+ Person Families | 14 (50.0%) | $0 |
| Total | 28 (100.0%) | $0 |
Family Income by Number of Earners in Los Fresnos
| Number of Earners | # Families | Median Income |
| No Earners | 0 (0.0%) | $0 |
| 1 Earner | 0 (0.0%) | $0 |
| 2 Earners | 14 (50.0%) | $0 |
| 3+ Earners | 14 (50.0%) | $0 |
| Total | 28 (100.0%) | $0 |
Household Income in Los Fresnos
Household Income Brackets in Los Fresnos
With 14 households falling in the category, the $75,000 to $99,999 income range is the most frequent in Los Fresnos, accounting for 50.0% of all households.
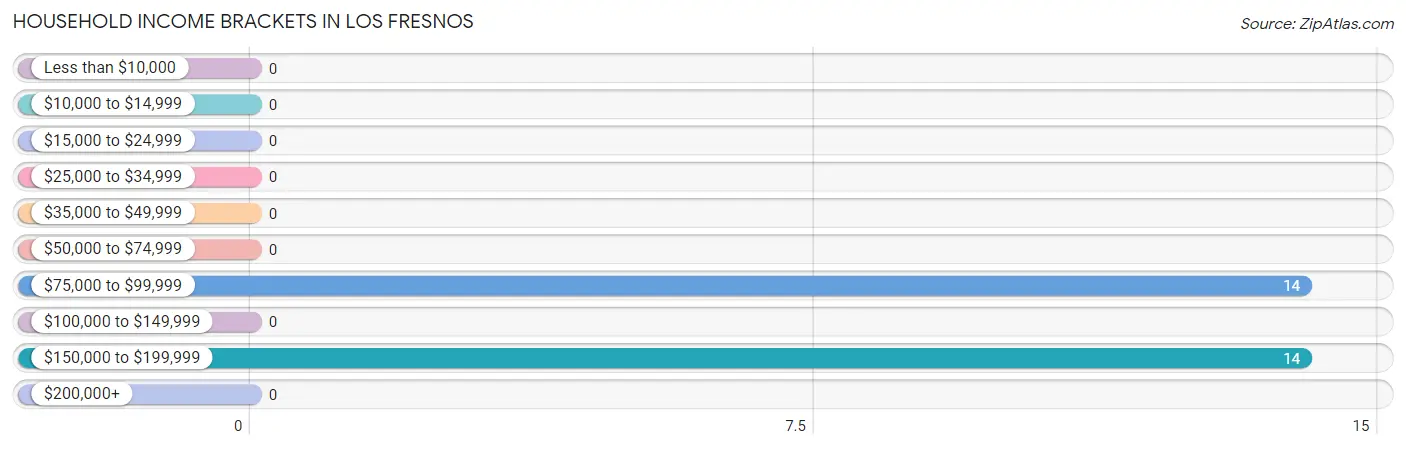
| Income Bracket | # Households | % Households |
| Less than $10,000 | 0 | 0.0% |
| $10,000 to $14,999 | 0 | 0.0% |
| $15,000 to $24,999 | 0 | 0.0% |
| $25,000 to $34,999 | 0 | 0.0% |
| $35,000 to $49,999 | 0 | 0.0% |
| $50,000 to $74,999 | 0 | 0.0% |
| $75,000 to $99,999 | 14 | 50.0% |
| $100,000 to $149,999 | 0 | 0.0% |
| $150,000 to $199,999 | 14 | 50.0% |
| $200,000+ | 0 | 0.0% |
Household Income by Householder Age in Los Fresnos
| Income Bracket | # Households | Median Income |
| 15 to 24 Years | 0 (0.0%) | $0 |
| 25 to 44 Years | 14 (50.0%) | $0 |
| 45 to 64 Years | 14 (50.0%) | $0 |
| 65+ Years | 0 (0.0%) | $0 |
| Total | 28 (100.0%) | $0 |
Poverty in Los Fresnos
Income Below Poverty by Sex and Age in Los Fresnos
| Age Bracket | Male | Female |
| Under 5 Years | 0 (0.0%) | 0 (0.0%) |
| 5 Years | 0 (0.0%) | 0 (0.0%) |
| 6 to 11 Years | 0 (0.0%) | 0 (0.0%) |
| 12 to 14 Years | 0 (0.0%) | 0 (0.0%) |
| 15 Years | 0 (0.0%) | 0 (0.0%) |
| 16 and 17 Years | 0 (0.0%) | 0 (0.0%) |
| 18 to 24 Years | 0 (0.0%) | 0 (0.0%) |
| 25 to 34 Years | 0 (0.0%) | 0 (0.0%) |
| 35 to 44 Years | 0 (0.0%) | 0 (0.0%) |
| 45 to 54 Years | 0 (0.0%) | 0 (0.0%) |
| 55 to 64 Years | 0 (0.0%) | 0 (0.0%) |
| 65 to 74 Years | 0 (0.0%) | 0 (0.0%) |
| 75 Years and over | 0 (0.0%) | 0 (0.0%) |
| Total | 0 (0.0%) | 0 (0.0%) |
Income Above Poverty by Sex and Age in Los Fresnos
According to the poverty statistics in Los Fresnos, males aged under 5 years and females aged 5 years are the age groups that are most secure financially, with 100.0% of males and 100.0% of females in these age groups living above the poverty line.
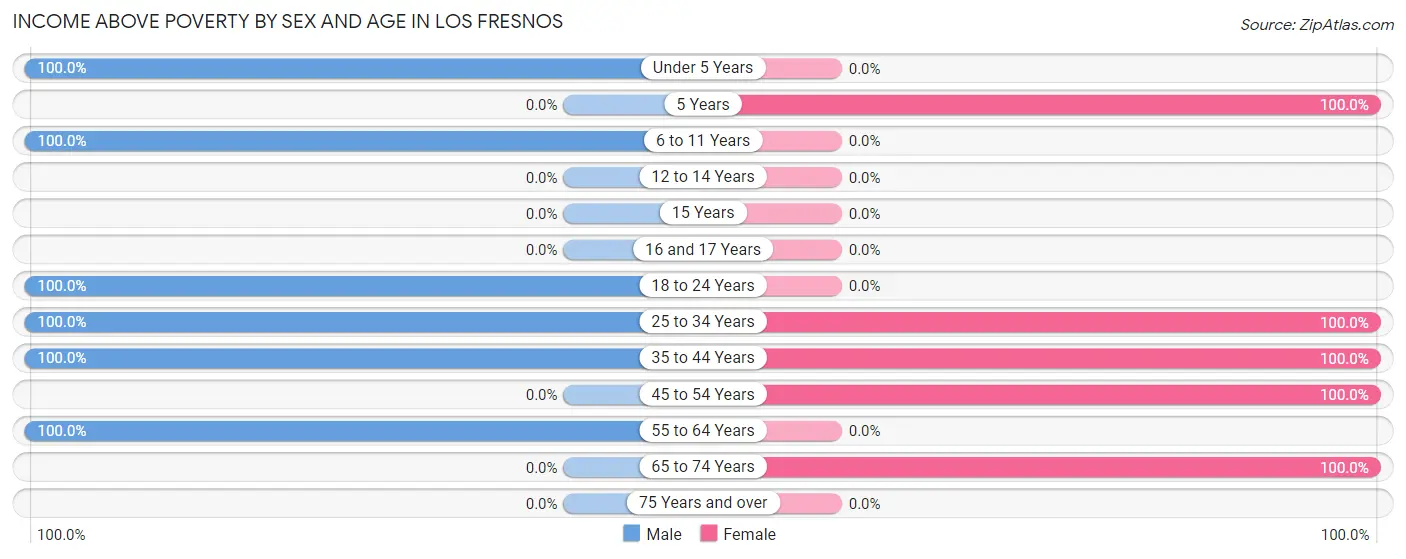
| Age Bracket | Male | Female |
| Under 5 Years | 35 (100.0%) | 0 (0.0%) |
| 5 Years | 0 (0.0%) | 16 (100.0%) |
| 6 to 11 Years | 43 (100.0%) | 0 (0.0%) |
| 12 to 14 Years | 0 (0.0%) | 0 (0.0%) |
| 15 Years | 0 (0.0%) | 0 (0.0%) |
| 16 and 17 Years | 0 (0.0%) | 0 (0.0%) |
| 18 to 24 Years | 12 (100.0%) | 0 (0.0%) |
| 25 to 34 Years | 15 (100.0%) | 12 (100.0%) |
| 35 to 44 Years | 14 (100.0%) | 11 (100.0%) |
| 45 to 54 Years | 0 (0.0%) | 14 (100.0%) |
| 55 to 64 Years | 14 (100.0%) | 0 (0.0%) |
| 65 to 74 Years | 0 (0.0%) | 11 (100.0%) |
| 75 Years and over | 0 (0.0%) | 0 (0.0%) |
| Total | 133 (100.0%) | 64 (100.0%) |
Income Below Poverty Among Married-Couple Families in Los Fresnos
| Children | Above Poverty | Below Poverty |
| No Children | 0 (0.0%) | 0 (0.0%) |
| 1 or 2 Children | 14 (100.0%) | 0 (0.0%) |
| 3 or 4 Children | 14 (100.0%) | 0 (0.0%) |
| 5 or more Children | 0 (0.0%) | 0 (0.0%) |
| Total | 28 (100.0%) | 0 (0.0%) |
Income Below Poverty Among Single-Parent Households in Los Fresnos
| Children | Single Father | Single Mother |
| No Children | 0 (0.0%) | 0 (0.0%) |
| 1 or 2 Children | 0 (0.0%) | 0 (0.0%) |
| 3 or 4 Children | 0 (0.0%) | 0 (0.0%) |
| 5 or more Children | 0 (0.0%) | 0 (0.0%) |
| Total | 0 (0.0%) | 0 (0.0%) |
Income Below Poverty Among Married-Couple vs Single-Parent Households in Los Fresnos
| Children | Married-Couple Families | Single-Parent Households |
| No Children | 0 (0.0%) | 0 (0.0%) |
| 1 or 2 Children | 0 (0.0%) | 0 (0.0%) |
| 3 or 4 Children | 0 (0.0%) | 0 (0.0%) |
| 5 or more Children | 0 (0.0%) | 0 (0.0%) |
| Total | 0 (0.0%) | 0 (0.0%) |
Race in Los Fresnos
The most populous races in Los Fresnos are Hispanic or Latino (197 | 100.0%), Two or more Races (130 | 66.0%), and White / Caucasian (67 | 34.0%).
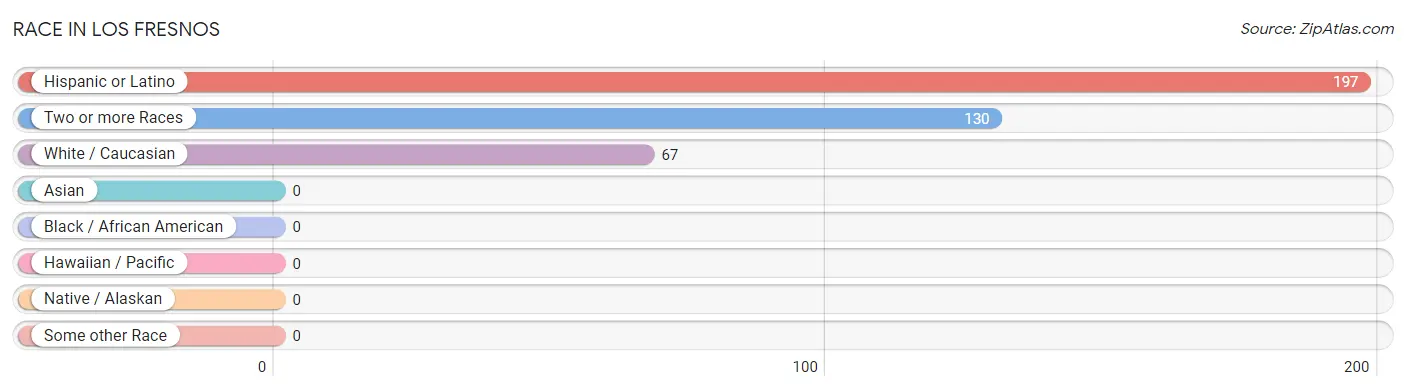
| Race | # Population | % Population |
| Asian | 0 | 0.0% |
| Black / African American | 0 | 0.0% |
| Hawaiian / Pacific | 0 | 0.0% |
| Hispanic or Latino | 197 | 100.0% |
| Native / Alaskan | 0 | 0.0% |
| White / Caucasian | 67 | 34.0% |
| Two or more Races | 130 | 66.0% |
| Some other Race | 0 | 0.0% |
| Total | 197 | 100.0% |
Ancestry in Los Fresnos
The most populous ancestries reported in Los Fresnos are Mexican (197 | 100.0%), and American (67 | 34.0%), together accounting for 134.0% of all Los Fresnos residents.
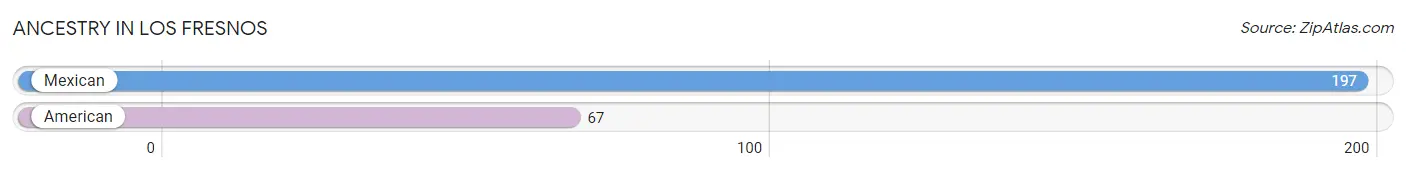
| Ancestry | # Population | % Population |
| American | 67 | 34.0% |
| Mexican | 197 | 100.0% | View All 2 Rows |
Immigrants in Los Fresnos
The most numerous immigrant groups reported in Los Fresnos came from Central America (25 | 12.7%), Latin America (25 | 12.7%), and Mexico (25 | 12.7%), together accounting for 38.1% of all Los Fresnos residents.
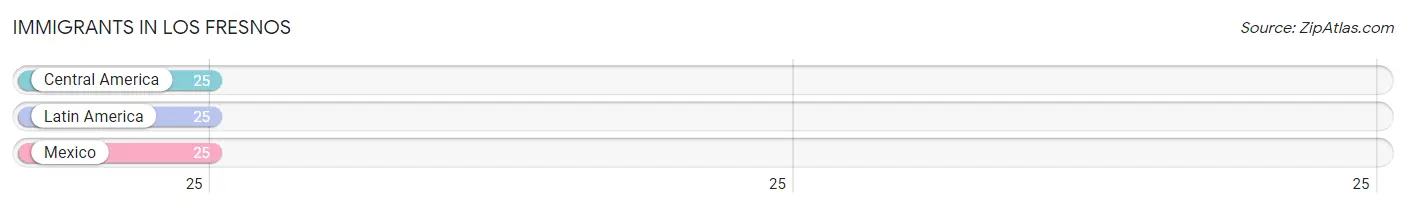
| Immigration Origin | # Population | % Population |
| Central America | 25 | 12.7% |
| Latin America | 25 | 12.7% |
| Mexico | 25 | 12.7% | View All 3 Rows |
Sex and Age in Los Fresnos
Sex and Age in Los Fresnos
The most populous age groups in Los Fresnos are Under 5 Years (35 | 26.3%) for men and 5 to 9 Years (16 | 25.0%) for women.
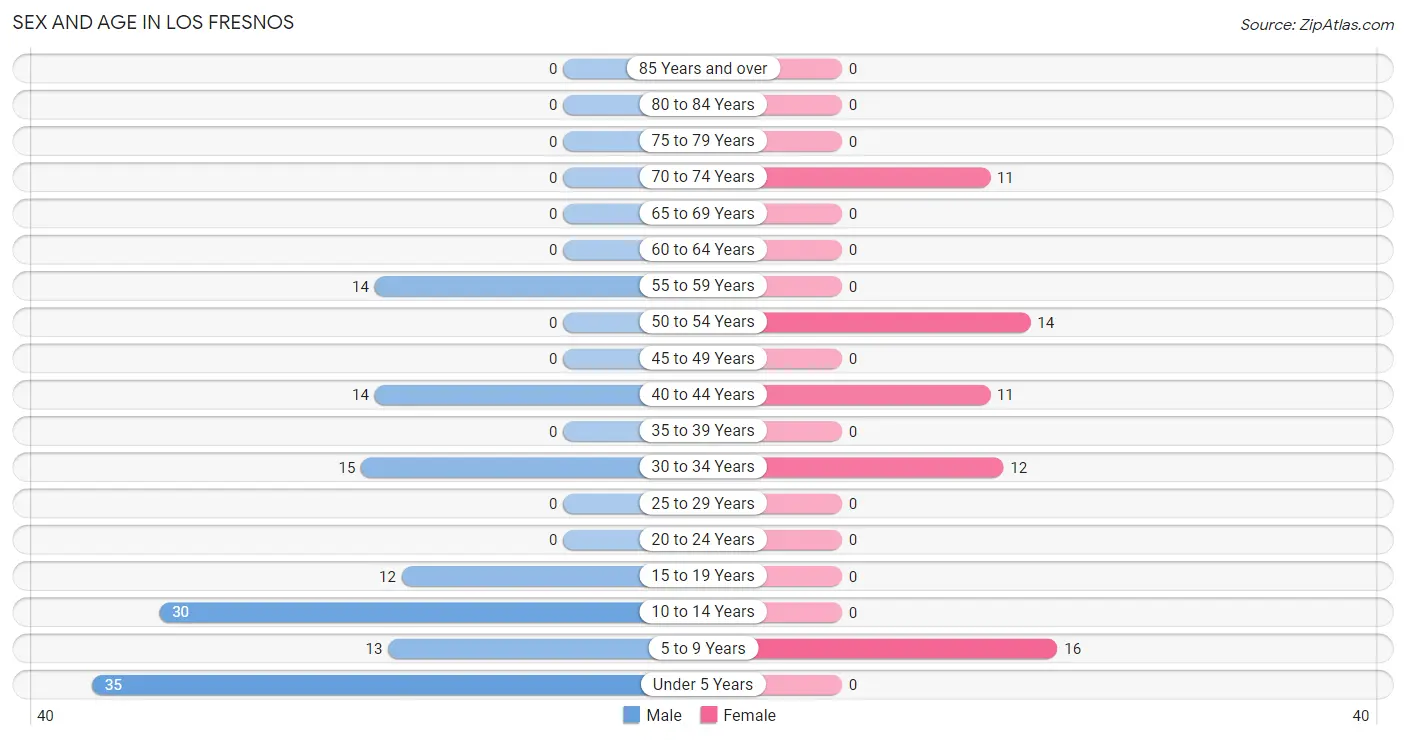
| Age Bracket | Male | Female |
| Under 5 Years | 35 (26.3%) | 0 (0.0%) |
| 5 to 9 Years | 13 (9.8%) | 16 (25.0%) |
| 10 to 14 Years | 30 (22.6%) | 0 (0.0%) |
| 15 to 19 Years | 12 (9.0%) | 0 (0.0%) |
| 20 to 24 Years | 0 (0.0%) | 0 (0.0%) |
| 25 to 29 Years | 0 (0.0%) | 0 (0.0%) |
| 30 to 34 Years | 15 (11.3%) | 12 (18.8%) |
| 35 to 39 Years | 0 (0.0%) | 0 (0.0%) |
| 40 to 44 Years | 14 (10.5%) | 11 (17.2%) |
| 45 to 49 Years | 0 (0.0%) | 0 (0.0%) |
| 50 to 54 Years | 0 (0.0%) | 14 (21.9%) |
| 55 to 59 Years | 14 (10.5%) | 0 (0.0%) |
| 60 to 64 Years | 0 (0.0%) | 0 (0.0%) |
| 65 to 69 Years | 0 (0.0%) | 0 (0.0%) |
| 70 to 74 Years | 0 (0.0%) | 11 (17.2%) |
| 75 to 79 Years | 0 (0.0%) | 0 (0.0%) |
| 80 to 84 Years | 0 (0.0%) | 0 (0.0%) |
| 85 Years and over | 0 (0.0%) | 0 (0.0%) |
| Total | 133 (100.0%) | 64 (100.0%) |
Families and Households in Los Fresnos
Median Family Size in Los Fresnos
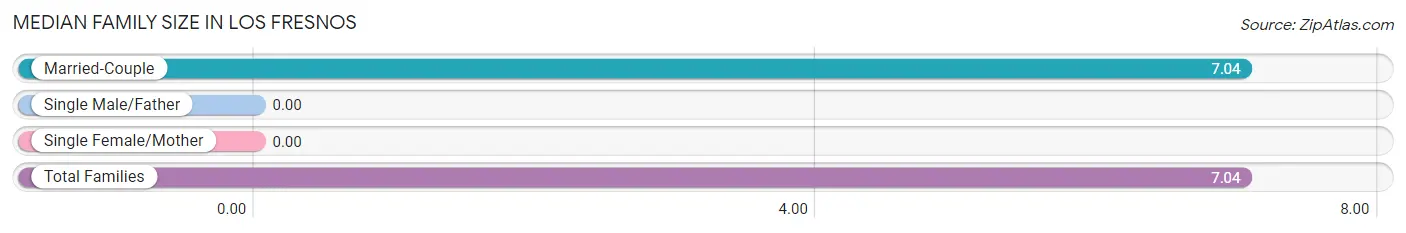
| Family Type | # Families | Family Size |
| Married-Couple | 28 (100.0%) | 7.04 |
| Single Male/Father | 0 (0.0%) | - |
| Single Female/Mother | 0 (0.0%) | - |
| Total Families | 28 (100.0%) | 7.04 |
Median Household Size in Los Fresnos
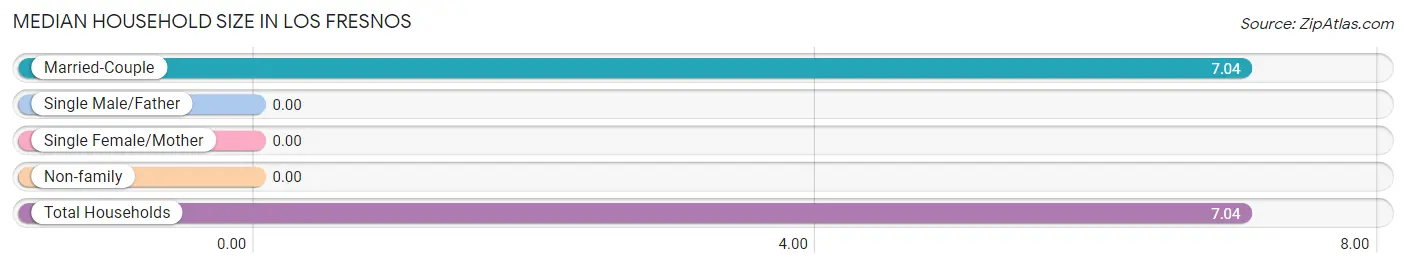
| Household Type | # Households | Household Size |
| Married-Couple | 28 (100.0%) | 7.04 |
| Single Male/Father | 0 (0.0%) | - |
| Single Female/Mother | 0 (0.0%) | - |
| Non-family | 0 (0.0%) | - |
| Total Households | 28 (100.0%) | 7.04 |
Household Size by Marriage Status in Los Fresnos
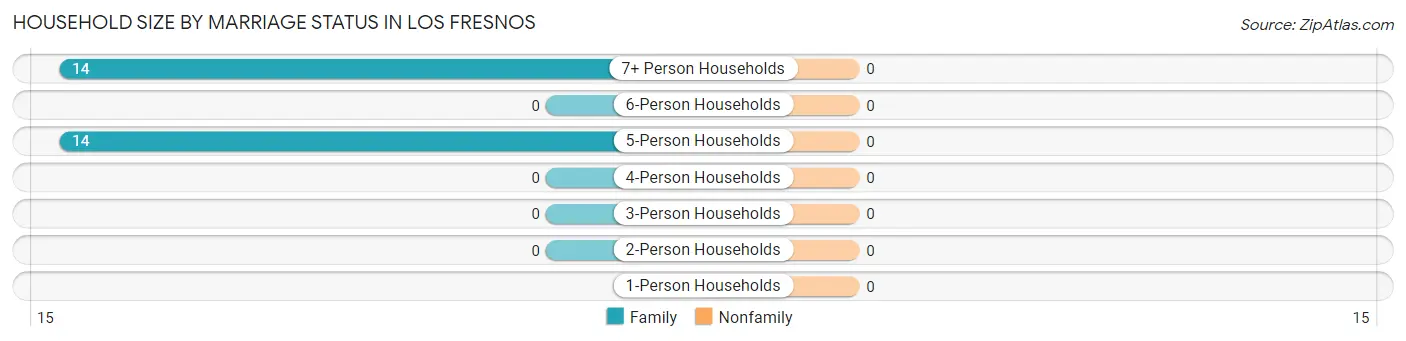
| Household Size | Family Households | Nonfamily Households |
| 1-Person Households | - | 0 (0.0%) |
| 2-Person Households | 0 (0.0%) | 0 (0.0%) |
| 3-Person Households | 0 (0.0%) | 0 (0.0%) |
| 4-Person Households | 0 (0.0%) | 0 (0.0%) |
| 5-Person Households | 14 (50.0%) | 0 (0.0%) |
| 6-Person Households | 0 (0.0%) | 0 (0.0%) |
| 7+ Person Households | 14 (50.0%) | 0 (0.0%) |
| Total | 28 (100.0%) | 0 (0.0%) |
Female Fertility in Los Fresnos
Fertility by Age in Los Fresnos
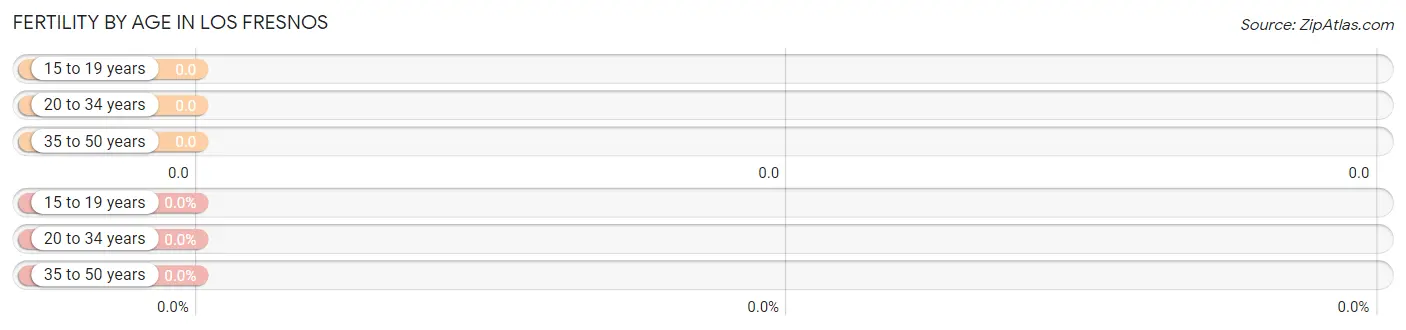
| Age Bracket | Women with Births | Births / 1,000 Women |
| 15 to 19 years | 0 (0.0%) | 0.0 |
| 20 to 34 years | 0 (0.0%) | 0.0 |
| 35 to 50 years | 0 (0.0%) | 0.0 |
| Total | 0 (0.0%) | 0.0 |
Fertility by Age by Marriage Status in Los Fresnos
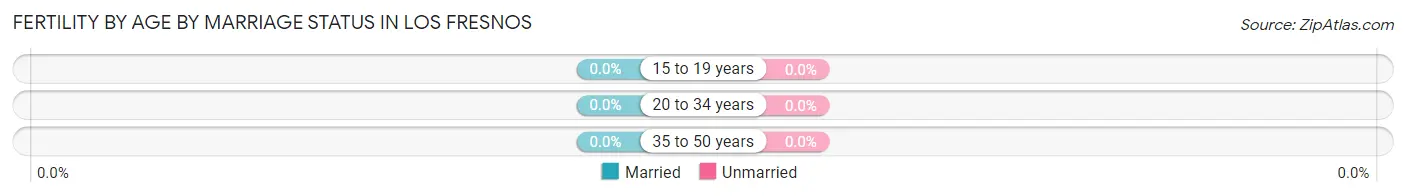
| Age Bracket | Married | Unmarried |
| 15 to 19 years | 0 (0.0%) | 0 (0.0%) |
| 20 to 34 years | 0 (0.0%) | 0 (0.0%) |
| 35 to 50 years | 0 (0.0%) | 0 (0.0%) |
| Total | 0 (0.0%) | 0 (0.0%) |
Fertility by Education in Los Fresnos
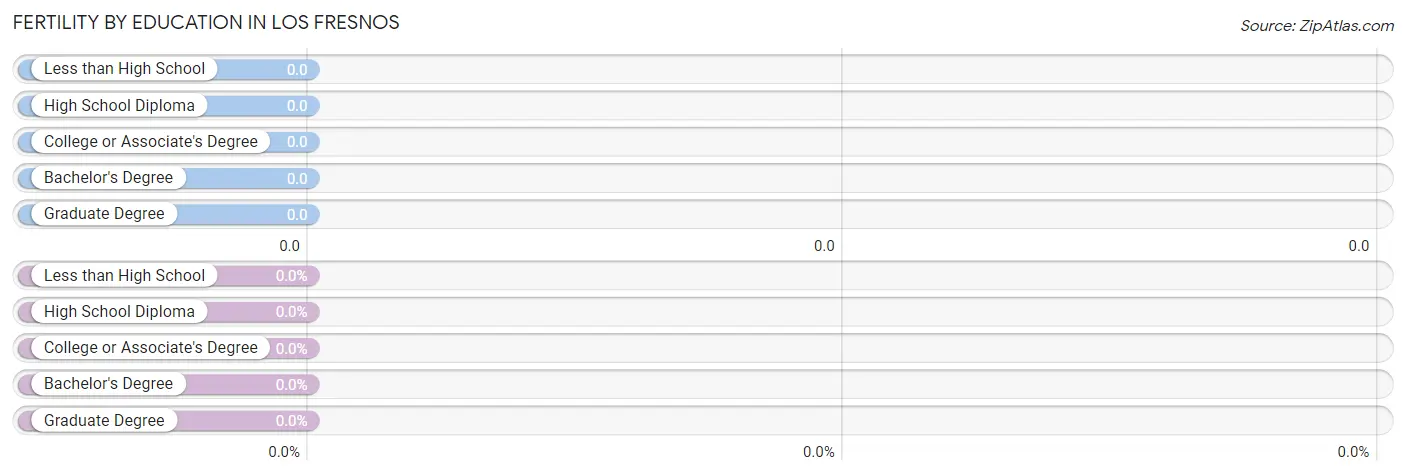
| Educational Attainment | Women with Births | Births / 1,000 Women |
| Less than High School | 0 (0.0%) | 0.0 |
| High School Diploma | 0 (0.0%) | 0.0 |
| College or Associate's Degree | 0 (0.0%) | 0.0 |
| Bachelor's Degree | 0 (0.0%) | 0.0 |
| Graduate Degree | 0 (0.0%) | 0.0 |
| Total | 0 (0.0%) | 0.0 |
Fertility by Education by Marriage Status in Los Fresnos
| Educational Attainment | Married | Unmarried |
| Less than High School | 0 (0.0%) | 0 (0.0%) |
| High School Diploma | 0 (0.0%) | 0 (0.0%) |
| College or Associate's Degree | 0 (0.0%) | 0 (0.0%) |
| Bachelor's Degree | 0 (0.0%) | 0 (0.0%) |
| Graduate Degree | 0 (0.0%) | 0 (0.0%) |
| Total | 0 (0.0%) | 0 (0.0%) |
Employment Characteristics in Los Fresnos
Employment by Class of Employer in Los Fresnos
Among the 54 employed individuals in Los Fresnos, private company employees (40 | 74.1%), and self-employed (not incorporated) (14 | 25.9%) make up the most common classes of employment.
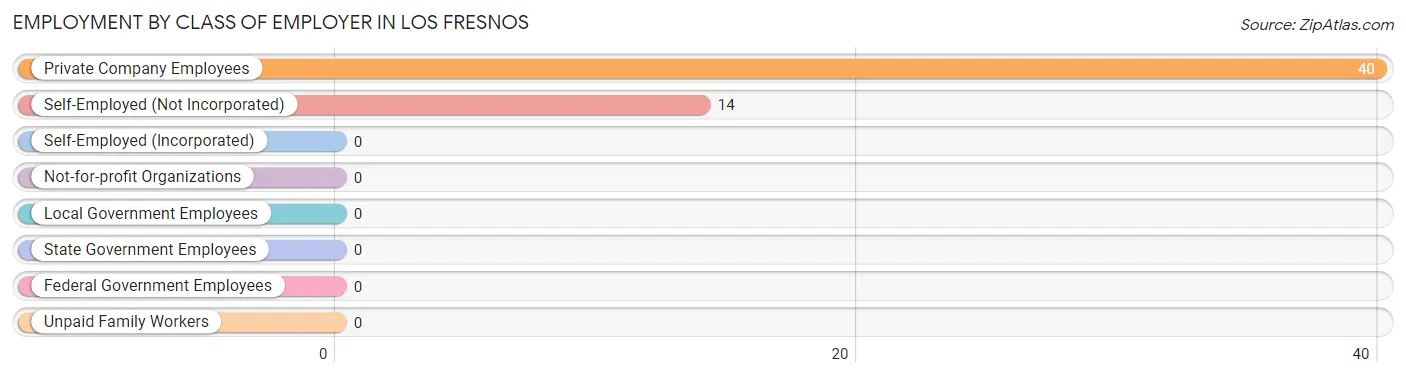
| Employer Class | # Employees | % Employees |
| Private Company Employees | 40 | 74.1% |
| Self-Employed (Incorporated) | 0 | 0.0% |
| Self-Employed (Not Incorporated) | 14 | 25.9% |
| Not-for-profit Organizations | 0 | 0.0% |
| Local Government Employees | 0 | 0.0% |
| State Government Employees | 0 | 0.0% |
| Federal Government Employees | 0 | 0.0% |
| Unpaid Family Workers | 0 | 0.0% |
| Total | 54 | 100.0% |
Employment Status by Age in Los Fresnos
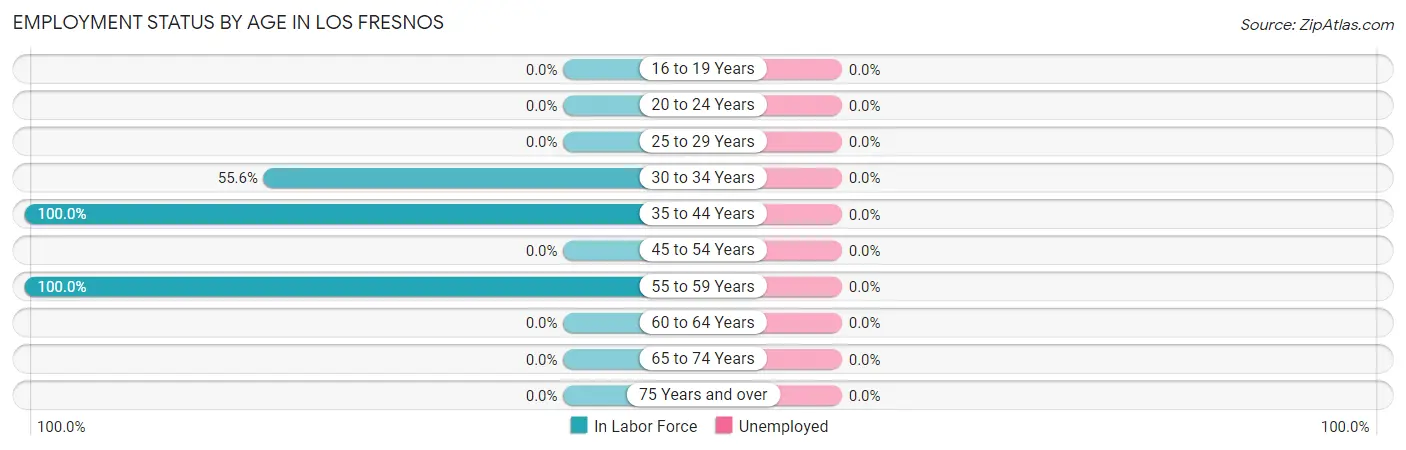
| Age Bracket | In Labor Force | Unemployed |
| 16 to 19 Years | 0 (0.0%) | 0 (0.0%) |
| 20 to 24 Years | 0 (0.0%) | 0 (0.0%) |
| 25 to 29 Years | 0 (0.0%) | 0 (0.0%) |
| 30 to 34 Years | 15 (55.6%) | 0 (0.0%) |
| 35 to 44 Years | 25 (100.0%) | 0 (0.0%) |
| 45 to 54 Years | 0 (0.0%) | 0 (0.0%) |
| 55 to 59 Years | 14 (100.0%) | 0 (0.0%) |
| 60 to 64 Years | 0 (0.0%) | 0 (0.0%) |
| 65 to 74 Years | 0 (0.0%) | 0 (0.0%) |
| 75 Years and over | 0 (0.0%) | 0 (0.0%) |
| Total | 54 (52.4%) | 0 (0.0%) |
Employment Status by Educational Attainment in Los Fresnos
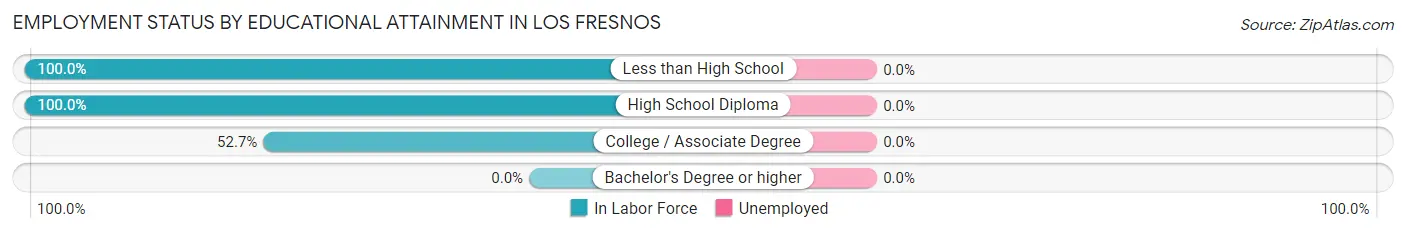
| Educational Attainment | In Labor Force | Unemployed |
| Less than High School | 14 (100.0%) | 0 (0.0%) |
| High School Diploma | 11 (100.0%) | 0 (0.0%) |
| College / Associate Degree | 29 (52.7%) | 0 (0.0%) |
| Bachelor's Degree or higher | 0 (0.0%) | 0 (0.0%) |
| Total | 54 (67.5%) | 0 (0.0%) |
Employment Occupations by Sex in Los Fresnos
Management, Business, Science and Arts Occupations
Management, Business, Science and Arts Occupations by Sex
| Occupation | Male | Female |
| Management | 0 (0.0%) | 0 (0.0%) |
| Business & Financial | 0 (0.0%) | 0 (0.0%) |
| Computers, Engineering & Science | 0 (0.0%) | 0 (0.0%) |
| Computers & Mathematics | 0 (0.0%) | 0 (0.0%) |
| Architecture & Engineering | 0 (0.0%) | 0 (0.0%) |
| Life, Physical & Social Science | 0 (0.0%) | 0 (0.0%) |
| Community & Social Service | 0 (0.0%) | 0 (0.0%) |
| Education, Arts & Media | 0 (0.0%) | 0 (0.0%) |
| Legal Services & Support | 0 (0.0%) | 0 (0.0%) |
| Education Instruction & Library | 0 (0.0%) | 0 (0.0%) |
| Arts, Media & Entertainment | 0 (0.0%) | 0 (0.0%) |
| Health Diagnosing & Treating | 0 (0.0%) | 0 (0.0%) |
| Health Technologists | 0 (0.0%) | 0 (0.0%) |
| Total (Category) | 0 (0.0%) | 0 (0.0%) |
| Total (Overall) | 43 (79.6%) | 11 (20.4%) |
Services Occupations
Services Occupations by Sex
| Occupation | Male | Female |
| Healthcare Support | 0 (0.0%) | 0 (0.0%) |
| Security & Protection | 0 (0.0%) | 0 (0.0%) |
| Firefighting & Prevention | 0 (0.0%) | 0 (0.0%) |
| Law Enforcement | 0 (0.0%) | 0 (0.0%) |
| Food Preparation & Serving | 0 (0.0%) | 0 (0.0%) |
| Cleaning & Maintenance | 0 (0.0%) | 0 (0.0%) |
| Personal Care & Service | 0 (0.0%) | 0 (0.0%) |
| Total (Category) | 0 (0.0%) | 0 (0.0%) |
| Total (Overall) | 43 (79.6%) | 11 (20.4%) |
Sales and Office Occupations
The most common Sales and Office occupations in Los Fresnos are Sales & Related (14 | 25.9%), and Office & Administration (11 | 20.4%).
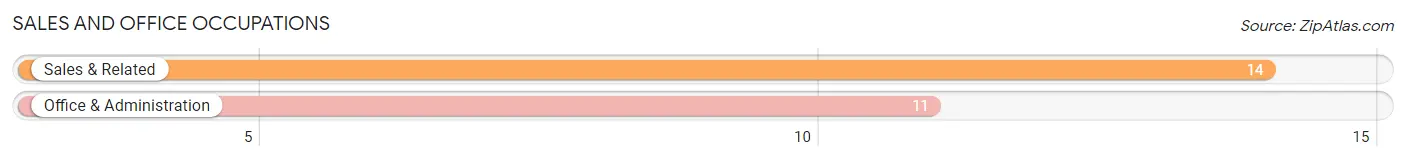
Sales and Office Occupations by Sex
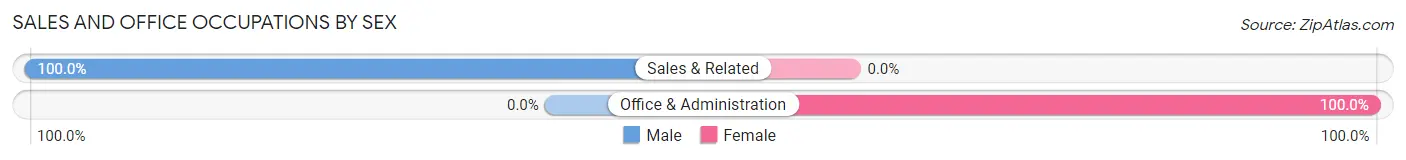
| Occupation | Male | Female |
| Sales & Related | 14 (100.0%) | 0 (0.0%) |
| Office & Administration | 0 (0.0%) | 11 (100.0%) |
| Total (Category) | 14 (56.0%) | 11 (44.0%) |
| Total (Overall) | 43 (79.6%) | 11 (20.4%) |
Natural Resources, Construction and Maintenance Occupations
The most common Natural Resources, Construction and Maintenance occupations in Los Fresnos are , and Construction & Extraction (15 | 27.8%).
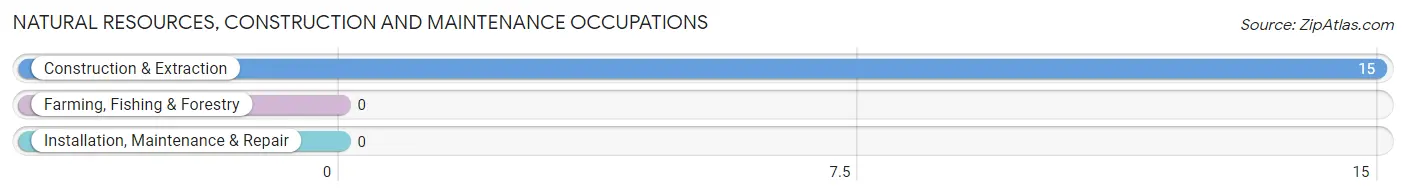
Natural Resources, Construction and Maintenance Occupations by Sex
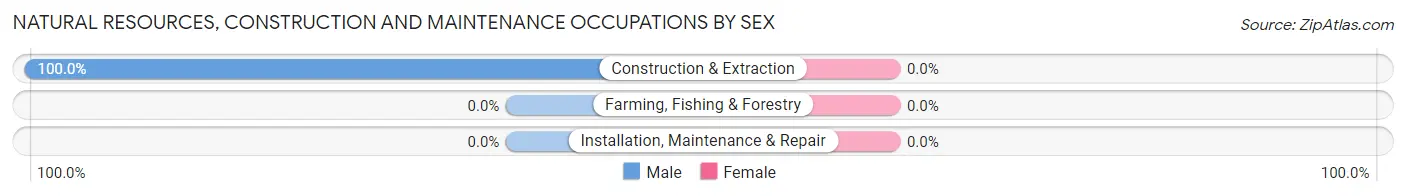
| Occupation | Male | Female |
| Farming, Fishing & Forestry | 0 (0.0%) | 0 (0.0%) |
| Construction & Extraction | 15 (100.0%) | 0 (0.0%) |
| Installation, Maintenance & Repair | 0 (0.0%) | 0 (0.0%) |
| Total (Category) | 15 (100.0%) | 0 (0.0%) |
| Total (Overall) | 43 (79.6%) | 11 (20.4%) |
Production, Transportation and Moving Occupations
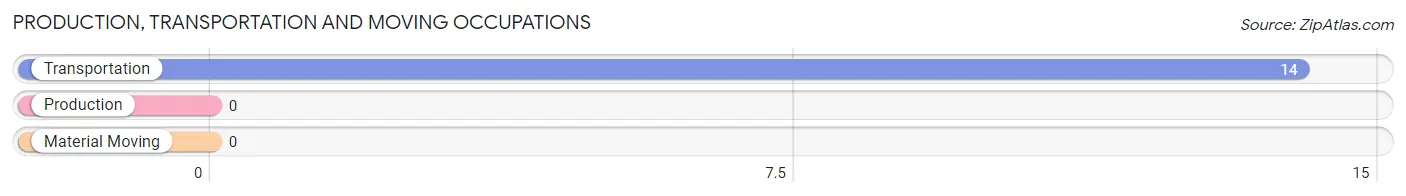
The most common Production, Transportation and Moving occupations in Los Fresnos are , and Transportation (14 | 25.9%).
Production, Transportation and Moving Occupations by Sex
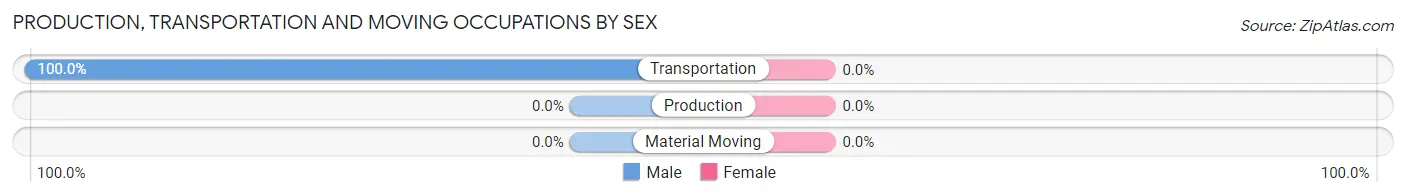
| Occupation | Male | Female |
| Production | 0 (0.0%) | 0 (0.0%) |
| Transportation | 14 (100.0%) | 0 (0.0%) |
| Material Moving | 0 (0.0%) | 0 (0.0%) |
| Total (Category) | 14 (100.0%) | 0 (0.0%) |
| Total (Overall) | 43 (79.6%) | 11 (20.4%) |
Employment Industries by Sex in Los Fresnos
Employment Industries in Los Fresnos
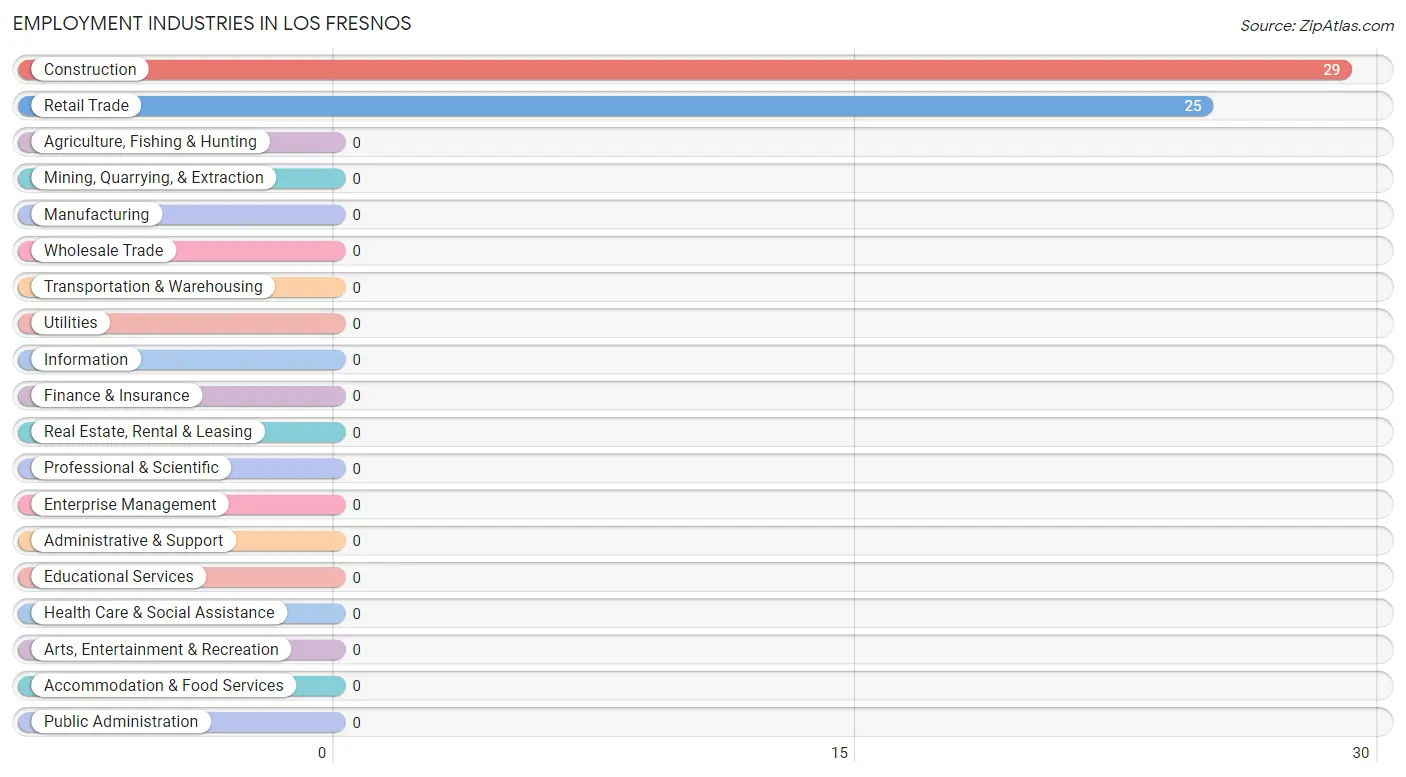
The major employment industries in Los Fresnos include Construction (29 | 53.7%), and Retail Trade (25 | 46.3%).
Employment Industries by Sex in Los Fresnos
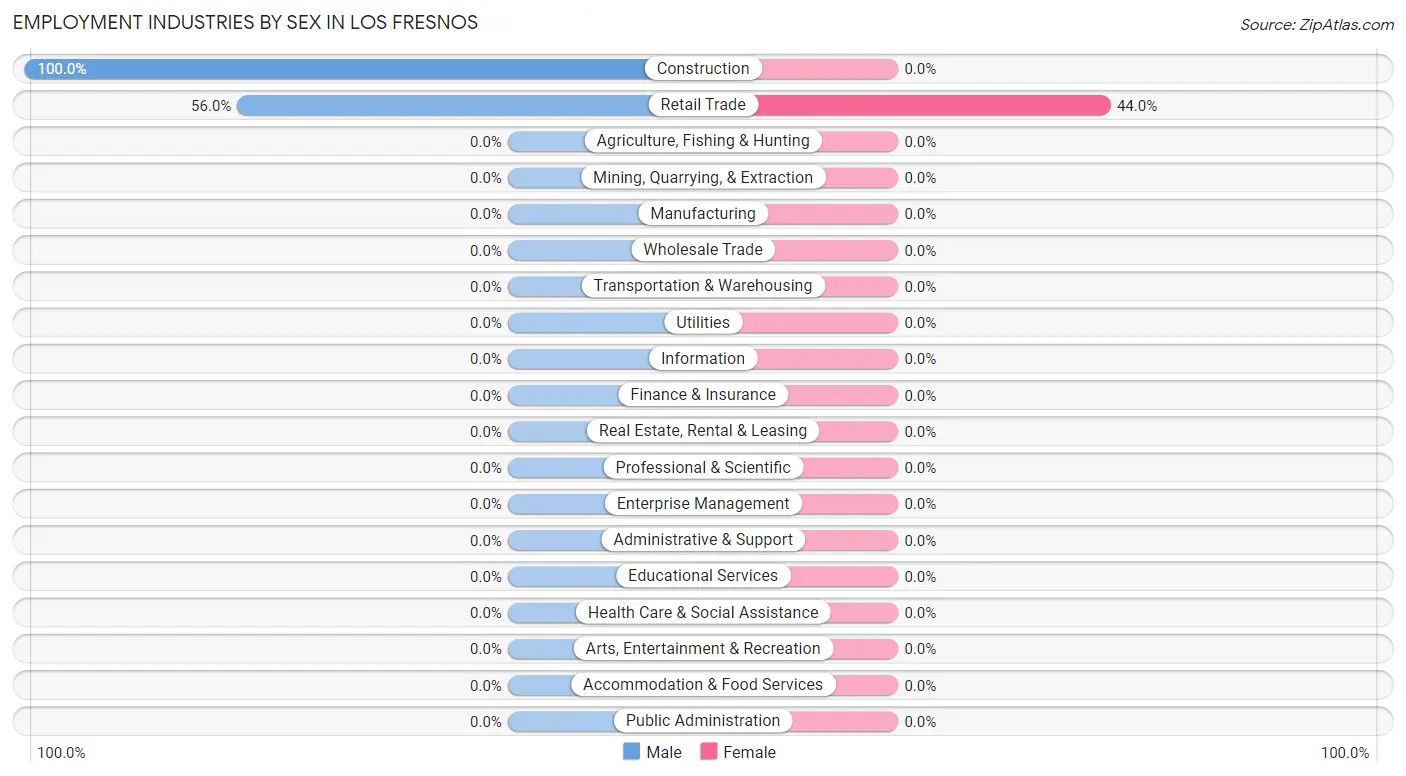
| Industry | Male | Female |
| Agriculture, Fishing & Hunting | 0 (0.0%) | 0 (0.0%) |
| Mining, Quarrying, & Extraction | 0 (0.0%) | 0 (0.0%) |
| Construction | 29 (100.0%) | 0 (0.0%) |
| Manufacturing | 0 (0.0%) | 0 (0.0%) |
| Wholesale Trade | 0 (0.0%) | 0 (0.0%) |
| Retail Trade | 14 (56.0%) | 11 (44.0%) |
| Transportation & Warehousing | 0 (0.0%) | 0 (0.0%) |
| Utilities | 0 (0.0%) | 0 (0.0%) |
| Information | 0 (0.0%) | 0 (0.0%) |
| Finance & Insurance | 0 (0.0%) | 0 (0.0%) |
| Real Estate, Rental & Leasing | 0 (0.0%) | 0 (0.0%) |
| Professional & Scientific | 0 (0.0%) | 0 (0.0%) |
| Enterprise Management | 0 (0.0%) | 0 (0.0%) |
| Administrative & Support | 0 (0.0%) | 0 (0.0%) |
| Educational Services | 0 (0.0%) | 0 (0.0%) |
| Health Care & Social Assistance | 0 (0.0%) | 0 (0.0%) |
| Arts, Entertainment & Recreation | 0 (0.0%) | 0 (0.0%) |
| Accommodation & Food Services | 0 (0.0%) | 0 (0.0%) |
| Public Administration | 0 (0.0%) | 0 (0.0%) |
| Total | 43 (79.6%) | 11 (20.4%) |
Education in Los Fresnos
School Enrollment in Los Fresnos
The most common levels of schooling among the 77 students in Los Fresnos are middle school (30 | 39.0%), nursery / preschool (18 | 23.4%), and kindergarten (16 | 20.8%).
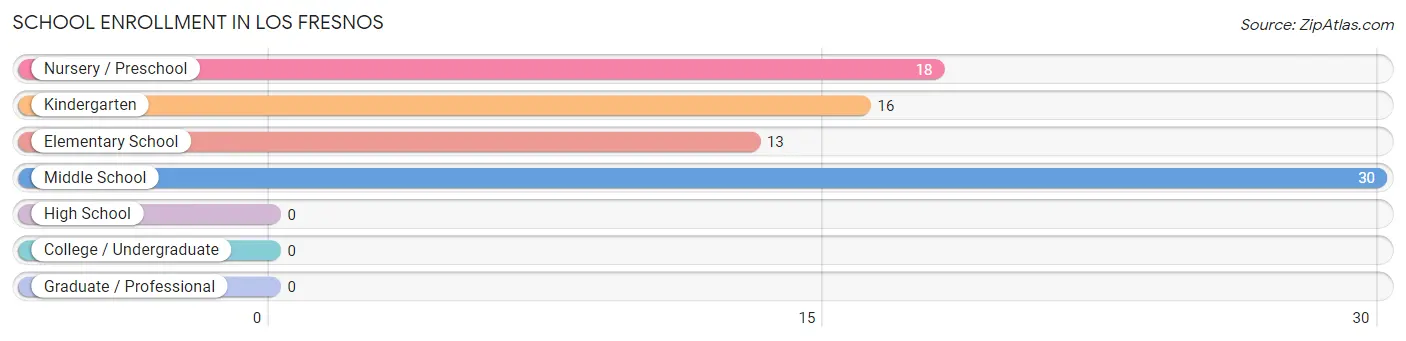
| School Level | # Students | % Students |
| Nursery / Preschool | 18 | 23.4% |
| Kindergarten | 16 | 20.8% |
| Elementary School | 13 | 16.9% |
| Middle School | 30 | 39.0% |
| High School | 0 | 0.0% |
| College / Undergraduate | 0 | 0.0% |
| Graduate / Professional | 0 | 0.0% |
| Total | 77 | 100.0% |
School Enrollment by Age by Funding Source in Los Fresnos
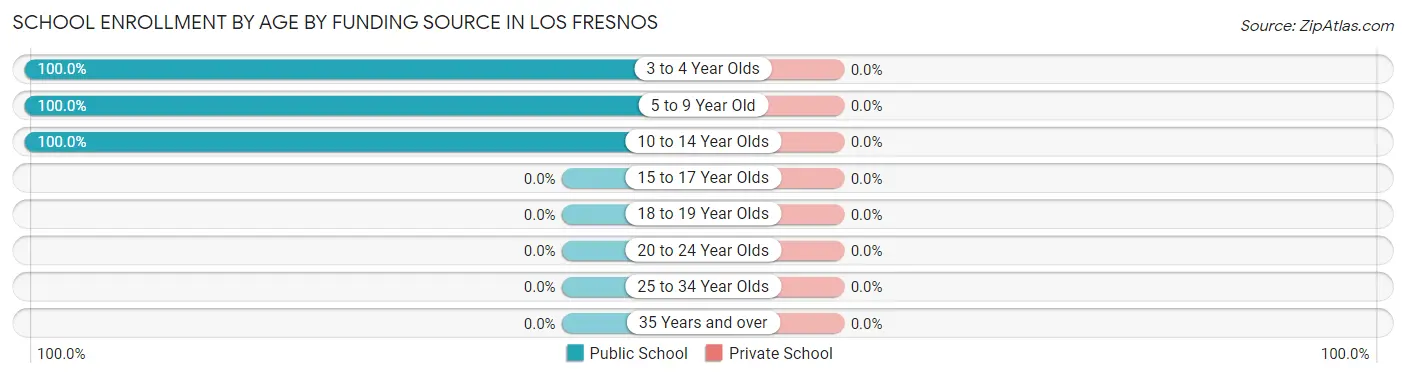
| Age Bracket | Public School | Private School |
| 3 to 4 Year Olds | 18 (100.0%) | 0 (0.0%) |
| 5 to 9 Year Old | 29 (100.0%) | 0 (0.0%) |
| 10 to 14 Year Olds | 30 (100.0%) | 0 (0.0%) |
| 15 to 17 Year Olds | 0 (0.0%) | 0 (0.0%) |
| 18 to 19 Year Olds | 0 (0.0%) | 0 (0.0%) |
| 20 to 24 Year Olds | 0 (0.0%) | 0 (0.0%) |
| 25 to 34 Year Olds | 0 (0.0%) | 0 (0.0%) |
| 35 Years and over | 0 (0.0%) | 0 (0.0%) |
| Total | 77 (100.0%) | 0 (0.0%) |
Educational Attainment by Field of Study in Los Fresnos
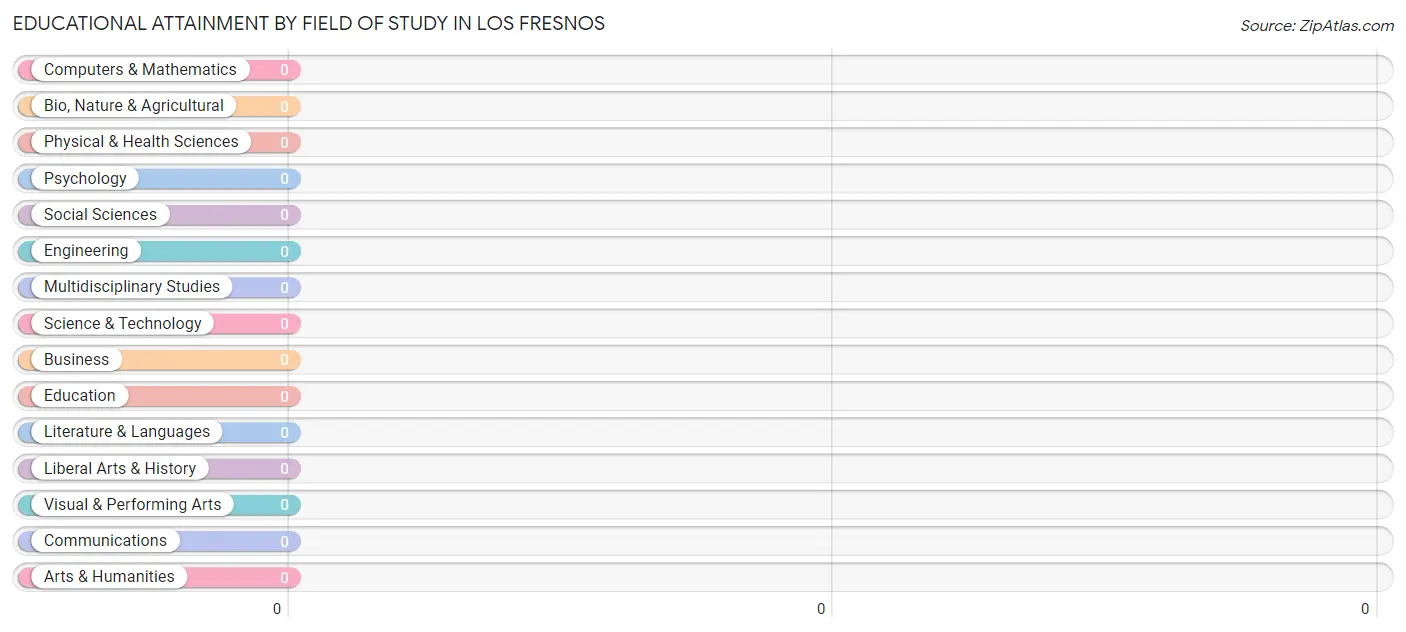
| Field of Study | # Graduates | % Graduates |
| Computers & Mathematics | 0 | 0.0% |
| Bio, Nature & Agricultural | 0 | 0.0% |
| Physical & Health Sciences | 0 | 0.0% |
| Psychology | 0 | 0.0% |
| Social Sciences | 0 | 0.0% |
| Engineering | 0 | 0.0% |
| Multidisciplinary Studies | 0 | 0.0% |
| Science & Technology | 0 | 0.0% |
| Business | 0 | 0.0% |
| Education | 0 | 0.0% |
| Literature & Languages | 0 | 0.0% |
| Liberal Arts & History | 0 | 0.0% |
| Visual & Performing Arts | 0 | 0.0% |
| Communications | 0 | 0.0% |
| Arts & Humanities | 0 | 0.0% |
| Total | 0 | 0.0% |
Transportation & Commute in Los Fresnos
Vehicle Availability by Sex in Los Fresnos
The most prevalent vehicle ownership categories in Los Fresnos are males with 5 or more vehicles (29, accounting for 67.4%) and females with 5 or more vehicles (0, making up 263.6%).
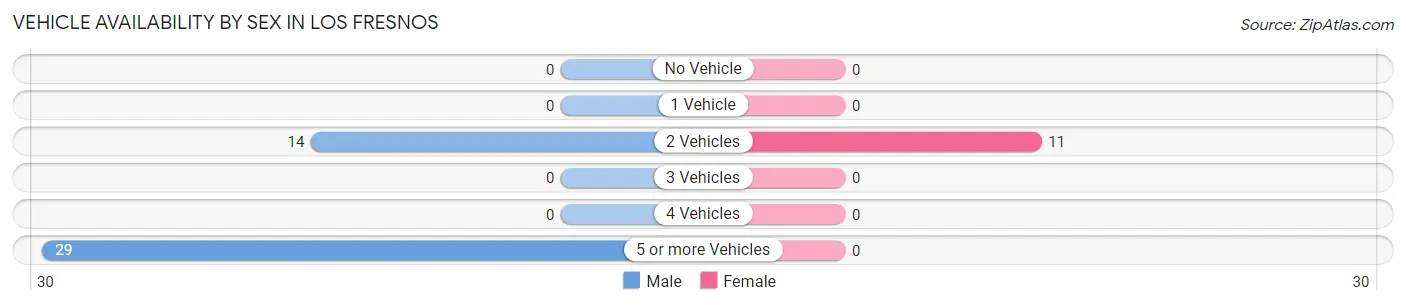
| Vehicles Available | Male | Female |
| No Vehicle | 0 (0.0%) | 0 (0.0%) |
| 1 Vehicle | 0 (0.0%) | 0 (0.0%) |
| 2 Vehicles | 14 (32.6%) | 11 (100.0%) |
| 3 Vehicles | 0 (0.0%) | 0 (0.0%) |
| 4 Vehicles | 0 (0.0%) | 0 (0.0%) |
| 5 or more Vehicles | 29 (67.4%) | 0 (0.0%) |
| Total | 43 (100.0%) | 11 (100.0%) |
Commute Time in Los Fresnos
The most frequently occuring commute durations in Los Fresnos are 90 or more minutes (29 commuters, 53.7%), less than 5 minutes (25 commuters, 46.3%), and 5 to 9 minutes (0 commuters, 0.0%).
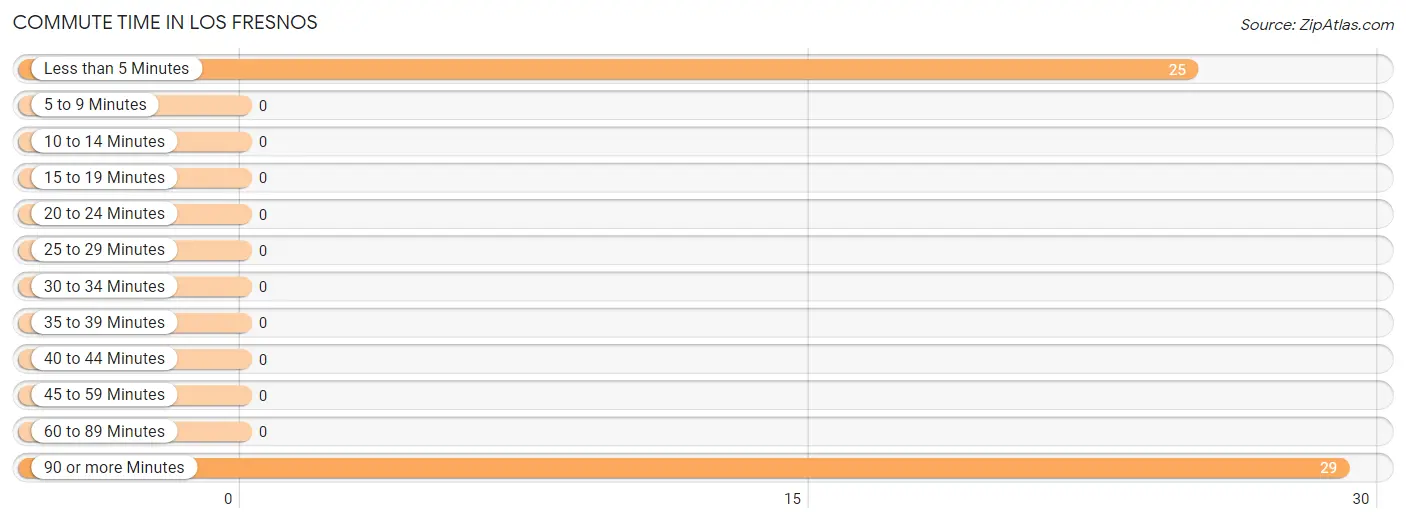
| Commute Time | # Commuters | % Commuters |
| Less than 5 Minutes | 25 | 46.3% |
| 5 to 9 Minutes | 0 | 0.0% |
| 10 to 14 Minutes | 0 | 0.0% |
| 15 to 19 Minutes | 0 | 0.0% |
| 20 to 24 Minutes | 0 | 0.0% |
| 25 to 29 Minutes | 0 | 0.0% |
| 30 to 34 Minutes | 0 | 0.0% |
| 35 to 39 Minutes | 0 | 0.0% |
| 40 to 44 Minutes | 0 | 0.0% |
| 45 to 59 Minutes | 0 | 0.0% |
| 60 to 89 Minutes | 0 | 0.0% |
| 90 or more Minutes | 29 | 53.7% |
Commute Time by Sex in Los Fresnos
The most common commute times in Los Fresnos are 90 or more minutes (29 commuters, 67.4%) for males and less than 5 minutes (11 commuters, 100.0%) for females.
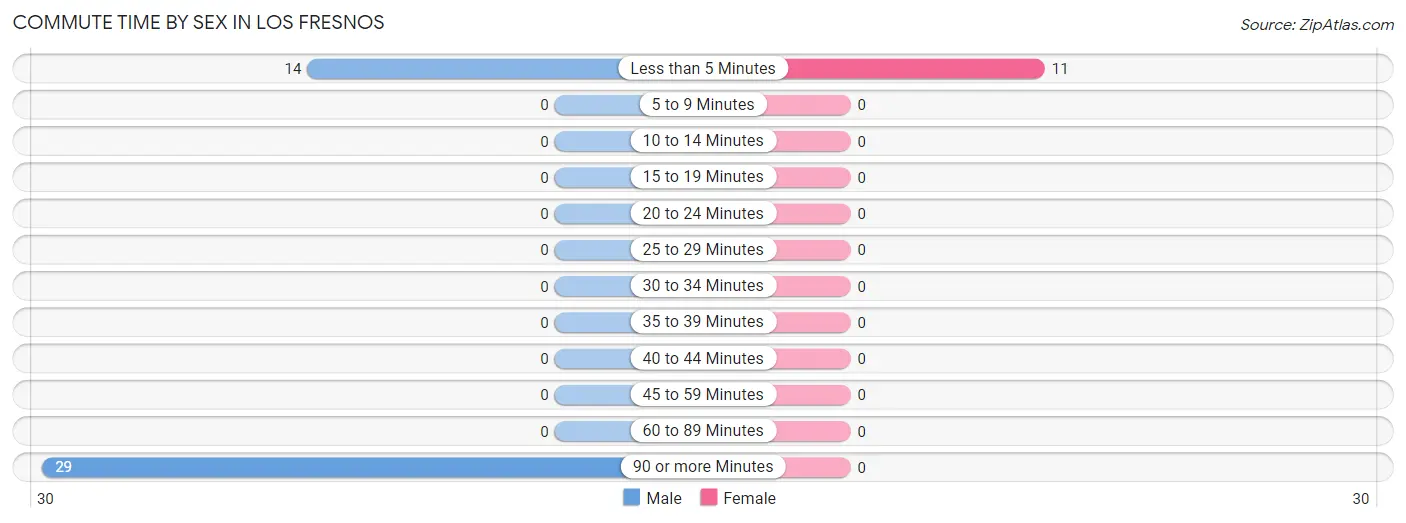
| Commute Time | Male | Female |
| Less than 5 Minutes | 14 (32.6%) | 11 (100.0%) |
| 5 to 9 Minutes | 0 (0.0%) | 0 (0.0%) |
| 10 to 14 Minutes | 0 (0.0%) | 0 (0.0%) |
| 15 to 19 Minutes | 0 (0.0%) | 0 (0.0%) |
| 20 to 24 Minutes | 0 (0.0%) | 0 (0.0%) |
| 25 to 29 Minutes | 0 (0.0%) | 0 (0.0%) |
| 30 to 34 Minutes | 0 (0.0%) | 0 (0.0%) |
| 35 to 39 Minutes | 0 (0.0%) | 0 (0.0%) |
| 40 to 44 Minutes | 0 (0.0%) | 0 (0.0%) |
| 45 to 59 Minutes | 0 (0.0%) | 0 (0.0%) |
| 60 to 89 Minutes | 0 (0.0%) | 0 (0.0%) |
| 90 or more Minutes | 29 (67.4%) | 0 (0.0%) |
Time of Departure to Work by Sex in Los Fresnos
The most frequent times of departure to work in Los Fresnos are 12:00 AM to 4:59 AM (43, 100.0%) for males and 8:00 AM to 8:29 AM (11, 100.0%) for females.
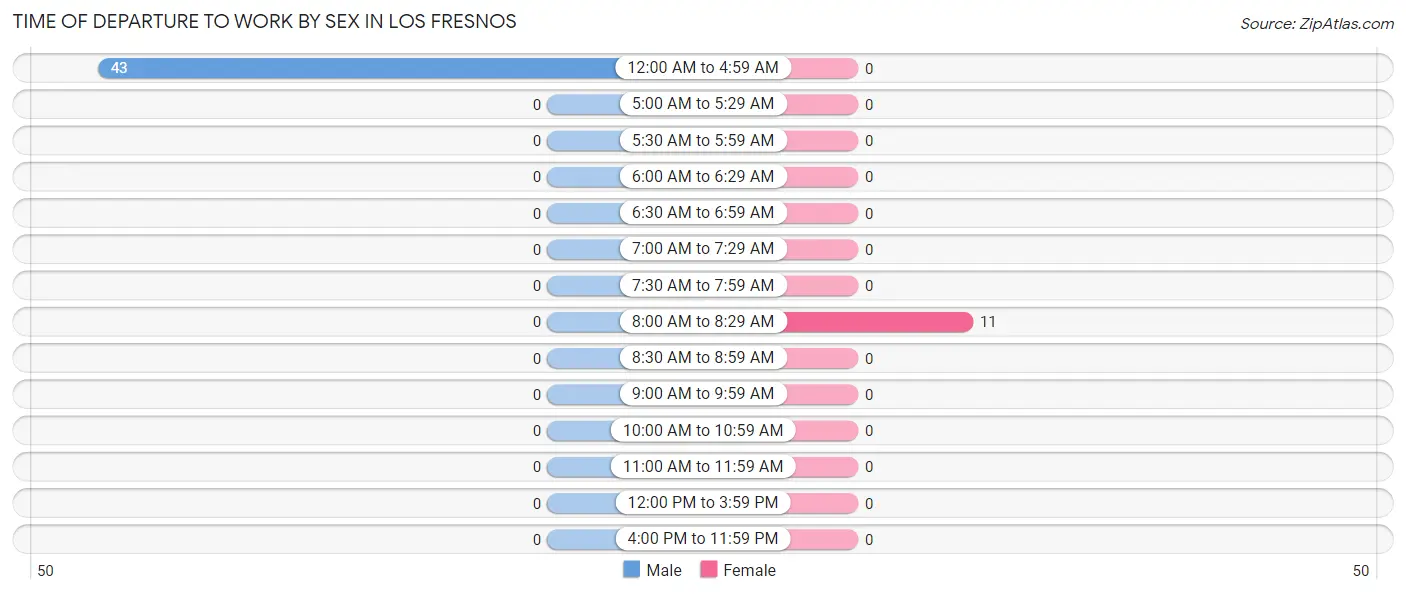
| Time of Departure | Male | Female |
| 12:00 AM to 4:59 AM | 43 (100.0%) | 0 (0.0%) |
| 5:00 AM to 5:29 AM | 0 (0.0%) | 0 (0.0%) |
| 5:30 AM to 5:59 AM | 0 (0.0%) | 0 (0.0%) |
| 6:00 AM to 6:29 AM | 0 (0.0%) | 0 (0.0%) |
| 6:30 AM to 6:59 AM | 0 (0.0%) | 0 (0.0%) |
| 7:00 AM to 7:29 AM | 0 (0.0%) | 0 (0.0%) |
| 7:30 AM to 7:59 AM | 0 (0.0%) | 0 (0.0%) |
| 8:00 AM to 8:29 AM | 0 (0.0%) | 11 (100.0%) |
| 8:30 AM to 8:59 AM | 0 (0.0%) | 0 (0.0%) |
| 9:00 AM to 9:59 AM | 0 (0.0%) | 0 (0.0%) |
| 10:00 AM to 10:59 AM | 0 (0.0%) | 0 (0.0%) |
| 11:00 AM to 11:59 AM | 0 (0.0%) | 0 (0.0%) |
| 12:00 PM to 3:59 PM | 0 (0.0%) | 0 (0.0%) |
| 4:00 PM to 11:59 PM | 0 (0.0%) | 0 (0.0%) |
| Total | 43 (100.0%) | 11 (100.0%) |
Housing Occupancy in Los Fresnos
Occupancy by Ownership in Los Fresnos
Of the total 2,187 dwellings in Los Fresnos, owner-occupied units account for 1,457 (66.6%), while renter-occupied units make up 730 (33.4%).
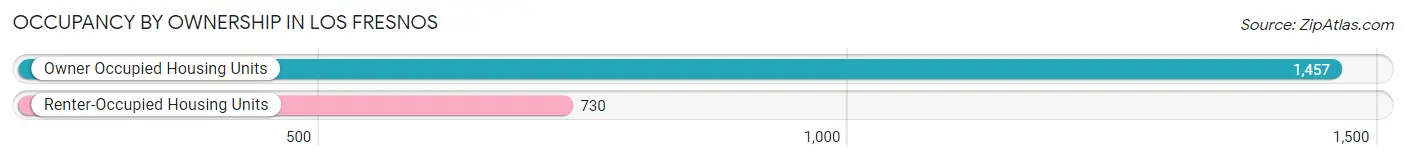
| Occupancy | # Housing Units | % Housing Units |
| Owner Occupied Housing Units | 1,457 | 66.6% |
| Renter-Occupied Housing Units | 730 | 33.4% |
| Total Occupied Housing Units | 2,187 | 100.0% |
Occupancy by Household Size in Los Fresnos
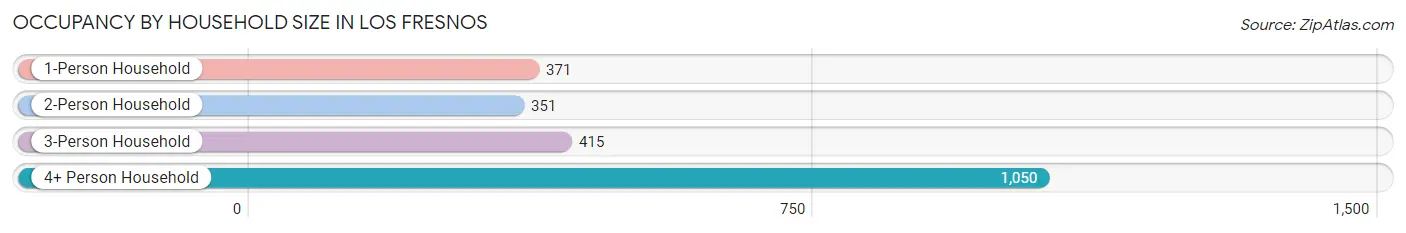
| Household Size | # Housing Units | % Housing Units |
| 1-Person Household | 371 | 17.0% |
| 2-Person Household | 351 | 16.1% |
| 3-Person Household | 415 | 19.0% |
| 4+ Person Household | 1,050 | 48.0% |
| Total Housing Units | 2,187 | 100.0% |
Occupancy by Ownership by Household Size in Los Fresnos
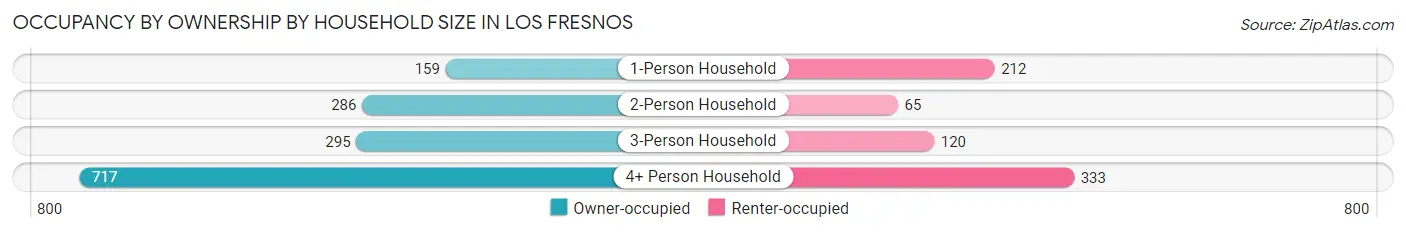
| Household Size | Owner-occupied | Renter-occupied |
| 1-Person Household | 159 (42.9%) | 212 (57.1%) |
| 2-Person Household | 286 (81.5%) | 65 (18.5%) |
| 3-Person Household | 295 (71.1%) | 120 (28.9%) |
| 4+ Person Household | 717 (68.3%) | 333 (31.7%) |
| Total Housing Units | 1,457 (66.6%) | 730 (33.4%) |
Occupancy by Educational Attainment in Los Fresnos
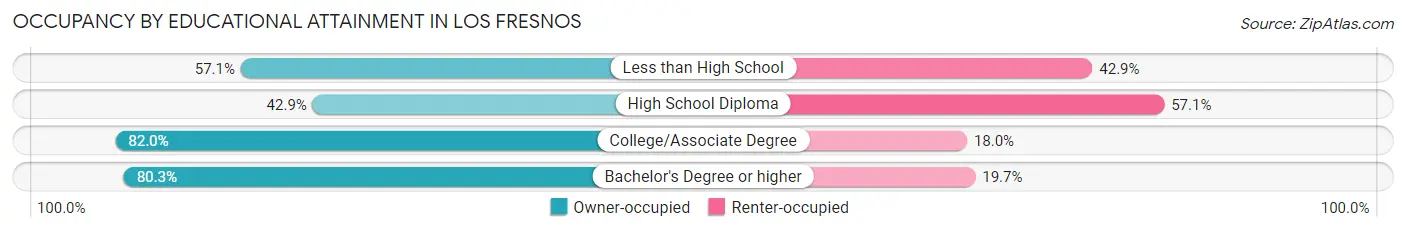
| Household Size | Owner-occupied | Renter-occupied |
| Less than High School | 372 (57.1%) | 279 (42.9%) |
| High School Diploma | 184 (42.9%) | 245 (57.1%) |
| College/Associate Degree | 574 (82.0%) | 126 (18.0%) |
| Bachelor's Degree or higher | 327 (80.3%) | 80 (19.7%) |
Occupancy by Age of Householder in Los Fresnos
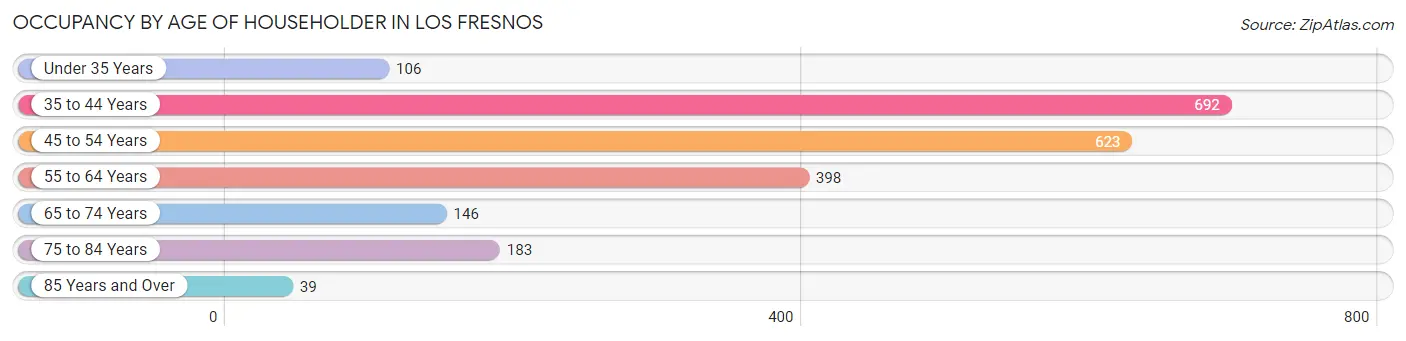
| Age Bracket | # Households | % Households |
| Under 35 Years | 106 | 4.9% |
| 35 to 44 Years | 692 | 31.6% |
| 45 to 54 Years | 623 | 28.5% |
| 55 to 64 Years | 398 | 18.2% |
| 65 to 74 Years | 146 | 6.7% |
| 75 to 84 Years | 183 | 8.4% |
| 85 Years and Over | 39 | 1.8% |
| Total | 2,187 | 100.0% |
Housing Finances in Los Fresnos
Median Income by Occupancy in Los Fresnos
| Occupancy Type | # Households | Median Income |
| Owner-Occupied | 28 (100.0%) | $0 |
| Renter-Occupied | 0 (0.0%) | $0 |
| Average | 28 (100.0%) | $0 |
Occupancy by Householder Income Bracket in Los Fresnos
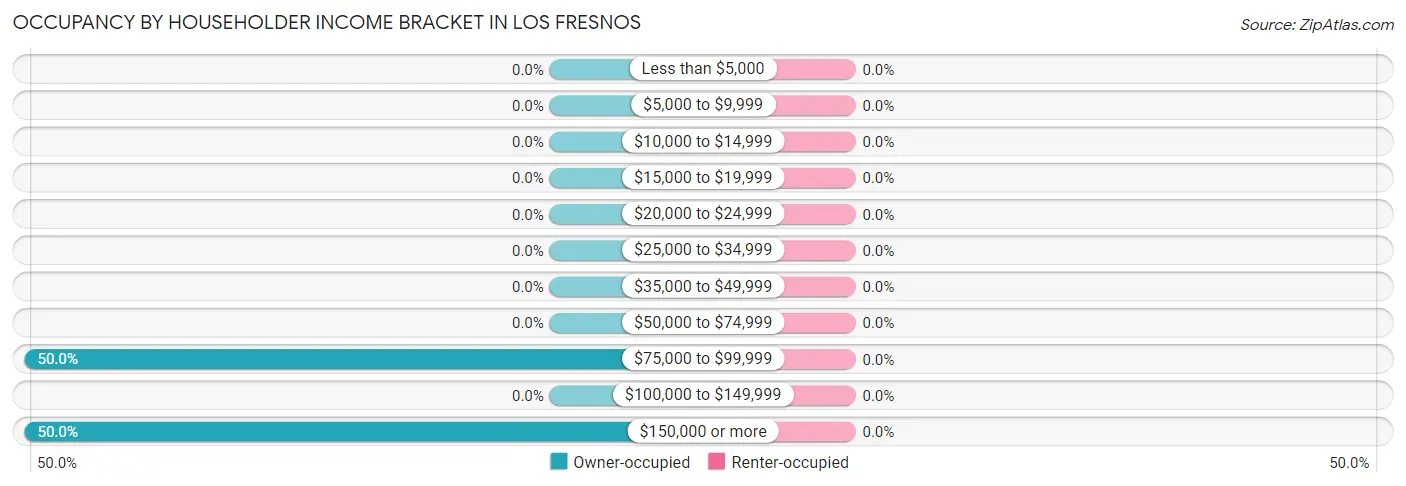
| Income Bracket | Owner-occupied | Renter-occupied |
| Less than $5,000 | 0 (0.0%) | 0 (0.0%) |
| $5,000 to $9,999 | 0 (0.0%) | 0 (0.0%) |
| $10,000 to $14,999 | 0 (0.0%) | 0 (0.0%) |
| $15,000 to $19,999 | 0 (0.0%) | 0 (0.0%) |
| $20,000 to $24,999 | 0 (0.0%) | 0 (0.0%) |
| $25,000 to $34,999 | 0 (0.0%) | 0 (0.0%) |
| $35,000 to $49,999 | 0 (0.0%) | 0 (0.0%) |
| $50,000 to $74,999 | 0 (0.0%) | 0 (0.0%) |
| $75,000 to $99,999 | 14 (50.0%) | 0 (0.0%) |
| $100,000 to $149,999 | 0 (0.0%) | 0 (0.0%) |
| $150,000 or more | 14 (50.0%) | 0 (0.0%) |
| Total | 28 (100.0%) | 0 (0.0%) |
Monthly Housing Cost Tiers in Los Fresnos
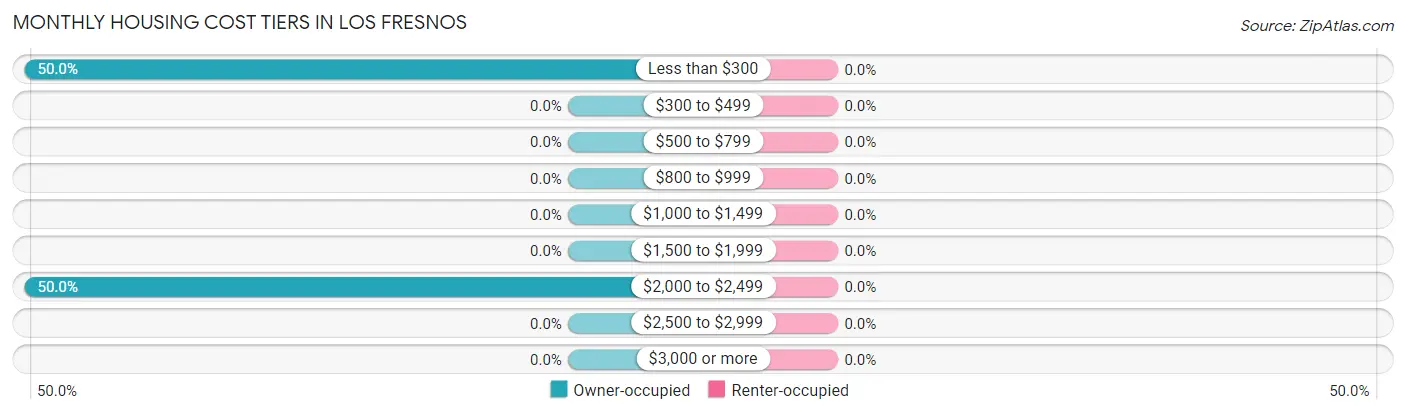
| Monthly Cost | Owner-occupied | Renter-occupied |
| Less than $300 | 14 (50.0%) | 0 (0.0%) |
| $300 to $499 | 0 (0.0%) | 0 (0.0%) |
| $500 to $799 | 0 (0.0%) | 0 (0.0%) |
| $800 to $999 | 0 (0.0%) | 0 (0.0%) |
| $1,000 to $1,499 | 0 (0.0%) | 0 (0.0%) |
| $1,500 to $1,999 | 0 (0.0%) | 0 (0.0%) |
| $2,000 to $2,499 | 14 (50.0%) | 0 (0.0%) |
| $2,500 to $2,999 | 0 (0.0%) | 0 (0.0%) |
| $3,000 or more | 0 (0.0%) | 0 (0.0%) |
| Total | 28 (100.0%) | 0 (0.0%) |
Physical Housing Characteristics in Los Fresnos
Housing Structures in Los Fresnos
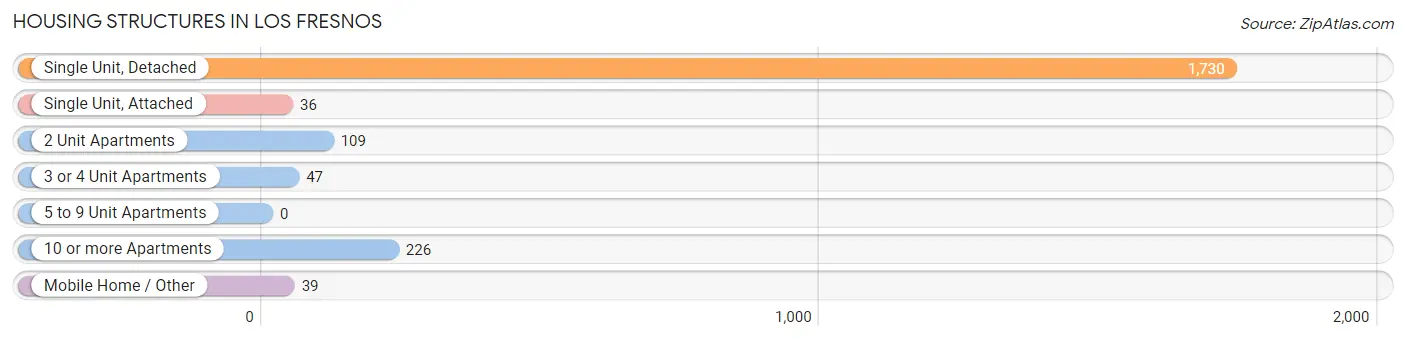
| Structure Type | # Housing Units | % Housing Units |
| Single Unit, Detached | 1,730 | 79.1% |
| Single Unit, Attached | 36 | 1.7% |
| 2 Unit Apartments | 109 | 5.0% |
| 3 or 4 Unit Apartments | 47 | 2.1% |
| 5 to 9 Unit Apartments | 0 | 0.0% |
| 10 or more Apartments | 226 | 10.3% |
| Mobile Home / Other | 39 | 1.8% |
| Total | 2,187 | 100.0% |
Housing Structures by Occupancy in Los Fresnos
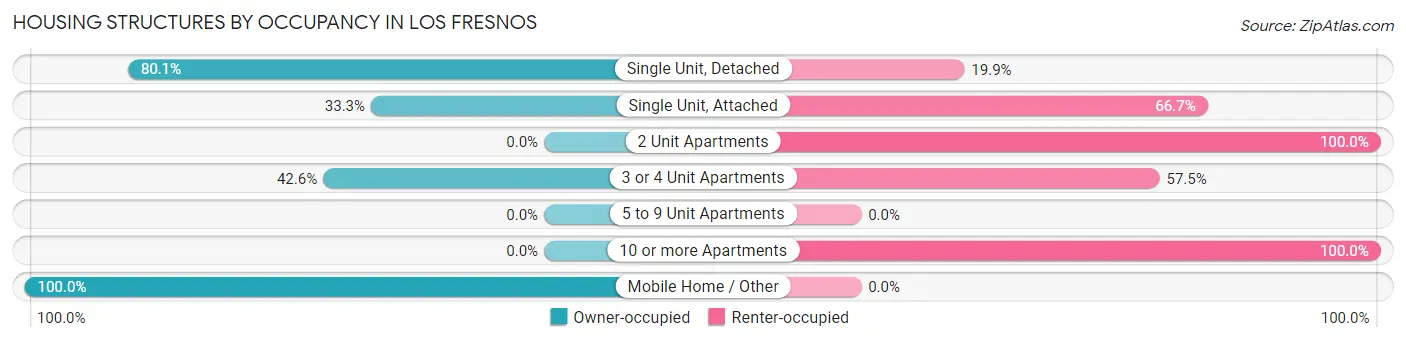
| Structure Type | Owner-occupied | Renter-occupied |
| Single Unit, Detached | 1,386 (80.1%) | 344 (19.9%) |
| Single Unit, Attached | 12 (33.3%) | 24 (66.7%) |
| 2 Unit Apartments | 0 (0.0%) | 109 (100.0%) |
| 3 or 4 Unit Apartments | 20 (42.5%) | 27 (57.5%) |
| 5 to 9 Unit Apartments | 0 (0.0%) | 0 (0.0%) |
| 10 or more Apartments | 0 (0.0%) | 226 (100.0%) |
| Mobile Home / Other | 39 (100.0%) | 0 (0.0%) |
| Total | 1,457 (66.6%) | 730 (33.4%) |
Housing Structures by Number of Rooms in Los Fresnos
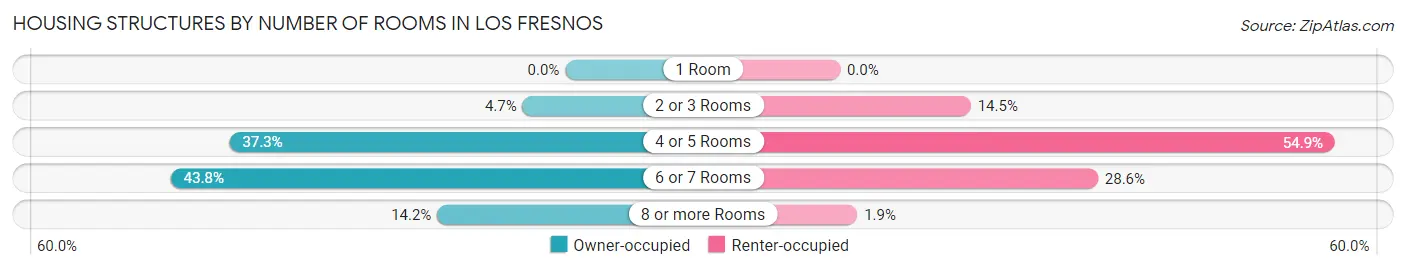
| Number of Rooms | Owner-occupied | Renter-occupied |
| 1 Room | 0 (0.0%) | 0 (0.0%) |
| 2 or 3 Rooms | 69 (4.7%) | 106 (14.5%) |
| 4 or 5 Rooms | 543 (37.3%) | 401 (54.9%) |
| 6 or 7 Rooms | 638 (43.8%) | 209 (28.6%) |
| 8 or more Rooms | 207 (14.2%) | 14 (1.9%) |
| Total | 1,457 (100.0%) | 730 (100.0%) |
Housing Structure by Heating Type in Los Fresnos
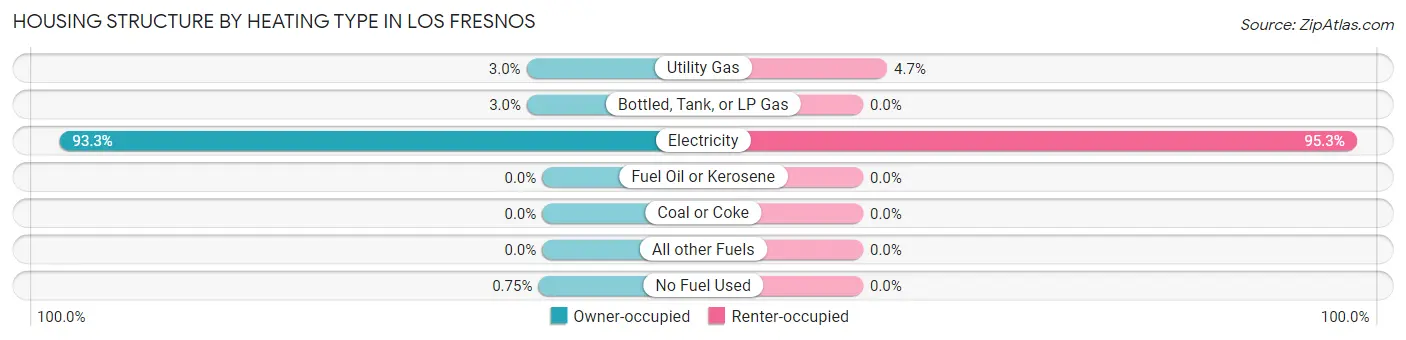
| Heating Type | Owner-occupied | Renter-occupied |
| Utility Gas | 44 (3.0%) | 34 (4.7%) |
| Bottled, Tank, or LP Gas | 43 (2.9%) | 0 (0.0%) |
| Electricity | 1,359 (93.3%) | 696 (95.3%) |
| Fuel Oil or Kerosene | 0 (0.0%) | 0 (0.0%) |
| Coal or Coke | 0 (0.0%) | 0 (0.0%) |
| All other Fuels | 0 (0.0%) | 0 (0.0%) |
| No Fuel Used | 11 (0.7%) | 0 (0.0%) |
| Total | 1,457 (100.0%) | 730 (100.0%) |
Household Vehicle Usage in Los Fresnos
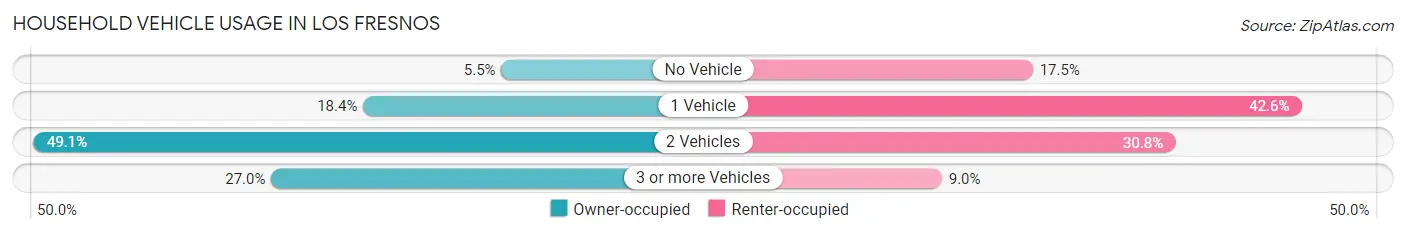
| Vehicles per Household | Owner-occupied | Renter-occupied |
| No Vehicle | 80 (5.5%) | 128 (17.5%) |
| 1 Vehicle | 268 (18.4%) | 311 (42.6%) |
| 2 Vehicles | 716 (49.1%) | 225 (30.8%) |
| 3 or more Vehicles | 393 (27.0%) | 66 (9.0%) |
| Total | 1,457 (100.0%) | 730 (100.0%) |
Real Estate & Mortgages in Los Fresnos
Real Estate and Mortgage Overview in Los Fresnos
| Characteristic | Without Mortgage | With Mortgage |
| Housing Units | 735 | 14 |
| Median Property Value | $111,100 | $0 |
| Median Household Income | $37,841 | $14 |
| Monthly Housing Costs | $509 | $0 |
| Real Estate Taxes | $2,123 | $0 |
Property Value by Mortgage Status in Los Fresnos
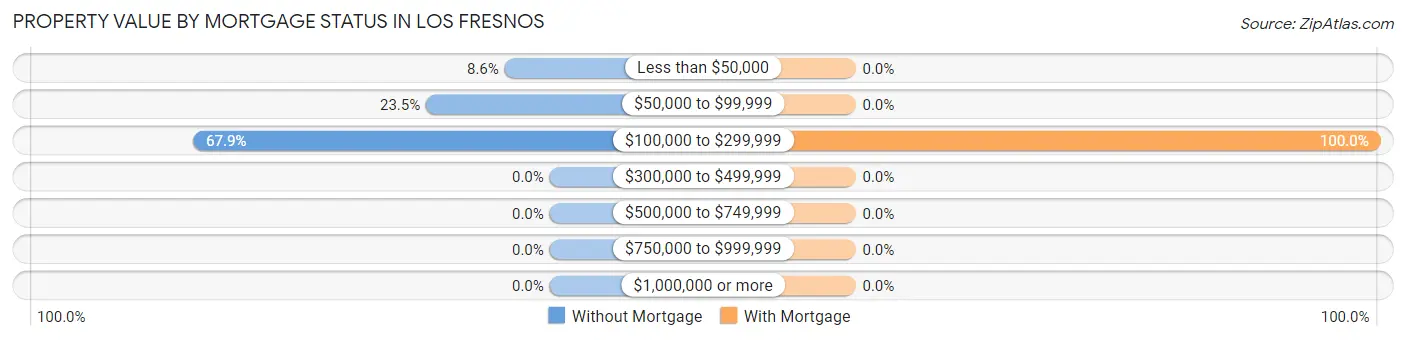
| Property Value | Without Mortgage | With Mortgage |
| Less than $50,000 | 63 (8.6%) | 0 (0.0%) |
| $50,000 to $99,999 | 173 (23.5%) | 0 (0.0%) |
| $100,000 to $299,999 | 499 (67.9%) | 14 (100.0%) |
| $300,000 to $499,999 | 0 (0.0%) | 0 (0.0%) |
| $500,000 to $749,999 | 0 (0.0%) | 0 (0.0%) |
| $750,000 to $999,999 | 0 (0.0%) | 0 (0.0%) |
| $1,000,000 or more | 0 (0.0%) | 0 (0.0%) |
| Total | 735 (100.0%) | 14 (100.0%) |
Household Income by Mortgage Status in Los Fresnos
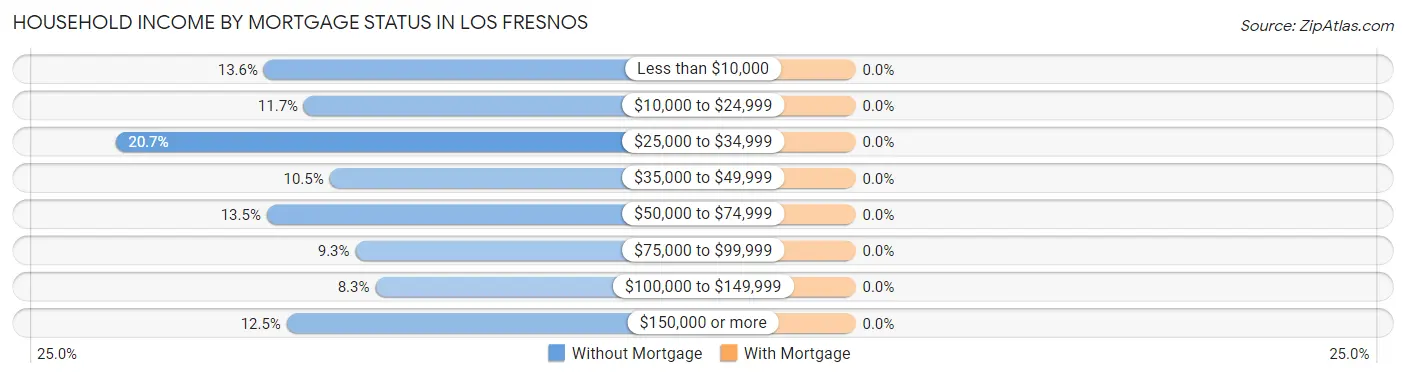
| Household Income | Without Mortgage | With Mortgage |
| Less than $10,000 | 100 (13.6%) | 0 (0.0%) |
| $10,000 to $24,999 | 86 (11.7%) | 0 (0.0%) |
| $25,000 to $34,999 | 152 (20.7%) | 0 (0.0%) |
| $35,000 to $49,999 | 77 (10.5%) | 0 (0.0%) |
| $50,000 to $74,999 | 99 (13.5%) | 0 (0.0%) |
| $75,000 to $99,999 | 68 (9.2%) | 0 (0.0%) |
| $100,000 to $149,999 | 61 (8.3%) | 0 (0.0%) |
| $150,000 or more | 92 (12.5%) | 0 (0.0%) |
| Total | 735 (100.0%) | 14 (100.0%) |
Property Value to Household Income Ratio in Los Fresnos
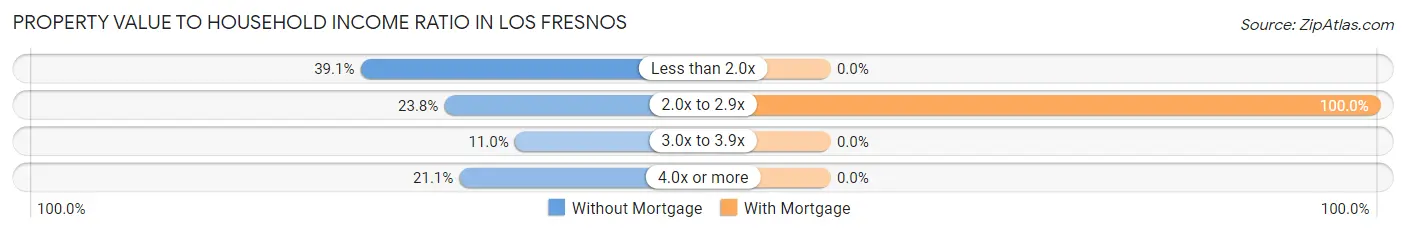
| Value-to-Income Ratio | Without Mortgage | With Mortgage |
| Less than 2.0x | 287 (39.1%) | 0 (0.0%) |
| 2.0x to 2.9x | 175 (23.8%) | 14 (100.0%) |
| 3.0x to 3.9x | 81 (11.0%) | 0 (0.0%) |
| 4.0x or more | 155 (21.1%) | 0 (0.0%) |
| Total | 735 (100.0%) | 14 (100.0%) |
Real Estate Taxes by Mortgage Status in Los Fresnos
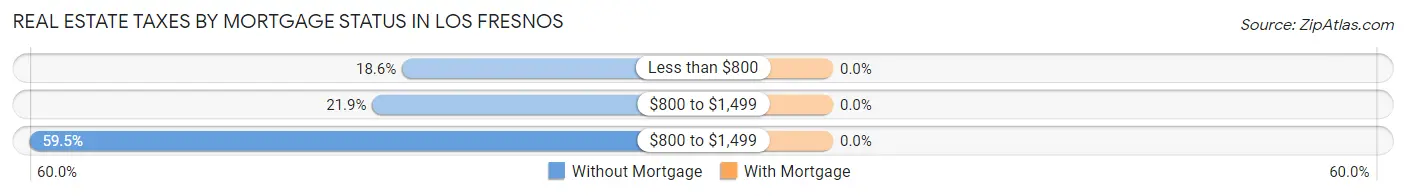
| Property Taxes | Without Mortgage | With Mortgage |
| Less than $800 | 137 (18.6%) | 0 (0.0%) |
| $800 to $1,499 | 161 (21.9%) | 0 (0.0%) |
| $800 to $1,499 | 437 (59.5%) | 0 (0.0%) |
| Total | 735 (100.0%) | 14 (100.0%) |
Health & Disability in Los Fresnos
Health Insurance Coverage by Age in Los Fresnos
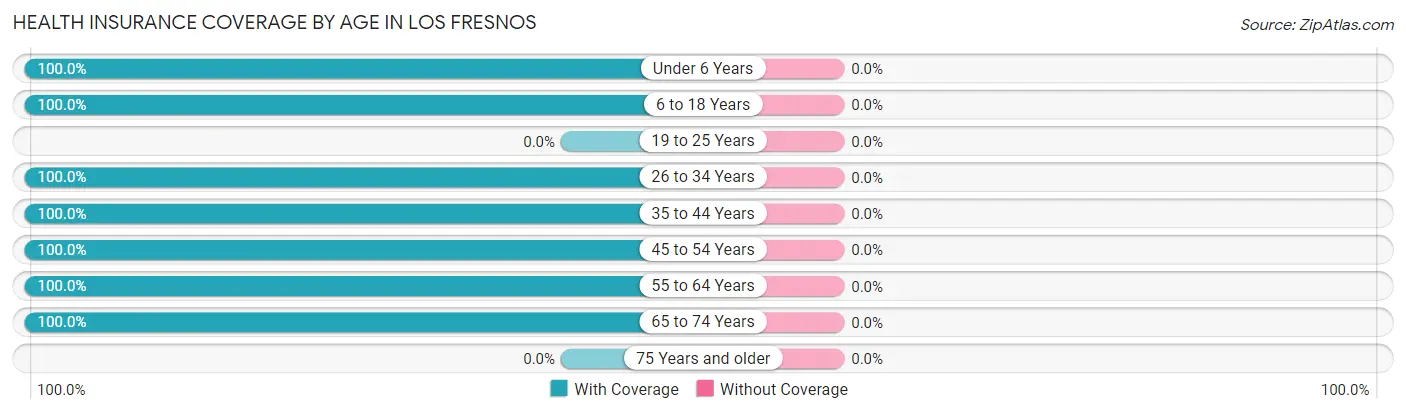
| Age Bracket | With Coverage | Without Coverage |
| Under 6 Years | 51 (100.0%) | 0 (0.0%) |
| 6 to 18 Years | 55 (100.0%) | 0 (0.0%) |
| 19 to 25 Years | 0 (0.0%) | 0 (0.0%) |
| 26 to 34 Years | 27 (100.0%) | 0 (0.0%) |
| 35 to 44 Years | 25 (100.0%) | 0 (0.0%) |
| 45 to 54 Years | 14 (100.0%) | 0 (0.0%) |
| 55 to 64 Years | 14 (100.0%) | 0 (0.0%) |
| 65 to 74 Years | 11 (100.0%) | 0 (0.0%) |
| 75 Years and older | 0 (0.0%) | 0 (0.0%) |
| Total | 197 (100.0%) | 0 (0.0%) |
Health Insurance Coverage by Citizenship Status in Los Fresnos
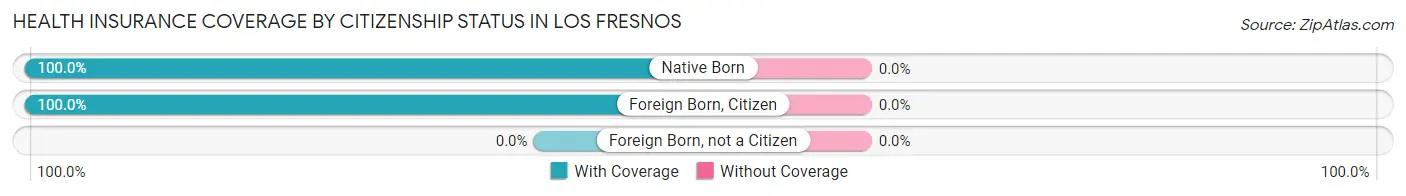
| Citizenship Status | With Coverage | Without Coverage |
| Native Born | 51 (100.0%) | 0 (0.0%) |
| Foreign Born, Citizen | 55 (100.0%) | 0 (0.0%) |
| Foreign Born, not a Citizen | 0 (0.0%) | 0 (0.0%) |
Health Insurance Coverage by Household Income in Los Fresnos
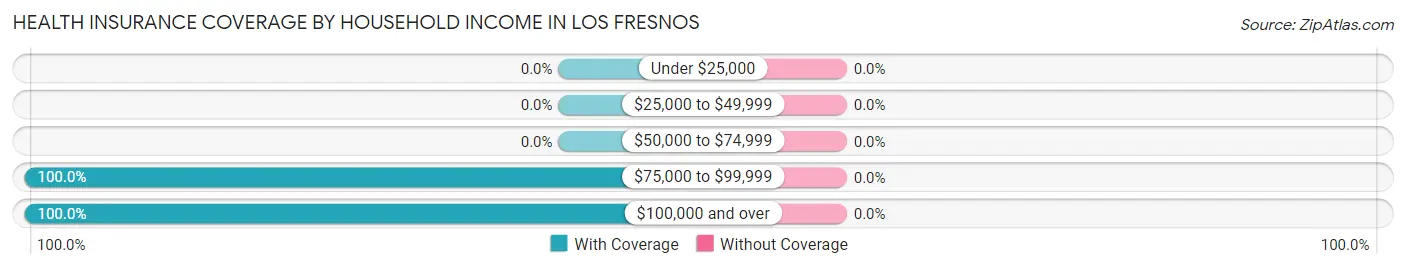
| Household Income | With Coverage | Without Coverage |
| Under $25,000 | 0 (0.0%) | 0 (0.0%) |
| $25,000 to $49,999 | 0 (0.0%) | 0 (0.0%) |
| $50,000 to $74,999 | 0 (0.0%) | 0 (0.0%) |
| $75,000 to $99,999 | 67 (100.0%) | 0 (0.0%) |
| $100,000 and over | 130 (100.0%) | 0 (0.0%) |
Public vs Private Health Insurance Coverage by Age in Los Fresnos
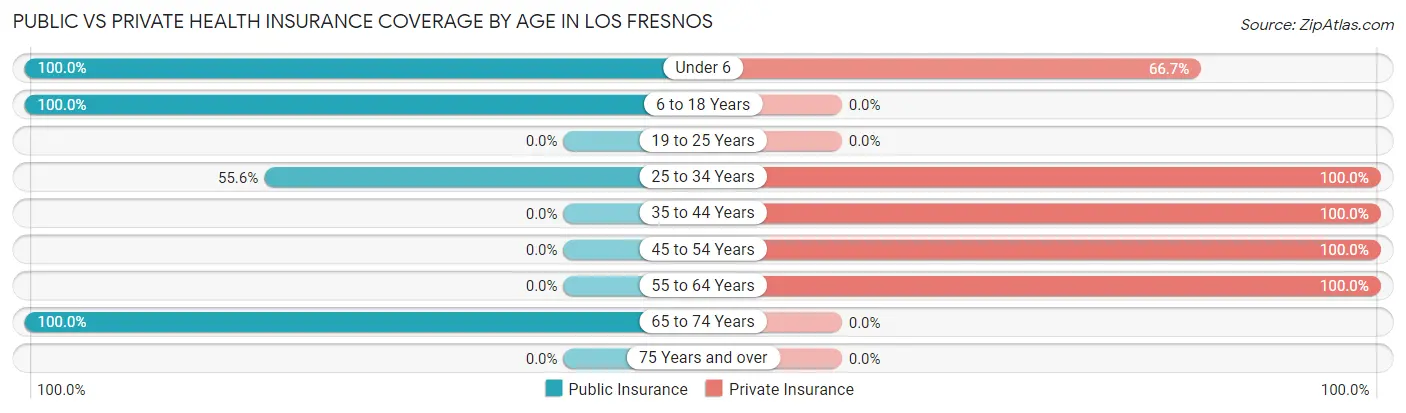
| Age Bracket | Public Insurance | Private Insurance |
| Under 6 | 51 (100.0%) | 34 (66.7%) |
| 6 to 18 Years | 55 (100.0%) | 0 (0.0%) |
| 19 to 25 Years | 0 (0.0%) | 0 (0.0%) |
| 25 to 34 Years | 15 (55.6%) | 27 (100.0%) |
| 35 to 44 Years | 0 (0.0%) | 25 (100.0%) |
| 45 to 54 Years | 0 (0.0%) | 14 (100.0%) |
| 55 to 64 Years | 0 (0.0%) | 14 (100.0%) |
| 65 to 74 Years | 11 (100.0%) | 0 (0.0%) |
| 75 Years and over | 0 (0.0%) | 0 (0.0%) |
| Total | 132 (67.0%) | 114 (57.9%) |
Disability Status by Sex by Age in Los Fresnos
| Age Bracket | Male | Female |
| Under 5 Years | 0 (0.0%) | 0 (0.0%) |
| 5 to 17 Years | 0 (0.0%) | 0 (0.0%) |
| 18 to 34 Years | 0 (0.0%) | 0 (0.0%) |
| 35 to 64 Years | 0 (0.0%) | 0 (0.0%) |
| 65 to 74 Years | 0 (0.0%) | 0 (0.0%) |
| 75 Years and over | 0 (0.0%) | 0 (0.0%) |
Disability Class by Sex by Age in Los Fresnos
Disability Class: Hearing Difficulty
| Age Bracket | Male | Female |
| Under 5 Years | 0 (0.0%) | 0 (0.0%) |
| 5 to 17 Years | 0 (0.0%) | 0 (0.0%) |
| 18 to 34 Years | 0 (0.0%) | 0 (0.0%) |
| 35 to 64 Years | 0 (0.0%) | 0 (0.0%) |
| 65 to 74 Years | 0 (0.0%) | 0 (0.0%) |
| 75 Years and over | 0 (0.0%) | 0 (0.0%) |
Disability Class: Vision Difficulty
| Age Bracket | Male | Female |
| Under 5 Years | 0 (0.0%) | 0 (0.0%) |
| 5 to 17 Years | 0 (0.0%) | 0 (0.0%) |
| 18 to 34 Years | 0 (0.0%) | 0 (0.0%) |
| 35 to 64 Years | 0 (0.0%) | 0 (0.0%) |
| 65 to 74 Years | 0 (0.0%) | 0 (0.0%) |
| 75 Years and over | 0 (0.0%) | 0 (0.0%) |
Disability Class: Cognitive Difficulty

| Age Bracket | Male | Female |
| 5 to 17 Years | 0 (0.0%) | 0 (0.0%) |
| 18 to 34 Years | 0 (0.0%) | 0 (0.0%) |
| 35 to 64 Years | 0 (0.0%) | 0 (0.0%) |
| 65 to 74 Years | 0 (0.0%) | 0 (0.0%) |
| 75 Years and over | 0 (0.0%) | 0 (0.0%) |
Disability Class: Ambulatory Difficulty
| Age Bracket | Male | Female |
| 5 to 17 Years | 0 (0.0%) | 0 (0.0%) |
| 18 to 34 Years | 0 (0.0%) | 0 (0.0%) |
| 35 to 64 Years | 0 (0.0%) | 0 (0.0%) |
| 65 to 74 Years | 0 (0.0%) | 0 (0.0%) |
| 75 Years and over | 0 (0.0%) | 0 (0.0%) |
Disability Class: Self-Care Difficulty
| Age Bracket | Male | Female |
| 5 to 17 Years | 0 (0.0%) | 0 (0.0%) |
| 18 to 34 Years | 0 (0.0%) | 0 (0.0%) |
| 35 to 64 Years | 0 (0.0%) | 0 (0.0%) |
| 65 to 74 Years | 0 (0.0%) | 0 (0.0%) |
| 75 Years and over | 0 (0.0%) | 0 (0.0%) |
Technology Access in Los Fresnos
Computing Device Access in Los Fresnos
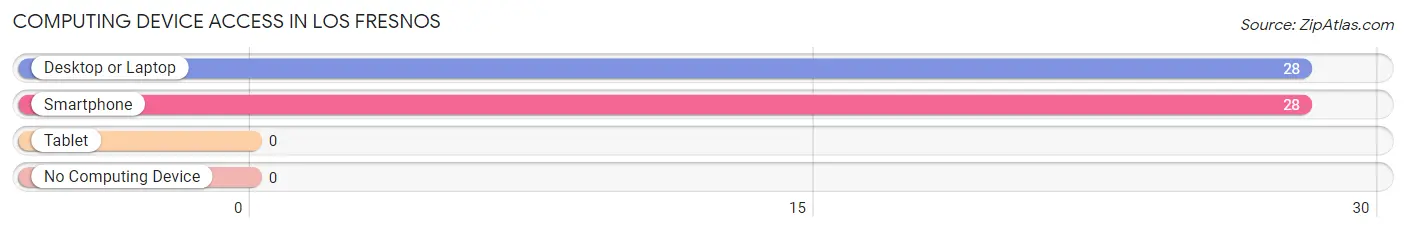
| Device Type | # Households | % Households |
| Desktop or Laptop | 28 | 100.0% |
| Smartphone | 28 | 100.0% |
| Tablet | 0 | 0.0% |
| No Computing Device | 0 | 0.0% |
| Total | 28 | 100.0% |
Internet Access in Los Fresnos
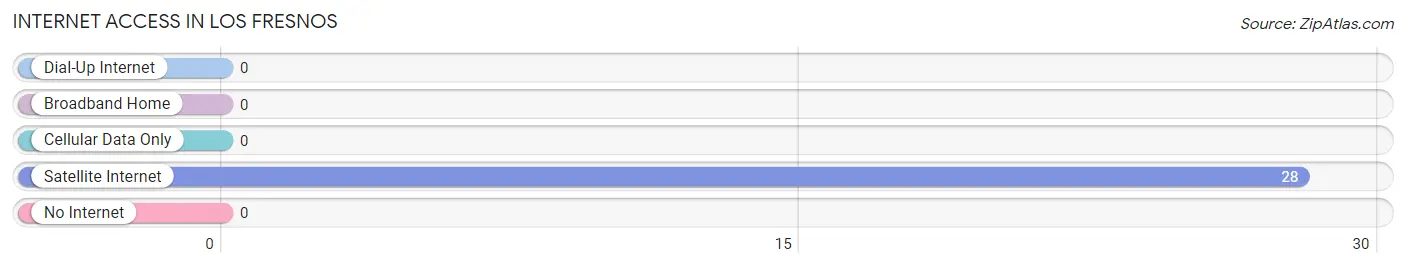
| Internet Type | # Households | % Households |
| Dial-Up Internet | 0 | 0.0% |
| Broadband Home | 0 | 0.0% |
| Cellular Data Only | 0 | 0.0% |
| Satellite Internet | 28 | 100.0% |
| No Internet | 0 | 0.0% |
| Total | 28 | 100.0% |
Los Fresnos Summary
History
The area now known as Los Fresnos, Texas was originally inhabited by the Karankawa Indians. The first European to explore the area was Spanish explorer Alonso de Leon in 1690. He named the area Los Fresnos, which translates to “the ash trees” in Spanish. The area was later settled by ranchers in the late 1800s. The first post office was established in 1891 and the town was officially incorporated in 1925.
Los Fresnos is located in Cameron County, Texas, and is part of the Brownsville-Harlingen Metropolitan Statistical Area. The city is situated on the banks of the Arroyo Colorado, a tributary of the Rio Grande. It is located about 30 miles south of Brownsville and about 20 miles north of South Padre Island.
Geography
Los Fresnos is located in Cameron County, Texas, and is part of the Brownsville-Harlingen Metropolitan Statistical Area. The city is situated on the banks of the Arroyo Colorado, a tributary of the Rio Grande. It is located about 30 miles south of Brownsville and about 20 miles north of South Padre Island.
The city has a total area of 4.2 square miles, all of which is land. The terrain is mostly flat with some rolling hills. The climate is subtropical with hot summers and mild winters. The average temperature is around 70 degrees Fahrenheit.
Economy
Los Fresnos is a small city with a population of about 8,000 people. The economy is largely based on agriculture and tourism. The city is home to several large farms and ranches, as well as a number of small businesses.
The city is also home to a number of tourist attractions, including the Los Fresnos Historical Museum, the Los Fresnos Wildlife Refuge, and the Los Fresnos State Park. The city is also home to a number of festivals and events throughout the year, including the Los Fresnos Rodeo and the Los Fresnos Fiesta.
Demographics
As of the 2010 census, the population of Los Fresnos was 8,092. The racial makeup of the city was 79.3% White, 0.7% African American, 0.3% Native American, 0.3% Asian, 0.1% Pacific Islander, 17.2% from other races, and 2.4% from two or more races. Hispanic or Latino of any race were 95.2% of the population.
The median household income in Los Fresnos was $30,938, and the median family income was $35,938. The per capita income was $14,945. About 24.2% of families and 28.2% of the population were below the poverty line, including 37.2% of those under age 18 and 16.2% of those age 65 or over.
The city is served by the Los Fresnos Consolidated Independent School District. The district has five elementary schools, two middle schools, and one high school. The city is also home to a number of private schools, including the Los Fresnos Christian Academy and the Los Fresnos Montessori School.
Common Questions
What is Per Capita Income in Los Fresnos?
Per Capita income in Los Fresnos is $18,801.
What is Income or Wage Gap in Los Fresnos?
Income or Wage Gap in Los Fresnos is 25.8%.
Women in Los Fresnos earn 74.2 cents for every dollar earned by a man.
What is Inequality or Gini Index in Los Fresnos?
Inequality or Gini Index in Los Fresnos is 0.21.
What is the Total Population of Los Fresnos?
Total Population of Los Fresnos is 197.
What is the Total Male Population of Los Fresnos?
Total Male Population of Los Fresnos is 133.
What is the Total Female Population of Los Fresnos?
Total Female Population of Los Fresnos is 64.
What is the Ratio of Males per 100 Females in Los Fresnos?
There are 207.81 Males per 100 Females in Los Fresnos.
What is the Ratio of Females per 100 Males in Los Fresnos?
There are 48.12 Females per 100 Males in Los Fresnos.
What is the Median Population Age in Los Fresnos?
Median Population Age in Los Fresnos is 18.4 Years.
What is the Average Family Size in Los Fresnos
Average Family Size in Los Fresnos is 7.0 People.
What is the Average Household Size in Los Fresnos
Average Household Size in Los Fresnos is 7.0 People.
How Large is the Labor Force in Los Fresnos?
There are 54 People in the Labor Forcein in Los Fresnos.
What is the Percentage of People in the Labor Force in Los Fresnos?
52.4% of People are in the Labor Force in Los Fresnos.