Loop, TX Map & Demographics
Loop Map
Loop Overview
$29,313
PER CAPITA INCOME
0.42
INEQUALITY / GINI INDEX
172
TOTAL POPULATION
99
MALE POPULATION
73
FEMALE POPULATION
135.62
MALES / 100 FEMALES
73.74
FEMALES / 100 MALES
56.8
MEDIAN AGE
3.0
AVG FAMILY SIZE
2.8
AVG HOUSEHOLD SIZE
68
LABOR FORCE [ PEOPLE ]
50.0%
PERCENT IN LABOR FORCE
Loop Zip Codes
Loop Area Codes
Income in Loop
Income Overview in Loop
| Characteristic | Number | Measure |
| Per Capita Income | 172 | $29,313 |
| Median Family Income | 51 | $0 |
| Mean Family Income | 51 | $76,835 |
| Median Household Income | 57 | $0 |
| Mean Household Income | 57 | $72,458 |
| Income Deficit | 51 | $0 |
| Wage / Income Gap (%) | 172 | 0.00% |
| Wage / Income Gap ($) | 172 | 100.00¢ per $1 |
| Gini / Inequality Index | 172 | 0.42 |
Earnings by Sex in Loop
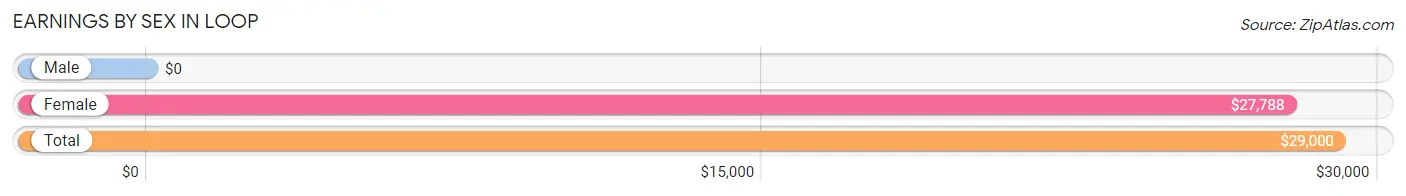
| Sex | Number | Average Earnings |
| Male | 45 (66.2%) | $0 |
| Female | 23 (33.8%) | $27,788 |
| Total | 68 (100.0%) | $29,000 |
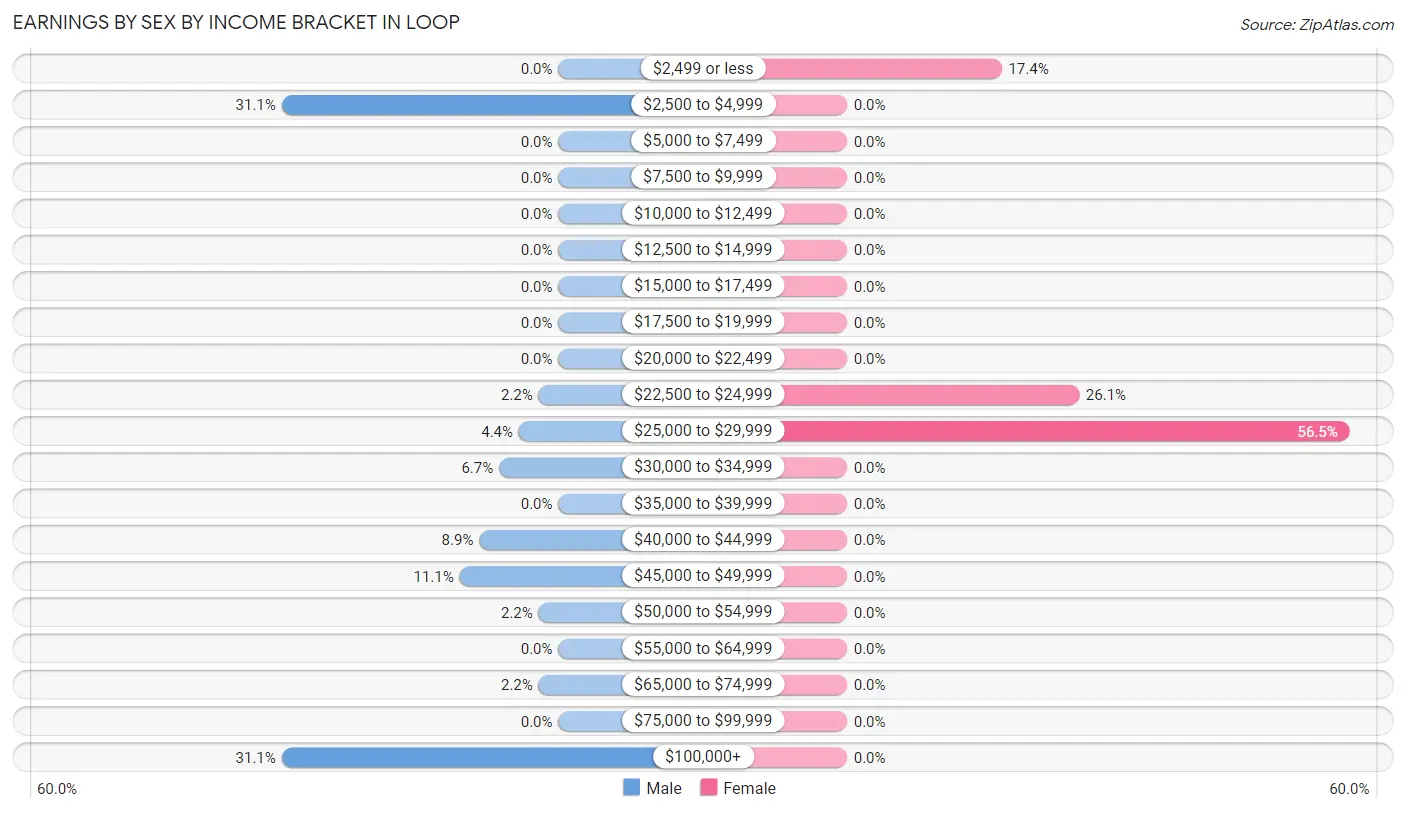
Earnings by Sex by Income Bracket in Loop
The most common earnings brackets in Loop are $2,500 to $4,999 for men (14 | 31.1%) and $25,000 to $29,999 for women (13 | 56.5%).
| Income | Male | Female |
| $2,499 or less | 0 (0.0%) | 4 (17.4%) |
| $2,500 to $4,999 | 14 (31.1%) | 0 (0.0%) |
| $5,000 to $7,499 | 0 (0.0%) | 0 (0.0%) |
| $7,500 to $9,999 | 0 (0.0%) | 0 (0.0%) |
| $10,000 to $12,499 | 0 (0.0%) | 0 (0.0%) |
| $12,500 to $14,999 | 0 (0.0%) | 0 (0.0%) |
| $15,000 to $17,499 | 0 (0.0%) | 0 (0.0%) |
| $17,500 to $19,999 | 0 (0.0%) | 0 (0.0%) |
| $20,000 to $22,499 | 0 (0.0%) | 0 (0.0%) |
| $22,500 to $24,999 | 1 (2.2%) | 6 (26.1%) |
| $25,000 to $29,999 | 2 (4.4%) | 13 (56.5%) |
| $30,000 to $34,999 | 3 (6.7%) | 0 (0.0%) |
| $35,000 to $39,999 | 0 (0.0%) | 0 (0.0%) |
| $40,000 to $44,999 | 4 (8.9%) | 0 (0.0%) |
| $45,000 to $49,999 | 5 (11.1%) | 0 (0.0%) |
| $50,000 to $54,999 | 1 (2.2%) | 0 (0.0%) |
| $55,000 to $64,999 | 0 (0.0%) | 0 (0.0%) |
| $65,000 to $74,999 | 1 (2.2%) | 0 (0.0%) |
| $75,000 to $99,999 | 0 (0.0%) | 0 (0.0%) |
| $100,000+ | 14 (31.1%) | 0 (0.0%) |
| Total | 45 (100.0%) | 23 (100.0%) |
Earnings by Sex by Educational Attainment in Loop
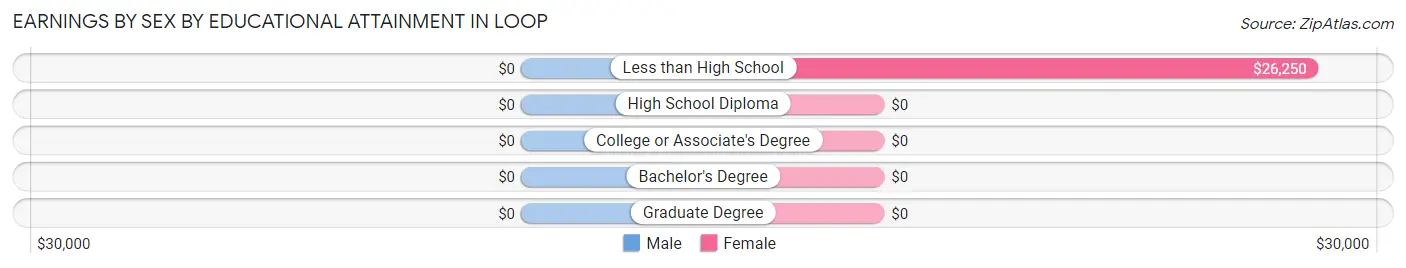
| Educational Attainment | Male Income | Female Income |
| Less than High School | - | - |
| High School Diploma | - | - |
| College or Associate's Degree | - | - |
| Bachelor's Degree | - | - |
| Graduate Degree | - | - |
| Total | - | - |
Family Income in Loop
Family Income Brackets in Loop
According to the Loop family income data, there are 14 families falling into the $25,000 to $34,999 income range, which is the most common income bracket and makes up 27.5% of all families.
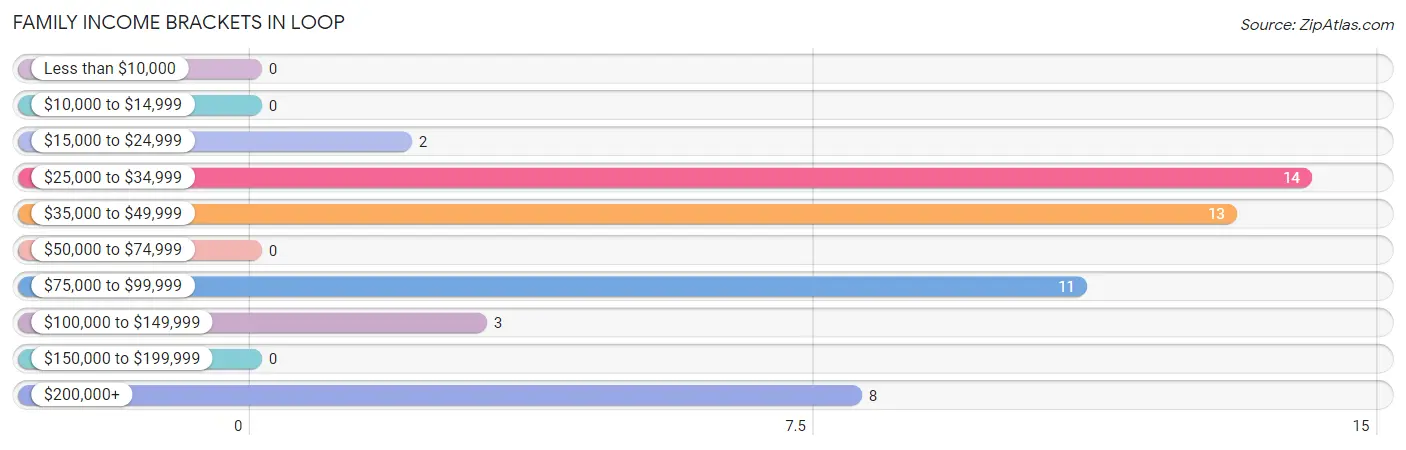
| Income Bracket | # Families | % Families |
| Less than $10,000 | 0 | 0.0% |
| $10,000 to $14,999 | 0 | 0.0% |
| $15,000 to $24,999 | 2 | 3.9% |
| $25,000 to $34,999 | 14 | 27.5% |
| $35,000 to $49,999 | 13 | 25.5% |
| $50,000 to $74,999 | 0 | 0.0% |
| $75,000 to $99,999 | 11 | 21.6% |
| $100,000 to $149,999 | 3 | 5.9% |
| $150,000 to $199,999 | 0 | 0.0% |
| $200,000+ | 8 | 15.7% |
Family Income by Famaliy Size in Loop
3-person families (12 | 23.5%) account for the highest median family income in Loop with $98,500 per family, while 3-person families (12 | 23.5%) have the highest median income of $32,833 per family member.
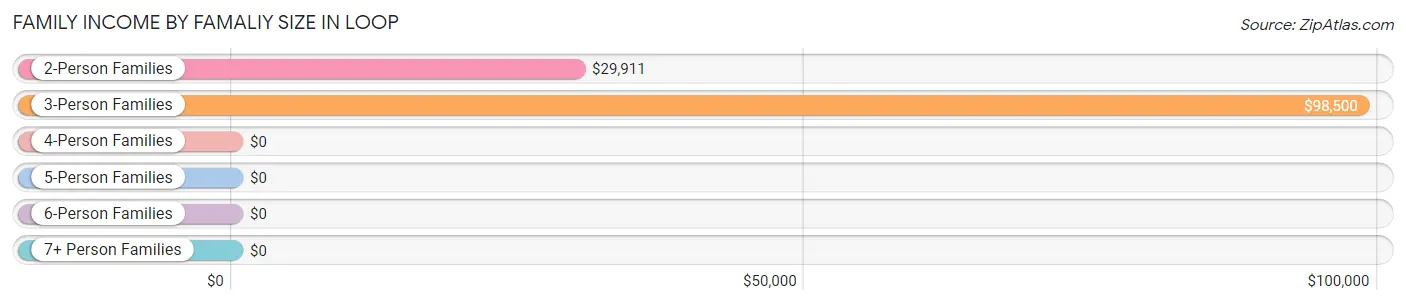
| Income Bracket | # Families | Median Income |
| 2-Person Families | 31 (60.8%) | $29,911 |
| 3-Person Families | 12 (23.5%) | $98,500 |
| 4-Person Families | 0 (0.0%) | $0 |
| 5-Person Families | 8 (15.7%) | $0 |
| 6-Person Families | 0 (0.0%) | $0 |
| 7+ Person Families | 0 (0.0%) | $0 |
| Total | 51 (100.0%) | $0 |
Family Income by Number of Earners in Loop
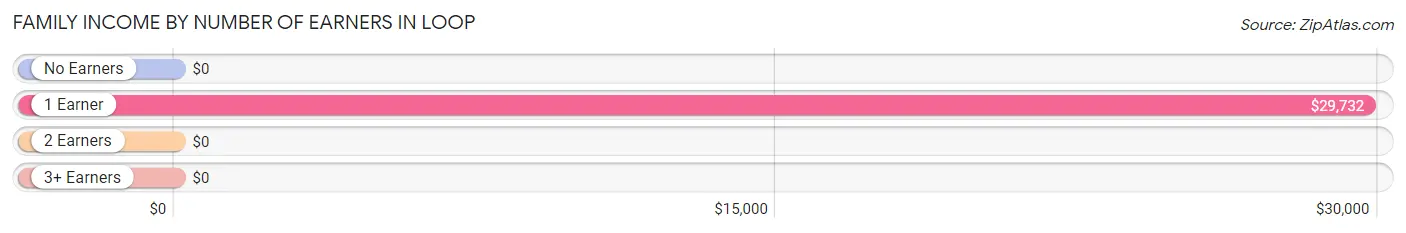
| Number of Earners | # Families | Median Income |
| No Earners | 13 (25.5%) | $0 |
| 1 Earner | 25 (49.0%) | $29,732 |
| 2 Earners | 8 (15.7%) | $0 |
| 3+ Earners | 5 (9.8%) | $0 |
| Total | 51 (100.0%) | $0 |
Household Income in Loop
Household Income Brackets in Loop
With 17 households falling in the category, the $35,000 to $49,999 income range is the most frequent in Loop, accounting for 29.8% of all households.
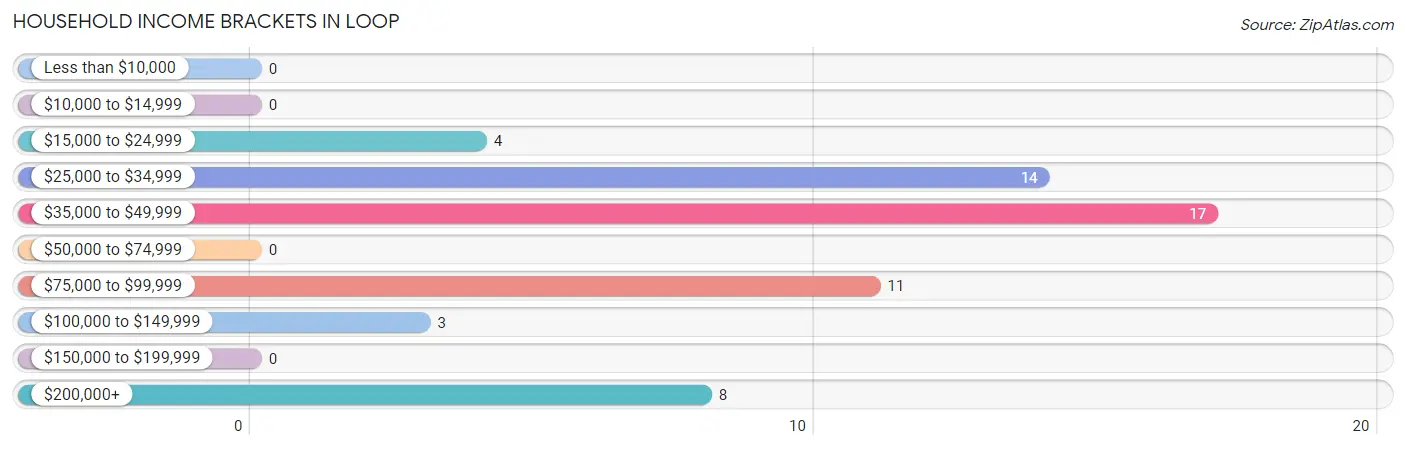
| Income Bracket | # Households | % Households |
| Less than $10,000 | 0 | 0.0% |
| $10,000 to $14,999 | 0 | 0.0% |
| $15,000 to $24,999 | 4 | 7.0% |
| $25,000 to $34,999 | 14 | 24.6% |
| $35,000 to $49,999 | 17 | 29.8% |
| $50,000 to $74,999 | 0 | 0.0% |
| $75,000 to $99,999 | 11 | 19.3% |
| $100,000 to $149,999 | 3 | 5.3% |
| $150,000 to $199,999 | 0 | 0.0% |
| $200,000+ | 8 | 14.0% |
Household Income by Householder Age in Loop
The median household income in Loop is $0, with the highest median household income of $29,911 found in the 65+ years age bracket for the primary householder. A total of 31 households (54.4%) fall into this category. Meanwhile, the 15 to 24 years age bracket for the primary householder has the lowest median household income of $0, with 4 households (7.0%) in this group.
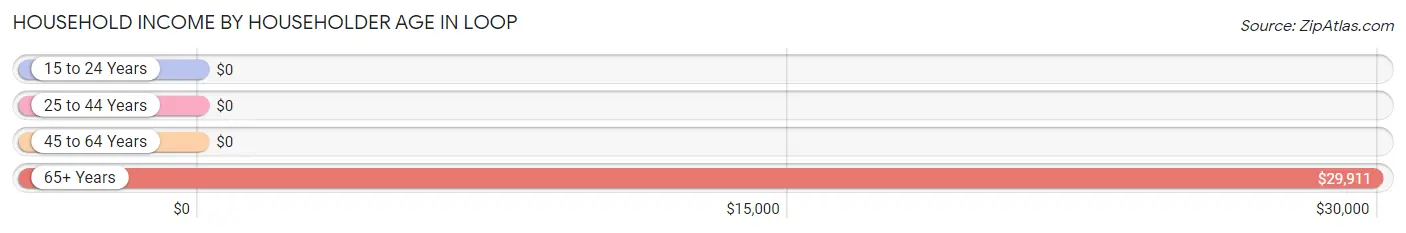
| Income Bracket | # Households | Median Income |
| 15 to 24 Years | 4 (7.0%) | $0 |
| 25 to 44 Years | 8 (14.0%) | $0 |
| 45 to 64 Years | 14 (24.6%) | $0 |
| 65+ Years | 31 (54.4%) | $29,911 |
| Total | 57 (100.0%) | $0 |
Poverty in Loop
Income Below Poverty by Sex and Age in Loop
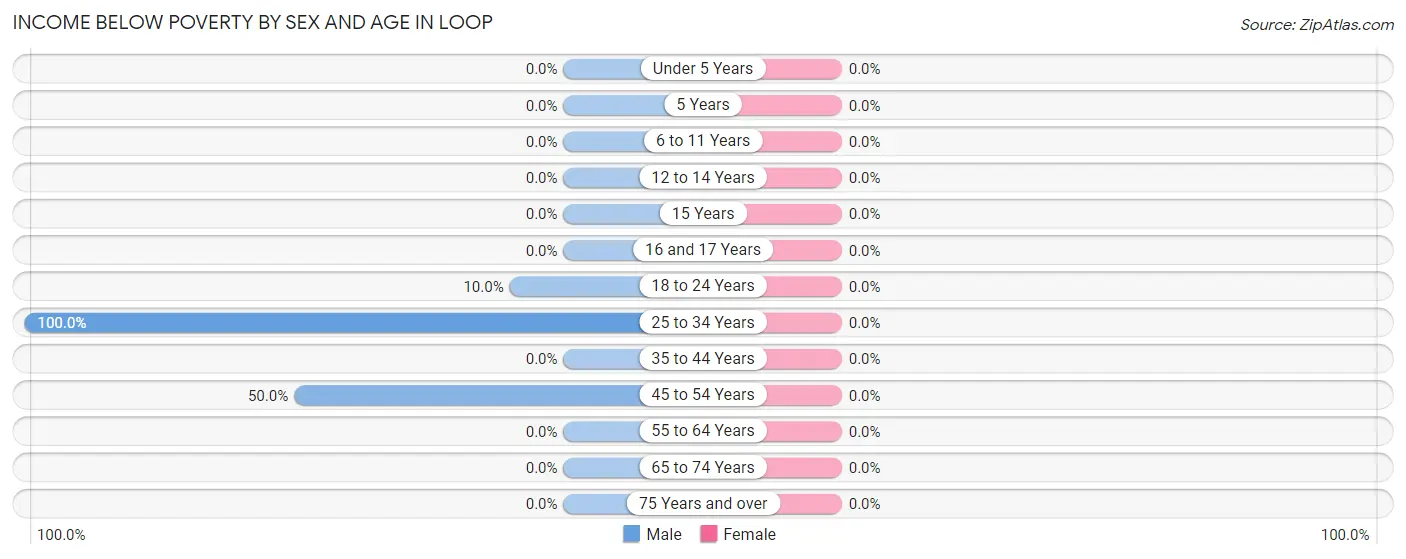
| Age Bracket | Male | Female |
| Under 5 Years | 0 (0.0%) | 0 (0.0%) |
| 5 Years | 0 (0.0%) | 0 (0.0%) |
| 6 to 11 Years | 0 (0.0%) | 0 (0.0%) |
| 12 to 14 Years | 0 (0.0%) | 0 (0.0%) |
| 15 Years | 0 (0.0%) | 0 (0.0%) |
| 16 and 17 Years | 0 (0.0%) | 0 (0.0%) |
| 18 to 24 Years | 1 (10.0%) | 0 (0.0%) |
| 25 to 34 Years | 1 (100.0%) | 0 (0.0%) |
| 35 to 44 Years | 0 (0.0%) | 0 (0.0%) |
| 45 to 54 Years | 1 (50.0%) | 0 (0.0%) |
| 55 to 64 Years | 0 (0.0%) | 0 (0.0%) |
| 65 to 74 Years | 0 (0.0%) | 0 (0.0%) |
| 75 Years and over | 0 (0.0%) | 0 (0.0%) |
| Total | 3 (3.0%) | 0 (0.0%) |
Income Above Poverty by Sex and Age in Loop
According to the poverty statistics in Loop, males aged 6 to 11 years and females aged 15 years are the age groups that are most secure financially, with 100.0% of males and 100.0% of females in these age groups living above the poverty line.
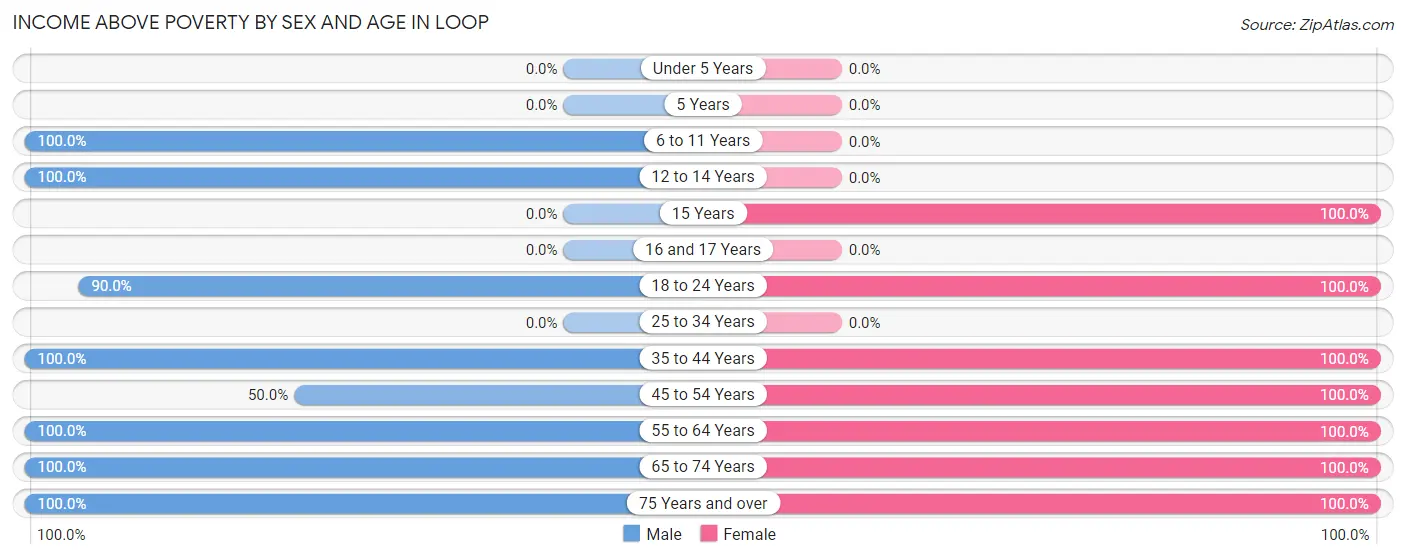
| Age Bracket | Male | Female |
| Under 5 Years | 0 (0.0%) | 0 (0.0%) |
| 5 Years | 0 (0.0%) | 0 (0.0%) |
| 6 to 11 Years | 21 (100.0%) | 0 (0.0%) |
| 12 to 14 Years | 8 (100.0%) | 0 (0.0%) |
| 15 Years | 0 (0.0%) | 7 (100.0%) |
| 16 and 17 Years | 0 (0.0%) | 0 (0.0%) |
| 18 to 24 Years | 9 (90.0%) | 2 (100.0%) |
| 25 to 34 Years | 0 (0.0%) | 0 (0.0%) |
| 35 to 44 Years | 15 (100.0%) | 8 (100.0%) |
| 45 to 54 Years | 1 (50.0%) | 5 (100.0%) |
| 55 to 64 Years | 10 (100.0%) | 13 (100.0%) |
| 65 to 74 Years | 5 (100.0%) | 26 (100.0%) |
| 75 Years and over | 27 (100.0%) | 12 (100.0%) |
| Total | 96 (97.0%) | 73 (100.0%) |
Income Below Poverty Among Married-Couple Families in Loop
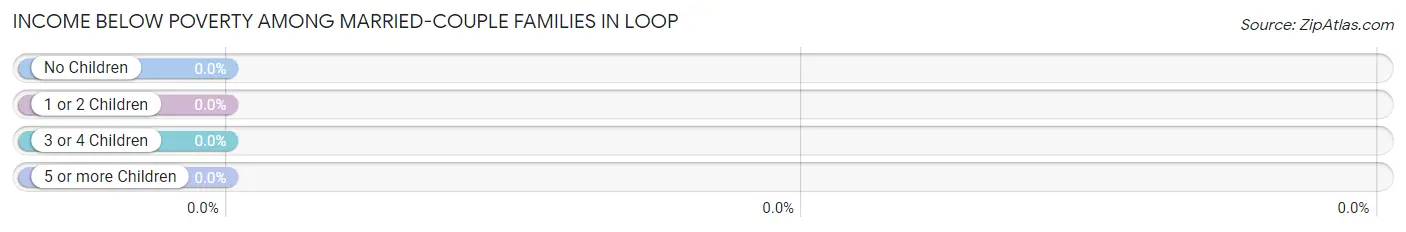
| Children | Above Poverty | Below Poverty |
| No Children | 36 (100.0%) | 0 (0.0%) |
| 1 or 2 Children | 3 (100.0%) | 0 (0.0%) |
| 3 or 4 Children | 8 (100.0%) | 0 (0.0%) |
| 5 or more Children | 0 (0.0%) | 0 (0.0%) |
| Total | 47 (100.0%) | 0 (0.0%) |
Income Below Poverty Among Single-Parent Households in Loop
| Children | Single Father | Single Mother |
| No Children | 0 (0.0%) | 0 (0.0%) |
| 1 or 2 Children | 0 (0.0%) | 0 (0.0%) |
| 3 or 4 Children | 0 (0.0%) | 0 (0.0%) |
| 5 or more Children | 0 (0.0%) | 0 (0.0%) |
| Total | 0 (0.0%) | 0 (0.0%) |
Income Below Poverty Among Married-Couple vs Single-Parent Households in Loop
| Children | Married-Couple Families | Single-Parent Households |
| No Children | 0 (0.0%) | 0 (0.0%) |
| 1 or 2 Children | 0 (0.0%) | 0 (0.0%) |
| 3 or 4 Children | 0 (0.0%) | 0 (0.0%) |
| 5 or more Children | 0 (0.0%) | 0 (0.0%) |
| Total | 0 (0.0%) | 0 (0.0%) |
Race in Loop
The most populous races in Loop are White / Caucasian (126 | 73.3%), Hispanic or Latino (110 | 63.9%), and Some other Race (37 | 21.5%).
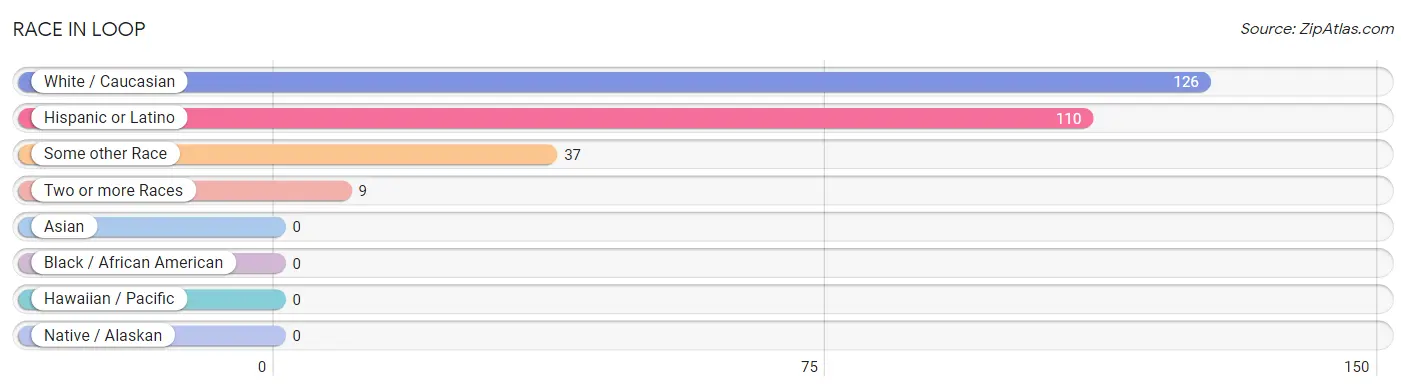
| Race | # Population | % Population |
| Asian | 0 | 0.0% |
| Black / African American | 0 | 0.0% |
| Hawaiian / Pacific | 0 | 0.0% |
| Hispanic or Latino | 110 | 63.9% |
| Native / Alaskan | 0 | 0.0% |
| White / Caucasian | 126 | 73.3% |
| Two or more Races | 9 | 5.2% |
| Some other Race | 37 | 21.5% |
| Total | 172 | 100.0% |
Ancestry in Loop
The most populous ancestries reported in Loop are Mexican (106 | 61.6%), American (37 | 21.5%), Irish (18 | 10.5%), English (9 | 5.2%), and Italian (4 | 2.3%), together accounting for 101.2% of all Loop residents.
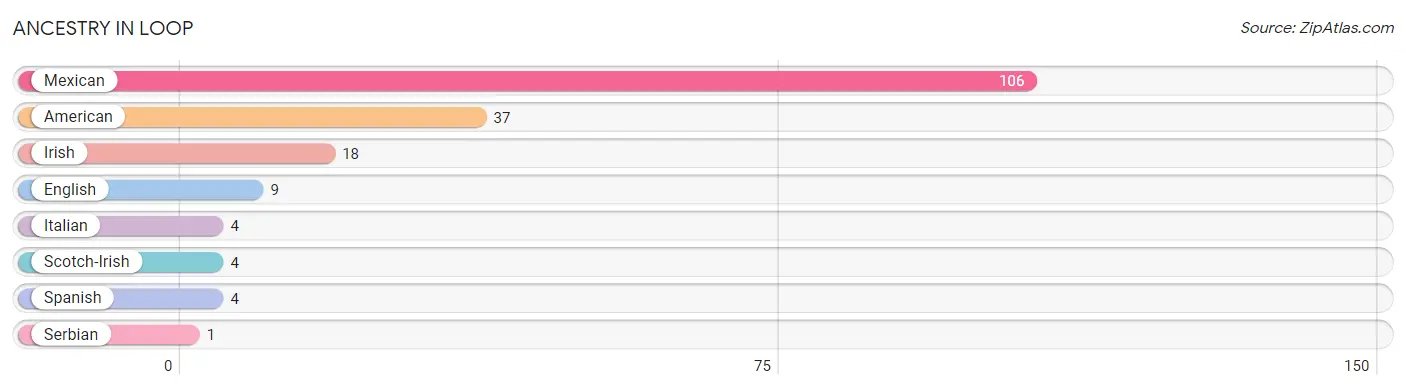
| Ancestry | # Population | % Population |
| American | 37 | 21.5% |
| English | 9 | 5.2% |
| Irish | 18 | 10.5% |
| Italian | 4 | 2.3% |
| Mexican | 106 | 61.6% |
| Scotch-Irish | 4 | 2.3% |
| Serbian | 1 | 0.6% |
| Spanish | 4 | 2.3% | View All 8 Rows |
Immigrants in Loop
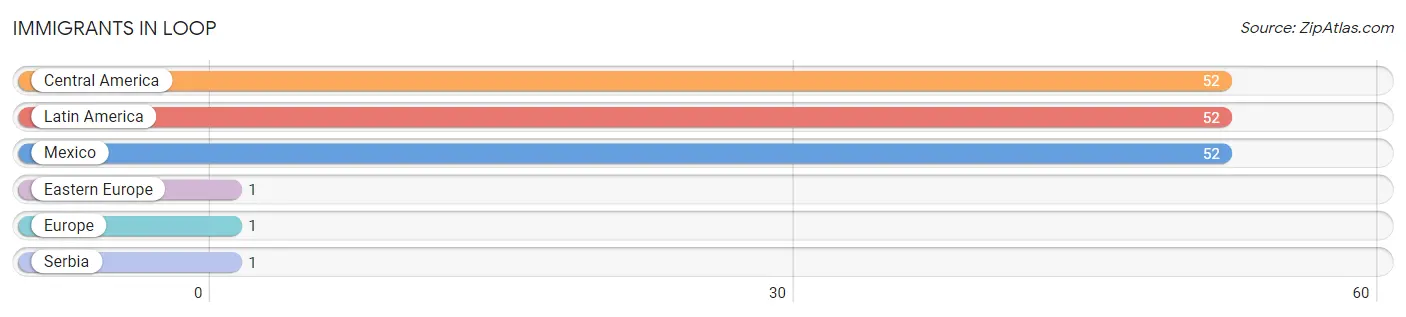
The most numerous immigrant groups reported in Loop came from Central America (52 | 30.2%), Latin America (52 | 30.2%), Mexico (52 | 30.2%), Eastern Europe (1 | 0.6%), and Europe (1 | 0.6%), together accounting for 91.9% of all Loop residents.
| Immigration Origin | # Population | % Population |
| Central America | 52 | 30.2% |
| Eastern Europe | 1 | 0.6% |
| Europe | 1 | 0.6% |
| Latin America | 52 | 30.2% |
| Mexico | 52 | 30.2% |
| Serbia | 1 | 0.6% | View All 6 Rows |
Sex and Age in Loop
Sex and Age in Loop
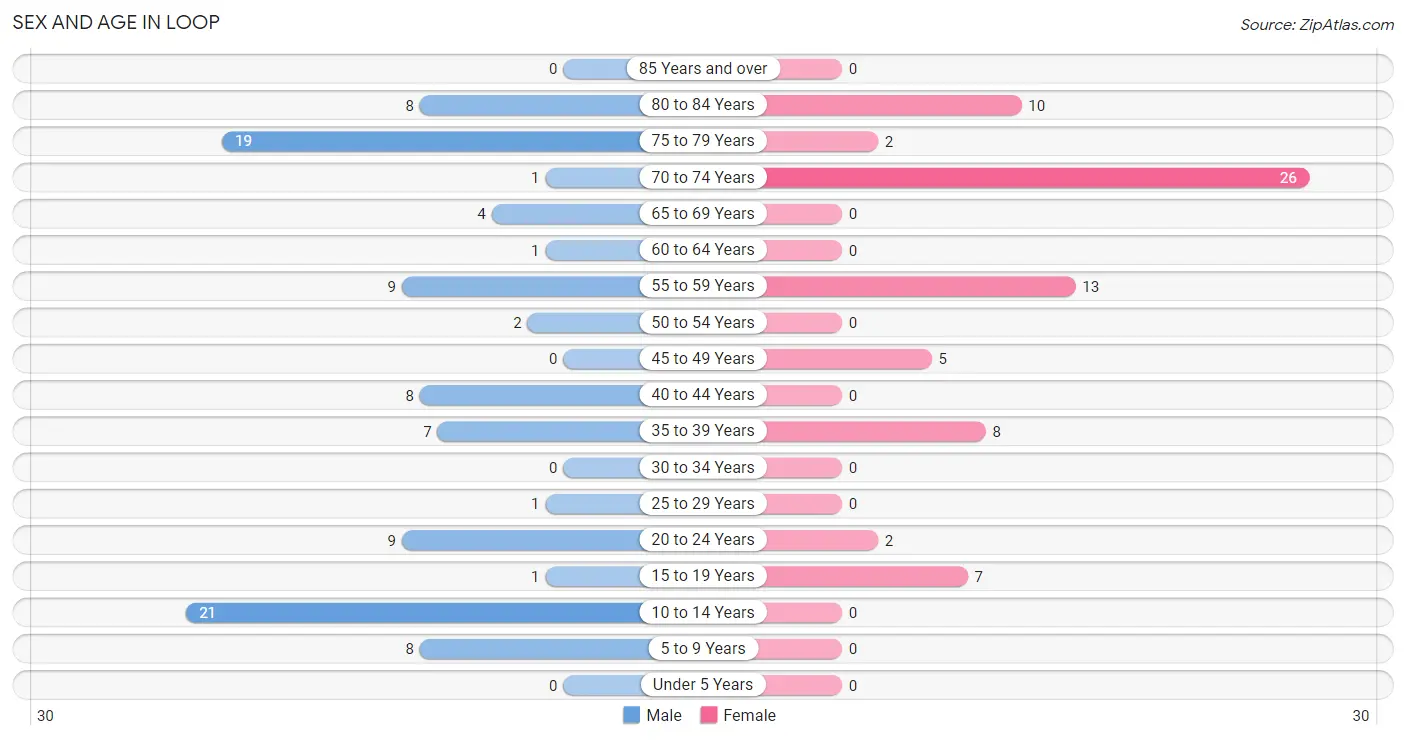
The most populous age groups in Loop are 10 to 14 Years (21 | 21.2%) for men and 70 to 74 Years (26 | 35.6%) for women.
| Age Bracket | Male | Female |
| Under 5 Years | 0 (0.0%) | 0 (0.0%) |
| 5 to 9 Years | 8 (8.1%) | 0 (0.0%) |
| 10 to 14 Years | 21 (21.2%) | 0 (0.0%) |
| 15 to 19 Years | 1 (1.0%) | 7 (9.6%) |
| 20 to 24 Years | 9 (9.1%) | 2 (2.7%) |
| 25 to 29 Years | 1 (1.0%) | 0 (0.0%) |
| 30 to 34 Years | 0 (0.0%) | 0 (0.0%) |
| 35 to 39 Years | 7 (7.1%) | 8 (11.0%) |
| 40 to 44 Years | 8 (8.1%) | 0 (0.0%) |
| 45 to 49 Years | 0 (0.0%) | 5 (6.9%) |
| 50 to 54 Years | 2 (2.0%) | 0 (0.0%) |
| 55 to 59 Years | 9 (9.1%) | 13 (17.8%) |
| 60 to 64 Years | 1 (1.0%) | 0 (0.0%) |
| 65 to 69 Years | 4 (4.0%) | 0 (0.0%) |
| 70 to 74 Years | 1 (1.0%) | 26 (35.6%) |
| 75 to 79 Years | 19 (19.2%) | 2 (2.7%) |
| 80 to 84 Years | 8 (8.1%) | 10 (13.7%) |
| 85 Years and over | 0 (0.0%) | 0 (0.0%) |
| Total | 99 (100.0%) | 73 (100.0%) |
Families and Households in Loop
Median Family Size in Loop
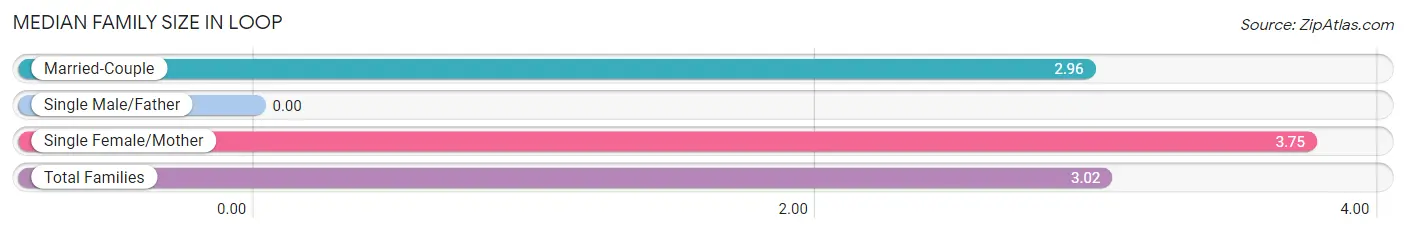
| Family Type | # Families | Family Size |
| Married-Couple | 47 (92.2%) | 2.96 |
| Single Male/Father | 0 (0.0%) | - |
| Single Female/Mother | 4 (7.8%) | 3.75 |
| Total Families | 51 (100.0%) | 3.02 |
Median Household Size in Loop
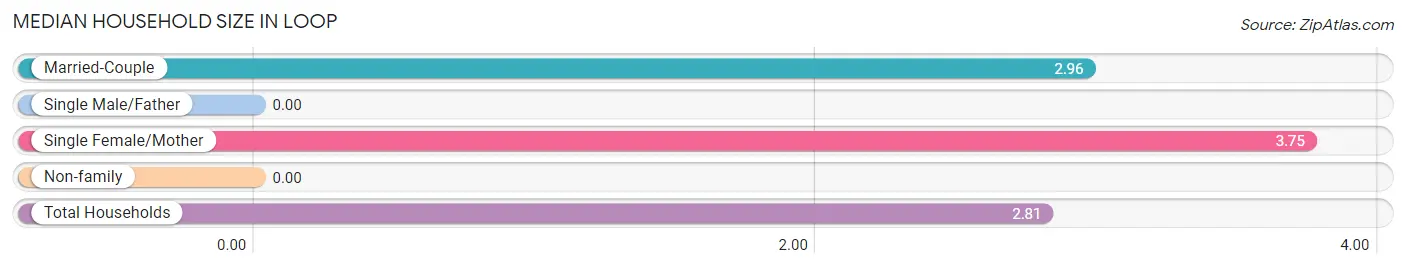
| Household Type | # Households | Household Size |
| Married-Couple | 47 (82.5%) | 2.96 |
| Single Male/Father | 0 (0.0%) | - |
| Single Female/Mother | 4 (7.0%) | 3.75 |
| Non-family | 6 (10.5%) | - |
| Total Households | 57 (100.0%) | 2.81 |
Household Size by Marriage Status in Loop
Out of a total of 57 households in Loop, 51 (89.5%) are family households, while 6 (10.5%) are nonfamily households. The most numerous type of family households are 2-person households, comprising 31, and the most common type of nonfamily households are 1-person households, comprising 6.
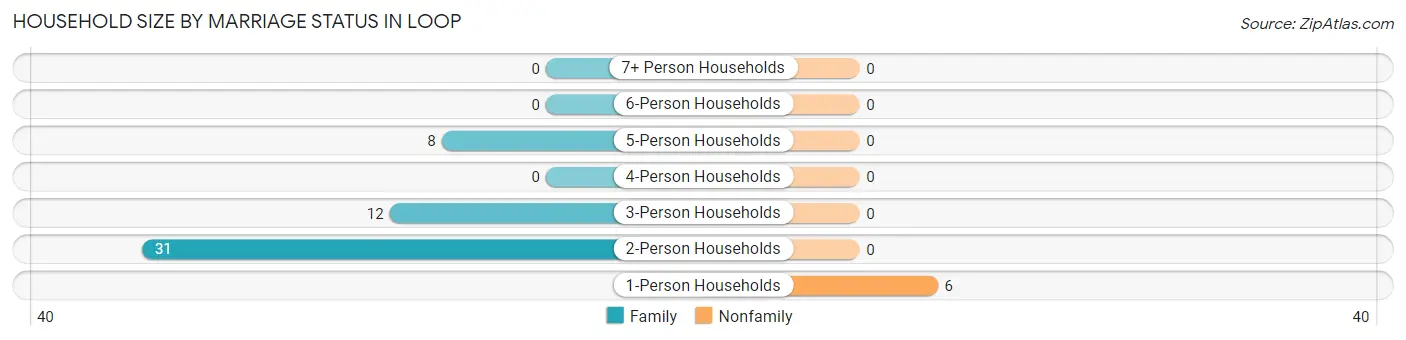
| Household Size | Family Households | Nonfamily Households |
| 1-Person Households | - | 6 (10.5%) |
| 2-Person Households | 31 (54.4%) | 0 (0.0%) |
| 3-Person Households | 12 (21.0%) | 0 (0.0%) |
| 4-Person Households | 0 (0.0%) | 0 (0.0%) |
| 5-Person Households | 8 (14.0%) | 0 (0.0%) |
| 6-Person Households | 0 (0.0%) | 0 (0.0%) |
| 7+ Person Households | 0 (0.0%) | 0 (0.0%) |
| Total | 51 (89.5%) | 6 (10.5%) |
Female Fertility in Loop
Fertility by Age in Loop
| Age Bracket | Women with Births | Births / 1,000 Women |
| 15 to 19 years | 0 (0.0%) | 0.0 |
| 20 to 34 years | 0 (0.0%) | 0.0 |
| 35 to 50 years | 0 (0.0%) | 0.0 |
| Total | 0 (0.0%) | 0.0 |
Fertility by Age by Marriage Status in Loop
| Age Bracket | Married | Unmarried |
| 15 to 19 years | 0 (0.0%) | 0 (0.0%) |
| 20 to 34 years | 0 (0.0%) | 0 (0.0%) |
| 35 to 50 years | 0 (0.0%) | 0 (0.0%) |
| Total | 0 (0.0%) | 0 (0.0%) |
Fertility by Education in Loop
| Educational Attainment | Women with Births | Births / 1,000 Women |
| Less than High School | 0 (0.0%) | 0.0 |
| High School Diploma | 0 (0.0%) | 0.0 |
| College or Associate's Degree | 0 (0.0%) | 0.0 |
| Bachelor's Degree | 0 (0.0%) | 0.0 |
| Graduate Degree | 0 (0.0%) | 0.0 |
| Total | 0 (0.0%) | 0.0 |
Fertility by Education by Marriage Status in Loop
| Educational Attainment | Married | Unmarried |
| Less than High School | 0 (0.0%) | 0 (0.0%) |
| High School Diploma | 0 (0.0%) | 0 (0.0%) |
| College or Associate's Degree | 0 (0.0%) | 0 (0.0%) |
| Bachelor's Degree | 0 (0.0%) | 0 (0.0%) |
| Graduate Degree | 0 (0.0%) | 0 (0.0%) |
| Total | 0 (0.0%) | 0 (0.0%) |
Employment Characteristics in Loop
Employment by Class of Employer in Loop
Among the 67 employed individuals in Loop, private company employees (26 | 38.8%), not-for-profit organizations (24 | 35.8%), and local government employees (9 | 13.4%) make up the most common classes of employment.
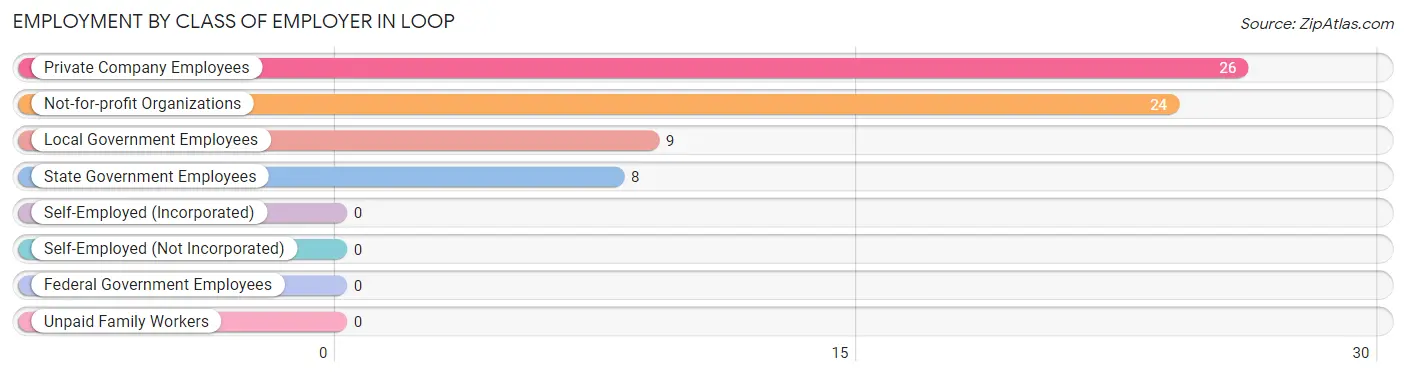
| Employer Class | # Employees | % Employees |
| Private Company Employees | 26 | 38.8% |
| Self-Employed (Incorporated) | 0 | 0.0% |
| Self-Employed (Not Incorporated) | 0 | 0.0% |
| Not-for-profit Organizations | 24 | 35.8% |
| Local Government Employees | 9 | 13.4% |
| State Government Employees | 8 | 11.9% |
| Federal Government Employees | 0 | 0.0% |
| Unpaid Family Workers | 0 | 0.0% |
| Total | 67 | 100.0% |
Employment Status by Age in Loop
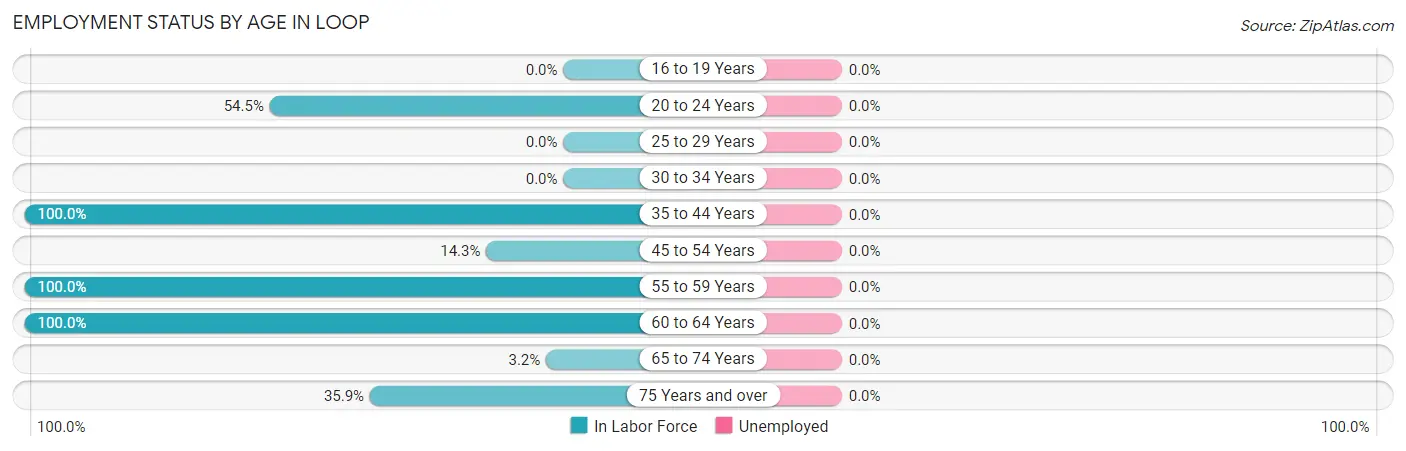
| Age Bracket | In Labor Force | Unemployed |
| 16 to 19 Years | 0 (0.0%) | 0 (0.0%) |
| 20 to 24 Years | 6 (54.5%) | 0 (0.0%) |
| 25 to 29 Years | 0 (0.0%) | 0 (0.0%) |
| 30 to 34 Years | 0 (0.0%) | 0 (0.0%) |
| 35 to 44 Years | 23 (100.0%) | 0 (0.0%) |
| 45 to 54 Years | 1 (14.3%) | 0 (0.0%) |
| 55 to 59 Years | 22 (100.0%) | 0 (0.0%) |
| 60 to 64 Years | 1 (100.0%) | 0 (0.0%) |
| 65 to 74 Years | 1 (3.2%) | 0 (0.0%) |
| 75 Years and over | 14 (35.9%) | 0 (0.0%) |
| Total | 68 (50.0%) | 0 (0.0%) |
Employment Status by Educational Attainment in Loop
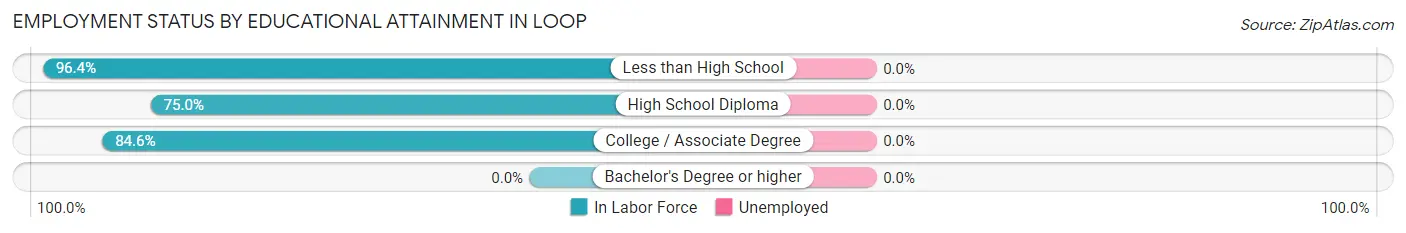
| Educational Attainment | In Labor Force | Unemployed |
| Less than High School | 27 (96.4%) | 0 (0.0%) |
| High School Diploma | 9 (75.0%) | 0 (0.0%) |
| College / Associate Degree | 11 (84.6%) | 0 (0.0%) |
| Bachelor's Degree or higher | 0 (0.0%) | 0 (0.0%) |
| Total | 47 (87.0%) | 0 (0.0%) |
Employment Occupations by Sex in Loop
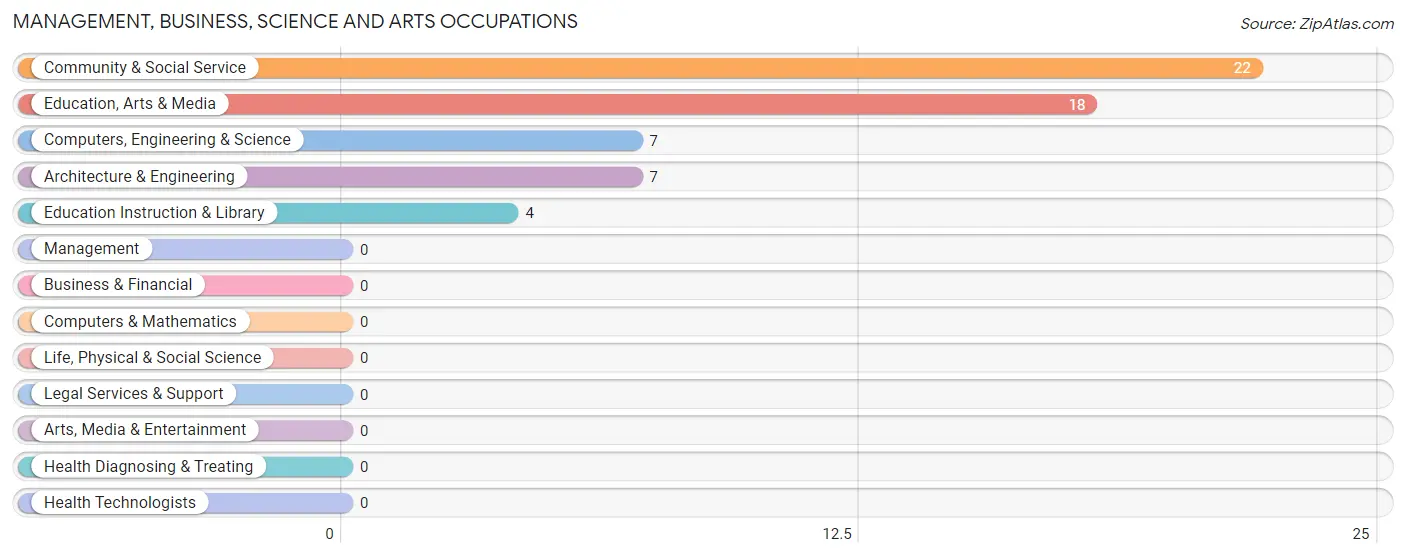
Management, Business, Science and Arts Occupations
The most common Management, Business, Science and Arts occupations in Loop are Community & Social Service (22 | 32.4%), Education, Arts & Media (18 | 26.5%), Computers, Engineering & Science (7 | 10.3%), Architecture & Engineering (7 | 10.3%), and Education Instruction & Library (4 | 5.9%).
Management, Business, Science and Arts Occupations by Sex
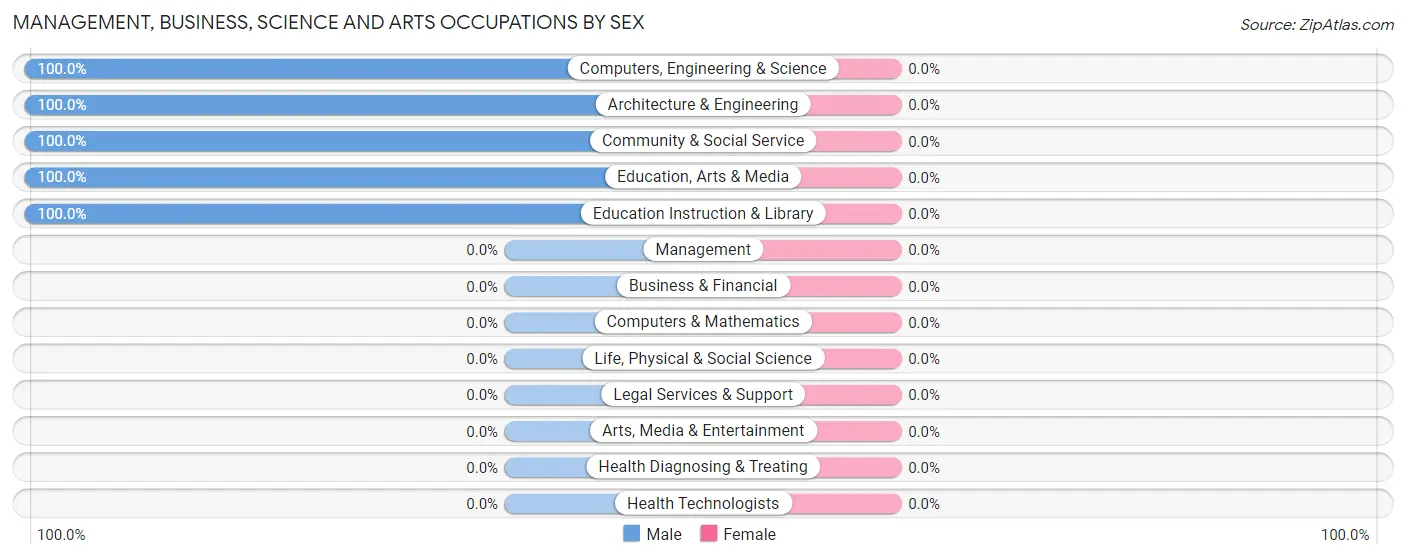
| Occupation | Male | Female |
| Management | 0 (0.0%) | 0 (0.0%) |
| Business & Financial | 0 (0.0%) | 0 (0.0%) |
| Computers, Engineering & Science | 7 (100.0%) | 0 (0.0%) |
| Computers & Mathematics | 0 (0.0%) | 0 (0.0%) |
| Architecture & Engineering | 7 (100.0%) | 0 (0.0%) |
| Life, Physical & Social Science | 0 (0.0%) | 0 (0.0%) |
| Community & Social Service | 22 (100.0%) | 0 (0.0%) |
| Education, Arts & Media | 18 (100.0%) | 0 (0.0%) |
| Legal Services & Support | 0 (0.0%) | 0 (0.0%) |
| Education Instruction & Library | 4 (100.0%) | 0 (0.0%) |
| Arts, Media & Entertainment | 0 (0.0%) | 0 (0.0%) |
| Health Diagnosing & Treating | 0 (0.0%) | 0 (0.0%) |
| Health Technologists | 0 (0.0%) | 0 (0.0%) |
| Total (Category) | 29 (100.0%) | 0 (0.0%) |
| Total (Overall) | 45 (66.2%) | 23 (33.8%) |
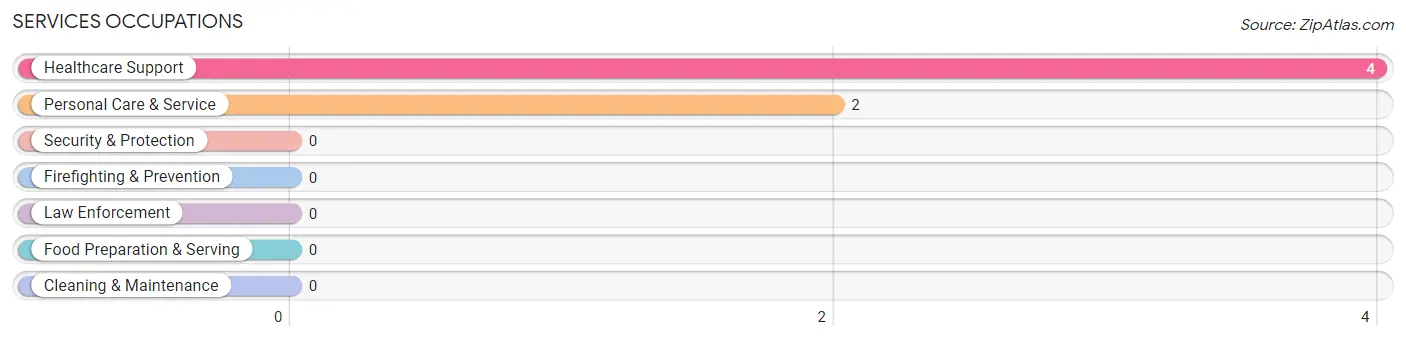
Services Occupations
The most common Services occupations in Loop are Healthcare Support (4 | 5.9%), and Personal Care & Service (2 | 2.9%).
Services Occupations by Sex
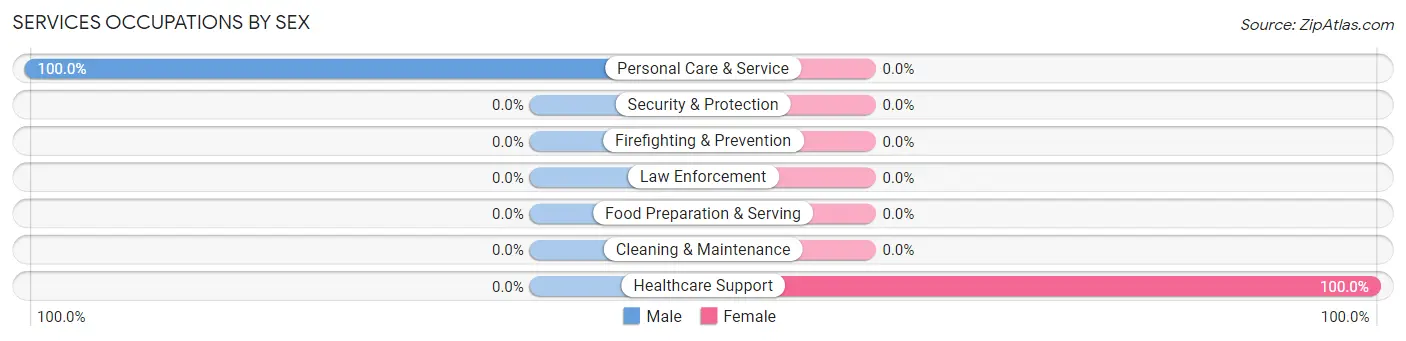
| Occupation | Male | Female |
| Healthcare Support | 0 (0.0%) | 4 (100.0%) |
| Security & Protection | 0 (0.0%) | 0 (0.0%) |
| Firefighting & Prevention | 0 (0.0%) | 0 (0.0%) |
| Law Enforcement | 0 (0.0%) | 0 (0.0%) |
| Food Preparation & Serving | 0 (0.0%) | 0 (0.0%) |
| Cleaning & Maintenance | 0 (0.0%) | 0 (0.0%) |
| Personal Care & Service | 2 (100.0%) | 0 (0.0%) |
| Total (Category) | 2 (33.3%) | 4 (66.7%) |
| Total (Overall) | 45 (66.2%) | 23 (33.8%) |
Sales and Office Occupations
The most common Sales and Office occupations in Loop are , and Office & Administration (10 | 14.7%).
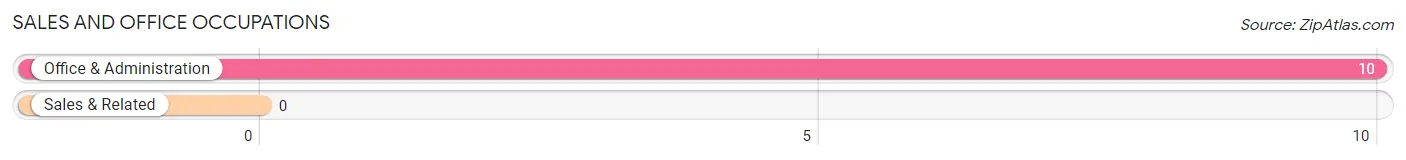
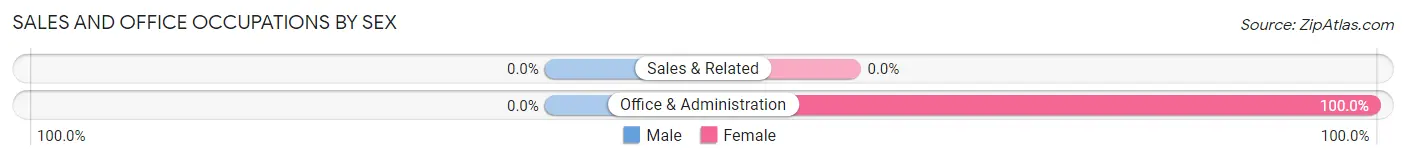
Sales and Office Occupations by Sex
| Occupation | Male | Female |
| Sales & Related | 0 (0.0%) | 0 (0.0%) |
| Office & Administration | 0 (0.0%) | 10 (100.0%) |
| Total (Category) | 0 (0.0%) | 10 (100.0%) |
| Total (Overall) | 45 (66.2%) | 23 (33.8%) |
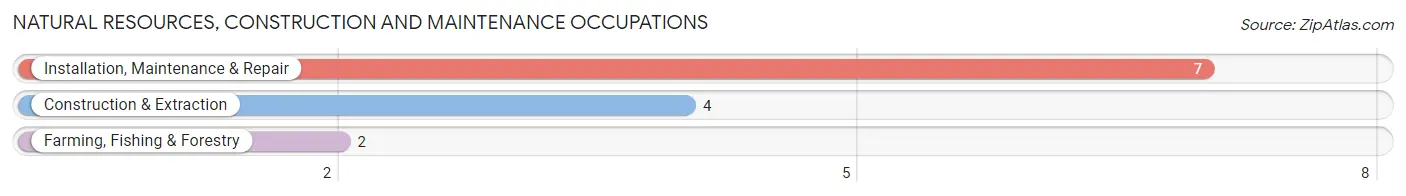
Natural Resources, Construction and Maintenance Occupations
The most common Natural Resources, Construction and Maintenance occupations in Loop are Installation, Maintenance & Repair (7 | 10.3%), Construction & Extraction (4 | 5.9%), and Farming, Fishing & Forestry (2 | 2.9%).
Natural Resources, Construction and Maintenance Occupations by Sex
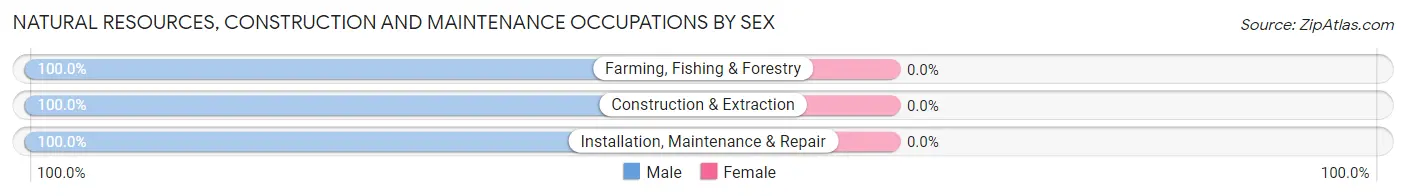
| Occupation | Male | Female |
| Farming, Fishing & Forestry | 2 (100.0%) | 0 (0.0%) |
| Construction & Extraction | 4 (100.0%) | 0 (0.0%) |
| Installation, Maintenance & Repair | 7 (100.0%) | 0 (0.0%) |
| Total (Category) | 13 (100.0%) | 0 (0.0%) |
| Total (Overall) | 45 (66.2%) | 23 (33.8%) |
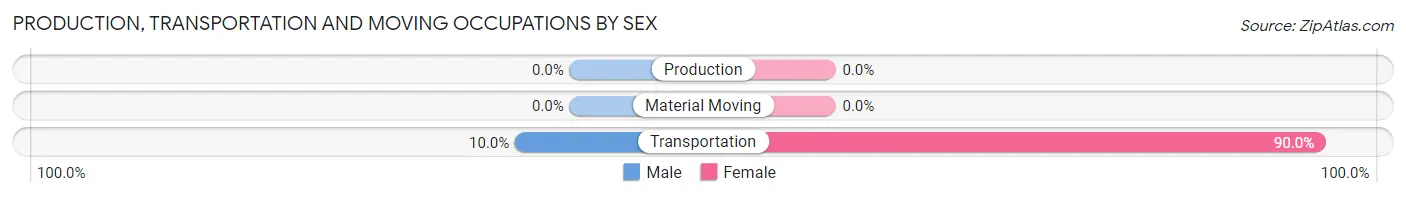
Production, Transportation and Moving Occupations
The most common Production, Transportation and Moving occupations in Loop are , and Transportation (10 | 14.7%).

Production, Transportation and Moving Occupations by Sex
| Occupation | Male | Female |
| Production | 0 (0.0%) | 0 (0.0%) |
| Transportation | 1 (10.0%) | 9 (90.0%) |
| Material Moving | 0 (0.0%) | 0 (0.0%) |
| Total (Category) | 1 (10.0%) | 9 (90.0%) |
| Total (Overall) | 45 (66.2%) | 23 (33.8%) |
Employment Industries by Sex in Loop
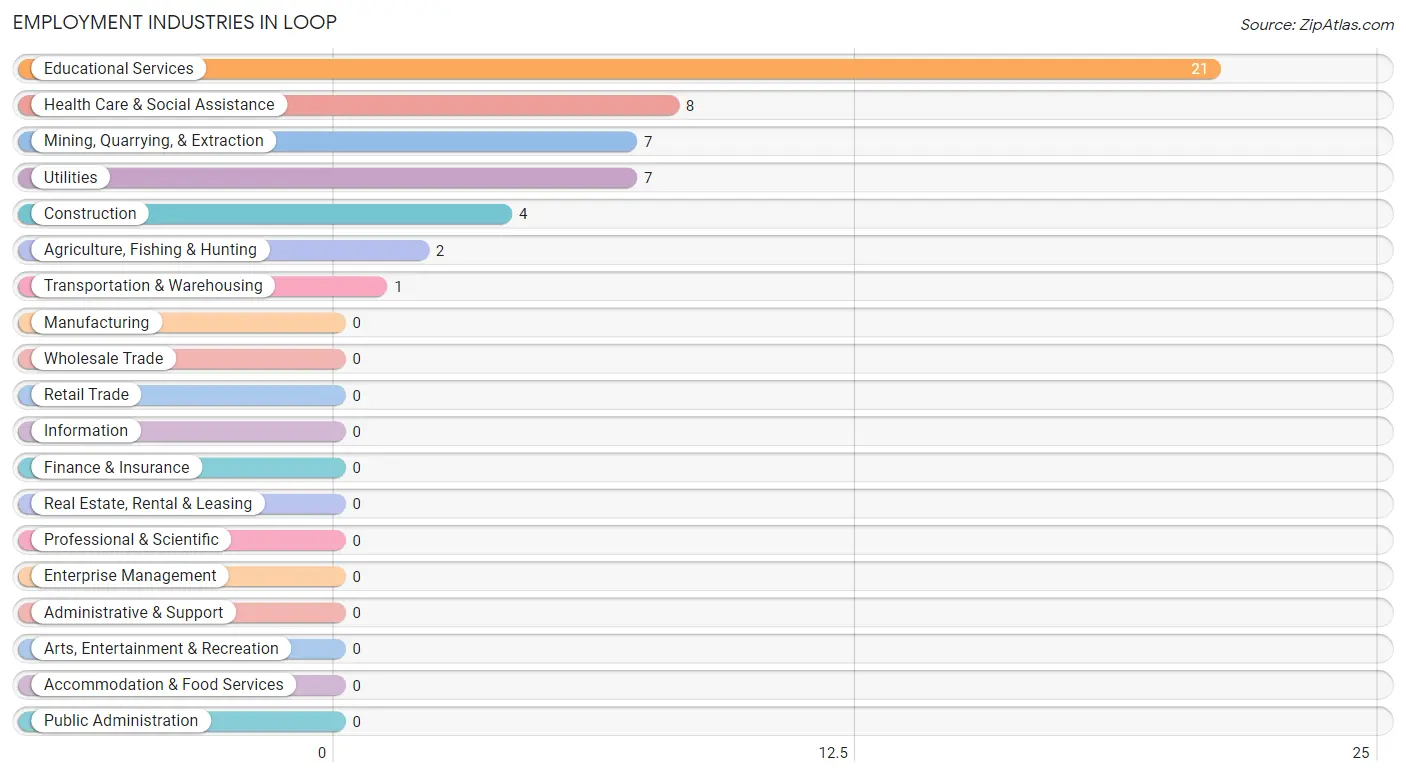
Employment Industries in Loop
The major employment industries in Loop include Educational Services (21 | 30.9%), Health Care & Social Assistance (8 | 11.8%), Mining, Quarrying, & Extraction (7 | 10.3%), Utilities (7 | 10.3%), and Construction (4 | 5.9%).
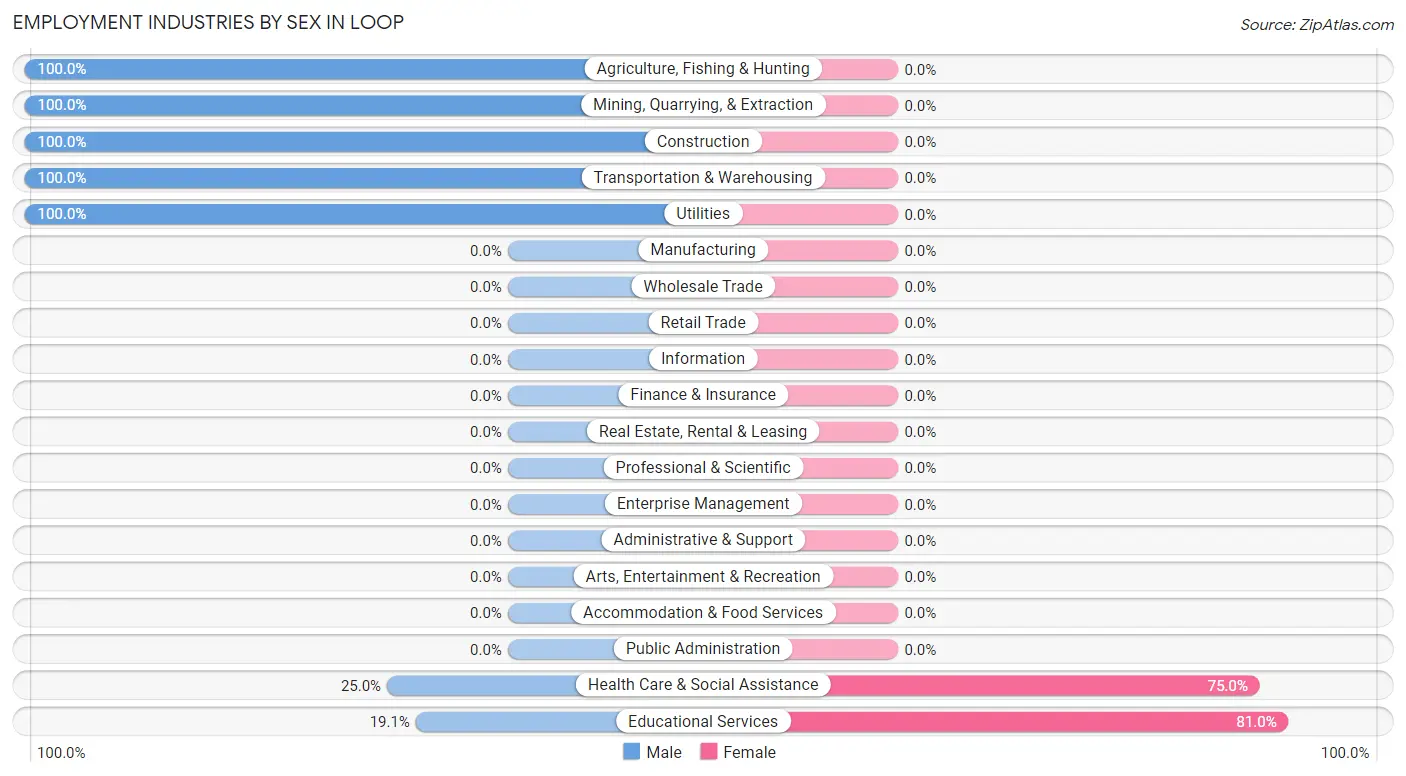
Employment Industries by Sex in Loop
The Loop industries that see more men than women are Agriculture, Fishing & Hunting (100.0%), Mining, Quarrying, & Extraction (100.0%), and Construction (100.0%), whereas the industries that tend to have a higher number of women are Educational Services (80.9%), and Health Care & Social Assistance (75.0%).
| Industry | Male | Female |
| Agriculture, Fishing & Hunting | 2 (100.0%) | 0 (0.0%) |
| Mining, Quarrying, & Extraction | 7 (100.0%) | 0 (0.0%) |
| Construction | 4 (100.0%) | 0 (0.0%) |
| Manufacturing | 0 (0.0%) | 0 (0.0%) |
| Wholesale Trade | 0 (0.0%) | 0 (0.0%) |
| Retail Trade | 0 (0.0%) | 0 (0.0%) |
| Transportation & Warehousing | 1 (100.0%) | 0 (0.0%) |
| Utilities | 7 (100.0%) | 0 (0.0%) |
| Information | 0 (0.0%) | 0 (0.0%) |
| Finance & Insurance | 0 (0.0%) | 0 (0.0%) |
| Real Estate, Rental & Leasing | 0 (0.0%) | 0 (0.0%) |
| Professional & Scientific | 0 (0.0%) | 0 (0.0%) |
| Enterprise Management | 0 (0.0%) | 0 (0.0%) |
| Administrative & Support | 0 (0.0%) | 0 (0.0%) |
| Educational Services | 4 (19.1%) | 17 (80.9%) |
| Health Care & Social Assistance | 2 (25.0%) | 6 (75.0%) |
| Arts, Entertainment & Recreation | 0 (0.0%) | 0 (0.0%) |
| Accommodation & Food Services | 0 (0.0%) | 0 (0.0%) |
| Public Administration | 0 (0.0%) | 0 (0.0%) |
| Total | 45 (66.2%) | 23 (33.8%) |
Education in Loop
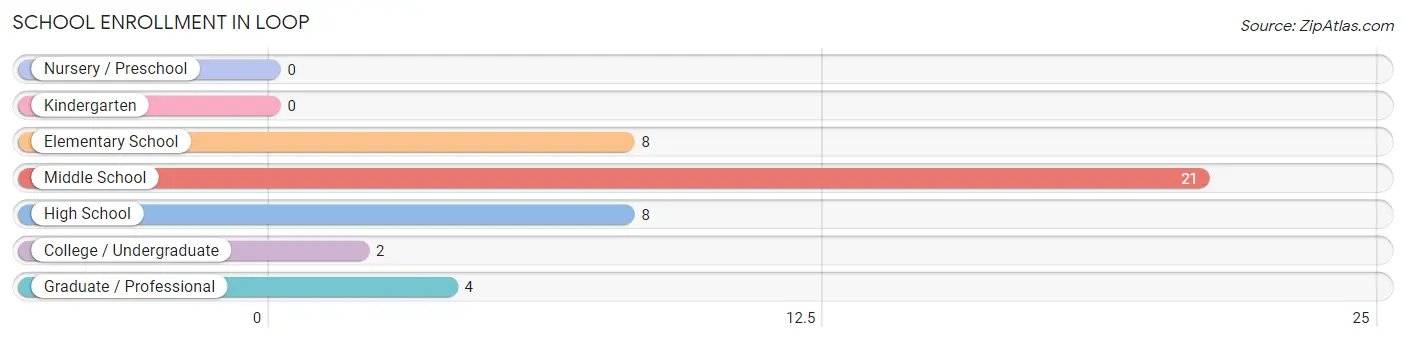
School Enrollment in Loop
The most common levels of schooling among the 43 students in Loop are middle school (21 | 48.8%), elementary school (8 | 18.6%), and high school (8 | 18.6%).
| School Level | # Students | % Students |
| Nursery / Preschool | 0 | 0.0% |
| Kindergarten | 0 | 0.0% |
| Elementary School | 8 | 18.6% |
| Middle School | 21 | 48.8% |
| High School | 8 | 18.6% |
| College / Undergraduate | 2 | 4.6% |
| Graduate / Professional | 4 | 9.3% |
| Total | 43 | 100.0% |
School Enrollment by Age by Funding Source in Loop
Out of a total of 43 students who are enrolled in schools in Loop, 5 (11.6%) attend a private institution, while the remaining 38 (88.4%) are enrolled in public schools. The age group of 18 to 19 year olds has the highest likelihood of being enrolled in private schools, with 1 (100.0% in the age bracket) enrolled. Conversely, the age group of 5 to 9 year old has the lowest likelihood of being enrolled in a private school, with 8 (100.0% in the age bracket) attending a public institution.
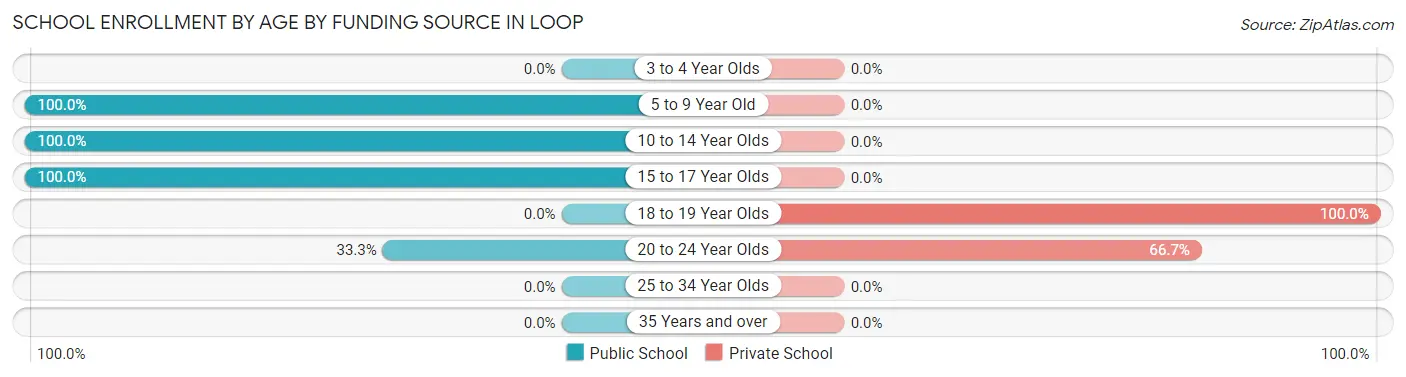
| Age Bracket | Public School | Private School |
| 3 to 4 Year Olds | 0 (0.0%) | 0 (0.0%) |
| 5 to 9 Year Old | 8 (100.0%) | 0 (0.0%) |
| 10 to 14 Year Olds | 21 (100.0%) | 0 (0.0%) |
| 15 to 17 Year Olds | 7 (100.0%) | 0 (0.0%) |
| 18 to 19 Year Olds | 0 (0.0%) | 1 (100.0%) |
| 20 to 24 Year Olds | 2 (33.3%) | 4 (66.7%) |
| 25 to 34 Year Olds | 0 (0.0%) | 0 (0.0%) |
| 35 Years and over | 0 (0.0%) | 0 (0.0%) |
| Total | 38 (88.4%) | 5 (11.6%) |
Educational Attainment by Field of Study in Loop
Education (5 | 71.4%), bio, nature & agricultural (1 | 14.3%), and liberal arts & history (1 | 14.3%) are the most common fields of study among 7 individuals in Loop who have obtained a bachelor's degree or higher.
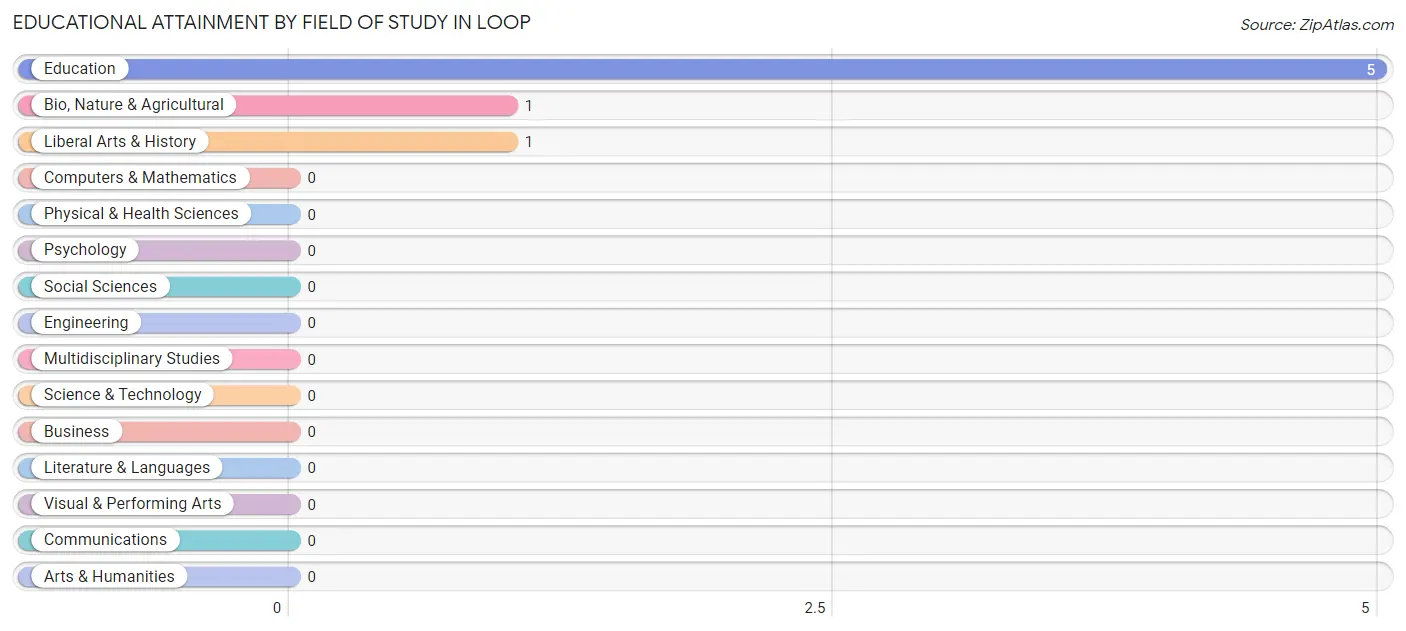
| Field of Study | # Graduates | % Graduates |
| Computers & Mathematics | 0 | 0.0% |
| Bio, Nature & Agricultural | 1 | 14.3% |
| Physical & Health Sciences | 0 | 0.0% |
| Psychology | 0 | 0.0% |
| Social Sciences | 0 | 0.0% |
| Engineering | 0 | 0.0% |
| Multidisciplinary Studies | 0 | 0.0% |
| Science & Technology | 0 | 0.0% |
| Business | 0 | 0.0% |
| Education | 5 | 71.4% |
| Literature & Languages | 0 | 0.0% |
| Liberal Arts & History | 1 | 14.3% |
| Visual & Performing Arts | 0 | 0.0% |
| Communications | 0 | 0.0% |
| Arts & Humanities | 0 | 0.0% |
| Total | 7 | 100.0% |
Transportation & Commute in Loop
Vehicle Availability by Sex in Loop
The most prevalent vehicle ownership categories in Loop are males with 1 vehicle (18, accounting for 50.0%) and females with 1 vehicle (8, making up 78.3%).
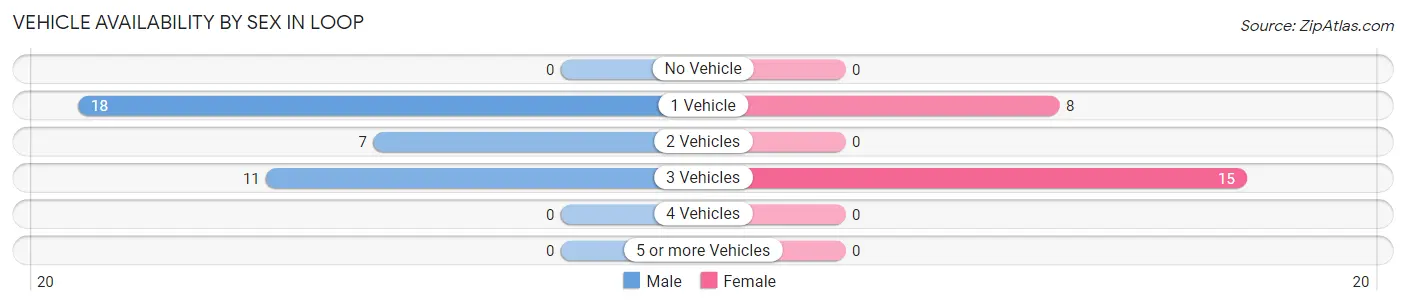
| Vehicles Available | Male | Female |
| No Vehicle | 0 (0.0%) | 0 (0.0%) |
| 1 Vehicle | 18 (50.0%) | 8 (34.8%) |
| 2 Vehicles | 7 (19.4%) | 0 (0.0%) |
| 3 Vehicles | 11 (30.6%) | 15 (65.2%) |
| 4 Vehicles | 0 (0.0%) | 0 (0.0%) |
| 5 or more Vehicles | 0 (0.0%) | 0 (0.0%) |
| Total | 36 (100.0%) | 23 (100.0%) |
Commute Time in Loop
The most frequently occuring commute durations in Loop are less than 5 minutes (36 commuters, 63.2%), 15 to 19 minutes (11 commuters, 19.3%), and 60 to 89 minutes (9 commuters, 15.8%).
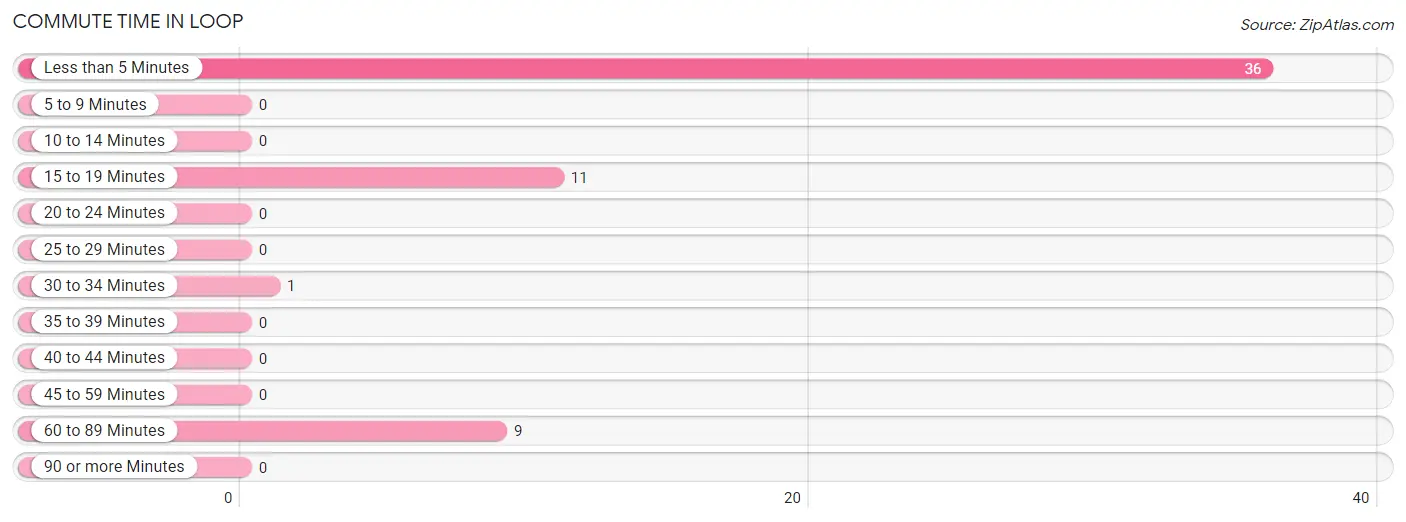
| Commute Time | # Commuters | % Commuters |
| Less than 5 Minutes | 36 | 63.2% |
| 5 to 9 Minutes | 0 | 0.0% |
| 10 to 14 Minutes | 0 | 0.0% |
| 15 to 19 Minutes | 11 | 19.3% |
| 20 to 24 Minutes | 0 | 0.0% |
| 25 to 29 Minutes | 0 | 0.0% |
| 30 to 34 Minutes | 1 | 1.8% |
| 35 to 39 Minutes | 0 | 0.0% |
| 40 to 44 Minutes | 0 | 0.0% |
| 45 to 59 Minutes | 0 | 0.0% |
| 60 to 89 Minutes | 9 | 15.8% |
| 90 or more Minutes | 0 | 0.0% |
Commute Time by Sex in Loop
The most common commute times in Loop are less than 5 minutes (19 commuters, 50.0%) for males and less than 5 minutes (17 commuters, 89.5%) for females.
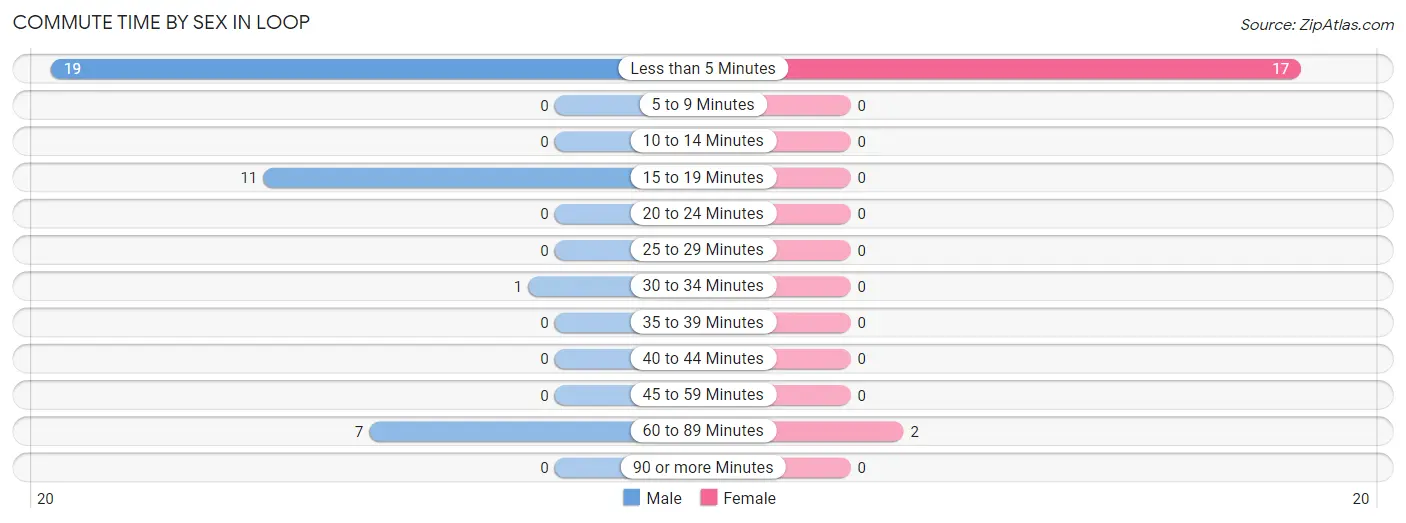
| Commute Time | Male | Female |
| Less than 5 Minutes | 19 (50.0%) | 17 (89.5%) |
| 5 to 9 Minutes | 0 (0.0%) | 0 (0.0%) |
| 10 to 14 Minutes | 0 (0.0%) | 0 (0.0%) |
| 15 to 19 Minutes | 11 (28.9%) | 0 (0.0%) |
| 20 to 24 Minutes | 0 (0.0%) | 0 (0.0%) |
| 25 to 29 Minutes | 0 (0.0%) | 0 (0.0%) |
| 30 to 34 Minutes | 1 (2.6%) | 0 (0.0%) |
| 35 to 39 Minutes | 0 (0.0%) | 0 (0.0%) |
| 40 to 44 Minutes | 0 (0.0%) | 0 (0.0%) |
| 45 to 59 Minutes | 0 (0.0%) | 0 (0.0%) |
| 60 to 89 Minutes | 7 (18.4%) | 2 (10.5%) |
| 90 or more Minutes | 0 (0.0%) | 0 (0.0%) |
Time of Departure to Work by Sex in Loop
The most frequent times of departure to work in Loop are 8:00 AM to 8:29 AM (14, 36.8%) for males and 6:30 AM to 6:59 AM (10, 52.6%) for females.
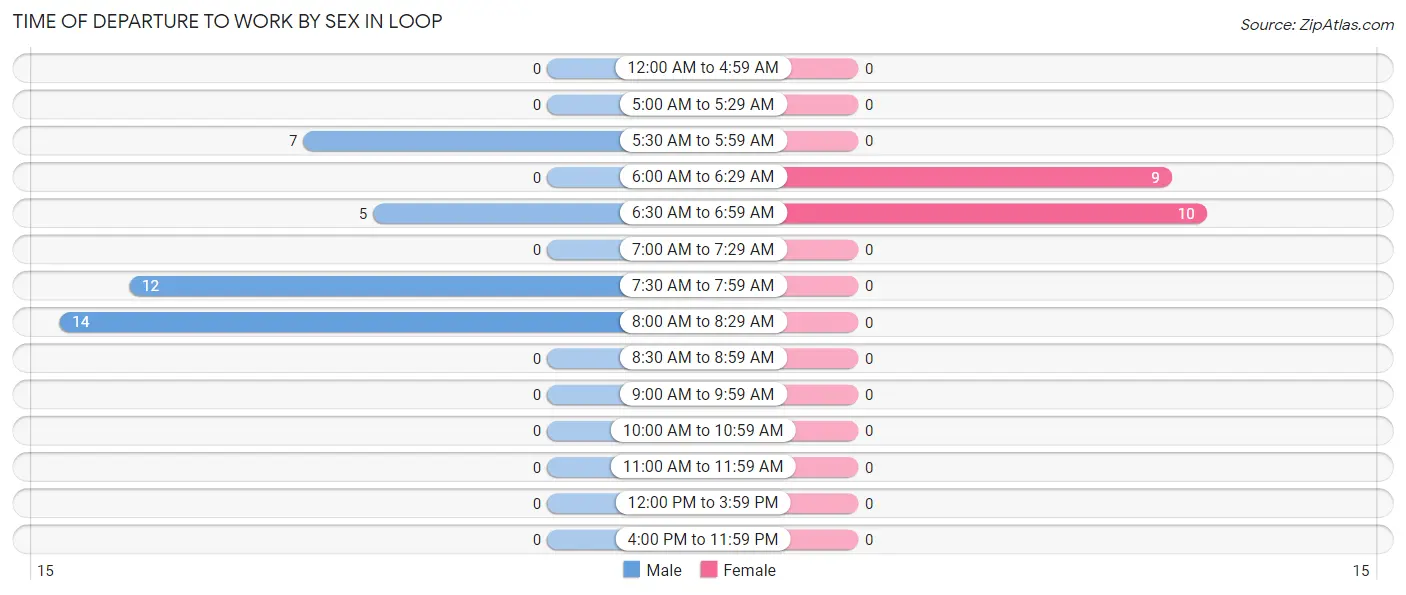
| Time of Departure | Male | Female |
| 12:00 AM to 4:59 AM | 0 (0.0%) | 0 (0.0%) |
| 5:00 AM to 5:29 AM | 0 (0.0%) | 0 (0.0%) |
| 5:30 AM to 5:59 AM | 7 (18.4%) | 0 (0.0%) |
| 6:00 AM to 6:29 AM | 0 (0.0%) | 9 (47.4%) |
| 6:30 AM to 6:59 AM | 5 (13.2%) | 10 (52.6%) |
| 7:00 AM to 7:29 AM | 0 (0.0%) | 0 (0.0%) |
| 7:30 AM to 7:59 AM | 12 (31.6%) | 0 (0.0%) |
| 8:00 AM to 8:29 AM | 14 (36.8%) | 0 (0.0%) |
| 8:30 AM to 8:59 AM | 0 (0.0%) | 0 (0.0%) |
| 9:00 AM to 9:59 AM | 0 (0.0%) | 0 (0.0%) |
| 10:00 AM to 10:59 AM | 0 (0.0%) | 0 (0.0%) |
| 11:00 AM to 11:59 AM | 0 (0.0%) | 0 (0.0%) |
| 12:00 PM to 3:59 PM | 0 (0.0%) | 0 (0.0%) |
| 4:00 PM to 11:59 PM | 0 (0.0%) | 0 (0.0%) |
| Total | 38 (100.0%) | 19 (100.0%) |
Housing Occupancy in Loop
Occupancy by Ownership in Loop
Of the total 57 dwellings in Loop, owner-occupied units account for 53 (93.0%), while renter-occupied units make up 4 (7.0%).
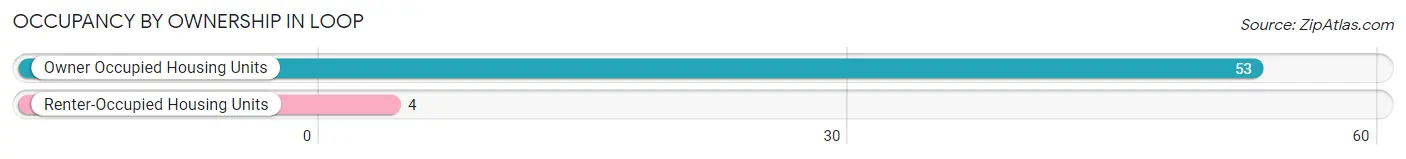
| Occupancy | # Housing Units | % Housing Units |
| Owner Occupied Housing Units | 53 | 93.0% |
| Renter-Occupied Housing Units | 4 | 7.0% |
| Total Occupied Housing Units | 57 | 100.0% |
Occupancy by Household Size in Loop
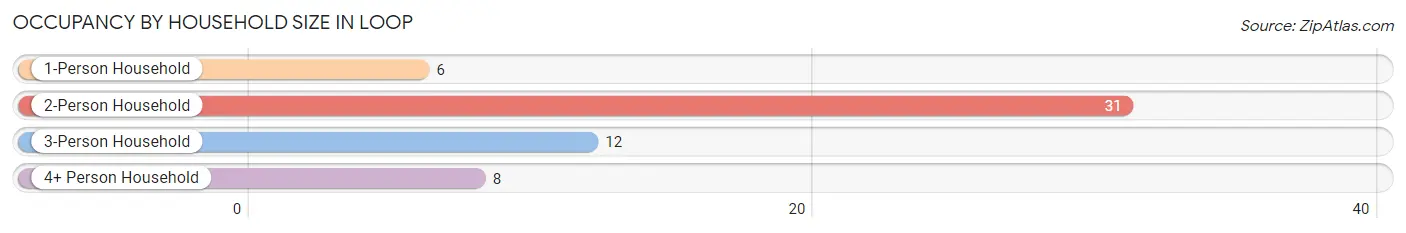
| Household Size | # Housing Units | % Housing Units |
| 1-Person Household | 6 | 10.5% |
| 2-Person Household | 31 | 54.4% |
| 3-Person Household | 12 | 21.0% |
| 4+ Person Household | 8 | 14.0% |
| Total Housing Units | 57 | 100.0% |
Occupancy by Ownership by Household Size in Loop
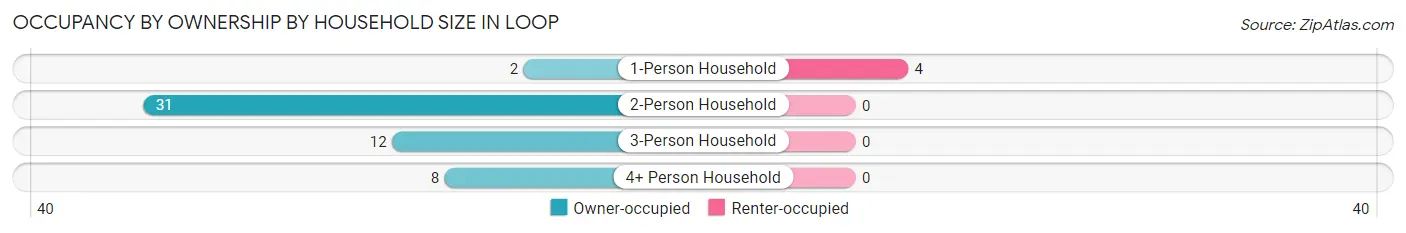
| Household Size | Owner-occupied | Renter-occupied |
| 1-Person Household | 2 (33.3%) | 4 (66.7%) |
| 2-Person Household | 31 (100.0%) | 0 (0.0%) |
| 3-Person Household | 12 (100.0%) | 0 (0.0%) |
| 4+ Person Household | 8 (100.0%) | 0 (0.0%) |
| Total Housing Units | 53 (93.0%) | 4 (7.0%) |
Occupancy by Educational Attainment in Loop
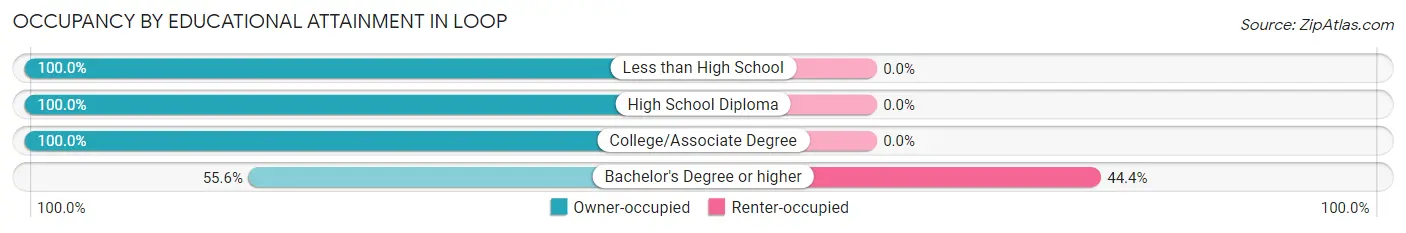
| Household Size | Owner-occupied | Renter-occupied |
| Less than High School | 32 (100.0%) | 0 (0.0%) |
| High School Diploma | 14 (100.0%) | 0 (0.0%) |
| College/Associate Degree | 2 (100.0%) | 0 (0.0%) |
| Bachelor's Degree or higher | 5 (55.6%) | 4 (44.4%) |
Occupancy by Age of Householder in Loop
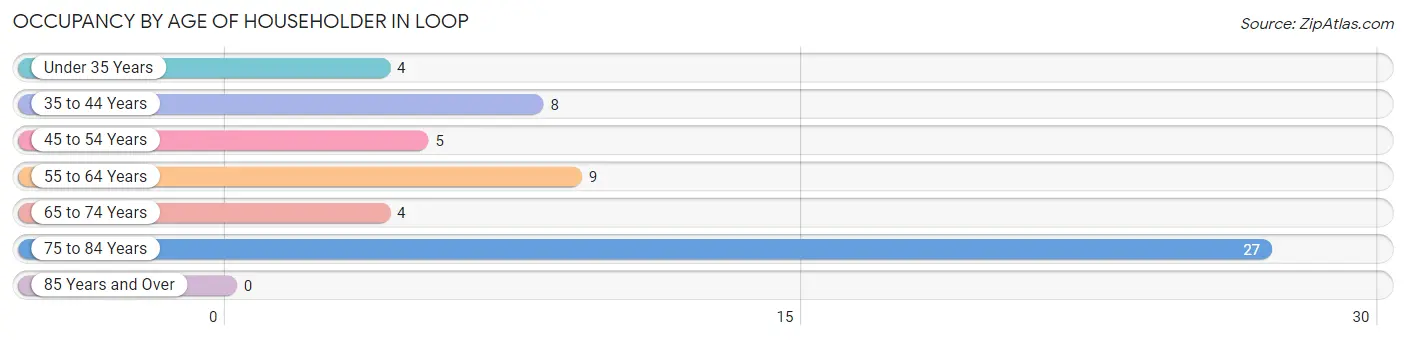
| Age Bracket | # Households | % Households |
| Under 35 Years | 4 | 7.0% |
| 35 to 44 Years | 8 | 14.0% |
| 45 to 54 Years | 5 | 8.8% |
| 55 to 64 Years | 9 | 15.8% |
| 65 to 74 Years | 4 | 7.0% |
| 75 to 84 Years | 27 | 47.4% |
| 85 Years and Over | 0 | 0.0% |
| Total | 57 | 100.0% |
Housing Finances in Loop
Median Income by Occupancy in Loop
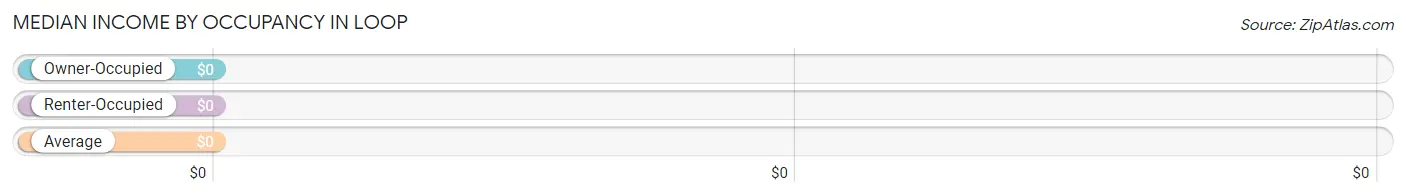
| Occupancy Type | # Households | Median Income |
| Owner-Occupied | 53 (93.0%) | $0 |
| Renter-Occupied | 4 (7.0%) | $0 |
| Average | 57 (100.0%) | $0 |
Occupancy by Householder Income Bracket in Loop
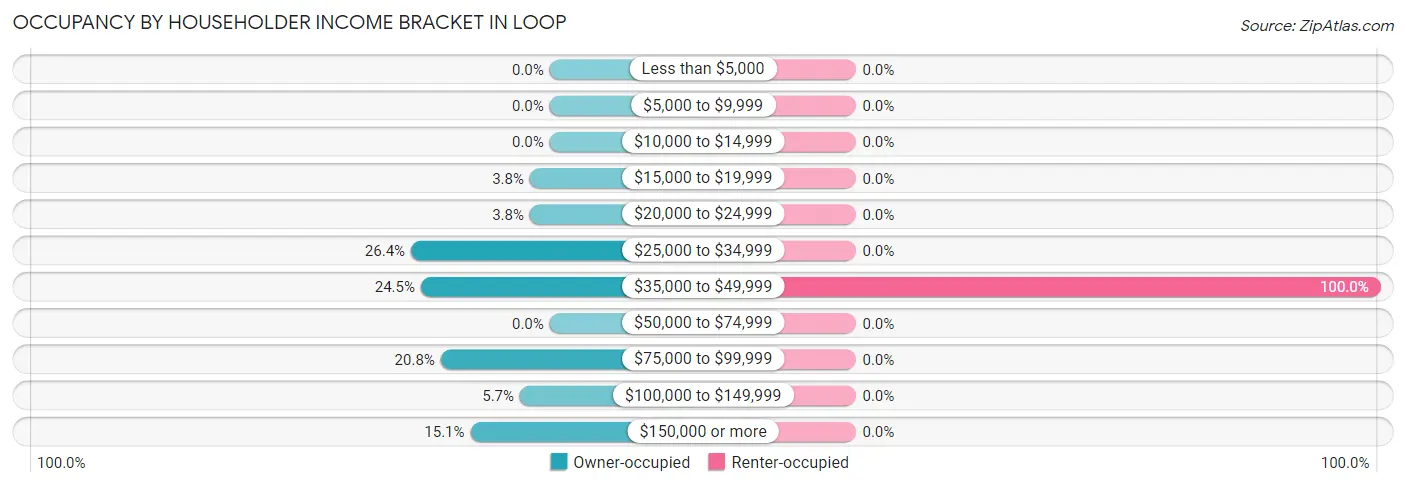
| Income Bracket | Owner-occupied | Renter-occupied |
| Less than $5,000 | 0 (0.0%) | 0 (0.0%) |
| $5,000 to $9,999 | 0 (0.0%) | 0 (0.0%) |
| $10,000 to $14,999 | 0 (0.0%) | 0 (0.0%) |
| $15,000 to $19,999 | 2 (3.8%) | 0 (0.0%) |
| $20,000 to $24,999 | 2 (3.8%) | 0 (0.0%) |
| $25,000 to $34,999 | 14 (26.4%) | 0 (0.0%) |
| $35,000 to $49,999 | 13 (24.5%) | 4 (100.0%) |
| $50,000 to $74,999 | 0 (0.0%) | 0 (0.0%) |
| $75,000 to $99,999 | 11 (20.7%) | 0 (0.0%) |
| $100,000 to $149,999 | 3 (5.7%) | 0 (0.0%) |
| $150,000 or more | 8 (15.1%) | 0 (0.0%) |
| Total | 53 (100.0%) | 4 (100.0%) |
Monthly Housing Cost Tiers in Loop
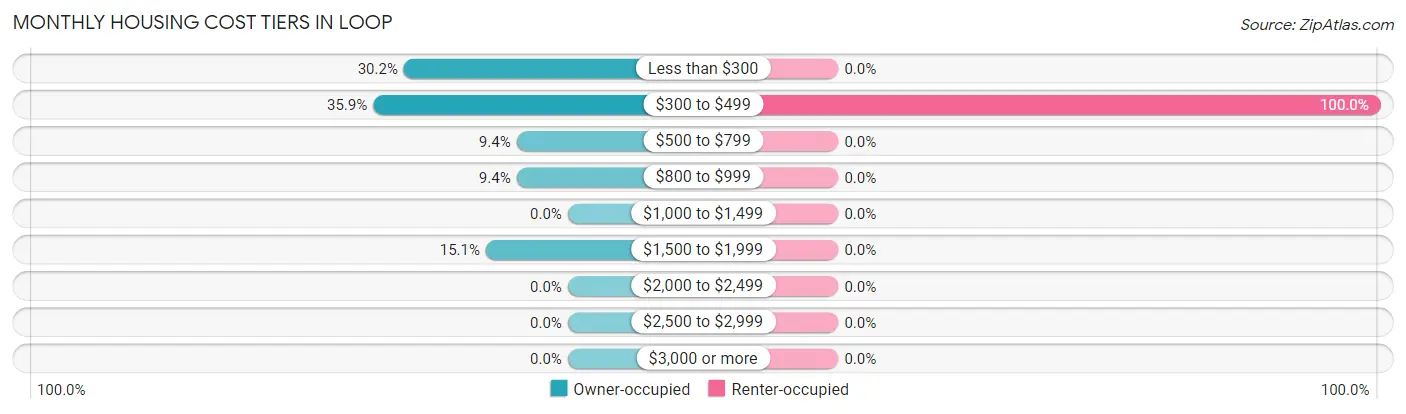
| Monthly Cost | Owner-occupied | Renter-occupied |
| Less than $300 | 16 (30.2%) | 0 (0.0%) |
| $300 to $499 | 19 (35.8%) | 4 (100.0%) |
| $500 to $799 | 5 (9.4%) | 0 (0.0%) |
| $800 to $999 | 5 (9.4%) | 0 (0.0%) |
| $1,000 to $1,499 | 0 (0.0%) | 0 (0.0%) |
| $1,500 to $1,999 | 8 (15.1%) | 0 (0.0%) |
| $2,000 to $2,499 | 0 (0.0%) | 0 (0.0%) |
| $2,500 to $2,999 | 0 (0.0%) | 0 (0.0%) |
| $3,000 or more | 0 (0.0%) | 0 (0.0%) |
| Total | 53 (100.0%) | 4 (100.0%) |
Physical Housing Characteristics in Loop
Housing Structures in Loop
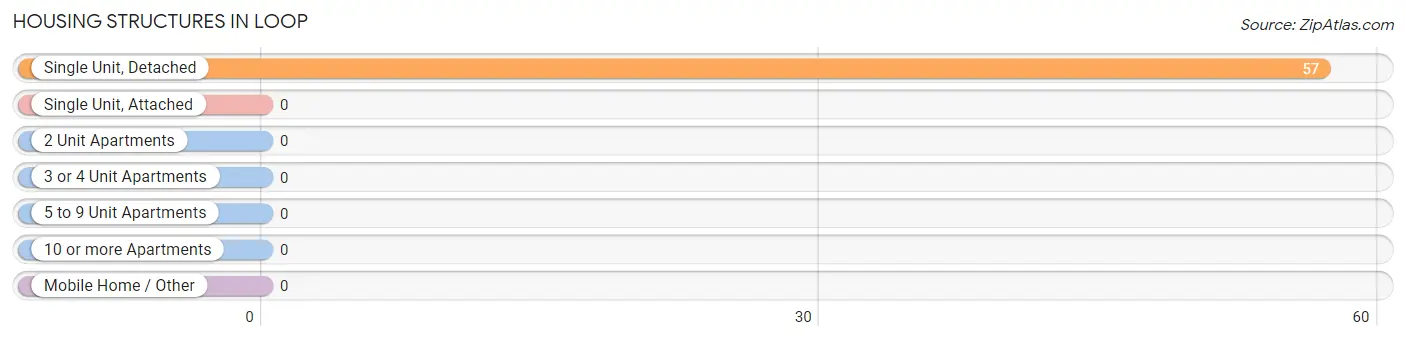
| Structure Type | # Housing Units | % Housing Units |
| Single Unit, Detached | 57 | 100.0% |
| Single Unit, Attached | 0 | 0.0% |
| 2 Unit Apartments | 0 | 0.0% |
| 3 or 4 Unit Apartments | 0 | 0.0% |
| 5 to 9 Unit Apartments | 0 | 0.0% |
| 10 or more Apartments | 0 | 0.0% |
| Mobile Home / Other | 0 | 0.0% |
| Total | 57 | 100.0% |
Housing Structures by Occupancy in Loop
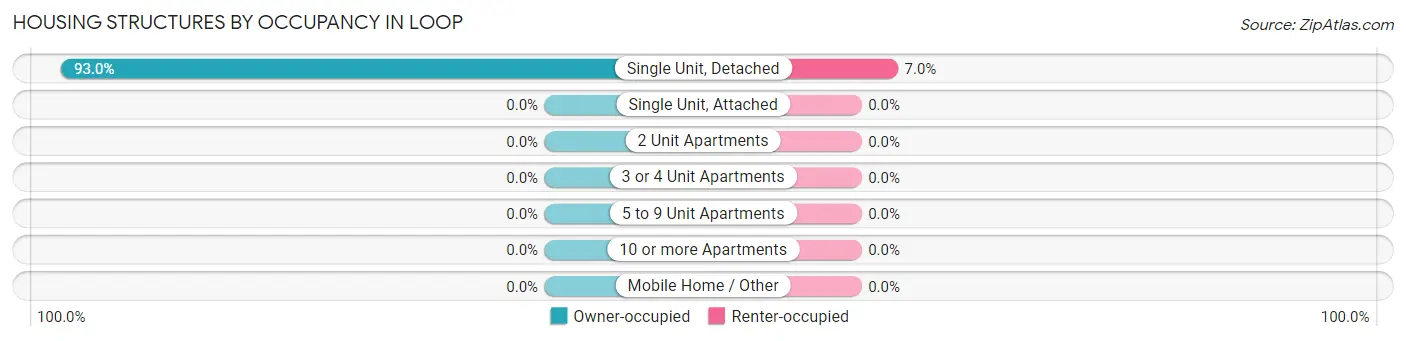
| Structure Type | Owner-occupied | Renter-occupied |
| Single Unit, Detached | 53 (93.0%) | 4 (7.0%) |
| Single Unit, Attached | 0 (0.0%) | 0 (0.0%) |
| 2 Unit Apartments | 0 (0.0%) | 0 (0.0%) |
| 3 or 4 Unit Apartments | 0 (0.0%) | 0 (0.0%) |
| 5 to 9 Unit Apartments | 0 (0.0%) | 0 (0.0%) |
| 10 or more Apartments | 0 (0.0%) | 0 (0.0%) |
| Mobile Home / Other | 0 (0.0%) | 0 (0.0%) |
| Total | 53 (93.0%) | 4 (7.0%) |
Housing Structures by Number of Rooms in Loop
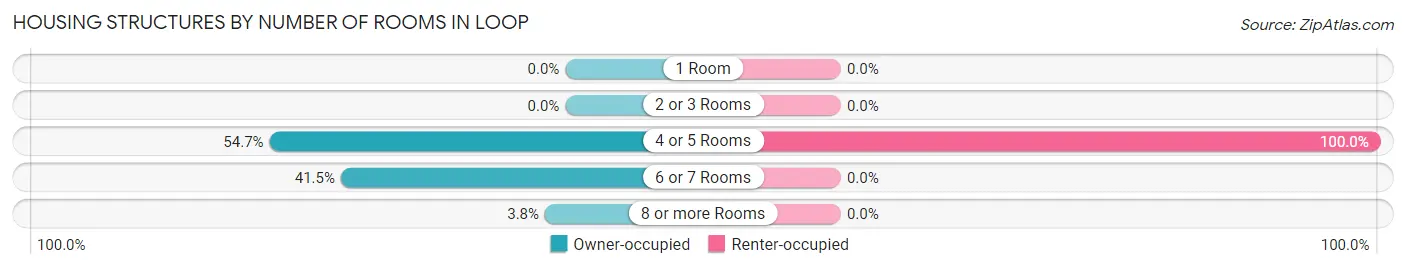
| Number of Rooms | Owner-occupied | Renter-occupied |
| 1 Room | 0 (0.0%) | 0 (0.0%) |
| 2 or 3 Rooms | 0 (0.0%) | 0 (0.0%) |
| 4 or 5 Rooms | 29 (54.7%) | 4 (100.0%) |
| 6 or 7 Rooms | 22 (41.5%) | 0 (0.0%) |
| 8 or more Rooms | 2 (3.8%) | 0 (0.0%) |
| Total | 53 (100.0%) | 4 (100.0%) |
Housing Structure by Heating Type in Loop
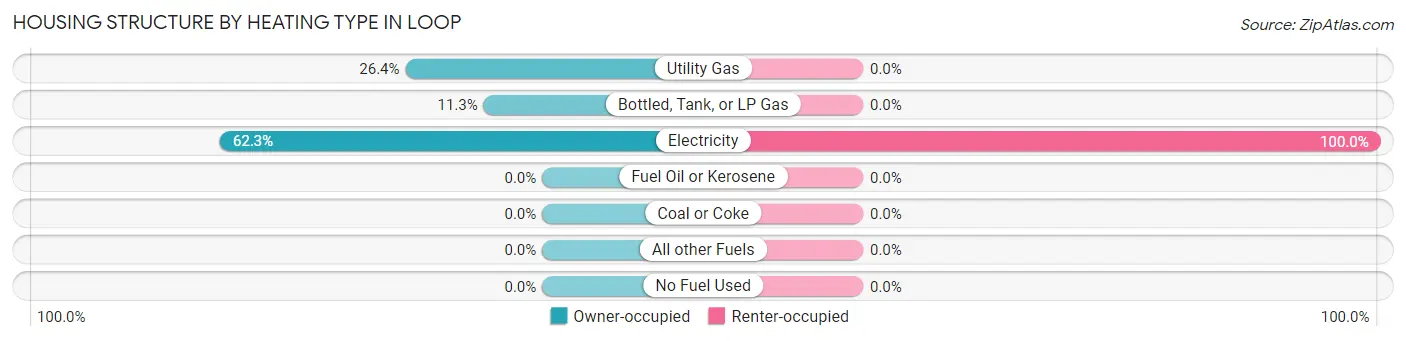
| Heating Type | Owner-occupied | Renter-occupied |
| Utility Gas | 14 (26.4%) | 0 (0.0%) |
| Bottled, Tank, or LP Gas | 6 (11.3%) | 0 (0.0%) |
| Electricity | 33 (62.3%) | 4 (100.0%) |
| Fuel Oil or Kerosene | 0 (0.0%) | 0 (0.0%) |
| Coal or Coke | 0 (0.0%) | 0 (0.0%) |
| All other Fuels | 0 (0.0%) | 0 (0.0%) |
| No Fuel Used | 0 (0.0%) | 0 (0.0%) |
| Total | 53 (100.0%) | 4 (100.0%) |
Household Vehicle Usage in Loop
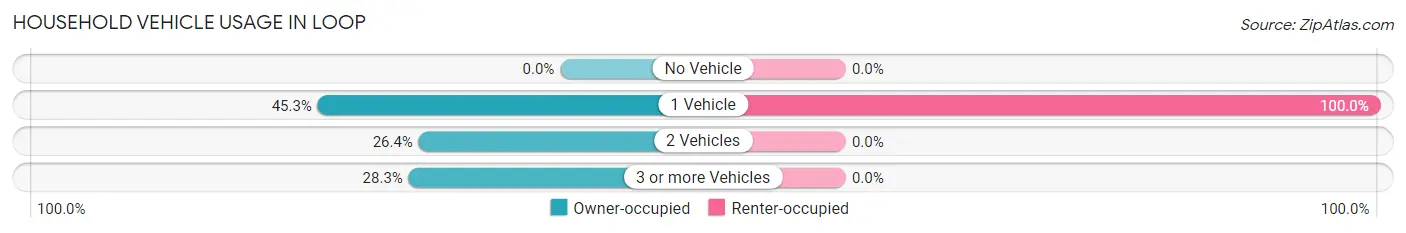
| Vehicles per Household | Owner-occupied | Renter-occupied |
| No Vehicle | 0 (0.0%) | 0 (0.0%) |
| 1 Vehicle | 24 (45.3%) | 4 (100.0%) |
| 2 Vehicles | 14 (26.4%) | 0 (0.0%) |
| 3 or more Vehicles | 15 (28.3%) | 0 (0.0%) |
| Total | 53 (100.0%) | 4 (100.0%) |
Real Estate & Mortgages in Loop
Real Estate and Mortgage Overview in Loop
| Characteristic | Without Mortgage | With Mortgage |
| Housing Units | 40 | 13 |
| Median Property Value | - | - |
| Median Household Income | $35,385 | $8 |
| Monthly Housing Costs | $379 | $0 |
| Real Estate Taxes | - | - |
Property Value by Mortgage Status in Loop
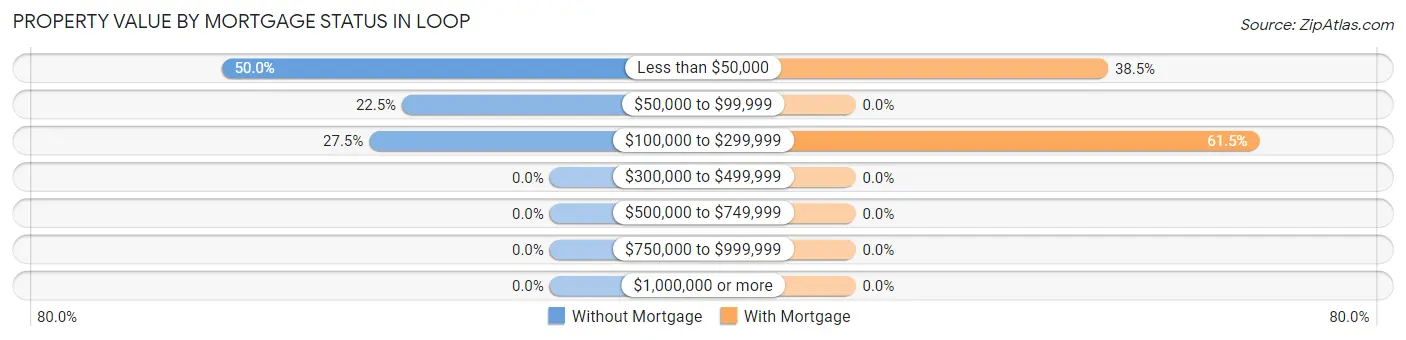
| Property Value | Without Mortgage | With Mortgage |
| Less than $50,000 | 20 (50.0%) | 5 (38.5%) |
| $50,000 to $99,999 | 9 (22.5%) | 0 (0.0%) |
| $100,000 to $299,999 | 11 (27.5%) | 8 (61.5%) |
| $300,000 to $499,999 | 0 (0.0%) | 0 (0.0%) |
| $500,000 to $749,999 | 0 (0.0%) | 0 (0.0%) |
| $750,000 to $999,999 | 0 (0.0%) | 0 (0.0%) |
| $1,000,000 or more | 0 (0.0%) | 0 (0.0%) |
| Total | 40 (100.0%) | 13 (100.0%) |
Household Income by Mortgage Status in Loop
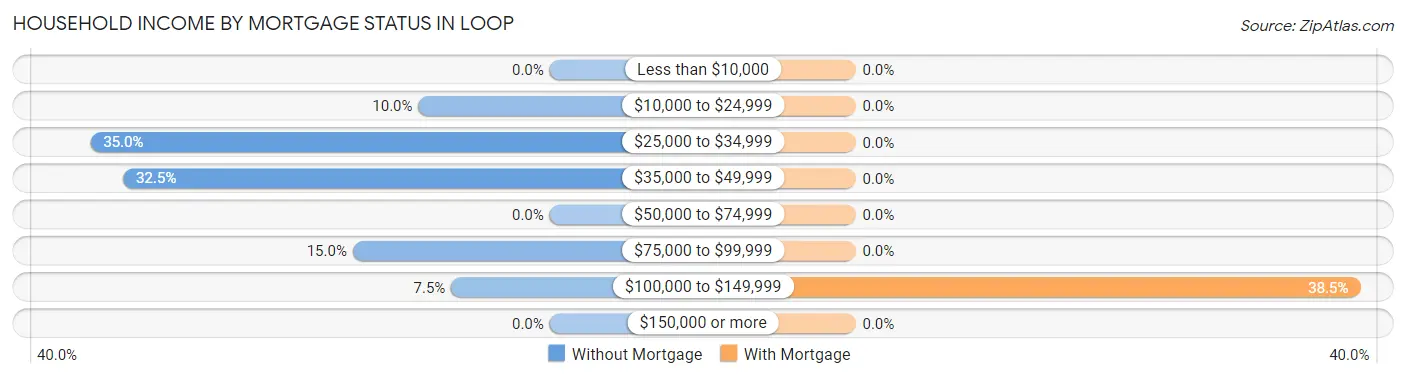
| Household Income | Without Mortgage | With Mortgage |
| Less than $10,000 | 0 (0.0%) | 0 (0.0%) |
| $10,000 to $24,999 | 4 (10.0%) | 0 (0.0%) |
| $25,000 to $34,999 | 14 (35.0%) | 0 (0.0%) |
| $35,000 to $49,999 | 13 (32.5%) | 0 (0.0%) |
| $50,000 to $74,999 | 0 (0.0%) | 0 (0.0%) |
| $75,000 to $99,999 | 6 (15.0%) | 0 (0.0%) |
| $100,000 to $149,999 | 3 (7.5%) | 5 (38.5%) |
| $150,000 or more | 0 (0.0%) | 0 (0.0%) |
| Total | 40 (100.0%) | 13 (100.0%) |
Property Value to Household Income Ratio in Loop
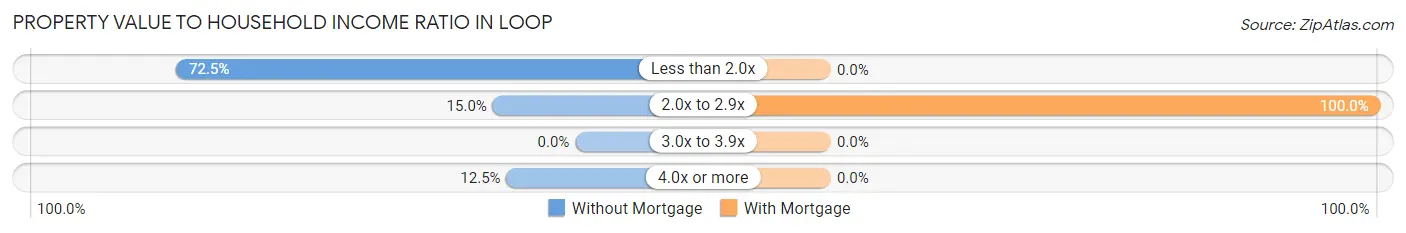
| Value-to-Income Ratio | Without Mortgage | With Mortgage |
| Less than 2.0x | 29 (72.5%) | 0 (0.0%) |
| 2.0x to 2.9x | 6 (15.0%) | 13 (100.0%) |
| 3.0x to 3.9x | 0 (0.0%) | 0 (0.0%) |
| 4.0x or more | 5 (12.5%) | 0 (0.0%) |
| Total | 40 (100.0%) | 13 (100.0%) |
Real Estate Taxes by Mortgage Status in Loop
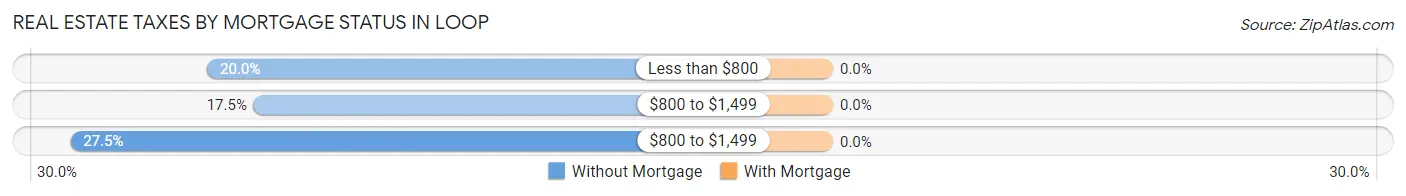
| Property Taxes | Without Mortgage | With Mortgage |
| Less than $800 | 8 (20.0%) | 0 (0.0%) |
| $800 to $1,499 | 7 (17.5%) | 0 (0.0%) |
| $800 to $1,499 | 11 (27.5%) | 0 (0.0%) |
| Total | 40 (100.0%) | 13 (100.0%) |
Health & Disability in Loop
Health Insurance Coverage by Age in Loop
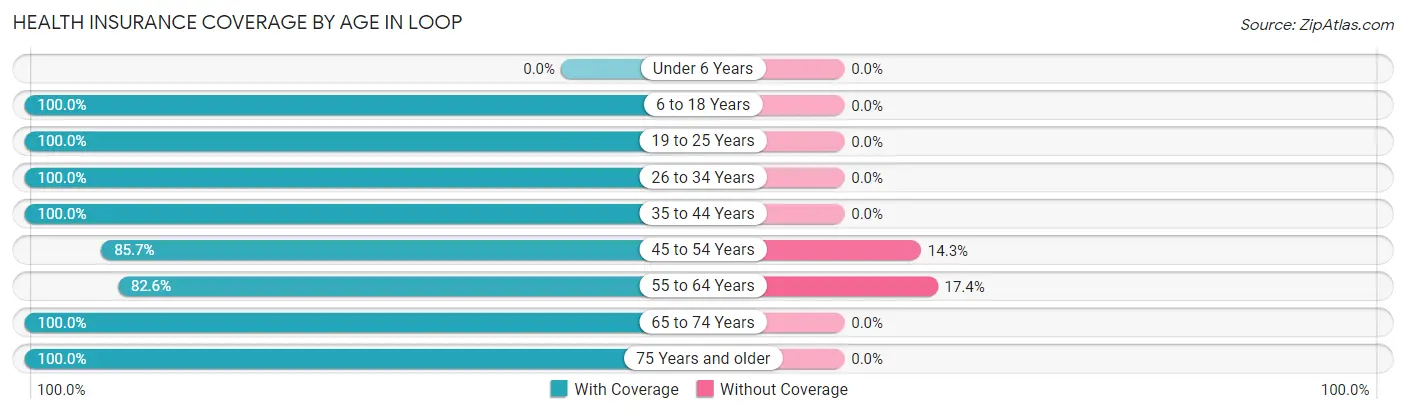
| Age Bracket | With Coverage | Without Coverage |
| Under 6 Years | 0 (0.0%) | 0 (0.0%) |
| 6 to 18 Years | 36 (100.0%) | 0 (0.0%) |
| 19 to 25 Years | 12 (100.0%) | 0 (0.0%) |
| 26 to 34 Years | 1 (100.0%) | 0 (0.0%) |
| 35 to 44 Years | 23 (100.0%) | 0 (0.0%) |
| 45 to 54 Years | 6 (85.7%) | 1 (14.3%) |
| 55 to 64 Years | 19 (82.6%) | 4 (17.4%) |
| 65 to 74 Years | 31 (100.0%) | 0 (0.0%) |
| 75 Years and older | 39 (100.0%) | 0 (0.0%) |
| Total | 167 (97.1%) | 5 (2.9%) |
Health Insurance Coverage by Citizenship Status in Loop
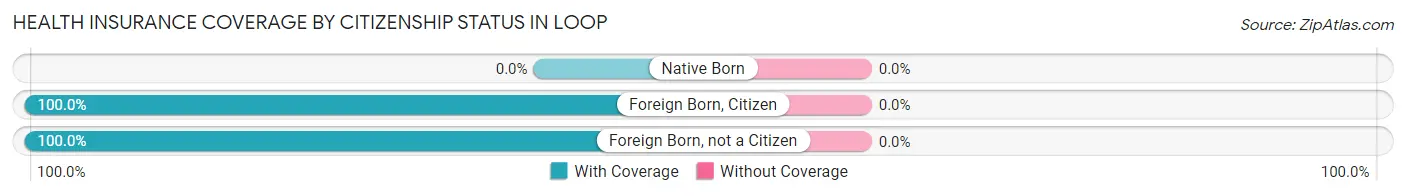
| Citizenship Status | With Coverage | Without Coverage |
| Native Born | 0 (0.0%) | 0 (0.0%) |
| Foreign Born, Citizen | 36 (100.0%) | 0 (0.0%) |
| Foreign Born, not a Citizen | 12 (100.0%) | 0 (0.0%) |
Health Insurance Coverage by Household Income in Loop

| Household Income | With Coverage | Without Coverage |
| Under $25,000 | 6 (100.0%) | 0 (0.0%) |
| $25,000 to $49,999 | 68 (94.4%) | 4 (5.6%) |
| $50,000 to $74,999 | 0 (0.0%) | 0 (0.0%) |
| $75,000 to $99,999 | 27 (100.0%) | 0 (0.0%) |
| $100,000 and over | 55 (100.0%) | 0 (0.0%) |
Public vs Private Health Insurance Coverage by Age in Loop
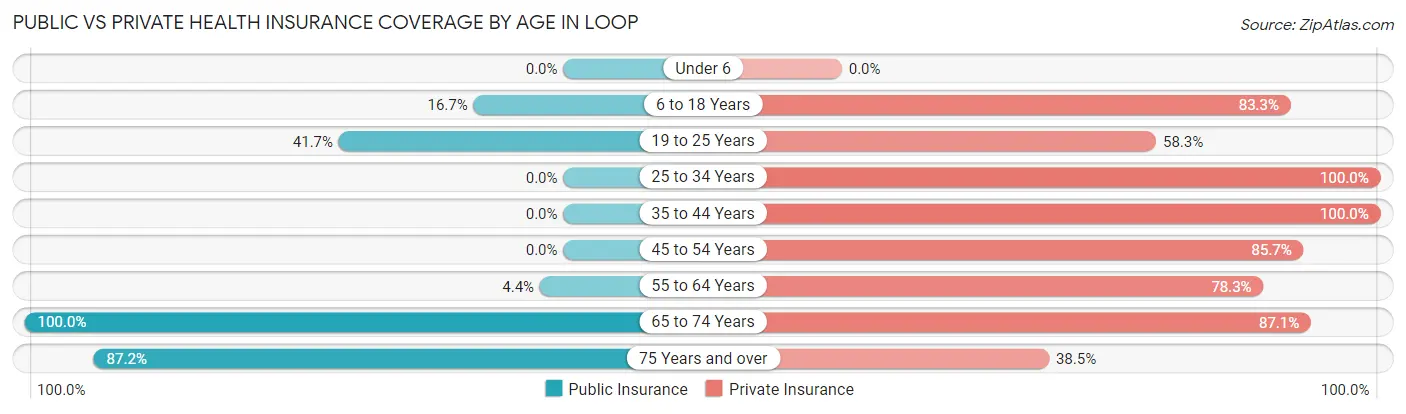
| Age Bracket | Public Insurance | Private Insurance |
| Under 6 | 0 (0.0%) | 0 (0.0%) |
| 6 to 18 Years | 6 (16.7%) | 30 (83.3%) |
| 19 to 25 Years | 5 (41.7%) | 7 (58.3%) |
| 25 to 34 Years | 0 (0.0%) | 1 (100.0%) |
| 35 to 44 Years | 0 (0.0%) | 23 (100.0%) |
| 45 to 54 Years | 0 (0.0%) | 6 (85.7%) |
| 55 to 64 Years | 1 (4.3%) | 18 (78.3%) |
| 65 to 74 Years | 31 (100.0%) | 27 (87.1%) |
| 75 Years and over | 34 (87.2%) | 15 (38.5%) |
| Total | 77 (44.8%) | 127 (73.8%) |
Disability Status by Sex by Age in Loop
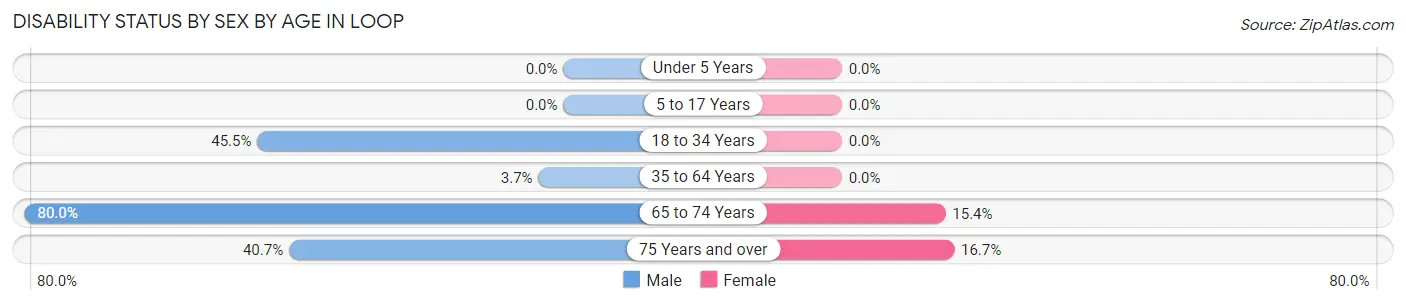
| Age Bracket | Male | Female |
| Under 5 Years | 0 (0.0%) | 0 (0.0%) |
| 5 to 17 Years | 0 (0.0%) | 0 (0.0%) |
| 18 to 34 Years | 5 (45.5%) | 0 (0.0%) |
| 35 to 64 Years | 1 (3.7%) | 0 (0.0%) |
| 65 to 74 Years | 4 (80.0%) | 4 (15.4%) |
| 75 Years and over | 11 (40.7%) | 2 (16.7%) |
Disability Class by Sex by Age in Loop
Disability Class: Hearing Difficulty
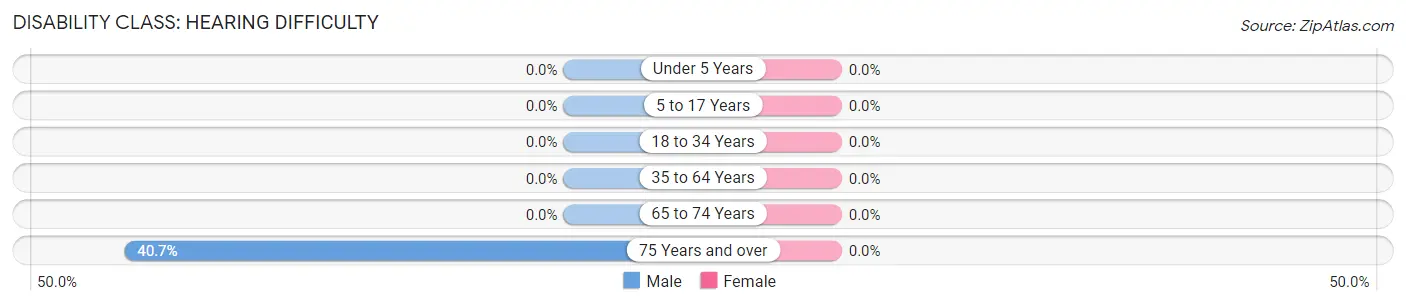
| Age Bracket | Male | Female |
| Under 5 Years | 0 (0.0%) | 0 (0.0%) |
| 5 to 17 Years | 0 (0.0%) | 0 (0.0%) |
| 18 to 34 Years | 0 (0.0%) | 0 (0.0%) |
| 35 to 64 Years | 0 (0.0%) | 0 (0.0%) |
| 65 to 74 Years | 0 (0.0%) | 0 (0.0%) |
| 75 Years and over | 11 (40.7%) | 0 (0.0%) |
Disability Class: Vision Difficulty
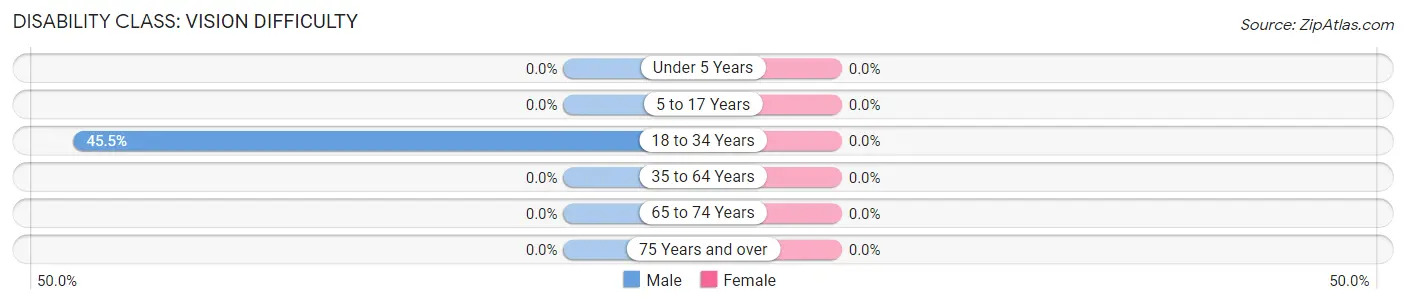
| Age Bracket | Male | Female |
| Under 5 Years | 0 (0.0%) | 0 (0.0%) |
| 5 to 17 Years | 0 (0.0%) | 0 (0.0%) |
| 18 to 34 Years | 5 (45.5%) | 0 (0.0%) |
| 35 to 64 Years | 0 (0.0%) | 0 (0.0%) |
| 65 to 74 Years | 0 (0.0%) | 0 (0.0%) |
| 75 Years and over | 0 (0.0%) | 0 (0.0%) |
Disability Class: Cognitive Difficulty
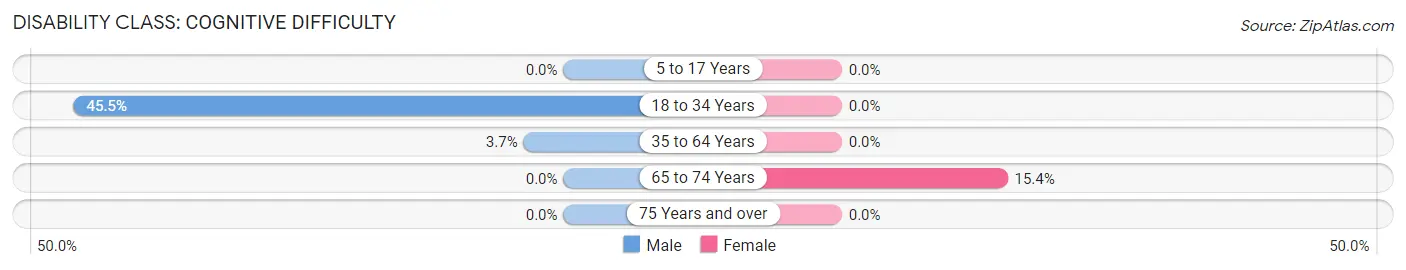
| Age Bracket | Male | Female |
| 5 to 17 Years | 0 (0.0%) | 0 (0.0%) |
| 18 to 34 Years | 5 (45.5%) | 0 (0.0%) |
| 35 to 64 Years | 1 (3.7%) | 0 (0.0%) |
| 65 to 74 Years | 0 (0.0%) | 4 (15.4%) |
| 75 Years and over | 0 (0.0%) | 0 (0.0%) |
Disability Class: Ambulatory Difficulty
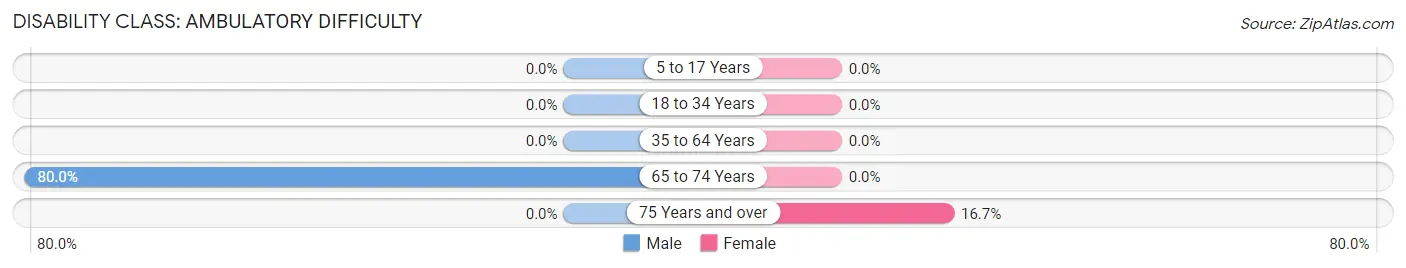
| Age Bracket | Male | Female |
| 5 to 17 Years | 0 (0.0%) | 0 (0.0%) |
| 18 to 34 Years | 0 (0.0%) | 0 (0.0%) |
| 35 to 64 Years | 0 (0.0%) | 0 (0.0%) |
| 65 to 74 Years | 4 (80.0%) | 0 (0.0%) |
| 75 Years and over | 0 (0.0%) | 2 (16.7%) |
Disability Class: Self-Care Difficulty
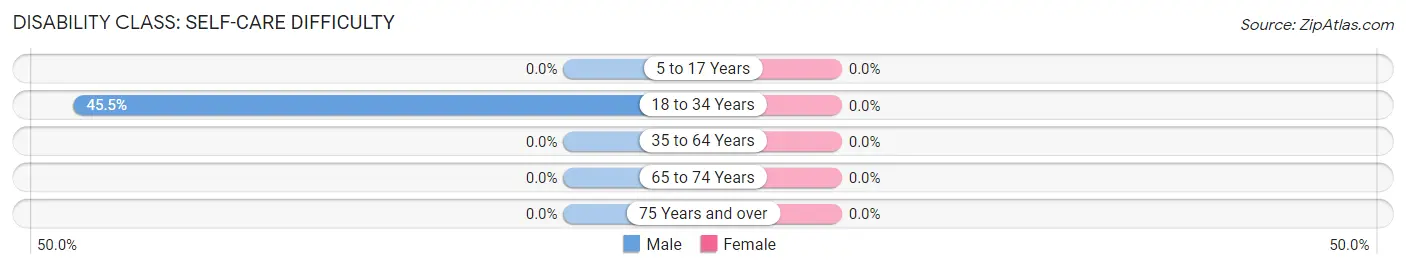
| Age Bracket | Male | Female |
| 5 to 17 Years | 0 (0.0%) | 0 (0.0%) |
| 18 to 34 Years | 5 (45.5%) | 0 (0.0%) |
| 35 to 64 Years | 0 (0.0%) | 0 (0.0%) |
| 65 to 74 Years | 0 (0.0%) | 0 (0.0%) |
| 75 Years and over | 0 (0.0%) | 0 (0.0%) |
Technology Access in Loop
Computing Device Access in Loop
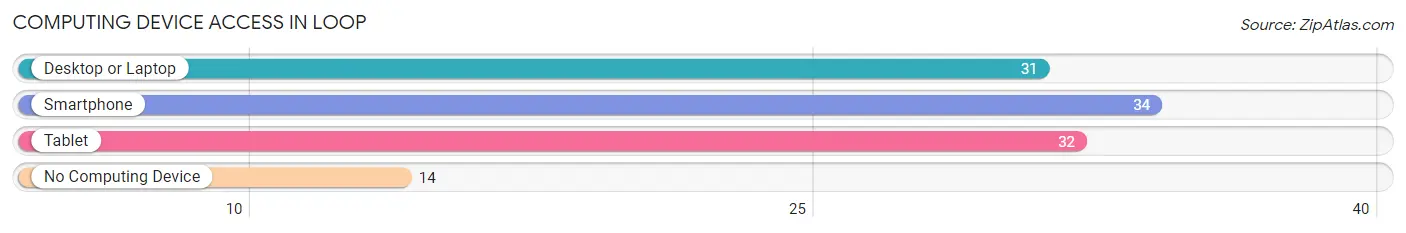
| Device Type | # Households | % Households |
| Desktop or Laptop | 31 | 54.4% |
| Smartphone | 34 | 59.7% |
| Tablet | 32 | 56.1% |
| No Computing Device | 14 | 24.6% |
| Total | 57 | 100.0% |
Internet Access in Loop
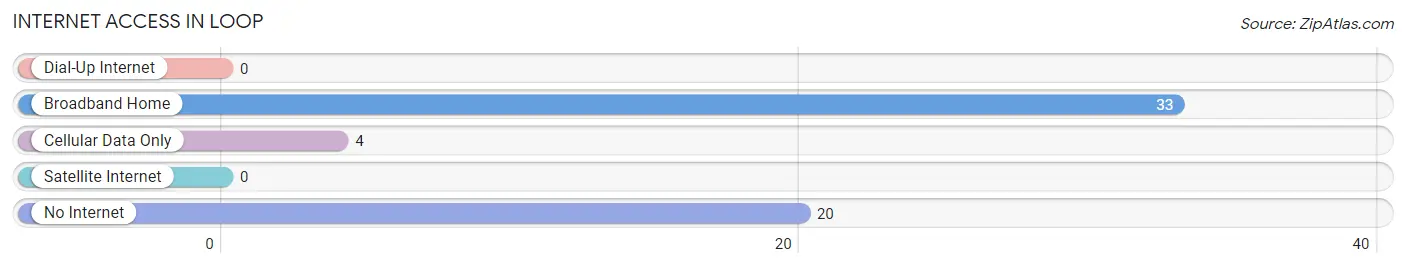
| Internet Type | # Households | % Households |
| Dial-Up Internet | 0 | 0.0% |
| Broadband Home | 33 | 57.9% |
| Cellular Data Only | 4 | 7.0% |
| Satellite Internet | 0 | 0.0% |
| No Internet | 20 | 35.1% |
| Total | 57 | 100.0% |
Loop Summary
Texas is a state located in the south-central region of the United States. It is the second largest state in the country, both in terms of population and land area. Texas has a rich and varied history, a diverse geography, a vibrant economy, and a unique set of demographics.
History
The history of Texas dates back to the 16th century, when Spanish explorers first arrived in the region. The area was claimed by Spain in 1519, and the first Spanish settlement was established in 1690. In 1821, Texas became part of Mexico, and in 1836, it declared its independence from Mexico and became the Republic of Texas. In 1845, Texas was annexed by the United States, and it became the 28th state in the Union.
During the Civil War, Texas was a Confederate state, and it was the site of several major battles. After the war, Texas experienced a period of rapid growth and development, and it became an important center of the oil and gas industry. In the 20th century, Texas was a leader in the civil rights movement, and it was the site of several important Supreme Court cases.
Geography
Texas is located in the south-central region of the United States, and it is bordered by Oklahoma, Arkansas, Louisiana, New Mexico, and Mexico. The state has a total area of 268,820 square miles, making it the second largest state in the country.
Texas is divided into four distinct geographic regions: the Gulf Coastal Plains, the Great Plains, the Edwards Plateau, and the Basin and Range Province. The Gulf Coastal Plains are located in the southeastern part of the state, and they are characterized by flat terrain and sandy beaches. The Great Plains are located in the northern and western parts of the state, and they are characterized by rolling hills and grasslands. The Edwards Plateau is located in the central part of the state, and it is characterized by rugged hills and canyons. The Basin and Range Province is located in the southwestern part of the state, and it is characterized by desert terrain and mountain ranges.
Economy
The economy of Texas is one of the largest and most diverse in the United States. The state is a major producer of oil and gas, and it is also a leader in the technology, manufacturing, and finance sectors.
The state’s largest industries include oil and gas, technology, manufacturing, finance, agriculture, and tourism. The state is also home to several major corporations, including Dell, ExxonMobil, AT&T, and Southwest Airlines.
Demographics
As of 2020, the population of Texas was estimated to be 29.1 million, making it the second most populous state in the country. The state is racially and ethnically diverse, with a majority of the population identifying as white (43.7%), followed by Hispanic or Latino (39.4%), African American (12.8%), and Asian (4.2%).
The median household income in Texas is $59,206, and the median home value is $195,400. The state’s largest cities include Houston, San Antonio, Dallas, Austin, and Fort Worth.
Texas is a diverse and vibrant state with a rich history, a unique geography, a thriving economy, and a unique set of demographics. The state is home to a variety of cultures and people, and it is an important part of the United States.
Common Questions
What is Per Capita Income in Loop?
Per Capita income in Loop is $29,313.
What is Inequality or Gini Index in Loop?
Inequality or Gini Index in Loop is 0.42.
What is the Total Population of Loop?
Total Population of Loop is 172.
What is the Total Male Population of Loop?
Total Male Population of Loop is 99.
What is the Total Female Population of Loop?
Total Female Population of Loop is 73.
What is the Ratio of Males per 100 Females in Loop?
There are 135.62 Males per 100 Females in Loop.
What is the Ratio of Females per 100 Males in Loop?
There are 73.74 Females per 100 Males in Loop.
What is the Median Population Age in Loop?
Median Population Age in Loop is 56.8 Years.
What is the Average Family Size in Loop
Average Family Size in Loop is 3.0 People.
What is the Average Household Size in Loop
Average Household Size in Loop is 2.8 People.
How Large is the Labor Force in Loop?
There are 68 People in the Labor Forcein in Loop.
What is the Percentage of People in the Labor Force in Loop?
50.0% of People are in the Labor Force in Loop.