Lockney, TX Map & Demographics
Lockney Map
Lockney Overview
$24,390
PER CAPITA INCOME
$65,298
AVG FAMILY INCOME
$52,500
AVG HOUSEHOLD INCOME
37.1%
WAGE / INCOME GAP [ % ]
62.9¢/ $1
WAGE / INCOME GAP [ $ ]
0.41
INEQUALITY / GINI INDEX
1,720
TOTAL POPULATION
822
MALE POPULATION
898
FEMALE POPULATION
91.54
MALES / 100 FEMALES
109.25
FEMALES / 100 MALES
44.0
MEDIAN AGE
3.3
AVG FAMILY SIZE
2.7
AVG HOUSEHOLD SIZE
843
LABOR FORCE [ PEOPLE ]
55.8%
PERCENT IN LABOR FORCE
5.0%
UNEMPLOYMENT RATE
Lockney Zip Codes
Lockney Area Codes
Income in Lockney
Income Overview in Lockney
Per Capita Income in Lockney is $24,390, while median incomes of families and households are $65,298 and $52,500 respectively.
| Characteristic | Number | Measure |
| Per Capita Income | 1,720 | $24,390 |
| Median Family Income | 435 | $65,298 |
| Mean Family Income | 435 | $74,177 |
| Median Household Income | 616 | $52,500 |
| Mean Household Income | 616 | $61,803 |
| Income Deficit | 435 | $0 |
| Wage / Income Gap (%) | 1,720 | 37.14% |
| Wage / Income Gap ($) | 1,720 | 62.86¢ per $1 |
| Gini / Inequality Index | 1,720 | 0.41 |
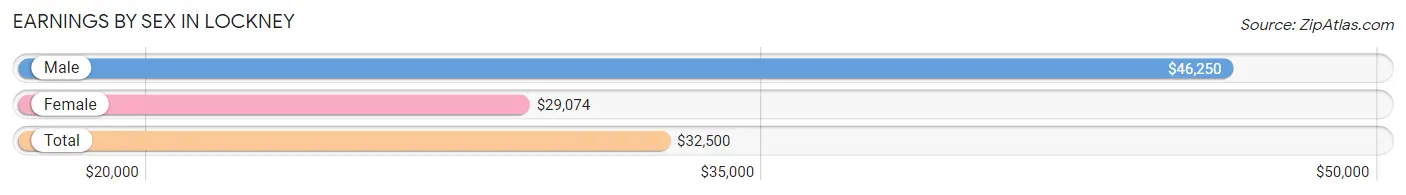
Earnings by Sex in Lockney
Average Earnings in Lockney are $32,500, $46,250 for men and $29,074 for women, a difference of 37.1%.
| Sex | Number | Average Earnings |
| Male | 330 (40.9%) | $46,250 |
| Female | 476 (59.1%) | $29,074 |
| Total | 806 (100.0%) | $32,500 |
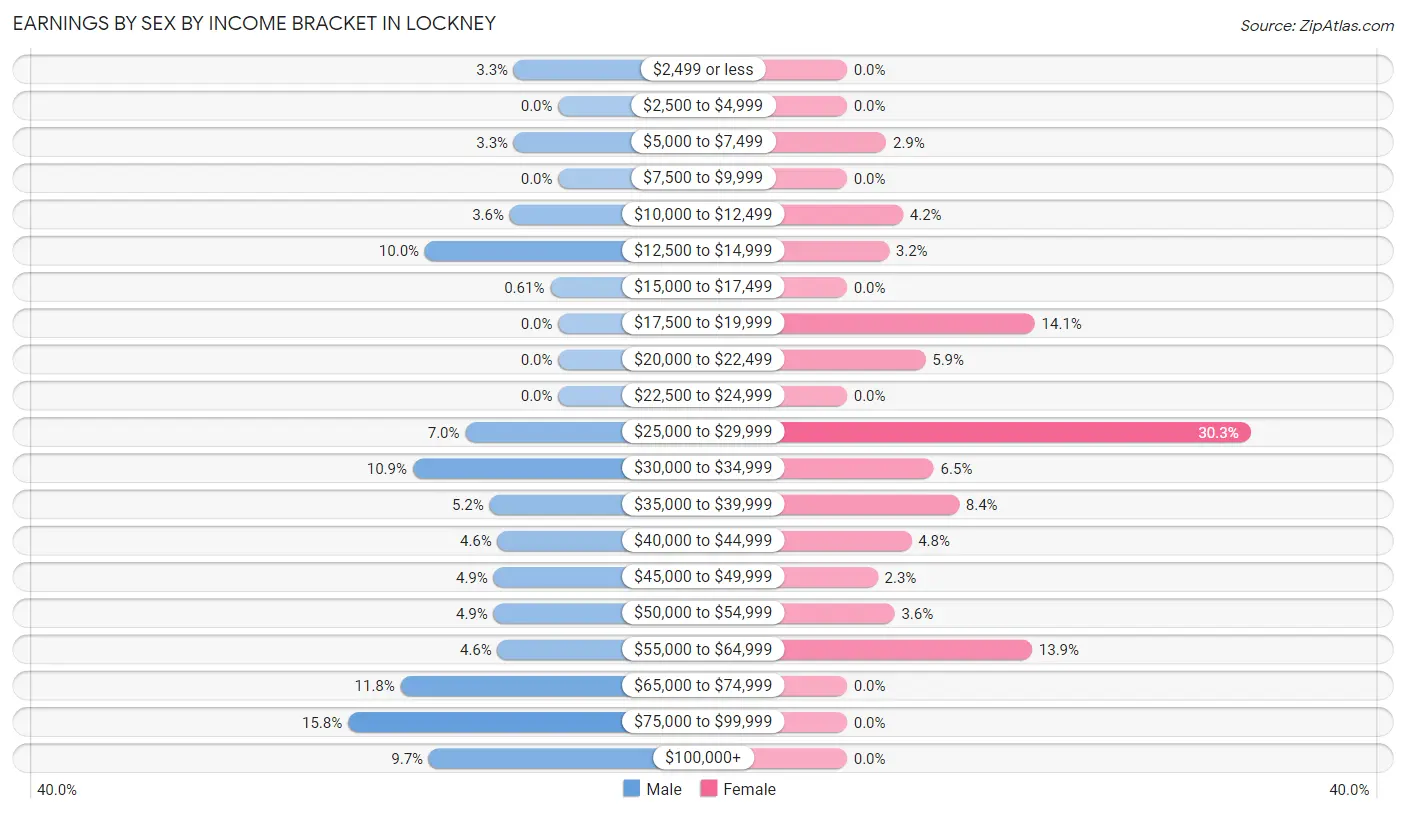
Earnings by Sex by Income Bracket in Lockney
The most common earnings brackets in Lockney are $75,000 to $99,999 for men (52 | 15.8%) and $25,000 to $29,999 for women (144 | 30.2%).
| Income | Male | Female |
| $2,499 or less | 11 (3.3%) | 0 (0.0%) |
| $2,500 to $4,999 | 0 (0.0%) | 0 (0.0%) |
| $5,000 to $7,499 | 11 (3.3%) | 14 (2.9%) |
| $7,500 to $9,999 | 0 (0.0%) | 0 (0.0%) |
| $10,000 to $12,499 | 12 (3.6%) | 20 (4.2%) |
| $12,500 to $14,999 | 33 (10.0%) | 15 (3.2%) |
| $15,000 to $17,499 | 2 (0.6%) | 0 (0.0%) |
| $17,500 to $19,999 | 0 (0.0%) | 67 (14.1%) |
| $20,000 to $22,499 | 0 (0.0%) | 28 (5.9%) |
| $22,500 to $24,999 | 0 (0.0%) | 0 (0.0%) |
| $25,000 to $29,999 | 23 (7.0%) | 144 (30.2%) |
| $30,000 to $34,999 | 36 (10.9%) | 31 (6.5%) |
| $35,000 to $39,999 | 17 (5.1%) | 40 (8.4%) |
| $40,000 to $44,999 | 15 (4.5%) | 23 (4.8%) |
| $45,000 to $49,999 | 16 (4.9%) | 11 (2.3%) |
| $50,000 to $54,999 | 16 (4.9%) | 17 (3.6%) |
| $55,000 to $64,999 | 15 (4.5%) | 66 (13.9%) |
| $65,000 to $74,999 | 39 (11.8%) | 0 (0.0%) |
| $75,000 to $99,999 | 52 (15.8%) | 0 (0.0%) |
| $100,000+ | 32 (9.7%) | 0 (0.0%) |
| Total | 330 (100.0%) | 476 (100.0%) |
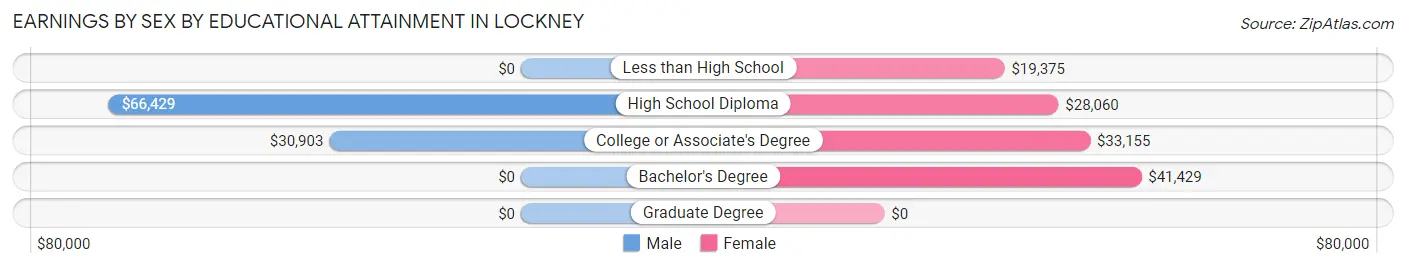
Earnings by Sex by Educational Attainment in Lockney
Average earnings in Lockney are $47,000 for men and $29,729 for women, a difference of 36.7%. Men with an educational attainment of high school diploma enjoy the highest average annual earnings of $66,429, while those with college or associate's degree education earn the least with $30,903. Women with an educational attainment of bachelor's degree earn the most with the average annual earnings of $41,429, while those with less than high school education have the smallest earnings of $19,375.
| Educational Attainment | Male Income | Female Income |
| Less than High School | - | - |
| High School Diploma | $66,429 | $28,060 |
| College or Associate's Degree | $30,903 | $33,155 |
| Bachelor's Degree | - | - |
| Graduate Degree | - | - |
| Total | $47,000 | $29,729 |
Family Income in Lockney
Family Income Brackets in Lockney
According to the Lockney family income data, there are 85 families falling into the $50,000 to $74,999 income range, which is the most common income bracket and makes up 19.5% of all families. Conversely, the less than $10,000 income bracket is the least frequent group with only 2 families (0.5%) belonging to this category.
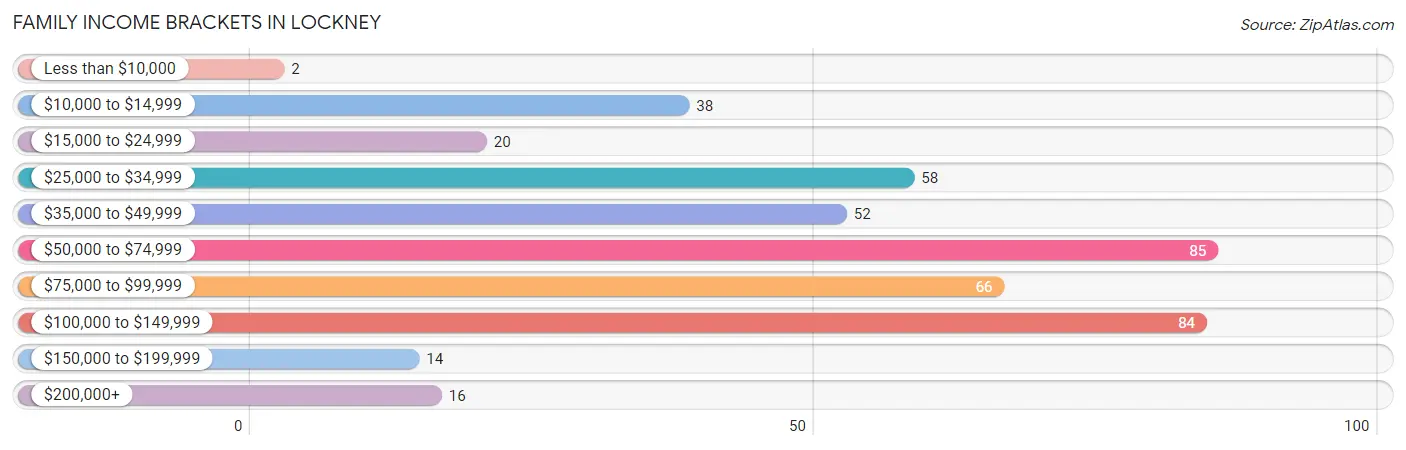
| Income Bracket | # Families | % Families |
| Less than $10,000 | 2 | 0.5% |
| $10,000 to $14,999 | 38 | 8.7% |
| $15,000 to $24,999 | 20 | 4.6% |
| $25,000 to $34,999 | 58 | 13.3% |
| $35,000 to $49,999 | 52 | 12.0% |
| $50,000 to $74,999 | 85 | 19.5% |
| $75,000 to $99,999 | 66 | 15.2% |
| $100,000 to $149,999 | 84 | 19.3% |
| $150,000 to $199,999 | 14 | 3.2% |
| $200,000+ | 16 | 3.7% |
Family Income by Famaliy Size in Lockney
5-person families (42 | 9.7%) account for the highest median family income in Lockney with $112,813 per family, while 2-person families (207 | 47.6%) have the highest median income of $29,554 per family member.
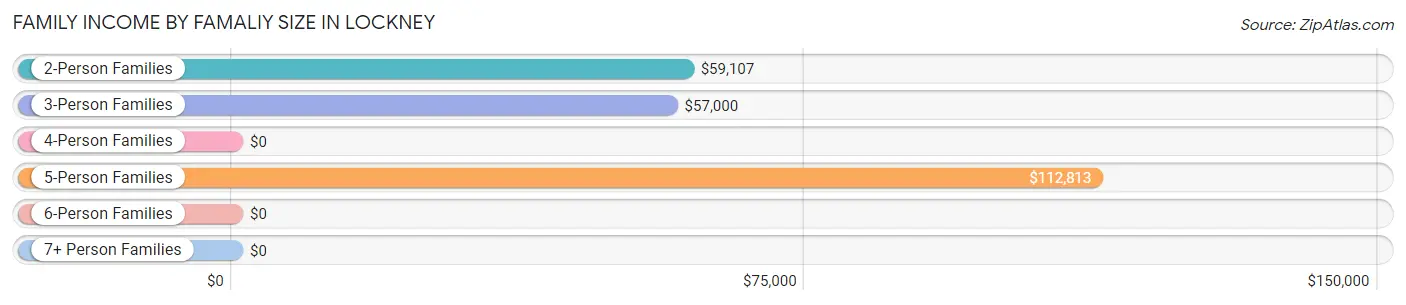
| Income Bracket | # Families | Median Income |
| 2-Person Families | 207 (47.6%) | $59,107 |
| 3-Person Families | 120 (27.6%) | $57,000 |
| 4-Person Families | 66 (15.2%) | $0 |
| 5-Person Families | 42 (9.7%) | $112,813 |
| 6-Person Families | 0 (0.0%) | $0 |
| 7+ Person Families | 0 (0.0%) | $0 |
| Total | 435 (100.0%) | $65,298 |
Family Income by Number of Earners in Lockney
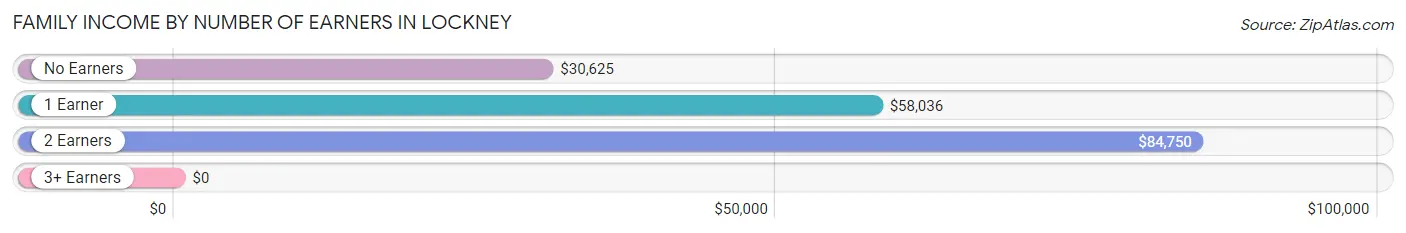
| Number of Earners | # Families | Median Income |
| No Earners | 51 (11.7%) | $30,625 |
| 1 Earner | 201 (46.2%) | $58,036 |
| 2 Earners | 172 (39.5%) | $84,750 |
| 3+ Earners | 11 (2.5%) | $0 |
| Total | 435 (100.0%) | $65,298 |
Household Income in Lockney
Household Income Brackets in Lockney
With 124 households falling in the category, the $50,000 to $74,999 income range is the most frequent in Lockney, accounting for 20.1% of all households. In contrast, only 14 households (2.3%) fall into the $150,000 to $199,999 income bracket, making it the least populous group.
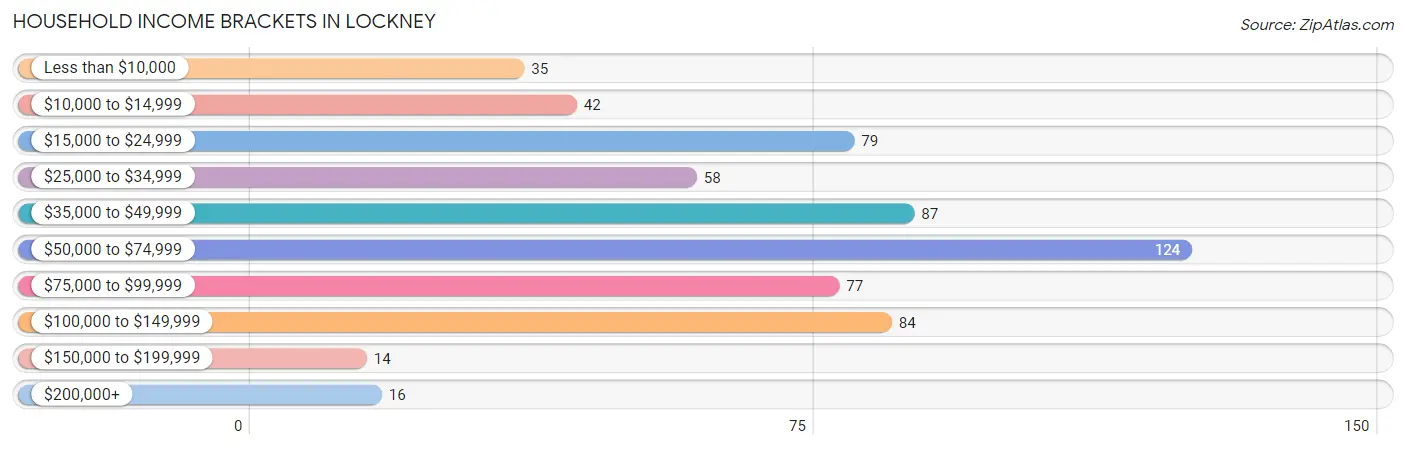
| Income Bracket | # Households | % Households |
| Less than $10,000 | 35 | 5.7% |
| $10,000 to $14,999 | 42 | 6.8% |
| $15,000 to $24,999 | 79 | 12.8% |
| $25,000 to $34,999 | 58 | 9.4% |
| $35,000 to $49,999 | 87 | 14.1% |
| $50,000 to $74,999 | 124 | 20.1% |
| $75,000 to $99,999 | 77 | 12.5% |
| $100,000 to $149,999 | 84 | 13.6% |
| $150,000 to $199,999 | 14 | 2.3% |
| $200,000+ | 16 | 2.6% |
Household Income by Householder Age in Lockney
The median household income in Lockney is $52,500, with the highest median household income of $68,173 found in the 45 to 64 years age bracket for the primary householder. A total of 245 households (39.8%) fall into this category. Meanwhile, the 65+ years age bracket for the primary householder has the lowest median household income of $22,143, with 172 households (27.9%) in this group.
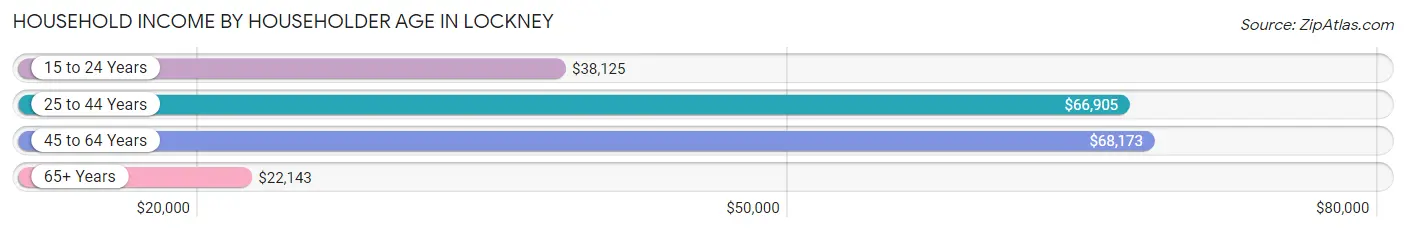
| Income Bracket | # Households | Median Income |
| 15 to 24 Years | 55 (8.9%) | $38,125 |
| 25 to 44 Years | 144 (23.4%) | $66,905 |
| 45 to 64 Years | 245 (39.8%) | $68,173 |
| 65+ Years | 172 (27.9%) | $22,143 |
| Total | 616 (100.0%) | $52,500 |
Poverty in Lockney
Income Below Poverty by Sex and Age in Lockney
With 18.0% poverty level for males and 14.5% for females among the residents of Lockney, 18 to 24 year old males and 5 year old females are the most vulnerable to poverty, with 22 males (100.0%) and 17 females (100.0%) in their respective age groups living below the poverty level.
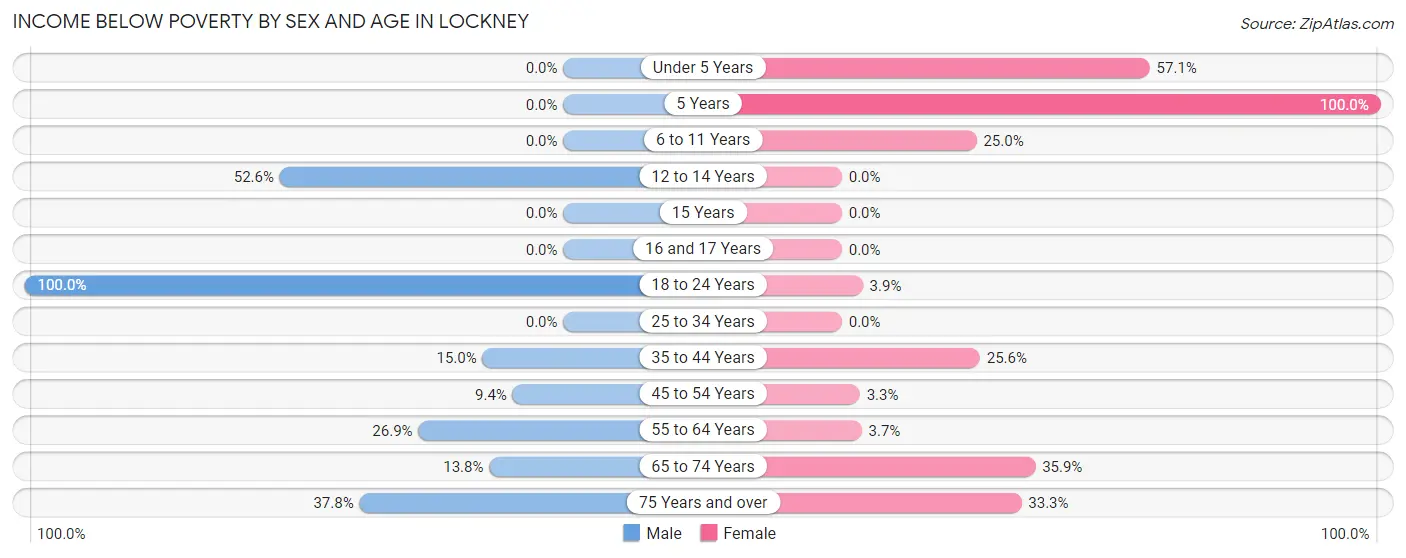
| Age Bracket | Male | Female |
| Under 5 Years | 0 (0.0%) | 16 (57.1%) |
| 5 Years | 0 (0.0%) | 17 (100.0%) |
| 6 to 11 Years | 0 (0.0%) | 9 (25.0%) |
| 12 to 14 Years | 10 (52.6%) | 0 (0.0%) |
| 15 Years | 0 (0.0%) | 0 (0.0%) |
| 16 and 17 Years | 0 (0.0%) | 0 (0.0%) |
| 18 to 24 Years | 22 (100.0%) | 6 (3.9%) |
| 25 to 34 Years | 0 (0.0%) | 0 (0.0%) |
| 35 to 44 Years | 27 (15.0%) | 21 (25.6%) |
| 45 to 54 Years | 8 (9.4%) | 4 (3.3%) |
| 55 to 64 Years | 39 (26.9%) | 6 (3.7%) |
| 65 to 74 Years | 11 (13.8%) | 28 (35.9%) |
| 75 Years and over | 28 (37.8%) | 21 (33.3%) |
| Total | 145 (18.0%) | 128 (14.5%) |
Income Above Poverty by Sex and Age in Lockney
According to the poverty statistics in Lockney, males aged under 5 years and females aged 12 to 14 years are the age groups that are most secure financially, with 100.0% of males and 100.0% of females in these age groups living above the poverty line.
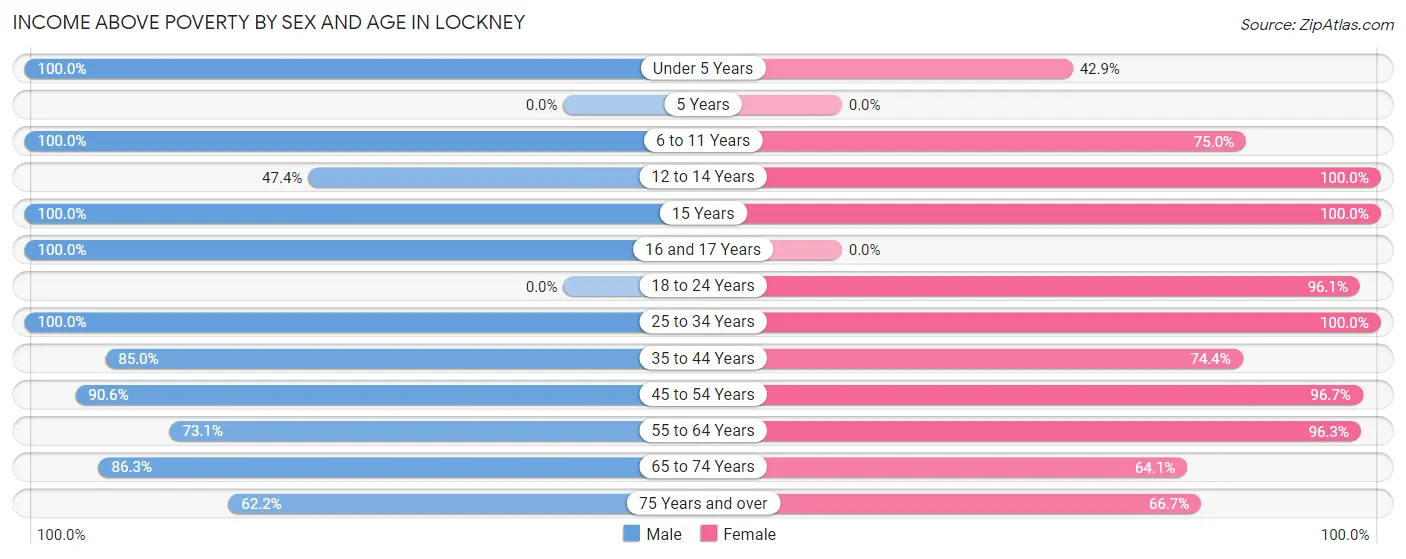
| Age Bracket | Male | Female |
| Under 5 Years | 25 (100.0%) | 12 (42.9%) |
| 5 Years | 0 (0.0%) | 0 (0.0%) |
| 6 to 11 Years | 18 (100.0%) | 27 (75.0%) |
| 12 to 14 Years | 9 (47.4%) | 34 (100.0%) |
| 15 Years | 4 (100.0%) | 29 (100.0%) |
| 16 and 17 Years | 24 (100.0%) | 0 (0.0%) |
| 18 to 24 Years | 0 (0.0%) | 149 (96.1%) |
| 25 to 34 Years | 131 (100.0%) | 78 (100.0%) |
| 35 to 44 Years | 153 (85.0%) | 61 (74.4%) |
| 45 to 54 Years | 77 (90.6%) | 116 (96.7%) |
| 55 to 64 Years | 106 (73.1%) | 157 (96.3%) |
| 65 to 74 Years | 69 (86.3%) | 50 (64.1%) |
| 75 Years and over | 46 (62.2%) | 42 (66.7%) |
| Total | 662 (82.0%) | 755 (85.5%) |
Income Below Poverty Among Married-Couple Families in Lockney
The poverty statistics for married-couple families in Lockney show that 12.2% or 46 of the total 376 families live below the poverty line. Families with 1 or 2 children have the highest poverty rate of 16.7%, comprising of 29 families. On the other hand, families with no children have the lowest poverty rate of 8.4%, which includes 17 families.
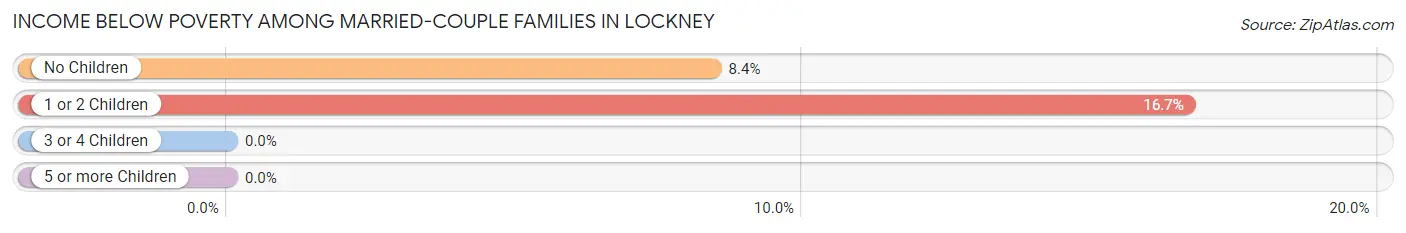
| Children | Above Poverty | Below Poverty |
| No Children | 185 (91.6%) | 17 (8.4%) |
| 1 or 2 Children | 145 (83.3%) | 29 (16.7%) |
| 3 or 4 Children | 0 (0.0%) | 0 (0.0%) |
| 5 or more Children | 0 (0.0%) | 0 (0.0%) |
| Total | 330 (87.8%) | 46 (12.2%) |
Income Below Poverty Among Single-Parent Households in Lockney
According to the poverty data in Lockney, 28.6% or 4 single-father households and 4.4% or 2 single-mother households are living below the poverty line. Among single-father households, those with no children have the highest poverty rate, with 4 households (28.6%) experiencing poverty. Likewise, among single-mother households, those with 1 or 2 children have the highest poverty rate, with 2 households (6.5%) falling below the poverty line.
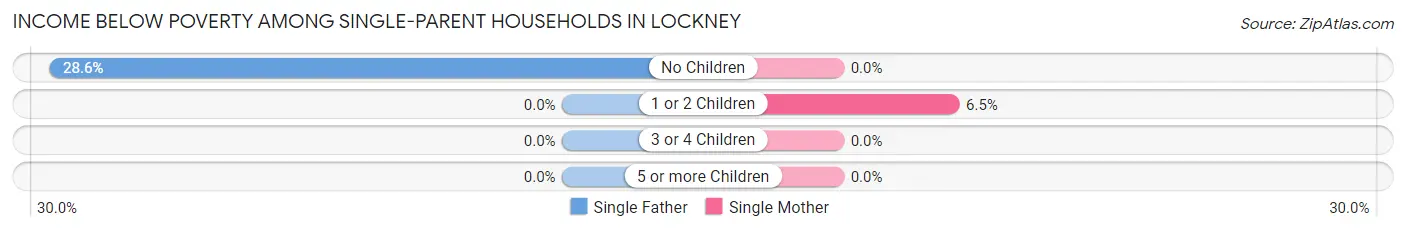
| Children | Single Father | Single Mother |
| No Children | 4 (28.6%) | 0 (0.0%) |
| 1 or 2 Children | 0 (0.0%) | 2 (6.5%) |
| 3 or 4 Children | 0 (0.0%) | 0 (0.0%) |
| 5 or more Children | 0 (0.0%) | 0 (0.0%) |
| Total | 4 (28.6%) | 2 (4.4%) |
Income Below Poverty Among Married-Couple vs Single-Parent Households in Lockney
The poverty data for Lockney shows that 46 of the married-couple family households (12.2%) and 6 of the single-parent households (10.2%) are living below the poverty level. Within the married-couple family households, those with 1 or 2 children have the highest poverty rate, with 29 households (16.7%) falling below the poverty line. Among the single-parent households, those with no children have the highest poverty rate, with 4 household (14.3%) living below poverty.
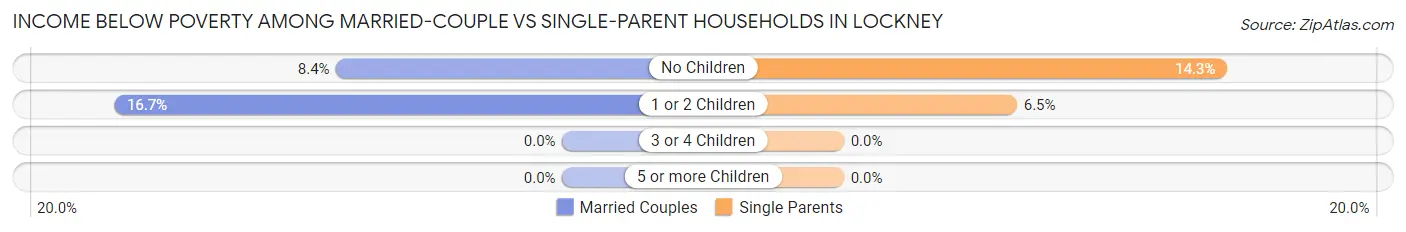
| Children | Married-Couple Families | Single-Parent Households |
| No Children | 17 (8.4%) | 4 (14.3%) |
| 1 or 2 Children | 29 (16.7%) | 2 (6.5%) |
| 3 or 4 Children | 0 (0.0%) | 0 (0.0%) |
| 5 or more Children | 0 (0.0%) | 0 (0.0%) |
| Total | 46 (12.2%) | 6 (10.2%) |
Race in Lockney
The most populous races in Lockney are White / Caucasian (1,492 | 86.7%), Hispanic or Latino (1,025 | 59.6%), and Two or more Races (168 | 9.8%).
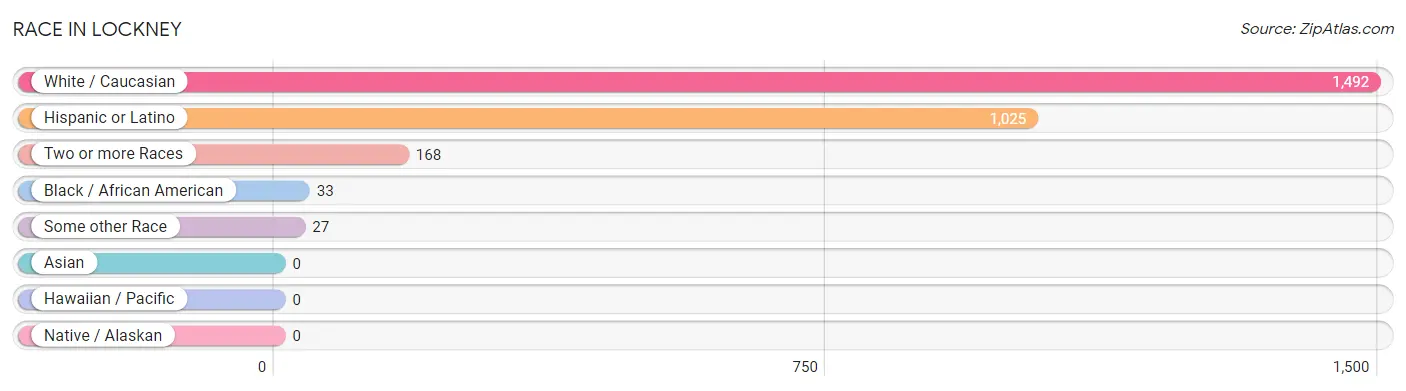
| Race | # Population | % Population |
| Asian | 0 | 0.0% |
| Black / African American | 33 | 1.9% |
| Hawaiian / Pacific | 0 | 0.0% |
| Hispanic or Latino | 1,025 | 59.6% |
| Native / Alaskan | 0 | 0.0% |
| White / Caucasian | 1,492 | 86.7% |
| Two or more Races | 168 | 9.8% |
| Some other Race | 27 | 1.6% |
| Total | 1,720 | 100.0% |
Ancestry in Lockney
The most populous ancestries reported in Lockney are Mexican (993 | 57.7%), Irish (149 | 8.7%), German (88 | 5.1%), English (54 | 3.1%), and African (30 | 1.7%), together accounting for 76.4% of all Lockney residents.
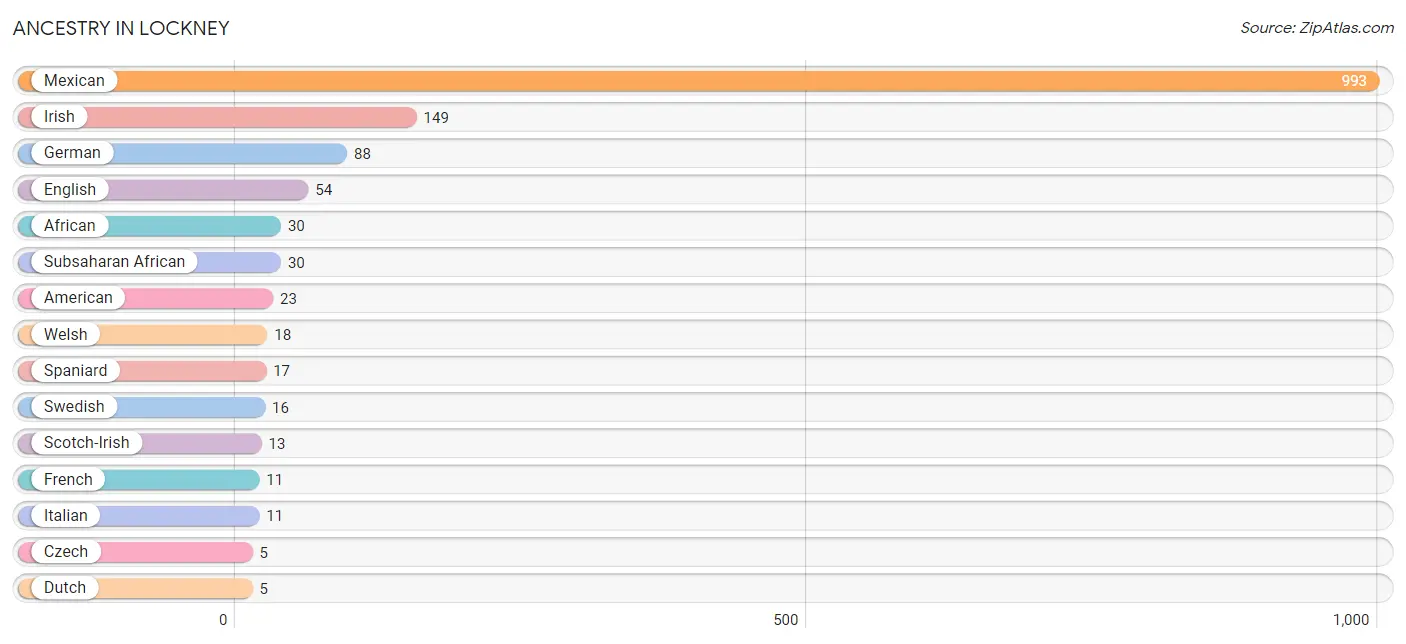
| Ancestry | # Population | % Population |
| African | 30 | 1.7% |
| American | 23 | 1.3% |
| Czech | 5 | 0.3% |
| Dutch | 5 | 0.3% |
| English | 54 | 3.1% |
| European | 5 | 0.3% |
| French | 11 | 0.6% |
| German | 88 | 5.1% |
| Irish | 149 | 8.7% |
| Italian | 11 | 0.6% |
| Mexican | 993 | 57.7% |
| Scotch-Irish | 13 | 0.8% |
| Spaniard | 17 | 1.0% |
| Subsaharan African | 30 | 1.7% |
| Swedish | 16 | 0.9% |
| Welsh | 18 | 1.1% | View All 16 Rows |
Immigrants in Lockney
The most numerous immigrant groups reported in Lockney came from Central America (166 | 9.7%), Latin America (166 | 9.7%), and Mexico (166 | 9.7%), together accounting for 28.9% of all Lockney residents.
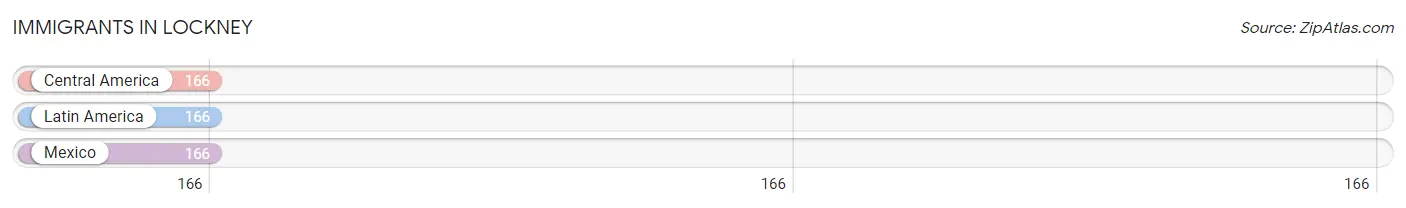
| Immigration Origin | # Population | % Population |
| Central America | 166 | 9.7% |
| Latin America | 166 | 9.7% |
| Mexico | 166 | 9.7% | View All 3 Rows |
Sex and Age in Lockney
Sex and Age in Lockney
The most populous age groups in Lockney are 35 to 39 Years (122 | 14.8%) for men and 20 to 24 Years (146 | 16.3%) for women.
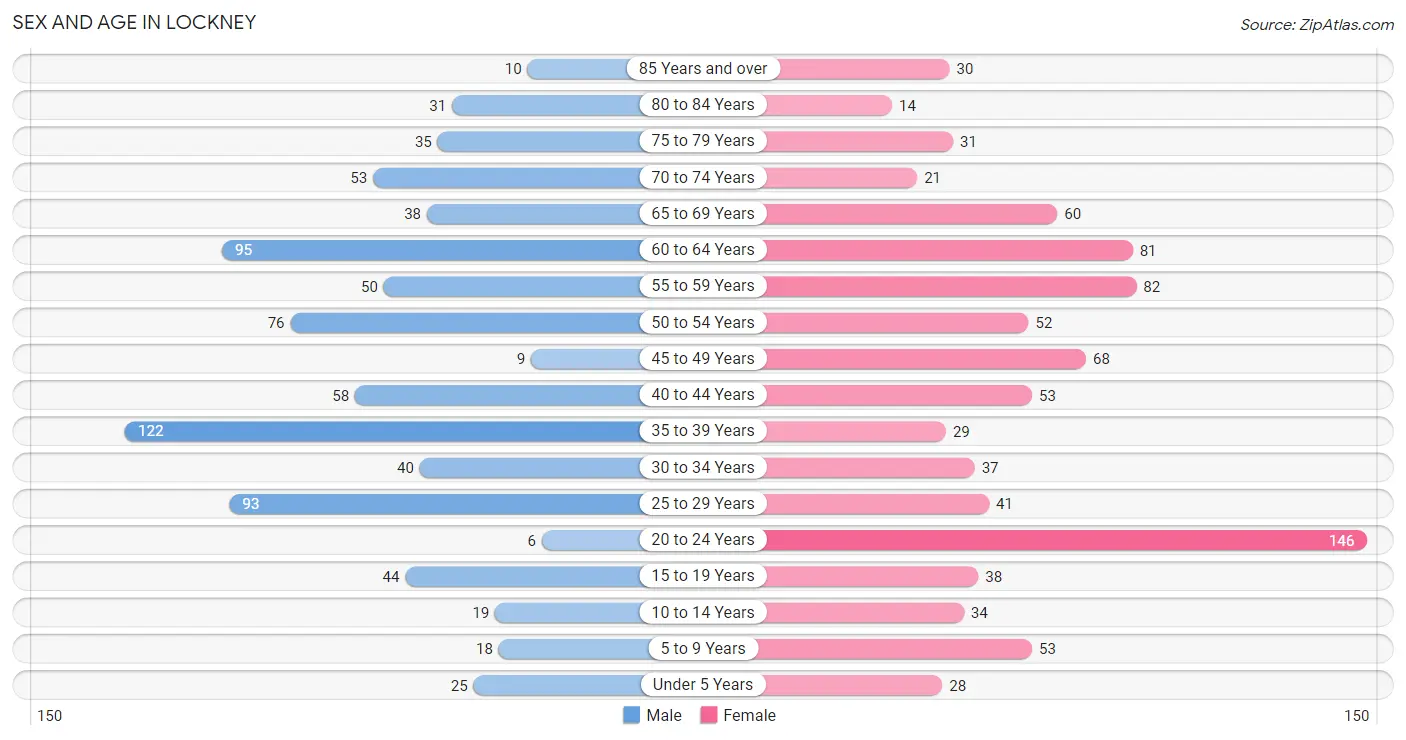
| Age Bracket | Male | Female |
| Under 5 Years | 25 (3.0%) | 28 (3.1%) |
| 5 to 9 Years | 18 (2.2%) | 53 (5.9%) |
| 10 to 14 Years | 19 (2.3%) | 34 (3.8%) |
| 15 to 19 Years | 44 (5.3%) | 38 (4.2%) |
| 20 to 24 Years | 6 (0.7%) | 146 (16.3%) |
| 25 to 29 Years | 93 (11.3%) | 41 (4.6%) |
| 30 to 34 Years | 40 (4.9%) | 37 (4.1%) |
| 35 to 39 Years | 122 (14.8%) | 29 (3.2%) |
| 40 to 44 Years | 58 (7.1%) | 53 (5.9%) |
| 45 to 49 Years | 9 (1.1%) | 68 (7.6%) |
| 50 to 54 Years | 76 (9.2%) | 52 (5.8%) |
| 55 to 59 Years | 50 (6.1%) | 82 (9.1%) |
| 60 to 64 Years | 95 (11.6%) | 81 (9.0%) |
| 65 to 69 Years | 38 (4.6%) | 60 (6.7%) |
| 70 to 74 Years | 53 (6.5%) | 21 (2.3%) |
| 75 to 79 Years | 35 (4.3%) | 31 (3.5%) |
| 80 to 84 Years | 31 (3.8%) | 14 (1.6%) |
| 85 Years and over | 10 (1.2%) | 30 (3.3%) |
| Total | 822 (100.0%) | 898 (100.0%) |
Families and Households in Lockney
Median Family Size in Lockney
The median family size in Lockney is 3.28 persons per family, with single male/father families (14 | 3.2%) accounting for the largest median family size of 3.36 persons per family. On the other hand, single female/mother families (45 | 10.3%) represent the smallest median family size with 3.22 persons per family.
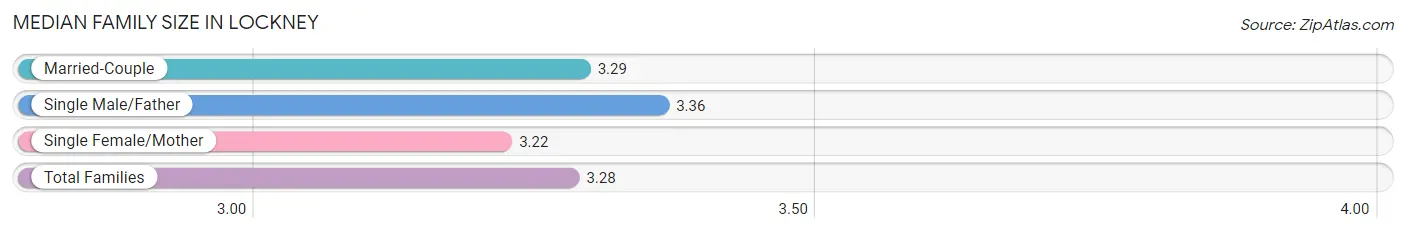
| Family Type | # Families | Family Size |
| Married-Couple | 376 (86.4%) | 3.29 |
| Single Male/Father | 14 (3.2%) | 3.36 |
| Single Female/Mother | 45 (10.3%) | 3.22 |
| Total Families | 435 (100.0%) | 3.28 |
Median Household Size in Lockney
The median household size in Lockney is 2.74 persons per household, with single female/mother households (45 | 7.3%) accounting for the largest median household size of 3.53 persons per household. non-family households (181 | 29.4%) represent the smallest median household size with 1.37 persons per household.
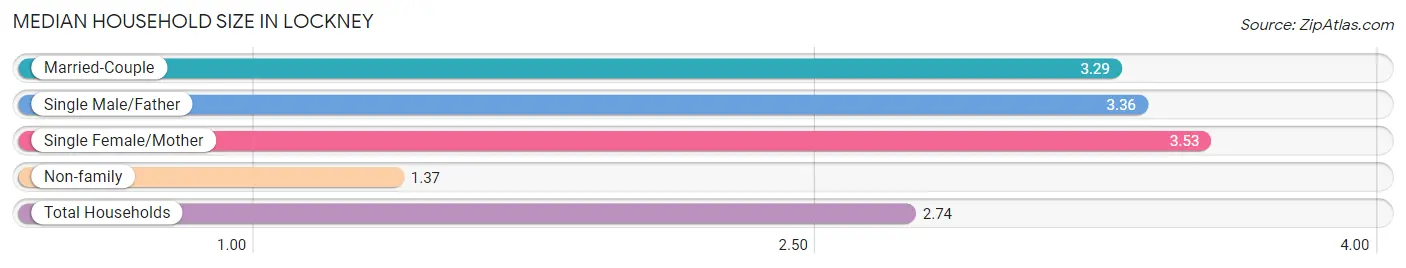
| Household Type | # Households | Household Size |
| Married-Couple | 376 (61.0%) | 3.29 |
| Single Male/Father | 14 (2.3%) | 3.36 |
| Single Female/Mother | 45 (7.3%) | 3.53 |
| Non-family | 181 (29.4%) | 1.37 |
| Total Households | 616 (100.0%) | 2.74 |
Household Size by Marriage Status in Lockney
Out of a total of 616 households in Lockney, 435 (70.6%) are family households, while 181 (29.4%) are nonfamily households. The most numerous type of family households are 2-person households, comprising 207, and the most common type of nonfamily households are 1-person households, comprising 163.
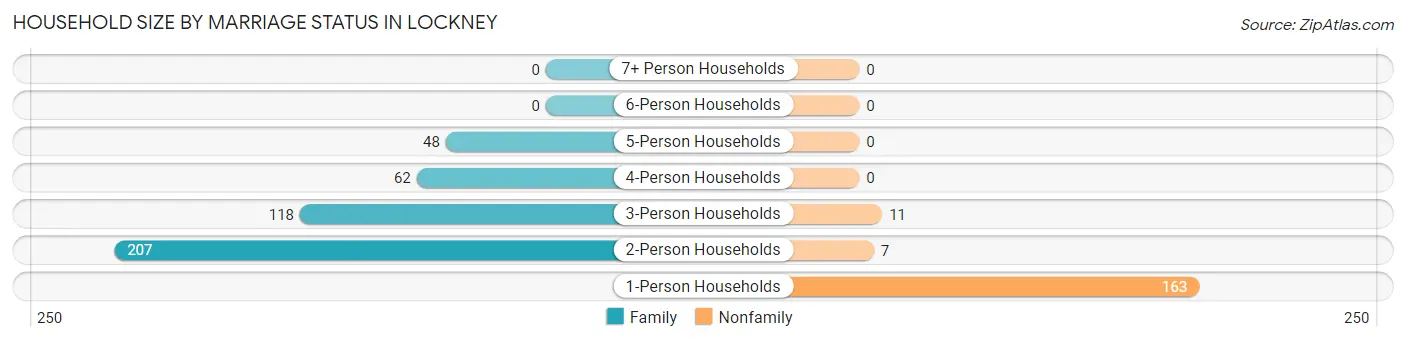
| Household Size | Family Households | Nonfamily Households |
| 1-Person Households | - | 163 (26.5%) |
| 2-Person Households | 207 (33.6%) | 7 (1.1%) |
| 3-Person Households | 118 (19.2%) | 11 (1.8%) |
| 4-Person Households | 62 (10.1%) | 0 (0.0%) |
| 5-Person Households | 48 (7.8%) | 0 (0.0%) |
| 6-Person Households | 0 (0.0%) | 0 (0.0%) |
| 7+ Person Households | 0 (0.0%) | 0 (0.0%) |
| Total | 435 (70.6%) | 181 (29.4%) |
Female Fertility in Lockney
Fertility by Age in Lockney
Average fertility rate in Lockney is 40.0 births per 1,000 women. Women in the age bracket of 20 to 34 years have the highest fertility rate with 76.0 births per 1,000 women. Women in the age bracket of 20 to 34 years acount for 100.0% of all women with births.
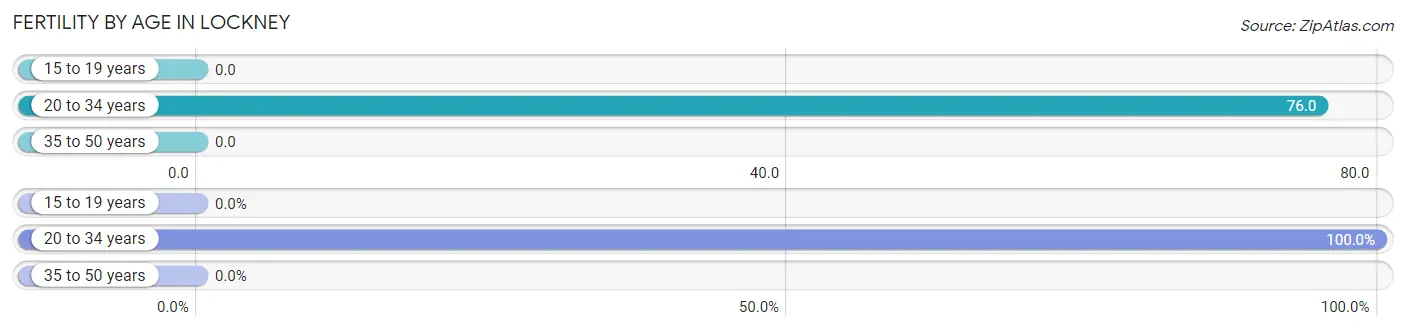
| Age Bracket | Women with Births | Births / 1,000 Women |
| 15 to 19 years | 0 (0.0%) | 0.0 |
| 20 to 34 years | 17 (100.0%) | 76.0 |
| 35 to 50 years | 0 (0.0%) | 0.0 |
| Total | 17 (100.0%) | 40.0 |
Fertility by Age by Marriage Status in Lockney
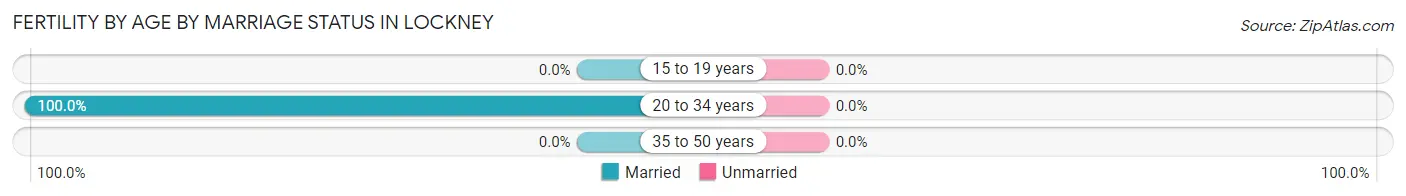
| Age Bracket | Married | Unmarried |
| 15 to 19 years | 0 (0.0%) | 0 (0.0%) |
| 20 to 34 years | 17 (100.0%) | 0 (0.0%) |
| 35 to 50 years | 0 (0.0%) | 0 (0.0%) |
| Total | 17 (100.0%) | 0 (0.0%) |
Fertility by Education in Lockney
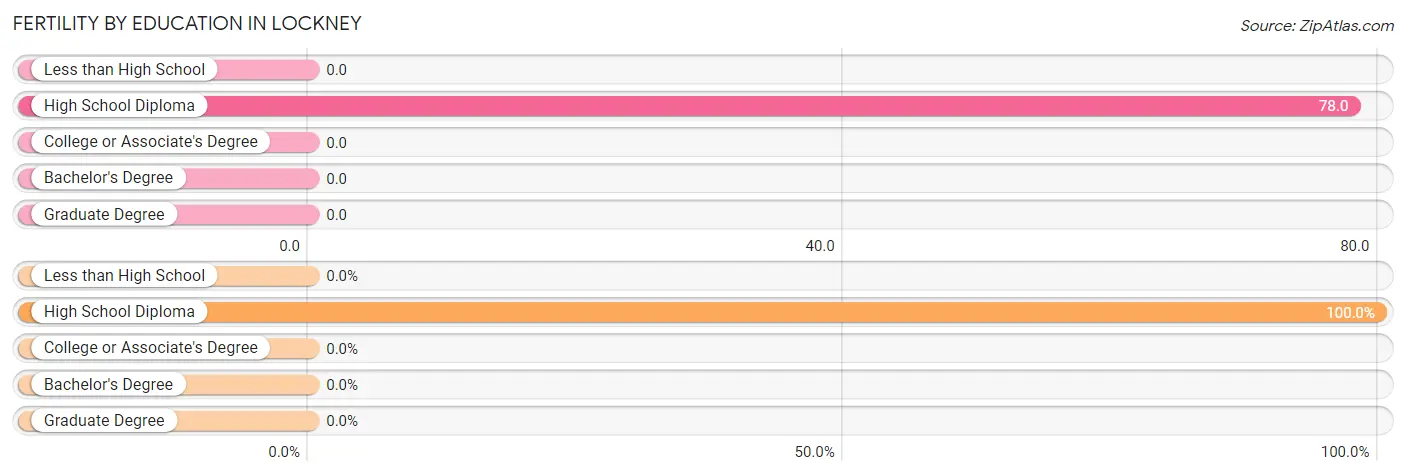
| Educational Attainment | Women with Births | Births / 1,000 Women |
| Less than High School | 0 (0.0%) | 0.0 |
| High School Diploma | 17 (100.0%) | 78.0 |
| College or Associate's Degree | 0 (0.0%) | 0.0 |
| Bachelor's Degree | 0 (0.0%) | 0.0 |
| Graduate Degree | 0 (0.0%) | 0.0 |
| Total | 17 (100.0%) | 40.0 |
Fertility by Education by Marriage Status in Lockney
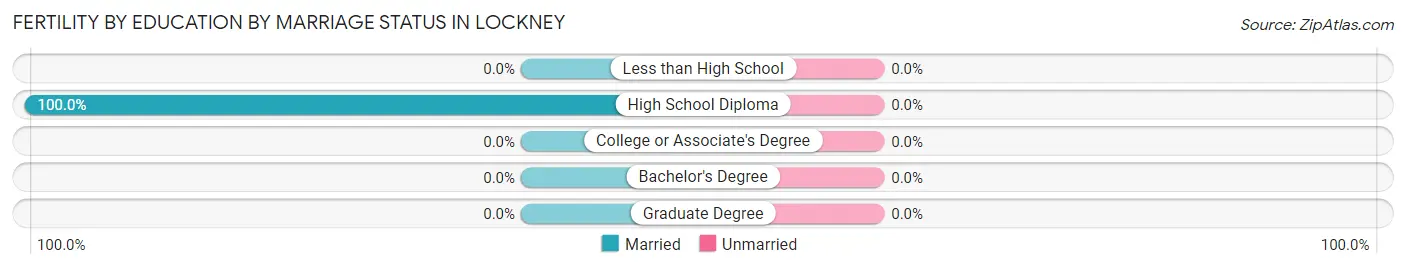
| Educational Attainment | Married | Unmarried |
| Less than High School | 0 (0.0%) | 0 (0.0%) |
| High School Diploma | 17 (100.0%) | 0 (0.0%) |
| College or Associate's Degree | 0 (0.0%) | 0 (0.0%) |
| Bachelor's Degree | 0 (0.0%) | 0 (0.0%) |
| Graduate Degree | 0 (0.0%) | 0 (0.0%) |
| Total | 17 (100.0%) | 0 (0.0%) |
Employment Characteristics in Lockney
Employment by Class of Employer in Lockney
Among the 789 employed individuals in Lockney, private company employees (469 | 59.4%), local government employees (168 | 21.3%), and state government employees (77 | 9.8%) make up the most common classes of employment.
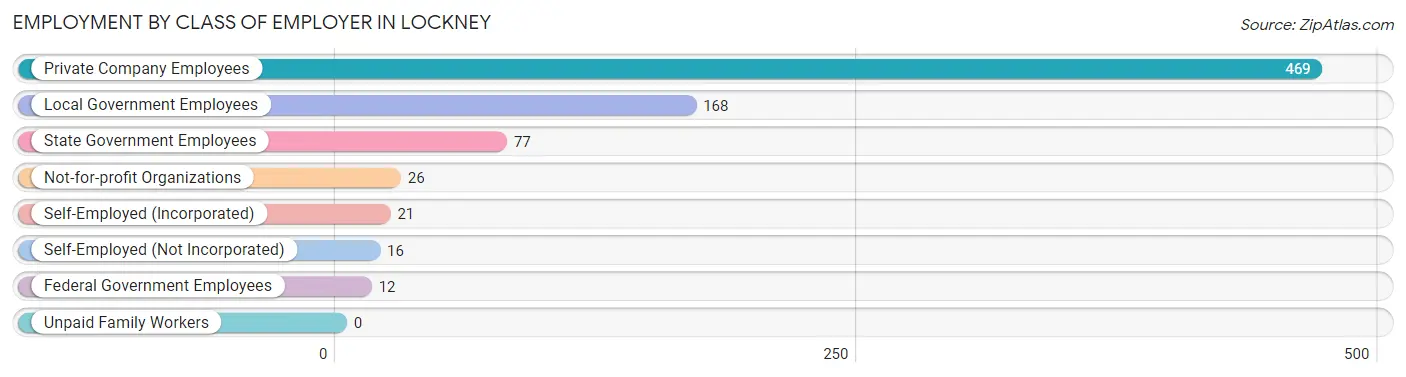
| Employer Class | # Employees | % Employees |
| Private Company Employees | 469 | 59.4% |
| Self-Employed (Incorporated) | 21 | 2.7% |
| Self-Employed (Not Incorporated) | 16 | 2.0% |
| Not-for-profit Organizations | 26 | 3.3% |
| Local Government Employees | 168 | 21.3% |
| State Government Employees | 77 | 9.8% |
| Federal Government Employees | 12 | 1.5% |
| Unpaid Family Workers | 0 | 0.0% |
| Total | 789 | 100.0% |
Employment Status by Age in Lockney
According to the labor force statistics for Lockney, out of the total population over 16 years of age (1,510), 55.8% or 843 individuals are in the labor force, with 5.0% or 42 of them unemployed. The age group with the highest labor force participation rate is 20 to 24 years, with 100.0% or 152 individuals in the labor force. Within the labor force, the 16 to 19 years age range has the highest percentage of unemployed individuals, with 100.0% or 4 of them being unemployed.
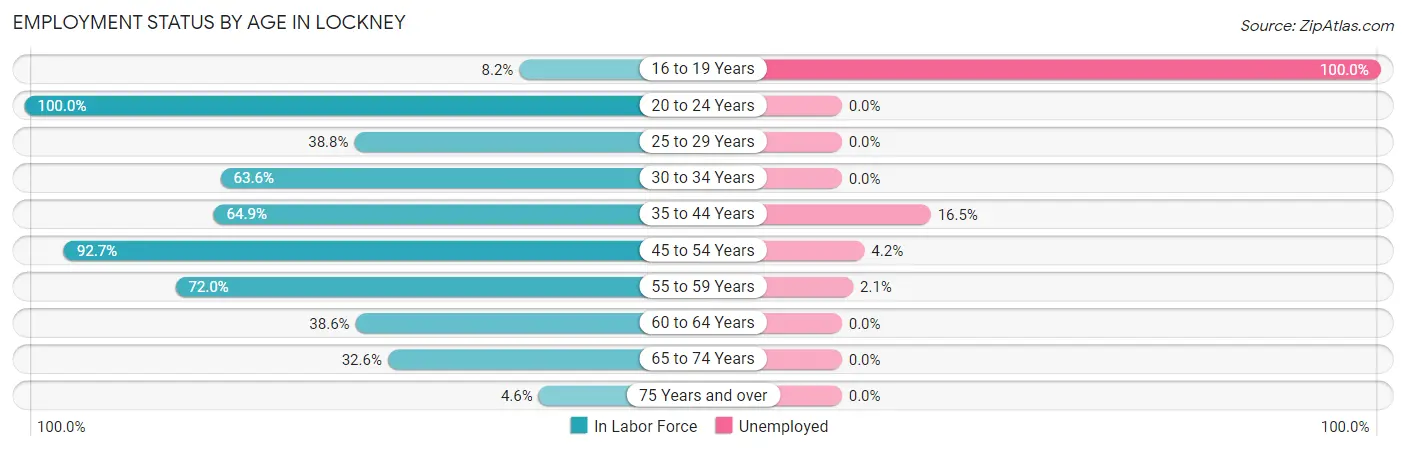
| Age Bracket | In Labor Force | Unemployed |
| 16 to 19 Years | 4 (8.2%) | 4 (100.0%) |
| 20 to 24 Years | 152 (100.0%) | 0 (0.0%) |
| 25 to 29 Years | 52 (38.8%) | 0 (0.0%) |
| 30 to 34 Years | 49 (63.6%) | 0 (0.0%) |
| 35 to 44 Years | 170 (64.9%) | 28 (16.5%) |
| 45 to 54 Years | 190 (92.7%) | 8 (4.2%) |
| 55 to 59 Years | 95 (72.0%) | 2 (2.1%) |
| 60 to 64 Years | 68 (38.6%) | 0 (0.0%) |
| 65 to 74 Years | 56 (32.6%) | 0 (0.0%) |
| 75 Years and over | 7 (4.6%) | 0 (0.0%) |
| Total | 843 (55.8%) | 42 (5.0%) |
Employment Status by Educational Attainment in Lockney
According to labor force statistics for Lockney, 63.3% of individuals (624) out of the total population between 25 and 64 years of age (986) are in the labor force, with 6.1% or 38 of them being unemployed. The group with the highest labor force participation rate are those with the educational attainment of bachelor's degree or higher, with 82.3% or 130 individuals in the labor force. Within the labor force, individuals with high school diploma education have the highest percentage of unemployment, with 11.9% or 28 of them being unemployed.
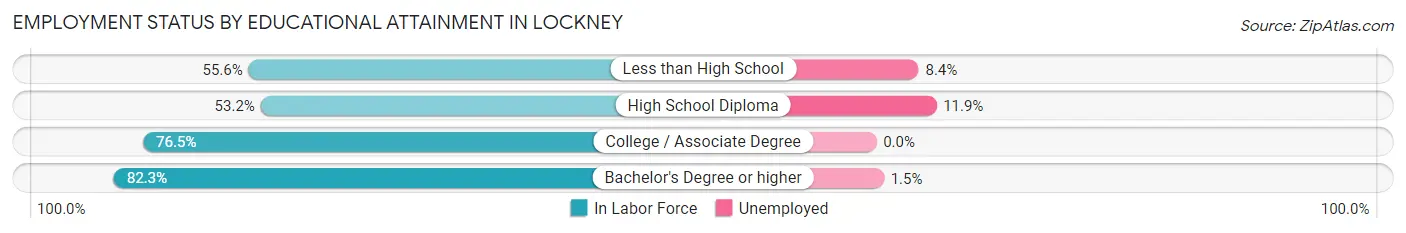
| Educational Attainment | In Labor Force | Unemployed |
| Less than High School | 95 (55.6%) | 14 (8.4%) |
| High School Diploma | 236 (53.2%) | 53 (11.9%) |
| College / Associate Degree | 163 (76.5%) | 0 (0.0%) |
| Bachelor's Degree or higher | 130 (82.3%) | 2 (1.5%) |
| Total | 624 (63.3%) | 60 (6.1%) |
Employment Occupations by Sex in Lockney
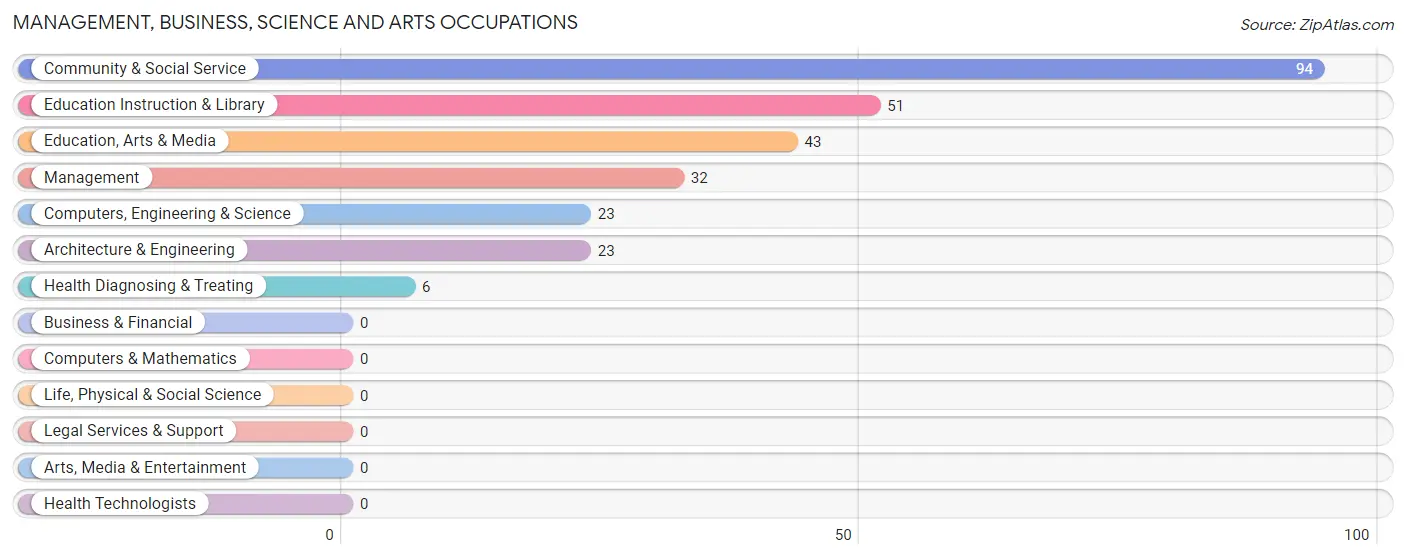
Management, Business, Science and Arts Occupations
The most common Management, Business, Science and Arts occupations in Lockney are Community & Social Service (94 | 11.7%), Education Instruction & Library (51 | 6.4%), Education, Arts & Media (43 | 5.4%), Management (32 | 4.0%), and Computers, Engineering & Science (23 | 2.9%).
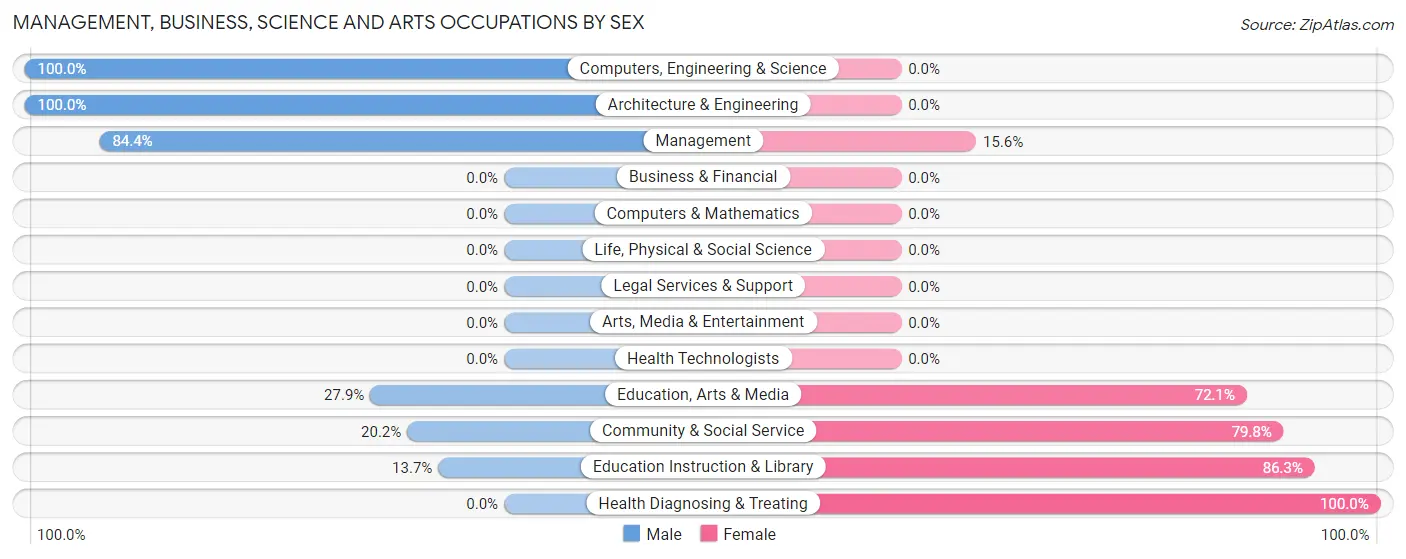
Management, Business, Science and Arts Occupations by Sex
Within the Management, Business, Science and Arts occupations in Lockney, the most male-oriented occupations are Computers, Engineering & Science (100.0%), Architecture & Engineering (100.0%), and Management (84.4%), while the most female-oriented occupations are Health Diagnosing & Treating (100.0%), Education Instruction & Library (86.3%), and Community & Social Service (79.8%).
| Occupation | Male | Female |
| Management | 27 (84.4%) | 5 (15.6%) |
| Business & Financial | 0 (0.0%) | 0 (0.0%) |
| Computers, Engineering & Science | 23 (100.0%) | 0 (0.0%) |
| Computers & Mathematics | 0 (0.0%) | 0 (0.0%) |
| Architecture & Engineering | 23 (100.0%) | 0 (0.0%) |
| Life, Physical & Social Science | 0 (0.0%) | 0 (0.0%) |
| Community & Social Service | 19 (20.2%) | 75 (79.8%) |
| Education, Arts & Media | 12 (27.9%) | 31 (72.1%) |
| Legal Services & Support | 0 (0.0%) | 0 (0.0%) |
| Education Instruction & Library | 7 (13.7%) | 44 (86.3%) |
| Arts, Media & Entertainment | 0 (0.0%) | 0 (0.0%) |
| Health Diagnosing & Treating | 0 (0.0%) | 6 (100.0%) |
| Health Technologists | 0 (0.0%) | 0 (0.0%) |
| Total (Category) | 69 (44.5%) | 86 (55.5%) |
| Total (Overall) | 325 (40.6%) | 476 (59.4%) |
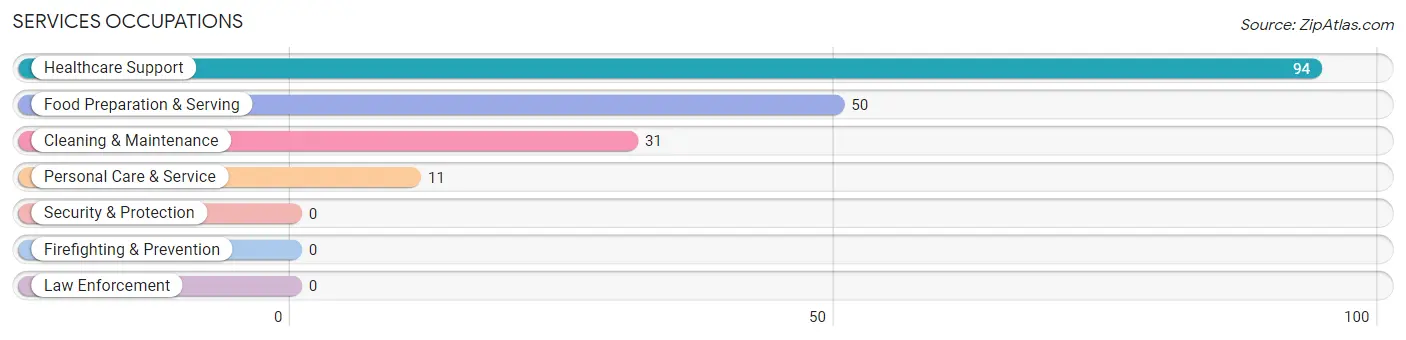
Services Occupations
The most common Services occupations in Lockney are Healthcare Support (94 | 11.7%), Food Preparation & Serving (50 | 6.2%), Cleaning & Maintenance (31 | 3.9%), and Personal Care & Service (11 | 1.4%).
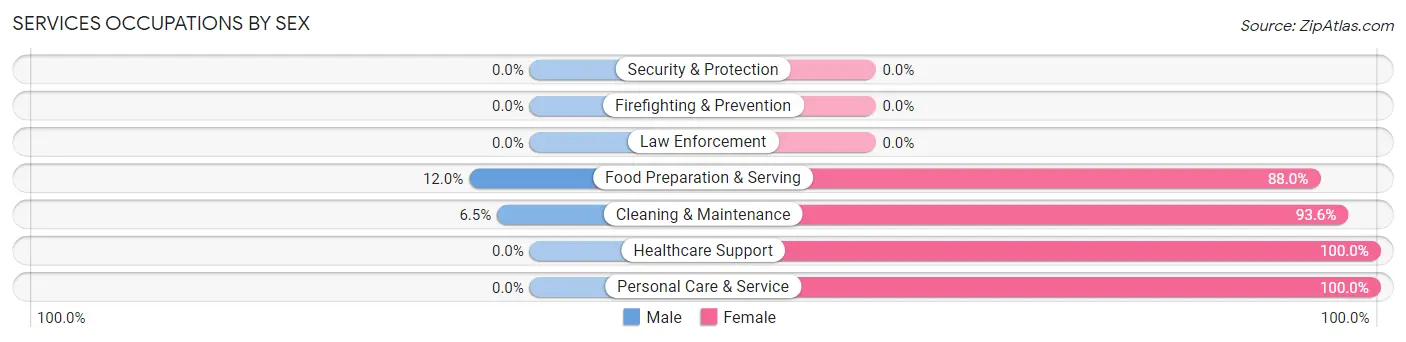
Services Occupations by Sex
Within the Services occupations in Lockney, the most male-oriented occupations are Food Preparation & Serving (12.0%), and Cleaning & Maintenance (6.5%), while the most female-oriented occupations are Healthcare Support (100.0%), Personal Care & Service (100.0%), and Cleaning & Maintenance (93.5%).
| Occupation | Male | Female |
| Healthcare Support | 0 (0.0%) | 94 (100.0%) |
| Security & Protection | 0 (0.0%) | 0 (0.0%) |
| Firefighting & Prevention | 0 (0.0%) | 0 (0.0%) |
| Law Enforcement | 0 (0.0%) | 0 (0.0%) |
| Food Preparation & Serving | 6 (12.0%) | 44 (88.0%) |
| Cleaning & Maintenance | 2 (6.5%) | 29 (93.5%) |
| Personal Care & Service | 0 (0.0%) | 11 (100.0%) |
| Total (Category) | 8 (4.3%) | 178 (95.7%) |
| Total (Overall) | 325 (40.6%) | 476 (59.4%) |
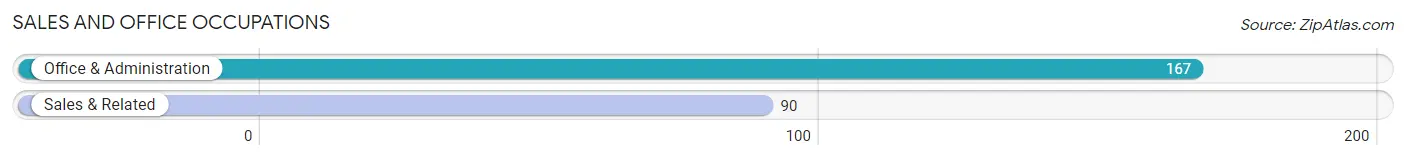
Sales and Office Occupations
The most common Sales and Office occupations in Lockney are Office & Administration (167 | 20.8%), and Sales & Related (90 | 11.2%).
Sales and Office Occupations by Sex
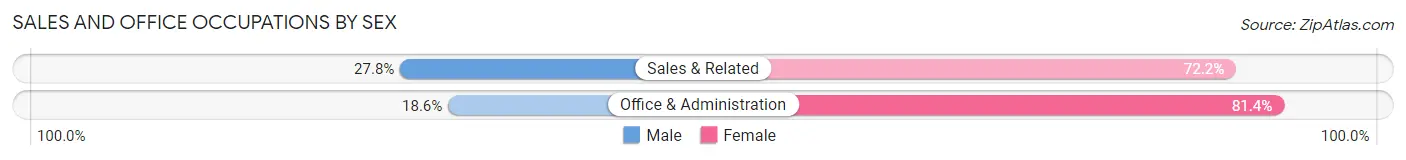
| Occupation | Male | Female |
| Sales & Related | 25 (27.8%) | 65 (72.2%) |
| Office & Administration | 31 (18.6%) | 136 (81.4%) |
| Total (Category) | 56 (21.8%) | 201 (78.2%) |
| Total (Overall) | 325 (40.6%) | 476 (59.4%) |
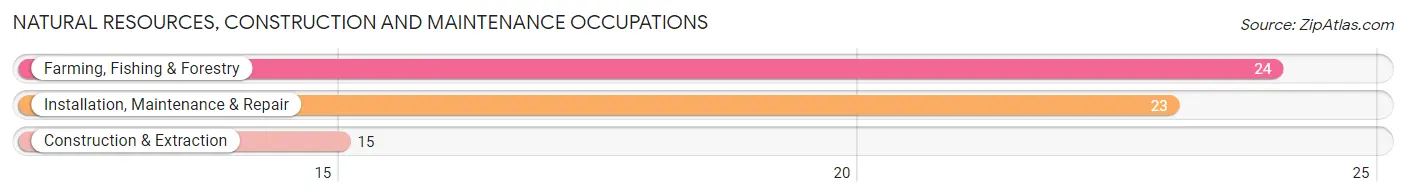
Natural Resources, Construction and Maintenance Occupations
The most common Natural Resources, Construction and Maintenance occupations in Lockney are Farming, Fishing & Forestry (24 | 3.0%), Installation, Maintenance & Repair (23 | 2.9%), and Construction & Extraction (15 | 1.9%).
Natural Resources, Construction and Maintenance Occupations by Sex
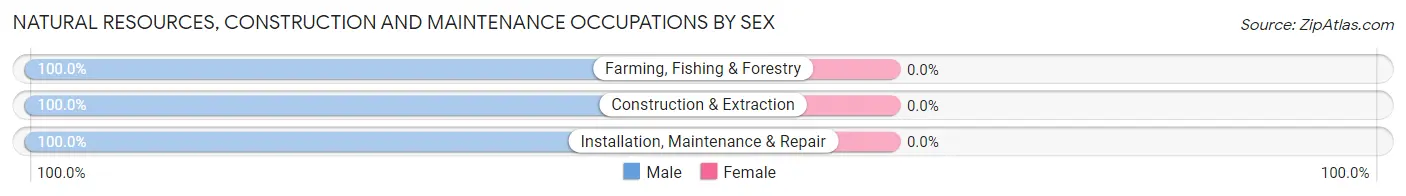
| Occupation | Male | Female |
| Farming, Fishing & Forestry | 24 (100.0%) | 0 (0.0%) |
| Construction & Extraction | 15 (100.0%) | 0 (0.0%) |
| Installation, Maintenance & Repair | 23 (100.0%) | 0 (0.0%) |
| Total (Category) | 62 (100.0%) | 0 (0.0%) |
| Total (Overall) | 325 (40.6%) | 476 (59.4%) |
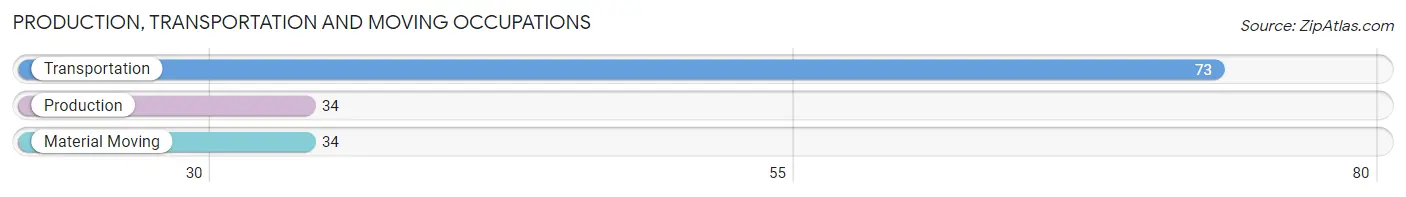
Production, Transportation and Moving Occupations
The most common Production, Transportation and Moving occupations in Lockney are Transportation (73 | 9.1%), Production (34 | 4.2%), and Material Moving (34 | 4.2%).
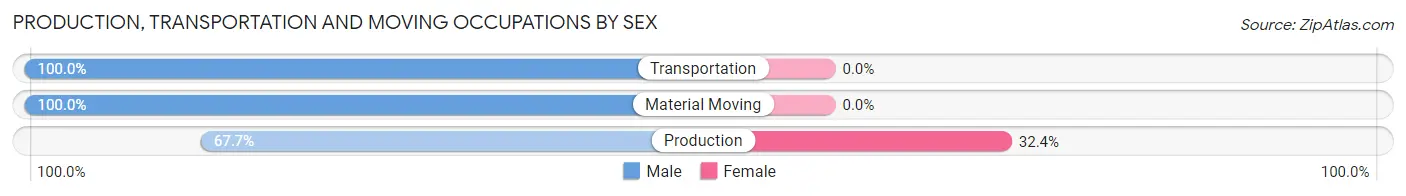
Production, Transportation and Moving Occupations by Sex
| Occupation | Male | Female |
| Production | 23 (67.6%) | 11 (32.4%) |
| Transportation | 73 (100.0%) | 0 (0.0%) |
| Material Moving | 34 (100.0%) | 0 (0.0%) |
| Total (Category) | 130 (92.2%) | 11 (7.8%) |
| Total (Overall) | 325 (40.6%) | 476 (59.4%) |
Employment Industries by Sex in Lockney
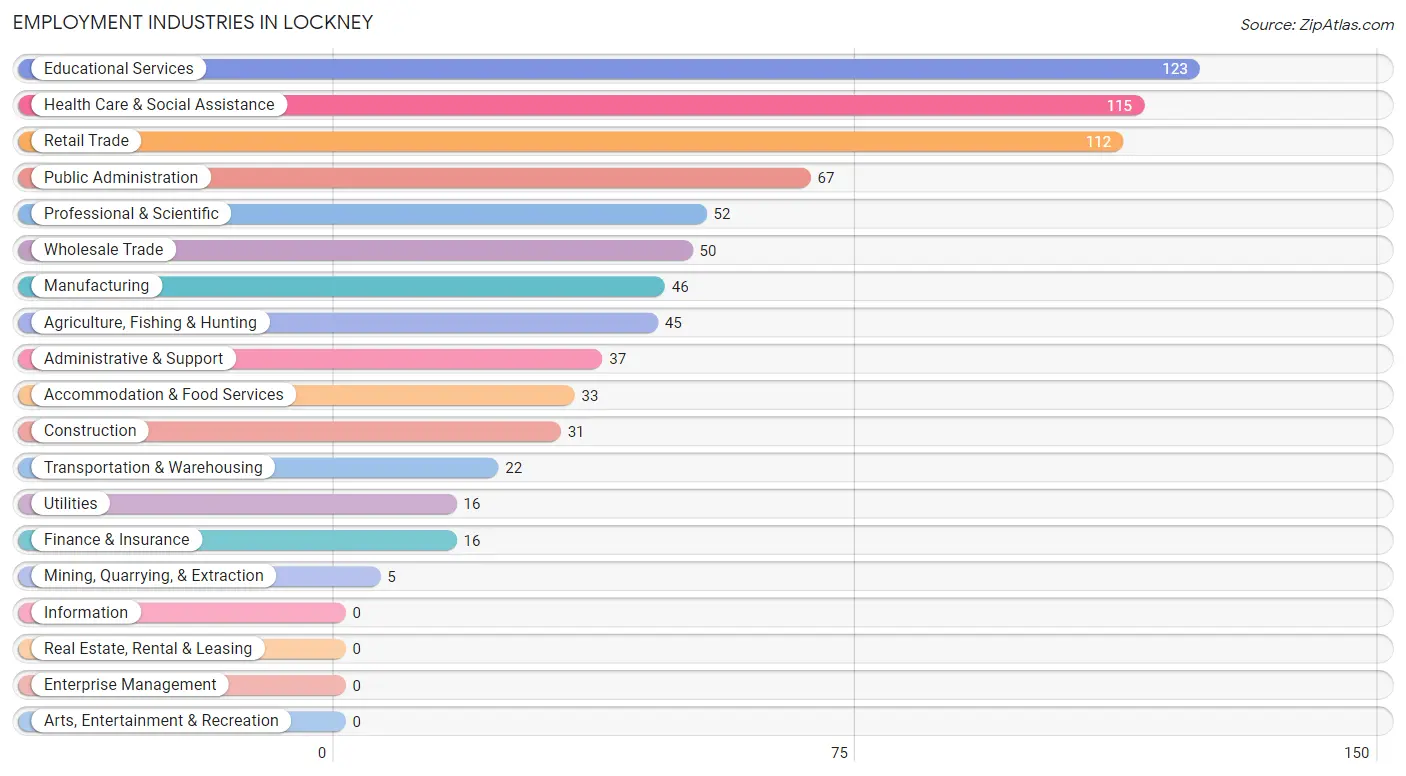
Employment Industries in Lockney
The major employment industries in Lockney include Educational Services (123 | 15.4%), Health Care & Social Assistance (115 | 14.4%), Retail Trade (112 | 14.0%), Public Administration (67 | 8.4%), and Professional & Scientific (52 | 6.5%).
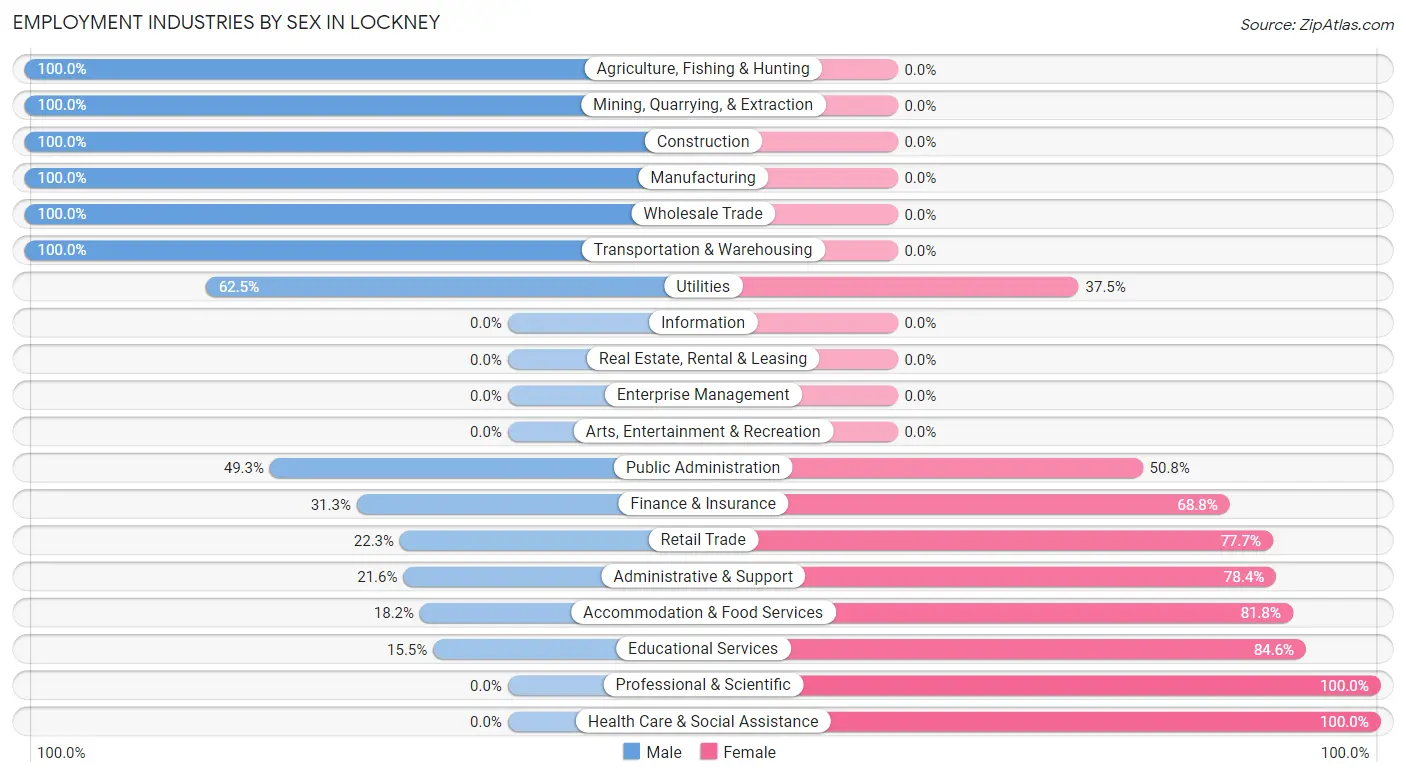
Employment Industries by Sex in Lockney
The Lockney industries that see more men than women are Agriculture, Fishing & Hunting (100.0%), Mining, Quarrying, & Extraction (100.0%), and Construction (100.0%), whereas the industries that tend to have a higher number of women are Professional & Scientific (100.0%), Health Care & Social Assistance (100.0%), and Educational Services (84.6%).
| Industry | Male | Female |
| Agriculture, Fishing & Hunting | 45 (100.0%) | 0 (0.0%) |
| Mining, Quarrying, & Extraction | 5 (100.0%) | 0 (0.0%) |
| Construction | 31 (100.0%) | 0 (0.0%) |
| Manufacturing | 46 (100.0%) | 0 (0.0%) |
| Wholesale Trade | 50 (100.0%) | 0 (0.0%) |
| Retail Trade | 25 (22.3%) | 87 (77.7%) |
| Transportation & Warehousing | 22 (100.0%) | 0 (0.0%) |
| Utilities | 10 (62.5%) | 6 (37.5%) |
| Information | 0 (0.0%) | 0 (0.0%) |
| Finance & Insurance | 5 (31.2%) | 11 (68.8%) |
| Real Estate, Rental & Leasing | 0 (0.0%) | 0 (0.0%) |
| Professional & Scientific | 0 (0.0%) | 52 (100.0%) |
| Enterprise Management | 0 (0.0%) | 0 (0.0%) |
| Administrative & Support | 8 (21.6%) | 29 (78.4%) |
| Educational Services | 19 (15.4%) | 104 (84.6%) |
| Health Care & Social Assistance | 0 (0.0%) | 115 (100.0%) |
| Arts, Entertainment & Recreation | 0 (0.0%) | 0 (0.0%) |
| Accommodation & Food Services | 6 (18.2%) | 27 (81.8%) |
| Public Administration | 33 (49.2%) | 34 (50.7%) |
| Total | 325 (40.6%) | 476 (59.4%) |
Education in Lockney
School Enrollment in Lockney
The most common levels of schooling among the 272 students in Lockney are high school (78 | 28.7%), middle school (53 | 19.5%), and graduate / professional (43 | 15.8%).
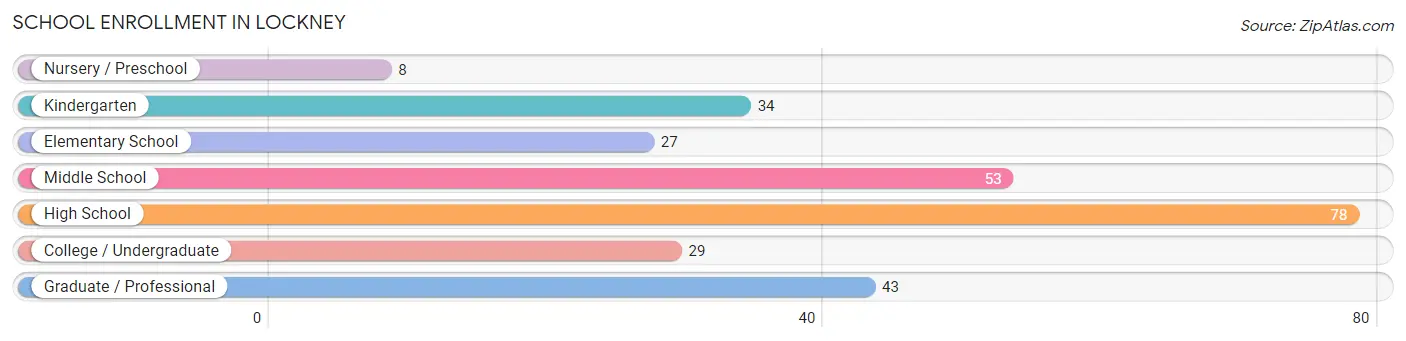
| School Level | # Students | % Students |
| Nursery / Preschool | 8 | 2.9% |
| Kindergarten | 34 | 12.5% |
| Elementary School | 27 | 9.9% |
| Middle School | 53 | 19.5% |
| High School | 78 | 28.7% |
| College / Undergraduate | 29 | 10.7% |
| Graduate / Professional | 43 | 15.8% |
| Total | 272 | 100.0% |
School Enrollment by Age by Funding Source in Lockney
Out of a total of 272 students who are enrolled in schools in Lockney, 13 (4.8%) attend a private institution, while the remaining 259 (95.2%) are enrolled in public schools. The age group of 35 years and over has the highest likelihood of being enrolled in private schools, with 13 (81.2% in the age bracket) enrolled. Conversely, the age group of 3 to 4 year olds has the lowest likelihood of being enrolled in a private school, with 8 (100.0% in the age bracket) attending a public institution.
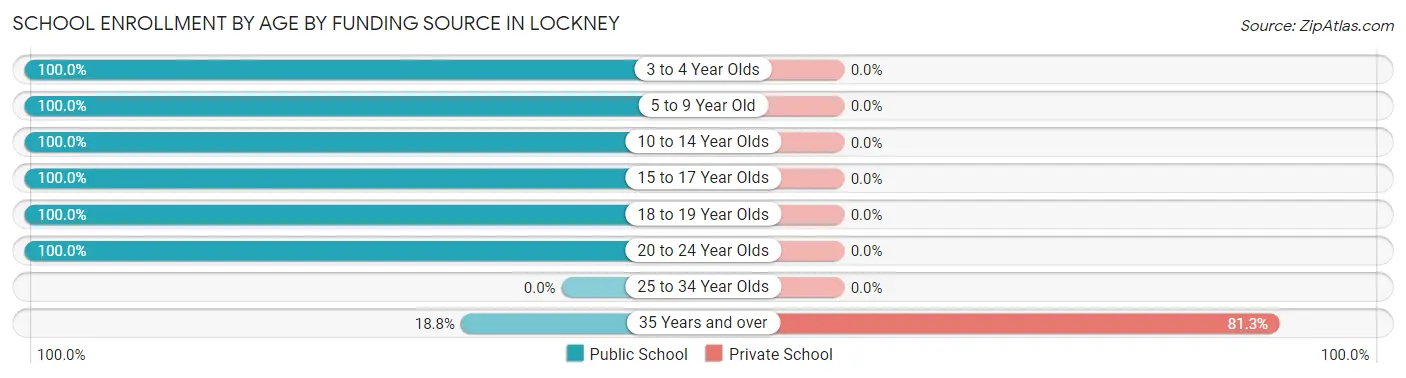
| Age Bracket | Public School | Private School |
| 3 to 4 Year Olds | 8 (100.0%) | 0 (0.0%) |
| 5 to 9 Year Old | 61 (100.0%) | 0 (0.0%) |
| 10 to 14 Year Olds | 53 (100.0%) | 0 (0.0%) |
| 15 to 17 Year Olds | 57 (100.0%) | 0 (0.0%) |
| 18 to 19 Year Olds | 21 (100.0%) | 0 (0.0%) |
| 20 to 24 Year Olds | 56 (100.0%) | 0 (0.0%) |
| 25 to 34 Year Olds | 0 (0.0%) | 0 (0.0%) |
| 35 Years and over | 3 (18.8%) | 13 (81.2%) |
| Total | 259 (95.2%) | 13 (4.8%) |
Educational Attainment by Field of Study in Lockney
Education (48 | 23.6%), bio, nature & agricultural (33 | 16.3%), social sciences (29 | 14.3%), arts & humanities (29 | 14.3%), and business (20 | 9.9%) are the most common fields of study among 203 individuals in Lockney who have obtained a bachelor's degree or higher.
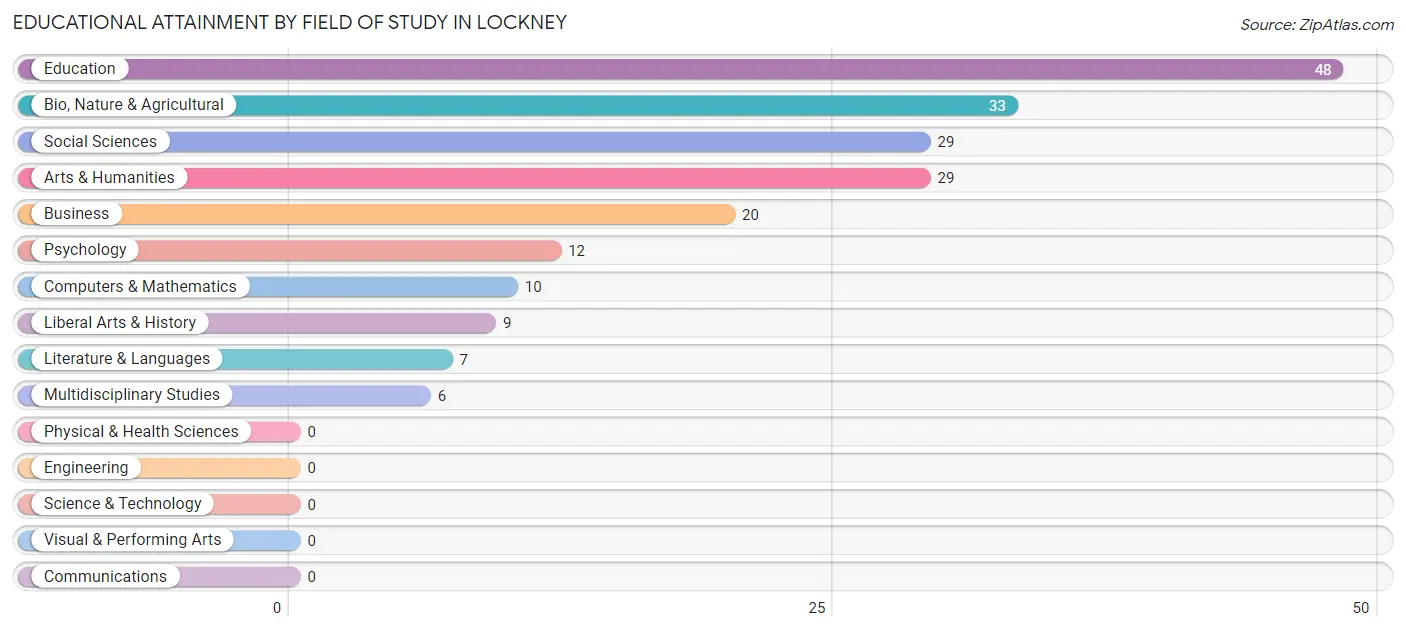
| Field of Study | # Graduates | % Graduates |
| Computers & Mathematics | 10 | 4.9% |
| Bio, Nature & Agricultural | 33 | 16.3% |
| Physical & Health Sciences | 0 | 0.0% |
| Psychology | 12 | 5.9% |
| Social Sciences | 29 | 14.3% |
| Engineering | 0 | 0.0% |
| Multidisciplinary Studies | 6 | 3.0% |
| Science & Technology | 0 | 0.0% |
| Business | 20 | 9.9% |
| Education | 48 | 23.6% |
| Literature & Languages | 7 | 3.5% |
| Liberal Arts & History | 9 | 4.4% |
| Visual & Performing Arts | 0 | 0.0% |
| Communications | 0 | 0.0% |
| Arts & Humanities | 29 | 14.3% |
| Total | 203 | 100.0% |
Transportation & Commute in Lockney
Vehicle Availability by Sex in Lockney
The most prevalent vehicle ownership categories in Lockney are males with 3 vehicles (152, accounting for 47.6%) and females with 3 vehicles (146, making up 32.3%).
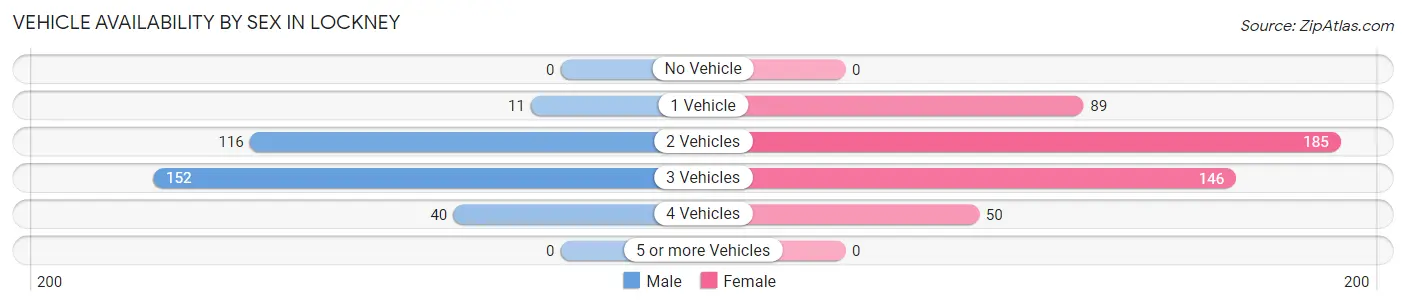
| Vehicles Available | Male | Female |
| No Vehicle | 0 (0.0%) | 0 (0.0%) |
| 1 Vehicle | 11 (3.5%) | 89 (18.9%) |
| 2 Vehicles | 116 (36.4%) | 185 (39.4%) |
| 3 Vehicles | 152 (47.6%) | 146 (31.1%) |
| 4 Vehicles | 40 (12.5%) | 50 (10.6%) |
| 5 or more Vehicles | 0 (0.0%) | 0 (0.0%) |
| Total | 319 (100.0%) | 470 (100.0%) |
Commute Time in Lockney
The most frequently occuring commute durations in Lockney are 5 to 9 minutes (128 commuters, 16.6%), less than 5 minutes (127 commuters, 16.4%), and 15 to 19 minutes (123 commuters, 15.9%).
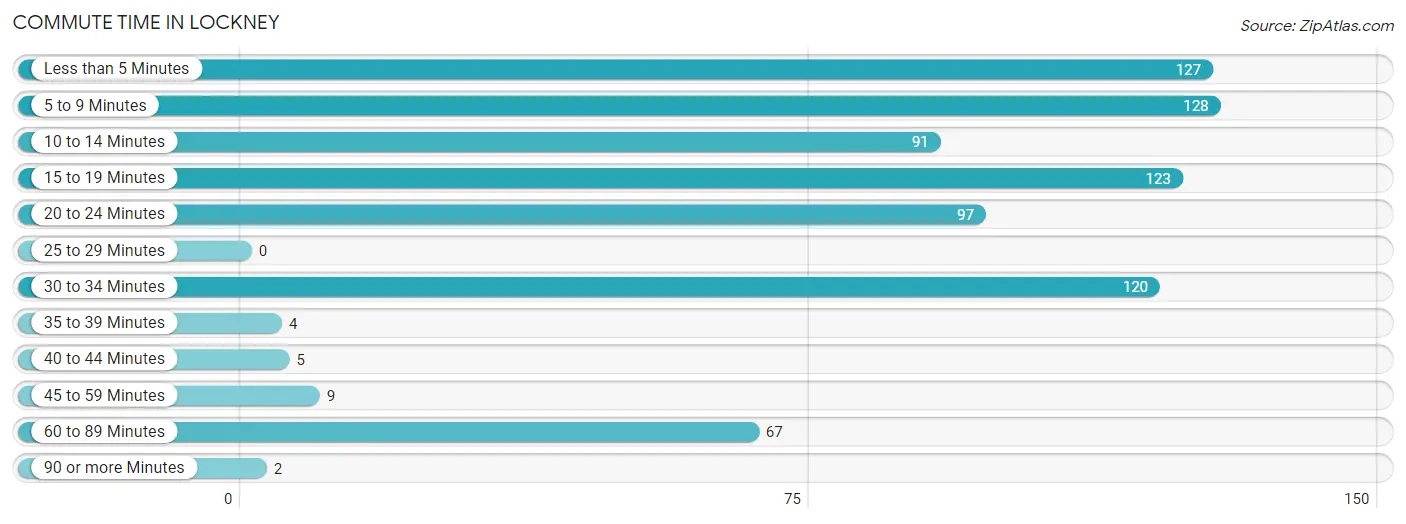
| Commute Time | # Commuters | % Commuters |
| Less than 5 Minutes | 127 | 16.4% |
| 5 to 9 Minutes | 128 | 16.6% |
| 10 to 14 Minutes | 91 | 11.8% |
| 15 to 19 Minutes | 123 | 15.9% |
| 20 to 24 Minutes | 97 | 12.6% |
| 25 to 29 Minutes | 0 | 0.0% |
| 30 to 34 Minutes | 120 | 15.5% |
| 35 to 39 Minutes | 4 | 0.5% |
| 40 to 44 Minutes | 5 | 0.6% |
| 45 to 59 Minutes | 9 | 1.2% |
| 60 to 89 Minutes | 67 | 8.7% |
| 90 or more Minutes | 2 | 0.3% |
Commute Time by Sex in Lockney
The most common commute times in Lockney are 5 to 9 minutes (72 commuters, 22.6%) for males and 15 to 19 minutes (97 commuters, 21.4%) for females.
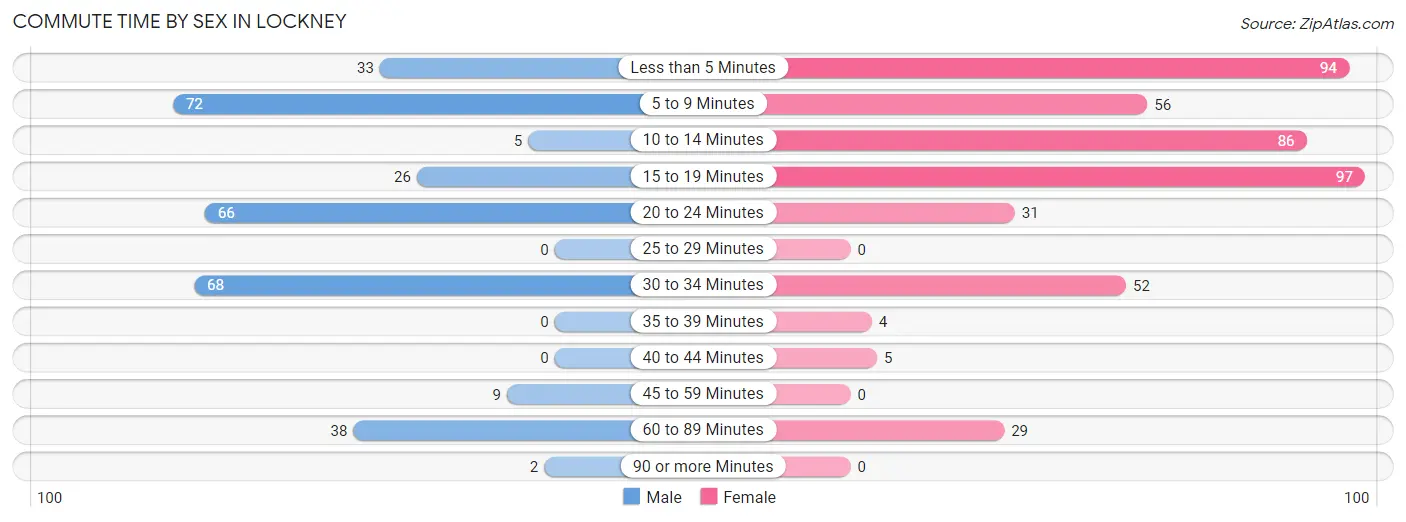
| Commute Time | Male | Female |
| Less than 5 Minutes | 33 (10.3%) | 94 (20.7%) |
| 5 to 9 Minutes | 72 (22.6%) | 56 (12.3%) |
| 10 to 14 Minutes | 5 (1.6%) | 86 (18.9%) |
| 15 to 19 Minutes | 26 (8.2%) | 97 (21.4%) |
| 20 to 24 Minutes | 66 (20.7%) | 31 (6.8%) |
| 25 to 29 Minutes | 0 (0.0%) | 0 (0.0%) |
| 30 to 34 Minutes | 68 (21.3%) | 52 (11.5%) |
| 35 to 39 Minutes | 0 (0.0%) | 4 (0.9%) |
| 40 to 44 Minutes | 0 (0.0%) | 5 (1.1%) |
| 45 to 59 Minutes | 9 (2.8%) | 0 (0.0%) |
| 60 to 89 Minutes | 38 (11.9%) | 29 (6.4%) |
| 90 or more Minutes | 2 (0.6%) | 0 (0.0%) |
Time of Departure to Work by Sex in Lockney
The most frequent times of departure to work in Lockney are 7:30 AM to 7:59 AM (59, 18.5%) for males and 8:00 AM to 8:29 AM (102, 22.5%) for females.
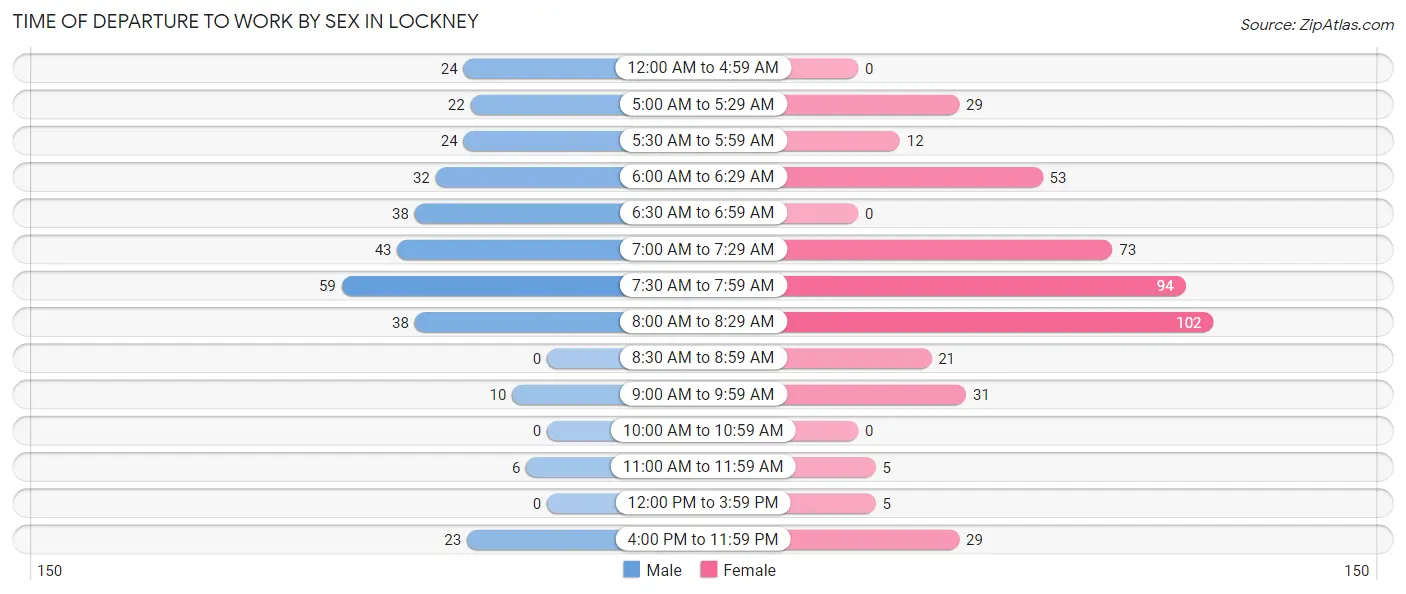
| Time of Departure | Male | Female |
| 12:00 AM to 4:59 AM | 24 (7.5%) | 0 (0.0%) |
| 5:00 AM to 5:29 AM | 22 (6.9%) | 29 (6.4%) |
| 5:30 AM to 5:59 AM | 24 (7.5%) | 12 (2.6%) |
| 6:00 AM to 6:29 AM | 32 (10.0%) | 53 (11.7%) |
| 6:30 AM to 6:59 AM | 38 (11.9%) | 0 (0.0%) |
| 7:00 AM to 7:29 AM | 43 (13.5%) | 73 (16.1%) |
| 7:30 AM to 7:59 AM | 59 (18.5%) | 94 (20.7%) |
| 8:00 AM to 8:29 AM | 38 (11.9%) | 102 (22.5%) |
| 8:30 AM to 8:59 AM | 0 (0.0%) | 21 (4.6%) |
| 9:00 AM to 9:59 AM | 10 (3.1%) | 31 (6.8%) |
| 10:00 AM to 10:59 AM | 0 (0.0%) | 0 (0.0%) |
| 11:00 AM to 11:59 AM | 6 (1.9%) | 5 (1.1%) |
| 12:00 PM to 3:59 PM | 0 (0.0%) | 5 (1.1%) |
| 4:00 PM to 11:59 PM | 23 (7.2%) | 29 (6.4%) |
| Total | 319 (100.0%) | 454 (100.0%) |
Housing Occupancy in Lockney
Occupancy by Ownership in Lockney
Of the total 616 dwellings in Lockney, owner-occupied units account for 489 (79.4%), while renter-occupied units make up 127 (20.6%).
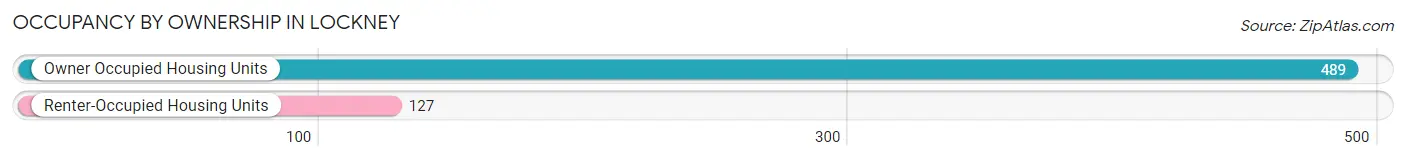
| Occupancy | # Housing Units | % Housing Units |
| Owner Occupied Housing Units | 489 | 79.4% |
| Renter-Occupied Housing Units | 127 | 20.6% |
| Total Occupied Housing Units | 616 | 100.0% |
Occupancy by Household Size in Lockney
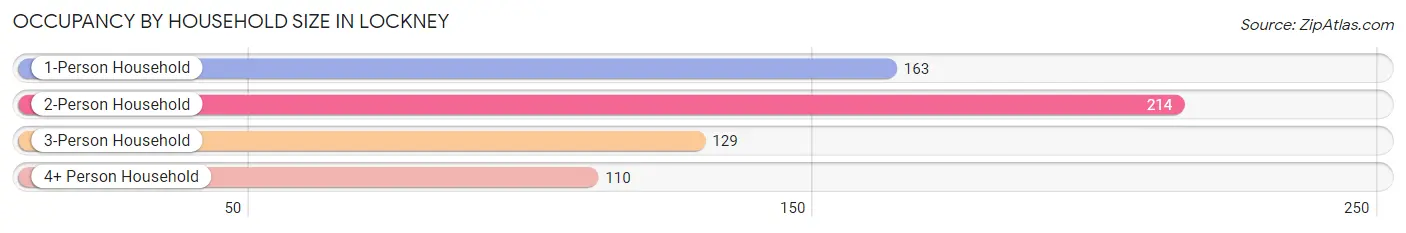
| Household Size | # Housing Units | % Housing Units |
| 1-Person Household | 163 | 26.5% |
| 2-Person Household | 214 | 34.7% |
| 3-Person Household | 129 | 20.9% |
| 4+ Person Household | 110 | 17.9% |
| Total Housing Units | 616 | 100.0% |
Occupancy by Ownership by Household Size in Lockney
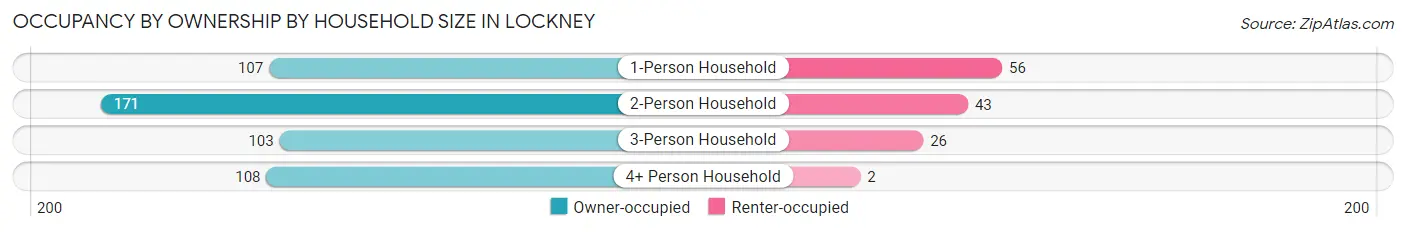
| Household Size | Owner-occupied | Renter-occupied |
| 1-Person Household | 107 (65.6%) | 56 (34.4%) |
| 2-Person Household | 171 (79.9%) | 43 (20.1%) |
| 3-Person Household | 103 (79.8%) | 26 (20.2%) |
| 4+ Person Household | 108 (98.2%) | 2 (1.8%) |
| Total Housing Units | 489 (79.4%) | 127 (20.6%) |
Occupancy by Educational Attainment in Lockney
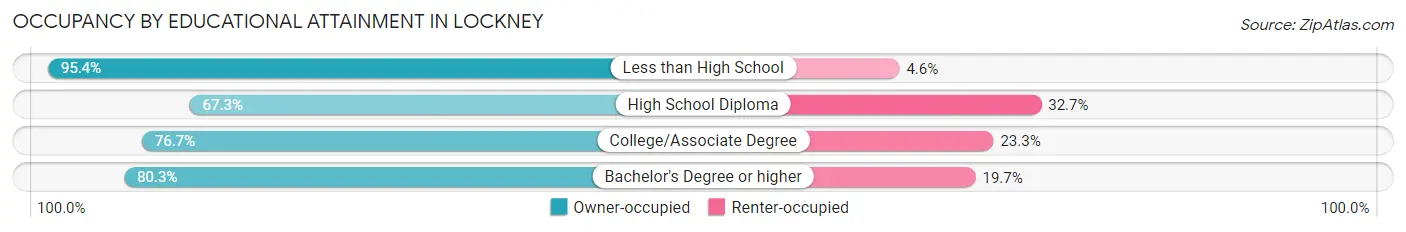
| Household Size | Owner-occupied | Renter-occupied |
| Less than High School | 165 (95.4%) | 8 (4.6%) |
| High School Diploma | 148 (67.3%) | 72 (32.7%) |
| College/Associate Degree | 66 (76.7%) | 20 (23.3%) |
| Bachelor's Degree or higher | 110 (80.3%) | 27 (19.7%) |
Occupancy by Age of Householder in Lockney
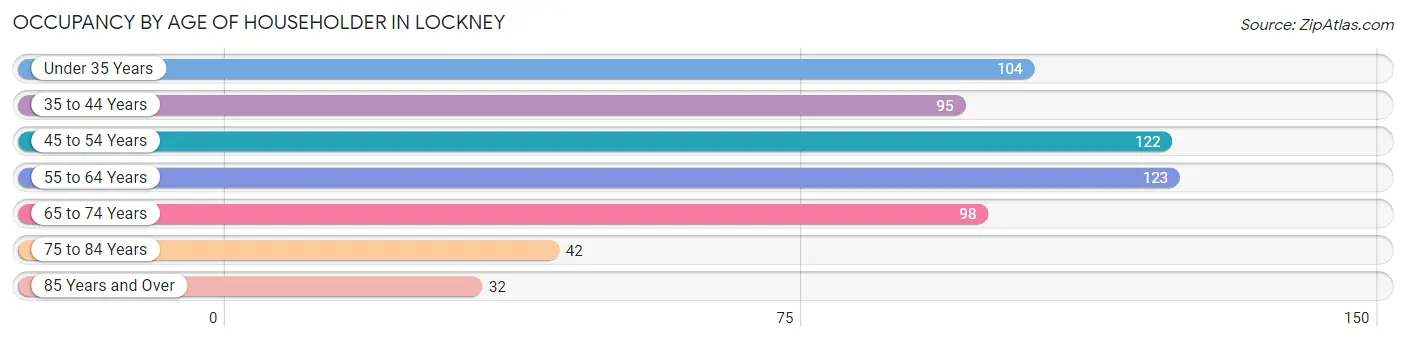
| Age Bracket | # Households | % Households |
| Under 35 Years | 104 | 16.9% |
| 35 to 44 Years | 95 | 15.4% |
| 45 to 54 Years | 122 | 19.8% |
| 55 to 64 Years | 123 | 20.0% |
| 65 to 74 Years | 98 | 15.9% |
| 75 to 84 Years | 42 | 6.8% |
| 85 Years and Over | 32 | 5.2% |
| Total | 616 | 100.0% |
Housing Finances in Lockney
Median Income by Occupancy in Lockney
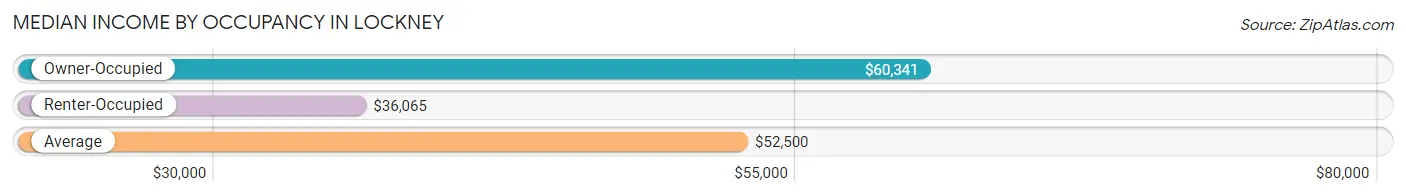
| Occupancy Type | # Households | Median Income |
| Owner-Occupied | 489 (79.4%) | $60,341 |
| Renter-Occupied | 127 (20.6%) | $36,065 |
| Average | 616 (100.0%) | $52,500 |
Occupancy by Householder Income Bracket in Lockney
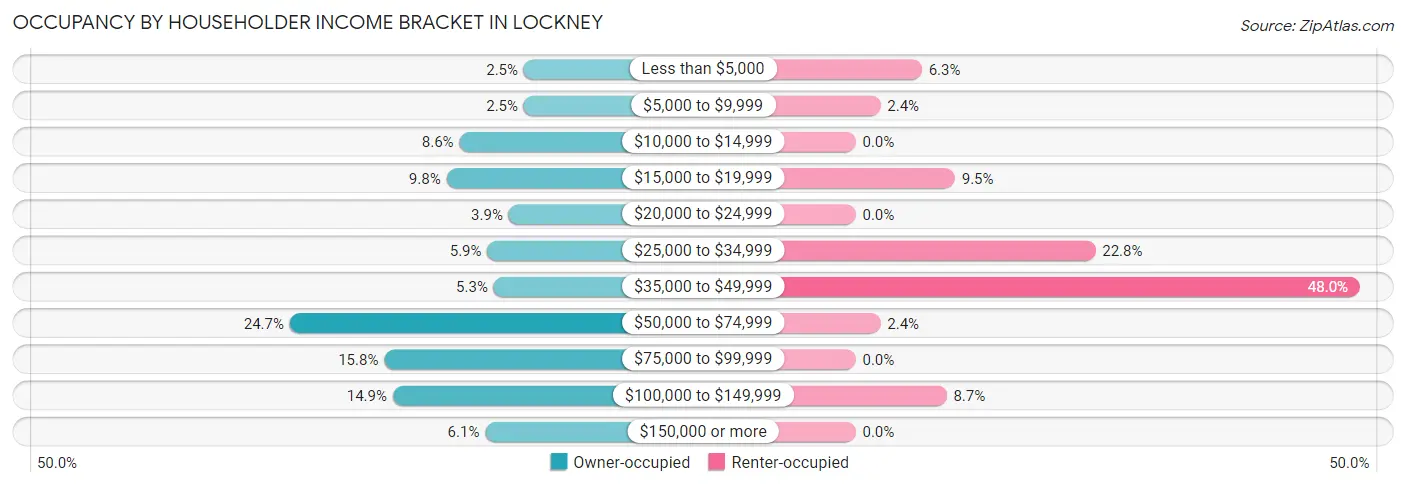
| Income Bracket | Owner-occupied | Renter-occupied |
| Less than $5,000 | 12 (2.5%) | 8 (6.3%) |
| $5,000 to $9,999 | 12 (2.5%) | 3 (2.4%) |
| $10,000 to $14,999 | 42 (8.6%) | 0 (0.0%) |
| $15,000 to $19,999 | 48 (9.8%) | 12 (9.5%) |
| $20,000 to $24,999 | 19 (3.9%) | 0 (0.0%) |
| $25,000 to $34,999 | 29 (5.9%) | 29 (22.8%) |
| $35,000 to $49,999 | 26 (5.3%) | 61 (48.0%) |
| $50,000 to $74,999 | 121 (24.7%) | 3 (2.4%) |
| $75,000 to $99,999 | 77 (15.8%) | 0 (0.0%) |
| $100,000 to $149,999 | 73 (14.9%) | 11 (8.7%) |
| $150,000 or more | 30 (6.1%) | 0 (0.0%) |
| Total | 489 (100.0%) | 127 (100.0%) |
Monthly Housing Cost Tiers in Lockney
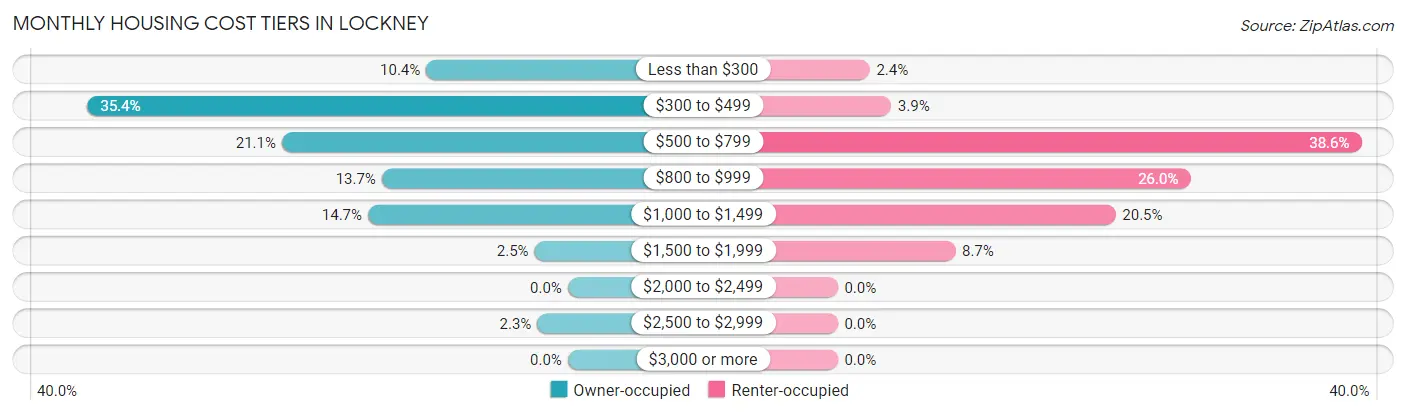
| Monthly Cost | Owner-occupied | Renter-occupied |
| Less than $300 | 51 (10.4%) | 3 (2.4%) |
| $300 to $499 | 173 (35.4%) | 5 (3.9%) |
| $500 to $799 | 103 (21.1%) | 49 (38.6%) |
| $800 to $999 | 67 (13.7%) | 33 (26.0%) |
| $1,000 to $1,499 | 72 (14.7%) | 26 (20.5%) |
| $1,500 to $1,999 | 12 (2.5%) | 11 (8.7%) |
| $2,000 to $2,499 | 0 (0.0%) | 0 (0.0%) |
| $2,500 to $2,999 | 11 (2.2%) | 0 (0.0%) |
| $3,000 or more | 0 (0.0%) | 0 (0.0%) |
| Total | 489 (100.0%) | 127 (100.0%) |
Physical Housing Characteristics in Lockney
Housing Structures in Lockney
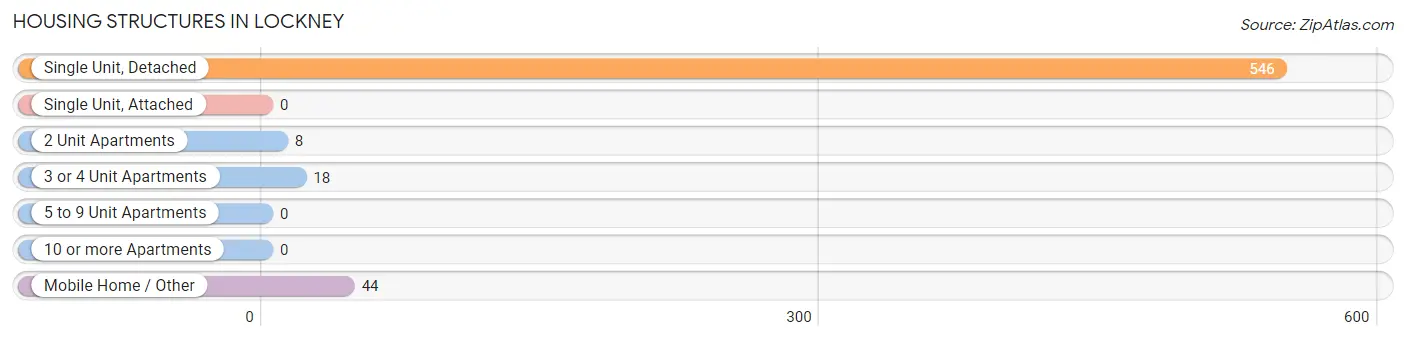
| Structure Type | # Housing Units | % Housing Units |
| Single Unit, Detached | 546 | 88.6% |
| Single Unit, Attached | 0 | 0.0% |
| 2 Unit Apartments | 8 | 1.3% |
| 3 or 4 Unit Apartments | 18 | 2.9% |
| 5 to 9 Unit Apartments | 0 | 0.0% |
| 10 or more Apartments | 0 | 0.0% |
| Mobile Home / Other | 44 | 7.1% |
| Total | 616 | 100.0% |
Housing Structures by Occupancy in Lockney
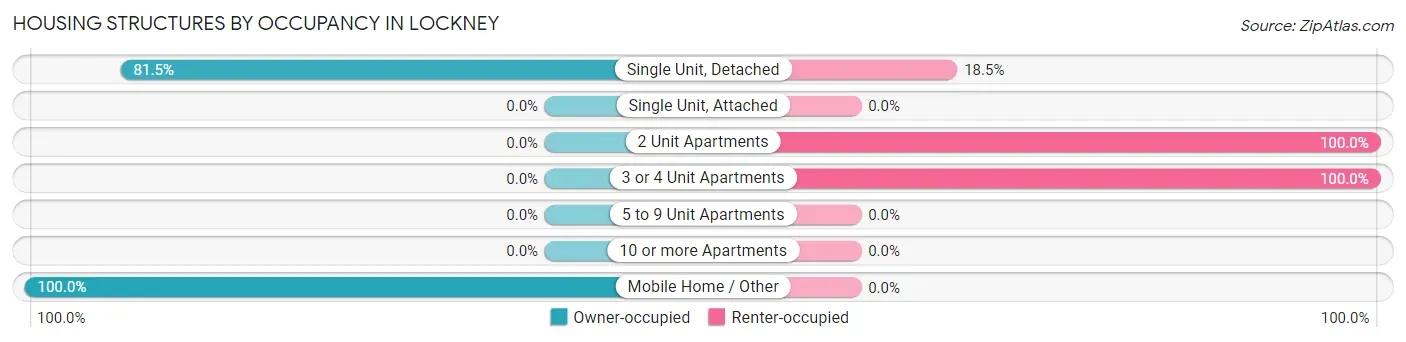
| Structure Type | Owner-occupied | Renter-occupied |
| Single Unit, Detached | 445 (81.5%) | 101 (18.5%) |
| Single Unit, Attached | 0 (0.0%) | 0 (0.0%) |
| 2 Unit Apartments | 0 (0.0%) | 8 (100.0%) |
| 3 or 4 Unit Apartments | 0 (0.0%) | 18 (100.0%) |
| 5 to 9 Unit Apartments | 0 (0.0%) | 0 (0.0%) |
| 10 or more Apartments | 0 (0.0%) | 0 (0.0%) |
| Mobile Home / Other | 44 (100.0%) | 0 (0.0%) |
| Total | 489 (79.4%) | 127 (20.6%) |
Housing Structures by Number of Rooms in Lockney
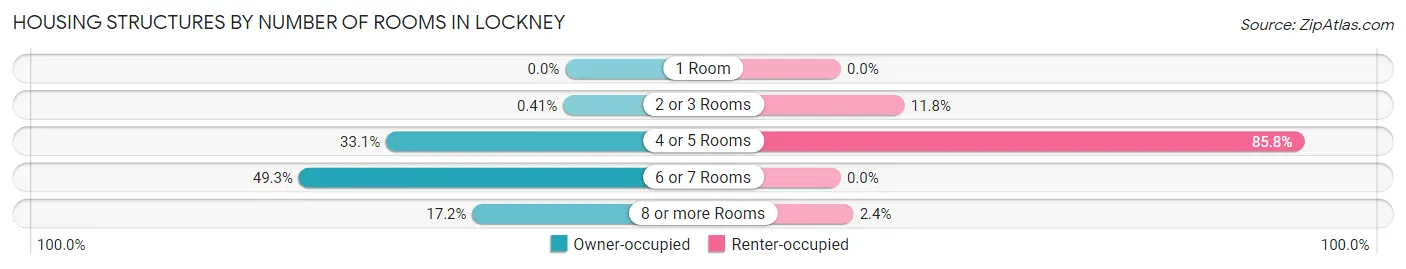
| Number of Rooms | Owner-occupied | Renter-occupied |
| 1 Room | 0 (0.0%) | 0 (0.0%) |
| 2 or 3 Rooms | 2 (0.4%) | 15 (11.8%) |
| 4 or 5 Rooms | 162 (33.1%) | 109 (85.8%) |
| 6 or 7 Rooms | 241 (49.3%) | 0 (0.0%) |
| 8 or more Rooms | 84 (17.2%) | 3 (2.4%) |
| Total | 489 (100.0%) | 127 (100.0%) |
Housing Structure by Heating Type in Lockney
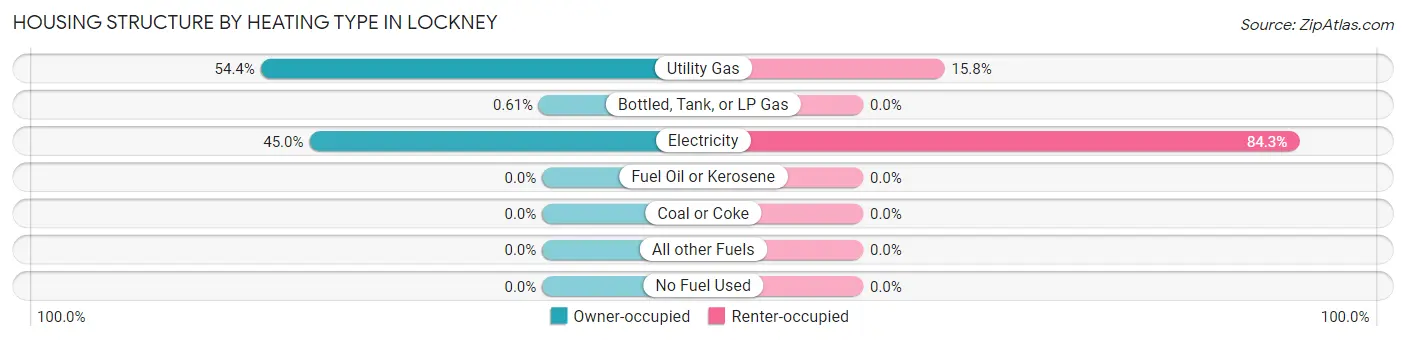
| Heating Type | Owner-occupied | Renter-occupied |
| Utility Gas | 266 (54.4%) | 20 (15.8%) |
| Bottled, Tank, or LP Gas | 3 (0.6%) | 0 (0.0%) |
| Electricity | 220 (45.0%) | 107 (84.3%) |
| Fuel Oil or Kerosene | 0 (0.0%) | 0 (0.0%) |
| Coal or Coke | 0 (0.0%) | 0 (0.0%) |
| All other Fuels | 0 (0.0%) | 0 (0.0%) |
| No Fuel Used | 0 (0.0%) | 0 (0.0%) |
| Total | 489 (100.0%) | 127 (100.0%) |
Household Vehicle Usage in Lockney
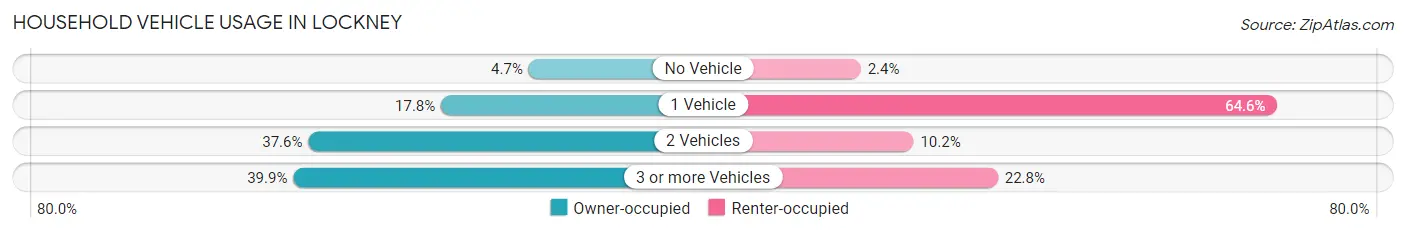
| Vehicles per Household | Owner-occupied | Renter-occupied |
| No Vehicle | 23 (4.7%) | 3 (2.4%) |
| 1 Vehicle | 87 (17.8%) | 82 (64.6%) |
| 2 Vehicles | 184 (37.6%) | 13 (10.2%) |
| 3 or more Vehicles | 195 (39.9%) | 29 (22.8%) |
| Total | 489 (100.0%) | 127 (100.0%) |
Real Estate & Mortgages in Lockney
Real Estate and Mortgage Overview in Lockney
| Characteristic | Without Mortgage | With Mortgage |
| Housing Units | 308 | 181 |
| Median Property Value | $60,000 | $101,800 |
| Median Household Income | $47,188 | $16 |
| Monthly Housing Costs | $405 | $0 |
| Real Estate Taxes | $707 | $56 |
Property Value by Mortgage Status in Lockney
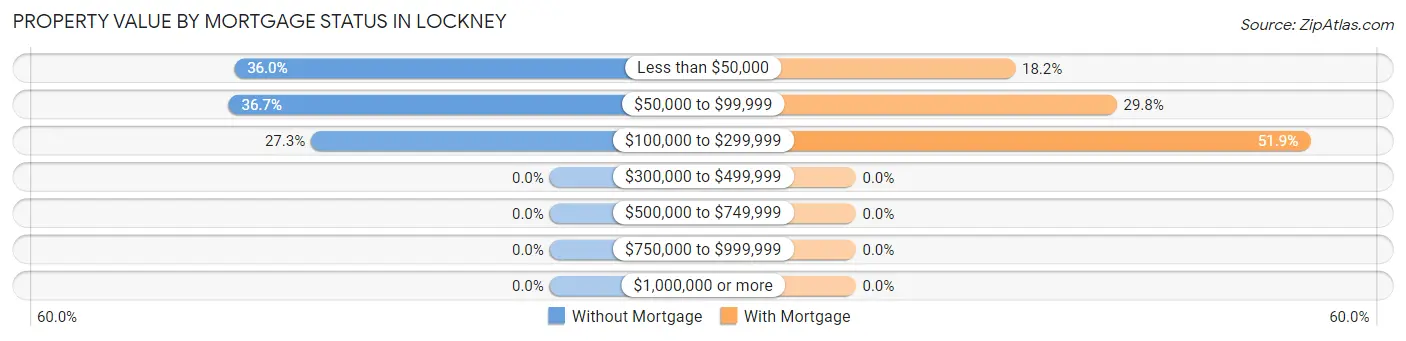
| Property Value | Without Mortgage | With Mortgage |
| Less than $50,000 | 111 (36.0%) | 33 (18.2%) |
| $50,000 to $99,999 | 113 (36.7%) | 54 (29.8%) |
| $100,000 to $299,999 | 84 (27.3%) | 94 (51.9%) |
| $300,000 to $499,999 | 0 (0.0%) | 0 (0.0%) |
| $500,000 to $749,999 | 0 (0.0%) | 0 (0.0%) |
| $750,000 to $999,999 | 0 (0.0%) | 0 (0.0%) |
| $1,000,000 or more | 0 (0.0%) | 0 (0.0%) |
| Total | 308 (100.0%) | 181 (100.0%) |
Household Income by Mortgage Status in Lockney
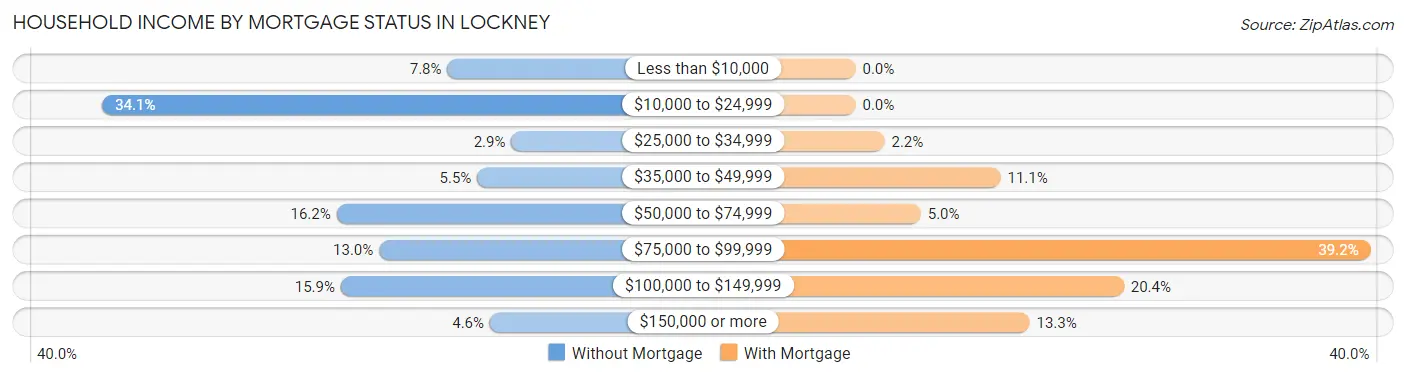
| Household Income | Without Mortgage | With Mortgage |
| Less than $10,000 | 24 (7.8%) | 0 (0.0%) |
| $10,000 to $24,999 | 105 (34.1%) | 0 (0.0%) |
| $25,000 to $34,999 | 9 (2.9%) | 4 (2.2%) |
| $35,000 to $49,999 | 17 (5.5%) | 20 (11.1%) |
| $50,000 to $74,999 | 50 (16.2%) | 9 (5.0%) |
| $75,000 to $99,999 | 40 (13.0%) | 71 (39.2%) |
| $100,000 to $149,999 | 49 (15.9%) | 37 (20.4%) |
| $150,000 or more | 14 (4.5%) | 24 (13.3%) |
| Total | 308 (100.0%) | 181 (100.0%) |
Property Value to Household Income Ratio in Lockney
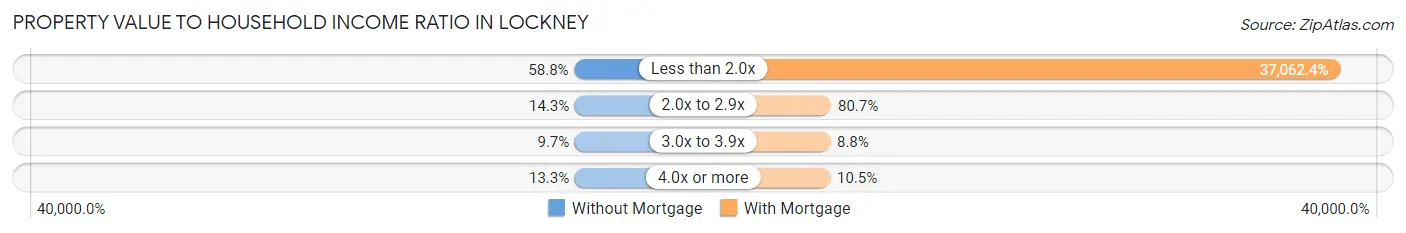
| Value-to-Income Ratio | Without Mortgage | With Mortgage |
| Less than 2.0x | 181 (58.8%) | 67,083 (37,062.4%) |
| 2.0x to 2.9x | 44 (14.3%) | 146 (80.7%) |
| 3.0x to 3.9x | 30 (9.7%) | 16 (8.8%) |
| 4.0x or more | 41 (13.3%) | 19 (10.5%) |
| Total | 308 (100.0%) | 181 (100.0%) |
Real Estate Taxes by Mortgage Status in Lockney
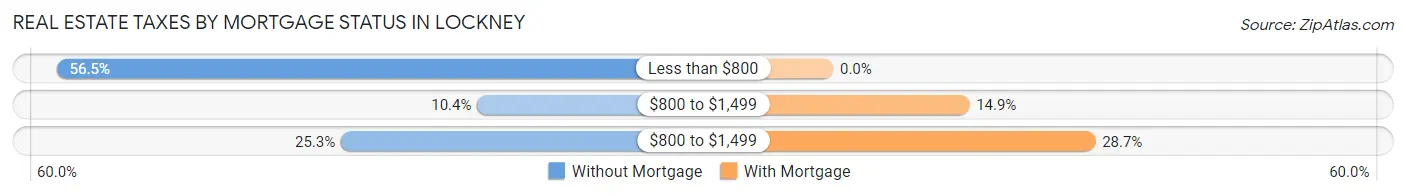
| Property Taxes | Without Mortgage | With Mortgage |
| Less than $800 | 174 (56.5%) | 0 (0.0%) |
| $800 to $1,499 | 32 (10.4%) | 27 (14.9%) |
| $800 to $1,499 | 78 (25.3%) | 52 (28.7%) |
| Total | 308 (100.0%) | 181 (100.0%) |
Health & Disability in Lockney
Health Insurance Coverage by Age in Lockney
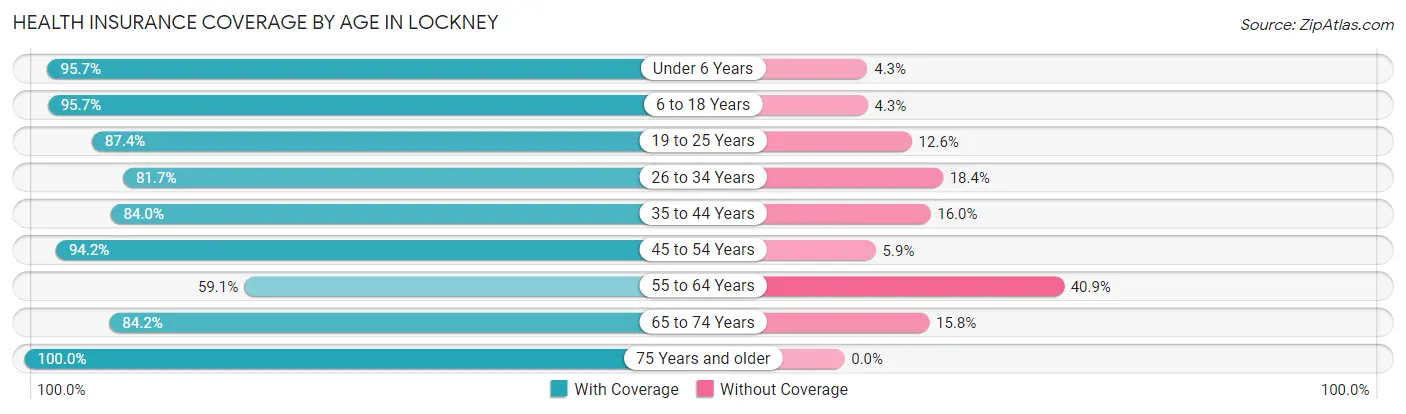
| Age Bracket | With Coverage | Without Coverage |
| Under 6 Years | 67 (95.7%) | 3 (4.3%) |
| 6 to 18 Years | 177 (95.7%) | 8 (4.3%) |
| 19 to 25 Years | 181 (87.4%) | 26 (12.6%) |
| 26 to 34 Years | 129 (81.7%) | 29 (18.3%) |
| 35 to 44 Years | 220 (84.0%) | 42 (16.0%) |
| 45 to 54 Years | 193 (94.2%) | 12 (5.9%) |
| 55 to 64 Years | 182 (59.1%) | 126 (40.9%) |
| 65 to 74 Years | 133 (84.2%) | 25 (15.8%) |
| 75 Years and older | 137 (100.0%) | 0 (0.0%) |
| Total | 1,419 (84.0%) | 271 (16.0%) |
Health Insurance Coverage by Citizenship Status in Lockney
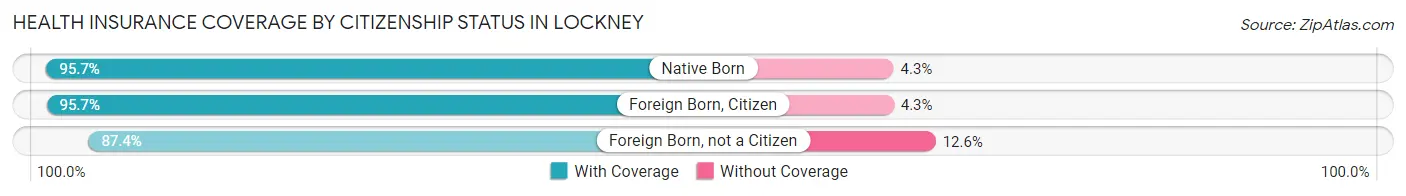
| Citizenship Status | With Coverage | Without Coverage |
| Native Born | 67 (95.7%) | 3 (4.3%) |
| Foreign Born, Citizen | 177 (95.7%) | 8 (4.3%) |
| Foreign Born, not a Citizen | 181 (87.4%) | 26 (12.6%) |
Health Insurance Coverage by Household Income in Lockney
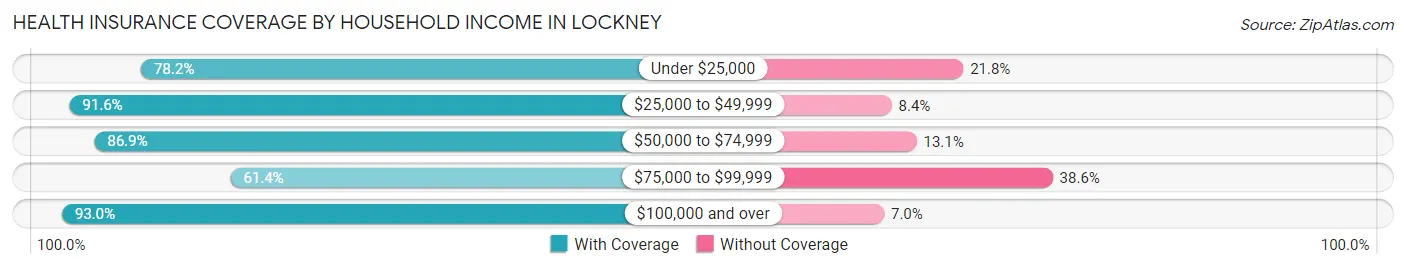
| Household Income | With Coverage | Without Coverage |
| Under $25,000 | 190 (78.2%) | 53 (21.8%) |
| $25,000 to $49,999 | 371 (91.6%) | 34 (8.4%) |
| $50,000 to $74,999 | 326 (86.9%) | 49 (13.1%) |
| $75,000 to $99,999 | 172 (61.4%) | 108 (38.6%) |
| $100,000 and over | 360 (93.0%) | 27 (7.0%) |
Public vs Private Health Insurance Coverage by Age in Lockney
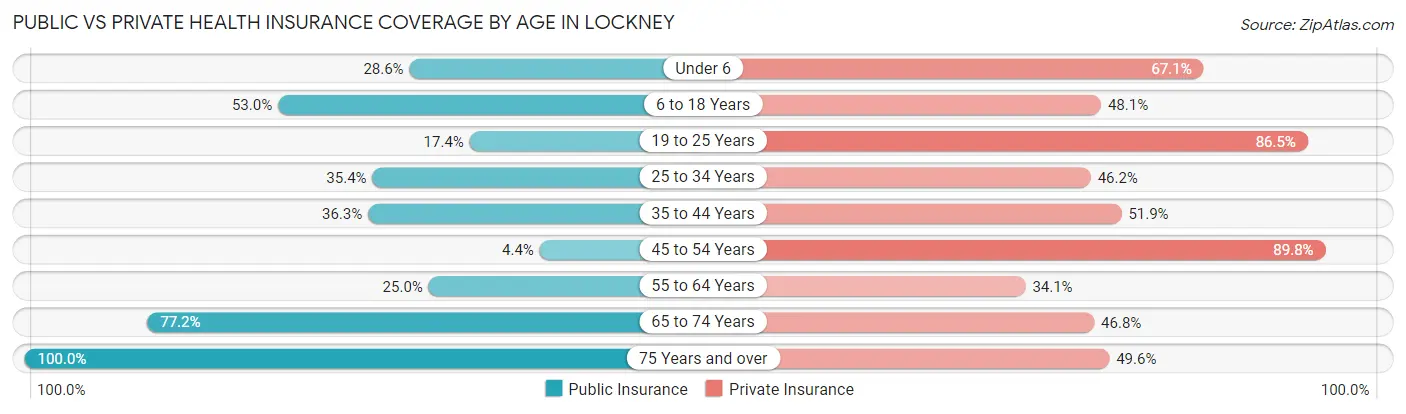
| Age Bracket | Public Insurance | Private Insurance |
| Under 6 | 20 (28.6%) | 47 (67.1%) |
| 6 to 18 Years | 98 (53.0%) | 89 (48.1%) |
| 19 to 25 Years | 36 (17.4%) | 179 (86.5%) |
| 25 to 34 Years | 56 (35.4%) | 73 (46.2%) |
| 35 to 44 Years | 95 (36.3%) | 136 (51.9%) |
| 45 to 54 Years | 9 (4.4%) | 184 (89.8%) |
| 55 to 64 Years | 77 (25.0%) | 105 (34.1%) |
| 65 to 74 Years | 122 (77.2%) | 74 (46.8%) |
| 75 Years and over | 137 (100.0%) | 68 (49.6%) |
| Total | 650 (38.5%) | 955 (56.5%) |
Disability Status by Sex by Age in Lockney
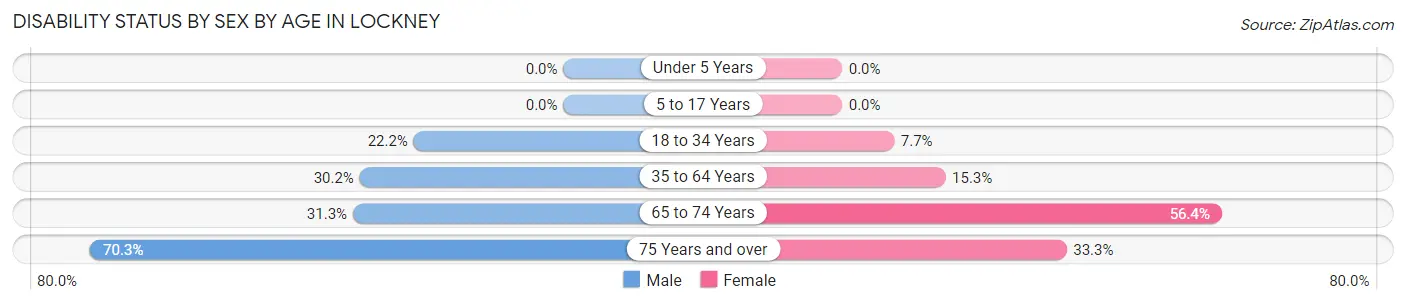
| Age Bracket | Male | Female |
| Under 5 Years | 0 (0.0%) | 0 (0.0%) |
| 5 to 17 Years | 0 (0.0%) | 0 (0.0%) |
| 18 to 34 Years | 34 (22.2%) | 18 (7.7%) |
| 35 to 64 Years | 124 (30.2%) | 56 (15.3%) |
| 65 to 74 Years | 25 (31.2%) | 44 (56.4%) |
| 75 Years and over | 52 (70.3%) | 21 (33.3%) |
Disability Class by Sex by Age in Lockney
Disability Class: Hearing Difficulty
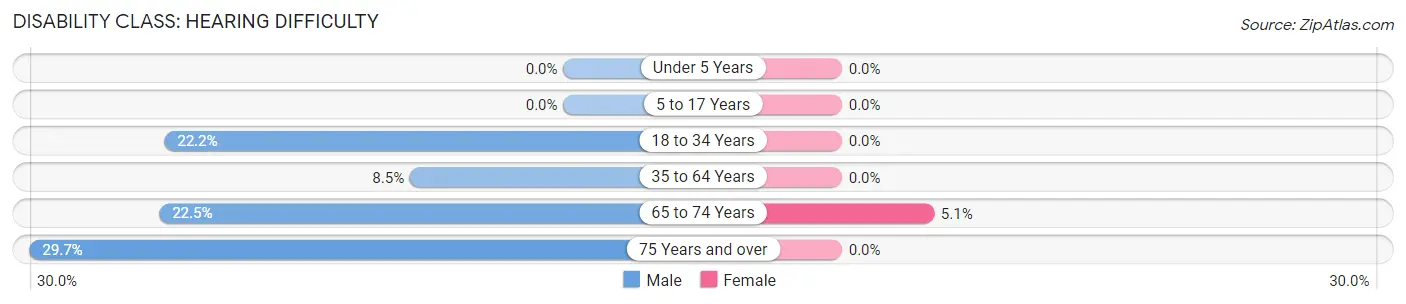
| Age Bracket | Male | Female |
| Under 5 Years | 0 (0.0%) | 0 (0.0%) |
| 5 to 17 Years | 0 (0.0%) | 0 (0.0%) |
| 18 to 34 Years | 34 (22.2%) | 0 (0.0%) |
| 35 to 64 Years | 35 (8.5%) | 0 (0.0%) |
| 65 to 74 Years | 18 (22.5%) | 4 (5.1%) |
| 75 Years and over | 22 (29.7%) | 0 (0.0%) |
Disability Class: Vision Difficulty
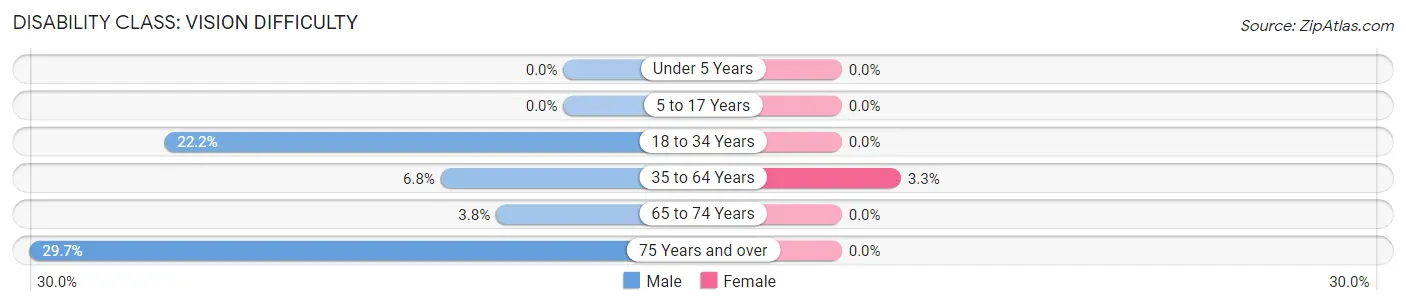
| Age Bracket | Male | Female |
| Under 5 Years | 0 (0.0%) | 0 (0.0%) |
| 5 to 17 Years | 0 (0.0%) | 0 (0.0%) |
| 18 to 34 Years | 34 (22.2%) | 0 (0.0%) |
| 35 to 64 Years | 28 (6.8%) | 12 (3.3%) |
| 65 to 74 Years | 3 (3.7%) | 0 (0.0%) |
| 75 Years and over | 22 (29.7%) | 0 (0.0%) |
Disability Class: Cognitive Difficulty
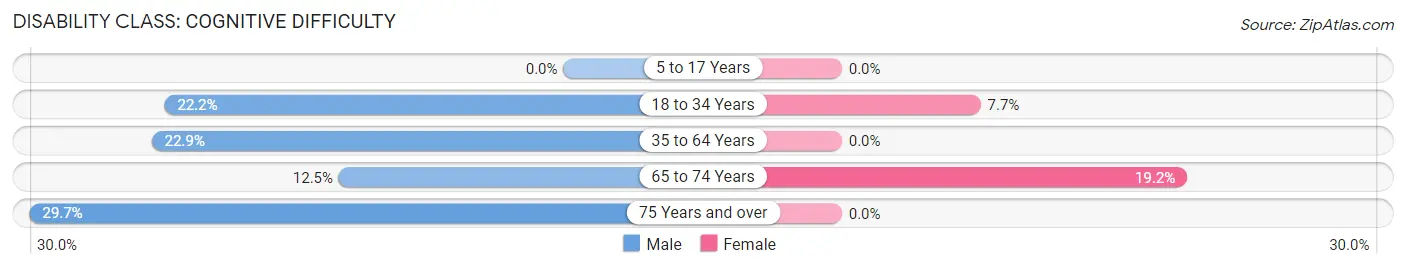
| Age Bracket | Male | Female |
| 5 to 17 Years | 0 (0.0%) | 0 (0.0%) |
| 18 to 34 Years | 34 (22.2%) | 18 (7.7%) |
| 35 to 64 Years | 94 (22.9%) | 0 (0.0%) |
| 65 to 74 Years | 10 (12.5%) | 15 (19.2%) |
| 75 Years and over | 22 (29.7%) | 0 (0.0%) |
Disability Class: Ambulatory Difficulty
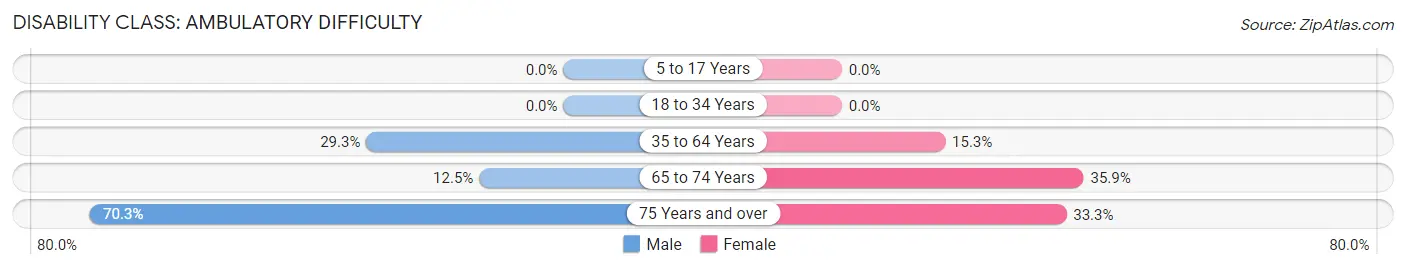
| Age Bracket | Male | Female |
| 5 to 17 Years | 0 (0.0%) | 0 (0.0%) |
| 18 to 34 Years | 0 (0.0%) | 0 (0.0%) |
| 35 to 64 Years | 120 (29.3%) | 56 (15.3%) |
| 65 to 74 Years | 10 (12.5%) | 28 (35.9%) |
| 75 Years and over | 52 (70.3%) | 21 (33.3%) |
Disability Class: Self-Care Difficulty
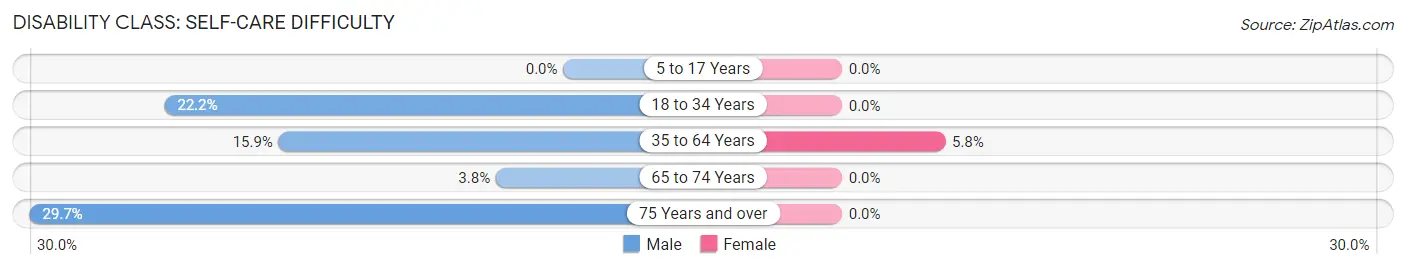
| Age Bracket | Male | Female |
| 5 to 17 Years | 0 (0.0%) | 0 (0.0%) |
| 18 to 34 Years | 34 (22.2%) | 0 (0.0%) |
| 35 to 64 Years | 65 (15.9%) | 21 (5.8%) |
| 65 to 74 Years | 3 (3.7%) | 0 (0.0%) |
| 75 Years and over | 22 (29.7%) | 0 (0.0%) |
Technology Access in Lockney
Computing Device Access in Lockney
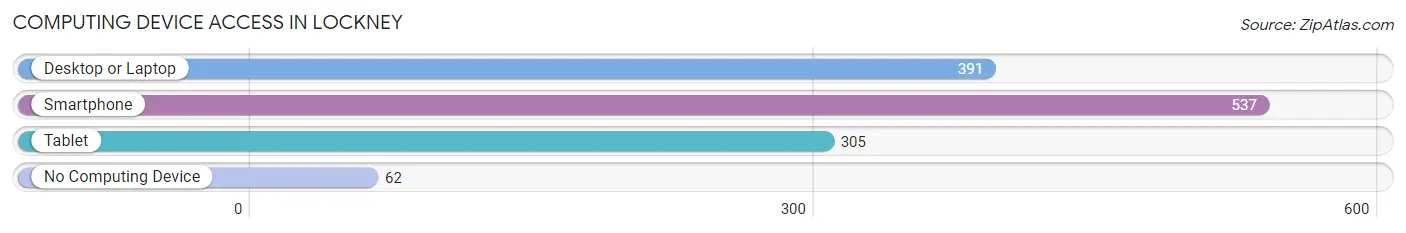
| Device Type | # Households | % Households |
| Desktop or Laptop | 391 | 63.5% |
| Smartphone | 537 | 87.2% |
| Tablet | 305 | 49.5% |
| No Computing Device | 62 | 10.1% |
| Total | 616 | 100.0% |
Internet Access in Lockney
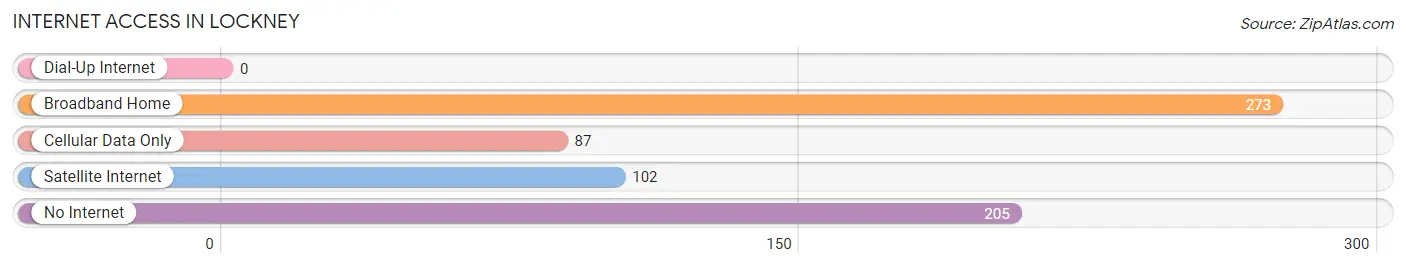
| Internet Type | # Households | % Households |
| Dial-Up Internet | 0 | 0.0% |
| Broadband Home | 273 | 44.3% |
| Cellular Data Only | 87 | 14.1% |
| Satellite Internet | 102 | 16.6% |
| No Internet | 205 | 33.3% |
| Total | 616 | 100.0% |
Lockney Summary
Lockney is a small town located in Floyd County, Texas, United States. It is situated on the high plains of the Llano Estacado, approximately 25 miles east of Plainview and 40 miles south of Lubbock. The population of Lockney was 2,072 at the 2010 census.
History
The area around Lockney was first settled in the late 1880s by ranchers and farmers. The town was founded in 1909 when the Santa Fe Railroad built a line through the area. The town was named after Lockney, a railroad official. The first post office was established in 1910.
In the early years, Lockney was a farming and ranching community. Cotton was the main crop, and the town had several cotton gins. The town also had a number of businesses, including a bank, a hotel, a drug store, and a movie theater.
In the 1950s, Lockney began to experience a decline in population as many of the young people moved away to find work in larger cities. The town was further impacted by the closing of the local cotton gins in the 1970s.
Geography
Lockney is located at 34°25'25" North, 101°30'25" West (34.423, -101.507). According to the United States Census Bureau, the town has a total area of 1.2 square miles, all of it land.
Economy
The economy of Lockney is largely based on agriculture. Cotton is still the main crop, although other crops such as corn, wheat, and sorghum are also grown. The town also has a number of businesses, including a grocery store, a hardware store, and a feed store.
Demographics
As of the 2010 census, there were 2,072 people, 790 households, and 545 families residing in the town. The population density was 1,726.7 people per square mile. The racial makeup of the town was 79.2% White, 0.7% African American, 0.4% Native American, 0.2% Asian, 16.2% from other races, and 3.3% from two or more races. Hispanic or Latino of any race were 33.2% of the population.
The median income for a household in the town was $30,938, and the median income for a family was $35,625. Males had a median income of $27,500 versus $20,000 for females. The per capita income for the town was $14,845. About 17.2% of families and 20.2% of the population were below the poverty line, including 28.2% of those under age 18 and 15.2% of those age 65 or over.
Common Questions
What is Per Capita Income in Lockney?
Per Capita income in Lockney is $24,390.
What is the Median Family Income in Lockney?
Median Family Income in Lockney is $65,298.
What is the Median Household income in Lockney?
Median Household Income in Lockney is $52,500.
What is Income or Wage Gap in Lockney?
Income or Wage Gap in Lockney is 37.1%.
Women in Lockney earn 62.9 cents for every dollar earned by a man.
What is Inequality or Gini Index in Lockney?
Inequality or Gini Index in Lockney is 0.41.
What is the Total Population of Lockney?
Total Population of Lockney is 1,720.
What is the Total Male Population of Lockney?
Total Male Population of Lockney is 822.
What is the Total Female Population of Lockney?
Total Female Population of Lockney is 898.
What is the Ratio of Males per 100 Females in Lockney?
There are 91.54 Males per 100 Females in Lockney.
What is the Ratio of Females per 100 Males in Lockney?
There are 109.25 Females per 100 Males in Lockney.
What is the Median Population Age in Lockney?
Median Population Age in Lockney is 44.0 Years.
What is the Average Family Size in Lockney
Average Family Size in Lockney is 3.3 People.
What is the Average Household Size in Lockney
Average Household Size in Lockney is 2.7 People.
How Large is the Labor Force in Lockney?
There are 843 People in the Labor Forcein in Lockney.
What is the Percentage of People in the Labor Force in Lockney?
55.8% of People are in the Labor Force in Lockney.
What is the Unemployment Rate in Lockney?
Unemployment Rate in Lockney is 5.0%.