Lockhart, TX Map & Demographics
Lockhart Map
Lockhart Overview
$27,759
PER CAPITA INCOME
$75,092
AVG FAMILY INCOME
$68,270
AVG HOUSEHOLD INCOME
37.4%
WAGE / INCOME GAP [ % ]
62.6¢/ $1
WAGE / INCOME GAP [ $ ]
0.41
INEQUALITY / GINI INDEX
14,463
TOTAL POPULATION
6,452
MALE POPULATION
8,011
FEMALE POPULATION
80.54
MALES / 100 FEMALES
124.16
FEMALES / 100 MALES
38.6
MEDIAN AGE
3.3
AVG FAMILY SIZE
2.7
AVG HOUSEHOLD SIZE
6,505
LABOR FORCE [ PEOPLE ]
55.3%
PERCENT IN LABOR FORCE
1.3%
UNEMPLOYMENT RATE
Lockhart Zip Codes
Lockhart Area Codes
Income in Lockhart
Income Overview in Lockhart
Per Capita Income in Lockhart is $27,759, while median incomes of families and households are $75,092 and $68,270 respectively.
| Characteristic | Number | Measure |
| Per Capita Income | 14,463 | $27,759 |
| Median Family Income | 3,194 | $75,092 |
| Mean Family Income | 3,194 | $88,769 |
| Median Household Income | 4,707 | $68,270 |
| Mean Household Income | 4,707 | $80,404 |
| Income Deficit | 3,194 | $0 |
| Wage / Income Gap (%) | 14,463 | 37.43% |
| Wage / Income Gap ($) | 14,463 | 62.57¢ per $1 |
| Gini / Inequality Index | 14,463 | 0.41 |
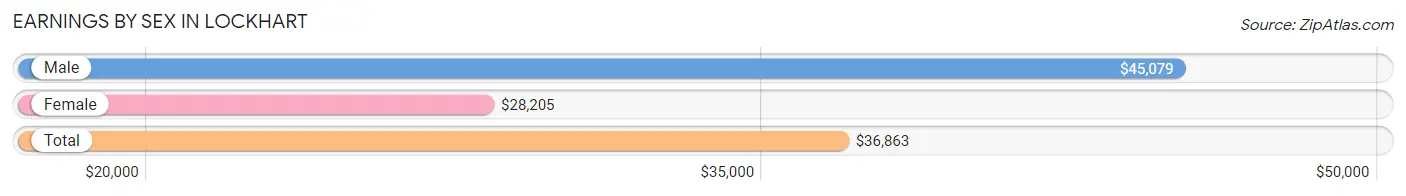
Earnings by Sex in Lockhart
Average Earnings in Lockhart are $36,863, $45,079 for men and $28,205 for women, a difference of 37.4%.
| Sex | Number | Average Earnings |
| Male | 3,526 (50.6%) | $45,079 |
| Female | 3,446 (49.4%) | $28,205 |
| Total | 6,972 (100.0%) | $36,863 |
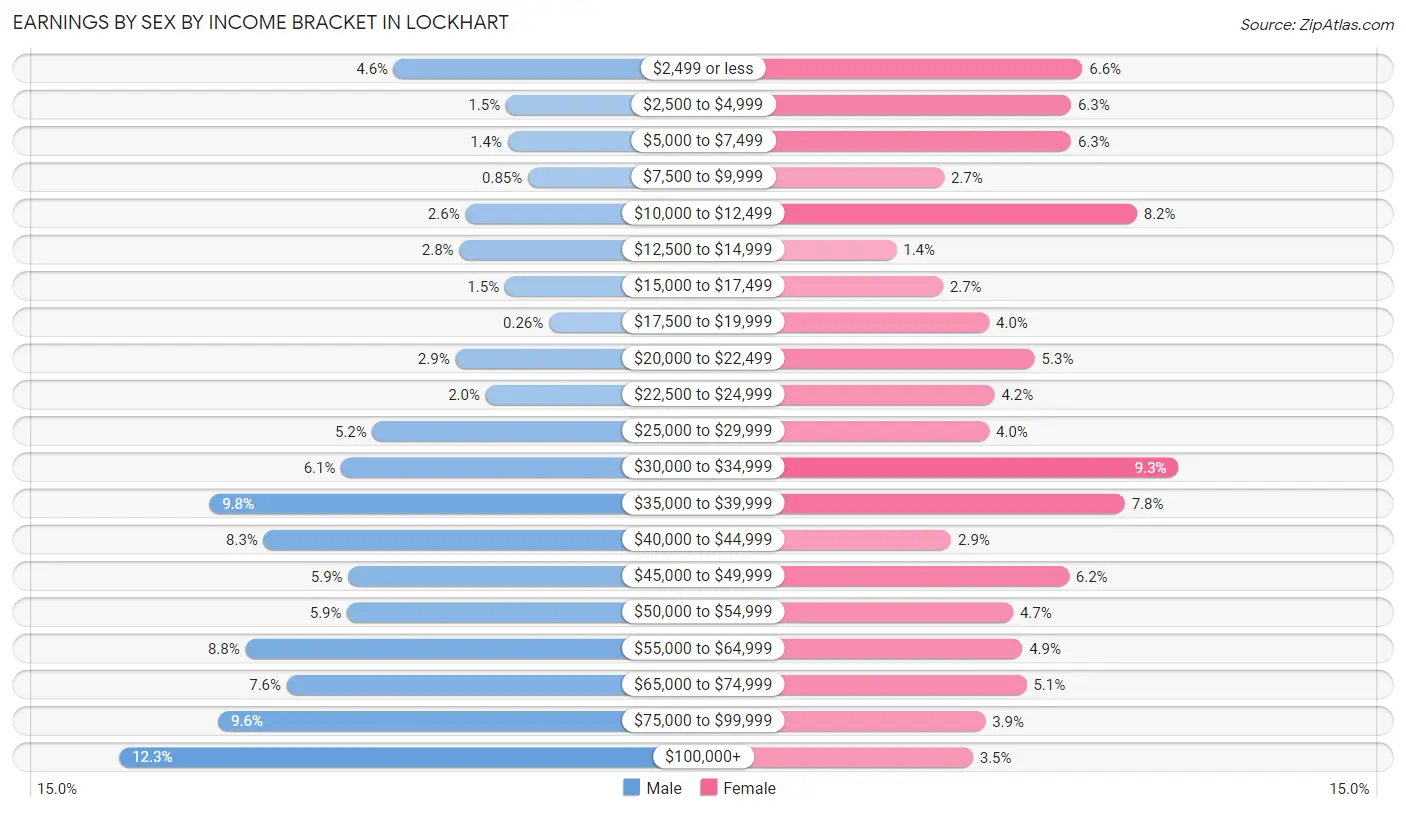
Earnings by Sex by Income Bracket in Lockhart
The most common earnings brackets in Lockhart are $100,000+ for men (435 | 12.3%) and $30,000 to $34,999 for women (321 | 9.3%).
| Income | Male | Female |
| $2,499 or less | 163 (4.6%) | 228 (6.6%) |
| $2,500 to $4,999 | 52 (1.5%) | 217 (6.3%) |
| $5,000 to $7,499 | 50 (1.4%) | 217 (6.3%) |
| $7,500 to $9,999 | 30 (0.9%) | 94 (2.7%) |
| $10,000 to $12,499 | 92 (2.6%) | 281 (8.2%) |
| $12,500 to $14,999 | 98 (2.8%) | 48 (1.4%) |
| $15,000 to $17,499 | 53 (1.5%) | 93 (2.7%) |
| $17,500 to $19,999 | 9 (0.3%) | 138 (4.0%) |
| $20,000 to $22,499 | 102 (2.9%) | 182 (5.3%) |
| $22,500 to $24,999 | 72 (2.0%) | 143 (4.2%) |
| $25,000 to $29,999 | 184 (5.2%) | 138 (4.0%) |
| $30,000 to $34,999 | 215 (6.1%) | 321 (9.3%) |
| $35,000 to $39,999 | 346 (9.8%) | 269 (7.8%) |
| $40,000 to $44,999 | 292 (8.3%) | 101 (2.9%) |
| $45,000 to $49,999 | 208 (5.9%) | 215 (6.2%) |
| $50,000 to $54,999 | 209 (5.9%) | 161 (4.7%) |
| $55,000 to $64,999 | 310 (8.8%) | 170 (4.9%) |
| $65,000 to $74,999 | 269 (7.6%) | 174 (5.1%) |
| $75,000 to $99,999 | 337 (9.6%) | 134 (3.9%) |
| $100,000+ | 435 (12.3%) | 122 (3.5%) |
| Total | 3,526 (100.0%) | 3,446 (100.0%) |
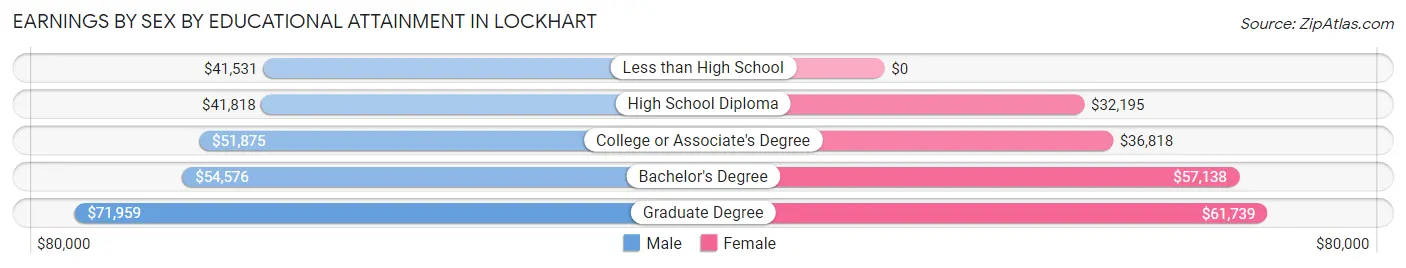
Earnings by Sex by Educational Attainment in Lockhart
Average earnings in Lockhart are $47,429 for men and $34,575 for women, a difference of 27.1%. Men with an educational attainment of graduate degree enjoy the highest average annual earnings of $71,959, while those with less than high school education earn the least with $41,531. Women with an educational attainment of graduate degree earn the most with the average annual earnings of $61,739, while those with high school diploma education have the smallest earnings of $32,195.
| Educational Attainment | Male Income | Female Income |
| Less than High School | $41,531 | $0 |
| High School Diploma | $41,818 | $32,195 |
| College or Associate's Degree | $51,875 | $36,818 |
| Bachelor's Degree | $54,576 | $57,138 |
| Graduate Degree | $71,959 | $61,739 |
| Total | $47,429 | $34,575 |
Family Income in Lockhart
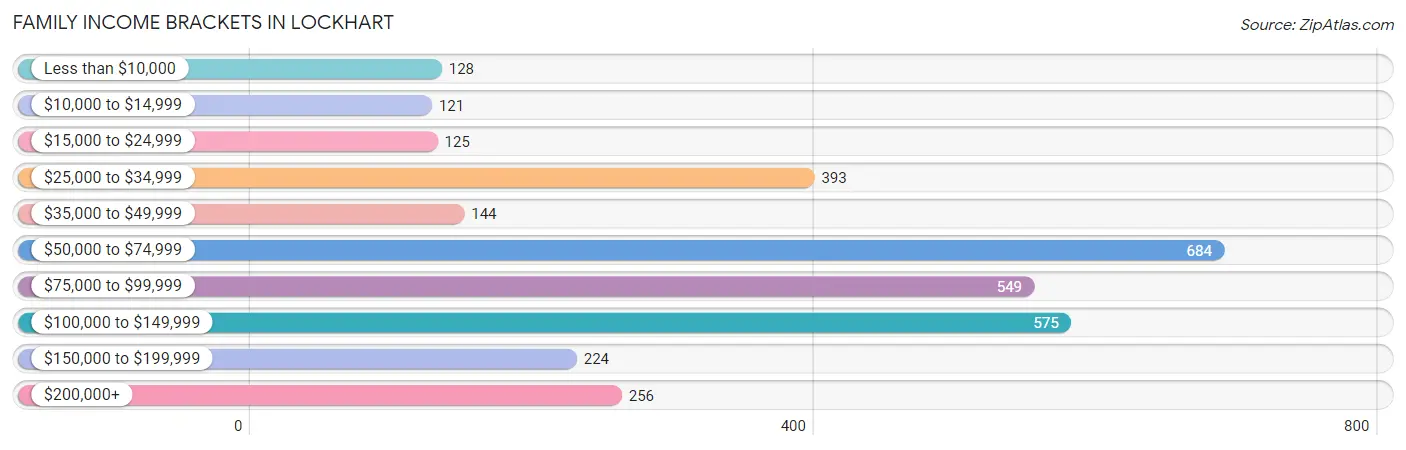
Family Income Brackets in Lockhart
According to the Lockhart family income data, there are 684 families falling into the $50,000 to $74,999 income range, which is the most common income bracket and makes up 21.4% of all families. Conversely, the $10,000 to $14,999 income bracket is the least frequent group with only 121 families (3.8%) belonging to this category.
| Income Bracket | # Families | % Families |
| Less than $10,000 | 128 | 4.0% |
| $10,000 to $14,999 | 121 | 3.8% |
| $15,000 to $24,999 | 125 | 3.9% |
| $25,000 to $34,999 | 393 | 12.3% |
| $35,000 to $49,999 | 144 | 4.5% |
| $50,000 to $74,999 | 684 | 21.4% |
| $75,000 to $99,999 | 549 | 17.2% |
| $100,000 to $149,999 | 575 | 18.0% |
| $150,000 to $199,999 | 224 | 7.0% |
| $200,000+ | 256 | 8.0% |
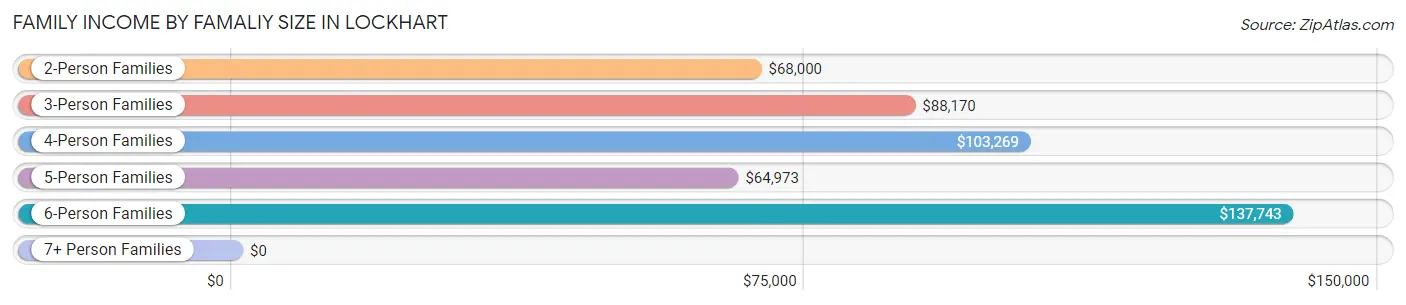
Family Income by Famaliy Size in Lockhart
6-person families (123 | 3.8%) account for the highest median family income in Lockhart with $137,743 per family, while 2-person families (1,574 | 49.3%) have the highest median income of $34,000 per family member.
| Income Bracket | # Families | Median Income |
| 2-Person Families | 1,574 (49.3%) | $68,000 |
| 3-Person Families | 636 (19.9%) | $88,170 |
| 4-Person Families | 340 (10.6%) | $103,269 |
| 5-Person Families | 345 (10.8%) | $64,973 |
| 6-Person Families | 123 (3.8%) | $137,743 |
| 7+ Person Families | 176 (5.5%) | $0 |
| Total | 3,194 (100.0%) | $75,092 |
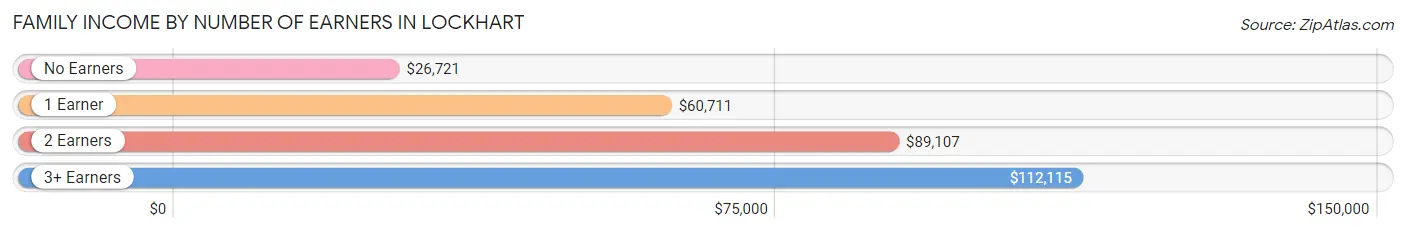
Family Income by Number of Earners in Lockhart
The median family income in Lockhart is $75,092, with families comprising 3+ earners (406) having the highest median family income of $112,115, while families with no earners (363) have the lowest median family income of $26,721, accounting for 12.7% and 11.4% of families, respectively.
| Number of Earners | # Families | Median Income |
| No Earners | 363 (11.4%) | $26,721 |
| 1 Earner | 1,109 (34.7%) | $60,711 |
| 2 Earners | 1,316 (41.2%) | $89,107 |
| 3+ Earners | 406 (12.7%) | $112,115 |
| Total | 3,194 (100.0%) | $75,092 |
Household Income in Lockhart
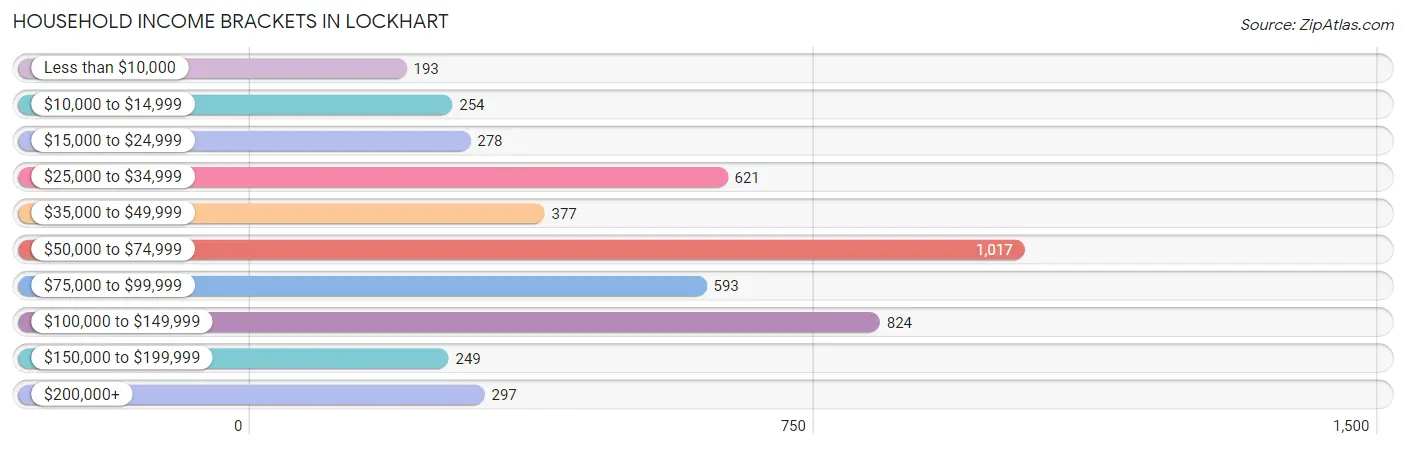
Household Income Brackets in Lockhart
With 1,017 households falling in the category, the $50,000 to $74,999 income range is the most frequent in Lockhart, accounting for 21.6% of all households. In contrast, only 193 households (4.1%) fall into the less than $10,000 income bracket, making it the least populous group.
| Income Bracket | # Households | % Households |
| Less than $10,000 | 193 | 4.1% |
| $10,000 to $14,999 | 254 | 5.4% |
| $15,000 to $24,999 | 278 | 5.9% |
| $25,000 to $34,999 | 621 | 13.2% |
| $35,000 to $49,999 | 377 | 8.0% |
| $50,000 to $74,999 | 1,017 | 21.6% |
| $75,000 to $99,999 | 593 | 12.6% |
| $100,000 to $149,999 | 824 | 17.5% |
| $150,000 to $199,999 | 249 | 5.3% |
| $200,000+ | 297 | 6.3% |
Household Income by Householder Age in Lockhart
The median household income in Lockhart is $68,270, with the highest median household income of $76,197 found in the 45 to 64 years age bracket for the primary householder. A total of 1,724 households (36.6%) fall into this category. Meanwhile, the 15 to 24 years age bracket for the primary householder has the lowest median household income of $30,833, with 228 households (4.8%) in this group.
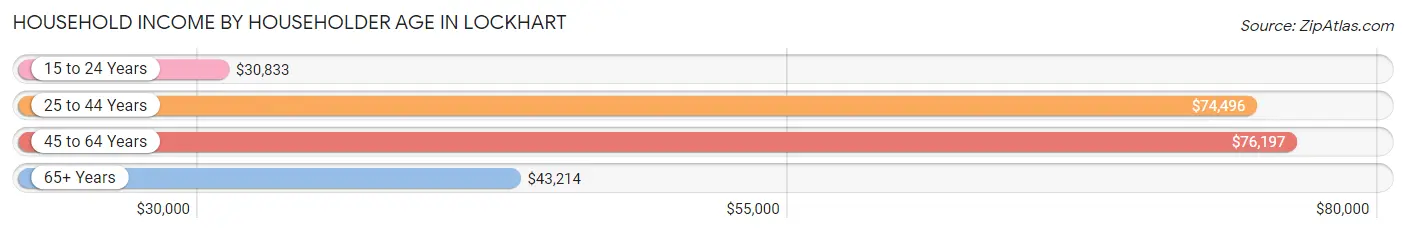
| Income Bracket | # Households | Median Income |
| 15 to 24 Years | 228 (4.8%) | $30,833 |
| 25 to 44 Years | 1,411 (30.0%) | $74,496 |
| 45 to 64 Years | 1,724 (36.6%) | $76,197 |
| 65+ Years | 1,344 (28.5%) | $43,214 |
| Total | 4,707 (100.0%) | $68,270 |
Poverty in Lockhart
Income Below Poverty by Sex and Age in Lockhart
With 9.5% poverty level for males and 15.7% for females among the residents of Lockhart, 12 to 14 year old males and 6 to 11 year old females are the most vulnerable to poverty, with 63 males (22.9%) and 146 females (24.0%) in their respective age groups living below the poverty level.
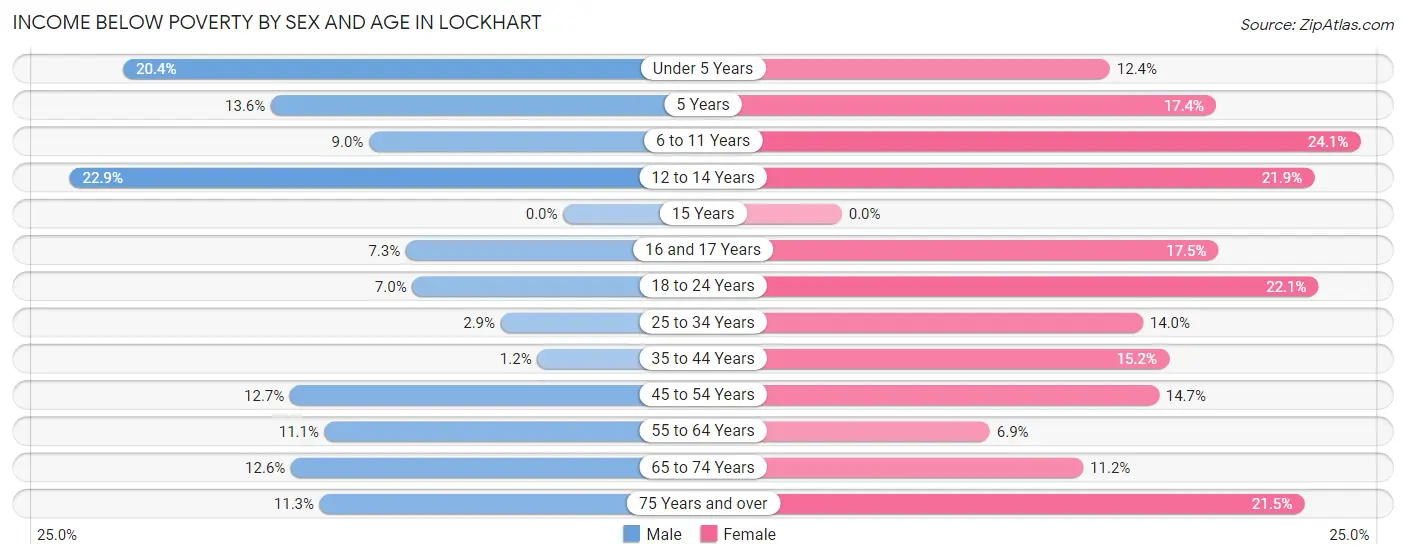
| Age Bracket | Male | Female |
| Under 5 Years | 67 (20.4%) | 28 (12.4%) |
| 5 Years | 24 (13.6%) | 25 (17.4%) |
| 6 to 11 Years | 49 (9.0%) | 146 (24.0%) |
| 12 to 14 Years | 63 (22.9%) | 62 (21.9%) |
| 15 Years | 0 (0.0%) | 0 (0.0%) |
| 16 and 17 Years | 10 (7.3%) | 47 (17.5%) |
| 18 to 24 Years | 24 (7.0%) | 153 (22.1%) |
| 25 to 34 Years | 30 (2.9%) | 107 (14.0%) |
| 35 to 44 Years | 8 (1.2%) | 110 (15.2%) |
| 45 to 54 Years | 99 (12.7%) | 95 (14.7%) |
| 55 to 64 Years | 96 (11.1%) | 64 (6.9%) |
| 65 to 74 Years | 75 (12.6%) | 97 (11.2%) |
| 75 Years and over | 26 (11.3%) | 121 (21.4%) |
| Total | 571 (9.5%) | 1,055 (15.7%) |
Income Above Poverty by Sex and Age in Lockhart
According to the poverty statistics in Lockhart, males aged 15 years and females aged 15 years are the age groups that are most secure financially, with 100.0% of males and 100.0% of females in these age groups living above the poverty line.
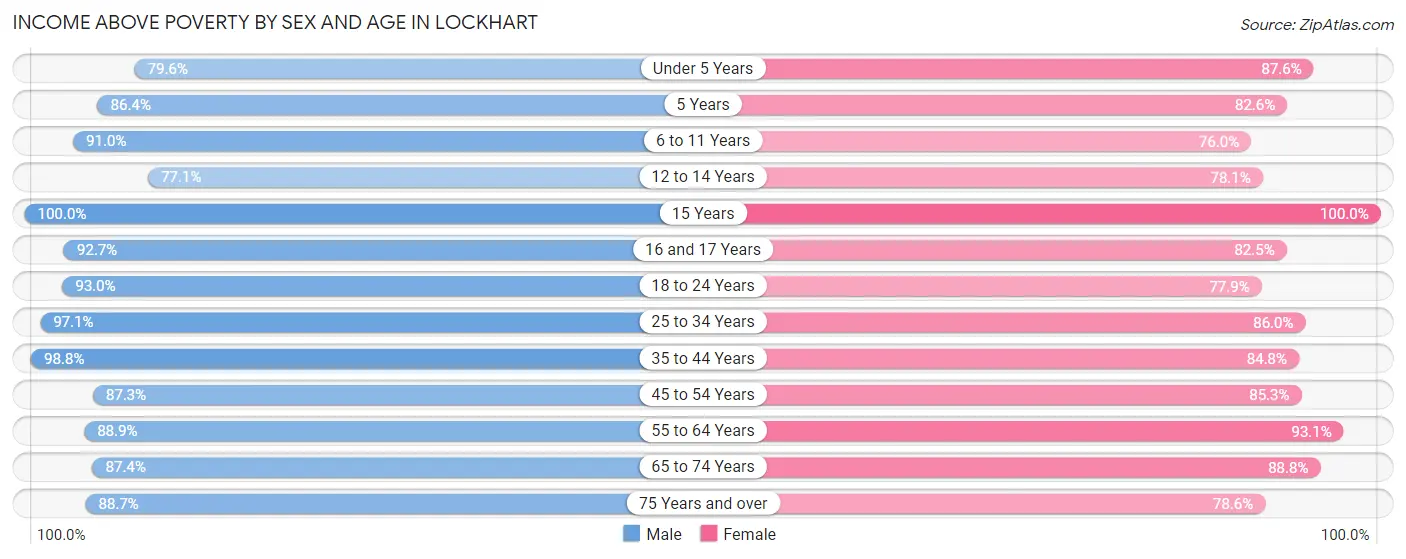
| Age Bracket | Male | Female |
| Under 5 Years | 261 (79.6%) | 197 (87.6%) |
| 5 Years | 153 (86.4%) | 119 (82.6%) |
| 6 to 11 Years | 495 (91.0%) | 461 (75.9%) |
| 12 to 14 Years | 212 (77.1%) | 221 (78.1%) |
| 15 Years | 66 (100.0%) | 11 (100.0%) |
| 16 and 17 Years | 127 (92.7%) | 222 (82.5%) |
| 18 to 24 Years | 319 (93.0%) | 539 (77.9%) |
| 25 to 34 Years | 1,003 (97.1%) | 659 (86.0%) |
| 35 to 44 Years | 660 (98.8%) | 615 (84.8%) |
| 45 to 54 Years | 682 (87.3%) | 551 (85.3%) |
| 55 to 64 Years | 771 (88.9%) | 868 (93.1%) |
| 65 to 74 Years | 519 (87.4%) | 769 (88.8%) |
| 75 Years and over | 204 (88.7%) | 443 (78.5%) |
| Total | 5,472 (90.5%) | 5,675 (84.3%) |
Income Below Poverty Among Married-Couple Families in Lockhart
The poverty statistics for married-couple families in Lockhart show that 6.4% or 143 of the total 2,243 families live below the poverty line. Families with 1 or 2 children have the highest poverty rate of 14.0%, comprising of 109 families. On the other hand, families with 3 or 4 children have the lowest poverty rate of 0.0%, which includes 0 families.
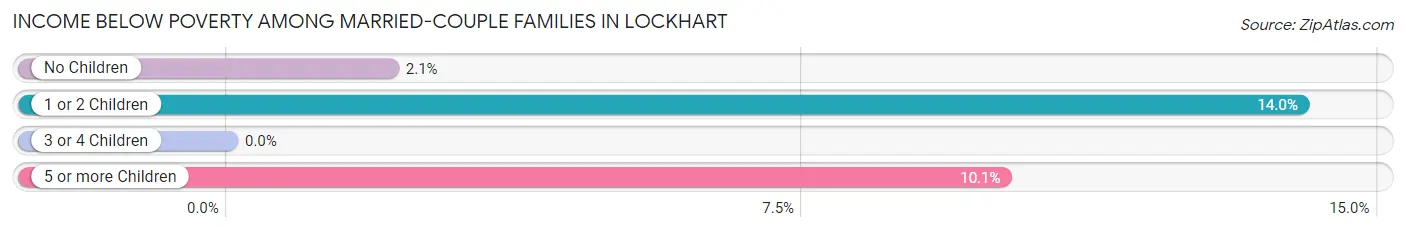
| Children | Above Poverty | Below Poverty |
| No Children | 1,165 (97.9%) | 25 (2.1%) |
| 1 or 2 Children | 670 (86.0%) | 109 (14.0%) |
| 3 or 4 Children | 185 (100.0%) | 0 (0.0%) |
| 5 or more Children | 80 (89.9%) | 9 (10.1%) |
| Total | 2,100 (93.6%) | 143 (6.4%) |
Income Below Poverty Among Single-Parent Households in Lockhart
According to the poverty data in Lockhart, 1.1% or 2 single-father households and 28.5% or 220 single-mother households are living below the poverty line. Among single-father households, those with 1 or 2 children have the highest poverty rate, with 2 households (2.9%) experiencing poverty. Likewise, among single-mother households, those with 3 or 4 children have the highest poverty rate, with 58 households (73.4%) falling below the poverty line.
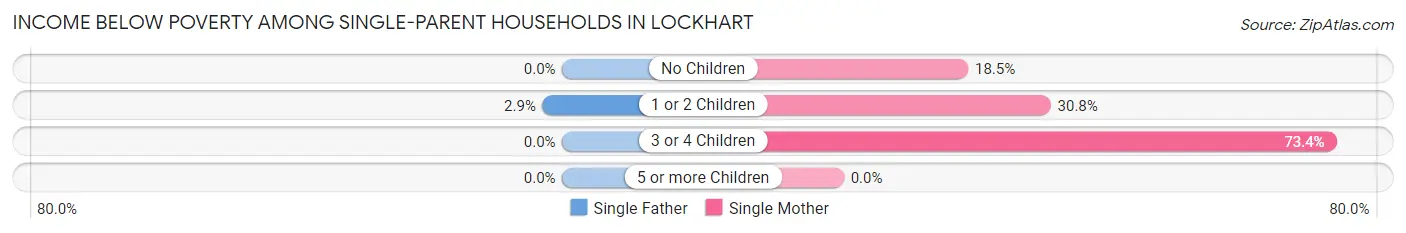
| Children | Single Father | Single Mother |
| No Children | 0 (0.0%) | 63 (18.5%) |
| 1 or 2 Children | 2 (2.9%) | 99 (30.8%) |
| 3 or 4 Children | 0 (0.0%) | 58 (73.4%) |
| 5 or more Children | 0 (0.0%) | 0 (0.0%) |
| Total | 2 (1.1%) | 220 (28.5%) |
Income Below Poverty Among Married-Couple vs Single-Parent Households in Lockhart
The poverty data for Lockhart shows that 143 of the married-couple family households (6.4%) and 222 of the single-parent households (23.3%) are living below the poverty level. Within the married-couple family households, those with 1 or 2 children have the highest poverty rate, with 109 households (14.0%) falling below the poverty line. Among the single-parent households, those with 3 or 4 children have the highest poverty rate, with 58 household (73.4%) living below poverty.
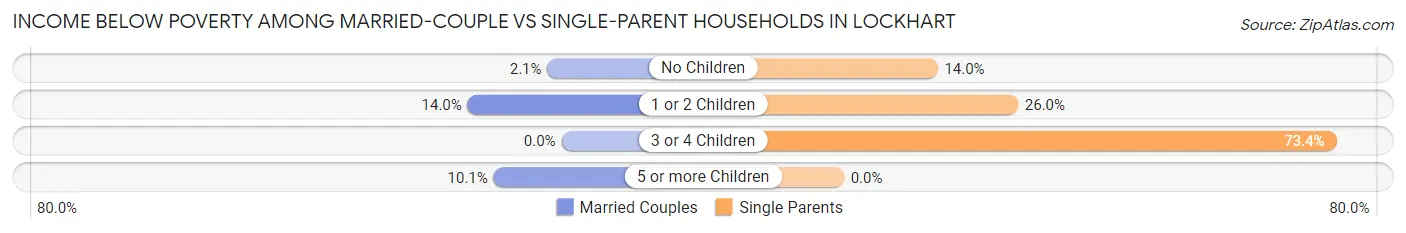
| Children | Married-Couple Families | Single-Parent Households |
| No Children | 25 (2.1%) | 63 (14.0%) |
| 1 or 2 Children | 109 (14.0%) | 101 (26.0%) |
| 3 or 4 Children | 0 (0.0%) | 58 (73.4%) |
| 5 or more Children | 9 (10.1%) | 0 (0.0%) |
| Total | 143 (6.4%) | 222 (23.3%) |
Race in Lockhart
The most populous races in Lockhart are White / Caucasian (10,336 | 71.5%), Hispanic or Latino (7,836 | 54.2%), and Two or more Races (1,738 | 12.0%).
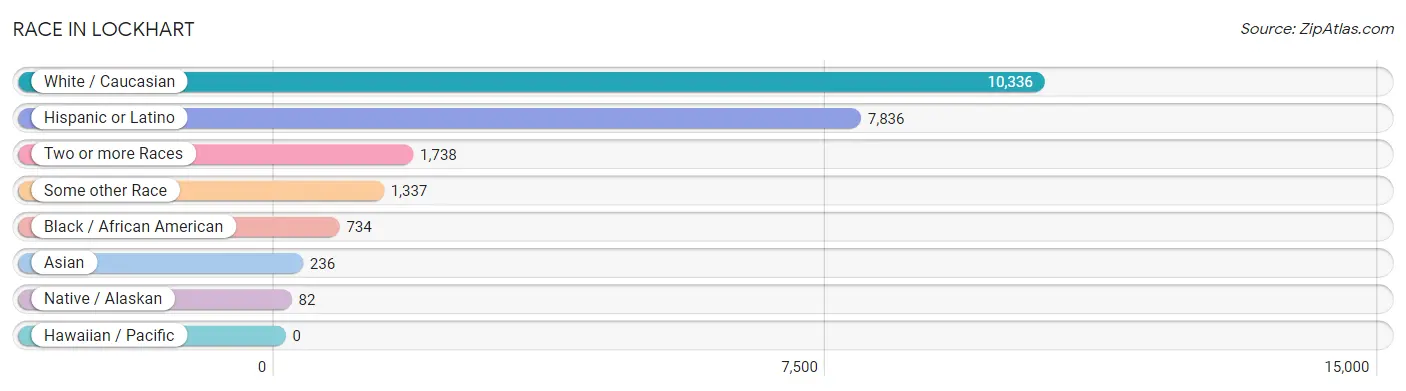
| Race | # Population | % Population |
| Asian | 236 | 1.6% |
| Black / African American | 734 | 5.1% |
| Hawaiian / Pacific | 0 | 0.0% |
| Hispanic or Latino | 7,836 | 54.2% |
| Native / Alaskan | 82 | 0.6% |
| White / Caucasian | 10,336 | 71.5% |
| Two or more Races | 1,738 | 12.0% |
| Some other Race | 1,337 | 9.2% |
| Total | 14,463 | 100.0% |
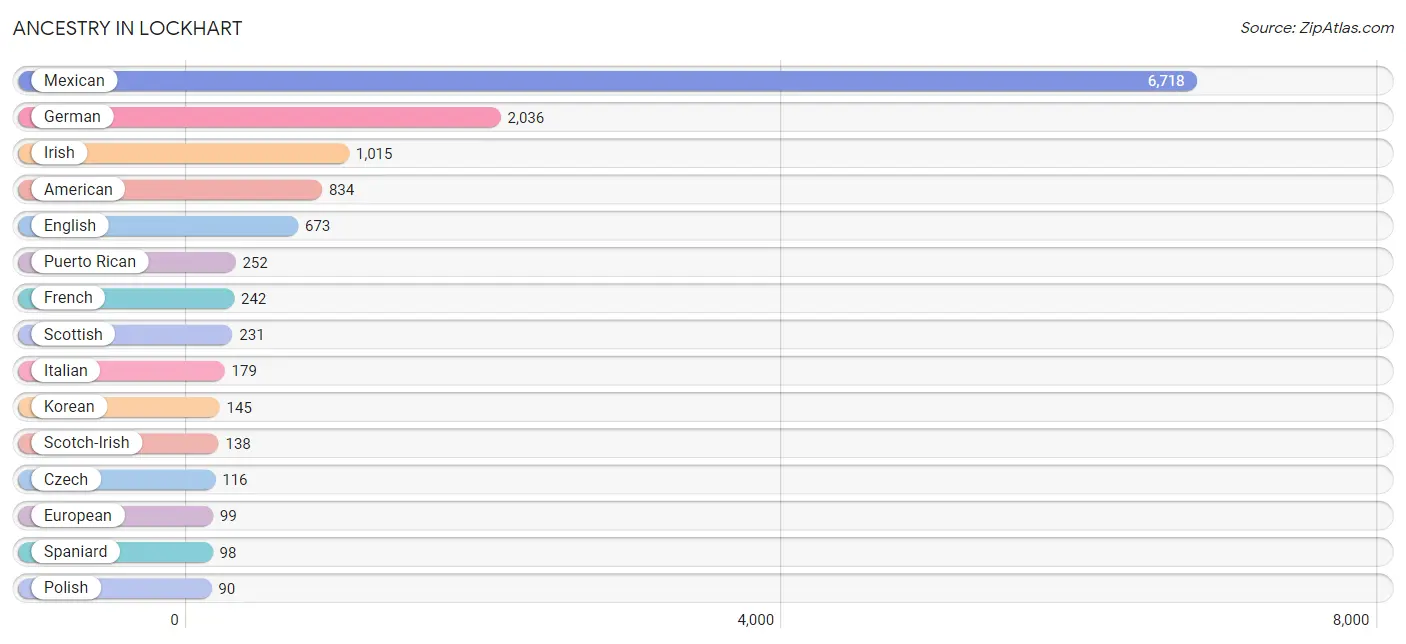
Ancestry in Lockhart
The most populous ancestries reported in Lockhart are Mexican (6,718 | 46.5%), German (2,036 | 14.1%), Irish (1,015 | 7.0%), American (834 | 5.8%), and English (673 | 4.6%), together accounting for 78.0% of all Lockhart residents.
| Ancestry | # Population | % Population |
| African | 8 | 0.1% |
| American | 834 | 5.8% |
| Arab | 45 | 0.3% |
| Austrian | 31 | 0.2% |
| Bhutanese | 77 | 0.5% |
| British | 63 | 0.4% |
| Burmese | 9 | 0.1% |
| Cajun | 7 | 0.1% |
| Canadian | 14 | 0.1% |
| Central American | 26 | 0.2% |
| Cherokee | 42 | 0.3% |
| Choctaw | 1 | 0.0% |
| Colombian | 69 | 0.5% |
| Czech | 116 | 0.8% |
| Dutch | 15 | 0.1% |
| Dutch West Indian | 22 | 0.2% |
| Eastern European | 23 | 0.2% |
| English | 673 | 4.6% |
| European | 99 | 0.7% |
| Finnish | 16 | 0.1% |
| French | 242 | 1.7% |
| German | 2,036 | 14.1% |
| Greek | 5 | 0.0% |
| Hungarian | 52 | 0.4% |
| Indian (Asian) | 36 | 0.3% |
| Irish | 1,015 | 7.0% |
| Iroquois | 34 | 0.2% |
| Italian | 179 | 1.2% |
| Jordanian | 29 | 0.2% |
| Korean | 145 | 1.0% |
| Lithuanian | 8 | 0.1% |
| Malaysian | 34 | 0.2% |
| Mexican | 6,718 | 46.5% |
| Mexican American Indian | 72 | 0.5% |
| Norwegian | 43 | 0.3% |
| Panamanian | 26 | 0.2% |
| Pennsylvania German | 4 | 0.0% |
| Pima | 15 | 0.1% |
| Polish | 90 | 0.6% |
| Portuguese | 10 | 0.1% |
| Puerto Rican | 252 | 1.7% |
| Russian | 24 | 0.2% |
| Scandinavian | 10 | 0.1% |
| Scotch-Irish | 138 | 0.9% |
| Scottish | 231 | 1.6% |
| South American | 69 | 0.5% |
| Spaniard | 98 | 0.7% |
| Spanish | 5 | 0.0% |
| Subsaharan African | 15 | 0.1% |
| Swedish | 16 | 0.1% |
| Swiss | 17 | 0.1% |
| Welsh | 23 | 0.2% | View All 52 Rows |
Immigrants in Lockhart
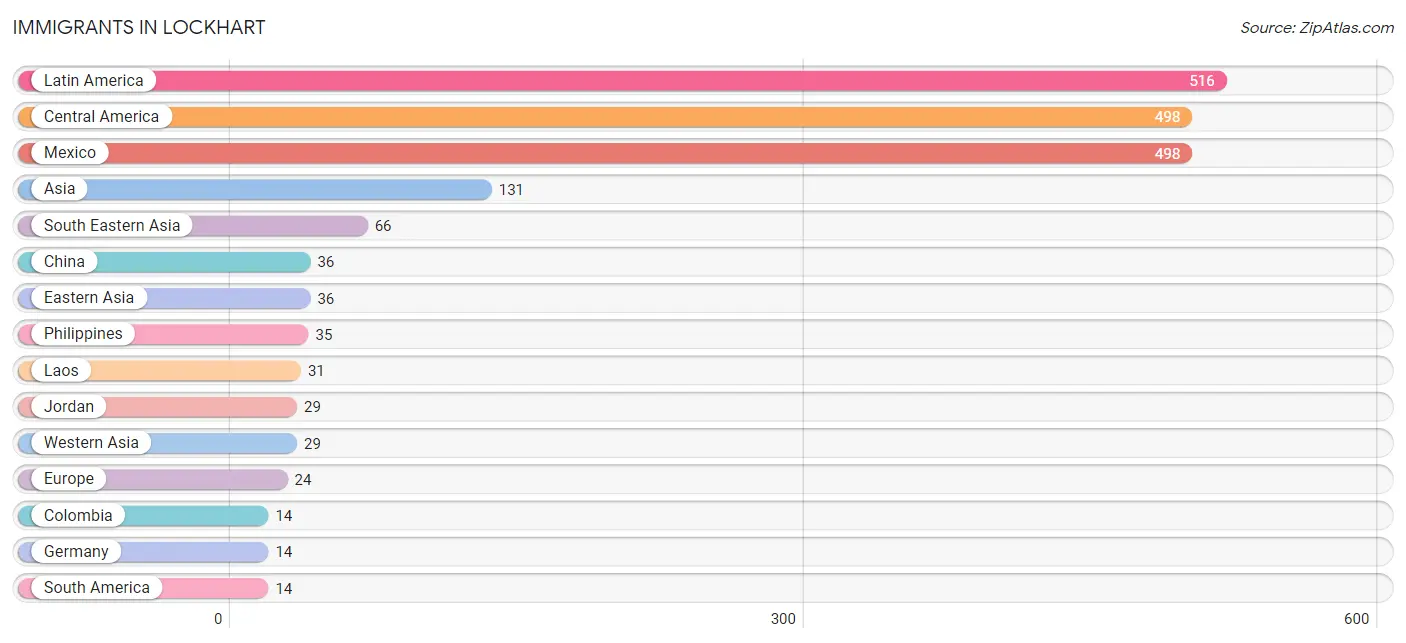
The most numerous immigrant groups reported in Lockhart came from Latin America (516 | 3.6%), Central America (498 | 3.4%), Mexico (498 | 3.4%), Asia (131 | 0.9%), and South Eastern Asia (66 | 0.5%), together accounting for 11.8% of all Lockhart residents.
| Immigration Origin | # Population | % Population |
| Africa | 7 | 0.1% |
| Asia | 131 | 0.9% |
| Cameroon | 7 | 0.1% |
| Caribbean | 4 | 0.0% |
| Central America | 498 | 3.4% |
| China | 36 | 0.3% |
| Colombia | 14 | 0.1% |
| Dominican Republic | 4 | 0.0% |
| Eastern Asia | 36 | 0.3% |
| Eastern Europe | 10 | 0.1% |
| Europe | 24 | 0.2% |
| Germany | 14 | 0.1% |
| Hungary | 10 | 0.1% |
| Jordan | 29 | 0.2% |
| Laos | 31 | 0.2% |
| Latin America | 516 | 3.6% |
| Mexico | 498 | 3.4% |
| Middle Africa | 7 | 0.1% |
| Philippines | 35 | 0.2% |
| South America | 14 | 0.1% |
| South Eastern Asia | 66 | 0.5% |
| Western Asia | 29 | 0.2% |
| Western Europe | 14 | 0.1% | View All 23 Rows |
Sex and Age in Lockhart
Sex and Age in Lockhart
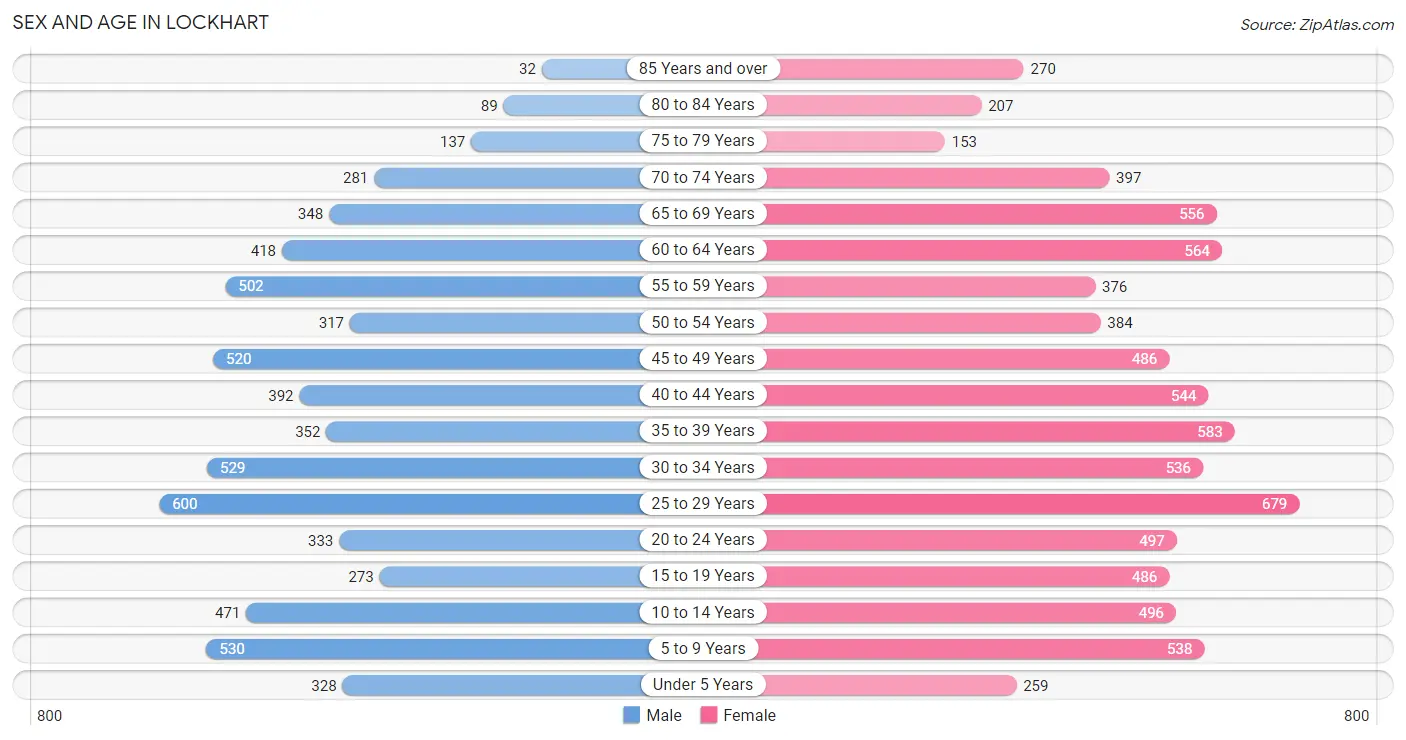
The most populous age groups in Lockhart are 25 to 29 Years (600 | 9.3%) for men and 25 to 29 Years (679 | 8.5%) for women.
| Age Bracket | Male | Female |
| Under 5 Years | 328 (5.1%) | 259 (3.2%) |
| 5 to 9 Years | 530 (8.2%) | 538 (6.7%) |
| 10 to 14 Years | 471 (7.3%) | 496 (6.2%) |
| 15 to 19 Years | 273 (4.2%) | 486 (6.1%) |
| 20 to 24 Years | 333 (5.2%) | 497 (6.2%) |
| 25 to 29 Years | 600 (9.3%) | 679 (8.5%) |
| 30 to 34 Years | 529 (8.2%) | 536 (6.7%) |
| 35 to 39 Years | 352 (5.5%) | 583 (7.3%) |
| 40 to 44 Years | 392 (6.1%) | 544 (6.8%) |
| 45 to 49 Years | 520 (8.1%) | 486 (6.1%) |
| 50 to 54 Years | 317 (4.9%) | 384 (4.8%) |
| 55 to 59 Years | 502 (7.8%) | 376 (4.7%) |
| 60 to 64 Years | 418 (6.5%) | 564 (7.0%) |
| 65 to 69 Years | 348 (5.4%) | 556 (6.9%) |
| 70 to 74 Years | 281 (4.4%) | 397 (5.0%) |
| 75 to 79 Years | 137 (2.1%) | 153 (1.9%) |
| 80 to 84 Years | 89 (1.4%) | 207 (2.6%) |
| 85 Years and over | 32 (0.5%) | 270 (3.4%) |
| Total | 6,452 (100.0%) | 8,011 (100.0%) |
Families and Households in Lockhart
Median Family Size in Lockhart
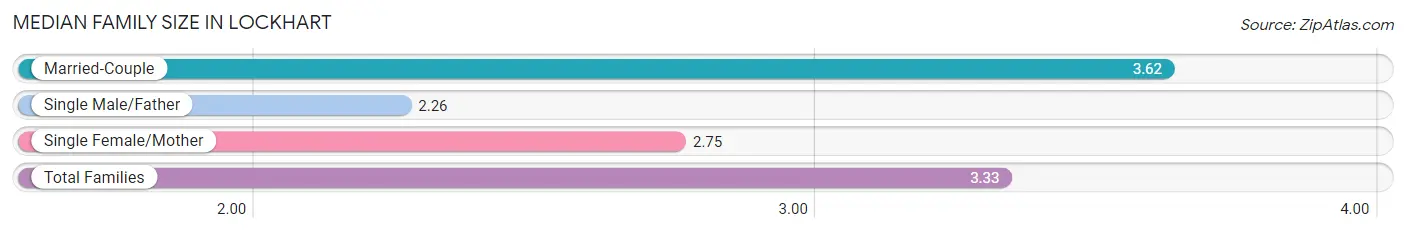
The median family size in Lockhart is 3.33 persons per family, with married-couple families (2,243 | 70.2%) accounting for the largest median family size of 3.62 persons per family. On the other hand, single male/father families (179 | 5.6%) represent the smallest median family size with 2.26 persons per family.
| Family Type | # Families | Family Size |
| Married-Couple | 2,243 (70.2%) | 3.62 |
| Single Male/Father | 179 (5.6%) | 2.26 |
| Single Female/Mother | 772 (24.2%) | 2.75 |
| Total Families | 3,194 (100.0%) | 3.33 |
Median Household Size in Lockhart
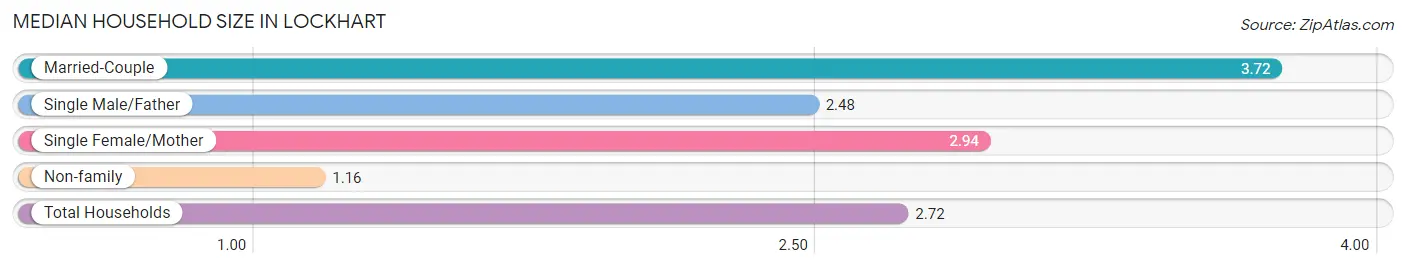
The median household size in Lockhart is 2.72 persons per household, with married-couple households (2,243 | 47.6%) accounting for the largest median household size of 3.72 persons per household. non-family households (1,513 | 32.1%) represent the smallest median household size with 1.16 persons per household.
| Household Type | # Households | Household Size |
| Married-Couple | 2,243 (47.6%) | 3.72 |
| Single Male/Father | 179 (3.8%) | 2.48 |
| Single Female/Mother | 772 (16.4%) | 2.94 |
| Non-family | 1,513 (32.1%) | 1.16 |
| Total Households | 4,707 (100.0%) | 2.72 |
Household Size by Marriage Status in Lockhart
Out of a total of 4,707 households in Lockhart, 3,194 (67.9%) are family households, while 1,513 (32.1%) are nonfamily households. The most numerous type of family households are 2-person households, comprising 1,447, and the most common type of nonfamily households are 1-person households, comprising 1,265.
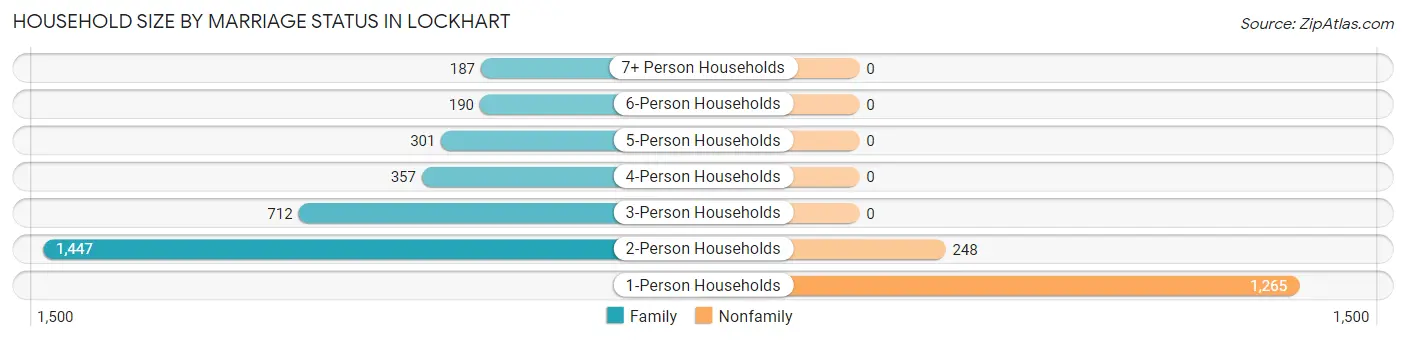
| Household Size | Family Households | Nonfamily Households |
| 1-Person Households | - | 1,265 (26.9%) |
| 2-Person Households | 1,447 (30.7%) | 248 (5.3%) |
| 3-Person Households | 712 (15.1%) | 0 (0.0%) |
| 4-Person Households | 357 (7.6%) | 0 (0.0%) |
| 5-Person Households | 301 (6.4%) | 0 (0.0%) |
| 6-Person Households | 190 (4.0%) | 0 (0.0%) |
| 7+ Person Households | 187 (4.0%) | 0 (0.0%) |
| Total | 3,194 (67.9%) | 1,513 (32.1%) |
Female Fertility in Lockhart
Fertility by Age in Lockhart
Average fertility rate in Lockhart is 38.0 births per 1,000 women. Women in the age bracket of 20 to 34 years have the highest fertility rate with 77.0 births per 1,000 women. Women in the age bracket of 20 to 34 years acount for 88.0% of all women with births.
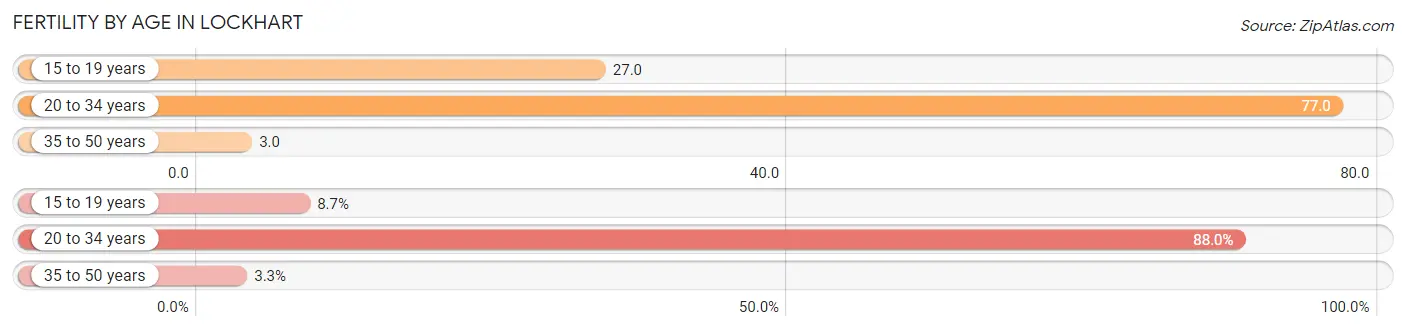
| Age Bracket | Women with Births | Births / 1,000 Women |
| 15 to 19 years | 13 (8.7%) | 27.0 |
| 20 to 34 years | 132 (88.0%) | 77.0 |
| 35 to 50 years | 5 (3.3%) | 3.0 |
| Total | 150 (100.0%) | 38.0 |
Fertility by Age by Marriage Status in Lockhart
61.3% of women with births (150) in Lockhart are married. The highest percentage of unmarried women with births falls into 15 to 19 years age bracket with 100.0% of them unmarried at the time of birth, while the lowest percentage of unmarried women with births belong to 35 to 50 years age bracket with 0.0% of them unmarried.
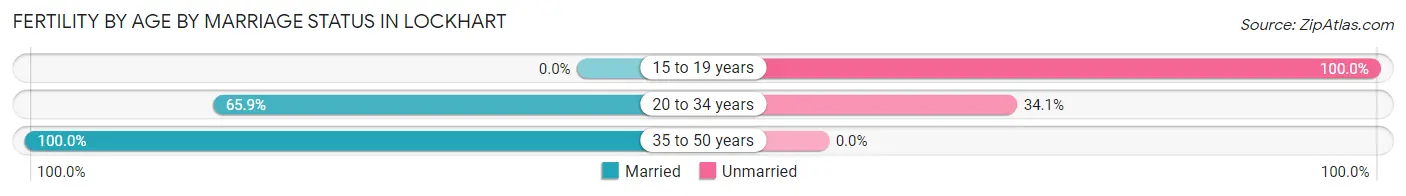
| Age Bracket | Married | Unmarried |
| 15 to 19 years | 0 (0.0%) | 13 (100.0%) |
| 20 to 34 years | 87 (65.9%) | 45 (34.1%) |
| 35 to 50 years | 5 (100.0%) | 0 (0.0%) |
| Total | 92 (61.3%) | 58 (38.7%) |
Fertility by Education in Lockhart
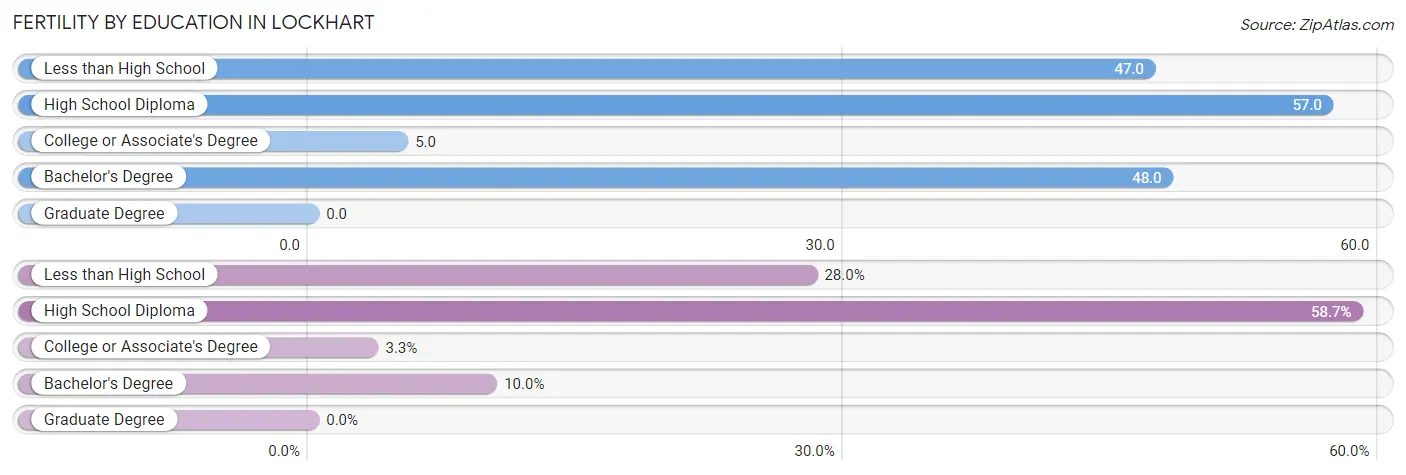
| Educational Attainment | Women with Births | Births / 1,000 Women |
| Less than High School | 42 (28.0%) | 47.0 |
| High School Diploma | 88 (58.7%) | 57.0 |
| College or Associate's Degree | 5 (3.3%) | 5.0 |
| Bachelor's Degree | 15 (10.0%) | 48.0 |
| Graduate Degree | 0 (0.0%) | 0.0 |
| Total | 150 (100.0%) | 38.0 |
Fertility by Education by Marriage Status in Lockhart
38.7% of women with births in Lockhart are unmarried. Women with the educational attainment of college or associate's degree are most likely to be married with 100.0% of them married at childbirth, while women with the educational attainment of less than high school are least likely to be married with 78.6% of them unmarried at childbirth.
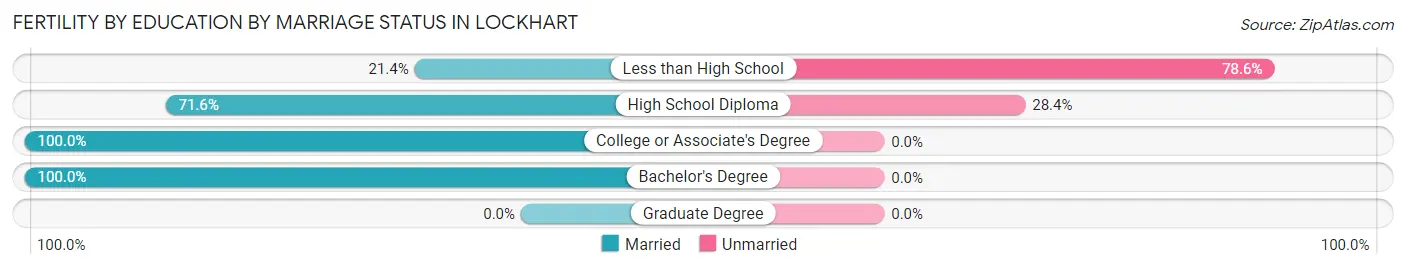
| Educational Attainment | Married | Unmarried |
| Less than High School | 9 (21.4%) | 33 (78.6%) |
| High School Diploma | 63 (71.6%) | 25 (28.4%) |
| College or Associate's Degree | 5 (100.0%) | 0 (0.0%) |
| Bachelor's Degree | 15 (100.0%) | 0 (0.0%) |
| Graduate Degree | 0 (0.0%) | 0 (0.0%) |
| Total | 92 (61.3%) | 58 (38.7%) |
Employment Characteristics in Lockhart
Employment by Class of Employer in Lockhart
Among the 6,285 employed individuals in Lockhart, private company employees (4,326 | 68.8%), local government employees (698 | 11.1%), and self-employed (not incorporated) (457 | 7.3%) make up the most common classes of employment.
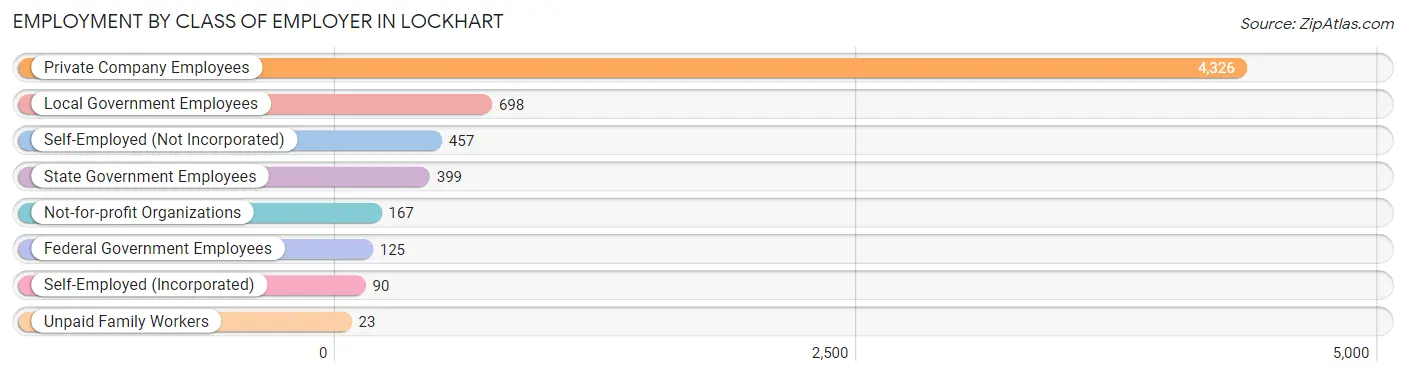
| Employer Class | # Employees | % Employees |
| Private Company Employees | 4,326 | 68.8% |
| Self-Employed (Incorporated) | 90 | 1.4% |
| Self-Employed (Not Incorporated) | 457 | 7.3% |
| Not-for-profit Organizations | 167 | 2.7% |
| Local Government Employees | 698 | 11.1% |
| State Government Employees | 399 | 6.4% |
| Federal Government Employees | 125 | 2.0% |
| Unpaid Family Workers | 23 | 0.4% |
| Total | 6,285 | 100.0% |
Employment Status by Age in Lockhart
According to the labor force statistics for Lockhart, out of the total population over 16 years of age (11,764), 55.3% or 6,505 individuals are in the labor force, with 1.3% or 85 of them unemployed. The age group with the highest labor force participation rate is 20 to 24 years, with 87.8% or 729 individuals in the labor force. Within the labor force, the 45 to 54 years age range has the highest percentage of unemployed individuals, with 6.1% or 69 of them being unemployed.
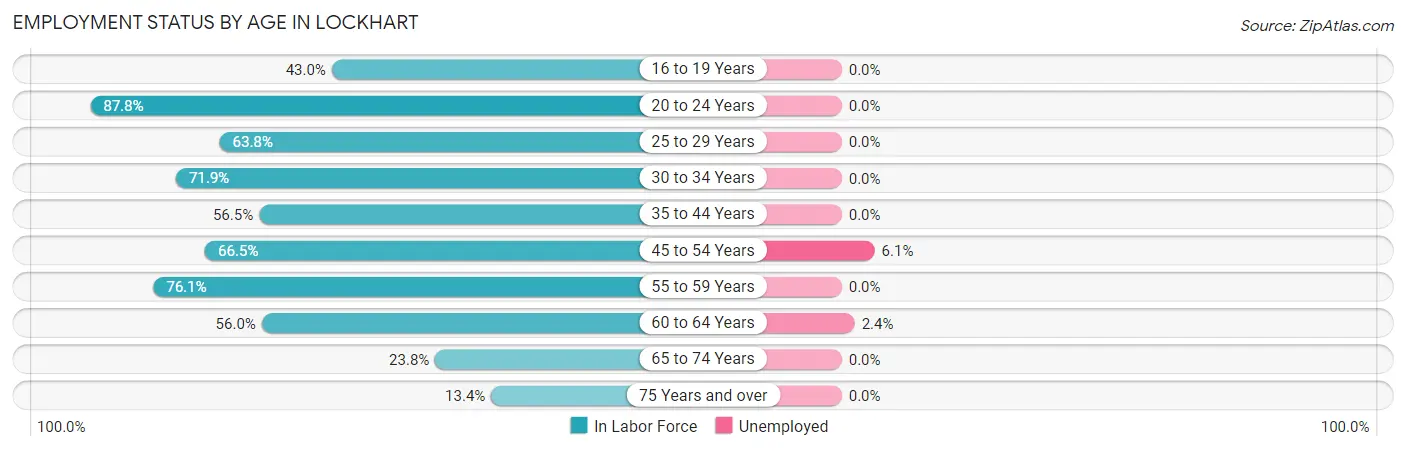
| Age Bracket | In Labor Force | Unemployed |
| 16 to 19 Years | 293 (43.0%) | 0 (0.0%) |
| 20 to 24 Years | 729 (87.8%) | 0 (0.0%) |
| 25 to 29 Years | 816 (63.8%) | 0 (0.0%) |
| 30 to 34 Years | 766 (71.9%) | 0 (0.0%) |
| 35 to 44 Years | 1,057 (56.5%) | 0 (0.0%) |
| 45 to 54 Years | 1,135 (66.5%) | 69 (6.1%) |
| 55 to 59 Years | 668 (76.1%) | 0 (0.0%) |
| 60 to 64 Years | 550 (56.0%) | 13 (2.4%) |
| 65 to 74 Years | 377 (23.8%) | 0 (0.0%) |
| 75 Years and over | 119 (13.4%) | 0 (0.0%) |
| Total | 6,505 (55.3%) | 85 (1.3%) |
Employment Status by Educational Attainment in Lockhart
According to labor force statistics for Lockhart, 64.2% of individuals (4,996) out of the total population between 25 and 64 years of age (7,782) are in the labor force, with 1.6% or 80 of them being unemployed. The group with the highest labor force participation rate are those with the educational attainment of bachelor's degree or higher, with 79.6% or 1,027 individuals in the labor force. Within the labor force, individuals with high school diploma education have the highest percentage of unemployment, with 2.3% or 52 of them being unemployed.
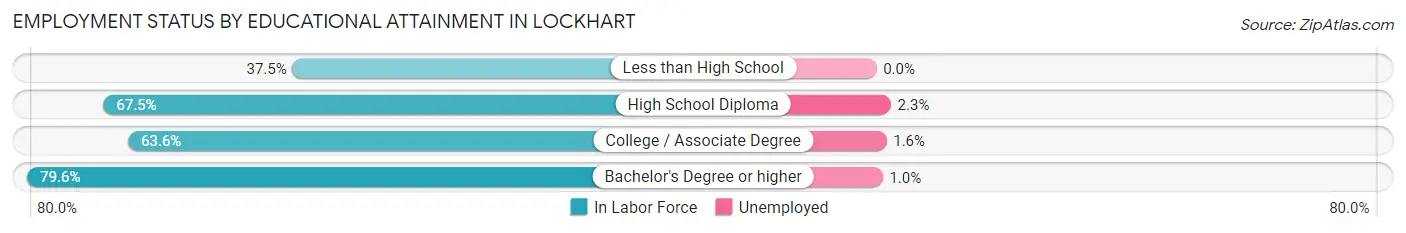
| Educational Attainment | In Labor Force | Unemployed |
| Less than High School | 419 (37.5%) | 0 (0.0%) |
| High School Diploma | 2,256 (67.5%) | 77 (2.3%) |
| College / Associate Degree | 1,292 (63.6%) | 33 (1.6%) |
| Bachelor's Degree or higher | 1,027 (79.6%) | 13 (1.0%) |
| Total | 4,996 (64.2%) | 125 (1.6%) |
Employment Occupations by Sex in Lockhart
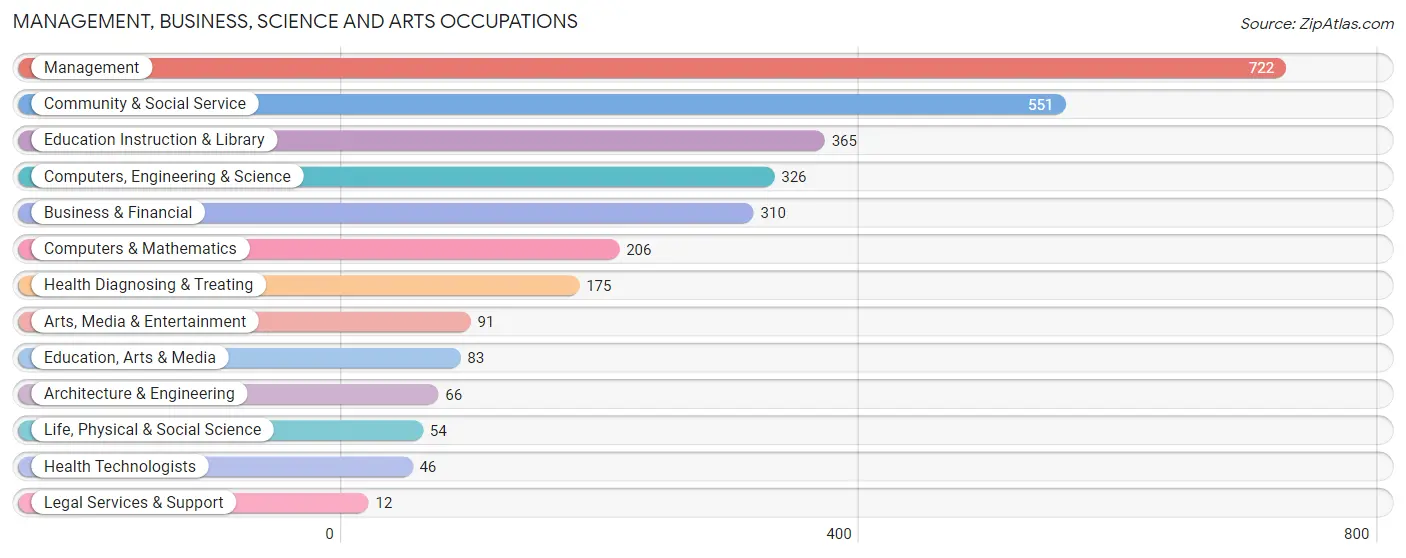
Management, Business, Science and Arts Occupations
The most common Management, Business, Science and Arts occupations in Lockhart are Management (722 | 11.2%), Community & Social Service (551 | 8.6%), Education Instruction & Library (365 | 5.7%), Computers, Engineering & Science (326 | 5.1%), and Business & Financial (310 | 4.8%).
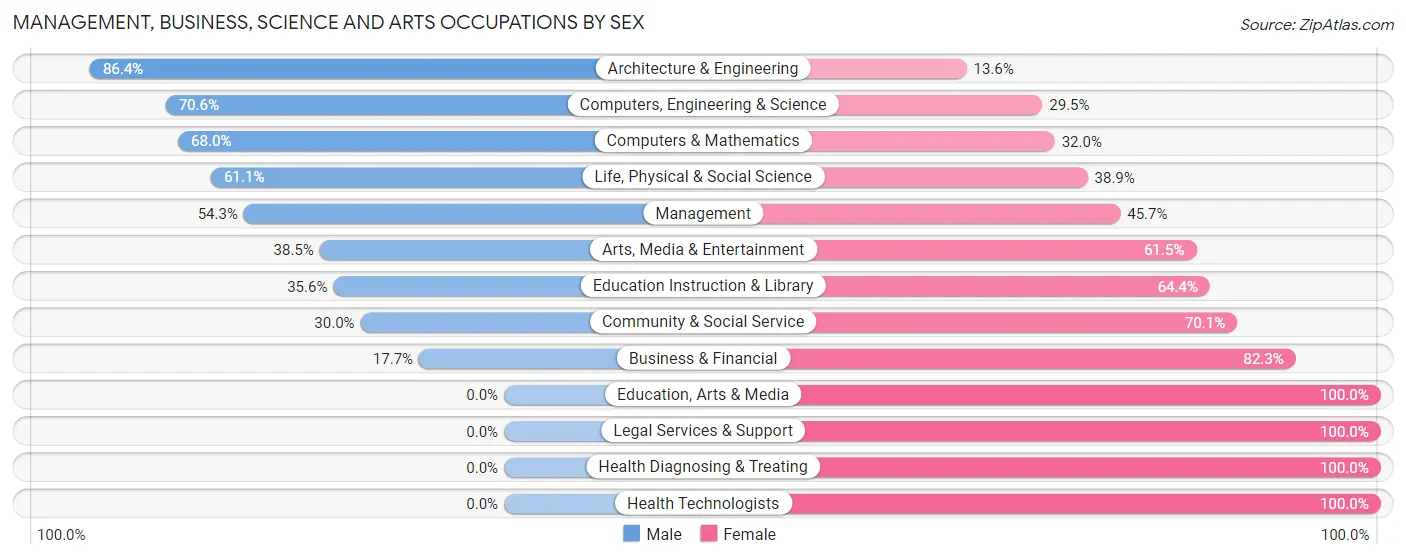
Management, Business, Science and Arts Occupations by Sex
Within the Management, Business, Science and Arts occupations in Lockhart, the most male-oriented occupations are Architecture & Engineering (86.4%), Computers, Engineering & Science (70.6%), and Computers & Mathematics (68.0%), while the most female-oriented occupations are Education, Arts & Media (100.0%), Legal Services & Support (100.0%), and Health Diagnosing & Treating (100.0%).
| Occupation | Male | Female |
| Management | 392 (54.3%) | 330 (45.7%) |
| Business & Financial | 55 (17.7%) | 255 (82.3%) |
| Computers, Engineering & Science | 230 (70.6%) | 96 (29.4%) |
| Computers & Mathematics | 140 (68.0%) | 66 (32.0%) |
| Architecture & Engineering | 57 (86.4%) | 9 (13.6%) |
| Life, Physical & Social Science | 33 (61.1%) | 21 (38.9%) |
| Community & Social Service | 165 (29.9%) | 386 (70.1%) |
| Education, Arts & Media | 0 (0.0%) | 83 (100.0%) |
| Legal Services & Support | 0 (0.0%) | 12 (100.0%) |
| Education Instruction & Library | 130 (35.6%) | 235 (64.4%) |
| Arts, Media & Entertainment | 35 (38.5%) | 56 (61.5%) |
| Health Diagnosing & Treating | 0 (0.0%) | 175 (100.0%) |
| Health Technologists | 0 (0.0%) | 46 (100.0%) |
| Total (Category) | 842 (40.4%) | 1,242 (59.6%) |
| Total (Overall) | 3,284 (51.1%) | 3,145 (48.9%) |
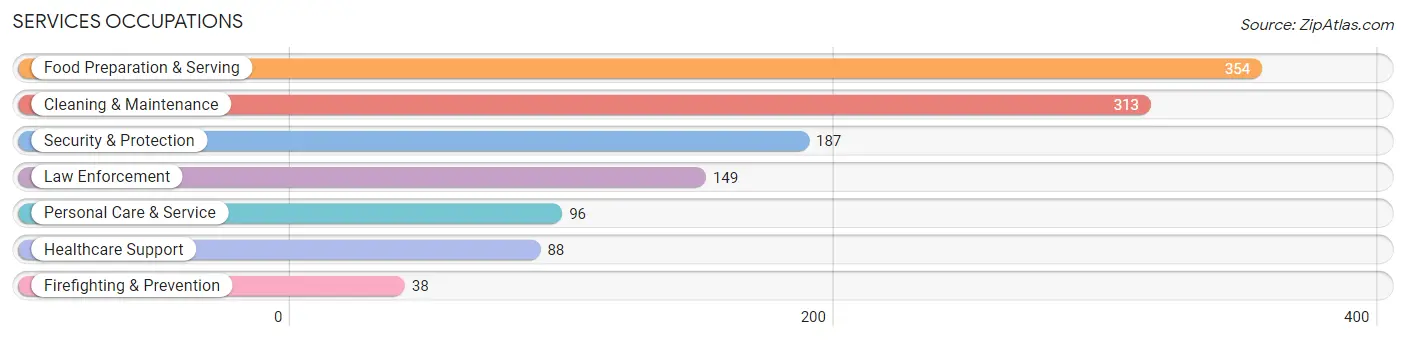
Services Occupations
The most common Services occupations in Lockhart are Food Preparation & Serving (354 | 5.5%), Cleaning & Maintenance (313 | 4.9%), Security & Protection (187 | 2.9%), Law Enforcement (149 | 2.3%), and Personal Care & Service (96 | 1.5%).
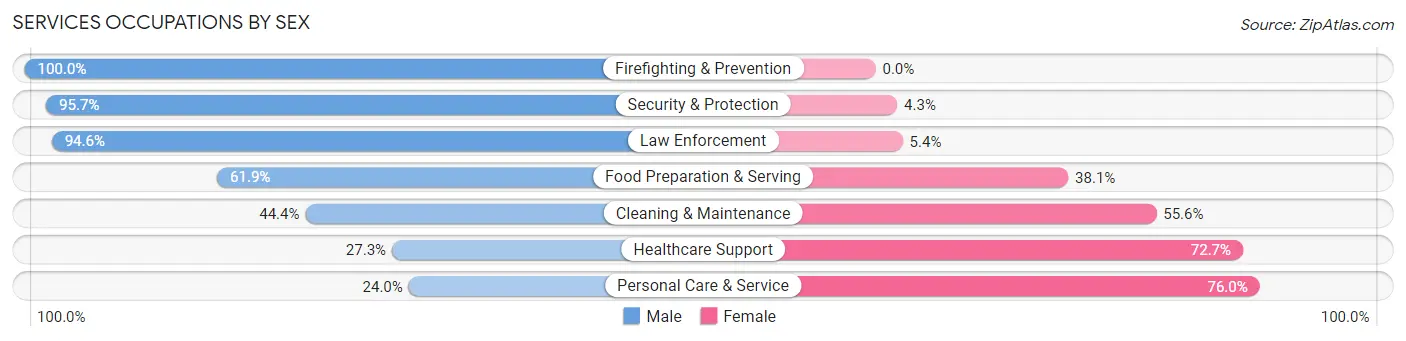
Services Occupations by Sex
Within the Services occupations in Lockhart, the most male-oriented occupations are Firefighting & Prevention (100.0%), Security & Protection (95.7%), and Law Enforcement (94.6%), while the most female-oriented occupations are Personal Care & Service (76.0%), Healthcare Support (72.7%), and Cleaning & Maintenance (55.6%).
| Occupation | Male | Female |
| Healthcare Support | 24 (27.3%) | 64 (72.7%) |
| Security & Protection | 179 (95.7%) | 8 (4.3%) |
| Firefighting & Prevention | 38 (100.0%) | 0 (0.0%) |
| Law Enforcement | 141 (94.6%) | 8 (5.4%) |
| Food Preparation & Serving | 219 (61.9%) | 135 (38.1%) |
| Cleaning & Maintenance | 139 (44.4%) | 174 (55.6%) |
| Personal Care & Service | 23 (24.0%) | 73 (76.0%) |
| Total (Category) | 584 (56.3%) | 454 (43.7%) |
| Total (Overall) | 3,284 (51.1%) | 3,145 (48.9%) |
Sales and Office Occupations
The most common Sales and Office occupations in Lockhart are Office & Administration (863 | 13.4%), and Sales & Related (815 | 12.7%).
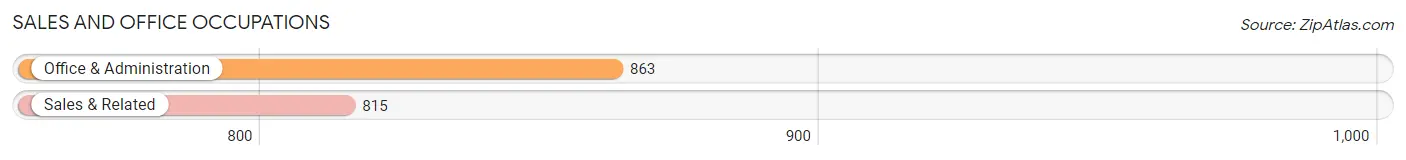
Sales and Office Occupations by Sex

| Occupation | Male | Female |
| Sales & Related | 152 (18.6%) | 663 (81.4%) |
| Office & Administration | 251 (29.1%) | 612 (70.9%) |
| Total (Category) | 403 (24.0%) | 1,275 (76.0%) |
| Total (Overall) | 3,284 (51.1%) | 3,145 (48.9%) |
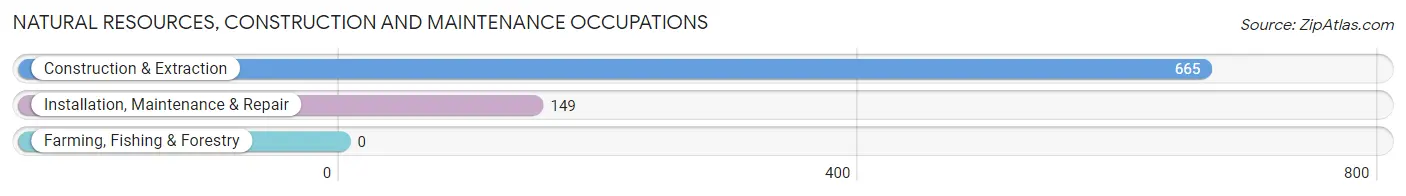
Natural Resources, Construction and Maintenance Occupations
The most common Natural Resources, Construction and Maintenance occupations in Lockhart are Construction & Extraction (665 | 10.3%), and Installation, Maintenance & Repair (149 | 2.3%).
Natural Resources, Construction and Maintenance Occupations by Sex
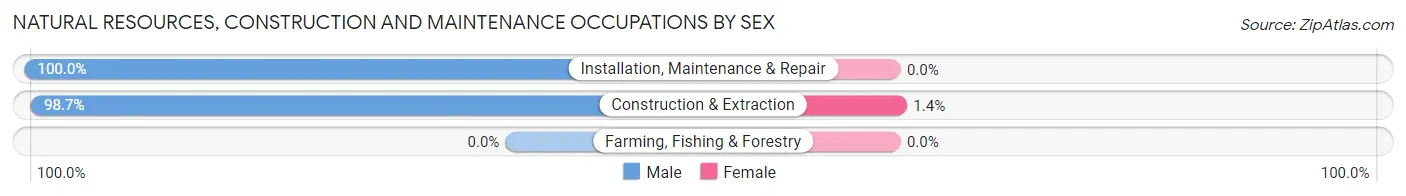
| Occupation | Male | Female |
| Farming, Fishing & Forestry | 0 (0.0%) | 0 (0.0%) |
| Construction & Extraction | 656 (98.7%) | 9 (1.3%) |
| Installation, Maintenance & Repair | 149 (100.0%) | 0 (0.0%) |
| Total (Category) | 805 (98.9%) | 9 (1.1%) |
| Total (Overall) | 3,284 (51.1%) | 3,145 (48.9%) |
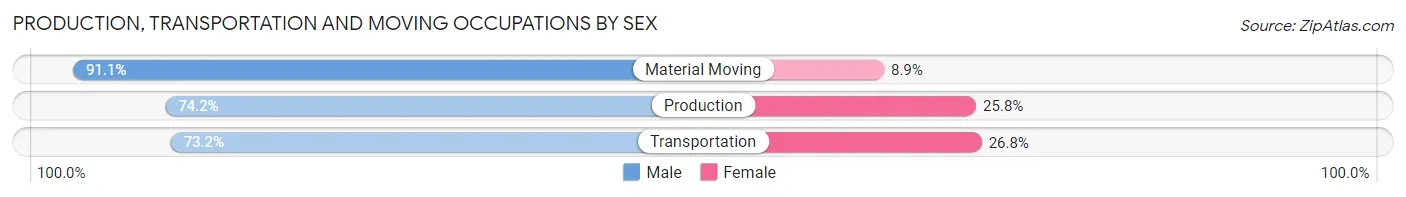
Production, Transportation and Moving Occupations
The most common Production, Transportation and Moving occupations in Lockhart are Production (314 | 4.9%), Material Moving (281 | 4.4%), and Transportation (220 | 3.4%).
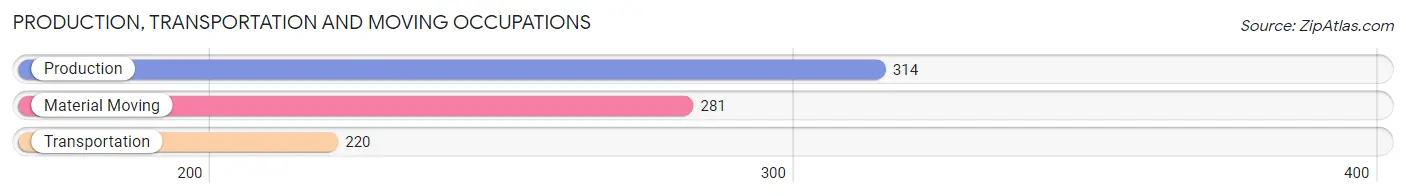
Production, Transportation and Moving Occupations by Sex
| Occupation | Male | Female |
| Production | 233 (74.2%) | 81 (25.8%) |
| Transportation | 161 (73.2%) | 59 (26.8%) |
| Material Moving | 256 (91.1%) | 25 (8.9%) |
| Total (Category) | 650 (79.7%) | 165 (20.3%) |
| Total (Overall) | 3,284 (51.1%) | 3,145 (48.9%) |
Employment Industries by Sex in Lockhart
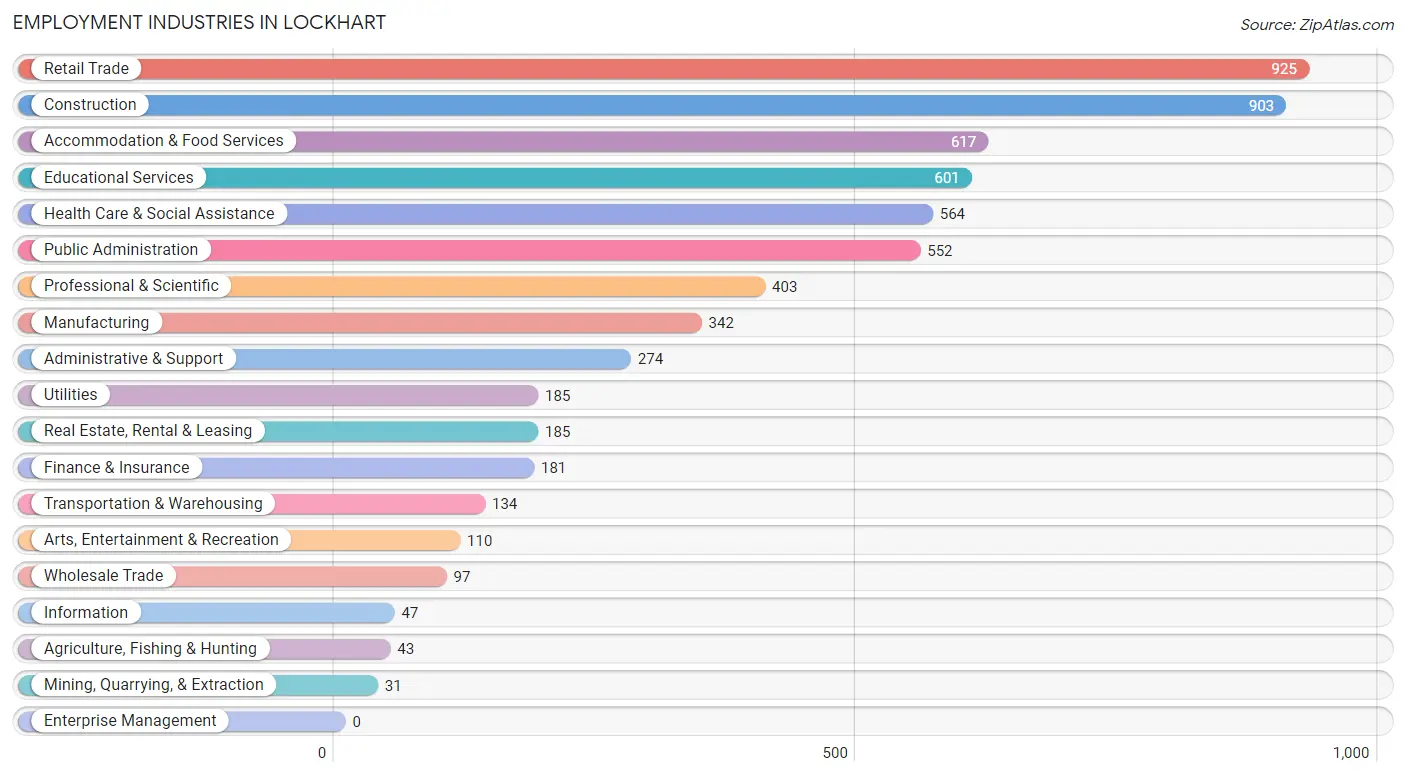
Employment Industries in Lockhart
The major employment industries in Lockhart include Retail Trade (925 | 14.4%), Construction (903 | 14.1%), Accommodation & Food Services (617 | 9.6%), Educational Services (601 | 9.3%), and Health Care & Social Assistance (564 | 8.8%).
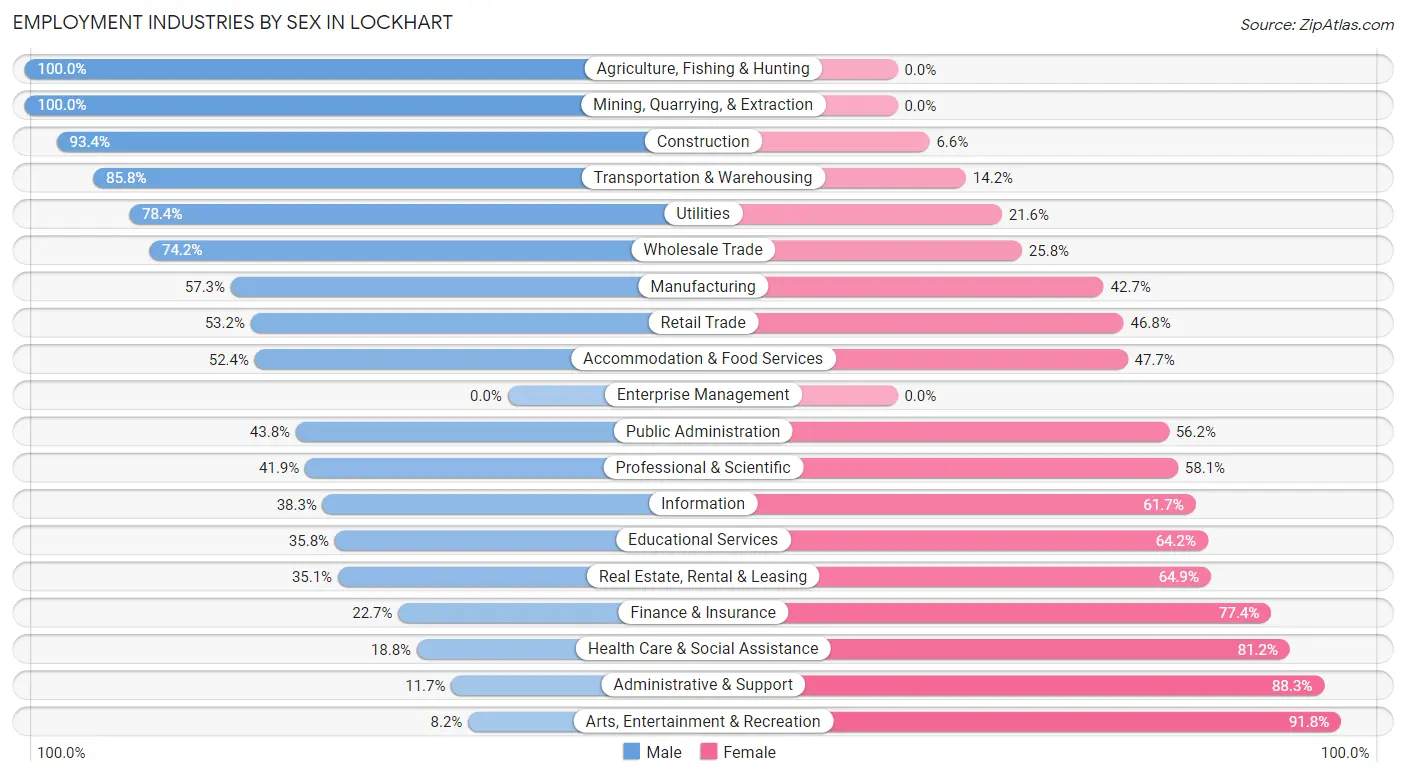
Employment Industries by Sex in Lockhart
The Lockhart industries that see more men than women are Agriculture, Fishing & Hunting (100.0%), Mining, Quarrying, & Extraction (100.0%), and Construction (93.4%), whereas the industries that tend to have a higher number of women are Arts, Entertainment & Recreation (91.8%), Administrative & Support (88.3%), and Health Care & Social Assistance (81.2%).
| Industry | Male | Female |
| Agriculture, Fishing & Hunting | 43 (100.0%) | 0 (0.0%) |
| Mining, Quarrying, & Extraction | 31 (100.0%) | 0 (0.0%) |
| Construction | 843 (93.4%) | 60 (6.6%) |
| Manufacturing | 196 (57.3%) | 146 (42.7%) |
| Wholesale Trade | 72 (74.2%) | 25 (25.8%) |
| Retail Trade | 492 (53.2%) | 433 (46.8%) |
| Transportation & Warehousing | 115 (85.8%) | 19 (14.2%) |
| Utilities | 145 (78.4%) | 40 (21.6%) |
| Information | 18 (38.3%) | 29 (61.7%) |
| Finance & Insurance | 41 (22.7%) | 140 (77.3%) |
| Real Estate, Rental & Leasing | 65 (35.1%) | 120 (64.9%) |
| Professional & Scientific | 169 (41.9%) | 234 (58.1%) |
| Enterprise Management | 0 (0.0%) | 0 (0.0%) |
| Administrative & Support | 32 (11.7%) | 242 (88.3%) |
| Educational Services | 215 (35.8%) | 386 (64.2%) |
| Health Care & Social Assistance | 106 (18.8%) | 458 (81.2%) |
| Arts, Entertainment & Recreation | 9 (8.2%) | 101 (91.8%) |
| Accommodation & Food Services | 323 (52.3%) | 294 (47.6%) |
| Public Administration | 242 (43.8%) | 310 (56.2%) |
| Total | 3,284 (51.1%) | 3,145 (48.9%) |
Education in Lockhart
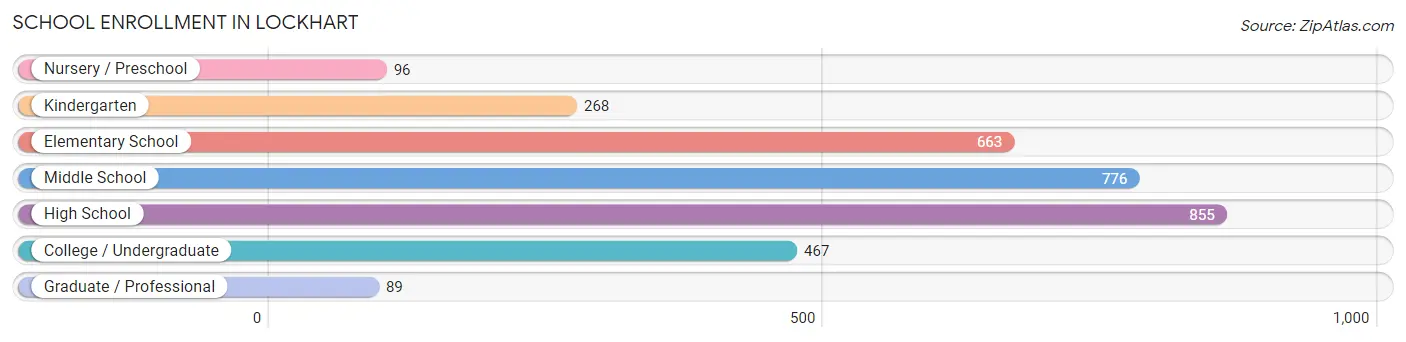
School Enrollment in Lockhart
The most common levels of schooling among the 3,214 students in Lockhart are high school (855 | 26.6%), middle school (776 | 24.1%), and elementary school (663 | 20.6%).
| School Level | # Students | % Students |
| Nursery / Preschool | 96 | 3.0% |
| Kindergarten | 268 | 8.3% |
| Elementary School | 663 | 20.6% |
| Middle School | 776 | 24.1% |
| High School | 855 | 26.6% |
| College / Undergraduate | 467 | 14.5% |
| Graduate / Professional | 89 | 2.8% |
| Total | 3,214 | 100.0% |
School Enrollment by Age by Funding Source in Lockhart
Out of a total of 3,214 students who are enrolled in schools in Lockhart, 193 (6.0%) attend a private institution, while the remaining 3,021 (94.0%) are enrolled in public schools. The age group of 25 to 34 year olds has the highest likelihood of being enrolled in private schools, with 24 (9.5% in the age bracket) enrolled. Conversely, the age group of 5 to 9 year old has the lowest likelihood of being enrolled in a private school, with 907 (96.2% in the age bracket) attending a public institution.
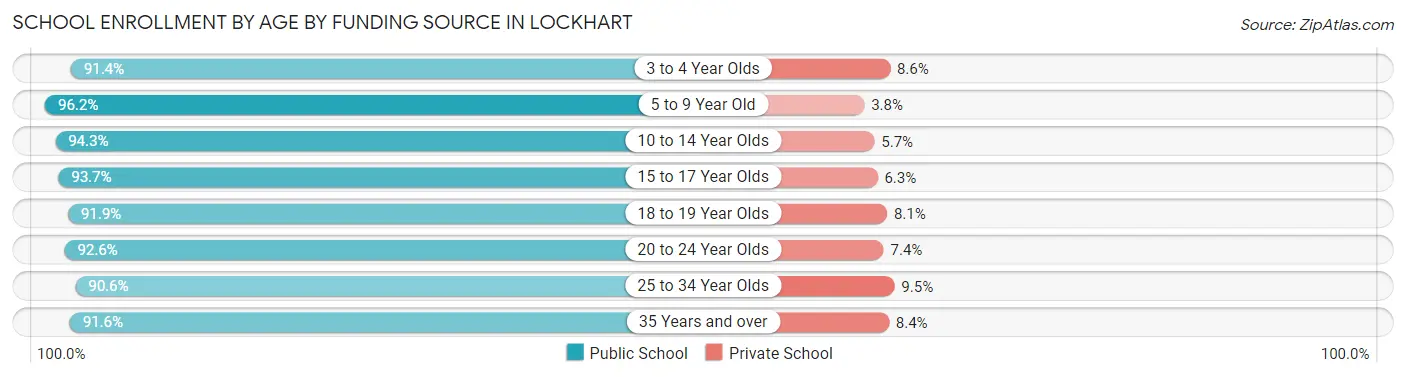
| Age Bracket | Public School | Private School |
| 3 to 4 Year Olds | 53 (91.4%) | 5 (8.6%) |
| 5 to 9 Year Old | 907 (96.2%) | 36 (3.8%) |
| 10 to 14 Year Olds | 842 (94.3%) | 51 (5.7%) |
| 15 to 17 Year Olds | 417 (93.7%) | 28 (6.3%) |
| 18 to 19 Year Olds | 148 (91.9%) | 13 (8.1%) |
| 20 to 24 Year Olds | 162 (92.6%) | 13 (7.4%) |
| 25 to 34 Year Olds | 230 (90.5%) | 24 (9.5%) |
| 35 Years and over | 261 (91.6%) | 24 (8.4%) |
| Total | 3,021 (94.0%) | 193 (6.0%) |
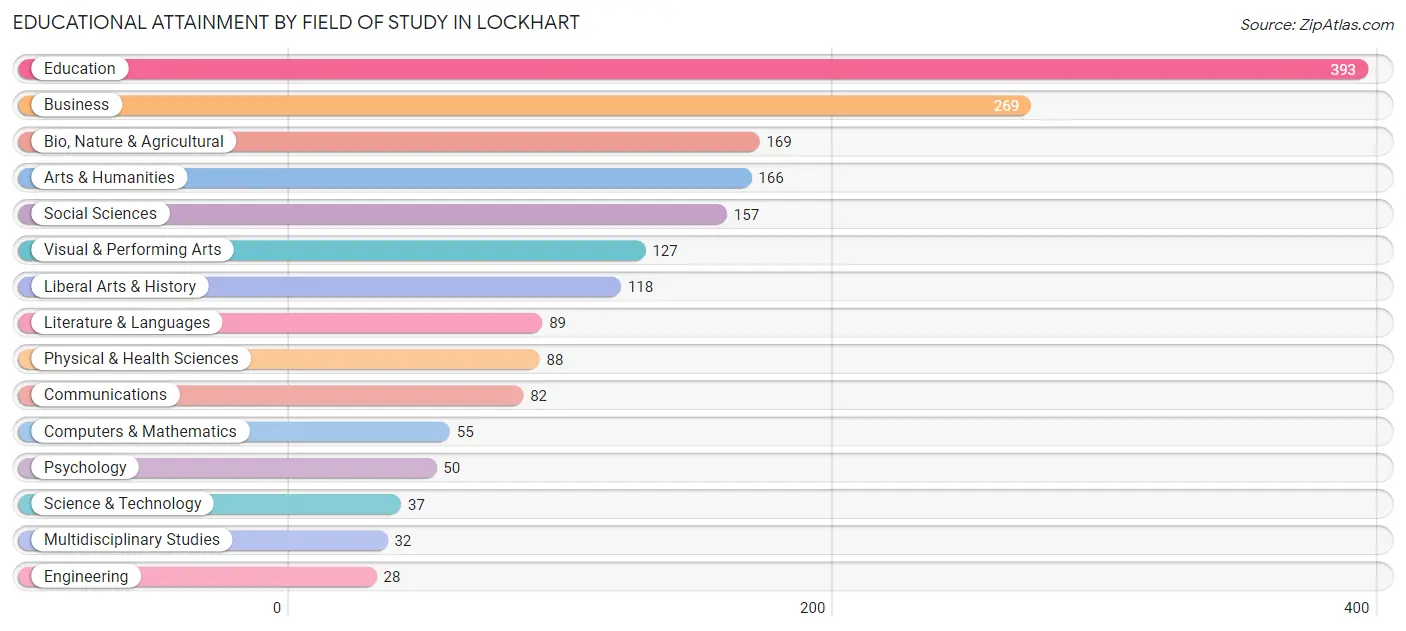
Educational Attainment by Field of Study in Lockhart
Education (393 | 21.1%), business (269 | 14.5%), bio, nature & agricultural (169 | 9.1%), arts & humanities (166 | 8.9%), and social sciences (157 | 8.4%) are the most common fields of study among 1,860 individuals in Lockhart who have obtained a bachelor's degree or higher.
| Field of Study | # Graduates | % Graduates |
| Computers & Mathematics | 55 | 3.0% |
| Bio, Nature & Agricultural | 169 | 9.1% |
| Physical & Health Sciences | 88 | 4.7% |
| Psychology | 50 | 2.7% |
| Social Sciences | 157 | 8.4% |
| Engineering | 28 | 1.5% |
| Multidisciplinary Studies | 32 | 1.7% |
| Science & Technology | 37 | 2.0% |
| Business | 269 | 14.5% |
| Education | 393 | 21.1% |
| Literature & Languages | 89 | 4.8% |
| Liberal Arts & History | 118 | 6.3% |
| Visual & Performing Arts | 127 | 6.8% |
| Communications | 82 | 4.4% |
| Arts & Humanities | 166 | 8.9% |
| Total | 1,860 | 100.0% |
Transportation & Commute in Lockhart
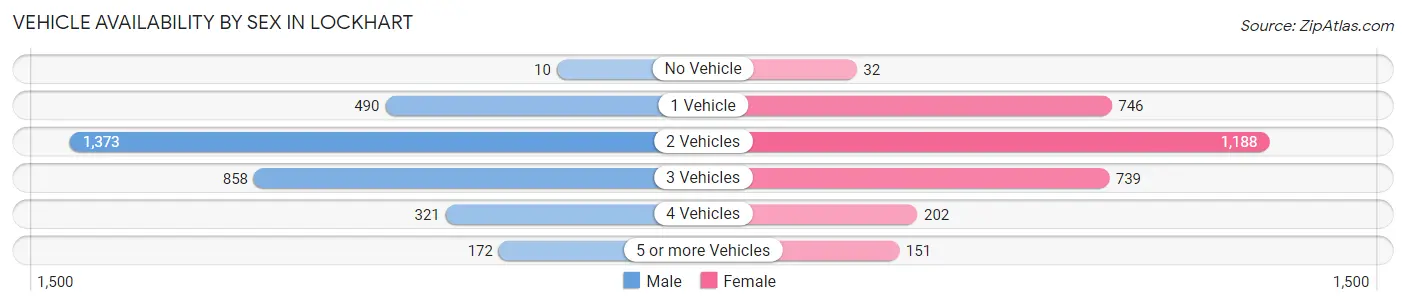
Vehicle Availability by Sex in Lockhart
The most prevalent vehicle ownership categories in Lockhart are males with 2 vehicles (1,373, accounting for 42.6%) and females with 2 vehicles (1,188, making up 44.9%).
| Vehicles Available | Male | Female |
| No Vehicle | 10 (0.3%) | 32 (1.1%) |
| 1 Vehicle | 490 (15.2%) | 746 (24.4%) |
| 2 Vehicles | 1,373 (42.6%) | 1,188 (38.9%) |
| 3 Vehicles | 858 (26.6%) | 739 (24.2%) |
| 4 Vehicles | 321 (10.0%) | 202 (6.6%) |
| 5 or more Vehicles | 172 (5.3%) | 151 (4.9%) |
| Total | 3,224 (100.0%) | 3,058 (100.0%) |
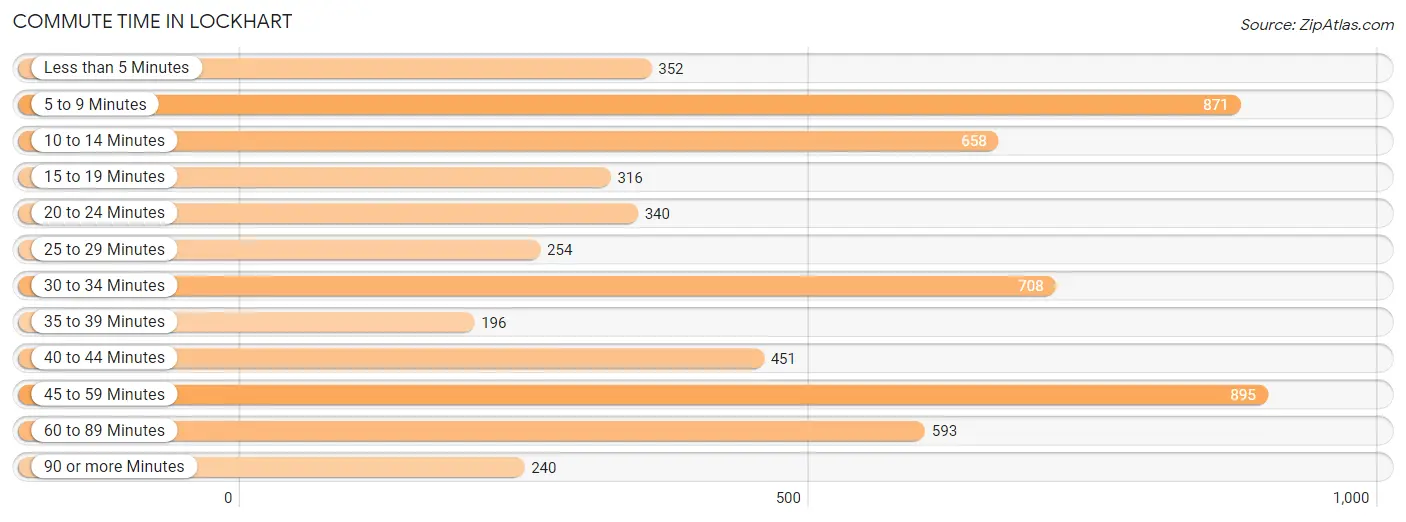
Commute Time in Lockhart
The most frequently occuring commute durations in Lockhart are 45 to 59 minutes (895 commuters, 15.2%), 5 to 9 minutes (871 commuters, 14.8%), and 30 to 34 minutes (708 commuters, 12.0%).
| Commute Time | # Commuters | % Commuters |
| Less than 5 Minutes | 352 | 6.0% |
| 5 to 9 Minutes | 871 | 14.8% |
| 10 to 14 Minutes | 658 | 11.2% |
| 15 to 19 Minutes | 316 | 5.4% |
| 20 to 24 Minutes | 340 | 5.8% |
| 25 to 29 Minutes | 254 | 4.3% |
| 30 to 34 Minutes | 708 | 12.0% |
| 35 to 39 Minutes | 196 | 3.3% |
| 40 to 44 Minutes | 451 | 7.7% |
| 45 to 59 Minutes | 895 | 15.2% |
| 60 to 89 Minutes | 593 | 10.1% |
| 90 or more Minutes | 240 | 4.1% |
Commute Time by Sex in Lockhart
The most common commute times in Lockhart are 45 to 59 minutes (445 commuters, 14.5%) for males and 5 to 9 minutes (456 commuters, 16.2%) for females.
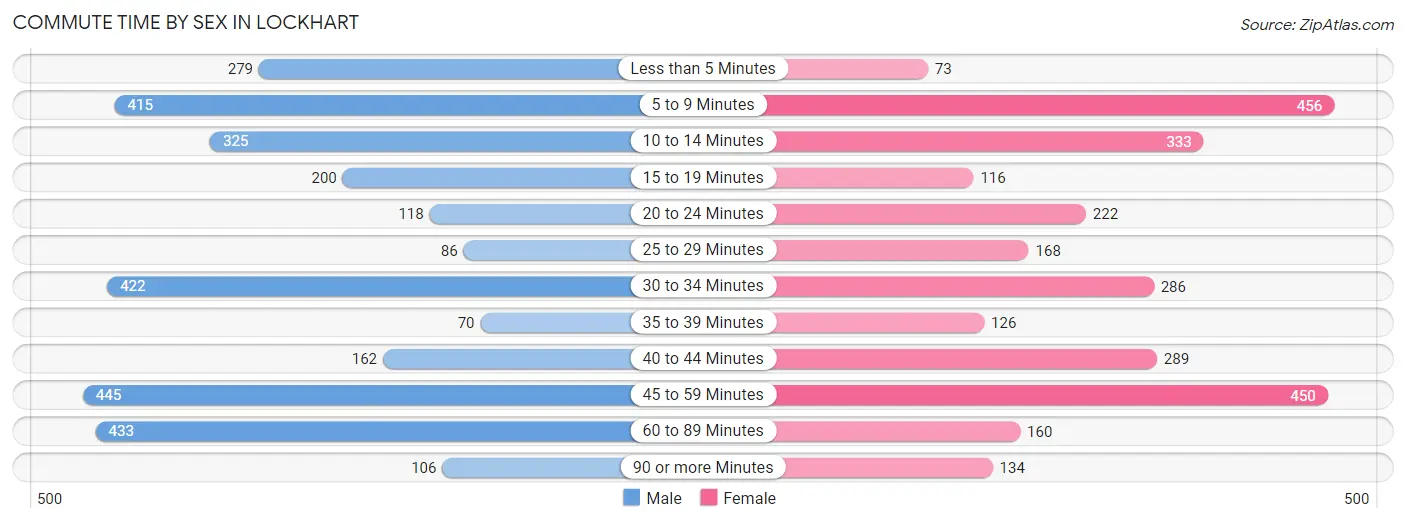
| Commute Time | Male | Female |
| Less than 5 Minutes | 279 (9.1%) | 73 (2.6%) |
| 5 to 9 Minutes | 415 (13.6%) | 456 (16.2%) |
| 10 to 14 Minutes | 325 (10.6%) | 333 (11.8%) |
| 15 to 19 Minutes | 200 (6.5%) | 116 (4.1%) |
| 20 to 24 Minutes | 118 (3.8%) | 222 (7.9%) |
| 25 to 29 Minutes | 86 (2.8%) | 168 (6.0%) |
| 30 to 34 Minutes | 422 (13.8%) | 286 (10.2%) |
| 35 to 39 Minutes | 70 (2.3%) | 126 (4.5%) |
| 40 to 44 Minutes | 162 (5.3%) | 289 (10.3%) |
| 45 to 59 Minutes | 445 (14.5%) | 450 (16.0%) |
| 60 to 89 Minutes | 433 (14.1%) | 160 (5.7%) |
| 90 or more Minutes | 106 (3.5%) | 134 (4.8%) |
Time of Departure to Work by Sex in Lockhart
The most frequent times of departure to work in Lockhart are 6:30 AM to 6:59 AM (496, 16.2%) for males and 6:30 AM to 6:59 AM (424, 15.1%) for females.
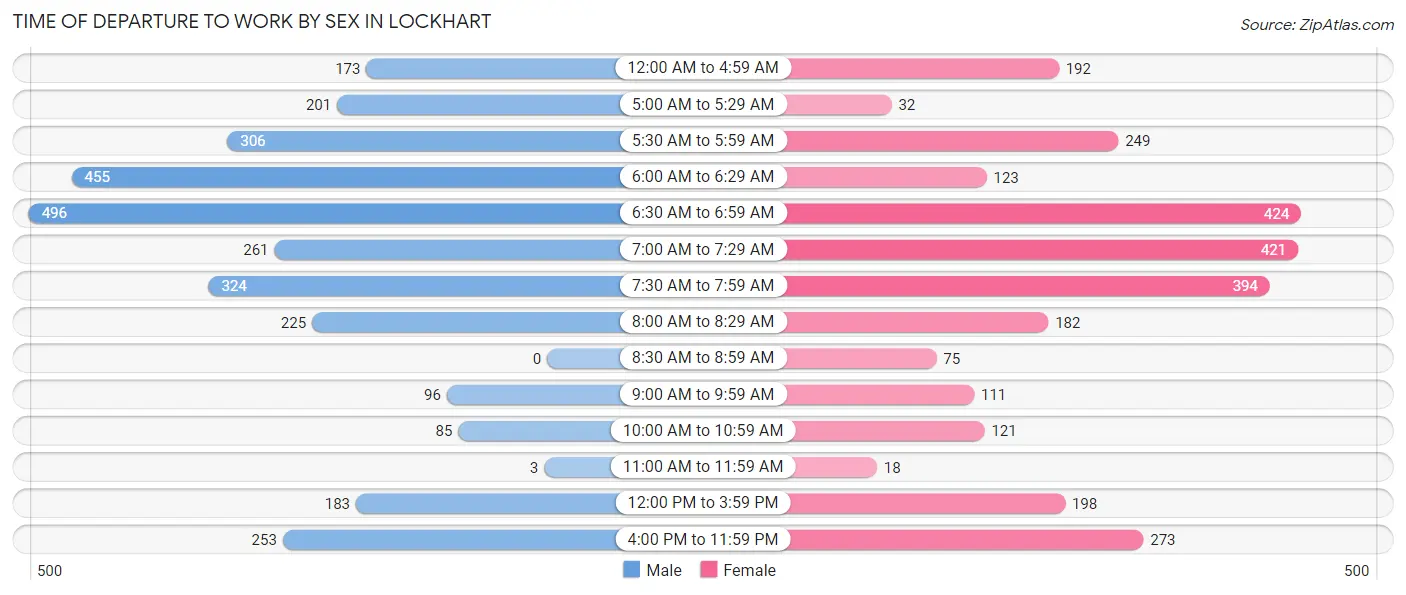
| Time of Departure | Male | Female |
| 12:00 AM to 4:59 AM | 173 (5.7%) | 192 (6.8%) |
| 5:00 AM to 5:29 AM | 201 (6.6%) | 32 (1.1%) |
| 5:30 AM to 5:59 AM | 306 (10.0%) | 249 (8.8%) |
| 6:00 AM to 6:29 AM | 455 (14.9%) | 123 (4.4%) |
| 6:30 AM to 6:59 AM | 496 (16.2%) | 424 (15.1%) |
| 7:00 AM to 7:29 AM | 261 (8.5%) | 421 (15.0%) |
| 7:30 AM to 7:59 AM | 324 (10.6%) | 394 (14.0%) |
| 8:00 AM to 8:29 AM | 225 (7.3%) | 182 (6.5%) |
| 8:30 AM to 8:59 AM | 0 (0.0%) | 75 (2.7%) |
| 9:00 AM to 9:59 AM | 96 (3.1%) | 111 (4.0%) |
| 10:00 AM to 10:59 AM | 85 (2.8%) | 121 (4.3%) |
| 11:00 AM to 11:59 AM | 3 (0.1%) | 18 (0.6%) |
| 12:00 PM to 3:59 PM | 183 (6.0%) | 198 (7.0%) |
| 4:00 PM to 11:59 PM | 253 (8.3%) | 273 (9.7%) |
| Total | 3,061 (100.0%) | 2,813 (100.0%) |
Housing Occupancy in Lockhart
Occupancy by Ownership in Lockhart
Of the total 4,707 dwellings in Lockhart, owner-occupied units account for 2,901 (61.6%), while renter-occupied units make up 1,806 (38.4%).
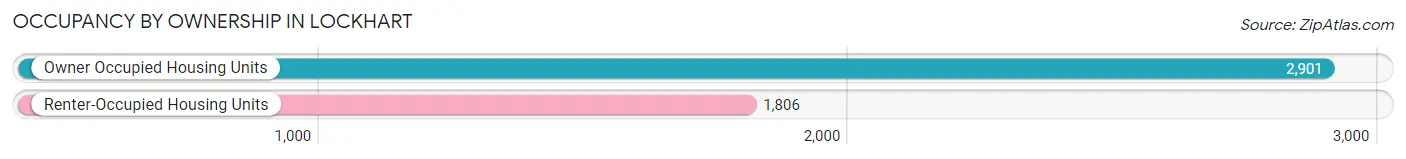
| Occupancy | # Housing Units | % Housing Units |
| Owner Occupied Housing Units | 2,901 | 61.6% |
| Renter-Occupied Housing Units | 1,806 | 38.4% |
| Total Occupied Housing Units | 4,707 | 100.0% |
Occupancy by Household Size in Lockhart
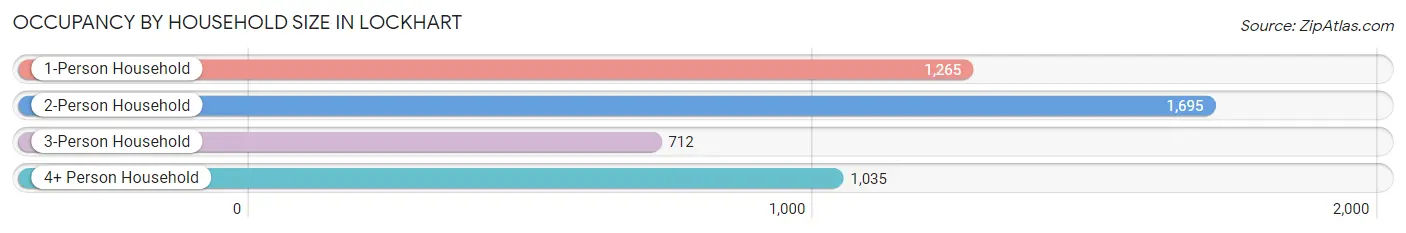
| Household Size | # Housing Units | % Housing Units |
| 1-Person Household | 1,265 | 26.9% |
| 2-Person Household | 1,695 | 36.0% |
| 3-Person Household | 712 | 15.1% |
| 4+ Person Household | 1,035 | 22.0% |
| Total Housing Units | 4,707 | 100.0% |
Occupancy by Ownership by Household Size in Lockhart
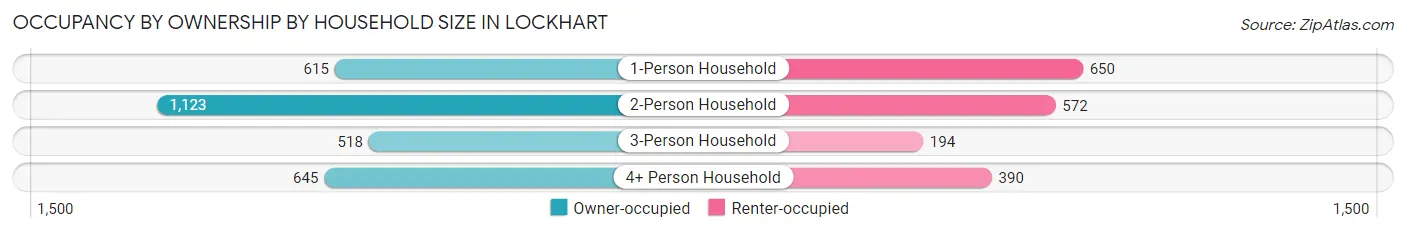
| Household Size | Owner-occupied | Renter-occupied |
| 1-Person Household | 615 (48.6%) | 650 (51.4%) |
| 2-Person Household | 1,123 (66.2%) | 572 (33.8%) |
| 3-Person Household | 518 (72.8%) | 194 (27.3%) |
| 4+ Person Household | 645 (62.3%) | 390 (37.7%) |
| Total Housing Units | 2,901 (61.6%) | 1,806 (38.4%) |
Occupancy by Educational Attainment in Lockhart
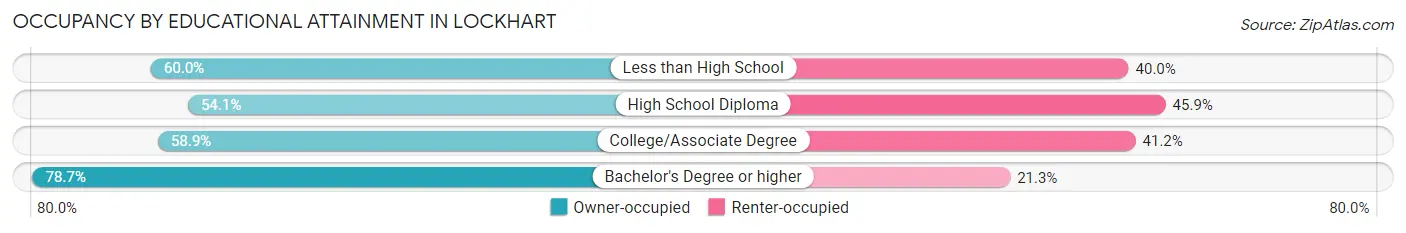
| Household Size | Owner-occupied | Renter-occupied |
| Less than High School | 304 (60.0%) | 203 (40.0%) |
| High School Diploma | 934 (54.1%) | 793 (45.9%) |
| College/Associate Degree | 841 (58.9%) | 588 (41.1%) |
| Bachelor's Degree or higher | 822 (78.7%) | 222 (21.3%) |
Occupancy by Age of Householder in Lockhart
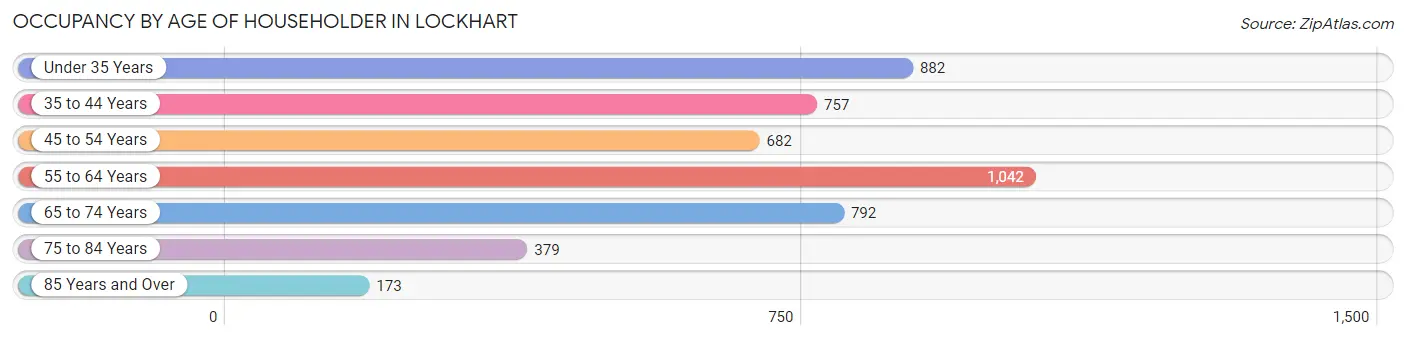
| Age Bracket | # Households | % Households |
| Under 35 Years | 882 | 18.7% |
| 35 to 44 Years | 757 | 16.1% |
| 45 to 54 Years | 682 | 14.5% |
| 55 to 64 Years | 1,042 | 22.1% |
| 65 to 74 Years | 792 | 16.8% |
| 75 to 84 Years | 379 | 8.1% |
| 85 Years and Over | 173 | 3.7% |
| Total | 4,707 | 100.0% |
Housing Finances in Lockhart
Median Income by Occupancy in Lockhart
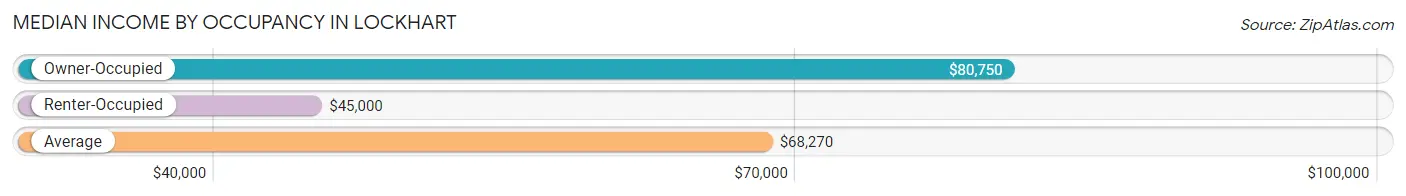
| Occupancy Type | # Households | Median Income |
| Owner-Occupied | 2,901 (61.6%) | $80,750 |
| Renter-Occupied | 1,806 (38.4%) | $45,000 |
| Average | 4,707 (100.0%) | $68,270 |
Occupancy by Householder Income Bracket in Lockhart
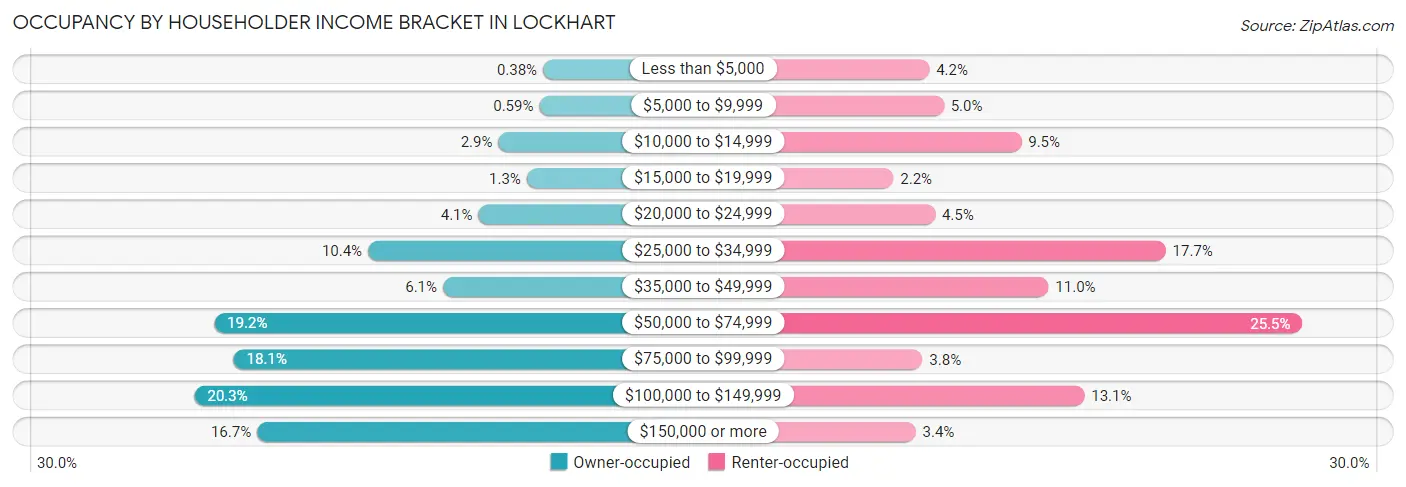
| Income Bracket | Owner-occupied | Renter-occupied |
| Less than $5,000 | 11 (0.4%) | 76 (4.2%) |
| $5,000 to $9,999 | 17 (0.6%) | 91 (5.0%) |
| $10,000 to $14,999 | 85 (2.9%) | 171 (9.5%) |
| $15,000 to $19,999 | 38 (1.3%) | 39 (2.2%) |
| $20,000 to $24,999 | 118 (4.1%) | 82 (4.5%) |
| $25,000 to $34,999 | 301 (10.4%) | 320 (17.7%) |
| $35,000 to $49,999 | 177 (6.1%) | 199 (11.0%) |
| $50,000 to $74,999 | 556 (19.2%) | 461 (25.5%) |
| $75,000 to $99,999 | 524 (18.1%) | 69 (3.8%) |
| $100,000 to $149,999 | 589 (20.3%) | 236 (13.1%) |
| $150,000 or more | 485 (16.7%) | 62 (3.4%) |
| Total | 2,901 (100.0%) | 1,806 (100.0%) |
Monthly Housing Cost Tiers in Lockhart
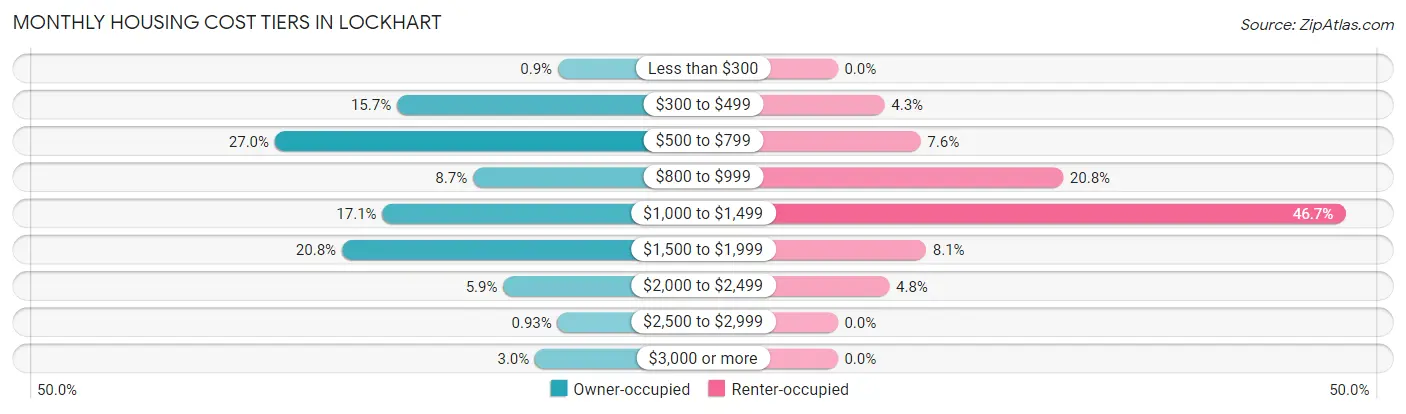
| Monthly Cost | Owner-occupied | Renter-occupied |
| Less than $300 | 26 (0.9%) | 0 (0.0%) |
| $300 to $499 | 456 (15.7%) | 78 (4.3%) |
| $500 to $799 | 782 (27.0%) | 138 (7.6%) |
| $800 to $999 | 253 (8.7%) | 375 (20.8%) |
| $1,000 to $1,499 | 495 (17.1%) | 844 (46.7%) |
| $1,500 to $1,999 | 603 (20.8%) | 147 (8.1%) |
| $2,000 to $2,499 | 172 (5.9%) | 86 (4.8%) |
| $2,500 to $2,999 | 27 (0.9%) | 0 (0.0%) |
| $3,000 or more | 87 (3.0%) | 0 (0.0%) |
| Total | 2,901 (100.0%) | 1,806 (100.0%) |
Physical Housing Characteristics in Lockhart
Housing Structures in Lockhart
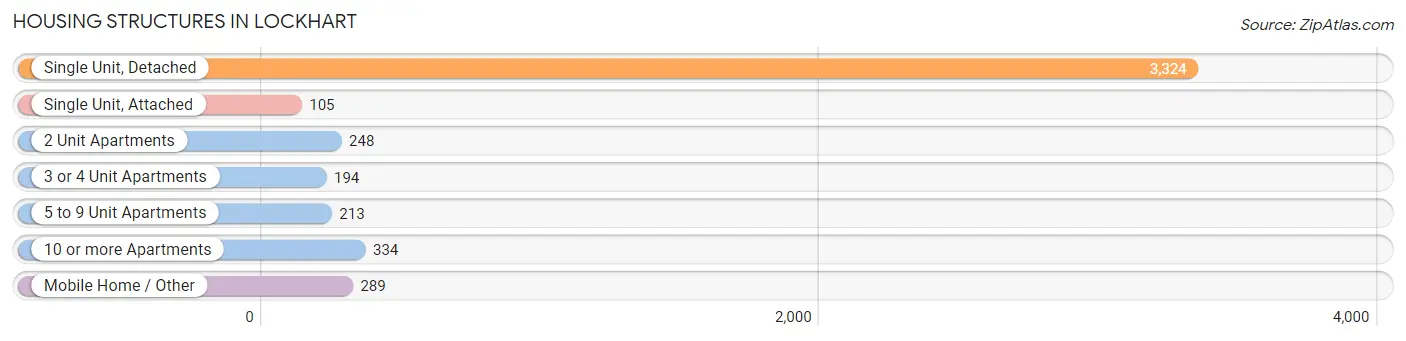
| Structure Type | # Housing Units | % Housing Units |
| Single Unit, Detached | 3,324 | 70.6% |
| Single Unit, Attached | 105 | 2.2% |
| 2 Unit Apartments | 248 | 5.3% |
| 3 or 4 Unit Apartments | 194 | 4.1% |
| 5 to 9 Unit Apartments | 213 | 4.5% |
| 10 or more Apartments | 334 | 7.1% |
| Mobile Home / Other | 289 | 6.1% |
| Total | 4,707 | 100.0% |
Housing Structures by Occupancy in Lockhart
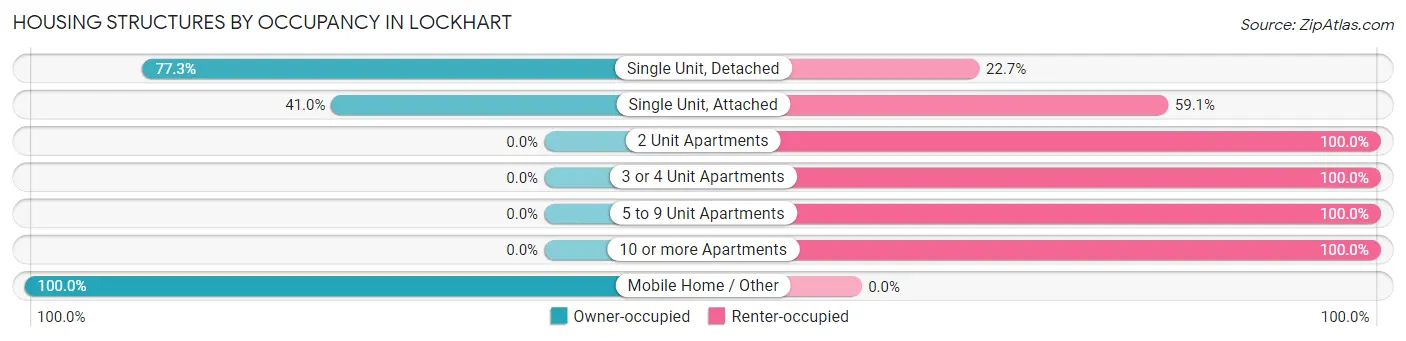
| Structure Type | Owner-occupied | Renter-occupied |
| Single Unit, Detached | 2,569 (77.3%) | 755 (22.7%) |
| Single Unit, Attached | 43 (40.9%) | 62 (59.1%) |
| 2 Unit Apartments | 0 (0.0%) | 248 (100.0%) |
| 3 or 4 Unit Apartments | 0 (0.0%) | 194 (100.0%) |
| 5 to 9 Unit Apartments | 0 (0.0%) | 213 (100.0%) |
| 10 or more Apartments | 0 (0.0%) | 334 (100.0%) |
| Mobile Home / Other | 289 (100.0%) | 0 (0.0%) |
| Total | 2,901 (61.6%) | 1,806 (38.4%) |
Housing Structures by Number of Rooms in Lockhart
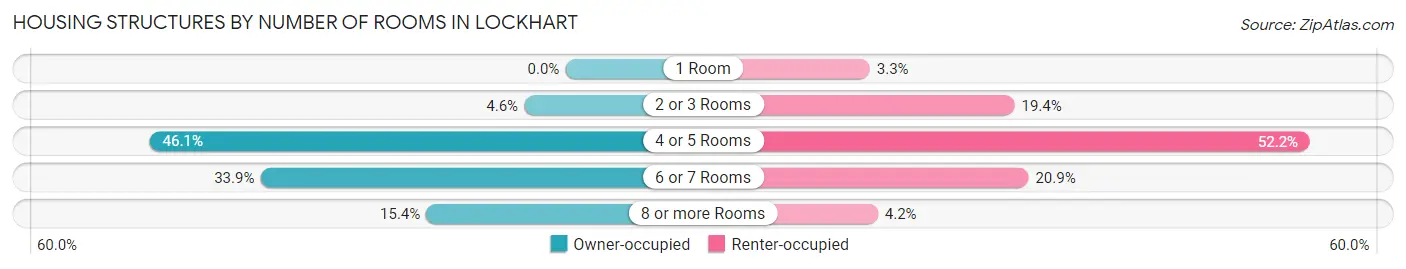
| Number of Rooms | Owner-occupied | Renter-occupied |
| 1 Room | 0 (0.0%) | 60 (3.3%) |
| 2 or 3 Rooms | 133 (4.6%) | 350 (19.4%) |
| 4 or 5 Rooms | 1,338 (46.1%) | 942 (52.2%) |
| 6 or 7 Rooms | 982 (33.9%) | 378 (20.9%) |
| 8 or more Rooms | 448 (15.4%) | 76 (4.2%) |
| Total | 2,901 (100.0%) | 1,806 (100.0%) |
Housing Structure by Heating Type in Lockhart
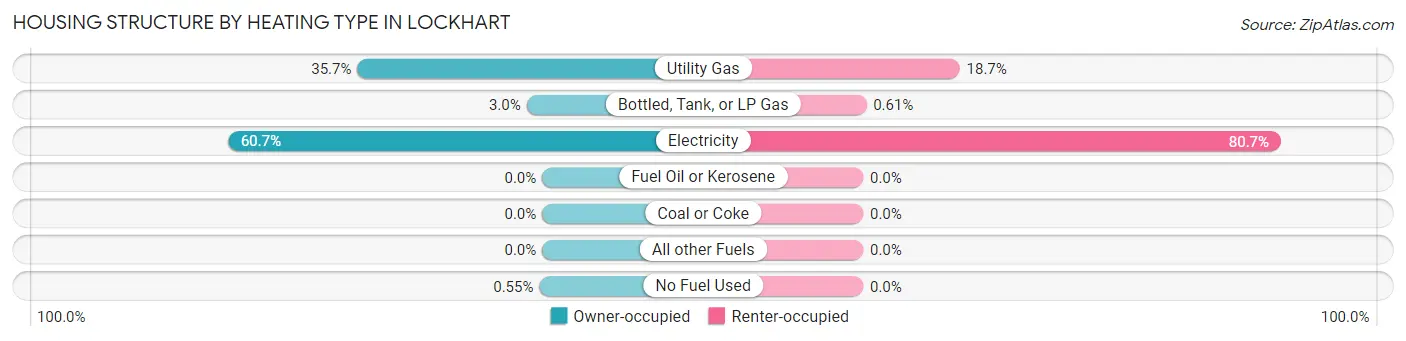
| Heating Type | Owner-occupied | Renter-occupied |
| Utility Gas | 1,036 (35.7%) | 337 (18.7%) |
| Bottled, Tank, or LP Gas | 87 (3.0%) | 11 (0.6%) |
| Electricity | 1,762 (60.7%) | 1,458 (80.7%) |
| Fuel Oil or Kerosene | 0 (0.0%) | 0 (0.0%) |
| Coal or Coke | 0 (0.0%) | 0 (0.0%) |
| All other Fuels | 0 (0.0%) | 0 (0.0%) |
| No Fuel Used | 16 (0.5%) | 0 (0.0%) |
| Total | 2,901 (100.0%) | 1,806 (100.0%) |
Household Vehicle Usage in Lockhart
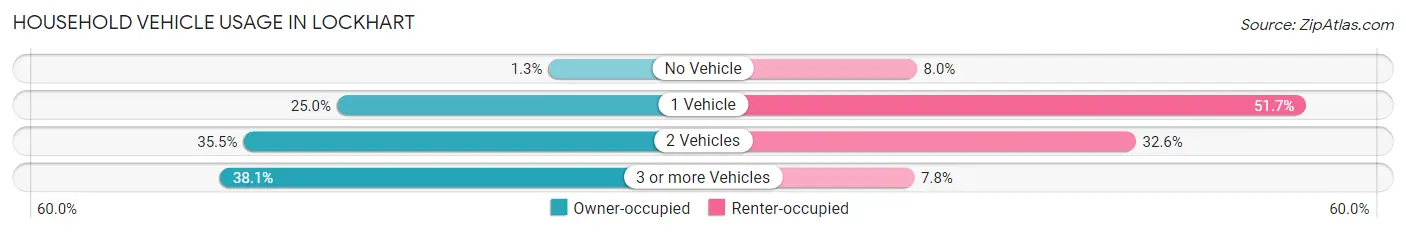
| Vehicles per Household | Owner-occupied | Renter-occupied |
| No Vehicle | 39 (1.3%) | 145 (8.0%) |
| 1 Vehicle | 726 (25.0%) | 933 (51.7%) |
| 2 Vehicles | 1,030 (35.5%) | 588 (32.6%) |
| 3 or more Vehicles | 1,106 (38.1%) | 140 (7.7%) |
| Total | 2,901 (100.0%) | 1,806 (100.0%) |
Real Estate & Mortgages in Lockhart
Real Estate and Mortgage Overview in Lockhart
| Characteristic | Without Mortgage | With Mortgage |
| Housing Units | 1,470 | 1,431 |
| Median Property Value | $128,000 | $222,800 |
| Median Household Income | $69,107 | $308 |
| Monthly Housing Costs | $591 | $87 |
| Real Estate Taxes | $2,472 | $40 |
Property Value by Mortgage Status in Lockhart
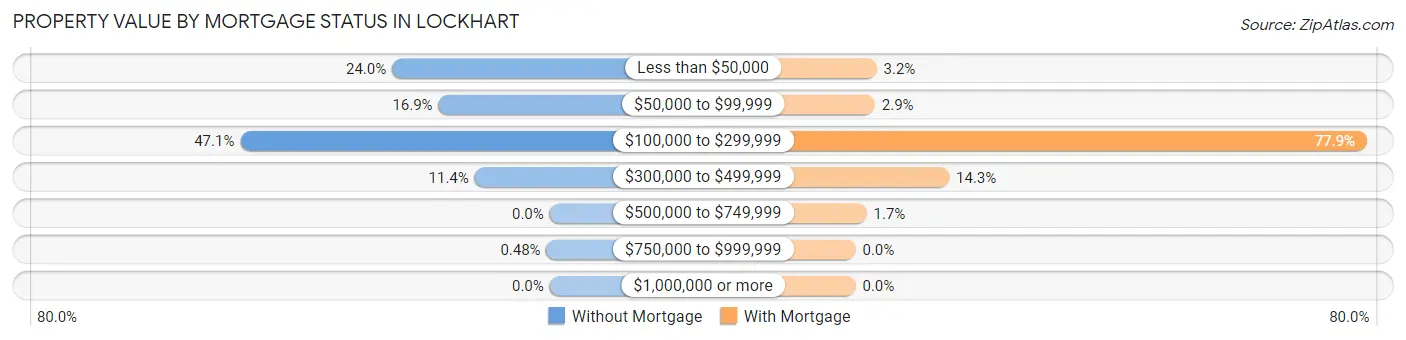
| Property Value | Without Mortgage | With Mortgage |
| Less than $50,000 | 353 (24.0%) | 46 (3.2%) |
| $50,000 to $99,999 | 249 (16.9%) | 42 (2.9%) |
| $100,000 to $299,999 | 693 (47.1%) | 1,115 (77.9%) |
| $300,000 to $499,999 | 168 (11.4%) | 204 (14.3%) |
| $500,000 to $749,999 | 0 (0.0%) | 24 (1.7%) |
| $750,000 to $999,999 | 7 (0.5%) | 0 (0.0%) |
| $1,000,000 or more | 0 (0.0%) | 0 (0.0%) |
| Total | 1,470 (100.0%) | 1,431 (100.0%) |
Household Income by Mortgage Status in Lockhart
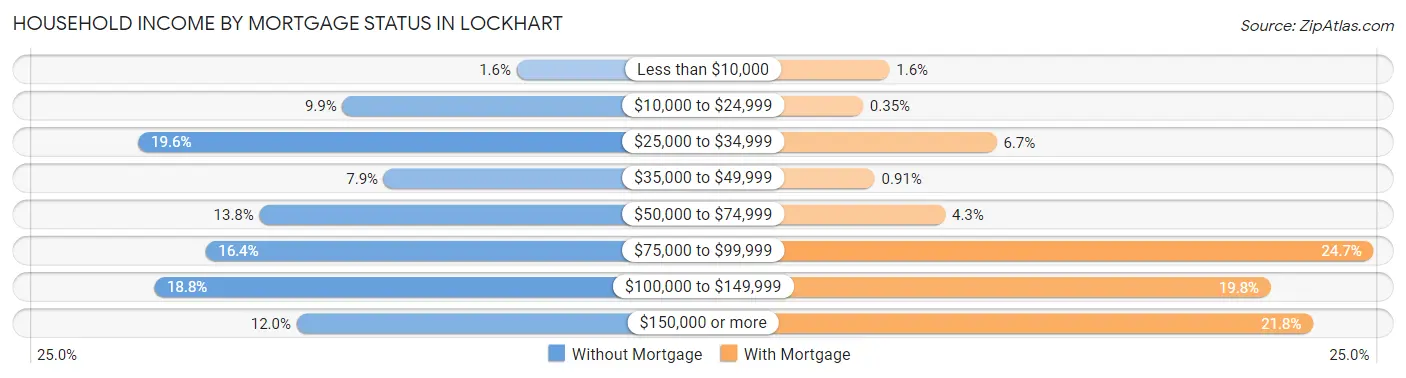
| Household Income | Without Mortgage | With Mortgage |
| Less than $10,000 | 23 (1.6%) | 23 (1.6%) |
| $10,000 to $24,999 | 145 (9.9%) | 5 (0.4%) |
| $25,000 to $34,999 | 288 (19.6%) | 96 (6.7%) |
| $35,000 to $49,999 | 116 (7.9%) | 13 (0.9%) |
| $50,000 to $74,999 | 203 (13.8%) | 61 (4.3%) |
| $75,000 to $99,999 | 241 (16.4%) | 353 (24.7%) |
| $100,000 to $149,999 | 277 (18.8%) | 283 (19.8%) |
| $150,000 or more | 177 (12.0%) | 312 (21.8%) |
| Total | 1,470 (100.0%) | 1,431 (100.0%) |
Property Value to Household Income Ratio in Lockhart
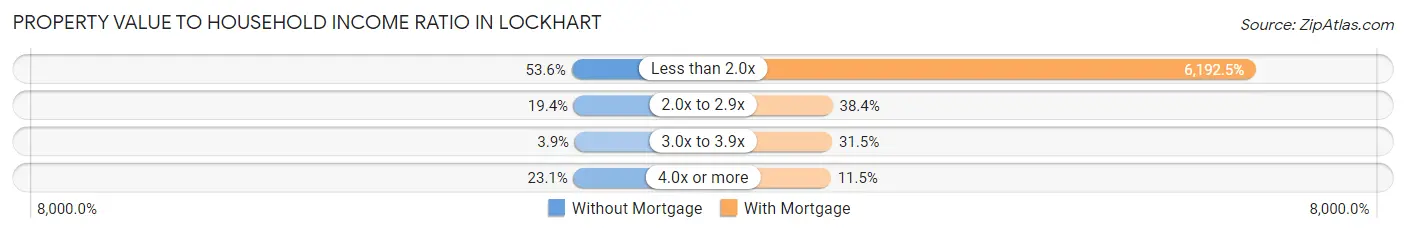
| Value-to-Income Ratio | Without Mortgage | With Mortgage |
| Less than 2.0x | 788 (53.6%) | 88,614 (6,192.5%) |
| 2.0x to 2.9x | 285 (19.4%) | 550 (38.4%) |
| 3.0x to 3.9x | 57 (3.9%) | 450 (31.5%) |
| 4.0x or more | 340 (23.1%) | 164 (11.5%) |
| Total | 1,470 (100.0%) | 1,431 (100.0%) |
Real Estate Taxes by Mortgage Status in Lockhart
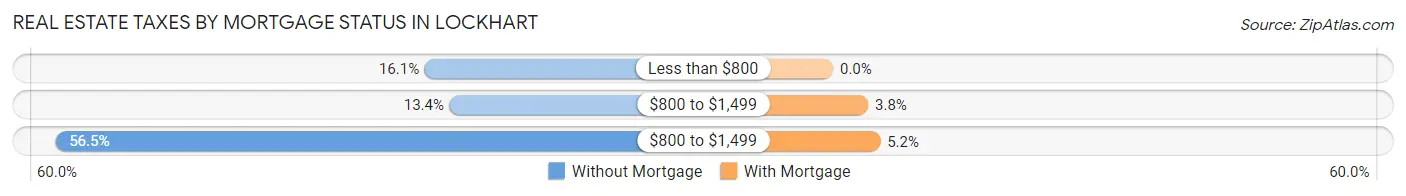
| Property Taxes | Without Mortgage | With Mortgage |
| Less than $800 | 237 (16.1%) | 0 (0.0%) |
| $800 to $1,499 | 197 (13.4%) | 55 (3.8%) |
| $800 to $1,499 | 831 (56.5%) | 74 (5.2%) |
| Total | 1,470 (100.0%) | 1,431 (100.0%) |
Health & Disability in Lockhart
Health Insurance Coverage by Age in Lockhart
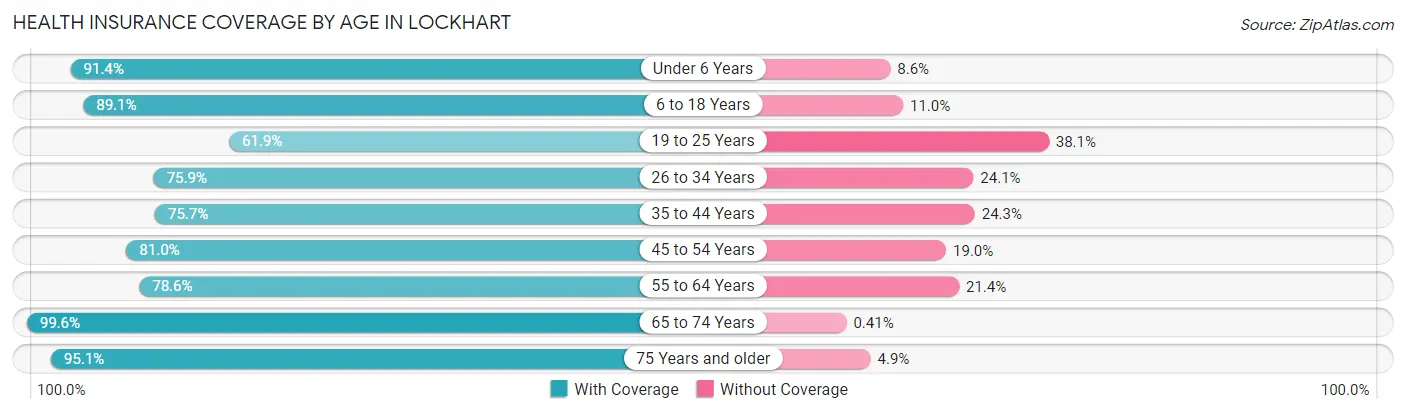
| Age Bracket | With Coverage | Without Coverage |
| Under 6 Years | 830 (91.4%) | 78 (8.6%) |
| 6 to 18 Years | 2,106 (89.0%) | 259 (11.0%) |
| 19 to 25 Years | 568 (61.9%) | 350 (38.1%) |
| 26 to 34 Years | 1,327 (75.9%) | 421 (24.1%) |
| 35 to 44 Years | 1,054 (75.7%) | 339 (24.3%) |
| 45 to 54 Years | 1,156 (81.0%) | 271 (19.0%) |
| 55 to 64 Years | 1,414 (78.6%) | 385 (21.4%) |
| 65 to 74 Years | 1,454 (99.6%) | 6 (0.4%) |
| 75 Years and older | 755 (95.1%) | 39 (4.9%) |
| Total | 10,664 (83.2%) | 2,148 (16.8%) |
Health Insurance Coverage by Citizenship Status in Lockhart
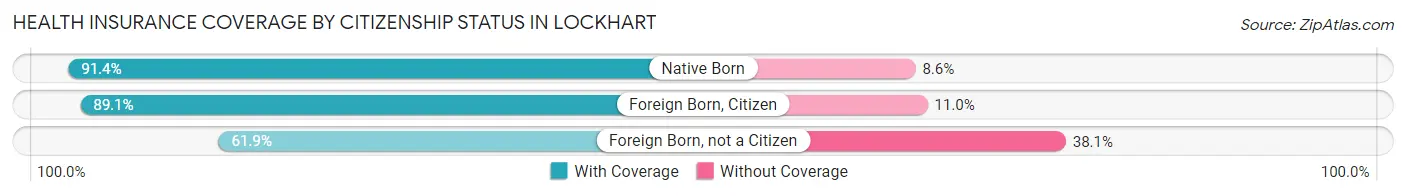
| Citizenship Status | With Coverage | Without Coverage |
| Native Born | 830 (91.4%) | 78 (8.6%) |
| Foreign Born, Citizen | 2,106 (89.0%) | 259 (11.0%) |
| Foreign Born, not a Citizen | 568 (61.9%) | 350 (38.1%) |
Health Insurance Coverage by Household Income in Lockhart
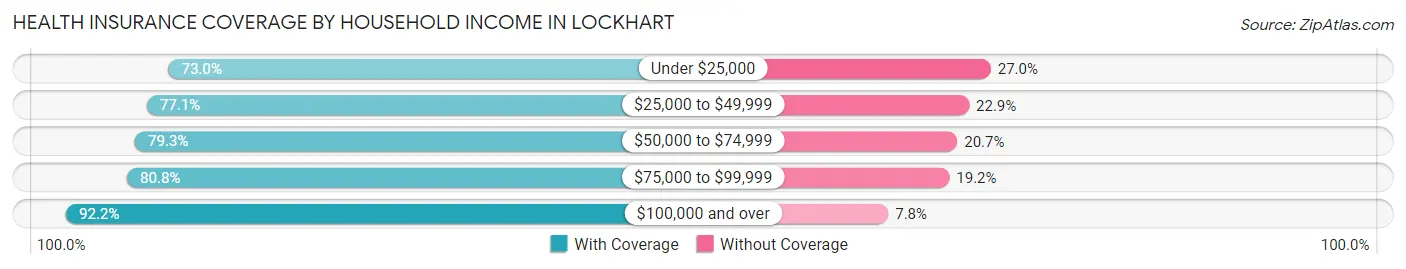
| Household Income | With Coverage | Without Coverage |
| Under $25,000 | 1,031 (73.0%) | 381 (27.0%) |
| $25,000 to $49,999 | 1,648 (77.1%) | 490 (22.9%) |
| $50,000 to $74,999 | 2,157 (79.3%) | 563 (20.7%) |
| $75,000 to $99,999 | 1,442 (80.8%) | 343 (19.2%) |
| $100,000 and over | 4,382 (92.2%) | 369 (7.8%) |
Public vs Private Health Insurance Coverage by Age in Lockhart
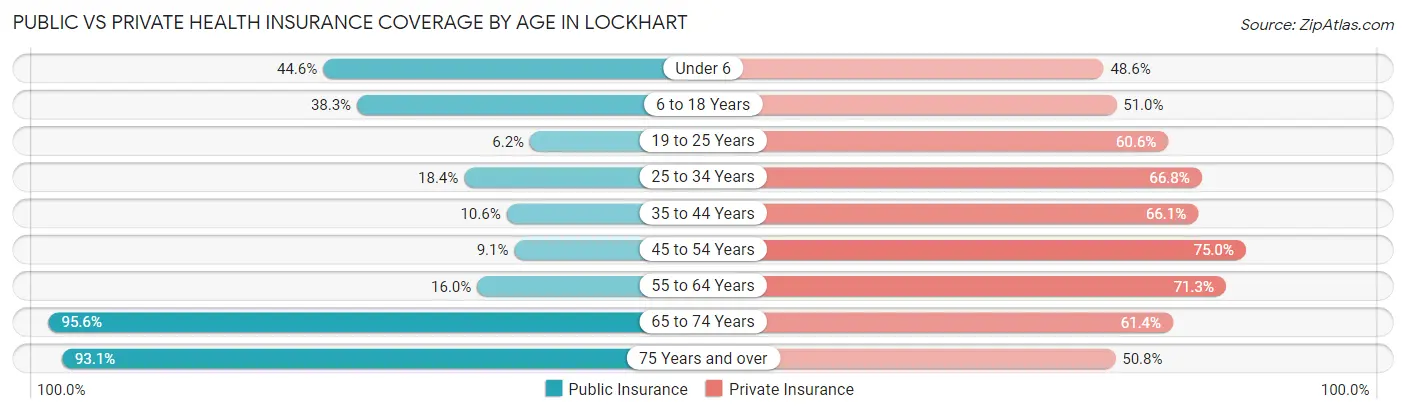
| Age Bracket | Public Insurance | Private Insurance |
| Under 6 | 405 (44.6%) | 441 (48.6%) |
| 6 to 18 Years | 906 (38.3%) | 1,205 (50.9%) |
| 19 to 25 Years | 57 (6.2%) | 556 (60.6%) |
| 25 to 34 Years | 322 (18.4%) | 1,167 (66.8%) |
| 35 to 44 Years | 147 (10.5%) | 921 (66.1%) |
| 45 to 54 Years | 130 (9.1%) | 1,070 (75.0%) |
| 55 to 64 Years | 288 (16.0%) | 1,282 (71.3%) |
| 65 to 74 Years | 1,395 (95.6%) | 897 (61.4%) |
| 75 Years and over | 739 (93.1%) | 403 (50.8%) |
| Total | 4,389 (34.3%) | 7,942 (62.0%) |
Disability Status by Sex by Age in Lockhart
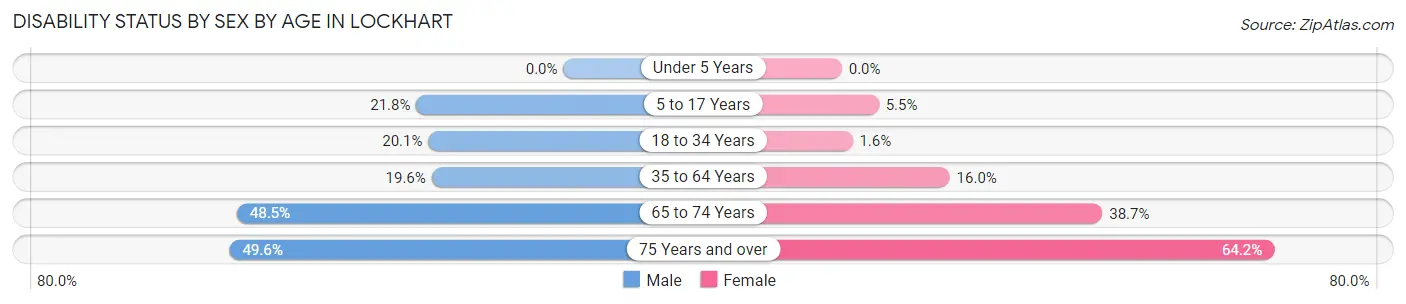
| Age Bracket | Male | Female |
| Under 5 Years | 0 (0.0%) | 0 (0.0%) |
| 5 to 17 Years | 263 (21.8%) | 72 (5.5%) |
| 18 to 34 Years | 276 (20.1%) | 23 (1.6%) |
| 35 to 64 Years | 453 (19.6%) | 369 (16.0%) |
| 65 to 74 Years | 288 (48.5%) | 335 (38.7%) |
| 75 Years and over | 114 (49.6%) | 362 (64.2%) |
Disability Class by Sex by Age in Lockhart
Disability Class: Hearing Difficulty
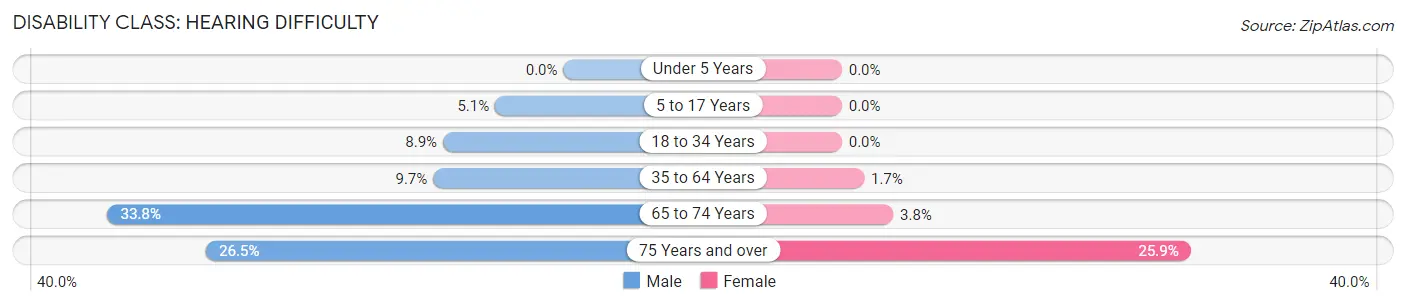
| Age Bracket | Male | Female |
| Under 5 Years | 0 (0.0%) | 0 (0.0%) |
| 5 to 17 Years | 61 (5.1%) | 0 (0.0%) |
| 18 to 34 Years | 123 (8.9%) | 0 (0.0%) |
| 35 to 64 Years | 224 (9.7%) | 38 (1.7%) |
| 65 to 74 Years | 201 (33.8%) | 33 (3.8%) |
| 75 Years and over | 61 (26.5%) | 146 (25.9%) |
Disability Class: Vision Difficulty
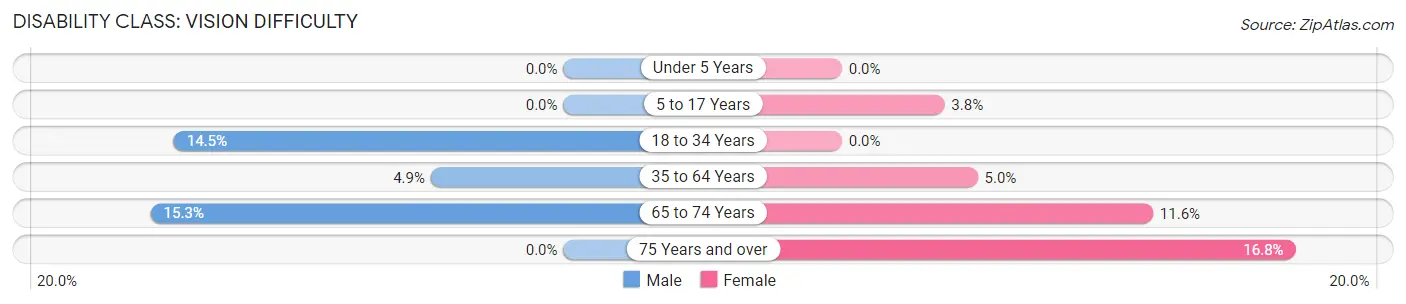
| Age Bracket | Male | Female |
| Under 5 Years | 0 (0.0%) | 0 (0.0%) |
| 5 to 17 Years | 0 (0.0%) | 50 (3.8%) |
| 18 to 34 Years | 199 (14.5%) | 0 (0.0%) |
| 35 to 64 Years | 114 (4.9%) | 116 (5.0%) |
| 65 to 74 Years | 91 (15.3%) | 100 (11.6%) |
| 75 Years and over | 0 (0.0%) | 95 (16.8%) |
Disability Class: Cognitive Difficulty
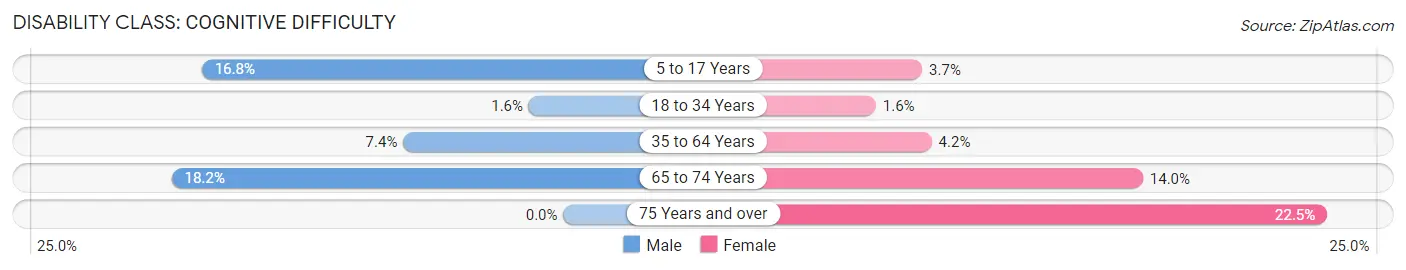
| Age Bracket | Male | Female |
| 5 to 17 Years | 202 (16.8%) | 49 (3.7%) |
| 18 to 34 Years | 22 (1.6%) | 23 (1.6%) |
| 35 to 64 Years | 172 (7.4%) | 96 (4.2%) |
| 65 to 74 Years | 108 (18.2%) | 121 (14.0%) |
| 75 Years and over | 0 (0.0%) | 127 (22.5%) |
Disability Class: Ambulatory Difficulty
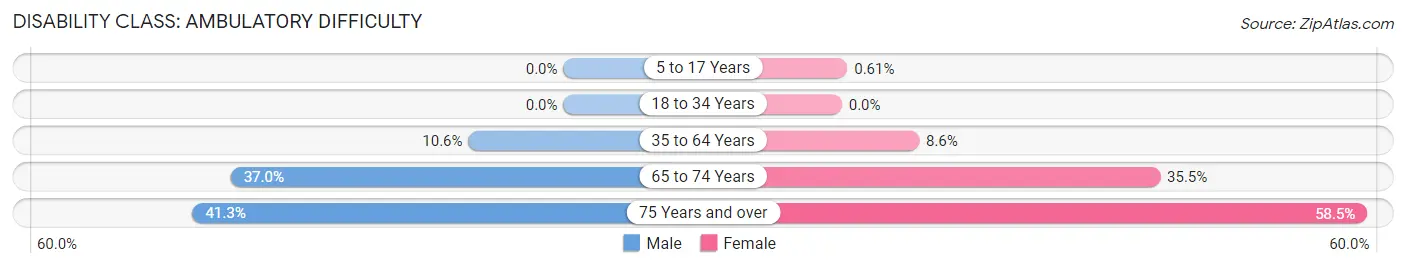
| Age Bracket | Male | Female |
| 5 to 17 Years | 0 (0.0%) | 8 (0.6%) |
| 18 to 34 Years | 0 (0.0%) | 0 (0.0%) |
| 35 to 64 Years | 245 (10.6%) | 198 (8.6%) |
| 65 to 74 Years | 220 (37.0%) | 307 (35.4%) |
| 75 Years and over | 95 (41.3%) | 330 (58.5%) |
Disability Class: Self-Care Difficulty
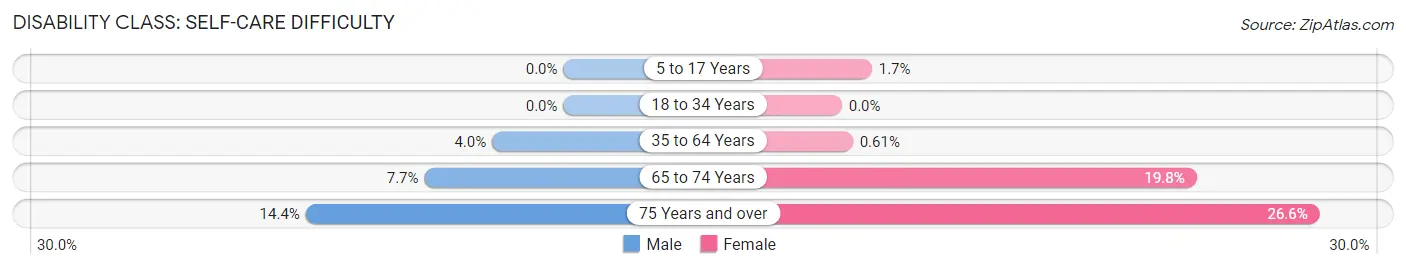
| Age Bracket | Male | Female |
| 5 to 17 Years | 0 (0.0%) | 22 (1.7%) |
| 18 to 34 Years | 0 (0.0%) | 0 (0.0%) |
| 35 to 64 Years | 92 (4.0%) | 14 (0.6%) |
| 65 to 74 Years | 46 (7.7%) | 171 (19.8%) |
| 75 Years and over | 33 (14.3%) | 150 (26.6%) |
Technology Access in Lockhart
Computing Device Access in Lockhart
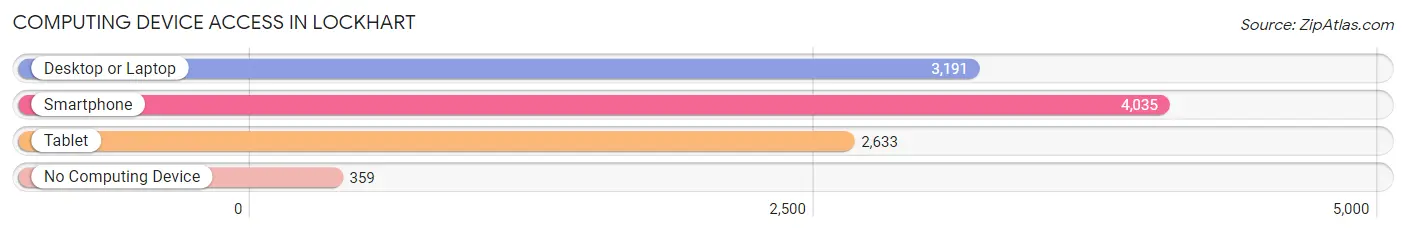
| Device Type | # Households | % Households |
| Desktop or Laptop | 3,191 | 67.8% |
| Smartphone | 4,035 | 85.7% |
| Tablet | 2,633 | 55.9% |
| No Computing Device | 359 | 7.6% |
| Total | 4,707 | 100.0% |
Internet Access in Lockhart
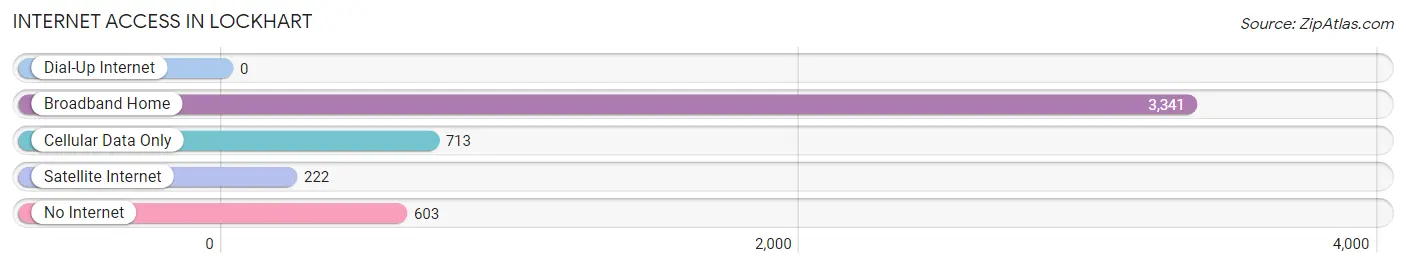
| Internet Type | # Households | % Households |
| Dial-Up Internet | 0 | 0.0% |
| Broadband Home | 3,341 | 71.0% |
| Cellular Data Only | 713 | 15.1% |
| Satellite Internet | 222 | 4.7% |
| No Internet | 603 | 12.8% |
| Total | 4,707 | 100.0% |
Lockhart Summary
Lockhart is a city located in Caldwell County, Texas, United States. It is the county seat of Caldwell County and is located about 30 miles south of Austin and about 60 miles northeast of San Antonio. The population of Lockhart was 12,698 at the 2010 census.
History
The area around Lockhart was first settled in the early 1830s by Anglo-American settlers. The town was named after Byrd Lockhart, an early settler who donated land for the town's first school. Lockhart was officially incorporated in 1858.
During the Civil War, Lockhart was a major supply center for the Confederate Army. After the war, the town's economy was based on cotton farming and ranching. In the late 19th century, Lockhart became a major railroad hub, with the International-Great Northern Railroad and the Missouri-Kansas-Texas Railroad both running through the town.
In the early 20th century, Lockhart was a center for the oil and gas industry. The town also became a center for the manufacture of cottonseed oil and other products.
Geography
Lockhart is located at 30°30'N 97°41'W (30.50, -97.68). According to the United States Census Bureau, the city has a total area of 8.2 square miles (21.2 km2), all of it land.
Economy
The economy of Lockhart is largely based on agriculture and manufacturing. The city is home to several large food processing plants, including the H-E-B Grocery Company, which is the largest employer in the city. Other major employers include the Lockhart Independent School District, the Caldwell County government, and the Lockhart State Park.
The city is also home to several small businesses, including restaurants, retail stores, and professional services.
Demographics
As of the 2010 census, there were 12,698 people, 4,717 households, and 3,092 families residing in the city. The population density was 1,547.2 people per square mile (596.7/km2). There were 5,093 housing units at an average density of 619.7 per square mile (239.2/km2). The racial makeup of the city was 74.2% White, 11.3% African American, 0.7% Native American, 0.5% Asian, 11.7% from other races, and 1.6% from two or more races. Hispanic or Latino of any race were 33.2% of the population.
There were 4,717 households, out of which 33.2% had children under the age of 18 living with them, 44.2% were married couples living together, 17.2% had a female householder with no husband present, and 33.2% were non-families. 28.2% of all households were made up of individuals, and 11.7% had someone living alone who was 65 years of age or older. The average household size was 2.63 and the average family size was 3.22.
In the city, the population was spread out, with 27.2% under the age of 18, 8.7% from 18 to 24, 28.2% from 25 to 44, 21.2% from 45 to 64, and 14.7% who were 65 years of age or older. The median age was 35 years. For every 100 females, there were 92.2 males. For every 100 females age 18 and over, there were 88.2 males.
The median income for a household in the city was $35,938, and the median income for a family was $41,919. Males had a median income of $30,917 versus $22,917 for females. The per capita income for the city was $17,890. About 13.2% of families and 16.7% of the population were below the poverty line, including 22.2% of those under age 18 and 13.2% of those age 65 or over.
Common Questions
What is Per Capita Income in Lockhart?
Per Capita income in Lockhart is $27,759.
What is the Median Family Income in Lockhart?
Median Family Income in Lockhart is $75,092.
What is the Median Household income in Lockhart?
Median Household Income in Lockhart is $68,270.
What is Income or Wage Gap in Lockhart?
Income or Wage Gap in Lockhart is 37.4%.
Women in Lockhart earn 62.6 cents for every dollar earned by a man.
What is Inequality or Gini Index in Lockhart?
Inequality or Gini Index in Lockhart is 0.41.
What is the Total Population of Lockhart?
Total Population of Lockhart is 14,463.
What is the Total Male Population of Lockhart?
Total Male Population of Lockhart is 6,452.
What is the Total Female Population of Lockhart?
Total Female Population of Lockhart is 8,011.
What is the Ratio of Males per 100 Females in Lockhart?
There are 80.54 Males per 100 Females in Lockhart.
What is the Ratio of Females per 100 Males in Lockhart?
There are 124.16 Females per 100 Males in Lockhart.
What is the Median Population Age in Lockhart?
Median Population Age in Lockhart is 38.6 Years.
What is the Average Family Size in Lockhart
Average Family Size in Lockhart is 3.3 People.
What is the Average Household Size in Lockhart
Average Household Size in Lockhart is 2.7 People.
How Large is the Labor Force in Lockhart?
There are 6,505 People in the Labor Forcein in Lockhart.
What is the Percentage of People in the Labor Force in Lockhart?
55.3% of People are in the Labor Force in Lockhart.
What is the Unemployment Rate in Lockhart?
Unemployment Rate in Lockhart is 1.3%.