Littlefield, TX Map & Demographics
Littlefield Map
Littlefield Overview
$25,391
PER CAPITA INCOME
$63,214
AVG FAMILY INCOME
$48,962
AVG HOUSEHOLD INCOME
35.8%
WAGE / INCOME GAP [ % ]
64.2¢/ $1
WAGE / INCOME GAP [ $ ]
0.46
INEQUALITY / GINI INDEX
5,939
TOTAL POPULATION
2,928
MALE POPULATION
3,011
FEMALE POPULATION
97.24
MALES / 100 FEMALES
102.83
FEMALES / 100 MALES
35.1
MEDIAN AGE
3.5
AVG FAMILY SIZE
2.7
AVG HOUSEHOLD SIZE
2,557
LABOR FORCE [ PEOPLE ]
59.0%
PERCENT IN LABOR FORCE
2.4%
UNEMPLOYMENT RATE
Littlefield Zip Codes
Littlefield Area Codes
Income in Littlefield
Income Overview in Littlefield
Per Capita Income in Littlefield is $25,391, while median incomes of families and households are $63,214 and $48,962 respectively.
| Characteristic | Number | Measure |
| Per Capita Income | 5,939 | $25,391 |
| Median Family Income | 1,432 | $63,214 |
| Mean Family Income | 1,432 | $79,367 |
| Median Household Income | 2,146 | $48,962 |
| Mean Household Income | 2,146 | $66,153 |
| Income Deficit | 1,432 | $0 |
| Wage / Income Gap (%) | 5,939 | 35.79% |
| Wage / Income Gap ($) | 5,939 | 64.21¢ per $1 |
| Gini / Inequality Index | 5,939 | 0.46 |
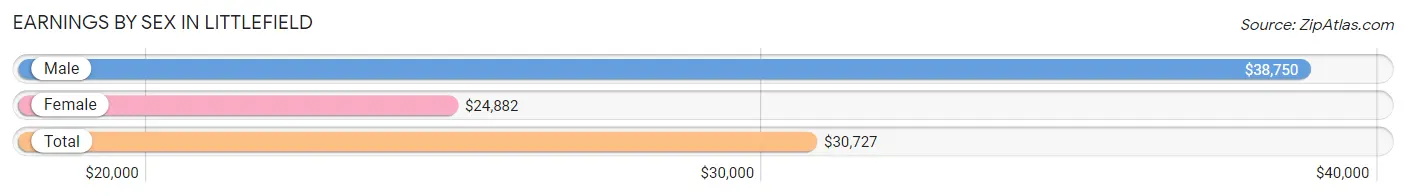
Earnings by Sex in Littlefield
Average Earnings in Littlefield are $30,727, $38,750 for men and $24,882 for women, a difference of 35.8%.
| Sex | Number | Average Earnings |
| Male | 1,444 (53.7%) | $38,750 |
| Female | 1,243 (46.3%) | $24,882 |
| Total | 2,687 (100.0%) | $30,727 |
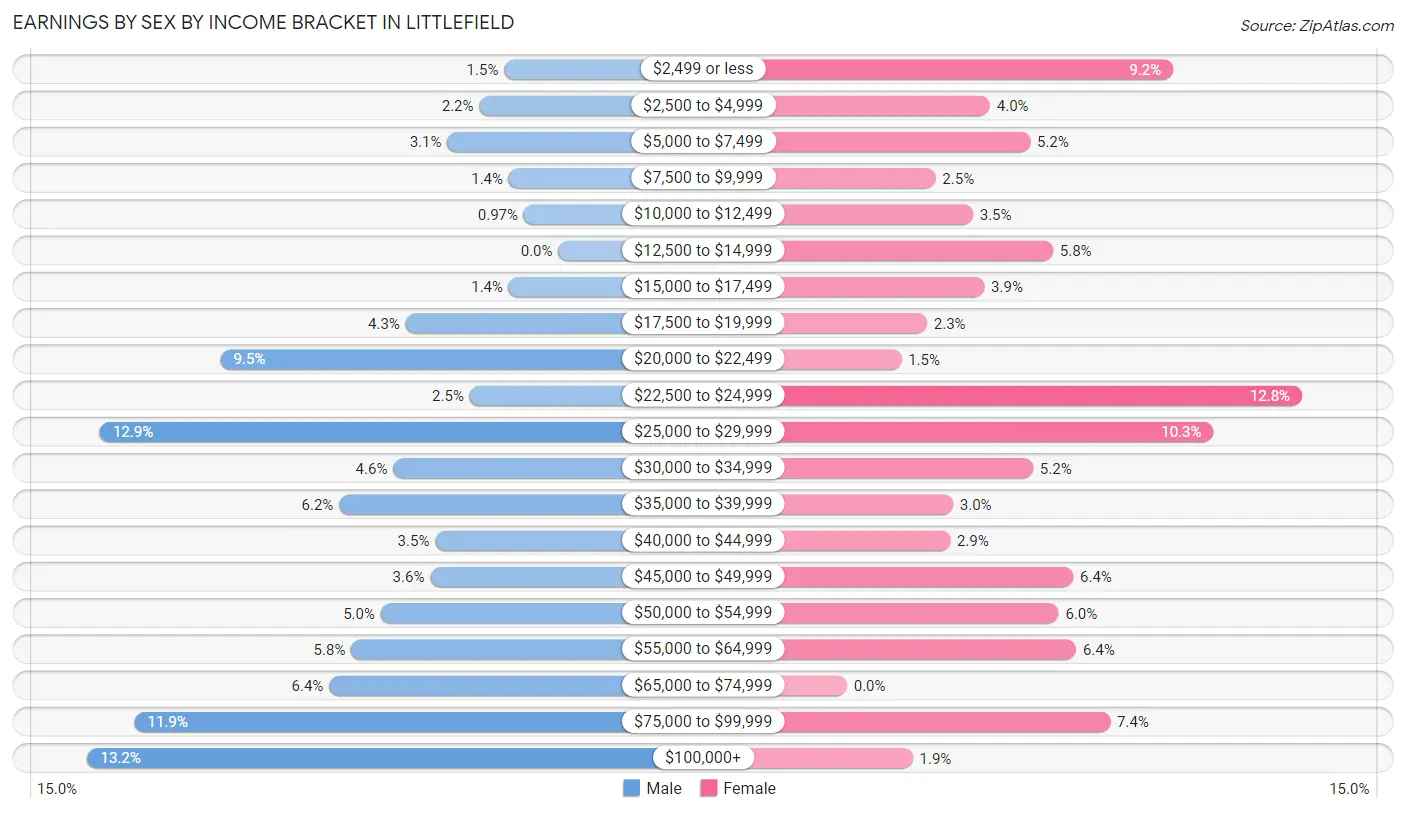
Earnings by Sex by Income Bracket in Littlefield
The most common earnings brackets in Littlefield are $100,000+ for men (191 | 13.2%) and $22,500 to $24,999 for women (159 | 12.8%).
| Income | Male | Female |
| $2,499 or less | 22 (1.5%) | 114 (9.2%) |
| $2,500 to $4,999 | 32 (2.2%) | 50 (4.0%) |
| $5,000 to $7,499 | 45 (3.1%) | 64 (5.1%) |
| $7,500 to $9,999 | 20 (1.4%) | 31 (2.5%) |
| $10,000 to $12,499 | 14 (1.0%) | 44 (3.5%) |
| $12,500 to $14,999 | 0 (0.0%) | 72 (5.8%) |
| $15,000 to $17,499 | 20 (1.4%) | 48 (3.9%) |
| $17,500 to $19,999 | 62 (4.3%) | 28 (2.2%) |
| $20,000 to $22,499 | 137 (9.5%) | 19 (1.5%) |
| $22,500 to $24,999 | 36 (2.5%) | 159 (12.8%) |
| $25,000 to $29,999 | 186 (12.9%) | 128 (10.3%) |
| $30,000 to $34,999 | 67 (4.6%) | 65 (5.2%) |
| $35,000 to $39,999 | 89 (6.2%) | 37 (3.0%) |
| $40,000 to $44,999 | 50 (3.5%) | 36 (2.9%) |
| $45,000 to $49,999 | 52 (3.6%) | 79 (6.4%) |
| $50,000 to $54,999 | 72 (5.0%) | 74 (5.9%) |
| $55,000 to $64,999 | 84 (5.8%) | 80 (6.4%) |
| $65,000 to $74,999 | 93 (6.4%) | 0 (0.0%) |
| $75,000 to $99,999 | 172 (11.9%) | 92 (7.4%) |
| $100,000+ | 191 (13.2%) | 23 (1.8%) |
| Total | 1,444 (100.0%) | 1,243 (100.0%) |
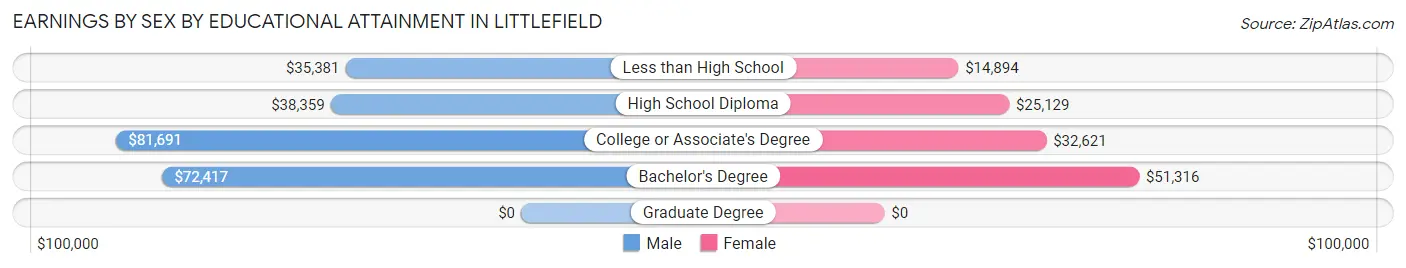
Earnings by Sex by Educational Attainment in Littlefield
Average earnings in Littlefield are $45,219 for men and $28,558 for women, a difference of 36.8%. Men with an educational attainment of college or associate's degree enjoy the highest average annual earnings of $81,691, while those with less than high school education earn the least with $35,381. Women with an educational attainment of bachelor's degree earn the most with the average annual earnings of $51,316, while those with less than high school education have the smallest earnings of $14,894.
| Educational Attainment | Male Income | Female Income |
| Less than High School | $35,381 | $14,894 |
| High School Diploma | $38,359 | $25,129 |
| College or Associate's Degree | $81,691 | $32,621 |
| Bachelor's Degree | $72,417 | $51,316 |
| Graduate Degree | - | - |
| Total | $45,219 | $28,558 |
Family Income in Littlefield
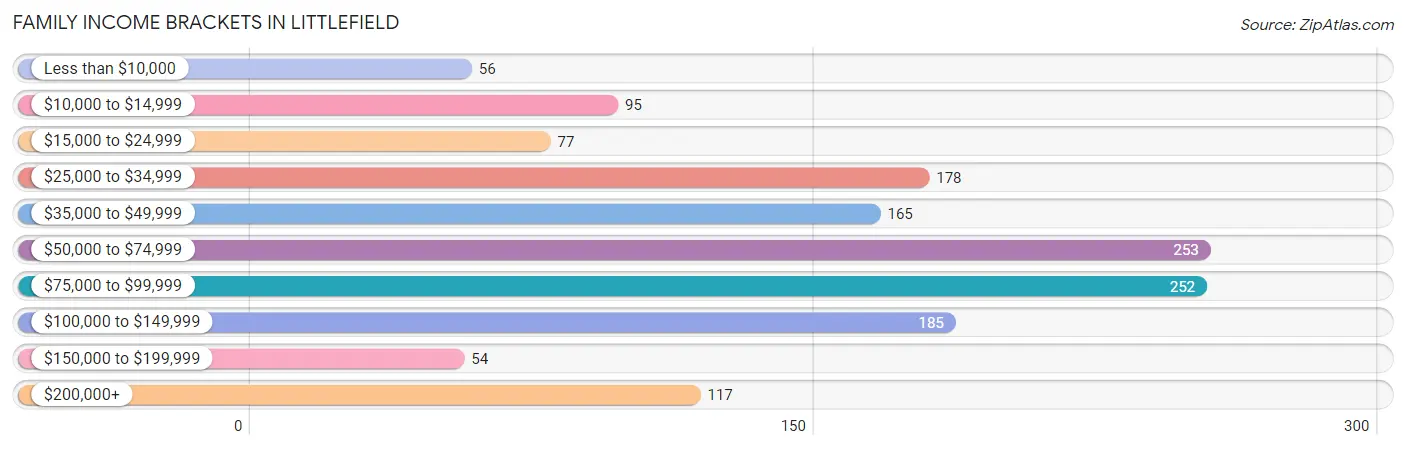
Family Income Brackets in Littlefield
According to the Littlefield family income data, there are 253 families falling into the $50,000 to $74,999 income range, which is the most common income bracket and makes up 17.7% of all families. Conversely, the $150,000 to $199,999 income bracket is the least frequent group with only 54 families (3.8%) belonging to this category.
| Income Bracket | # Families | % Families |
| Less than $10,000 | 56 | 3.9% |
| $10,000 to $14,999 | 95 | 6.6% |
| $15,000 to $24,999 | 77 | 5.4% |
| $25,000 to $34,999 | 178 | 12.4% |
| $35,000 to $49,999 | 165 | 11.5% |
| $50,000 to $74,999 | 253 | 17.7% |
| $75,000 to $99,999 | 252 | 17.6% |
| $100,000 to $149,999 | 185 | 12.9% |
| $150,000 to $199,999 | 54 | 3.8% |
| $200,000+ | 117 | 8.2% |
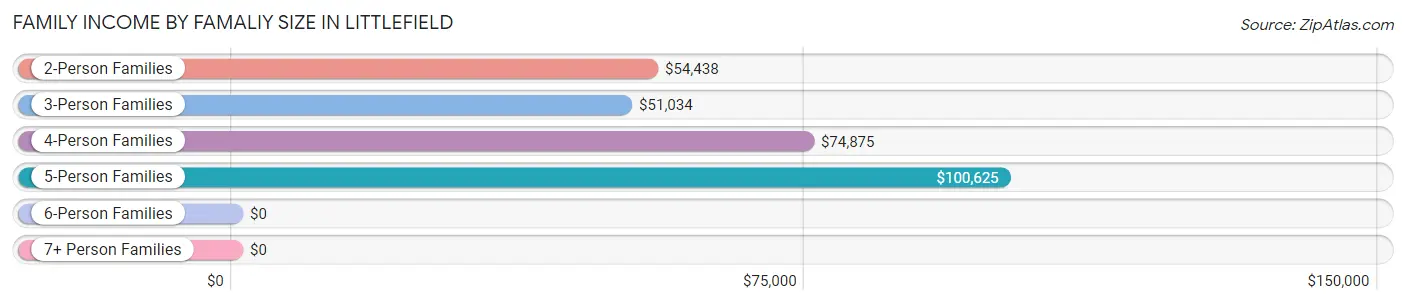
Family Income by Famaliy Size in Littlefield
5-person families (90 | 6.3%) account for the highest median family income in Littlefield with $100,625 per family, while 2-person families (513 | 35.8%) have the highest median income of $27,219 per family member.
| Income Bracket | # Families | Median Income |
| 2-Person Families | 513 (35.8%) | $54,438 |
| 3-Person Families | 356 (24.9%) | $51,034 |
| 4-Person Families | 410 (28.6%) | $74,875 |
| 5-Person Families | 90 (6.3%) | $100,625 |
| 6-Person Families | 48 (3.4%) | $0 |
| 7+ Person Families | 15 (1.1%) | $0 |
| Total | 1,432 (100.0%) | $63,214 |
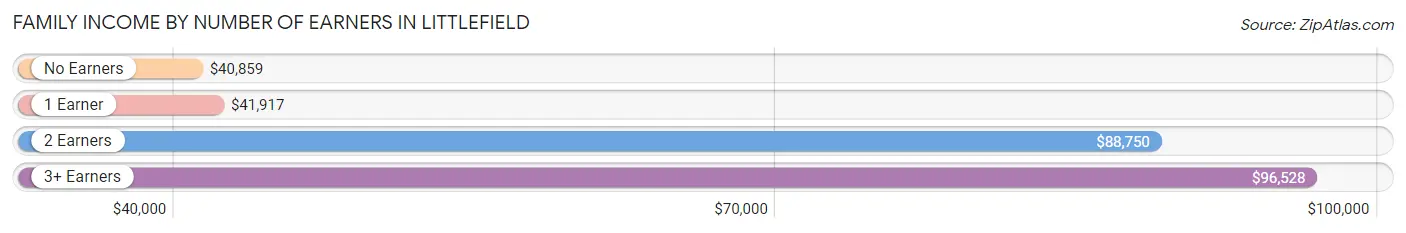
Family Income by Number of Earners in Littlefield
The median family income in Littlefield is $63,214, with families comprising 3+ earners (136) having the highest median family income of $96,528, while families with no earners (259) have the lowest median family income of $40,859, accounting for 9.5% and 18.1% of families, respectively.
| Number of Earners | # Families | Median Income |
| No Earners | 259 (18.1%) | $40,859 |
| 1 Earner | 557 (38.9%) | $41,917 |
| 2 Earners | 480 (33.5%) | $88,750 |
| 3+ Earners | 136 (9.5%) | $96,528 |
| Total | 1,432 (100.0%) | $63,214 |
Household Income in Littlefield
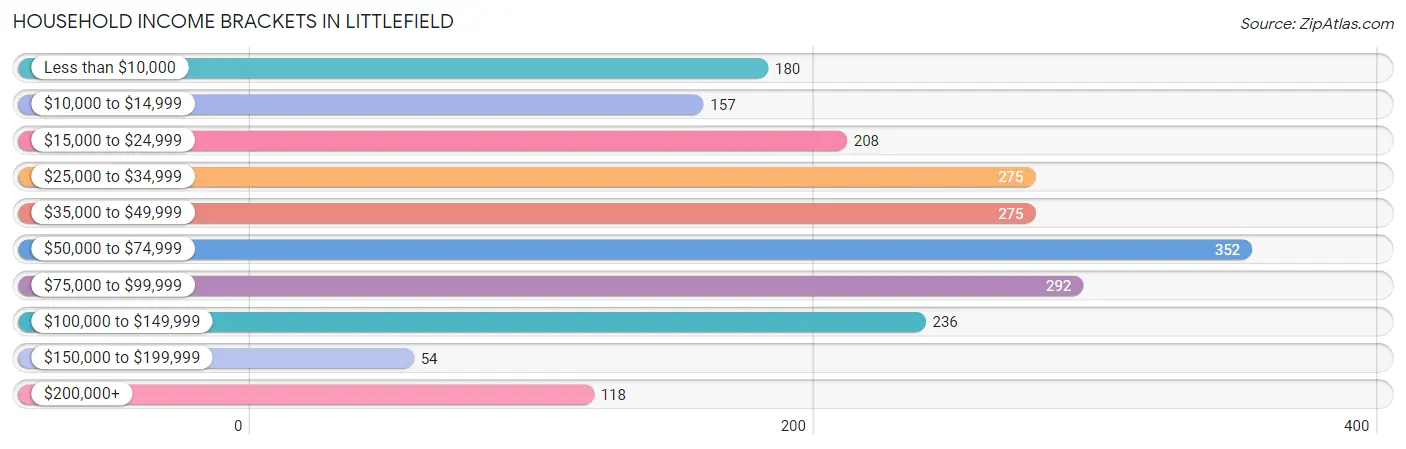
Household Income Brackets in Littlefield
With 352 households falling in the category, the $50,000 to $74,999 income range is the most frequent in Littlefield, accounting for 16.4% of all households. In contrast, only 54 households (2.5%) fall into the $150,000 to $199,999 income bracket, making it the least populous group.
| Income Bracket | # Households | % Households |
| Less than $10,000 | 180 | 8.4% |
| $10,000 to $14,999 | 157 | 7.3% |
| $15,000 to $24,999 | 208 | 9.7% |
| $25,000 to $34,999 | 275 | 12.8% |
| $35,000 to $49,999 | 275 | 12.8% |
| $50,000 to $74,999 | 352 | 16.4% |
| $75,000 to $99,999 | 292 | 13.6% |
| $100,000 to $149,999 | 236 | 11.0% |
| $150,000 to $199,999 | 54 | 2.5% |
| $200,000+ | 118 | 5.5% |
Household Income by Householder Age in Littlefield
The median household income in Littlefield is $48,962, with the highest median household income of $70,509 found in the 25 to 44 years age bracket for the primary householder. A total of 685 households (31.9%) fall into this category. Meanwhile, the 15 to 24 years age bracket for the primary householder has the lowest median household income of $0, with 96 households (4.5%) in this group.
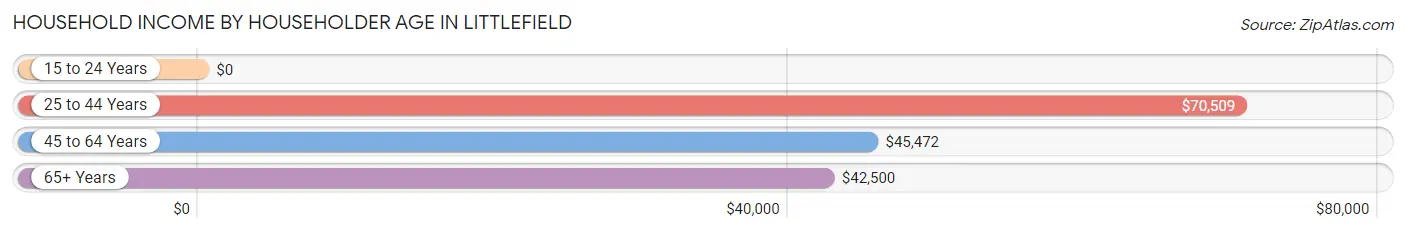
| Income Bracket | # Households | Median Income |
| 15 to 24 Years | 96 (4.5%) | $0 |
| 25 to 44 Years | 685 (31.9%) | $70,509 |
| 45 to 64 Years | 813 (37.9%) | $45,472 |
| 65+ Years | 552 (25.7%) | $42,500 |
| Total | 2,146 (100.0%) | $48,962 |
Poverty in Littlefield
Income Below Poverty by Sex and Age in Littlefield
With 10.9% poverty level for males and 24.1% for females among the residents of Littlefield, 12 to 14 year old males and 12 to 14 year old females are the most vulnerable to poverty, with 17 males (27.0%) and 87 females (46.0%) in their respective age groups living below the poverty level.
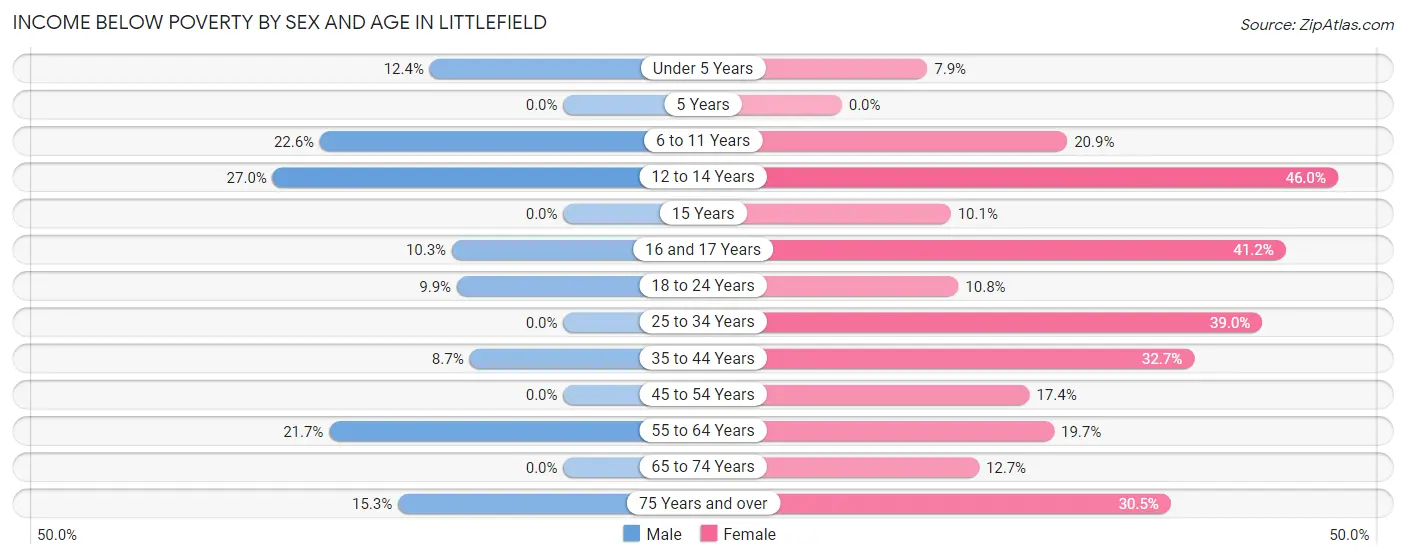
| Age Bracket | Male | Female |
| Under 5 Years | 32 (12.4%) | 15 (7.9%) |
| 5 Years | 0 (0.0%) | 0 (0.0%) |
| 6 to 11 Years | 96 (22.6%) | 59 (20.9%) |
| 12 to 14 Years | 17 (27.0%) | 87 (46.0%) |
| 15 Years | 0 (0.0%) | 9 (10.1%) |
| 16 and 17 Years | 9 (10.3%) | 35 (41.2%) |
| 18 to 24 Years | 24 (9.9%) | 29 (10.8%) |
| 25 to 34 Years | 0 (0.0%) | 149 (39.0%) |
| 35 to 44 Years | 29 (8.7%) | 102 (32.7%) |
| 45 to 54 Years | 0 (0.0%) | 54 (17.4%) |
| 55 to 64 Years | 78 (21.7%) | 66 (19.7%) |
| 65 to 74 Years | 0 (0.0%) | 35 (12.7%) |
| 75 Years and over | 29 (15.3%) | 76 (30.5%) |
| Total | 314 (10.9%) | 716 (24.1%) |
Income Above Poverty by Sex and Age in Littlefield
According to the poverty statistics in Littlefield, males aged 5 years and females aged under 5 years are the age groups that are most secure financially, with 100.0% of males and 92.1% of females in these age groups living above the poverty line.
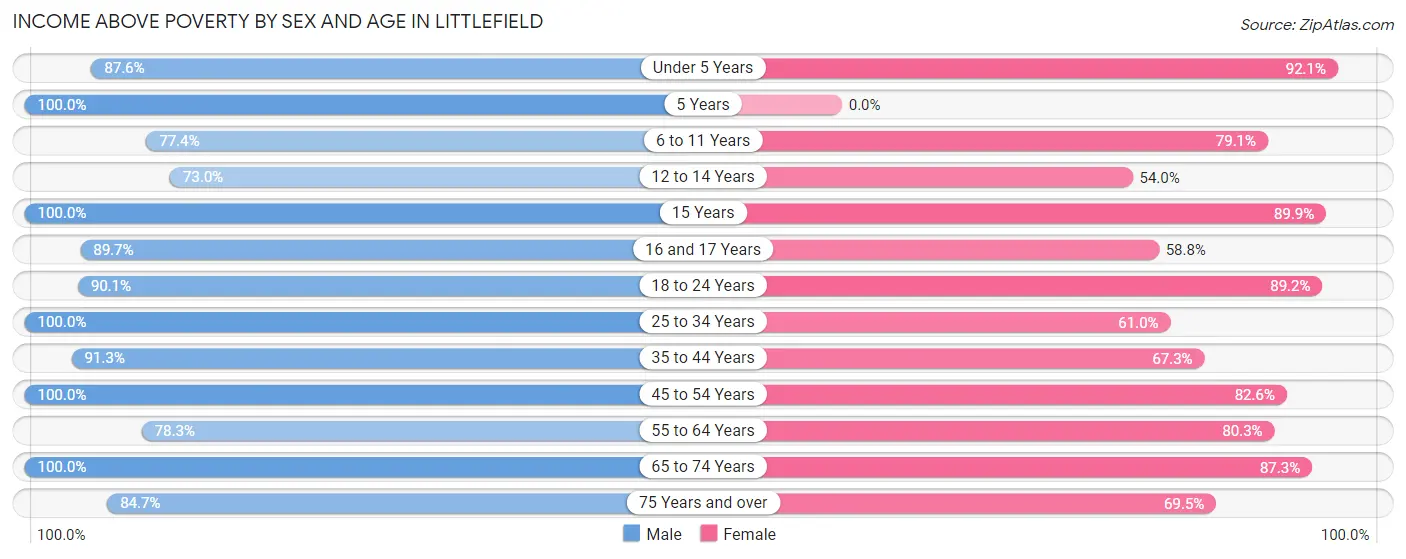
| Age Bracket | Male | Female |
| Under 5 Years | 226 (87.6%) | 174 (92.1%) |
| 5 Years | 44 (100.0%) | 0 (0.0%) |
| 6 to 11 Years | 329 (77.4%) | 223 (79.1%) |
| 12 to 14 Years | 46 (73.0%) | 102 (54.0%) |
| 15 Years | 66 (100.0%) | 80 (89.9%) |
| 16 and 17 Years | 78 (89.7%) | 50 (58.8%) |
| 18 to 24 Years | 219 (90.1%) | 239 (89.2%) |
| 25 to 34 Years | 271 (100.0%) | 233 (61.0%) |
| 35 to 44 Years | 304 (91.3%) | 210 (67.3%) |
| 45 to 54 Years | 325 (100.0%) | 256 (82.6%) |
| 55 to 64 Years | 281 (78.3%) | 269 (80.3%) |
| 65 to 74 Years | 224 (100.0%) | 240 (87.3%) |
| 75 Years and over | 160 (84.7%) | 173 (69.5%) |
| Total | 2,573 (89.1%) | 2,249 (75.8%) |
Income Below Poverty Among Married-Couple Families in Littlefield
The poverty statistics for married-couple families in Littlefield show that 3.9% or 36 of the total 923 families live below the poverty line. Families with no children have the highest poverty rate of 4.9%, comprising of 26 families. On the other hand, families with 3 or 4 children have the lowest poverty rate of 0.0%, which includes 0 families.
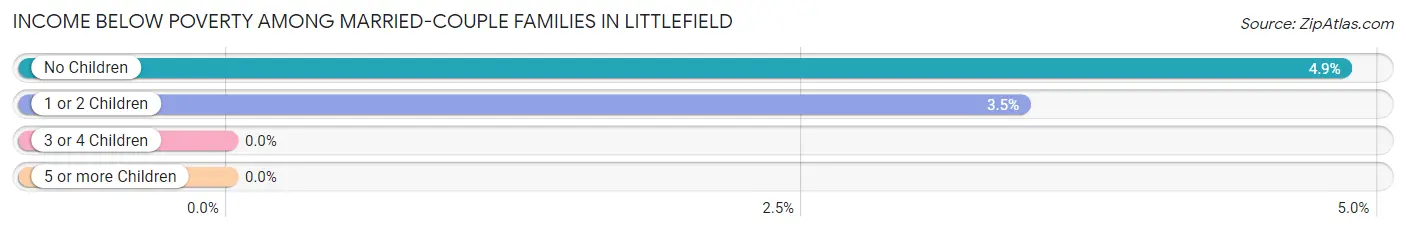
| Children | Above Poverty | Below Poverty |
| No Children | 510 (95.2%) | 26 (4.9%) |
| 1 or 2 Children | 280 (96.6%) | 10 (3.5%) |
| 3 or 4 Children | 97 (100.0%) | 0 (0.0%) |
| 5 or more Children | 0 (0.0%) | 0 (0.0%) |
| Total | 887 (96.1%) | 36 (3.9%) |
Income Below Poverty Among Single-Parent Households in Littlefield
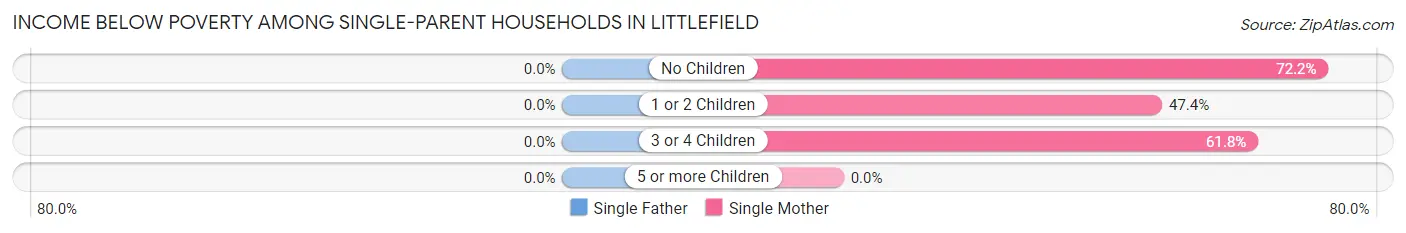
| Children | Single Father | Single Mother |
| No Children | 0 (0.0%) | 26 (72.2%) |
| 1 or 2 Children | 0 (0.0%) | 74 (47.4%) |
| 3 or 4 Children | 0 (0.0%) | 84 (61.8%) |
| 5 or more Children | 0 (0.0%) | 0 (0.0%) |
| Total | 0 (0.0%) | 184 (56.1%) |
Income Below Poverty Among Married-Couple vs Single-Parent Households in Littlefield
The poverty data for Littlefield shows that 36 of the married-couple family households (3.9%) and 184 of the single-parent households (36.1%) are living below the poverty level. Within the married-couple family households, those with no children have the highest poverty rate, with 26 households (4.9%) falling below the poverty line. Among the single-parent households, those with no children have the highest poverty rate, with 26 household (72.2%) living below poverty.
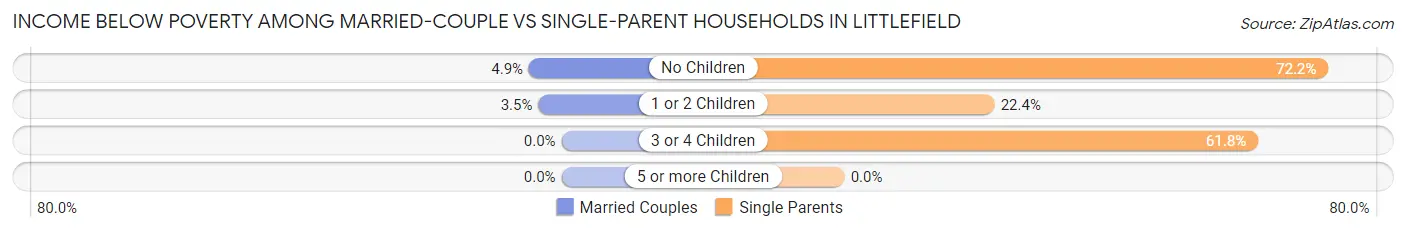
| Children | Married-Couple Families | Single-Parent Households |
| No Children | 26 (4.9%) | 26 (72.2%) |
| 1 or 2 Children | 10 (3.5%) | 74 (22.4%) |
| 3 or 4 Children | 0 (0.0%) | 84 (61.8%) |
| 5 or more Children | 0 (0.0%) | 0 (0.0%) |
| Total | 36 (3.9%) | 184 (36.1%) |
Race in Littlefield
The most populous races in Littlefield are White / Caucasian (4,766 | 80.2%), Hispanic or Latino (3,482 | 58.6%), and Two or more Races (724 | 12.2%).
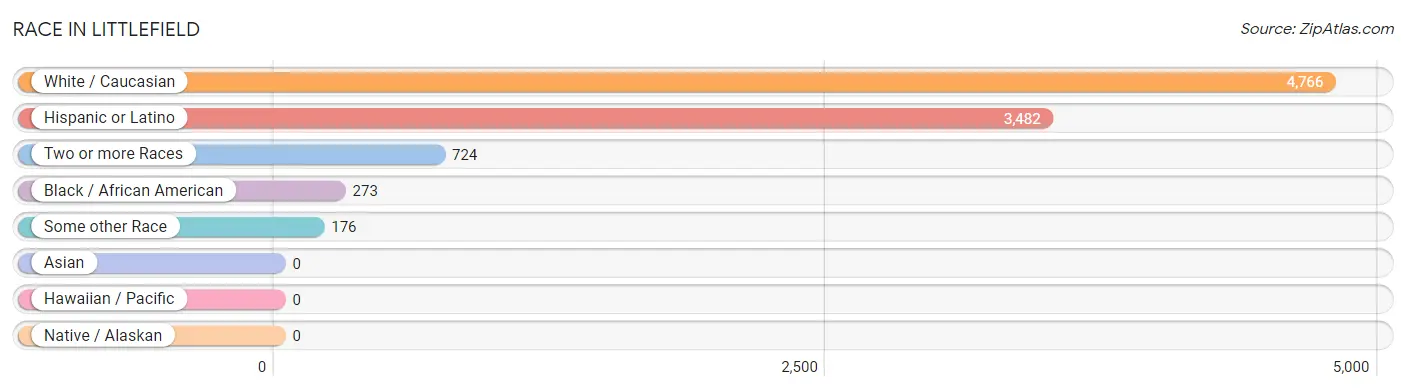
| Race | # Population | % Population |
| Asian | 0 | 0.0% |
| Black / African American | 273 | 4.6% |
| Hawaiian / Pacific | 0 | 0.0% |
| Hispanic or Latino | 3,482 | 58.6% |
| Native / Alaskan | 0 | 0.0% |
| White / Caucasian | 4,766 | 80.2% |
| Two or more Races | 724 | 12.2% |
| Some other Race | 176 | 3.0% |
| Total | 5,939 | 100.0% |
Ancestry in Littlefield
The most populous ancestries reported in Littlefield are Mexican (3,361 | 56.6%), German (378 | 6.4%), American (324 | 5.5%), Irish (272 | 4.6%), and English (191 | 3.2%), together accounting for 76.2% of all Littlefield residents.
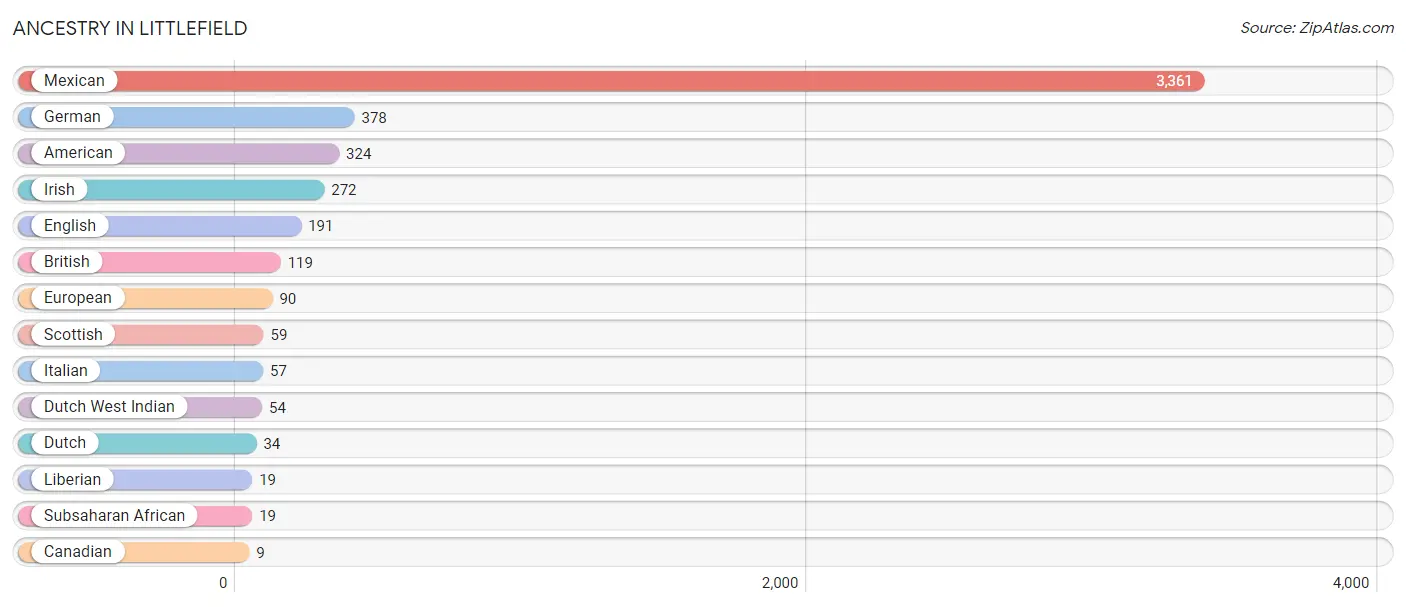
| Ancestry | # Population | % Population |
| American | 324 | 5.5% |
| British | 119 | 2.0% |
| Canadian | 9 | 0.2% |
| Dutch | 34 | 0.6% |
| Dutch West Indian | 54 | 0.9% |
| English | 191 | 3.2% |
| European | 90 | 1.5% |
| German | 378 | 6.4% |
| Irish | 272 | 4.6% |
| Italian | 57 | 1.0% |
| Liberian | 19 | 0.3% |
| Mexican | 3,361 | 56.6% |
| Scottish | 59 | 1.0% |
| Subsaharan African | 19 | 0.3% | View All 14 Rows |
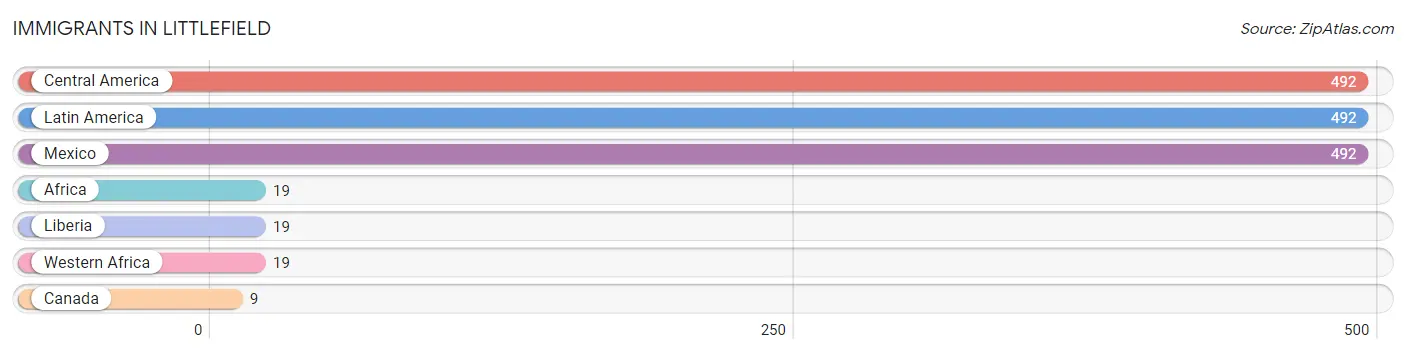
Immigrants in Littlefield
The most numerous immigrant groups reported in Littlefield came from Central America (492 | 8.3%), Latin America (492 | 8.3%), Mexico (492 | 8.3%), Africa (19 | 0.3%), and Liberia (19 | 0.3%), together accounting for 25.5% of all Littlefield residents.
| Immigration Origin | # Population | % Population |
| Africa | 19 | 0.3% |
| Canada | 9 | 0.2% |
| Central America | 492 | 8.3% |
| Latin America | 492 | 8.3% |
| Liberia | 19 | 0.3% |
| Mexico | 492 | 8.3% |
| Western Africa | 19 | 0.3% | View All 7 Rows |
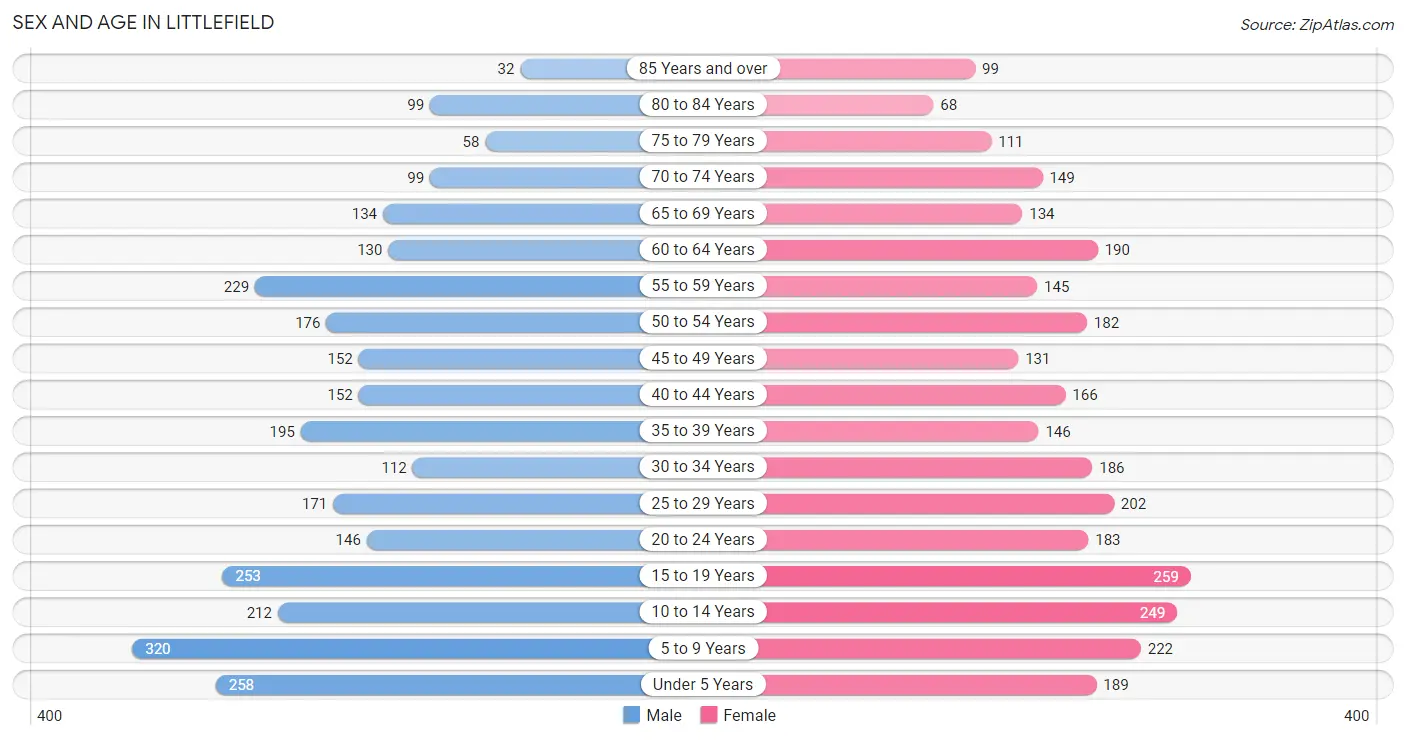
Sex and Age in Littlefield
Sex and Age in Littlefield
The most populous age groups in Littlefield are 5 to 9 Years (320 | 10.9%) for men and 15 to 19 Years (259 | 8.6%) for women.
| Age Bracket | Male | Female |
| Under 5 Years | 258 (8.8%) | 189 (6.3%) |
| 5 to 9 Years | 320 (10.9%) | 222 (7.4%) |
| 10 to 14 Years | 212 (7.2%) | 249 (8.3%) |
| 15 to 19 Years | 253 (8.6%) | 259 (8.6%) |
| 20 to 24 Years | 146 (5.0%) | 183 (6.1%) |
| 25 to 29 Years | 171 (5.8%) | 202 (6.7%) |
| 30 to 34 Years | 112 (3.8%) | 186 (6.2%) |
| 35 to 39 Years | 195 (6.7%) | 146 (4.9%) |
| 40 to 44 Years | 152 (5.2%) | 166 (5.5%) |
| 45 to 49 Years | 152 (5.2%) | 131 (4.3%) |
| 50 to 54 Years | 176 (6.0%) | 182 (6.0%) |
| 55 to 59 Years | 229 (7.8%) | 145 (4.8%) |
| 60 to 64 Years | 130 (4.4%) | 190 (6.3%) |
| 65 to 69 Years | 134 (4.6%) | 134 (4.4%) |
| 70 to 74 Years | 99 (3.4%) | 149 (5.0%) |
| 75 to 79 Years | 58 (2.0%) | 111 (3.7%) |
| 80 to 84 Years | 99 (3.4%) | 68 (2.3%) |
| 85 Years and over | 32 (1.1%) | 99 (3.3%) |
| Total | 2,928 (100.0%) | 3,011 (100.0%) |
Families and Households in Littlefield
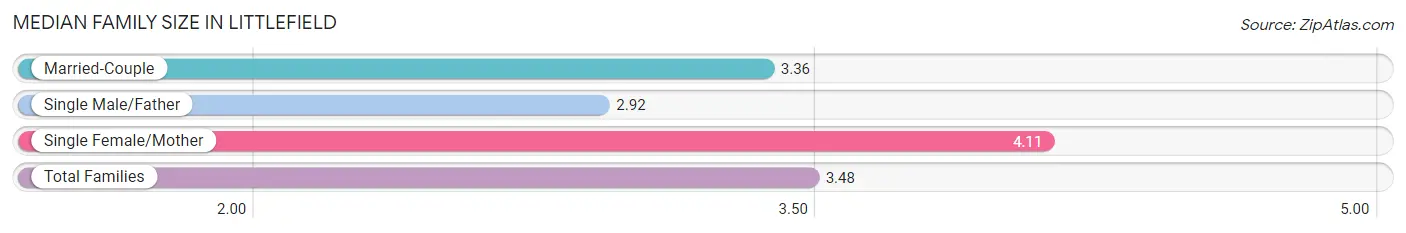
Median Family Size in Littlefield
The median family size in Littlefield is 3.48 persons per family, with single female/mother families (328 | 22.9%) accounting for the largest median family size of 4.11 persons per family. On the other hand, single male/father families (181 | 12.6%) represent the smallest median family size with 2.92 persons per family.
| Family Type | # Families | Family Size |
| Married-Couple | 923 (64.5%) | 3.36 |
| Single Male/Father | 181 (12.6%) | 2.92 |
| Single Female/Mother | 328 (22.9%) | 4.11 |
| Total Families | 1,432 (100.0%) | 3.48 |
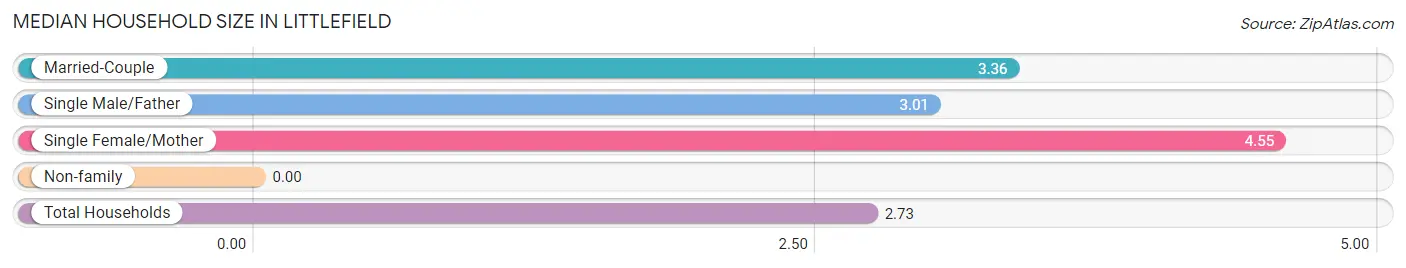
Median Household Size in Littlefield
| Household Type | # Households | Household Size |
| Married-Couple | 923 (43.0%) | 3.36 |
| Single Male/Father | 181 (8.4%) | 3.01 |
| Single Female/Mother | 328 (15.3%) | 4.55 |
| Non-family | 714 (33.3%) | - |
| Total Households | 2,146 (100.0%) | 2.73 |
Household Size by Marriage Status in Littlefield
Out of a total of 2,146 households in Littlefield, 1,432 (66.7%) are family households, while 714 (33.3%) are nonfamily households. The most numerous type of family households are 2-person households, comprising 491, and the most common type of nonfamily households are 1-person households, comprising 714.
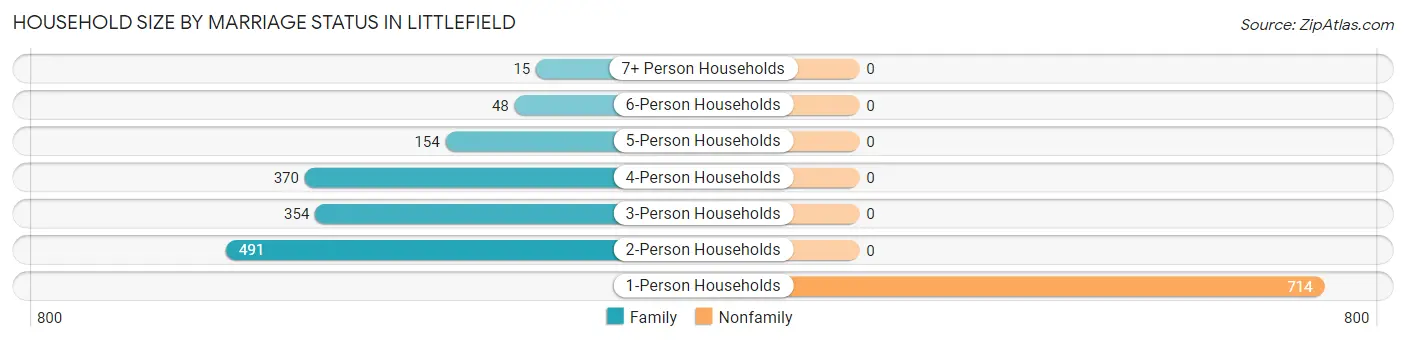
| Household Size | Family Households | Nonfamily Households |
| 1-Person Households | - | 714 (33.3%) |
| 2-Person Households | 491 (22.9%) | 0 (0.0%) |
| 3-Person Households | 354 (16.5%) | 0 (0.0%) |
| 4-Person Households | 370 (17.2%) | 0 (0.0%) |
| 5-Person Households | 154 (7.2%) | 0 (0.0%) |
| 6-Person Households | 48 (2.2%) | 0 (0.0%) |
| 7+ Person Households | 15 (0.7%) | 0 (0.0%) |
| Total | 1,432 (66.7%) | 714 (33.3%) |
Female Fertility in Littlefield
Fertility by Age in Littlefield
Average fertility rate in Littlefield is 47.0 births per 1,000 women. Women in the age bracket of 20 to 34 years have the highest fertility rate with 98.0 births per 1,000 women. Women in the age bracket of 20 to 34 years acount for 93.3% of all women with births.
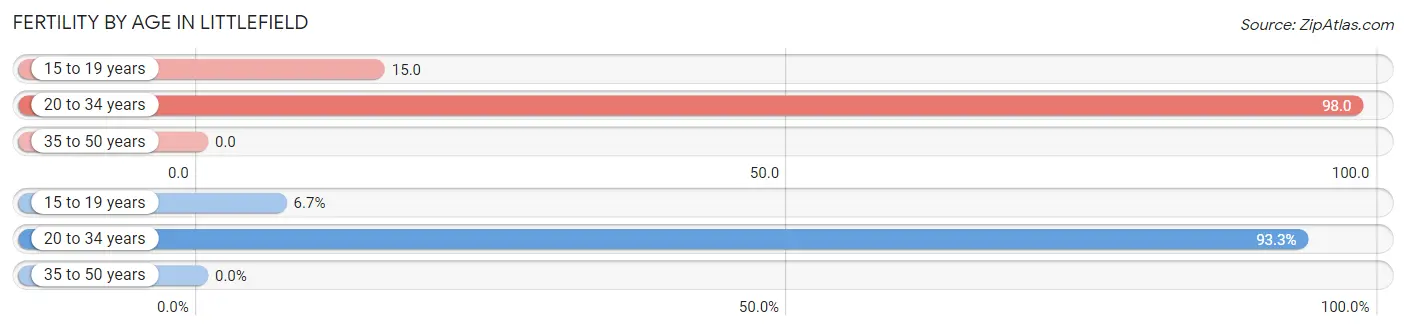
| Age Bracket | Women with Births | Births / 1,000 Women |
| 15 to 19 years | 4 (6.7%) | 15.0 |
| 20 to 34 years | 56 (93.3%) | 98.0 |
| 35 to 50 years | 0 (0.0%) | 0.0 |
| Total | 60 (100.0%) | 47.0 |
Fertility by Age by Marriage Status in Littlefield
45.0% of women with births (60) in Littlefield are married. The highest percentage of unmarried women with births falls into 15 to 19 years age bracket with 100.0% of them unmarried at the time of birth, while the lowest percentage of unmarried women with births belong to 20 to 34 years age bracket with 51.8% of them unmarried.
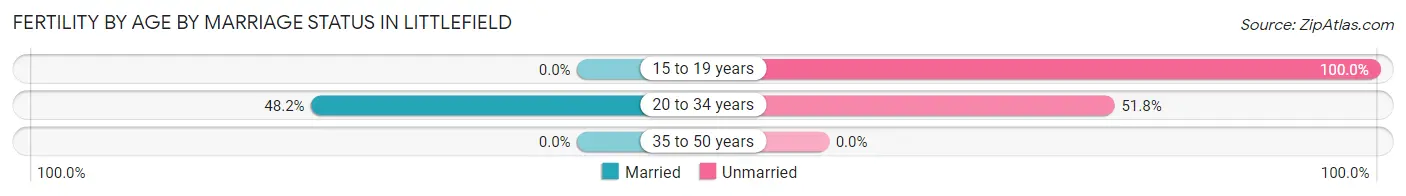
| Age Bracket | Married | Unmarried |
| 15 to 19 years | 0 (0.0%) | 4 (100.0%) |
| 20 to 34 years | 27 (48.2%) | 29 (51.8%) |
| 35 to 50 years | 0 (0.0%) | 0 (0.0%) |
| Total | 27 (45.0%) | 33 (55.0%) |
Fertility by Education in Littlefield
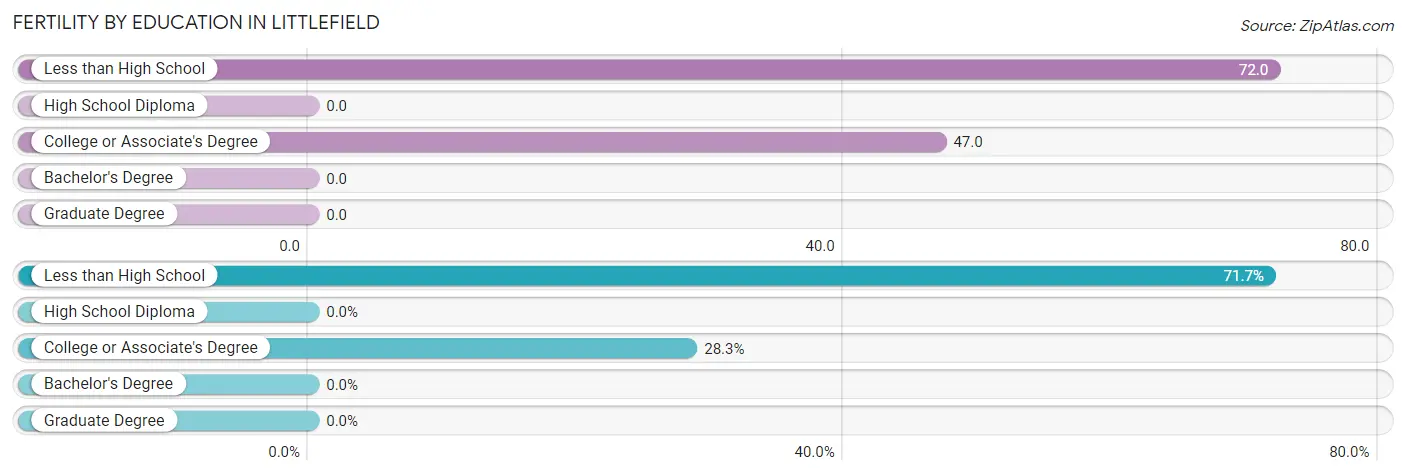
| Educational Attainment | Women with Births | Births / 1,000 Women |
| Less than High School | 43 (71.7%) | 72.0 |
| High School Diploma | 0 (0.0%) | 0.0 |
| College or Associate's Degree | 17 (28.3%) | 47.0 |
| Bachelor's Degree | 0 (0.0%) | 0.0 |
| Graduate Degree | 0 (0.0%) | 0.0 |
| Total | 60 (100.0%) | 47.0 |
Fertility by Education by Marriage Status in Littlefield
55.0% of women with births in Littlefield are unmarried. Women with the educational attainment of college or associate's degree are most likely to be married with 100.0% of them married at childbirth, while women with the educational attainment of less than high school are least likely to be married with 76.7% of them unmarried at childbirth.
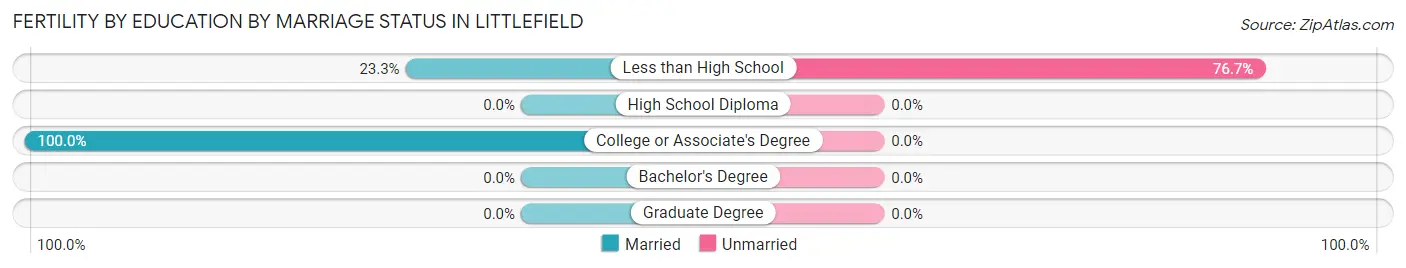
| Educational Attainment | Married | Unmarried |
| Less than High School | 10 (23.3%) | 33 (76.7%) |
| High School Diploma | 0 (0.0%) | 0 (0.0%) |
| College or Associate's Degree | 17 (100.0%) | 0 (0.0%) |
| Bachelor's Degree | 0 (0.0%) | 0 (0.0%) |
| Graduate Degree | 0 (0.0%) | 0 (0.0%) |
| Total | 27 (45.0%) | 33 (55.0%) |
Employment Characteristics in Littlefield
Employment by Class of Employer in Littlefield
Among the 2,433 employed individuals in Littlefield, private company employees (1,745 | 71.7%), local government employees (242 | 10.0%), and self-employed (not incorporated) (230 | 9.5%) make up the most common classes of employment.
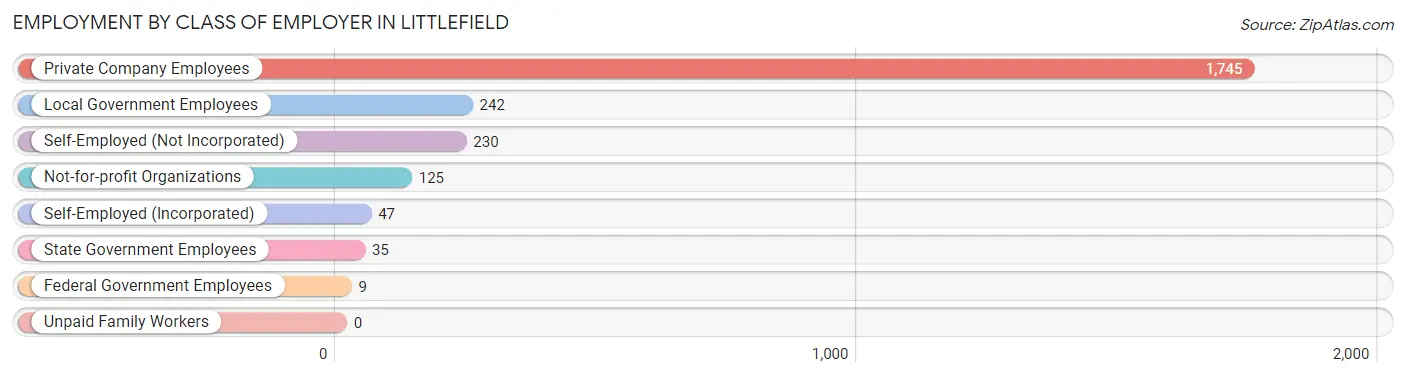
| Employer Class | # Employees | % Employees |
| Private Company Employees | 1,745 | 71.7% |
| Self-Employed (Incorporated) | 47 | 1.9% |
| Self-Employed (Not Incorporated) | 230 | 9.5% |
| Not-for-profit Organizations | 125 | 5.1% |
| Local Government Employees | 242 | 10.0% |
| State Government Employees | 35 | 1.4% |
| Federal Government Employees | 9 | 0.4% |
| Unpaid Family Workers | 0 | 0.0% |
| Total | 2,433 | 100.0% |
Employment Status by Age in Littlefield
According to the labor force statistics for Littlefield, out of the total population over 16 years of age (4,334), 59.0% or 2,557 individuals are in the labor force, with 2.4% or 61 of them unemployed. The age group with the highest labor force participation rate is 20 to 24 years, with 86.6% or 285 individuals in the labor force. Within the labor force, the 60 to 64 years age range has the highest percentage of unemployed individuals, with 9.0% or 19 of them being unemployed.
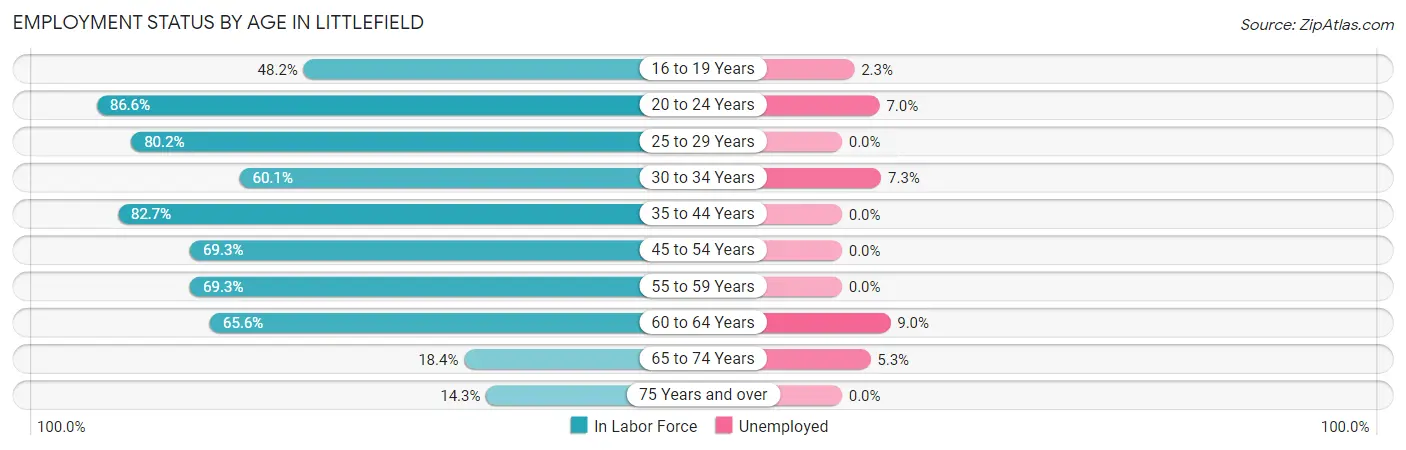
| Age Bracket | In Labor Force | Unemployed |
| 16 to 19 Years | 172 (48.2%) | 4 (2.3%) |
| 20 to 24 Years | 285 (86.6%) | 20 (7.0%) |
| 25 to 29 Years | 299 (80.2%) | 0 (0.0%) |
| 30 to 34 Years | 179 (60.1%) | 13 (7.3%) |
| 35 to 44 Years | 545 (82.7%) | 0 (0.0%) |
| 45 to 54 Years | 444 (69.3%) | 0 (0.0%) |
| 55 to 59 Years | 259 (69.3%) | 0 (0.0%) |
| 60 to 64 Years | 210 (65.6%) | 19 (9.0%) |
| 65 to 74 Years | 95 (18.4%) | 5 (5.3%) |
| 75 Years and over | 67 (14.3%) | 0 (0.0%) |
| Total | 2,557 (59.0%) | 61 (2.4%) |
Employment Status by Educational Attainment in Littlefield
According to labor force statistics for Littlefield, 72.6% of individuals (1,935) out of the total population between 25 and 64 years of age (2,665) are in the labor force, with 1.7% or 33 of them being unemployed. The group with the highest labor force participation rate are those with the educational attainment of college / associate degree, with 81.7% or 579 individuals in the labor force. Within the labor force, individuals with high school diploma education have the highest percentage of unemployment, with 2.6% or 19 of them being unemployed.
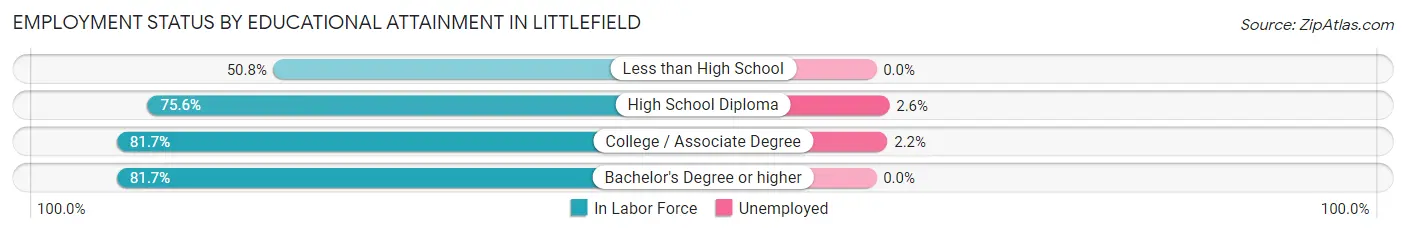
| Educational Attainment | In Labor Force | Unemployed |
| Less than High School | 298 (50.8%) | 0 (0.0%) |
| High School Diploma | 738 (75.6%) | 25 (2.6%) |
| College / Associate Degree | 579 (81.7%) | 16 (2.2%) |
| Bachelor's Degree or higher | 321 (81.7%) | 0 (0.0%) |
| Total | 1,935 (72.6%) | 45 (1.7%) |
Employment Occupations by Sex in Littlefield
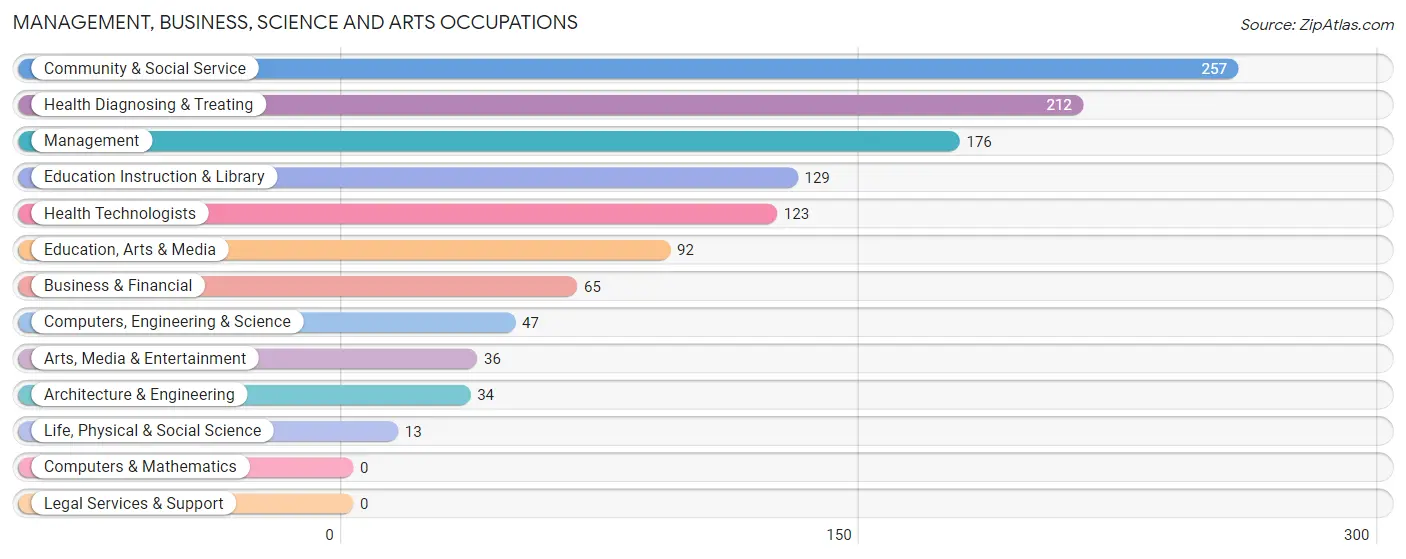
Management, Business, Science and Arts Occupations
The most common Management, Business, Science and Arts occupations in Littlefield are Community & Social Service (257 | 10.3%), Health Diagnosing & Treating (212 | 8.5%), Management (176 | 7.1%), Education Instruction & Library (129 | 5.2%), and Health Technologists (123 | 4.9%).
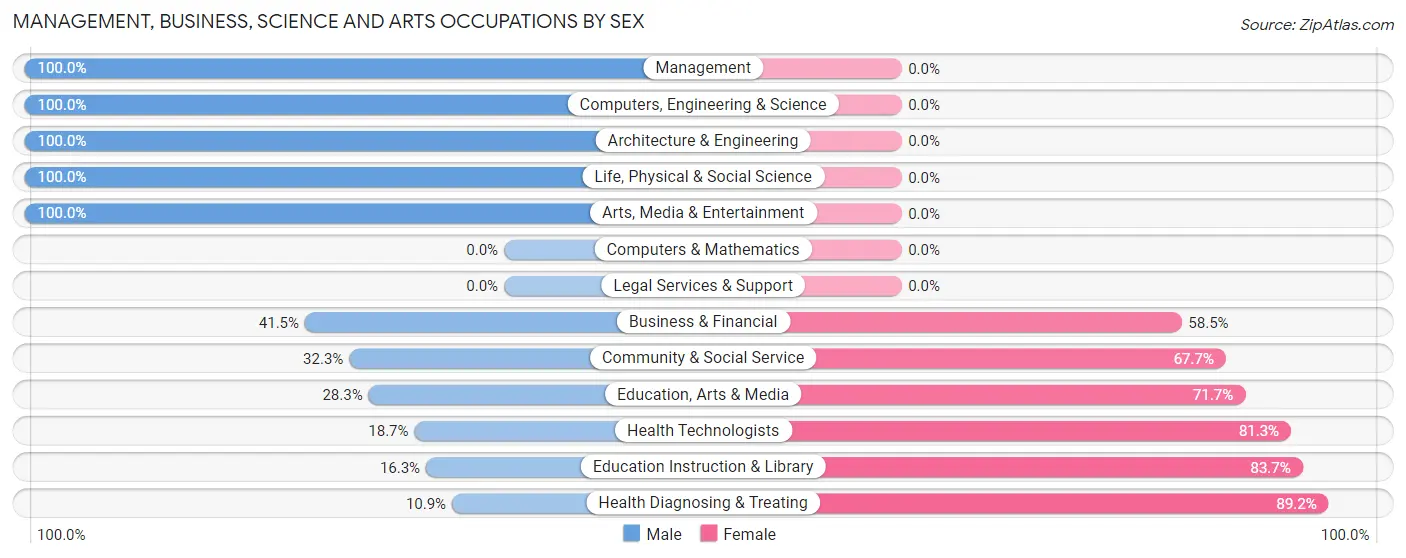
Management, Business, Science and Arts Occupations by Sex
Within the Management, Business, Science and Arts occupations in Littlefield, the most male-oriented occupations are Management (100.0%), Computers, Engineering & Science (100.0%), and Architecture & Engineering (100.0%), while the most female-oriented occupations are Health Diagnosing & Treating (89.1%), Education Instruction & Library (83.7%), and Health Technologists (81.3%).
| Occupation | Male | Female |
| Management | 176 (100.0%) | 0 (0.0%) |
| Business & Financial | 27 (41.5%) | 38 (58.5%) |
| Computers, Engineering & Science | 47 (100.0%) | 0 (0.0%) |
| Computers & Mathematics | 0 (0.0%) | 0 (0.0%) |
| Architecture & Engineering | 34 (100.0%) | 0 (0.0%) |
| Life, Physical & Social Science | 13 (100.0%) | 0 (0.0%) |
| Community & Social Service | 83 (32.3%) | 174 (67.7%) |
| Education, Arts & Media | 26 (28.3%) | 66 (71.7%) |
| Legal Services & Support | 0 (0.0%) | 0 (0.0%) |
| Education Instruction & Library | 21 (16.3%) | 108 (83.7%) |
| Arts, Media & Entertainment | 36 (100.0%) | 0 (0.0%) |
| Health Diagnosing & Treating | 23 (10.8%) | 189 (89.1%) |
| Health Technologists | 23 (18.7%) | 100 (81.3%) |
| Total (Category) | 356 (47.0%) | 401 (53.0%) |
| Total (Overall) | 1,343 (53.8%) | 1,151 (46.2%) |
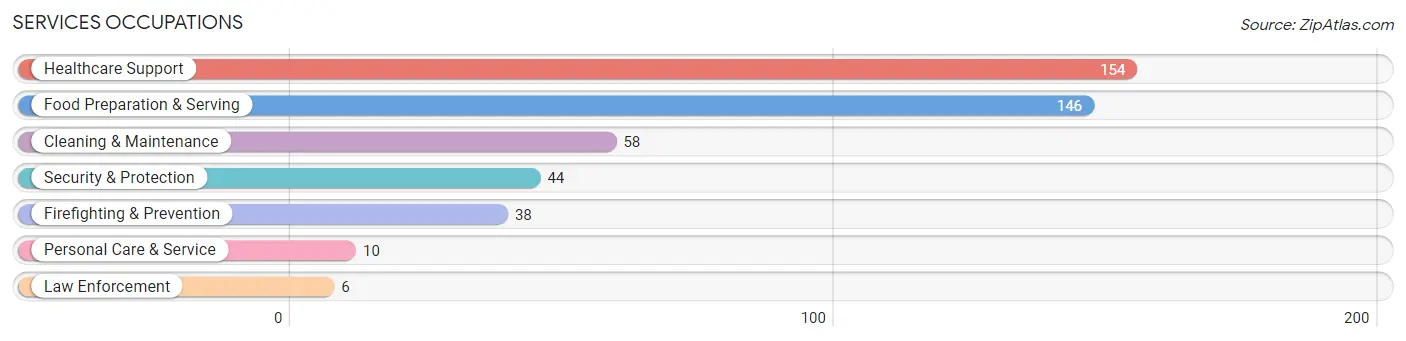
Services Occupations
The most common Services occupations in Littlefield are Healthcare Support (154 | 6.2%), Food Preparation & Serving (146 | 5.9%), Cleaning & Maintenance (58 | 2.3%), Security & Protection (44 | 1.8%), and Firefighting & Prevention (38 | 1.5%).
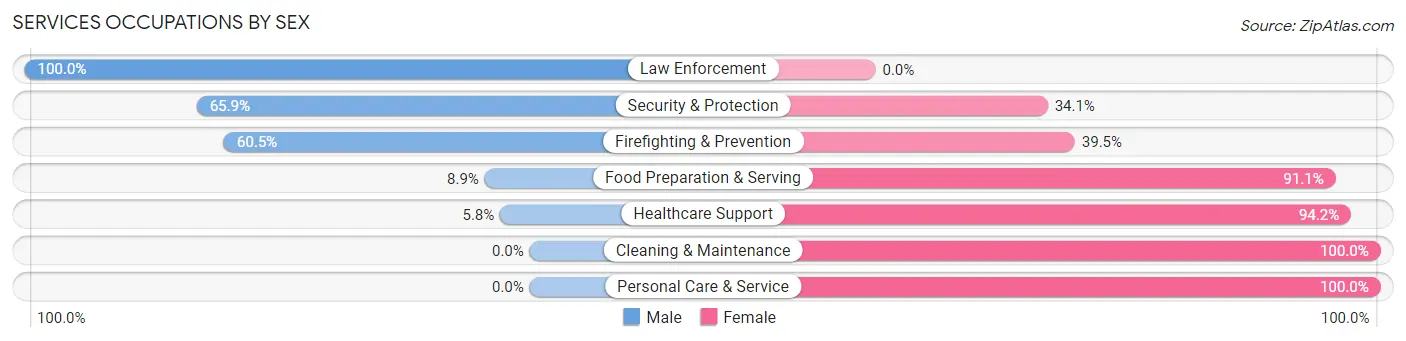
Services Occupations by Sex
Within the Services occupations in Littlefield, the most male-oriented occupations are Law Enforcement (100.0%), Security & Protection (65.9%), and Firefighting & Prevention (60.5%), while the most female-oriented occupations are Cleaning & Maintenance (100.0%), Personal Care & Service (100.0%), and Healthcare Support (94.2%).
| Occupation | Male | Female |
| Healthcare Support | 9 (5.8%) | 145 (94.2%) |
| Security & Protection | 29 (65.9%) | 15 (34.1%) |
| Firefighting & Prevention | 23 (60.5%) | 15 (39.5%) |
| Law Enforcement | 6 (100.0%) | 0 (0.0%) |
| Food Preparation & Serving | 13 (8.9%) | 133 (91.1%) |
| Cleaning & Maintenance | 0 (0.0%) | 58 (100.0%) |
| Personal Care & Service | 0 (0.0%) | 10 (100.0%) |
| Total (Category) | 51 (12.4%) | 361 (87.6%) |
| Total (Overall) | 1,343 (53.8%) | 1,151 (46.2%) |
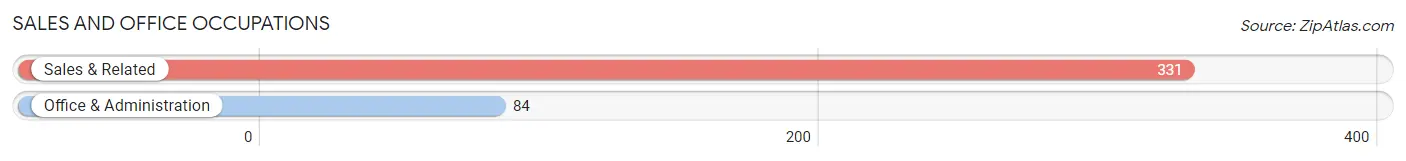
Sales and Office Occupations
The most common Sales and Office occupations in Littlefield are Sales & Related (331 | 13.3%), and Office & Administration (84 | 3.4%).
Sales and Office Occupations by Sex
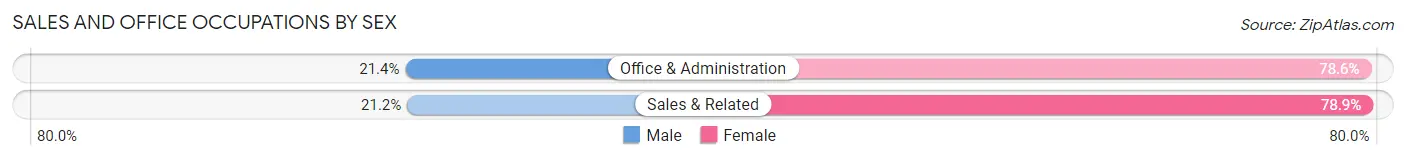
| Occupation | Male | Female |
| Sales & Related | 70 (21.1%) | 261 (78.8%) |
| Office & Administration | 18 (21.4%) | 66 (78.6%) |
| Total (Category) | 88 (21.2%) | 327 (78.8%) |
| Total (Overall) | 1,343 (53.8%) | 1,151 (46.2%) |
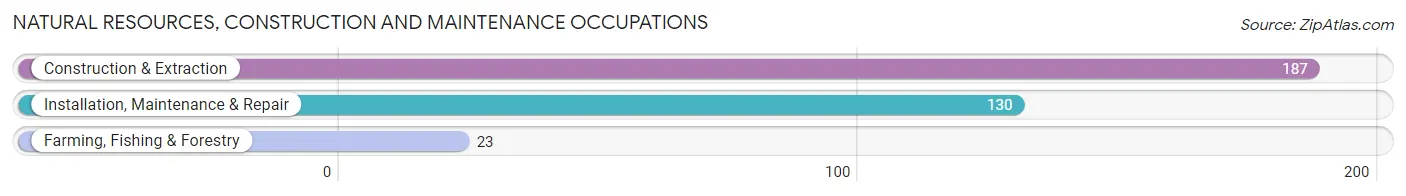
Natural Resources, Construction and Maintenance Occupations
The most common Natural Resources, Construction and Maintenance occupations in Littlefield are Construction & Extraction (187 | 7.5%), Installation, Maintenance & Repair (130 | 5.2%), and Farming, Fishing & Forestry (23 | 0.9%).
Natural Resources, Construction and Maintenance Occupations by Sex
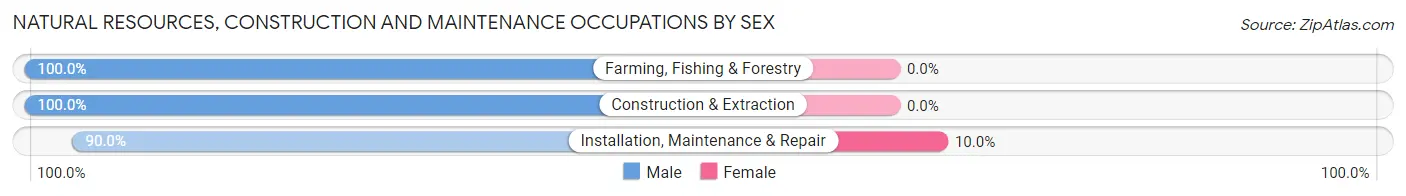
| Occupation | Male | Female |
| Farming, Fishing & Forestry | 23 (100.0%) | 0 (0.0%) |
| Construction & Extraction | 187 (100.0%) | 0 (0.0%) |
| Installation, Maintenance & Repair | 117 (90.0%) | 13 (10.0%) |
| Total (Category) | 327 (96.2%) | 13 (3.8%) |
| Total (Overall) | 1,343 (53.8%) | 1,151 (46.2%) |
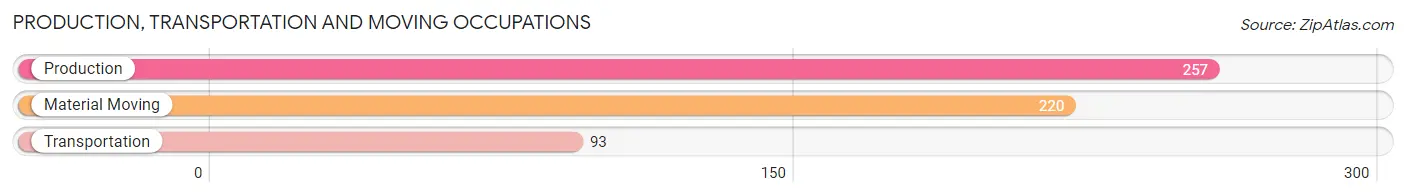
Production, Transportation and Moving Occupations
The most common Production, Transportation and Moving occupations in Littlefield are Production (257 | 10.3%), Material Moving (220 | 8.8%), and Transportation (93 | 3.7%).
Production, Transportation and Moving Occupations by Sex
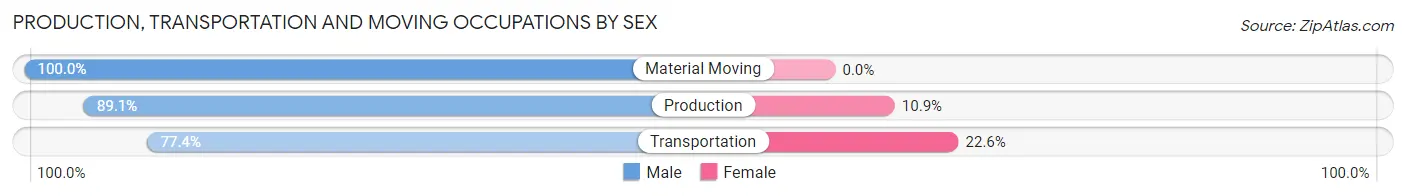
| Occupation | Male | Female |
| Production | 229 (89.1%) | 28 (10.9%) |
| Transportation | 72 (77.4%) | 21 (22.6%) |
| Material Moving | 220 (100.0%) | 0 (0.0%) |
| Total (Category) | 521 (91.4%) | 49 (8.6%) |
| Total (Overall) | 1,343 (53.8%) | 1,151 (46.2%) |
Employment Industries by Sex in Littlefield
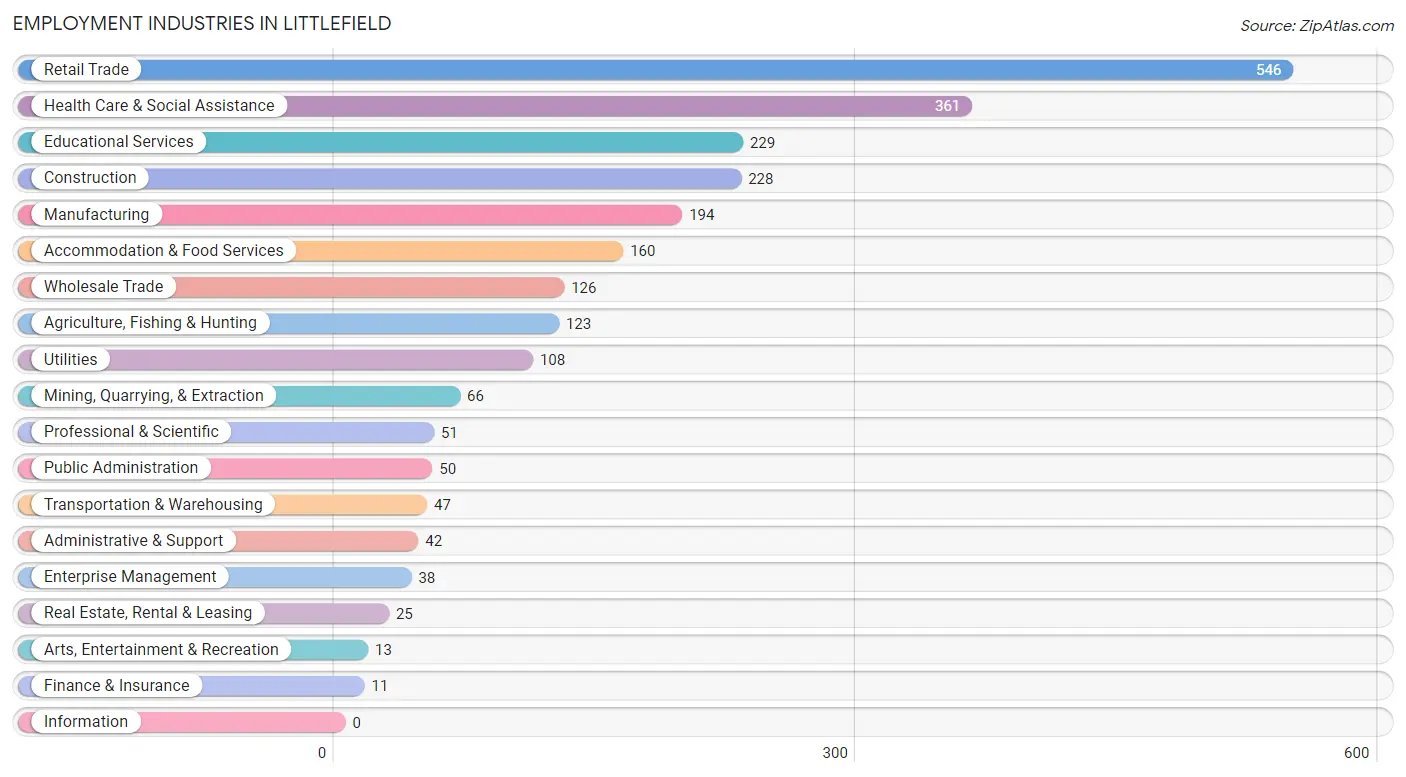
Employment Industries in Littlefield
The major employment industries in Littlefield include Retail Trade (546 | 21.9%), Health Care & Social Assistance (361 | 14.5%), Educational Services (229 | 9.2%), Construction (228 | 9.1%), and Manufacturing (194 | 7.8%).
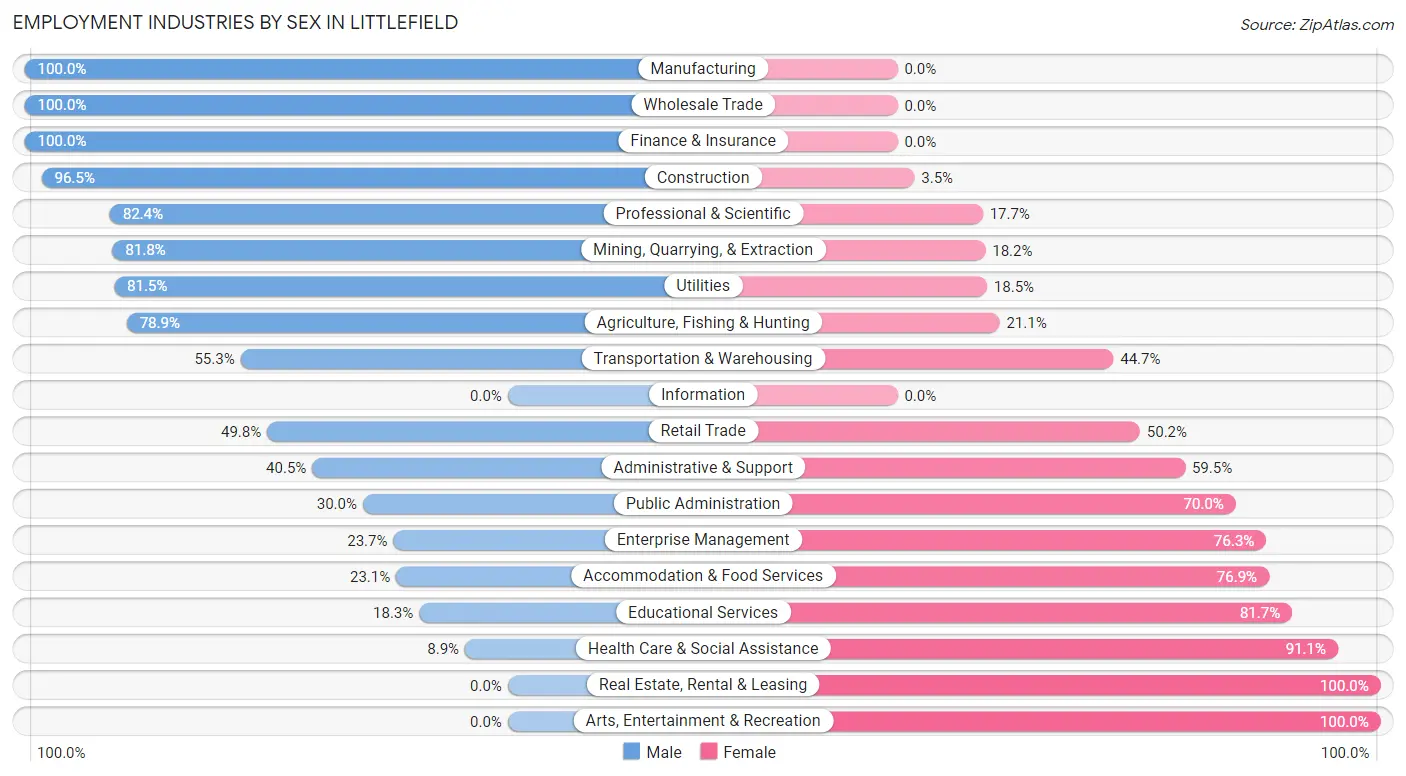
Employment Industries by Sex in Littlefield
The Littlefield industries that see more men than women are Manufacturing (100.0%), Wholesale Trade (100.0%), and Finance & Insurance (100.0%), whereas the industries that tend to have a higher number of women are Real Estate, Rental & Leasing (100.0%), Arts, Entertainment & Recreation (100.0%), and Health Care & Social Assistance (91.1%).
| Industry | Male | Female |
| Agriculture, Fishing & Hunting | 97 (78.9%) | 26 (21.1%) |
| Mining, Quarrying, & Extraction | 54 (81.8%) | 12 (18.2%) |
| Construction | 220 (96.5%) | 8 (3.5%) |
| Manufacturing | 194 (100.0%) | 0 (0.0%) |
| Wholesale Trade | 126 (100.0%) | 0 (0.0%) |
| Retail Trade | 272 (49.8%) | 274 (50.2%) |
| Transportation & Warehousing | 26 (55.3%) | 21 (44.7%) |
| Utilities | 88 (81.5%) | 20 (18.5%) |
| Information | 0 (0.0%) | 0 (0.0%) |
| Finance & Insurance | 11 (100.0%) | 0 (0.0%) |
| Real Estate, Rental & Leasing | 0 (0.0%) | 25 (100.0%) |
| Professional & Scientific | 42 (82.4%) | 9 (17.6%) |
| Enterprise Management | 9 (23.7%) | 29 (76.3%) |
| Administrative & Support | 17 (40.5%) | 25 (59.5%) |
| Educational Services | 42 (18.3%) | 187 (81.7%) |
| Health Care & Social Assistance | 32 (8.9%) | 329 (91.1%) |
| Arts, Entertainment & Recreation | 0 (0.0%) | 13 (100.0%) |
| Accommodation & Food Services | 37 (23.1%) | 123 (76.9%) |
| Public Administration | 15 (30.0%) | 35 (70.0%) |
| Total | 1,343 (53.8%) | 1,151 (46.2%) |
Education in Littlefield
School Enrollment in Littlefield
The most common levels of schooling among the 1,494 students in Littlefield are elementary school (513 | 34.3%), middle school (386 | 25.8%), and high school (333 | 22.3%).
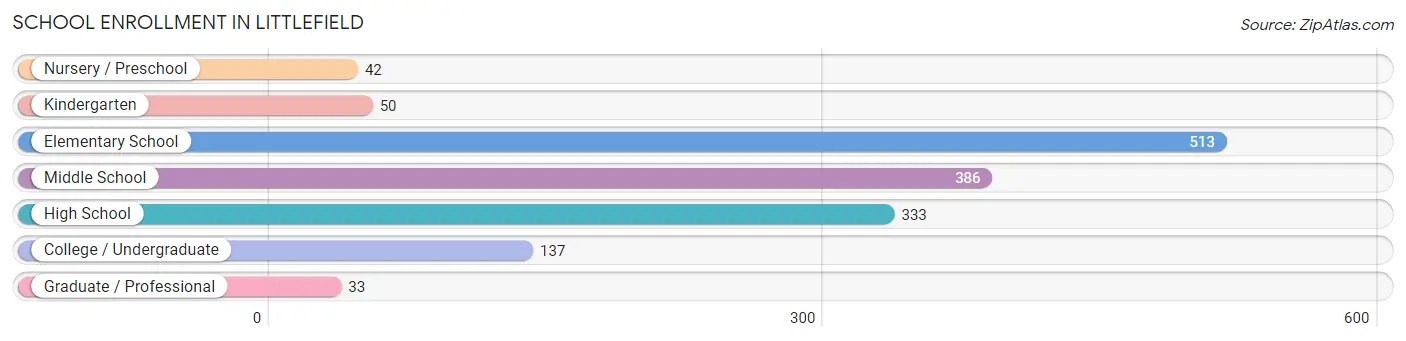
| School Level | # Students | % Students |
| Nursery / Preschool | 42 | 2.8% |
| Kindergarten | 50 | 3.4% |
| Elementary School | 513 | 34.3% |
| Middle School | 386 | 25.8% |
| High School | 333 | 22.3% |
| College / Undergraduate | 137 | 9.2% |
| Graduate / Professional | 33 | 2.2% |
| Total | 1,494 | 100.0% |
School Enrollment by Age by Funding Source in Littlefield
Out of a total of 1,494 students who are enrolled in schools in Littlefield, 105 (7.0%) attend a private institution, while the remaining 1,389 (93.0%) are enrolled in public schools. The age group of 25 to 34 year olds has the highest likelihood of being enrolled in private schools, with 6 (30.0% in the age bracket) enrolled. Conversely, the age group of 3 to 4 year olds has the lowest likelihood of being enrolled in a private school, with 23 (100.0% in the age bracket) attending a public institution.
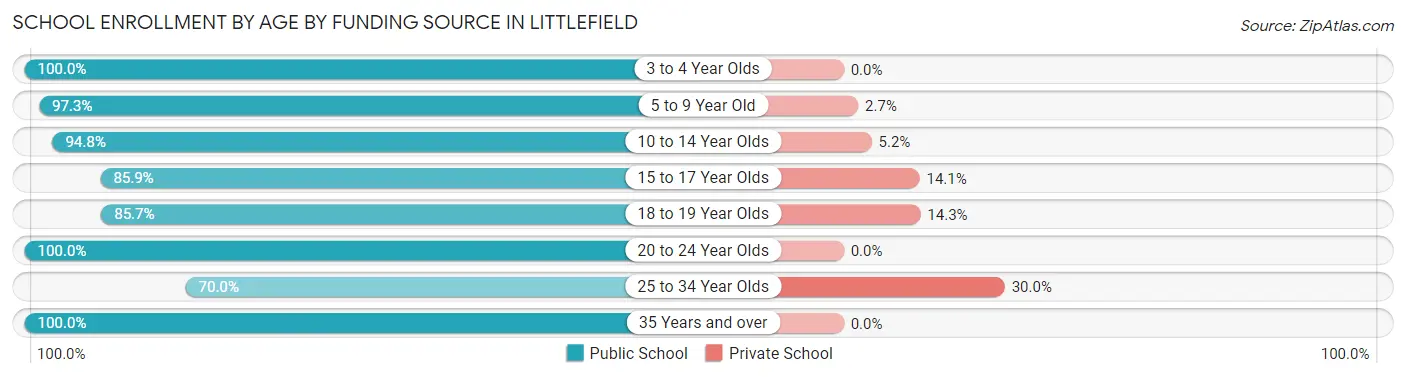
| Age Bracket | Public School | Private School |
| 3 to 4 Year Olds | 23 (100.0%) | 0 (0.0%) |
| 5 to 9 Year Old | 505 (97.3%) | 14 (2.7%) |
| 10 to 14 Year Olds | 401 (94.8%) | 22 (5.2%) |
| 15 to 17 Year Olds | 243 (85.9%) | 40 (14.1%) |
| 18 to 19 Year Olds | 138 (85.7%) | 23 (14.3%) |
| 20 to 24 Year Olds | 38 (100.0%) | 0 (0.0%) |
| 25 to 34 Year Olds | 14 (70.0%) | 6 (30.0%) |
| 35 Years and over | 27 (100.0%) | 0 (0.0%) |
| Total | 1,389 (93.0%) | 105 (7.0%) |
Educational Attainment by Field of Study in Littlefield
Business (120 | 27.0%), education (102 | 23.0%), liberal arts & history (87 | 19.6%), science & technology (59 | 13.3%), and bio, nature & agricultural (27 | 6.1%) are the most common fields of study among 444 individuals in Littlefield who have obtained a bachelor's degree or higher.
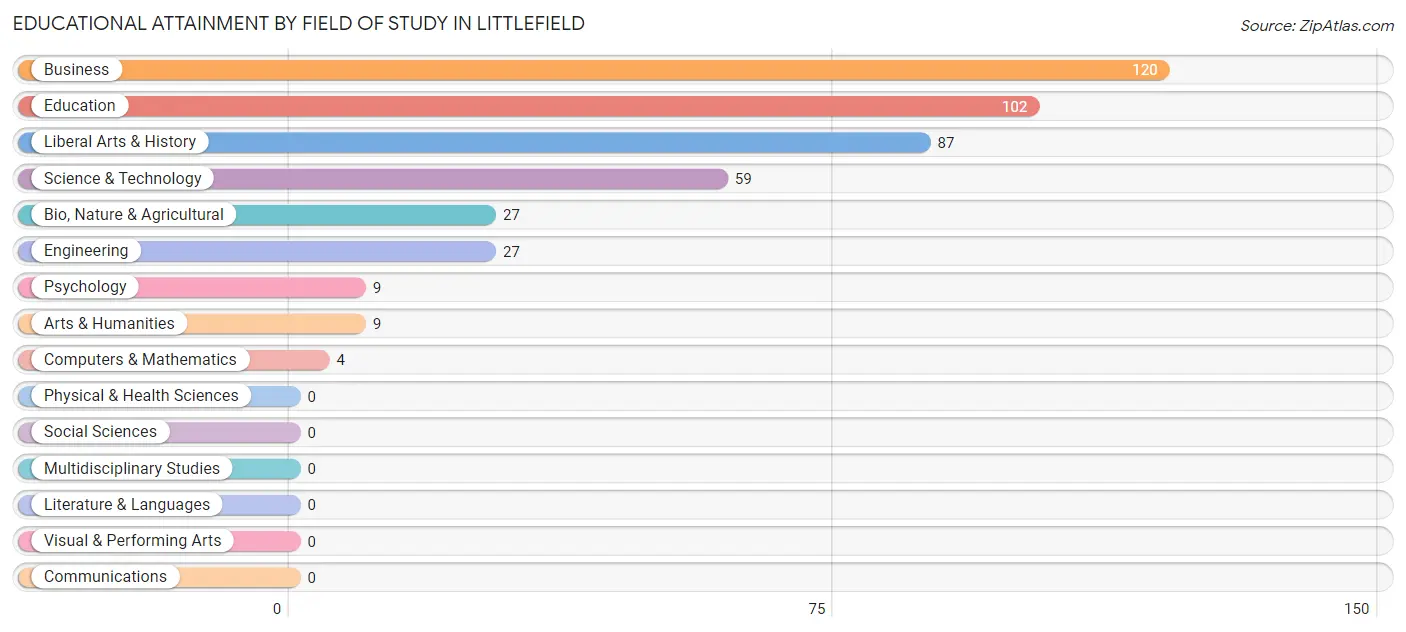
| Field of Study | # Graduates | % Graduates |
| Computers & Mathematics | 4 | 0.9% |
| Bio, Nature & Agricultural | 27 | 6.1% |
| Physical & Health Sciences | 0 | 0.0% |
| Psychology | 9 | 2.0% |
| Social Sciences | 0 | 0.0% |
| Engineering | 27 | 6.1% |
| Multidisciplinary Studies | 0 | 0.0% |
| Science & Technology | 59 | 13.3% |
| Business | 120 | 27.0% |
| Education | 102 | 23.0% |
| Literature & Languages | 0 | 0.0% |
| Liberal Arts & History | 87 | 19.6% |
| Visual & Performing Arts | 0 | 0.0% |
| Communications | 0 | 0.0% |
| Arts & Humanities | 9 | 2.0% |
| Total | 444 | 100.0% |
Transportation & Commute in Littlefield
Vehicle Availability by Sex in Littlefield
The most prevalent vehicle ownership categories in Littlefield are males with 2 vehicles (616, accounting for 46.9%) and females with 2 vehicles (464, making up 55.0%).
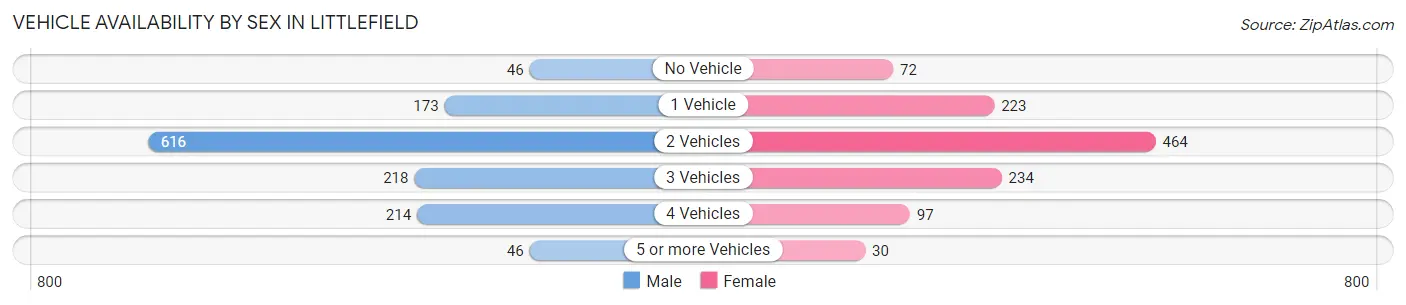
| Vehicles Available | Male | Female |
| No Vehicle | 46 (3.5%) | 72 (6.4%) |
| 1 Vehicle | 173 (13.2%) | 223 (19.9%) |
| 2 Vehicles | 616 (46.9%) | 464 (41.4%) |
| 3 Vehicles | 218 (16.6%) | 234 (20.9%) |
| 4 Vehicles | 214 (16.3%) | 97 (8.7%) |
| 5 or more Vehicles | 46 (3.5%) | 30 (2.7%) |
| Total | 1,313 (100.0%) | 1,120 (100.0%) |
Commute Time in Littlefield
The most frequently occuring commute durations in Littlefield are 5 to 9 minutes (814 commuters, 34.5%), less than 5 minutes (382 commuters, 16.2%), and 10 to 14 minutes (348 commuters, 14.7%).
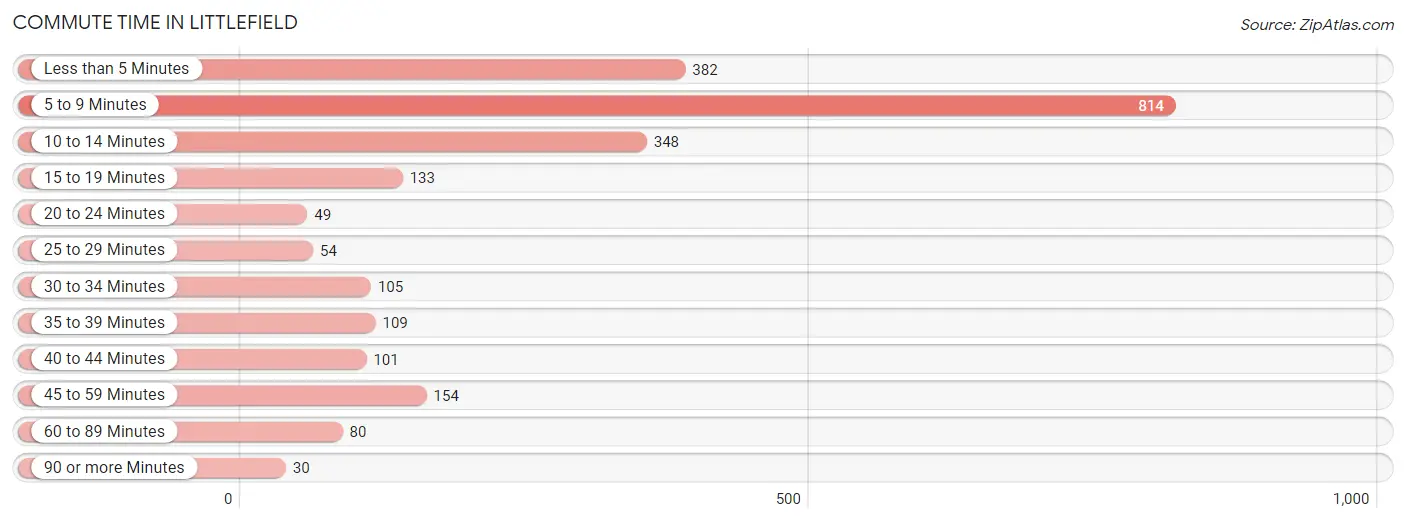
| Commute Time | # Commuters | % Commuters |
| Less than 5 Minutes | 382 | 16.2% |
| 5 to 9 Minutes | 814 | 34.5% |
| 10 to 14 Minutes | 348 | 14.7% |
| 15 to 19 Minutes | 133 | 5.6% |
| 20 to 24 Minutes | 49 | 2.1% |
| 25 to 29 Minutes | 54 | 2.3% |
| 30 to 34 Minutes | 105 | 4.4% |
| 35 to 39 Minutes | 109 | 4.6% |
| 40 to 44 Minutes | 101 | 4.3% |
| 45 to 59 Minutes | 154 | 6.5% |
| 60 to 89 Minutes | 80 | 3.4% |
| 90 or more Minutes | 30 | 1.3% |
Commute Time by Sex in Littlefield
The most common commute times in Littlefield are 5 to 9 minutes (429 commuters, 33.2%) for males and 5 to 9 minutes (385 commuters, 36.0%) for females.
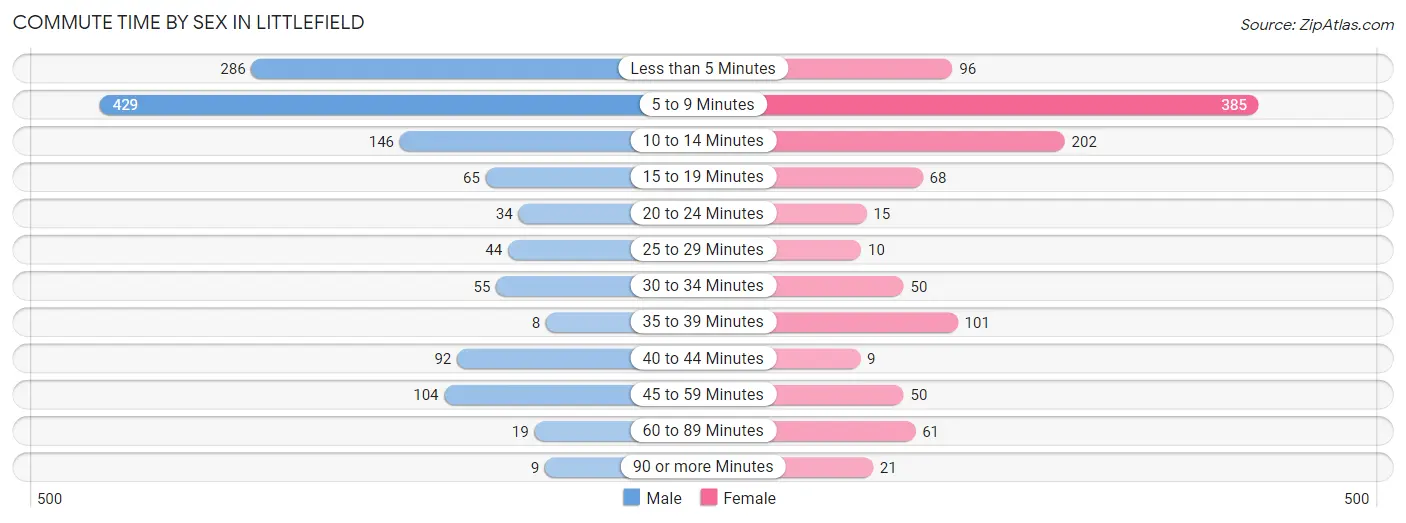
| Commute Time | Male | Female |
| Less than 5 Minutes | 286 (22.2%) | 96 (9.0%) |
| 5 to 9 Minutes | 429 (33.2%) | 385 (36.0%) |
| 10 to 14 Minutes | 146 (11.3%) | 202 (18.9%) |
| 15 to 19 Minutes | 65 (5.0%) | 68 (6.4%) |
| 20 to 24 Minutes | 34 (2.6%) | 15 (1.4%) |
| 25 to 29 Minutes | 44 (3.4%) | 10 (0.9%) |
| 30 to 34 Minutes | 55 (4.3%) | 50 (4.7%) |
| 35 to 39 Minutes | 8 (0.6%) | 101 (9.5%) |
| 40 to 44 Minutes | 92 (7.1%) | 9 (0.8%) |
| 45 to 59 Minutes | 104 (8.1%) | 50 (4.7%) |
| 60 to 89 Minutes | 19 (1.5%) | 61 (5.7%) |
| 90 or more Minutes | 9 (0.7%) | 21 (2.0%) |
Time of Departure to Work by Sex in Littlefield
The most frequent times of departure to work in Littlefield are 5:00 AM to 5:29 AM (235, 18.2%) for males and 7:00 AM to 7:29 AM (170, 15.9%) for females.
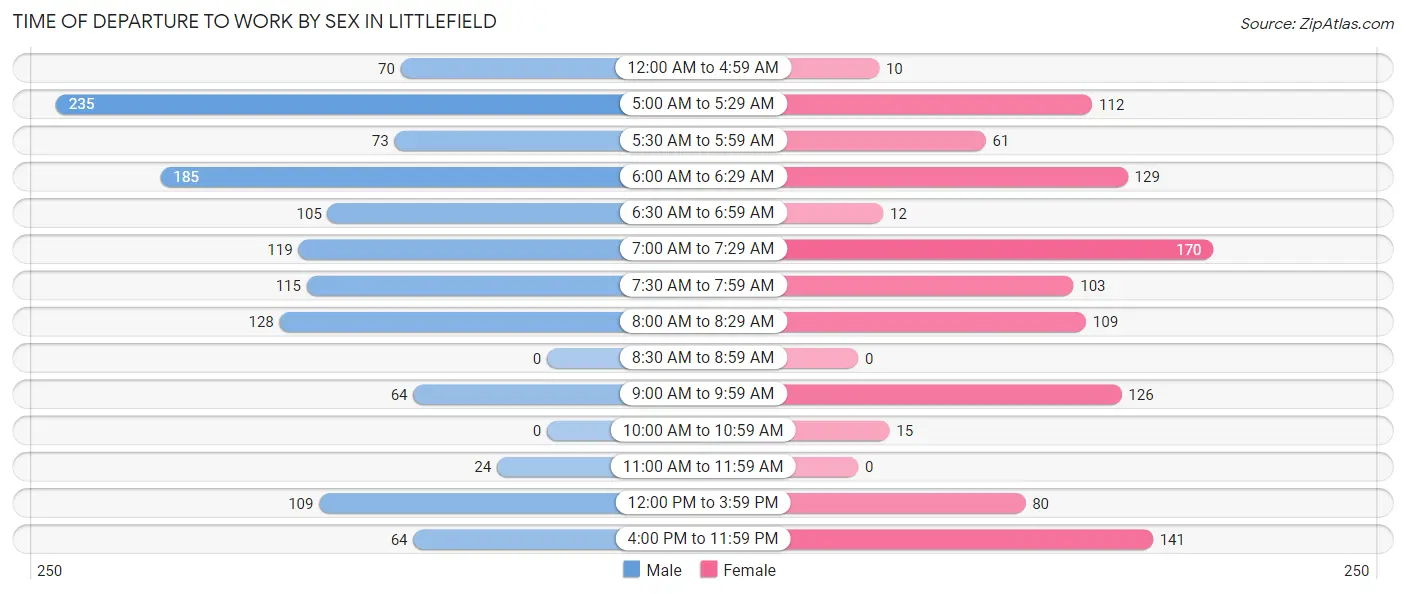
| Time of Departure | Male | Female |
| 12:00 AM to 4:59 AM | 70 (5.4%) | 10 (0.9%) |
| 5:00 AM to 5:29 AM | 235 (18.2%) | 112 (10.5%) |
| 5:30 AM to 5:59 AM | 73 (5.7%) | 61 (5.7%) |
| 6:00 AM to 6:29 AM | 185 (14.3%) | 129 (12.1%) |
| 6:30 AM to 6:59 AM | 105 (8.1%) | 12 (1.1%) |
| 7:00 AM to 7:29 AM | 119 (9.2%) | 170 (15.9%) |
| 7:30 AM to 7:59 AM | 115 (8.9%) | 103 (9.6%) |
| 8:00 AM to 8:29 AM | 128 (9.9%) | 109 (10.2%) |
| 8:30 AM to 8:59 AM | 0 (0.0%) | 0 (0.0%) |
| 9:00 AM to 9:59 AM | 64 (5.0%) | 126 (11.8%) |
| 10:00 AM to 10:59 AM | 0 (0.0%) | 15 (1.4%) |
| 11:00 AM to 11:59 AM | 24 (1.9%) | 0 (0.0%) |
| 12:00 PM to 3:59 PM | 109 (8.4%) | 80 (7.5%) |
| 4:00 PM to 11:59 PM | 64 (5.0%) | 141 (13.2%) |
| Total | 1,291 (100.0%) | 1,068 (100.0%) |
Housing Occupancy in Littlefield
Occupancy by Ownership in Littlefield
Of the total 2,146 dwellings in Littlefield, owner-occupied units account for 1,451 (67.6%), while renter-occupied units make up 695 (32.4%).
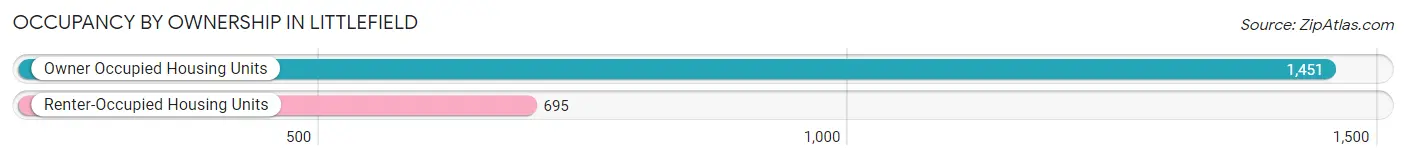
| Occupancy | # Housing Units | % Housing Units |
| Owner Occupied Housing Units | 1,451 | 67.6% |
| Renter-Occupied Housing Units | 695 | 32.4% |
| Total Occupied Housing Units | 2,146 | 100.0% |
Occupancy by Household Size in Littlefield
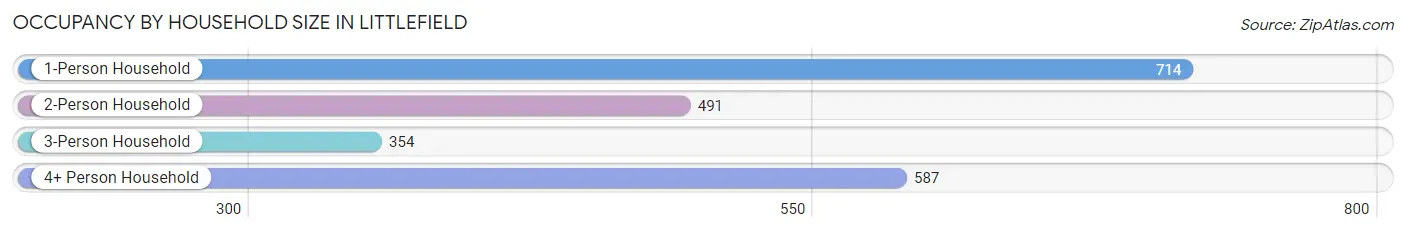
| Household Size | # Housing Units | % Housing Units |
| 1-Person Household | 714 | 33.3% |
| 2-Person Household | 491 | 22.9% |
| 3-Person Household | 354 | 16.5% |
| 4+ Person Household | 587 | 27.4% |
| Total Housing Units | 2,146 | 100.0% |
Occupancy by Ownership by Household Size in Littlefield
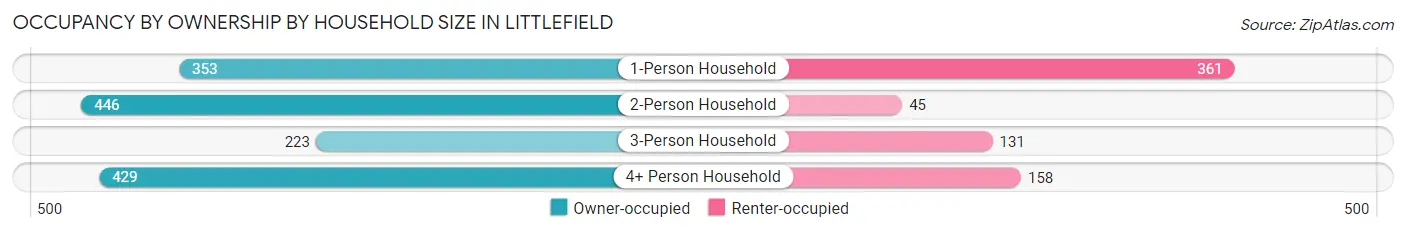
| Household Size | Owner-occupied | Renter-occupied |
| 1-Person Household | 353 (49.4%) | 361 (50.6%) |
| 2-Person Household | 446 (90.8%) | 45 (9.2%) |
| 3-Person Household | 223 (63.0%) | 131 (37.0%) |
| 4+ Person Household | 429 (73.1%) | 158 (26.9%) |
| Total Housing Units | 1,451 (67.6%) | 695 (32.4%) |
Occupancy by Educational Attainment in Littlefield
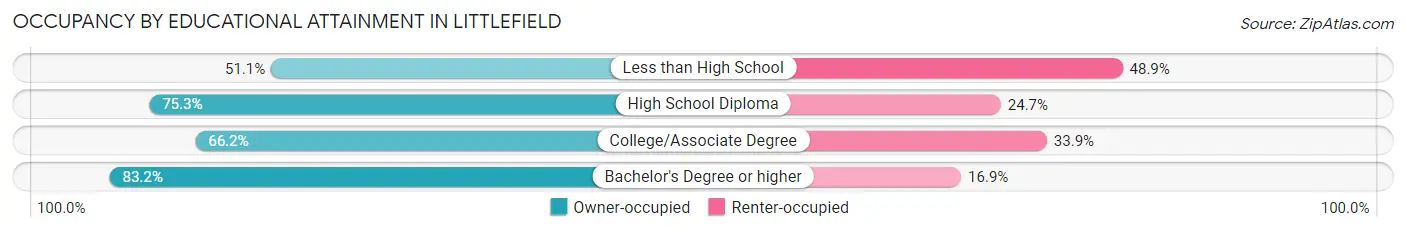
| Household Size | Owner-occupied | Renter-occupied |
| Less than High School | 269 (51.1%) | 257 (48.9%) |
| High School Diploma | 536 (75.3%) | 176 (24.7%) |
| College/Associate Degree | 424 (66.1%) | 217 (33.9%) |
| Bachelor's Degree or higher | 222 (83.2%) | 45 (16.9%) |
Occupancy by Age of Householder in Littlefield
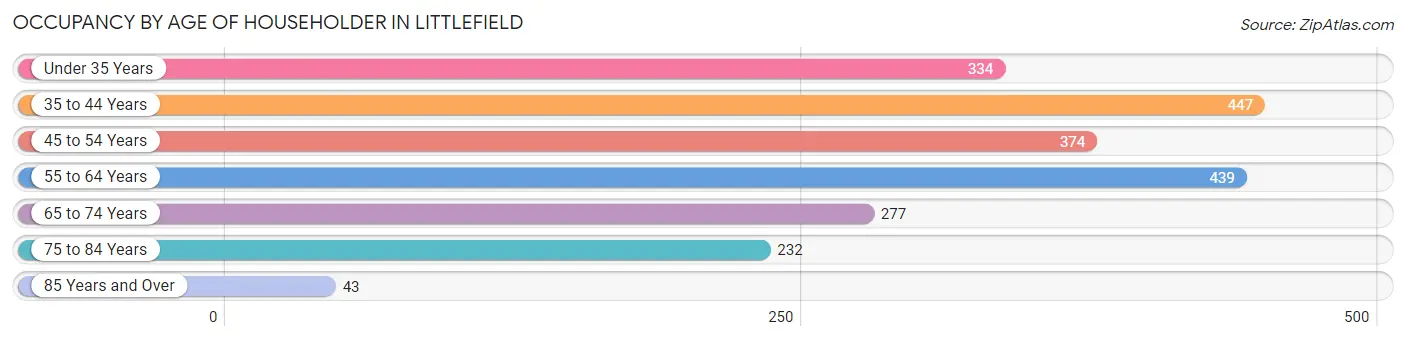
| Age Bracket | # Households | % Households |
| Under 35 Years | 334 | 15.6% |
| 35 to 44 Years | 447 | 20.8% |
| 45 to 54 Years | 374 | 17.4% |
| 55 to 64 Years | 439 | 20.5% |
| 65 to 74 Years | 277 | 12.9% |
| 75 to 84 Years | 232 | 10.8% |
| 85 Years and Over | 43 | 2.0% |
| Total | 2,146 | 100.0% |
Housing Finances in Littlefield
Median Income by Occupancy in Littlefield
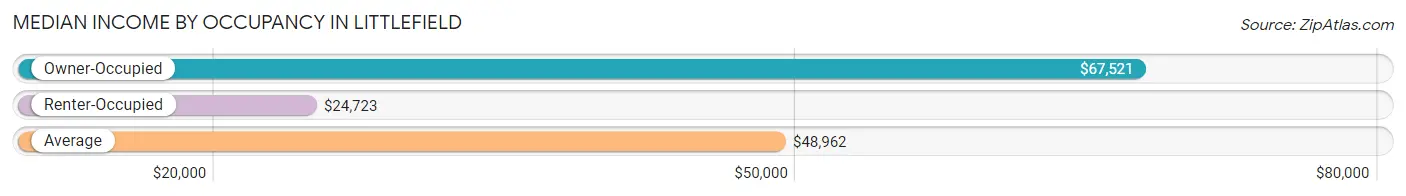
| Occupancy Type | # Households | Median Income |
| Owner-Occupied | 1,451 (67.6%) | $67,521 |
| Renter-Occupied | 695 (32.4%) | $24,723 |
| Average | 2,146 (100.0%) | $48,962 |
Occupancy by Householder Income Bracket in Littlefield
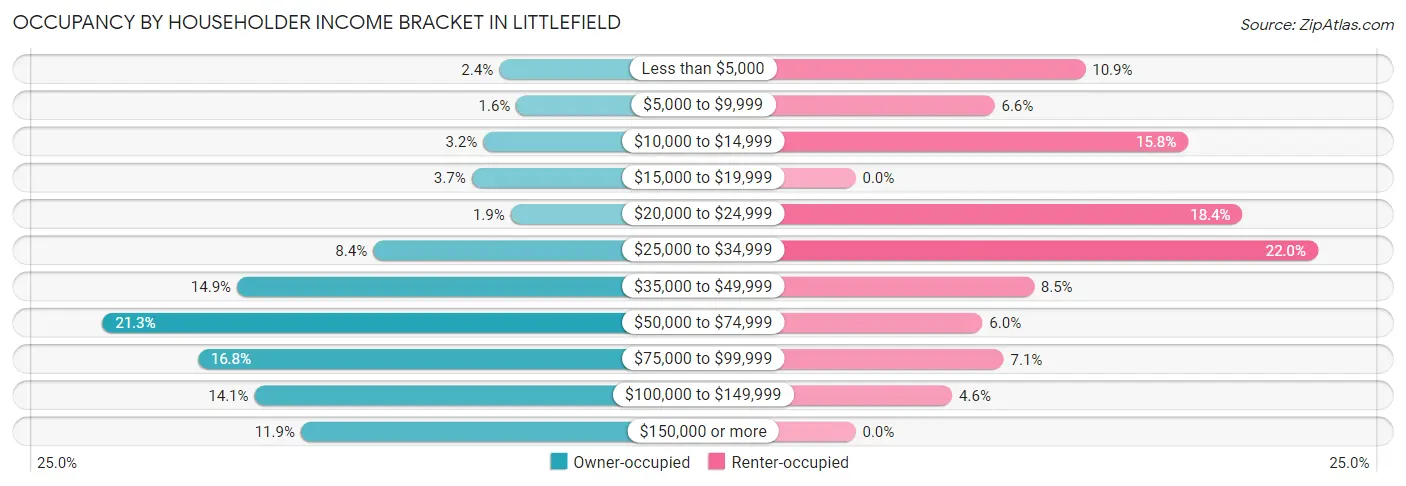
| Income Bracket | Owner-occupied | Renter-occupied |
| Less than $5,000 | 35 (2.4%) | 76 (10.9%) |
| $5,000 to $9,999 | 23 (1.6%) | 46 (6.6%) |
| $10,000 to $14,999 | 46 (3.2%) | 110 (15.8%) |
| $15,000 to $19,999 | 54 (3.7%) | 0 (0.0%) |
| $20,000 to $24,999 | 27 (1.9%) | 128 (18.4%) |
| $25,000 to $34,999 | 122 (8.4%) | 153 (22.0%) |
| $35,000 to $49,999 | 216 (14.9%) | 59 (8.5%) |
| $50,000 to $74,999 | 309 (21.3%) | 42 (6.0%) |
| $75,000 to $99,999 | 243 (16.8%) | 49 (7.0%) |
| $100,000 to $149,999 | 204 (14.1%) | 32 (4.6%) |
| $150,000 or more | 172 (11.8%) | 0 (0.0%) |
| Total | 1,451 (100.0%) | 695 (100.0%) |
Monthly Housing Cost Tiers in Littlefield
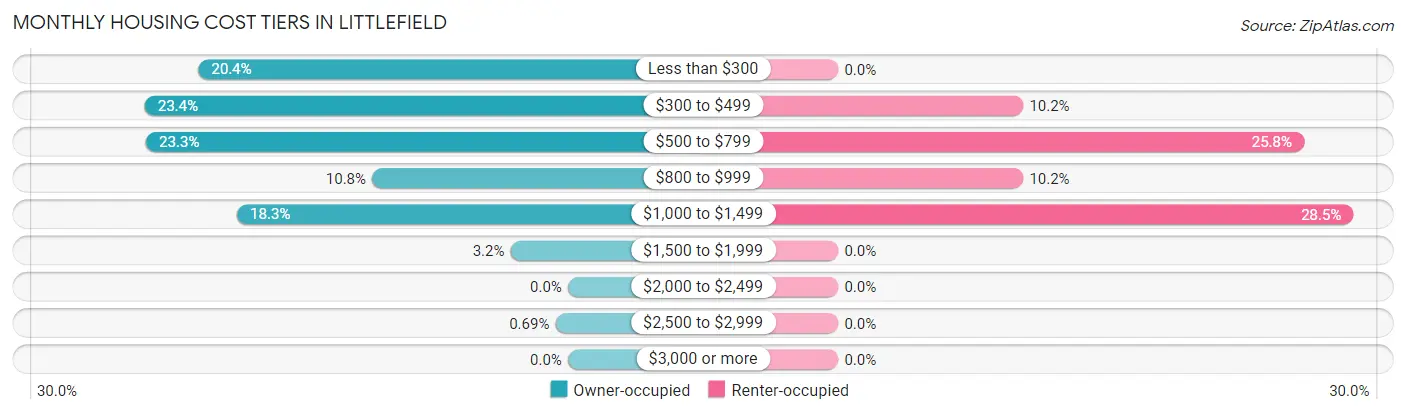
| Monthly Cost | Owner-occupied | Renter-occupied |
| Less than $300 | 296 (20.4%) | 0 (0.0%) |
| $300 to $499 | 339 (23.4%) | 71 (10.2%) |
| $500 to $799 | 338 (23.3%) | 179 (25.8%) |
| $800 to $999 | 157 (10.8%) | 71 (10.2%) |
| $1,000 to $1,499 | 265 (18.3%) | 198 (28.5%) |
| $1,500 to $1,999 | 46 (3.2%) | 0 (0.0%) |
| $2,000 to $2,499 | 0 (0.0%) | 0 (0.0%) |
| $2,500 to $2,999 | 10 (0.7%) | 0 (0.0%) |
| $3,000 or more | 0 (0.0%) | 0 (0.0%) |
| Total | 1,451 (100.0%) | 695 (100.0%) |
Physical Housing Characteristics in Littlefield
Housing Structures in Littlefield
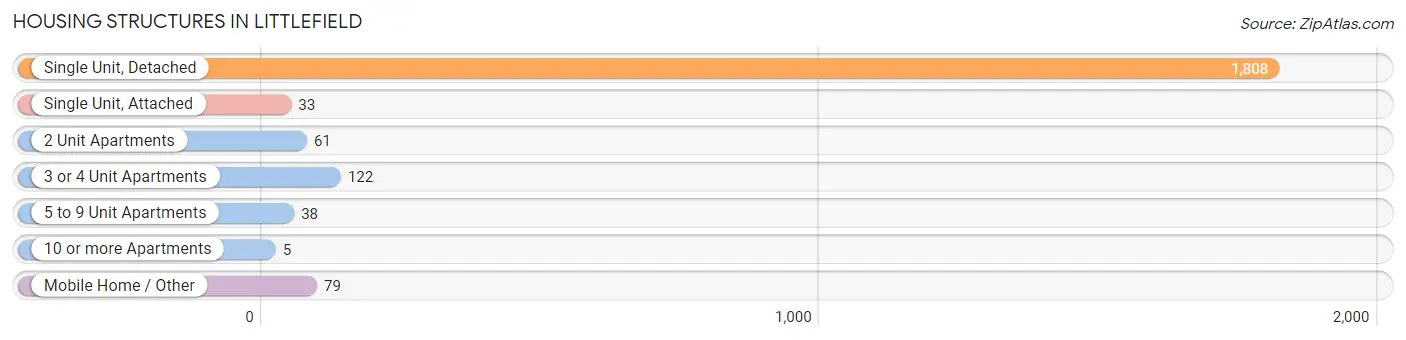
| Structure Type | # Housing Units | % Housing Units |
| Single Unit, Detached | 1,808 | 84.3% |
| Single Unit, Attached | 33 | 1.5% |
| 2 Unit Apartments | 61 | 2.8% |
| 3 or 4 Unit Apartments | 122 | 5.7% |
| 5 to 9 Unit Apartments | 38 | 1.8% |
| 10 or more Apartments | 5 | 0.2% |
| Mobile Home / Other | 79 | 3.7% |
| Total | 2,146 | 100.0% |
Housing Structures by Occupancy in Littlefield
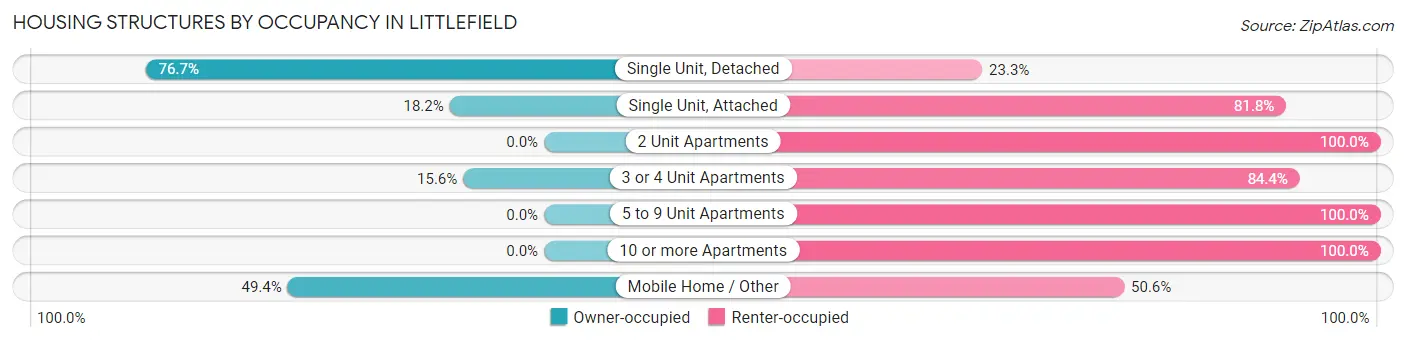
| Structure Type | Owner-occupied | Renter-occupied |
| Single Unit, Detached | 1,387 (76.7%) | 421 (23.3%) |
| Single Unit, Attached | 6 (18.2%) | 27 (81.8%) |
| 2 Unit Apartments | 0 (0.0%) | 61 (100.0%) |
| 3 or 4 Unit Apartments | 19 (15.6%) | 103 (84.4%) |
| 5 to 9 Unit Apartments | 0 (0.0%) | 38 (100.0%) |
| 10 or more Apartments | 0 (0.0%) | 5 (100.0%) |
| Mobile Home / Other | 39 (49.4%) | 40 (50.6%) |
| Total | 1,451 (67.6%) | 695 (32.4%) |
Housing Structures by Number of Rooms in Littlefield
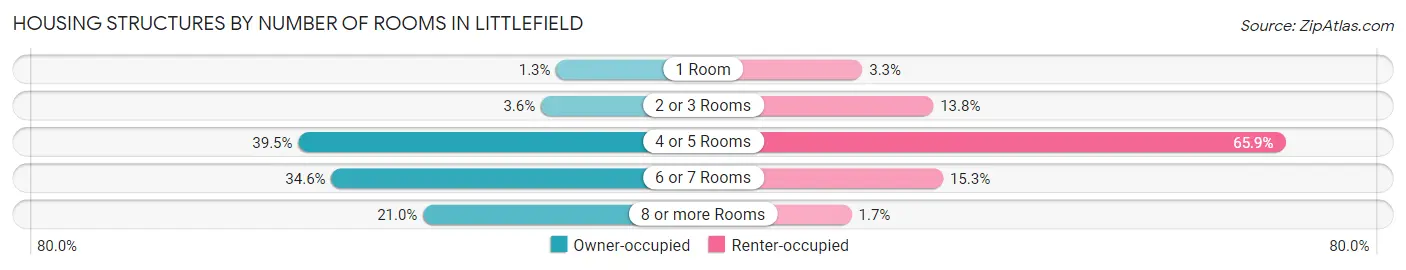
| Number of Rooms | Owner-occupied | Renter-occupied |
| 1 Room | 19 (1.3%) | 23 (3.3%) |
| 2 or 3 Rooms | 52 (3.6%) | 96 (13.8%) |
| 4 or 5 Rooms | 573 (39.5%) | 458 (65.9%) |
| 6 or 7 Rooms | 502 (34.6%) | 106 (15.2%) |
| 8 or more Rooms | 305 (21.0%) | 12 (1.7%) |
| Total | 1,451 (100.0%) | 695 (100.0%) |
Housing Structure by Heating Type in Littlefield
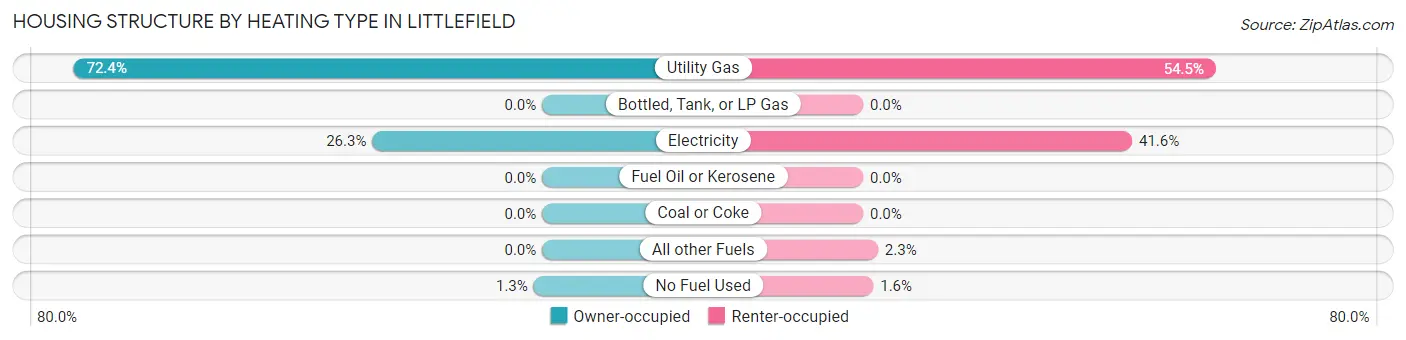
| Heating Type | Owner-occupied | Renter-occupied |
| Utility Gas | 1,051 (72.4%) | 379 (54.5%) |
| Bottled, Tank, or LP Gas | 0 (0.0%) | 0 (0.0%) |
| Electricity | 381 (26.3%) | 289 (41.6%) |
| Fuel Oil or Kerosene | 0 (0.0%) | 0 (0.0%) |
| Coal or Coke | 0 (0.0%) | 0 (0.0%) |
| All other Fuels | 0 (0.0%) | 16 (2.3%) |
| No Fuel Used | 19 (1.3%) | 11 (1.6%) |
| Total | 1,451 (100.0%) | 695 (100.0%) |
Household Vehicle Usage in Littlefield
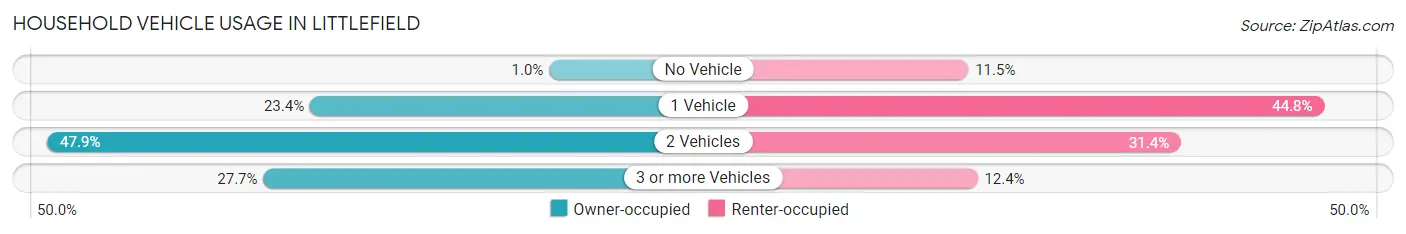
| Vehicles per Household | Owner-occupied | Renter-occupied |
| No Vehicle | 15 (1.0%) | 80 (11.5%) |
| 1 Vehicle | 339 (23.4%) | 311 (44.8%) |
| 2 Vehicles | 695 (47.9%) | 218 (31.4%) |
| 3 or more Vehicles | 402 (27.7%) | 86 (12.4%) |
| Total | 1,451 (100.0%) | 695 (100.0%) |
Real Estate & Mortgages in Littlefield
Real Estate and Mortgage Overview in Littlefield
| Characteristic | Without Mortgage | With Mortgage |
| Housing Units | 959 | 492 |
| Median Property Value | $64,900 | $120,900 |
| Median Household Income | $53,375 | $64 |
| Monthly Housing Costs | $399 | $0 |
| Real Estate Taxes | $580 | $41 |
Property Value by Mortgage Status in Littlefield
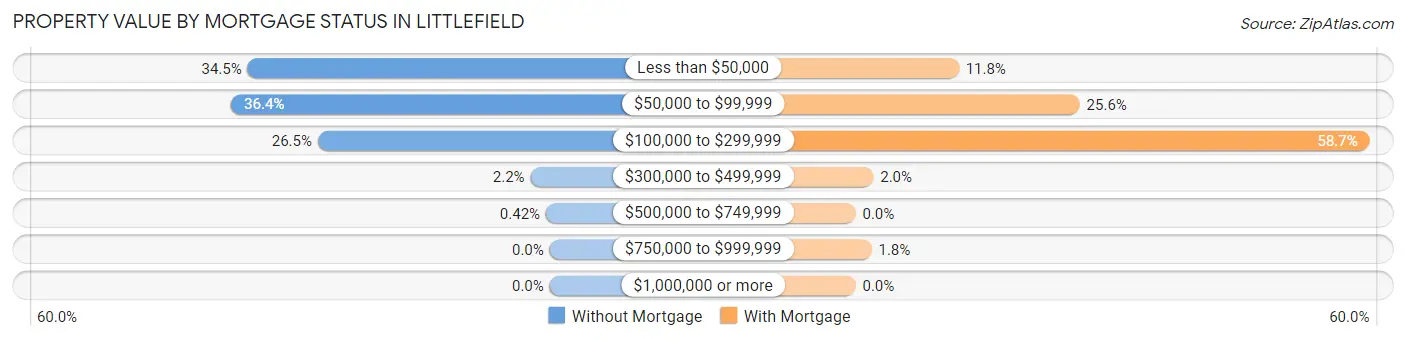
| Property Value | Without Mortgage | With Mortgage |
| Less than $50,000 | 331 (34.5%) | 58 (11.8%) |
| $50,000 to $99,999 | 349 (36.4%) | 126 (25.6%) |
| $100,000 to $299,999 | 254 (26.5%) | 289 (58.7%) |
| $300,000 to $499,999 | 21 (2.2%) | 10 (2.0%) |
| $500,000 to $749,999 | 4 (0.4%) | 0 (0.0%) |
| $750,000 to $999,999 | 0 (0.0%) | 9 (1.8%) |
| $1,000,000 or more | 0 (0.0%) | 0 (0.0%) |
| Total | 959 (100.0%) | 492 (100.0%) |
Household Income by Mortgage Status in Littlefield
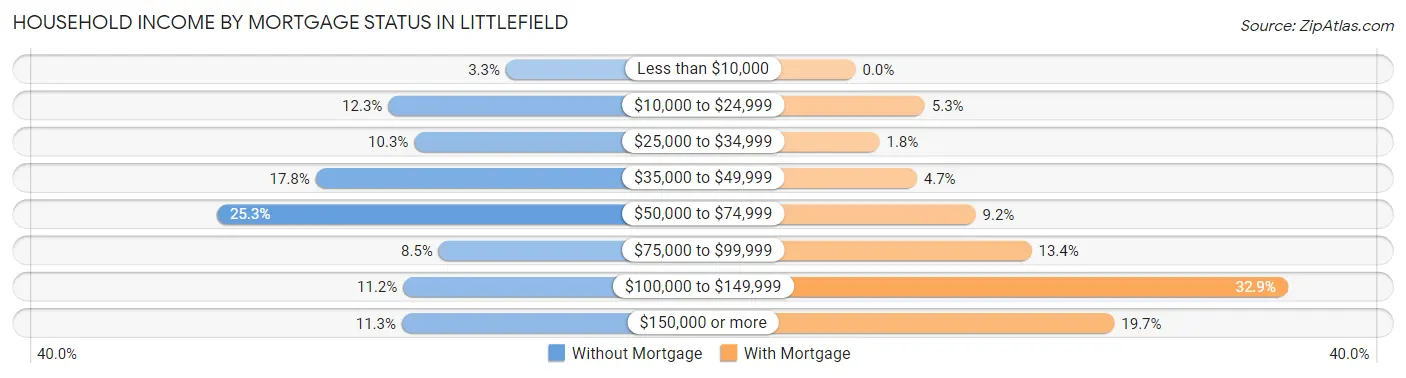
| Household Income | Without Mortgage | With Mortgage |
| Less than $10,000 | 32 (3.3%) | 0 (0.0%) |
| $10,000 to $24,999 | 118 (12.3%) | 26 (5.3%) |
| $25,000 to $34,999 | 99 (10.3%) | 9 (1.8%) |
| $35,000 to $49,999 | 171 (17.8%) | 23 (4.7%) |
| $50,000 to $74,999 | 243 (25.3%) | 45 (9.1%) |
| $75,000 to $99,999 | 81 (8.5%) | 66 (13.4%) |
| $100,000 to $149,999 | 107 (11.2%) | 162 (32.9%) |
| $150,000 or more | 108 (11.3%) | 97 (19.7%) |
| Total | 959 (100.0%) | 492 (100.0%) |
Property Value to Household Income Ratio in Littlefield
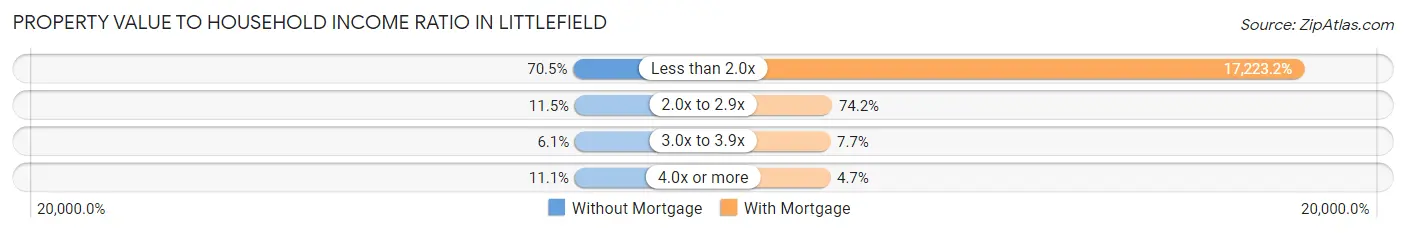
| Value-to-Income Ratio | Without Mortgage | With Mortgage |
| Less than 2.0x | 676 (70.5%) | 84,738 (17,223.2%) |
| 2.0x to 2.9x | 110 (11.5%) | 365 (74.2%) |
| 3.0x to 3.9x | 58 (6.0%) | 38 (7.7%) |
| 4.0x or more | 106 (11.1%) | 23 (4.7%) |
| Total | 959 (100.0%) | 492 (100.0%) |
Real Estate Taxes by Mortgage Status in Littlefield
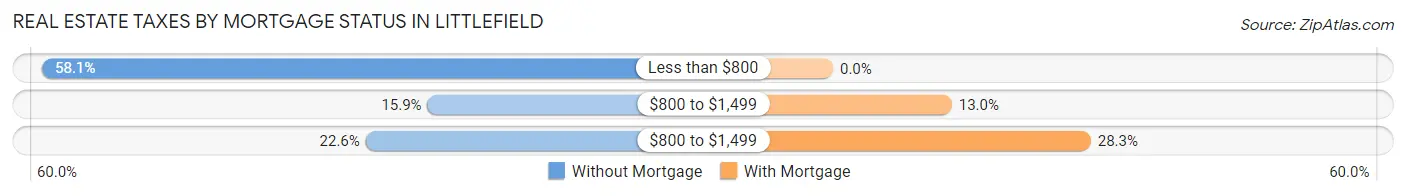
| Property Taxes | Without Mortgage | With Mortgage |
| Less than $800 | 557 (58.1%) | 0 (0.0%) |
| $800 to $1,499 | 152 (15.9%) | 64 (13.0%) |
| $800 to $1,499 | 217 (22.6%) | 139 (28.2%) |
| Total | 959 (100.0%) | 492 (100.0%) |
Health & Disability in Littlefield
Health Insurance Coverage by Age in Littlefield
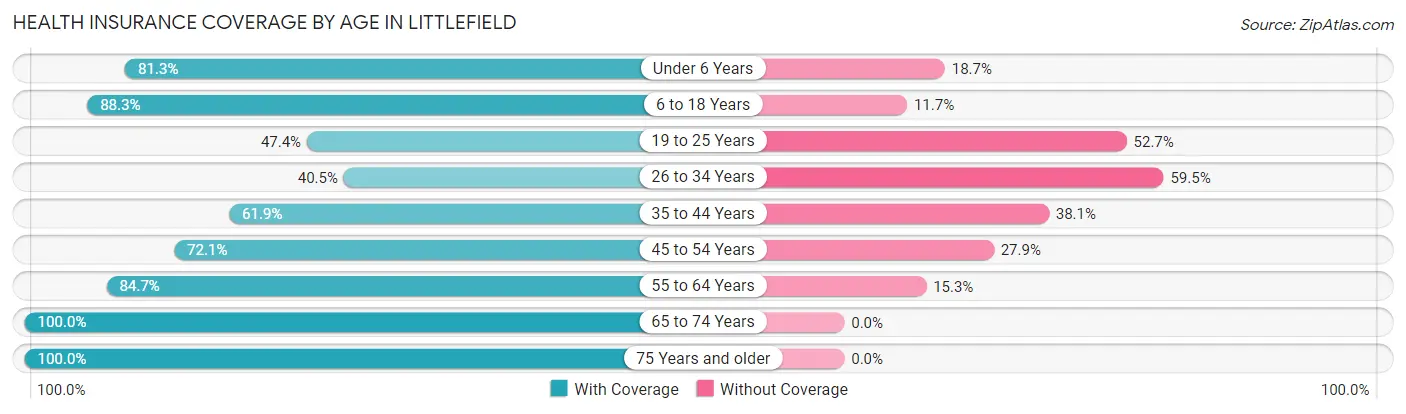
| Age Bracket | With Coverage | Without Coverage |
| Under 6 Years | 399 (81.3%) | 92 (18.7%) |
| 6 to 18 Years | 1,216 (88.3%) | 161 (11.7%) |
| 19 to 25 Years | 232 (47.3%) | 258 (52.6%) |
| 26 to 34 Years | 236 (40.5%) | 347 (59.5%) |
| 35 to 44 Years | 399 (61.9%) | 246 (38.1%) |
| 45 to 54 Years | 458 (72.1%) | 177 (27.9%) |
| 55 to 64 Years | 588 (84.7%) | 106 (15.3%) |
| 65 to 74 Years | 499 (100.0%) | 0 (0.0%) |
| 75 Years and older | 438 (100.0%) | 0 (0.0%) |
| Total | 4,465 (76.3%) | 1,387 (23.7%) |
Health Insurance Coverage by Citizenship Status in Littlefield
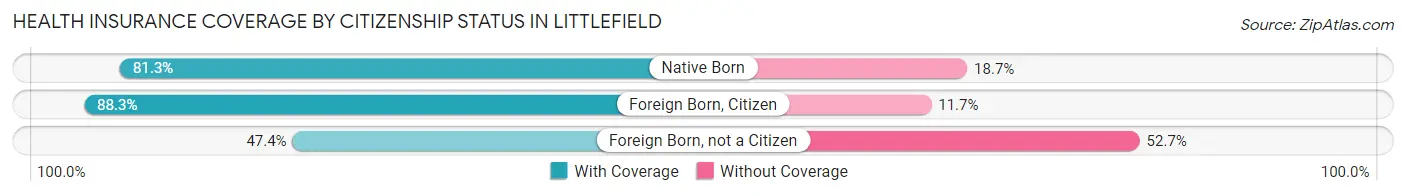
| Citizenship Status | With Coverage | Without Coverage |
| Native Born | 399 (81.3%) | 92 (18.7%) |
| Foreign Born, Citizen | 1,216 (88.3%) | 161 (11.7%) |
| Foreign Born, not a Citizen | 232 (47.3%) | 258 (52.6%) |
Health Insurance Coverage by Household Income in Littlefield
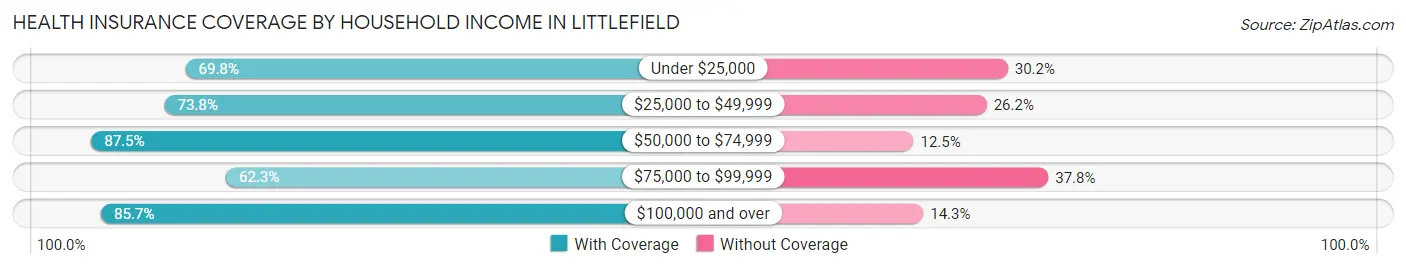
| Household Income | With Coverage | Without Coverage |
| Under $25,000 | 685 (69.8%) | 296 (30.2%) |
| $25,000 to $49,999 | 1,024 (73.8%) | 364 (26.2%) |
| $50,000 to $74,999 | 944 (87.5%) | 135 (12.5%) |
| $75,000 to $99,999 | 658 (62.3%) | 399 (37.8%) |
| $100,000 and over | 1,154 (85.7%) | 193 (14.3%) |
Public vs Private Health Insurance Coverage by Age in Littlefield
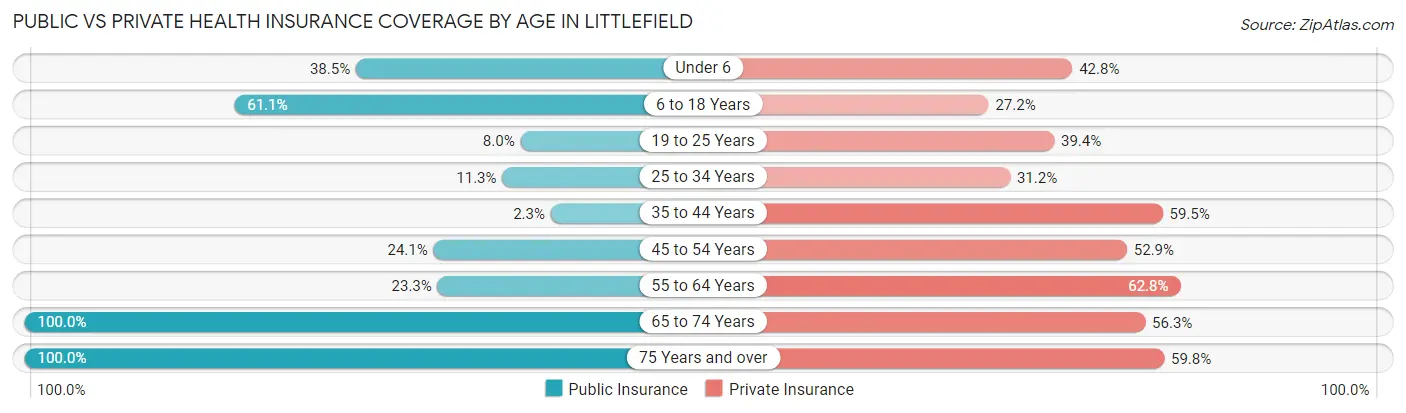
| Age Bracket | Public Insurance | Private Insurance |
| Under 6 | 189 (38.5%) | 210 (42.8%) |
| 6 to 18 Years | 841 (61.1%) | 375 (27.2%) |
| 19 to 25 Years | 39 (8.0%) | 193 (39.4%) |
| 25 to 34 Years | 66 (11.3%) | 182 (31.2%) |
| 35 to 44 Years | 15 (2.3%) | 384 (59.5%) |
| 45 to 54 Years | 153 (24.1%) | 336 (52.9%) |
| 55 to 64 Years | 162 (23.3%) | 436 (62.8%) |
| 65 to 74 Years | 499 (100.0%) | 281 (56.3%) |
| 75 Years and over | 438 (100.0%) | 262 (59.8%) |
| Total | 2,402 (41.0%) | 2,659 (45.4%) |
Disability Status by Sex by Age in Littlefield
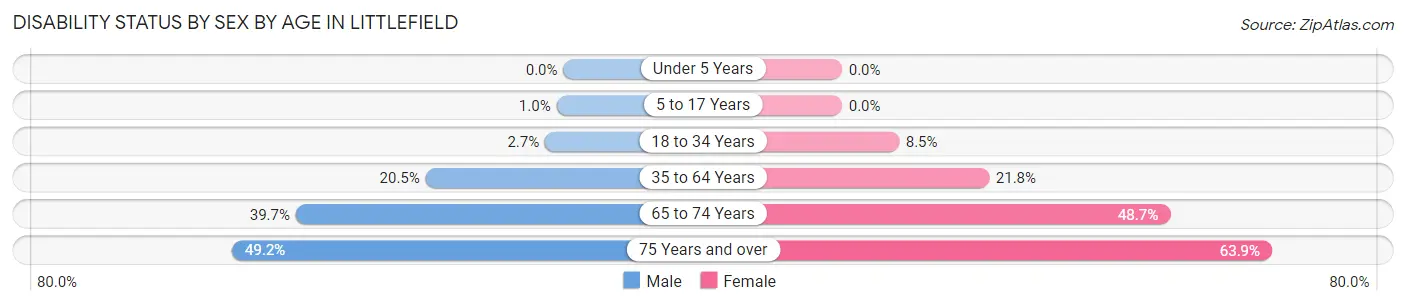
| Age Bracket | Male | Female |
| Under 5 Years | 0 (0.0%) | 0 (0.0%) |
| 5 to 17 Years | 7 (1.0%) | 0 (0.0%) |
| 18 to 34 Years | 14 (2.7%) | 55 (8.5%) |
| 35 to 64 Years | 208 (20.4%) | 209 (21.8%) |
| 65 to 74 Years | 89 (39.7%) | 134 (48.7%) |
| 75 Years and over | 93 (49.2%) | 159 (63.9%) |
Disability Class by Sex by Age in Littlefield
Disability Class: Hearing Difficulty
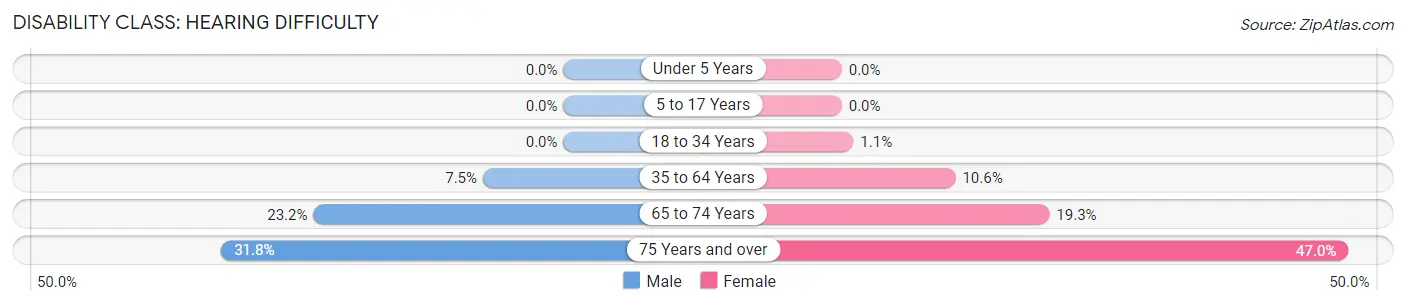
| Age Bracket | Male | Female |
| Under 5 Years | 0 (0.0%) | 0 (0.0%) |
| 5 to 17 Years | 0 (0.0%) | 0 (0.0%) |
| 18 to 34 Years | 0 (0.0%) | 7 (1.1%) |
| 35 to 64 Years | 76 (7.5%) | 101 (10.5%) |
| 65 to 74 Years | 52 (23.2%) | 53 (19.3%) |
| 75 Years and over | 60 (31.8%) | 117 (47.0%) |
Disability Class: Vision Difficulty
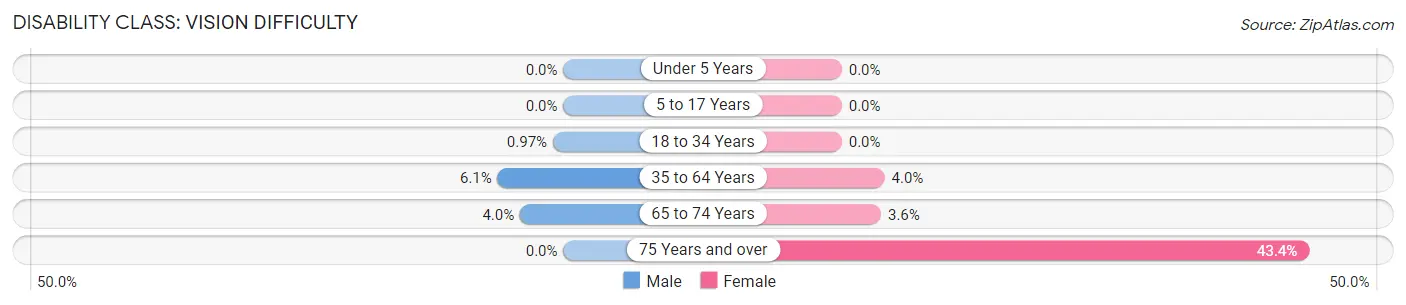
| Age Bracket | Male | Female |
| Under 5 Years | 0 (0.0%) | 0 (0.0%) |
| 5 to 17 Years | 0 (0.0%) | 0 (0.0%) |
| 18 to 34 Years | 5 (1.0%) | 0 (0.0%) |
| 35 to 64 Years | 62 (6.1%) | 38 (4.0%) |
| 65 to 74 Years | 9 (4.0%) | 10 (3.6%) |
| 75 Years and over | 0 (0.0%) | 108 (43.4%) |
Disability Class: Cognitive Difficulty
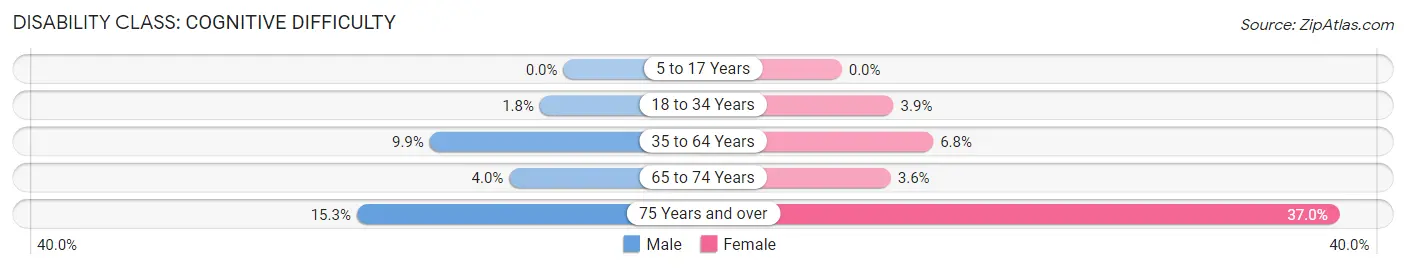
| Age Bracket | Male | Female |
| 5 to 17 Years | 0 (0.0%) | 0 (0.0%) |
| 18 to 34 Years | 9 (1.8%) | 25 (3.8%) |
| 35 to 64 Years | 101 (9.9%) | 65 (6.8%) |
| 65 to 74 Years | 9 (4.0%) | 10 (3.6%) |
| 75 Years and over | 29 (15.3%) | 92 (36.9%) |
Disability Class: Ambulatory Difficulty
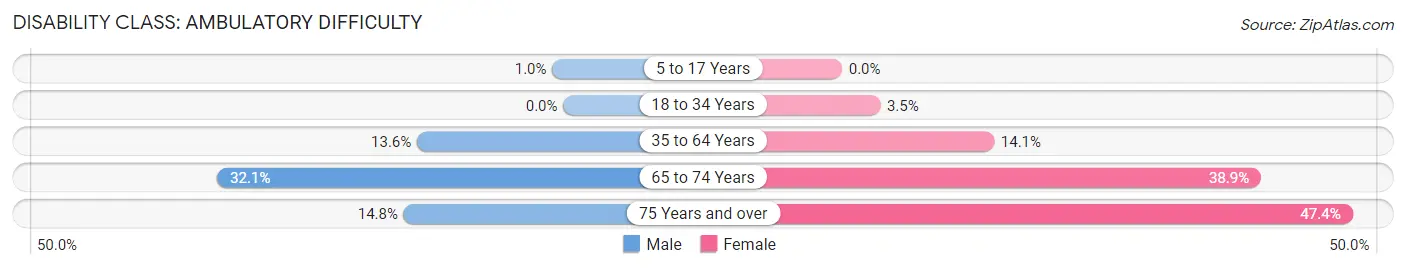
| Age Bracket | Male | Female |
| 5 to 17 Years | 7 (1.0%) | 0 (0.0%) |
| 18 to 34 Years | 0 (0.0%) | 23 (3.5%) |
| 35 to 64 Years | 138 (13.6%) | 135 (14.1%) |
| 65 to 74 Years | 72 (32.1%) | 107 (38.9%) |
| 75 Years and over | 28 (14.8%) | 118 (47.4%) |
Disability Class: Self-Care Difficulty
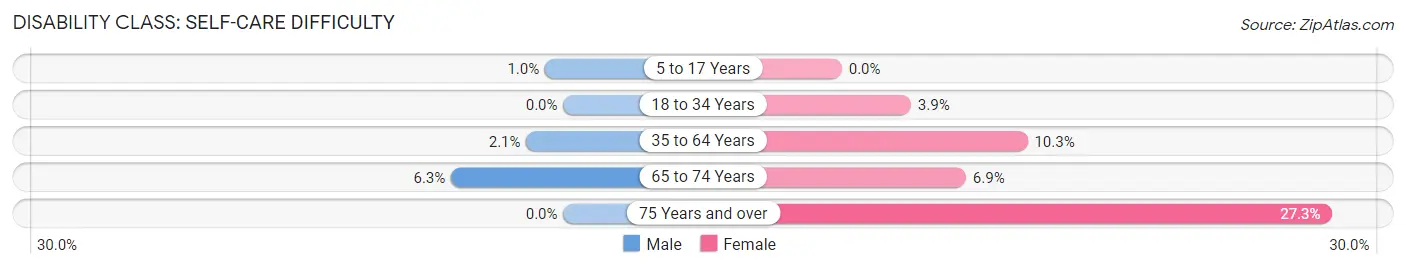
| Age Bracket | Male | Female |
| 5 to 17 Years | 7 (1.0%) | 0 (0.0%) |
| 18 to 34 Years | 0 (0.0%) | 25 (3.8%) |
| 35 to 64 Years | 21 (2.1%) | 99 (10.3%) |
| 65 to 74 Years | 14 (6.2%) | 19 (6.9%) |
| 75 Years and over | 0 (0.0%) | 68 (27.3%) |
Technology Access in Littlefield
Computing Device Access in Littlefield
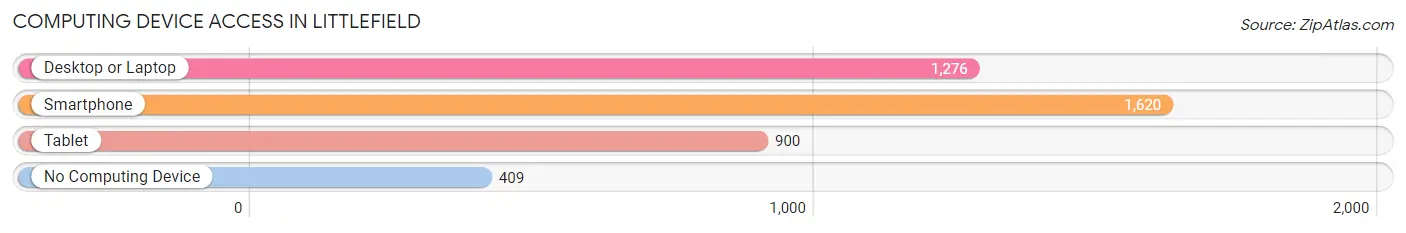
| Device Type | # Households | % Households |
| Desktop or Laptop | 1,276 | 59.5% |
| Smartphone | 1,620 | 75.5% |
| Tablet | 900 | 41.9% |
| No Computing Device | 409 | 19.1% |
| Total | 2,146 | 100.0% |
Internet Access in Littlefield
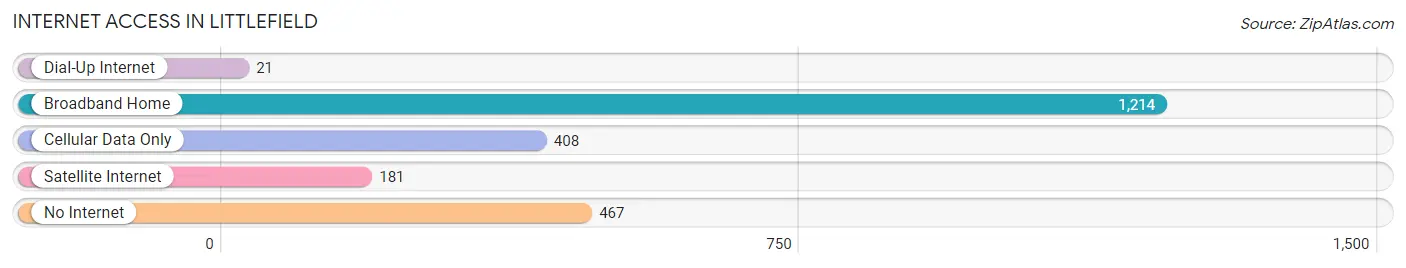
| Internet Type | # Households | % Households |
| Dial-Up Internet | 21 | 1.0% |
| Broadband Home | 1,214 | 56.6% |
| Cellular Data Only | 408 | 19.0% |
| Satellite Internet | 181 | 8.4% |
| No Internet | 467 | 21.8% |
| Total | 2,146 | 100.0% |
Littlefield Summary
Littlefield is a city located in Lamb County, Texas, United States. The population was 6,743 at the 2010 census. It is the county seat of Lamb County. Littlefield is located in the South Plains region of Texas, approximately 30 miles west of Lubbock.
History
Littlefield was founded in 1906 by two brothers, George and Joe Littlefield. The brothers purchased a large tract of land in the area and began to develop it. The town was named after the brothers and was incorporated in 1910.
Littlefield quickly became an important center for the region’s agricultural industry. The town was home to several cotton gins, a cottonseed oil mill, and a cotton compress. The town also had a number of businesses, including a bank, a hotel, and a movie theater.
In the 1920s, Littlefield began to experience a period of growth and prosperity. The town was home to several large businesses, including a cottonseed oil mill, a cotton compress, and a cotton gin. The town also had a number of other businesses, including a bank, a hotel, and a movie theater.
In the 1930s, Littlefield was hit hard by the Great Depression. Many of the businesses in town closed and the population declined. However, the town was able to survive and eventually began to experience a period of growth and prosperity again.
In the 1950s, Littlefield was home to a number of large businesses, including a cottonseed oil mill, a cotton compress, and a cotton gin. The town also had a number of other businesses, including a bank, a hotel, and a movie theater.
In the 1960s, Littlefield experienced a period of growth and prosperity. The town was home to several large businesses, including a cottonseed oil mill, a cotton compress, and a cotton gin. The town also had a number of other businesses, including a bank, a hotel, and a movie theater.
In the 1970s, Littlefield experienced a period of decline. Many of the businesses in town closed and the population declined. However, the town was able to survive and eventually began to experience a period of growth and prosperity again.
Geography
Littlefield is located at 33°59'25" North, 102°20'17" West (33.990278, -102.338333). According to the United States Census Bureau, the city has a total area of 4.2 square miles (10.8 km2), all of it land.
Economy
Littlefield’s economy is largely based on agriculture. The town is home to several large agricultural businesses, including a cottonseed oil mill, a cotton compress, and a cotton gin. The town also has a number of other businesses, including a bank, a hotel, and a movie theater.
Demographics
As of the census of 2000, there were 6,743 people, 2,541 households, and 1,743 families residing in the city. The population density was 1,611.2 people per square mile (619.7/km2). There were 2,919 housing units at an average density of 690.2 per square mile (266.3/km2). The racial makeup of the city was 68.45% White, 5.45% African American, 0.45% Native American, 0.17% Asian, 0.02% Pacific Islander, 23.45% from other races, and 2.01% from two or more races. Hispanic or Latino of any race were 39.45% of the population.
There were 2,541 households, out of which 33.2% had children under the age of 18 living with them, 51.2% were married couples living together, 14.2% had a female householder with no husband present, and 29.7% were non-families. 26.3% of all households were made up of individuals, and 14.2% had someone living alone who was 65 years of age or older. The average household size was 2.62 and the average family size was 3.17.
In the city, the population was spread out, with 28.2% under the age of 18, 9.2% from 18 to 24, 25.2% from 25 to 44, 20.2% from 45 to 64, and 17.2% who were 65 years of age or older. The median age was 35 years. For every 100 females, there were 91.2 males. For every 100 females age 18 and over, there were 86.2 males.
The median income for a household in the city was $25,938, and the median income for a family was $31,944. Males had a median income of $25,938 versus $19,722 for females. The per capita income for the city was $13,845. About 19.2% of families and 22.7% of the population were below the poverty line, including 28.7% of those under age 18 and 16.2% of those age 65 or over.
Common Questions
What is Per Capita Income in Littlefield?
Per Capita income in Littlefield is $25,391.
What is the Median Family Income in Littlefield?
Median Family Income in Littlefield is $63,214.
What is the Median Household income in Littlefield?
Median Household Income in Littlefield is $48,962.
What is Income or Wage Gap in Littlefield?
Income or Wage Gap in Littlefield is 35.8%.
Women in Littlefield earn 64.2 cents for every dollar earned by a man.
What is Inequality or Gini Index in Littlefield?
Inequality or Gini Index in Littlefield is 0.46.
What is the Total Population of Littlefield?
Total Population of Littlefield is 5,939.
What is the Total Male Population of Littlefield?
Total Male Population of Littlefield is 2,928.
What is the Total Female Population of Littlefield?
Total Female Population of Littlefield is 3,011.
What is the Ratio of Males per 100 Females in Littlefield?
There are 97.24 Males per 100 Females in Littlefield.
What is the Ratio of Females per 100 Males in Littlefield?
There are 102.83 Females per 100 Males in Littlefield.
What is the Median Population Age in Littlefield?
Median Population Age in Littlefield is 35.1 Years.
What is the Average Family Size in Littlefield
Average Family Size in Littlefield is 3.5 People.
What is the Average Household Size in Littlefield
Average Household Size in Littlefield is 2.7 People.
How Large is the Labor Force in Littlefield?
There are 2,557 People in the Labor Forcein in Littlefield.
What is the Percentage of People in the Labor Force in Littlefield?
59.0% of People are in the Labor Force in Littlefield.
What is the Unemployment Rate in Littlefield?
Unemployment Rate in Littlefield is 2.4%.