Lindsay, TX Map & Demographics
Lindsay Map
Lindsay Overview
$44,844
PER CAPITA INCOME
$81,653
AVG HOUSEHOLD INCOME
31.4%
WAGE / INCOME GAP [ % ]
68.6¢/ $1
WAGE / INCOME GAP [ $ ]
0.18
INEQUALITY / GINI INDEX
789
TOTAL POPULATION
711
MALE POPULATION
78
FEMALE POPULATION
911.54
MALES / 100 FEMALES
10.97
FEMALES / 100 MALES
46.2
MEDIAN AGE
7.2
AVG FAMILY SIZE
2.2
AVG HOUSEHOLD SIZE
744
LABOR FORCE [ PEOPLE ]
94.3%
PERCENT IN LABOR FORCE
Lindsay Zip Codes
Lindsay Area Codes
Income in Lindsay
Income Overview in Lindsay
| Characteristic | Number | Measure |
| Per Capita Income | 789 | $44,844 |
| Median Family Income | 36 | $0 |
| Mean Family Income | 36 | $62,225 |
| Median Household Income | 351 | $81,653 |
| Mean Household Income | 351 | $82,144 |
| Income Deficit | 36 | $0 |
| Wage / Income Gap (%) | 789 | 31.36% |
| Wage / Income Gap ($) | 789 | 68.64¢ per $1 |
| Gini / Inequality Index | 789 | 0.18 |
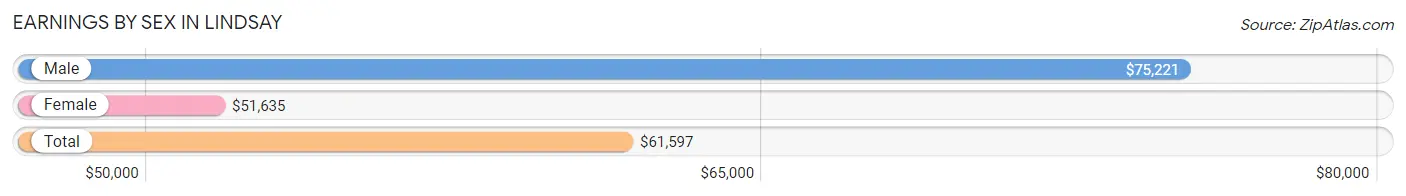
Earnings by Sex in Lindsay
Average Earnings in Lindsay are $61,597, $75,221 for men and $51,635 for women, a difference of 31.4%.
| Sex | Number | Average Earnings |
| Male | 694 (93.3%) | $75,221 |
| Female | 50 (6.7%) | $51,635 |
| Total | 744 (100.0%) | $61,597 |
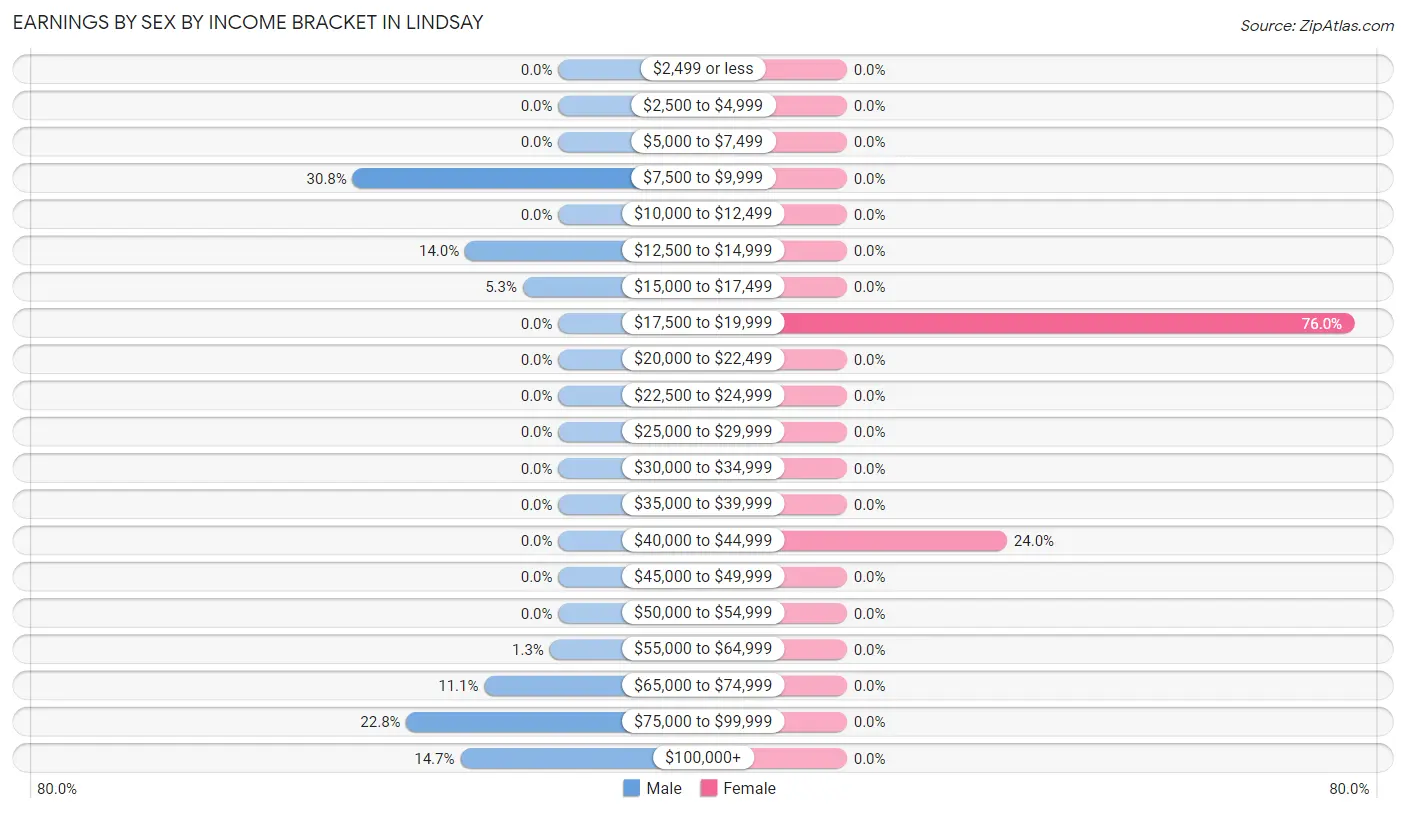
Earnings by Sex by Income Bracket in Lindsay
The most common earnings brackets in Lindsay are $7,500 to $9,999 for men (214 | 30.8%) and $17,500 to $19,999 for women (38 | 76.0%).
| Income | Male | Female |
| $2,499 or less | 0 (0.0%) | 0 (0.0%) |
| $2,500 to $4,999 | 0 (0.0%) | 0 (0.0%) |
| $5,000 to $7,499 | 0 (0.0%) | 0 (0.0%) |
| $7,500 to $9,999 | 214 (30.8%) | 0 (0.0%) |
| $10,000 to $12,499 | 0 (0.0%) | 0 (0.0%) |
| $12,500 to $14,999 | 97 (14.0%) | 0 (0.0%) |
| $15,000 to $17,499 | 37 (5.3%) | 0 (0.0%) |
| $17,500 to $19,999 | 0 (0.0%) | 38 (76.0%) |
| $20,000 to $22,499 | 0 (0.0%) | 0 (0.0%) |
| $22,500 to $24,999 | 0 (0.0%) | 0 (0.0%) |
| $25,000 to $29,999 | 0 (0.0%) | 0 (0.0%) |
| $30,000 to $34,999 | 0 (0.0%) | 0 (0.0%) |
| $35,000 to $39,999 | 0 (0.0%) | 0 (0.0%) |
| $40,000 to $44,999 | 0 (0.0%) | 12 (24.0%) |
| $45,000 to $49,999 | 0 (0.0%) | 0 (0.0%) |
| $50,000 to $54,999 | 0 (0.0%) | 0 (0.0%) |
| $55,000 to $64,999 | 9 (1.3%) | 0 (0.0%) |
| $65,000 to $74,999 | 77 (11.1%) | 0 (0.0%) |
| $75,000 to $99,999 | 158 (22.8%) | 0 (0.0%) |
| $100,000+ | 102 (14.7%) | 0 (0.0%) |
| Total | 694 (100.0%) | 50 (100.0%) |
Earnings by Sex by Educational Attainment in Lindsay
| Educational Attainment | Male Income | Female Income |
| Less than High School | - | - |
| High School Diploma | - | - |
| College or Associate's Degree | - | - |
| Bachelor's Degree | - | - |
| Graduate Degree | - | - |
| Total | - | - |
Family Income in Lindsay
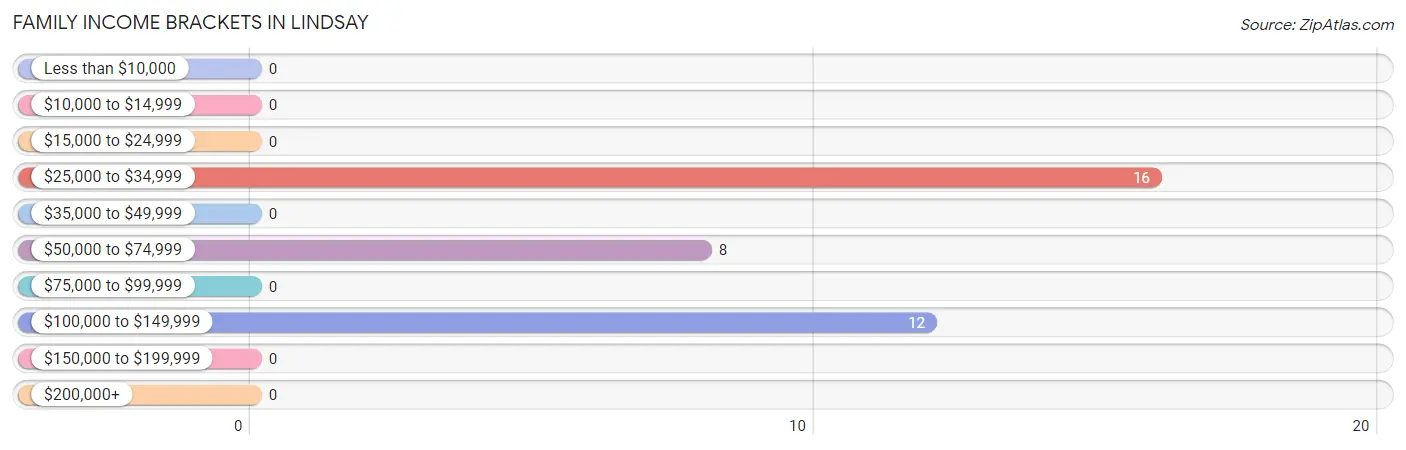
Family Income Brackets in Lindsay
According to the Lindsay family income data, there are 16 families falling into the $25,000 to $34,999 income range, which is the most common income bracket and makes up 44.4% of all families.
| Income Bracket | # Families | % Families |
| Less than $10,000 | 0 | 0.0% |
| $10,000 to $14,999 | 0 | 0.0% |
| $15,000 to $24,999 | 0 | 0.0% |
| $25,000 to $34,999 | 16 | 44.4% |
| $35,000 to $49,999 | 0 | 0.0% |
| $50,000 to $74,999 | 8 | 22.2% |
| $75,000 to $99,999 | 0 | 0.0% |
| $100,000 to $149,999 | 12 | 33.3% |
| $150,000 to $199,999 | 0 | 0.0% |
| $200,000+ | 0 | 0.0% |
Family Income by Famaliy Size in Lindsay
| Income Bracket | # Families | Median Income |
| 2-Person Families | 12 (33.3%) | $0 |
| 3-Person Families | 24 (66.7%) | $0 |
| 4-Person Families | 0 (0.0%) | $0 |
| 5-Person Families | 0 (0.0%) | $0 |
| 6-Person Families | 0 (0.0%) | $0 |
| 7+ Person Families | 0 (0.0%) | $0 |
| Total | 36 (100.0%) | $0 |
Family Income by Number of Earners in Lindsay
| Number of Earners | # Families | Median Income |
| No Earners | 0 (0.0%) | $0 |
| 1 Earner | 24 (66.7%) | $0 |
| 2 Earners | 12 (33.3%) | $0 |
| 3+ Earners | 0 (0.0%) | $0 |
| Total | 36 (100.0%) | $0 |
Household Income in Lindsay
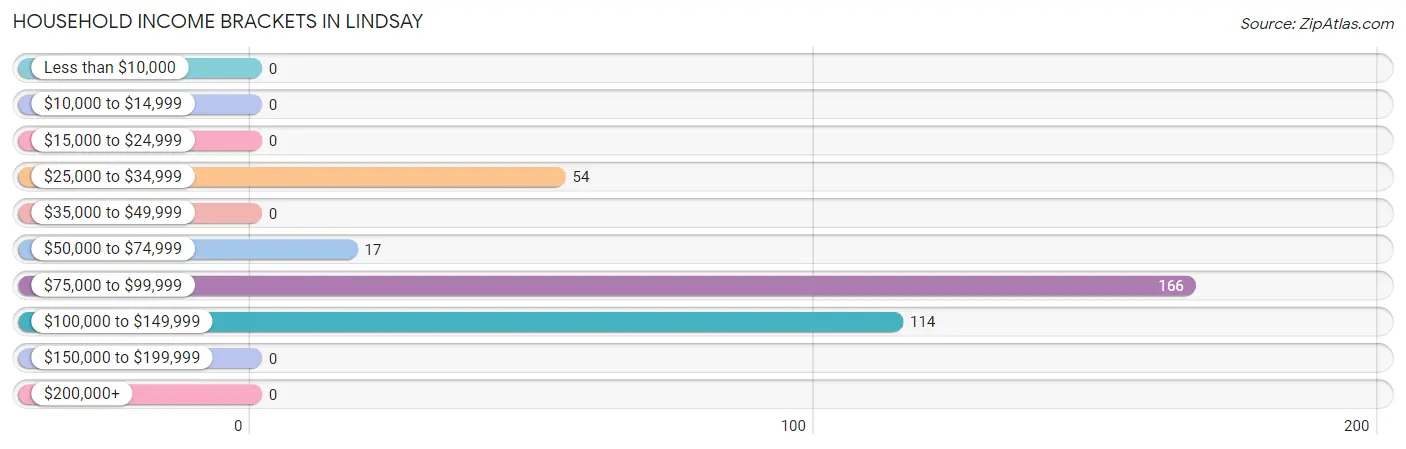
Household Income Brackets in Lindsay
With 166 households falling in the category, the $75,000 to $99,999 income range is the most frequent in Lindsay, accounting for 47.3% of all households.
| Income Bracket | # Households | % Households |
| Less than $10,000 | 0 | 0.0% |
| $10,000 to $14,999 | 0 | 0.0% |
| $15,000 to $24,999 | 0 | 0.0% |
| $25,000 to $34,999 | 54 | 15.4% |
| $35,000 to $49,999 | 0 | 0.0% |
| $50,000 to $74,999 | 17 | 4.8% |
| $75,000 to $99,999 | 166 | 47.3% |
| $100,000 to $149,999 | 114 | 32.5% |
| $150,000 to $199,999 | 0 | 0.0% |
| $200,000+ | 0 | 0.0% |
Household Income by Householder Age in Lindsay
The median household income in Lindsay is $81,653, with the highest median household income of $112,929 found in the 45 to 64 years age bracket for the primary householder. A total of 169 households (48.1%) fall into this category.
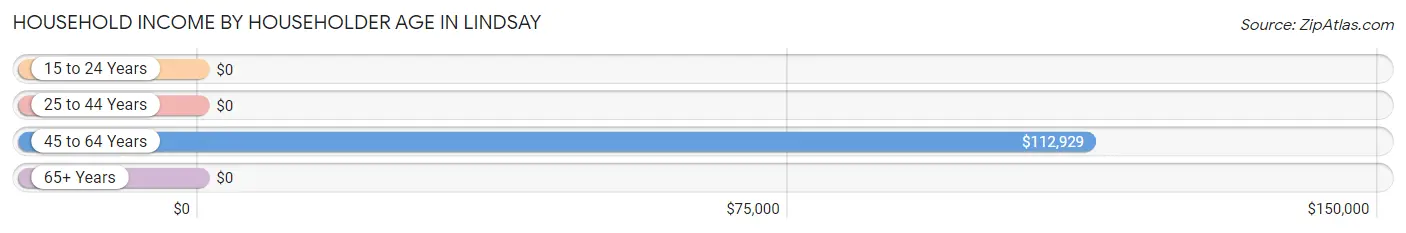
| Income Bracket | # Households | Median Income |
| 15 to 24 Years | 0 (0.0%) | $0 |
| 25 to 44 Years | 158 (45.0%) | $0 |
| 45 to 64 Years | 169 (48.1%) | $112,929 |
| 65+ Years | 24 (6.8%) | $0 |
| Total | 351 (100.0%) | $81,653 |
Poverty in Lindsay
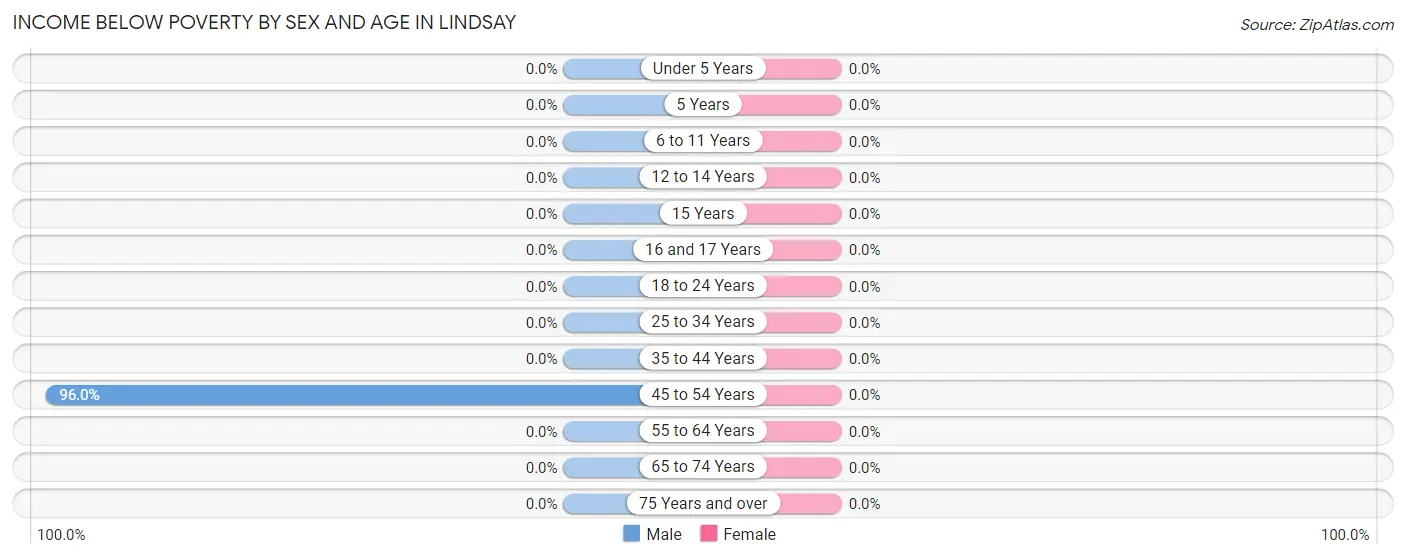
Income Below Poverty by Sex and Age in Lindsay
| Age Bracket | Male | Female |
| Under 5 Years | 0 (0.0%) | 0 (0.0%) |
| 5 Years | 0 (0.0%) | 0 (0.0%) |
| 6 to 11 Years | 0 (0.0%) | 0 (0.0%) |
| 12 to 14 Years | 0 (0.0%) | 0 (0.0%) |
| 15 Years | 0 (0.0%) | 0 (0.0%) |
| 16 and 17 Years | 0 (0.0%) | 0 (0.0%) |
| 18 to 24 Years | 0 (0.0%) | 0 (0.0%) |
| 25 to 34 Years | 0 (0.0%) | 0 (0.0%) |
| 35 to 44 Years | 0 (0.0%) | 0 (0.0%) |
| 45 to 54 Years | 214 (96.0%) | 0 (0.0%) |
| 55 to 64 Years | 0 (0.0%) | 0 (0.0%) |
| 65 to 74 Years | 0 (0.0%) | 0 (0.0%) |
| 75 Years and over | 0 (0.0%) | 0 (0.0%) |
| Total | 214 (30.1%) | 0 (0.0%) |
Income Above Poverty by Sex and Age in Lindsay
According to the poverty statistics in Lindsay, males aged 18 to 24 years and females aged 55 to 64 years are the age groups that are most secure financially, with 100.0% of males and 100.0% of females in these age groups living above the poverty line.
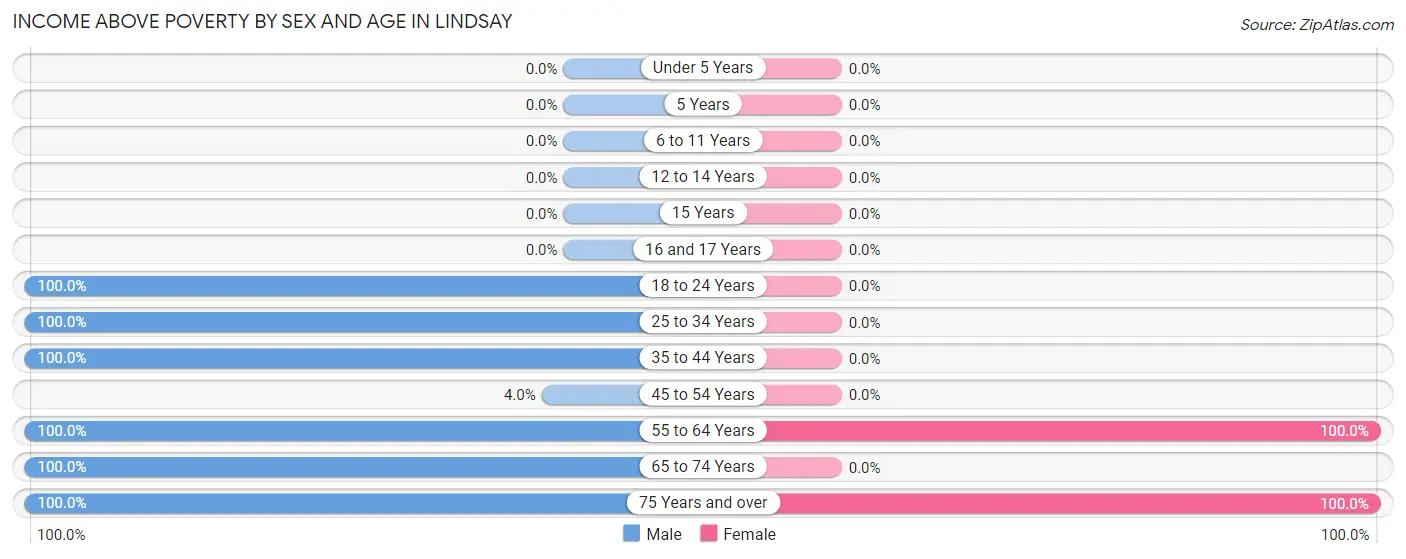
| Age Bracket | Male | Female |
| Under 5 Years | 0 (0.0%) | 0 (0.0%) |
| 5 Years | 0 (0.0%) | 0 (0.0%) |
| 6 to 11 Years | 0 (0.0%) | 0 (0.0%) |
| 12 to 14 Years | 0 (0.0%) | 0 (0.0%) |
| 15 Years | 0 (0.0%) | 0 (0.0%) |
| 16 and 17 Years | 0 (0.0%) | 0 (0.0%) |
| 18 to 24 Years | 37 (100.0%) | 0 (0.0%) |
| 25 to 34 Years | 158 (100.0%) | 0 (0.0%) |
| 35 to 44 Years | 166 (100.0%) | 0 (0.0%) |
| 45 to 54 Years | 9 (4.0%) | 0 (0.0%) |
| 55 to 64 Years | 110 (100.0%) | 62 (100.0%) |
| 65 to 74 Years | 8 (100.0%) | 0 (0.0%) |
| 75 Years and over | 9 (100.0%) | 16 (100.0%) |
| Total | 497 (69.9%) | 78 (100.0%) |
Income Below Poverty Among Married-Couple Families in Lindsay
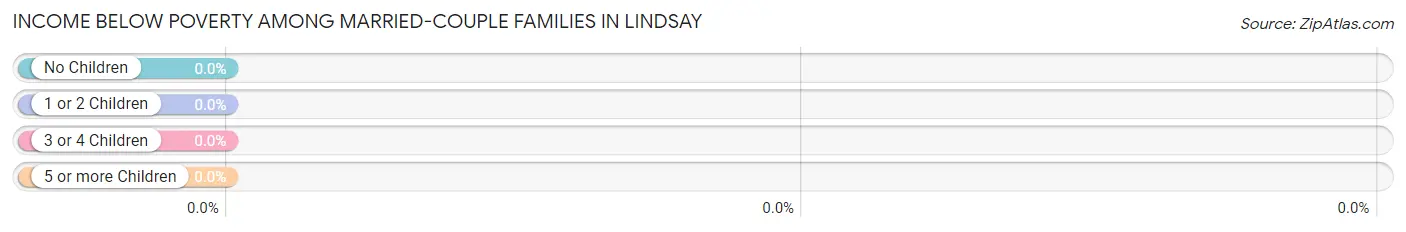
| Children | Above Poverty | Below Poverty |
| No Children | 24 (100.0%) | 0 (0.0%) |
| 1 or 2 Children | 0 (0.0%) | 0 (0.0%) |
| 3 or 4 Children | 0 (0.0%) | 0 (0.0%) |
| 5 or more Children | 0 (0.0%) | 0 (0.0%) |
| Total | 24 (100.0%) | 0 (0.0%) |
Income Below Poverty Among Single-Parent Households in Lindsay
| Children | Single Father | Single Mother |
| No Children | 0 (0.0%) | 0 (0.0%) |
| 1 or 2 Children | 0 (0.0%) | 0 (0.0%) |
| 3 or 4 Children | 0 (0.0%) | 0 (0.0%) |
| 5 or more Children | 0 (0.0%) | 0 (0.0%) |
| Total | 0 (0.0%) | 0 (0.0%) |
Income Below Poverty Among Married-Couple vs Single-Parent Households in Lindsay
| Children | Married-Couple Families | Single-Parent Households |
| No Children | 0 (0.0%) | 0 (0.0%) |
| 1 or 2 Children | 0 (0.0%) | 0 (0.0%) |
| 3 or 4 Children | 0 (0.0%) | 0 (0.0%) |
| 5 or more Children | 0 (0.0%) | 0 (0.0%) |
| Total | 0 (0.0%) | 0 (0.0%) |
Race in Lindsay
The most populous races in Lindsay are Hispanic or Latino (575 | 72.9%), White / Caucasian (380 | 48.2%), and Two or more Races (221 | 28.0%).
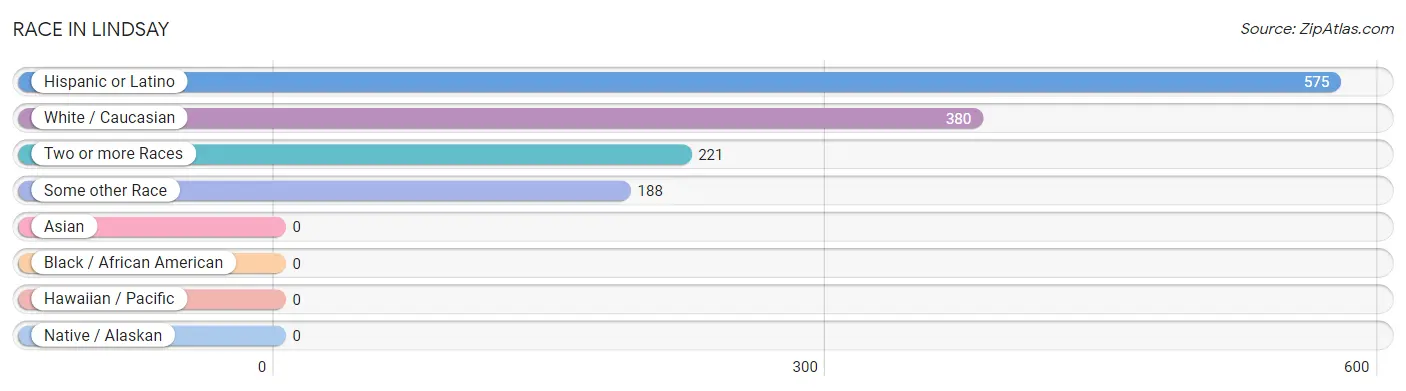
| Race | # Population | % Population |
| Asian | 0 | 0.0% |
| Black / African American | 0 | 0.0% |
| Hawaiian / Pacific | 0 | 0.0% |
| Hispanic or Latino | 575 | 72.9% |
| Native / Alaskan | 0 | 0.0% |
| White / Caucasian | 380 | 48.2% |
| Two or more Races | 221 | 28.0% |
| Some other Race | 188 | 23.8% |
| Total | 789 | 100.0% |
Ancestry in Lindsay
The most populous ancestries reported in Lindsay are Mexican (575 | 72.9%), and American (311 | 39.4%), together accounting for 112.3% of all Lindsay residents.
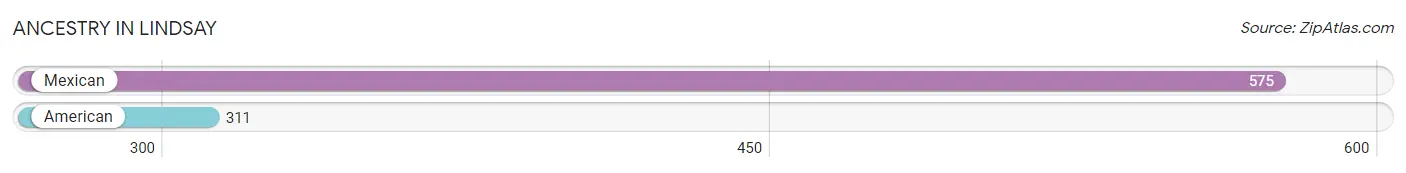
| Ancestry | # Population | % Population |
| American | 311 | 39.4% |
| Mexican | 575 | 72.9% | View All 2 Rows |
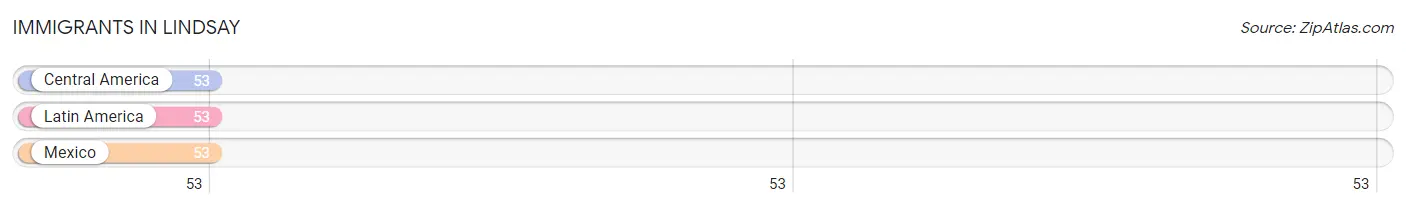
Immigrants in Lindsay
The most numerous immigrant groups reported in Lindsay came from Central America (53 | 6.7%), Latin America (53 | 6.7%), and Mexico (53 | 6.7%), together accounting for 20.2% of all Lindsay residents.
| Immigration Origin | # Population | % Population |
| Central America | 53 | 6.7% |
| Latin America | 53 | 6.7% |
| Mexico | 53 | 6.7% | View All 3 Rows |
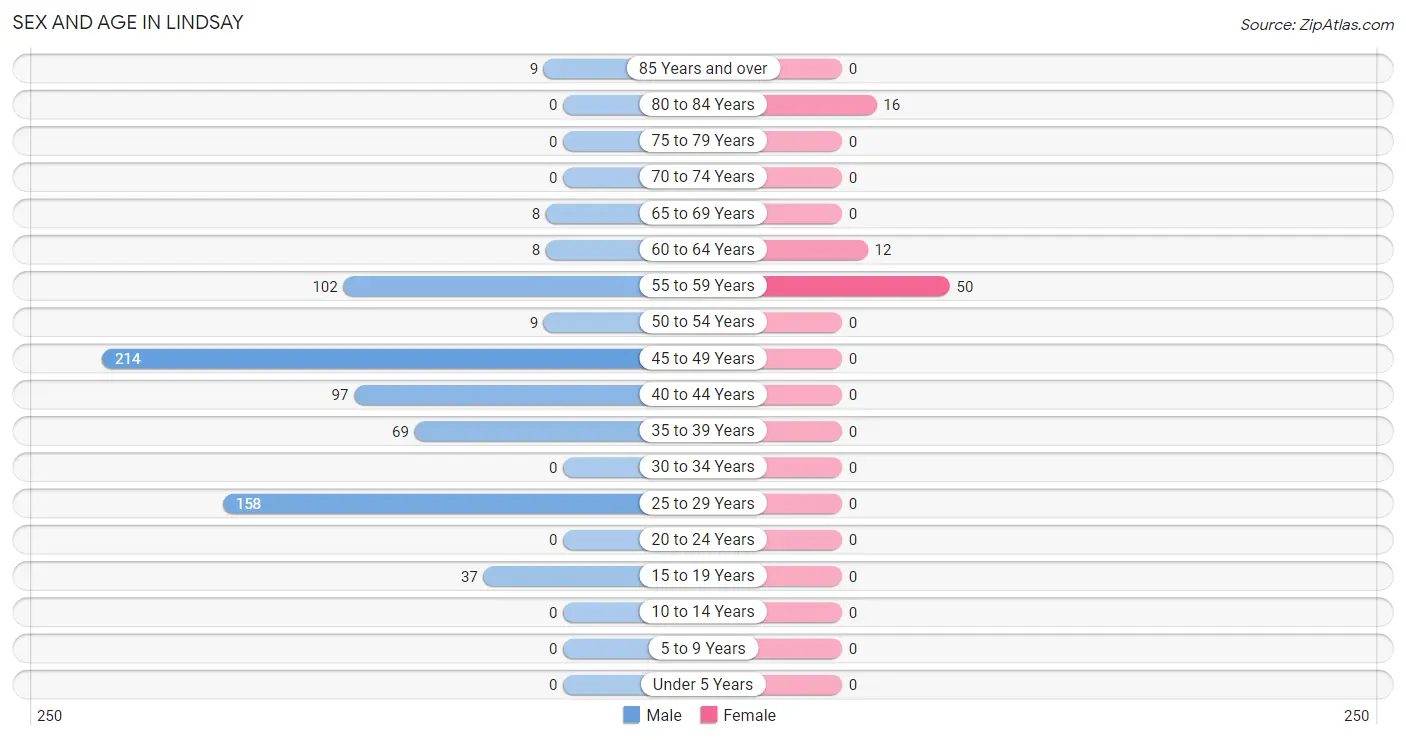
Sex and Age in Lindsay
Sex and Age in Lindsay
The most populous age groups in Lindsay are 45 to 49 Years (214 | 30.1%) for men and 55 to 59 Years (50 | 64.1%) for women.
| Age Bracket | Male | Female |
| Under 5 Years | 0 (0.0%) | 0 (0.0%) |
| 5 to 9 Years | 0 (0.0%) | 0 (0.0%) |
| 10 to 14 Years | 0 (0.0%) | 0 (0.0%) |
| 15 to 19 Years | 37 (5.2%) | 0 (0.0%) |
| 20 to 24 Years | 0 (0.0%) | 0 (0.0%) |
| 25 to 29 Years | 158 (22.2%) | 0 (0.0%) |
| 30 to 34 Years | 0 (0.0%) | 0 (0.0%) |
| 35 to 39 Years | 69 (9.7%) | 0 (0.0%) |
| 40 to 44 Years | 97 (13.6%) | 0 (0.0%) |
| 45 to 49 Years | 214 (30.1%) | 0 (0.0%) |
| 50 to 54 Years | 9 (1.3%) | 0 (0.0%) |
| 55 to 59 Years | 102 (14.3%) | 50 (64.1%) |
| 60 to 64 Years | 8 (1.1%) | 12 (15.4%) |
| 65 to 69 Years | 8 (1.1%) | 0 (0.0%) |
| 70 to 74 Years | 0 (0.0%) | 0 (0.0%) |
| 75 to 79 Years | 0 (0.0%) | 0 (0.0%) |
| 80 to 84 Years | 0 (0.0%) | 16 (20.5%) |
| 85 Years and over | 9 (1.3%) | 0 (0.0%) |
| Total | 711 (100.0%) | 78 (100.0%) |
Families and Households in Lindsay
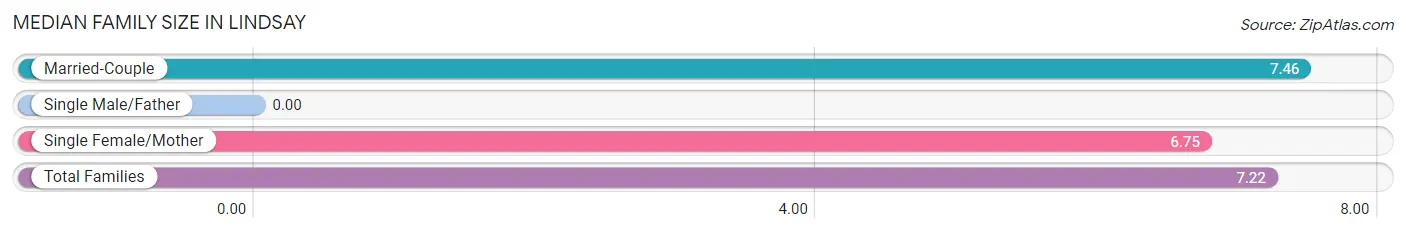
Median Family Size in Lindsay
| Family Type | # Families | Family Size |
| Married-Couple | 24 (66.7%) | 7.46 |
| Single Male/Father | 0 (0.0%) | - |
| Single Female/Mother | 12 (33.3%) | 6.75 |
| Total Families | 36 (100.0%) | 7.22 |
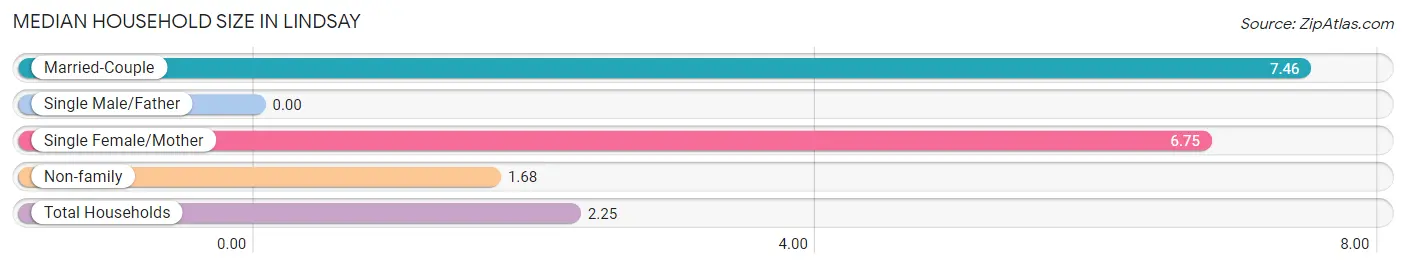
Median Household Size in Lindsay
| Household Type | # Households | Household Size |
| Married-Couple | 24 (6.8%) | 7.46 |
| Single Male/Father | 0 (0.0%) | - |
| Single Female/Mother | 12 (3.4%) | 6.75 |
| Non-family | 315 (89.7%) | 1.68 |
| Total Households | 351 (100.0%) | 2.25 |
Household Size by Marriage Status in Lindsay
Out of a total of 351 households in Lindsay, 36 (10.3%) are family households, while 315 (89.7%) are nonfamily households. The most numerous type of family households are 3-person households, comprising 24, and the most common type of nonfamily households are 1-person households, comprising 277.
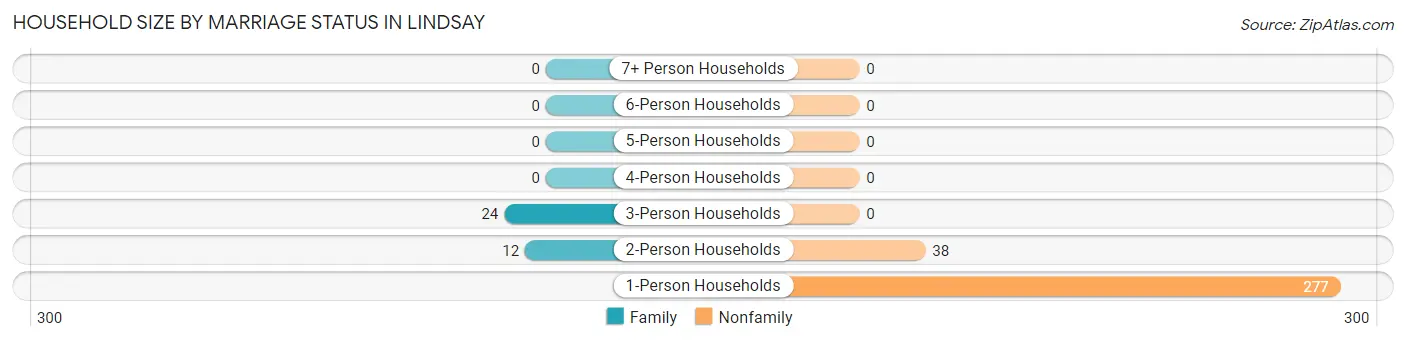
| Household Size | Family Households | Nonfamily Households |
| 1-Person Households | - | 277 (78.9%) |
| 2-Person Households | 12 (3.4%) | 38 (10.8%) |
| 3-Person Households | 24 (6.8%) | 0 (0.0%) |
| 4-Person Households | 0 (0.0%) | 0 (0.0%) |
| 5-Person Households | 0 (0.0%) | 0 (0.0%) |
| 6-Person Households | 0 (0.0%) | 0 (0.0%) |
| 7+ Person Households | 0 (0.0%) | 0 (0.0%) |
| Total | 36 (10.3%) | 315 (89.7%) |
Female Fertility in Lindsay
Fertility by Age in Lindsay
| Age Bracket | Women with Births | Births / 1,000 Women |
| 15 to 19 years | 0 (0.0%) | 0.0 |
| 20 to 34 years | 0 (0.0%) | 0.0 |
| 35 to 50 years | 0 (0.0%) | 0.0 |
| Total | 0 (0.0%) | 0.0 |
Fertility by Age by Marriage Status in Lindsay
| Age Bracket | Married | Unmarried |
| 15 to 19 years | 0 (0.0%) | 0 (0.0%) |
| 20 to 34 years | 0 (0.0%) | 0 (0.0%) |
| 35 to 50 years | 0 (0.0%) | 0 (0.0%) |
| Total | 0 (0.0%) | 0 (0.0%) |
Fertility by Education in Lindsay
| Educational Attainment | Women with Births | Births / 1,000 Women |
| Less than High School | 0 (0.0%) | 0.0 |
| High School Diploma | 0 (0.0%) | 0.0 |
| College or Associate's Degree | 0 (0.0%) | 0.0 |
| Bachelor's Degree | 0 (0.0%) | 0.0 |
| Graduate Degree | 0 (0.0%) | 0.0 |
| Total | 0 (0.0%) | 0.0 |
Fertility by Education by Marriage Status in Lindsay
| Educational Attainment | Married | Unmarried |
| Less than High School | 0 (0.0%) | 0 (0.0%) |
| High School Diploma | 0 (0.0%) | 0 (0.0%) |
| College or Associate's Degree | 0 (0.0%) | 0 (0.0%) |
| Bachelor's Degree | 0 (0.0%) | 0 (0.0%) |
| Graduate Degree | 0 (0.0%) | 0 (0.0%) |
| Total | 0 (0.0%) | 0 (0.0%) |
Employment Characteristics in Lindsay
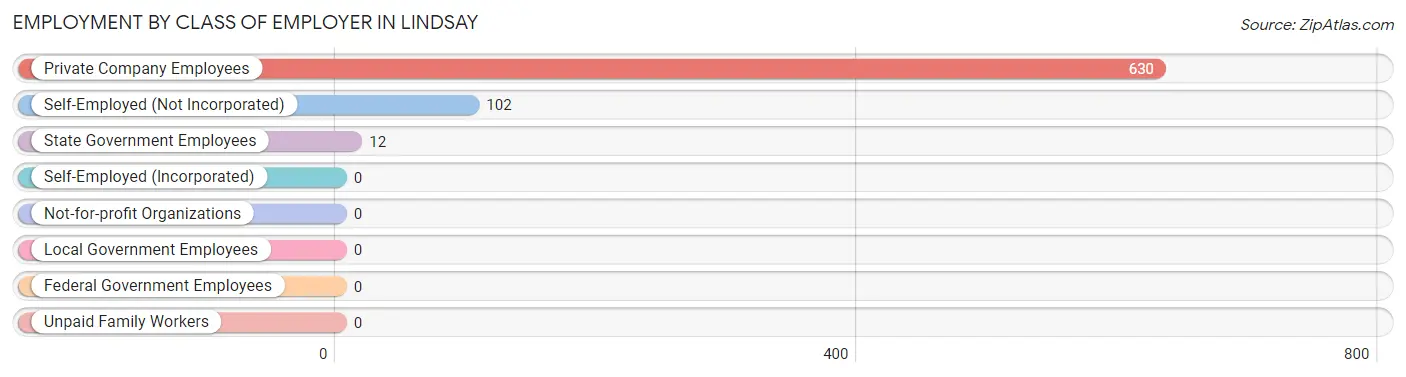
Employment by Class of Employer in Lindsay
Among the 744 employed individuals in Lindsay, private company employees (630 | 84.7%), self-employed (not incorporated) (102 | 13.7%), and state government employees (12 | 1.6%) make up the most common classes of employment.
| Employer Class | # Employees | % Employees |
| Private Company Employees | 630 | 84.7% |
| Self-Employed (Incorporated) | 0 | 0.0% |
| Self-Employed (Not Incorporated) | 102 | 13.7% |
| Not-for-profit Organizations | 0 | 0.0% |
| Local Government Employees | 0 | 0.0% |
| State Government Employees | 12 | 1.6% |
| Federal Government Employees | 0 | 0.0% |
| Unpaid Family Workers | 0 | 0.0% |
| Total | 744 | 100.0% |
Employment Status by Age in Lindsay
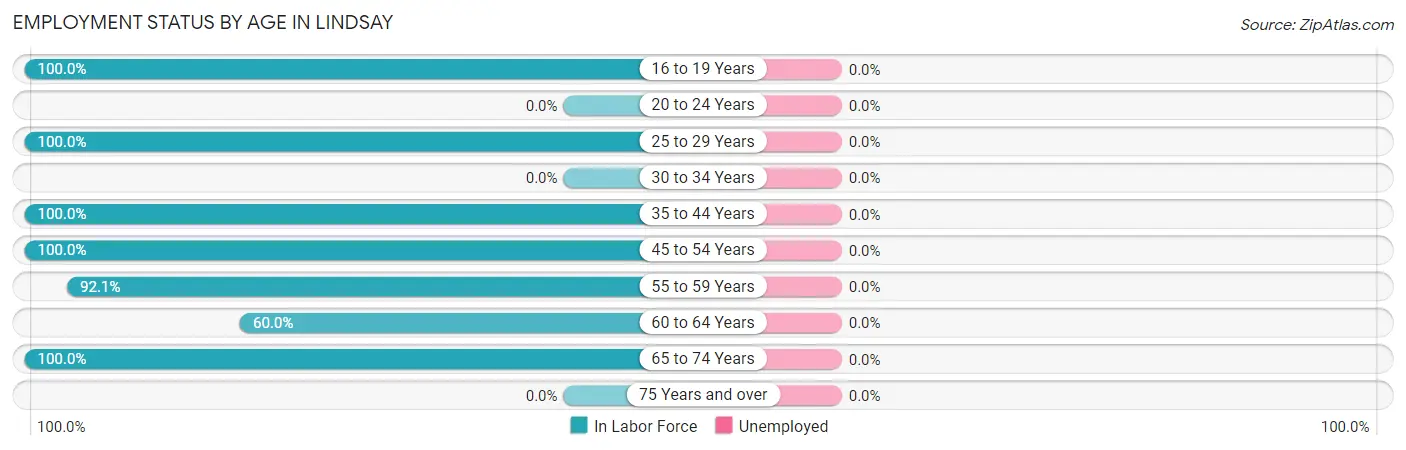
| Age Bracket | In Labor Force | Unemployed |
| 16 to 19 Years | 37 (100.0%) | 0 (0.0%) |
| 20 to 24 Years | 0 (0.0%) | 0 (0.0%) |
| 25 to 29 Years | 158 (100.0%) | 0 (0.0%) |
| 30 to 34 Years | 0 (0.0%) | 0 (0.0%) |
| 35 to 44 Years | 166 (100.0%) | 0 (0.0%) |
| 45 to 54 Years | 223 (100.0%) | 0 (0.0%) |
| 55 to 59 Years | 140 (92.1%) | 0 (0.0%) |
| 60 to 64 Years | 12 (60.0%) | 0 (0.0%) |
| 65 to 74 Years | 8 (100.0%) | 0 (0.0%) |
| 75 Years and over | 0 (0.0%) | 0 (0.0%) |
| Total | 744 (94.3%) | 0 (0.0%) |
Employment Status by Educational Attainment in Lindsay
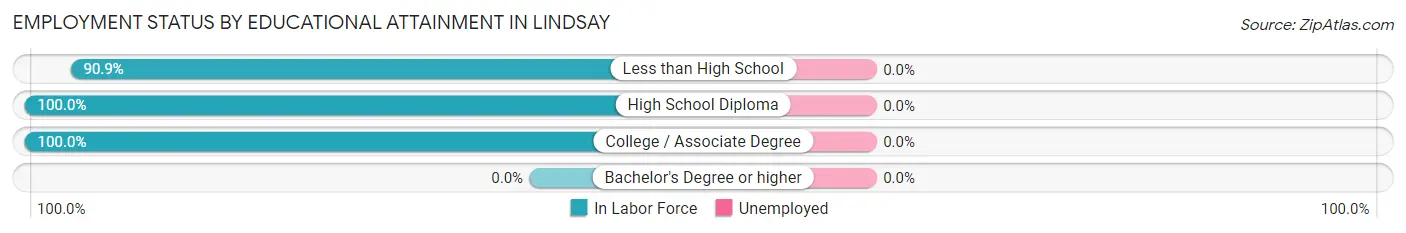
| Educational Attainment | In Labor Force | Unemployed |
| Less than High School | 199 (90.9%) | 0 (0.0%) |
| High School Diploma | 419 (100.0%) | 0 (0.0%) |
| College / Associate Degree | 81 (100.0%) | 0 (0.0%) |
| Bachelor's Degree or higher | 0 (0.0%) | 0 (0.0%) |
| Total | 699 (97.2%) | 0 (0.0%) |
Employment Occupations by Sex in Lindsay
Management, Business, Science and Arts Occupations
The most common Management, Business, Science and Arts occupations in Lindsay are , and Management (110 | 14.8%).
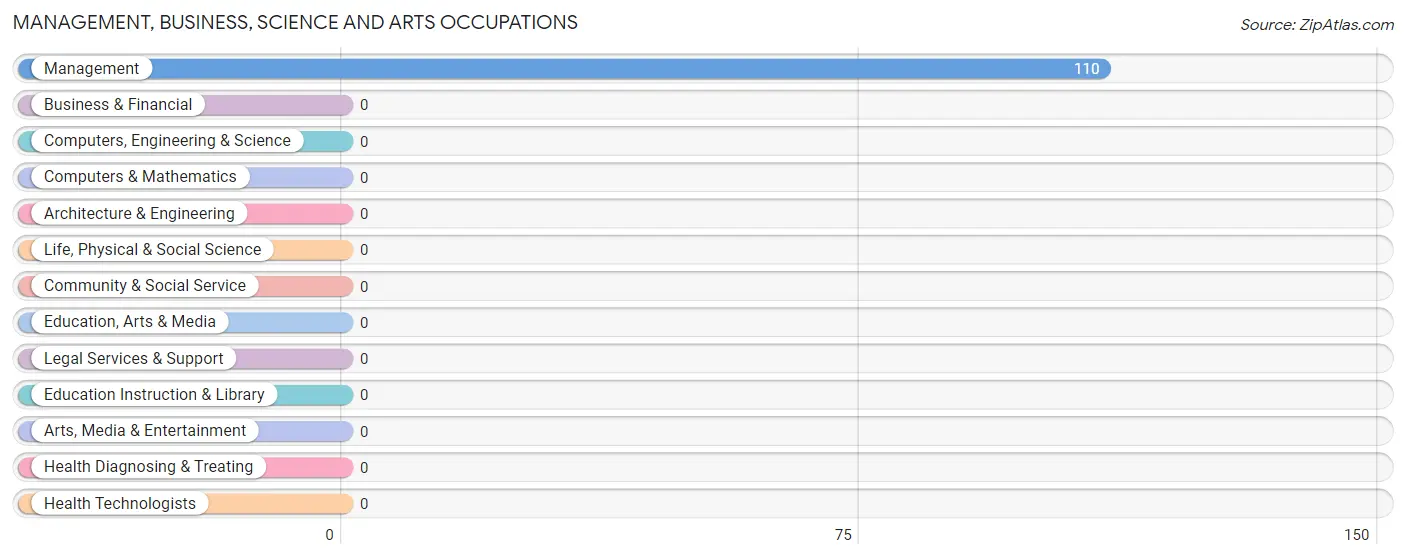
Management, Business, Science and Arts Occupations by Sex
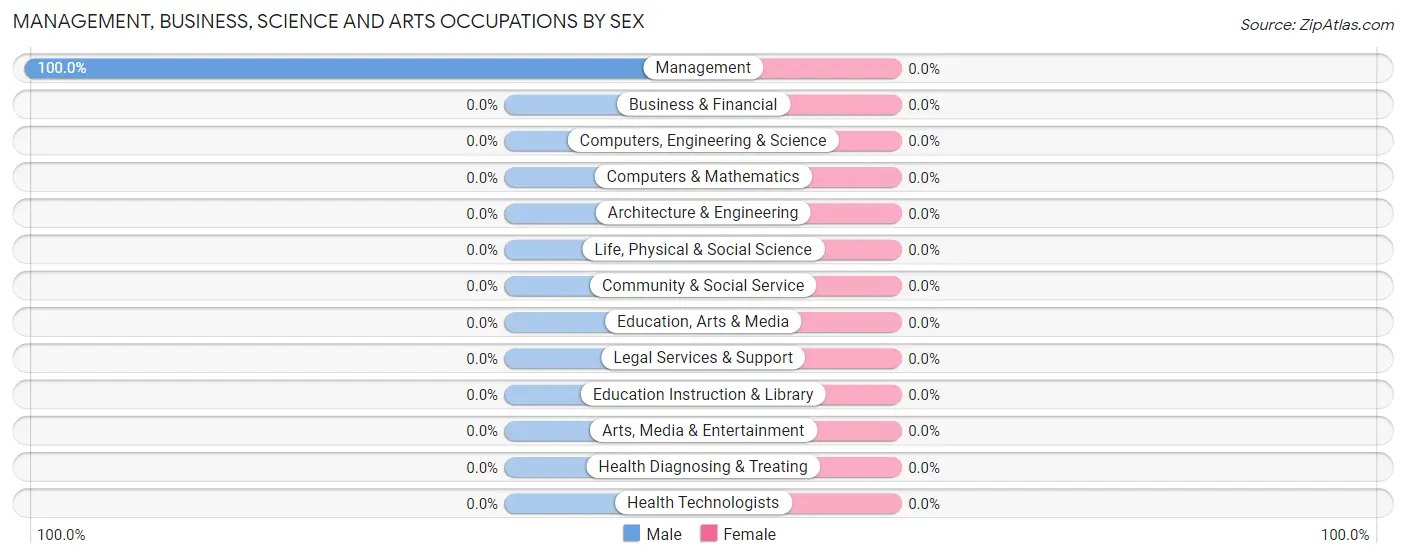
| Occupation | Male | Female |
| Management | 110 (100.0%) | 0 (0.0%) |
| Business & Financial | 0 (0.0%) | 0 (0.0%) |
| Computers, Engineering & Science | 0 (0.0%) | 0 (0.0%) |
| Computers & Mathematics | 0 (0.0%) | 0 (0.0%) |
| Architecture & Engineering | 0 (0.0%) | 0 (0.0%) |
| Life, Physical & Social Science | 0 (0.0%) | 0 (0.0%) |
| Community & Social Service | 0 (0.0%) | 0 (0.0%) |
| Education, Arts & Media | 0 (0.0%) | 0 (0.0%) |
| Legal Services & Support | 0 (0.0%) | 0 (0.0%) |
| Education Instruction & Library | 0 (0.0%) | 0 (0.0%) |
| Arts, Media & Entertainment | 0 (0.0%) | 0 (0.0%) |
| Health Diagnosing & Treating | 0 (0.0%) | 0 (0.0%) |
| Health Technologists | 0 (0.0%) | 0 (0.0%) |
| Total (Category) | 110 (100.0%) | 0 (0.0%) |
| Total (Overall) | 694 (93.3%) | 50 (6.7%) |
Services Occupations
The most common Services occupations in Lindsay are , and Food Preparation & Serving (97 | 13.0%).
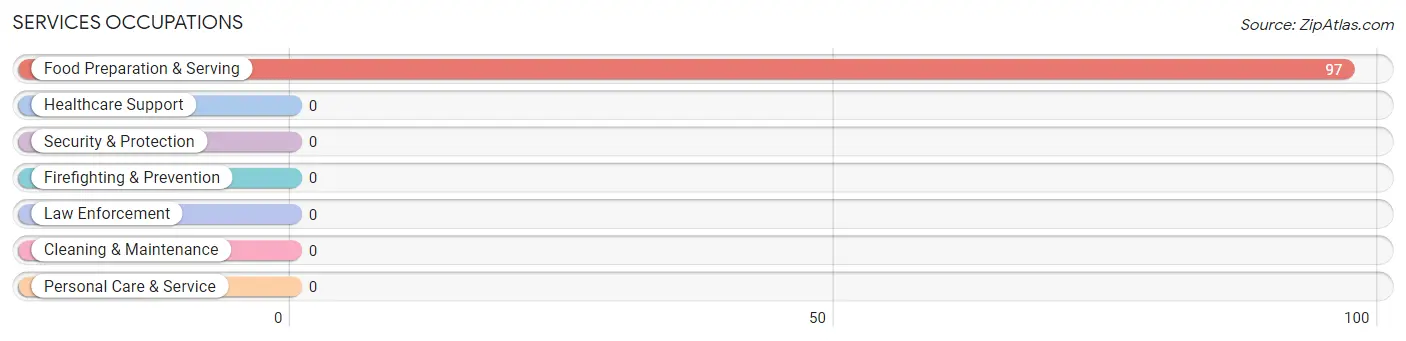
Services Occupations by Sex
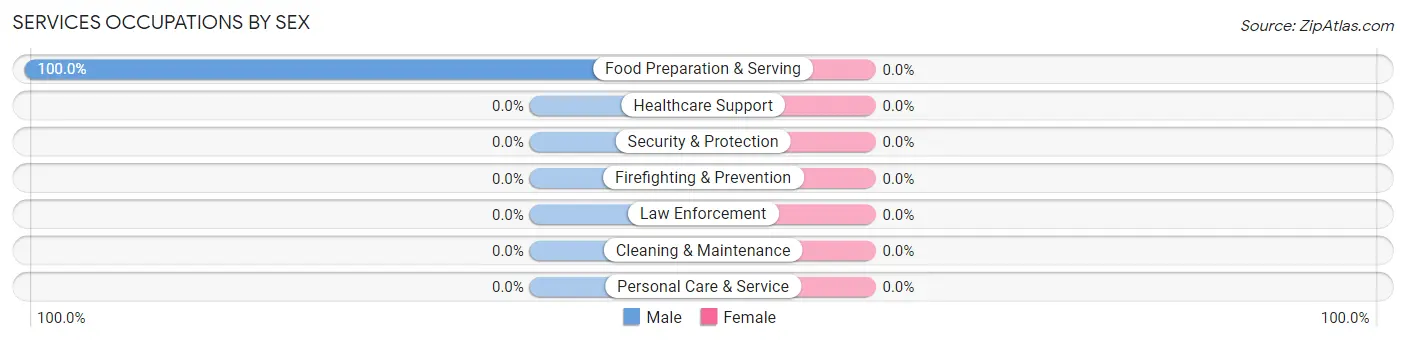
| Occupation | Male | Female |
| Healthcare Support | 0 (0.0%) | 0 (0.0%) |
| Security & Protection | 0 (0.0%) | 0 (0.0%) |
| Firefighting & Prevention | 0 (0.0%) | 0 (0.0%) |
| Law Enforcement | 0 (0.0%) | 0 (0.0%) |
| Food Preparation & Serving | 97 (100.0%) | 0 (0.0%) |
| Cleaning & Maintenance | 0 (0.0%) | 0 (0.0%) |
| Personal Care & Service | 0 (0.0%) | 0 (0.0%) |
| Total (Category) | 97 (100.0%) | 0 (0.0%) |
| Total (Overall) | 694 (93.3%) | 50 (6.7%) |
Sales and Office Occupations
The most common Sales and Office occupations in Lindsay are , and Office & Administration (12 | 1.6%).
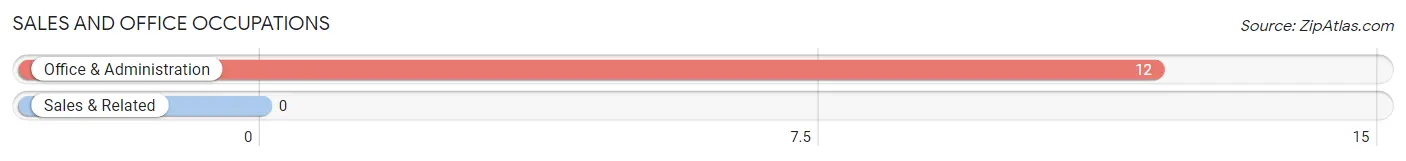
Sales and Office Occupations by Sex
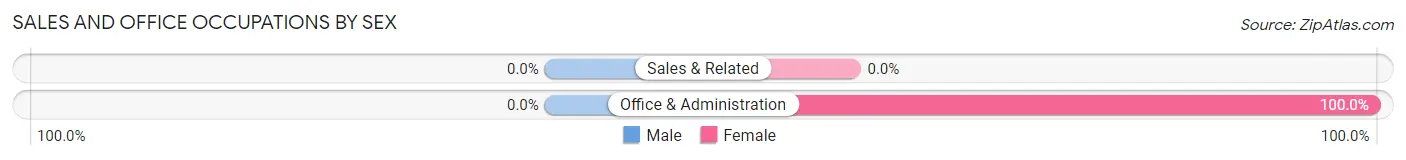
| Occupation | Male | Female |
| Sales & Related | 0 (0.0%) | 0 (0.0%) |
| Office & Administration | 0 (0.0%) | 12 (100.0%) |
| Total (Category) | 0 (0.0%) | 12 (100.0%) |
| Total (Overall) | 694 (93.3%) | 50 (6.7%) |
Natural Resources, Construction and Maintenance Occupations
The most common Natural Resources, Construction and Maintenance occupations in Lindsay are Construction & Extraction (261 | 35.1%), and Farming, Fishing & Forestry (158 | 21.2%).
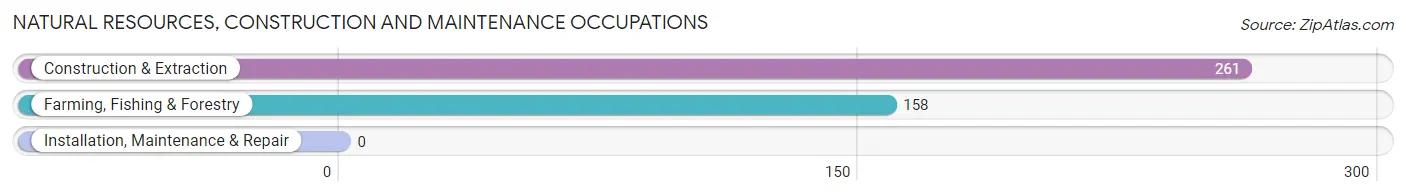
Natural Resources, Construction and Maintenance Occupations by Sex
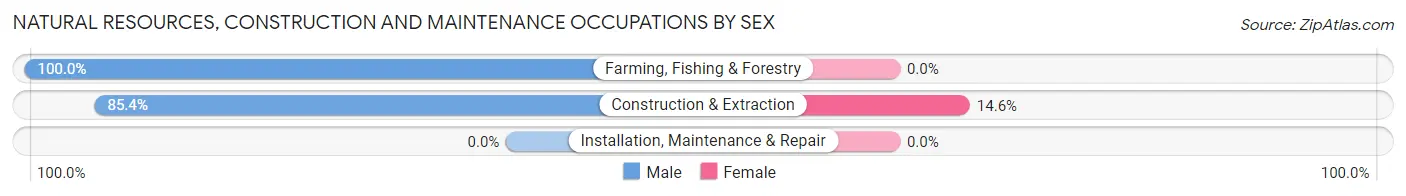
| Occupation | Male | Female |
| Farming, Fishing & Forestry | 158 (100.0%) | 0 (0.0%) |
| Construction & Extraction | 223 (85.4%) | 38 (14.6%) |
| Installation, Maintenance & Repair | 0 (0.0%) | 0 (0.0%) |
| Total (Category) | 381 (90.9%) | 38 (9.1%) |
| Total (Overall) | 694 (93.3%) | 50 (6.7%) |
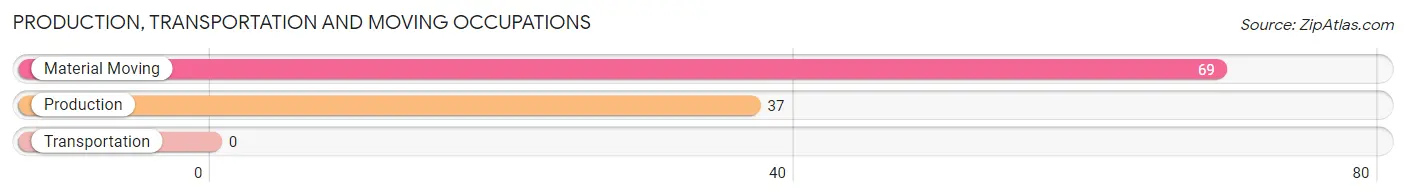
Production, Transportation and Moving Occupations
The most common Production, Transportation and Moving occupations in Lindsay are Material Moving (69 | 9.3%), and Production (37 | 5.0%).
Production, Transportation and Moving Occupations by Sex
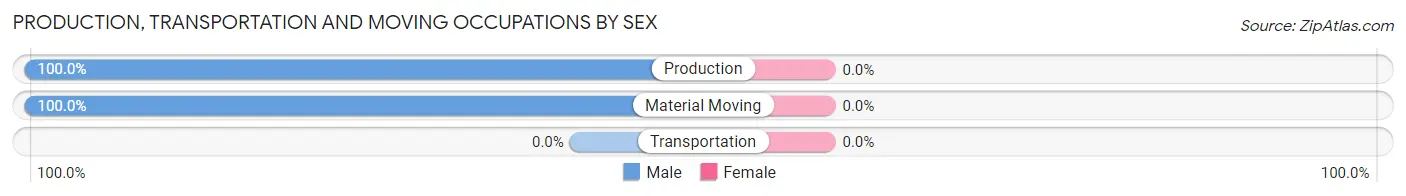
| Occupation | Male | Female |
| Production | 37 (100.0%) | 0 (0.0%) |
| Transportation | 0 (0.0%) | 0 (0.0%) |
| Material Moving | 69 (100.0%) | 0 (0.0%) |
| Total (Category) | 106 (100.0%) | 0 (0.0%) |
| Total (Overall) | 694 (93.3%) | 50 (6.7%) |
Employment Industries by Sex in Lindsay
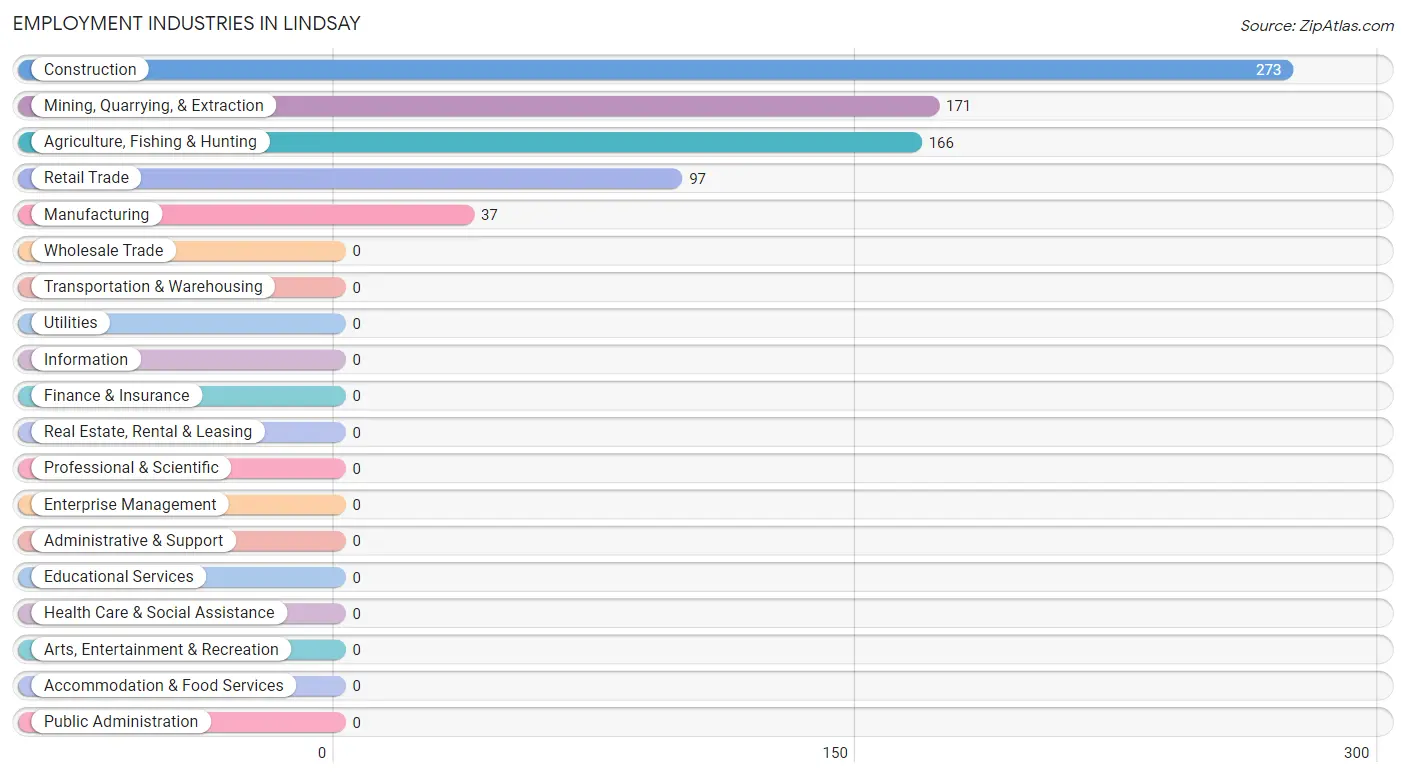
Employment Industries in Lindsay
The major employment industries in Lindsay include Construction (273 | 36.7%), Mining, Quarrying, & Extraction (171 | 23.0%), Agriculture, Fishing & Hunting (166 | 22.3%), Retail Trade (97 | 13.0%), and Manufacturing (37 | 5.0%).
Employment Industries by Sex in Lindsay
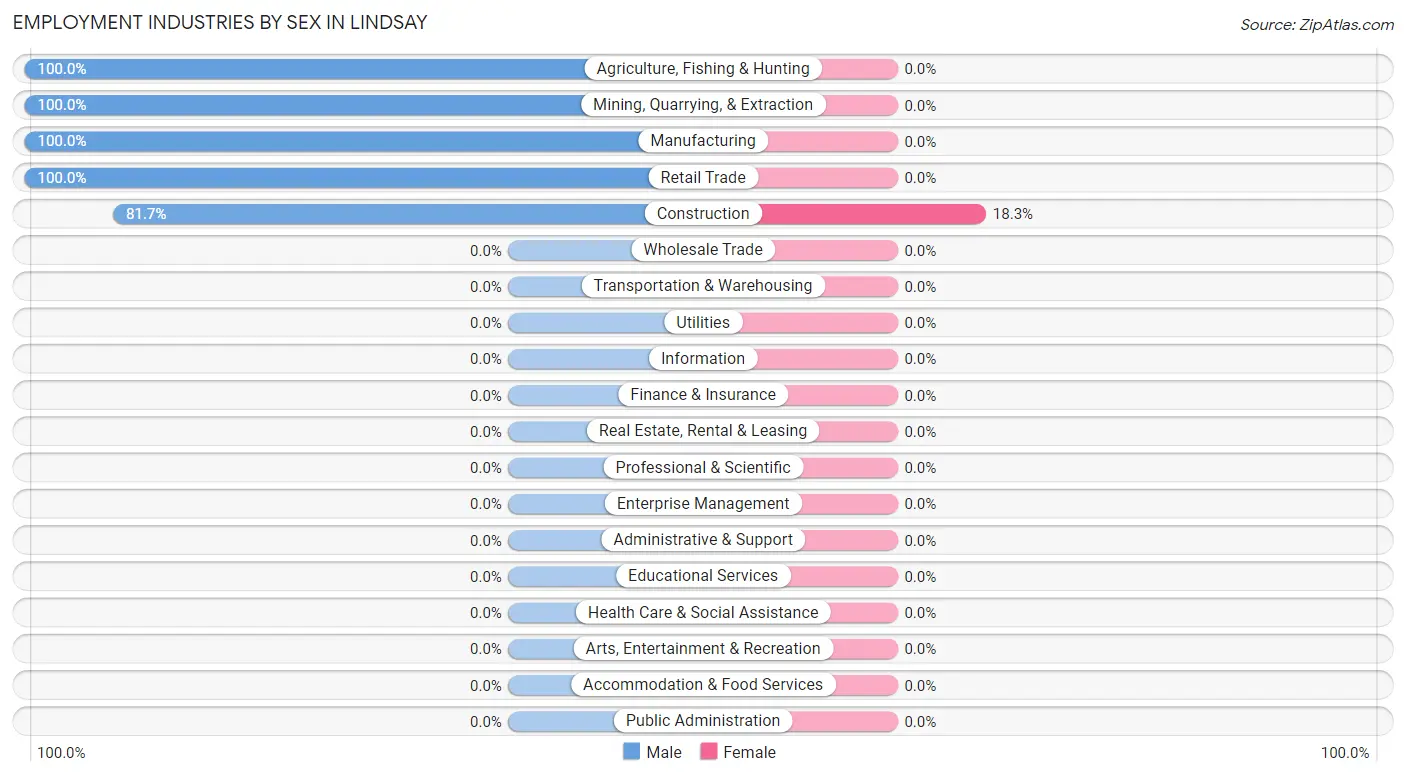
| Industry | Male | Female |
| Agriculture, Fishing & Hunting | 166 (100.0%) | 0 (0.0%) |
| Mining, Quarrying, & Extraction | 171 (100.0%) | 0 (0.0%) |
| Construction | 223 (81.7%) | 50 (18.3%) |
| Manufacturing | 37 (100.0%) | 0 (0.0%) |
| Wholesale Trade | 0 (0.0%) | 0 (0.0%) |
| Retail Trade | 97 (100.0%) | 0 (0.0%) |
| Transportation & Warehousing | 0 (0.0%) | 0 (0.0%) |
| Utilities | 0 (0.0%) | 0 (0.0%) |
| Information | 0 (0.0%) | 0 (0.0%) |
| Finance & Insurance | 0 (0.0%) | 0 (0.0%) |
| Real Estate, Rental & Leasing | 0 (0.0%) | 0 (0.0%) |
| Professional & Scientific | 0 (0.0%) | 0 (0.0%) |
| Enterprise Management | 0 (0.0%) | 0 (0.0%) |
| Administrative & Support | 0 (0.0%) | 0 (0.0%) |
| Educational Services | 0 (0.0%) | 0 (0.0%) |
| Health Care & Social Assistance | 0 (0.0%) | 0 (0.0%) |
| Arts, Entertainment & Recreation | 0 (0.0%) | 0 (0.0%) |
| Accommodation & Food Services | 0 (0.0%) | 0 (0.0%) |
| Public Administration | 0 (0.0%) | 0 (0.0%) |
| Total | 694 (93.3%) | 50 (6.7%) |
Education in Lindsay
School Enrollment in Lindsay
| School Level | # Students | % Students |
| Nursery / Preschool | 0 | 0.0% |
| Kindergarten | 0 | 0.0% |
| Elementary School | 0 | 0.0% |
| Middle School | 0 | 0.0% |
| High School | 0 | 0.0% |
| College / Undergraduate | 0 | 0.0% |
| Graduate / Professional | 0 | 0.0% |
| Total | 0 | 0.0% |
School Enrollment by Age by Funding Source in Lindsay
| Age Bracket | Public School | Private School |
| 3 to 4 Year Olds | 0 (0.0%) | 0 (0.0%) |
| 5 to 9 Year Old | 0 (0.0%) | 0 (0.0%) |
| 10 to 14 Year Olds | 0 (0.0%) | 0 (0.0%) |
| 15 to 17 Year Olds | 0 (0.0%) | 0 (0.0%) |
| 18 to 19 Year Olds | 0 (0.0%) | 0 (0.0%) |
| 20 to 24 Year Olds | 0 (0.0%) | 0 (0.0%) |
| 25 to 34 Year Olds | 0 (0.0%) | 0 (0.0%) |
| 35 Years and over | 0 (0.0%) | 0 (0.0%) |
| Total | 0 (0.0%) | 0 (0.0%) |
Educational Attainment by Field of Study in Lindsay
| Field of Study | # Graduates | % Graduates |
| Computers & Mathematics | 0 | 0.0% |
| Bio, Nature & Agricultural | 0 | 0.0% |
| Physical & Health Sciences | 0 | 0.0% |
| Psychology | 0 | 0.0% |
| Social Sciences | 0 | 0.0% |
| Engineering | 0 | 0.0% |
| Multidisciplinary Studies | 0 | 0.0% |
| Science & Technology | 0 | 0.0% |
| Business | 0 | 0.0% |
| Education | 0 | 0.0% |
| Literature & Languages | 0 | 0.0% |
| Liberal Arts & History | 0 | 0.0% |
| Visual & Performing Arts | 0 | 0.0% |
| Communications | 0 | 0.0% |
| Arts & Humanities | 0 | 0.0% |
| Total | 0 | 0.0% |
Transportation & Commute in Lindsay
Vehicle Availability by Sex in Lindsay
The most prevalent vehicle ownership categories in Lindsay are males with 1 vehicle (223, accounting for 32.1%) and females with 1 vehicle (38, making up 446.0%).
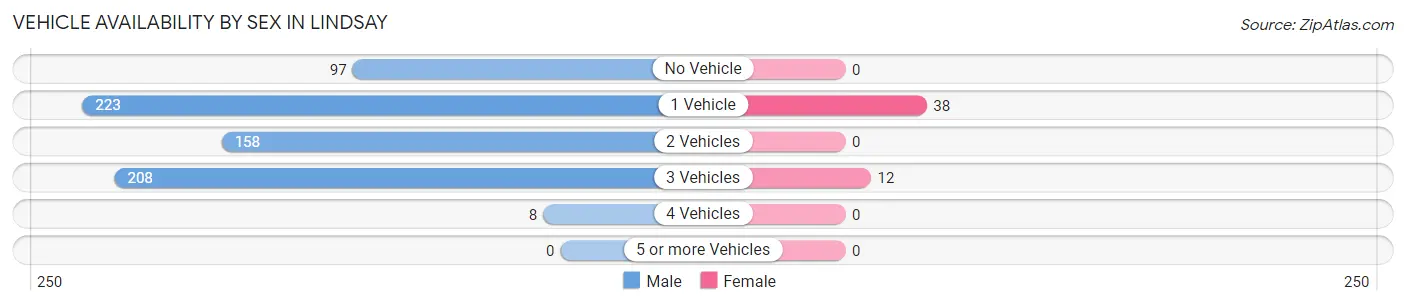
| Vehicles Available | Male | Female |
| No Vehicle | 97 (14.0%) | 0 (0.0%) |
| 1 Vehicle | 223 (32.1%) | 38 (76.0%) |
| 2 Vehicles | 158 (22.8%) | 0 (0.0%) |
| 3 Vehicles | 208 (30.0%) | 12 (24.0%) |
| 4 Vehicles | 8 (1.1%) | 0 (0.0%) |
| 5 or more Vehicles | 0 (0.0%) | 0 (0.0%) |
| Total | 694 (100.0%) | 50 (100.0%) |
Commute Time in Lindsay
The most frequently occuring commute durations in Lindsay are 15 to 19 minutes (260 commuters, 34.9%), 5 to 9 minutes (171 commuters, 23.0%), and 60 to 89 minutes (158 commuters, 21.2%).
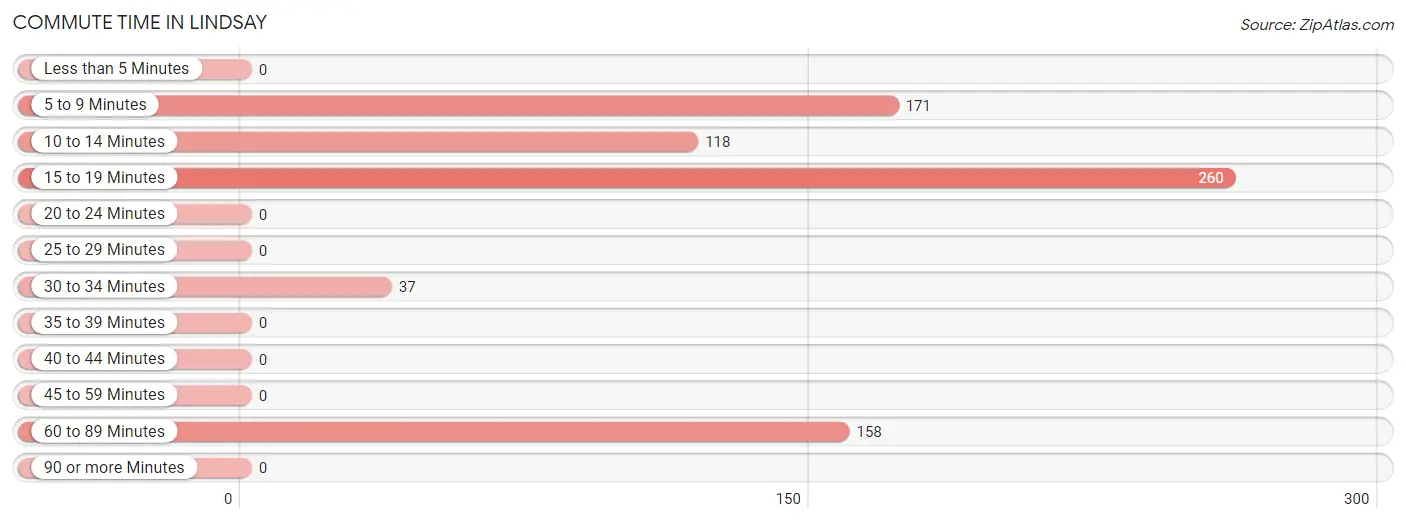
| Commute Time | # Commuters | % Commuters |
| Less than 5 Minutes | 0 | 0.0% |
| 5 to 9 Minutes | 171 | 23.0% |
| 10 to 14 Minutes | 118 | 15.9% |
| 15 to 19 Minutes | 260 | 34.9% |
| 20 to 24 Minutes | 0 | 0.0% |
| 25 to 29 Minutes | 0 | 0.0% |
| 30 to 34 Minutes | 37 | 5.0% |
| 35 to 39 Minutes | 0 | 0.0% |
| 40 to 44 Minutes | 0 | 0.0% |
| 45 to 59 Minutes | 0 | 0.0% |
| 60 to 89 Minutes | 158 | 21.2% |
| 90 or more Minutes | 0 | 0.0% |
Commute Time by Sex in Lindsay
The most common commute times in Lindsay are 15 to 19 minutes (222 commuters, 32.0%) for males and 15 to 19 minutes (38 commuters, 76.0%) for females.
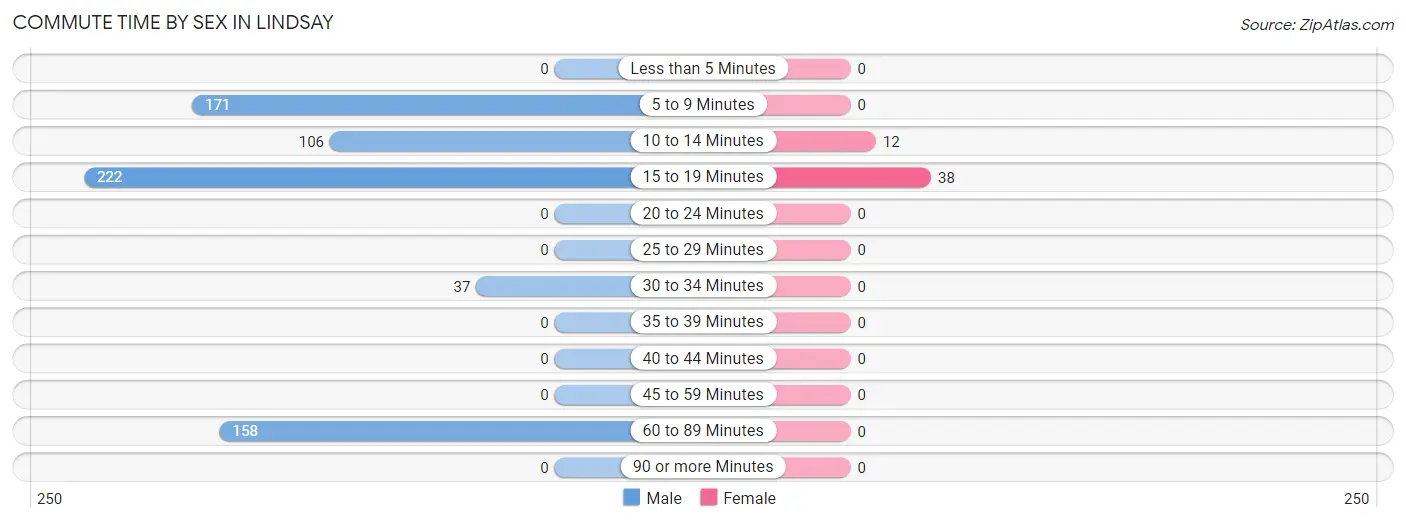
| Commute Time | Male | Female |
| Less than 5 Minutes | 0 (0.0%) | 0 (0.0%) |
| 5 to 9 Minutes | 171 (24.6%) | 0 (0.0%) |
| 10 to 14 Minutes | 106 (15.3%) | 12 (24.0%) |
| 15 to 19 Minutes | 222 (32.0%) | 38 (76.0%) |
| 20 to 24 Minutes | 0 (0.0%) | 0 (0.0%) |
| 25 to 29 Minutes | 0 (0.0%) | 0 (0.0%) |
| 30 to 34 Minutes | 37 (5.3%) | 0 (0.0%) |
| 35 to 39 Minutes | 0 (0.0%) | 0 (0.0%) |
| 40 to 44 Minutes | 0 (0.0%) | 0 (0.0%) |
| 45 to 59 Minutes | 0 (0.0%) | 0 (0.0%) |
| 60 to 89 Minutes | 158 (22.8%) | 0 (0.0%) |
| 90 or more Minutes | 0 (0.0%) | 0 (0.0%) |
Time of Departure to Work by Sex in Lindsay
The most frequent times of departure to work in Lindsay are 6:00 AM to 6:29 AM (325, 46.8%) for males and 9:00 AM to 9:59 AM (38, 76.0%) for females.
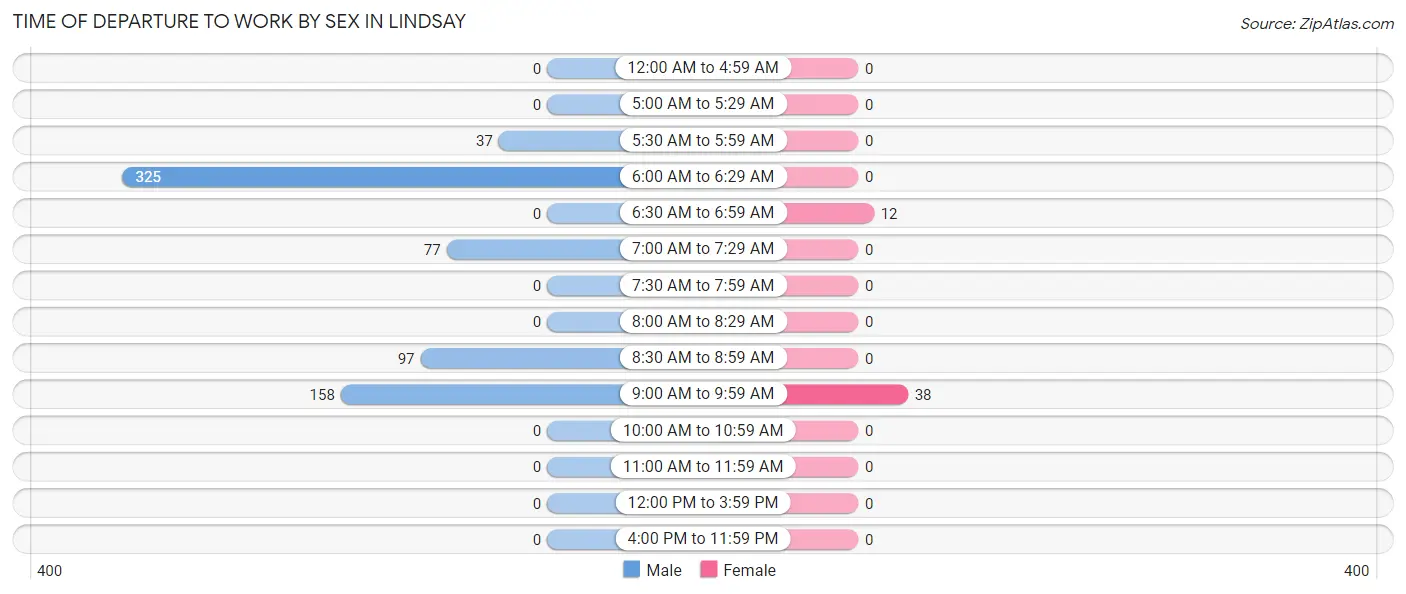
| Time of Departure | Male | Female |
| 12:00 AM to 4:59 AM | 0 (0.0%) | 0 (0.0%) |
| 5:00 AM to 5:29 AM | 0 (0.0%) | 0 (0.0%) |
| 5:30 AM to 5:59 AM | 37 (5.3%) | 0 (0.0%) |
| 6:00 AM to 6:29 AM | 325 (46.8%) | 0 (0.0%) |
| 6:30 AM to 6:59 AM | 0 (0.0%) | 12 (24.0%) |
| 7:00 AM to 7:29 AM | 77 (11.1%) | 0 (0.0%) |
| 7:30 AM to 7:59 AM | 0 (0.0%) | 0 (0.0%) |
| 8:00 AM to 8:29 AM | 0 (0.0%) | 0 (0.0%) |
| 8:30 AM to 8:59 AM | 97 (14.0%) | 0 (0.0%) |
| 9:00 AM to 9:59 AM | 158 (22.8%) | 38 (76.0%) |
| 10:00 AM to 10:59 AM | 0 (0.0%) | 0 (0.0%) |
| 11:00 AM to 11:59 AM | 0 (0.0%) | 0 (0.0%) |
| 12:00 PM to 3:59 PM | 0 (0.0%) | 0 (0.0%) |
| 4:00 PM to 11:59 PM | 0 (0.0%) | 0 (0.0%) |
| Total | 694 (100.0%) | 50 (100.0%) |
Housing Occupancy in Lindsay
Occupancy by Ownership in Lindsay
Of the total 432 dwellings in Lindsay, owner-occupied units account for 377 (87.3%), while renter-occupied units make up 55 (12.7%).
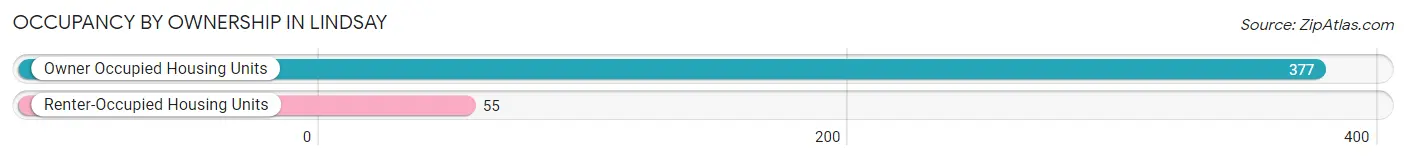
| Occupancy | # Housing Units | % Housing Units |
| Owner Occupied Housing Units | 377 | 87.3% |
| Renter-Occupied Housing Units | 55 | 12.7% |
| Total Occupied Housing Units | 432 | 100.0% |
Occupancy by Household Size in Lindsay
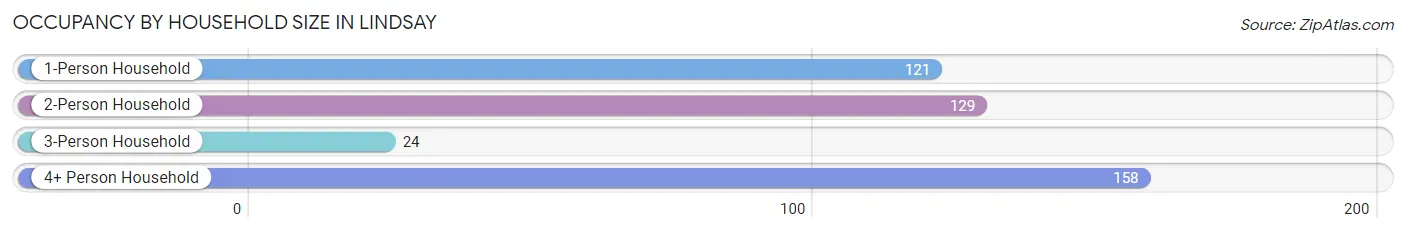
| Household Size | # Housing Units | % Housing Units |
| 1-Person Household | 121 | 28.0% |
| 2-Person Household | 129 | 29.9% |
| 3-Person Household | 24 | 5.6% |
| 4+ Person Household | 158 | 36.6% |
| Total Housing Units | 432 | 100.0% |
Occupancy by Ownership by Household Size in Lindsay
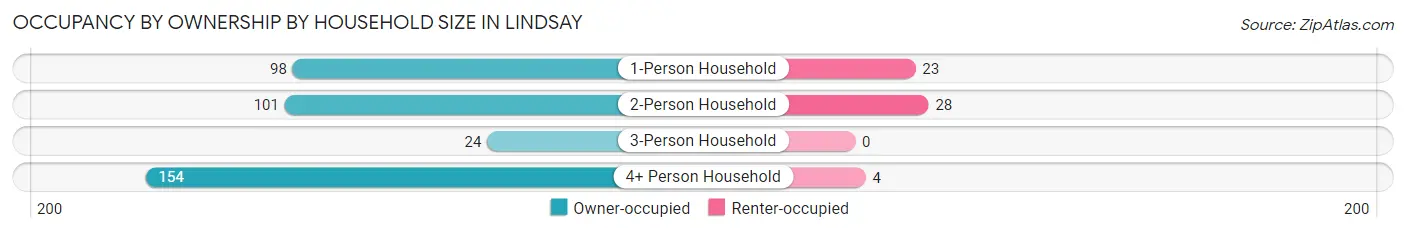
| Household Size | Owner-occupied | Renter-occupied |
| 1-Person Household | 98 (81.0%) | 23 (19.0%) |
| 2-Person Household | 101 (78.3%) | 28 (21.7%) |
| 3-Person Household | 24 (100.0%) | 0 (0.0%) |
| 4+ Person Household | 154 (97.5%) | 4 (2.5%) |
| Total Housing Units | 377 (87.3%) | 55 (12.7%) |
Occupancy by Educational Attainment in Lindsay
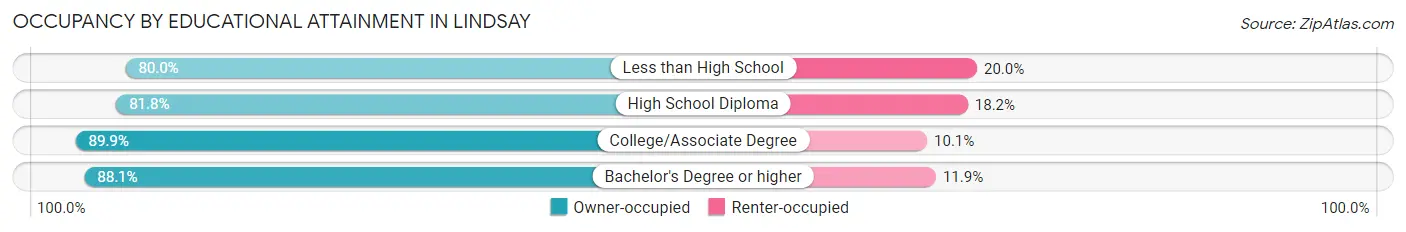
| Household Size | Owner-occupied | Renter-occupied |
| Less than High School | 32 (80.0%) | 8 (20.0%) |
| High School Diploma | 54 (81.8%) | 12 (18.2%) |
| College/Associate Degree | 187 (89.9%) | 21 (10.1%) |
| Bachelor's Degree or higher | 104 (88.1%) | 14 (11.9%) |
Occupancy by Age of Householder in Lindsay
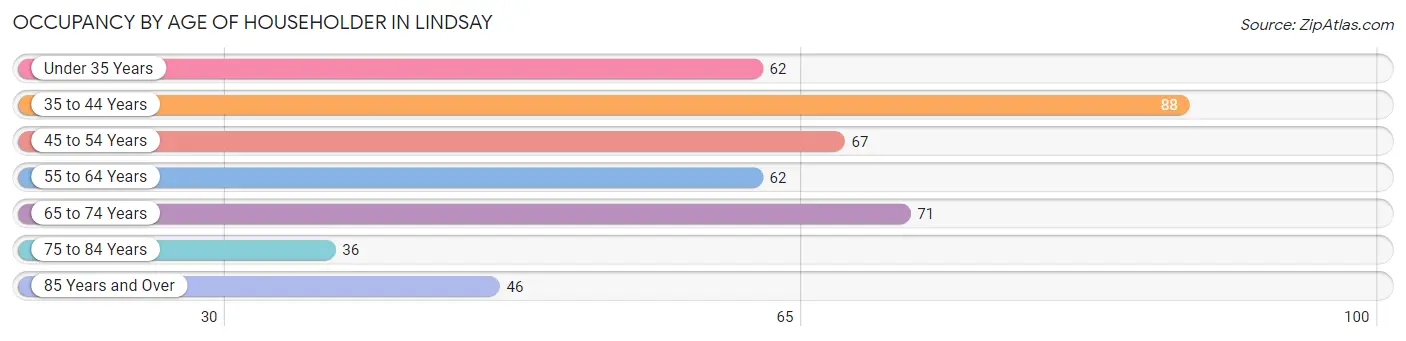
| Age Bracket | # Households | % Households |
| Under 35 Years | 62 | 14.3% |
| 35 to 44 Years | 88 | 20.4% |
| 45 to 54 Years | 67 | 15.5% |
| 55 to 64 Years | 62 | 14.3% |
| 65 to 74 Years | 71 | 16.4% |
| 75 to 84 Years | 36 | 8.3% |
| 85 Years and Over | 46 | 10.6% |
| Total | 432 | 100.0% |
Housing Finances in Lindsay
Median Income by Occupancy in Lindsay
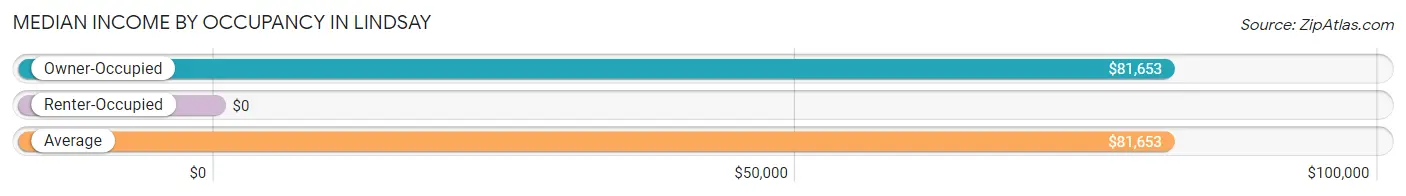
| Occupancy Type | # Households | Median Income |
| Owner-Occupied | 351 (100.0%) | $81,653 |
| Renter-Occupied | 0 (0.0%) | $0 |
| Average | 351 (100.0%) | $81,653 |
Occupancy by Householder Income Bracket in Lindsay
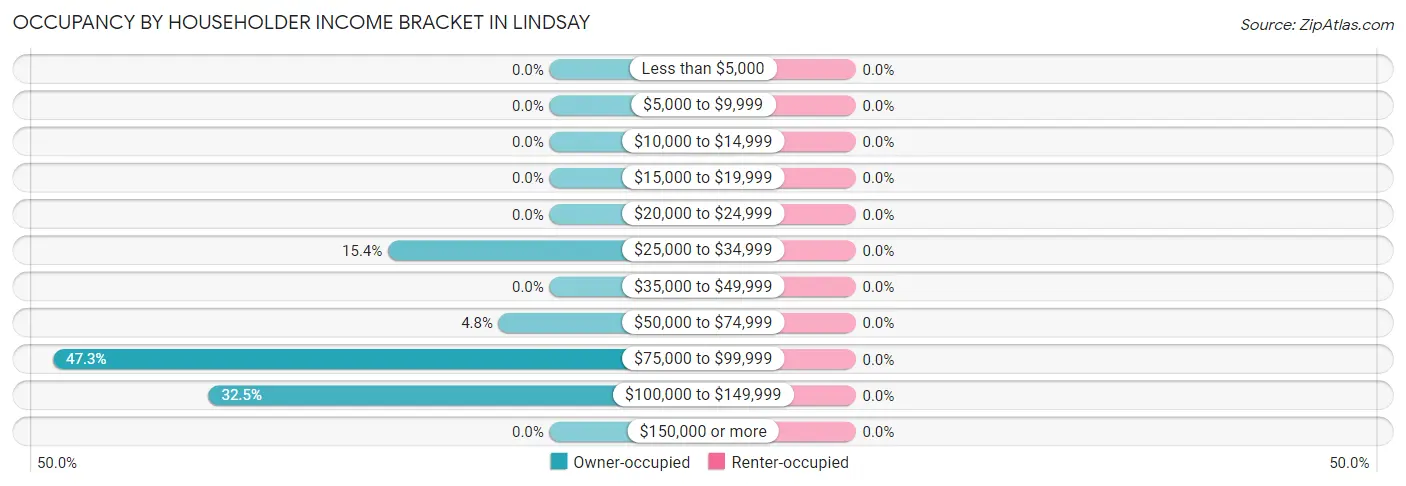
| Income Bracket | Owner-occupied | Renter-occupied |
| Less than $5,000 | 0 (0.0%) | 0 (0.0%) |
| $5,000 to $9,999 | 0 (0.0%) | 0 (0.0%) |
| $10,000 to $14,999 | 0 (0.0%) | 0 (0.0%) |
| $15,000 to $19,999 | 0 (0.0%) | 0 (0.0%) |
| $20,000 to $24,999 | 0 (0.0%) | 0 (0.0%) |
| $25,000 to $34,999 | 54 (15.4%) | 0 (0.0%) |
| $35,000 to $49,999 | 0 (0.0%) | 0 (0.0%) |
| $50,000 to $74,999 | 17 (4.8%) | 0 (0.0%) |
| $75,000 to $99,999 | 166 (47.3%) | 0 (0.0%) |
| $100,000 to $149,999 | 114 (32.5%) | 0 (0.0%) |
| $150,000 or more | 0 (0.0%) | 0 (0.0%) |
| Total | 351 (100.0%) | 0 (0.0%) |
Monthly Housing Cost Tiers in Lindsay
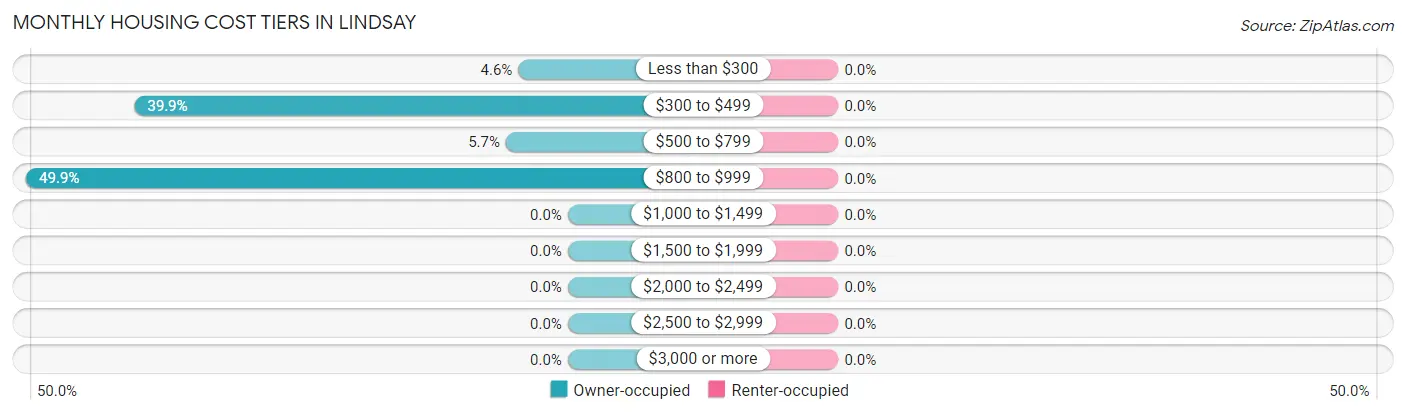
| Monthly Cost | Owner-occupied | Renter-occupied |
| Less than $300 | 16 (4.6%) | 0 (0.0%) |
| $300 to $499 | 140 (39.9%) | 0 (0.0%) |
| $500 to $799 | 20 (5.7%) | 0 (0.0%) |
| $800 to $999 | 175 (49.9%) | 0 (0.0%) |
| $1,000 to $1,499 | 0 (0.0%) | 0 (0.0%) |
| $1,500 to $1,999 | 0 (0.0%) | 0 (0.0%) |
| $2,000 to $2,499 | 0 (0.0%) | 0 (0.0%) |
| $2,500 to $2,999 | 0 (0.0%) | 0 (0.0%) |
| $3,000 or more | 0 (0.0%) | 0 (0.0%) |
| Total | 351 (100.0%) | 0 (0.0%) |
Physical Housing Characteristics in Lindsay
Housing Structures in Lindsay
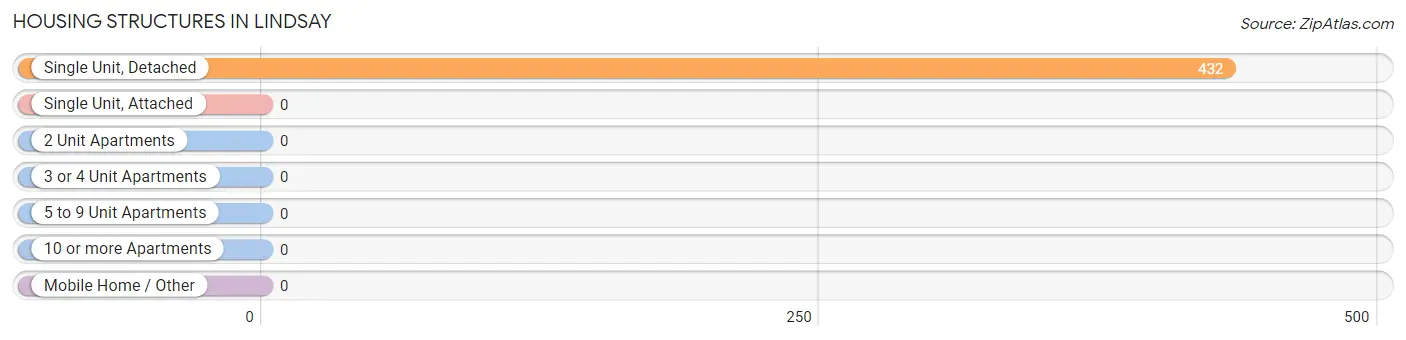
| Structure Type | # Housing Units | % Housing Units |
| Single Unit, Detached | 432 | 100.0% |
| Single Unit, Attached | 0 | 0.0% |
| 2 Unit Apartments | 0 | 0.0% |
| 3 or 4 Unit Apartments | 0 | 0.0% |
| 5 to 9 Unit Apartments | 0 | 0.0% |
| 10 or more Apartments | 0 | 0.0% |
| Mobile Home / Other | 0 | 0.0% |
| Total | 432 | 100.0% |
Housing Structures by Occupancy in Lindsay
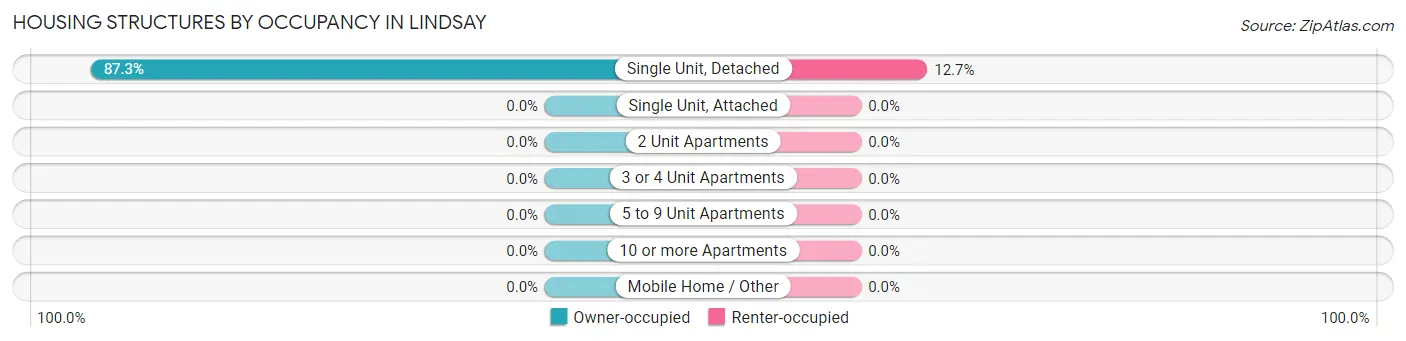
| Structure Type | Owner-occupied | Renter-occupied |
| Single Unit, Detached | 377 (87.3%) | 55 (12.7%) |
| Single Unit, Attached | 0 (0.0%) | 0 (0.0%) |
| 2 Unit Apartments | 0 (0.0%) | 0 (0.0%) |
| 3 or 4 Unit Apartments | 0 (0.0%) | 0 (0.0%) |
| 5 to 9 Unit Apartments | 0 (0.0%) | 0 (0.0%) |
| 10 or more Apartments | 0 (0.0%) | 0 (0.0%) |
| Mobile Home / Other | 0 (0.0%) | 0 (0.0%) |
| Total | 377 (87.3%) | 55 (12.7%) |
Housing Structures by Number of Rooms in Lindsay
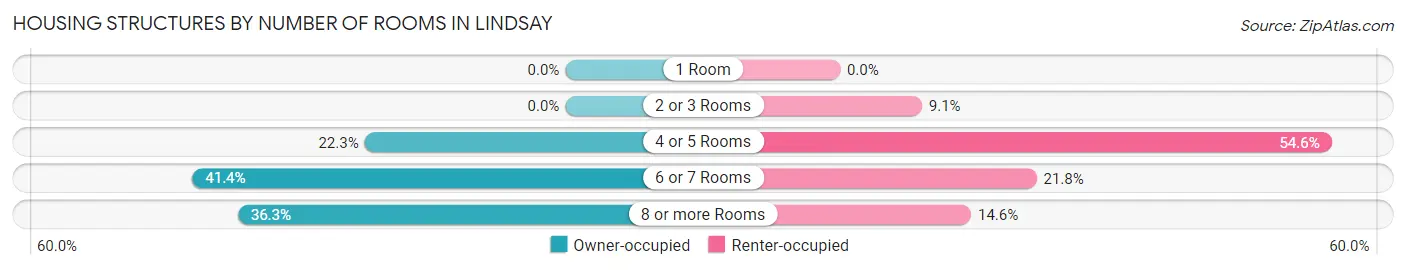
| Number of Rooms | Owner-occupied | Renter-occupied |
| 1 Room | 0 (0.0%) | 0 (0.0%) |
| 2 or 3 Rooms | 0 (0.0%) | 5 (9.1%) |
| 4 or 5 Rooms | 84 (22.3%) | 30 (54.5%) |
| 6 or 7 Rooms | 156 (41.4%) | 12 (21.8%) |
| 8 or more Rooms | 137 (36.3%) | 8 (14.5%) |
| Total | 377 (100.0%) | 55 (100.0%) |
Housing Structure by Heating Type in Lindsay
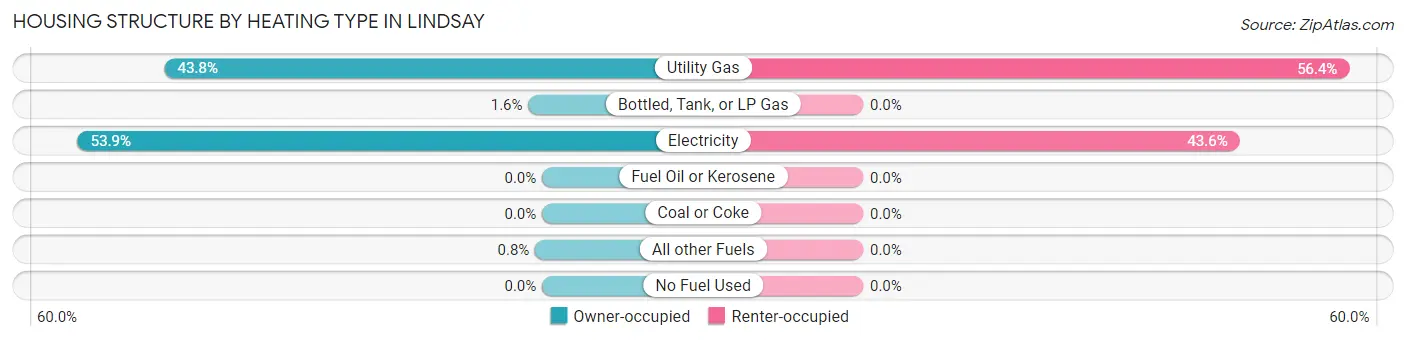
| Heating Type | Owner-occupied | Renter-occupied |
| Utility Gas | 165 (43.8%) | 31 (56.4%) |
| Bottled, Tank, or LP Gas | 6 (1.6%) | 0 (0.0%) |
| Electricity | 203 (53.8%) | 24 (43.6%) |
| Fuel Oil or Kerosene | 0 (0.0%) | 0 (0.0%) |
| Coal or Coke | 0 (0.0%) | 0 (0.0%) |
| All other Fuels | 3 (0.8%) | 0 (0.0%) |
| No Fuel Used | 0 (0.0%) | 0 (0.0%) |
| Total | 377 (100.0%) | 55 (100.0%) |
Household Vehicle Usage in Lindsay
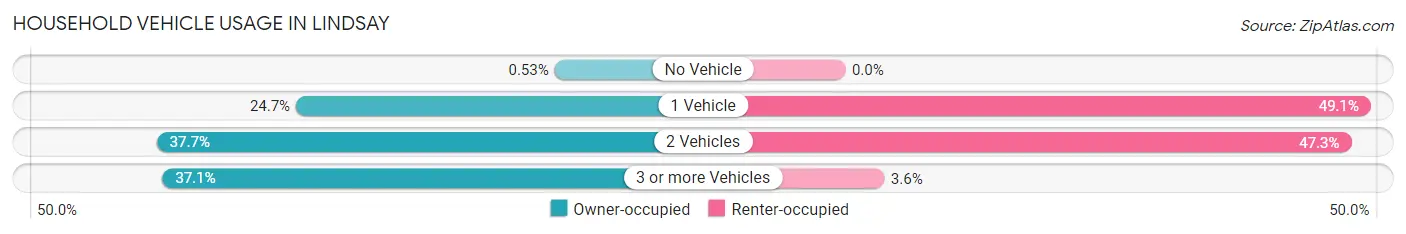
| Vehicles per Household | Owner-occupied | Renter-occupied |
| No Vehicle | 2 (0.5%) | 0 (0.0%) |
| 1 Vehicle | 93 (24.7%) | 27 (49.1%) |
| 2 Vehicles | 142 (37.7%) | 26 (47.3%) |
| 3 or more Vehicles | 140 (37.1%) | 2 (3.6%) |
| Total | 377 (100.0%) | 55 (100.0%) |
Real Estate & Mortgages in Lindsay
Real Estate and Mortgage Overview in Lindsay
| Characteristic | Without Mortgage | With Mortgage |
| Housing Units | 187 | 9 |
| Median Property Value | $220,500 | $0 |
| Median Household Income | $51,827 | $0 |
| Monthly Housing Costs | $760 | $0 |
| Real Estate Taxes | $3,675 | $0 |
Property Value by Mortgage Status in Lindsay
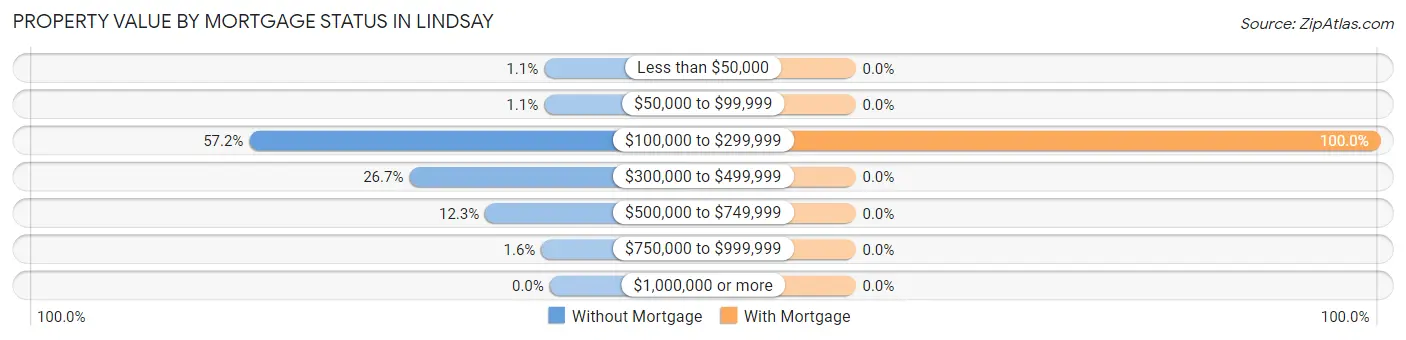
| Property Value | Without Mortgage | With Mortgage |
| Less than $50,000 | 2 (1.1%) | 0 (0.0%) |
| $50,000 to $99,999 | 2 (1.1%) | 0 (0.0%) |
| $100,000 to $299,999 | 107 (57.2%) | 9 (100.0%) |
| $300,000 to $499,999 | 50 (26.7%) | 0 (0.0%) |
| $500,000 to $749,999 | 23 (12.3%) | 0 (0.0%) |
| $750,000 to $999,999 | 3 (1.6%) | 0 (0.0%) |
| $1,000,000 or more | 0 (0.0%) | 0 (0.0%) |
| Total | 187 (100.0%) | 9 (100.0%) |
Household Income by Mortgage Status in Lindsay
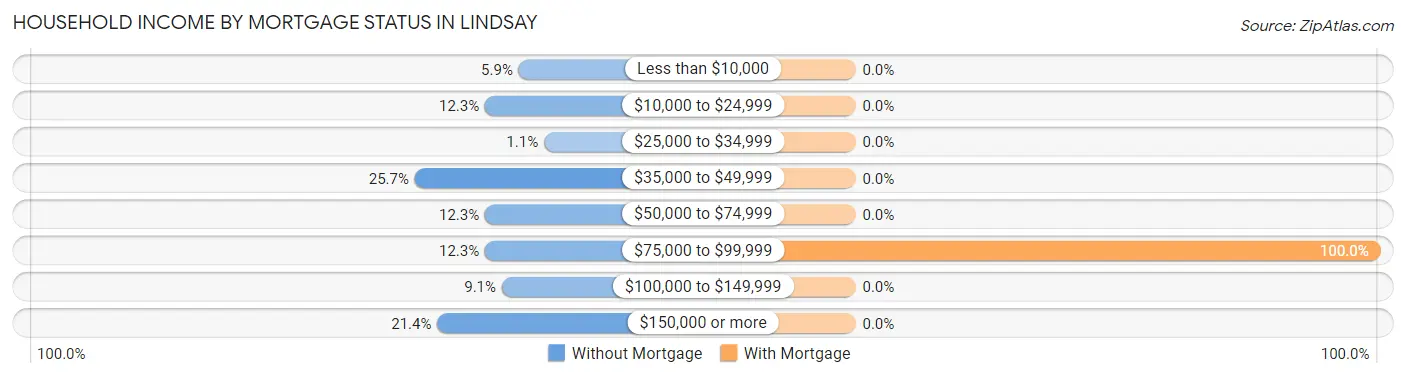
| Household Income | Without Mortgage | With Mortgage |
| Less than $10,000 | 11 (5.9%) | 0 (0.0%) |
| $10,000 to $24,999 | 23 (12.3%) | 0 (0.0%) |
| $25,000 to $34,999 | 2 (1.1%) | 0 (0.0%) |
| $35,000 to $49,999 | 48 (25.7%) | 0 (0.0%) |
| $50,000 to $74,999 | 23 (12.3%) | 0 (0.0%) |
| $75,000 to $99,999 | 23 (12.3%) | 9 (100.0%) |
| $100,000 to $149,999 | 17 (9.1%) | 0 (0.0%) |
| $150,000 or more | 40 (21.4%) | 0 (0.0%) |
| Total | 187 (100.0%) | 9 (100.0%) |
Property Value to Household Income Ratio in Lindsay
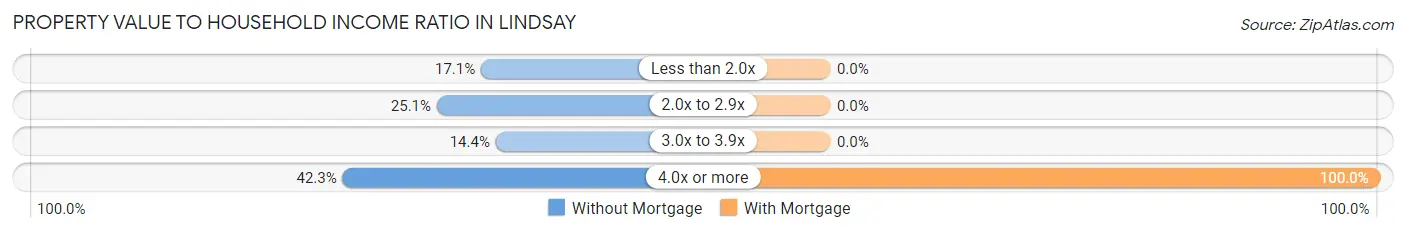
| Value-to-Income Ratio | Without Mortgage | With Mortgage |
| Less than 2.0x | 32 (17.1%) | 0 (0.0%) |
| 2.0x to 2.9x | 47 (25.1%) | 0 (0.0%) |
| 3.0x to 3.9x | 27 (14.4%) | 0 (0.0%) |
| 4.0x or more | 79 (42.2%) | 9 (100.0%) |
| Total | 187 (100.0%) | 9 (100.0%) |
Real Estate Taxes by Mortgage Status in Lindsay
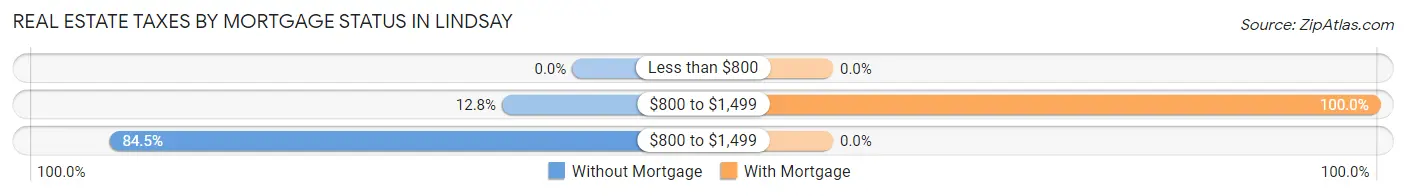
| Property Taxes | Without Mortgage | With Mortgage |
| Less than $800 | 0 (0.0%) | 0 (0.0%) |
| $800 to $1,499 | 24 (12.8%) | 9 (100.0%) |
| $800 to $1,499 | 158 (84.5%) | 0 (0.0%) |
| Total | 187 (100.0%) | 9 (100.0%) |
Health & Disability in Lindsay
Health Insurance Coverage by Age in Lindsay
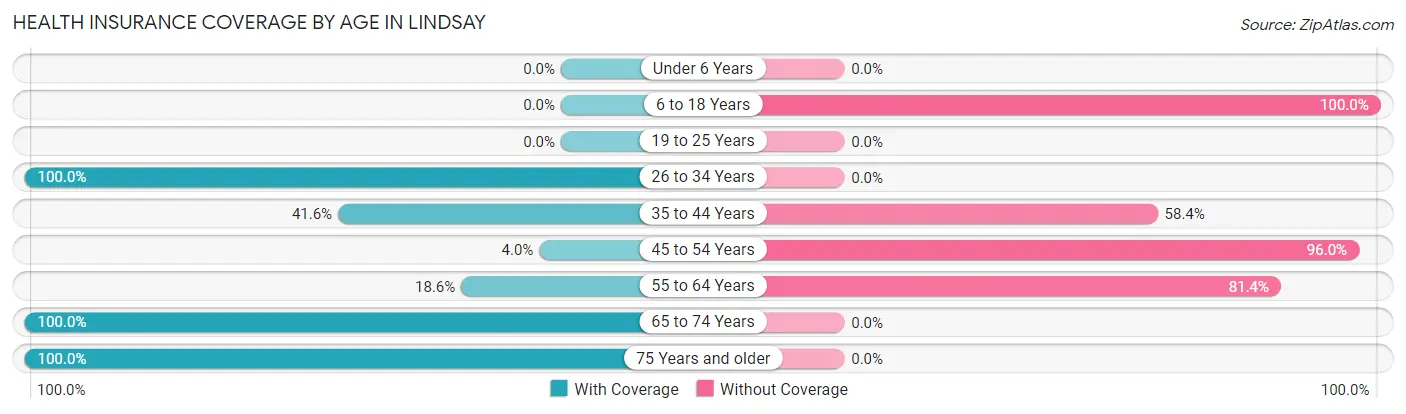
| Age Bracket | With Coverage | Without Coverage |
| Under 6 Years | 0 (0.0%) | 0 (0.0%) |
| 6 to 18 Years | 0 (0.0%) | 37 (100.0%) |
| 19 to 25 Years | 0 (0.0%) | 0 (0.0%) |
| 26 to 34 Years | 158 (100.0%) | 0 (0.0%) |
| 35 to 44 Years | 69 (41.6%) | 97 (58.4%) |
| 45 to 54 Years | 9 (4.0%) | 214 (96.0%) |
| 55 to 64 Years | 32 (18.6%) | 140 (81.4%) |
| 65 to 74 Years | 8 (100.0%) | 0 (0.0%) |
| 75 Years and older | 25 (100.0%) | 0 (0.0%) |
| Total | 301 (38.2%) | 488 (61.9%) |
Health Insurance Coverage by Citizenship Status in Lindsay
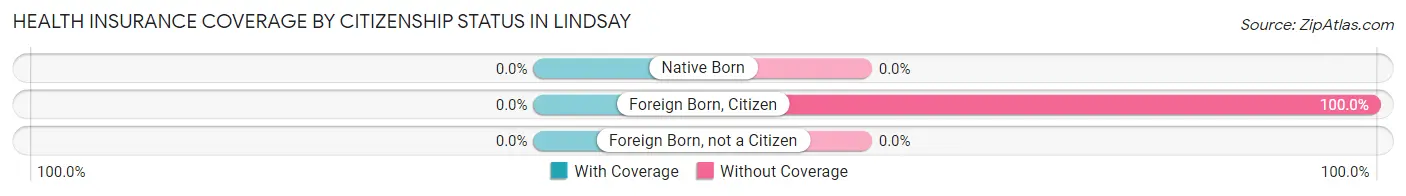
| Citizenship Status | With Coverage | Without Coverage |
| Native Born | 0 (0.0%) | 0 (0.0%) |
| Foreign Born, Citizen | 0 (0.0%) | 37 (100.0%) |
| Foreign Born, not a Citizen | 0 (0.0%) | 0 (0.0%) |
Health Insurance Coverage by Household Income in Lindsay
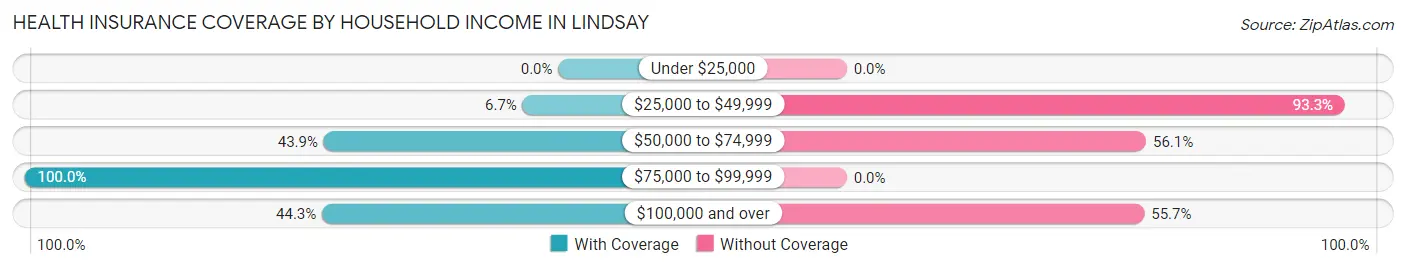
| Household Income | With Coverage | Without Coverage |
| Under $25,000 | 0 (0.0%) | 0 (0.0%) |
| $25,000 to $49,999 | 25 (6.7%) | 349 (93.3%) |
| $50,000 to $74,999 | 29 (43.9%) | 37 (56.1%) |
| $75,000 to $99,999 | 166 (100.0%) | 0 (0.0%) |
| $100,000 and over | 81 (44.3%) | 102 (55.7%) |
Public vs Private Health Insurance Coverage by Age in Lindsay
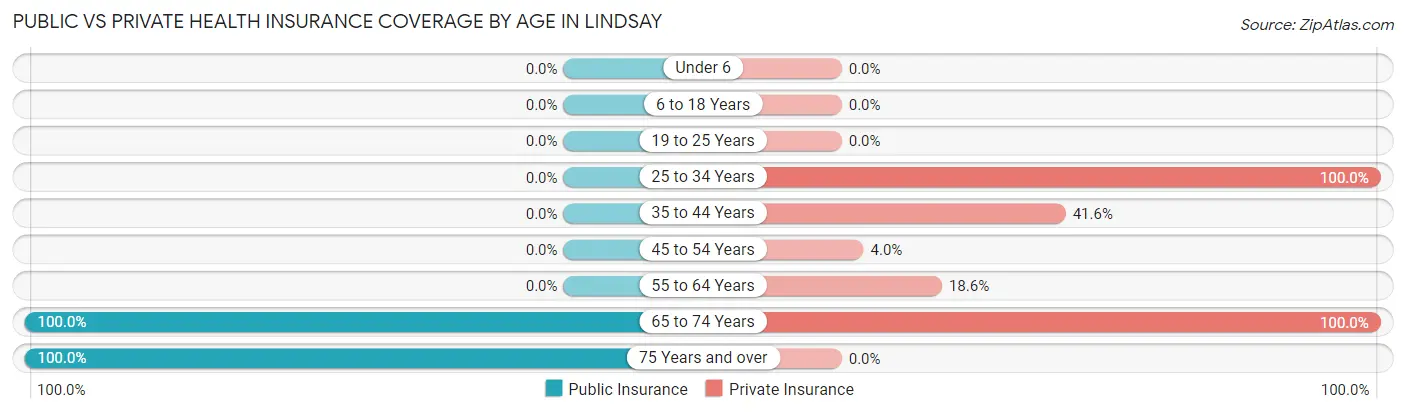
| Age Bracket | Public Insurance | Private Insurance |
| Under 6 | 0 (0.0%) | 0 (0.0%) |
| 6 to 18 Years | 0 (0.0%) | 0 (0.0%) |
| 19 to 25 Years | 0 (0.0%) | 0 (0.0%) |
| 25 to 34 Years | 0 (0.0%) | 158 (100.0%) |
| 35 to 44 Years | 0 (0.0%) | 69 (41.6%) |
| 45 to 54 Years | 0 (0.0%) | 9 (4.0%) |
| 55 to 64 Years | 0 (0.0%) | 32 (18.6%) |
| 65 to 74 Years | 8 (100.0%) | 8 (100.0%) |
| 75 Years and over | 25 (100.0%) | 0 (0.0%) |
| Total | 33 (4.2%) | 276 (35.0%) |
Disability Status by Sex by Age in Lindsay
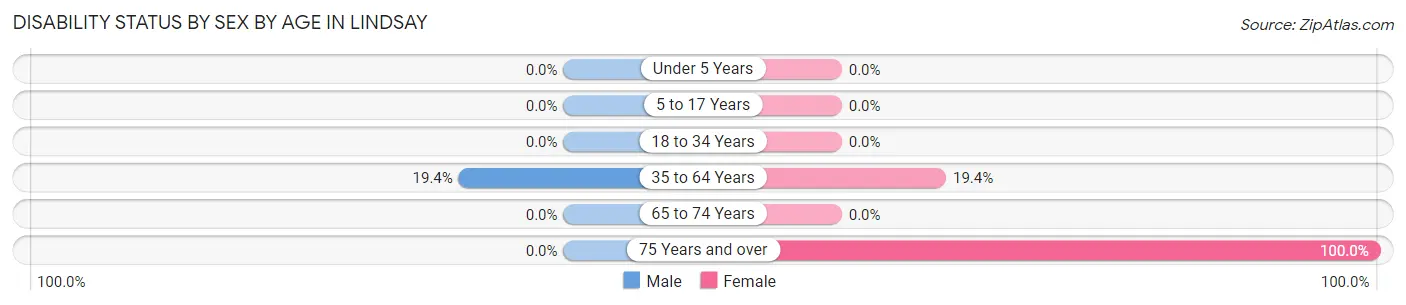
| Age Bracket | Male | Female |
| Under 5 Years | 0 (0.0%) | 0 (0.0%) |
| 5 to 17 Years | 0 (0.0%) | 0 (0.0%) |
| 18 to 34 Years | 0 (0.0%) | 0 (0.0%) |
| 35 to 64 Years | 97 (19.4%) | 12 (19.4%) |
| 65 to 74 Years | 0 (0.0%) | 0 (0.0%) |
| 75 Years and over | 0 (0.0%) | 16 (100.0%) |
Disability Class by Sex by Age in Lindsay
Disability Class: Hearing Difficulty
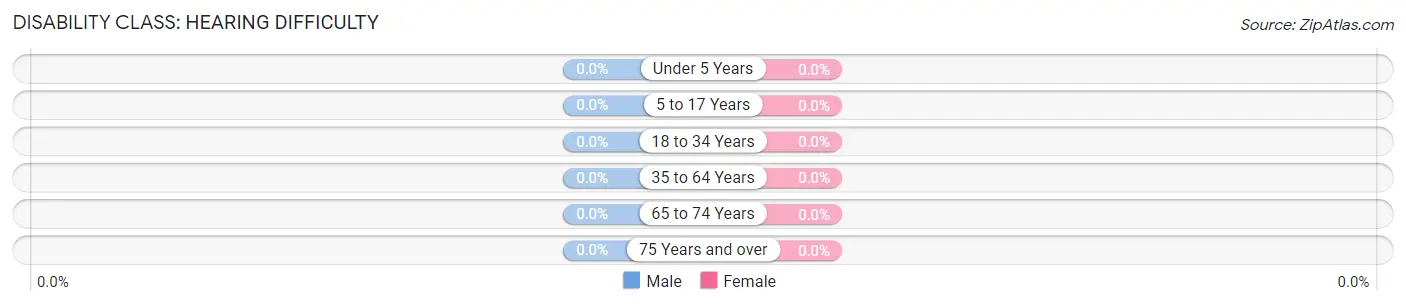
| Age Bracket | Male | Female |
| Under 5 Years | 0 (0.0%) | 0 (0.0%) |
| 5 to 17 Years | 0 (0.0%) | 0 (0.0%) |
| 18 to 34 Years | 0 (0.0%) | 0 (0.0%) |
| 35 to 64 Years | 0 (0.0%) | 0 (0.0%) |
| 65 to 74 Years | 0 (0.0%) | 0 (0.0%) |
| 75 Years and over | 0 (0.0%) | 0 (0.0%) |
Disability Class: Vision Difficulty
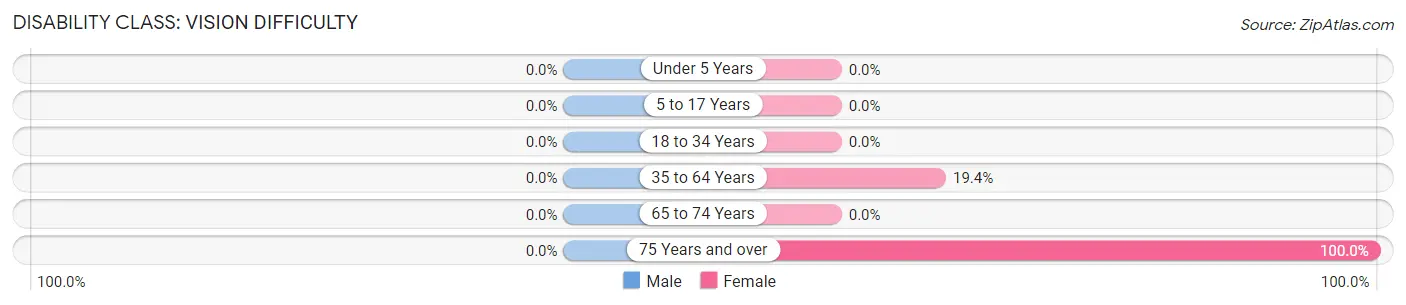
| Age Bracket | Male | Female |
| Under 5 Years | 0 (0.0%) | 0 (0.0%) |
| 5 to 17 Years | 0 (0.0%) | 0 (0.0%) |
| 18 to 34 Years | 0 (0.0%) | 0 (0.0%) |
| 35 to 64 Years | 0 (0.0%) | 12 (19.4%) |
| 65 to 74 Years | 0 (0.0%) | 0 (0.0%) |
| 75 Years and over | 0 (0.0%) | 16 (100.0%) |
Disability Class: Cognitive Difficulty
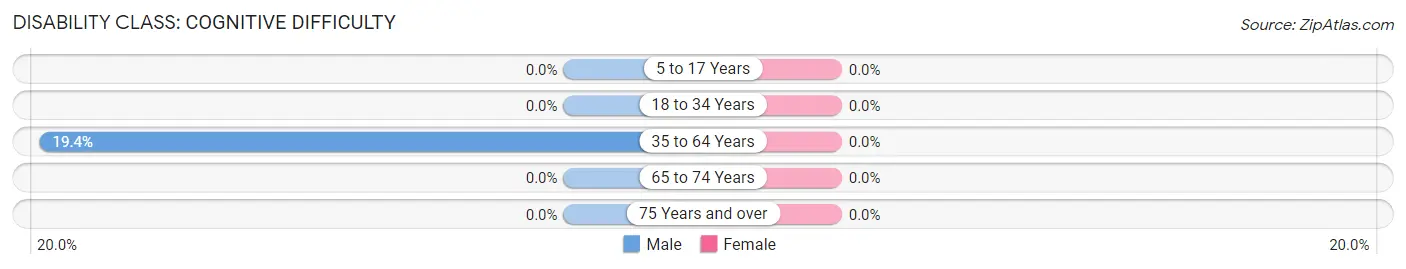
| Age Bracket | Male | Female |
| 5 to 17 Years | 0 (0.0%) | 0 (0.0%) |
| 18 to 34 Years | 0 (0.0%) | 0 (0.0%) |
| 35 to 64 Years | 97 (19.4%) | 0 (0.0%) |
| 65 to 74 Years | 0 (0.0%) | 0 (0.0%) |
| 75 Years and over | 0 (0.0%) | 0 (0.0%) |
Disability Class: Ambulatory Difficulty
| Age Bracket | Male | Female |
| 5 to 17 Years | 0 (0.0%) | 0 (0.0%) |
| 18 to 34 Years | 0 (0.0%) | 0 (0.0%) |
| 35 to 64 Years | 0 (0.0%) | 0 (0.0%) |
| 65 to 74 Years | 0 (0.0%) | 0 (0.0%) |
| 75 Years and over | 0 (0.0%) | 0 (0.0%) |
Disability Class: Self-Care Difficulty
| Age Bracket | Male | Female |
| 5 to 17 Years | 0 (0.0%) | 0 (0.0%) |
| 18 to 34 Years | 0 (0.0%) | 0 (0.0%) |
| 35 to 64 Years | 0 (0.0%) | 0 (0.0%) |
| 65 to 74 Years | 0 (0.0%) | 0 (0.0%) |
| 75 Years and over | 0 (0.0%) | 0 (0.0%) |
Technology Access in Lindsay
Computing Device Access in Lindsay
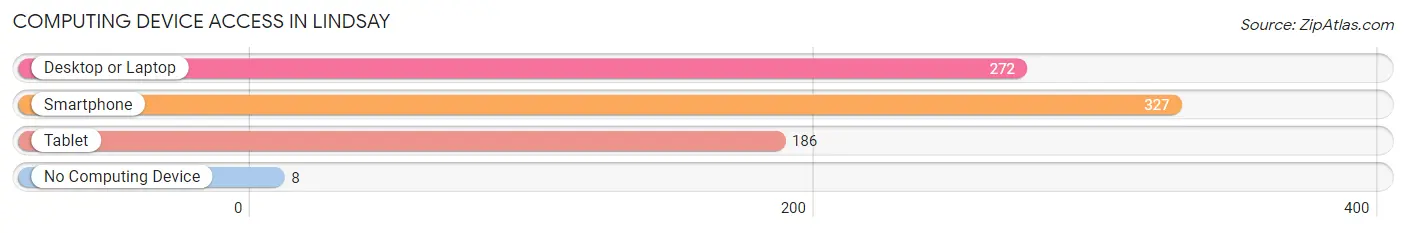
| Device Type | # Households | % Households |
| Desktop or Laptop | 272 | 77.5% |
| Smartphone | 327 | 93.2% |
| Tablet | 186 | 53.0% |
| No Computing Device | 8 | 2.3% |
| Total | 351 | 100.0% |
Internet Access in Lindsay
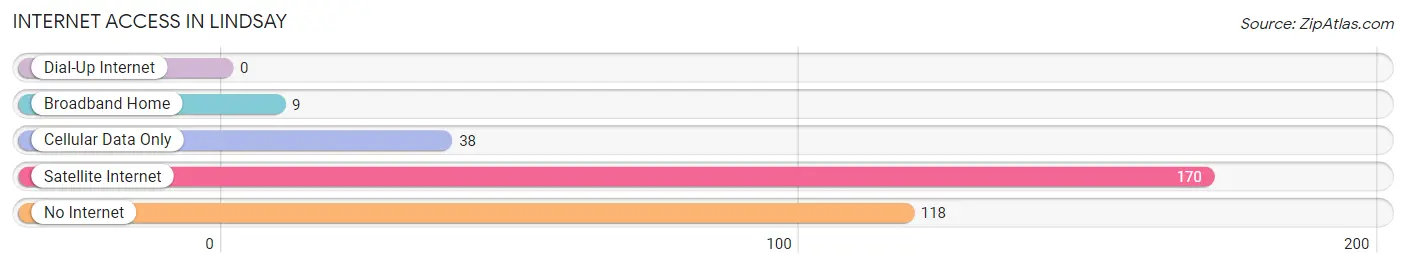
| Internet Type | # Households | % Households |
| Dial-Up Internet | 0 | 0.0% |
| Broadband Home | 9 | 2.6% |
| Cellular Data Only | 38 | 10.8% |
| Satellite Internet | 170 | 48.4% |
| No Internet | 118 | 33.6% |
| Total | 351 | 100.0% |
Lindsay Summary
Lindsay, Texas is a small town located in Collin County, Texas, about 40 miles northeast of Dallas. It is part of the Dallas-Fort Worth-Arlington metropolitan area. The population of Lindsay was 1,717 at the 2010 census.
History
The area that is now Lindsay was first settled in the 1840s by a group of settlers from Kentucky. The town was originally called “Cottonwood”, but was later renamed “Lindsay” in honor of the first postmaster, William Lindsay. The town was officially incorporated in 1891.
In the early 1900s, Lindsay was a thriving agricultural community, with cotton, corn, and wheat being the main crops. The town also had a cotton gin, a grist mill, and a blacksmith shop.
In the 1920s, the town began to experience a decline in population due to the Great Depression. However, the population began to increase again in the 1940s, when the town became a popular destination for weekenders from Dallas.
Geography
Lindsay is located at 33°25'25" North, 96°37'17" West (33.423, -96.621). The town is situated on the banks of the Trinity River, about 40 miles northeast of Dallas.
The town has a total area of 1.2 square miles, all of which is land. The terrain is mostly flat, with some rolling hills.
Economy
The economy of Lindsay is largely based on agriculture. The town is home to several farms, which produce cotton, corn, wheat, and other crops.
In addition, the town is home to several small businesses, including a grocery store, a hardware store, and a few restaurants.
Demographics
As of the 2010 census, the population of Lindsay was 1,717. The racial makeup of the town was 79.2% White, 15.2% Hispanic or Latino, 2.2% African American, 0.7% Native American, 0.3% Asian, and 2.6% from other races.
The median household income in Lindsay was $45,938, and the median family income was $51,250. The per capita income was $20,945. About 11.2% of the population was below the poverty line.
Conclusion
Lindsay, Texas is a small town located in Collin County, Texas, about 40 miles northeast of Dallas. It is part of the Dallas-Fort Worth-Arlington metropolitan area. The population of Lindsay was 1,717 at the 2010 census. The town has a long history, dating back to the 1840s, and is largely based on agriculture. The economy of Lindsay is largely based on agriculture, with several farms producing cotton, corn, wheat, and other crops. The town also has several small businesses, including a grocery store, a hardware store, and a few restaurants. The population of Lindsay is mostly White, with a significant Hispanic or Latino population. The median household income in Lindsay was $45,938, and the median family income was $51,250. About 11.2% of the population was below the poverty line.
Common Questions
What is Per Capita Income in Lindsay?
Per Capita income in Lindsay is $44,844.
What is the Median Household income in Lindsay?
Median Household Income in Lindsay is $81,653.
What is Income or Wage Gap in Lindsay?
Income or Wage Gap in Lindsay is 31.4%.
Women in Lindsay earn 68.6 cents for every dollar earned by a man.
What is Inequality or Gini Index in Lindsay?
Inequality or Gini Index in Lindsay is 0.18.
What is the Total Population of Lindsay?
Total Population of Lindsay is 789.
What is the Total Male Population of Lindsay?
Total Male Population of Lindsay is 711.
What is the Total Female Population of Lindsay?
Total Female Population of Lindsay is 78.
What is the Ratio of Males per 100 Females in Lindsay?
There are 911.54 Males per 100 Females in Lindsay.
What is the Ratio of Females per 100 Males in Lindsay?
There are 10.97 Females per 100 Males in Lindsay.
What is the Median Population Age in Lindsay?
Median Population Age in Lindsay is 46.2 Years.
What is the Average Family Size in Lindsay
Average Family Size in Lindsay is 7.2 People.
What is the Average Household Size in Lindsay
Average Household Size in Lindsay is 2.2 People.
How Large is the Labor Force in Lindsay?
There are 744 People in the Labor Forcein in Lindsay.
What is the Percentage of People in the Labor Force in Lindsay?
94.3% of People are in the Labor Force in Lindsay.