Lindale, TX Map & Demographics
Lindale Map
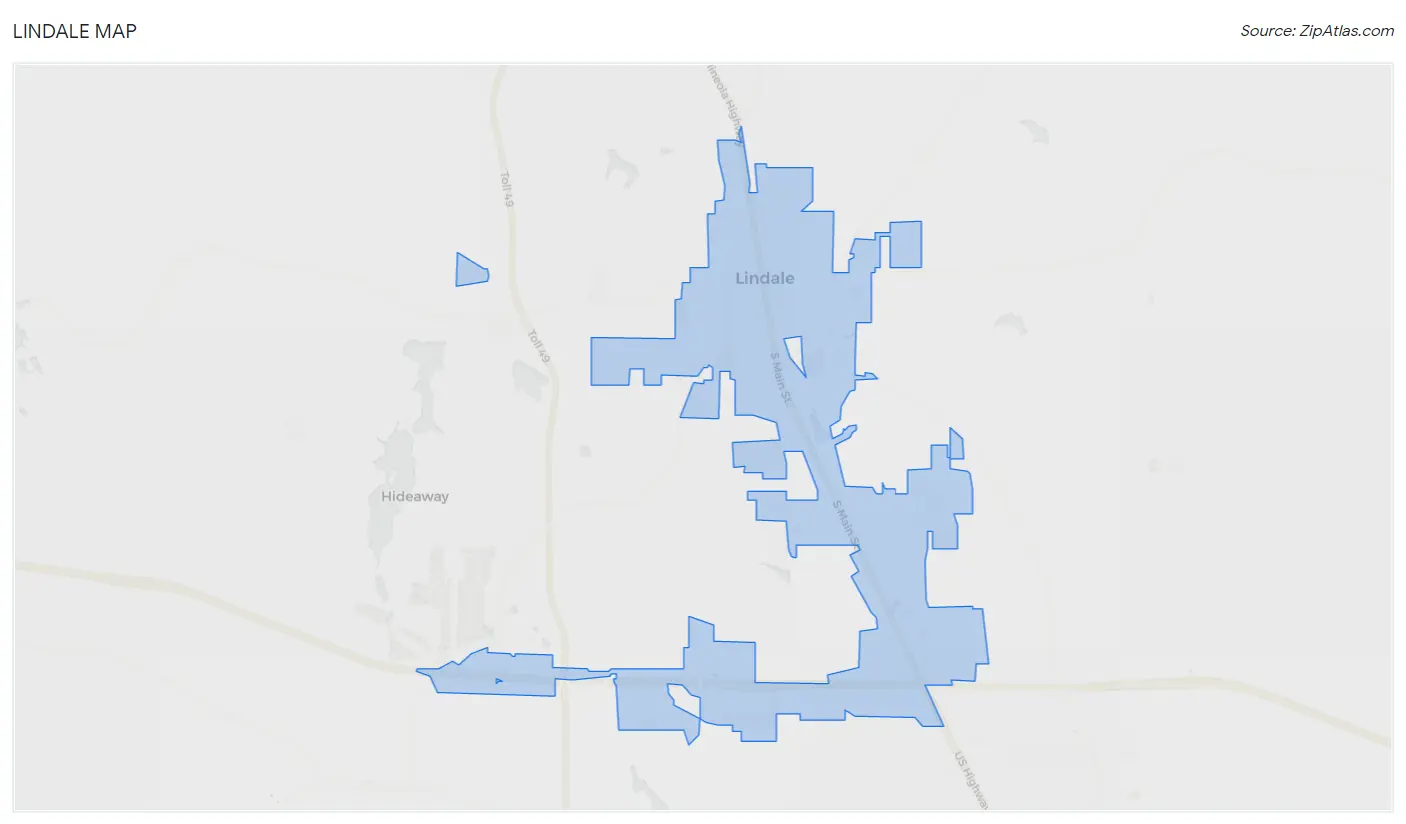
Lindale Overview
$34,240
PER CAPITA INCOME
$85,750
AVG FAMILY INCOME
$79,557
AVG HOUSEHOLD INCOME
45.4%
WAGE / INCOME GAP [ % ]
54.6¢/ $1
WAGE / INCOME GAP [ $ ]
0.37
INEQUALITY / GINI INDEX
6,174
TOTAL POPULATION
3,236
MALE POPULATION
2,938
FEMALE POPULATION
110.14
MALES / 100 FEMALES
90.79
FEMALES / 100 MALES
37.2
MEDIAN AGE
2.9
AVG FAMILY SIZE
2.6
AVG HOUSEHOLD SIZE
2,837
LABOR FORCE [ PEOPLE ]
60.0%
PERCENT IN LABOR FORCE
3.8%
UNEMPLOYMENT RATE
Lindale Zip Codes
Income in Lindale
Income Overview in Lindale
Per Capita Income in Lindale is $34,240, while median incomes of families and households are $85,750 and $79,557 respectively.
| Characteristic | Number | Measure |
| Per Capita Income | 6,174 | $34,240 |
| Median Family Income | 1,727 | $85,750 |
| Mean Family Income | 1,727 | $95,546 |
| Median Household Income | 2,350 | $79,557 |
| Mean Household Income | 2,350 | $88,533 |
| Income Deficit | 1,727 | $0 |
| Wage / Income Gap (%) | 6,174 | 45.42% |
| Wage / Income Gap ($) | 6,174 | 54.58¢ per $1 |
| Gini / Inequality Index | 6,174 | 0.37 |
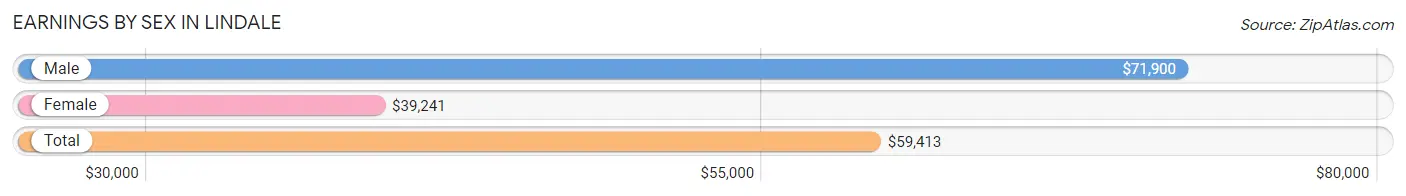
Earnings by Sex in Lindale
Average Earnings in Lindale are $59,413, $71,900 for men and $39,241 for women, a difference of 45.4%.
| Sex | Number | Average Earnings |
| Male | 1,656 (58.9%) | $71,900 |
| Female | 1,155 (41.1%) | $39,241 |
| Total | 2,811 (100.0%) | $59,413 |
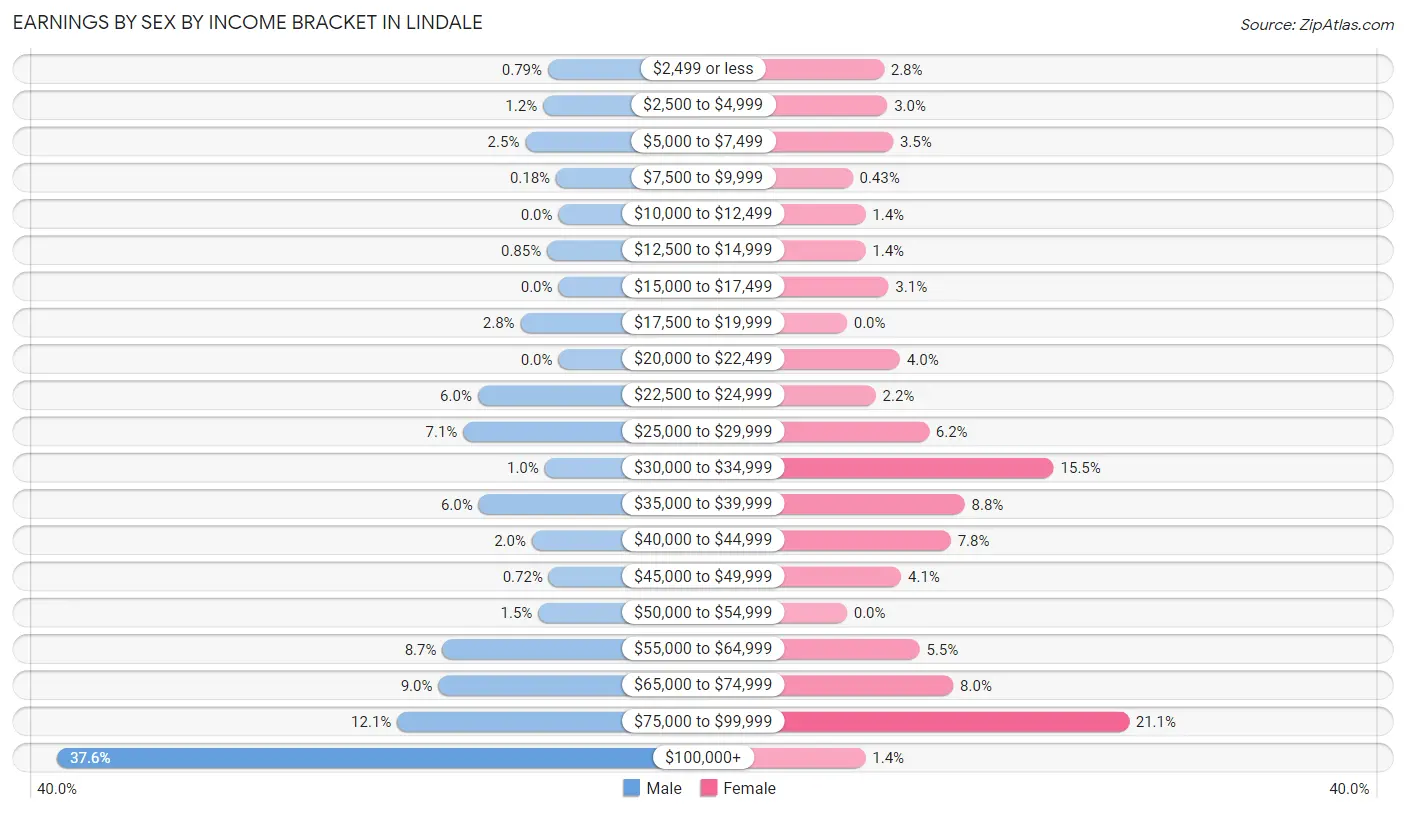
Earnings by Sex by Income Bracket in Lindale
The most common earnings brackets in Lindale are $100,000+ for men (622 | 37.6%) and $75,000 to $99,999 for women (244 | 21.1%).
| Income | Male | Female |
| $2,499 or less | 13 (0.8%) | 32 (2.8%) |
| $2,500 to $4,999 | 19 (1.1%) | 35 (3.0%) |
| $5,000 to $7,499 | 41 (2.5%) | 40 (3.5%) |
| $7,500 to $9,999 | 3 (0.2%) | 5 (0.4%) |
| $10,000 to $12,499 | 0 (0.0%) | 16 (1.4%) |
| $12,500 to $14,999 | 14 (0.9%) | 16 (1.4%) |
| $15,000 to $17,499 | 0 (0.0%) | 36 (3.1%) |
| $17,500 to $19,999 | 47 (2.8%) | 0 (0.0%) |
| $20,000 to $22,499 | 0 (0.0%) | 46 (4.0%) |
| $22,500 to $24,999 | 100 (6.0%) | 25 (2.2%) |
| $25,000 to $29,999 | 118 (7.1%) | 71 (6.1%) |
| $30,000 to $34,999 | 17 (1.0%) | 179 (15.5%) |
| $35,000 to $39,999 | 99 (6.0%) | 102 (8.8%) |
| $40,000 to $44,999 | 33 (2.0%) | 90 (7.8%) |
| $45,000 to $49,999 | 12 (0.7%) | 47 (4.1%) |
| $50,000 to $54,999 | 25 (1.5%) | 0 (0.0%) |
| $55,000 to $64,999 | 144 (8.7%) | 63 (5.4%) |
| $65,000 to $74,999 | 149 (9.0%) | 92 (8.0%) |
| $75,000 to $99,999 | 200 (12.1%) | 244 (21.1%) |
| $100,000+ | 622 (37.6%) | 16 (1.4%) |
| Total | 1,656 (100.0%) | 1,155 (100.0%) |
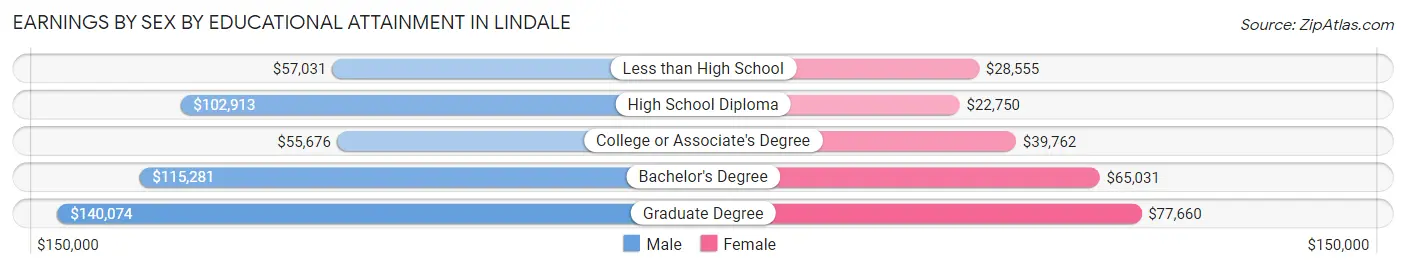
Earnings by Sex by Educational Attainment in Lindale
Average earnings in Lindale are $75,682 for men and $44,181 for women, a difference of 41.6%. Men with an educational attainment of graduate degree enjoy the highest average annual earnings of $140,074, while those with college or associate's degree education earn the least with $55,676. Women with an educational attainment of graduate degree earn the most with the average annual earnings of $77,660, while those with high school diploma education have the smallest earnings of $22,750.
| Educational Attainment | Male Income | Female Income |
| Less than High School | $57,031 | $28,555 |
| High School Diploma | $102,913 | $22,750 |
| College or Associate's Degree | $55,676 | $39,762 |
| Bachelor's Degree | $115,281 | $65,031 |
| Graduate Degree | $140,074 | $77,660 |
| Total | $75,682 | $44,181 |
Family Income in Lindale
Family Income Brackets in Lindale
According to the Lindale family income data, there are 473 families falling into the $100,000 to $149,999 income range, which is the most common income bracket and makes up 27.4% of all families. Conversely, the $10,000 to $14,999 income bracket is the least frequent group with only 10 families (0.6%) belonging to this category.
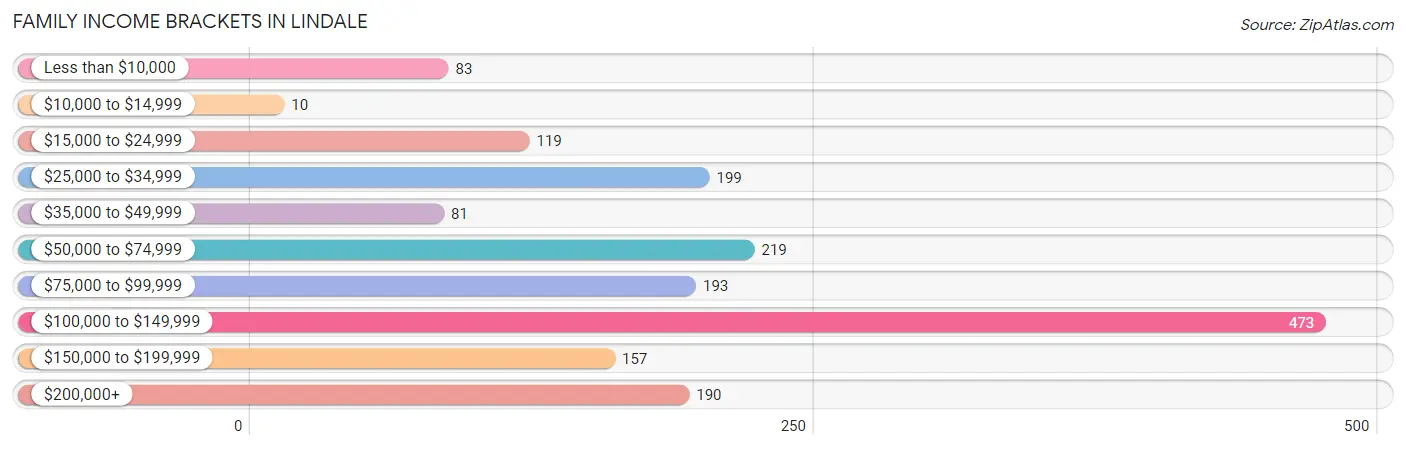
| Income Bracket | # Families | % Families |
| Less than $10,000 | 83 | 4.8% |
| $10,000 to $14,999 | 10 | 0.6% |
| $15,000 to $24,999 | 119 | 6.9% |
| $25,000 to $34,999 | 199 | 11.5% |
| $35,000 to $49,999 | 81 | 4.7% |
| $50,000 to $74,999 | 219 | 12.7% |
| $75,000 to $99,999 | 193 | 11.2% |
| $100,000 to $149,999 | 473 | 27.4% |
| $150,000 to $199,999 | 157 | 9.1% |
| $200,000+ | 190 | 11.0% |
Family Income by Famaliy Size in Lindale
5-person families (39 | 2.3%) account for the highest median family income in Lindale with $153,558 per family, while 2-person families (696 | 40.3%) have the highest median income of $39,822 per family member.
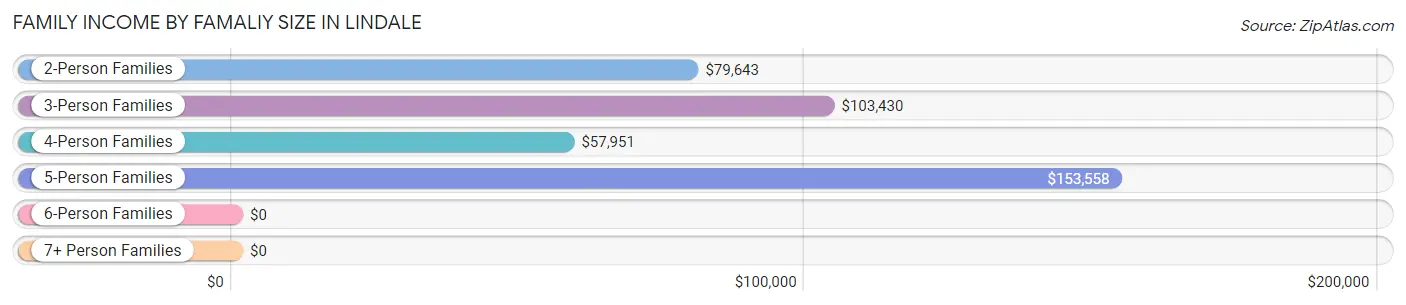
| Income Bracket | # Families | Median Income |
| 2-Person Families | 696 (40.3%) | $79,643 |
| 3-Person Families | 747 (43.2%) | $103,430 |
| 4-Person Families | 201 (11.6%) | $57,951 |
| 5-Person Families | 39 (2.3%) | $153,558 |
| 6-Person Families | 44 (2.5%) | $0 |
| 7+ Person Families | 0 (0.0%) | $0 |
| Total | 1,727 (100.0%) | $85,750 |
Family Income by Number of Earners in Lindale
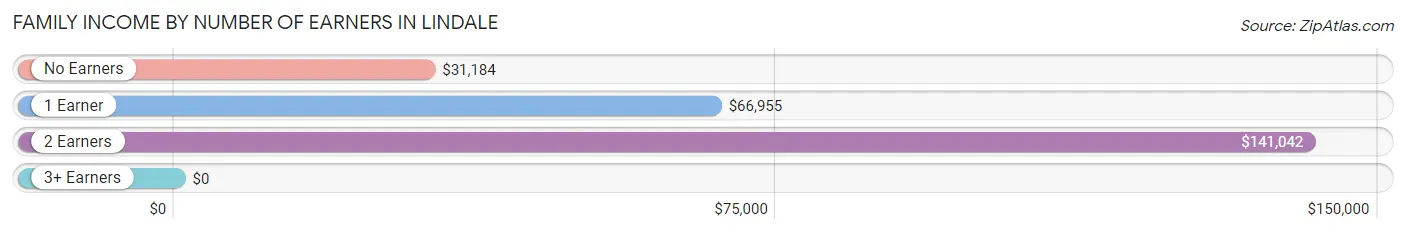
| Number of Earners | # Families | Median Income |
| No Earners | 308 (17.8%) | $31,184 |
| 1 Earner | 716 (41.5%) | $66,955 |
| 2 Earners | 664 (38.5%) | $141,042 |
| 3+ Earners | 39 (2.3%) | $0 |
| Total | 1,727 (100.0%) | $85,750 |
Household Income in Lindale
Household Income Brackets in Lindale
With 653 households falling in the category, the $100,000 to $149,999 income range is the most frequent in Lindale, accounting for 27.8% of all households. In contrast, only 38 households (1.6%) fall into the $10,000 to $14,999 income bracket, making it the least populous group.
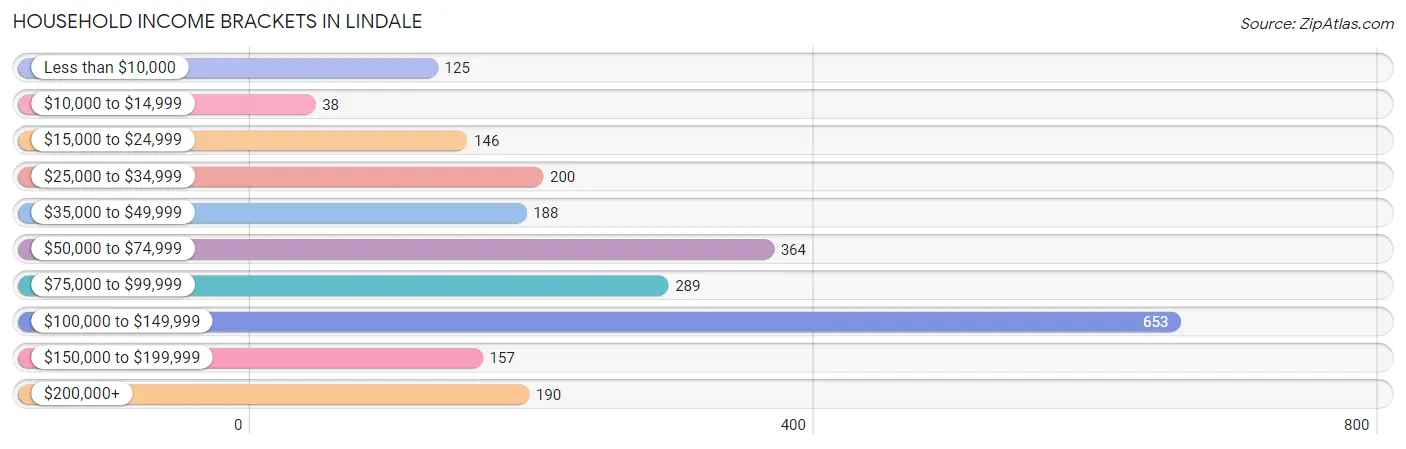
| Income Bracket | # Households | % Households |
| Less than $10,000 | 125 | 5.3% |
| $10,000 to $14,999 | 38 | 1.6% |
| $15,000 to $24,999 | 146 | 6.2% |
| $25,000 to $34,999 | 200 | 8.5% |
| $35,000 to $49,999 | 188 | 8.0% |
| $50,000 to $74,999 | 364 | 15.5% |
| $75,000 to $99,999 | 289 | 12.3% |
| $100,000 to $149,999 | 653 | 27.8% |
| $150,000 to $199,999 | 157 | 6.7% |
| $200,000+ | 190 | 8.1% |
Household Income by Householder Age in Lindale
The median household income in Lindale is $79,557, with the highest median household income of $113,239 found in the 45 to 64 years age bracket for the primary householder. A total of 775 households (33.0%) fall into this category. Meanwhile, the 65+ years age bracket for the primary householder has the lowest median household income of $38,190, with 616 households (26.2%) in this group.
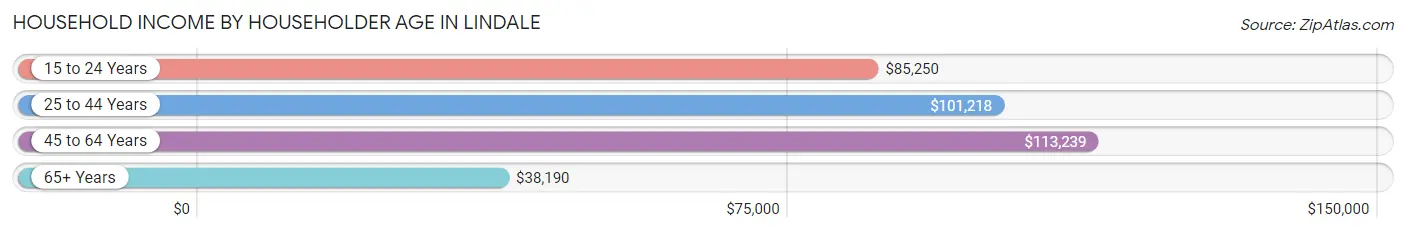
| Income Bracket | # Households | Median Income |
| 15 to 24 Years | 149 (6.3%) | $85,250 |
| 25 to 44 Years | 810 (34.5%) | $101,218 |
| 45 to 64 Years | 775 (33.0%) | $113,239 |
| 65+ Years | 616 (26.2%) | $38,190 |
| Total | 2,350 (100.0%) | $79,557 |
Poverty in Lindale
Income Below Poverty by Sex and Age in Lindale
With 18.7% poverty level for males and 10.8% for females among the residents of Lindale, 15 year old males and 5 year old females are the most vulnerable to poverty, with 51 males (100.0%) and 23 females (63.9%) in their respective age groups living below the poverty level.
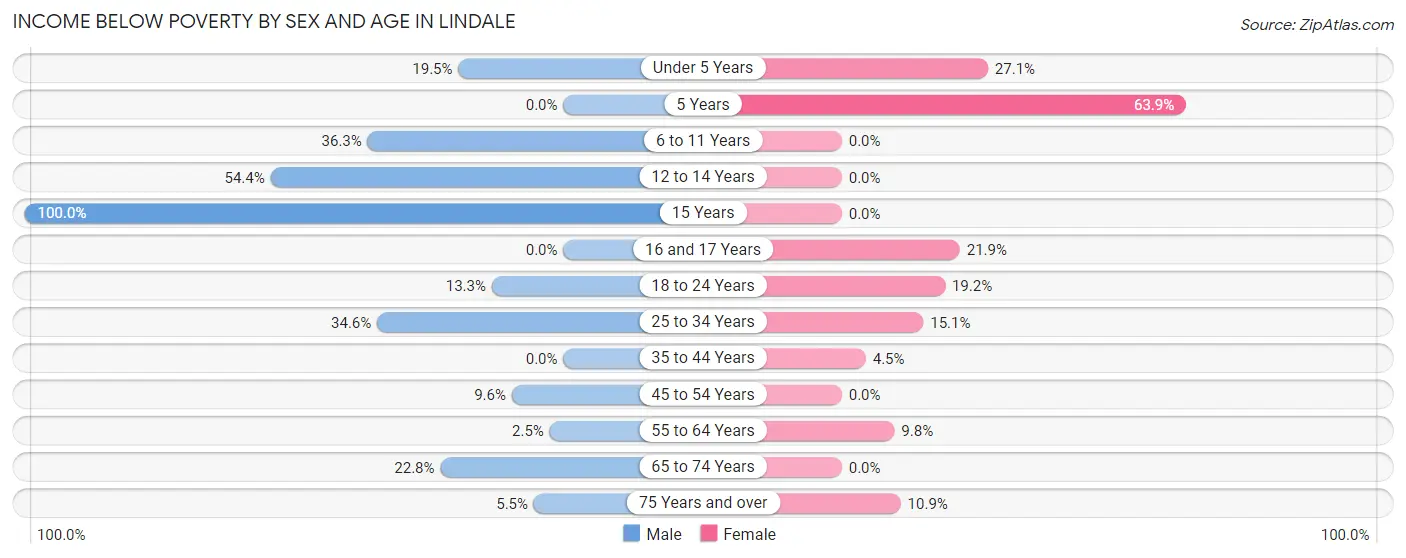
| Age Bracket | Male | Female |
| Under 5 Years | 61 (19.5%) | 32 (27.1%) |
| 5 Years | 0 (0.0%) | 23 (63.9%) |
| 6 to 11 Years | 174 (36.3%) | 0 (0.0%) |
| 12 to 14 Years | 75 (54.3%) | 0 (0.0%) |
| 15 Years | 51 (100.0%) | 0 (0.0%) |
| 16 and 17 Years | 0 (0.0%) | 30 (21.9%) |
| 18 to 24 Years | 36 (13.3%) | 68 (19.2%) |
| 25 to 34 Years | 112 (34.6%) | 64 (15.1%) |
| 35 to 44 Years | 0 (0.0%) | 11 (4.4%) |
| 45 to 54 Years | 41 (9.6%) | 0 (0.0%) |
| 55 to 64 Years | 8 (2.5%) | 34 (9.8%) |
| 65 to 74 Years | 29 (22.8%) | 0 (0.0%) |
| 75 Years and over | 11 (5.5%) | 41 (10.9%) |
| Total | 598 (18.7%) | 303 (10.8%) |
Income Above Poverty by Sex and Age in Lindale
According to the poverty statistics in Lindale, males aged 16 and 17 years and females aged 6 to 11 years are the age groups that are most secure financially, with 100.0% of males and 100.0% of females in these age groups living above the poverty line.
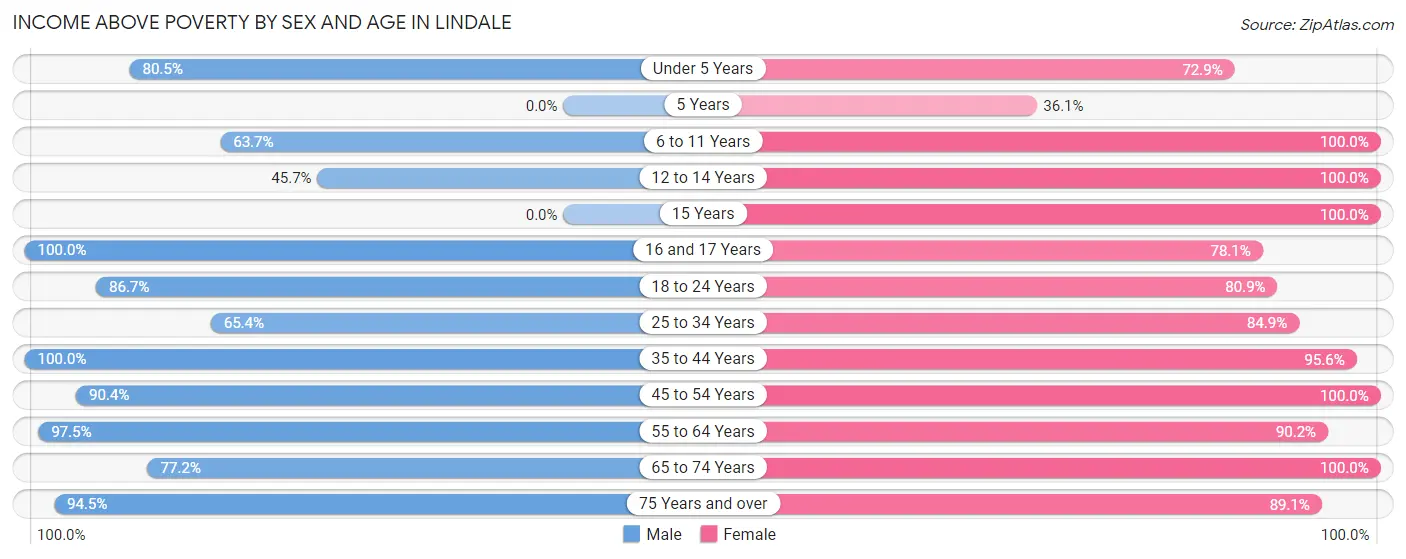
| Age Bracket | Male | Female |
| Under 5 Years | 252 (80.5%) | 86 (72.9%) |
| 5 Years | 0 (0.0%) | 13 (36.1%) |
| 6 to 11 Years | 305 (63.7%) | 208 (100.0%) |
| 12 to 14 Years | 63 (45.7%) | 53 (100.0%) |
| 15 Years | 0 (0.0%) | 15 (100.0%) |
| 16 and 17 Years | 69 (100.0%) | 107 (78.1%) |
| 18 to 24 Years | 235 (86.7%) | 287 (80.8%) |
| 25 to 34 Years | 212 (65.4%) | 359 (84.9%) |
| 35 to 44 Years | 483 (100.0%) | 236 (95.6%) |
| 45 to 54 Years | 388 (90.4%) | 326 (100.0%) |
| 55 to 64 Years | 307 (97.5%) | 314 (90.2%) |
| 65 to 74 Years | 98 (77.2%) | 174 (100.0%) |
| 75 Years and over | 190 (94.5%) | 334 (89.1%) |
| Total | 2,602 (81.3%) | 2,512 (89.2%) |
Income Below Poverty Among Married-Couple Families in Lindale
The poverty statistics for married-couple families in Lindale show that 4.1% or 58 of the total 1,400 families live below the poverty line. Families with 3 or 4 children have the highest poverty rate of 40.8%, comprising of 29 families. On the other hand, families with no children have the lowest poverty rate of 0.0%, which includes 0 families.
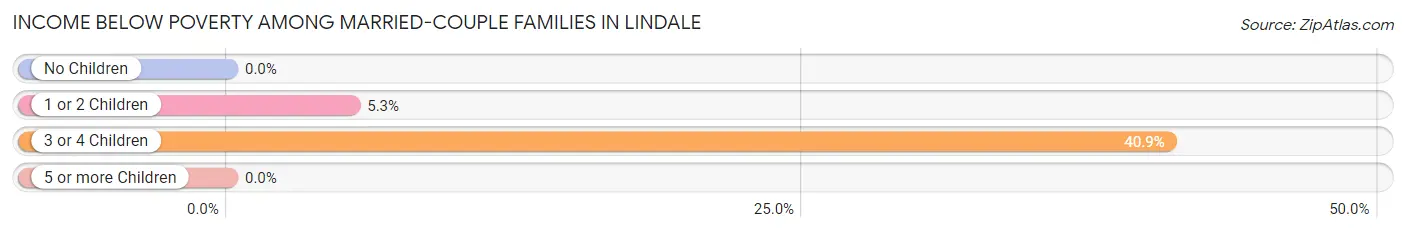
| Children | Above Poverty | Below Poverty |
| No Children | 784 (100.0%) | 0 (0.0%) |
| 1 or 2 Children | 516 (94.7%) | 29 (5.3%) |
| 3 or 4 Children | 42 (59.2%) | 29 (40.8%) |
| 5 or more Children | 0 (0.0%) | 0 (0.0%) |
| Total | 1,342 (95.9%) | 58 (4.1%) |
Income Below Poverty Among Single-Parent Households in Lindale
According to the poverty data in Lindale, 62.9% or 90 single-father households and 35.3% or 65 single-mother households are living below the poverty line. Among single-father households, those with 1 or 2 children have the highest poverty rate, with 90 households (62.9%) experiencing poverty. Likewise, among single-mother households, those with 1 or 2 children have the highest poverty rate, with 65 households (54.6%) falling below the poverty line.
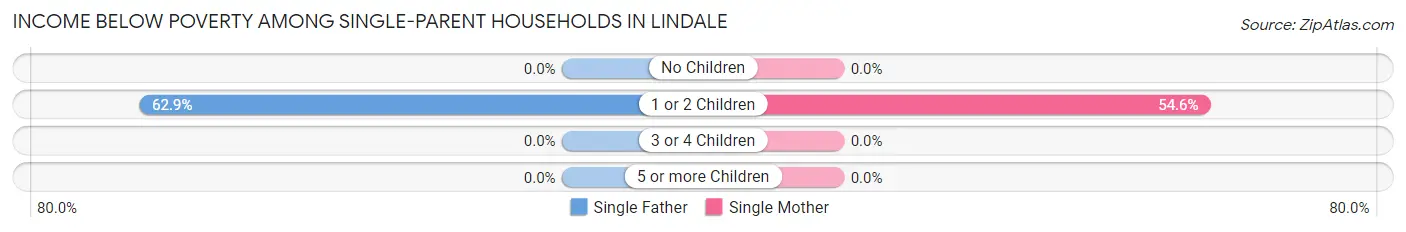
| Children | Single Father | Single Mother |
| No Children | 0 (0.0%) | 0 (0.0%) |
| 1 or 2 Children | 90 (62.9%) | 65 (54.6%) |
| 3 or 4 Children | 0 (0.0%) | 0 (0.0%) |
| 5 or more Children | 0 (0.0%) | 0 (0.0%) |
| Total | 90 (62.9%) | 65 (35.3%) |
Income Below Poverty Among Married-Couple vs Single-Parent Households in Lindale
The poverty data for Lindale shows that 58 of the married-couple family households (4.1%) and 155 of the single-parent households (47.4%) are living below the poverty level. Within the married-couple family households, those with 3 or 4 children have the highest poverty rate, with 29 households (40.8%) falling below the poverty line. Among the single-parent households, those with 1 or 2 children have the highest poverty rate, with 155 household (59.2%) living below poverty.
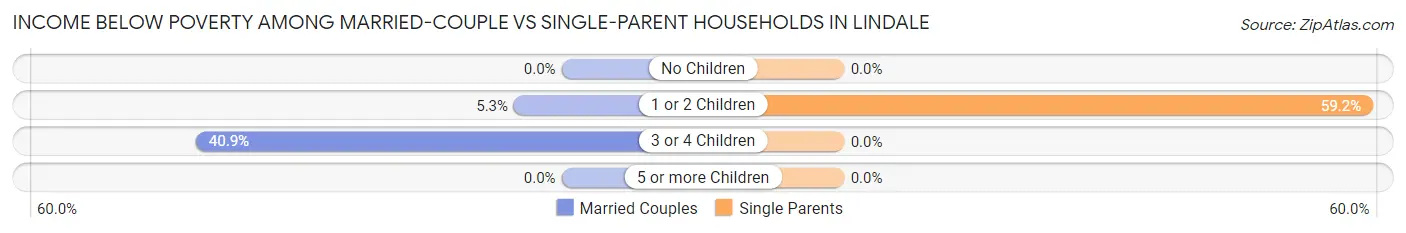
| Children | Married-Couple Families | Single-Parent Households |
| No Children | 0 (0.0%) | 0 (0.0%) |
| 1 or 2 Children | 29 (5.3%) | 155 (59.2%) |
| 3 or 4 Children | 29 (40.8%) | 0 (0.0%) |
| 5 or more Children | 0 (0.0%) | 0 (0.0%) |
| Total | 58 (4.1%) | 155 (47.4%) |
Race in Lindale
The most populous races in Lindale are White / Caucasian (5,291 | 85.7%), Black / African American (500 | 8.1%), and Hispanic or Latino (454 | 7.3%).
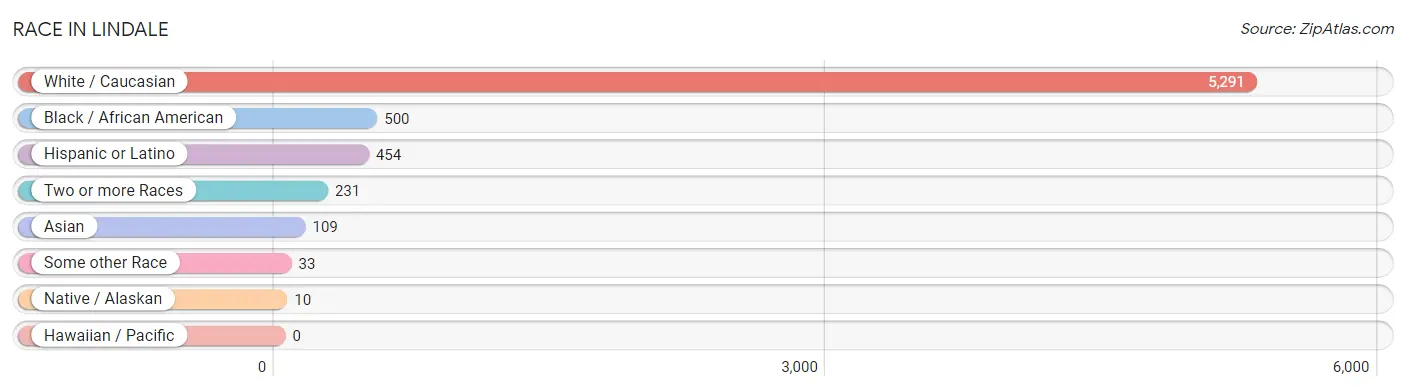
| Race | # Population | % Population |
| Asian | 109 | 1.8% |
| Black / African American | 500 | 8.1% |
| Hawaiian / Pacific | 0 | 0.0% |
| Hispanic or Latino | 454 | 7.3% |
| Native / Alaskan | 10 | 0.2% |
| White / Caucasian | 5,291 | 85.7% |
| Two or more Races | 231 | 3.7% |
| Some other Race | 33 | 0.5% |
| Total | 6,174 | 100.0% |
Ancestry in Lindale
The most populous ancestries reported in Lindale are American (1,691 | 27.4%), English (987 | 16.0%), German (669 | 10.8%), Irish (398 | 6.5%), and Mexican (396 | 6.4%), together accounting for 67.1% of all Lindale residents.
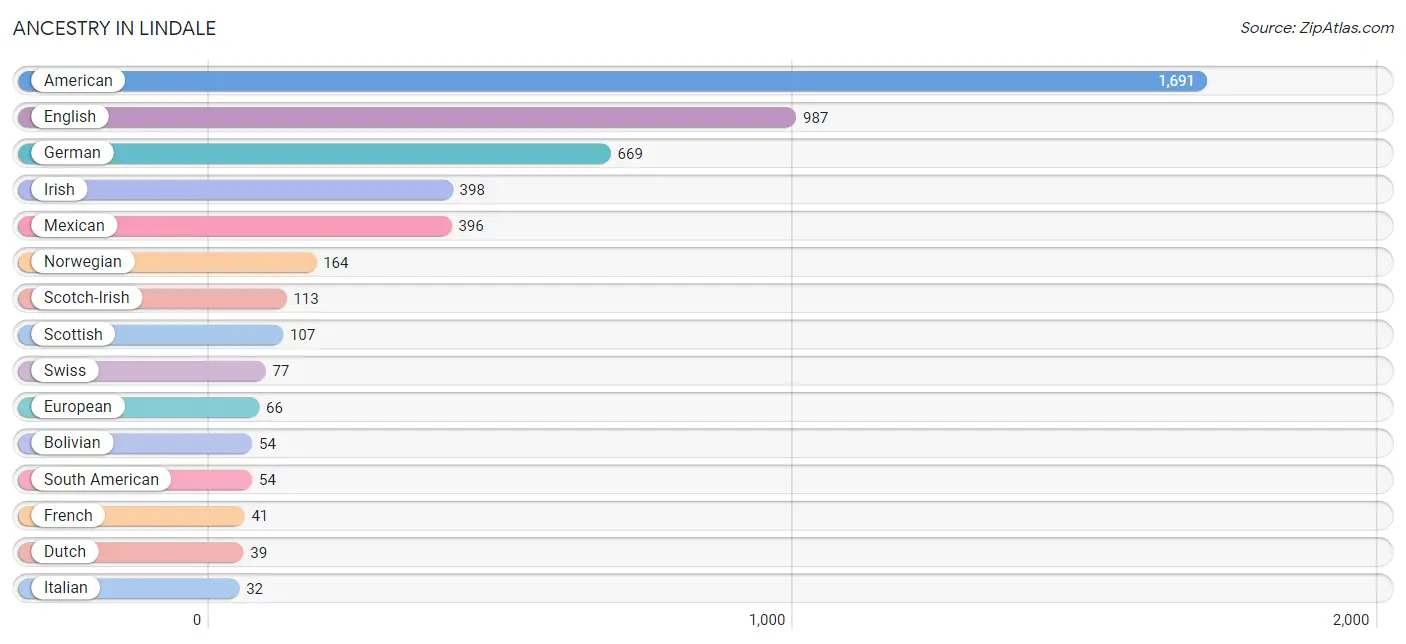
| Ancestry | # Population | % Population |
| American | 1,691 | 27.4% |
| Bolivian | 54 | 0.9% |
| British | 10 | 0.2% |
| Cajun | 14 | 0.2% |
| Choctaw | 10 | 0.2% |
| Czech | 8 | 0.1% |
| Danish | 11 | 0.2% |
| Dutch | 39 | 0.6% |
| English | 987 | 16.0% |
| European | 66 | 1.1% |
| French | 41 | 0.7% |
| French Canadian | 24 | 0.4% |
| German | 669 | 10.8% |
| Irish | 398 | 6.5% |
| Italian | 32 | 0.5% |
| Mexican | 396 | 6.4% |
| Norwegian | 164 | 2.7% |
| Russian | 27 | 0.4% |
| Scandinavian | 9 | 0.2% |
| Scotch-Irish | 113 | 1.8% |
| Scottish | 107 | 1.7% |
| Slovak | 15 | 0.2% |
| South American | 54 | 0.9% |
| Spanish | 4 | 0.1% |
| Swedish | 29 | 0.5% |
| Swiss | 77 | 1.3% | View All 26 Rows |
Immigrants in Lindale
The most numerous immigrant groups reported in Lindale came from Europe (119 | 1.9%), Western Europe (86 | 1.4%), Central America (56 | 0.9%), Latin America (56 | 0.9%), and Mexico (56 | 0.9%), together accounting for 6.0% of all Lindale residents.
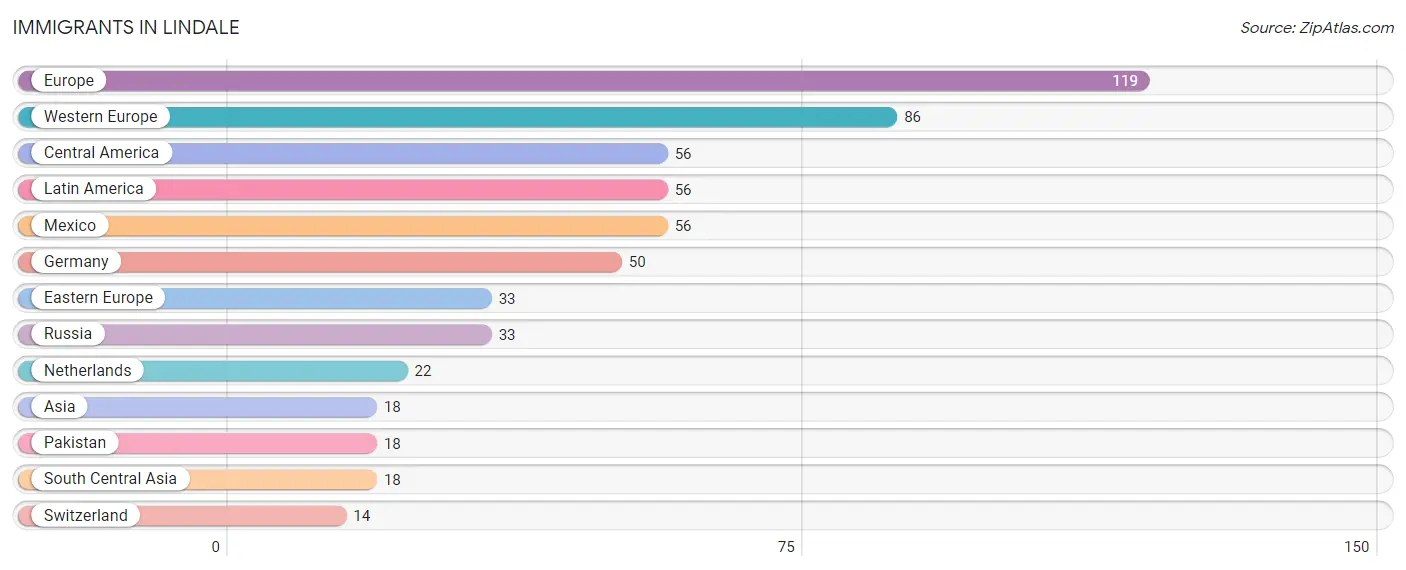
| Immigration Origin | # Population | % Population |
| Asia | 18 | 0.3% |
| Central America | 56 | 0.9% |
| Eastern Europe | 33 | 0.5% |
| Europe | 119 | 1.9% |
| Germany | 50 | 0.8% |
| Latin America | 56 | 0.9% |
| Mexico | 56 | 0.9% |
| Netherlands | 22 | 0.4% |
| Pakistan | 18 | 0.3% |
| Russia | 33 | 0.5% |
| South Central Asia | 18 | 0.3% |
| Switzerland | 14 | 0.2% |
| Western Europe | 86 | 1.4% | View All 13 Rows |
Sex and Age in Lindale
Sex and Age in Lindale
The most populous age groups in Lindale are 5 to 9 Years (450 | 13.9%) for men and 20 to 24 Years (309 | 10.5%) for women.
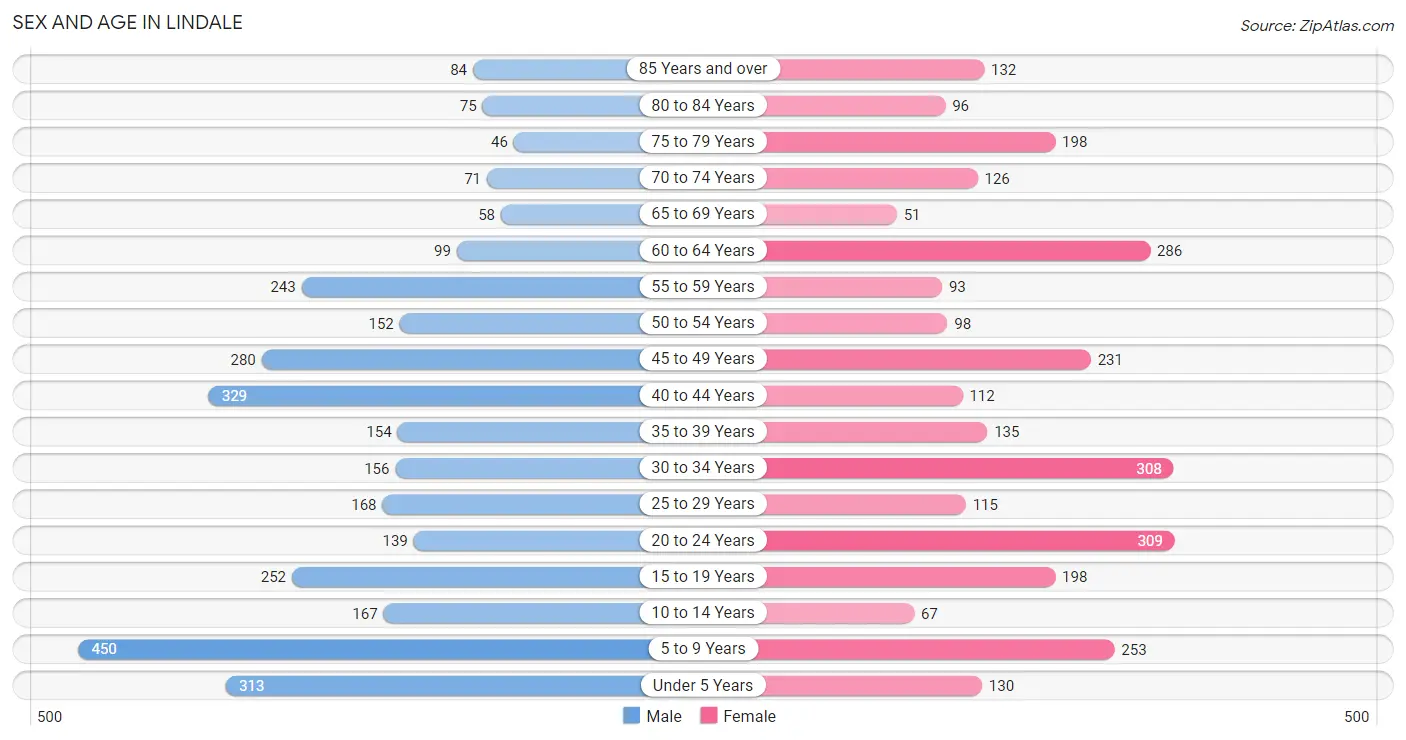
| Age Bracket | Male | Female |
| Under 5 Years | 313 (9.7%) | 130 (4.4%) |
| 5 to 9 Years | 450 (13.9%) | 253 (8.6%) |
| 10 to 14 Years | 167 (5.2%) | 67 (2.3%) |
| 15 to 19 Years | 252 (7.8%) | 198 (6.7%) |
| 20 to 24 Years | 139 (4.3%) | 309 (10.5%) |
| 25 to 29 Years | 168 (5.2%) | 115 (3.9%) |
| 30 to 34 Years | 156 (4.8%) | 308 (10.5%) |
| 35 to 39 Years | 154 (4.8%) | 135 (4.6%) |
| 40 to 44 Years | 329 (10.2%) | 112 (3.8%) |
| 45 to 49 Years | 280 (8.6%) | 231 (7.9%) |
| 50 to 54 Years | 152 (4.7%) | 98 (3.3%) |
| 55 to 59 Years | 243 (7.5%) | 93 (3.2%) |
| 60 to 64 Years | 99 (3.1%) | 286 (9.7%) |
| 65 to 69 Years | 58 (1.8%) | 51 (1.7%) |
| 70 to 74 Years | 71 (2.2%) | 126 (4.3%) |
| 75 to 79 Years | 46 (1.4%) | 198 (6.7%) |
| 80 to 84 Years | 75 (2.3%) | 96 (3.3%) |
| 85 Years and over | 84 (2.6%) | 132 (4.5%) |
| Total | 3,236 (100.0%) | 2,938 (100.0%) |
Families and Households in Lindale
Median Family Size in Lindale
The median family size in Lindale is 2.93 persons per family, with single male/father families (143 | 8.3%) accounting for the largest median family size of 3.04 persons per family. On the other hand, single female/mother families (184 | 10.6%) represent the smallest median family size with 2.73 persons per family.
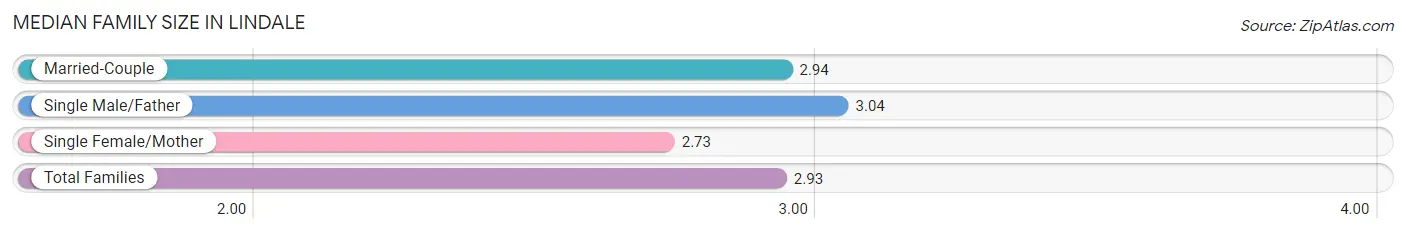
| Family Type | # Families | Family Size |
| Married-Couple | 1,400 (81.1%) | 2.94 |
| Single Male/Father | 143 (8.3%) | 3.04 |
| Single Female/Mother | 184 (10.6%) | 2.73 |
| Total Families | 1,727 (100.0%) | 2.93 |
Median Household Size in Lindale
The median household size in Lindale is 2.56 persons per household, with single male/father households (143 | 6.1%) accounting for the largest median household size of 3.76 persons per household. non-family households (623 | 26.5%) represent the smallest median household size with 1.22 persons per household.
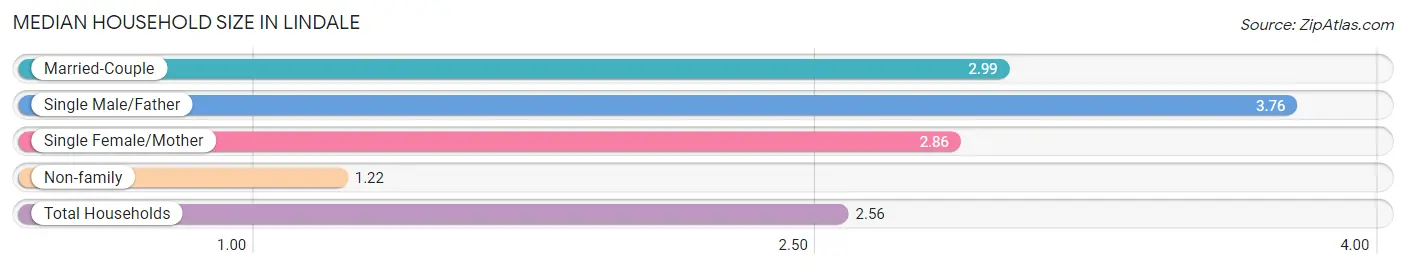
| Household Type | # Households | Household Size |
| Married-Couple | 1,400 (59.6%) | 2.99 |
| Single Male/Father | 143 (6.1%) | 3.76 |
| Single Female/Mother | 184 (7.8%) | 2.86 |
| Non-family | 623 (26.5%) | 1.22 |
| Total Households | 2,350 (100.0%) | 2.56 |
Household Size by Marriage Status in Lindale
Out of a total of 2,350 households in Lindale, 1,727 (73.5%) are family households, while 623 (26.5%) are nonfamily households. The most numerous type of family households are 2-person households, comprising 677, and the most common type of nonfamily households are 1-person households, comprising 545.
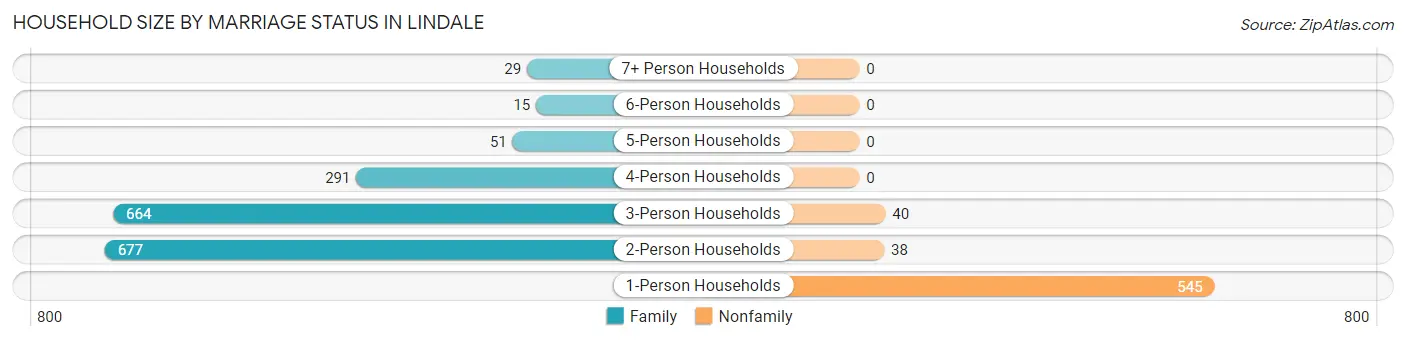
| Household Size | Family Households | Nonfamily Households |
| 1-Person Households | - | 545 (23.2%) |
| 2-Person Households | 677 (28.8%) | 38 (1.6%) |
| 3-Person Households | 664 (28.3%) | 40 (1.7%) |
| 4-Person Households | 291 (12.4%) | 0 (0.0%) |
| 5-Person Households | 51 (2.2%) | 0 (0.0%) |
| 6-Person Households | 15 (0.6%) | 0 (0.0%) |
| 7+ Person Households | 29 (1.2%) | 0 (0.0%) |
| Total | 1,727 (73.5%) | 623 (26.5%) |
Female Fertility in Lindale
Fertility by Age in Lindale
| Age Bracket | Women with Births | Births / 1,000 Women |
| 15 to 19 years | 0 (0.0%) | 0.0 |
| 20 to 34 years | 0 (0.0%) | 0.0 |
| 35 to 50 years | 0 (0.0%) | 0.0 |
| Total | 0 (0.0%) | 0.0 |
Fertility by Age by Marriage Status in Lindale
| Age Bracket | Married | Unmarried |
| 15 to 19 years | 0 (0.0%) | 0 (0.0%) |
| 20 to 34 years | 0 (0.0%) | 0 (0.0%) |
| 35 to 50 years | 0 (0.0%) | 0 (0.0%) |
| Total | 0 (0.0%) | 0 (0.0%) |
Fertility by Education in Lindale
| Educational Attainment | Women with Births | Births / 1,000 Women |
| Less than High School | 0 (0.0%) | 0.0 |
| High School Diploma | 0 (0.0%) | 0.0 |
| College or Associate's Degree | 0 (0.0%) | 0.0 |
| Bachelor's Degree | 0 (0.0%) | 0.0 |
| Graduate Degree | 0 (0.0%) | 0.0 |
| Total | 0 (0.0%) | 0.0 |
Fertility by Education by Marriage Status in Lindale
| Educational Attainment | Married | Unmarried |
| Less than High School | 0 (0.0%) | 0 (0.0%) |
| High School Diploma | 0 (0.0%) | 0 (0.0%) |
| College or Associate's Degree | 0 (0.0%) | 0 (0.0%) |
| Bachelor's Degree | 0 (0.0%) | 0 (0.0%) |
| Graduate Degree | 0 (0.0%) | 0 (0.0%) |
| Total | 0 (0.0%) | 0 (0.0%) |
Employment Characteristics in Lindale
Employment by Class of Employer in Lindale
Among the 2,711 employed individuals in Lindale, private company employees (1,623 | 59.9%), self-employed (not incorporated) (695 | 25.6%), and not-for-profit organizations (174 | 6.4%) make up the most common classes of employment.
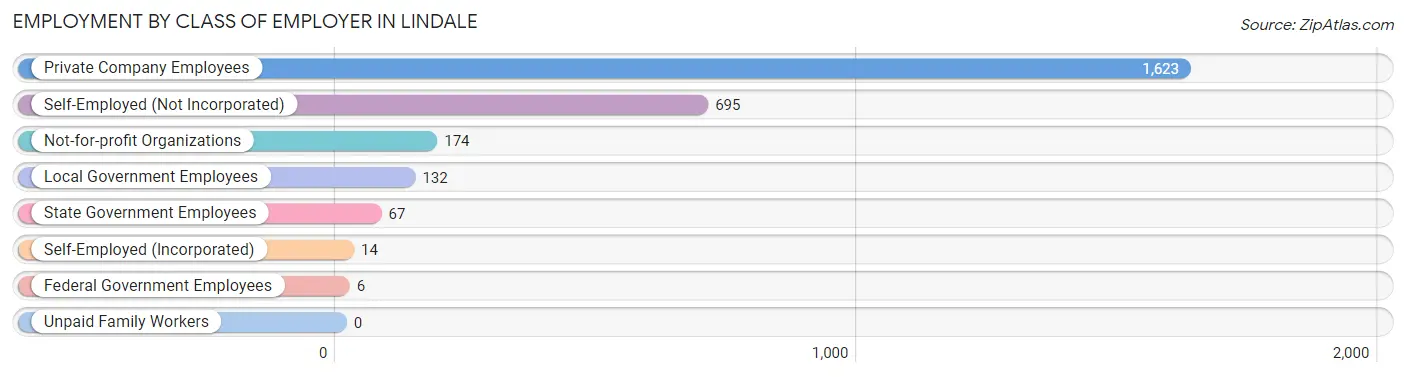
| Employer Class | # Employees | % Employees |
| Private Company Employees | 1,623 | 59.9% |
| Self-Employed (Incorporated) | 14 | 0.5% |
| Self-Employed (Not Incorporated) | 695 | 25.6% |
| Not-for-profit Organizations | 174 | 6.4% |
| Local Government Employees | 132 | 4.9% |
| State Government Employees | 67 | 2.5% |
| Federal Government Employees | 6 | 0.2% |
| Unpaid Family Workers | 0 | 0.0% |
| Total | 2,711 | 100.0% |
Employment Status by Age in Lindale
According to the labor force statistics for Lindale, out of the total population over 16 years of age (4,728), 60.0% or 2,837 individuals are in the labor force, with 3.8% or 108 of them unemployed. The age group with the highest labor force participation rate is 45 to 54 years, with 91.9% or 699 individuals in the labor force. Within the labor force, the 30 to 34 years age range has the highest percentage of unemployed individuals, with 20.7% or 46 of them being unemployed.
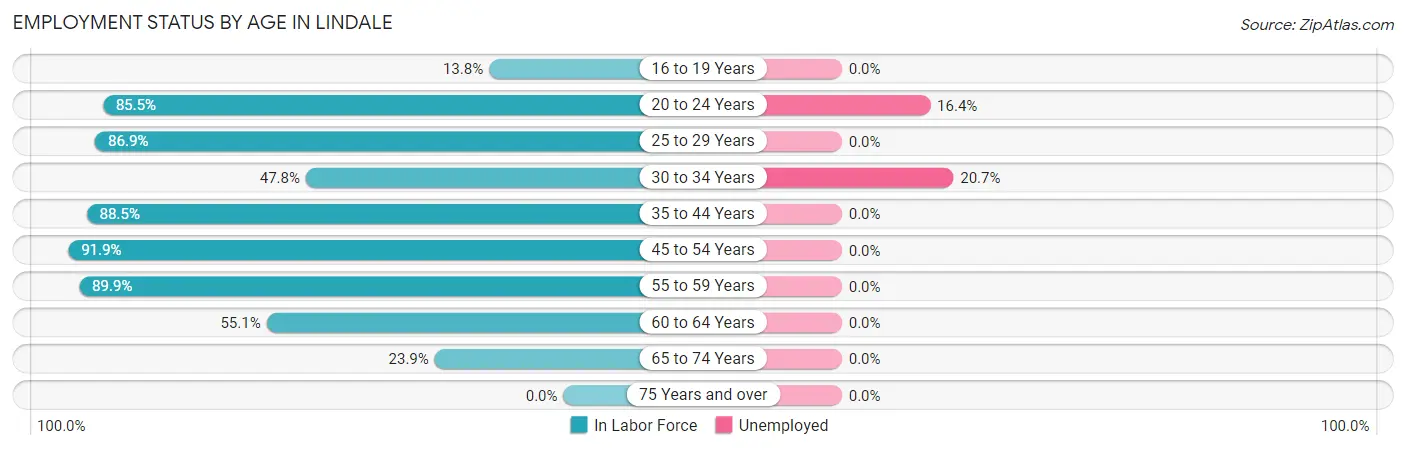
| Age Bracket | In Labor Force | Unemployed |
| 16 to 19 Years | 53 (13.8%) | 0 (0.0%) |
| 20 to 24 Years | 383 (85.5%) | 63 (16.4%) |
| 25 to 29 Years | 246 (86.9%) | 0 (0.0%) |
| 30 to 34 Years | 222 (47.8%) | 46 (20.7%) |
| 35 to 44 Years | 646 (88.5%) | 0 (0.0%) |
| 45 to 54 Years | 699 (91.9%) | 0 (0.0%) |
| 55 to 59 Years | 302 (89.9%) | 0 (0.0%) |
| 60 to 64 Years | 212 (55.1%) | 0 (0.0%) |
| 65 to 74 Years | 73 (23.9%) | 0 (0.0%) |
| 75 Years and over | 0 (0.0%) | 0 (0.0%) |
| Total | 2,837 (60.0%) | 108 (3.8%) |
Employment Status by Educational Attainment in Lindale
According to labor force statistics for Lindale, 78.6% of individuals (2,326) out of the total population between 25 and 64 years of age (2,959) are in the labor force, with 2.0% or 47 of them being unemployed. The group with the highest labor force participation rate are those with the educational attainment of bachelor's degree or higher, with 88.3% or 708 individuals in the labor force. Within the labor force, individuals with college / associate degree education have the highest percentage of unemployment, with 5.7% or 46 of them being unemployed.
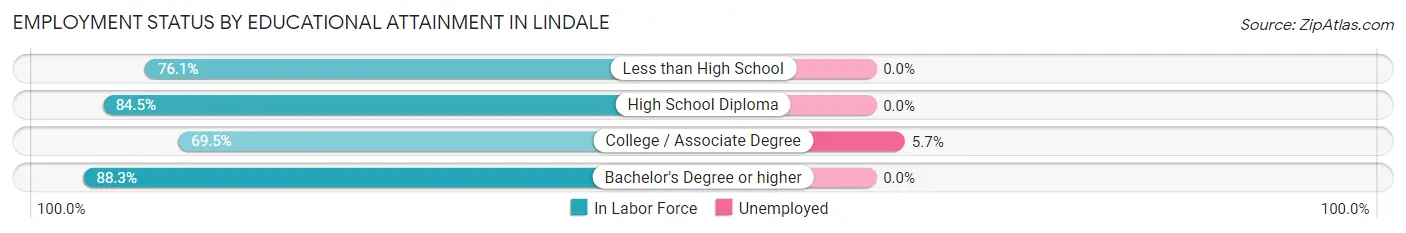
| Educational Attainment | In Labor Force | Unemployed |
| Less than High School | 280 (76.1%) | 0 (0.0%) |
| High School Diploma | 536 (84.5%) | 0 (0.0%) |
| College / Associate Degree | 803 (69.5%) | 66 (5.7%) |
| Bachelor's Degree or higher | 708 (88.3%) | 0 (0.0%) |
| Total | 2,326 (78.6%) | 59 (2.0%) |
Employment Occupations by Sex in Lindale
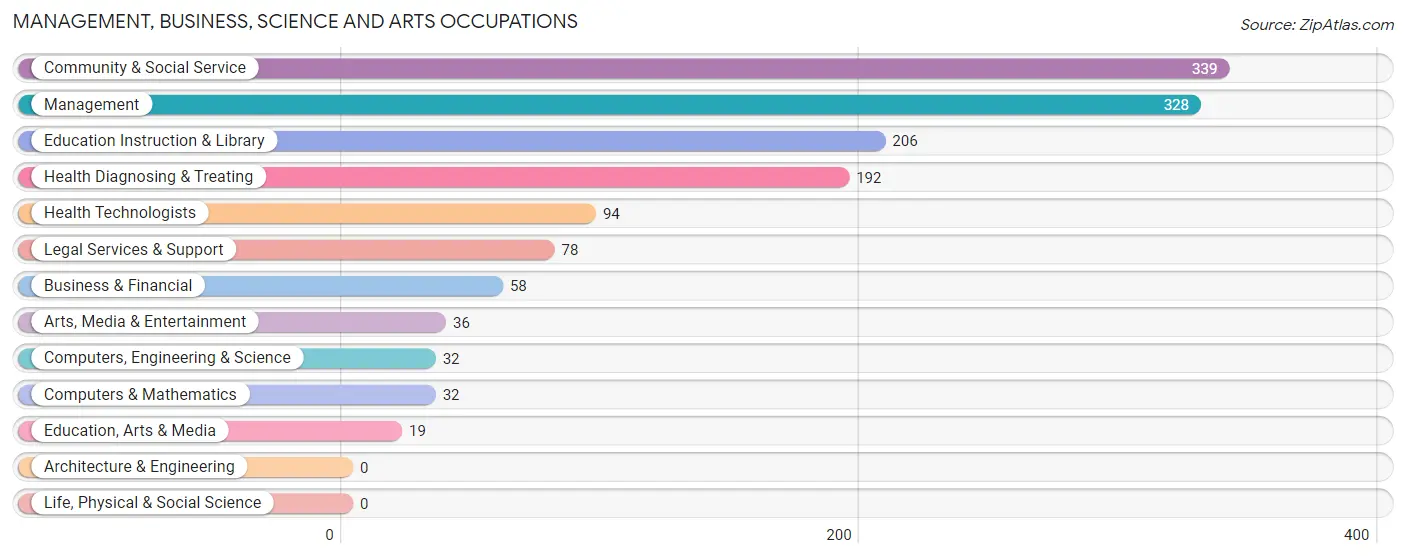
Management, Business, Science and Arts Occupations
The most common Management, Business, Science and Arts occupations in Lindale are Community & Social Service (339 | 12.4%), Management (328 | 12.0%), Education Instruction & Library (206 | 7.5%), Health Diagnosing & Treating (192 | 7.0%), and Health Technologists (94 | 3.5%).
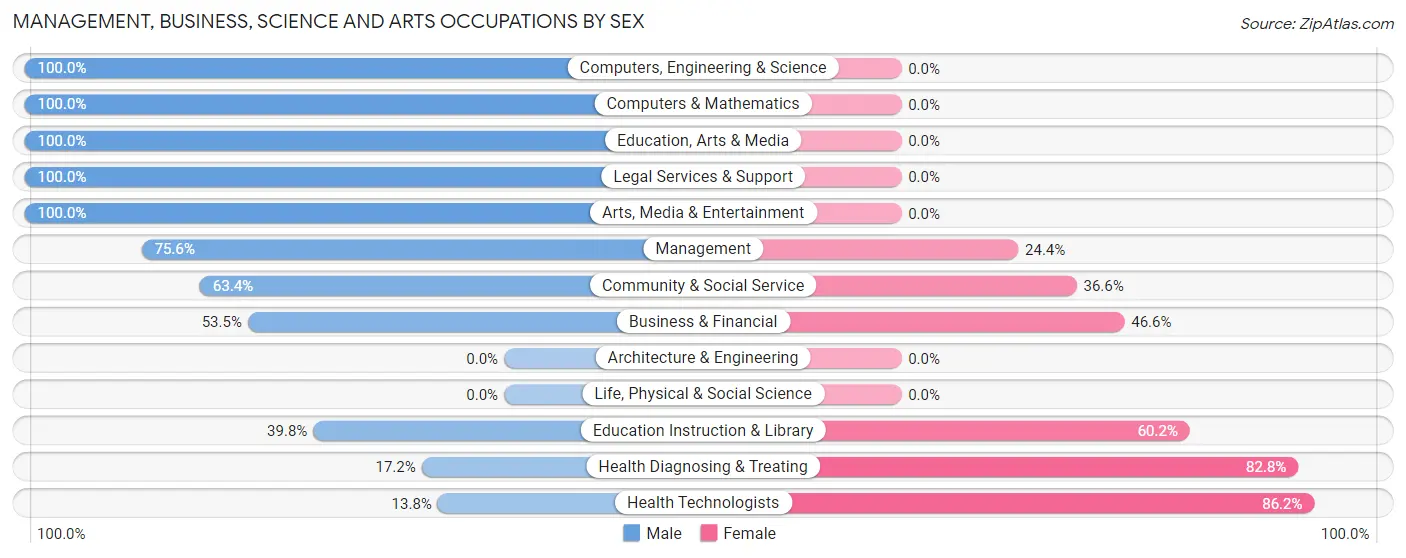
Management, Business, Science and Arts Occupations by Sex
Within the Management, Business, Science and Arts occupations in Lindale, the most male-oriented occupations are Computers, Engineering & Science (100.0%), Computers & Mathematics (100.0%), and Education, Arts & Media (100.0%), while the most female-oriented occupations are Health Technologists (86.2%), Health Diagnosing & Treating (82.8%), and Education Instruction & Library (60.2%).
| Occupation | Male | Female |
| Management | 248 (75.6%) | 80 (24.4%) |
| Business & Financial | 31 (53.4%) | 27 (46.6%) |
| Computers, Engineering & Science | 32 (100.0%) | 0 (0.0%) |
| Computers & Mathematics | 32 (100.0%) | 0 (0.0%) |
| Architecture & Engineering | 0 (0.0%) | 0 (0.0%) |
| Life, Physical & Social Science | 0 (0.0%) | 0 (0.0%) |
| Community & Social Service | 215 (63.4%) | 124 (36.6%) |
| Education, Arts & Media | 19 (100.0%) | 0 (0.0%) |
| Legal Services & Support | 78 (100.0%) | 0 (0.0%) |
| Education Instruction & Library | 82 (39.8%) | 124 (60.2%) |
| Arts, Media & Entertainment | 36 (100.0%) | 0 (0.0%) |
| Health Diagnosing & Treating | 33 (17.2%) | 159 (82.8%) |
| Health Technologists | 13 (13.8%) | 81 (86.2%) |
| Total (Category) | 559 (58.9%) | 390 (41.1%) |
| Total (Overall) | 1,629 (59.7%) | 1,098 (40.3%) |
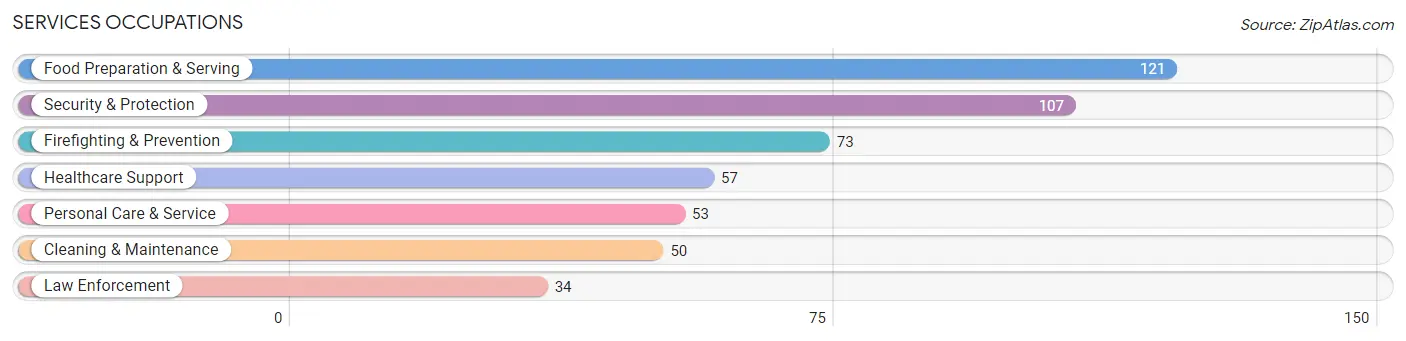
Services Occupations
The most common Services occupations in Lindale are Food Preparation & Serving (121 | 4.4%), Security & Protection (107 | 3.9%), Firefighting & Prevention (73 | 2.7%), Healthcare Support (57 | 2.1%), and Personal Care & Service (53 | 1.9%).
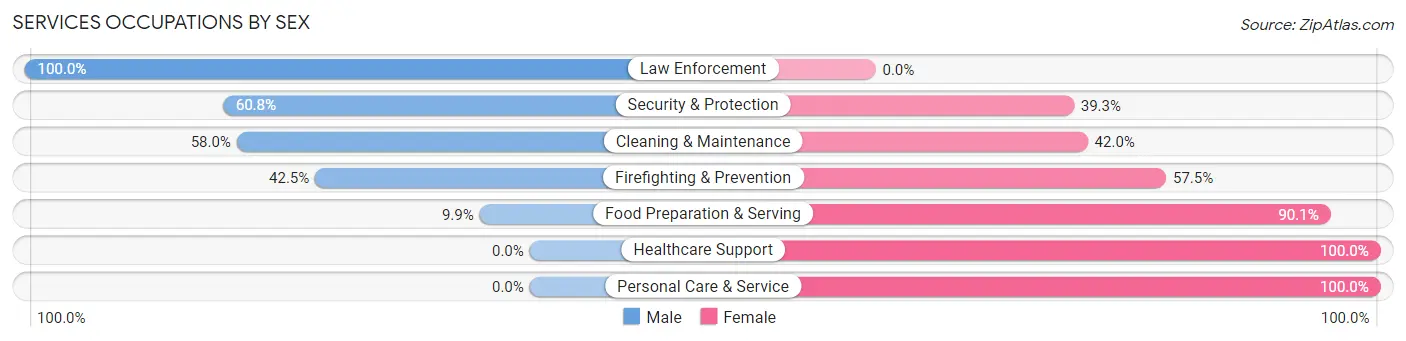
Services Occupations by Sex
Within the Services occupations in Lindale, the most male-oriented occupations are Law Enforcement (100.0%), Security & Protection (60.8%), and Cleaning & Maintenance (58.0%), while the most female-oriented occupations are Healthcare Support (100.0%), Personal Care & Service (100.0%), and Food Preparation & Serving (90.1%).
| Occupation | Male | Female |
| Healthcare Support | 0 (0.0%) | 57 (100.0%) |
| Security & Protection | 65 (60.8%) | 42 (39.3%) |
| Firefighting & Prevention | 31 (42.5%) | 42 (57.5%) |
| Law Enforcement | 34 (100.0%) | 0 (0.0%) |
| Food Preparation & Serving | 12 (9.9%) | 109 (90.1%) |
| Cleaning & Maintenance | 29 (58.0%) | 21 (42.0%) |
| Personal Care & Service | 0 (0.0%) | 53 (100.0%) |
| Total (Category) | 106 (27.3%) | 282 (72.7%) |
| Total (Overall) | 1,629 (59.7%) | 1,098 (40.3%) |
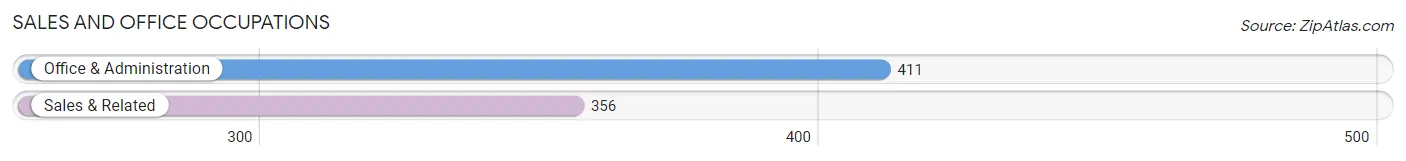
Sales and Office Occupations
The most common Sales and Office occupations in Lindale are Office & Administration (411 | 15.1%), and Sales & Related (356 | 13.1%).
Sales and Office Occupations by Sex
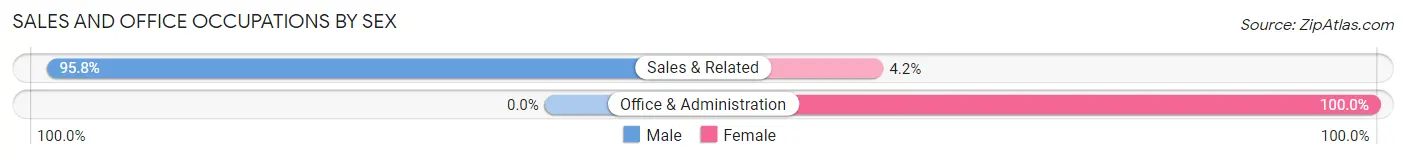
| Occupation | Male | Female |
| Sales & Related | 341 (95.8%) | 15 (4.2%) |
| Office & Administration | 0 (0.0%) | 411 (100.0%) |
| Total (Category) | 341 (44.5%) | 426 (55.5%) |
| Total (Overall) | 1,629 (59.7%) | 1,098 (40.3%) |
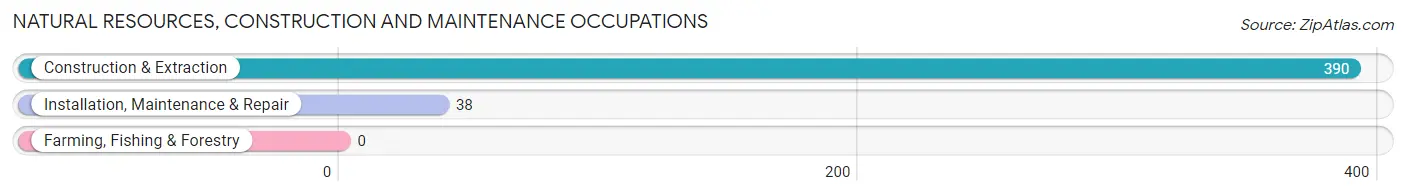
Natural Resources, Construction and Maintenance Occupations
The most common Natural Resources, Construction and Maintenance occupations in Lindale are Construction & Extraction (390 | 14.3%), and Installation, Maintenance & Repair (38 | 1.4%).
Natural Resources, Construction and Maintenance Occupations by Sex
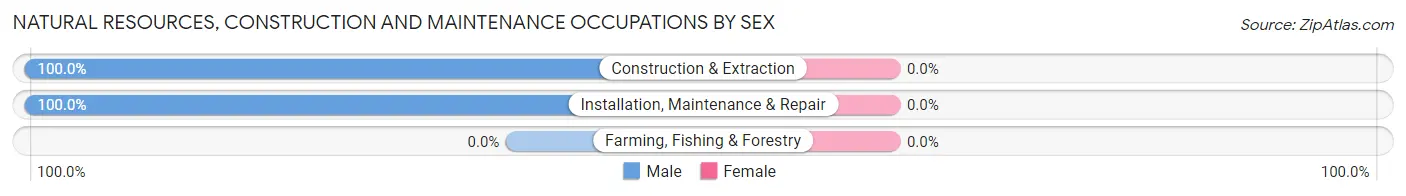
| Occupation | Male | Female |
| Farming, Fishing & Forestry | 0 (0.0%) | 0 (0.0%) |
| Construction & Extraction | 390 (100.0%) | 0 (0.0%) |
| Installation, Maintenance & Repair | 38 (100.0%) | 0 (0.0%) |
| Total (Category) | 428 (100.0%) | 0 (0.0%) |
| Total (Overall) | 1,629 (59.7%) | 1,098 (40.3%) |
Production, Transportation and Moving Occupations
The most common Production, Transportation and Moving occupations in Lindale are Transportation (121 | 4.4%), Production (50 | 1.8%), and Material Moving (24 | 0.9%).
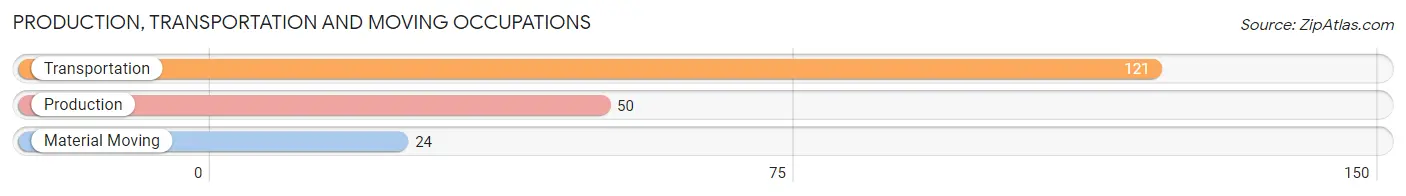
Production, Transportation and Moving Occupations by Sex
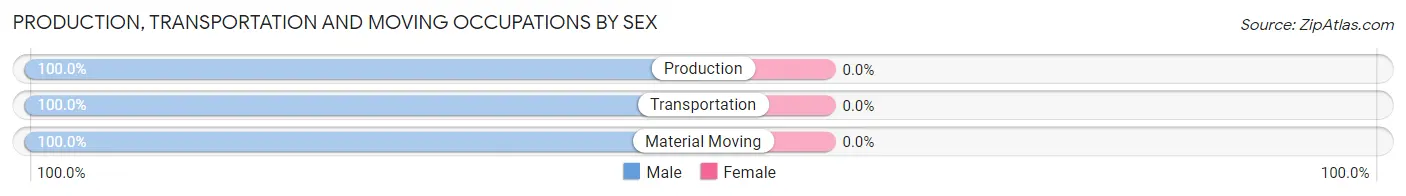
| Occupation | Male | Female |
| Production | 50 (100.0%) | 0 (0.0%) |
| Transportation | 121 (100.0%) | 0 (0.0%) |
| Material Moving | 24 (100.0%) | 0 (0.0%) |
| Total (Category) | 195 (100.0%) | 0 (0.0%) |
| Total (Overall) | 1,629 (59.7%) | 1,098 (40.3%) |
Employment Industries by Sex in Lindale
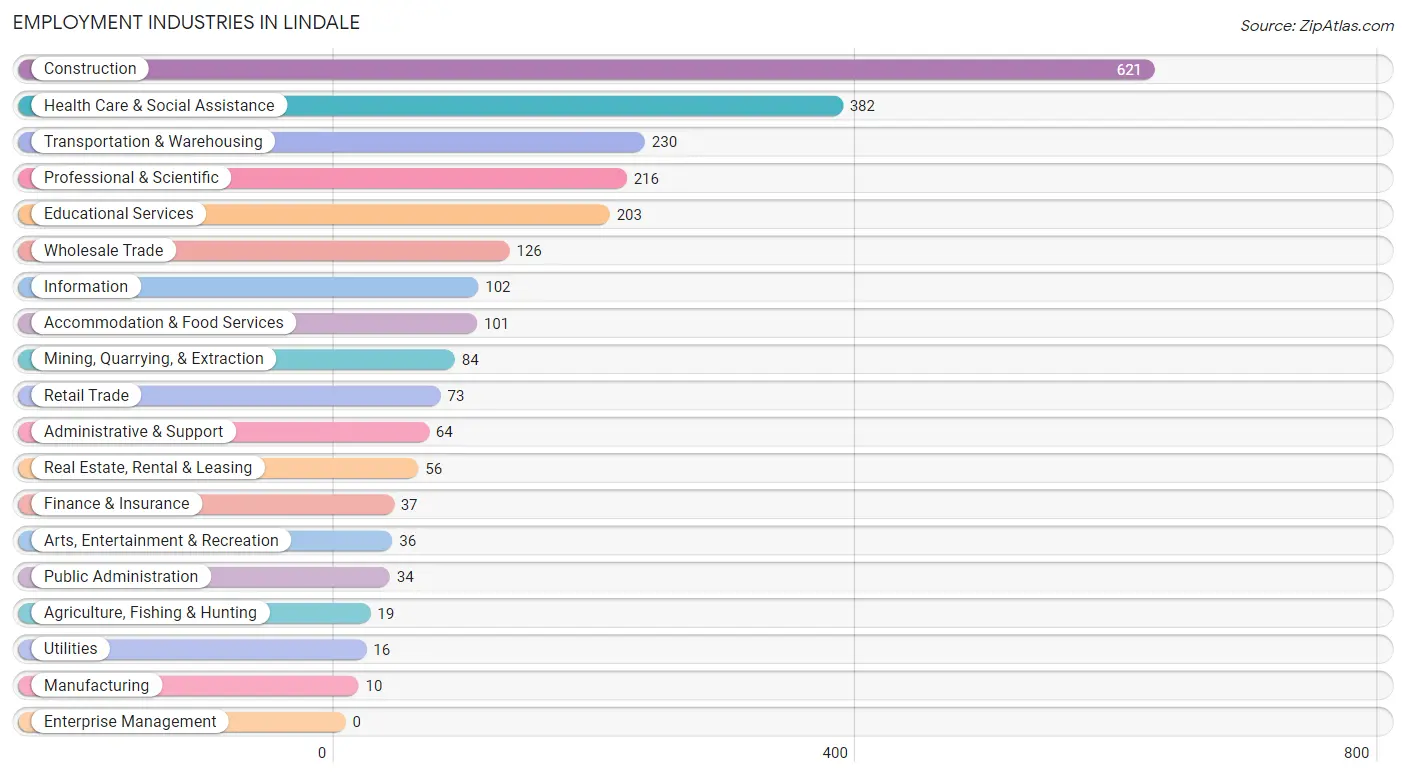
Employment Industries in Lindale
The major employment industries in Lindale include Construction (621 | 22.8%), Health Care & Social Assistance (382 | 14.0%), Transportation & Warehousing (230 | 8.4%), Professional & Scientific (216 | 7.9%), and Educational Services (203 | 7.4%).
Employment Industries by Sex in Lindale
The Lindale industries that see more men than women are Mining, Quarrying, & Extraction (100.0%), Manufacturing (100.0%), and Utilities (100.0%), whereas the industries that tend to have a higher number of women are Agriculture, Fishing & Hunting (100.0%), Information (100.0%), and Accommodation & Food Services (88.1%).
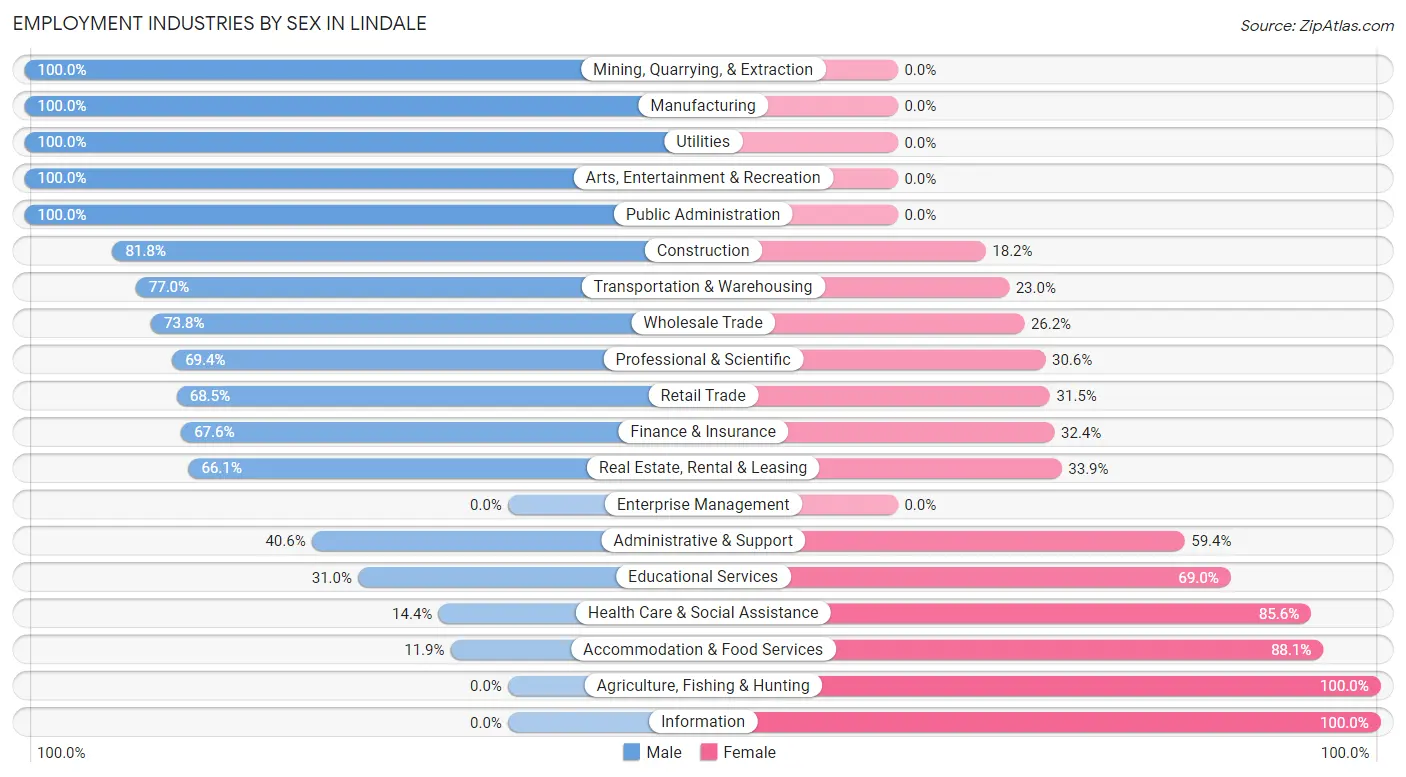
| Industry | Male | Female |
| Agriculture, Fishing & Hunting | 0 (0.0%) | 19 (100.0%) |
| Mining, Quarrying, & Extraction | 84 (100.0%) | 0 (0.0%) |
| Construction | 508 (81.8%) | 113 (18.2%) |
| Manufacturing | 10 (100.0%) | 0 (0.0%) |
| Wholesale Trade | 93 (73.8%) | 33 (26.2%) |
| Retail Trade | 50 (68.5%) | 23 (31.5%) |
| Transportation & Warehousing | 177 (77.0%) | 53 (23.0%) |
| Utilities | 16 (100.0%) | 0 (0.0%) |
| Information | 0 (0.0%) | 102 (100.0%) |
| Finance & Insurance | 25 (67.6%) | 12 (32.4%) |
| Real Estate, Rental & Leasing | 37 (66.1%) | 19 (33.9%) |
| Professional & Scientific | 150 (69.4%) | 66 (30.6%) |
| Enterprise Management | 0 (0.0%) | 0 (0.0%) |
| Administrative & Support | 26 (40.6%) | 38 (59.4%) |
| Educational Services | 63 (31.0%) | 140 (69.0%) |
| Health Care & Social Assistance | 55 (14.4%) | 327 (85.6%) |
| Arts, Entertainment & Recreation | 36 (100.0%) | 0 (0.0%) |
| Accommodation & Food Services | 12 (11.9%) | 89 (88.1%) |
| Public Administration | 34 (100.0%) | 0 (0.0%) |
| Total | 1,629 (59.7%) | 1,098 (40.3%) |
Education in Lindale
School Enrollment in Lindale
The most common levels of schooling among the 1,680 students in Lindale are kindergarten (378 | 22.5%), high school (342 | 20.4%), and elementary school (325 | 19.4%).
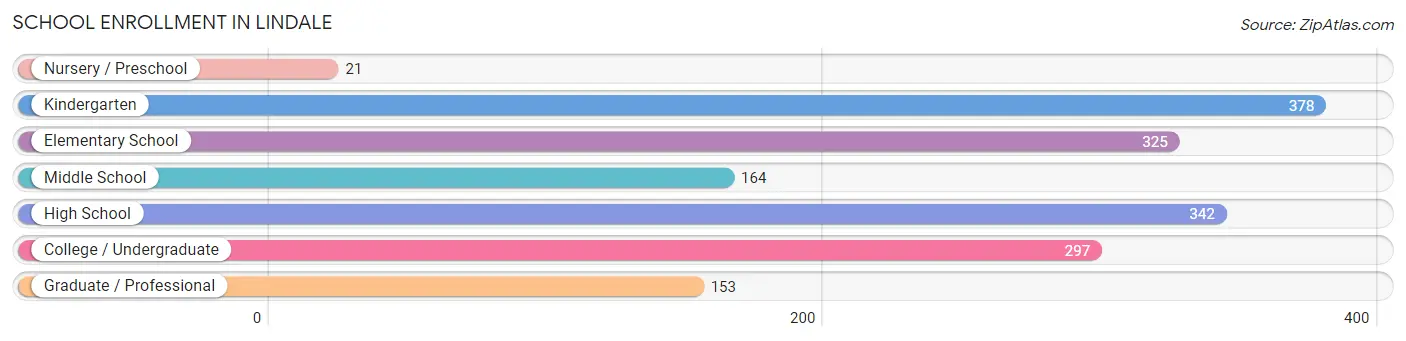
| School Level | # Students | % Students |
| Nursery / Preschool | 21 | 1.3% |
| Kindergarten | 378 | 22.5% |
| Elementary School | 325 | 19.4% |
| Middle School | 164 | 9.8% |
| High School | 342 | 20.4% |
| College / Undergraduate | 297 | 17.7% |
| Graduate / Professional | 153 | 9.1% |
| Total | 1,680 | 100.0% |
School Enrollment by Age by Funding Source in Lindale
Out of a total of 1,680 students who are enrolled in schools in Lindale, 91 (5.4%) attend a private institution, while the remaining 1,589 (94.6%) are enrolled in public schools. The age group of 3 to 4 year olds has the highest likelihood of being enrolled in private schools, with 21 (100.0% in the age bracket) enrolled. Conversely, the age group of 10 to 14 year olds has the lowest likelihood of being enrolled in a private school, with 234 (100.0% in the age bracket) attending a public institution.
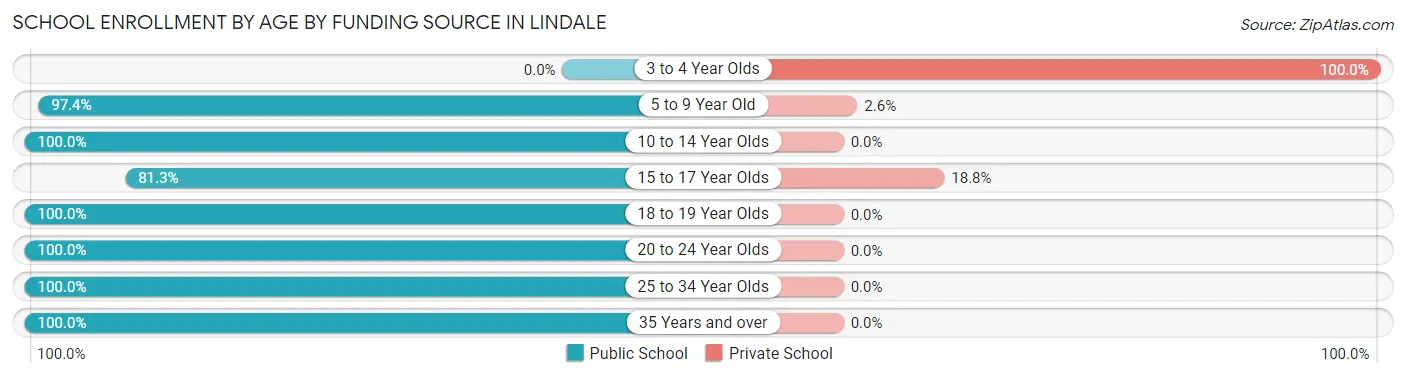
| Age Bracket | Public School | Private School |
| 3 to 4 Year Olds | 0 (0.0%) | 21 (100.0%) |
| 5 to 9 Year Old | 685 (97.4%) | 18 (2.6%) |
| 10 to 14 Year Olds | 234 (100.0%) | 0 (0.0%) |
| 15 to 17 Year Olds | 221 (81.2%) | 51 (18.8%) |
| 18 to 19 Year Olds | 46 (100.0%) | 0 (0.0%) |
| 20 to 24 Year Olds | 62 (100.0%) | 0 (0.0%) |
| 25 to 34 Year Olds | 186 (100.0%) | 0 (0.0%) |
| 35 Years and over | 156 (100.0%) | 0 (0.0%) |
| Total | 1,589 (94.6%) | 91 (5.4%) |
Educational Attainment by Field of Study in Lindale
Business (262 | 26.2%), arts & humanities (191 | 19.1%), education (166 | 16.6%), science & technology (97 | 9.7%), and computers & mathematics (62 | 6.2%) are the most common fields of study among 1,001 individuals in Lindale who have obtained a bachelor's degree or higher.
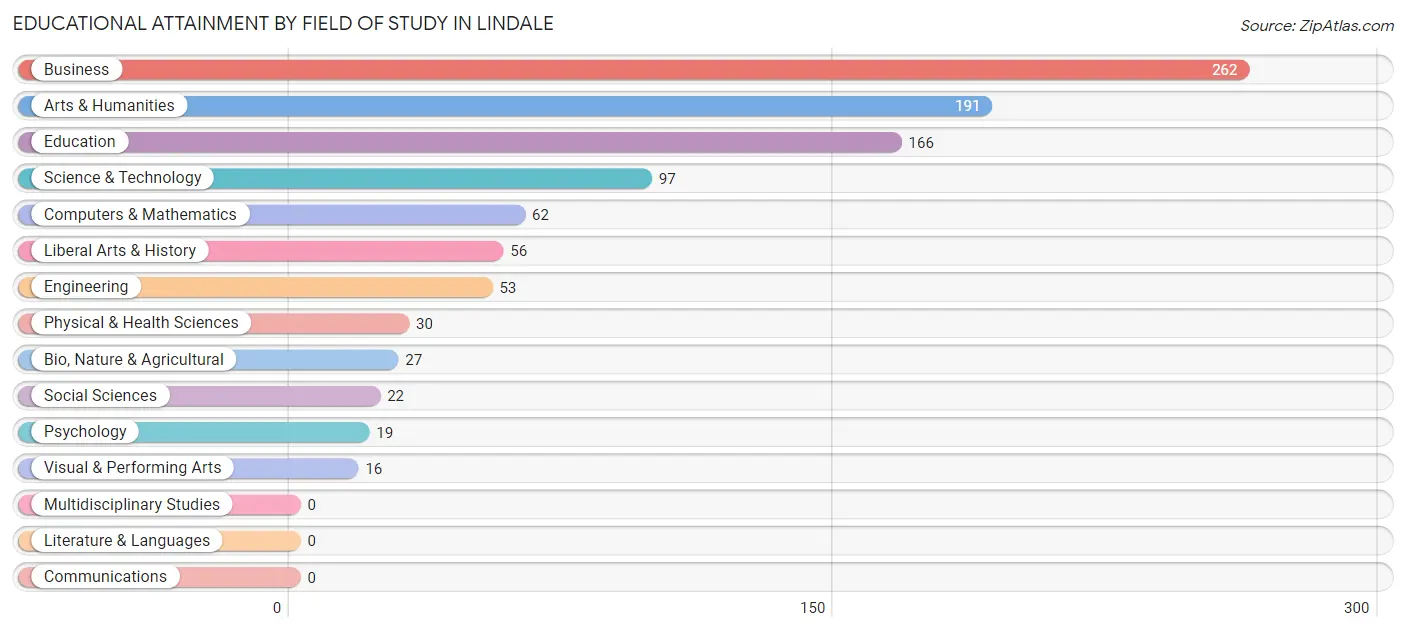
| Field of Study | # Graduates | % Graduates |
| Computers & Mathematics | 62 | 6.2% |
| Bio, Nature & Agricultural | 27 | 2.7% |
| Physical & Health Sciences | 30 | 3.0% |
| Psychology | 19 | 1.9% |
| Social Sciences | 22 | 2.2% |
| Engineering | 53 | 5.3% |
| Multidisciplinary Studies | 0 | 0.0% |
| Science & Technology | 97 | 9.7% |
| Business | 262 | 26.2% |
| Education | 166 | 16.6% |
| Literature & Languages | 0 | 0.0% |
| Liberal Arts & History | 56 | 5.6% |
| Visual & Performing Arts | 16 | 1.6% |
| Communications | 0 | 0.0% |
| Arts & Humanities | 191 | 19.1% |
| Total | 1,001 | 100.0% |
Transportation & Commute in Lindale
Vehicle Availability by Sex in Lindale
The most prevalent vehicle ownership categories in Lindale are males with 2 vehicles (1,000, accounting for 61.9%) and females with 2 vehicles (564, making up 92.8%).
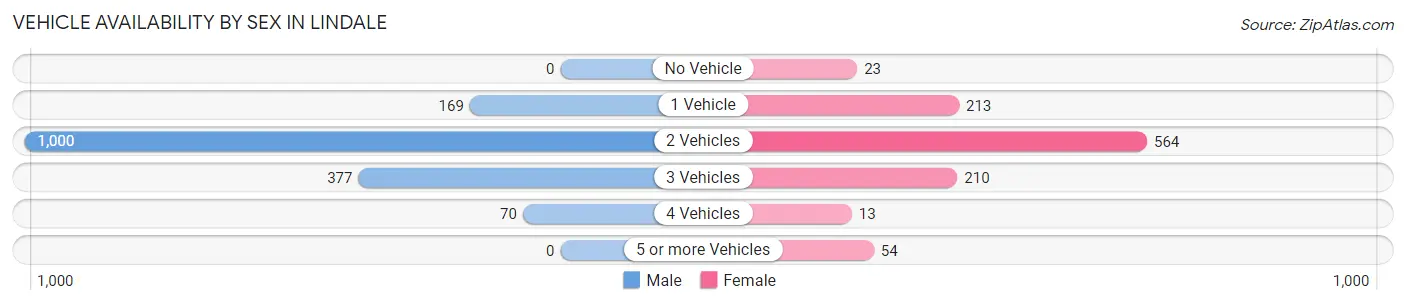
| Vehicles Available | Male | Female |
| No Vehicle | 0 (0.0%) | 23 (2.1%) |
| 1 Vehicle | 169 (10.5%) | 213 (19.8%) |
| 2 Vehicles | 1,000 (61.9%) | 564 (52.4%) |
| 3 Vehicles | 377 (23.3%) | 210 (19.5%) |
| 4 Vehicles | 70 (4.3%) | 13 (1.2%) |
| 5 or more Vehicles | 0 (0.0%) | 54 (5.0%) |
| Total | 1,616 (100.0%) | 1,077 (100.0%) |
Commute Time in Lindale
The most frequently occuring commute durations in Lindale are 30 to 34 minutes (717 commuters, 29.7%), 20 to 24 minutes (411 commuters, 17.0%), and 15 to 19 minutes (339 commuters, 14.0%).
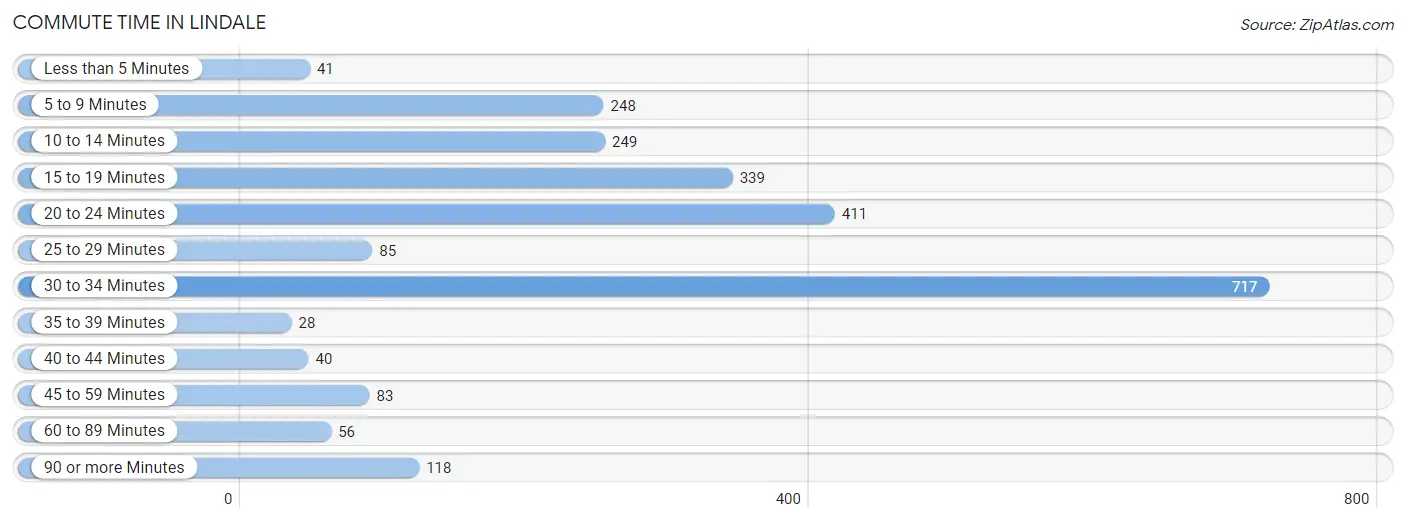
| Commute Time | # Commuters | % Commuters |
| Less than 5 Minutes | 41 | 1.7% |
| 5 to 9 Minutes | 248 | 10.3% |
| 10 to 14 Minutes | 249 | 10.3% |
| 15 to 19 Minutes | 339 | 14.0% |
| 20 to 24 Minutes | 411 | 17.0% |
| 25 to 29 Minutes | 85 | 3.5% |
| 30 to 34 Minutes | 717 | 29.7% |
| 35 to 39 Minutes | 28 | 1.2% |
| 40 to 44 Minutes | 40 | 1.7% |
| 45 to 59 Minutes | 83 | 3.4% |
| 60 to 89 Minutes | 56 | 2.3% |
| 90 or more Minutes | 118 | 4.9% |
Commute Time by Sex in Lindale
The most common commute times in Lindale are 30 to 34 minutes (415 commuters, 27.2%) for males and 30 to 34 minutes (302 commuters, 33.9%) for females.
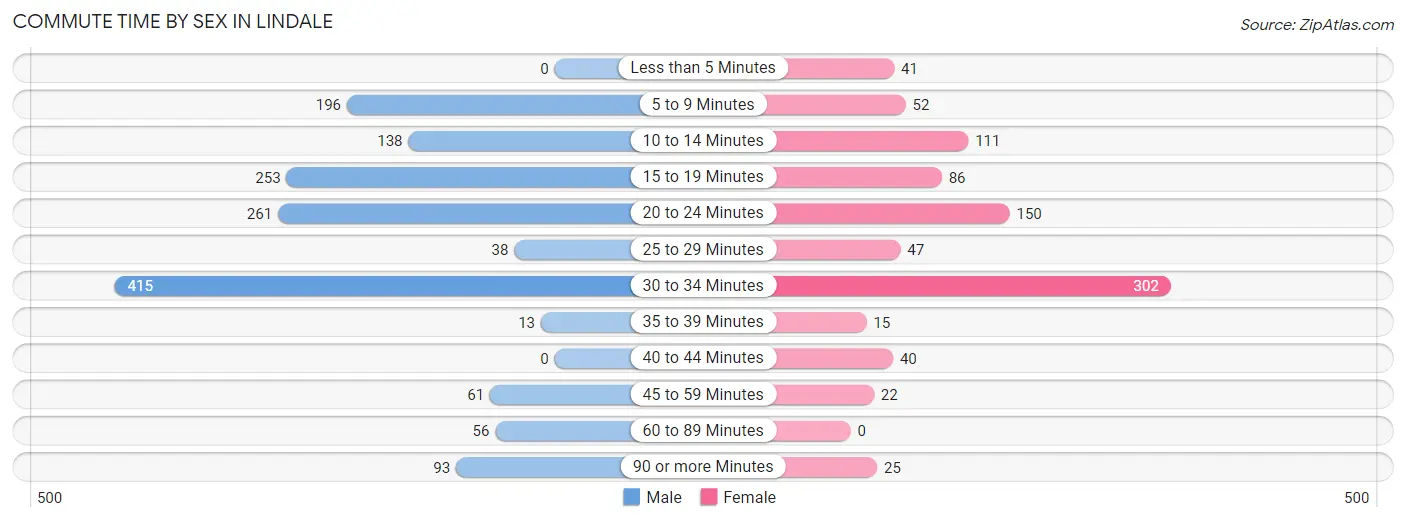
| Commute Time | Male | Female |
| Less than 5 Minutes | 0 (0.0%) | 41 (4.6%) |
| 5 to 9 Minutes | 196 (12.9%) | 52 (5.8%) |
| 10 to 14 Minutes | 138 (9.1%) | 111 (12.5%) |
| 15 to 19 Minutes | 253 (16.6%) | 86 (9.7%) |
| 20 to 24 Minutes | 261 (17.1%) | 150 (16.8%) |
| 25 to 29 Minutes | 38 (2.5%) | 47 (5.3%) |
| 30 to 34 Minutes | 415 (27.2%) | 302 (33.9%) |
| 35 to 39 Minutes | 13 (0.9%) | 15 (1.7%) |
| 40 to 44 Minutes | 0 (0.0%) | 40 (4.5%) |
| 45 to 59 Minutes | 61 (4.0%) | 22 (2.5%) |
| 60 to 89 Minutes | 56 (3.7%) | 0 (0.0%) |
| 90 or more Minutes | 93 (6.1%) | 25 (2.8%) |
Time of Departure to Work by Sex in Lindale
The most frequent times of departure to work in Lindale are 7:30 AM to 7:59 AM (234, 15.3%) for males and 9:00 AM to 9:59 AM (168, 18.9%) for females.
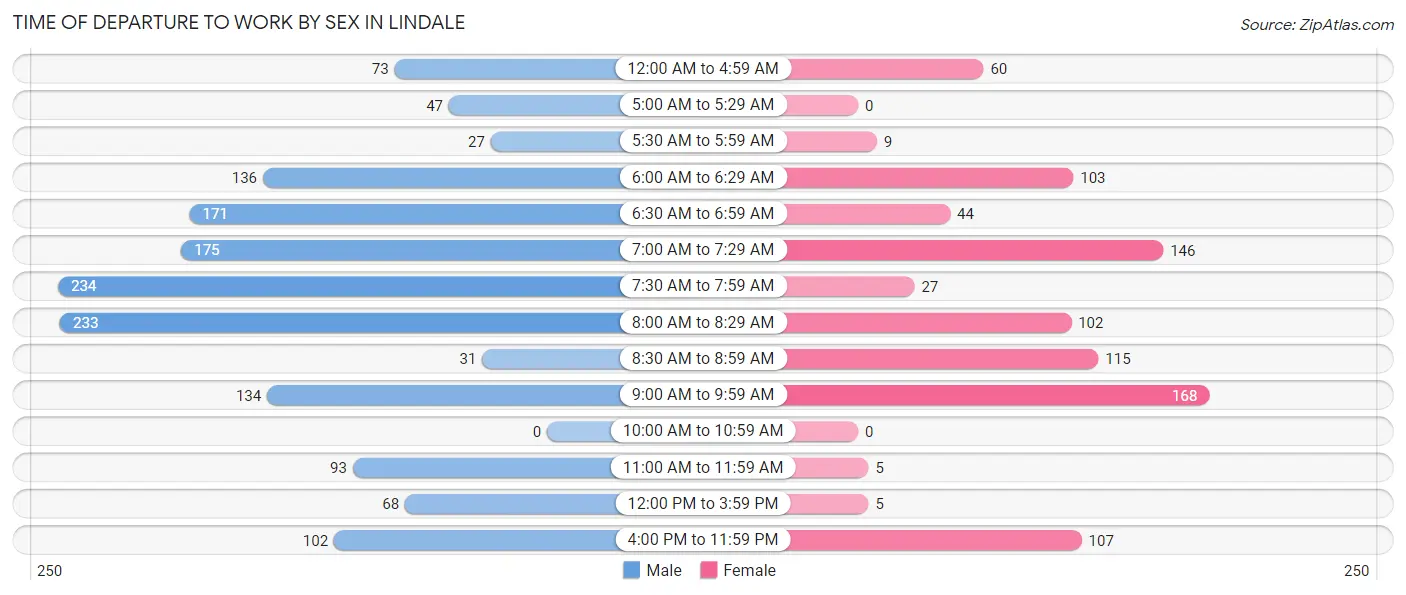
| Time of Departure | Male | Female |
| 12:00 AM to 4:59 AM | 73 (4.8%) | 60 (6.7%) |
| 5:00 AM to 5:29 AM | 47 (3.1%) | 0 (0.0%) |
| 5:30 AM to 5:59 AM | 27 (1.8%) | 9 (1.0%) |
| 6:00 AM to 6:29 AM | 136 (8.9%) | 103 (11.6%) |
| 6:30 AM to 6:59 AM | 171 (11.2%) | 44 (4.9%) |
| 7:00 AM to 7:29 AM | 175 (11.5%) | 146 (16.4%) |
| 7:30 AM to 7:59 AM | 234 (15.3%) | 27 (3.0%) |
| 8:00 AM to 8:29 AM | 233 (15.3%) | 102 (11.5%) |
| 8:30 AM to 8:59 AM | 31 (2.0%) | 115 (12.9%) |
| 9:00 AM to 9:59 AM | 134 (8.8%) | 168 (18.9%) |
| 10:00 AM to 10:59 AM | 0 (0.0%) | 0 (0.0%) |
| 11:00 AM to 11:59 AM | 93 (6.1%) | 5 (0.6%) |
| 12:00 PM to 3:59 PM | 68 (4.5%) | 5 (0.6%) |
| 4:00 PM to 11:59 PM | 102 (6.7%) | 107 (12.0%) |
| Total | 1,524 (100.0%) | 891 (100.0%) |
Housing Occupancy in Lindale
Occupancy by Ownership in Lindale
Of the total 2,350 dwellings in Lindale, owner-occupied units account for 1,724 (73.4%), while renter-occupied units make up 626 (26.6%).
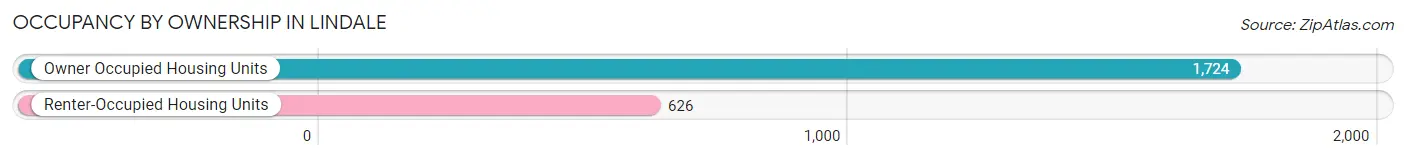
| Occupancy | # Housing Units | % Housing Units |
| Owner Occupied Housing Units | 1,724 | 73.4% |
| Renter-Occupied Housing Units | 626 | 26.6% |
| Total Occupied Housing Units | 2,350 | 100.0% |
Occupancy by Household Size in Lindale
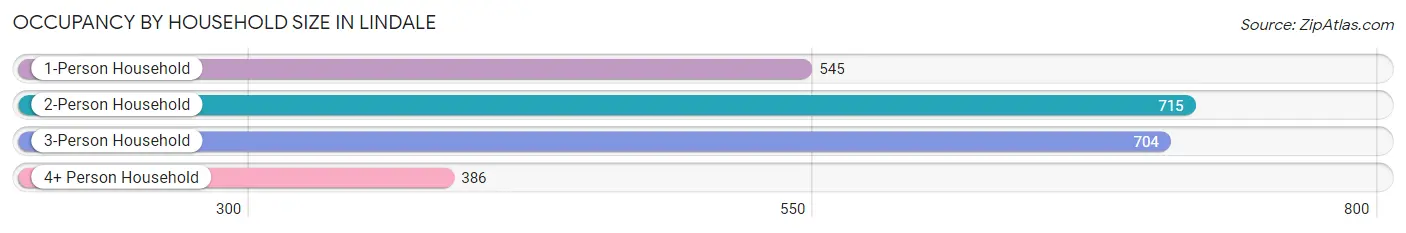
| Household Size | # Housing Units | % Housing Units |
| 1-Person Household | 545 | 23.2% |
| 2-Person Household | 715 | 30.4% |
| 3-Person Household | 704 | 30.0% |
| 4+ Person Household | 386 | 16.4% |
| Total Housing Units | 2,350 | 100.0% |
Occupancy by Ownership by Household Size in Lindale
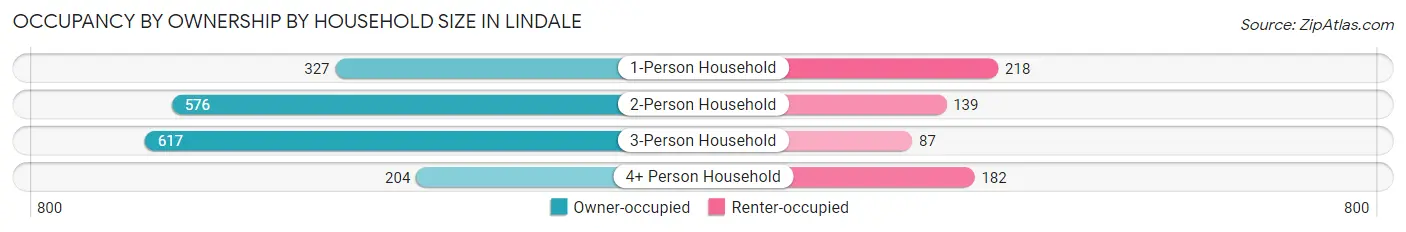
| Household Size | Owner-occupied | Renter-occupied |
| 1-Person Household | 327 (60.0%) | 218 (40.0%) |
| 2-Person Household | 576 (80.6%) | 139 (19.4%) |
| 3-Person Household | 617 (87.6%) | 87 (12.4%) |
| 4+ Person Household | 204 (52.8%) | 182 (47.1%) |
| Total Housing Units | 1,724 (73.4%) | 626 (26.6%) |
Occupancy by Educational Attainment in Lindale
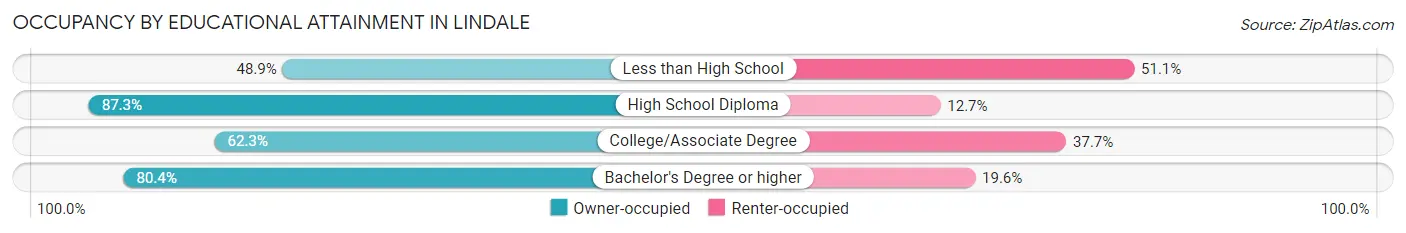
| Household Size | Owner-occupied | Renter-occupied |
| Less than High School | 107 (48.9%) | 112 (51.1%) |
| High School Diploma | 617 (87.3%) | 90 (12.7%) |
| College/Associate Degree | 500 (62.3%) | 302 (37.7%) |
| Bachelor's Degree or higher | 500 (80.4%) | 122 (19.6%) |
Occupancy by Age of Householder in Lindale
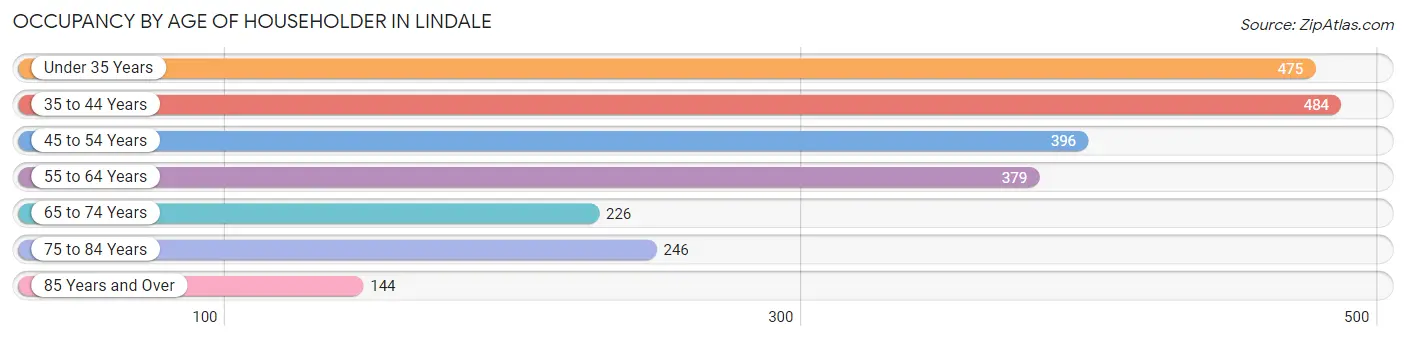
| Age Bracket | # Households | % Households |
| Under 35 Years | 475 | 20.2% |
| 35 to 44 Years | 484 | 20.6% |
| 45 to 54 Years | 396 | 16.9% |
| 55 to 64 Years | 379 | 16.1% |
| 65 to 74 Years | 226 | 9.6% |
| 75 to 84 Years | 246 | 10.5% |
| 85 Years and Over | 144 | 6.1% |
| Total | 2,350 | 100.0% |
Housing Finances in Lindale
Median Income by Occupancy in Lindale
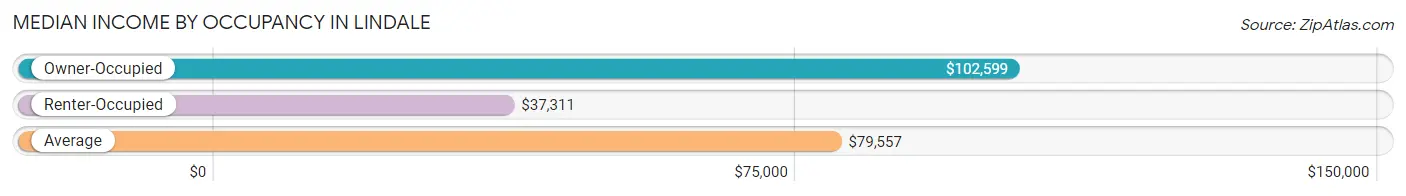
| Occupancy Type | # Households | Median Income |
| Owner-Occupied | 1,724 (73.4%) | $102,599 |
| Renter-Occupied | 626 (26.6%) | $37,311 |
| Average | 2,350 (100.0%) | $79,557 |
Occupancy by Householder Income Bracket in Lindale
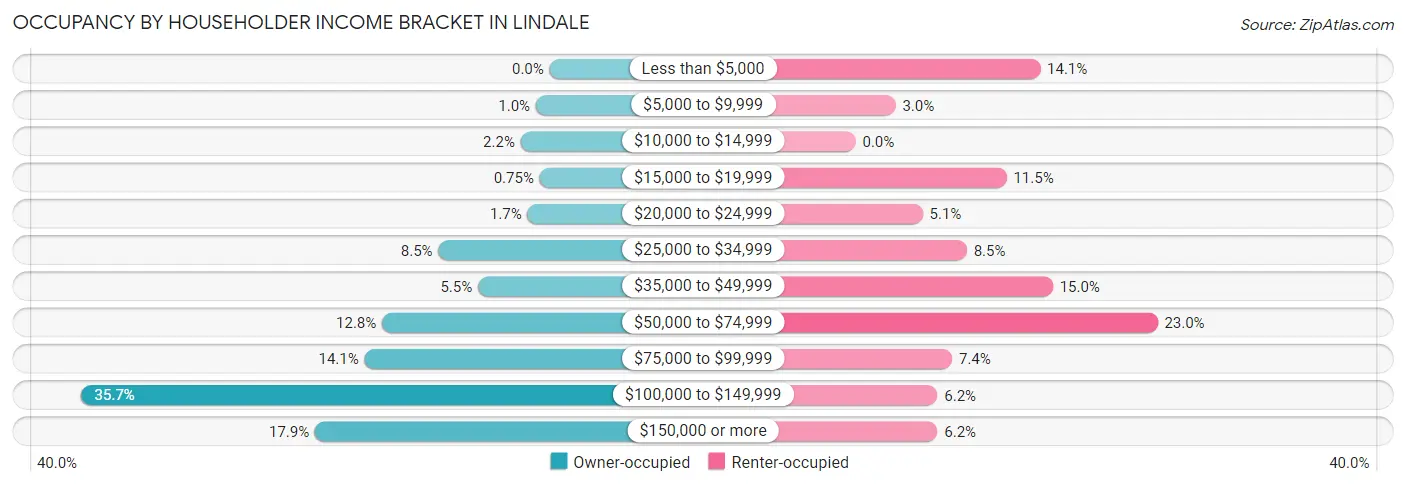
| Income Bracket | Owner-occupied | Renter-occupied |
| Less than $5,000 | 0 (0.0%) | 88 (14.1%) |
| $5,000 to $9,999 | 18 (1.0%) | 19 (3.0%) |
| $10,000 to $14,999 | 38 (2.2%) | 0 (0.0%) |
| $15,000 to $19,999 | 13 (0.7%) | 72 (11.5%) |
| $20,000 to $24,999 | 29 (1.7%) | 32 (5.1%) |
| $25,000 to $34,999 | 146 (8.5%) | 53 (8.5%) |
| $35,000 to $49,999 | 94 (5.4%) | 94 (15.0%) |
| $50,000 to $74,999 | 220 (12.8%) | 144 (23.0%) |
| $75,000 to $99,999 | 243 (14.1%) | 46 (7.3%) |
| $100,000 to $149,999 | 615 (35.7%) | 39 (6.2%) |
| $150,000 or more | 308 (17.9%) | 39 (6.2%) |
| Total | 1,724 (100.0%) | 626 (100.0%) |
Monthly Housing Cost Tiers in Lindale
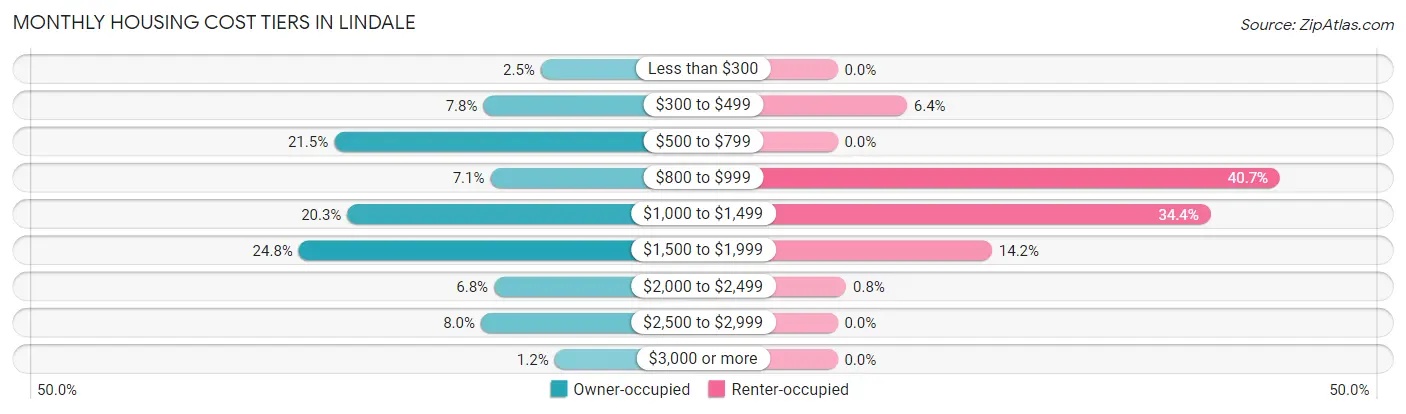
| Monthly Cost | Owner-occupied | Renter-occupied |
| Less than $300 | 43 (2.5%) | 0 (0.0%) |
| $300 to $499 | 134 (7.8%) | 40 (6.4%) |
| $500 to $799 | 371 (21.5%) | 0 (0.0%) |
| $800 to $999 | 123 (7.1%) | 255 (40.7%) |
| $1,000 to $1,499 | 350 (20.3%) | 215 (34.4%) |
| $1,500 to $1,999 | 427 (24.8%) | 89 (14.2%) |
| $2,000 to $2,499 | 117 (6.8%) | 5 (0.8%) |
| $2,500 to $2,999 | 138 (8.0%) | 0 (0.0%) |
| $3,000 or more | 21 (1.2%) | 0 (0.0%) |
| Total | 1,724 (100.0%) | 626 (100.0%) |
Physical Housing Characteristics in Lindale
Housing Structures in Lindale
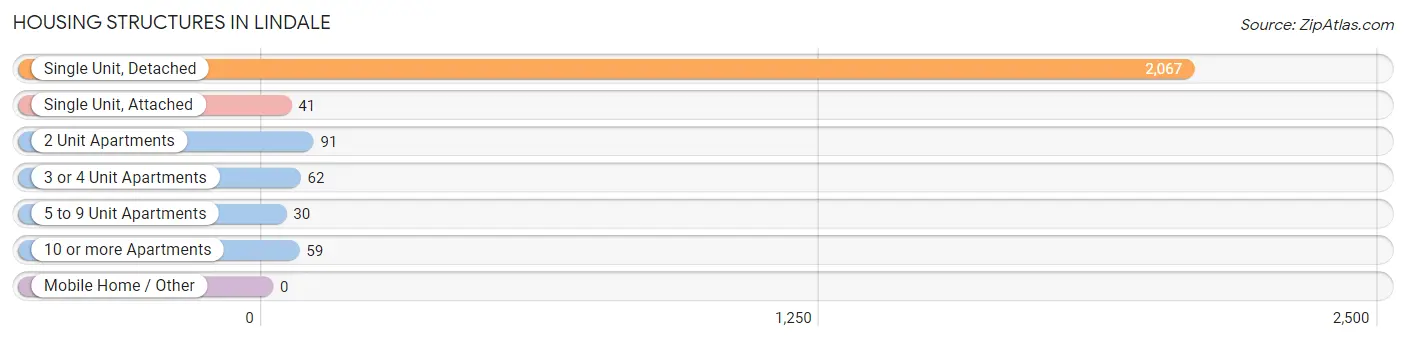
| Structure Type | # Housing Units | % Housing Units |
| Single Unit, Detached | 2,067 | 88.0% |
| Single Unit, Attached | 41 | 1.7% |
| 2 Unit Apartments | 91 | 3.9% |
| 3 or 4 Unit Apartments | 62 | 2.6% |
| 5 to 9 Unit Apartments | 30 | 1.3% |
| 10 or more Apartments | 59 | 2.5% |
| Mobile Home / Other | 0 | 0.0% |
| Total | 2,350 | 100.0% |
Housing Structures by Occupancy in Lindale
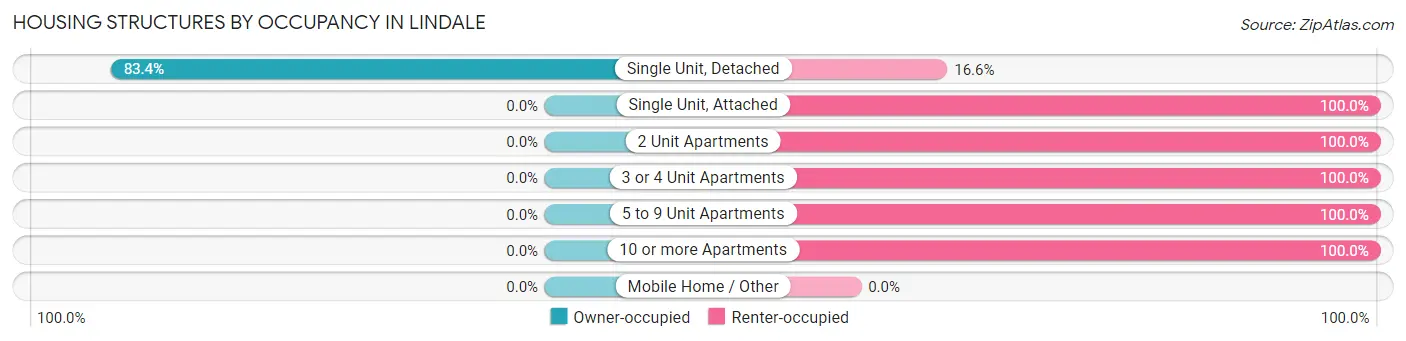
| Structure Type | Owner-occupied | Renter-occupied |
| Single Unit, Detached | 1,724 (83.4%) | 343 (16.6%) |
| Single Unit, Attached | 0 (0.0%) | 41 (100.0%) |
| 2 Unit Apartments | 0 (0.0%) | 91 (100.0%) |
| 3 or 4 Unit Apartments | 0 (0.0%) | 62 (100.0%) |
| 5 to 9 Unit Apartments | 0 (0.0%) | 30 (100.0%) |
| 10 or more Apartments | 0 (0.0%) | 59 (100.0%) |
| Mobile Home / Other | 0 (0.0%) | 0 (0.0%) |
| Total | 1,724 (73.4%) | 626 (26.6%) |
Housing Structures by Number of Rooms in Lindale
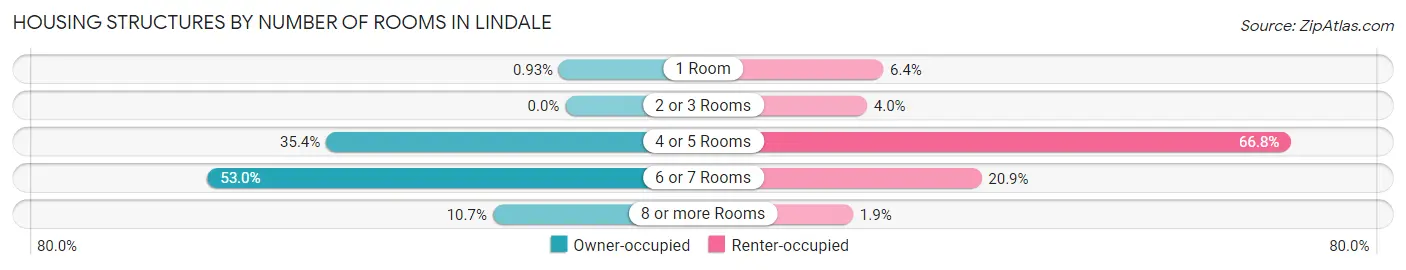
| Number of Rooms | Owner-occupied | Renter-occupied |
| 1 Room | 16 (0.9%) | 40 (6.4%) |
| 2 or 3 Rooms | 0 (0.0%) | 25 (4.0%) |
| 4 or 5 Rooms | 610 (35.4%) | 418 (66.8%) |
| 6 or 7 Rooms | 913 (53.0%) | 131 (20.9%) |
| 8 or more Rooms | 185 (10.7%) | 12 (1.9%) |
| Total | 1,724 (100.0%) | 626 (100.0%) |
Housing Structure by Heating Type in Lindale
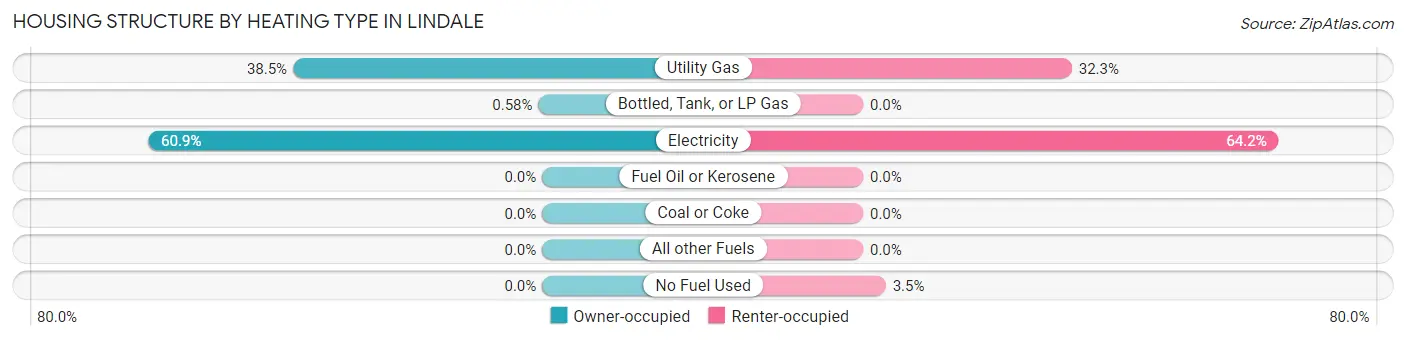
| Heating Type | Owner-occupied | Renter-occupied |
| Utility Gas | 664 (38.5%) | 202 (32.3%) |
| Bottled, Tank, or LP Gas | 10 (0.6%) | 0 (0.0%) |
| Electricity | 1,050 (60.9%) | 402 (64.2%) |
| Fuel Oil or Kerosene | 0 (0.0%) | 0 (0.0%) |
| Coal or Coke | 0 (0.0%) | 0 (0.0%) |
| All other Fuels | 0 (0.0%) | 0 (0.0%) |
| No Fuel Used | 0 (0.0%) | 22 (3.5%) |
| Total | 1,724 (100.0%) | 626 (100.0%) |
Household Vehicle Usage in Lindale
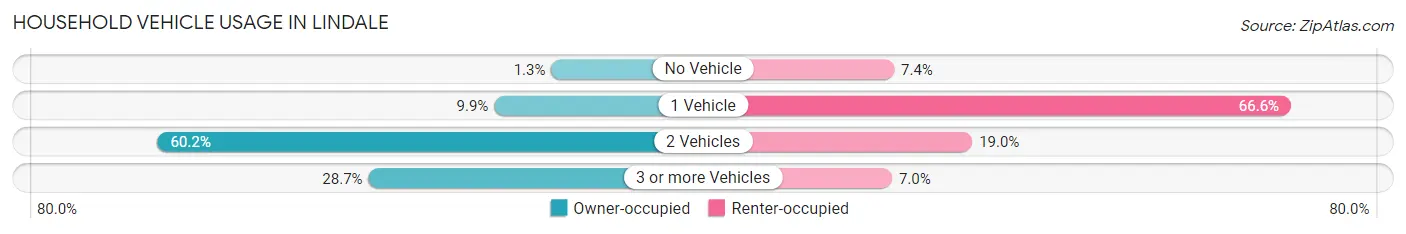
| Vehicles per Household | Owner-occupied | Renter-occupied |
| No Vehicle | 23 (1.3%) | 46 (7.3%) |
| 1 Vehicle | 170 (9.9%) | 417 (66.6%) |
| 2 Vehicles | 1,037 (60.2%) | 119 (19.0%) |
| 3 or more Vehicles | 494 (28.6%) | 44 (7.0%) |
| Total | 1,724 (100.0%) | 626 (100.0%) |
Real Estate & Mortgages in Lindale
Real Estate and Mortgage Overview in Lindale
| Characteristic | Without Mortgage | With Mortgage |
| Housing Units | 678 | 1,046 |
| Median Property Value | $239,500 | $216,800 |
| Median Household Income | $85,000 | $248 |
| Monthly Housing Costs | $566 | $21 |
| Real Estate Taxes | $4,131 | $0 |
Property Value by Mortgage Status in Lindale
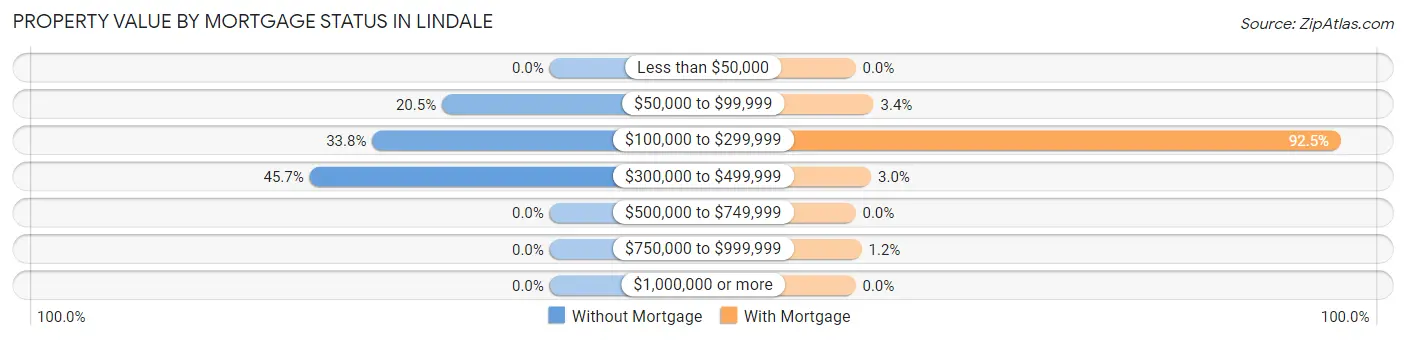
| Property Value | Without Mortgage | With Mortgage |
| Less than $50,000 | 0 (0.0%) | 0 (0.0%) |
| $50,000 to $99,999 | 139 (20.5%) | 36 (3.4%) |
| $100,000 to $299,999 | 229 (33.8%) | 967 (92.4%) |
| $300,000 to $499,999 | 310 (45.7%) | 31 (3.0%) |
| $500,000 to $749,999 | 0 (0.0%) | 0 (0.0%) |
| $750,000 to $999,999 | 0 (0.0%) | 12 (1.1%) |
| $1,000,000 or more | 0 (0.0%) | 0 (0.0%) |
| Total | 678 (100.0%) | 1,046 (100.0%) |
Household Income by Mortgage Status in Lindale
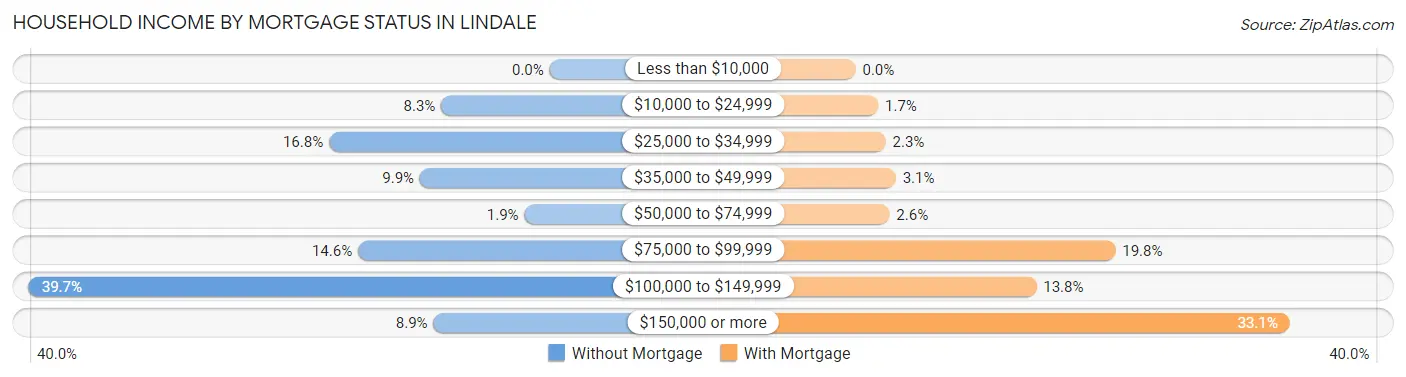
| Household Income | Without Mortgage | With Mortgage |
| Less than $10,000 | 0 (0.0%) | 0 (0.0%) |
| $10,000 to $24,999 | 56 (8.3%) | 18 (1.7%) |
| $25,000 to $34,999 | 114 (16.8%) | 24 (2.3%) |
| $35,000 to $49,999 | 67 (9.9%) | 32 (3.1%) |
| $50,000 to $74,999 | 13 (1.9%) | 27 (2.6%) |
| $75,000 to $99,999 | 99 (14.6%) | 207 (19.8%) |
| $100,000 to $149,999 | 269 (39.7%) | 144 (13.8%) |
| $150,000 or more | 60 (8.8%) | 346 (33.1%) |
| Total | 678 (100.0%) | 1,046 (100.0%) |
Property Value to Household Income Ratio in Lindale
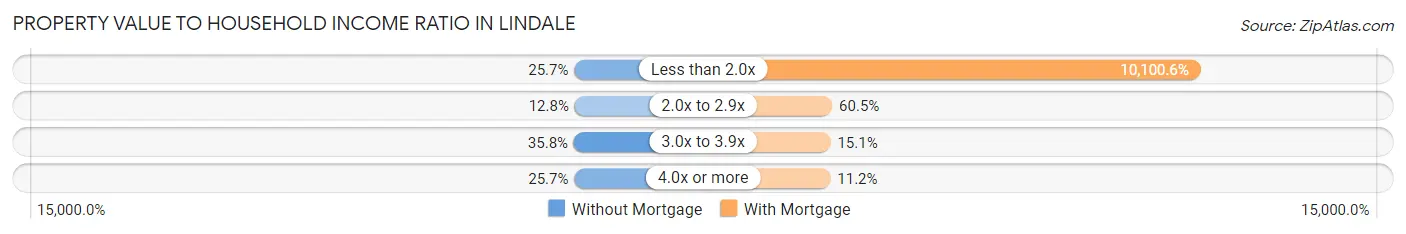
| Value-to-Income Ratio | Without Mortgage | With Mortgage |
| Less than 2.0x | 174 (25.7%) | 105,652 (10,100.6%) |
| 2.0x to 2.9x | 87 (12.8%) | 633 (60.5%) |
| 3.0x to 3.9x | 243 (35.8%) | 158 (15.1%) |
| 4.0x or more | 174 (25.7%) | 117 (11.2%) |
| Total | 678 (100.0%) | 1,046 (100.0%) |
Real Estate Taxes by Mortgage Status in Lindale
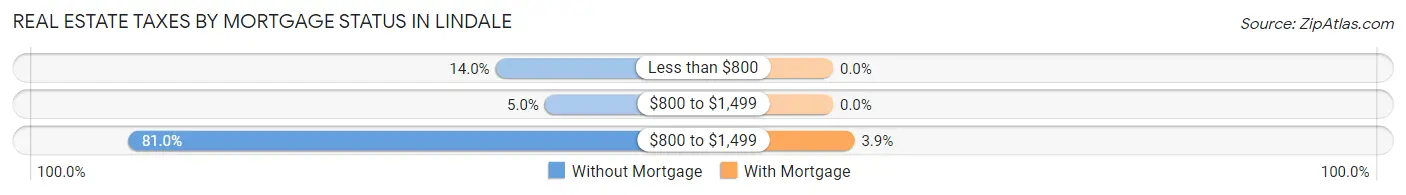
| Property Taxes | Without Mortgage | With Mortgage |
| Less than $800 | 95 (14.0%) | 0 (0.0%) |
| $800 to $1,499 | 34 (5.0%) | 0 (0.0%) |
| $800 to $1,499 | 549 (81.0%) | 41 (3.9%) |
| Total | 678 (100.0%) | 1,046 (100.0%) |
Health & Disability in Lindale
Health Insurance Coverage by Age in Lindale
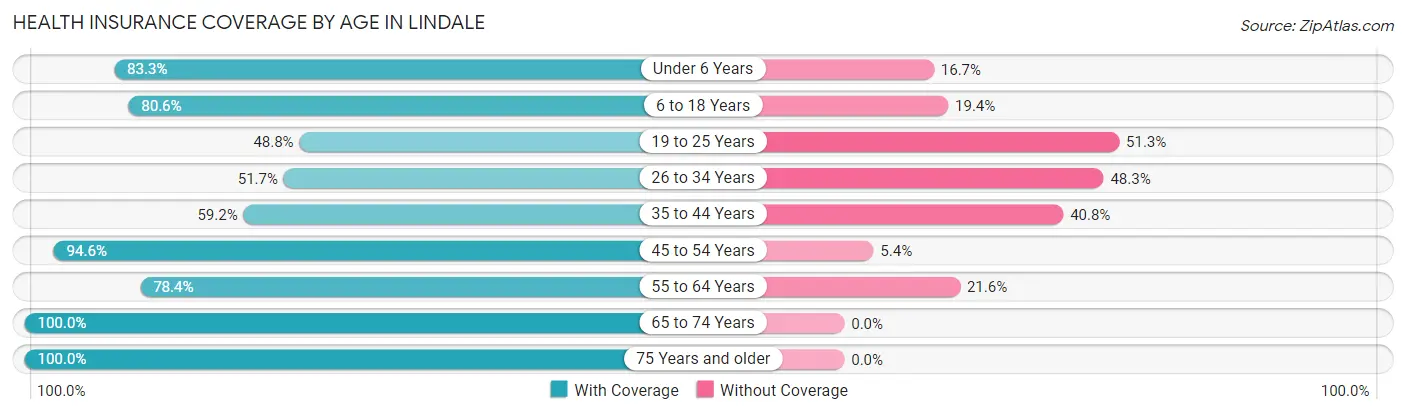
| Age Bracket | With Coverage | Without Coverage |
| Under 6 Years | 399 (83.3%) | 80 (16.7%) |
| 6 to 18 Years | 983 (80.6%) | 236 (19.4%) |
| 19 to 25 Years | 312 (48.7%) | 328 (51.2%) |
| 26 to 34 Years | 355 (51.7%) | 332 (48.3%) |
| 35 to 44 Years | 432 (59.2%) | 298 (40.8%) |
| 45 to 54 Years | 714 (94.6%) | 41 (5.4%) |
| 55 to 64 Years | 520 (78.4%) | 143 (21.6%) |
| 65 to 74 Years | 301 (100.0%) | 0 (0.0%) |
| 75 Years and older | 576 (100.0%) | 0 (0.0%) |
| Total | 4,592 (75.9%) | 1,458 (24.1%) |
Health Insurance Coverage by Citizenship Status in Lindale
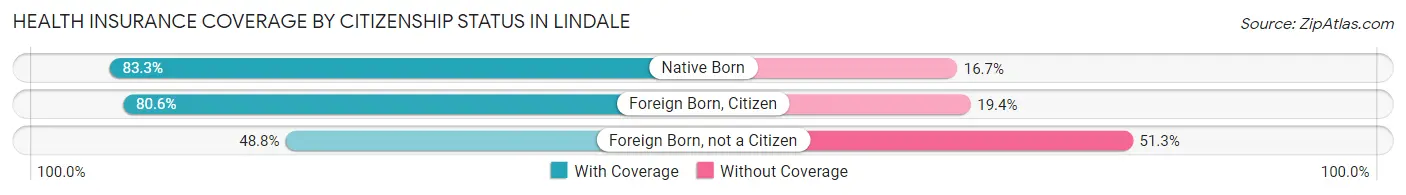
| Citizenship Status | With Coverage | Without Coverage |
| Native Born | 399 (83.3%) | 80 (16.7%) |
| Foreign Born, Citizen | 983 (80.6%) | 236 (19.4%) |
| Foreign Born, not a Citizen | 312 (48.7%) | 328 (51.2%) |
Health Insurance Coverage by Household Income in Lindale
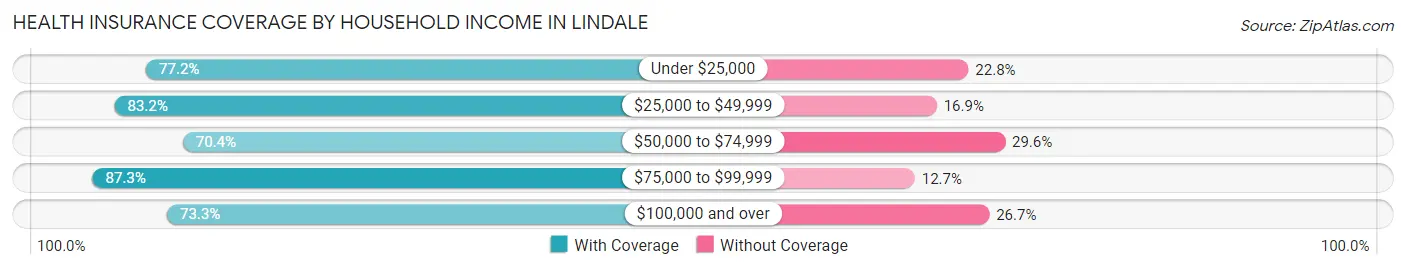
| Household Income | With Coverage | Without Coverage |
| Under $25,000 | 400 (77.2%) | 118 (22.8%) |
| $25,000 to $49,999 | 770 (83.2%) | 156 (16.9%) |
| $50,000 to $74,999 | 909 (70.4%) | 383 (29.6%) |
| $75,000 to $99,999 | 582 (87.3%) | 85 (12.7%) |
| $100,000 and over | 1,912 (73.3%) | 696 (26.7%) |
Public vs Private Health Insurance Coverage by Age in Lindale
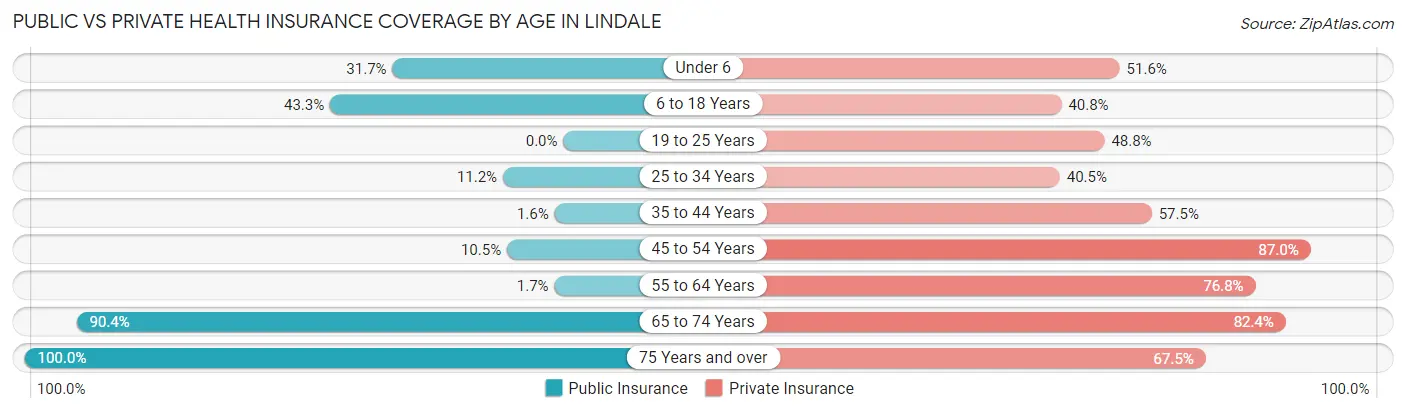
| Age Bracket | Public Insurance | Private Insurance |
| Under 6 | 152 (31.7%) | 247 (51.6%) |
| 6 to 18 Years | 528 (43.3%) | 497 (40.8%) |
| 19 to 25 Years | 0 (0.0%) | 312 (48.7%) |
| 25 to 34 Years | 77 (11.2%) | 278 (40.5%) |
| 35 to 44 Years | 12 (1.6%) | 420 (57.5%) |
| 45 to 54 Years | 79 (10.5%) | 657 (87.0%) |
| 55 to 64 Years | 11 (1.7%) | 509 (76.8%) |
| 65 to 74 Years | 272 (90.4%) | 248 (82.4%) |
| 75 Years and over | 576 (100.0%) | 389 (67.5%) |
| Total | 1,707 (28.2%) | 3,557 (58.8%) |
Disability Status by Sex by Age in Lindale
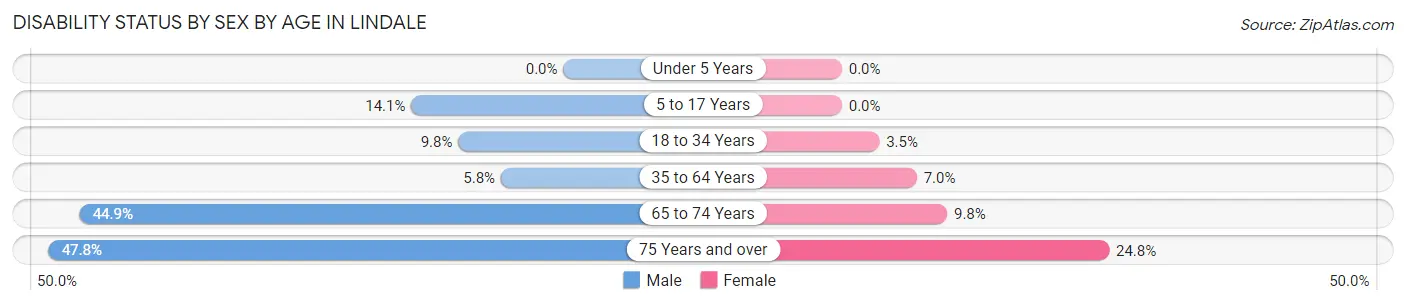
| Age Bracket | Male | Female |
| Under 5 Years | 0 (0.0%) | 0 (0.0%) |
| 5 to 17 Years | 104 (14.1%) | 0 (0.0%) |
| 18 to 34 Years | 58 (9.8%) | 27 (3.5%) |
| 35 to 64 Years | 71 (5.8%) | 64 (7.0%) |
| 65 to 74 Years | 57 (44.9%) | 17 (9.8%) |
| 75 Years and over | 96 (47.8%) | 93 (24.8%) |
Disability Class by Sex by Age in Lindale
Disability Class: Hearing Difficulty
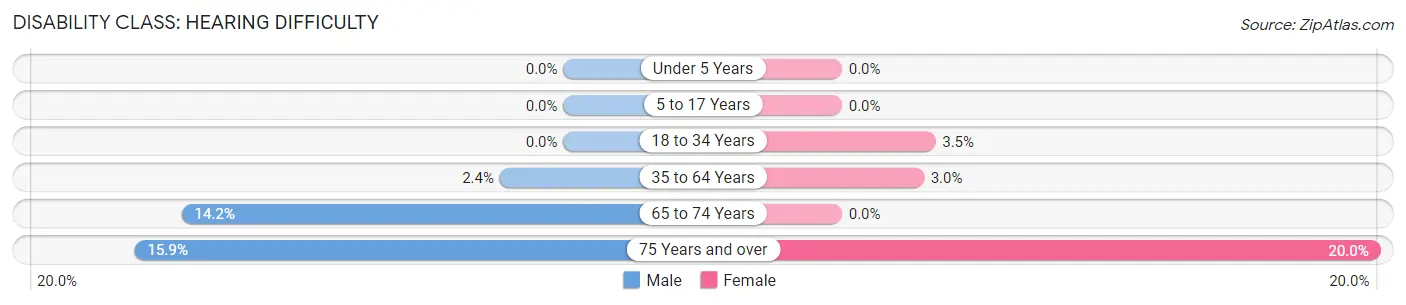
| Age Bracket | Male | Female |
| Under 5 Years | 0 (0.0%) | 0 (0.0%) |
| 5 to 17 Years | 0 (0.0%) | 0 (0.0%) |
| 18 to 34 Years | 0 (0.0%) | 27 (3.5%) |
| 35 to 64 Years | 29 (2.4%) | 28 (3.0%) |
| 65 to 74 Years | 18 (14.2%) | 0 (0.0%) |
| 75 Years and over | 32 (15.9%) | 75 (20.0%) |
Disability Class: Vision Difficulty
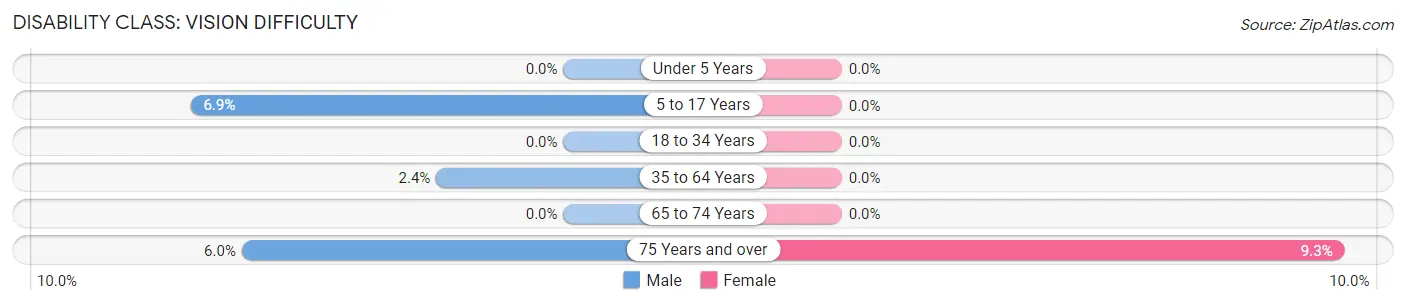
| Age Bracket | Male | Female |
| Under 5 Years | 0 (0.0%) | 0 (0.0%) |
| 5 to 17 Years | 51 (6.9%) | 0 (0.0%) |
| 18 to 34 Years | 0 (0.0%) | 0 (0.0%) |
| 35 to 64 Years | 29 (2.4%) | 0 (0.0%) |
| 65 to 74 Years | 0 (0.0%) | 0 (0.0%) |
| 75 Years and over | 12 (6.0%) | 35 (9.3%) |
Disability Class: Cognitive Difficulty
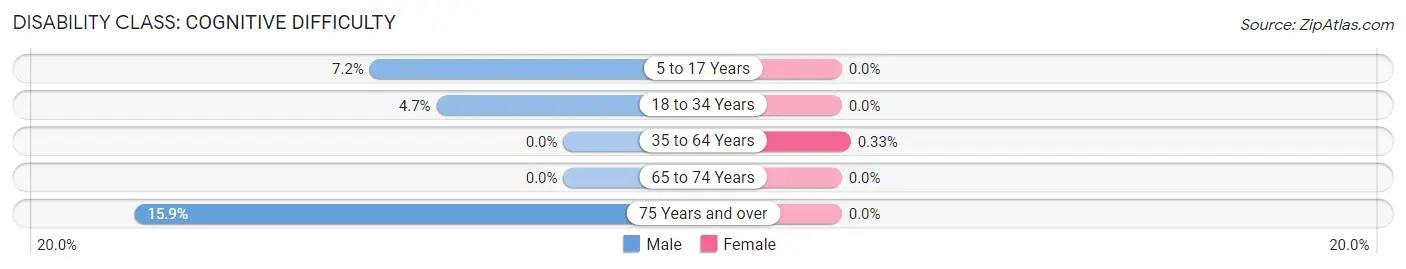
| Age Bracket | Male | Female |
| 5 to 17 Years | 53 (7.2%) | 0 (0.0%) |
| 18 to 34 Years | 28 (4.7%) | 0 (0.0%) |
| 35 to 64 Years | 0 (0.0%) | 3 (0.3%) |
| 65 to 74 Years | 0 (0.0%) | 0 (0.0%) |
| 75 Years and over | 32 (15.9%) | 0 (0.0%) |
Disability Class: Ambulatory Difficulty
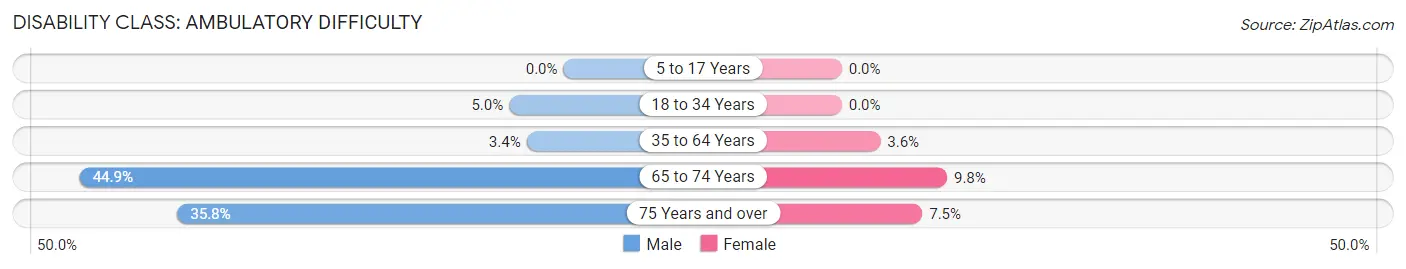
| Age Bracket | Male | Female |
| 5 to 17 Years | 0 (0.0%) | 0 (0.0%) |
| 18 to 34 Years | 30 (5.0%) | 0 (0.0%) |
| 35 to 64 Years | 42 (3.4%) | 33 (3.6%) |
| 65 to 74 Years | 57 (44.9%) | 17 (9.8%) |
| 75 Years and over | 72 (35.8%) | 28 (7.5%) |
Disability Class: Self-Care Difficulty
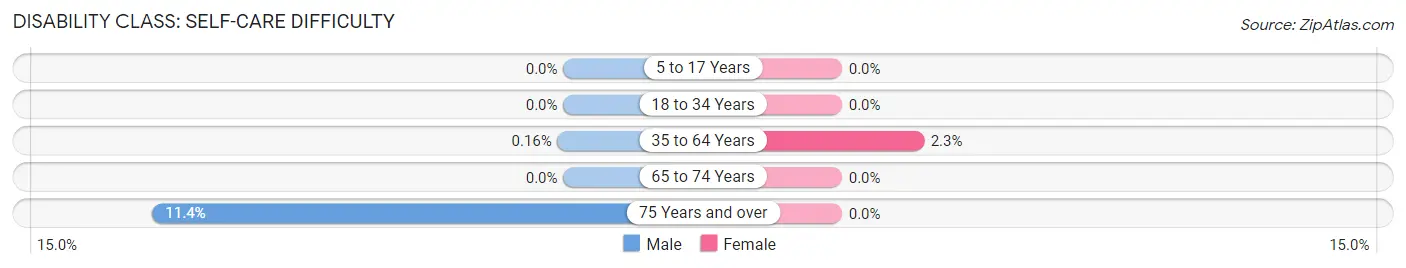
| Age Bracket | Male | Female |
| 5 to 17 Years | 0 (0.0%) | 0 (0.0%) |
| 18 to 34 Years | 0 (0.0%) | 0 (0.0%) |
| 35 to 64 Years | 2 (0.2%) | 21 (2.3%) |
| 65 to 74 Years | 0 (0.0%) | 0 (0.0%) |
| 75 Years and over | 23 (11.4%) | 0 (0.0%) |
Technology Access in Lindale
Computing Device Access in Lindale
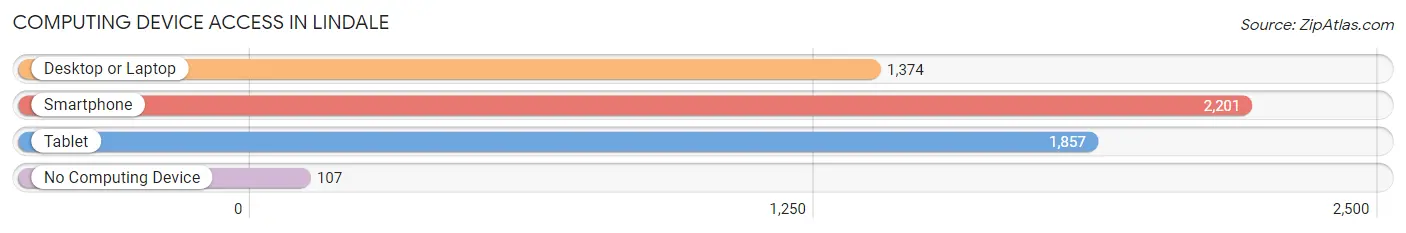
| Device Type | # Households | % Households |
| Desktop or Laptop | 1,374 | 58.5% |
| Smartphone | 2,201 | 93.7% |
| Tablet | 1,857 | 79.0% |
| No Computing Device | 107 | 4.5% |
| Total | 2,350 | 100.0% |
Internet Access in Lindale
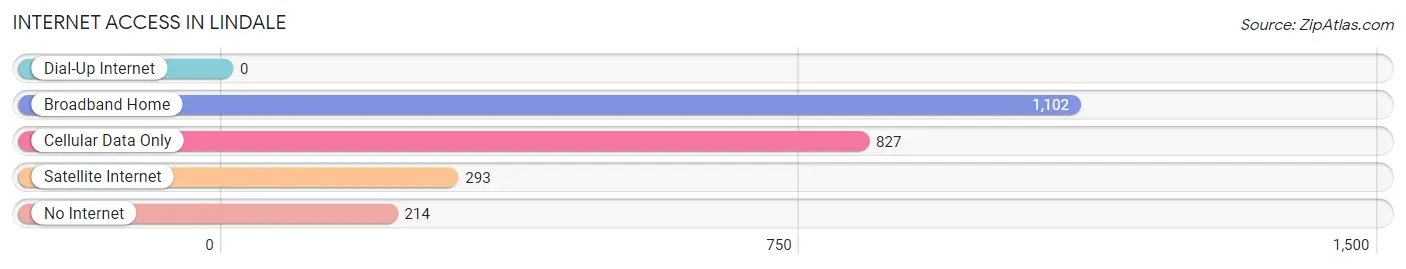
| Internet Type | # Households | % Households |
| Dial-Up Internet | 0 | 0.0% |
| Broadband Home | 1,102 | 46.9% |
| Cellular Data Only | 827 | 35.2% |
| Satellite Internet | 293 | 12.5% |
| No Internet | 214 | 9.1% |
| Total | 2,350 | 100.0% |
Lindale Summary
Lindale, Texas is a small city located in Smith County, Texas, United States. It is situated about 75 miles east of Dallas and is part of the Tyler-Longview metropolitan area. The city was founded in 1871 and was named after the Lindale post office, which was established in 1872. The population of Lindale was estimated to be 5,099 in 2019.
History
The area that is now Lindale was originally inhabited by the Caddo Indians. The first settlers in the area were the families of William and John Lindley, who arrived in 1871. The Lindleys purchased land from the Caddo Indians and established a small settlement. The settlement was named Lindale after the Lindley family.
In 1872, the Lindale post office was established and the town was officially recognized. The town grew slowly over the next few decades, and by the early 1900s, it had become a thriving agricultural community. The town was incorporated in 1925 and the population had grown to around 500 people.
In the 1950s, the town began to experience rapid growth due to the development of nearby Tyler and Longview. The population of Lindale increased to over 1,000 by 1960. The town continued to grow throughout the 1960s and 1970s, and by 1980, the population had reached 3,000.
Geography
Lindale is located in Smith County, Texas, United States. It is situated about 75 miles east of Dallas and is part of the Tyler-Longview metropolitan area. The city is located at the intersection of Interstate 20 and U.S. Highway 69. The city has a total area of 4.3 square miles, all of which is land.
The climate in Lindale is classified as humid subtropical, with hot summers and mild winters. The average annual temperature is around 68 degrees Fahrenheit. The average annual precipitation is around 40 inches.
Economy
The economy of Lindale is largely based on agriculture and manufacturing. The city is home to several large agricultural operations, including poultry farms, cattle ranches, and vegetable farms. The city is also home to several manufacturing companies, including a plastics plant and a furniture factory.
The city is also home to several retail stores, restaurants, and other businesses. The city is served by the Tyler-Longview metropolitan area, which provides access to a variety of services and amenities.
Demographics
As of the 2019 census, the population of Lindale was estimated to be 5,099. The racial makeup of the city was 79.3% White, 15.2% African American, 0.7% Native American, 0.7% Asian, 0.1% Pacific Islander, and 3.9% from other races. Hispanic or Latino of any race were 8.2% of the population.
The median household income in Lindale was $45,945 in 2019. The median home value was $150,000. The median age of the population was 37.5 years. The city had a poverty rate of 15.3%.
Conclusion
Lindale, Texas is a small city located in Smith County, Texas, United States. It is situated about 75 miles east of Dallas and is part of the Tyler-Longview metropolitan area. The city was founded in 1871 and was named after the Lindale post office, which was established in 1872. The population of Lindale was estimated to be 5,099 in 2019. The economy of Lindale is largely based on agriculture and manufacturing. The racial makeup of the city was 79.3% White, 15.2% African American, 0.7% Native American, 0.7% Asian, 0.1% Pacific Islander, and 3.9% from other races. The median household income in Lindale was $45,945 in 2019. Lindale is a small city with a rich history and a diverse population.
Common Questions
What is Per Capita Income in Lindale?
Per Capita income in Lindale is $34,240.
What is the Median Family Income in Lindale?
Median Family Income in Lindale is $85,750.
What is the Median Household income in Lindale?
Median Household Income in Lindale is $79,557.
What is Income or Wage Gap in Lindale?
Income or Wage Gap in Lindale is 45.4%.
Women in Lindale earn 54.6 cents for every dollar earned by a man.
What is Inequality or Gini Index in Lindale?
Inequality or Gini Index in Lindale is 0.37.
What is the Total Population of Lindale?
Total Population of Lindale is 6,174.
What is the Total Male Population of Lindale?
Total Male Population of Lindale is 3,236.
What is the Total Female Population of Lindale?
Total Female Population of Lindale is 2,938.
What is the Ratio of Males per 100 Females in Lindale?
There are 110.14 Males per 100 Females in Lindale.
What is the Ratio of Females per 100 Males in Lindale?
There are 90.79 Females per 100 Males in Lindale.
What is the Median Population Age in Lindale?
Median Population Age in Lindale is 37.2 Years.
What is the Average Family Size in Lindale
Average Family Size in Lindale is 2.9 People.
What is the Average Household Size in Lindale
Average Household Size in Lindale is 2.6 People.
How Large is the Labor Force in Lindale?
There are 2,837 People in the Labor Forcein in Lindale.
What is the Percentage of People in the Labor Force in Lindale?
60.0% of People are in the Labor Force in Lindale.
What is the Unemployment Rate in Lindale?
Unemployment Rate in Lindale is 3.8%.