Liberty Hill, TX Map & Demographics
Liberty Hill Map
Liberty Hill Overview
$24,682
PER CAPITA INCOME
$96,026
AVG FAMILY INCOME
$93,198
AVG HOUSEHOLD INCOME
26.4%
WAGE / INCOME GAP [ % ]
73.6¢/ $1
WAGE / INCOME GAP [ $ ]
$4,882
FAMILY INCOME DEFICIT
0.26
INEQUALITY / GINI INDEX
5,265
TOTAL POPULATION
2,240
MALE POPULATION
3,025
FEMALE POPULATION
74.05
MALES / 100 FEMALES
135.04
FEMALES / 100 MALES
27.4
MEDIAN AGE
3.7
AVG FAMILY SIZE
3.6
AVG HOUSEHOLD SIZE
2,738
LABOR FORCE [ PEOPLE ]
71.9%
PERCENT IN LABOR FORCE
10.5%
UNEMPLOYMENT RATE
Liberty Hill Zip Codes
Liberty Hill Area Codes
Income in Liberty Hill
Income Overview in Liberty Hill
Per Capita Income in Liberty Hill is $24,682, while median incomes of families and households are $96,026 and $93,198 respectively.
| Characteristic | Number | Measure |
| Per Capita Income | 5,265 | $24,682 |
| Median Family Income | 1,201 | $96,026 |
| Mean Family Income | 1,201 | $90,917 |
| Median Household Income | 1,447 | $93,198 |
| Mean Household Income | 1,447 | $88,875 |
| Income Deficit | 1,201 | $4,882 |
| Wage / Income Gap (%) | 5,265 | 26.38% |
| Wage / Income Gap ($) | 5,265 | 73.62¢ per $1 |
| Gini / Inequality Index | 5,265 | 0.26 |
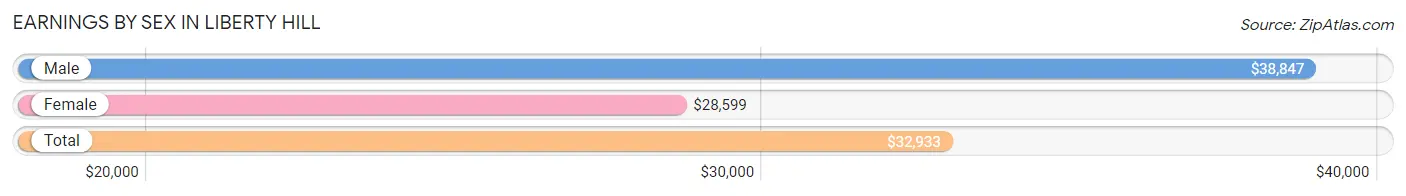
Earnings by Sex in Liberty Hill
Average Earnings in Liberty Hill are $32,933, $38,847 for men and $28,599 for women, a difference of 26.4%.
| Sex | Number | Average Earnings |
| Male | 1,340 (45.7%) | $38,847 |
| Female | 1,592 (54.3%) | $28,599 |
| Total | 2,932 (100.0%) | $32,933 |
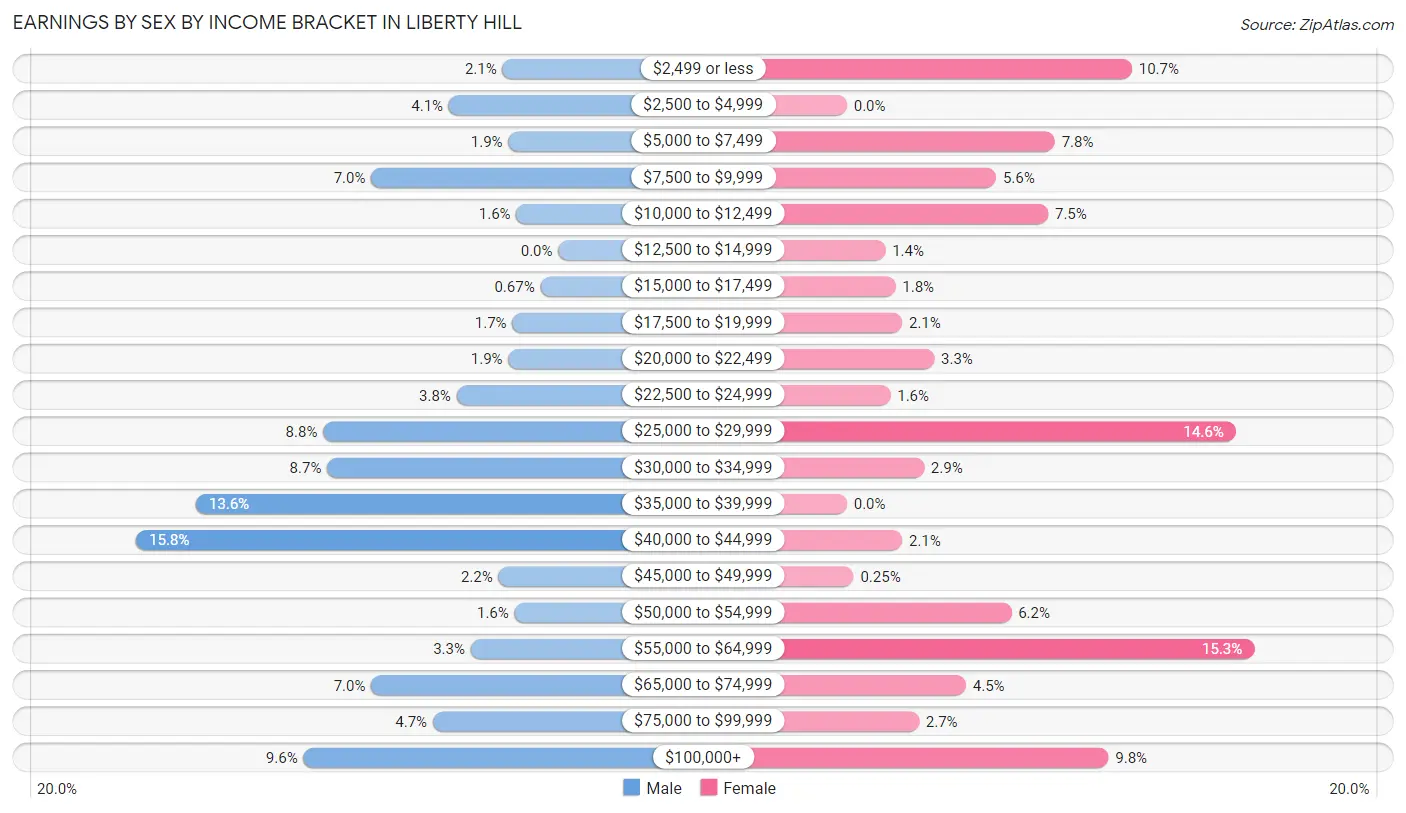
Earnings by Sex by Income Bracket in Liberty Hill
The most common earnings brackets in Liberty Hill are $40,000 to $44,999 for men (212 | 15.8%) and $55,000 to $64,999 for women (243 | 15.3%).
| Income | Male | Female |
| $2,499 or less | 28 (2.1%) | 170 (10.7%) |
| $2,500 to $4,999 | 55 (4.1%) | 0 (0.0%) |
| $5,000 to $7,499 | 25 (1.9%) | 124 (7.8%) |
| $7,500 to $9,999 | 94 (7.0%) | 89 (5.6%) |
| $10,000 to $12,499 | 21 (1.6%) | 120 (7.5%) |
| $12,500 to $14,999 | 0 (0.0%) | 23 (1.4%) |
| $15,000 to $17,499 | 9 (0.7%) | 29 (1.8%) |
| $17,500 to $19,999 | 23 (1.7%) | 33 (2.1%) |
| $20,000 to $22,499 | 25 (1.9%) | 52 (3.3%) |
| $22,500 to $24,999 | 51 (3.8%) | 26 (1.6%) |
| $25,000 to $29,999 | 118 (8.8%) | 232 (14.6%) |
| $30,000 to $34,999 | 116 (8.7%) | 46 (2.9%) |
| $35,000 to $39,999 | 182 (13.6%) | 0 (0.0%) |
| $40,000 to $44,999 | 212 (15.8%) | 33 (2.1%) |
| $45,000 to $49,999 | 30 (2.2%) | 4 (0.3%) |
| $50,000 to $54,999 | 22 (1.6%) | 98 (6.2%) |
| $55,000 to $64,999 | 44 (3.3%) | 243 (15.3%) |
| $65,000 to $74,999 | 94 (7.0%) | 71 (4.5%) |
| $75,000 to $99,999 | 63 (4.7%) | 43 (2.7%) |
| $100,000+ | 128 (9.6%) | 156 (9.8%) |
| Total | 1,340 (100.0%) | 1,592 (100.0%) |
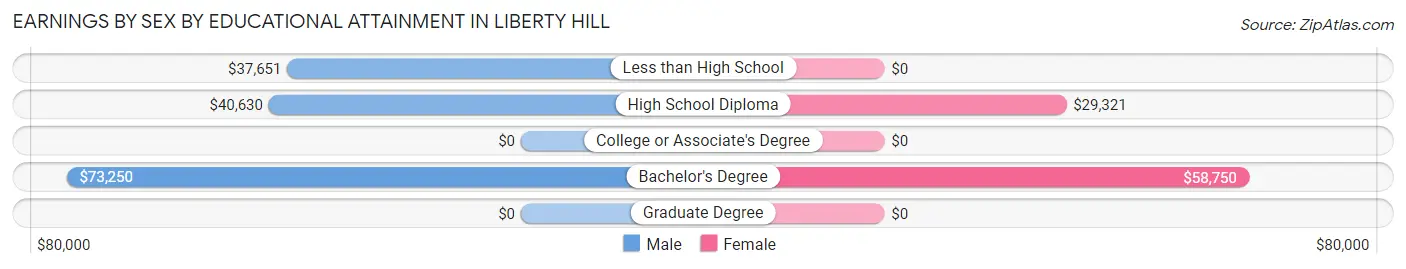
Earnings by Sex by Educational Attainment in Liberty Hill
Average earnings in Liberty Hill are $39,513 for men and $53,821 for women, a difference of 26.6%. Men with an educational attainment of bachelor's degree enjoy the highest average annual earnings of $73,250, while those with less than high school education earn the least with $37,651. Women with an educational attainment of bachelor's degree earn the most with the average annual earnings of $58,750, while those with high school diploma education have the smallest earnings of $29,321.
| Educational Attainment | Male Income | Female Income |
| Less than High School | $37,651 | $0 |
| High School Diploma | $40,630 | $29,321 |
| College or Associate's Degree | - | - |
| Bachelor's Degree | $73,250 | $58,750 |
| Graduate Degree | - | - |
| Total | $39,513 | $53,821 |
Family Income in Liberty Hill
Family Income Brackets in Liberty Hill
According to the Liberty Hill family income data, there are 399 families falling into the $100,000 to $149,999 income range, which is the most common income bracket and makes up 33.2% of all families.
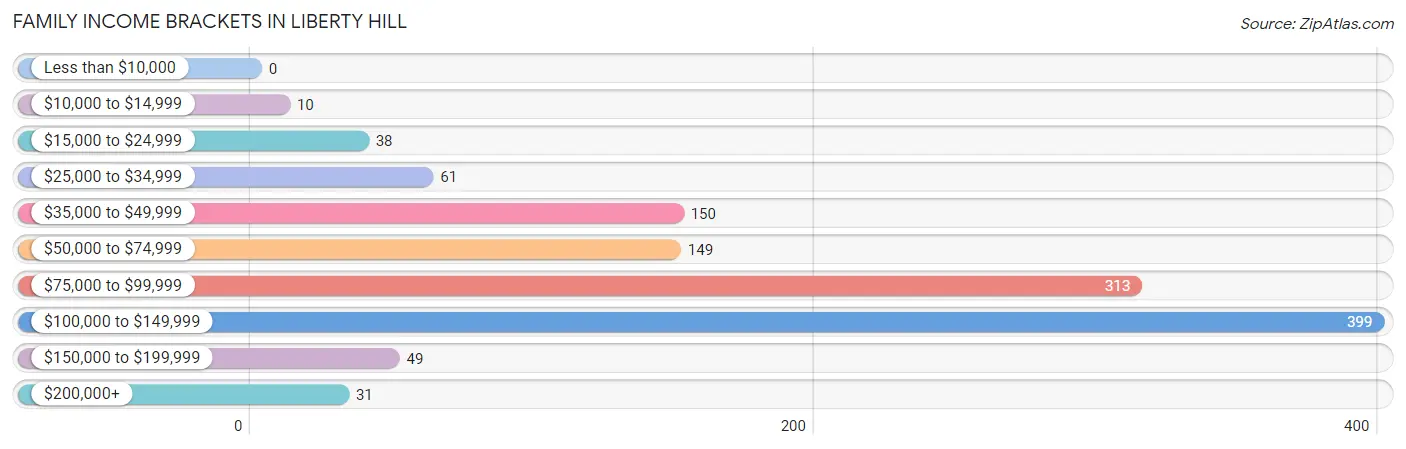
| Income Bracket | # Families | % Families |
| Less than $10,000 | 0 | 0.0% |
| $10,000 to $14,999 | 10 | 0.8% |
| $15,000 to $24,999 | 38 | 3.2% |
| $25,000 to $34,999 | 61 | 5.1% |
| $35,000 to $49,999 | 150 | 12.5% |
| $50,000 to $74,999 | 149 | 12.4% |
| $75,000 to $99,999 | 313 | 26.1% |
| $100,000 to $149,999 | 399 | 33.2% |
| $150,000 to $199,999 | 49 | 4.1% |
| $200,000+ | 31 | 2.6% |
Family Income by Famaliy Size in Liberty Hill
2-person families (418 | 34.8%) account for the highest median family income in Liberty Hill with $98,347 per family, while 2-person families (418 | 34.8%) have the highest median income of $49,174 per family member.
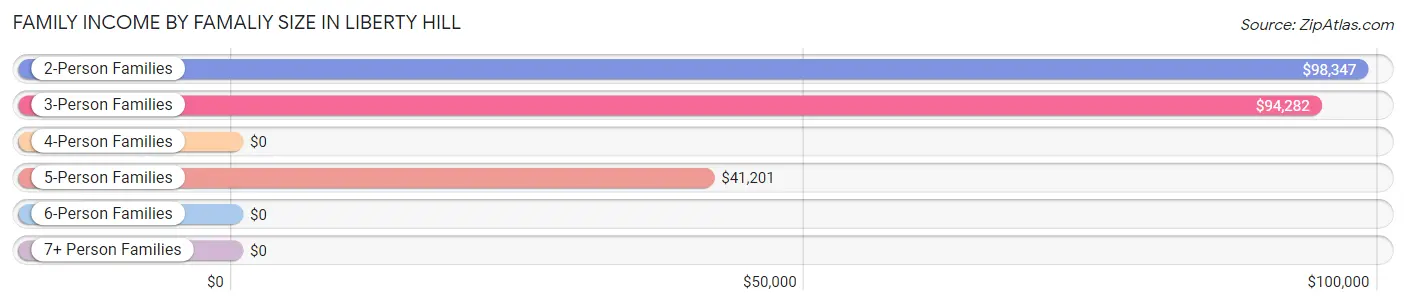
| Income Bracket | # Families | Median Income |
| 2-Person Families | 418 (34.8%) | $98,347 |
| 3-Person Families | 287 (23.9%) | $94,282 |
| 4-Person Families | 141 (11.7%) | $0 |
| 5-Person Families | 129 (10.7%) | $41,201 |
| 6-Person Families | 88 (7.3%) | $0 |
| 7+ Person Families | 138 (11.5%) | $0 |
| Total | 1,201 (100.0%) | $96,026 |
Family Income by Number of Earners in Liberty Hill
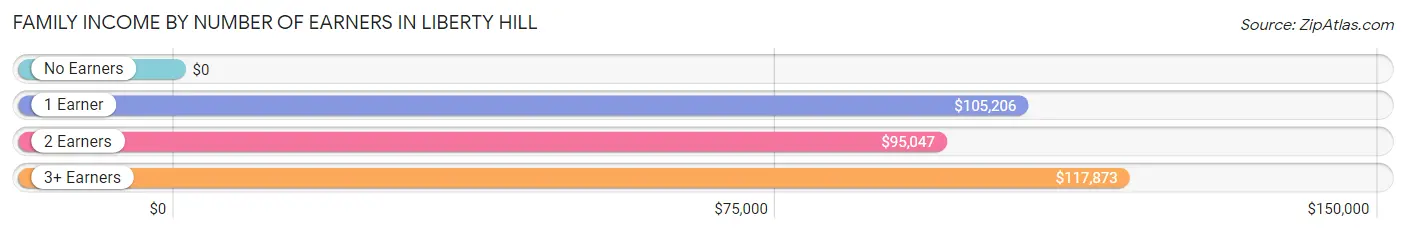
| Number of Earners | # Families | Median Income |
| No Earners | 20 (1.7%) | $0 |
| 1 Earner | 337 (28.1%) | $105,206 |
| 2 Earners | 575 (47.9%) | $95,047 |
| 3+ Earners | 269 (22.4%) | $117,873 |
| Total | 1,201 (100.0%) | $96,026 |
Household Income in Liberty Hill
Household Income Brackets in Liberty Hill
With 441 households falling in the category, the $100,000 to $149,999 income range is the most frequent in Liberty Hill, accounting for 30.5% of all households.
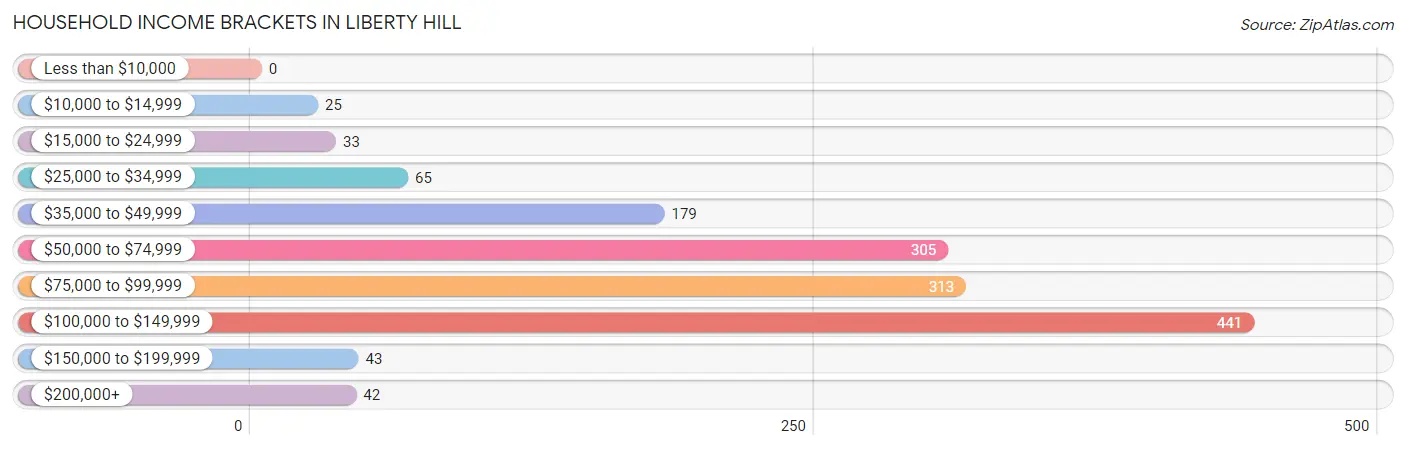
| Income Bracket | # Households | % Households |
| Less than $10,000 | 0 | 0.0% |
| $10,000 to $14,999 | 25 | 1.7% |
| $15,000 to $24,999 | 33 | 2.3% |
| $25,000 to $34,999 | 65 | 4.5% |
| $35,000 to $49,999 | 179 | 12.4% |
| $50,000 to $74,999 | 305 | 21.1% |
| $75,000 to $99,999 | 313 | 21.6% |
| $100,000 to $149,999 | 441 | 30.5% |
| $150,000 to $199,999 | 43 | 3.0% |
| $200,000+ | 42 | 2.9% |
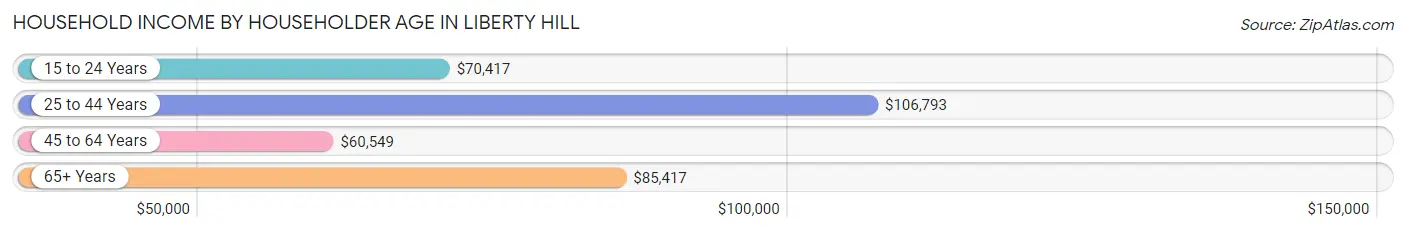
Household Income by Householder Age in Liberty Hill
The median household income in Liberty Hill is $93,198, with the highest median household income of $106,793 found in the 25 to 44 years age bracket for the primary householder. A total of 699 households (48.3%) fall into this category. Meanwhile, the 45 to 64 years age bracket for the primary householder has the lowest median household income of $60,549, with 580 households (40.1%) in this group.
| Income Bracket | # Households | Median Income |
| 15 to 24 Years | 57 (3.9%) | $70,417 |
| 25 to 44 Years | 699 (48.3%) | $106,793 |
| 45 to 64 Years | 580 (40.1%) | $60,549 |
| 65+ Years | 111 (7.7%) | $85,417 |
| Total | 1,447 (100.0%) | $93,198 |
Poverty in Liberty Hill
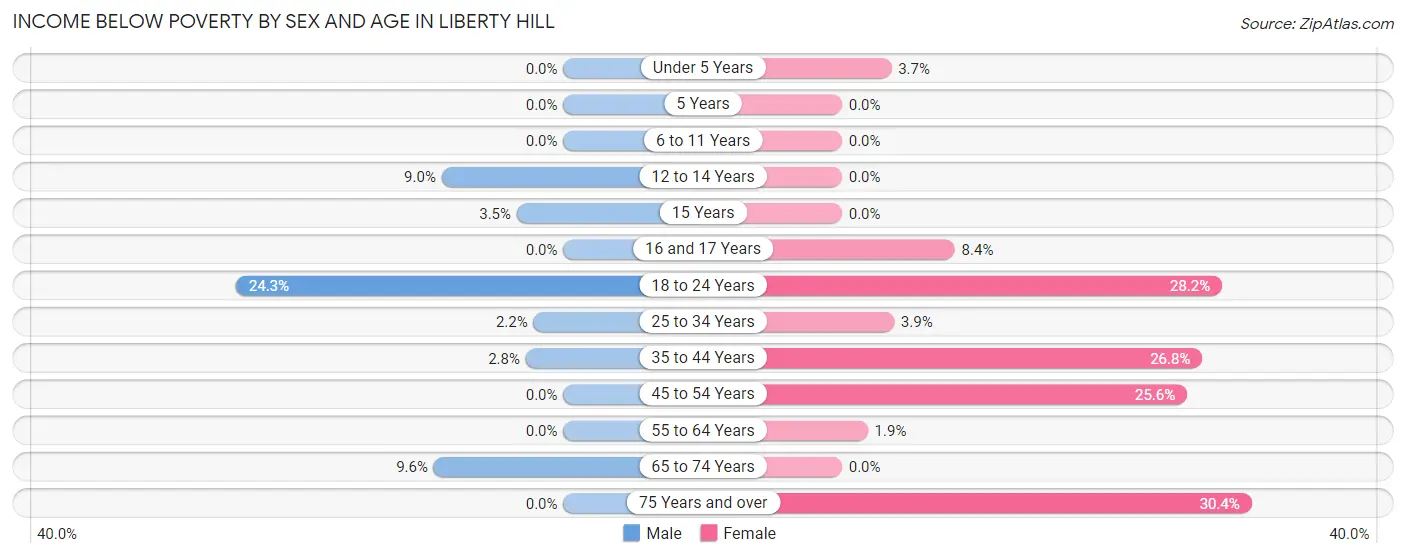
Income Below Poverty by Sex and Age in Liberty Hill
With 4.0% poverty level for males and 13.2% for females among the residents of Liberty Hill, 18 to 24 year old males and 75 year old and over females are the most vulnerable to poverty, with 44 males (24.3%) and 14 females (30.4%) in their respective age groups living below the poverty level.
| Age Bracket | Male | Female |
| Under 5 Years | 0 (0.0%) | 18 (3.7%) |
| 5 Years | 0 (0.0%) | 0 (0.0%) |
| 6 to 11 Years | 0 (0.0%) | 0 (0.0%) |
| 12 to 14 Years | 13 (9.0%) | 0 (0.0%) |
| 15 Years | 3 (3.5%) | 0 (0.0%) |
| 16 and 17 Years | 0 (0.0%) | 14 (8.4%) |
| 18 to 24 Years | 44 (24.3%) | 107 (28.2%) |
| 25 to 34 Years | 12 (2.2%) | 13 (3.9%) |
| 35 to 44 Years | 9 (2.8%) | 129 (26.8%) |
| 45 to 54 Years | 0 (0.0%) | 91 (25.6%) |
| 55 to 64 Years | 0 (0.0%) | 7 (1.9%) |
| 65 to 74 Years | 5 (9.6%) | 0 (0.0%) |
| 75 Years and over | 0 (0.0%) | 14 (30.4%) |
| Total | 86 (4.0%) | 393 (13.2%) |
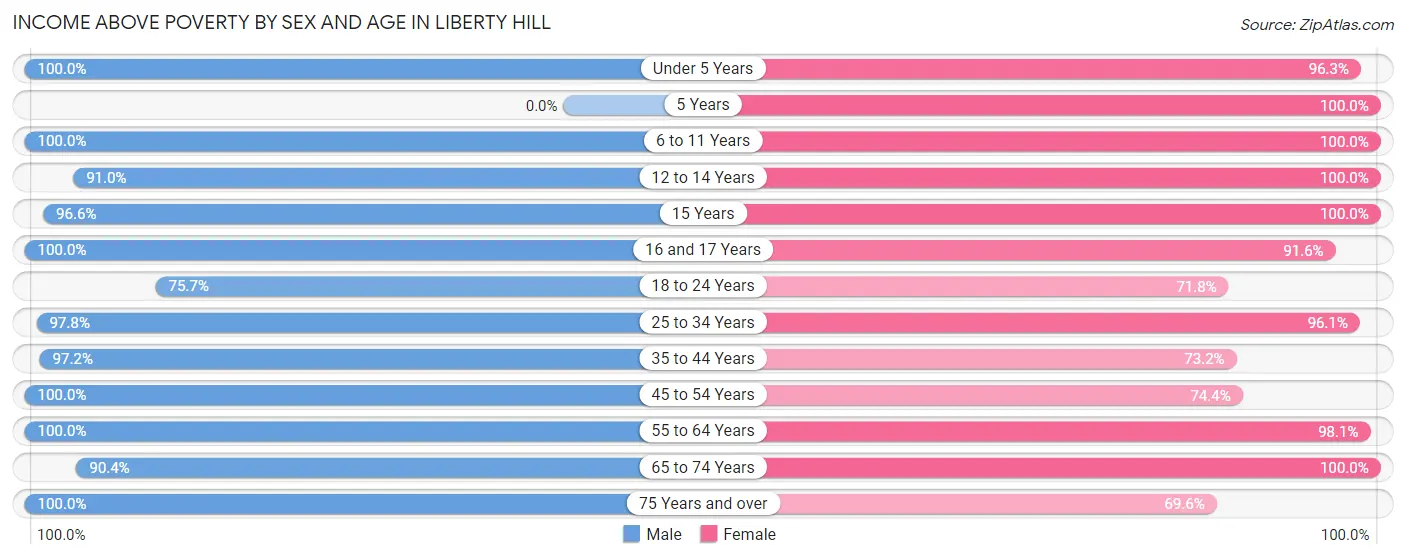
Income Above Poverty by Sex and Age in Liberty Hill
According to the poverty statistics in Liberty Hill, males aged under 5 years and females aged 5 years are the age groups that are most secure financially, with 100.0% of males and 100.0% of females in these age groups living above the poverty line.
| Age Bracket | Male | Female |
| Under 5 Years | 117 (100.0%) | 473 (96.3%) |
| 5 Years | 0 (0.0%) | 10 (100.0%) |
| 6 to 11 Years | 194 (100.0%) | 129 (100.0%) |
| 12 to 14 Years | 131 (91.0%) | 166 (100.0%) |
| 15 Years | 84 (96.6%) | 9 (100.0%) |
| 16 and 17 Years | 142 (100.0%) | 153 (91.6%) |
| 18 to 24 Years | 137 (75.7%) | 272 (71.8%) |
| 25 to 34 Years | 532 (97.8%) | 323 (96.1%) |
| 35 to 44 Years | 314 (97.2%) | 353 (73.2%) |
| 45 to 54 Years | 233 (100.0%) | 264 (74.4%) |
| 55 to 64 Years | 112 (100.0%) | 358 (98.1%) |
| 65 to 74 Years | 47 (90.4%) | 52 (100.0%) |
| 75 Years and over | 15 (100.0%) | 32 (69.6%) |
| Total | 2,058 (96.0%) | 2,594 (86.8%) |
Income Below Poverty Among Married-Couple Families in Liberty Hill
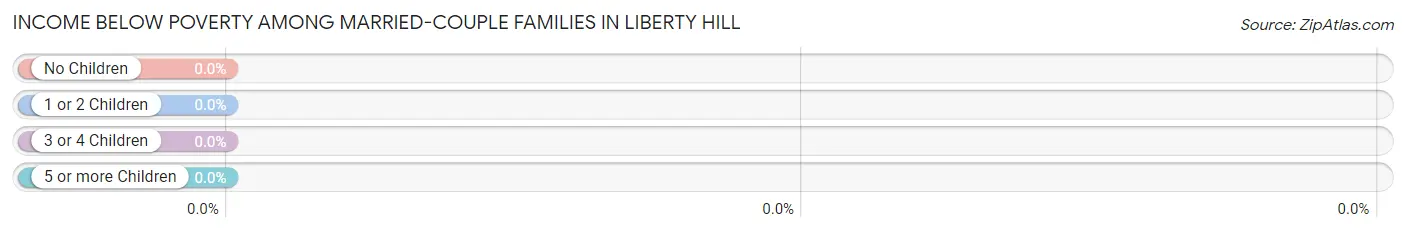
| Children | Above Poverty | Below Poverty |
| No Children | 268 (100.0%) | 0 (0.0%) |
| 1 or 2 Children | 225 (100.0%) | 0 (0.0%) |
| 3 or 4 Children | 219 (100.0%) | 0 (0.0%) |
| 5 or more Children | 0 (0.0%) | 0 (0.0%) |
| Total | 712 (100.0%) | 0 (0.0%) |
Income Below Poverty Among Single-Parent Households in Liberty Hill
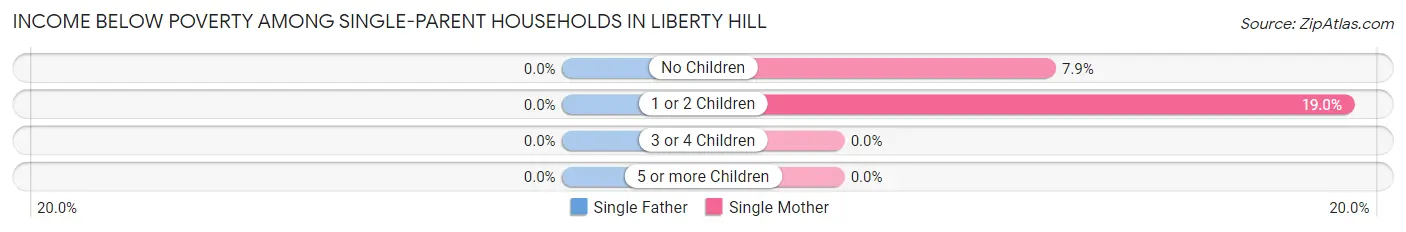
| Children | Single Father | Single Mother |
| No Children | 0 (0.0%) | 7 (7.9%) |
| 1 or 2 Children | 0 (0.0%) | 38 (19.0%) |
| 3 or 4 Children | 0 (0.0%) | 0 (0.0%) |
| 5 or more Children | 0 (0.0%) | 0 (0.0%) |
| Total | 0 (0.0%) | 45 (15.6%) |
Income Below Poverty Among Married-Couple vs Single-Parent Households in Liberty Hill
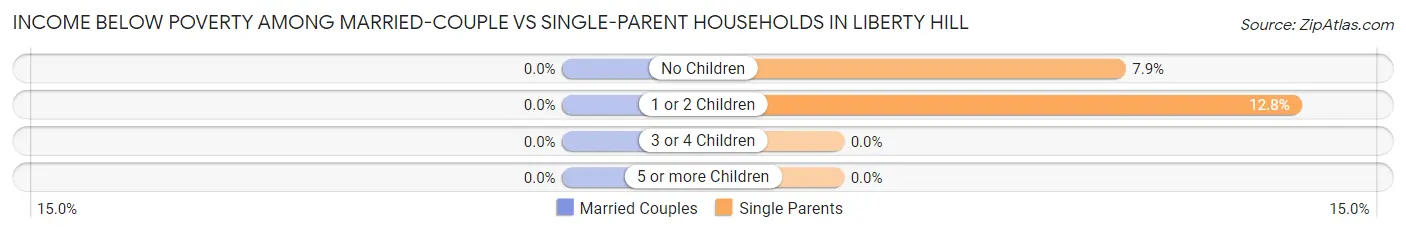
| Children | Married-Couple Families | Single-Parent Households |
| No Children | 0 (0.0%) | 7 (7.9%) |
| 1 or 2 Children | 0 (0.0%) | 38 (12.8%) |
| 3 or 4 Children | 0 (0.0%) | 0 (0.0%) |
| 5 or more Children | 0 (0.0%) | 0 (0.0%) |
| Total | 0 (0.0%) | 45 (9.2%) |
Race in Liberty Hill
The most populous races in Liberty Hill are White / Caucasian (4,024 | 76.4%), Hispanic or Latino (2,635 | 50.0%), and Two or more Races (904 | 17.2%).
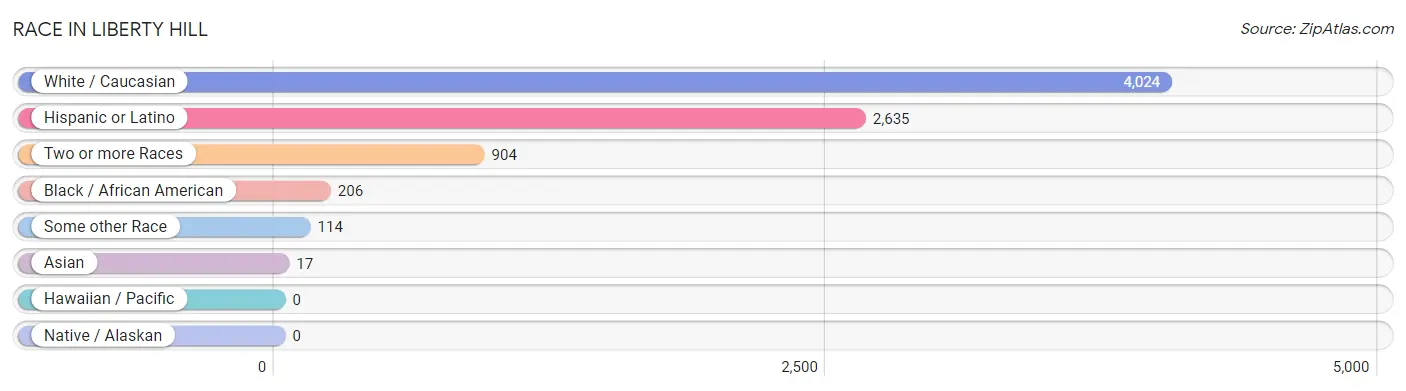
| Race | # Population | % Population |
| Asian | 17 | 0.3% |
| Black / African American | 206 | 3.9% |
| Hawaiian / Pacific | 0 | 0.0% |
| Hispanic or Latino | 2,635 | 50.0% |
| Native / Alaskan | 0 | 0.0% |
| White / Caucasian | 4,024 | 76.4% |
| Two or more Races | 904 | 17.2% |
| Some other Race | 114 | 2.2% |
| Total | 5,265 | 100.0% |
Ancestry in Liberty Hill
The most populous ancestries reported in Liberty Hill are Mexican (2,455 | 46.6%), American (768 | 14.6%), English (378 | 7.2%), German (277 | 5.3%), and Irish (225 | 4.3%), together accounting for 77.9% of all Liberty Hill residents.
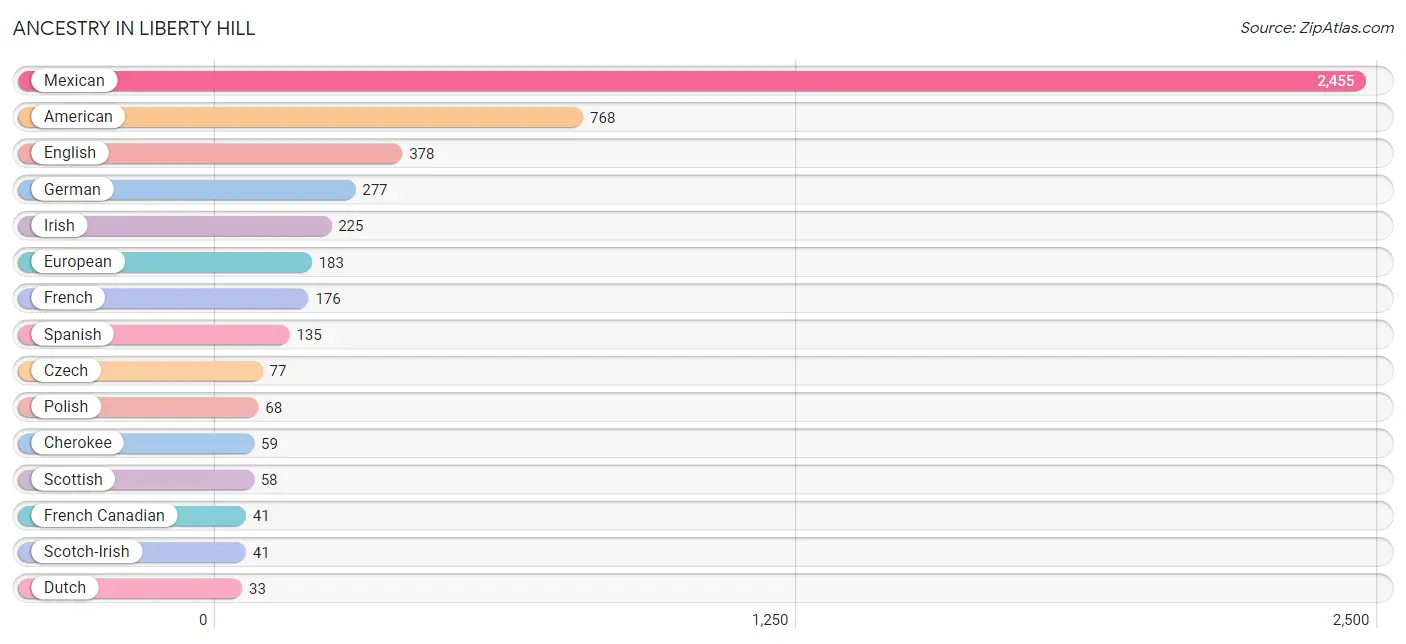
| Ancestry | # Population | % Population |
| American | 768 | 14.6% |
| Arab | 13 | 0.3% |
| British | 9 | 0.2% |
| Cajun | 11 | 0.2% |
| Cherokee | 59 | 1.1% |
| Czech | 77 | 1.5% |
| Czechoslovakian | 20 | 0.4% |
| Dominican | 13 | 0.3% |
| Dutch | 33 | 0.6% |
| English | 378 | 7.2% |
| European | 183 | 3.5% |
| French | 176 | 3.3% |
| French Canadian | 41 | 0.8% |
| German | 277 | 5.3% |
| Hungarian | 18 | 0.3% |
| Irish | 225 | 4.3% |
| Italian | 30 | 0.6% |
| Korean | 14 | 0.3% |
| Lebanese | 13 | 0.3% |
| Mexican | 2,455 | 46.6% |
| Native Hawaiian | 9 | 0.2% |
| Norwegian | 12 | 0.2% |
| Pakistani | 22 | 0.4% |
| Pennsylvania German | 10 | 0.2% |
| Polish | 68 | 1.3% |
| Portuguese | 31 | 0.6% |
| Puerto Rican | 32 | 0.6% |
| Romanian | 15 | 0.3% |
| Scotch-Irish | 41 | 0.8% |
| Scottish | 58 | 1.1% |
| Spanish | 135 | 2.6% |
| Sri Lankan | 3 | 0.1% |
| Swedish | 27 | 0.5% | View All 33 Rows |
Immigrants in Liberty Hill
The most numerous immigrant groups reported in Liberty Hill came from Latin America (550 | 10.4%), Central America (537 | 10.2%), Mexico (537 | 10.2%), Caribbean (13 | 0.3%), and Dominican Republic (13 | 0.3%), together accounting for 31.4% of all Liberty Hill residents.
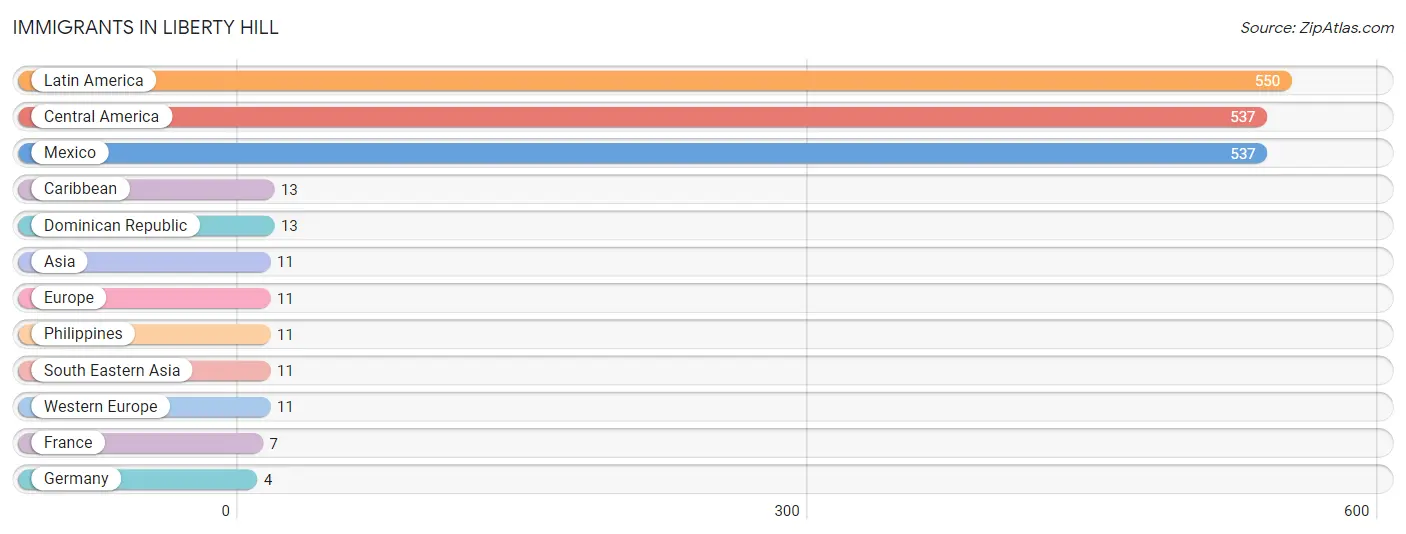
| Immigration Origin | # Population | % Population |
| Asia | 11 | 0.2% |
| Caribbean | 13 | 0.3% |
| Central America | 537 | 10.2% |
| Dominican Republic | 13 | 0.3% |
| Europe | 11 | 0.2% |
| France | 7 | 0.1% |
| Germany | 4 | 0.1% |
| Latin America | 550 | 10.4% |
| Mexico | 537 | 10.2% |
| Philippines | 11 | 0.2% |
| South Eastern Asia | 11 | 0.2% |
| Western Europe | 11 | 0.2% | View All 12 Rows |
Sex and Age in Liberty Hill
Sex and Age in Liberty Hill
The most populous age groups in Liberty Hill are 15 to 19 Years (321 | 14.3%) for men and Under 5 Years (491 | 16.2%) for women.
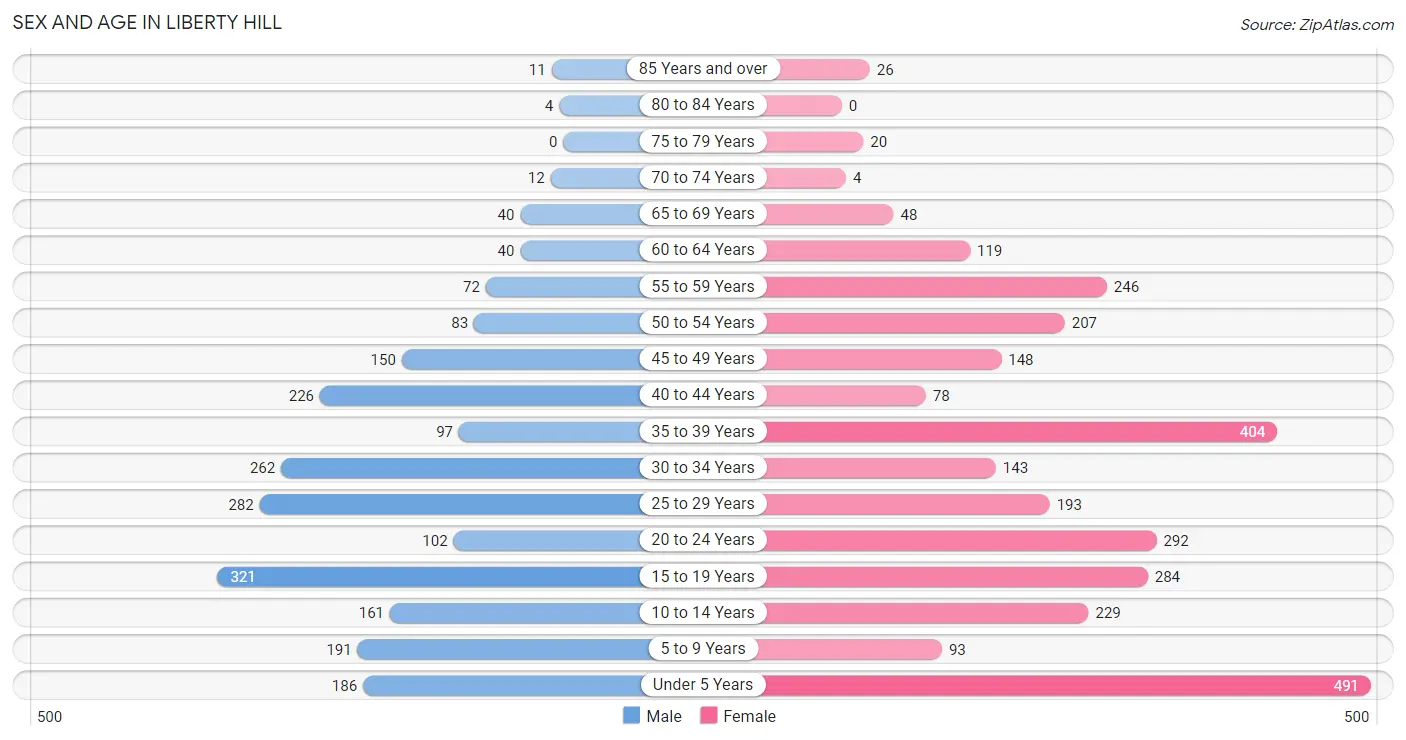
| Age Bracket | Male | Female |
| Under 5 Years | 186 (8.3%) | 491 (16.2%) |
| 5 to 9 Years | 191 (8.5%) | 93 (3.1%) |
| 10 to 14 Years | 161 (7.2%) | 229 (7.6%) |
| 15 to 19 Years | 321 (14.3%) | 284 (9.4%) |
| 20 to 24 Years | 102 (4.5%) | 292 (9.7%) |
| 25 to 29 Years | 282 (12.6%) | 193 (6.4%) |
| 30 to 34 Years | 262 (11.7%) | 143 (4.7%) |
| 35 to 39 Years | 97 (4.3%) | 404 (13.4%) |
| 40 to 44 Years | 226 (10.1%) | 78 (2.6%) |
| 45 to 49 Years | 150 (6.7%) | 148 (4.9%) |
| 50 to 54 Years | 83 (3.7%) | 207 (6.8%) |
| 55 to 59 Years | 72 (3.2%) | 246 (8.1%) |
| 60 to 64 Years | 40 (1.8%) | 119 (3.9%) |
| 65 to 69 Years | 40 (1.8%) | 48 (1.6%) |
| 70 to 74 Years | 12 (0.5%) | 4 (0.1%) |
| 75 to 79 Years | 0 (0.0%) | 20 (0.7%) |
| 80 to 84 Years | 4 (0.2%) | 0 (0.0%) |
| 85 Years and over | 11 (0.5%) | 26 (0.9%) |
| Total | 2,240 (100.0%) | 3,025 (100.0%) |
Families and Households in Liberty Hill
Median Family Size in Liberty Hill
The median family size in Liberty Hill is 3.67 persons per family, with married-couple families (712 | 59.3%) accounting for the largest median family size of 3.85 persons per family. On the other hand, single female/mother families (289 | 24.1%) represent the smallest median family size with 3.37 persons per family.
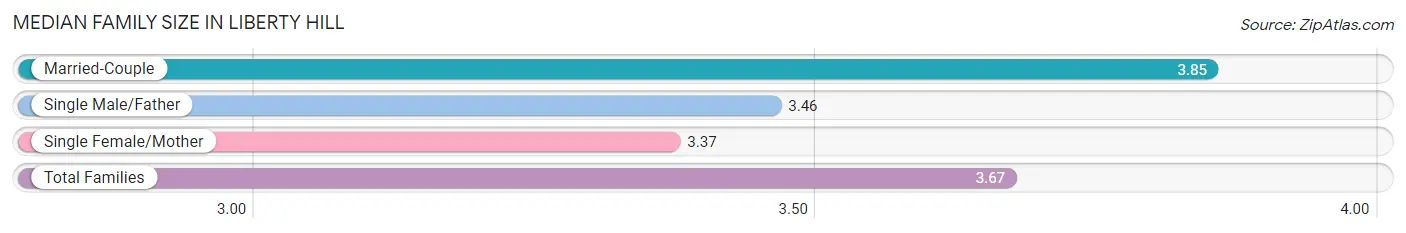
| Family Type | # Families | Family Size |
| Married-Couple | 712 (59.3%) | 3.85 |
| Single Male/Father | 200 (16.7%) | 3.46 |
| Single Female/Mother | 289 (24.1%) | 3.37 |
| Total Families | 1,201 (100.0%) | 3.67 |
Median Household Size in Liberty Hill
The median household size in Liberty Hill is 3.59 persons per household, with single male/father households (200 | 13.8%) accounting for the largest median household size of 4.26 persons per household. non-family households (246 | 17.0%) represent the smallest median household size with 1.41 persons per household.
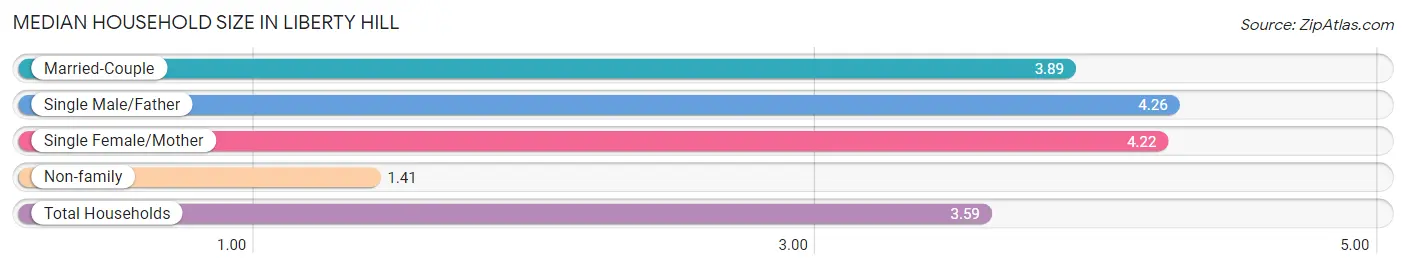
| Household Type | # Households | Household Size |
| Married-Couple | 712 (49.2%) | 3.89 |
| Single Male/Father | 200 (13.8%) | 4.26 |
| Single Female/Mother | 289 (20.0%) | 4.22 |
| Non-family | 246 (17.0%) | 1.41 |
| Total Households | 1,447 (100.0%) | 3.59 |
Household Size by Marriage Status in Liberty Hill
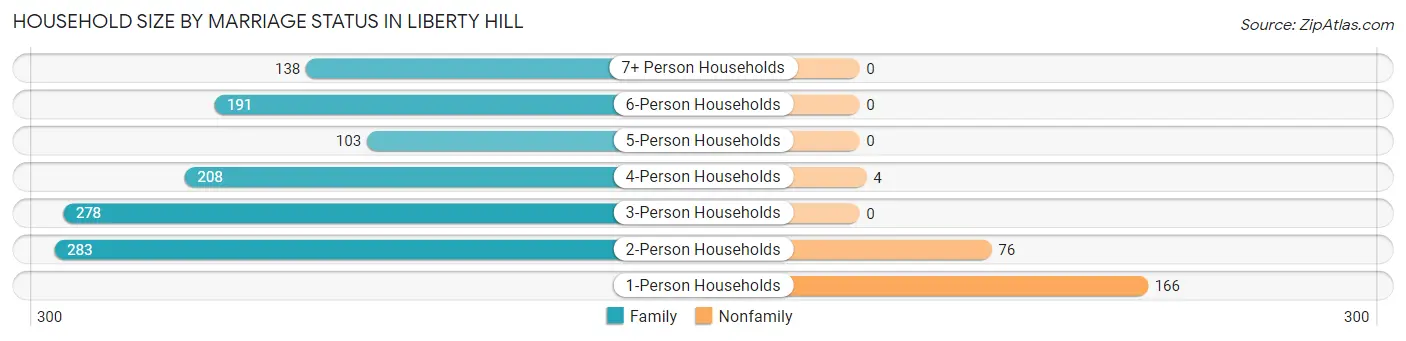
Out of a total of 1,447 households in Liberty Hill, 1,201 (83.0%) are family households, while 246 (17.0%) are nonfamily households. The most numerous type of family households are 2-person households, comprising 283, and the most common type of nonfamily households are 1-person households, comprising 166.
| Household Size | Family Households | Nonfamily Households |
| 1-Person Households | - | 166 (11.5%) |
| 2-Person Households | 283 (19.6%) | 76 (5.2%) |
| 3-Person Households | 278 (19.2%) | 0 (0.0%) |
| 4-Person Households | 208 (14.4%) | 4 (0.3%) |
| 5-Person Households | 103 (7.1%) | 0 (0.0%) |
| 6-Person Households | 191 (13.2%) | 0 (0.0%) |
| 7+ Person Households | 138 (9.5%) | 0 (0.0%) |
| Total | 1,201 (83.0%) | 246 (17.0%) |
Female Fertility in Liberty Hill
Fertility by Age in Liberty Hill
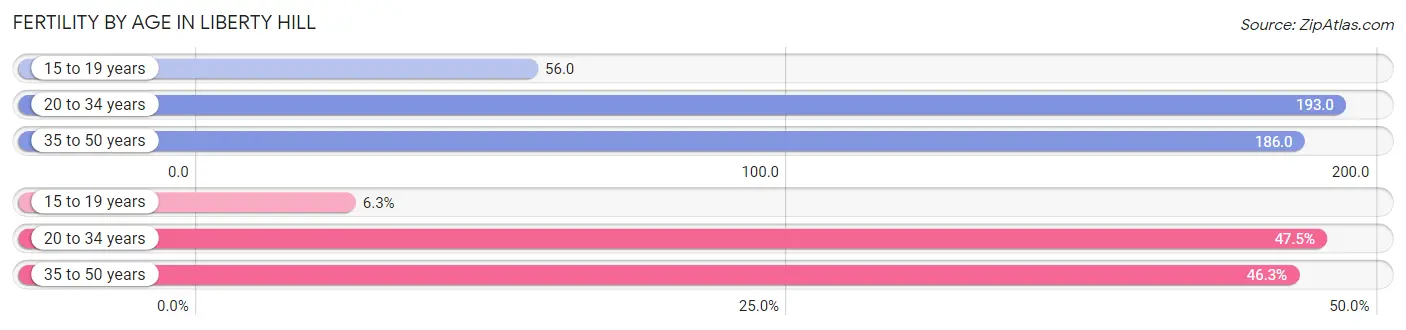
Average fertility rate in Liberty Hill is 165.0 births per 1,000 women. Women in the age bracket of 20 to 34 years have the highest fertility rate with 193.0 births per 1,000 women. Women in the age bracket of 20 to 34 years acount for 47.4% of all women with births.
| Age Bracket | Women with Births | Births / 1,000 Women |
| 15 to 19 years | 16 (6.3%) | 56.0 |
| 20 to 34 years | 121 (47.4%) | 193.0 |
| 35 to 50 years | 118 (46.3%) | 186.0 |
| Total | 255 (100.0%) | 165.0 |
Fertility by Age by Marriage Status in Liberty Hill
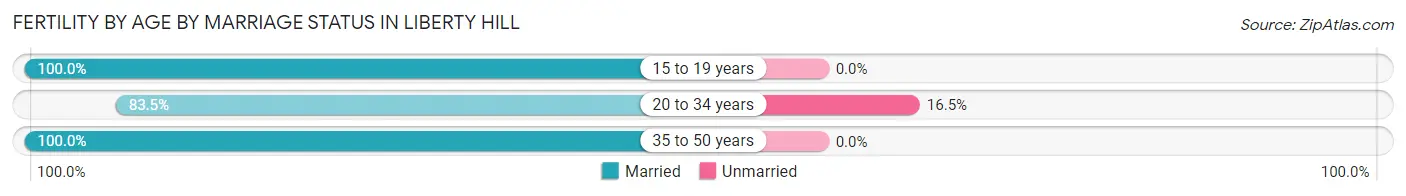
92.2% of women with births (255) in Liberty Hill are married. The highest percentage of unmarried women with births falls into 20 to 34 years age bracket with 16.5% of them unmarried at the time of birth, while the lowest percentage of unmarried women with births belong to 15 to 19 years age bracket with 0.0% of them unmarried.
| Age Bracket | Married | Unmarried |
| 15 to 19 years | 16 (100.0%) | 0 (0.0%) |
| 20 to 34 years | 101 (83.5%) | 20 (16.5%) |
| 35 to 50 years | 118 (100.0%) | 0 (0.0%) |
| Total | 235 (92.2%) | 20 (7.8%) |
Fertility by Education in Liberty Hill
| Educational Attainment | Women with Births | Births / 1,000 Women |
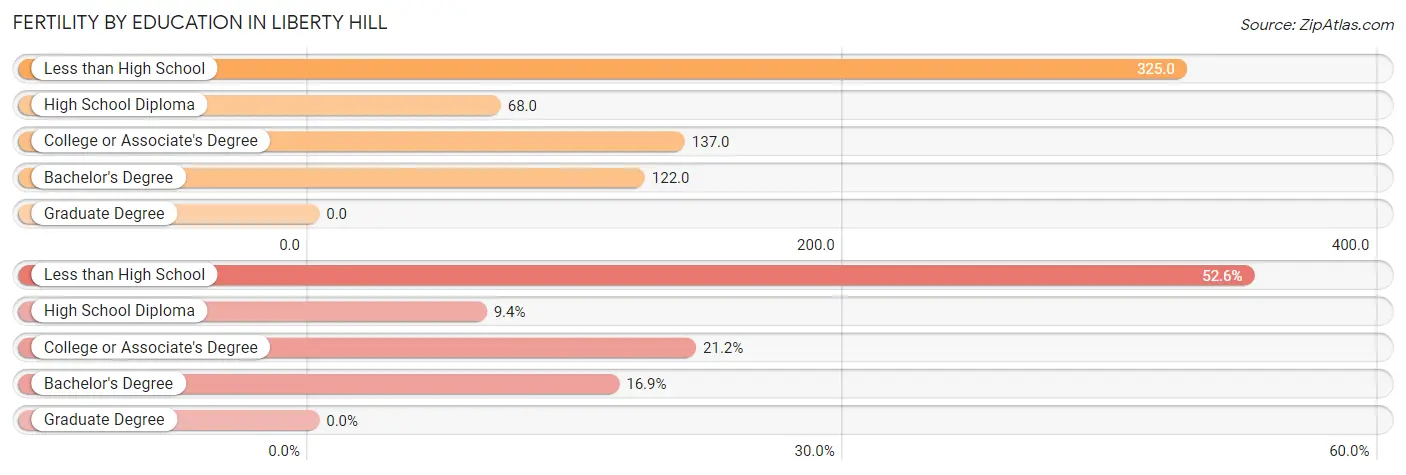
| Less than High School | 134 (52.5%) | 325.0 |
| High School Diploma | 24 (9.4%) | 68.0 |
| College or Associate's Degree | 54 (21.2%) | 137.0 |
| Bachelor's Degree | 43 (16.9%) | 122.0 |
| Graduate Degree | 0 (0.0%) | 0.0 |
| Total | 255 (100.0%) | 165.0 |
Fertility by Education by Marriage Status in Liberty Hill
7.8% of women with births in Liberty Hill are unmarried. Women with the educational attainment of less than high school are most likely to be married with 100.0% of them married at childbirth, while women with the educational attainment of high school diploma are least likely to be married with 83.3% of them unmarried at childbirth.
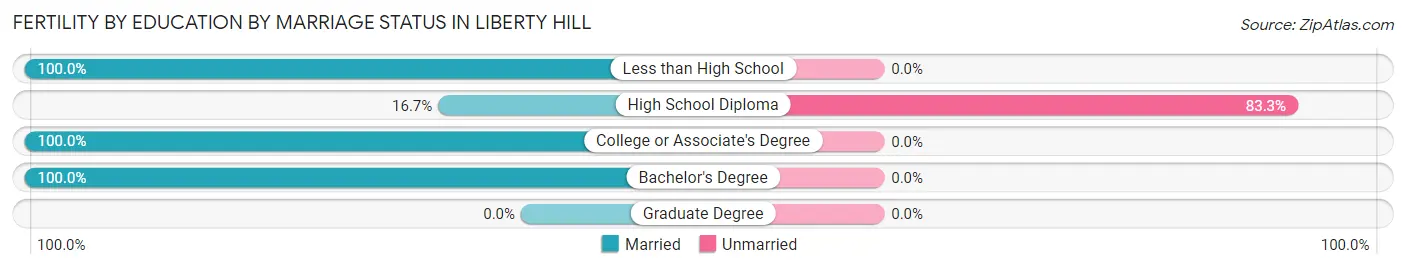
| Educational Attainment | Married | Unmarried |
| Less than High School | 134 (100.0%) | 0 (0.0%) |
| High School Diploma | 4 (16.7%) | 20 (83.3%) |
| College or Associate's Degree | 54 (100.0%) | 0 (0.0%) |
| Bachelor's Degree | 43 (100.0%) | 0 (0.0%) |
| Graduate Degree | 0 (0.0%) | 0 (0.0%) |
| Total | 235 (92.2%) | 20 (7.8%) |
Employment Characteristics in Liberty Hill
Employment by Class of Employer in Liberty Hill
Among the 2,439 employed individuals in Liberty Hill, private company employees (1,910 | 78.3%), not-for-profit organizations (146 | 6.0%), and local government employees (140 | 5.7%) make up the most common classes of employment.
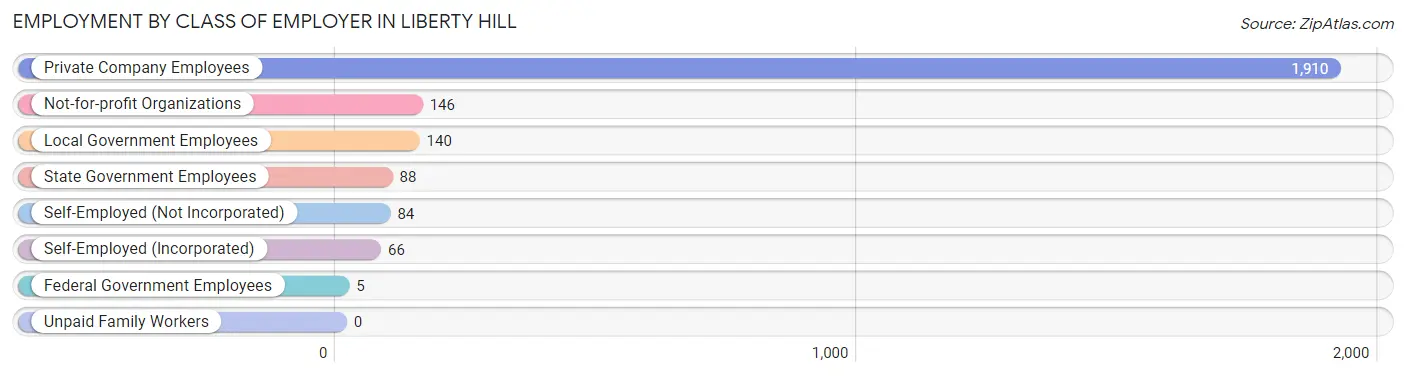
| Employer Class | # Employees | % Employees |
| Private Company Employees | 1,910 | 78.3% |
| Self-Employed (Incorporated) | 66 | 2.7% |
| Self-Employed (Not Incorporated) | 84 | 3.4% |
| Not-for-profit Organizations | 146 | 6.0% |
| Local Government Employees | 140 | 5.7% |
| State Government Employees | 88 | 3.6% |
| Federal Government Employees | 5 | 0.2% |
| Unpaid Family Workers | 0 | 0.0% |
| Total | 2,439 | 100.0% |
Employment Status by Age in Liberty Hill
According to the labor force statistics for Liberty Hill, out of the total population over 16 years of age (3,808), 71.9% or 2,738 individuals are in the labor force, with 10.5% or 287 of them unemployed. The age group with the highest labor force participation rate is 30 to 34 years, with 96.8% or 392 individuals in the labor force. Within the labor force, the 16 to 19 years age range has the highest percentage of unemployed individuals, with 63.8% or 132 of them being unemployed.
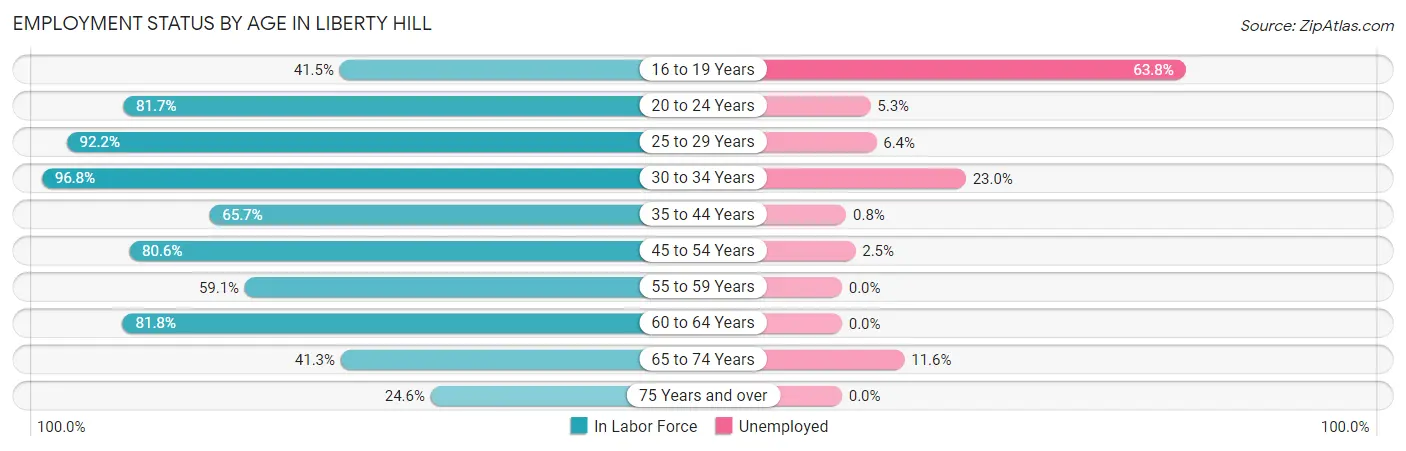
| Age Bracket | In Labor Force | Unemployed |
| 16 to 19 Years | 207 (41.5%) | 132 (63.8%) |
| 20 to 24 Years | 322 (81.7%) | 17 (5.3%) |
| 25 to 29 Years | 438 (92.2%) | 28 (6.4%) |
| 30 to 34 Years | 392 (96.8%) | 90 (23.0%) |
| 35 to 44 Years | 529 (65.7%) | 4 (0.8%) |
| 45 to 54 Years | 474 (80.6%) | 12 (2.5%) |
| 55 to 59 Years | 188 (59.1%) | 0 (0.0%) |
| 60 to 64 Years | 130 (81.8%) | 0 (0.0%) |
| 65 to 74 Years | 43 (41.3%) | 5 (11.6%) |
| 75 Years and over | 15 (24.6%) | 0 (0.0%) |
| Total | 2,738 (71.9%) | 287 (10.5%) |
Employment Status by Educational Attainment in Liberty Hill
According to labor force statistics for Liberty Hill, 78.2% of individuals (2,150) out of the total population between 25 and 64 years of age (2,750) are in the labor force, with 6.2% or 133 of them being unemployed. The group with the highest labor force participation rate are those with the educational attainment of high school diploma, with 91.4% or 695 individuals in the labor force. Within the labor force, individuals with college / associate degree education have the highest percentage of unemployment, with 16.7% or 95 of them being unemployed.
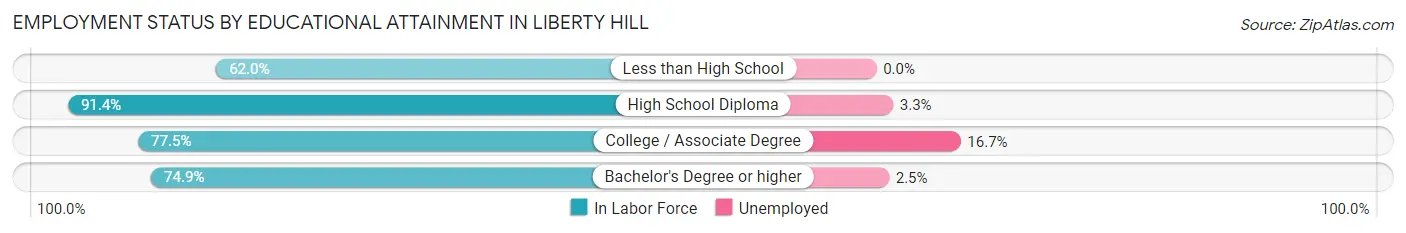
| Educational Attainment | In Labor Force | Unemployed |
| Less than High School | 256 (62.0%) | 0 (0.0%) |
| High School Diploma | 695 (91.4%) | 25 (3.3%) |
| College / Associate Degree | 569 (77.5%) | 123 (16.7%) |
| Bachelor's Degree or higher | 631 (74.9%) | 21 (2.5%) |
| Total | 2,150 (78.2%) | 170 (6.2%) |
Employment Occupations by Sex in Liberty Hill
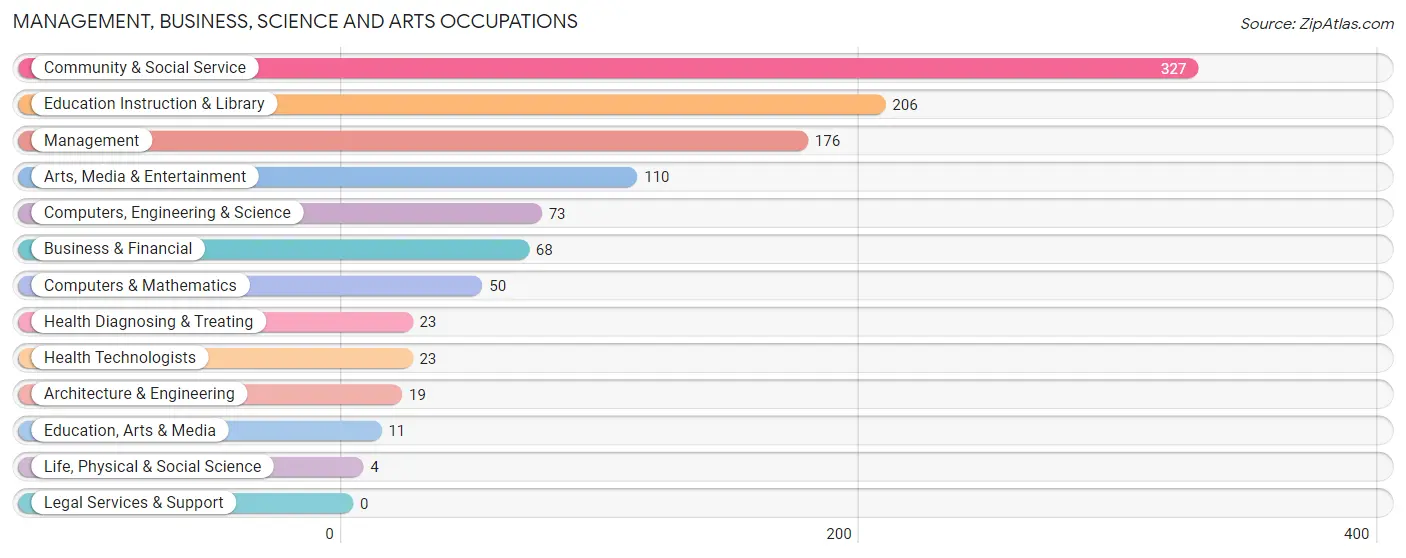
Management, Business, Science and Arts Occupations
The most common Management, Business, Science and Arts occupations in Liberty Hill are Community & Social Service (327 | 13.4%), Education Instruction & Library (206 | 8.4%), Management (176 | 7.2%), Arts, Media & Entertainment (110 | 4.5%), and Computers, Engineering & Science (73 | 3.0%).
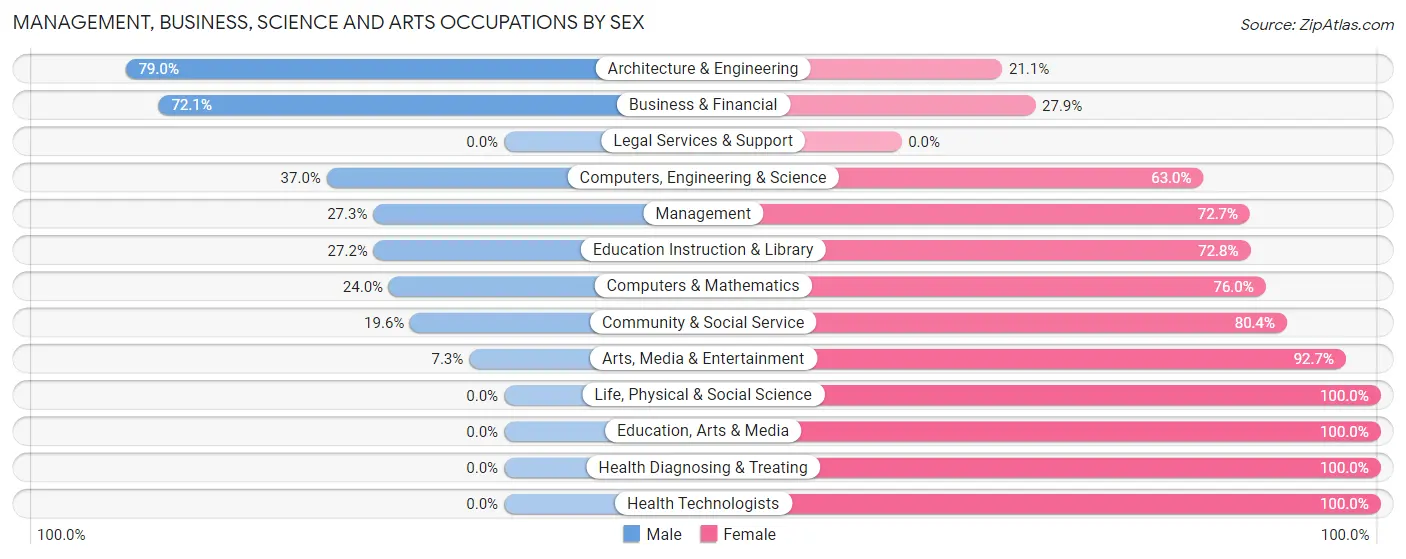
Management, Business, Science and Arts Occupations by Sex
Within the Management, Business, Science and Arts occupations in Liberty Hill, the most male-oriented occupations are Architecture & Engineering (78.9%), Business & Financial (72.1%), and Computers, Engineering & Science (37.0%), while the most female-oriented occupations are Life, Physical & Social Science (100.0%), Education, Arts & Media (100.0%), and Health Diagnosing & Treating (100.0%).
| Occupation | Male | Female |
| Management | 48 (27.3%) | 128 (72.7%) |
| Business & Financial | 49 (72.1%) | 19 (27.9%) |
| Computers, Engineering & Science | 27 (37.0%) | 46 (63.0%) |
| Computers & Mathematics | 12 (24.0%) | 38 (76.0%) |
| Architecture & Engineering | 15 (78.9%) | 4 (21.0%) |
| Life, Physical & Social Science | 0 (0.0%) | 4 (100.0%) |
| Community & Social Service | 64 (19.6%) | 263 (80.4%) |
| Education, Arts & Media | 0 (0.0%) | 11 (100.0%) |
| Legal Services & Support | 0 (0.0%) | 0 (0.0%) |
| Education Instruction & Library | 56 (27.2%) | 150 (72.8%) |
| Arts, Media & Entertainment | 8 (7.3%) | 102 (92.7%) |
| Health Diagnosing & Treating | 0 (0.0%) | 23 (100.0%) |
| Health Technologists | 0 (0.0%) | 23 (100.0%) |
| Total (Category) | 188 (28.2%) | 479 (71.8%) |
| Total (Overall) | 1,170 (47.8%) | 1,280 (52.2%) |
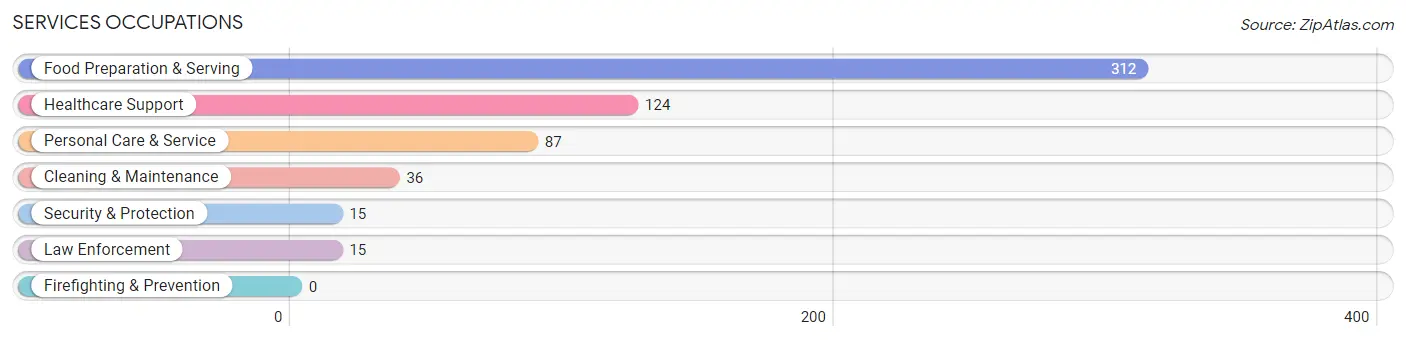
Services Occupations
The most common Services occupations in Liberty Hill are Food Preparation & Serving (312 | 12.7%), Healthcare Support (124 | 5.1%), Personal Care & Service (87 | 3.5%), Cleaning & Maintenance (36 | 1.5%), and Security & Protection (15 | 0.6%).
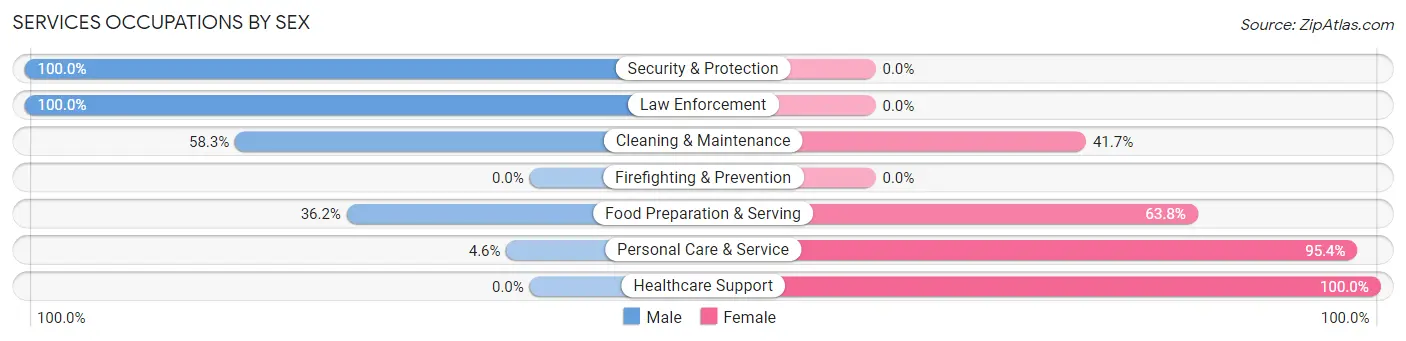
Services Occupations by Sex
Within the Services occupations in Liberty Hill, the most male-oriented occupations are Security & Protection (100.0%), Law Enforcement (100.0%), and Cleaning & Maintenance (58.3%), while the most female-oriented occupations are Healthcare Support (100.0%), Personal Care & Service (95.4%), and Food Preparation & Serving (63.8%).
| Occupation | Male | Female |
| Healthcare Support | 0 (0.0%) | 124 (100.0%) |
| Security & Protection | 15 (100.0%) | 0 (0.0%) |
| Firefighting & Prevention | 0 (0.0%) | 0 (0.0%) |
| Law Enforcement | 15 (100.0%) | 0 (0.0%) |
| Food Preparation & Serving | 113 (36.2%) | 199 (63.8%) |
| Cleaning & Maintenance | 21 (58.3%) | 15 (41.7%) |
| Personal Care & Service | 4 (4.6%) | 83 (95.4%) |
| Total (Category) | 153 (26.7%) | 421 (73.3%) |
| Total (Overall) | 1,170 (47.8%) | 1,280 (52.2%) |
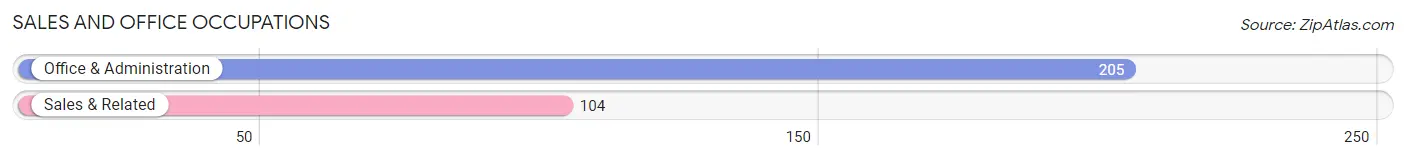
Sales and Office Occupations
The most common Sales and Office occupations in Liberty Hill are Office & Administration (205 | 8.4%), and Sales & Related (104 | 4.2%).
Sales and Office Occupations by Sex
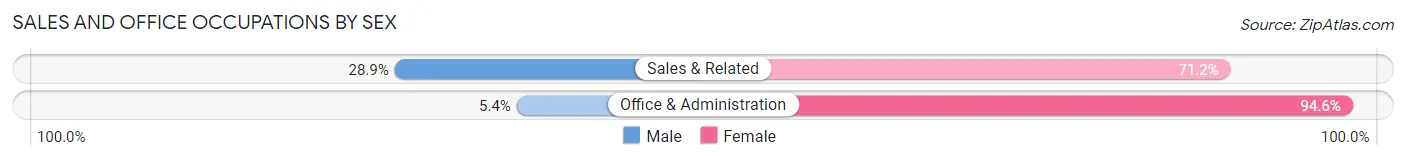
| Occupation | Male | Female |
| Sales & Related | 30 (28.8%) | 74 (71.2%) |
| Office & Administration | 11 (5.4%) | 194 (94.6%) |
| Total (Category) | 41 (13.3%) | 268 (86.7%) |
| Total (Overall) | 1,170 (47.8%) | 1,280 (52.2%) |
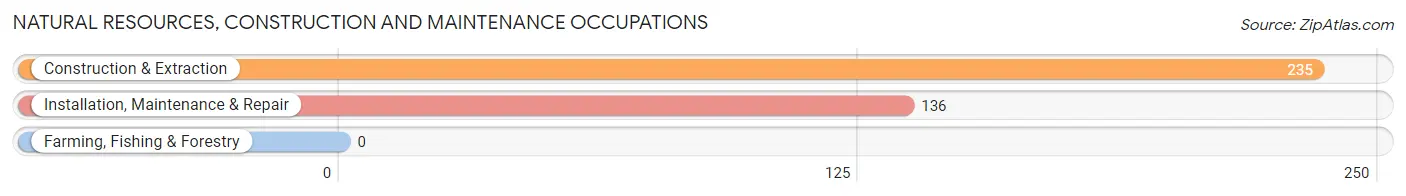
Natural Resources, Construction and Maintenance Occupations
The most common Natural Resources, Construction and Maintenance occupations in Liberty Hill are Construction & Extraction (235 | 9.6%), and Installation, Maintenance & Repair (136 | 5.6%).
Natural Resources, Construction and Maintenance Occupations by Sex
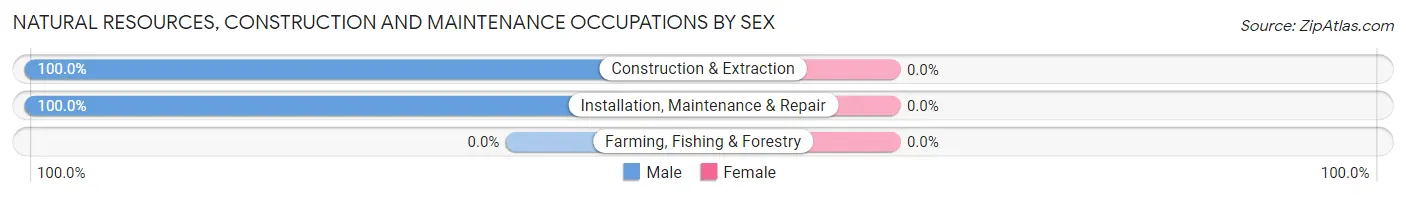
| Occupation | Male | Female |
| Farming, Fishing & Forestry | 0 (0.0%) | 0 (0.0%) |
| Construction & Extraction | 235 (100.0%) | 0 (0.0%) |
| Installation, Maintenance & Repair | 136 (100.0%) | 0 (0.0%) |
| Total (Category) | 371 (100.0%) | 0 (0.0%) |
| Total (Overall) | 1,170 (47.8%) | 1,280 (52.2%) |
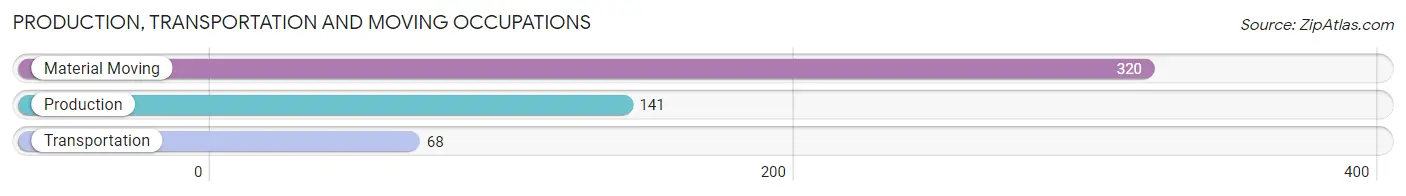
Production, Transportation and Moving Occupations
The most common Production, Transportation and Moving occupations in Liberty Hill are Material Moving (320 | 13.1%), Production (141 | 5.8%), and Transportation (68 | 2.8%).
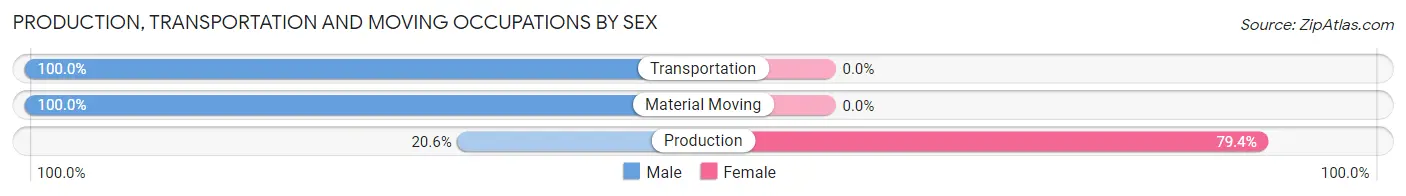
Production, Transportation and Moving Occupations by Sex
| Occupation | Male | Female |
| Production | 29 (20.6%) | 112 (79.4%) |
| Transportation | 68 (100.0%) | 0 (0.0%) |
| Material Moving | 320 (100.0%) | 0 (0.0%) |
| Total (Category) | 417 (78.8%) | 112 (21.2%) |
| Total (Overall) | 1,170 (47.8%) | 1,280 (52.2%) |
Employment Industries by Sex in Liberty Hill
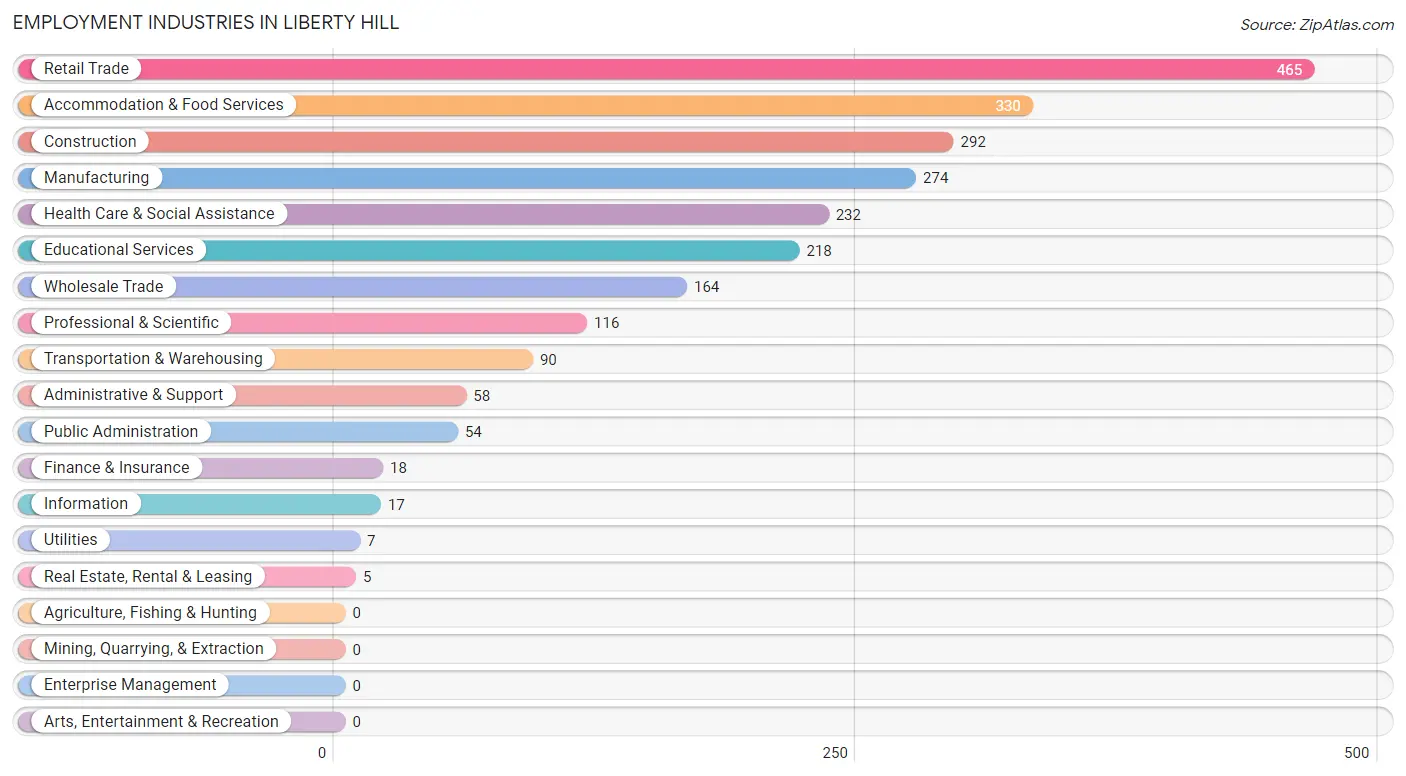
Employment Industries in Liberty Hill
The major employment industries in Liberty Hill include Retail Trade (465 | 19.0%), Accommodation & Food Services (330 | 13.5%), Construction (292 | 11.9%), Manufacturing (274 | 11.2%), and Health Care & Social Assistance (232 | 9.5%).
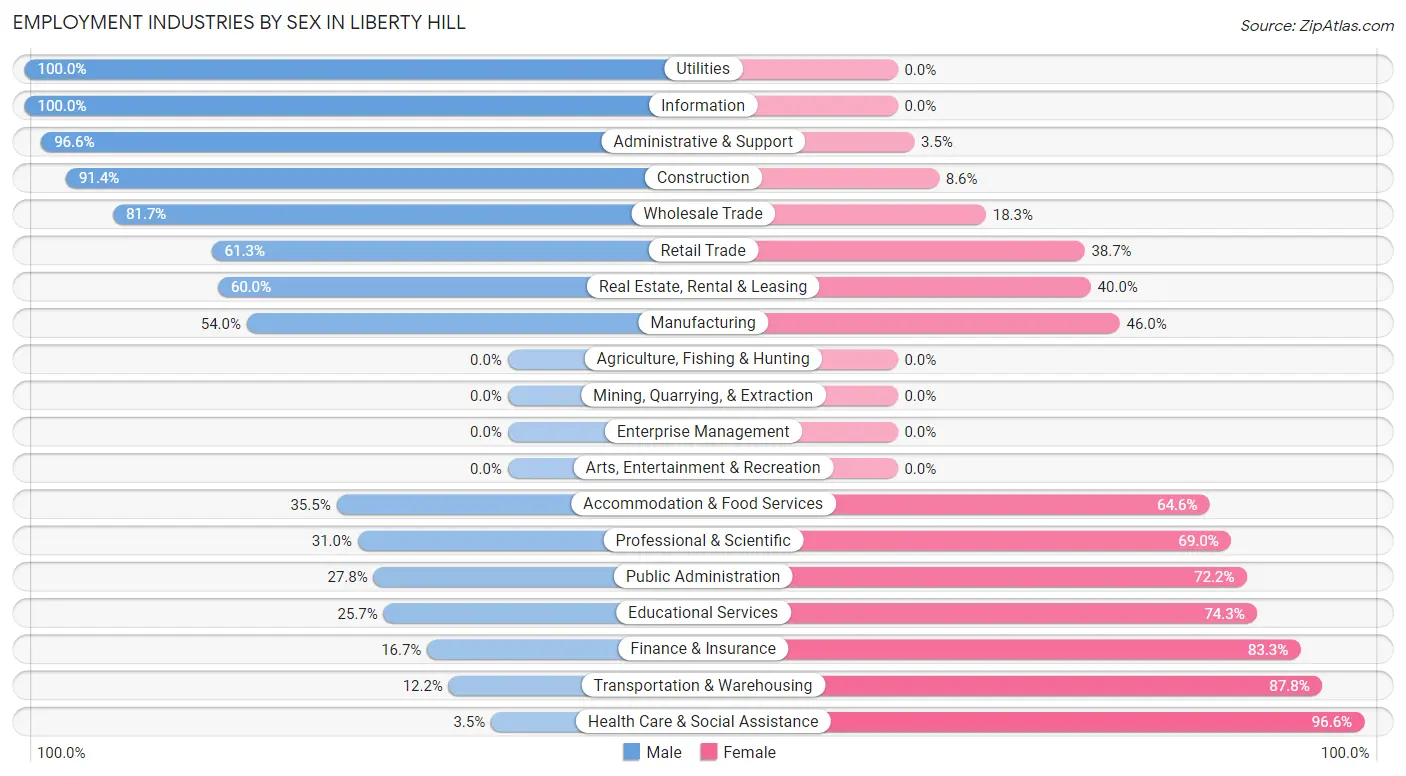
Employment Industries by Sex in Liberty Hill
The Liberty Hill industries that see more men than women are Utilities (100.0%), Information (100.0%), and Administrative & Support (96.6%), whereas the industries that tend to have a higher number of women are Health Care & Social Assistance (96.6%), Transportation & Warehousing (87.8%), and Finance & Insurance (83.3%).
| Industry | Male | Female |
| Agriculture, Fishing & Hunting | 0 (0.0%) | 0 (0.0%) |
| Mining, Quarrying, & Extraction | 0 (0.0%) | 0 (0.0%) |
| Construction | 267 (91.4%) | 25 (8.6%) |
| Manufacturing | 148 (54.0%) | 126 (46.0%) |
| Wholesale Trade | 134 (81.7%) | 30 (18.3%) |
| Retail Trade | 285 (61.3%) | 180 (38.7%) |
| Transportation & Warehousing | 11 (12.2%) | 79 (87.8%) |
| Utilities | 7 (100.0%) | 0 (0.0%) |
| Information | 17 (100.0%) | 0 (0.0%) |
| Finance & Insurance | 3 (16.7%) | 15 (83.3%) |
| Real Estate, Rental & Leasing | 3 (60.0%) | 2 (40.0%) |
| Professional & Scientific | 36 (31.0%) | 80 (69.0%) |
| Enterprise Management | 0 (0.0%) | 0 (0.0%) |
| Administrative & Support | 56 (96.6%) | 2 (3.5%) |
| Educational Services | 56 (25.7%) | 162 (74.3%) |
| Health Care & Social Assistance | 8 (3.5%) | 224 (96.6%) |
| Arts, Entertainment & Recreation | 0 (0.0%) | 0 (0.0%) |
| Accommodation & Food Services | 117 (35.4%) | 213 (64.5%) |
| Public Administration | 15 (27.8%) | 39 (72.2%) |
| Total | 1,170 (47.8%) | 1,280 (52.2%) |
Education in Liberty Hill
School Enrollment in Liberty Hill
The most common levels of schooling among the 1,420 students in Liberty Hill are high school (515 | 36.3%), middle school (379 | 26.7%), and elementary school (233 | 16.4%).
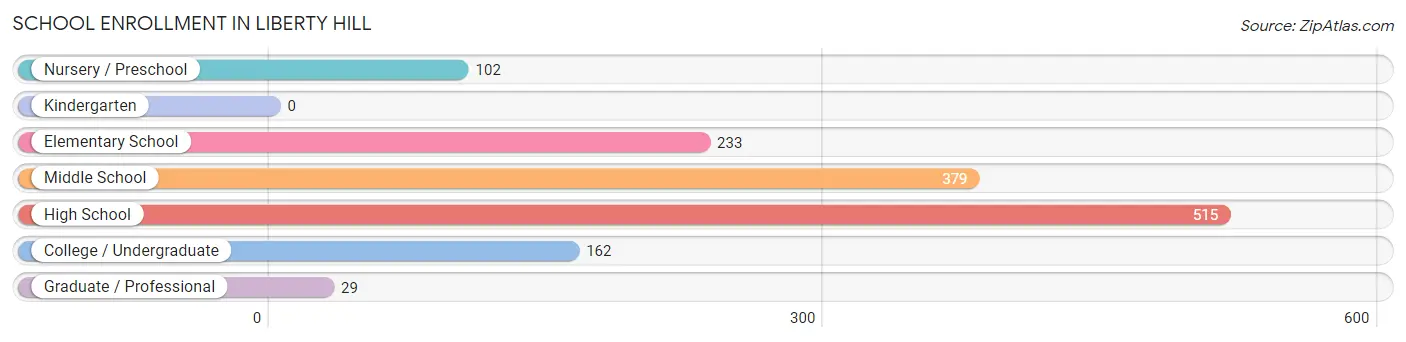
| School Level | # Students | % Students |
| Nursery / Preschool | 102 | 7.2% |
| Kindergarten | 0 | 0.0% |
| Elementary School | 233 | 16.4% |
| Middle School | 379 | 26.7% |
| High School | 515 | 36.3% |
| College / Undergraduate | 162 | 11.4% |
| Graduate / Professional | 29 | 2.0% |
| Total | 1,420 | 100.0% |
School Enrollment by Age by Funding Source in Liberty Hill
Out of a total of 1,420 students who are enrolled in schools in Liberty Hill, 74 (5.2%) attend a private institution, while the remaining 1,346 (94.8%) are enrolled in public schools. The age group of 35 years and over has the highest likelihood of being enrolled in private schools, with 25 (52.1% in the age bracket) enrolled. Conversely, the age group of 18 to 19 year olds has the lowest likelihood of being enrolled in a private school, with 90 (100.0% in the age bracket) attending a public institution.
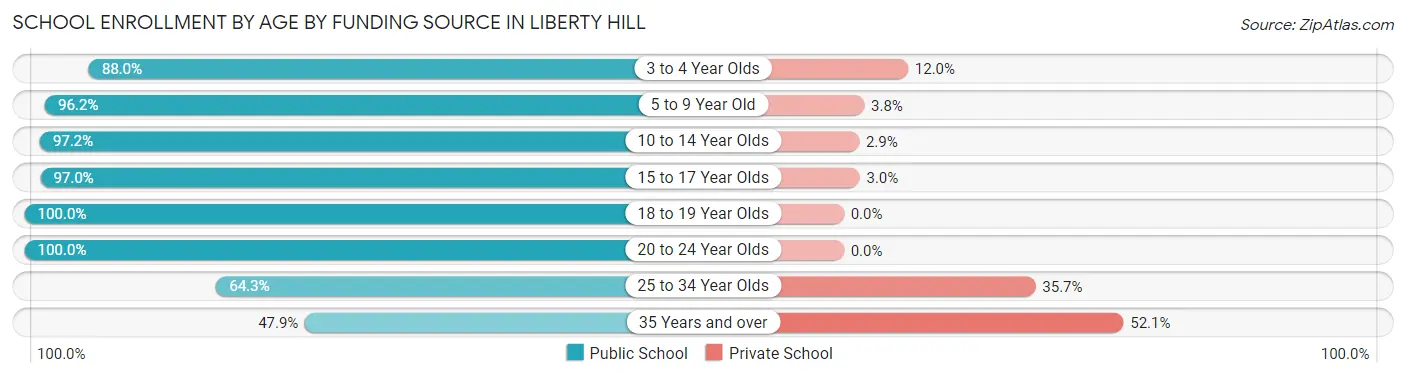
| Age Bracket | Public School | Private School |
| 3 to 4 Year Olds | 81 (88.0%) | 11 (12.0%) |
| 5 to 9 Year Old | 227 (96.2%) | 9 (3.8%) |
| 10 to 14 Year Olds | 375 (97.2%) | 11 (2.9%) |
| 15 to 17 Year Olds | 426 (97.0%) | 13 (3.0%) |
| 18 to 19 Year Olds | 90 (100.0%) | 0 (0.0%) |
| 20 to 24 Year Olds | 115 (100.0%) | 0 (0.0%) |
| 25 to 34 Year Olds | 9 (64.3%) | 5 (35.7%) |
| 35 Years and over | 23 (47.9%) | 25 (52.1%) |
| Total | 1,346 (94.8%) | 74 (5.2%) |
Educational Attainment by Field of Study in Liberty Hill
Business (365 | 39.9%), education (137 | 15.0%), visual & performing arts (131 | 14.3%), science & technology (59 | 6.5%), and arts & humanities (57 | 6.2%) are the most common fields of study among 914 individuals in Liberty Hill who have obtained a bachelor's degree or higher.
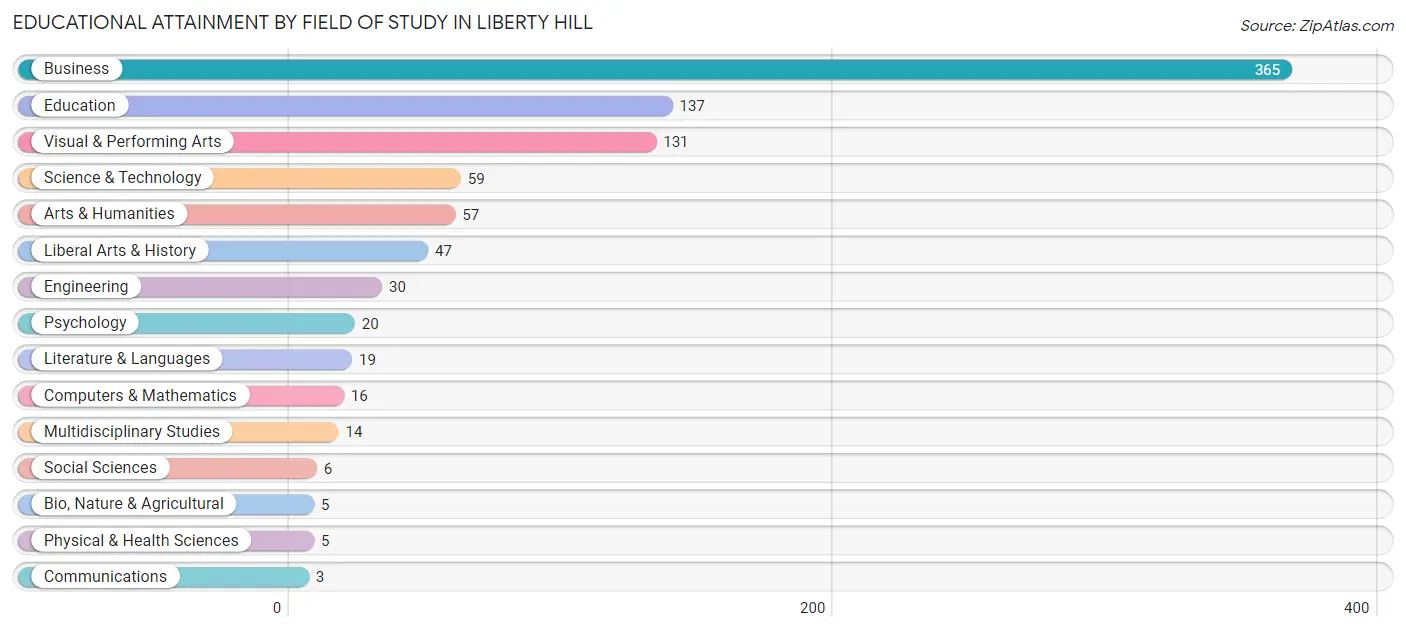
| Field of Study | # Graduates | % Graduates |
| Computers & Mathematics | 16 | 1.8% |
| Bio, Nature & Agricultural | 5 | 0.5% |
| Physical & Health Sciences | 5 | 0.5% |
| Psychology | 20 | 2.2% |
| Social Sciences | 6 | 0.7% |
| Engineering | 30 | 3.3% |
| Multidisciplinary Studies | 14 | 1.5% |
| Science & Technology | 59 | 6.5% |
| Business | 365 | 39.9% |
| Education | 137 | 15.0% |
| Literature & Languages | 19 | 2.1% |
| Liberal Arts & History | 47 | 5.1% |
| Visual & Performing Arts | 131 | 14.3% |
| Communications | 3 | 0.3% |
| Arts & Humanities | 57 | 6.2% |
| Total | 914 | 100.0% |
Transportation & Commute in Liberty Hill
Vehicle Availability by Sex in Liberty Hill
The most prevalent vehicle ownership categories in Liberty Hill are males with 3 vehicles (535, accounting for 45.7%) and females with 3 vehicles (459, making up 42.2%).
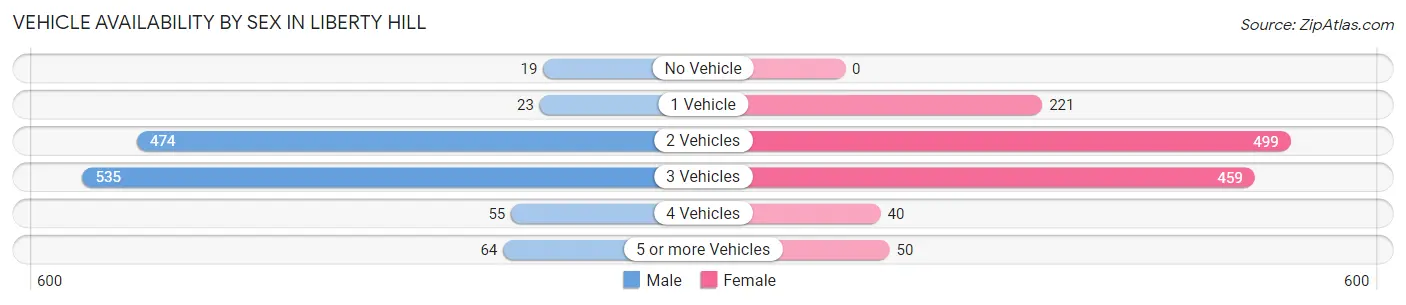
| Vehicles Available | Male | Female |
| No Vehicle | 19 (1.6%) | 0 (0.0%) |
| 1 Vehicle | 23 (2.0%) | 221 (17.4%) |
| 2 Vehicles | 474 (40.5%) | 499 (39.3%) |
| 3 Vehicles | 535 (45.7%) | 459 (36.2%) |
| 4 Vehicles | 55 (4.7%) | 40 (3.2%) |
| 5 or more Vehicles | 64 (5.5%) | 50 (3.9%) |
| Total | 1,170 (100.0%) | 1,269 (100.0%) |
Commute Time in Liberty Hill
The most frequently occuring commute durations in Liberty Hill are 30 to 34 minutes (522 commuters, 23.1%), 20 to 24 minutes (516 commuters, 22.9%), and 60 to 89 minutes (414 commuters, 18.3%).
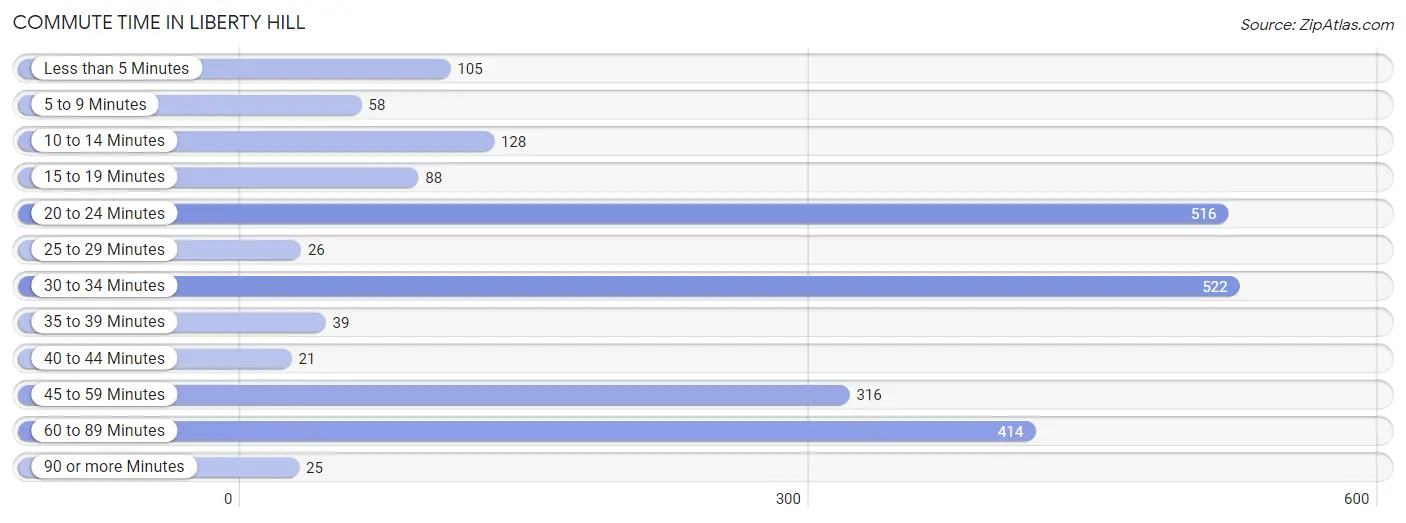
| Commute Time | # Commuters | % Commuters |
| Less than 5 Minutes | 105 | 4.6% |
| 5 to 9 Minutes | 58 | 2.6% |
| 10 to 14 Minutes | 128 | 5.7% |
| 15 to 19 Minutes | 88 | 3.9% |
| 20 to 24 Minutes | 516 | 22.9% |
| 25 to 29 Minutes | 26 | 1.1% |
| 30 to 34 Minutes | 522 | 23.1% |
| 35 to 39 Minutes | 39 | 1.7% |
| 40 to 44 Minutes | 21 | 0.9% |
| 45 to 59 Minutes | 316 | 14.0% |
| 60 to 89 Minutes | 414 | 18.3% |
| 90 or more Minutes | 25 | 1.1% |
Commute Time by Sex in Liberty Hill
The most common commute times in Liberty Hill are 60 to 89 minutes (285 commuters, 25.5%) for males and 30 to 34 minutes (375 commuters, 32.9%) for females.
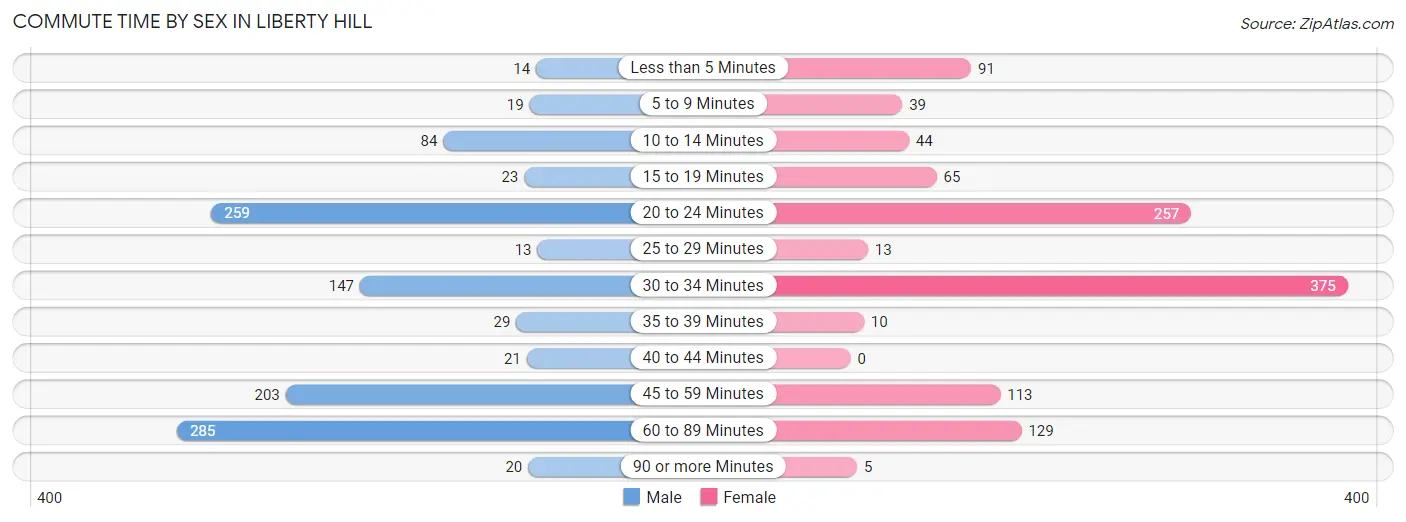
| Commute Time | Male | Female |
| Less than 5 Minutes | 14 (1.3%) | 91 (8.0%) |
| 5 to 9 Minutes | 19 (1.7%) | 39 (3.4%) |
| 10 to 14 Minutes | 84 (7.5%) | 44 (3.9%) |
| 15 to 19 Minutes | 23 (2.1%) | 65 (5.7%) |
| 20 to 24 Minutes | 259 (23.2%) | 257 (22.5%) |
| 25 to 29 Minutes | 13 (1.2%) | 13 (1.1%) |
| 30 to 34 Minutes | 147 (13.2%) | 375 (32.9%) |
| 35 to 39 Minutes | 29 (2.6%) | 10 (0.9%) |
| 40 to 44 Minutes | 21 (1.9%) | 0 (0.0%) |
| 45 to 59 Minutes | 203 (18.2%) | 113 (9.9%) |
| 60 to 89 Minutes | 285 (25.5%) | 129 (11.3%) |
| 90 or more Minutes | 20 (1.8%) | 5 (0.4%) |
Time of Departure to Work by Sex in Liberty Hill
The most frequent times of departure to work in Liberty Hill are 6:30 AM to 6:59 AM (182, 16.3%) for males and 12:00 AM to 4:59 AM (196, 17.2%) for females.
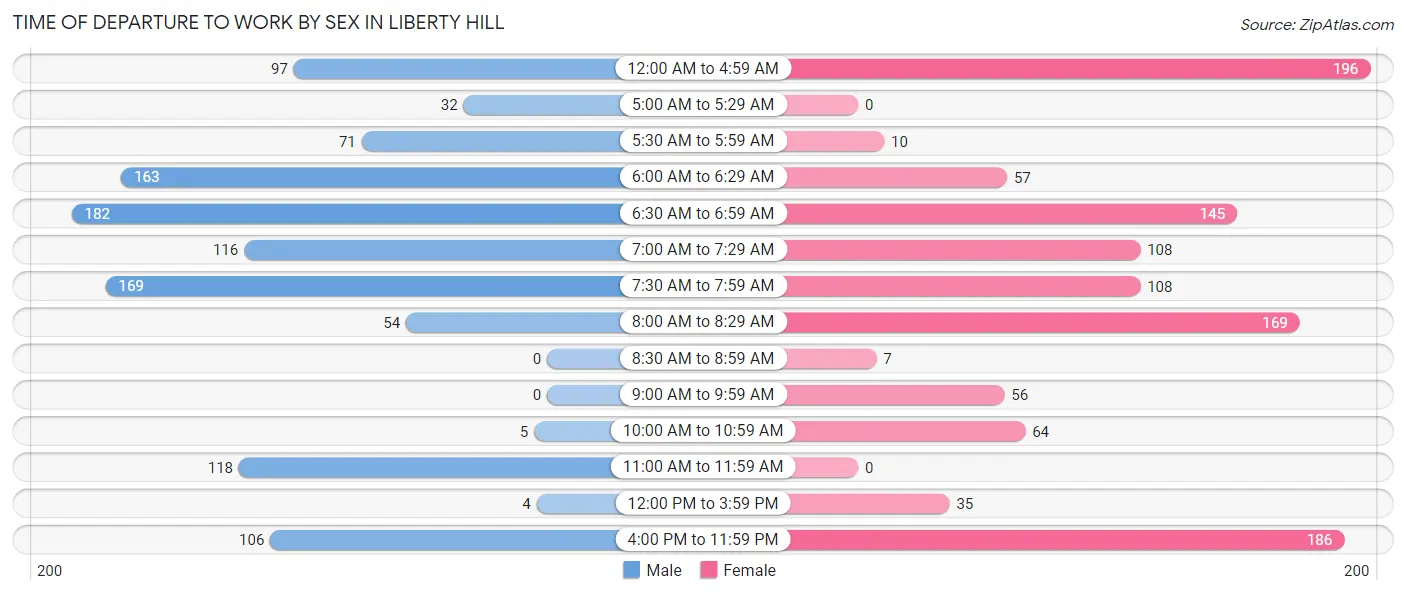
| Time of Departure | Male | Female |
| 12:00 AM to 4:59 AM | 97 (8.7%) | 196 (17.2%) |
| 5:00 AM to 5:29 AM | 32 (2.9%) | 0 (0.0%) |
| 5:30 AM to 5:59 AM | 71 (6.4%) | 10 (0.9%) |
| 6:00 AM to 6:29 AM | 163 (14.6%) | 57 (5.0%) |
| 6:30 AM to 6:59 AM | 182 (16.3%) | 145 (12.7%) |
| 7:00 AM to 7:29 AM | 116 (10.4%) | 108 (9.5%) |
| 7:30 AM to 7:59 AM | 169 (15.1%) | 108 (9.5%) |
| 8:00 AM to 8:29 AM | 54 (4.8%) | 169 (14.8%) |
| 8:30 AM to 8:59 AM | 0 (0.0%) | 7 (0.6%) |
| 9:00 AM to 9:59 AM | 0 (0.0%) | 56 (4.9%) |
| 10:00 AM to 10:59 AM | 5 (0.4%) | 64 (5.6%) |
| 11:00 AM to 11:59 AM | 118 (10.6%) | 0 (0.0%) |
| 12:00 PM to 3:59 PM | 4 (0.4%) | 35 (3.1%) |
| 4:00 PM to 11:59 PM | 106 (9.5%) | 186 (16.3%) |
| Total | 1,117 (100.0%) | 1,141 (100.0%) |
Housing Occupancy in Liberty Hill
Occupancy by Ownership in Liberty Hill
Of the total 1,447 dwellings in Liberty Hill, owner-occupied units account for 861 (59.5%), while renter-occupied units make up 586 (40.5%).
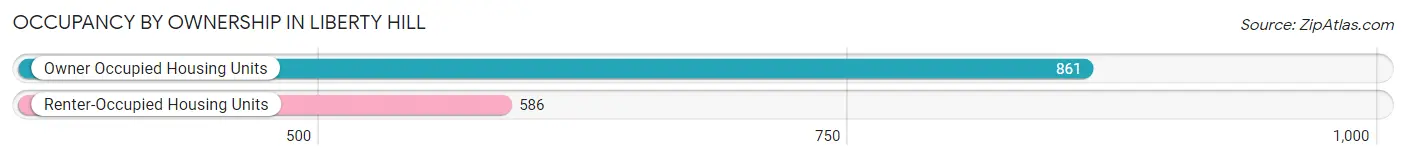
| Occupancy | # Housing Units | % Housing Units |
| Owner Occupied Housing Units | 861 | 59.5% |
| Renter-Occupied Housing Units | 586 | 40.5% |
| Total Occupied Housing Units | 1,447 | 100.0% |
Occupancy by Household Size in Liberty Hill
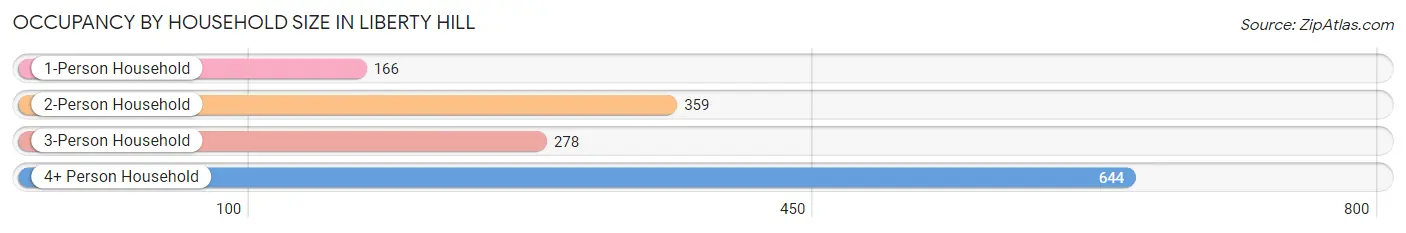
| Household Size | # Housing Units | % Housing Units |
| 1-Person Household | 166 | 11.5% |
| 2-Person Household | 359 | 24.8% |
| 3-Person Household | 278 | 19.2% |
| 4+ Person Household | 644 | 44.5% |
| Total Housing Units | 1,447 | 100.0% |
Occupancy by Ownership by Household Size in Liberty Hill
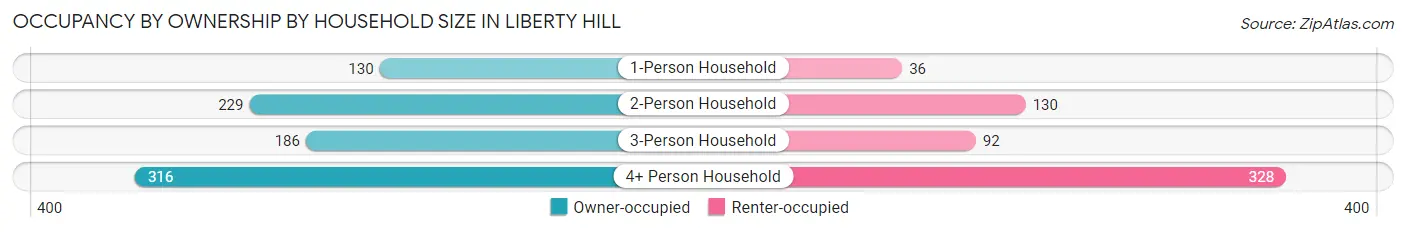
| Household Size | Owner-occupied | Renter-occupied |
| 1-Person Household | 130 (78.3%) | 36 (21.7%) |
| 2-Person Household | 229 (63.8%) | 130 (36.2%) |
| 3-Person Household | 186 (66.9%) | 92 (33.1%) |
| 4+ Person Household | 316 (49.1%) | 328 (50.9%) |
| Total Housing Units | 861 (59.5%) | 586 (40.5%) |
Occupancy by Educational Attainment in Liberty Hill
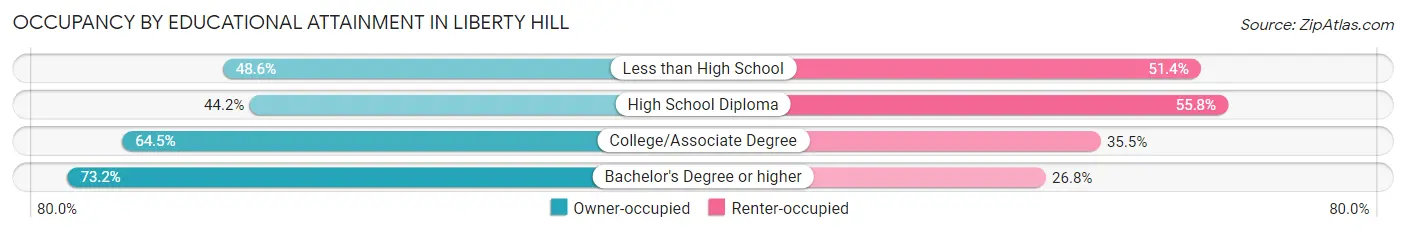
| Household Size | Owner-occupied | Renter-occupied |
| Less than High School | 135 (48.6%) | 143 (51.4%) |
| High School Diploma | 153 (44.2%) | 193 (55.8%) |
| College/Associate Degree | 218 (64.5%) | 120 (35.5%) |
| Bachelor's Degree or higher | 355 (73.2%) | 130 (26.8%) |
Occupancy by Age of Householder in Liberty Hill
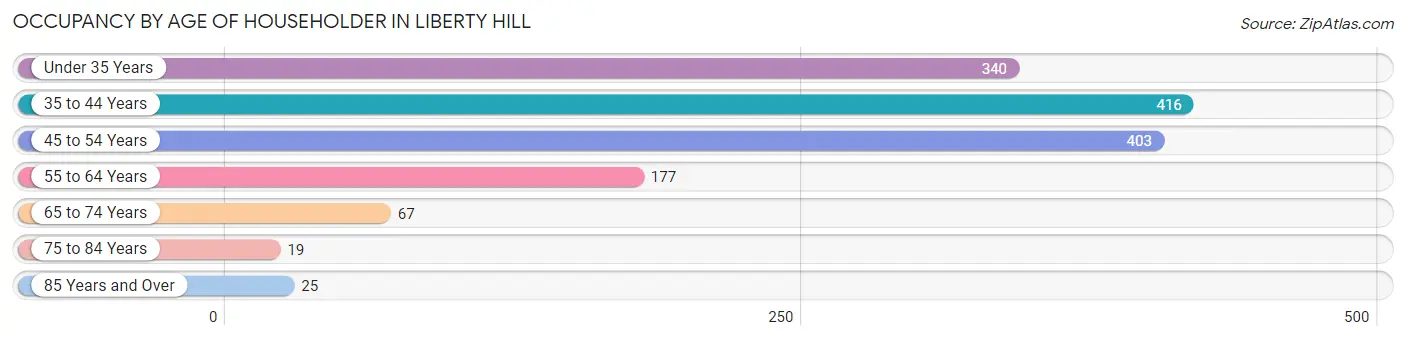
| Age Bracket | # Households | % Households |
| Under 35 Years | 340 | 23.5% |
| 35 to 44 Years | 416 | 28.7% |
| 45 to 54 Years | 403 | 27.9% |
| 55 to 64 Years | 177 | 12.2% |
| 65 to 74 Years | 67 | 4.6% |
| 75 to 84 Years | 19 | 1.3% |
| 85 Years and Over | 25 | 1.7% |
| Total | 1,447 | 100.0% |
Housing Finances in Liberty Hill
Median Income by Occupancy in Liberty Hill
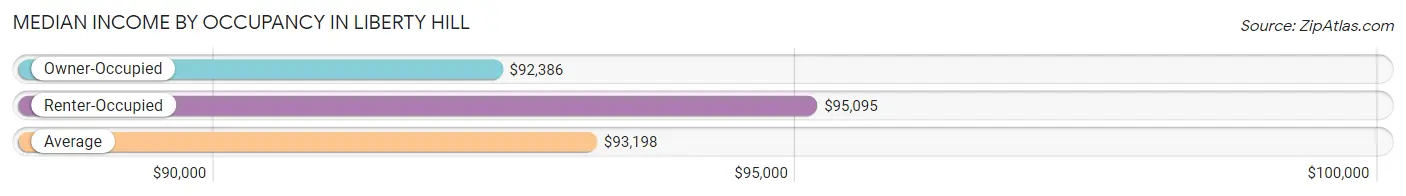
| Occupancy Type | # Households | Median Income |
| Owner-Occupied | 861 (59.5%) | $92,386 |
| Renter-Occupied | 586 (40.5%) | $95,095 |
| Average | 1,447 (100.0%) | $93,198 |
Occupancy by Householder Income Bracket in Liberty Hill
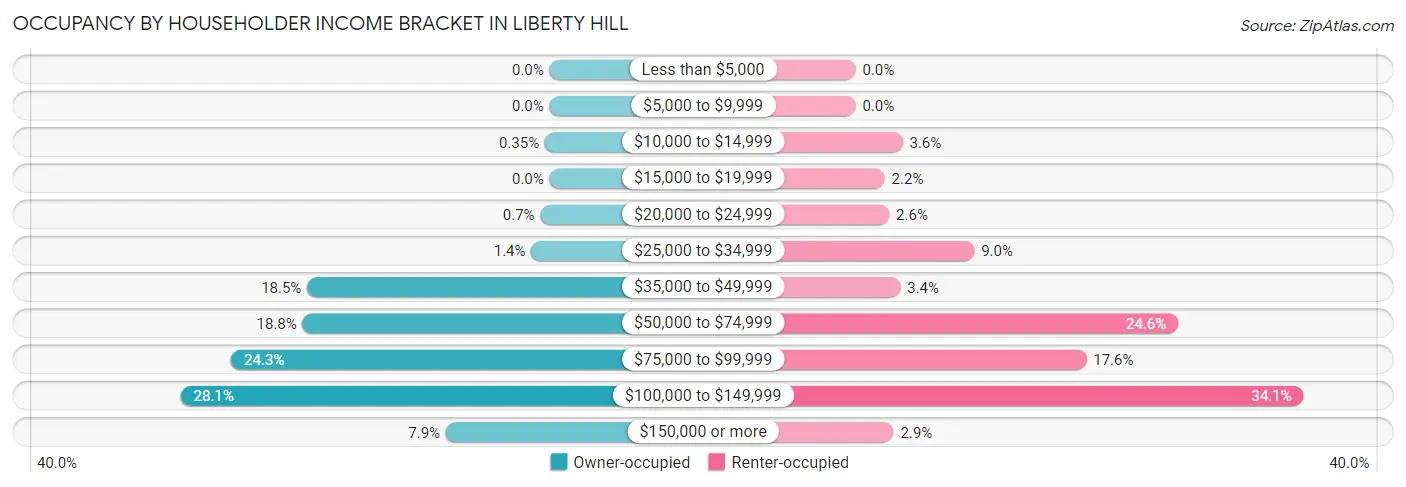
| Income Bracket | Owner-occupied | Renter-occupied |
| Less than $5,000 | 0 (0.0%) | 0 (0.0%) |
| $5,000 to $9,999 | 0 (0.0%) | 0 (0.0%) |
| $10,000 to $14,999 | 3 (0.4%) | 21 (3.6%) |
| $15,000 to $19,999 | 0 (0.0%) | 13 (2.2%) |
| $20,000 to $24,999 | 6 (0.7%) | 15 (2.6%) |
| $25,000 to $34,999 | 12 (1.4%) | 53 (9.0%) |
| $35,000 to $49,999 | 159 (18.5%) | 20 (3.4%) |
| $50,000 to $74,999 | 162 (18.8%) | 144 (24.6%) |
| $75,000 to $99,999 | 209 (24.3%) | 103 (17.6%) |
| $100,000 to $149,999 | 242 (28.1%) | 200 (34.1%) |
| $150,000 or more | 68 (7.9%) | 17 (2.9%) |
| Total | 861 (100.0%) | 586 (100.0%) |
Monthly Housing Cost Tiers in Liberty Hill
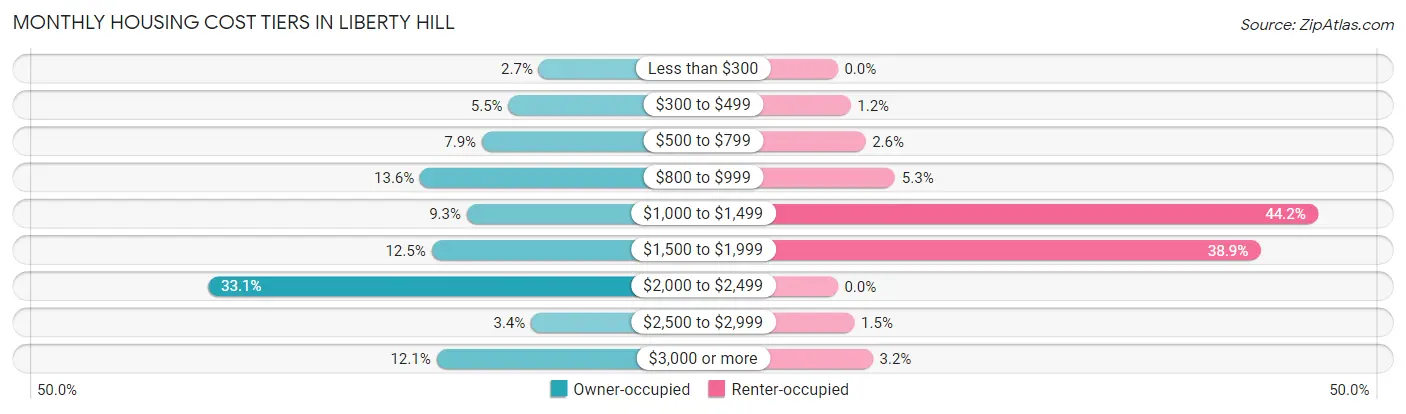
| Monthly Cost | Owner-occupied | Renter-occupied |
| Less than $300 | 23 (2.7%) | 0 (0.0%) |
| $300 to $499 | 47 (5.5%) | 7 (1.2%) |
| $500 to $799 | 68 (7.9%) | 15 (2.6%) |
| $800 to $999 | 117 (13.6%) | 31 (5.3%) |
| $1,000 to $1,499 | 80 (9.3%) | 259 (44.2%) |
| $1,500 to $1,999 | 108 (12.5%) | 228 (38.9%) |
| $2,000 to $2,499 | 285 (33.1%) | 0 (0.0%) |
| $2,500 to $2,999 | 29 (3.4%) | 9 (1.5%) |
| $3,000 or more | 104 (12.1%) | 19 (3.2%) |
| Total | 861 (100.0%) | 586 (100.0%) |
Physical Housing Characteristics in Liberty Hill
Housing Structures in Liberty Hill
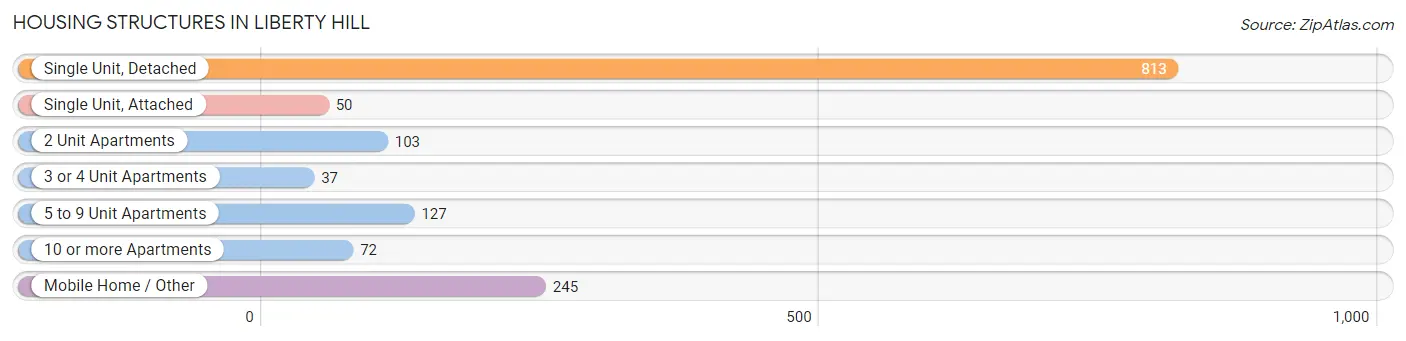
| Structure Type | # Housing Units | % Housing Units |
| Single Unit, Detached | 813 | 56.2% |
| Single Unit, Attached | 50 | 3.5% |
| 2 Unit Apartments | 103 | 7.1% |
| 3 or 4 Unit Apartments | 37 | 2.6% |
| 5 to 9 Unit Apartments | 127 | 8.8% |
| 10 or more Apartments | 72 | 5.0% |
| Mobile Home / Other | 245 | 16.9% |
| Total | 1,447 | 100.0% |
Housing Structures by Occupancy in Liberty Hill
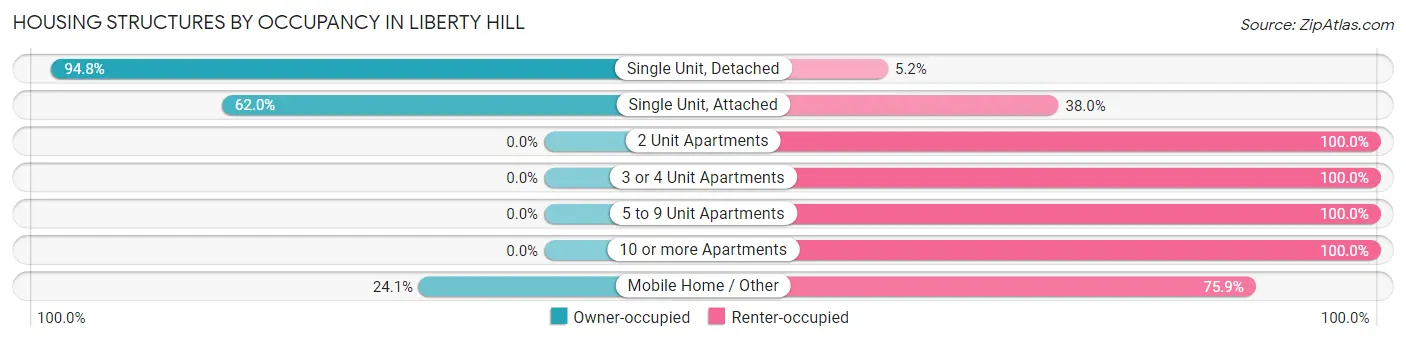
| Structure Type | Owner-occupied | Renter-occupied |
| Single Unit, Detached | 771 (94.8%) | 42 (5.2%) |
| Single Unit, Attached | 31 (62.0%) | 19 (38.0%) |
| 2 Unit Apartments | 0 (0.0%) | 103 (100.0%) |
| 3 or 4 Unit Apartments | 0 (0.0%) | 37 (100.0%) |
| 5 to 9 Unit Apartments | 0 (0.0%) | 127 (100.0%) |
| 10 or more Apartments | 0 (0.0%) | 72 (100.0%) |
| Mobile Home / Other | 59 (24.1%) | 186 (75.9%) |
| Total | 861 (59.5%) | 586 (40.5%) |
Housing Structures by Number of Rooms in Liberty Hill
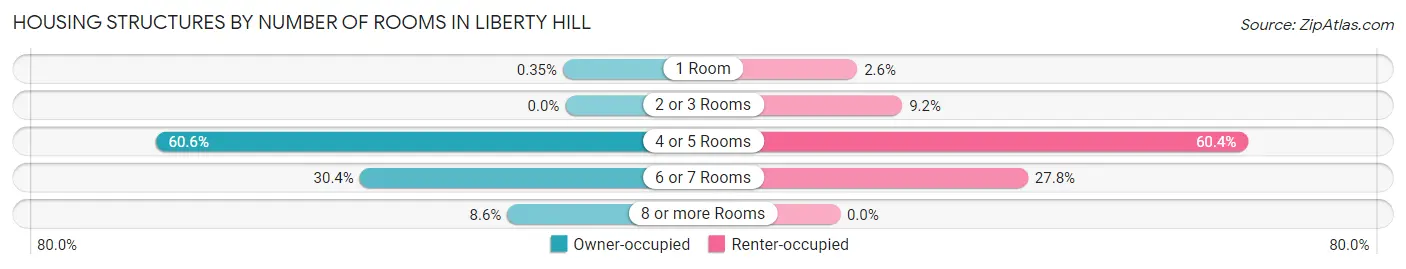
| Number of Rooms | Owner-occupied | Renter-occupied |
| 1 Room | 3 (0.4%) | 15 (2.6%) |
| 2 or 3 Rooms | 0 (0.0%) | 54 (9.2%) |
| 4 or 5 Rooms | 522 (60.6%) | 354 (60.4%) |
| 6 or 7 Rooms | 262 (30.4%) | 163 (27.8%) |
| 8 or more Rooms | 74 (8.6%) | 0 (0.0%) |
| Total | 861 (100.0%) | 586 (100.0%) |
Housing Structure by Heating Type in Liberty Hill
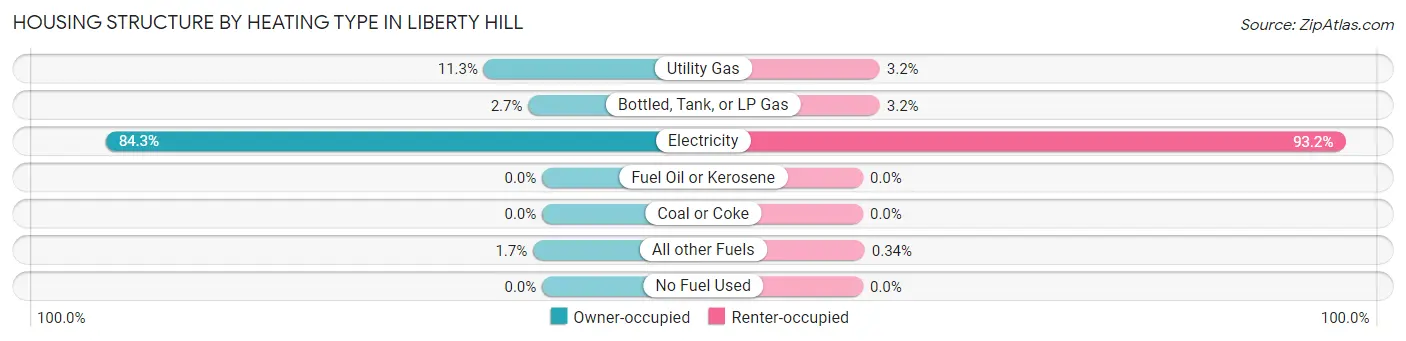
| Heating Type | Owner-occupied | Renter-occupied |
| Utility Gas | 97 (11.3%) | 19 (3.2%) |
| Bottled, Tank, or LP Gas | 23 (2.7%) | 19 (3.2%) |
| Electricity | 726 (84.3%) | 546 (93.2%) |
| Fuel Oil or Kerosene | 0 (0.0%) | 0 (0.0%) |
| Coal or Coke | 0 (0.0%) | 0 (0.0%) |
| All other Fuels | 15 (1.7%) | 2 (0.3%) |
| No Fuel Used | 0 (0.0%) | 0 (0.0%) |
| Total | 861 (100.0%) | 586 (100.0%) |
Household Vehicle Usage in Liberty Hill
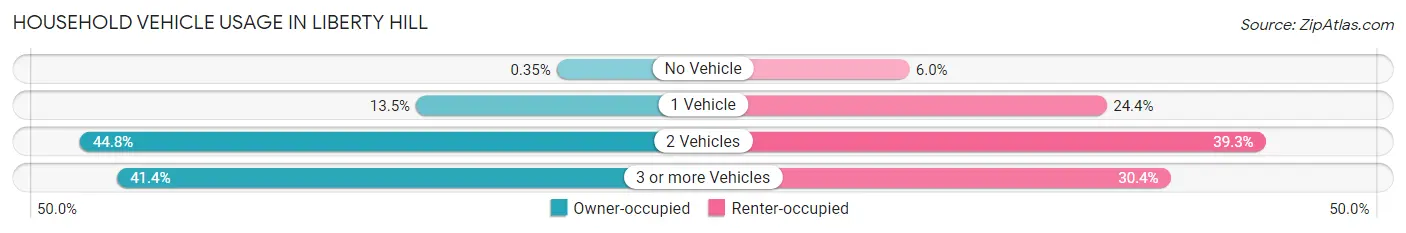
| Vehicles per Household | Owner-occupied | Renter-occupied |
| No Vehicle | 3 (0.4%) | 35 (6.0%) |
| 1 Vehicle | 116 (13.5%) | 143 (24.4%) |
| 2 Vehicles | 386 (44.8%) | 230 (39.3%) |
| 3 or more Vehicles | 356 (41.3%) | 178 (30.4%) |
| Total | 861 (100.0%) | 586 (100.0%) |
Real Estate & Mortgages in Liberty Hill
Real Estate and Mortgage Overview in Liberty Hill
| Characteristic | Without Mortgage | With Mortgage |
| Housing Units | 235 | 626 |
| Median Property Value | $285,900 | $336,400 |
| Median Household Income | $46,870 | $64 |
| Monthly Housing Costs | $692 | $104 |
| Real Estate Taxes | $6,705 | $18 |
Property Value by Mortgage Status in Liberty Hill
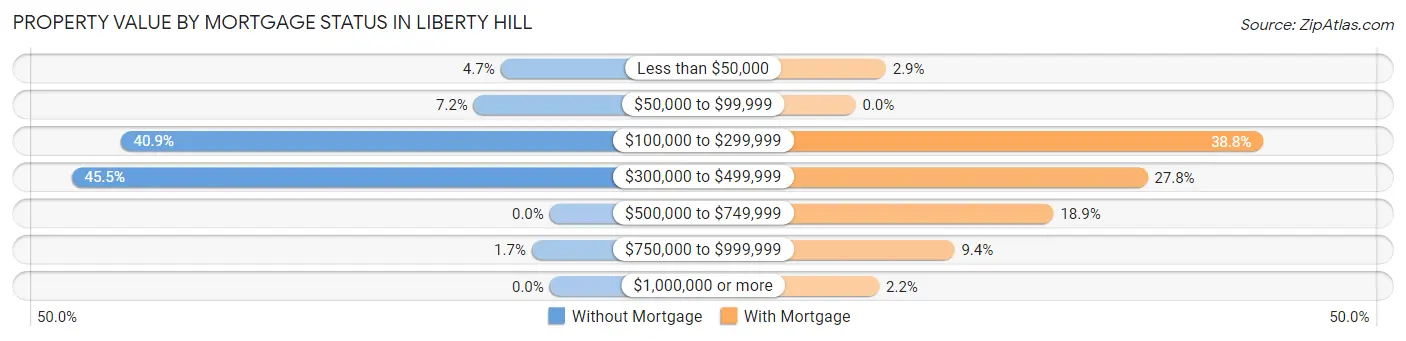
| Property Value | Without Mortgage | With Mortgage |
| Less than $50,000 | 11 (4.7%) | 18 (2.9%) |
| $50,000 to $99,999 | 17 (7.2%) | 0 (0.0%) |
| $100,000 to $299,999 | 96 (40.8%) | 243 (38.8%) |
| $300,000 to $499,999 | 107 (45.5%) | 174 (27.8%) |
| $500,000 to $749,999 | 0 (0.0%) | 118 (18.9%) |
| $750,000 to $999,999 | 4 (1.7%) | 59 (9.4%) |
| $1,000,000 or more | 0 (0.0%) | 14 (2.2%) |
| Total | 235 (100.0%) | 626 (100.0%) |
Household Income by Mortgage Status in Liberty Hill
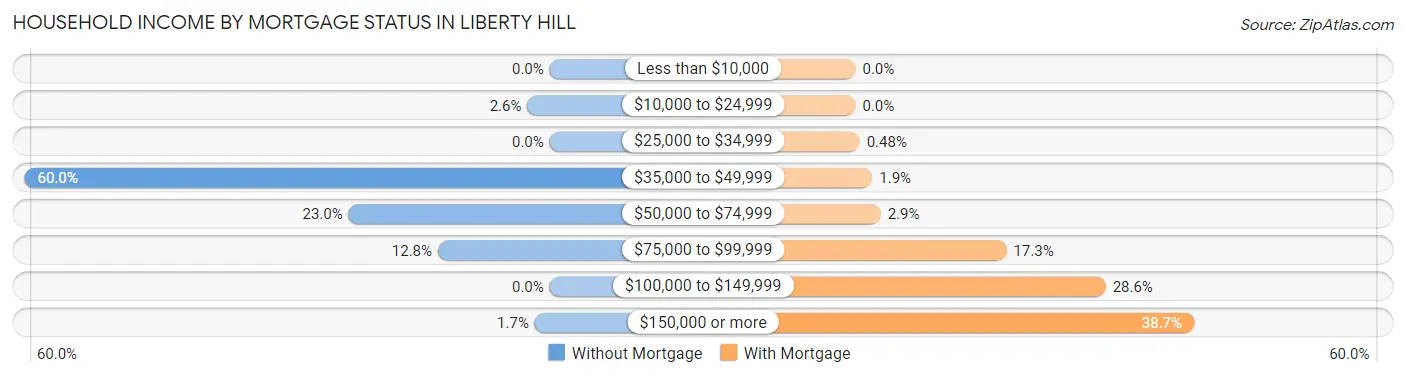
| Household Income | Without Mortgage | With Mortgage |
| Less than $10,000 | 0 (0.0%) | 0 (0.0%) |
| $10,000 to $24,999 | 6 (2.5%) | 0 (0.0%) |
| $25,000 to $34,999 | 0 (0.0%) | 3 (0.5%) |
| $35,000 to $49,999 | 141 (60.0%) | 12 (1.9%) |
| $50,000 to $74,999 | 54 (23.0%) | 18 (2.9%) |
| $75,000 to $99,999 | 30 (12.8%) | 108 (17.2%) |
| $100,000 to $149,999 | 0 (0.0%) | 179 (28.6%) |
| $150,000 or more | 4 (1.7%) | 242 (38.7%) |
| Total | 235 (100.0%) | 626 (100.0%) |
Property Value to Household Income Ratio in Liberty Hill
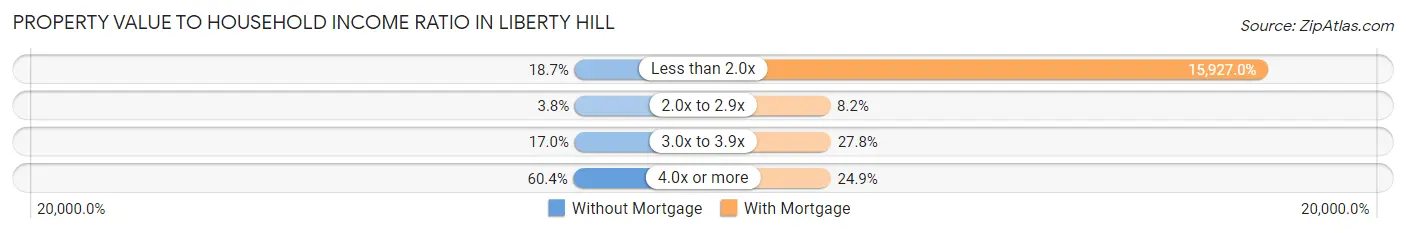
| Value-to-Income Ratio | Without Mortgage | With Mortgage |
| Less than 2.0x | 44 (18.7%) | 99,703 (15,927.0%) |
| 2.0x to 2.9x | 9 (3.8%) | 51 (8.2%) |
| 3.0x to 3.9x | 40 (17.0%) | 174 (27.8%) |
| 4.0x or more | 142 (60.4%) | 156 (24.9%) |
| Total | 235 (100.0%) | 626 (100.0%) |
Real Estate Taxes by Mortgage Status in Liberty Hill
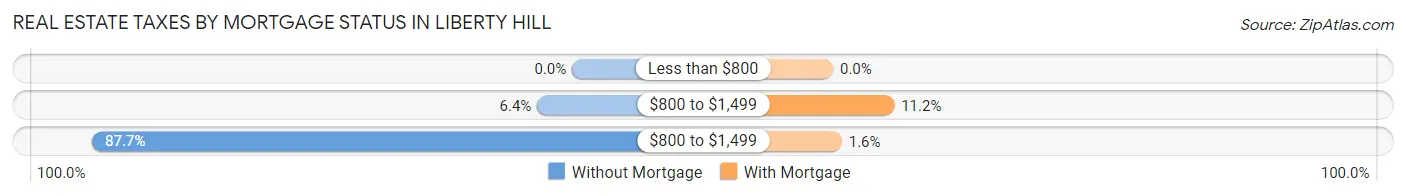
| Property Taxes | Without Mortgage | With Mortgage |
| Less than $800 | 0 (0.0%) | 0 (0.0%) |
| $800 to $1,499 | 15 (6.4%) | 70 (11.2%) |
| $800 to $1,499 | 206 (87.7%) | 10 (1.6%) |
| Total | 235 (100.0%) | 626 (100.0%) |
Health & Disability in Liberty Hill
Health Insurance Coverage by Age in Liberty Hill
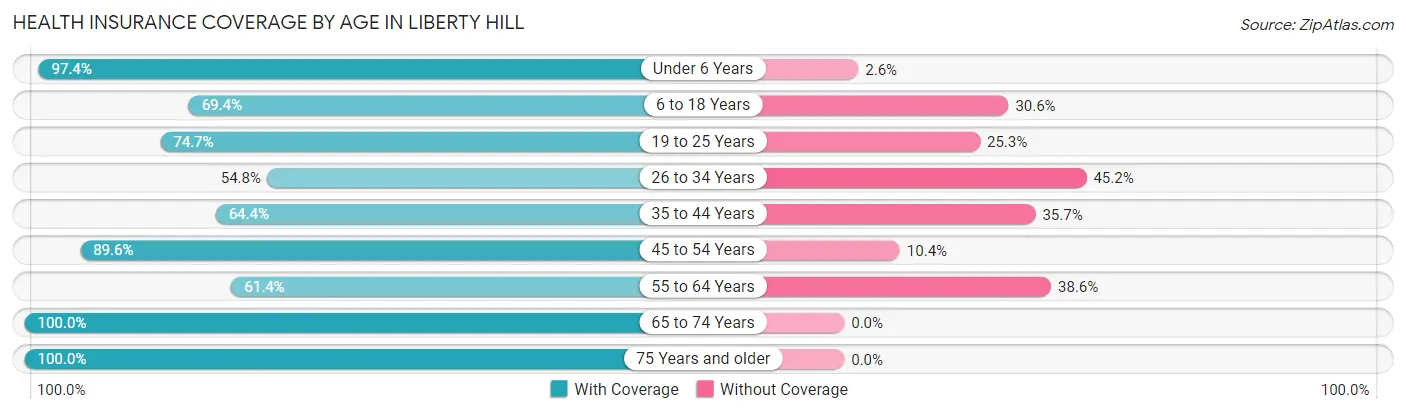
| Age Bracket | With Coverage | Without Coverage |
| Under 6 Years | 669 (97.4%) | 18 (2.6%) |
| 6 to 18 Years | 789 (69.4%) | 348 (30.6%) |
| 19 to 25 Years | 469 (74.7%) | 159 (25.3%) |
| 26 to 34 Years | 391 (54.8%) | 322 (45.2%) |
| 35 to 44 Years | 518 (64.3%) | 287 (35.6%) |
| 45 to 54 Years | 527 (89.6%) | 61 (10.4%) |
| 55 to 64 Years | 293 (61.4%) | 184 (38.6%) |
| 65 to 74 Years | 104 (100.0%) | 0 (0.0%) |
| 75 Years and older | 61 (100.0%) | 0 (0.0%) |
| Total | 3,821 (73.5%) | 1,379 (26.5%) |
Health Insurance Coverage by Citizenship Status in Liberty Hill
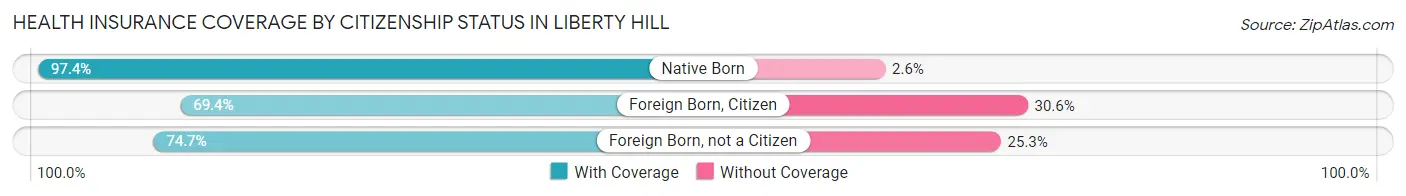
| Citizenship Status | With Coverage | Without Coverage |
| Native Born | 669 (97.4%) | 18 (2.6%) |
| Foreign Born, Citizen | 789 (69.4%) | 348 (30.6%) |
| Foreign Born, not a Citizen | 469 (74.7%) | 159 (25.3%) |
Health Insurance Coverage by Household Income in Liberty Hill
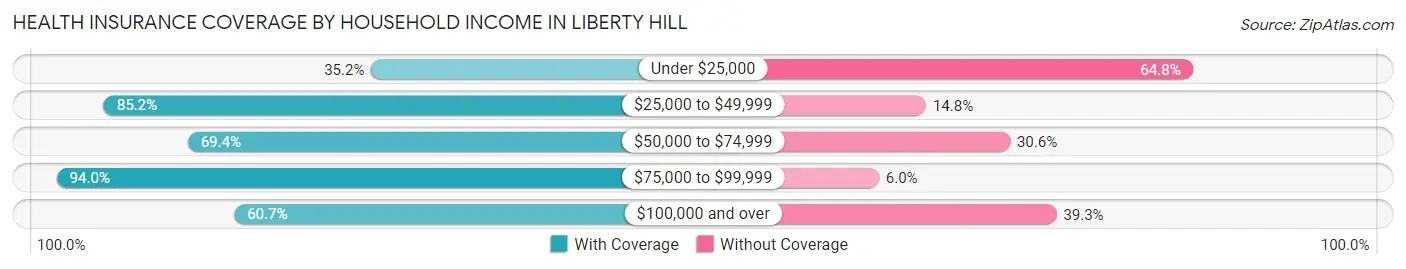
| Household Income | With Coverage | Without Coverage |
| Under $25,000 | 37 (35.2%) | 68 (64.8%) |
| $25,000 to $49,999 | 763 (85.2%) | 133 (14.8%) |
| $50,000 to $74,999 | 595 (69.4%) | 262 (30.6%) |
| $75,000 to $99,999 | 1,111 (94.0%) | 71 (6.0%) |
| $100,000 and over | 1,306 (60.7%) | 845 (39.3%) |
Public vs Private Health Insurance Coverage by Age in Liberty Hill
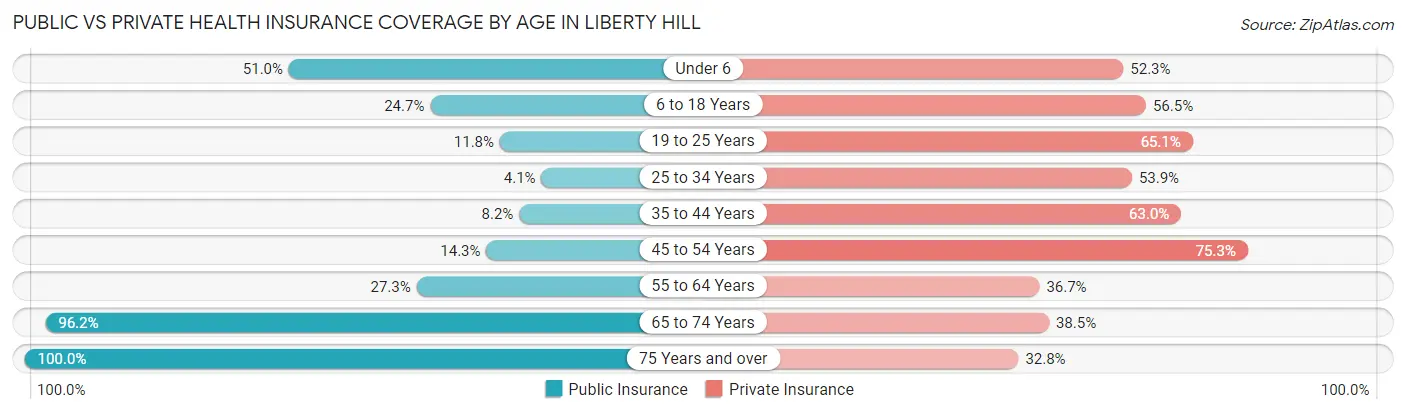
| Age Bracket | Public Insurance | Private Insurance |
| Under 6 | 350 (50.9%) | 359 (52.3%) |
| 6 to 18 Years | 281 (24.7%) | 642 (56.5%) |
| 19 to 25 Years | 74 (11.8%) | 409 (65.1%) |
| 25 to 34 Years | 29 (4.1%) | 384 (53.9%) |
| 35 to 44 Years | 66 (8.2%) | 507 (63.0%) |
| 45 to 54 Years | 84 (14.3%) | 443 (75.3%) |
| 55 to 64 Years | 130 (27.3%) | 175 (36.7%) |
| 65 to 74 Years | 100 (96.2%) | 40 (38.5%) |
| 75 Years and over | 61 (100.0%) | 20 (32.8%) |
| Total | 1,175 (22.6%) | 2,979 (57.3%) |
Disability Status by Sex by Age in Liberty Hill
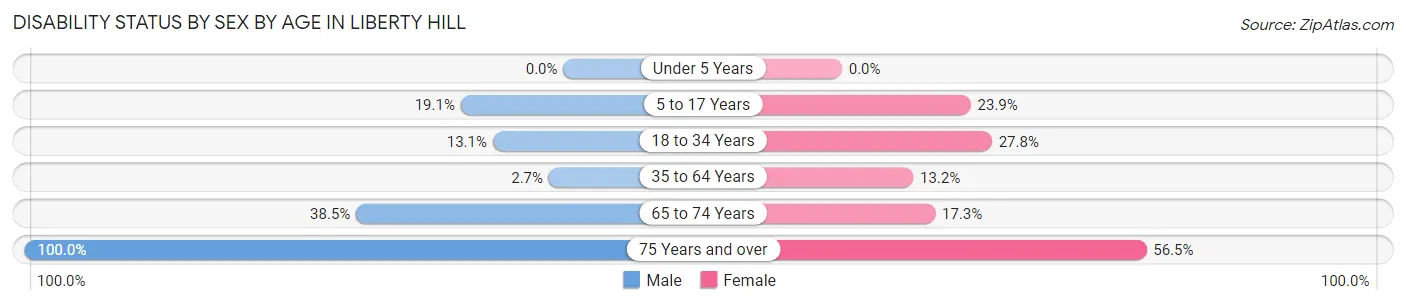
| Age Bracket | Male | Female |
| Under 5 Years | 0 (0.0%) | 0 (0.0%) |
| 5 to 17 Years | 108 (19.1%) | 115 (23.9%) |
| 18 to 34 Years | 95 (13.1%) | 199 (27.8%) |
| 35 to 64 Years | 18 (2.7%) | 159 (13.2%) |
| 65 to 74 Years | 20 (38.5%) | 9 (17.3%) |
| 75 Years and over | 15 (100.0%) | 26 (56.5%) |
Disability Class by Sex by Age in Liberty Hill
Disability Class: Hearing Difficulty
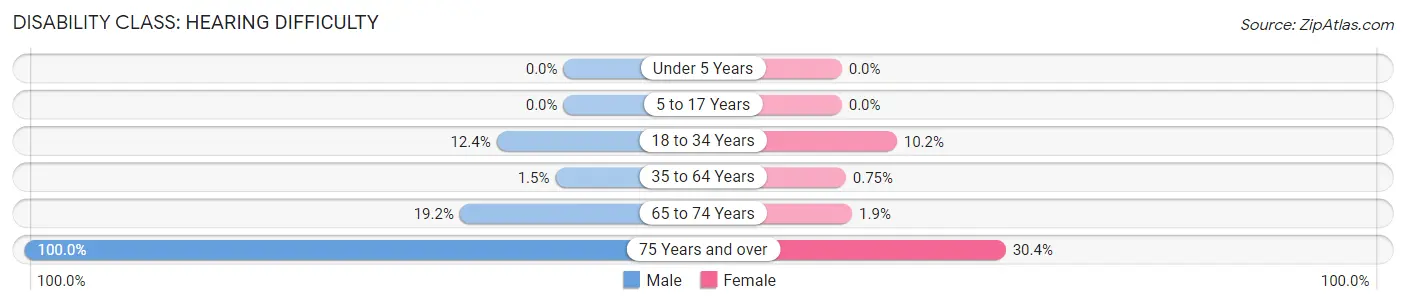
| Age Bracket | Male | Female |
| Under 5 Years | 0 (0.0%) | 0 (0.0%) |
| 5 to 17 Years | 0 (0.0%) | 0 (0.0%) |
| 18 to 34 Years | 90 (12.4%) | 73 (10.2%) |
| 35 to 64 Years | 10 (1.5%) | 9 (0.7%) |
| 65 to 74 Years | 10 (19.2%) | 1 (1.9%) |
| 75 Years and over | 15 (100.0%) | 14 (30.4%) |
Disability Class: Vision Difficulty
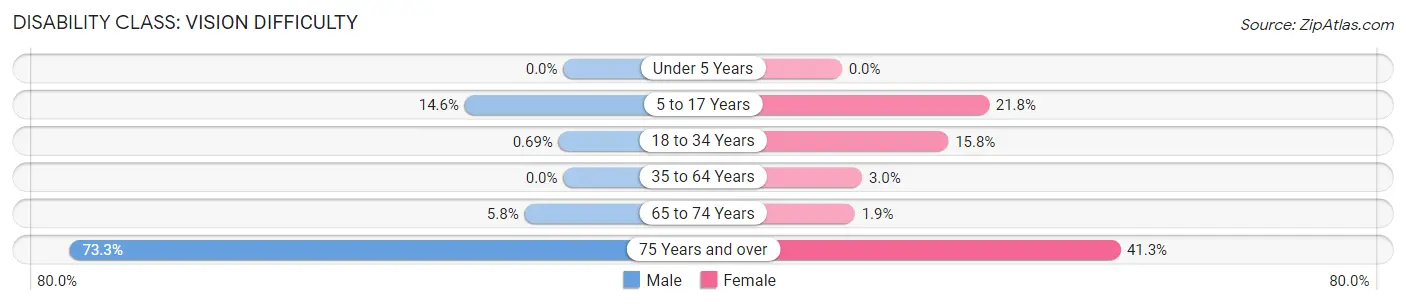
| Age Bracket | Male | Female |
| Under 5 Years | 0 (0.0%) | 0 (0.0%) |
| 5 to 17 Years | 83 (14.6%) | 105 (21.8%) |
| 18 to 34 Years | 5 (0.7%) | 113 (15.8%) |
| 35 to 64 Years | 0 (0.0%) | 36 (3.0%) |
| 65 to 74 Years | 3 (5.8%) | 1 (1.9%) |
| 75 Years and over | 11 (73.3%) | 19 (41.3%) |
Disability Class: Cognitive Difficulty
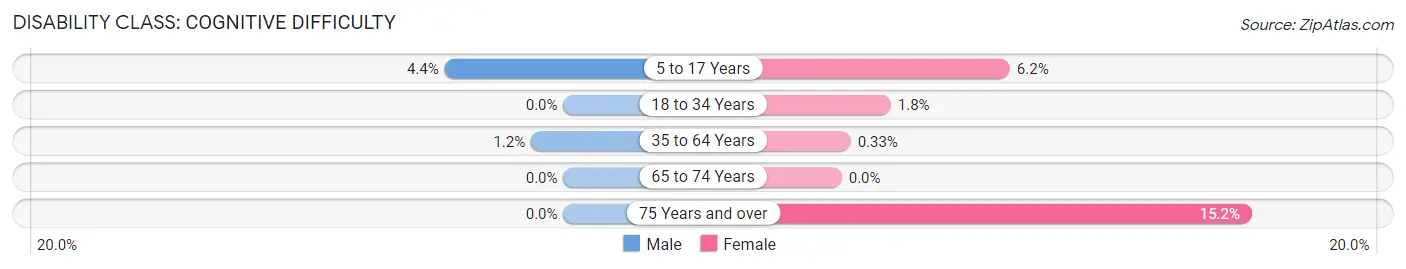
| Age Bracket | Male | Female |
| 5 to 17 Years | 25 (4.4%) | 30 (6.2%) |
| 18 to 34 Years | 0 (0.0%) | 13 (1.8%) |
| 35 to 64 Years | 8 (1.2%) | 4 (0.3%) |
| 65 to 74 Years | 0 (0.0%) | 0 (0.0%) |
| 75 Years and over | 0 (0.0%) | 7 (15.2%) |
Disability Class: Ambulatory Difficulty
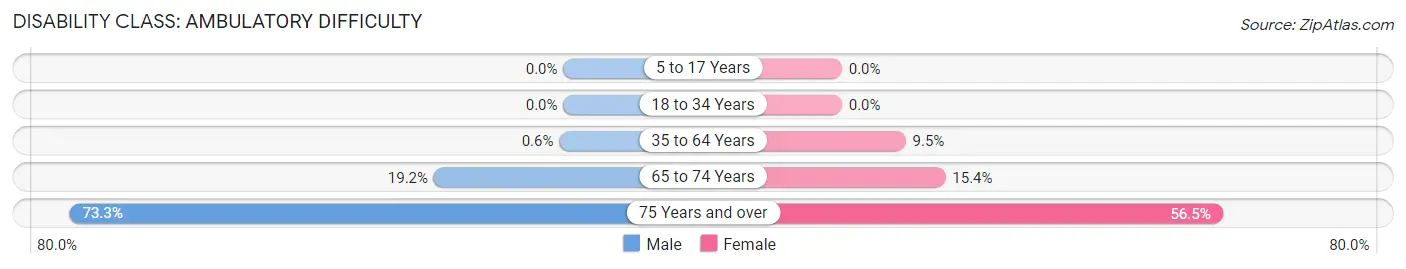
| Age Bracket | Male | Female |
| 5 to 17 Years | 0 (0.0%) | 0 (0.0%) |
| 18 to 34 Years | 0 (0.0%) | 0 (0.0%) |
| 35 to 64 Years | 4 (0.6%) | 114 (9.5%) |
| 65 to 74 Years | 10 (19.2%) | 8 (15.4%) |
| 75 Years and over | 11 (73.3%) | 26 (56.5%) |
Disability Class: Self-Care Difficulty
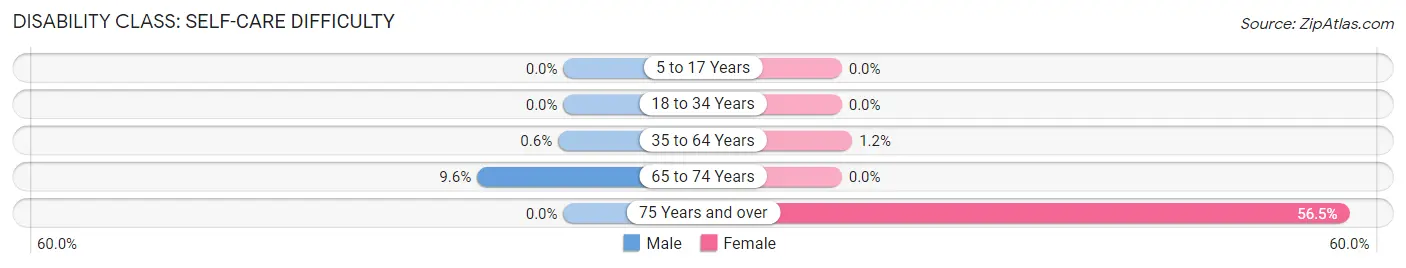
| Age Bracket | Male | Female |
| 5 to 17 Years | 0 (0.0%) | 0 (0.0%) |
| 18 to 34 Years | 0 (0.0%) | 0 (0.0%) |
| 35 to 64 Years | 4 (0.6%) | 14 (1.2%) |
| 65 to 74 Years | 5 (9.6%) | 0 (0.0%) |
| 75 Years and over | 0 (0.0%) | 26 (56.5%) |
Technology Access in Liberty Hill
Computing Device Access in Liberty Hill
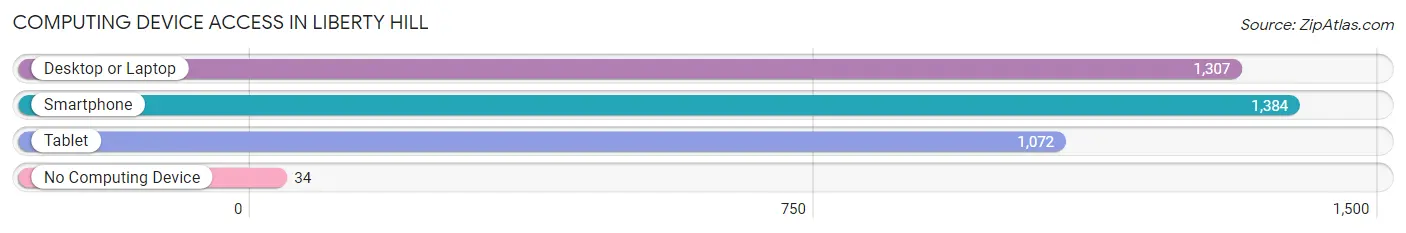
| Device Type | # Households | % Households |
| Desktop or Laptop | 1,307 | 90.3% |
| Smartphone | 1,384 | 95.7% |
| Tablet | 1,072 | 74.1% |
| No Computing Device | 34 | 2.4% |
| Total | 1,447 | 100.0% |
Internet Access in Liberty Hill
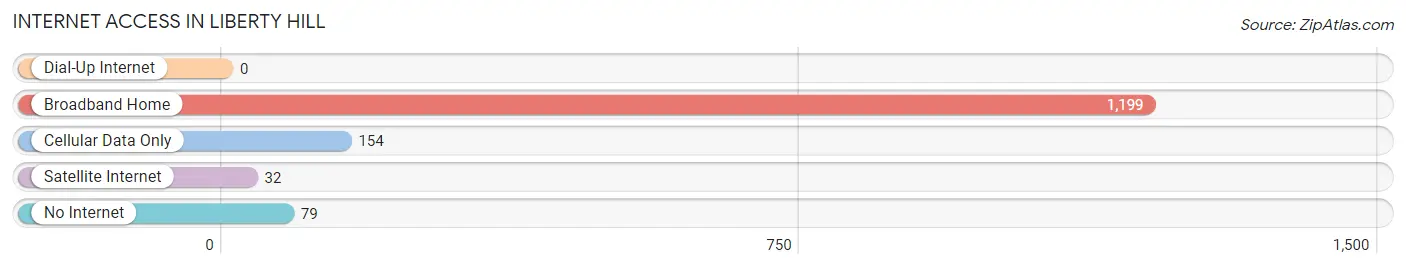
| Internet Type | # Households | % Households |
| Dial-Up Internet | 0 | 0.0% |
| Broadband Home | 1,199 | 82.9% |
| Cellular Data Only | 154 | 10.6% |
| Satellite Internet | 32 | 2.2% |
| No Internet | 79 | 5.5% |
| Total | 1,447 | 100.0% |
Liberty Hill Summary
Liberty Hill is a small town located in Williamson County, Texas, United States. The population was 1,362 at the 2010 census. It is part of the Austin–Round Rock–San Marcos metropolitan area.
History
The area that is now Liberty Hill was first settled in the 1850s by German and Irish immigrants. The town was originally called “Gum Grove” after the abundance of gum trees in the area. In 1876, the town was renamed Liberty Hill after the local school district.
The town was officially incorporated in 1882 and the first post office was established in 1883. The town grew slowly but steadily over the years, and by the early 1900s, it had become a thriving agricultural community.
Geography
Liberty Hill is located at 30°41'25" North, 97°56'45" West (30.690278, -97.945556). It is situated on the western edge of Williamson County, about 25 miles northwest of Austin.
The town is located in the Hill Country region of Texas, and is surrounded by rolling hills and limestone outcroppings. The terrain is mostly flat, with some areas of gently rolling hills. The climate is generally mild, with hot summers and mild winters.
Economy
The economy of Liberty Hill is largely based on agriculture and tourism. The town is home to several farms and ranches, as well as a number of wineries and vineyards. The town also has a thriving retail sector, with several small businesses and restaurants.
The town is also home to several manufacturing companies, including a plastics factory and a metal fabrication plant.
Demographics
As of the 2010 census, the population of Liberty Hill was 1,362. The racial makeup of the town was 87.3% White, 5.2% Hispanic or Latino, 4.2% African American, 0.7% Native American, 0.3% Asian, and 2.5% from other races.
The median household income in Liberty Hill was $50,938, and the median family income was $58,750. The per capita income was $22,945. About 8.3% of families and 10.2% of the population were below the poverty line.
Conclusion
Liberty Hill is a small town located in Williamson County, Texas. It has a long history, dating back to the 1850s, and is home to a thriving agricultural and tourism economy. The population of Liberty Hill is largely white, with a small percentage of African American, Hispanic or Latino, Native American, and Asian residents. The median household income is slightly above the national average, and the per capita income is slightly below the national average.
Common Questions
What is Per Capita Income in Liberty Hill?
Per Capita income in Liberty Hill is $24,682.
What is the Median Family Income in Liberty Hill?
Median Family Income in Liberty Hill is $96,026.
What is the Median Household income in Liberty Hill?
Median Household Income in Liberty Hill is $93,198.
What is Income or Wage Gap in Liberty Hill?
Income or Wage Gap in Liberty Hill is 26.4%.
Women in Liberty Hill earn 73.6 cents for every dollar earned by a man.
What is Family Income Deficit in Liberty Hill?
Family Income Deficit in Liberty Hill is $4,882.
Families that are below poverty line in Liberty Hill earn $4,882 less on average than the poverty threshold level.
What is Inequality or Gini Index in Liberty Hill?
Inequality or Gini Index in Liberty Hill is 0.26.
What is the Total Population of Liberty Hill?
Total Population of Liberty Hill is 5,265.
What is the Total Male Population of Liberty Hill?
Total Male Population of Liberty Hill is 2,240.
What is the Total Female Population of Liberty Hill?
Total Female Population of Liberty Hill is 3,025.
What is the Ratio of Males per 100 Females in Liberty Hill?
There are 74.05 Males per 100 Females in Liberty Hill.
What is the Ratio of Females per 100 Males in Liberty Hill?
There are 135.04 Females per 100 Males in Liberty Hill.
What is the Median Population Age in Liberty Hill?
Median Population Age in Liberty Hill is 27.4 Years.
What is the Average Family Size in Liberty Hill
Average Family Size in Liberty Hill is 3.7 People.
What is the Average Household Size in Liberty Hill
Average Household Size in Liberty Hill is 3.6 People.
How Large is the Labor Force in Liberty Hill?
There are 2,738 People in the Labor Forcein in Liberty Hill.
What is the Percentage of People in the Labor Force in Liberty Hill?
71.9% of People are in the Labor Force in Liberty Hill.
What is the Unemployment Rate in Liberty Hill?
Unemployment Rate in Liberty Hill is 10.5%.