Leming, TX Map & Demographics
Leming Map
Leming Overview
$20,269
PER CAPITA INCOME
$94,226
AVG FAMILY INCOME
$93,155
AVG HOUSEHOLD INCOME
45.8%
WAGE / INCOME GAP [ % ]
54.2¢/ $1
WAGE / INCOME GAP [ $ ]
0.31
INEQUALITY / GINI INDEX
1,168
TOTAL POPULATION
646
MALE POPULATION
522
FEMALE POPULATION
123.75
MALES / 100 FEMALES
80.80
FEMALES / 100 MALES
18.9
MEDIAN AGE
5.2
AVG FAMILY SIZE
4.6
AVG HOUSEHOLD SIZE
590
LABOR FORCE [ PEOPLE ]
77.0%
PERCENT IN LABOR FORCE
10.8%
UNEMPLOYMENT RATE
Leming Zip Codes
Leming Area Codes
Income in Leming
Income Overview in Leming
Per Capita Income in Leming is $20,269, while median incomes of families and households are $94,226 and $93,155 respectively.
| Characteristic | Number | Measure |
| Per Capita Income | 1,168 | $20,269 |
| Median Family Income | 216 | $94,226 |
| Mean Family Income | 216 | $106,589 |
| Median Household Income | 252 | $93,155 |
| Mean Household Income | 252 | $92,568 |
| Income Deficit | 216 | $0 |
| Wage / Income Gap (%) | 1,168 | 45.83% |
| Wage / Income Gap ($) | 1,168 | 54.17¢ per $1 |
| Gini / Inequality Index | 1,168 | 0.31 |
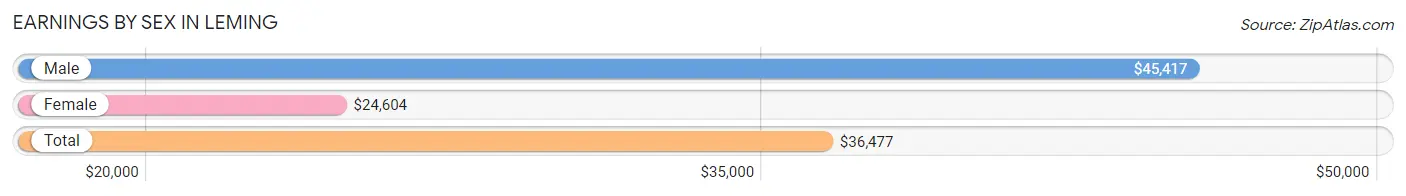
Earnings by Sex in Leming
Average Earnings in Leming are $36,477, $45,417 for men and $24,604 for women, a difference of 45.8%.
| Sex | Number | Average Earnings |
| Male | 275 (48.8%) | $45,417 |
| Female | 289 (51.2%) | $24,604 |
| Total | 564 (100.0%) | $36,477 |
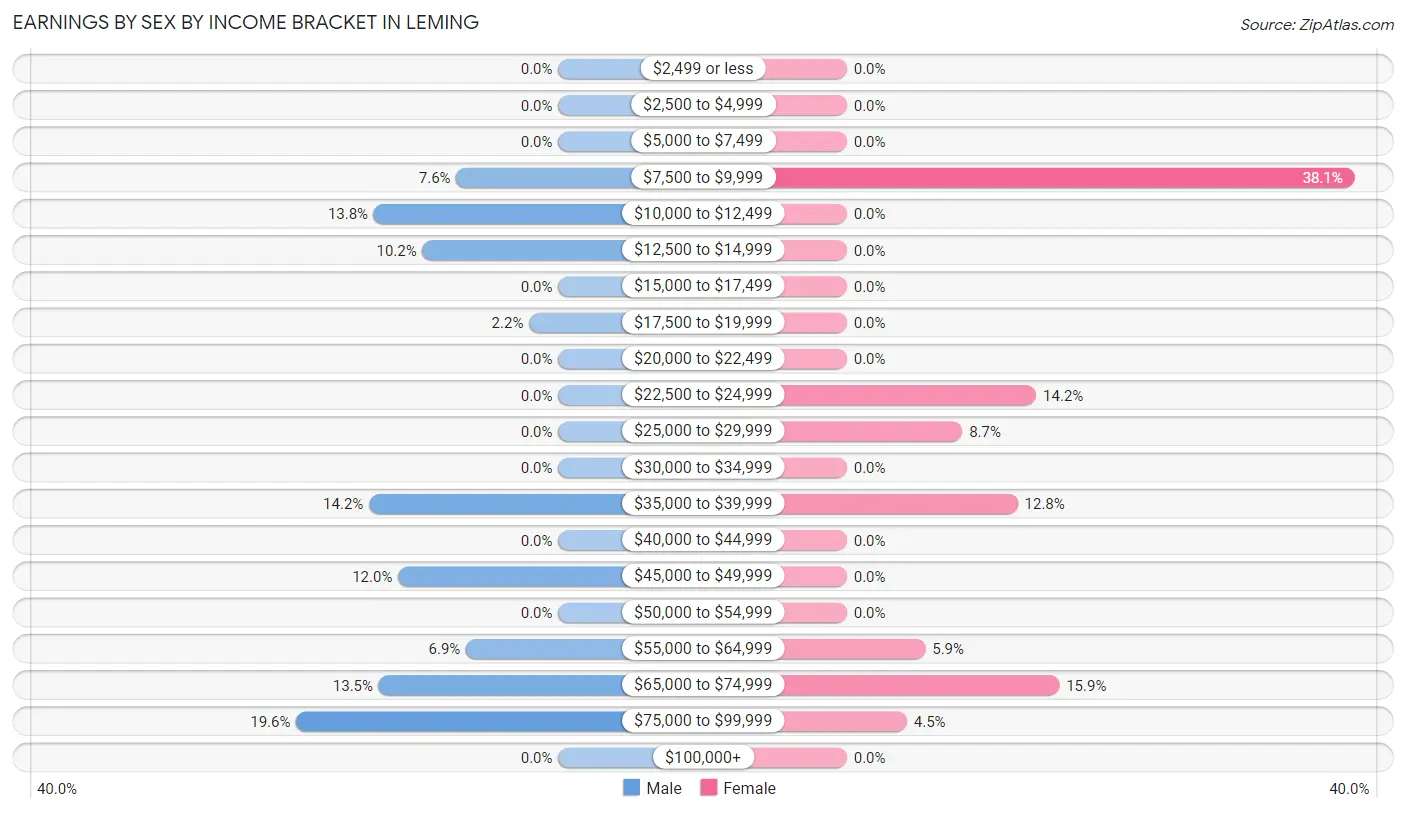
Earnings by Sex by Income Bracket in Leming
The most common earnings brackets in Leming are $75,000 to $99,999 for men (54 | 19.6%) and $7,500 to $9,999 for women (110 | 38.1%).
| Income | Male | Female |
| $2,499 or less | 0 (0.0%) | 0 (0.0%) |
| $2,500 to $4,999 | 0 (0.0%) | 0 (0.0%) |
| $5,000 to $7,499 | 0 (0.0%) | 0 (0.0%) |
| $7,500 to $9,999 | 21 (7.6%) | 110 (38.1%) |
| $10,000 to $12,499 | 38 (13.8%) | 0 (0.0%) |
| $12,500 to $14,999 | 28 (10.2%) | 0 (0.0%) |
| $15,000 to $17,499 | 0 (0.0%) | 0 (0.0%) |
| $17,500 to $19,999 | 6 (2.2%) | 0 (0.0%) |
| $20,000 to $22,499 | 0 (0.0%) | 0 (0.0%) |
| $22,500 to $24,999 | 0 (0.0%) | 41 (14.2%) |
| $25,000 to $29,999 | 0 (0.0%) | 25 (8.6%) |
| $30,000 to $34,999 | 0 (0.0%) | 0 (0.0%) |
| $35,000 to $39,999 | 39 (14.2%) | 37 (12.8%) |
| $40,000 to $44,999 | 0 (0.0%) | 0 (0.0%) |
| $45,000 to $49,999 | 33 (12.0%) | 0 (0.0%) |
| $50,000 to $54,999 | 0 (0.0%) | 0 (0.0%) |
| $55,000 to $64,999 | 19 (6.9%) | 17 (5.9%) |
| $65,000 to $74,999 | 37 (13.5%) | 46 (15.9%) |
| $75,000 to $99,999 | 54 (19.6%) | 13 (4.5%) |
| $100,000+ | 0 (0.0%) | 0 (0.0%) |
| Total | 275 (100.0%) | 289 (100.0%) |
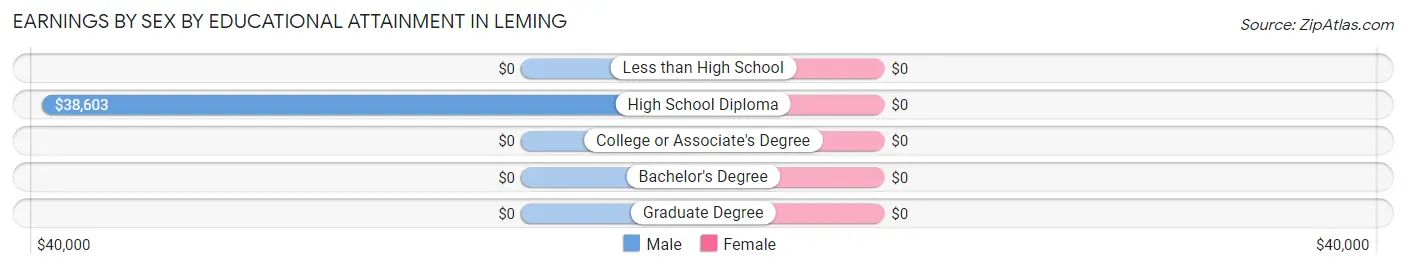
Earnings by Sex by Educational Attainment in Leming
| Educational Attainment | Male Income | Female Income |
| Less than High School | - | - |
| High School Diploma | $38,603 | $0 |
| College or Associate's Degree | - | - |
| Bachelor's Degree | - | - |
| Graduate Degree | - | - |
| Total | $46,477 | $39,088 |
Family Income in Leming
Family Income Brackets in Leming
According to the Leming family income data, there are 64 families falling into the $75,000 to $99,999 income range, which is the most common income bracket and makes up 29.6% of all families.
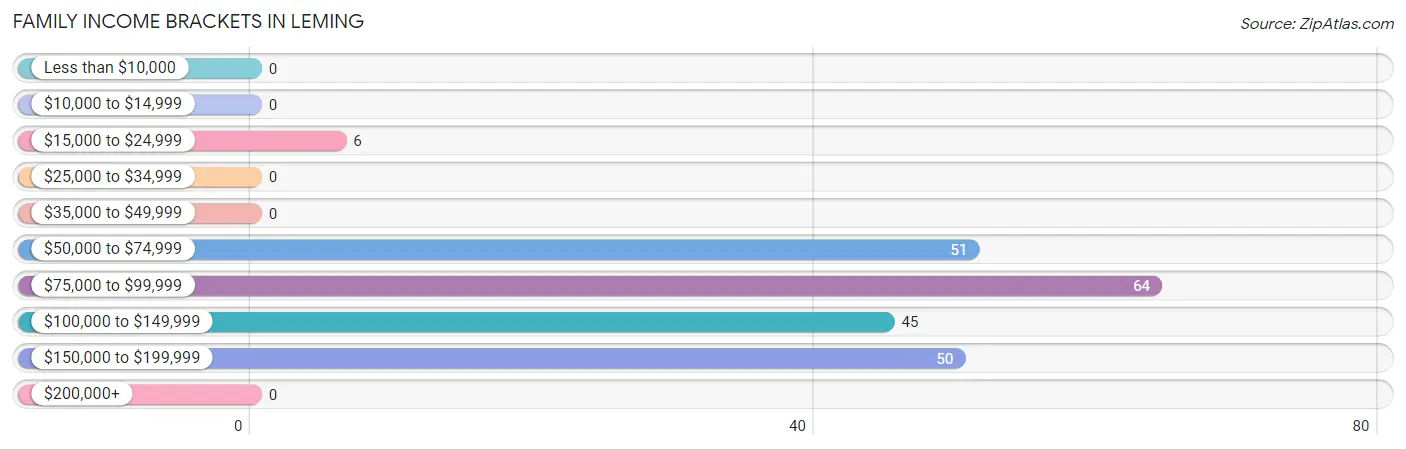
| Income Bracket | # Families | % Families |
| Less than $10,000 | 0 | 0.0% |
| $10,000 to $14,999 | 0 | 0.0% |
| $15,000 to $24,999 | 6 | 2.8% |
| $25,000 to $34,999 | 0 | 0.0% |
| $35,000 to $49,999 | 0 | 0.0% |
| $50,000 to $74,999 | 51 | 23.6% |
| $75,000 to $99,999 | 64 | 29.6% |
| $100,000 to $149,999 | 45 | 20.8% |
| $150,000 to $199,999 | 50 | 23.1% |
| $200,000+ | 0 | 0.0% |
Family Income by Famaliy Size in Leming
4-person families (43 | 19.9%) account for the highest median family income in Leming with $107,875 per family, while 2-person families (54 | 25.0%) have the highest median income of $46,534 per family member.
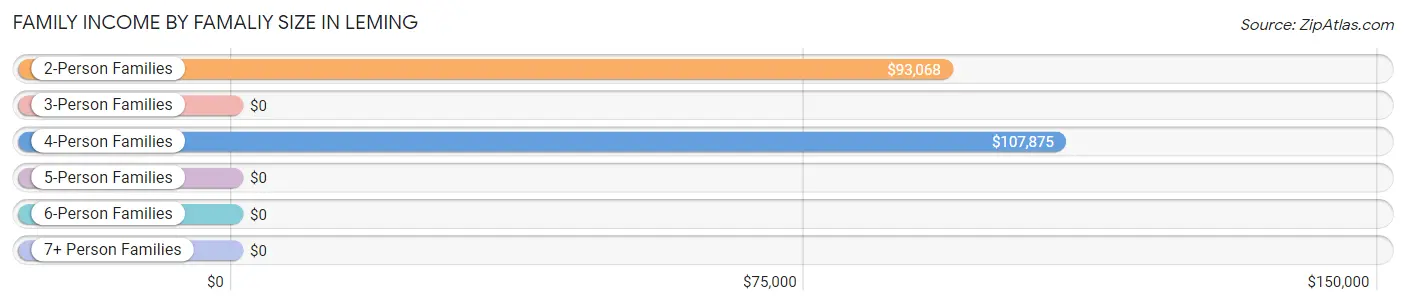
| Income Bracket | # Families | Median Income |
| 2-Person Families | 54 (25.0%) | $93,068 |
| 3-Person Families | 51 (23.6%) | $0 |
| 4-Person Families | 43 (19.9%) | $107,875 |
| 5-Person Families | 37 (17.1%) | $0 |
| 6-Person Families | 0 (0.0%) | $0 |
| 7+ Person Families | 31 (14.3%) | $0 |
| Total | 216 (100.0%) | $94,226 |
Family Income by Number of Earners in Leming
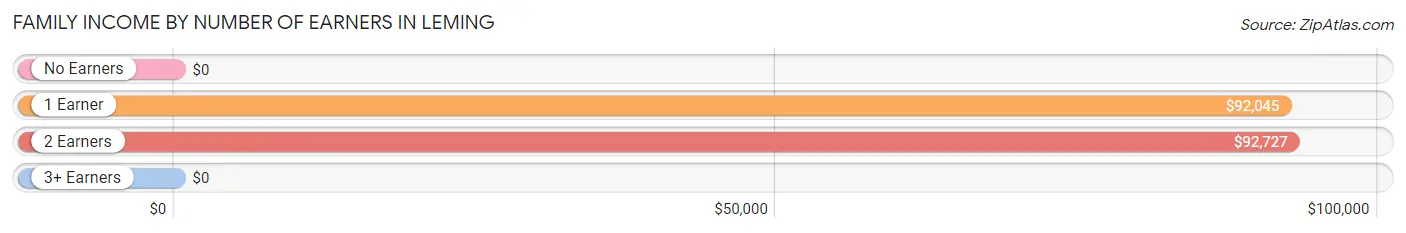
| Number of Earners | # Families | Median Income |
| No Earners | 0 (0.0%) | $0 |
| 1 Earner | 48 (22.2%) | $92,045 |
| 2 Earners | 106 (49.1%) | $92,727 |
| 3+ Earners | 62 (28.7%) | $0 |
| Total | 216 (100.0%) | $94,226 |
Household Income in Leming
Household Income Brackets in Leming
With 64 households falling in the category, the $75,000 to $99,999 income range is the most frequent in Leming, accounting for 25.4% of all households.
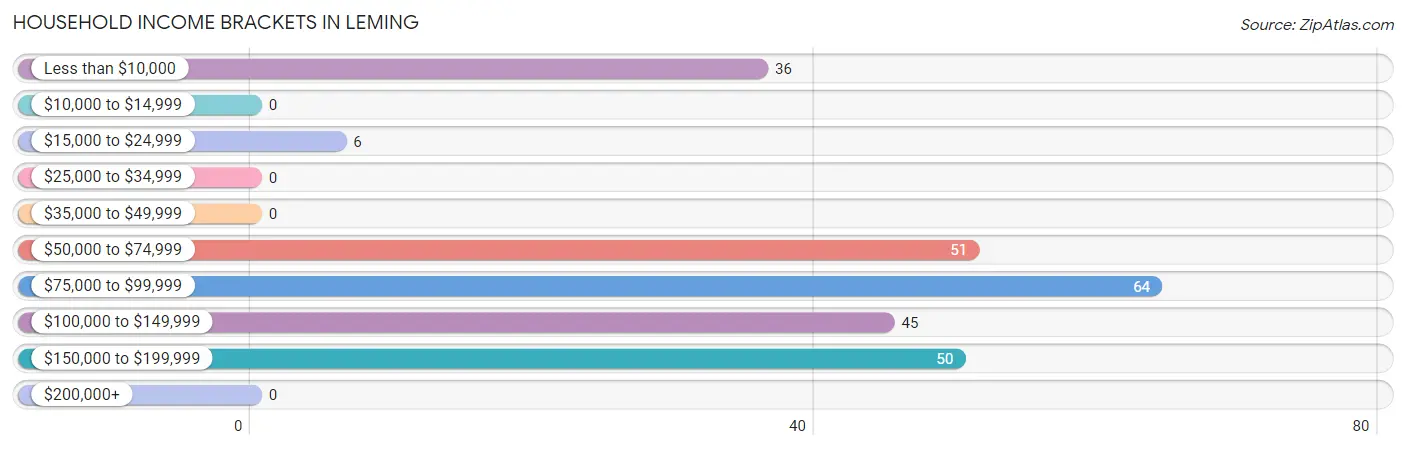
| Income Bracket | # Households | % Households |
| Less than $10,000 | 36 | 14.3% |
| $10,000 to $14,999 | 0 | 0.0% |
| $15,000 to $24,999 | 6 | 2.4% |
| $25,000 to $34,999 | 0 | 0.0% |
| $35,000 to $49,999 | 0 | 0.0% |
| $50,000 to $74,999 | 51 | 20.2% |
| $75,000 to $99,999 | 64 | 25.4% |
| $100,000 to $149,999 | 45 | 17.9% |
| $150,000 to $199,999 | 50 | 19.8% |
| $200,000+ | 0 | 0.0% |
Household Income by Householder Age in Leming
The median household income in Leming is $93,155, with the highest median household income of $150,135 found in the 25 to 44 years age bracket for the primary householder. A total of 96 households (38.1%) fall into this category.
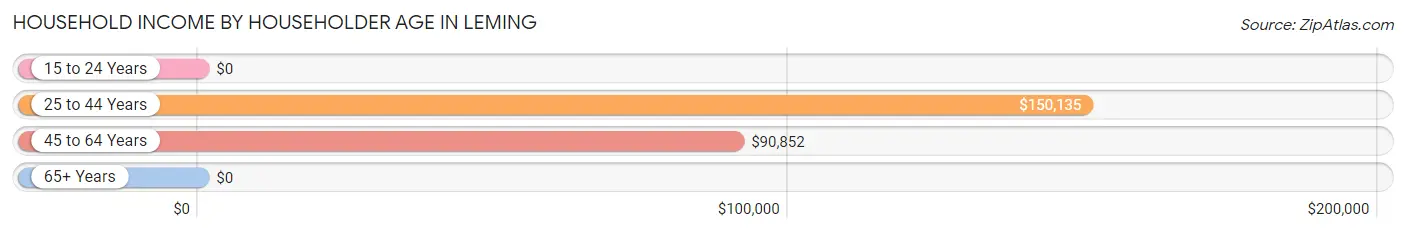
| Income Bracket | # Households | Median Income |
| 15 to 24 Years | 0 (0.0%) | $0 |
| 25 to 44 Years | 96 (38.1%) | $150,135 |
| 45 to 64 Years | 123 (48.8%) | $90,852 |
| 65+ Years | 33 (13.1%) | $0 |
| Total | 252 (100.0%) | $93,155 |
Poverty in Leming
Income Below Poverty by Sex and Age in Leming
With 11.8% poverty level for males and 12.8% for females among the residents of Leming, 5 year old males and 65 to 74 year old females are the most vulnerable to poverty, with 13 males (100.0%) and 15 females (100.0%) in their respective age groups living below the poverty level.
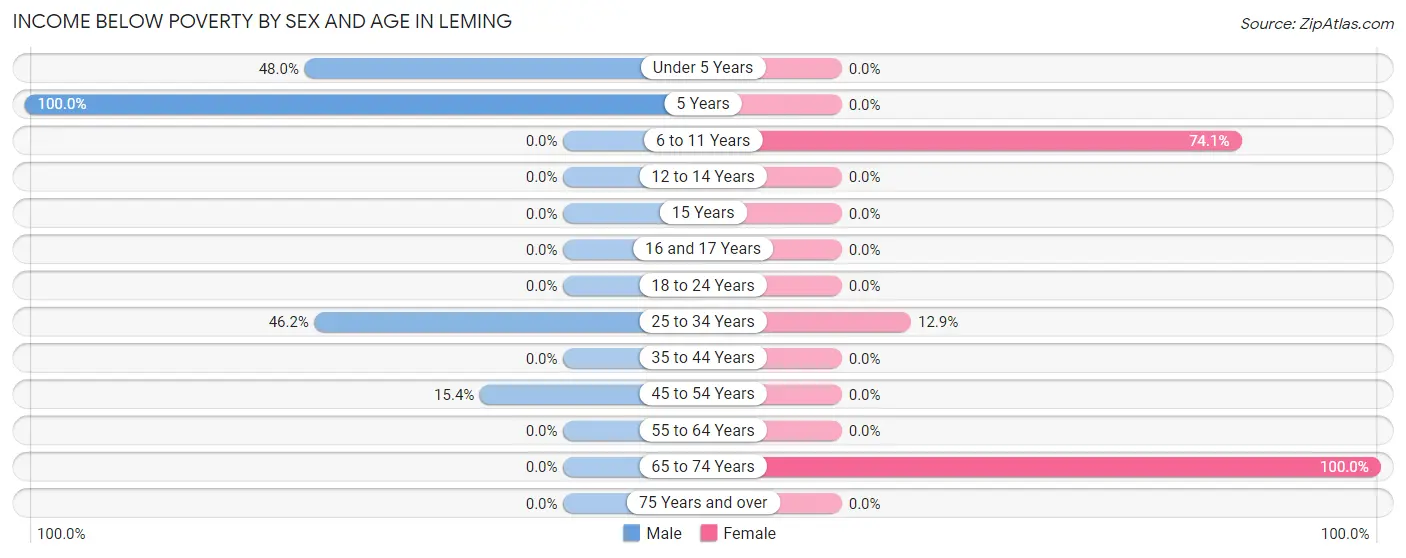
| Age Bracket | Male | Female |
| Under 5 Years | 36 (48.0%) | 0 (0.0%) |
| 5 Years | 13 (100.0%) | 0 (0.0%) |
| 6 to 11 Years | 0 (0.0%) | 43 (74.1%) |
| 12 to 14 Years | 0 (0.0%) | 0 (0.0%) |
| 15 Years | 0 (0.0%) | 0 (0.0%) |
| 16 and 17 Years | 0 (0.0%) | 0 (0.0%) |
| 18 to 24 Years | 0 (0.0%) | 0 (0.0%) |
| 25 to 34 Years | 6 (46.2%) | 9 (12.9%) |
| 35 to 44 Years | 0 (0.0%) | 0 (0.0%) |
| 45 to 54 Years | 21 (15.4%) | 0 (0.0%) |
| 55 to 64 Years | 0 (0.0%) | 0 (0.0%) |
| 65 to 74 Years | 0 (0.0%) | 15 (100.0%) |
| 75 Years and over | 0 (0.0%) | 0 (0.0%) |
| Total | 76 (11.8%) | 67 (12.8%) |
Income Above Poverty by Sex and Age in Leming
According to the poverty statistics in Leming, males aged 6 to 11 years and females aged 12 to 14 years are the age groups that are most secure financially, with 100.0% of males and 100.0% of females in these age groups living above the poverty line.
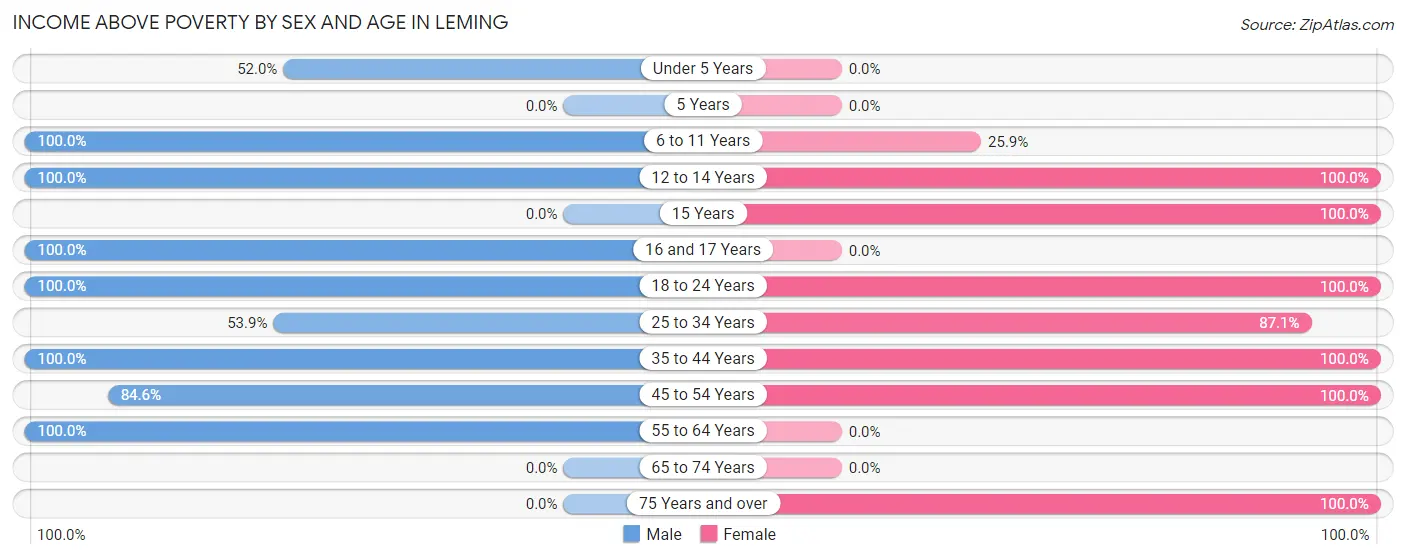
| Age Bracket | Male | Female |
| Under 5 Years | 39 (52.0%) | 0 (0.0%) |
| 5 Years | 0 (0.0%) | 0 (0.0%) |
| 6 to 11 Years | 43 (100.0%) | 15 (25.9%) |
| 12 to 14 Years | 162 (100.0%) | 15 (100.0%) |
| 15 Years | 0 (0.0%) | 36 (100.0%) |
| 16 and 17 Years | 78 (100.0%) | 0 (0.0%) |
| 18 to 24 Years | 28 (100.0%) | 110 (100.0%) |
| 25 to 34 Years | 7 (53.8%) | 61 (87.1%) |
| 35 to 44 Years | 79 (100.0%) | 66 (100.0%) |
| 45 to 54 Years | 115 (84.6%) | 92 (100.0%) |
| 55 to 64 Years | 19 (100.0%) | 0 (0.0%) |
| 65 to 74 Years | 0 (0.0%) | 0 (0.0%) |
| 75 Years and over | 0 (0.0%) | 60 (100.0%) |
| Total | 570 (88.2%) | 455 (87.2%) |
Income Below Poverty Among Married-Couple Families in Leming
The poverty statistics for married-couple families in Leming show that 3.0% or 6 of the total 198 families live below the poverty line. Families with 5 or more children have the highest poverty rate of 100.0%, comprising of 6 families. On the other hand, families with no children have the lowest poverty rate of 0.0%, which includes 0 families.
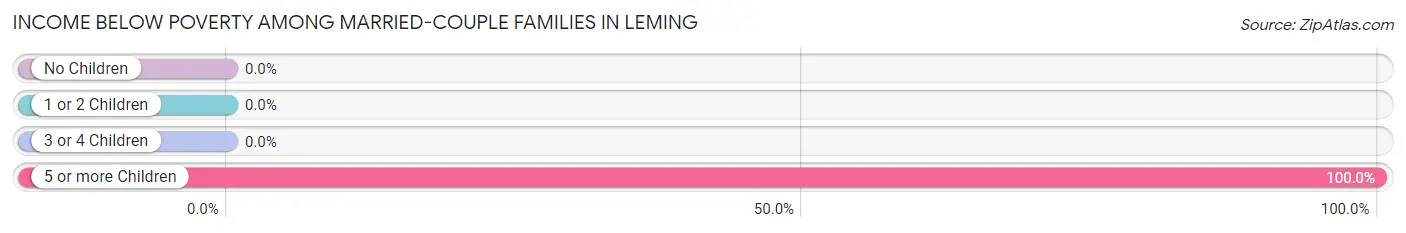
| Children | Above Poverty | Below Poverty |
| No Children | 54 (100.0%) | 0 (0.0%) |
| 1 or 2 Children | 113 (100.0%) | 0 (0.0%) |
| 3 or 4 Children | 25 (100.0%) | 0 (0.0%) |
| 5 or more Children | 0 (0.0%) | 6 (100.0%) |
| Total | 192 (97.0%) | 6 (3.0%) |
Income Below Poverty Among Single-Parent Households in Leming
| Children | Single Father | Single Mother |
| No Children | 0 (0.0%) | 0 (0.0%) |
| 1 or 2 Children | 0 (0.0%) | 0 (0.0%) |
| 3 or 4 Children | 0 (0.0%) | 0 (0.0%) |
| 5 or more Children | 0 (0.0%) | 0 (0.0%) |
| Total | 0 (0.0%) | 0 (0.0%) |
Income Below Poverty Among Married-Couple vs Single-Parent Households in Leming
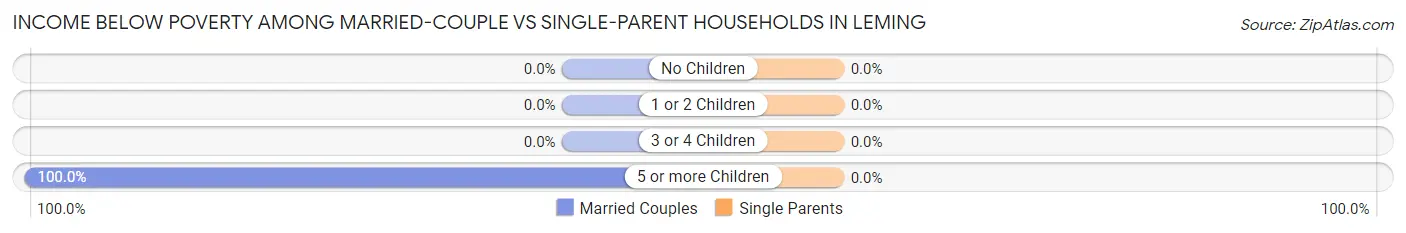
| Children | Married-Couple Families | Single-Parent Households |
| No Children | 0 (0.0%) | 0 (0.0%) |
| 1 or 2 Children | 0 (0.0%) | 0 (0.0%) |
| 3 or 4 Children | 0 (0.0%) | 0 (0.0%) |
| 5 or more Children | 6 (100.0%) | 0 (0.0%) |
| Total | 6 (3.0%) | 0 (0.0%) |
Race in Leming
The most populous races in Leming are White / Caucasian (756 | 64.7%), Hispanic or Latino (731 | 62.6%), and Two or more Races (412 | 35.3%).
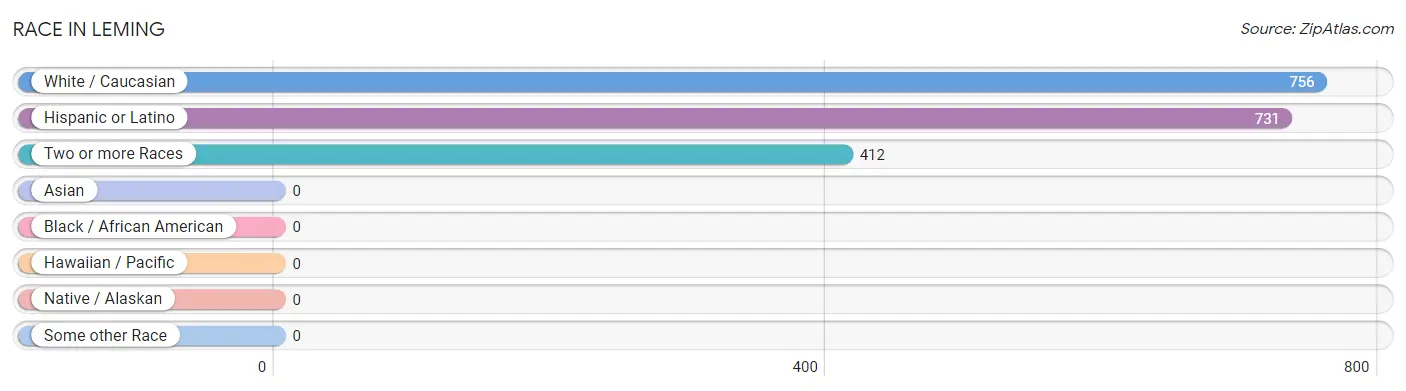
| Race | # Population | % Population |
| Asian | 0 | 0.0% |
| Black / African American | 0 | 0.0% |
| Hawaiian / Pacific | 0 | 0.0% |
| Hispanic or Latino | 731 | 62.6% |
| Native / Alaskan | 0 | 0.0% |
| White / Caucasian | 756 | 64.7% |
| Two or more Races | 412 | 35.3% |
| Some other Race | 0 | 0.0% |
| Total | 1,168 | 100.0% |
Ancestry in Leming
The most populous ancestries reported in Leming are Mexican (688 | 58.9%), English (71 | 6.1%), Czech (55 | 4.7%), Mexican American Indian (50 | 4.3%), and Danish (26 | 2.2%), together accounting for 76.2% of all Leming residents.
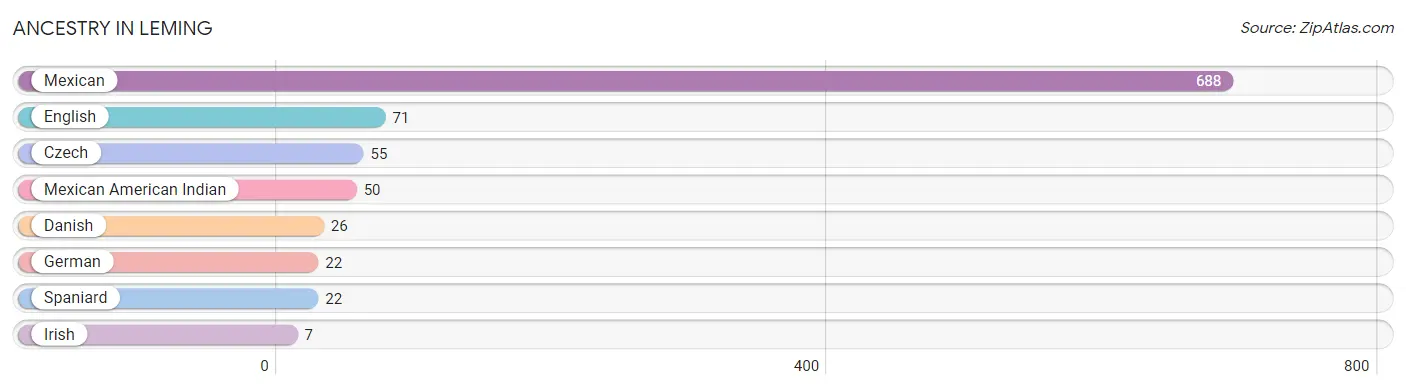
| Ancestry | # Population | % Population |
| Czech | 55 | 4.7% |
| Danish | 26 | 2.2% |
| English | 71 | 6.1% |
| German | 22 | 1.9% |
| Irish | 7 | 0.6% |
| Mexican | 688 | 58.9% |
| Mexican American Indian | 50 | 4.3% |
| Spaniard | 22 | 1.9% | View All 8 Rows |
Immigrants in Leming
The most numerous immigrant groups reported in Leming came from Central America (20 | 1.7%), Latin America (20 | 1.7%), and Mexico (20 | 1.7%), together accounting for 5.1% of all Leming residents.
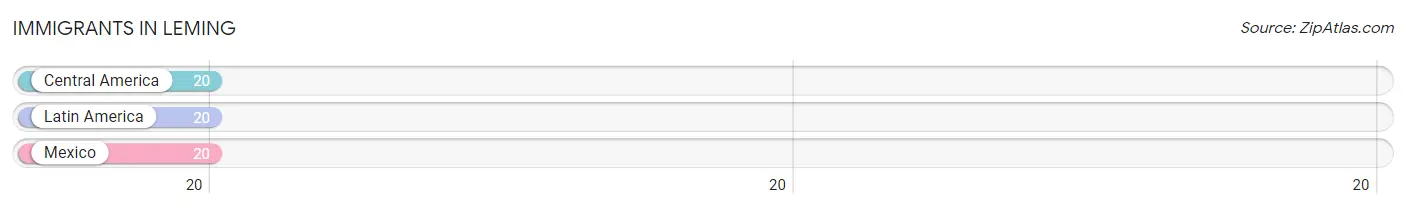
| Immigration Origin | # Population | % Population |
| Central America | 20 | 1.7% |
| Latin America | 20 | 1.7% |
| Mexico | 20 | 1.7% | View All 3 Rows |
Sex and Age in Leming
Sex and Age in Leming
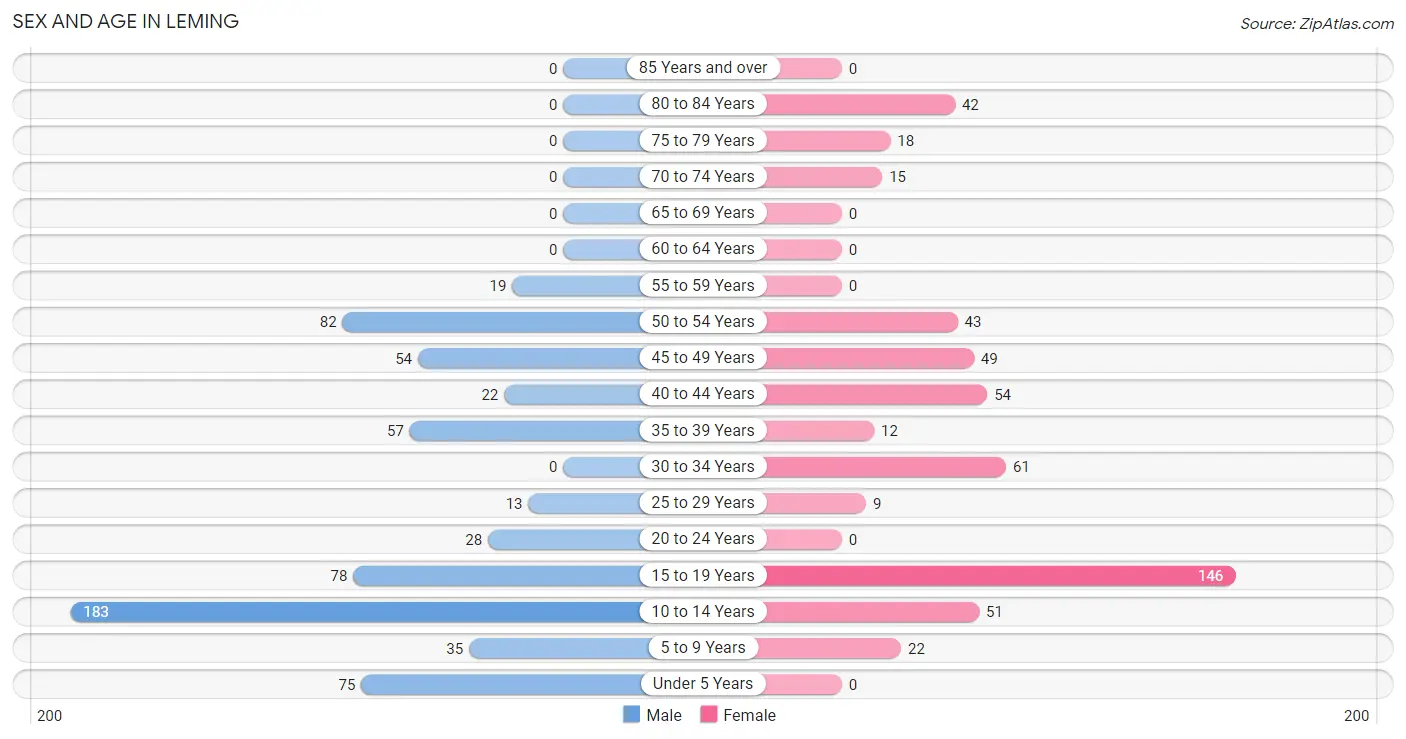
The most populous age groups in Leming are 10 to 14 Years (183 | 28.3%) for men and 15 to 19 Years (146 | 28.0%) for women.
| Age Bracket | Male | Female |
| Under 5 Years | 75 (11.6%) | 0 (0.0%) |
| 5 to 9 Years | 35 (5.4%) | 22 (4.2%) |
| 10 to 14 Years | 183 (28.3%) | 51 (9.8%) |
| 15 to 19 Years | 78 (12.1%) | 146 (28.0%) |
| 20 to 24 Years | 28 (4.3%) | 0 (0.0%) |
| 25 to 29 Years | 13 (2.0%) | 9 (1.7%) |
| 30 to 34 Years | 0 (0.0%) | 61 (11.7%) |
| 35 to 39 Years | 57 (8.8%) | 12 (2.3%) |
| 40 to 44 Years | 22 (3.4%) | 54 (10.3%) |
| 45 to 49 Years | 54 (8.4%) | 49 (9.4%) |
| 50 to 54 Years | 82 (12.7%) | 43 (8.2%) |
| 55 to 59 Years | 19 (2.9%) | 0 (0.0%) |
| 60 to 64 Years | 0 (0.0%) | 0 (0.0%) |
| 65 to 69 Years | 0 (0.0%) | 0 (0.0%) |
| 70 to 74 Years | 0 (0.0%) | 15 (2.9%) |
| 75 to 79 Years | 0 (0.0%) | 18 (3.5%) |
| 80 to 84 Years | 0 (0.0%) | 42 (8.1%) |
| 85 Years and over | 0 (0.0%) | 0 (0.0%) |
| Total | 646 (100.0%) | 522 (100.0%) |
Families and Households in Leming
Median Family Size in Leming
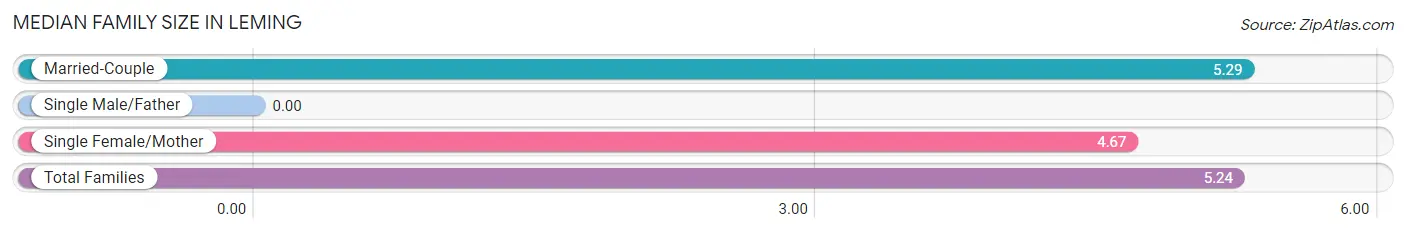
| Family Type | # Families | Family Size |
| Married-Couple | 198 (91.7%) | 5.29 |
| Single Male/Father | 0 (0.0%) | - |
| Single Female/Mother | 18 (8.3%) | 4.67 |
| Total Families | 216 (100.0%) | 5.24 |
Median Household Size in Leming
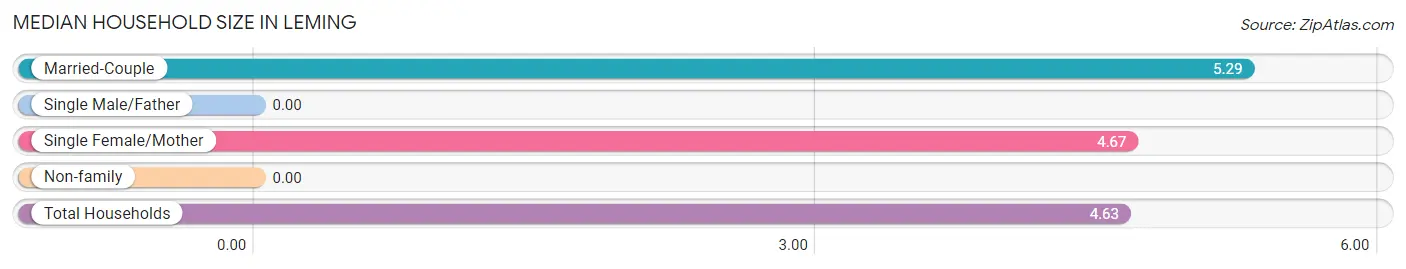
| Household Type | # Households | Household Size |
| Married-Couple | 198 (78.6%) | 5.29 |
| Single Male/Father | 0 (0.0%) | - |
| Single Female/Mother | 18 (7.1%) | 4.67 |
| Non-family | 36 (14.3%) | - |
| Total Households | 252 (100.0%) | 4.63 |
Household Size by Marriage Status in Leming
Out of a total of 252 households in Leming, 216 (85.7%) are family households, while 36 (14.3%) are nonfamily households. The most numerous type of family households are 2-person households, comprising 54, and the most common type of nonfamily households are 1-person households, comprising 36.
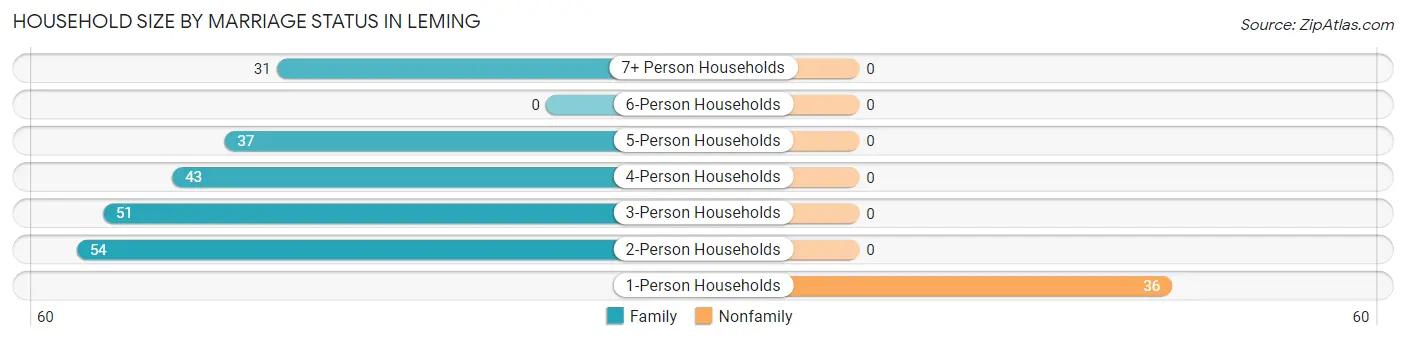
| Household Size | Family Households | Nonfamily Households |
| 1-Person Households | - | 36 (14.3%) |
| 2-Person Households | 54 (21.4%) | 0 (0.0%) |
| 3-Person Households | 51 (20.2%) | 0 (0.0%) |
| 4-Person Households | 43 (17.1%) | 0 (0.0%) |
| 5-Person Households | 37 (14.7%) | 0 (0.0%) |
| 6-Person Households | 0 (0.0%) | 0 (0.0%) |
| 7+ Person Households | 31 (12.3%) | 0 (0.0%) |
| Total | 216 (85.7%) | 36 (14.3%) |
Female Fertility in Leming
Fertility by Age in Leming
| Age Bracket | Women with Births | Births / 1,000 Women |
| 15 to 19 years | 0 (0.0%) | 0.0 |
| 20 to 34 years | 0 (0.0%) | 0.0 |
| 35 to 50 years | 0 (0.0%) | 0.0 |
| Total | 0 (0.0%) | 0.0 |
Fertility by Age by Marriage Status in Leming
| Age Bracket | Married | Unmarried |
| 15 to 19 years | 0 (0.0%) | 0 (0.0%) |
| 20 to 34 years | 0 (0.0%) | 0 (0.0%) |
| 35 to 50 years | 0 (0.0%) | 0 (0.0%) |
| Total | 0 (0.0%) | 0 (0.0%) |
Fertility by Education in Leming
| Educational Attainment | Women with Births | Births / 1,000 Women |
| Less than High School | 0 (0.0%) | 0.0 |
| High School Diploma | 0 (0.0%) | 0.0 |
| College or Associate's Degree | 0 (0.0%) | 0.0 |
| Bachelor's Degree | 0 (0.0%) | 0.0 |
| Graduate Degree | 0 (0.0%) | 0.0 |
| Total | 0 (0.0%) | 0.0 |
Fertility by Education by Marriage Status in Leming
| Educational Attainment | Married | Unmarried |
| Less than High School | 0 (0.0%) | 0 (0.0%) |
| High School Diploma | 0 (0.0%) | 0 (0.0%) |
| College or Associate's Degree | 0 (0.0%) | 0 (0.0%) |
| Bachelor's Degree | 0 (0.0%) | 0 (0.0%) |
| Graduate Degree | 0 (0.0%) | 0 (0.0%) |
| Total | 0 (0.0%) | 0 (0.0%) |
Employment Characteristics in Leming
Employment by Class of Employer in Leming
Among the 526 employed individuals in Leming, private company employees (340 | 64.6%), self-employed (incorporated) (110 | 20.9%), and local government employees (42 | 8.0%) make up the most common classes of employment.
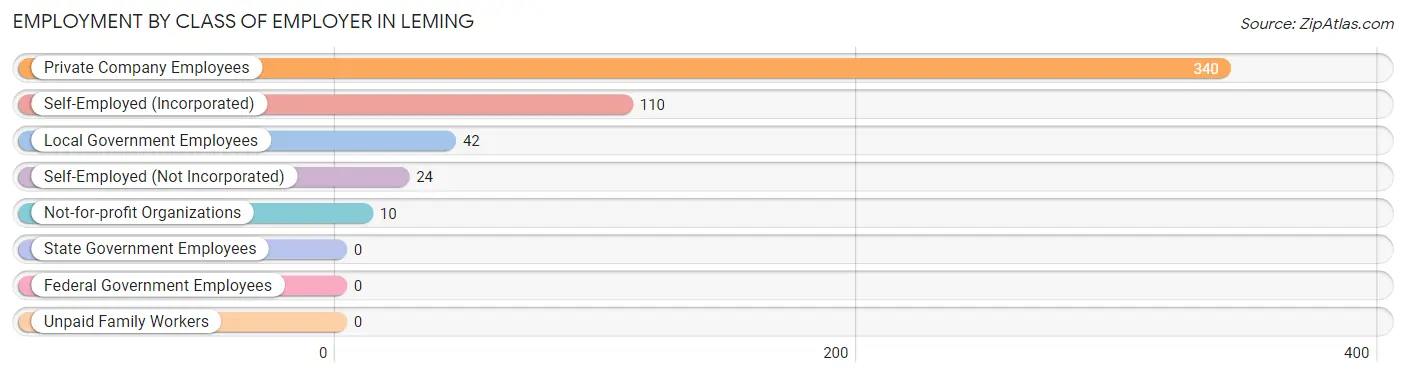
| Employer Class | # Employees | % Employees |
| Private Company Employees | 340 | 64.6% |
| Self-Employed (Incorporated) | 110 | 20.9% |
| Self-Employed (Not Incorporated) | 24 | 4.6% |
| Not-for-profit Organizations | 10 | 1.9% |
| Local Government Employees | 42 | 8.0% |
| State Government Employees | 0 | 0.0% |
| Federal Government Employees | 0 | 0.0% |
| Unpaid Family Workers | 0 | 0.0% |
| Total | 526 | 100.0% |
Employment Status by Age in Leming
According to the labor force statistics for Leming, out of the total population over 16 years of age (766), 77.0% or 590 individuals are in the labor force, with 10.8% or 64 of them unemployed. The age group with the highest labor force participation rate is 20 to 24 years, with 100.0% or 28 individuals in the labor force. Within the labor force, the 45 to 54 years age range has the highest percentage of unemployed individuals, with 28.1% or 64 of them being unemployed.
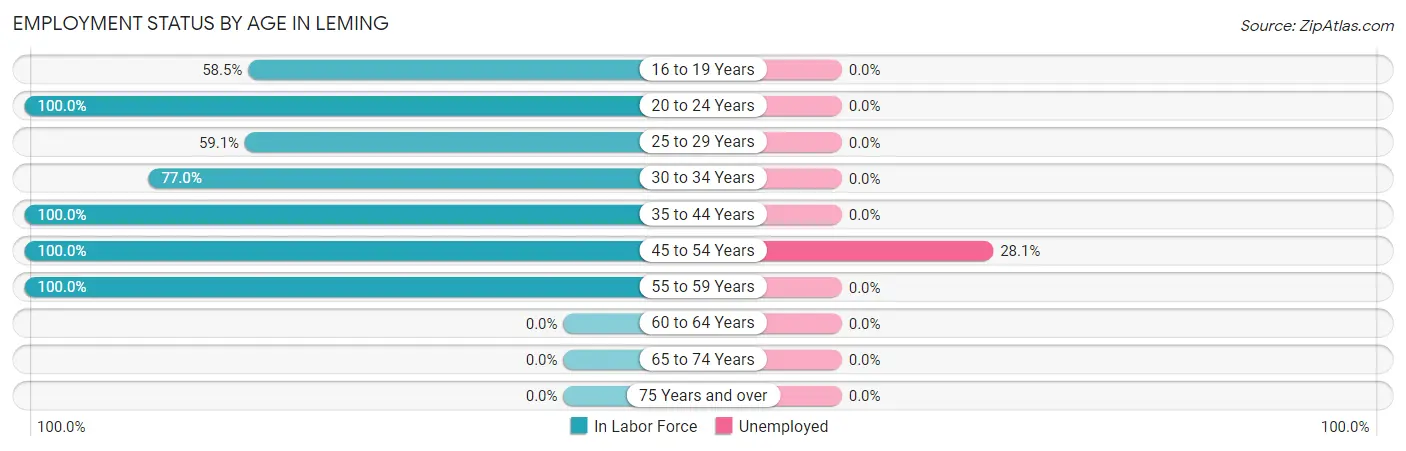
| Age Bracket | In Labor Force | Unemployed |
| 16 to 19 Years | 110 (58.5%) | 0 (0.0%) |
| 20 to 24 Years | 28 (100.0%) | 0 (0.0%) |
| 25 to 29 Years | 13 (59.1%) | 0 (0.0%) |
| 30 to 34 Years | 47 (77.0%) | 0 (0.0%) |
| 35 to 44 Years | 145 (100.0%) | 0 (0.0%) |
| 45 to 54 Years | 228 (100.0%) | 64 (28.1%) |
| 55 to 59 Years | 19 (100.0%) | 0 (0.0%) |
| 60 to 64 Years | 0 (0.0%) | 0 (0.0%) |
| 65 to 74 Years | 0 (0.0%) | 0 (0.0%) |
| 75 Years and over | 0 (0.0%) | 0 (0.0%) |
| Total | 590 (77.0%) | 64 (10.8%) |
Employment Status by Educational Attainment in Leming
According to labor force statistics for Leming, 95.2% of individuals (452) out of the total population between 25 and 64 years of age (475) are in the labor force, with 14.2% or 64 of them being unemployed. The group with the highest labor force participation rate are those with the educational attainment of high school diploma, with 100.0% or 225 individuals in the labor force. Within the labor force, individuals with less than high school education have the highest percentage of unemployment, with 37.6% or 38 of them being unemployed.
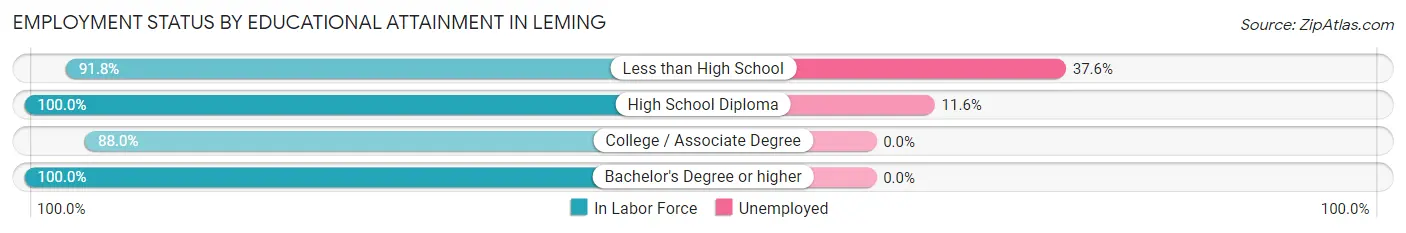
| Educational Attainment | In Labor Force | Unemployed |
| Less than High School | 101 (91.8%) | 41 (37.6%) |
| High School Diploma | 225 (100.0%) | 26 (11.6%) |
| College / Associate Degree | 103 (88.0%) | 0 (0.0%) |
| Bachelor's Degree or higher | 23 (100.0%) | 0 (0.0%) |
| Total | 452 (95.2%) | 67 (14.2%) |
Employment Occupations by Sex in Leming
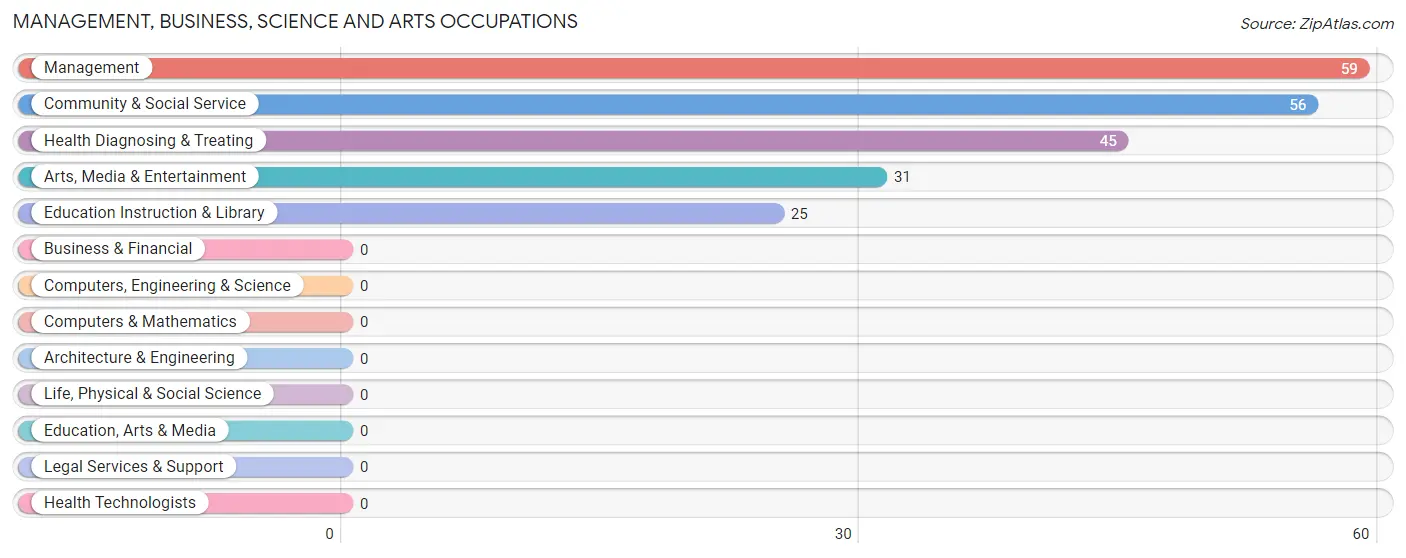
Management, Business, Science and Arts Occupations
The most common Management, Business, Science and Arts occupations in Leming are Management (59 | 11.2%), Community & Social Service (56 | 10.6%), Health Diagnosing & Treating (45 | 8.6%), Arts, Media & Entertainment (31 | 5.9%), and Education Instruction & Library (25 | 4.8%).
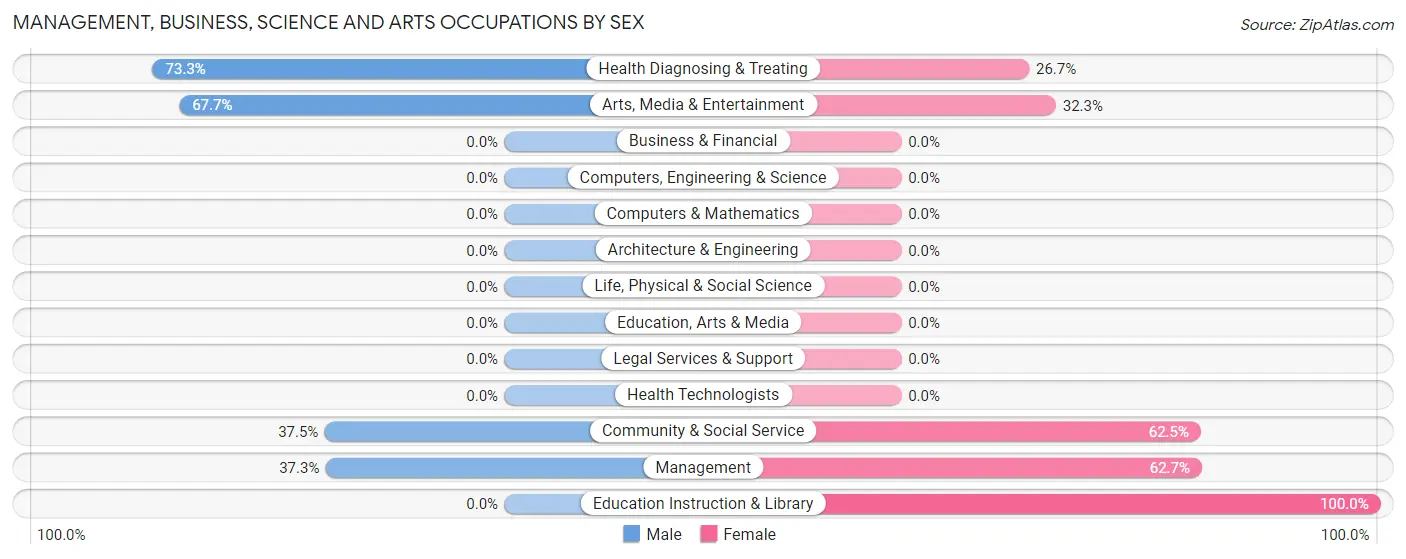
Management, Business, Science and Arts Occupations by Sex
Within the Management, Business, Science and Arts occupations in Leming, the most male-oriented occupations are Health Diagnosing & Treating (73.3%), Arts, Media & Entertainment (67.7%), and Community & Social Service (37.5%), while the most female-oriented occupations are Education Instruction & Library (100.0%), Management (62.7%), and Community & Social Service (62.5%).
| Occupation | Male | Female |
| Management | 22 (37.3%) | 37 (62.7%) |
| Business & Financial | 0 (0.0%) | 0 (0.0%) |
| Computers, Engineering & Science | 0 (0.0%) | 0 (0.0%) |
| Computers & Mathematics | 0 (0.0%) | 0 (0.0%) |
| Architecture & Engineering | 0 (0.0%) | 0 (0.0%) |
| Life, Physical & Social Science | 0 (0.0%) | 0 (0.0%) |
| Community & Social Service | 21 (37.5%) | 35 (62.5%) |
| Education, Arts & Media | 0 (0.0%) | 0 (0.0%) |
| Legal Services & Support | 0 (0.0%) | 0 (0.0%) |
| Education Instruction & Library | 0 (0.0%) | 25 (100.0%) |
| Arts, Media & Entertainment | 21 (67.7%) | 10 (32.3%) |
| Health Diagnosing & Treating | 33 (73.3%) | 12 (26.7%) |
| Health Technologists | 0 (0.0%) | 0 (0.0%) |
| Total (Category) | 76 (47.5%) | 84 (52.5%) |
| Total (Overall) | 237 (45.1%) | 289 (54.9%) |
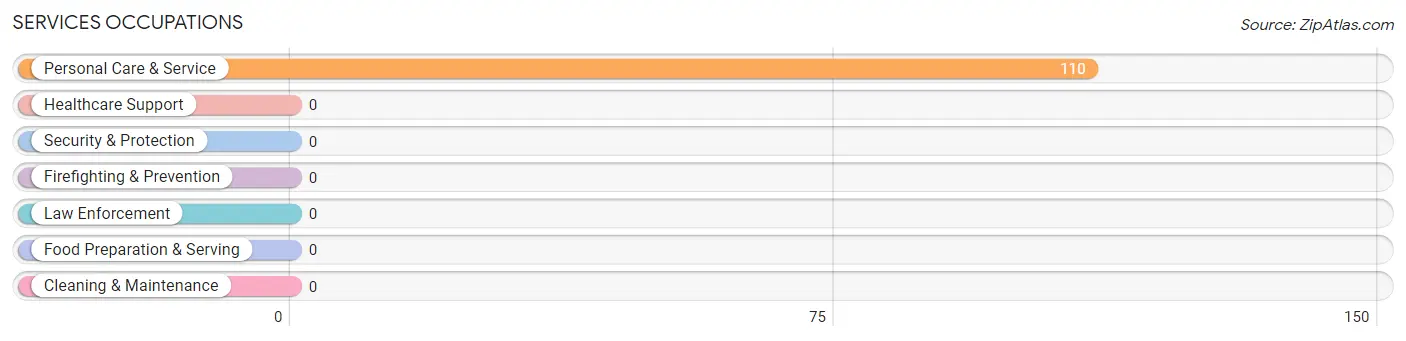
Services Occupations
The most common Services occupations in Leming are , and Personal Care & Service (110 | 20.9%).
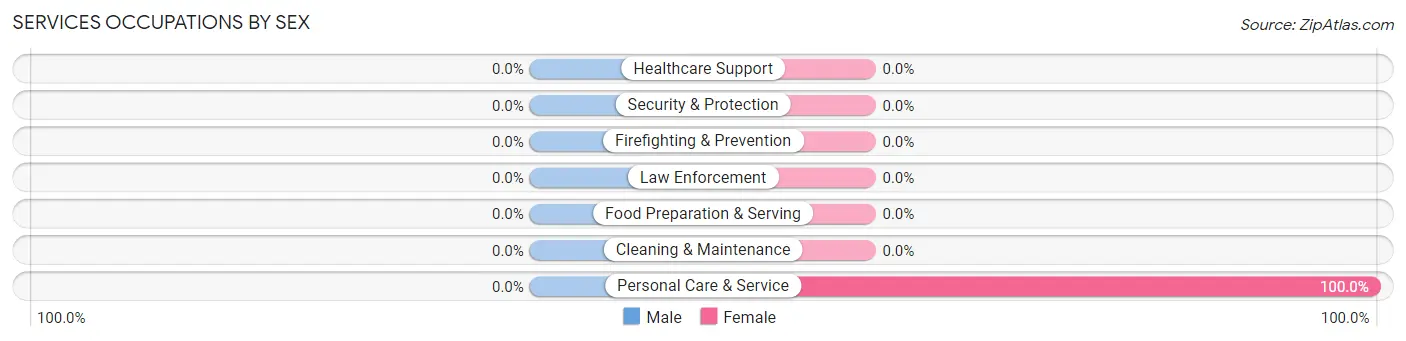
Services Occupations by Sex
| Occupation | Male | Female |
| Healthcare Support | 0 (0.0%) | 0 (0.0%) |
| Security & Protection | 0 (0.0%) | 0 (0.0%) |
| Firefighting & Prevention | 0 (0.0%) | 0 (0.0%) |
| Law Enforcement | 0 (0.0%) | 0 (0.0%) |
| Food Preparation & Serving | 0 (0.0%) | 0 (0.0%) |
| Cleaning & Maintenance | 0 (0.0%) | 0 (0.0%) |
| Personal Care & Service | 0 (0.0%) | 110 (100.0%) |
| Total (Category) | 0 (0.0%) | 110 (100.0%) |
| Total (Overall) | 237 (45.1%) | 289 (54.9%) |
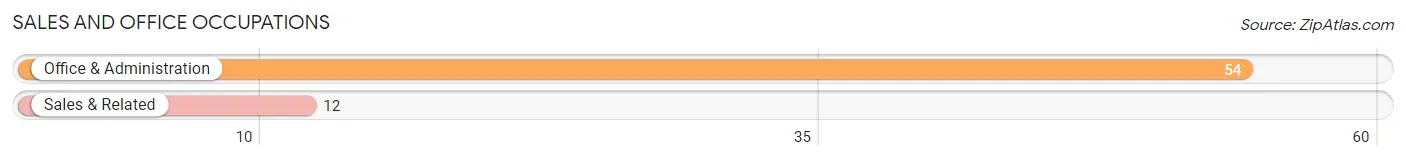
Sales and Office Occupations
The most common Sales and Office occupations in Leming are Office & Administration (54 | 10.3%), and Sales & Related (12 | 2.3%).
Sales and Office Occupations by Sex
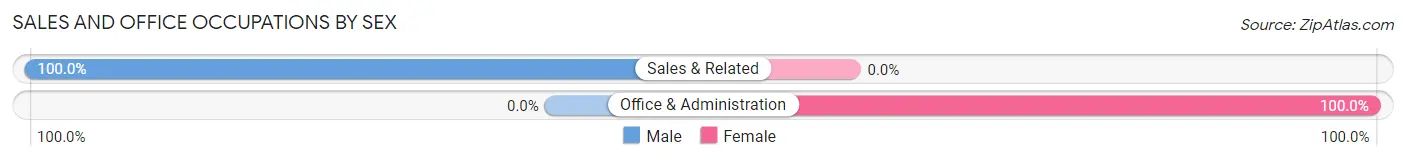
| Occupation | Male | Female |
| Sales & Related | 12 (100.0%) | 0 (0.0%) |
| Office & Administration | 0 (0.0%) | 54 (100.0%) |
| Total (Category) | 12 (18.2%) | 54 (81.8%) |
| Total (Overall) | 237 (45.1%) | 289 (54.9%) |
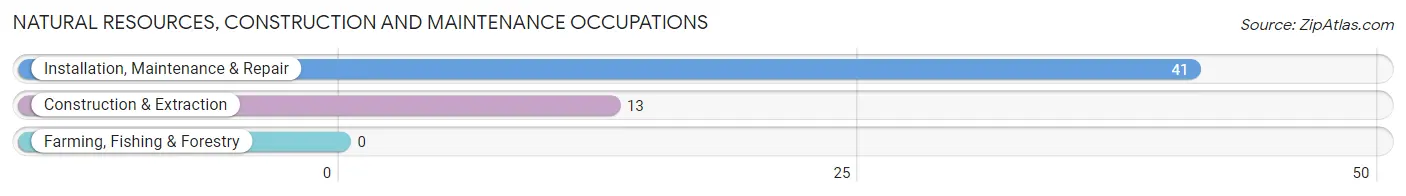
Natural Resources, Construction and Maintenance Occupations
The most common Natural Resources, Construction and Maintenance occupations in Leming are Installation, Maintenance & Repair (41 | 7.8%), and Construction & Extraction (13 | 2.5%).
Natural Resources, Construction and Maintenance Occupations by Sex
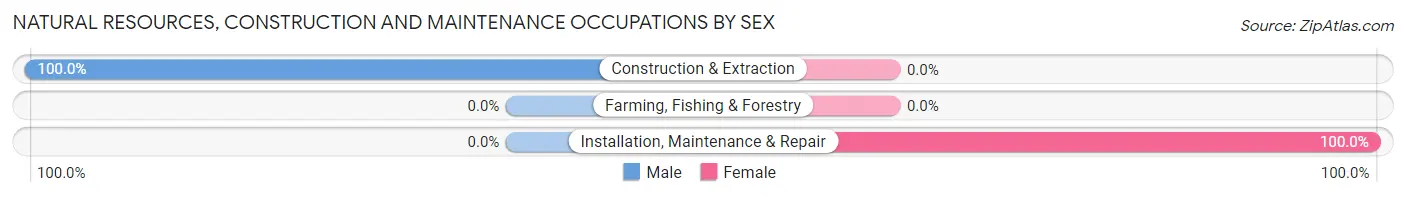
| Occupation | Male | Female |
| Farming, Fishing & Forestry | 0 (0.0%) | 0 (0.0%) |
| Construction & Extraction | 13 (100.0%) | 0 (0.0%) |
| Installation, Maintenance & Repair | 0 (0.0%) | 41 (100.0%) |
| Total (Category) | 13 (24.1%) | 41 (75.9%) |
| Total (Overall) | 237 (45.1%) | 289 (54.9%) |
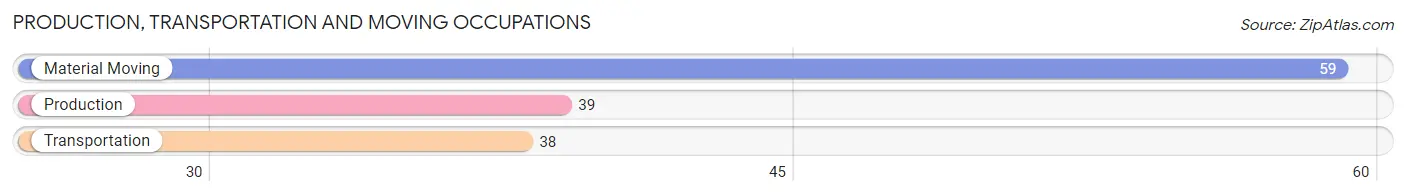
Production, Transportation and Moving Occupations
The most common Production, Transportation and Moving occupations in Leming are Material Moving (59 | 11.2%), Production (39 | 7.4%), and Transportation (38 | 7.2%).
Production, Transportation and Moving Occupations by Sex
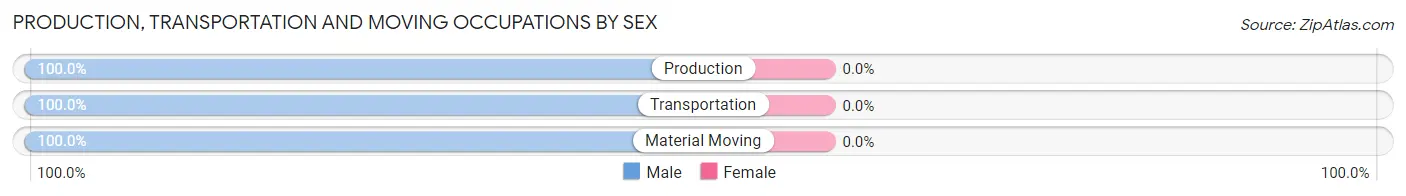
| Occupation | Male | Female |
| Production | 39 (100.0%) | 0 (0.0%) |
| Transportation | 38 (100.0%) | 0 (0.0%) |
| Material Moving | 59 (100.0%) | 0 (0.0%) |
| Total (Category) | 136 (100.0%) | 0 (0.0%) |
| Total (Overall) | 237 (45.1%) | 289 (54.9%) |
Employment Industries by Sex in Leming
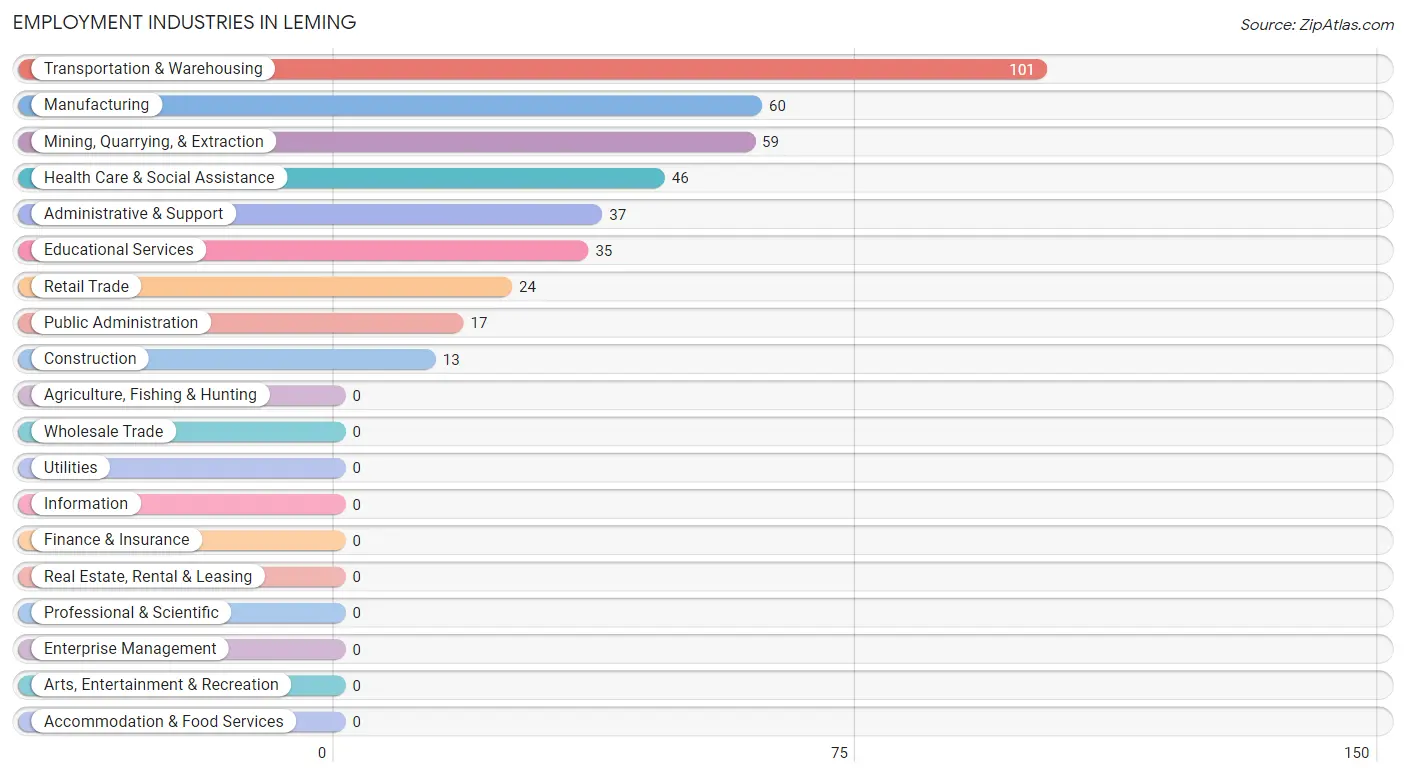
Employment Industries in Leming
The major employment industries in Leming include Transportation & Warehousing (101 | 19.2%), Manufacturing (60 | 11.4%), Mining, Quarrying, & Extraction (59 | 11.2%), Health Care & Social Assistance (46 | 8.7%), and Administrative & Support (37 | 7.0%).
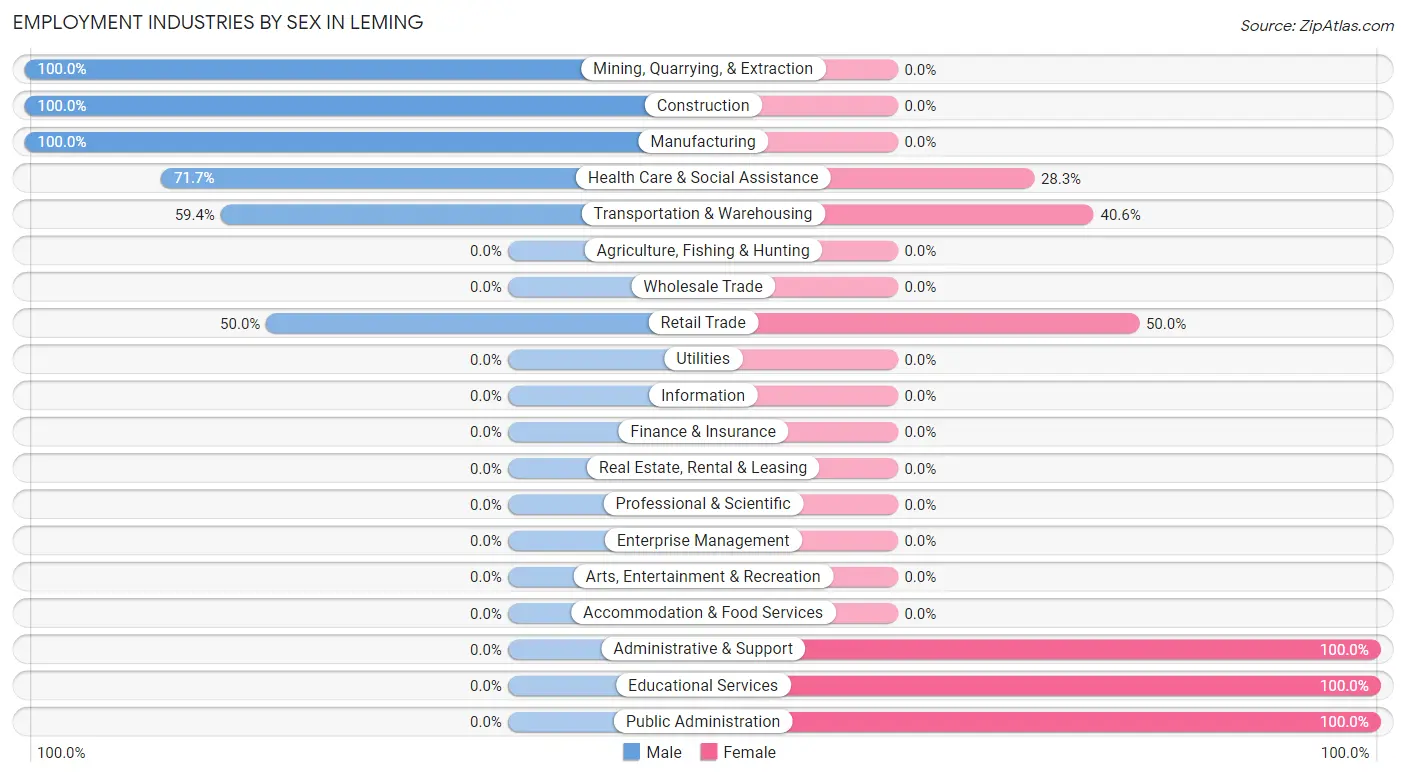
Employment Industries by Sex in Leming
The Leming industries that see more men than women are Mining, Quarrying, & Extraction (100.0%), Construction (100.0%), and Manufacturing (100.0%), whereas the industries that tend to have a higher number of women are Administrative & Support (100.0%), Educational Services (100.0%), and Public Administration (100.0%).
| Industry | Male | Female |
| Agriculture, Fishing & Hunting | 0 (0.0%) | 0 (0.0%) |
| Mining, Quarrying, & Extraction | 59 (100.0%) | 0 (0.0%) |
| Construction | 13 (100.0%) | 0 (0.0%) |
| Manufacturing | 60 (100.0%) | 0 (0.0%) |
| Wholesale Trade | 0 (0.0%) | 0 (0.0%) |
| Retail Trade | 12 (50.0%) | 12 (50.0%) |
| Transportation & Warehousing | 60 (59.4%) | 41 (40.6%) |
| Utilities | 0 (0.0%) | 0 (0.0%) |
| Information | 0 (0.0%) | 0 (0.0%) |
| Finance & Insurance | 0 (0.0%) | 0 (0.0%) |
| Real Estate, Rental & Leasing | 0 (0.0%) | 0 (0.0%) |
| Professional & Scientific | 0 (0.0%) | 0 (0.0%) |
| Enterprise Management | 0 (0.0%) | 0 (0.0%) |
| Administrative & Support | 0 (0.0%) | 37 (100.0%) |
| Educational Services | 0 (0.0%) | 35 (100.0%) |
| Health Care & Social Assistance | 33 (71.7%) | 13 (28.3%) |
| Arts, Entertainment & Recreation | 0 (0.0%) | 0 (0.0%) |
| Accommodation & Food Services | 0 (0.0%) | 0 (0.0%) |
| Public Administration | 0 (0.0%) | 17 (100.0%) |
| Total | 237 (45.1%) | 289 (54.9%) |
Education in Leming
School Enrollment in Leming
The most common levels of schooling among the 431 students in Leming are middle school (160 | 37.1%), elementary school (118 | 27.4%), and high school (114 | 26.5%).
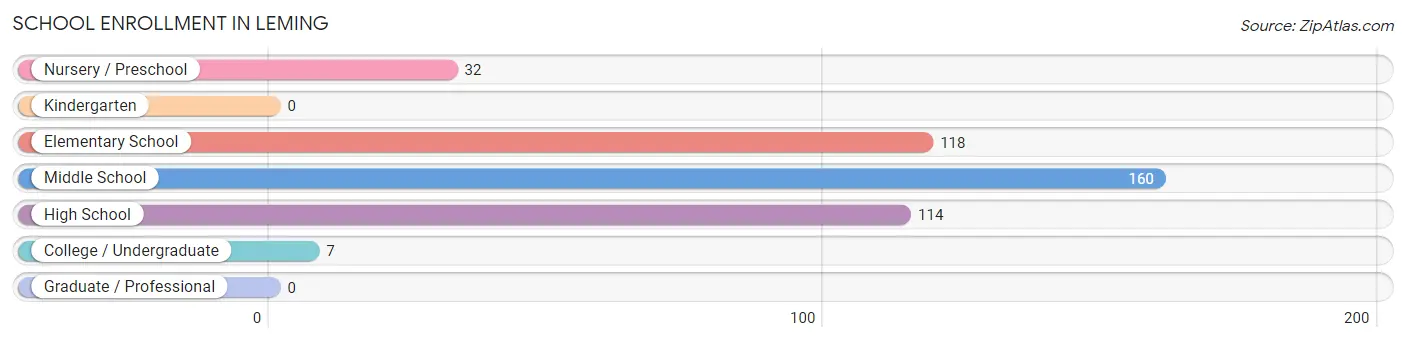
| School Level | # Students | % Students |
| Nursery / Preschool | 32 | 7.4% |
| Kindergarten | 0 | 0.0% |
| Elementary School | 118 | 27.4% |
| Middle School | 160 | 37.1% |
| High School | 114 | 26.5% |
| College / Undergraduate | 7 | 1.6% |
| Graduate / Professional | 0 | 0.0% |
| Total | 431 | 100.0% |
School Enrollment by Age by Funding Source in Leming
Out of a total of 431 students who are enrolled in schools in Leming, 128 (29.7%) attend a private institution, while the remaining 303 (70.3%) are enrolled in public schools. The age group of 10 to 14 year olds has the highest likelihood of being enrolled in private schools, with 128 (54.7% in the age bracket) enrolled. Conversely, the age group of 3 to 4 year olds has the lowest likelihood of being enrolled in a private school, with 19 (100.0% in the age bracket) attending a public institution.
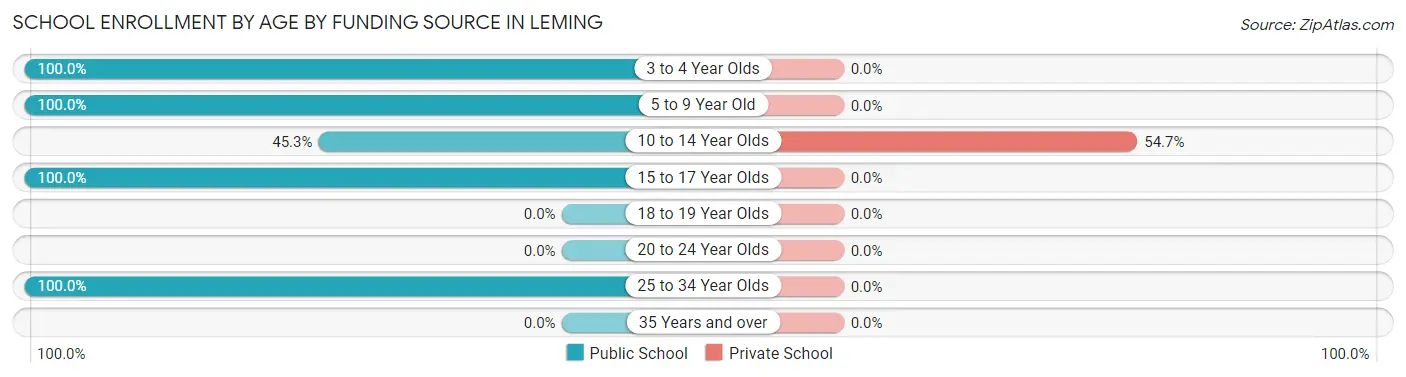
| Age Bracket | Public School | Private School |
| 3 to 4 Year Olds | 19 (100.0%) | 0 (0.0%) |
| 5 to 9 Year Old | 57 (100.0%) | 0 (0.0%) |
| 10 to 14 Year Olds | 106 (45.3%) | 128 (54.7%) |
| 15 to 17 Year Olds | 114 (100.0%) | 0 (0.0%) |
| 18 to 19 Year Olds | 0 (0.0%) | 0 (0.0%) |
| 20 to 24 Year Olds | 0 (0.0%) | 0 (0.0%) |
| 25 to 34 Year Olds | 7 (100.0%) | 0 (0.0%) |
| 35 Years and over | 0 (0.0%) | 0 (0.0%) |
| Total | 303 (70.3%) | 128 (29.7%) |
Educational Attainment by Field of Study in Leming
Social sciences (13 | 56.5%), and communications (10 | 43.5%) are the most common fields of study among 23 individuals in Leming who have obtained a bachelor's degree or higher.
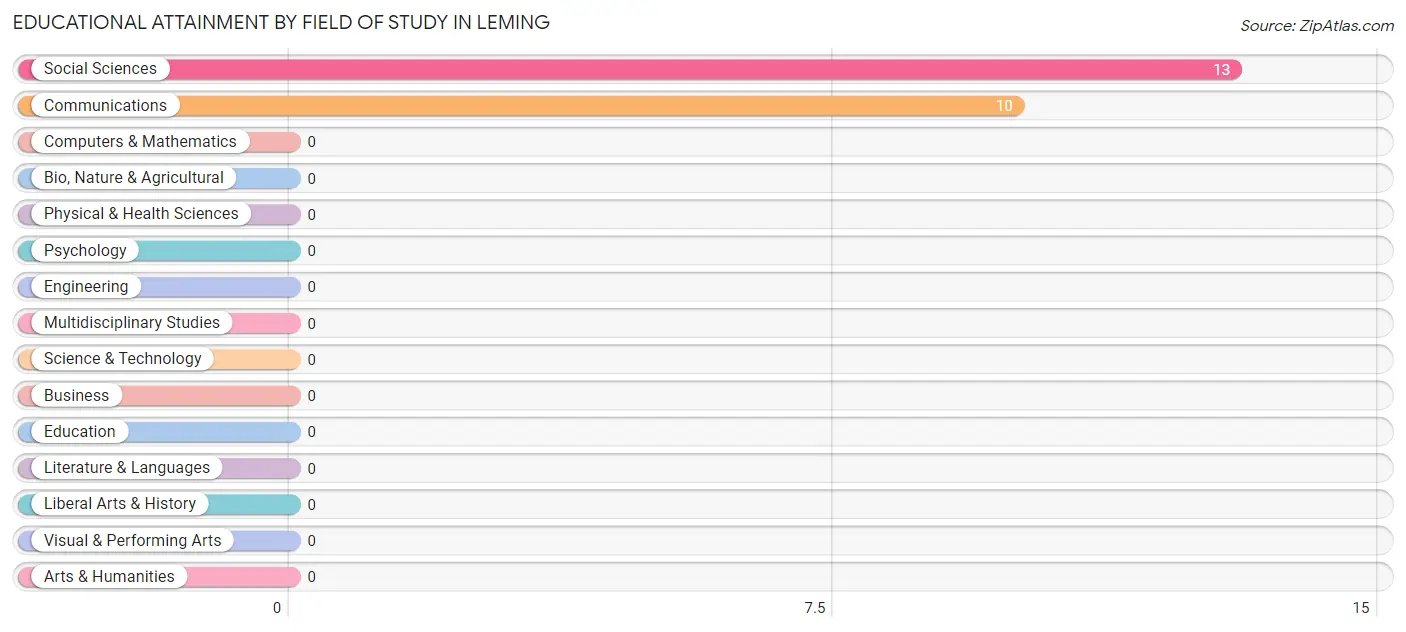
| Field of Study | # Graduates | % Graduates |
| Computers & Mathematics | 0 | 0.0% |
| Bio, Nature & Agricultural | 0 | 0.0% |
| Physical & Health Sciences | 0 | 0.0% |
| Psychology | 0 | 0.0% |
| Social Sciences | 13 | 56.5% |
| Engineering | 0 | 0.0% |
| Multidisciplinary Studies | 0 | 0.0% |
| Science & Technology | 0 | 0.0% |
| Business | 0 | 0.0% |
| Education | 0 | 0.0% |
| Literature & Languages | 0 | 0.0% |
| Liberal Arts & History | 0 | 0.0% |
| Visual & Performing Arts | 0 | 0.0% |
| Communications | 10 | 43.5% |
| Arts & Humanities | 0 | 0.0% |
| Total | 23 | 100.0% |
Transportation & Commute in Leming
Vehicle Availability by Sex in Leming
The most prevalent vehicle ownership categories in Leming are males with 3 vehicles (79, accounting for 33.3%) and females with 3 vehicles (151, making up 27.3%).
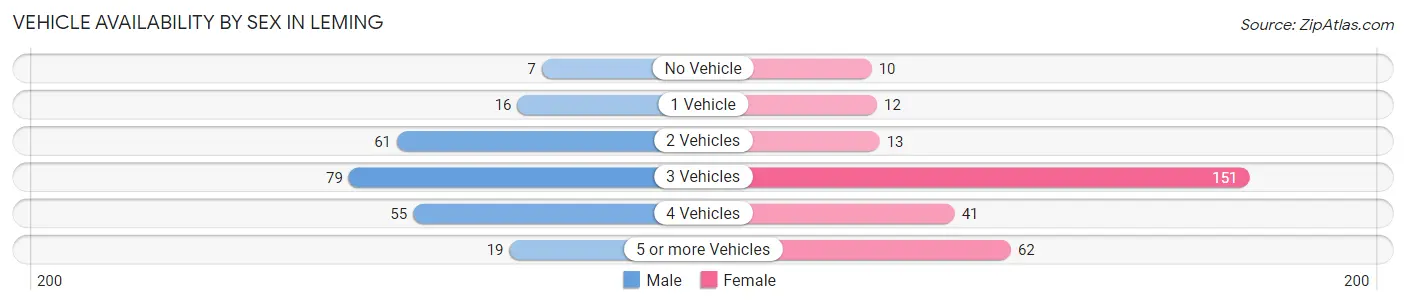
| Vehicles Available | Male | Female |
| No Vehicle | 7 (2.9%) | 10 (3.5%) |
| 1 Vehicle | 16 (6.8%) | 12 (4.2%) |
| 2 Vehicles | 61 (25.7%) | 13 (4.5%) |
| 3 Vehicles | 79 (33.3%) | 151 (52.2%) |
| 4 Vehicles | 55 (23.2%) | 41 (14.2%) |
| 5 or more Vehicles | 19 (8.0%) | 62 (21.4%) |
| Total | 237 (100.0%) | 289 (100.0%) |
Commute Time in Leming
The most frequently occuring commute durations in Leming are less than 5 minutes (110 commuters, 22.2%), 15 to 19 minutes (90 commuters, 18.1%), and 40 to 44 minutes (87 commuters, 17.5%).
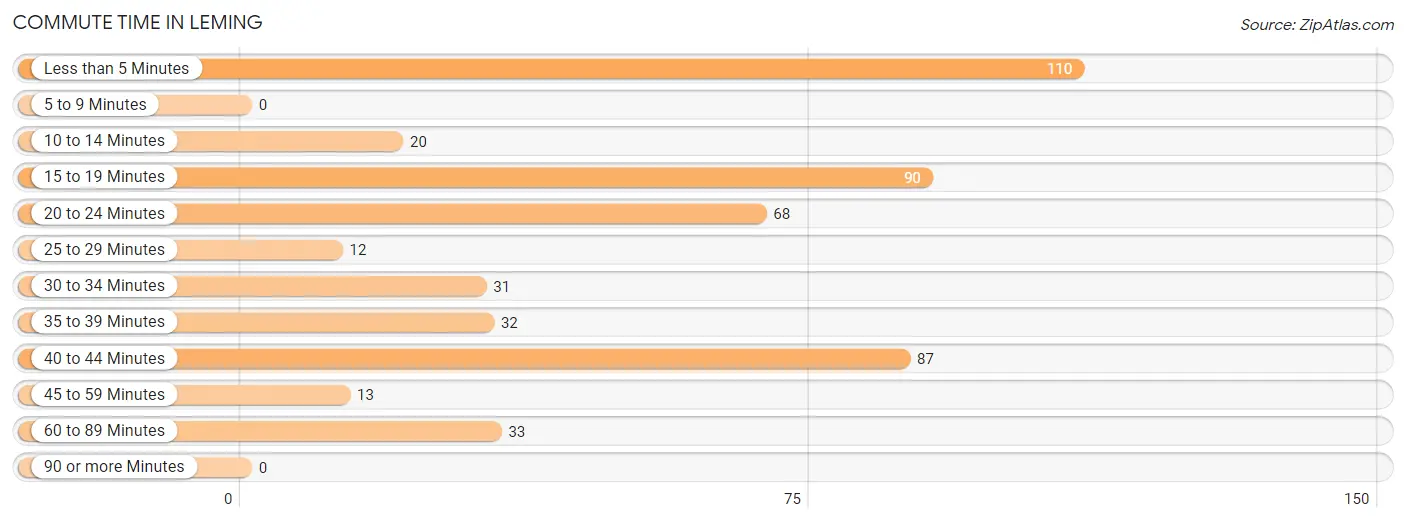
| Commute Time | # Commuters | % Commuters |
| Less than 5 Minutes | 110 | 22.2% |
| 5 to 9 Minutes | 0 | 0.0% |
| 10 to 14 Minutes | 20 | 4.0% |
| 15 to 19 Minutes | 90 | 18.1% |
| 20 to 24 Minutes | 68 | 13.7% |
| 25 to 29 Minutes | 12 | 2.4% |
| 30 to 34 Minutes | 31 | 6.2% |
| 35 to 39 Minutes | 32 | 6.5% |
| 40 to 44 Minutes | 87 | 17.5% |
| 45 to 59 Minutes | 13 | 2.6% |
| 60 to 89 Minutes | 33 | 6.7% |
| 90 or more Minutes | 0 | 0.0% |
Commute Time by Sex in Leming
The most common commute times in Leming are 15 to 19 minutes (65 commuters, 28.1%) for males and less than 5 minutes (110 commuters, 41.5%) for females.
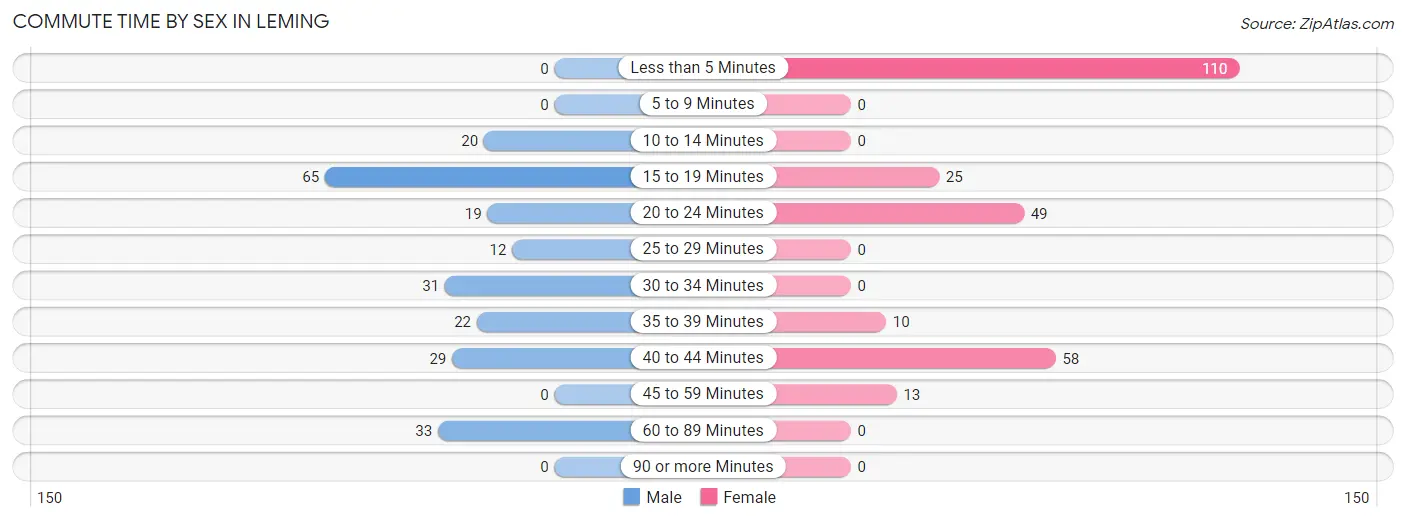
| Commute Time | Male | Female |
| Less than 5 Minutes | 0 (0.0%) | 110 (41.5%) |
| 5 to 9 Minutes | 0 (0.0%) | 0 (0.0%) |
| 10 to 14 Minutes | 20 (8.7%) | 0 (0.0%) |
| 15 to 19 Minutes | 65 (28.1%) | 25 (9.4%) |
| 20 to 24 Minutes | 19 (8.2%) | 49 (18.5%) |
| 25 to 29 Minutes | 12 (5.2%) | 0 (0.0%) |
| 30 to 34 Minutes | 31 (13.4%) | 0 (0.0%) |
| 35 to 39 Minutes | 22 (9.5%) | 10 (3.8%) |
| 40 to 44 Minutes | 29 (12.6%) | 58 (21.9%) |
| 45 to 59 Minutes | 0 (0.0%) | 13 (4.9%) |
| 60 to 89 Minutes | 33 (14.3%) | 0 (0.0%) |
| 90 or more Minutes | 0 (0.0%) | 0 (0.0%) |
Time of Departure to Work by Sex in Leming
The most frequent times of departure to work in Leming are 6:00 AM to 6:29 AM (64, 27.7%) for males and 9:00 AM to 9:59 AM (110, 41.5%) for females.
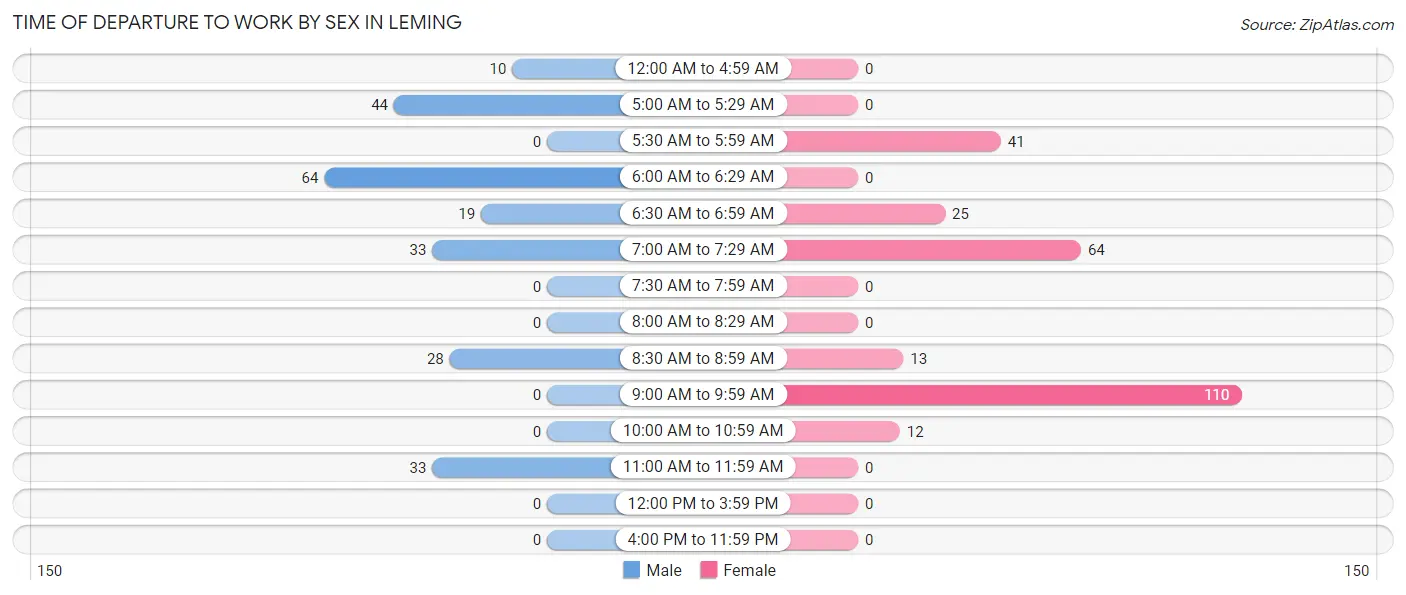
| Time of Departure | Male | Female |
| 12:00 AM to 4:59 AM | 10 (4.3%) | 0 (0.0%) |
| 5:00 AM to 5:29 AM | 44 (19.1%) | 0 (0.0%) |
| 5:30 AM to 5:59 AM | 0 (0.0%) | 41 (15.5%) |
| 6:00 AM to 6:29 AM | 64 (27.7%) | 0 (0.0%) |
| 6:30 AM to 6:59 AM | 19 (8.2%) | 25 (9.4%) |
| 7:00 AM to 7:29 AM | 33 (14.3%) | 64 (24.1%) |
| 7:30 AM to 7:59 AM | 0 (0.0%) | 0 (0.0%) |
| 8:00 AM to 8:29 AM | 0 (0.0%) | 0 (0.0%) |
| 8:30 AM to 8:59 AM | 28 (12.1%) | 13 (4.9%) |
| 9:00 AM to 9:59 AM | 0 (0.0%) | 110 (41.5%) |
| 10:00 AM to 10:59 AM | 0 (0.0%) | 12 (4.5%) |
| 11:00 AM to 11:59 AM | 33 (14.3%) | 0 (0.0%) |
| 12:00 PM to 3:59 PM | 0 (0.0%) | 0 (0.0%) |
| 4:00 PM to 11:59 PM | 0 (0.0%) | 0 (0.0%) |
| Total | 231 (100.0%) | 265 (100.0%) |
Housing Occupancy in Leming
Occupancy by Ownership in Leming
Of the total 252 dwellings in Leming, owner-occupied units account for 225 (89.3%), while renter-occupied units make up 27 (10.7%).
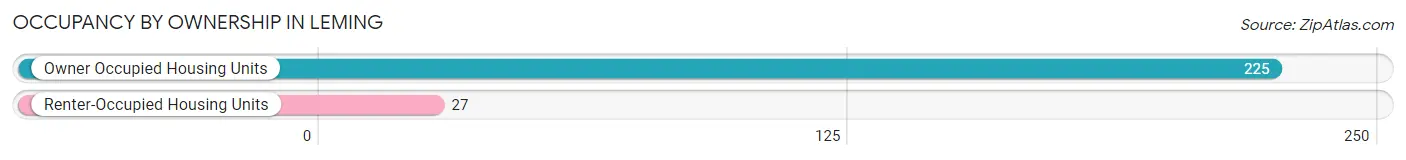
| Occupancy | # Housing Units | % Housing Units |
| Owner Occupied Housing Units | 225 | 89.3% |
| Renter-Occupied Housing Units | 27 | 10.7% |
| Total Occupied Housing Units | 252 | 100.0% |
Occupancy by Household Size in Leming
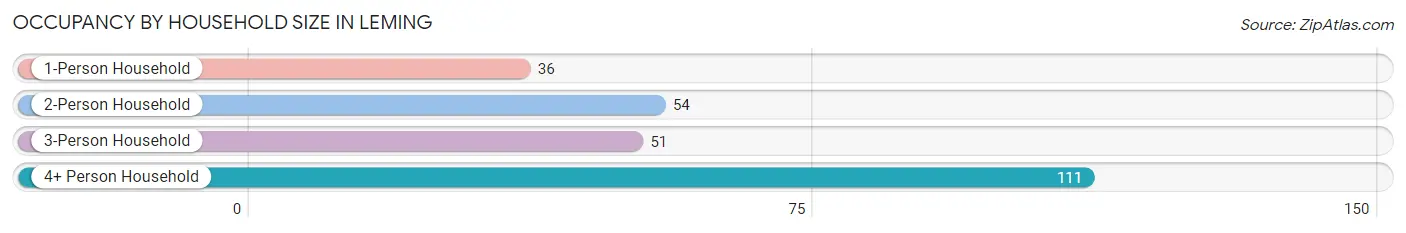
| Household Size | # Housing Units | % Housing Units |
| 1-Person Household | 36 | 14.3% |
| 2-Person Household | 54 | 21.4% |
| 3-Person Household | 51 | 20.2% |
| 4+ Person Household | 111 | 44.1% |
| Total Housing Units | 252 | 100.0% |
Occupancy by Ownership by Household Size in Leming
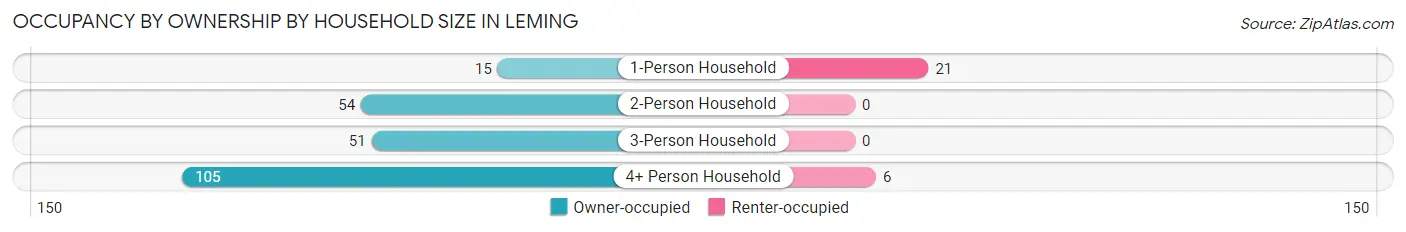
| Household Size | Owner-occupied | Renter-occupied |
| 1-Person Household | 15 (41.7%) | 21 (58.3%) |
| 2-Person Household | 54 (100.0%) | 0 (0.0%) |
| 3-Person Household | 51 (100.0%) | 0 (0.0%) |
| 4+ Person Household | 105 (94.6%) | 6 (5.4%) |
| Total Housing Units | 225 (89.3%) | 27 (10.7%) |
Occupancy by Educational Attainment in Leming
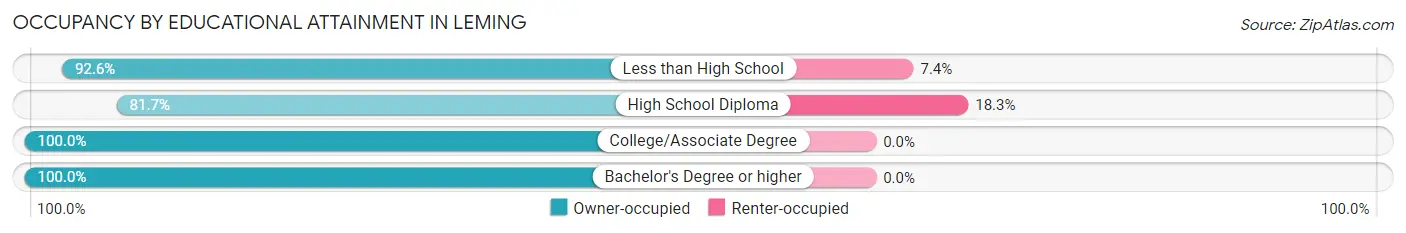
| Household Size | Owner-occupied | Renter-occupied |
| Less than High School | 75 (92.6%) | 6 (7.4%) |
| High School Diploma | 94 (81.7%) | 21 (18.3%) |
| College/Associate Degree | 33 (100.0%) | 0 (0.0%) |
| Bachelor's Degree or higher | 23 (100.0%) | 0 (0.0%) |
Occupancy by Age of Householder in Leming
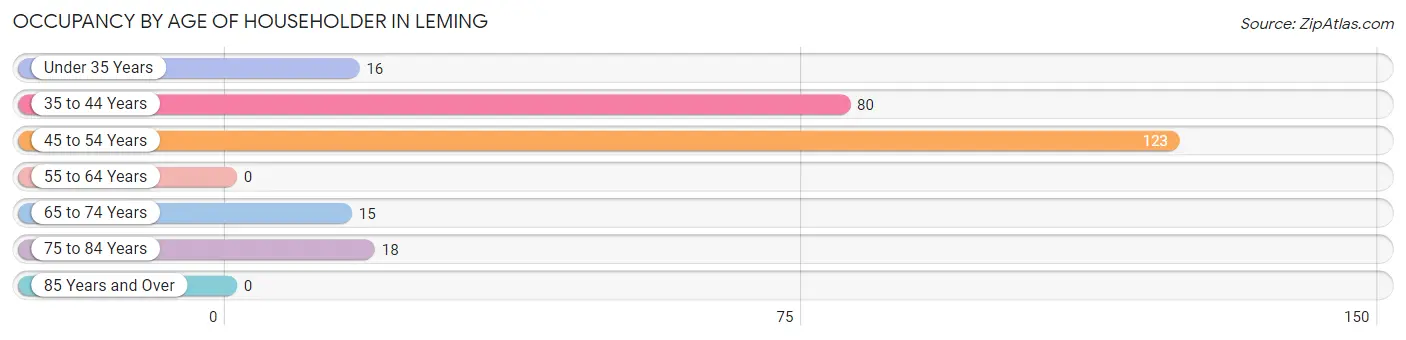
| Age Bracket | # Households | % Households |
| Under 35 Years | 16 | 6.4% |
| 35 to 44 Years | 80 | 31.8% |
| 45 to 54 Years | 123 | 48.8% |
| 55 to 64 Years | 0 | 0.0% |
| 65 to 74 Years | 15 | 5.9% |
| 75 to 84 Years | 18 | 7.1% |
| 85 Years and Over | 0 | 0.0% |
| Total | 252 | 100.0% |
Housing Finances in Leming
Median Income by Occupancy in Leming
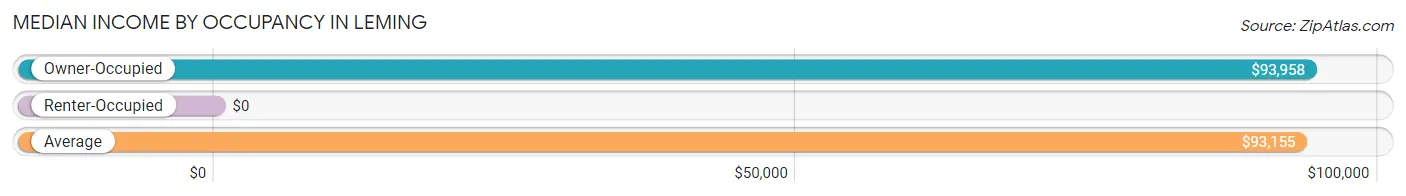
| Occupancy Type | # Households | Median Income |
| Owner-Occupied | 225 (89.3%) | $93,958 |
| Renter-Occupied | 27 (10.7%) | $0 |
| Average | 252 (100.0%) | $93,155 |
Occupancy by Householder Income Bracket in Leming
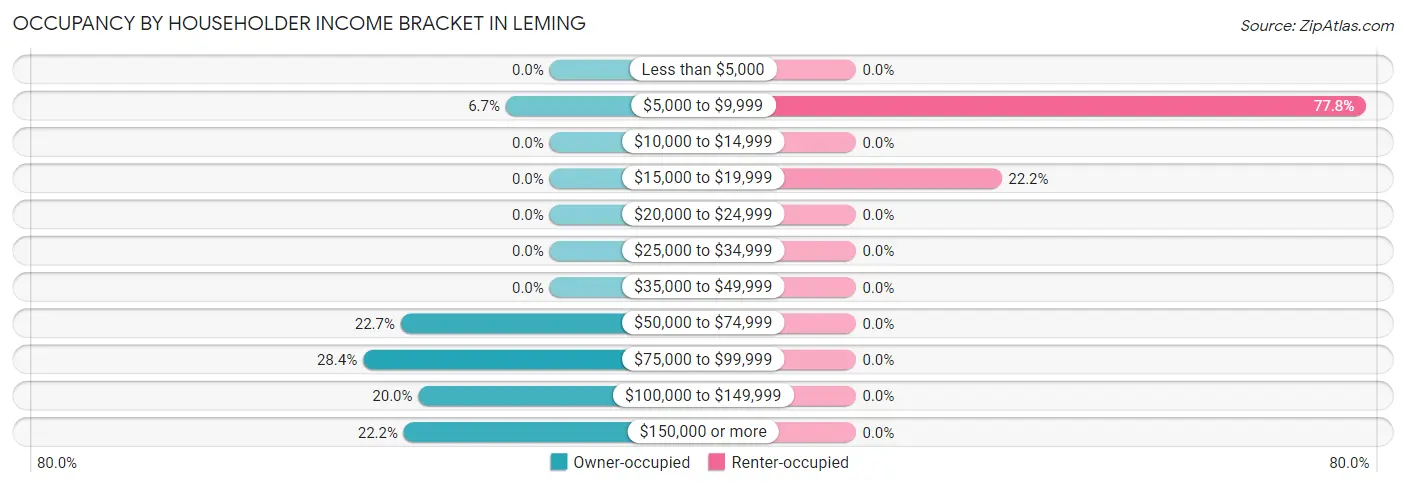
| Income Bracket | Owner-occupied | Renter-occupied |
| Less than $5,000 | 0 (0.0%) | 0 (0.0%) |
| $5,000 to $9,999 | 15 (6.7%) | 21 (77.8%) |
| $10,000 to $14,999 | 0 (0.0%) | 0 (0.0%) |
| $15,000 to $19,999 | 0 (0.0%) | 6 (22.2%) |
| $20,000 to $24,999 | 0 (0.0%) | 0 (0.0%) |
| $25,000 to $34,999 | 0 (0.0%) | 0 (0.0%) |
| $35,000 to $49,999 | 0 (0.0%) | 0 (0.0%) |
| $50,000 to $74,999 | 51 (22.7%) | 0 (0.0%) |
| $75,000 to $99,999 | 64 (28.4%) | 0 (0.0%) |
| $100,000 to $149,999 | 45 (20.0%) | 0 (0.0%) |
| $150,000 or more | 50 (22.2%) | 0 (0.0%) |
| Total | 225 (100.0%) | 27 (100.0%) |
Monthly Housing Cost Tiers in Leming
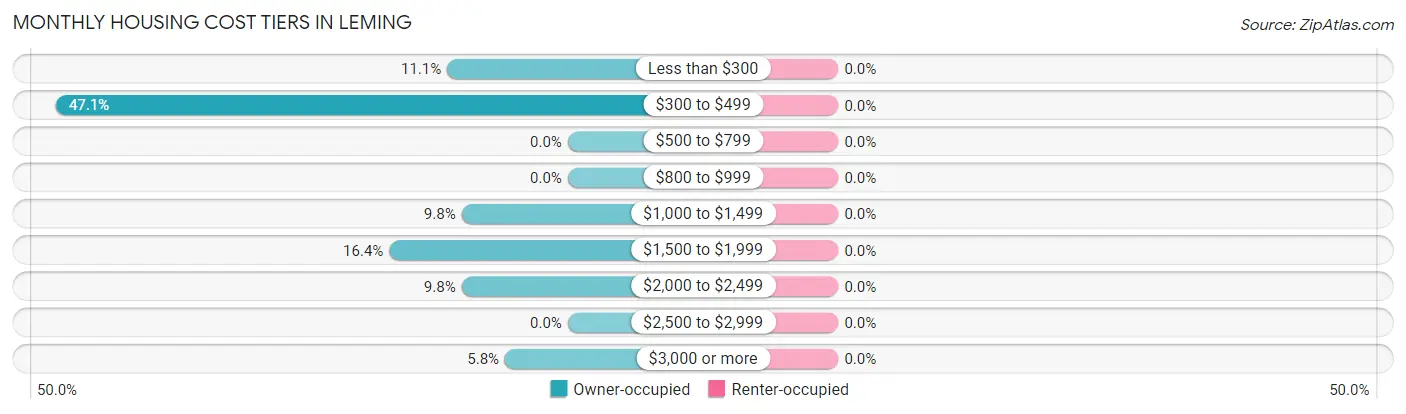
| Monthly Cost | Owner-occupied | Renter-occupied |
| Less than $300 | 25 (11.1%) | 0 (0.0%) |
| $300 to $499 | 106 (47.1%) | 0 (0.0%) |
| $500 to $799 | 0 (0.0%) | 0 (0.0%) |
| $800 to $999 | 0 (0.0%) | 0 (0.0%) |
| $1,000 to $1,499 | 22 (9.8%) | 0 (0.0%) |
| $1,500 to $1,999 | 37 (16.4%) | 0 (0.0%) |
| $2,000 to $2,499 | 22 (9.8%) | 0 (0.0%) |
| $2,500 to $2,999 | 0 (0.0%) | 0 (0.0%) |
| $3,000 or more | 13 (5.8%) | 0 (0.0%) |
| Total | 225 (100.0%) | 27 (100.0%) |
Physical Housing Characteristics in Leming
Housing Structures in Leming
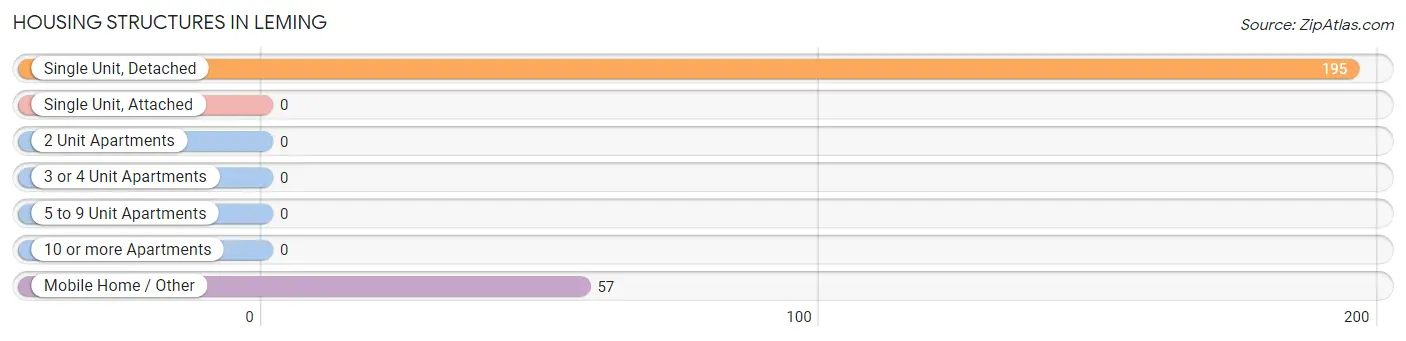
| Structure Type | # Housing Units | % Housing Units |
| Single Unit, Detached | 195 | 77.4% |
| Single Unit, Attached | 0 | 0.0% |
| 2 Unit Apartments | 0 | 0.0% |
| 3 or 4 Unit Apartments | 0 | 0.0% |
| 5 to 9 Unit Apartments | 0 | 0.0% |
| 10 or more Apartments | 0 | 0.0% |
| Mobile Home / Other | 57 | 22.6% |
| Total | 252 | 100.0% |
Housing Structures by Occupancy in Leming
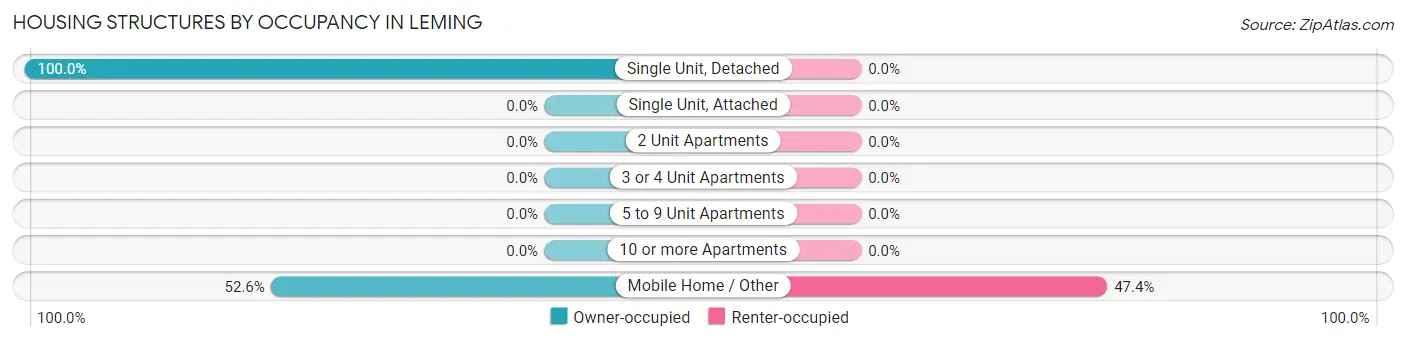
| Structure Type | Owner-occupied | Renter-occupied |
| Single Unit, Detached | 195 (100.0%) | 0 (0.0%) |
| Single Unit, Attached | 0 (0.0%) | 0 (0.0%) |
| 2 Unit Apartments | 0 (0.0%) | 0 (0.0%) |
| 3 or 4 Unit Apartments | 0 (0.0%) | 0 (0.0%) |
| 5 to 9 Unit Apartments | 0 (0.0%) | 0 (0.0%) |
| 10 or more Apartments | 0 (0.0%) | 0 (0.0%) |
| Mobile Home / Other | 30 (52.6%) | 27 (47.4%) |
| Total | 225 (89.3%) | 27 (10.7%) |
Housing Structures by Number of Rooms in Leming
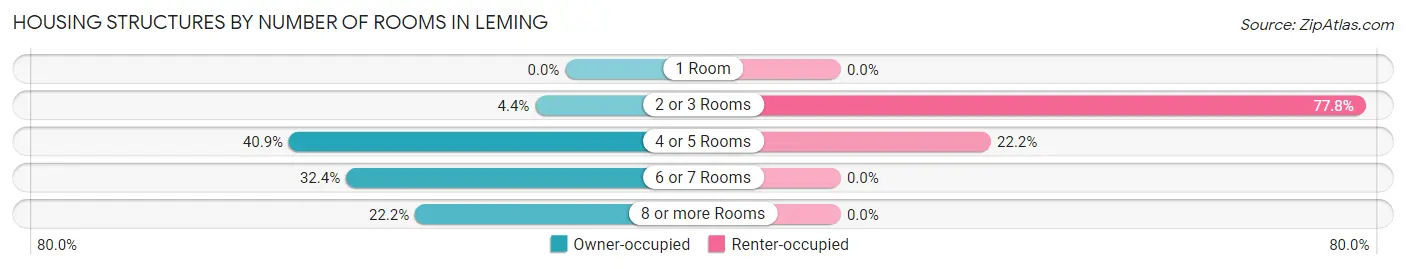
| Number of Rooms | Owner-occupied | Renter-occupied |
| 1 Room | 0 (0.0%) | 0 (0.0%) |
| 2 or 3 Rooms | 10 (4.4%) | 21 (77.8%) |
| 4 or 5 Rooms | 92 (40.9%) | 6 (22.2%) |
| 6 or 7 Rooms | 73 (32.4%) | 0 (0.0%) |
| 8 or more Rooms | 50 (22.2%) | 0 (0.0%) |
| Total | 225 (100.0%) | 27 (100.0%) |
Housing Structure by Heating Type in Leming
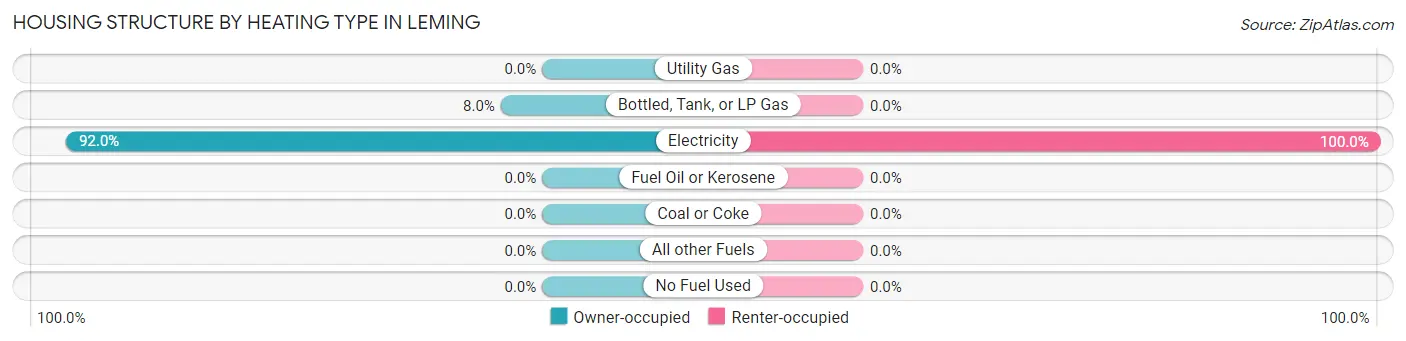
| Heating Type | Owner-occupied | Renter-occupied |
| Utility Gas | 0 (0.0%) | 0 (0.0%) |
| Bottled, Tank, or LP Gas | 18 (8.0%) | 0 (0.0%) |
| Electricity | 207 (92.0%) | 27 (100.0%) |
| Fuel Oil or Kerosene | 0 (0.0%) | 0 (0.0%) |
| Coal or Coke | 0 (0.0%) | 0 (0.0%) |
| All other Fuels | 0 (0.0%) | 0 (0.0%) |
| No Fuel Used | 0 (0.0%) | 0 (0.0%) |
| Total | 225 (100.0%) | 27 (100.0%) |
Household Vehicle Usage in Leming
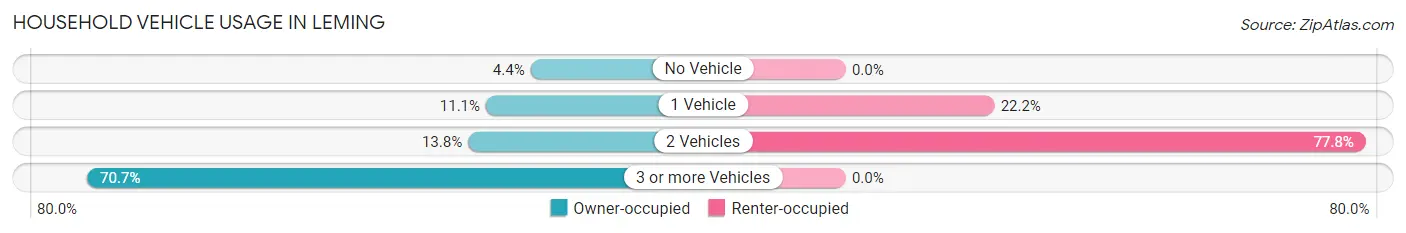
| Vehicles per Household | Owner-occupied | Renter-occupied |
| No Vehicle | 10 (4.4%) | 0 (0.0%) |
| 1 Vehicle | 25 (11.1%) | 6 (22.2%) |
| 2 Vehicles | 31 (13.8%) | 21 (77.8%) |
| 3 or more Vehicles | 159 (70.7%) | 0 (0.0%) |
| Total | 225 (100.0%) | 27 (100.0%) |
Real Estate & Mortgages in Leming
Real Estate and Mortgage Overview in Leming
| Characteristic | Without Mortgage | With Mortgage |
| Housing Units | 131 | 94 |
| Median Property Value | $78,800 | $308,100 |
| Median Household Income | $69,962 | $50 |
| Monthly Housing Costs | $424 | $13 |
| Real Estate Taxes | - | - |
Property Value by Mortgage Status in Leming
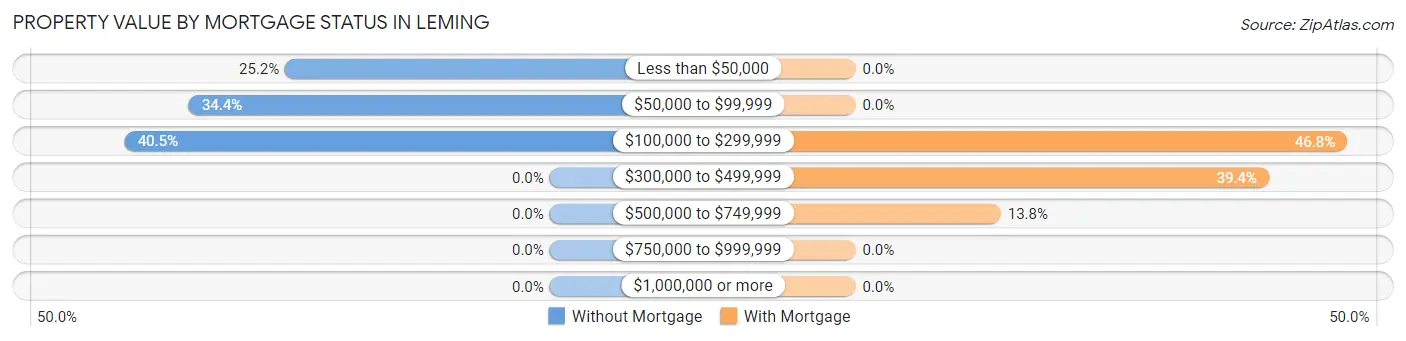
| Property Value | Without Mortgage | With Mortgage |
| Less than $50,000 | 33 (25.2%) | 0 (0.0%) |
| $50,000 to $99,999 | 45 (34.4%) | 0 (0.0%) |
| $100,000 to $299,999 | 53 (40.5%) | 44 (46.8%) |
| $300,000 to $499,999 | 0 (0.0%) | 37 (39.4%) |
| $500,000 to $749,999 | 0 (0.0%) | 13 (13.8%) |
| $750,000 to $999,999 | 0 (0.0%) | 0 (0.0%) |
| $1,000,000 or more | 0 (0.0%) | 0 (0.0%) |
| Total | 131 (100.0%) | 94 (100.0%) |
Household Income by Mortgage Status in Leming
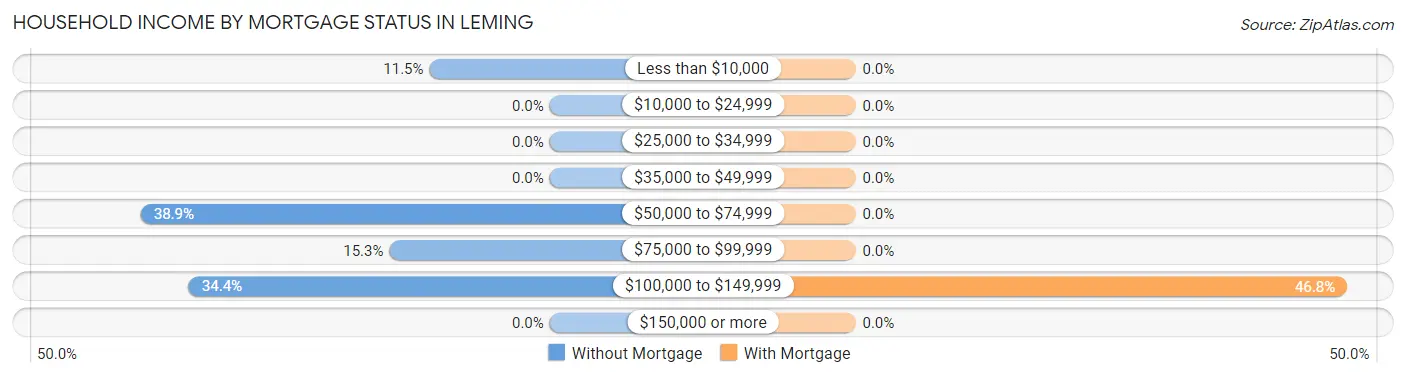
| Household Income | Without Mortgage | With Mortgage |
| Less than $10,000 | 15 (11.5%) | 0 (0.0%) |
| $10,000 to $24,999 | 0 (0.0%) | 0 (0.0%) |
| $25,000 to $34,999 | 0 (0.0%) | 0 (0.0%) |
| $35,000 to $49,999 | 0 (0.0%) | 0 (0.0%) |
| $50,000 to $74,999 | 51 (38.9%) | 0 (0.0%) |
| $75,000 to $99,999 | 20 (15.3%) | 0 (0.0%) |
| $100,000 to $149,999 | 45 (34.4%) | 44 (46.8%) |
| $150,000 or more | 0 (0.0%) | 0 (0.0%) |
| Total | 131 (100.0%) | 94 (100.0%) |
Property Value to Household Income Ratio in Leming
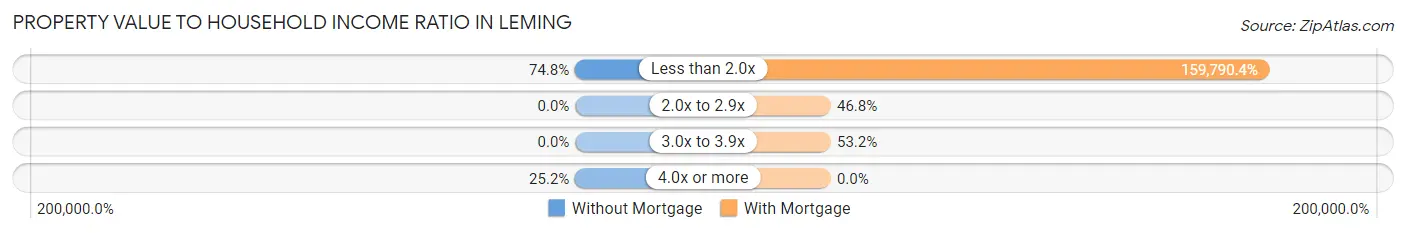
| Value-to-Income Ratio | Without Mortgage | With Mortgage |
| Less than 2.0x | 98 (74.8%) | 150,203 (159,790.4%) |
| 2.0x to 2.9x | 0 (0.0%) | 44 (46.8%) |
| 3.0x to 3.9x | 0 (0.0%) | 50 (53.2%) |
| 4.0x or more | 33 (25.2%) | 0 (0.0%) |
| Total | 131 (100.0%) | 94 (100.0%) |
Real Estate Taxes by Mortgage Status in Leming
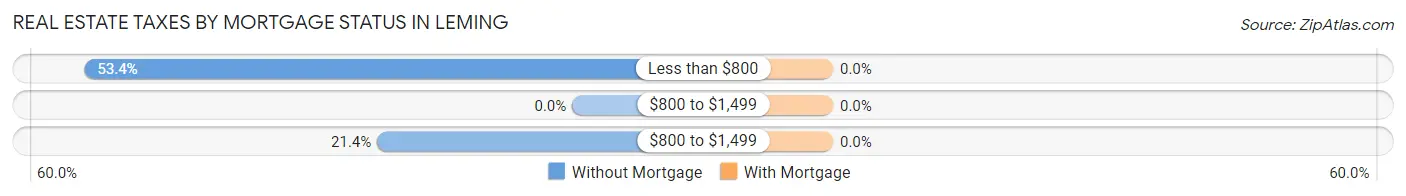
| Property Taxes | Without Mortgage | With Mortgage |
| Less than $800 | 70 (53.4%) | 0 (0.0%) |
| $800 to $1,499 | 0 (0.0%) | 0 (0.0%) |
| $800 to $1,499 | 28 (21.4%) | 0 (0.0%) |
| Total | 131 (100.0%) | 94 (100.0%) |
Health & Disability in Leming
Health Insurance Coverage by Age in Leming
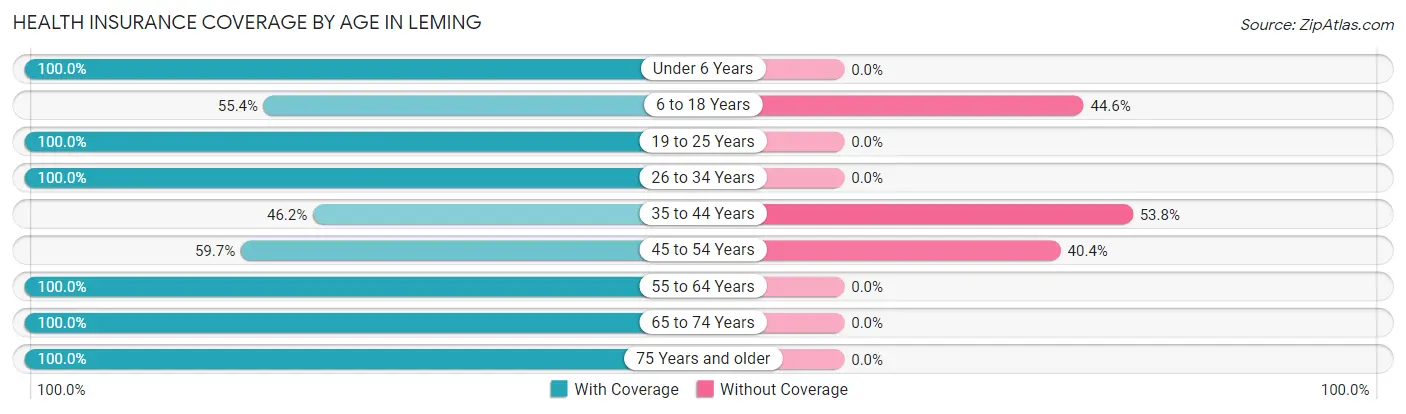
| Age Bracket | With Coverage | Without Coverage |
| Under 6 Years | 88 (100.0%) | 0 (0.0%) |
| 6 to 18 Years | 278 (55.4%) | 224 (44.6%) |
| 19 to 25 Years | 28 (100.0%) | 0 (0.0%) |
| 26 to 34 Years | 83 (100.0%) | 0 (0.0%) |
| 35 to 44 Years | 67 (46.2%) | 78 (53.8%) |
| 45 to 54 Years | 136 (59.7%) | 92 (40.4%) |
| 55 to 64 Years | 19 (100.0%) | 0 (0.0%) |
| 65 to 74 Years | 15 (100.0%) | 0 (0.0%) |
| 75 Years and older | 60 (100.0%) | 0 (0.0%) |
| Total | 774 (66.3%) | 394 (33.7%) |
Health Insurance Coverage by Citizenship Status in Leming
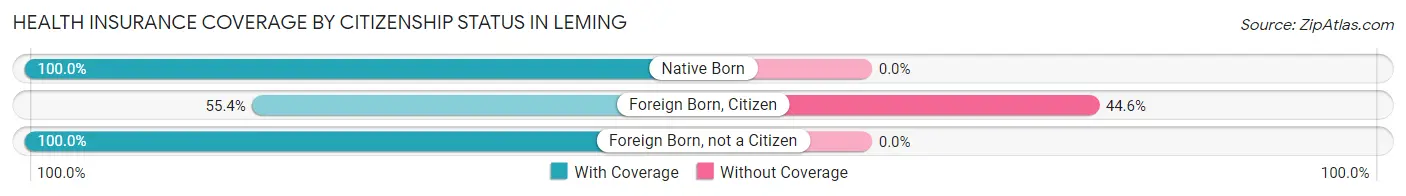
| Citizenship Status | With Coverage | Without Coverage |
| Native Born | 88 (100.0%) | 0 (0.0%) |
| Foreign Born, Citizen | 278 (55.4%) | 224 (44.6%) |
| Foreign Born, not a Citizen | 28 (100.0%) | 0 (0.0%) |
Health Insurance Coverage by Household Income in Leming
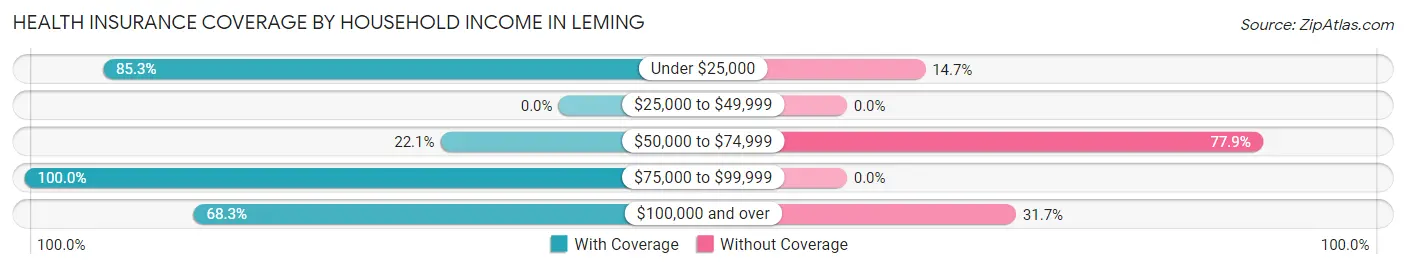
| Household Income | With Coverage | Without Coverage |
| Under $25,000 | 122 (85.3%) | 21 (14.7%) |
| $25,000 to $49,999 | 0 (0.0%) | 0 (0.0%) |
| $50,000 to $74,999 | 46 (22.1%) | 162 (77.9%) |
| $75,000 to $99,999 | 151 (100.0%) | 0 (0.0%) |
| $100,000 and over | 455 (68.3%) | 211 (31.7%) |
Public vs Private Health Insurance Coverage by Age in Leming
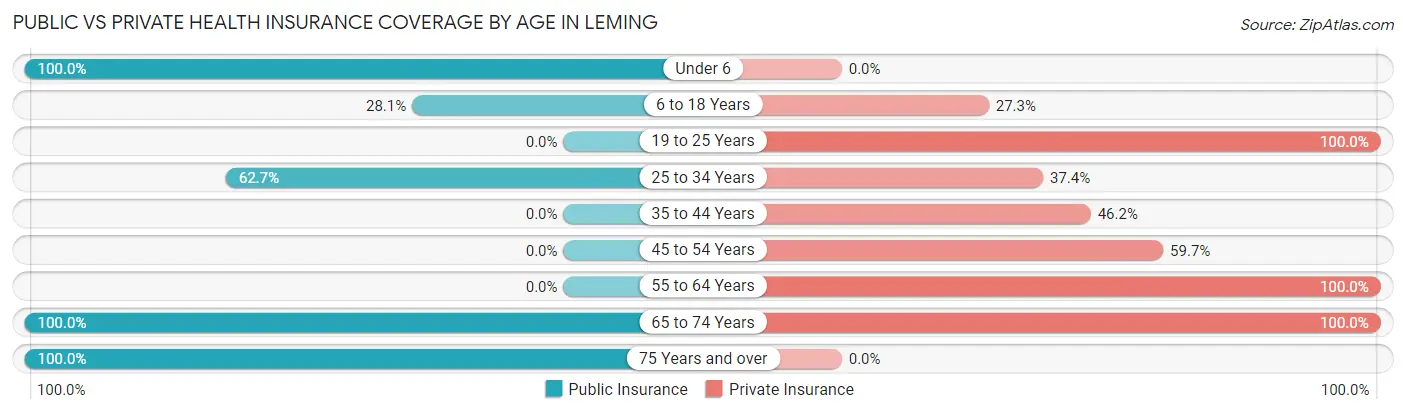
| Age Bracket | Public Insurance | Private Insurance |
| Under 6 | 88 (100.0%) | 0 (0.0%) |
| 6 to 18 Years | 141 (28.1%) | 137 (27.3%) |
| 19 to 25 Years | 0 (0.0%) | 28 (100.0%) |
| 25 to 34 Years | 52 (62.6%) | 31 (37.3%) |
| 35 to 44 Years | 0 (0.0%) | 67 (46.2%) |
| 45 to 54 Years | 0 (0.0%) | 136 (59.7%) |
| 55 to 64 Years | 0 (0.0%) | 19 (100.0%) |
| 65 to 74 Years | 15 (100.0%) | 15 (100.0%) |
| 75 Years and over | 60 (100.0%) | 0 (0.0%) |
| Total | 356 (30.5%) | 433 (37.1%) |
Disability Status by Sex by Age in Leming
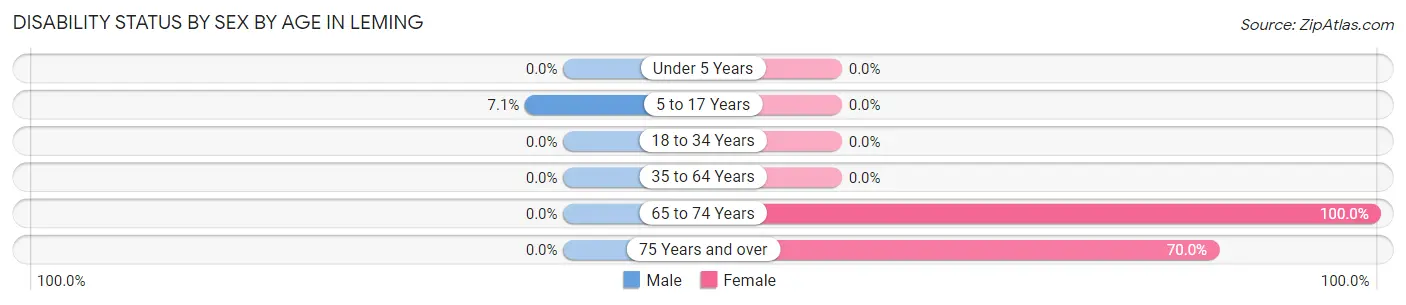
| Age Bracket | Male | Female |
| Under 5 Years | 0 (0.0%) | 0 (0.0%) |
| 5 to 17 Years | 21 (7.1%) | 0 (0.0%) |
| 18 to 34 Years | 0 (0.0%) | 0 (0.0%) |
| 35 to 64 Years | 0 (0.0%) | 0 (0.0%) |
| 65 to 74 Years | 0 (0.0%) | 15 (100.0%) |
| 75 Years and over | 0 (0.0%) | 42 (70.0%) |
Disability Class by Sex by Age in Leming
Disability Class: Hearing Difficulty
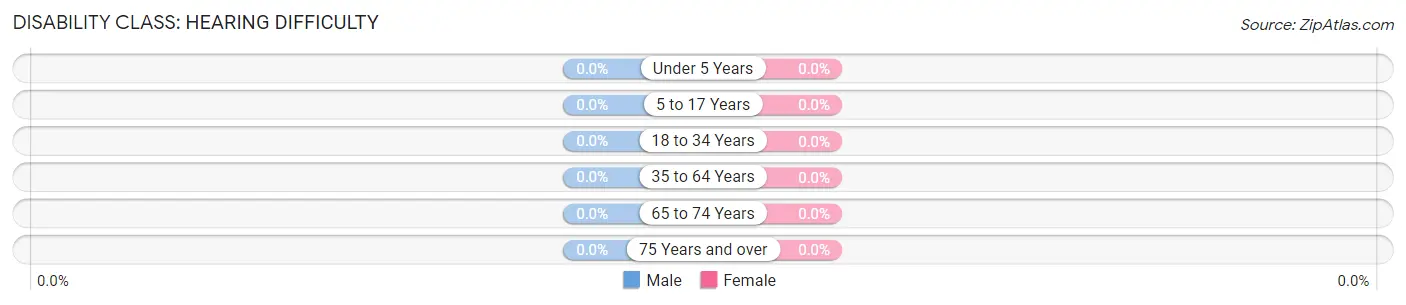
| Age Bracket | Male | Female |
| Under 5 Years | 0 (0.0%) | 0 (0.0%) |
| 5 to 17 Years | 0 (0.0%) | 0 (0.0%) |
| 18 to 34 Years | 0 (0.0%) | 0 (0.0%) |
| 35 to 64 Years | 0 (0.0%) | 0 (0.0%) |
| 65 to 74 Years | 0 (0.0%) | 0 (0.0%) |
| 75 Years and over | 0 (0.0%) | 0 (0.0%) |
Disability Class: Vision Difficulty
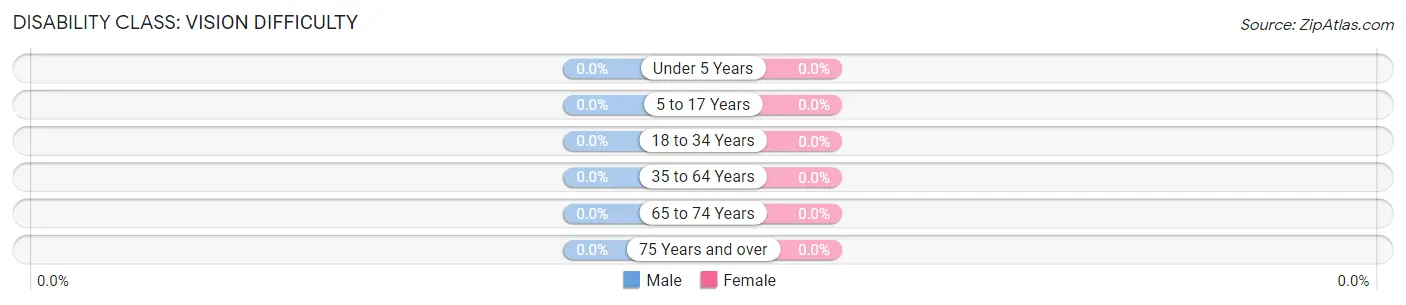
| Age Bracket | Male | Female |
| Under 5 Years | 0 (0.0%) | 0 (0.0%) |
| 5 to 17 Years | 0 (0.0%) | 0 (0.0%) |
| 18 to 34 Years | 0 (0.0%) | 0 (0.0%) |
| 35 to 64 Years | 0 (0.0%) | 0 (0.0%) |
| 65 to 74 Years | 0 (0.0%) | 0 (0.0%) |
| 75 Years and over | 0 (0.0%) | 0 (0.0%) |
Disability Class: Cognitive Difficulty
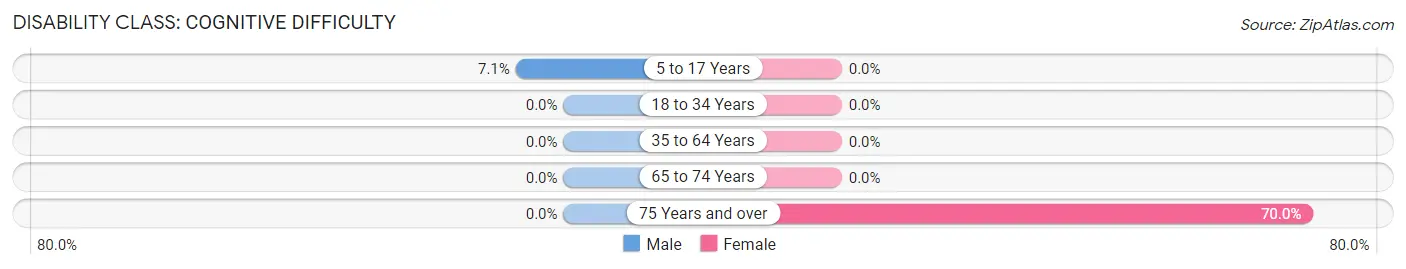
| Age Bracket | Male | Female |
| 5 to 17 Years | 21 (7.1%) | 0 (0.0%) |
| 18 to 34 Years | 0 (0.0%) | 0 (0.0%) |
| 35 to 64 Years | 0 (0.0%) | 0 (0.0%) |
| 65 to 74 Years | 0 (0.0%) | 0 (0.0%) |
| 75 Years and over | 0 (0.0%) | 42 (70.0%) |
Disability Class: Ambulatory Difficulty
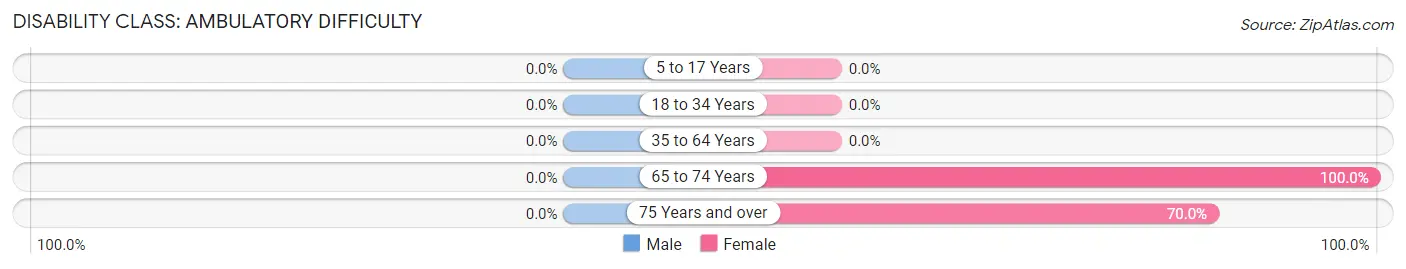
| Age Bracket | Male | Female |
| 5 to 17 Years | 0 (0.0%) | 0 (0.0%) |
| 18 to 34 Years | 0 (0.0%) | 0 (0.0%) |
| 35 to 64 Years | 0 (0.0%) | 0 (0.0%) |
| 65 to 74 Years | 0 (0.0%) | 15 (100.0%) |
| 75 Years and over | 0 (0.0%) | 42 (70.0%) |
Disability Class: Self-Care Difficulty
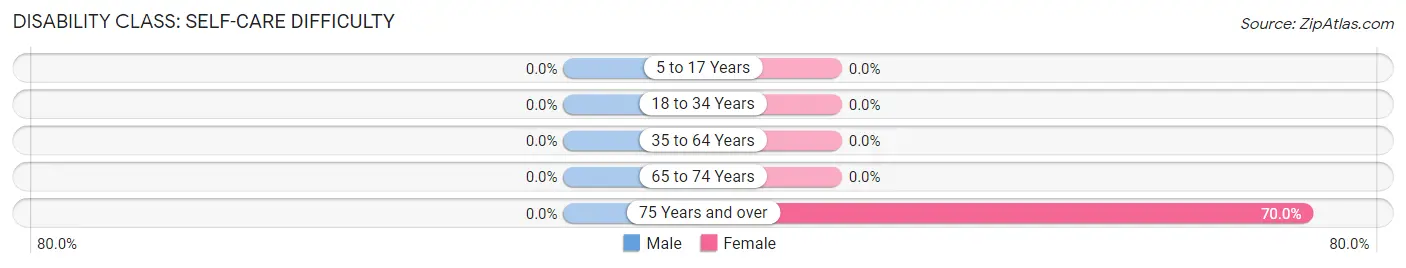
| Age Bracket | Male | Female |
| 5 to 17 Years | 0 (0.0%) | 0 (0.0%) |
| 18 to 34 Years | 0 (0.0%) | 0 (0.0%) |
| 35 to 64 Years | 0 (0.0%) | 0 (0.0%) |
| 65 to 74 Years | 0 (0.0%) | 0 (0.0%) |
| 75 Years and over | 0 (0.0%) | 42 (70.0%) |
Technology Access in Leming
Computing Device Access in Leming
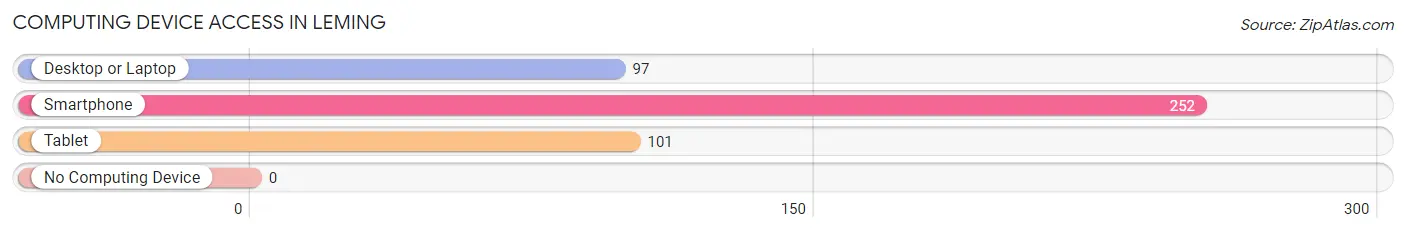
| Device Type | # Households | % Households |
| Desktop or Laptop | 97 | 38.5% |
| Smartphone | 252 | 100.0% |
| Tablet | 101 | 40.1% |
| No Computing Device | 0 | 0.0% |
| Total | 252 | 100.0% |
Internet Access in Leming
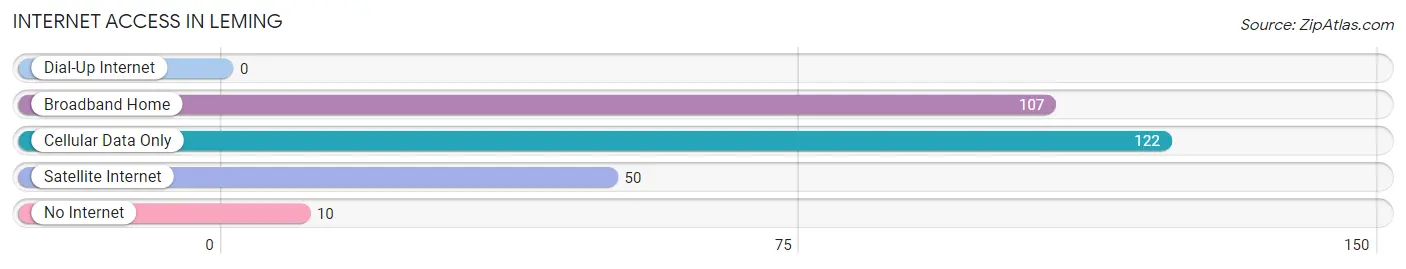
| Internet Type | # Households | % Households |
| Dial-Up Internet | 0 | 0.0% |
| Broadband Home | 107 | 42.5% |
| Cellular Data Only | 122 | 48.4% |
| Satellite Internet | 50 | 19.8% |
| No Internet | 10 | 4.0% |
| Total | 252 | 100.0% |
Leming Summary
Leming is a small unincorporated community located in Atascosa County, Texas. It is situated about 25 miles south of San Antonio and is part of the San Antonio–New Braunfels Metropolitan Statistical Area. The population of Leming was estimated to be around 1,000 in 2020.
History
Leming was founded in 1881 by German immigrants who had settled in the area. The town was named after one of the settlers, John Leming. The town was originally a farming community, but it soon became a center for the local oil industry. In the early 1900s, the town was home to several oil wells and refineries.
In the 1920s, the town experienced a period of growth as the oil industry flourished. The population of Leming increased from around 500 in 1920 to over 1,000 in 1930. During this time, the town was home to several businesses, including a bank, a hotel, a movie theater, and a variety of stores.
In the 1940s, the oil industry began to decline and the population of Leming began to decrease. By 1950, the population had dropped to around 500. The town continued to decline until the 1970s, when the population began to slowly increase again.
Geography
Leming is located in Atascosa County, Texas. It is situated about 25 miles south of San Antonio and is part of the San Antonio–New Braunfels Metropolitan Statistical Area. The town is located on the banks of the San Antonio River and is surrounded by rolling hills and farmland.
Economy
The economy of Leming is largely based on agriculture and oil production. The town is home to several farms and ranches, as well as several oil wells and refineries. The town is also home to several small businesses, including a grocery store, a hardware store, and a few restaurants.
Demographics
As of 2020, the population of Leming was estimated to be around 1,000. The town is predominantly white, with around 90% of the population identifying as such. The remaining 10% of the population is made up of African Americans, Hispanics, and other ethnicities. The median household income in Leming is around $45,000, and the median home value is around $100,000.
Conclusion
Leming is a small unincorporated community located in Atascosa County, Texas. It is situated about 25 miles south of San Antonio and is part of the San Antonio–New Braunfels Metropolitan Statistical Area. The population of Leming was estimated to be around 1,000 in 2020. The town is largely based on agriculture and oil production, and the median household income is around $45,000. Leming is predominantly white, with around 90% of the population identifying as such. The remaining 10% of the population is made up of African Americans, Hispanics, and other ethnicities.
Common Questions
What is Per Capita Income in Leming?
Per Capita income in Leming is $20,269.
What is the Median Family Income in Leming?
Median Family Income in Leming is $94,226.
What is the Median Household income in Leming?
Median Household Income in Leming is $93,155.
What is Income or Wage Gap in Leming?
Income or Wage Gap in Leming is 45.8%.
Women in Leming earn 54.2 cents for every dollar earned by a man.
What is Inequality or Gini Index in Leming?
Inequality or Gini Index in Leming is 0.31.
What is the Total Population of Leming?
Total Population of Leming is 1,168.
What is the Total Male Population of Leming?
Total Male Population of Leming is 646.
What is the Total Female Population of Leming?
Total Female Population of Leming is 522.
What is the Ratio of Males per 100 Females in Leming?
There are 123.75 Males per 100 Females in Leming.
What is the Ratio of Females per 100 Males in Leming?
There are 80.80 Females per 100 Males in Leming.
What is the Median Population Age in Leming?
Median Population Age in Leming is 18.9 Years.
What is the Average Family Size in Leming
Average Family Size in Leming is 5.2 People.
What is the Average Household Size in Leming
Average Household Size in Leming is 4.6 People.
How Large is the Labor Force in Leming?
There are 590 People in the Labor Forcein in Leming.
What is the Percentage of People in the Labor Force in Leming?
77.0% of People are in the Labor Force in Leming.
What is the Unemployment Rate in Leming?
Unemployment Rate in Leming is 10.8%.