Lamesa, TX Map & Demographics
Lamesa Map
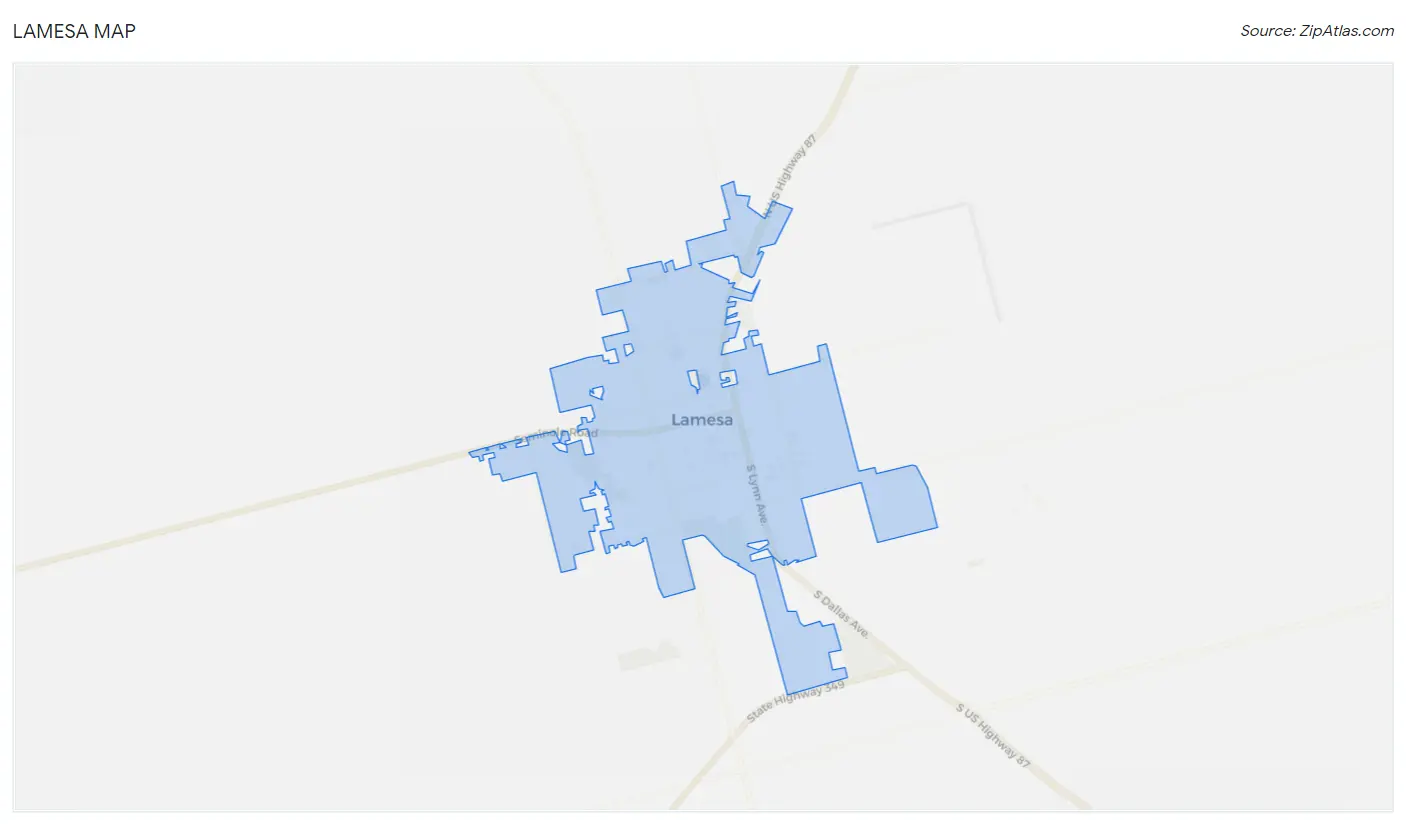
Lamesa Overview
$23,641
PER CAPITA INCOME
$56,171
AVG FAMILY INCOME
$39,434
AVG HOUSEHOLD INCOME
42.6%
WAGE / INCOME GAP [ % ]
57.4¢/ $1
WAGE / INCOME GAP [ $ ]
0.50
INEQUALITY / GINI INDEX
8,571
TOTAL POPULATION
4,203
MALE POPULATION
4,368
FEMALE POPULATION
96.22
MALES / 100 FEMALES
103.93
FEMALES / 100 MALES
33.1
MEDIAN AGE
3.3
AVG FAMILY SIZE
2.5
AVG HOUSEHOLD SIZE
3,832
LABOR FORCE [ PEOPLE ]
60.6%
PERCENT IN LABOR FORCE
11.0%
UNEMPLOYMENT RATE
Lamesa Zip Codes
Lamesa Area Codes
Income in Lamesa
Income Overview in Lamesa
Per Capita Income in Lamesa is $23,641, while median incomes of families and households are $56,171 and $39,434 respectively.
| Characteristic | Number | Measure |
| Per Capita Income | 8,571 | $23,641 |
| Median Family Income | 2,053 | $56,171 |
| Mean Family Income | 2,053 | $76,320 |
| Median Household Income | 3,419 | $39,434 |
| Mean Household Income | 3,419 | $61,336 |
| Income Deficit | 2,053 | $0 |
| Wage / Income Gap (%) | 8,571 | 42.57% |
| Wage / Income Gap ($) | 8,571 | 57.43¢ per $1 |
| Gini / Inequality Index | 8,571 | 0.50 |
Earnings by Sex in Lamesa
Average Earnings in Lamesa are $27,631, $40,912 for men and $23,494 for women, a difference of 42.6%.
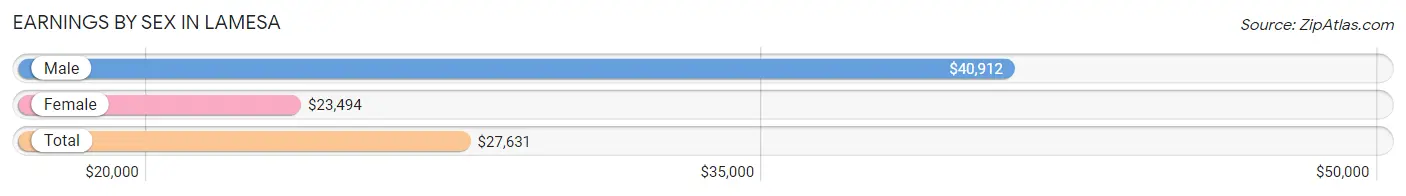
| Sex | Number | Average Earnings |
| Male | 2,151 (53.2%) | $40,912 |
| Female | 1,891 (46.8%) | $23,494 |
| Total | 4,042 (100.0%) | $27,631 |
Earnings by Sex by Income Bracket in Lamesa
The most common earnings brackets in Lamesa are $55,000 to $64,999 for men (339 | 15.8%) and $22,500 to $24,999 for women (225 | 11.9%).
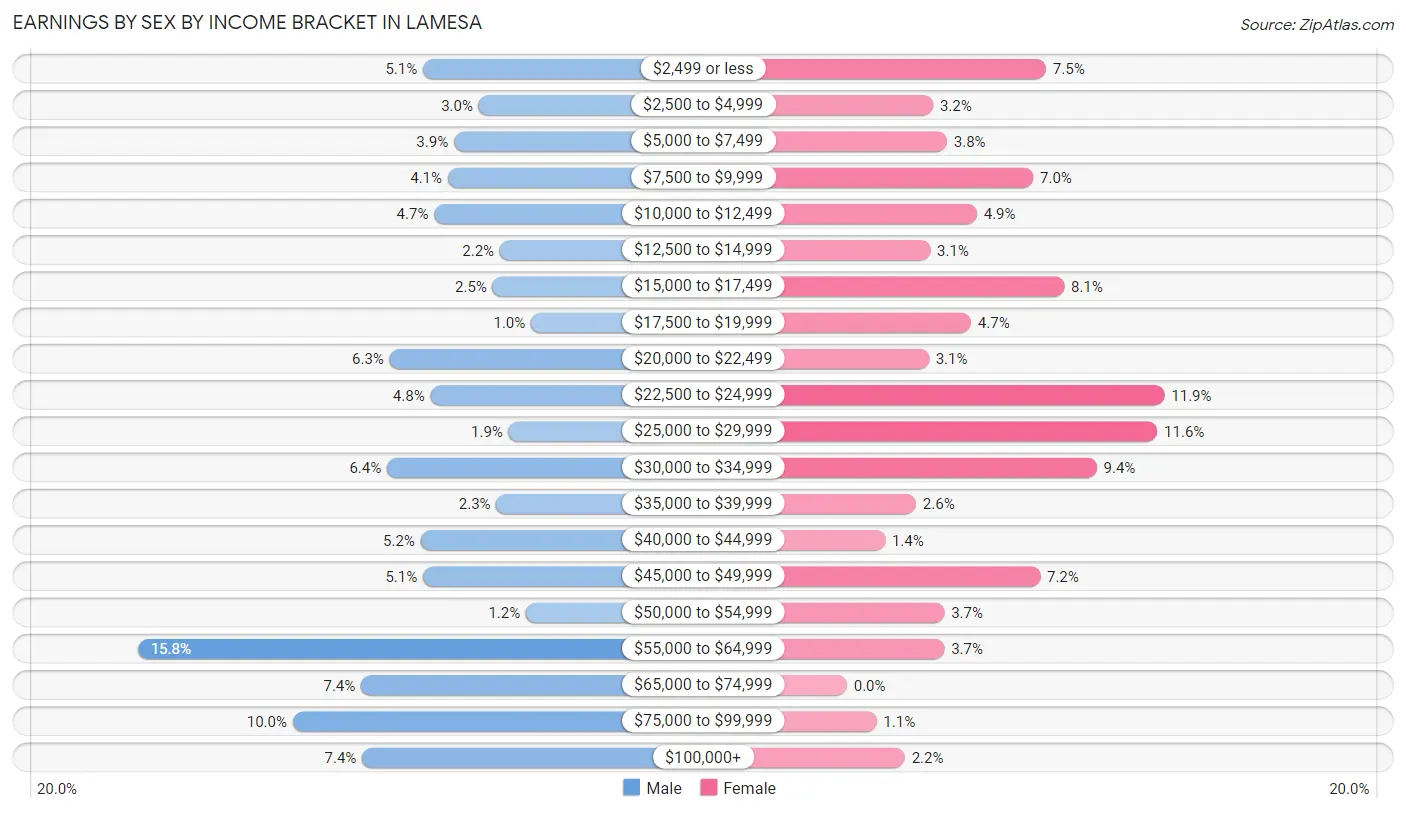
| Income | Male | Female |
| $2,499 or less | 109 (5.1%) | 141 (7.5%) |
| $2,500 to $4,999 | 64 (3.0%) | 61 (3.2%) |
| $5,000 to $7,499 | 84 (3.9%) | 71 (3.7%) |
| $7,500 to $9,999 | 89 (4.1%) | 132 (7.0%) |
| $10,000 to $12,499 | 100 (4.6%) | 92 (4.9%) |
| $12,500 to $14,999 | 47 (2.2%) | 59 (3.1%) |
| $15,000 to $17,499 | 53 (2.5%) | 154 (8.1%) |
| $17,500 to $19,999 | 22 (1.0%) | 88 (4.6%) |
| $20,000 to $22,499 | 136 (6.3%) | 58 (3.1%) |
| $22,500 to $24,999 | 103 (4.8%) | 225 (11.9%) |
| $25,000 to $29,999 | 40 (1.9%) | 220 (11.6%) |
| $30,000 to $34,999 | 138 (6.4%) | 177 (9.4%) |
| $35,000 to $39,999 | 50 (2.3%) | 49 (2.6%) |
| $40,000 to $44,999 | 111 (5.2%) | 27 (1.4%) |
| $45,000 to $49,999 | 109 (5.1%) | 137 (7.2%) |
| $50,000 to $54,999 | 26 (1.2%) | 69 (3.6%) |
| $55,000 to $64,999 | 339 (15.8%) | 69 (3.6%) |
| $65,000 to $74,999 | 159 (7.4%) | 0 (0.0%) |
| $75,000 to $99,999 | 214 (10.0%) | 21 (1.1%) |
| $100,000+ | 158 (7.3%) | 41 (2.2%) |
| Total | 2,151 (100.0%) | 1,891 (100.0%) |
Earnings by Sex by Educational Attainment in Lamesa
Average earnings in Lamesa are $42,354 for men and $24,788 for women, a difference of 41.5%. Men with an educational attainment of graduate degree enjoy the highest average annual earnings of $83,750, while those with high school diploma education earn the least with $45,404. Women with an educational attainment of bachelor's degree earn the most with the average annual earnings of $45,938, while those with less than high school education have the smallest earnings of $14,135.
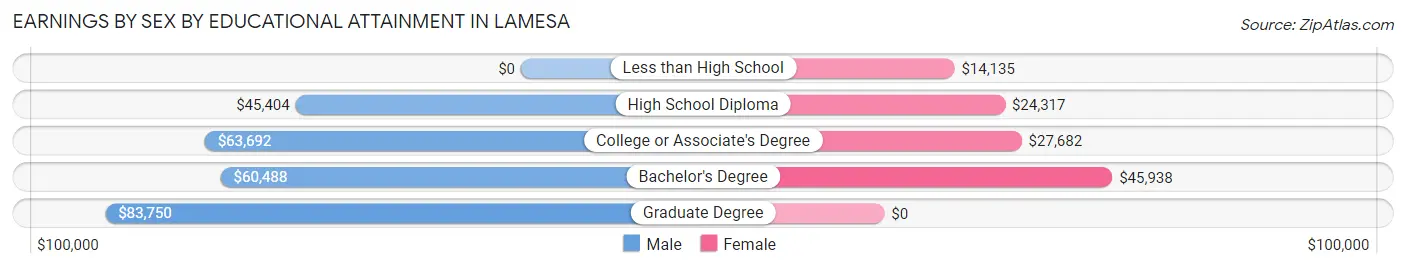
| Educational Attainment | Male Income | Female Income |
| Less than High School | - | - |
| High School Diploma | $45,404 | $24,317 |
| College or Associate's Degree | $63,692 | $27,682 |
| Bachelor's Degree | $60,488 | $45,938 |
| Graduate Degree | $83,750 | $0 |
| Total | $42,354 | $24,788 |
Family Income in Lamesa
Family Income Brackets in Lamesa
According to the Lamesa family income data, there are 370 families falling into the $50,000 to $74,999 income range, which is the most common income bracket and makes up 18.0% of all families. Conversely, the $200,000+ income bracket is the least frequent group with only 51 families (2.5%) belonging to this category.
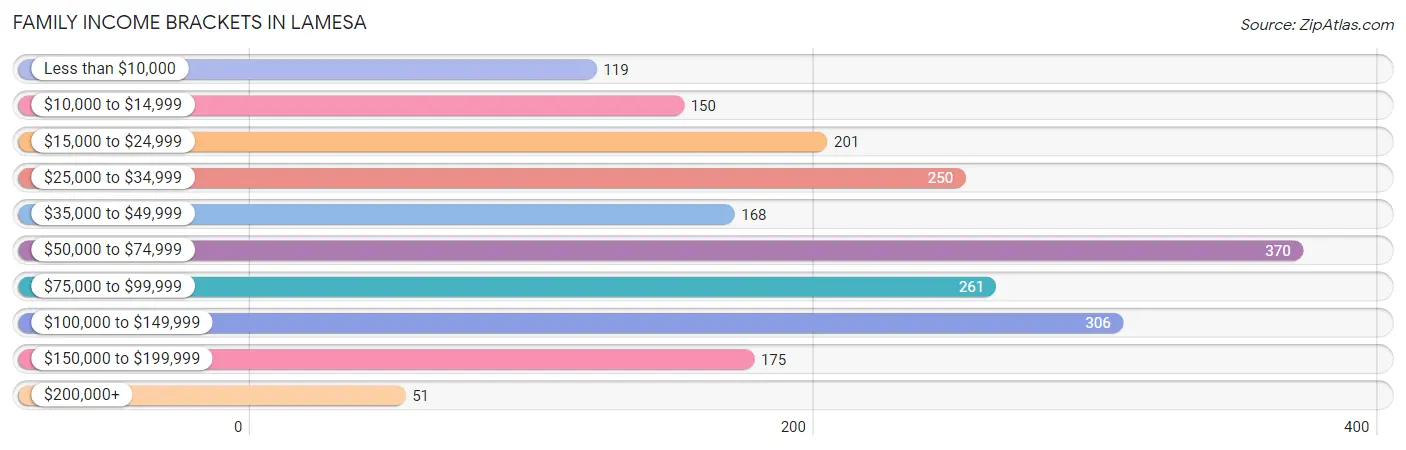
| Income Bracket | # Families | % Families |
| Less than $10,000 | 119 | 5.8% |
| $10,000 to $14,999 | 150 | 7.3% |
| $15,000 to $24,999 | 201 | 9.8% |
| $25,000 to $34,999 | 250 | 12.2% |
| $35,000 to $49,999 | 168 | 8.2% |
| $50,000 to $74,999 | 370 | 18.0% |
| $75,000 to $99,999 | 261 | 12.7% |
| $100,000 to $149,999 | 306 | 14.9% |
| $150,000 to $199,999 | 175 | 8.5% |
| $200,000+ | 51 | 2.5% |
Family Income by Famaliy Size in Lamesa
3-person families (425 | 20.7%) account for the highest median family income in Lamesa with $76,406 per family, while 3-person families (425 | 20.7%) have the highest median income of $25,469 per family member.
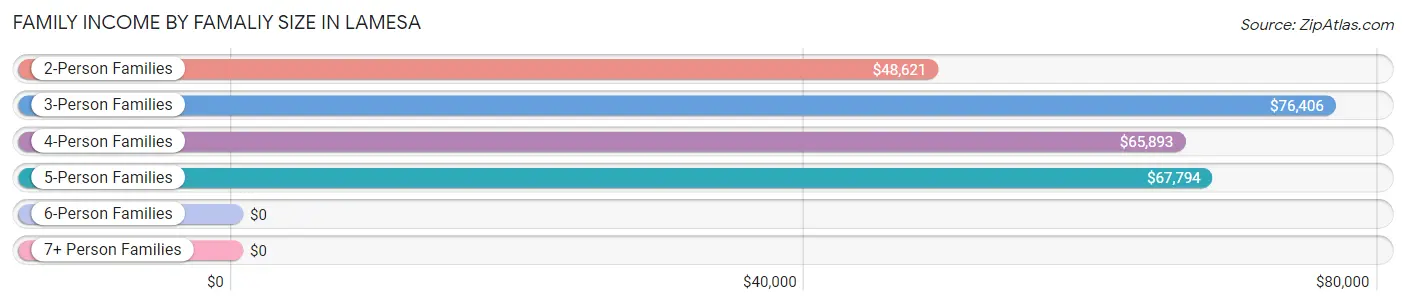
| Income Bracket | # Families | Median Income |
| 2-Person Families | 866 (42.2%) | $48,621 |
| 3-Person Families | 425 (20.7%) | $76,406 |
| 4-Person Families | 523 (25.5%) | $65,893 |
| 5-Person Families | 126 (6.1%) | $67,794 |
| 6-Person Families | 95 (4.6%) | $0 |
| 7+ Person Families | 18 (0.9%) | $0 |
| Total | 2,053 (100.0%) | $56,171 |
Family Income by Number of Earners in Lamesa
The median family income in Lamesa is $56,171, with families comprising 3+ earners (274) having the highest median family income of $113,393, while families with no earners (259) have the lowest median family income of $18,403, accounting for 13.4% and 12.6% of families, respectively.
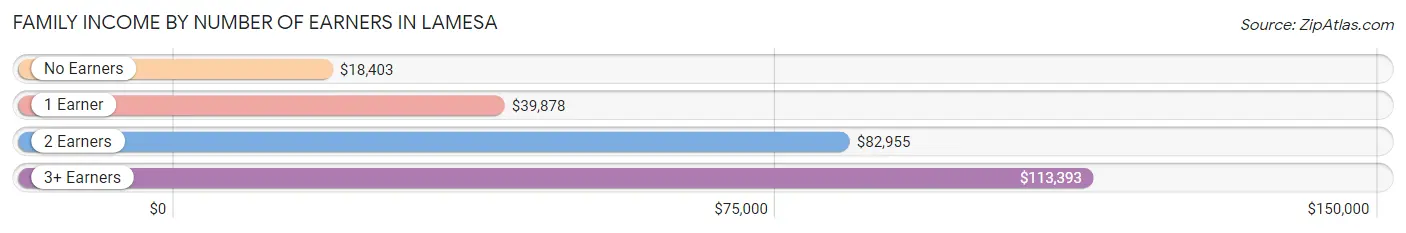
| Number of Earners | # Families | Median Income |
| No Earners | 259 (12.6%) | $18,403 |
| 1 Earner | 802 (39.1%) | $39,878 |
| 2 Earners | 718 (35.0%) | $82,955 |
| 3+ Earners | 274 (13.4%) | $113,393 |
| Total | 2,053 (100.0%) | $56,171 |
Household Income in Lamesa
Household Income Brackets in Lamesa
With 708 households falling in the category, the $15,000 to $24,999 income range is the most frequent in Lamesa, accounting for 20.7% of all households. In contrast, only 68 households (2.0%) fall into the $200,000+ income bracket, making it the least populous group.
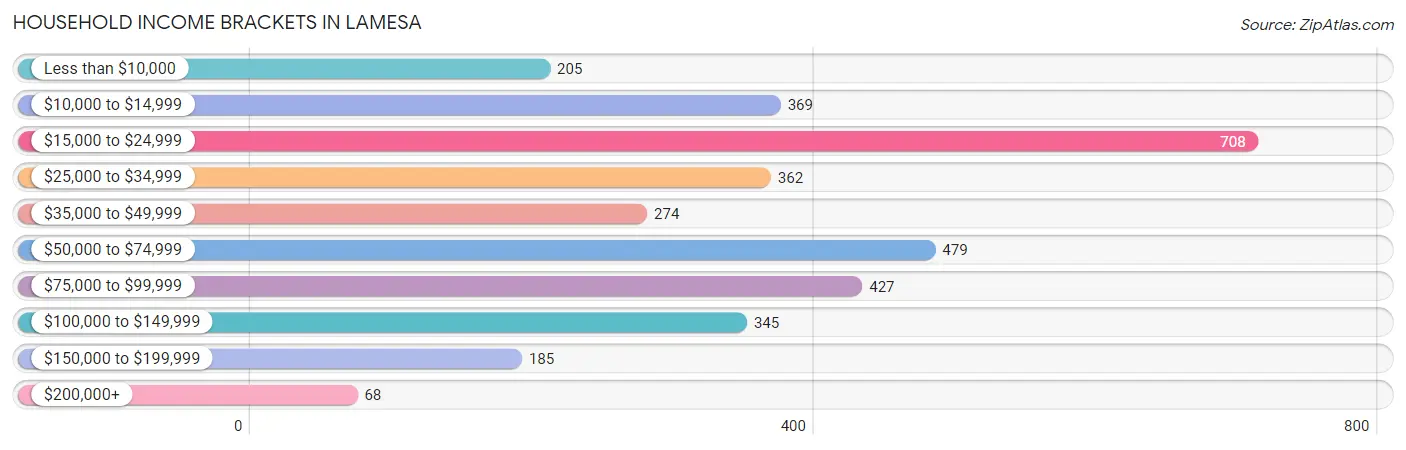
| Income Bracket | # Households | % Households |
| Less than $10,000 | 205 | 6.0% |
| $10,000 to $14,999 | 369 | 10.8% |
| $15,000 to $24,999 | 708 | 20.7% |
| $25,000 to $34,999 | 362 | 10.6% |
| $35,000 to $49,999 | 274 | 8.0% |
| $50,000 to $74,999 | 479 | 14.0% |
| $75,000 to $99,999 | 427 | 12.5% |
| $100,000 to $149,999 | 345 | 10.1% |
| $150,000 to $199,999 | 185 | 5.4% |
| $200,000+ | 68 | 2.0% |
Household Income by Householder Age in Lamesa
The median household income in Lamesa is $39,434, with the highest median household income of $55,151 found in the 15 to 24 years age bracket for the primary householder. A total of 365 households (10.7%) fall into this category. Meanwhile, the 65+ years age bracket for the primary householder has the lowest median household income of $26,607, with 932 households (27.3%) in this group.
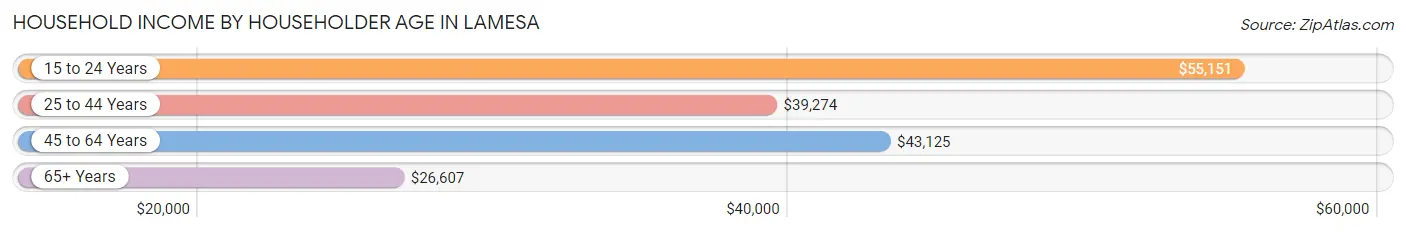
| Income Bracket | # Households | Median Income |
| 15 to 24 Years | 365 (10.7%) | $55,151 |
| 25 to 44 Years | 1,018 (29.8%) | $39,274 |
| 45 to 64 Years | 1,104 (32.3%) | $43,125 |
| 65+ Years | 932 (27.3%) | $26,607 |
| Total | 3,419 (100.0%) | $39,434 |
Poverty in Lamesa
Income Below Poverty by Sex and Age in Lamesa
With 26.9% poverty level for males and 29.7% for females among the residents of Lamesa, 12 to 14 year old males and 5 year old females are the most vulnerable to poverty, with 168 males (60.4%) and 31 females (63.3%) in their respective age groups living below the poverty level.
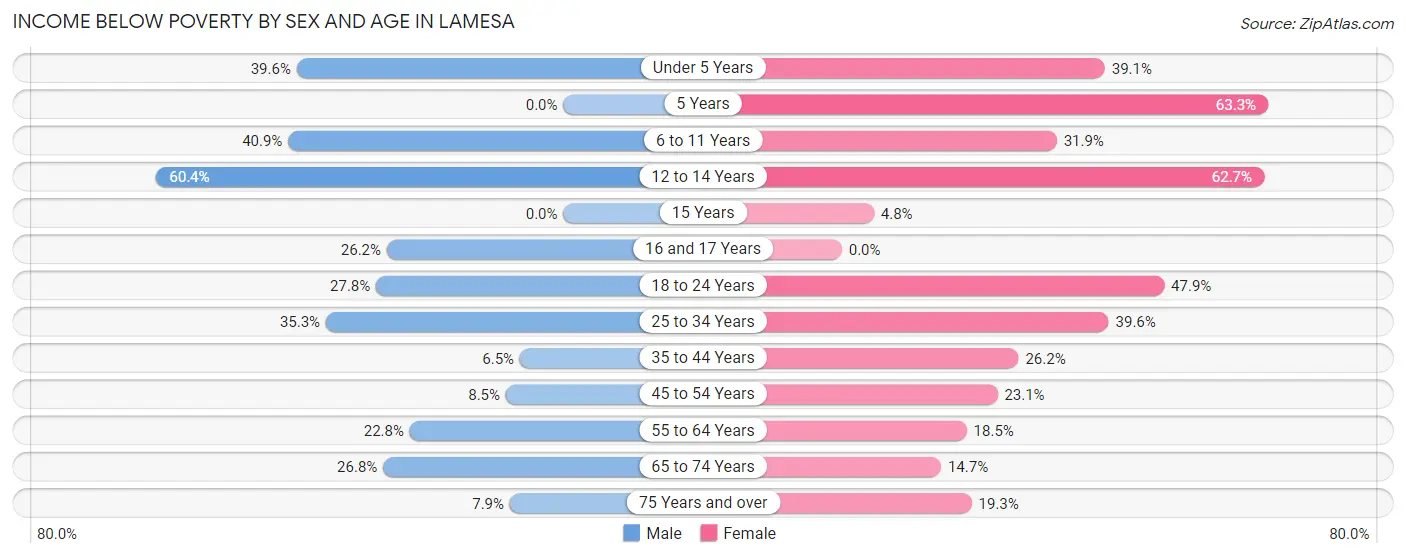
| Age Bracket | Male | Female |
| Under 5 Years | 135 (39.6%) | 132 (39.1%) |
| 5 Years | 0 (0.0%) | 31 (63.3%) |
| 6 to 11 Years | 181 (40.9%) | 157 (31.9%) |
| 12 to 14 Years | 168 (60.4%) | 94 (62.7%) |
| 15 Years | 0 (0.0%) | 4 (4.8%) |
| 16 and 17 Years | 38 (26.2%) | 0 (0.0%) |
| 18 to 24 Years | 144 (27.8%) | 202 (47.9%) |
| 25 to 34 Years | 202 (35.2%) | 227 (39.6%) |
| 35 to 44 Years | 30 (6.5%) | 132 (26.2%) |
| 45 to 54 Years | 35 (8.5%) | 98 (23.1%) |
| 55 to 64 Years | 96 (22.8%) | 84 (18.5%) |
| 65 to 74 Years | 80 (26.8%) | 61 (14.7%) |
| 75 Years and over | 17 (7.9%) | 64 (19.3%) |
| Total | 1,126 (26.9%) | 1,286 (29.7%) |
Income Above Poverty by Sex and Age in Lamesa
According to the poverty statistics in Lamesa, males aged 5 years and females aged 16 and 17 years are the age groups that are most secure financially, with 100.0% of males and 100.0% of females in these age groups living above the poverty line.
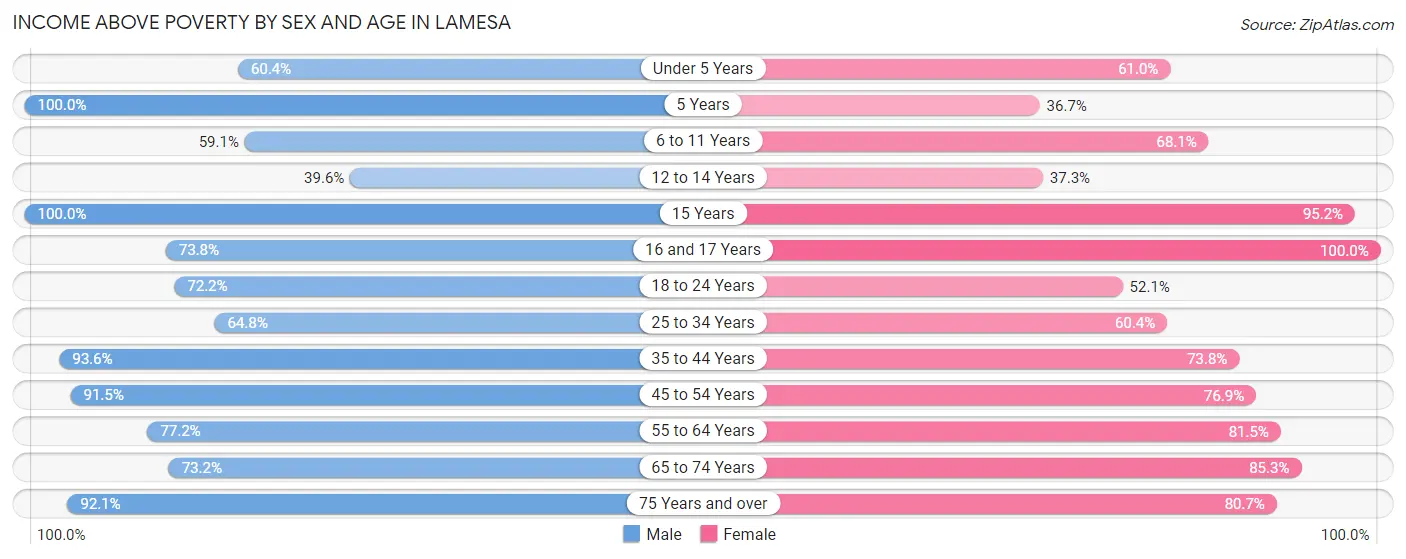
| Age Bracket | Male | Female |
| Under 5 Years | 206 (60.4%) | 206 (61.0%) |
| 5 Years | 46 (100.0%) | 18 (36.7%) |
| 6 to 11 Years | 262 (59.1%) | 335 (68.1%) |
| 12 to 14 Years | 110 (39.6%) | 56 (37.3%) |
| 15 Years | 26 (100.0%) | 80 (95.2%) |
| 16 and 17 Years | 107 (73.8%) | 94 (100.0%) |
| 18 to 24 Years | 374 (72.2%) | 220 (52.1%) |
| 25 to 34 Years | 371 (64.7%) | 346 (60.4%) |
| 35 to 44 Years | 435 (93.5%) | 371 (73.8%) |
| 45 to 54 Years | 375 (91.5%) | 326 (76.9%) |
| 55 to 64 Years | 325 (77.2%) | 369 (81.5%) |
| 65 to 74 Years | 219 (73.2%) | 353 (85.3%) |
| 75 Years and over | 197 (92.1%) | 268 (80.7%) |
| Total | 3,053 (73.1%) | 3,042 (70.3%) |
Income Below Poverty Among Married-Couple Families in Lamesa
The poverty statistics for married-couple families in Lamesa show that 14.7% or 185 of the total 1,256 families live below the poverty line. Families with 3 or 4 children have the highest poverty rate of 37.1%, comprising of 36 families. On the other hand, families with 1 or 2 children have the lowest poverty rate of 2.8%, which includes 12 families.
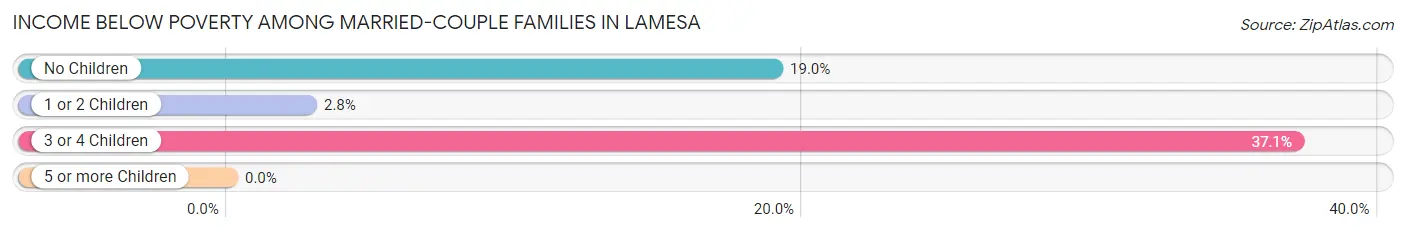
| Children | Above Poverty | Below Poverty |
| No Children | 585 (81.0%) | 137 (19.0%) |
| 1 or 2 Children | 425 (97.3%) | 12 (2.8%) |
| 3 or 4 Children | 61 (62.9%) | 36 (37.1%) |
| 5 or more Children | 0 (0.0%) | 0 (0.0%) |
| Total | 1,071 (85.3%) | 185 (14.7%) |
Income Below Poverty Among Single-Parent Households in Lamesa
According to the poverty data in Lamesa, 17.7% or 42 single-father households and 51.2% or 287 single-mother households are living below the poverty line. Among single-father households, those with 5 or more children have the highest poverty rate, with 42 households (100.0%) experiencing poverty. Likewise, among single-mother households, those with 3 or 4 children have the highest poverty rate, with 114 households (86.4%) falling below the poverty line.
| Children | Single Father | Single Mother |
| No Children | 0 (0.0%) | 54 (27.8%) |
| 1 or 2 Children | 0 (0.0%) | 119 (51.3%) |
| 3 or 4 Children | 0 (0.0%) | 114 (86.4%) |
| 5 or more Children | 42 (100.0%) | 0 (0.0%) |
| Total | 42 (17.7%) | 287 (51.2%) |
Income Below Poverty Among Married-Couple vs Single-Parent Households in Lamesa
The poverty data for Lamesa shows that 185 of the married-couple family households (14.7%) and 329 of the single-parent households (41.3%) are living below the poverty level. Within the married-couple family households, those with 3 or 4 children have the highest poverty rate, with 36 households (37.1%) falling below the poverty line. Among the single-parent households, those with 5 or more children have the highest poverty rate, with 42 household (95.5%) living below poverty.
| Children | Married-Couple Families | Single-Parent Households |
| No Children | 137 (19.0%) | 54 (19.8%) |
| 1 or 2 Children | 12 (2.8%) | 119 (35.6%) |
| 3 or 4 Children | 36 (37.1%) | 114 (78.1%) |
| 5 or more Children | 0 (0.0%) | 42 (95.5%) |
| Total | 185 (14.7%) | 329 (41.3%) |
Race in Lamesa
The most populous races in Lamesa are Hispanic or Latino (6,161 | 71.9%), White / Caucasian (5,275 | 61.5%), and Two or more Races (1,626 | 19.0%).
| Race | # Population | % Population |
| Asian | 0 | 0.0% |
| Black / African American | 267 | 3.1% |
| Hawaiian / Pacific | 1 | 0.0% |
| Hispanic or Latino | 6,161 | 71.9% |
| Native / Alaskan | 39 | 0.5% |
| White / Caucasian | 5,275 | 61.5% |
| Two or more Races | 1,626 | 19.0% |
| Some other Race | 1,363 | 15.9% |
| Total | 8,571 | 100.0% |
Ancestry in Lamesa
The most populous ancestries reported in Lamesa are Mexican (5,656 | 66.0%), American (540 | 6.3%), Irish (294 | 3.4%), German (268 | 3.1%), and English (220 | 2.6%), together accounting for 81.4% of all Lamesa residents.
| Ancestry | # Population | % Population |
| American | 540 | 6.3% |
| Apache | 6 | 0.1% |
| British | 7 | 0.1% |
| Canadian | 4 | 0.1% |
| Cherokee | 29 | 0.3% |
| Chickasaw | 10 | 0.1% |
| Choctaw | 20 | 0.2% |
| Czech | 18 | 0.2% |
| Dutch | 7 | 0.1% |
| English | 220 | 2.6% |
| European | 4 | 0.1% |
| Finnish | 5 | 0.1% |
| French | 69 | 0.8% |
| German | 268 | 3.1% |
| Guamanian / Chamorro | 1 | 0.0% |
| Irish | 294 | 3.4% |
| Italian | 104 | 1.2% |
| Jamaican | 19 | 0.2% |
| Mexican | 5,656 | 66.0% |
| Norwegian | 23 | 0.3% |
| Pennsylvania German | 50 | 0.6% |
| Scotch-Irish | 89 | 1.0% |
| Scottish | 87 | 1.0% |
| Spaniard | 4 | 0.1% |
| Spanish | 177 | 2.1% |
| Swedish | 39 | 0.5% |
| Turkish | 32 | 0.4% |
| Welsh | 31 | 0.4% | View All 28 Rows |
Immigrants in Lamesa
The most numerous immigrant groups reported in Lamesa came from Latin America (408 | 4.8%), Central America (400 | 4.7%), Mexico (400 | 4.7%), Caribbean (8 | 0.1%), and Jamaica (8 | 0.1%), together accounting for 14.3% of all Lamesa residents.
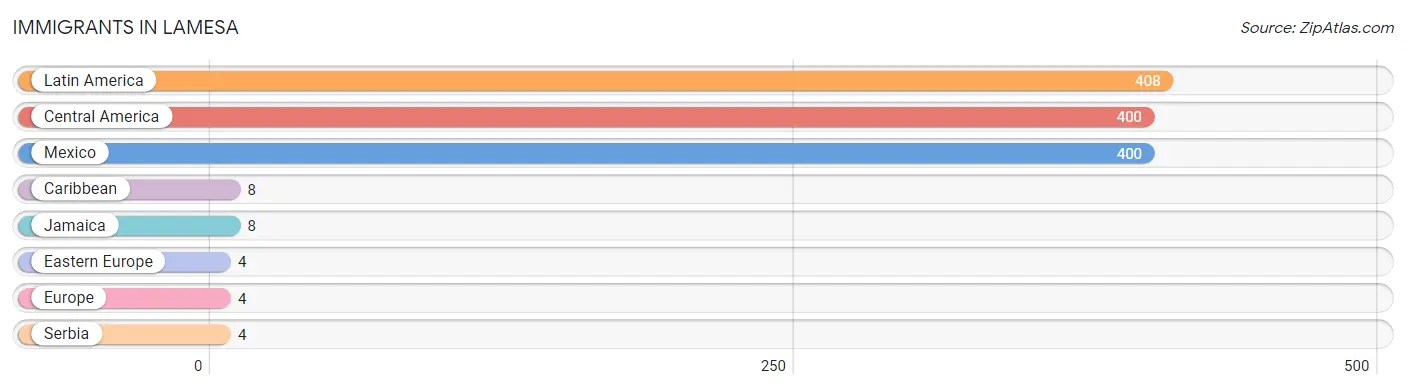
| Immigration Origin | # Population | % Population |
| Caribbean | 8 | 0.1% |
| Central America | 400 | 4.7% |
| Eastern Europe | 4 | 0.1% |
| Europe | 4 | 0.1% |
| Jamaica | 8 | 0.1% |
| Latin America | 408 | 4.8% |
| Mexico | 400 | 4.7% |
| Serbia | 4 | 0.1% | View All 8 Rows |
Sex and Age in Lamesa
Sex and Age in Lamesa
The most populous age groups in Lamesa are 10 to 14 Years (390 | 9.3%) for men and 10 to 14 Years (346 | 7.9%) for women.
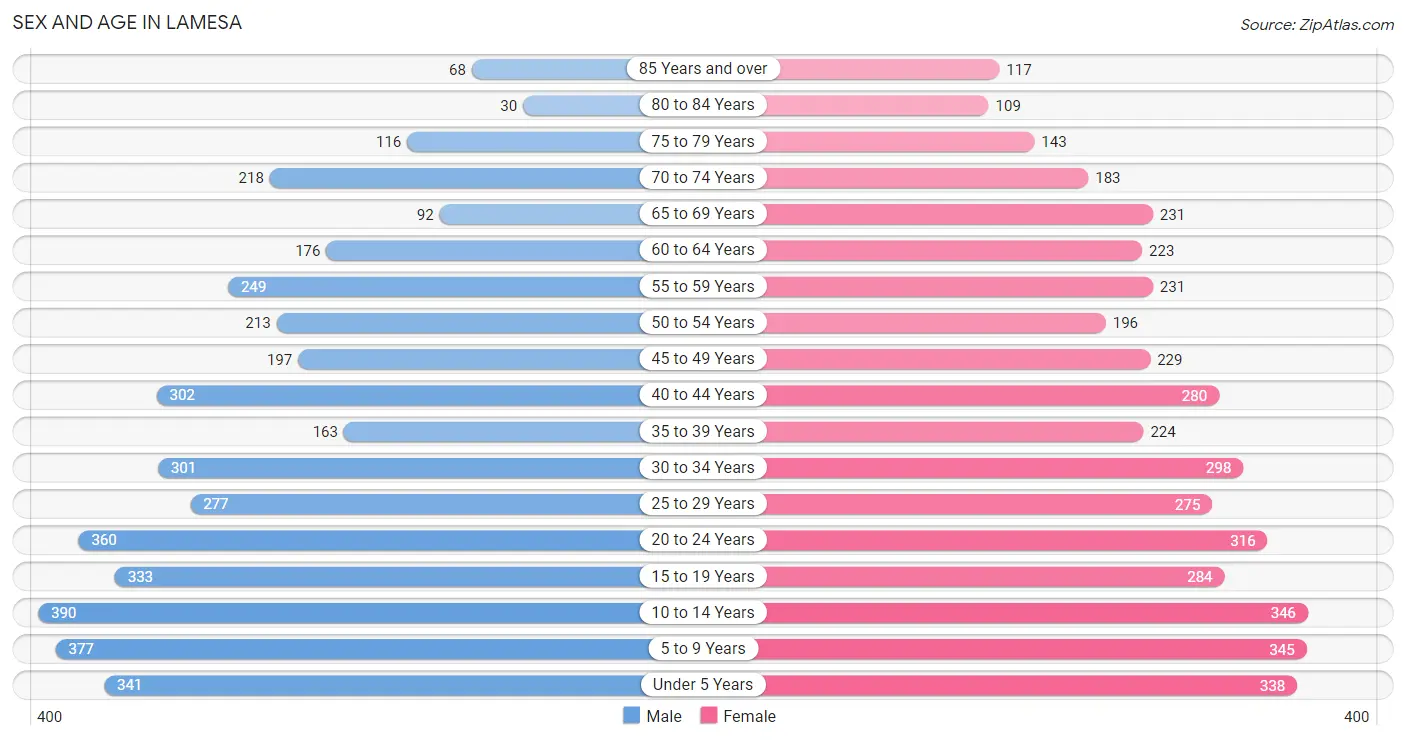
| Age Bracket | Male | Female |
| Under 5 Years | 341 (8.1%) | 338 (7.7%) |
| 5 to 9 Years | 377 (9.0%) | 345 (7.9%) |
| 10 to 14 Years | 390 (9.3%) | 346 (7.9%) |
| 15 to 19 Years | 333 (7.9%) | 284 (6.5%) |
| 20 to 24 Years | 360 (8.6%) | 316 (7.2%) |
| 25 to 29 Years | 277 (6.6%) | 275 (6.3%) |
| 30 to 34 Years | 301 (7.2%) | 298 (6.8%) |
| 35 to 39 Years | 163 (3.9%) | 224 (5.1%) |
| 40 to 44 Years | 302 (7.2%) | 280 (6.4%) |
| 45 to 49 Years | 197 (4.7%) | 229 (5.2%) |
| 50 to 54 Years | 213 (5.1%) | 196 (4.5%) |
| 55 to 59 Years | 249 (5.9%) | 231 (5.3%) |
| 60 to 64 Years | 176 (4.2%) | 223 (5.1%) |
| 65 to 69 Years | 92 (2.2%) | 231 (5.3%) |
| 70 to 74 Years | 218 (5.2%) | 183 (4.2%) |
| 75 to 79 Years | 116 (2.8%) | 143 (3.3%) |
| 80 to 84 Years | 30 (0.7%) | 109 (2.5%) |
| 85 Years and over | 68 (1.6%) | 117 (2.7%) |
| Total | 4,203 (100.0%) | 4,368 (100.0%) |
Families and Households in Lamesa
Median Family Size in Lamesa
The median family size in Lamesa is 3.30 persons per family, with single female/mother families (560 | 27.3%) accounting for the largest median family size of 3.43 persons per family. On the other hand, single male/father families (237 | 11.5%) represent the smallest median family size with 2.84 persons per family.
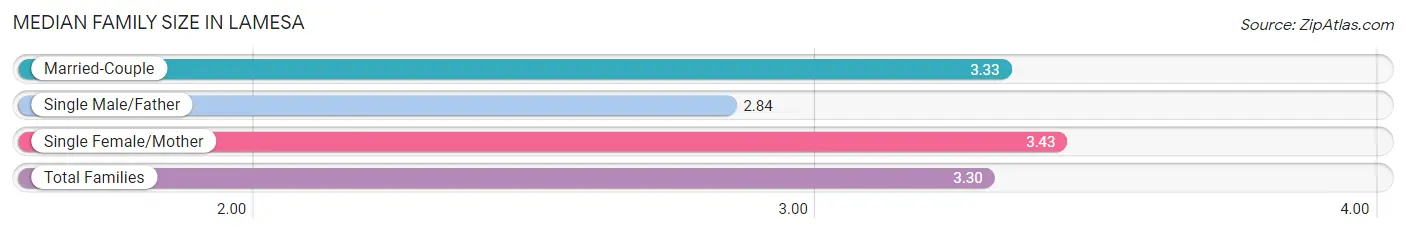
| Family Type | # Families | Family Size |
| Married-Couple | 1,256 (61.2%) | 3.33 |
| Single Male/Father | 237 (11.5%) | 2.84 |
| Single Female/Mother | 560 (27.3%) | 3.43 |
| Total Families | 2,053 (100.0%) | 3.30 |
Median Household Size in Lamesa
The median household size in Lamesa is 2.48 persons per household, with single female/mother households (560 | 16.4%) accounting for the largest median household size of 3.58 persons per household. non-family households (1,366 | 40.0%) represent the smallest median household size with 1.12 persons per household.
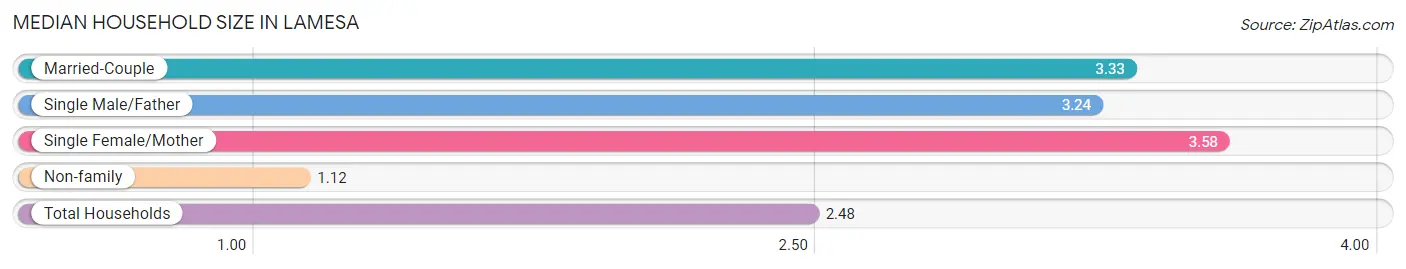
| Household Type | # Households | Household Size |
| Married-Couple | 1,256 (36.7%) | 3.33 |
| Single Male/Father | 237 (6.9%) | 3.24 |
| Single Female/Mother | 560 (16.4%) | 3.58 |
| Non-family | 1,366 (40.0%) | 1.12 |
| Total Households | 3,419 (100.0%) | 2.48 |
Household Size by Marriage Status in Lamesa
Out of a total of 3,419 households in Lamesa, 2,053 (60.1%) are family households, while 1,366 (40.0%) are nonfamily households. The most numerous type of family households are 2-person households, comprising 728, and the most common type of nonfamily households are 1-person households, comprising 1,179.
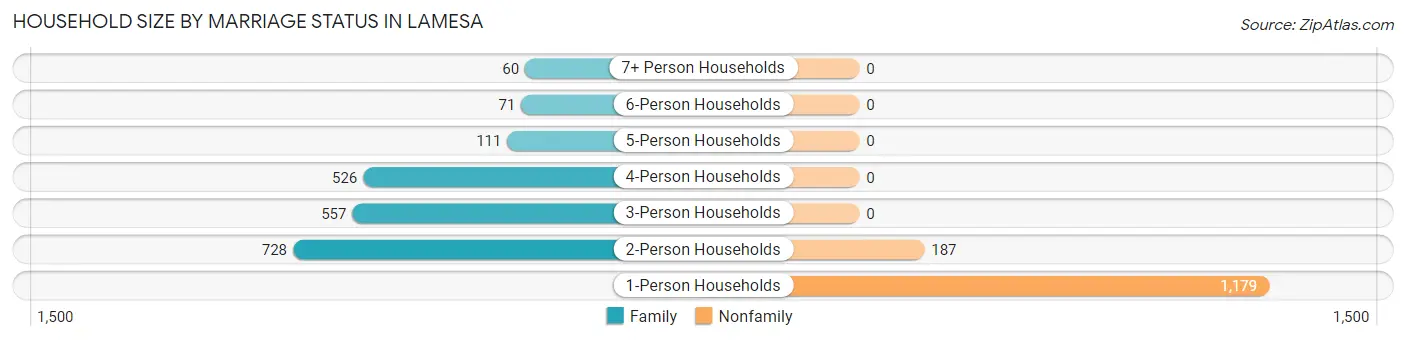
| Household Size | Family Households | Nonfamily Households |
| 1-Person Households | - | 1,179 (34.5%) |
| 2-Person Households | 728 (21.3%) | 187 (5.5%) |
| 3-Person Households | 557 (16.3%) | 0 (0.0%) |
| 4-Person Households | 526 (15.4%) | 0 (0.0%) |
| 5-Person Households | 111 (3.3%) | 0 (0.0%) |
| 6-Person Households | 71 (2.1%) | 0 (0.0%) |
| 7+ Person Households | 60 (1.8%) | 0 (0.0%) |
| Total | 2,053 (60.1%) | 1,366 (40.0%) |
Female Fertility in Lamesa
Fertility by Age in Lamesa
Average fertility rate in Lamesa is 65.0 births per 1,000 women. Women in the age bracket of 20 to 34 years have the highest fertility rate with 135.0 births per 1,000 women. Women in the age bracket of 20 to 34 years acount for 96.0% of all women with births.
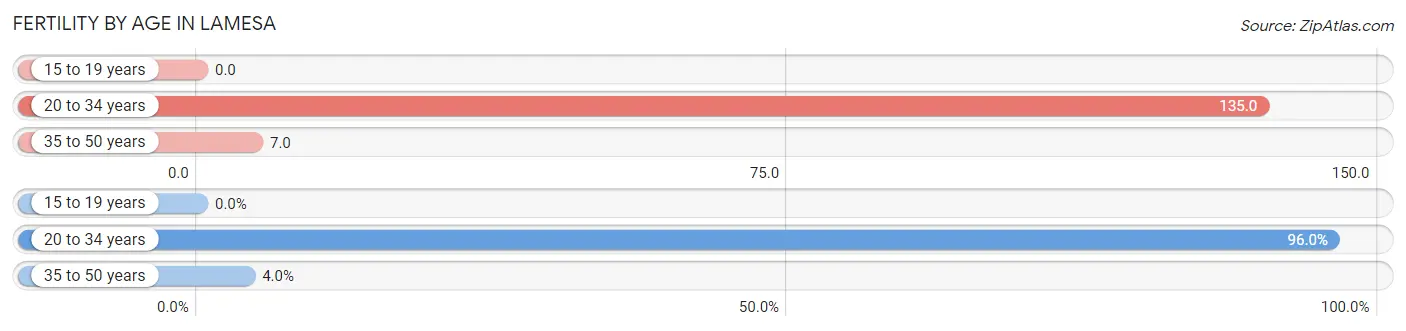
| Age Bracket | Women with Births | Births / 1,000 Women |
| 15 to 19 years | 0 (0.0%) | 0.0 |
| 20 to 34 years | 120 (96.0%) | 135.0 |
| 35 to 50 years | 5 (4.0%) | 7.0 |
| Total | 125 (100.0%) | 65.0 |
Fertility by Age by Marriage Status in Lamesa
50.4% of women with births (125) in Lamesa are married. The highest percentage of unmarried women with births falls into 20 to 34 years age bracket with 51.7% of them unmarried at the time of birth, while the lowest percentage of unmarried women with births belong to 35 to 50 years age bracket with 0.0% of them unmarried.
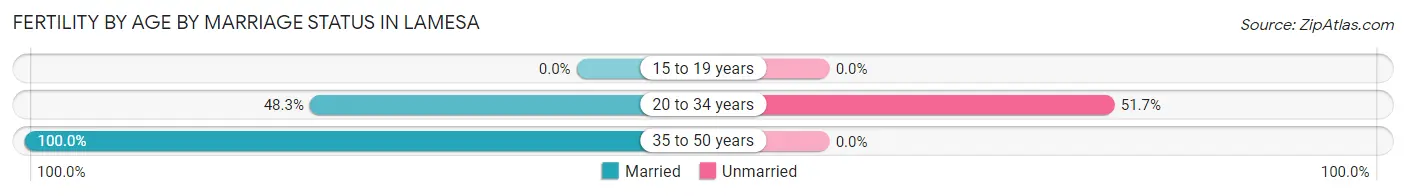
| Age Bracket | Married | Unmarried |
| 15 to 19 years | 0 (0.0%) | 0 (0.0%) |
| 20 to 34 years | 58 (48.3%) | 62 (51.7%) |
| 35 to 50 years | 5 (100.0%) | 0 (0.0%) |
| Total | 63 (50.4%) | 62 (49.6%) |
Fertility by Education in Lamesa
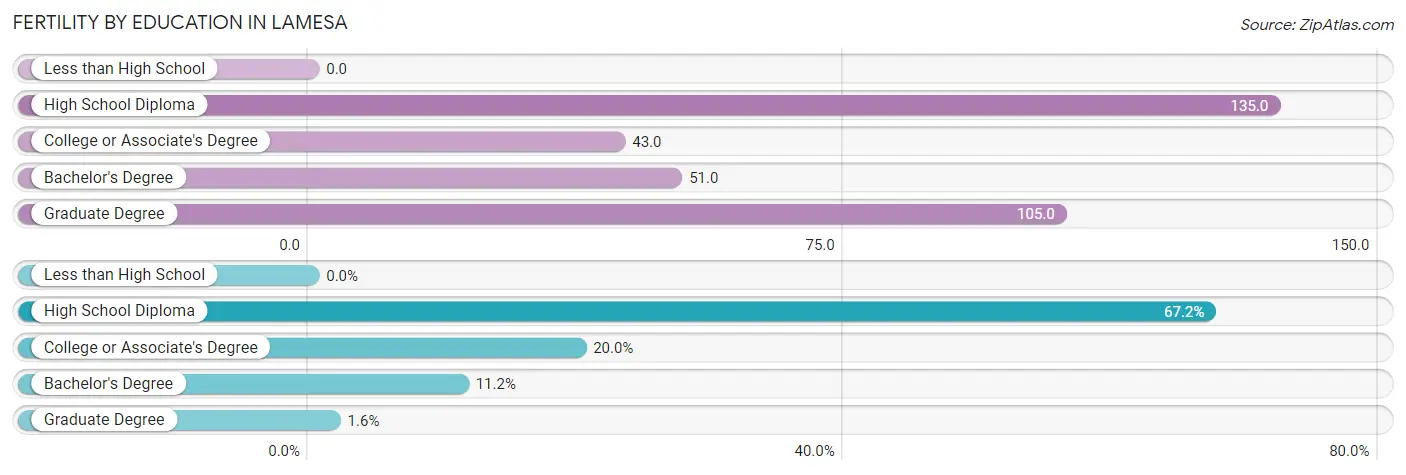
| Educational Attainment | Women with Births | Births / 1,000 Women |
| Less than High School | 0 (0.0%) | 0.0 |
| High School Diploma | 84 (67.2%) | 135.0 |
| College or Associate's Degree | 25 (20.0%) | 43.0 |
| Bachelor's Degree | 14 (11.2%) | 51.0 |
| Graduate Degree | 2 (1.6%) | 105.0 |
| Total | 125 (100.0%) | 65.0 |
Fertility by Education by Marriage Status in Lamesa
49.6% of women with births in Lamesa are unmarried. Women with the educational attainment of bachelor's degree are most likely to be married with 100.0% of them married at childbirth, while women with the educational attainment of college or associate's degree are least likely to be married with 100.0% of them unmarried at childbirth.
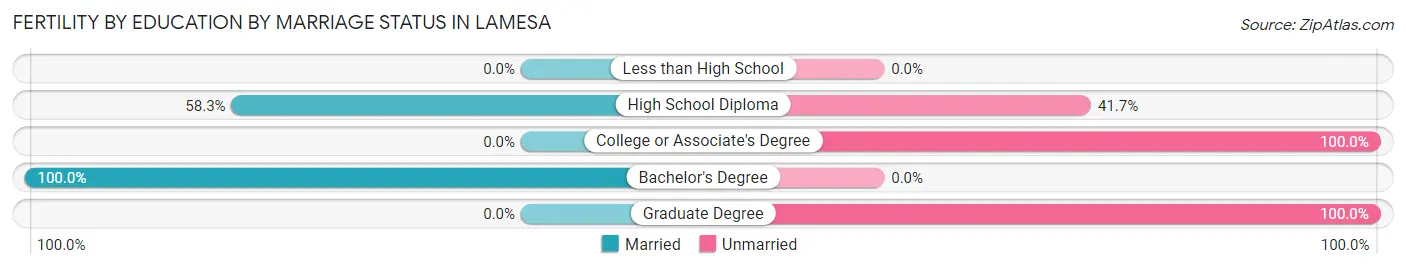
| Educational Attainment | Married | Unmarried |
| Less than High School | 0 (0.0%) | 0 (0.0%) |
| High School Diploma | 49 (58.3%) | 35 (41.7%) |
| College or Associate's Degree | 0 (0.0%) | 25 (100.0%) |
| Bachelor's Degree | 14 (100.0%) | 0 (0.0%) |
| Graduate Degree | 0 (0.0%) | 2 (100.0%) |
| Total | 63 (50.4%) | 62 (49.6%) |
Employment Characteristics in Lamesa
Employment by Class of Employer in Lamesa
Among the 3,367 employed individuals in Lamesa, private company employees (2,045 | 60.7%), local government employees (548 | 16.3%), and self-employed (not incorporated) (281 | 8.4%) make up the most common classes of employment.
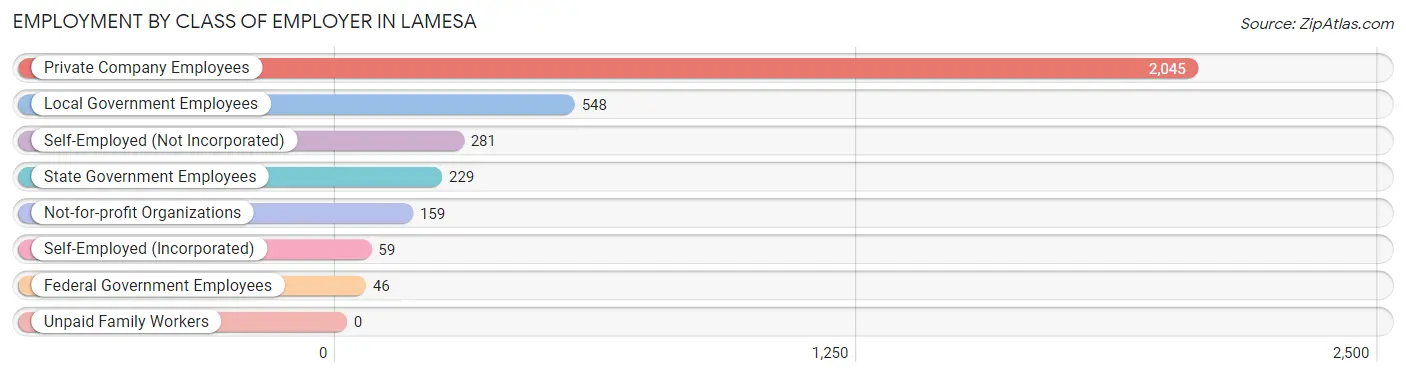
| Employer Class | # Employees | % Employees |
| Private Company Employees | 2,045 | 60.7% |
| Self-Employed (Incorporated) | 59 | 1.8% |
| Self-Employed (Not Incorporated) | 281 | 8.4% |
| Not-for-profit Organizations | 159 | 4.7% |
| Local Government Employees | 548 | 16.3% |
| State Government Employees | 229 | 6.8% |
| Federal Government Employees | 46 | 1.4% |
| Unpaid Family Workers | 0 | 0.0% |
| Total | 3,367 | 100.0% |
Employment Status by Age in Lamesa
According to the labor force statistics for Lamesa, out of the total population over 16 years of age (6,324), 60.6% or 3,832 individuals are in the labor force, with 11.0% or 422 of them unemployed. The age group with the highest labor force participation rate is 30 to 34 years, with 86.1% or 516 individuals in the labor force. Within the labor force, the 16 to 19 years age range has the highest percentage of unemployed individuals, with 22.6% or 54 of them being unemployed.
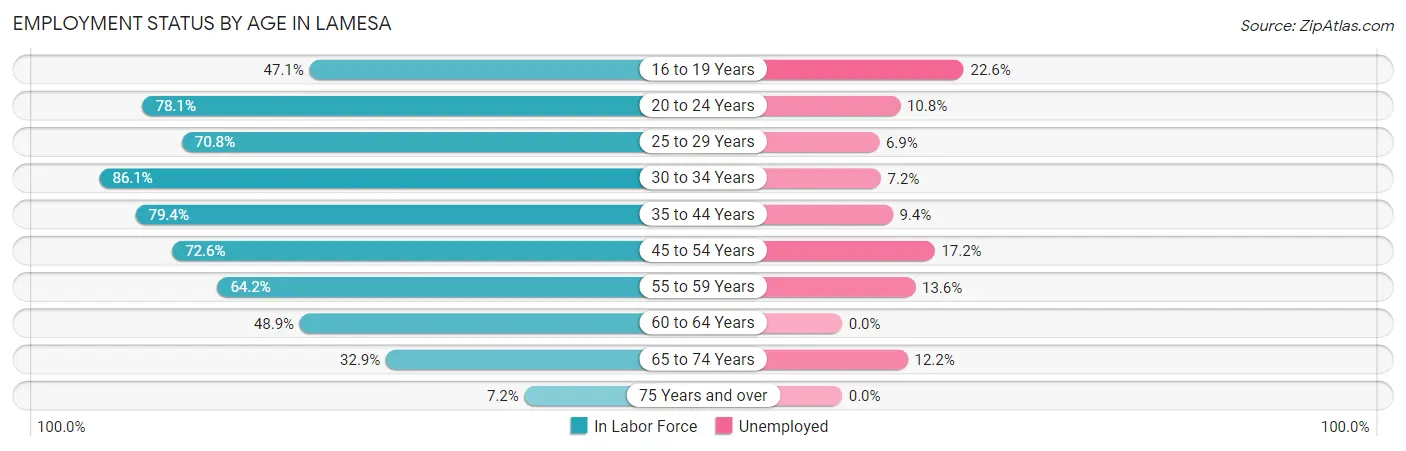
| Age Bracket | In Labor Force | Unemployed |
| 16 to 19 Years | 239 (47.1%) | 54 (22.6%) |
| 20 to 24 Years | 528 (78.1%) | 57 (10.8%) |
| 25 to 29 Years | 391 (70.8%) | 27 (6.9%) |
| 30 to 34 Years | 516 (86.1%) | 37 (7.2%) |
| 35 to 44 Years | 769 (79.4%) | 72 (9.4%) |
| 45 to 54 Years | 606 (72.6%) | 104 (17.2%) |
| 55 to 59 Years | 308 (64.2%) | 42 (13.6%) |
| 60 to 64 Years | 195 (48.9%) | 0 (0.0%) |
| 65 to 74 Years | 238 (32.9%) | 29 (12.2%) |
| 75 Years and over | 42 (7.2%) | 0 (0.0%) |
| Total | 3,832 (60.6%) | 422 (11.0%) |
Employment Status by Educational Attainment in Lamesa
According to labor force statistics for Lamesa, 72.6% of individuals (2,783) out of the total population between 25 and 64 years of age (3,834) are in the labor force, with 10.1% or 281 of them being unemployed. The group with the highest labor force participation rate are those with the educational attainment of bachelor's degree or higher, with 93.7% or 475 individuals in the labor force. Within the labor force, individuals with high school diploma education have the highest percentage of unemployment, with 16.8% or 205 of them being unemployed.
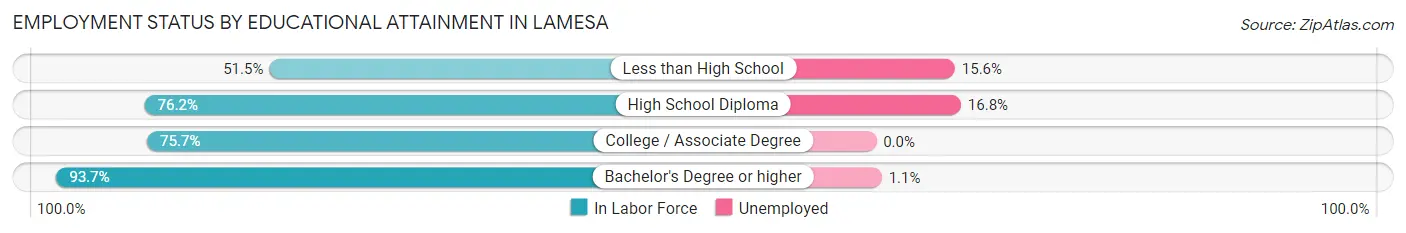
| Educational Attainment | In Labor Force | Unemployed |
| Less than High School | 461 (51.5%) | 140 (15.6%) |
| High School Diploma | 1,223 (76.2%) | 270 (16.8%) |
| College / Associate Degree | 626 (75.7%) | 0 (0.0%) |
| Bachelor's Degree or higher | 475 (93.7%) | 6 (1.1%) |
| Total | 2,783 (72.6%) | 387 (10.1%) |
Employment Occupations by Sex in Lamesa
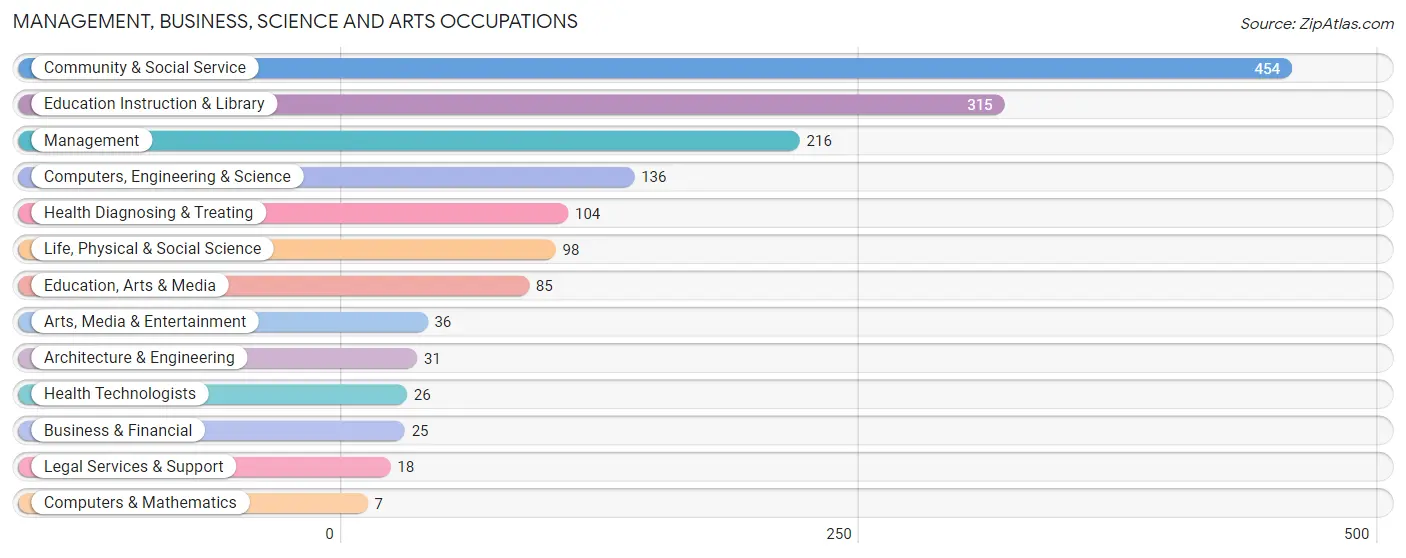
Management, Business, Science and Arts Occupations
The most common Management, Business, Science and Arts occupations in Lamesa are Community & Social Service (454 | 13.3%), Education Instruction & Library (315 | 9.2%), Management (216 | 6.3%), Computers, Engineering & Science (136 | 4.0%), and Health Diagnosing & Treating (104 | 3.0%).
Management, Business, Science and Arts Occupations by Sex
Within the Management, Business, Science and Arts occupations in Lamesa, the most male-oriented occupations are Architecture & Engineering (100.0%), Life, Physical & Social Science (100.0%), and Computers, Engineering & Science (94.9%), while the most female-oriented occupations are Computers & Mathematics (100.0%), Legal Services & Support (100.0%), and Education Instruction & Library (95.6%).
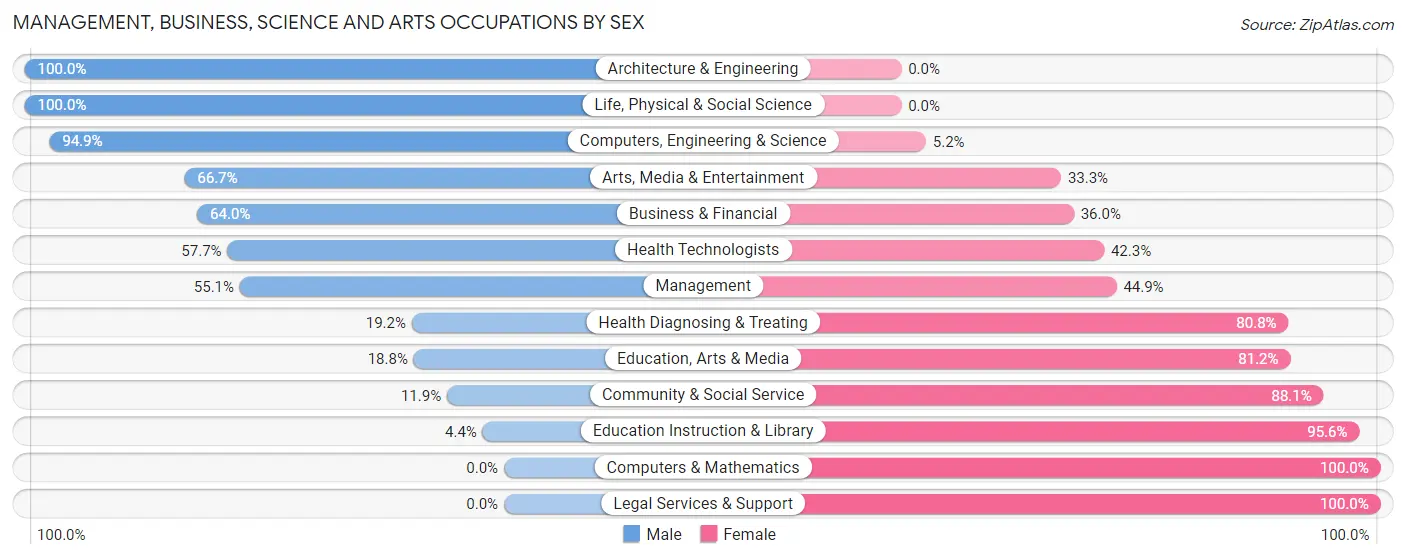
| Occupation | Male | Female |
| Management | 119 (55.1%) | 97 (44.9%) |
| Business & Financial | 16 (64.0%) | 9 (36.0%) |
| Computers, Engineering & Science | 129 (94.9%) | 7 (5.1%) |
| Computers & Mathematics | 0 (0.0%) | 7 (100.0%) |
| Architecture & Engineering | 31 (100.0%) | 0 (0.0%) |
| Life, Physical & Social Science | 98 (100.0%) | 0 (0.0%) |
| Community & Social Service | 54 (11.9%) | 400 (88.1%) |
| Education, Arts & Media | 16 (18.8%) | 69 (81.2%) |
| Legal Services & Support | 0 (0.0%) | 18 (100.0%) |
| Education Instruction & Library | 14 (4.4%) | 301 (95.6%) |
| Arts, Media & Entertainment | 24 (66.7%) | 12 (33.3%) |
| Health Diagnosing & Treating | 20 (19.2%) | 84 (80.8%) |
| Health Technologists | 15 (57.7%) | 11 (42.3%) |
| Total (Category) | 338 (36.1%) | 597 (63.8%) |
| Total (Overall) | 1,740 (51.0%) | 1,670 (49.0%) |
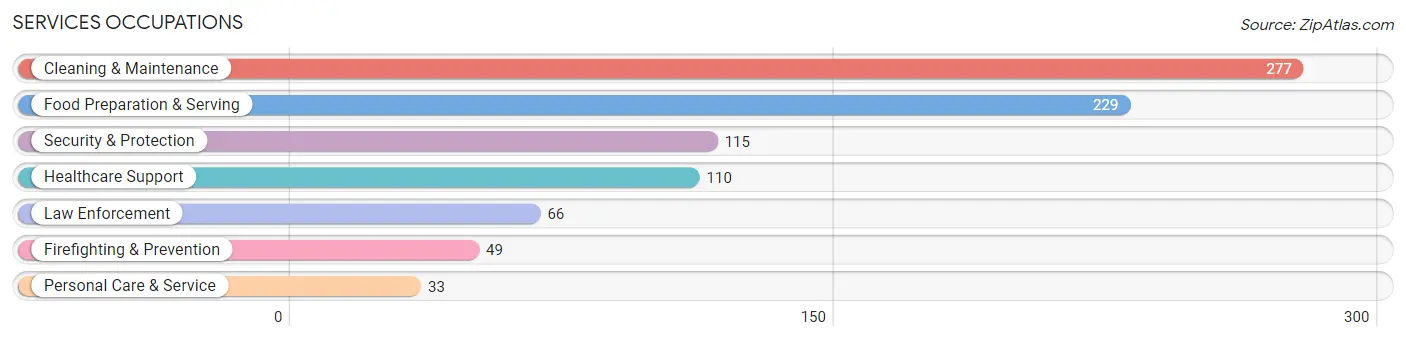
Services Occupations
The most common Services occupations in Lamesa are Cleaning & Maintenance (277 | 8.1%), Food Preparation & Serving (229 | 6.7%), Security & Protection (115 | 3.4%), Healthcare Support (110 | 3.2%), and Law Enforcement (66 | 1.9%).
Services Occupations by Sex
Within the Services occupations in Lamesa, the most male-oriented occupations are Law Enforcement (100.0%), Security & Protection (95.7%), and Firefighting & Prevention (89.8%), while the most female-oriented occupations are Healthcare Support (100.0%), Personal Care & Service (100.0%), and Cleaning & Maintenance (82.3%).
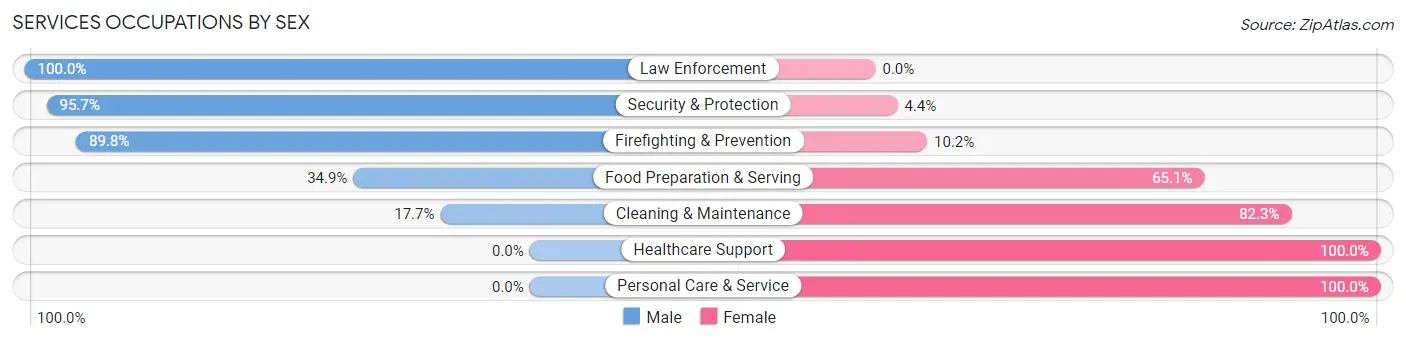
| Occupation | Male | Female |
| Healthcare Support | 0 (0.0%) | 110 (100.0%) |
| Security & Protection | 110 (95.7%) | 5 (4.3%) |
| Firefighting & Prevention | 44 (89.8%) | 5 (10.2%) |
| Law Enforcement | 66 (100.0%) | 0 (0.0%) |
| Food Preparation & Serving | 80 (34.9%) | 149 (65.1%) |
| Cleaning & Maintenance | 49 (17.7%) | 228 (82.3%) |
| Personal Care & Service | 0 (0.0%) | 33 (100.0%) |
| Total (Category) | 239 (31.3%) | 525 (68.7%) |
| Total (Overall) | 1,740 (51.0%) | 1,670 (49.0%) |
Sales and Office Occupations
The most common Sales and Office occupations in Lamesa are Office & Administration (342 | 10.0%), and Sales & Related (283 | 8.3%).
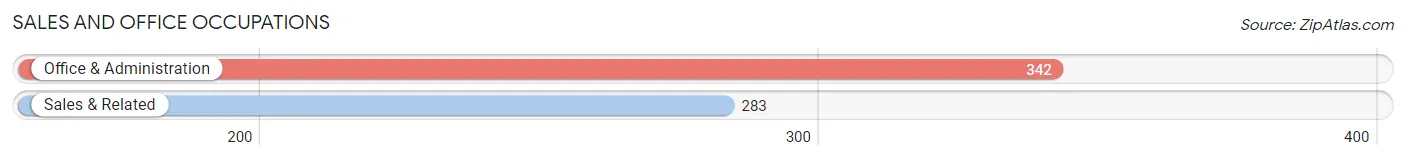
Sales and Office Occupations by Sex

| Occupation | Male | Female |
| Sales & Related | 143 (50.5%) | 140 (49.5%) |
| Office & Administration | 66 (19.3%) | 276 (80.7%) |
| Total (Category) | 209 (33.4%) | 416 (66.6%) |
| Total (Overall) | 1,740 (51.0%) | 1,670 (49.0%) |
Natural Resources, Construction and Maintenance Occupations
The most common Natural Resources, Construction and Maintenance occupations in Lamesa are Construction & Extraction (399 | 11.7%), Installation, Maintenance & Repair (168 | 4.9%), and Farming, Fishing & Forestry (60 | 1.8%).
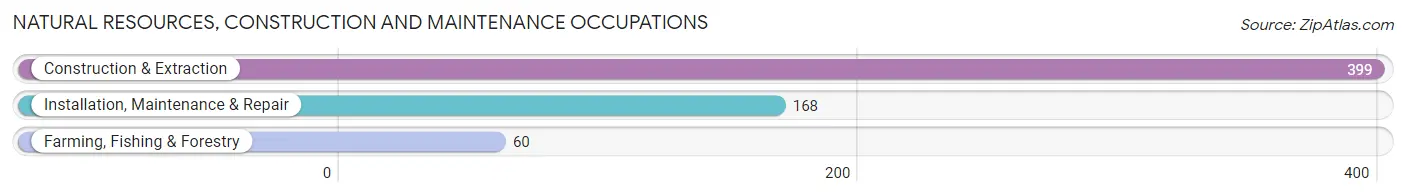
Natural Resources, Construction and Maintenance Occupations by Sex
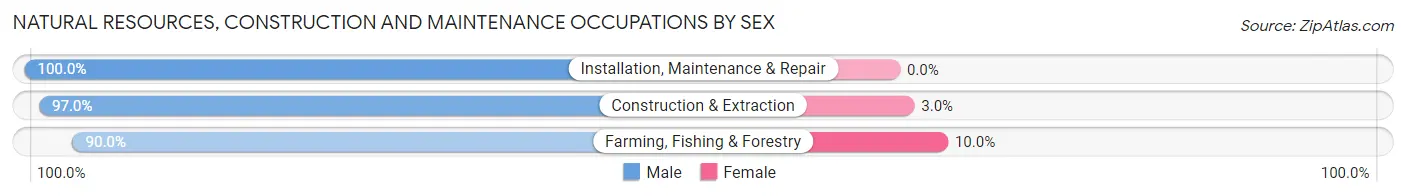
| Occupation | Male | Female |
| Farming, Fishing & Forestry | 54 (90.0%) | 6 (10.0%) |
| Construction & Extraction | 387 (97.0%) | 12 (3.0%) |
| Installation, Maintenance & Repair | 168 (100.0%) | 0 (0.0%) |
| Total (Category) | 609 (97.1%) | 18 (2.9%) |
| Total (Overall) | 1,740 (51.0%) | 1,670 (49.0%) |
Production, Transportation and Moving Occupations
The most common Production, Transportation and Moving occupations in Lamesa are Transportation (234 | 6.9%), Production (150 | 4.4%), and Material Moving (75 | 2.2%).
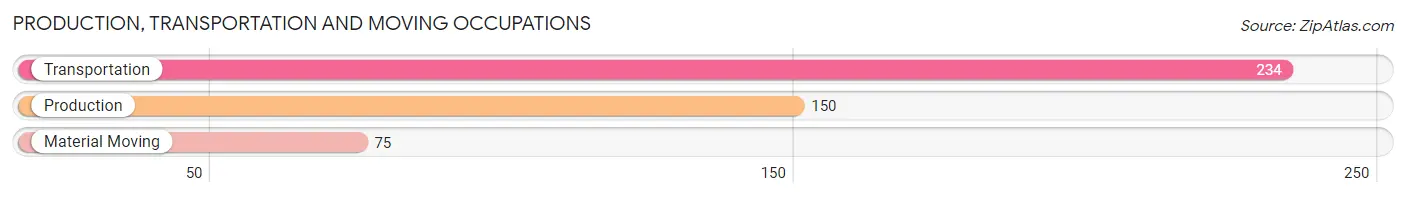
Production, Transportation and Moving Occupations by Sex
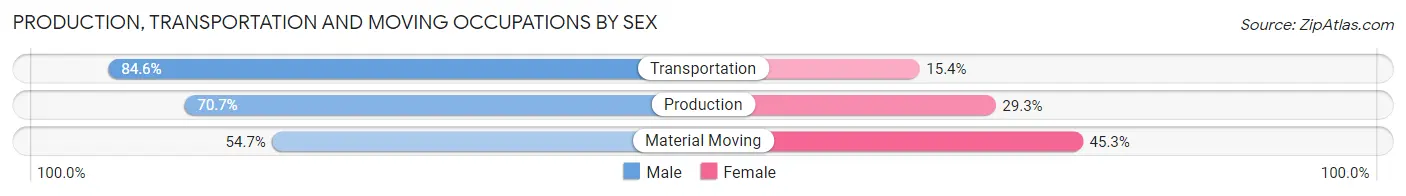
| Occupation | Male | Female |
| Production | 106 (70.7%) | 44 (29.3%) |
| Transportation | 198 (84.6%) | 36 (15.4%) |
| Material Moving | 41 (54.7%) | 34 (45.3%) |
| Total (Category) | 345 (75.2%) | 114 (24.8%) |
| Total (Overall) | 1,740 (51.0%) | 1,670 (49.0%) |
Employment Industries by Sex in Lamesa
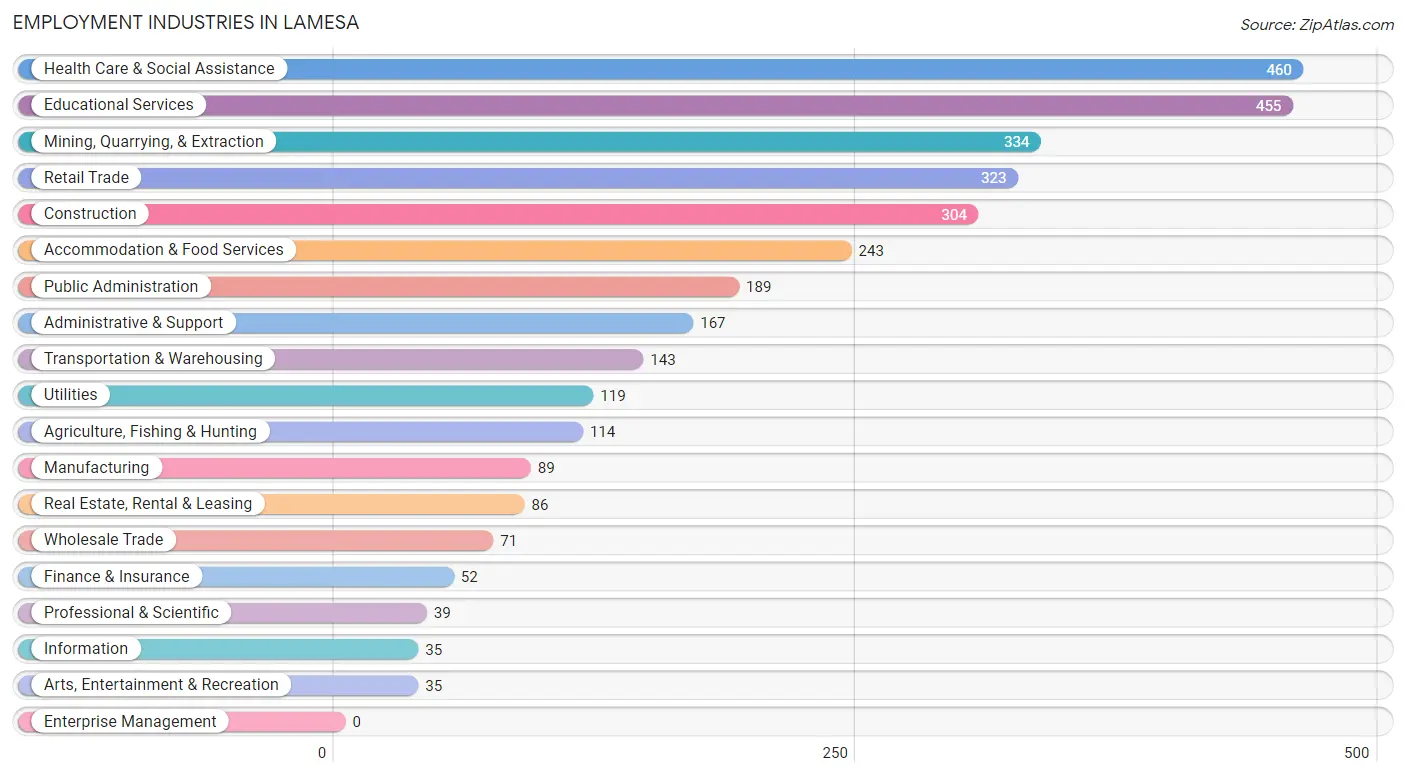
Employment Industries in Lamesa
The major employment industries in Lamesa include Health Care & Social Assistance (460 | 13.5%), Educational Services (455 | 13.3%), Mining, Quarrying, & Extraction (334 | 9.8%), Retail Trade (323 | 9.5%), and Construction (304 | 8.9%).
Employment Industries by Sex in Lamesa
The Lamesa industries that see more men than women are Agriculture, Fishing & Hunting (100.0%), Utilities (100.0%), and Arts, Entertainment & Recreation (100.0%), whereas the industries that tend to have a higher number of women are Health Care & Social Assistance (96.1%), Finance & Insurance (94.2%), and Educational Services (88.6%).
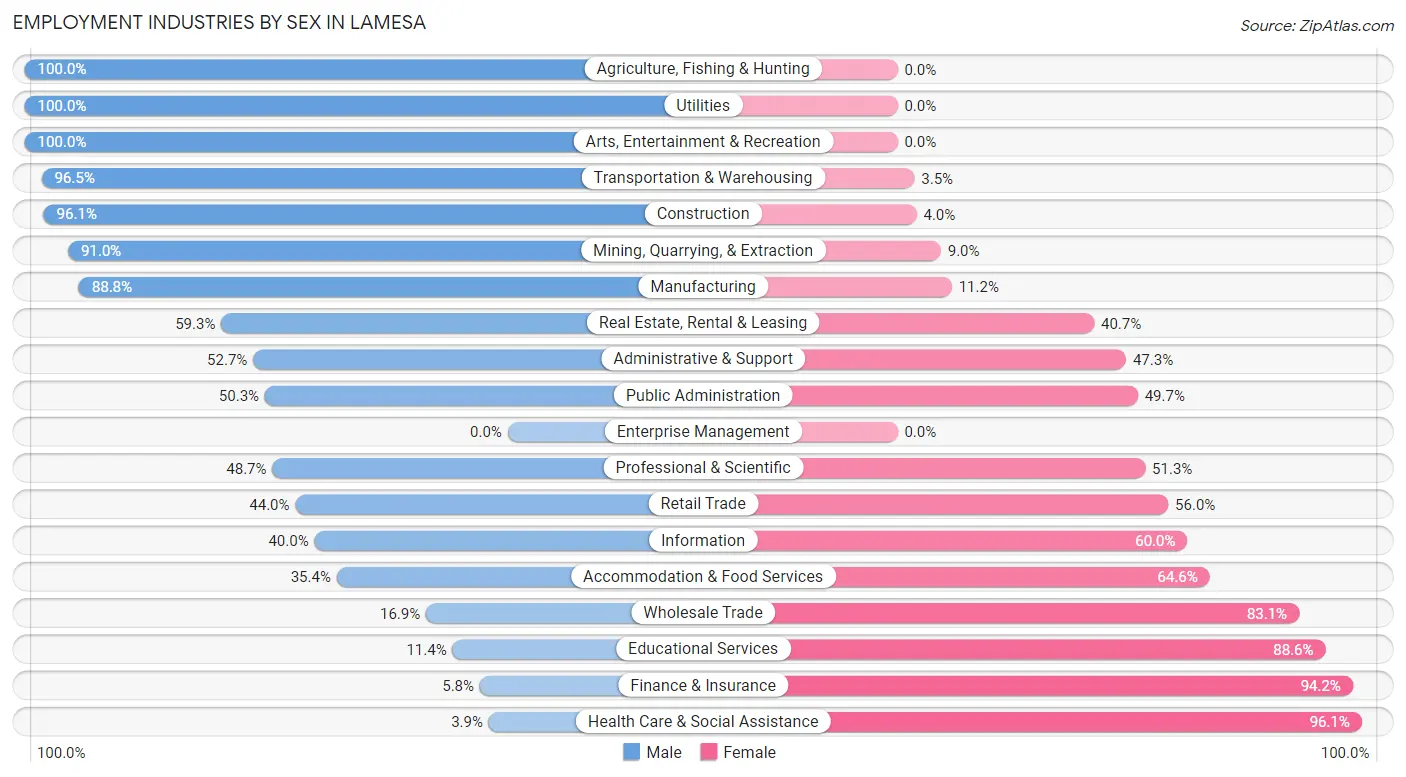
| Industry | Male | Female |
| Agriculture, Fishing & Hunting | 114 (100.0%) | 0 (0.0%) |
| Mining, Quarrying, & Extraction | 304 (91.0%) | 30 (9.0%) |
| Construction | 292 (96.1%) | 12 (4.0%) |
| Manufacturing | 79 (88.8%) | 10 (11.2%) |
| Wholesale Trade | 12 (16.9%) | 59 (83.1%) |
| Retail Trade | 142 (44.0%) | 181 (56.0%) |
| Transportation & Warehousing | 138 (96.5%) | 5 (3.5%) |
| Utilities | 119 (100.0%) | 0 (0.0%) |
| Information | 14 (40.0%) | 21 (60.0%) |
| Finance & Insurance | 3 (5.8%) | 49 (94.2%) |
| Real Estate, Rental & Leasing | 51 (59.3%) | 35 (40.7%) |
| Professional & Scientific | 19 (48.7%) | 20 (51.3%) |
| Enterprise Management | 0 (0.0%) | 0 (0.0%) |
| Administrative & Support | 88 (52.7%) | 79 (47.3%) |
| Educational Services | 52 (11.4%) | 403 (88.6%) |
| Health Care & Social Assistance | 18 (3.9%) | 442 (96.1%) |
| Arts, Entertainment & Recreation | 35 (100.0%) | 0 (0.0%) |
| Accommodation & Food Services | 86 (35.4%) | 157 (64.6%) |
| Public Administration | 95 (50.3%) | 94 (49.7%) |
| Total | 1,740 (51.0%) | 1,670 (49.0%) |
Education in Lamesa
School Enrollment in Lamesa
The most common levels of schooling among the 2,452 students in Lamesa are middle school (648 | 26.4%), elementary school (591 | 24.1%), and high school (500 | 20.4%).
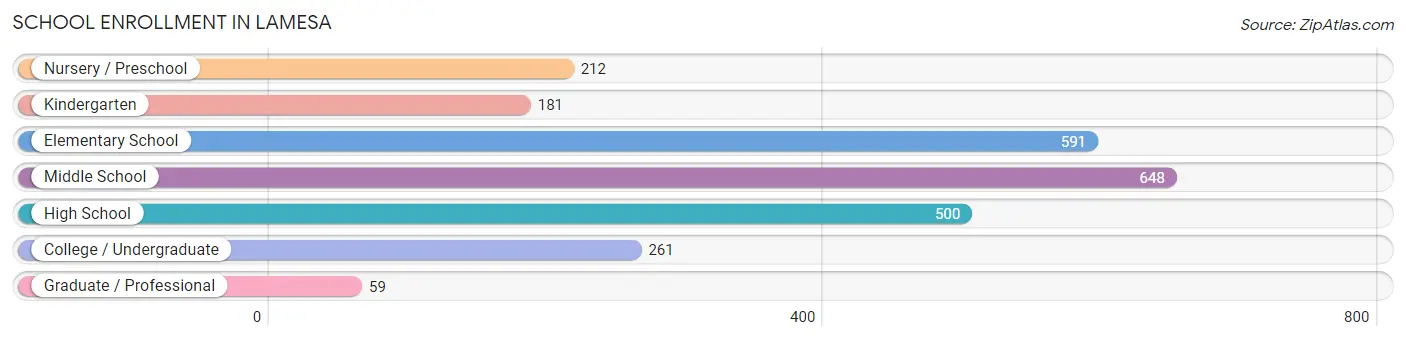
| School Level | # Students | % Students |
| Nursery / Preschool | 212 | 8.6% |
| Kindergarten | 181 | 7.4% |
| Elementary School | 591 | 24.1% |
| Middle School | 648 | 26.4% |
| High School | 500 | 20.4% |
| College / Undergraduate | 261 | 10.6% |
| Graduate / Professional | 59 | 2.4% |
| Total | 2,452 | 100.0% |
School Enrollment by Age by Funding Source in Lamesa
Out of a total of 2,452 students who are enrolled in schools in Lamesa, 147 (6.0%) attend a private institution, while the remaining 2,305 (94.0%) are enrolled in public schools. The age group of 3 to 4 year olds has the highest likelihood of being enrolled in private schools, with 57 (29.8% in the age bracket) enrolled. Conversely, the age group of 5 to 9 year old has the lowest likelihood of being enrolled in a private school, with 710 (100.0% in the age bracket) attending a public institution.
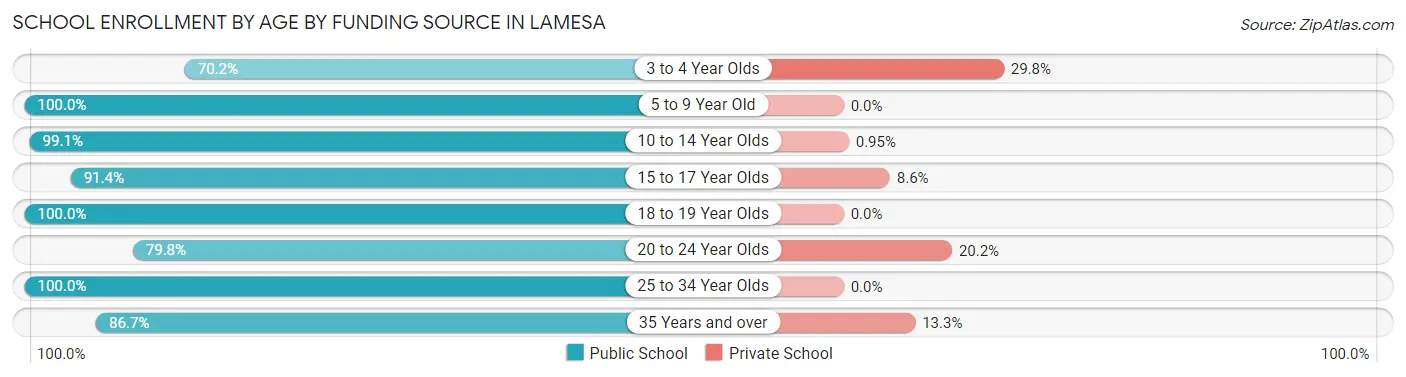
| Age Bracket | Public School | Private School |
| 3 to 4 Year Olds | 134 (70.2%) | 57 (29.8%) |
| 5 to 9 Year Old | 710 (100.0%) | 0 (0.0%) |
| 10 to 14 Year Olds | 729 (99.1%) | 7 (0.9%) |
| 15 to 17 Year Olds | 319 (91.4%) | 30 (8.6%) |
| 18 to 19 Year Olds | 117 (100.0%) | 0 (0.0%) |
| 20 to 24 Year Olds | 190 (79.8%) | 48 (20.2%) |
| 25 to 34 Year Olds | 81 (100.0%) | 0 (0.0%) |
| 35 Years and over | 26 (86.7%) | 4 (13.3%) |
| Total | 2,305 (94.0%) | 147 (6.0%) |
Educational Attainment by Field of Study in Lamesa
Business (218 | 27.9%), education (176 | 22.5%), arts & humanities (80 | 10.2%), psychology (59 | 7.5%), and bio, nature & agricultural (48 | 6.1%) are the most common fields of study among 781 individuals in Lamesa who have obtained a bachelor's degree or higher.
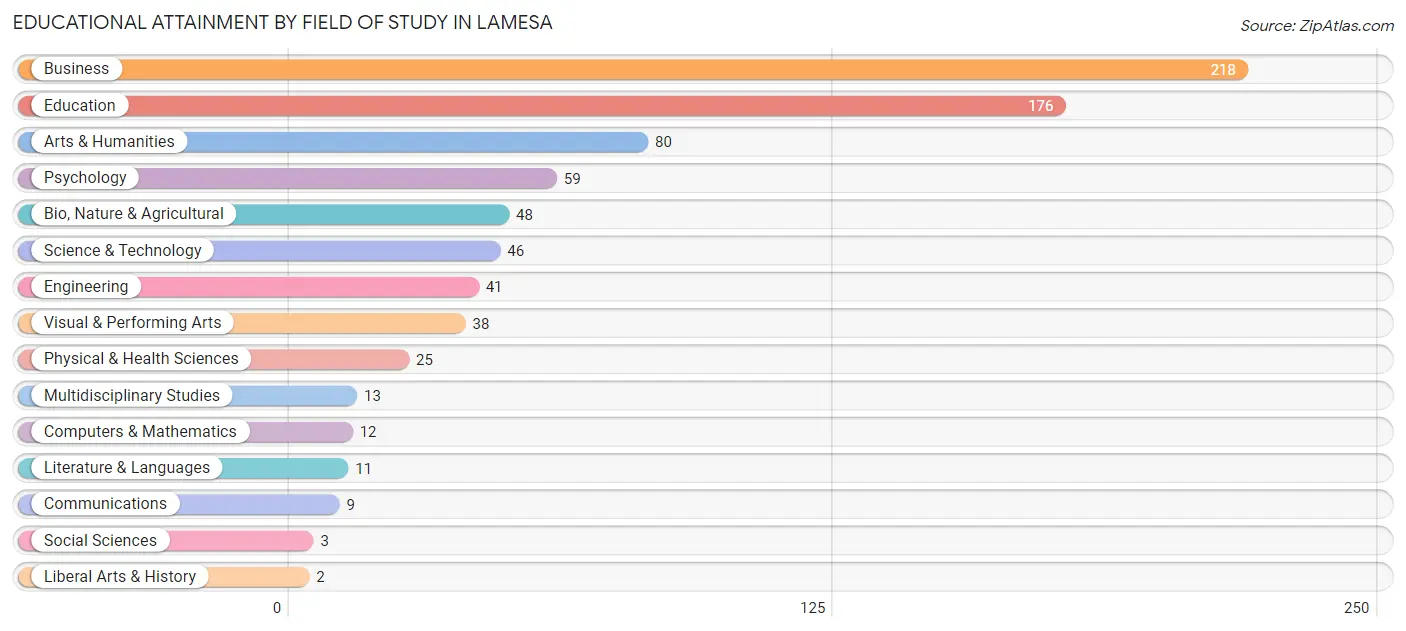
| Field of Study | # Graduates | % Graduates |
| Computers & Mathematics | 12 | 1.5% |
| Bio, Nature & Agricultural | 48 | 6.1% |
| Physical & Health Sciences | 25 | 3.2% |
| Psychology | 59 | 7.5% |
| Social Sciences | 3 | 0.4% |
| Engineering | 41 | 5.2% |
| Multidisciplinary Studies | 13 | 1.7% |
| Science & Technology | 46 | 5.9% |
| Business | 218 | 27.9% |
| Education | 176 | 22.5% |
| Literature & Languages | 11 | 1.4% |
| Liberal Arts & History | 2 | 0.3% |
| Visual & Performing Arts | 38 | 4.9% |
| Communications | 9 | 1.1% |
| Arts & Humanities | 80 | 10.2% |
| Total | 781 | 100.0% |
Transportation & Commute in Lamesa
Vehicle Availability by Sex in Lamesa
The most prevalent vehicle ownership categories in Lamesa are males with 2 vehicles (757, accounting for 44.3%) and females with 2 vehicles (477, making up 45.7%).
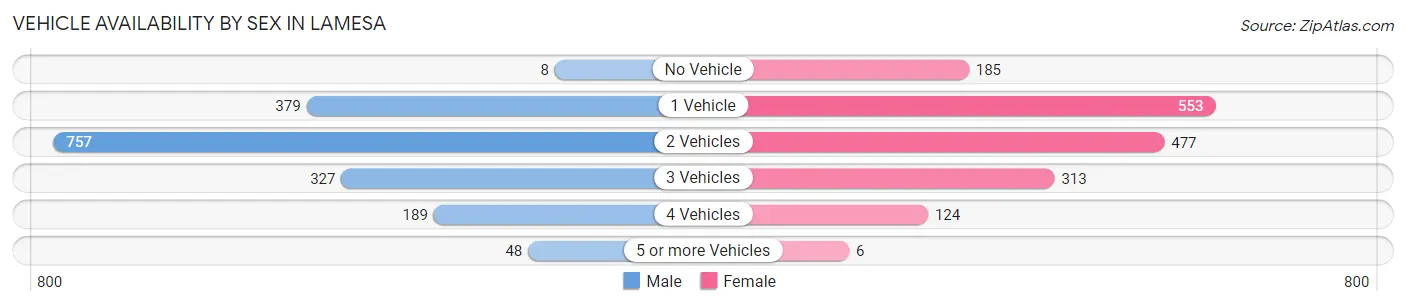
| Vehicles Available | Male | Female |
| No Vehicle | 8 (0.5%) | 185 (11.2%) |
| 1 Vehicle | 379 (22.2%) | 553 (33.4%) |
| 2 Vehicles | 757 (44.3%) | 477 (28.8%) |
| 3 Vehicles | 327 (19.2%) | 313 (18.9%) |
| 4 Vehicles | 189 (11.1%) | 124 (7.5%) |
| 5 or more Vehicles | 48 (2.8%) | 6 (0.4%) |
| Total | 1,708 (100.0%) | 1,658 (100.0%) |
Commute Time in Lamesa
The most frequently occuring commute durations in Lamesa are 5 to 9 minutes (1,325 commuters, 41.0%), 10 to 14 minutes (546 commuters, 16.9%), and 45 to 59 minutes (276 commuters, 8.5%).
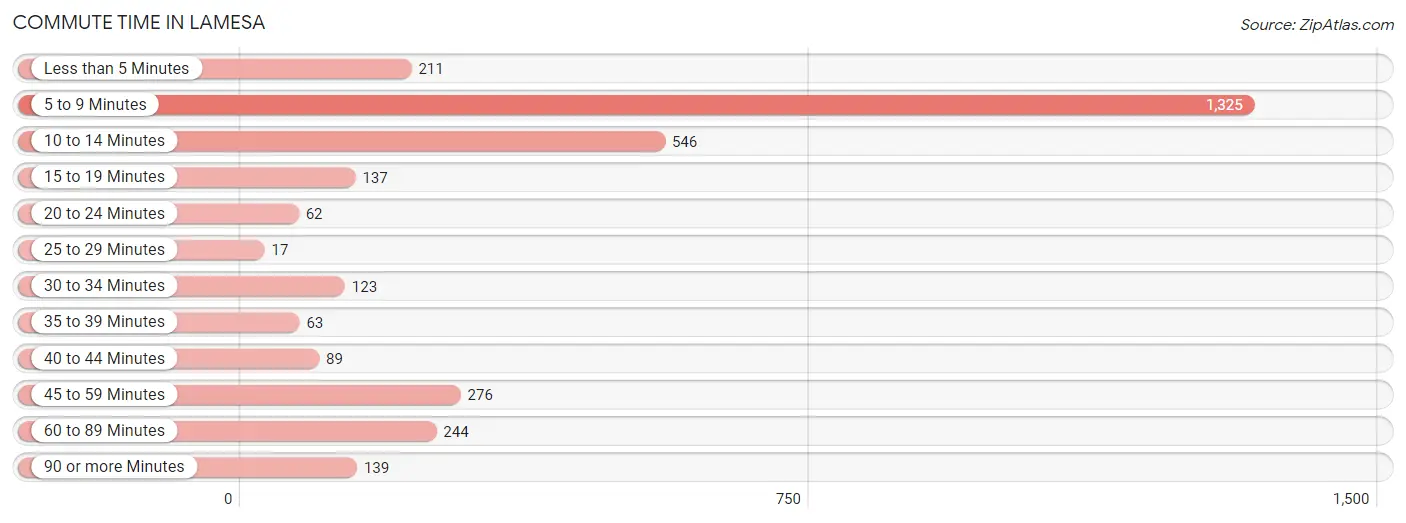
| Commute Time | # Commuters | % Commuters |
| Less than 5 Minutes | 211 | 6.5% |
| 5 to 9 Minutes | 1,325 | 41.0% |
| 10 to 14 Minutes | 546 | 16.9% |
| 15 to 19 Minutes | 137 | 4.2% |
| 20 to 24 Minutes | 62 | 1.9% |
| 25 to 29 Minutes | 17 | 0.5% |
| 30 to 34 Minutes | 123 | 3.8% |
| 35 to 39 Minutes | 63 | 1.9% |
| 40 to 44 Minutes | 89 | 2.8% |
| 45 to 59 Minutes | 276 | 8.5% |
| 60 to 89 Minutes | 244 | 7.5% |
| 90 or more Minutes | 139 | 4.3% |
Commute Time by Sex in Lamesa
The most common commute times in Lamesa are 5 to 9 minutes (512 commuters, 30.0%) for males and 5 to 9 minutes (813 commuters, 53.2%) for females.
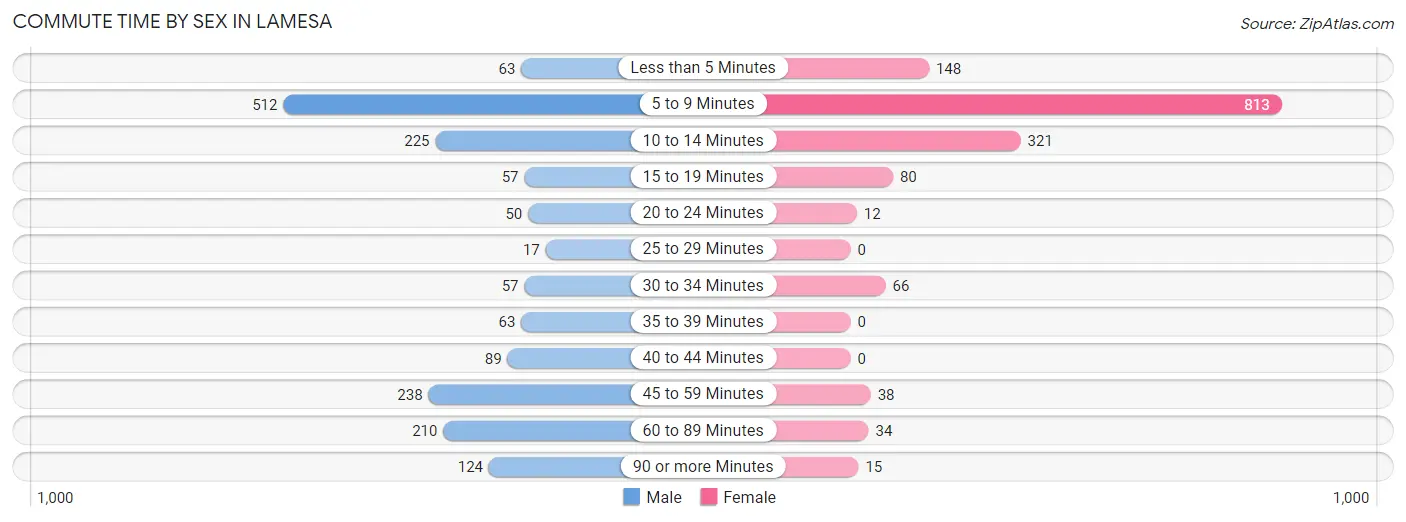
| Commute Time | Male | Female |
| Less than 5 Minutes | 63 (3.7%) | 148 (9.7%) |
| 5 to 9 Minutes | 512 (30.0%) | 813 (53.2%) |
| 10 to 14 Minutes | 225 (13.2%) | 321 (21.0%) |
| 15 to 19 Minutes | 57 (3.3%) | 80 (5.2%) |
| 20 to 24 Minutes | 50 (2.9%) | 12 (0.8%) |
| 25 to 29 Minutes | 17 (1.0%) | 0 (0.0%) |
| 30 to 34 Minutes | 57 (3.3%) | 66 (4.3%) |
| 35 to 39 Minutes | 63 (3.7%) | 0 (0.0%) |
| 40 to 44 Minutes | 89 (5.2%) | 0 (0.0%) |
| 45 to 59 Minutes | 238 (14.0%) | 38 (2.5%) |
| 60 to 89 Minutes | 210 (12.3%) | 34 (2.2%) |
| 90 or more Minutes | 124 (7.3%) | 15 (1.0%) |
Time of Departure to Work by Sex in Lamesa
The most frequent times of departure to work in Lamesa are 7:00 AM to 7:29 AM (263, 15.4%) for males and 8:00 AM to 8:29 AM (270, 17.7%) for females.
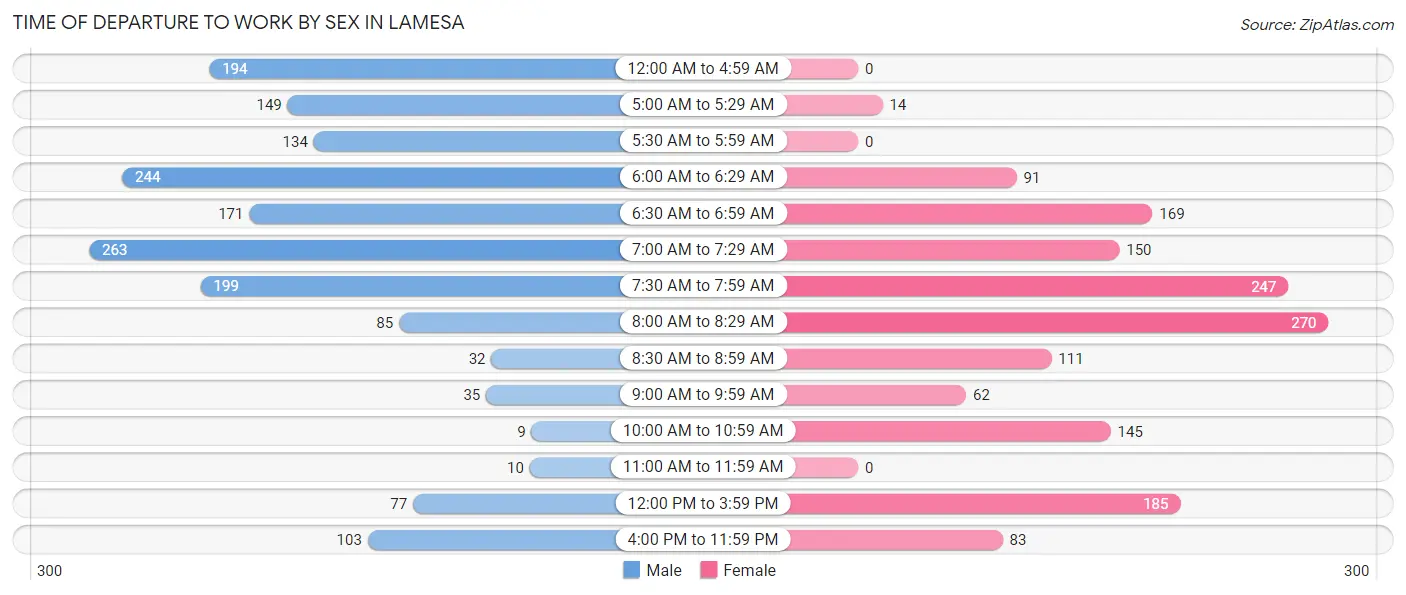
| Time of Departure | Male | Female |
| 12:00 AM to 4:59 AM | 194 (11.4%) | 0 (0.0%) |
| 5:00 AM to 5:29 AM | 149 (8.7%) | 14 (0.9%) |
| 5:30 AM to 5:59 AM | 134 (7.9%) | 0 (0.0%) |
| 6:00 AM to 6:29 AM | 244 (14.3%) | 91 (6.0%) |
| 6:30 AM to 6:59 AM | 171 (10.0%) | 169 (11.1%) |
| 7:00 AM to 7:29 AM | 263 (15.4%) | 150 (9.8%) |
| 7:30 AM to 7:59 AM | 199 (11.7%) | 247 (16.2%) |
| 8:00 AM to 8:29 AM | 85 (5.0%) | 270 (17.7%) |
| 8:30 AM to 8:59 AM | 32 (1.9%) | 111 (7.3%) |
| 9:00 AM to 9:59 AM | 35 (2.1%) | 62 (4.1%) |
| 10:00 AM to 10:59 AM | 9 (0.5%) | 145 (9.5%) |
| 11:00 AM to 11:59 AM | 10 (0.6%) | 0 (0.0%) |
| 12:00 PM to 3:59 PM | 77 (4.5%) | 185 (12.1%) |
| 4:00 PM to 11:59 PM | 103 (6.0%) | 83 (5.4%) |
| Total | 1,705 (100.0%) | 1,527 (100.0%) |
Housing Occupancy in Lamesa
Occupancy by Ownership in Lamesa
Of the total 3,419 dwellings in Lamesa, owner-occupied units account for 2,374 (69.4%), while renter-occupied units make up 1,045 (30.6%).
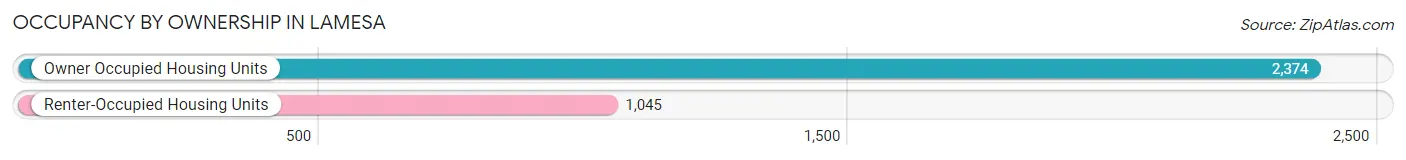
| Occupancy | # Housing Units | % Housing Units |
| Owner Occupied Housing Units | 2,374 | 69.4% |
| Renter-Occupied Housing Units | 1,045 | 30.6% |
| Total Occupied Housing Units | 3,419 | 100.0% |
Occupancy by Household Size in Lamesa
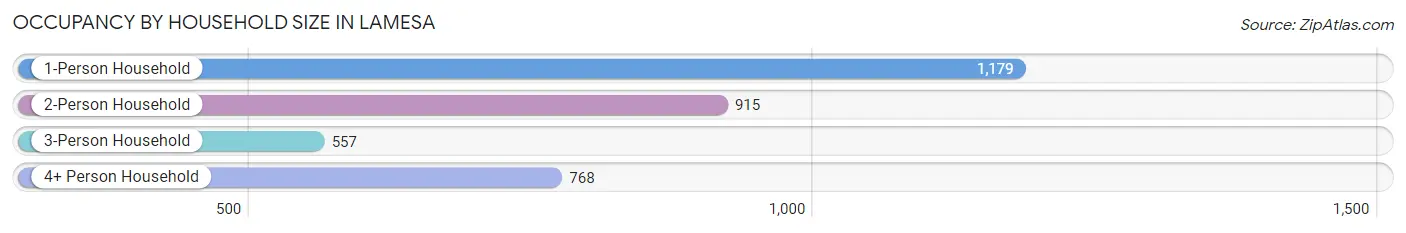
| Household Size | # Housing Units | % Housing Units |
| 1-Person Household | 1,179 | 34.5% |
| 2-Person Household | 915 | 26.8% |
| 3-Person Household | 557 | 16.3% |
| 4+ Person Household | 768 | 22.5% |
| Total Housing Units | 3,419 | 100.0% |
Occupancy by Ownership by Household Size in Lamesa
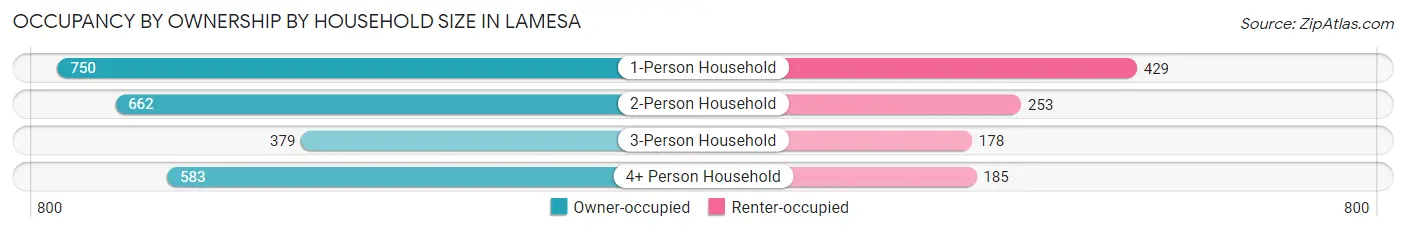
| Household Size | Owner-occupied | Renter-occupied |
| 1-Person Household | 750 (63.6%) | 429 (36.4%) |
| 2-Person Household | 662 (72.4%) | 253 (27.7%) |
| 3-Person Household | 379 (68.0%) | 178 (32.0%) |
| 4+ Person Household | 583 (75.9%) | 185 (24.1%) |
| Total Housing Units | 2,374 (69.4%) | 1,045 (30.6%) |
Occupancy by Educational Attainment in Lamesa
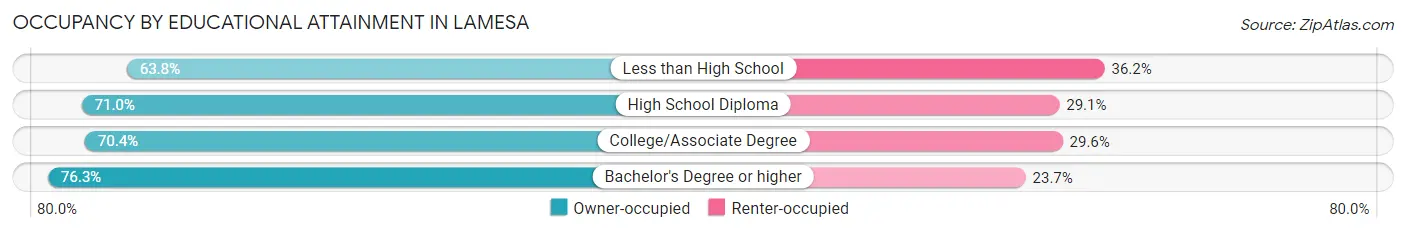
| Household Size | Owner-occupied | Renter-occupied |
| Less than High School | 627 (63.8%) | 356 (36.2%) |
| High School Diploma | 889 (71.0%) | 364 (29.0%) |
| College/Associate Degree | 536 (70.4%) | 225 (29.6%) |
| Bachelor's Degree or higher | 322 (76.3%) | 100 (23.7%) |
Occupancy by Age of Householder in Lamesa
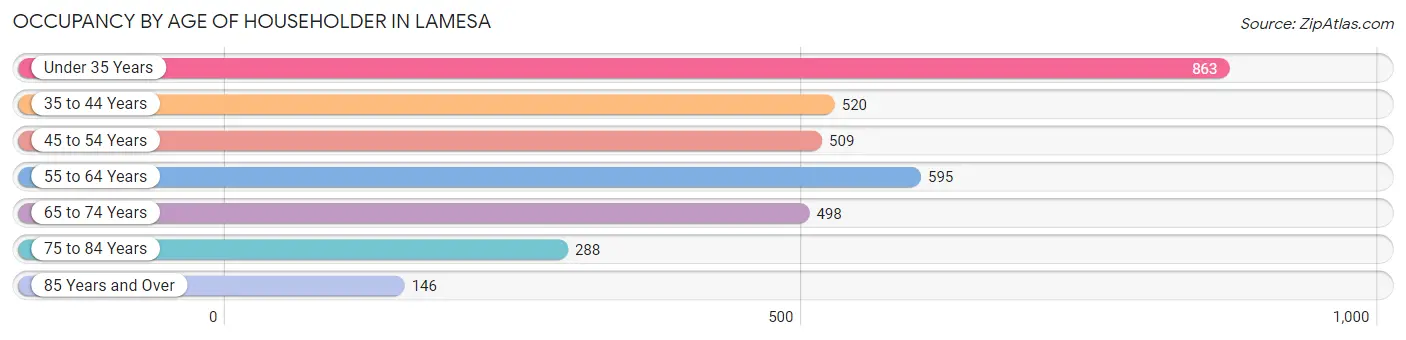
| Age Bracket | # Households | % Households |
| Under 35 Years | 863 | 25.2% |
| 35 to 44 Years | 520 | 15.2% |
| 45 to 54 Years | 509 | 14.9% |
| 55 to 64 Years | 595 | 17.4% |
| 65 to 74 Years | 498 | 14.6% |
| 75 to 84 Years | 288 | 8.4% |
| 85 Years and Over | 146 | 4.3% |
| Total | 3,419 | 100.0% |
Housing Finances in Lamesa
Median Income by Occupancy in Lamesa
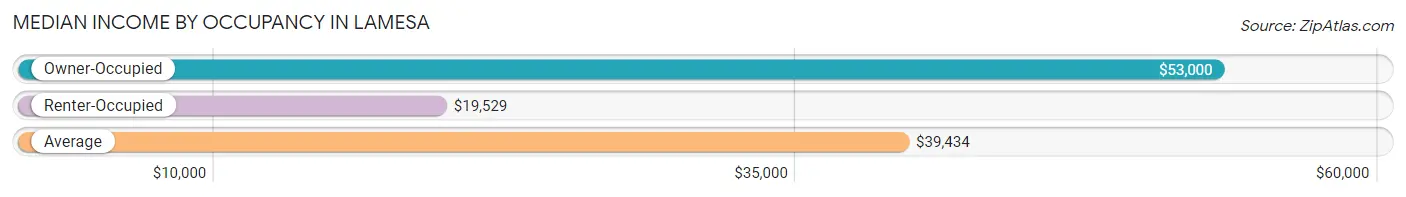
| Occupancy Type | # Households | Median Income |
| Owner-Occupied | 2,374 (69.4%) | $53,000 |
| Renter-Occupied | 1,045 (30.6%) | $19,529 |
| Average | 3,419 (100.0%) | $39,434 |
Occupancy by Householder Income Bracket in Lamesa
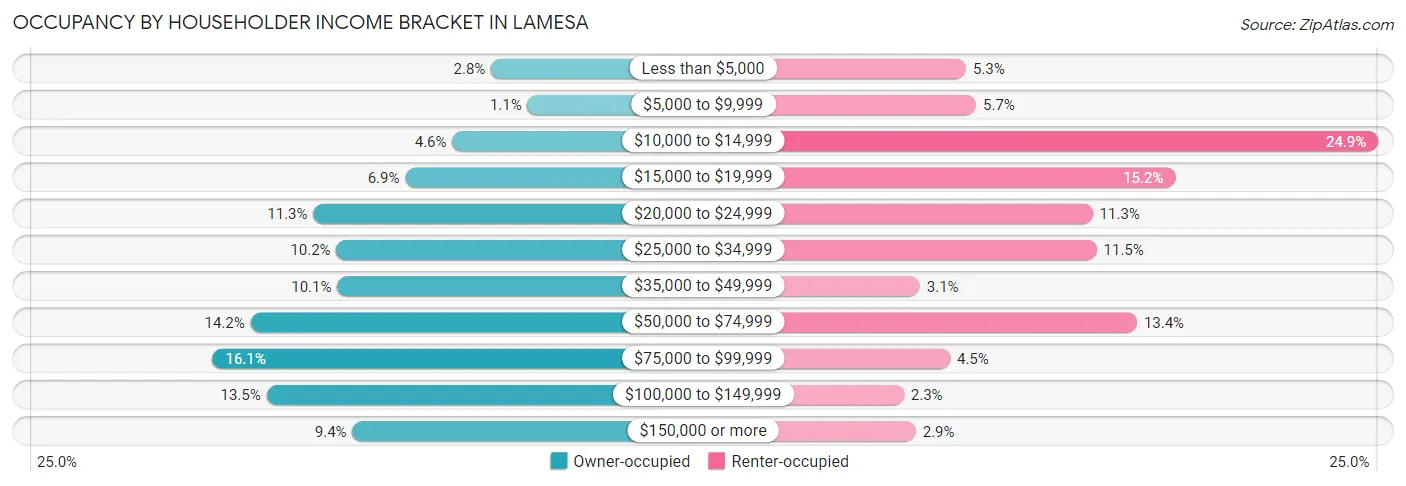
| Income Bracket | Owner-occupied | Renter-occupied |
| Less than $5,000 | 66 (2.8%) | 55 (5.3%) |
| $5,000 to $9,999 | 25 (1.1%) | 60 (5.7%) |
| $10,000 to $14,999 | 110 (4.6%) | 260 (24.9%) |
| $15,000 to $19,999 | 163 (6.9%) | 159 (15.2%) |
| $20,000 to $24,999 | 267 (11.3%) | 118 (11.3%) |
| $25,000 to $34,999 | 241 (10.2%) | 120 (11.5%) |
| $35,000 to $49,999 | 240 (10.1%) | 32 (3.1%) |
| $50,000 to $74,999 | 338 (14.2%) | 140 (13.4%) |
| $75,000 to $99,999 | 381 (16.1%) | 47 (4.5%) |
| $100,000 to $149,999 | 320 (13.5%) | 24 (2.3%) |
| $150,000 or more | 223 (9.4%) | 30 (2.9%) |
| Total | 2,374 (100.0%) | 1,045 (100.0%) |
Monthly Housing Cost Tiers in Lamesa
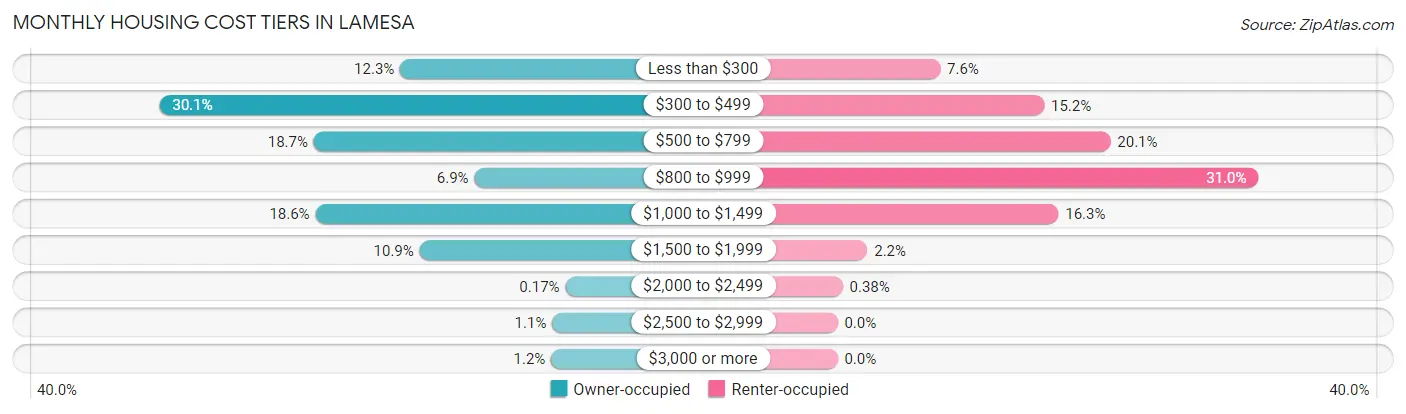
| Monthly Cost | Owner-occupied | Renter-occupied |
| Less than $300 | 293 (12.3%) | 79 (7.6%) |
| $300 to $499 | 714 (30.1%) | 159 (15.2%) |
| $500 to $799 | 444 (18.7%) | 210 (20.1%) |
| $800 to $999 | 163 (6.9%) | 324 (31.0%) |
| $1,000 to $1,499 | 441 (18.6%) | 170 (16.3%) |
| $1,500 to $1,999 | 259 (10.9%) | 23 (2.2%) |
| $2,000 to $2,499 | 4 (0.2%) | 4 (0.4%) |
| $2,500 to $2,999 | 27 (1.1%) | 0 (0.0%) |
| $3,000 or more | 29 (1.2%) | 0 (0.0%) |
| Total | 2,374 (100.0%) | 1,045 (100.0%) |
Physical Housing Characteristics in Lamesa
Housing Structures in Lamesa
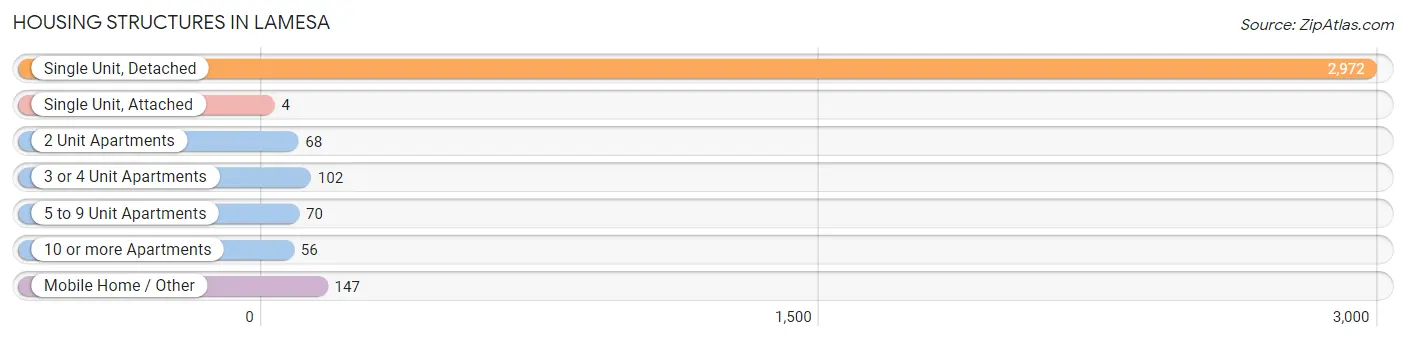
| Structure Type | # Housing Units | % Housing Units |
| Single Unit, Detached | 2,972 | 86.9% |
| Single Unit, Attached | 4 | 0.1% |
| 2 Unit Apartments | 68 | 2.0% |
| 3 or 4 Unit Apartments | 102 | 3.0% |
| 5 to 9 Unit Apartments | 70 | 2.1% |
| 10 or more Apartments | 56 | 1.6% |
| Mobile Home / Other | 147 | 4.3% |
| Total | 3,419 | 100.0% |
Housing Structures by Occupancy in Lamesa
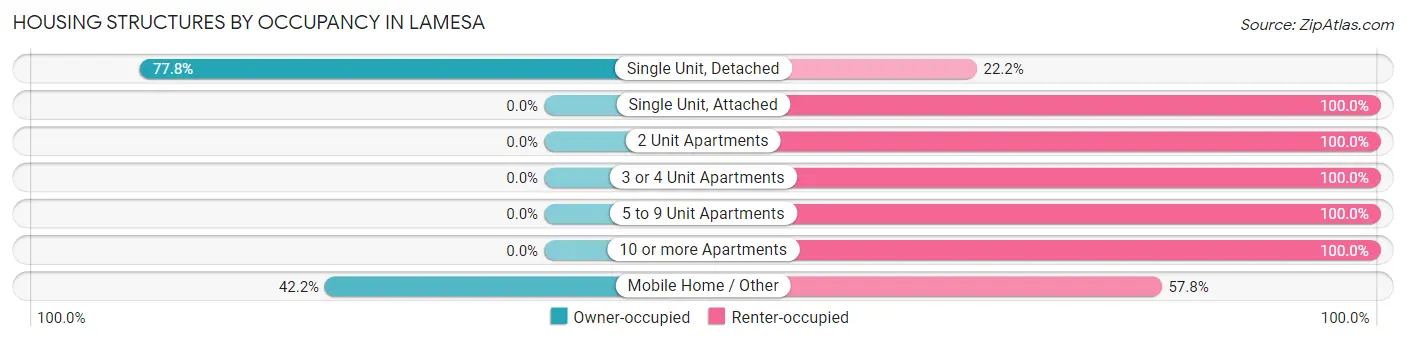
| Structure Type | Owner-occupied | Renter-occupied |
| Single Unit, Detached | 2,312 (77.8%) | 660 (22.2%) |
| Single Unit, Attached | 0 (0.0%) | 4 (100.0%) |
| 2 Unit Apartments | 0 (0.0%) | 68 (100.0%) |
| 3 or 4 Unit Apartments | 0 (0.0%) | 102 (100.0%) |
| 5 to 9 Unit Apartments | 0 (0.0%) | 70 (100.0%) |
| 10 or more Apartments | 0 (0.0%) | 56 (100.0%) |
| Mobile Home / Other | 62 (42.2%) | 85 (57.8%) |
| Total | 2,374 (69.4%) | 1,045 (30.6%) |
Housing Structures by Number of Rooms in Lamesa
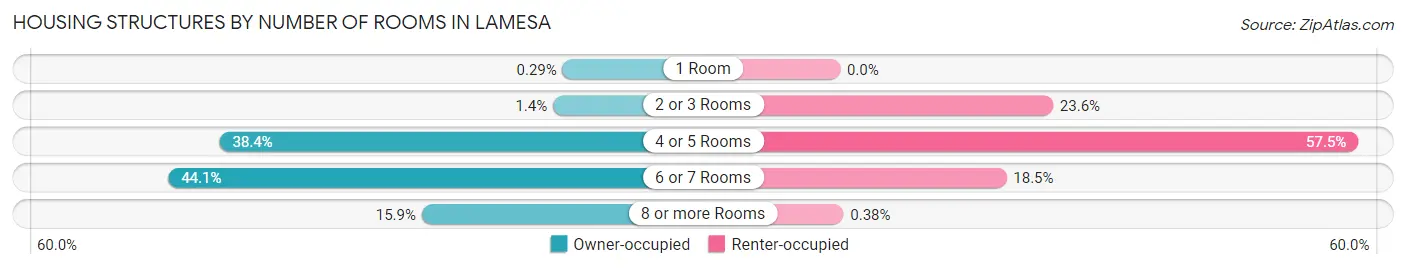
| Number of Rooms | Owner-occupied | Renter-occupied |
| 1 Room | 7 (0.3%) | 0 (0.0%) |
| 2 or 3 Rooms | 32 (1.3%) | 247 (23.6%) |
| 4 or 5 Rooms | 911 (38.4%) | 601 (57.5%) |
| 6 or 7 Rooms | 1,046 (44.1%) | 193 (18.5%) |
| 8 or more Rooms | 378 (15.9%) | 4 (0.4%) |
| Total | 2,374 (100.0%) | 1,045 (100.0%) |
Housing Structure by Heating Type in Lamesa
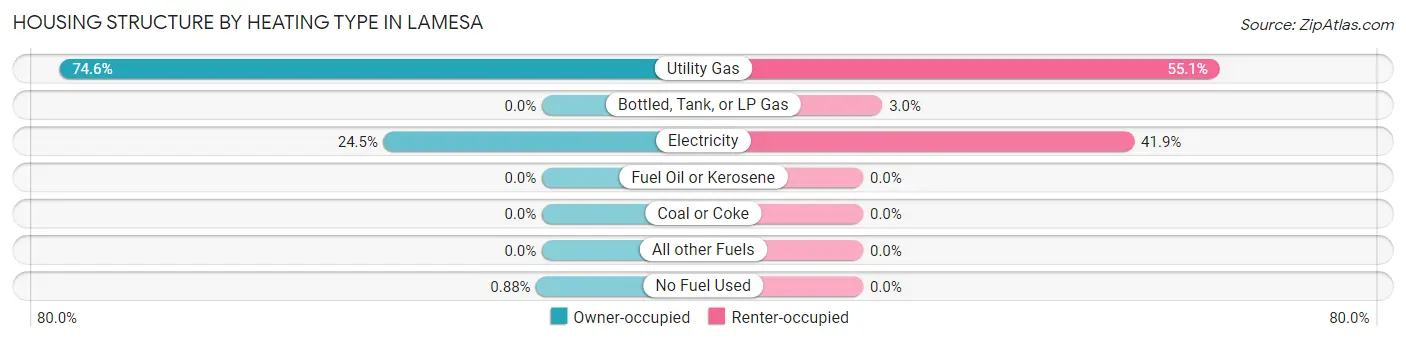
| Heating Type | Owner-occupied | Renter-occupied |
| Utility Gas | 1,772 (74.6%) | 576 (55.1%) |
| Bottled, Tank, or LP Gas | 0 (0.0%) | 31 (3.0%) |
| Electricity | 581 (24.5%) | 438 (41.9%) |
| Fuel Oil or Kerosene | 0 (0.0%) | 0 (0.0%) |
| Coal or Coke | 0 (0.0%) | 0 (0.0%) |
| All other Fuels | 0 (0.0%) | 0 (0.0%) |
| No Fuel Used | 21 (0.9%) | 0 (0.0%) |
| Total | 2,374 (100.0%) | 1,045 (100.0%) |
Household Vehicle Usage in Lamesa
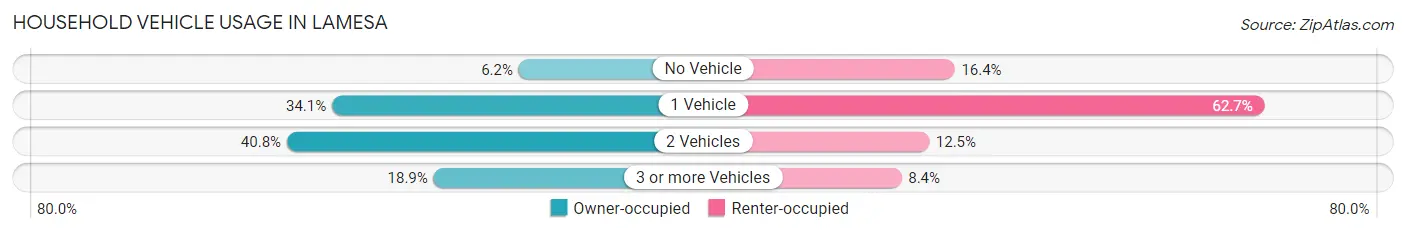
| Vehicles per Household | Owner-occupied | Renter-occupied |
| No Vehicle | 147 (6.2%) | 171 (16.4%) |
| 1 Vehicle | 809 (34.1%) | 655 (62.7%) |
| 2 Vehicles | 969 (40.8%) | 131 (12.5%) |
| 3 or more Vehicles | 449 (18.9%) | 88 (8.4%) |
| Total | 2,374 (100.0%) | 1,045 (100.0%) |
Real Estate & Mortgages in Lamesa
Real Estate and Mortgage Overview in Lamesa
| Characteristic | Without Mortgage | With Mortgage |
| Housing Units | 1,488 | 886 |
| Median Property Value | $66,300 | $135,600 |
| Median Household Income | $41,360 | $164 |
| Monthly Housing Costs | $397 | $29 |
| Real Estate Taxes | $952 | $21 |
Property Value by Mortgage Status in Lamesa
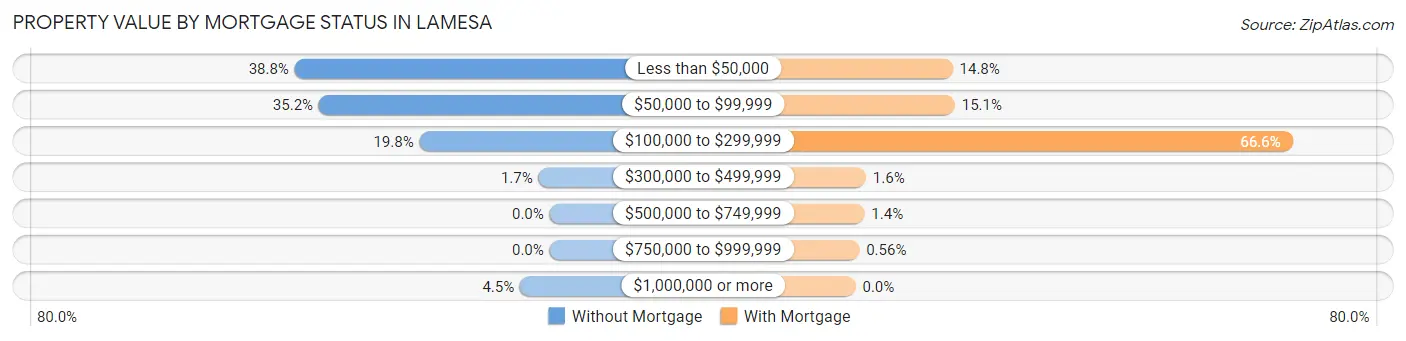
| Property Value | Without Mortgage | With Mortgage |
| Less than $50,000 | 578 (38.8%) | 131 (14.8%) |
| $50,000 to $99,999 | 523 (35.1%) | 134 (15.1%) |
| $100,000 to $299,999 | 295 (19.8%) | 590 (66.6%) |
| $300,000 to $499,999 | 25 (1.7%) | 14 (1.6%) |
| $500,000 to $749,999 | 0 (0.0%) | 12 (1.3%) |
| $750,000 to $999,999 | 0 (0.0%) | 5 (0.6%) |
| $1,000,000 or more | 67 (4.5%) | 0 (0.0%) |
| Total | 1,488 (100.0%) | 886 (100.0%) |
Household Income by Mortgage Status in Lamesa
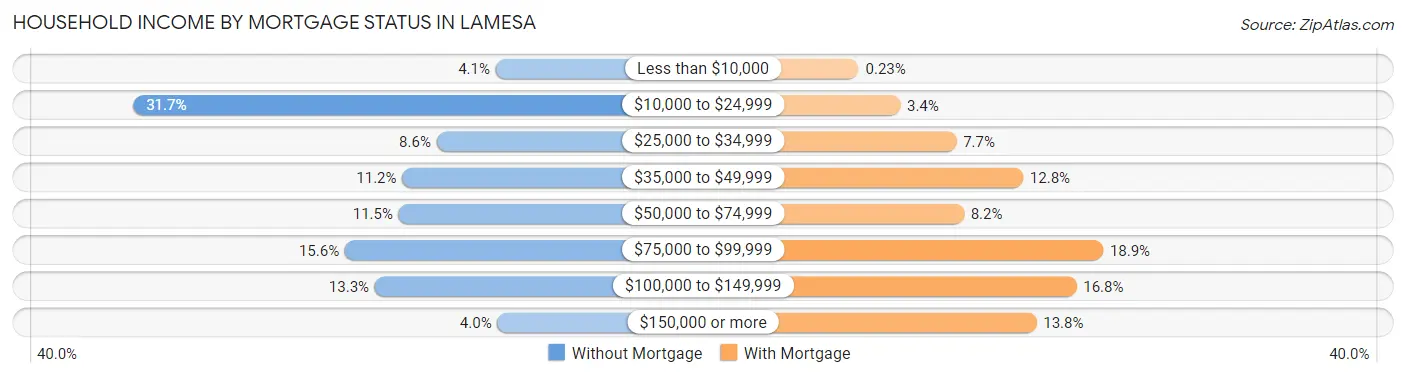
| Household Income | Without Mortgage | With Mortgage |
| Less than $10,000 | 61 (4.1%) | 2 (0.2%) |
| $10,000 to $24,999 | 472 (31.7%) | 30 (3.4%) |
| $25,000 to $34,999 | 128 (8.6%) | 68 (7.7%) |
| $35,000 to $49,999 | 167 (11.2%) | 113 (12.8%) |
| $50,000 to $74,999 | 171 (11.5%) | 73 (8.2%) |
| $75,000 to $99,999 | 232 (15.6%) | 167 (18.9%) |
| $100,000 to $149,999 | 198 (13.3%) | 149 (16.8%) |
| $150,000 or more | 59 (4.0%) | 122 (13.8%) |
| Total | 1,488 (100.0%) | 886 (100.0%) |
Property Value to Household Income Ratio in Lamesa
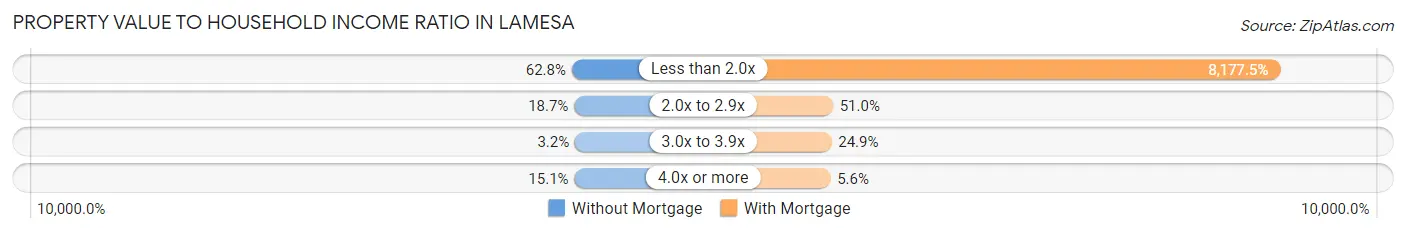
| Value-to-Income Ratio | Without Mortgage | With Mortgage |
| Less than 2.0x | 934 (62.8%) | 72,453 (8,177.5%) |
| 2.0x to 2.9x | 278 (18.7%) | 452 (51.0%) |
| 3.0x to 3.9x | 48 (3.2%) | 221 (24.9%) |
| 4.0x or more | 224 (15.0%) | 50 (5.6%) |
| Total | 1,488 (100.0%) | 886 (100.0%) |
Real Estate Taxes by Mortgage Status in Lamesa
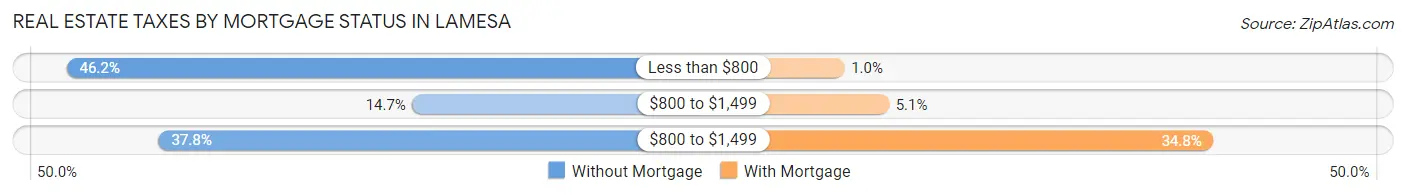
| Property Taxes | Without Mortgage | With Mortgage |
| Less than $800 | 687 (46.2%) | 9 (1.0%) |
| $800 to $1,499 | 218 (14.6%) | 45 (5.1%) |
| $800 to $1,499 | 562 (37.8%) | 308 (34.8%) |
| Total | 1,488 (100.0%) | 886 (100.0%) |
Health & Disability in Lamesa
Health Insurance Coverage by Age in Lamesa
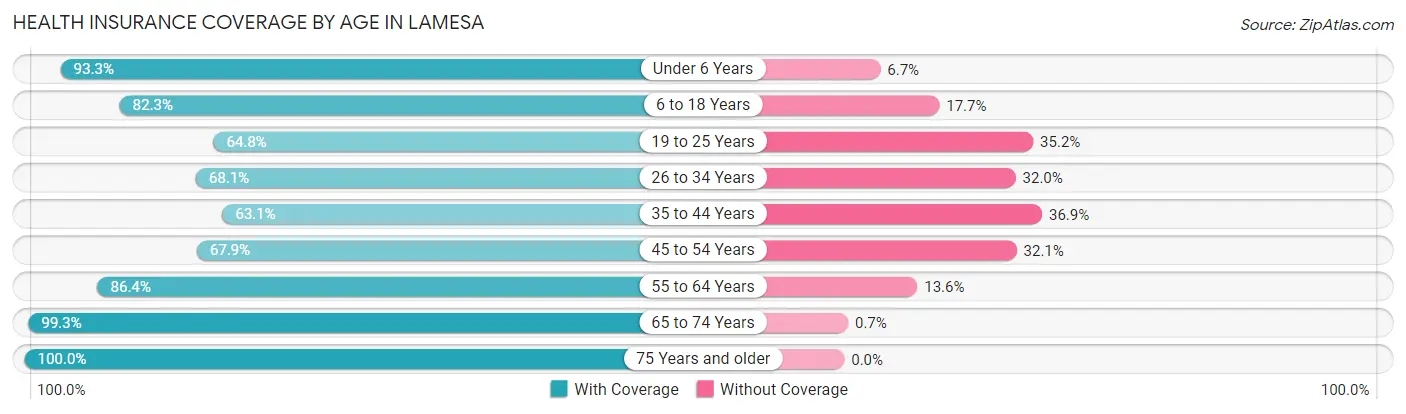
| Age Bracket | With Coverage | Without Coverage |
| Under 6 Years | 722 (93.3%) | 52 (6.7%) |
| 6 to 18 Years | 1,546 (82.3%) | 333 (17.7%) |
| 19 to 25 Years | 572 (64.8%) | 311 (35.2%) |
| 26 to 34 Years | 705 (68.0%) | 331 (32.0%) |
| 35 to 44 Years | 611 (63.1%) | 357 (36.9%) |
| 45 to 54 Years | 566 (67.9%) | 268 (32.1%) |
| 55 to 64 Years | 755 (86.4%) | 119 (13.6%) |
| 65 to 74 Years | 708 (99.3%) | 5 (0.7%) |
| 75 Years and older | 546 (100.0%) | 0 (0.0%) |
| Total | 6,731 (79.1%) | 1,776 (20.9%) |
Health Insurance Coverage by Citizenship Status in Lamesa
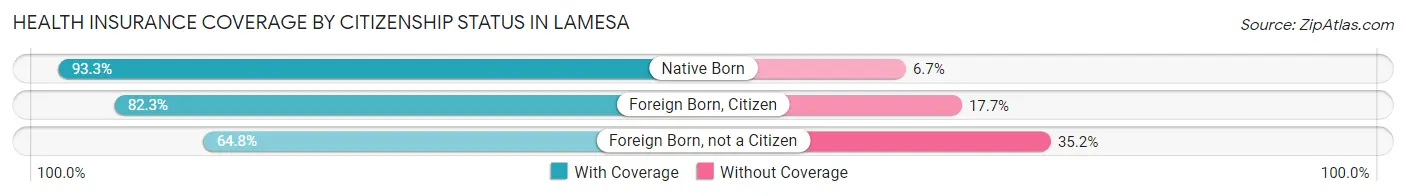
| Citizenship Status | With Coverage | Without Coverage |
| Native Born | 722 (93.3%) | 52 (6.7%) |
| Foreign Born, Citizen | 1,546 (82.3%) | 333 (17.7%) |
| Foreign Born, not a Citizen | 572 (64.8%) | 311 (35.2%) |
Health Insurance Coverage by Household Income in Lamesa
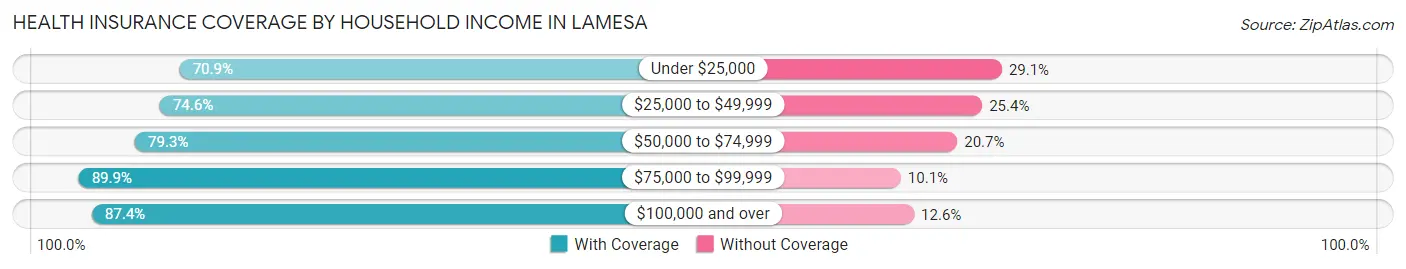
| Household Income | With Coverage | Without Coverage |
| Under $25,000 | 1,669 (70.9%) | 684 (29.1%) |
| $25,000 to $49,999 | 1,347 (74.6%) | 458 (25.4%) |
| $50,000 to $74,999 | 1,122 (79.3%) | 293 (20.7%) |
| $75,000 to $99,999 | 993 (89.9%) | 112 (10.1%) |
| $100,000 and over | 1,585 (87.4%) | 229 (12.6%) |
Public vs Private Health Insurance Coverage by Age in Lamesa
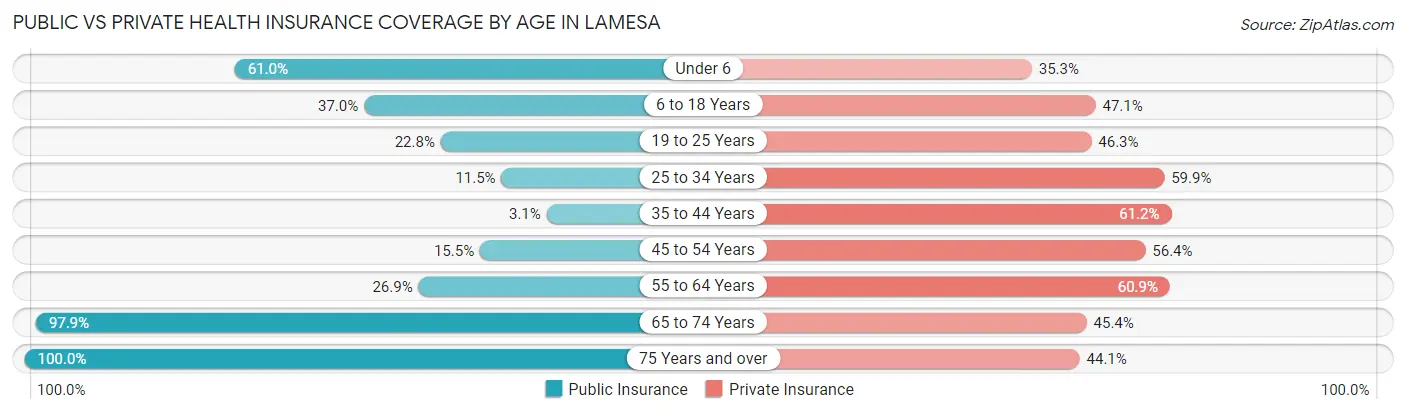
| Age Bracket | Public Insurance | Private Insurance |
| Under 6 | 472 (61.0%) | 273 (35.3%) |
| 6 to 18 Years | 695 (37.0%) | 885 (47.1%) |
| 19 to 25 Years | 201 (22.8%) | 409 (46.3%) |
| 25 to 34 Years | 119 (11.5%) | 620 (59.9%) |
| 35 to 44 Years | 30 (3.1%) | 592 (61.2%) |
| 45 to 54 Years | 129 (15.5%) | 470 (56.4%) |
| 55 to 64 Years | 235 (26.9%) | 532 (60.9%) |
| 65 to 74 Years | 698 (97.9%) | 324 (45.4%) |
| 75 Years and over | 546 (100.0%) | 241 (44.1%) |
| Total | 3,125 (36.7%) | 4,346 (51.1%) |
Disability Status by Sex by Age in Lamesa
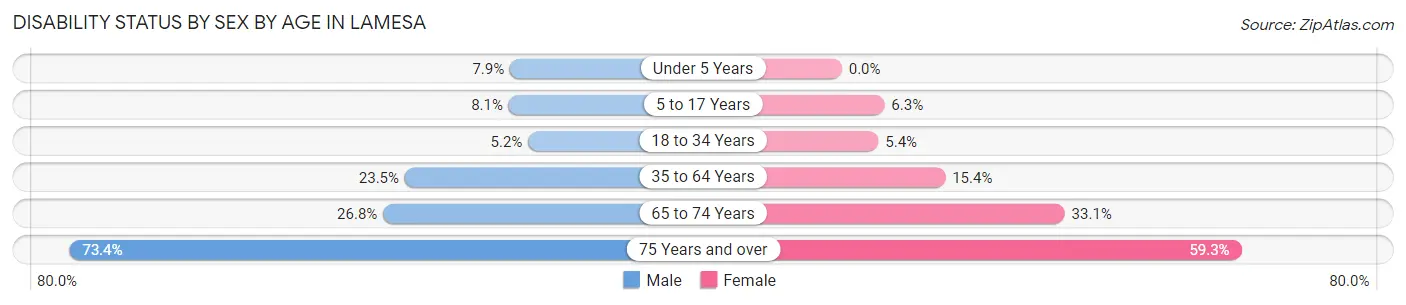
| Age Bracket | Male | Female |
| Under 5 Years | 27 (7.9%) | 0 (0.0%) |
| 5 to 17 Years | 76 (8.1%) | 55 (6.3%) |
| 18 to 34 Years | 57 (5.2%) | 54 (5.4%) |
| 35 to 64 Years | 305 (23.5%) | 212 (15.4%) |
| 65 to 74 Years | 80 (26.8%) | 137 (33.1%) |
| 75 Years and over | 157 (73.4%) | 197 (59.3%) |
Disability Class by Sex by Age in Lamesa
Disability Class: Hearing Difficulty
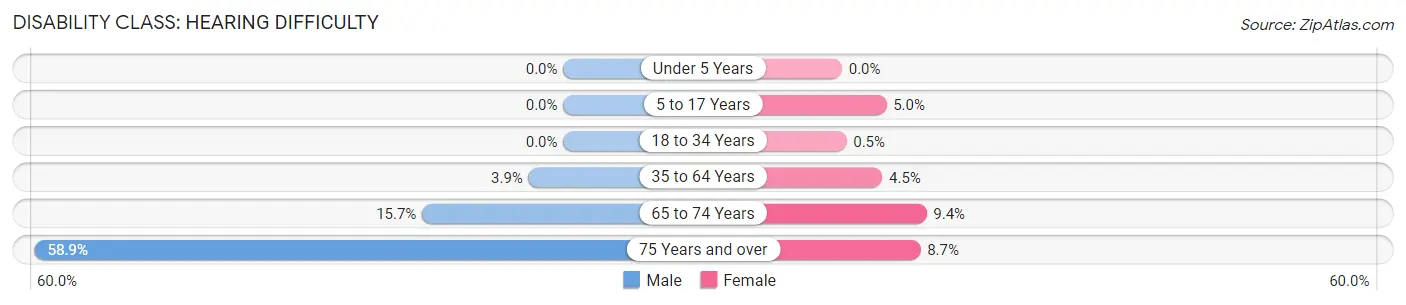
| Age Bracket | Male | Female |
| Under 5 Years | 0 (0.0%) | 0 (0.0%) |
| 5 to 17 Years | 0 (0.0%) | 43 (5.0%) |
| 18 to 34 Years | 0 (0.0%) | 5 (0.5%) |
| 35 to 64 Years | 50 (3.9%) | 62 (4.5%) |
| 65 to 74 Years | 47 (15.7%) | 39 (9.4%) |
| 75 Years and over | 126 (58.9%) | 29 (8.7%) |
Disability Class: Vision Difficulty
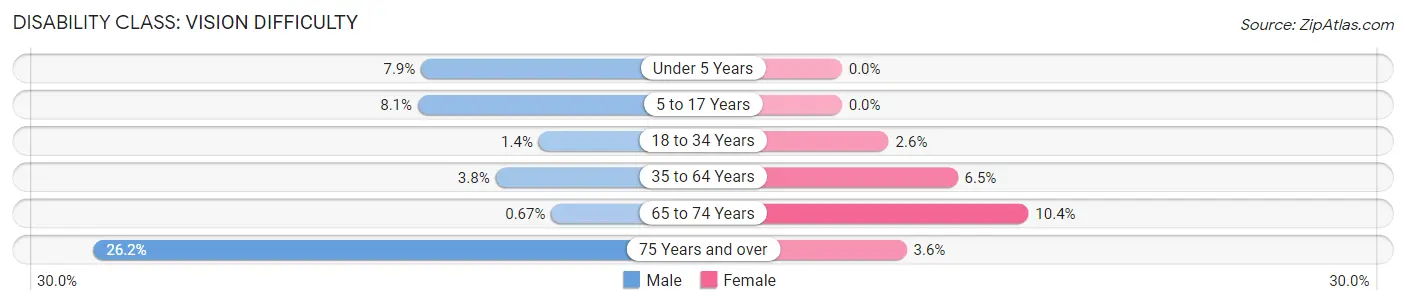
| Age Bracket | Male | Female |
| Under 5 Years | 27 (7.9%) | 0 (0.0%) |
| 5 to 17 Years | 76 (8.1%) | 0 (0.0%) |
| 18 to 34 Years | 15 (1.4%) | 26 (2.6%) |
| 35 to 64 Years | 49 (3.8%) | 89 (6.5%) |
| 65 to 74 Years | 2 (0.7%) | 43 (10.4%) |
| 75 Years and over | 56 (26.2%) | 12 (3.6%) |
Disability Class: Cognitive Difficulty
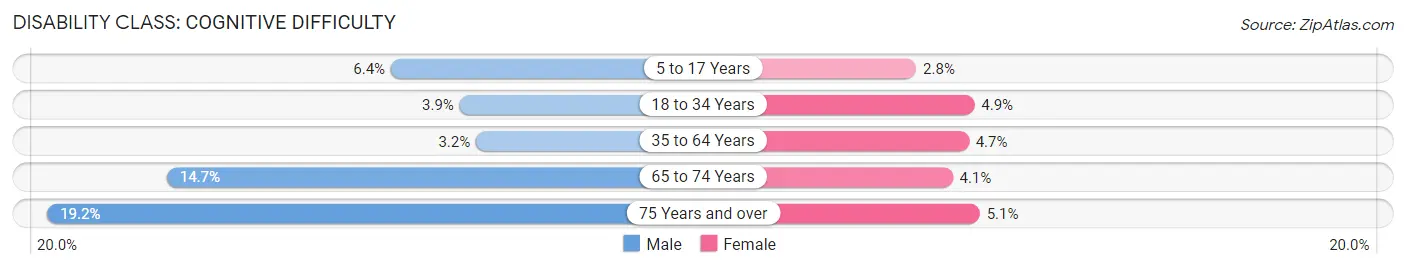
| Age Bracket | Male | Female |
| 5 to 17 Years | 60 (6.4%) | 24 (2.8%) |
| 18 to 34 Years | 42 (3.8%) | 49 (4.9%) |
| 35 to 64 Years | 42 (3.2%) | 65 (4.7%) |
| 65 to 74 Years | 44 (14.7%) | 17 (4.1%) |
| 75 Years and over | 41 (19.2%) | 17 (5.1%) |
Disability Class: Ambulatory Difficulty
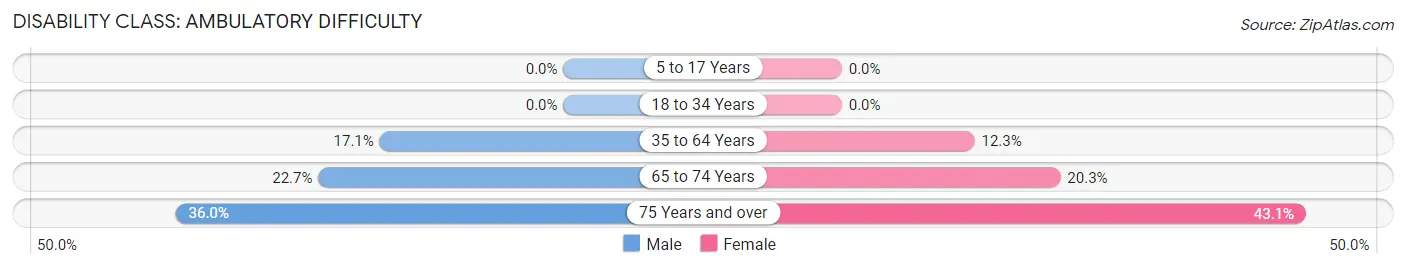
| Age Bracket | Male | Female |
| 5 to 17 Years | 0 (0.0%) | 0 (0.0%) |
| 18 to 34 Years | 0 (0.0%) | 0 (0.0%) |
| 35 to 64 Years | 221 (17.1%) | 170 (12.3%) |
| 65 to 74 Years | 68 (22.7%) | 84 (20.3%) |
| 75 Years and over | 77 (36.0%) | 143 (43.1%) |
Disability Class: Self-Care Difficulty
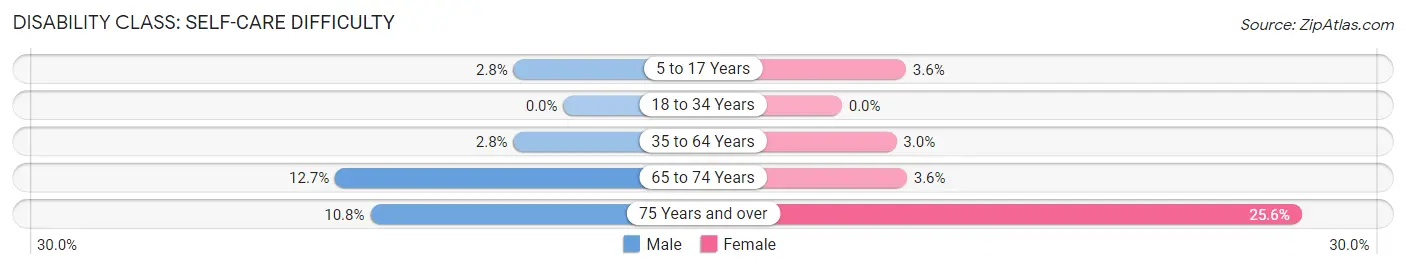
| Age Bracket | Male | Female |
| 5 to 17 Years | 26 (2.8%) | 31 (3.6%) |
| 18 to 34 Years | 0 (0.0%) | 0 (0.0%) |
| 35 to 64 Years | 36 (2.8%) | 42 (3.0%) |
| 65 to 74 Years | 38 (12.7%) | 15 (3.6%) |
| 75 Years and over | 23 (10.7%) | 85 (25.6%) |
Technology Access in Lamesa
Computing Device Access in Lamesa
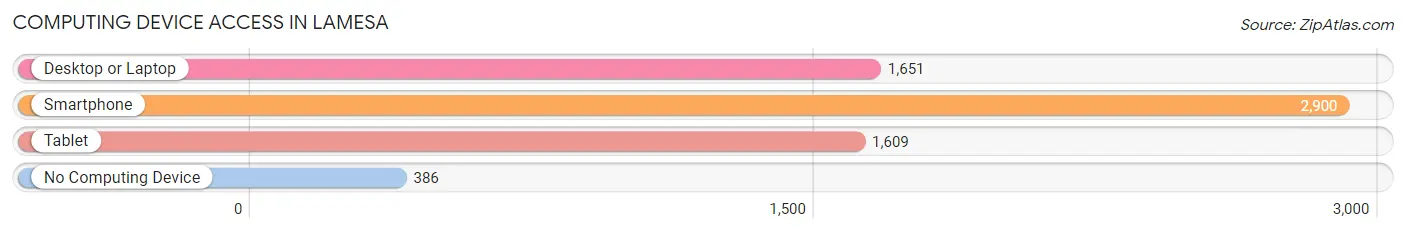
| Device Type | # Households | % Households |
| Desktop or Laptop | 1,651 | 48.3% |
| Smartphone | 2,900 | 84.8% |
| Tablet | 1,609 | 47.1% |
| No Computing Device | 386 | 11.3% |
| Total | 3,419 | 100.0% |
Internet Access in Lamesa
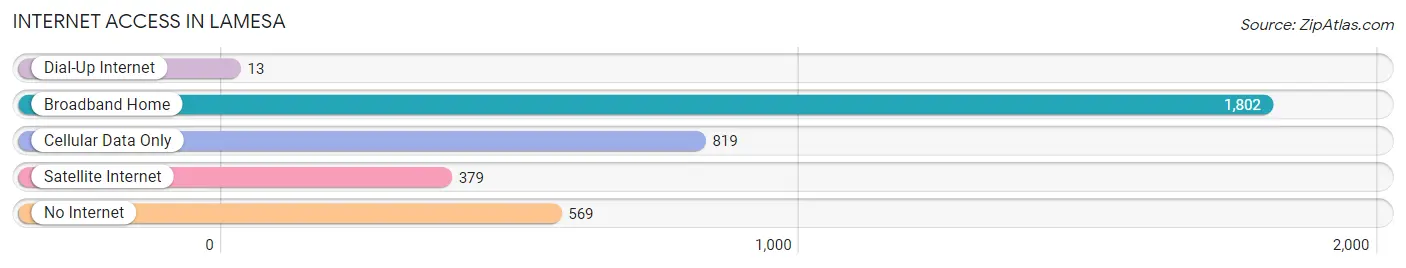
| Internet Type | # Households | % Households |
| Dial-Up Internet | 13 | 0.4% |
| Broadband Home | 1,802 | 52.7% |
| Cellular Data Only | 819 | 23.9% |
| Satellite Internet | 379 | 11.1% |
| No Internet | 569 | 16.6% |
| Total | 3,419 | 100.0% |
Lamesa Summary
Lamesa, Texas is a small city located in Dawson County, Texas. It is situated in the South Plains region of the state, approximately 80 miles northwest of Lubbock. The city has a population of approximately 11,000 people and is the county seat of Dawson County.
History
Lamesa was founded in 1906 by the Lamesa Townsite Company, which was owned by the Texas and Pacific Railway. The town was named after the Spanish word for “table”, as the town was situated on a flat table-like area of land. The town was incorporated in 1909 and quickly grew to become a major agricultural center in the region.
In the early 20th century, Lamesa was a major cotton-producing center, and the town was home to several cotton gins and related businesses. The town also had a thriving business district, with several stores, banks, and other businesses.
Geography
Lamesa is located in the South Plains region of Texas, approximately 80 miles northwest of Lubbock. The city is situated on the Llano Estacado, a large plateau that stretches across the Texas Panhandle and parts of New Mexico. The city is located at the intersection of U.S. Highway 87 and State Highway 137.
The climate in Lamesa is semi-arid, with hot summers and mild winters. The average annual temperature is 64°F, and the average annual precipitation is 19.5 inches.
Economy
The economy of Lamesa is largely based on agriculture. The city is home to several cotton gins and related businesses, as well as several grain elevators. The city is also home to several manufacturing companies, including a plastics plant and a metal fabrication plant.
The city is also home to several retail stores, restaurants, and other businesses. The city is served by the Lamesa Municipal Airport, which provides general aviation services.
Demographics
As of the 2010 census, the population of Lamesa was 11,039. The racial makeup of the city was 75.3% White, 0.9% African American, 0.7% Native American, 0.4% Asian, 0.1% Pacific Islander, 19.7% from other races, and 3.0% from two or more races. Hispanic or Latino of any race were 37.2% of the population.
The median household income in Lamesa was $31,944, and the median family income was $37,917. The per capita income for the city was $15,945. About 18.2% of the population was below the poverty line.
Conclusion
Lamesa, Texas is a small city located in the South Plains region of the state. The city has a population of approximately 11,000 people and is the county seat of Dawson County. The economy of Lamesa is largely based on agriculture, and the city is home to several cotton gins and related businesses, as well as several manufacturing companies. The racial makeup of the city is predominantly White, with a significant Hispanic population. The median household income in Lamesa is lower than the state average, and about 18.2% of the population is below the poverty line.
Common Questions
What is Per Capita Income in Lamesa?
Per Capita income in Lamesa is $23,641.
What is the Median Family Income in Lamesa?
Median Family Income in Lamesa is $56,171.
What is the Median Household income in Lamesa?
Median Household Income in Lamesa is $39,434.
What is Income or Wage Gap in Lamesa?
Income or Wage Gap in Lamesa is 42.6%.
Women in Lamesa earn 57.4 cents for every dollar earned by a man.
What is Inequality or Gini Index in Lamesa?
Inequality or Gini Index in Lamesa is 0.50.
What is the Total Population of Lamesa?
Total Population of Lamesa is 8,571.
What is the Total Male Population of Lamesa?
Total Male Population of Lamesa is 4,203.
What is the Total Female Population of Lamesa?
Total Female Population of Lamesa is 4,368.
What is the Ratio of Males per 100 Females in Lamesa?
There are 96.22 Males per 100 Females in Lamesa.
What is the Ratio of Females per 100 Males in Lamesa?
There are 103.93 Females per 100 Males in Lamesa.
What is the Median Population Age in Lamesa?
Median Population Age in Lamesa is 33.1 Years.
What is the Average Family Size in Lamesa
Average Family Size in Lamesa is 3.3 People.
What is the Average Household Size in Lamesa
Average Household Size in Lamesa is 2.5 People.
How Large is the Labor Force in Lamesa?
There are 3,832 People in the Labor Forcein in Lamesa.
What is the Percentage of People in the Labor Force in Lamesa?
60.6% of People are in the Labor Force in Lamesa.
What is the Unemployment Rate in Lamesa?
Unemployment Rate in Lamesa is 11.0%.