Lake Dallas, TX Map & Demographics
Lake Dallas Map
Lake Dallas Overview
$34,390
PER CAPITA INCOME
$87,885
AVG FAMILY INCOME
$72,386
AVG HOUSEHOLD INCOME
5.4%
WAGE / INCOME GAP [ % ]
94.6¢/ $1
WAGE / INCOME GAP [ $ ]
0.39
INEQUALITY / GINI INDEX
7,682
TOTAL POPULATION
3,450
MALE POPULATION
4,232
FEMALE POPULATION
81.52
MALES / 100 FEMALES
122.67
FEMALES / 100 MALES
38.9
MEDIAN AGE
3.0
AVG FAMILY SIZE
2.6
AVG HOUSEHOLD SIZE
4,338
LABOR FORCE [ PEOPLE ]
72.1%
PERCENT IN LABOR FORCE
2.7%
UNEMPLOYMENT RATE
Lake Dallas Zip Codes
Income in Lake Dallas
Income Overview in Lake Dallas
Per Capita Income in Lake Dallas is $34,390, while median incomes of families and households are $87,885 and $72,386 respectively.
| Characteristic | Number | Measure |
| Per Capita Income | 7,682 | $34,390 |
| Median Family Income | 2,242 | $87,885 |
| Mean Family Income | 2,242 | $100,807 |
| Median Household Income | 2,885 | $72,386 |
| Mean Household Income | 2,885 | $90,016 |
| Income Deficit | 2,242 | $0 |
| Wage / Income Gap (%) | 7,682 | 5.37% |
| Wage / Income Gap ($) | 7,682 | 94.63¢ per $1 |
| Gini / Inequality Index | 7,682 | 0.39 |
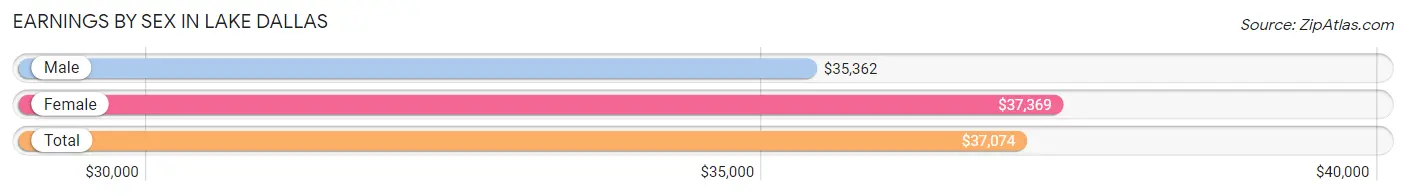
Earnings by Sex in Lake Dallas
Average Earnings in Lake Dallas are $37,074, $35,362 for men and $37,369 for women, a difference of 5.4%.
| Sex | Number | Average Earnings |
| Male | 2,411 (53.4%) | $35,362 |
| Female | 2,103 (46.6%) | $37,369 |
| Total | 4,514 (100.0%) | $37,074 |
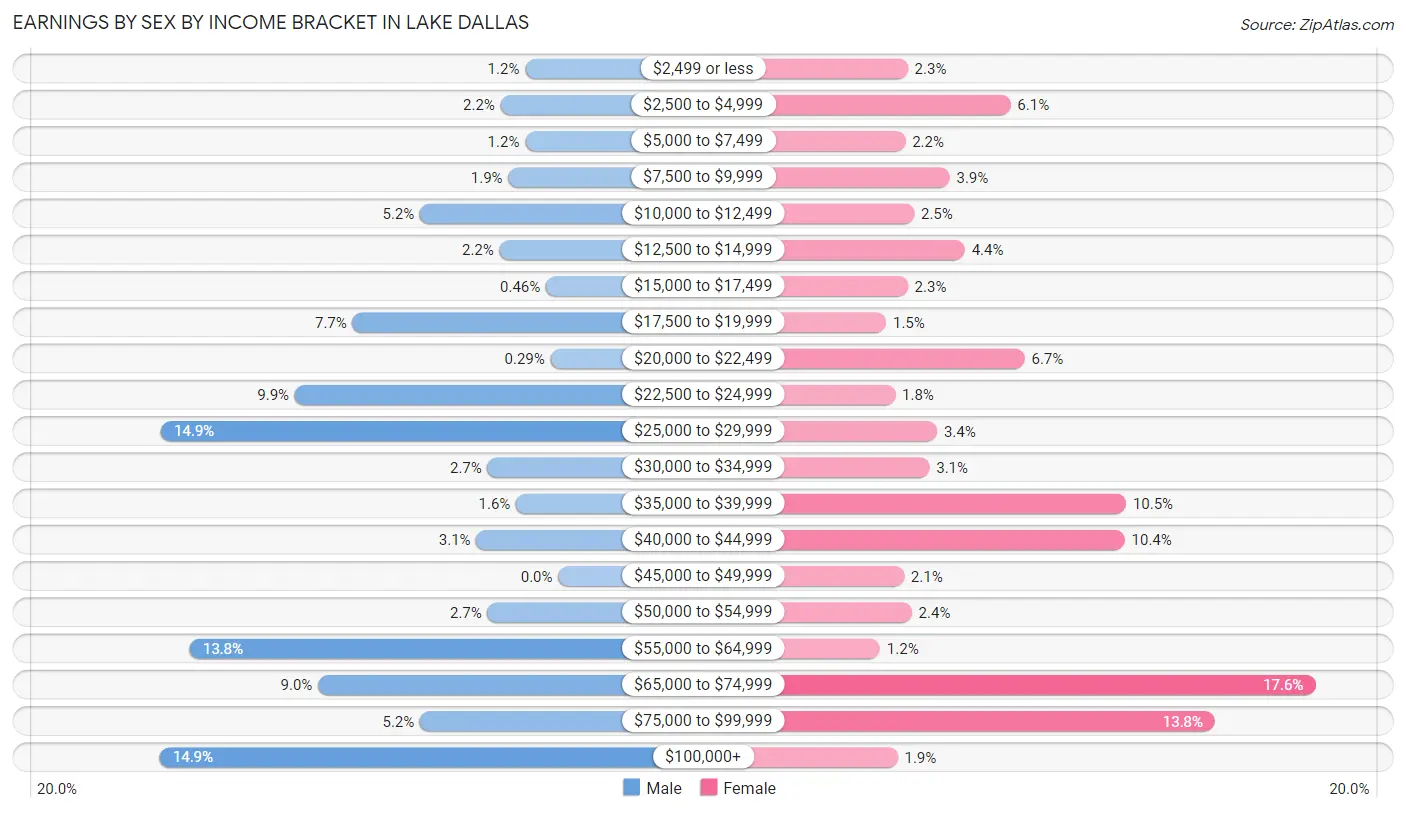
Earnings by Sex by Income Bracket in Lake Dallas
The most common earnings brackets in Lake Dallas are $100,000+ for men (360 | 14.9%) and $65,000 to $74,999 for women (369 | 17.5%).
| Income | Male | Female |
| $2,499 or less | 30 (1.2%) | 48 (2.3%) |
| $2,500 to $4,999 | 52 (2.2%) | 129 (6.1%) |
| $5,000 to $7,499 | 30 (1.2%) | 46 (2.2%) |
| $7,500 to $9,999 | 45 (1.9%) | 81 (3.8%) |
| $10,000 to $12,499 | 125 (5.2%) | 53 (2.5%) |
| $12,500 to $14,999 | 53 (2.2%) | 93 (4.4%) |
| $15,000 to $17,499 | 11 (0.5%) | 48 (2.3%) |
| $17,500 to $19,999 | 186 (7.7%) | 31 (1.5%) |
| $20,000 to $22,499 | 7 (0.3%) | 140 (6.7%) |
| $22,500 to $24,999 | 238 (9.9%) | 38 (1.8%) |
| $25,000 to $29,999 | 359 (14.9%) | 71 (3.4%) |
| $30,000 to $34,999 | 64 (2.6%) | 65 (3.1%) |
| $35,000 to $39,999 | 38 (1.6%) | 220 (10.5%) |
| $40,000 to $44,999 | 74 (3.1%) | 219 (10.4%) |
| $45,000 to $49,999 | 0 (0.0%) | 45 (2.1%) |
| $50,000 to $54,999 | 64 (2.6%) | 51 (2.4%) |
| $55,000 to $64,999 | 333 (13.8%) | 26 (1.2%) |
| $65,000 to $74,999 | 217 (9.0%) | 369 (17.5%) |
| $75,000 to $99,999 | 125 (5.2%) | 290 (13.8%) |
| $100,000+ | 360 (14.9%) | 40 (1.9%) |
| Total | 2,411 (100.0%) | 2,103 (100.0%) |
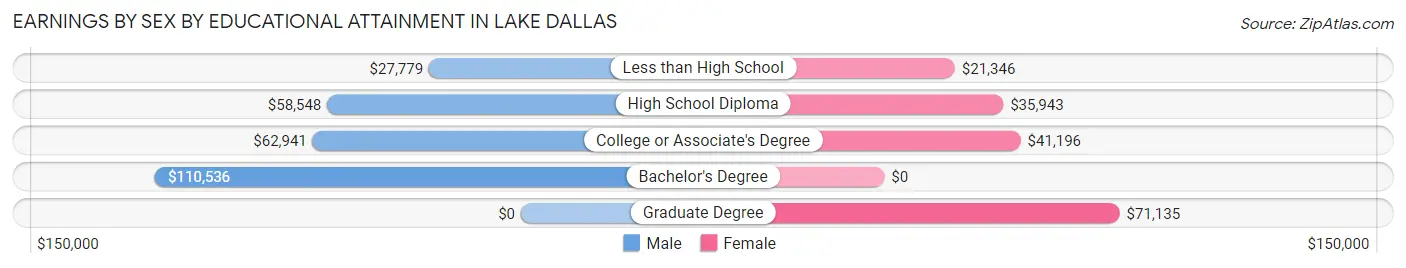
Earnings by Sex by Educational Attainment in Lake Dallas
Average earnings in Lake Dallas are $56,160 for men and $41,397 for women, a difference of 26.3%. Men with an educational attainment of bachelor's degree enjoy the highest average annual earnings of $110,536, while those with less than high school education earn the least with $27,779. Women with an educational attainment of graduate degree earn the most with the average annual earnings of $71,135, while those with less than high school education have the smallest earnings of $21,346.
| Educational Attainment | Male Income | Female Income |
| Less than High School | $27,779 | $21,346 |
| High School Diploma | $58,548 | $35,943 |
| College or Associate's Degree | $62,941 | $41,196 |
| Bachelor's Degree | $110,536 | $0 |
| Graduate Degree | - | - |
| Total | $56,160 | $41,397 |
Family Income in Lake Dallas
Family Income Brackets in Lake Dallas
According to the Lake Dallas family income data, there are 509 families falling into the $100,000 to $149,999 income range, which is the most common income bracket and makes up 22.7% of all families. Conversely, the $10,000 to $14,999 income bracket is the least frequent group with only 11 families (0.5%) belonging to this category.
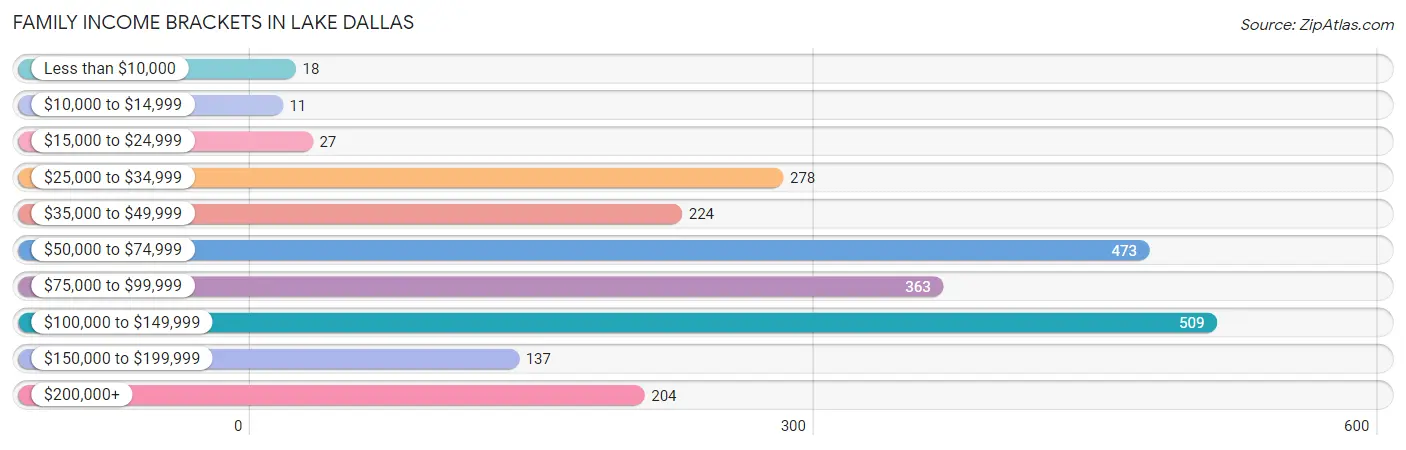
| Income Bracket | # Families | % Families |
| Less than $10,000 | 18 | 0.8% |
| $10,000 to $14,999 | 11 | 0.5% |
| $15,000 to $24,999 | 27 | 1.2% |
| $25,000 to $34,999 | 278 | 12.4% |
| $35,000 to $49,999 | 224 | 10.0% |
| $50,000 to $74,999 | 473 | 21.1% |
| $75,000 to $99,999 | 363 | 16.2% |
| $100,000 to $149,999 | 509 | 22.7% |
| $150,000 to $199,999 | 137 | 6.1% |
| $200,000+ | 204 | 9.1% |
Family Income by Famaliy Size in Lake Dallas
5-person families (118 | 5.3%) account for the highest median family income in Lake Dallas with $161,786 per family, while 2-person families (867 | 38.7%) have the highest median income of $37,914 per family member.
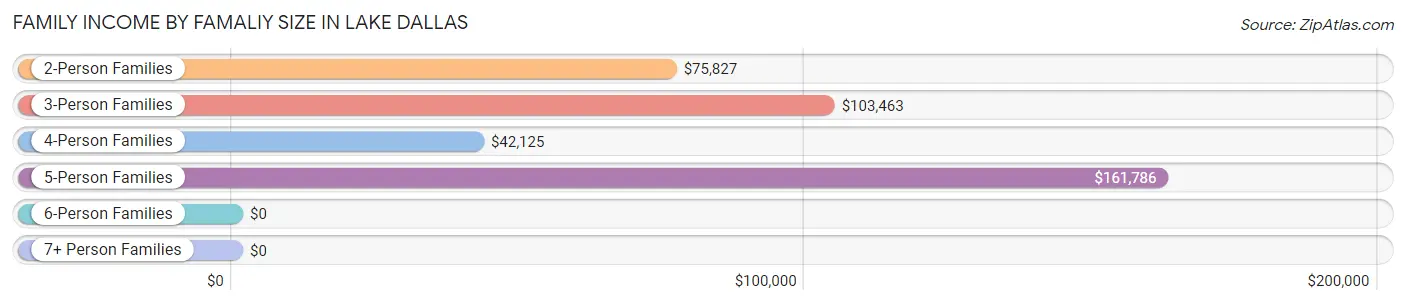
| Income Bracket | # Families | Median Income |
| 2-Person Families | 867 (38.7%) | $75,827 |
| 3-Person Families | 768 (34.3%) | $103,463 |
| 4-Person Families | 400 (17.8%) | $42,125 |
| 5-Person Families | 118 (5.3%) | $161,786 |
| 6-Person Families | 0 (0.0%) | $0 |
| 7+ Person Families | 89 (4.0%) | $0 |
| Total | 2,242 (100.0%) | $87,885 |
Family Income by Number of Earners in Lake Dallas
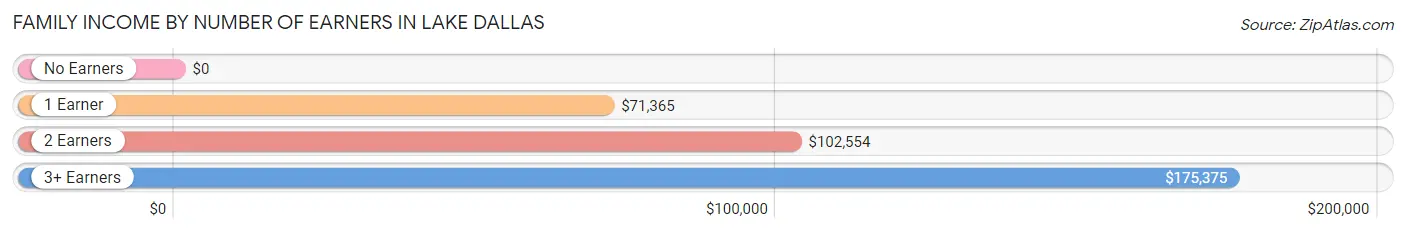
| Number of Earners | # Families | Median Income |
| No Earners | 60 (2.7%) | $0 |
| 1 Earner | 917 (40.9%) | $71,365 |
| 2 Earners | 930 (41.5%) | $102,554 |
| 3+ Earners | 335 (14.9%) | $175,375 |
| Total | 2,242 (100.0%) | $87,885 |
Household Income in Lake Dallas
Household Income Brackets in Lake Dallas
With 635 households falling in the category, the $50,000 to $74,999 income range is the most frequent in Lake Dallas, accounting for 22.0% of all households. In contrast, only 43 households (1.5%) fall into the $10,000 to $14,999 income bracket, making it the least populous group.
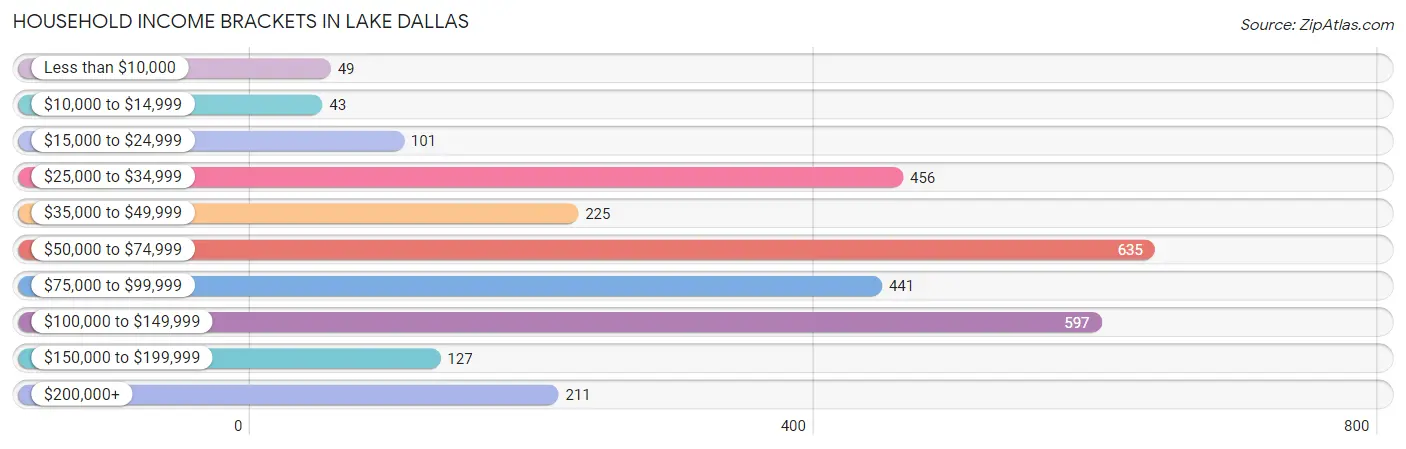
| Income Bracket | # Households | % Households |
| Less than $10,000 | 49 | 1.7% |
| $10,000 to $14,999 | 43 | 1.5% |
| $15,000 to $24,999 | 101 | 3.5% |
| $25,000 to $34,999 | 456 | 15.8% |
| $35,000 to $49,999 | 225 | 7.8% |
| $50,000 to $74,999 | 635 | 22.0% |
| $75,000 to $99,999 | 441 | 15.3% |
| $100,000 to $149,999 | 597 | 20.7% |
| $150,000 to $199,999 | 127 | 4.4% |
| $200,000+ | 211 | 7.3% |
Household Income by Householder Age in Lake Dallas
The median household income in Lake Dallas is $72,386, with the highest median household income of $96,424 found in the 45 to 64 years age bracket for the primary householder. A total of 1,199 households (41.6%) fall into this category. Meanwhile, the 15 to 24 years age bracket for the primary householder has the lowest median household income of $0, with 24 households (0.8%) in this group.
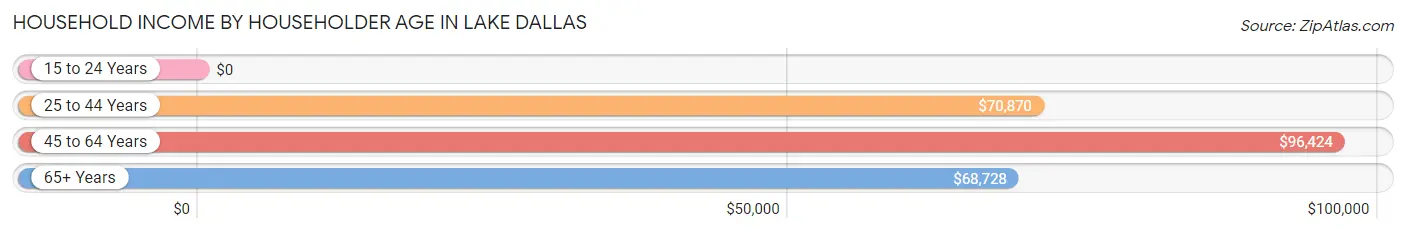
| Income Bracket | # Households | Median Income |
| 15 to 24 Years | 24 (0.8%) | $0 |
| 25 to 44 Years | 1,376 (47.7%) | $70,870 |
| 45 to 64 Years | 1,199 (41.6%) | $96,424 |
| 65+ Years | 286 (9.9%) | $68,728 |
| Total | 2,885 (100.0%) | $72,386 |
Poverty in Lake Dallas
Income Below Poverty by Sex and Age in Lake Dallas
With 3.2% poverty level for males and 3.1% for females among the residents of Lake Dallas, 15 year old males and 75 year old and over females are the most vulnerable to poverty, with 24 males (42.1%) and 12 females (40.0%) in their respective age groups living below the poverty level.
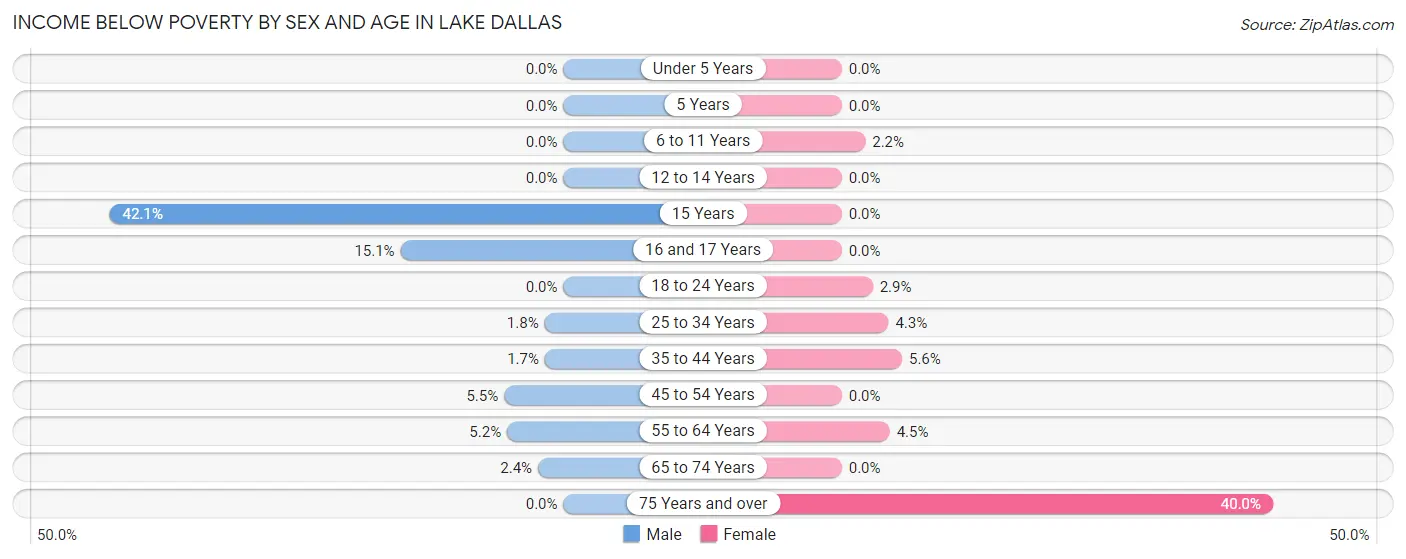
| Age Bracket | Male | Female |
| Under 5 Years | 0 (0.0%) | 0 (0.0%) |
| 5 Years | 0 (0.0%) | 0 (0.0%) |
| 6 to 11 Years | 0 (0.0%) | 10 (2.2%) |
| 12 to 14 Years | 0 (0.0%) | 0 (0.0%) |
| 15 Years | 24 (42.1%) | 0 (0.0%) |
| 16 and 17 Years | 13 (15.1%) | 0 (0.0%) |
| 18 to 24 Years | 0 (0.0%) | 6 (2.9%) |
| 25 to 34 Years | 8 (1.8%) | 17 (4.3%) |
| 35 to 44 Years | 12 (1.7%) | 52 (5.6%) |
| 45 to 54 Years | 27 (5.5%) | 0 (0.0%) |
| 55 to 64 Years | 15 (5.2%) | 35 (4.4%) |
| 65 to 74 Years | 11 (2.4%) | 0 (0.0%) |
| 75 Years and over | 0 (0.0%) | 12 (40.0%) |
| Total | 110 (3.2%) | 132 (3.1%) |
Income Above Poverty by Sex and Age in Lake Dallas
According to the poverty statistics in Lake Dallas, males aged under 5 years and females aged under 5 years are the age groups that are most secure financially, with 100.0% of males and 100.0% of females in these age groups living above the poverty line.
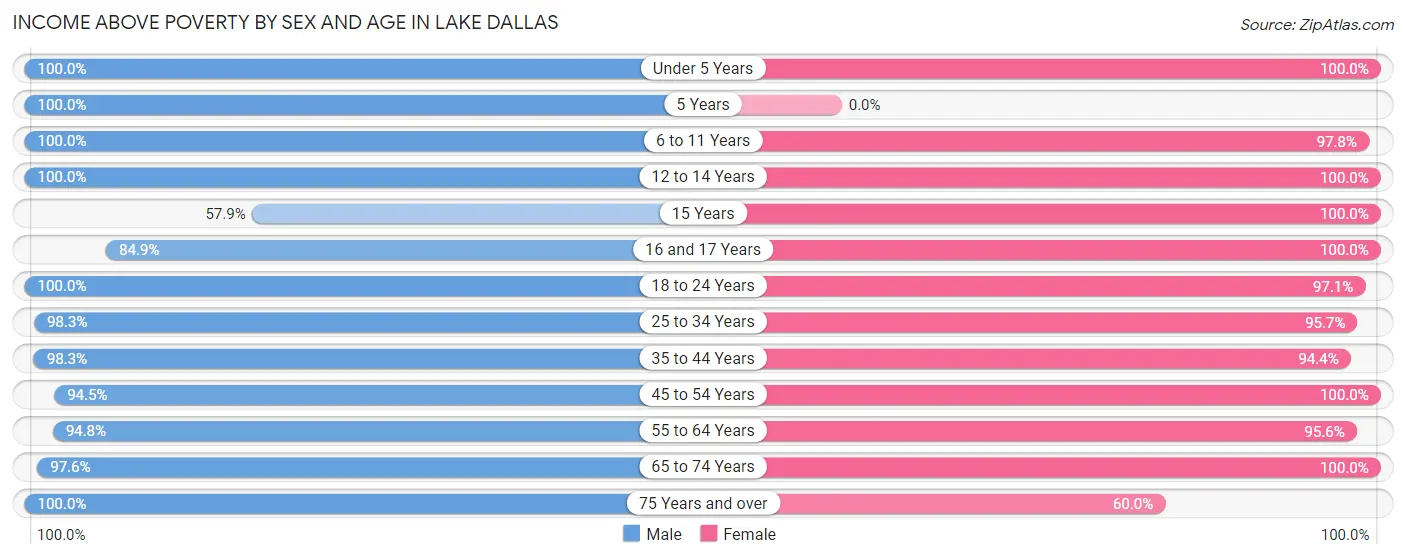
| Age Bracket | Male | Female |
| Under 5 Years | 54 (100.0%) | 179 (100.0%) |
| 5 Years | 47 (100.0%) | 0 (0.0%) |
| 6 to 11 Years | 150 (100.0%) | 449 (97.8%) |
| 12 to 14 Years | 99 (100.0%) | 398 (100.0%) |
| 15 Years | 33 (57.9%) | 194 (100.0%) |
| 16 and 17 Years | 73 (84.9%) | 92 (100.0%) |
| 18 to 24 Years | 502 (100.0%) | 203 (97.1%) |
| 25 to 34 Years | 448 (98.3%) | 376 (95.7%) |
| 35 to 44 Years | 684 (98.3%) | 879 (94.4%) |
| 45 to 54 Years | 464 (94.5%) | 390 (100.0%) |
| 55 to 64 Years | 272 (94.8%) | 751 (95.6%) |
| 65 to 74 Years | 456 (97.6%) | 171 (100.0%) |
| 75 Years and over | 30 (100.0%) | 18 (60.0%) |
| Total | 3,312 (96.8%) | 4,100 (96.9%) |
Income Below Poverty Among Married-Couple Families in Lake Dallas
The poverty statistics for married-couple families in Lake Dallas show that 0.7% or 11 of the total 1,626 families live below the poverty line. Families with 1 or 2 children have the highest poverty rate of 1.7%, comprising of 11 families. On the other hand, families with no children have the lowest poverty rate of 0.0%, which includes 0 families.
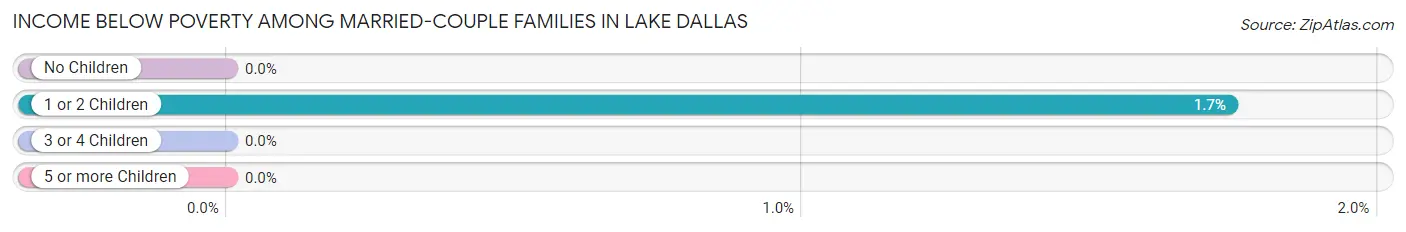
| Children | Above Poverty | Below Poverty |
| No Children | 897 (100.0%) | 0 (0.0%) |
| 1 or 2 Children | 622 (98.3%) | 11 (1.7%) |
| 3 or 4 Children | 52 (100.0%) | 0 (0.0%) |
| 5 or more Children | 44 (100.0%) | 0 (0.0%) |
| Total | 1,615 (99.3%) | 11 (0.7%) |
Income Below Poverty Among Single-Parent Households in Lake Dallas
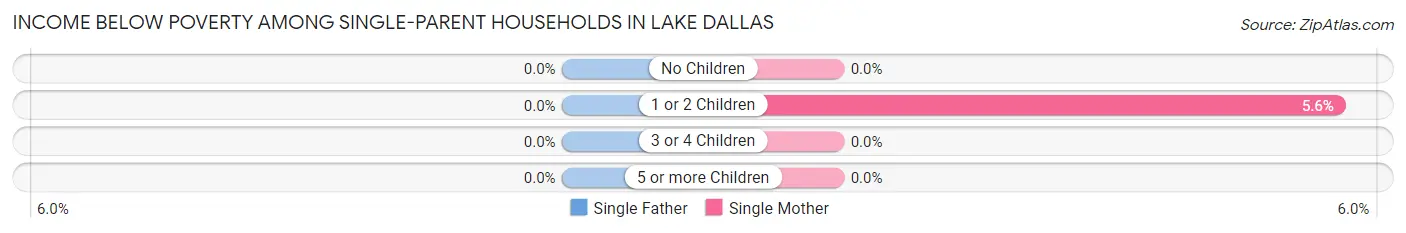
| Children | Single Father | Single Mother |
| No Children | 0 (0.0%) | 0 (0.0%) |
| 1 or 2 Children | 0 (0.0%) | 17 (5.6%) |
| 3 or 4 Children | 0 (0.0%) | 0 (0.0%) |
| 5 or more Children | 0 (0.0%) | 0 (0.0%) |
| Total | 0 (0.0%) | 17 (4.4%) |
Income Below Poverty Among Married-Couple vs Single-Parent Households in Lake Dallas
The poverty data for Lake Dallas shows that 11 of the married-couple family households (0.7%) and 17 of the single-parent households (2.8%) are living below the poverty level. Within the married-couple family households, those with 1 or 2 children have the highest poverty rate, with 11 households (1.7%) falling below the poverty line. Among the single-parent households, those with 1 or 2 children have the highest poverty rate, with 17 household (3.6%) living below poverty.
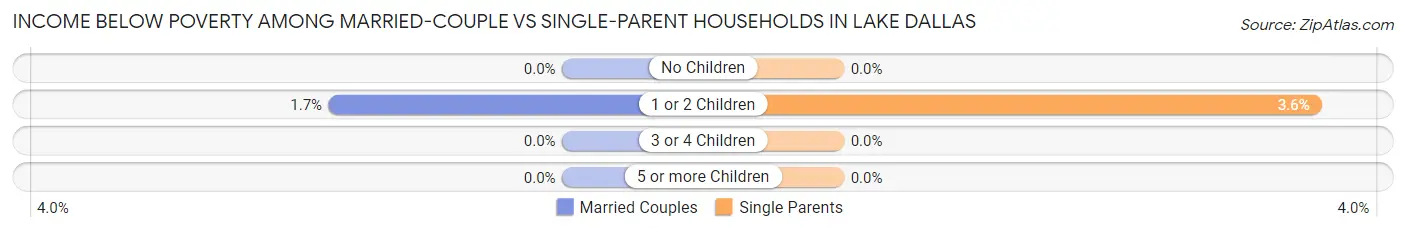
| Children | Married-Couple Families | Single-Parent Households |
| No Children | 0 (0.0%) | 0 (0.0%) |
| 1 or 2 Children | 11 (1.7%) | 17 (3.6%) |
| 3 or 4 Children | 0 (0.0%) | 0 (0.0%) |
| 5 or more Children | 0 (0.0%) | 0 (0.0%) |
| Total | 11 (0.7%) | 17 (2.8%) |
Race in Lake Dallas
The most populous races in Lake Dallas are White / Caucasian (6,685 | 87.0%), Hispanic or Latino (2,724 | 35.5%), and Two or more Races (614 | 8.0%).
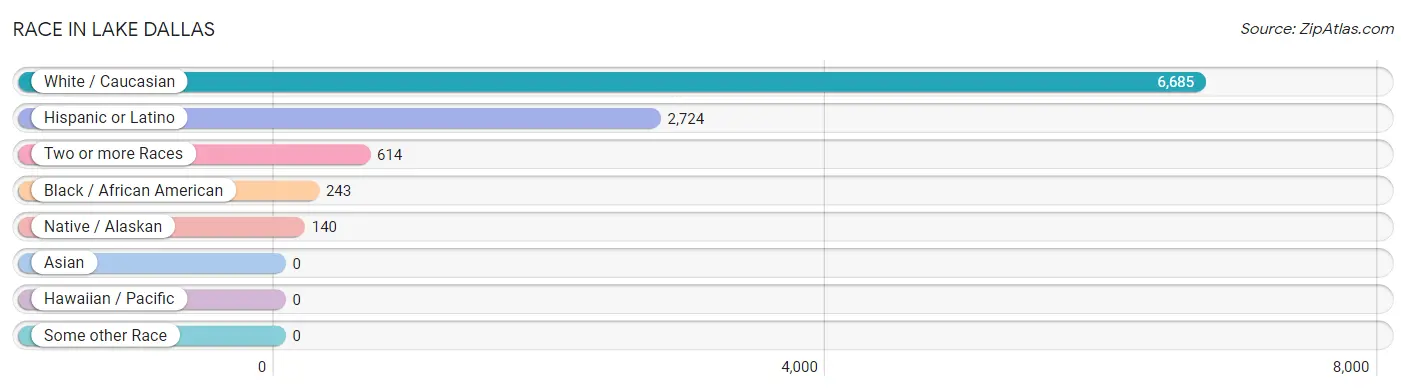
| Race | # Population | % Population |
| Asian | 0 | 0.0% |
| Black / African American | 243 | 3.2% |
| Hawaiian / Pacific | 0 | 0.0% |
| Hispanic or Latino | 2,724 | 35.5% |
| Native / Alaskan | 140 | 1.8% |
| White / Caucasian | 6,685 | 87.0% |
| Two or more Races | 614 | 8.0% |
| Some other Race | 0 | 0.0% |
| Total | 7,682 | 100.0% |
Ancestry in Lake Dallas
The most populous ancestries reported in Lake Dallas are Mexican (2,675 | 34.8%), English (866 | 11.3%), Irish (819 | 10.7%), American (683 | 8.9%), and German (640 | 8.3%), together accounting for 74.0% of all Lake Dallas residents.
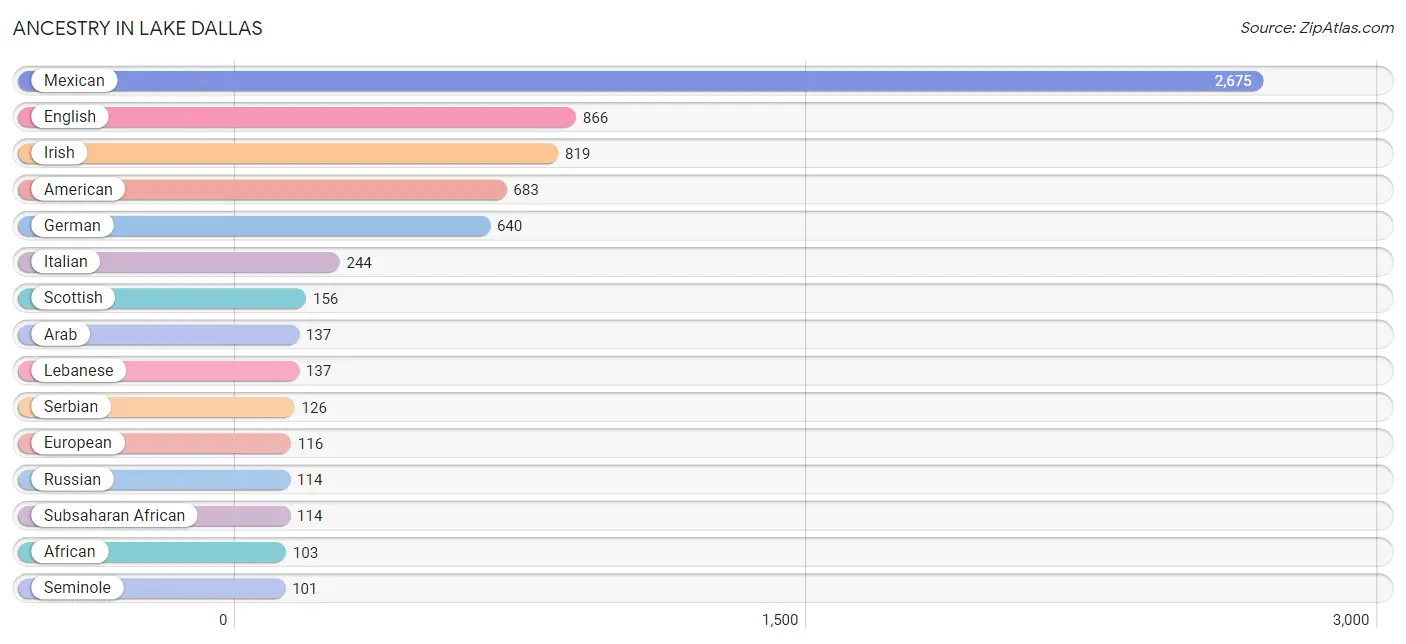
| Ancestry | # Population | % Population |
| African | 103 | 1.3% |
| American | 683 | 8.9% |
| Arab | 137 | 1.8% |
| Burmese | 4 | 0.1% |
| Central American | 2 | 0.0% |
| Cherokee | 46 | 0.6% |
| Choctaw | 15 | 0.2% |
| Creek | 5 | 0.1% |
| Czech | 6 | 0.1% |
| Czechoslovakian | 5 | 0.1% |
| Dutch | 33 | 0.4% |
| English | 866 | 11.3% |
| European | 116 | 1.5% |
| French | 46 | 0.6% |
| French Canadian | 12 | 0.2% |
| German | 640 | 8.3% |
| Guatemalan | 2 | 0.0% |
| Hungarian | 28 | 0.4% |
| Irish | 819 | 10.7% |
| Italian | 244 | 3.2% |
| Jamaican | 29 | 0.4% |
| Korean | 12 | 0.2% |
| Lebanese | 137 | 1.8% |
| Liberian | 11 | 0.1% |
| Mexican | 2,675 | 34.8% |
| Northern European | 23 | 0.3% |
| Norwegian | 29 | 0.4% |
| Polish | 70 | 0.9% |
| Puerto Rican | 47 | 0.6% |
| Russian | 114 | 1.5% |
| Scandinavian | 58 | 0.8% |
| Scottish | 156 | 2.0% |
| Seminole | 101 | 1.3% |
| Serbian | 126 | 1.6% |
| Sri Lankan | 17 | 0.2% |
| Subsaharan African | 114 | 1.5% |
| Swedish | 21 | 0.3% |
| Welsh | 83 | 1.1% | View All 38 Rows |
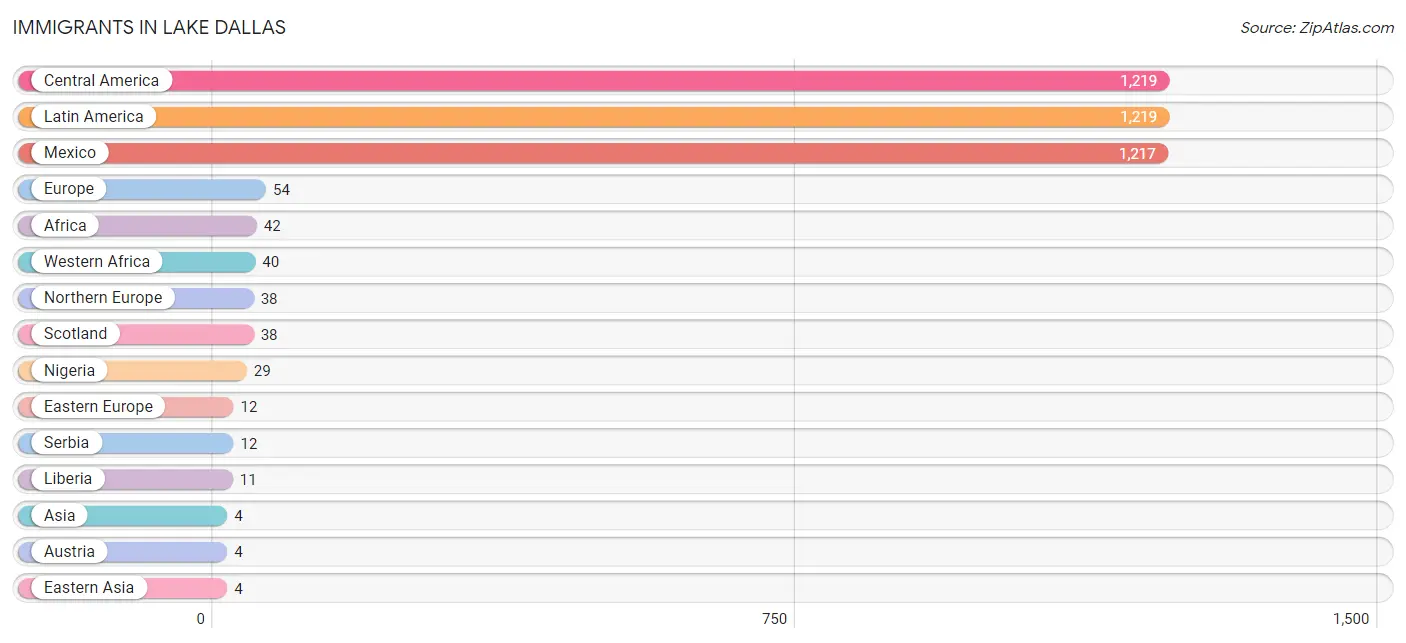
Immigrants in Lake Dallas
The most numerous immigrant groups reported in Lake Dallas came from Central America (1,219 | 15.9%), Latin America (1,219 | 15.9%), Mexico (1,217 | 15.8%), Europe (54 | 0.7%), and Africa (42 | 0.5%), together accounting for 48.8% of all Lake Dallas residents.
| Immigration Origin | # Population | % Population |
| Africa | 42 | 0.5% |
| Asia | 4 | 0.1% |
| Austria | 4 | 0.1% |
| Central America | 1,219 | 15.9% |
| Eastern Africa | 2 | 0.0% |
| Eastern Asia | 4 | 0.1% |
| Eastern Europe | 12 | 0.2% |
| Europe | 54 | 0.7% |
| Guatemala | 2 | 0.0% |
| Korea | 4 | 0.1% |
| Latin America | 1,219 | 15.9% |
| Liberia | 11 | 0.1% |
| Mexico | 1,217 | 15.8% |
| Nigeria | 29 | 0.4% |
| Northern Europe | 38 | 0.5% |
| Scotland | 38 | 0.5% |
| Serbia | 12 | 0.2% |
| Western Africa | 40 | 0.5% |
| Western Europe | 4 | 0.1% | View All 19 Rows |
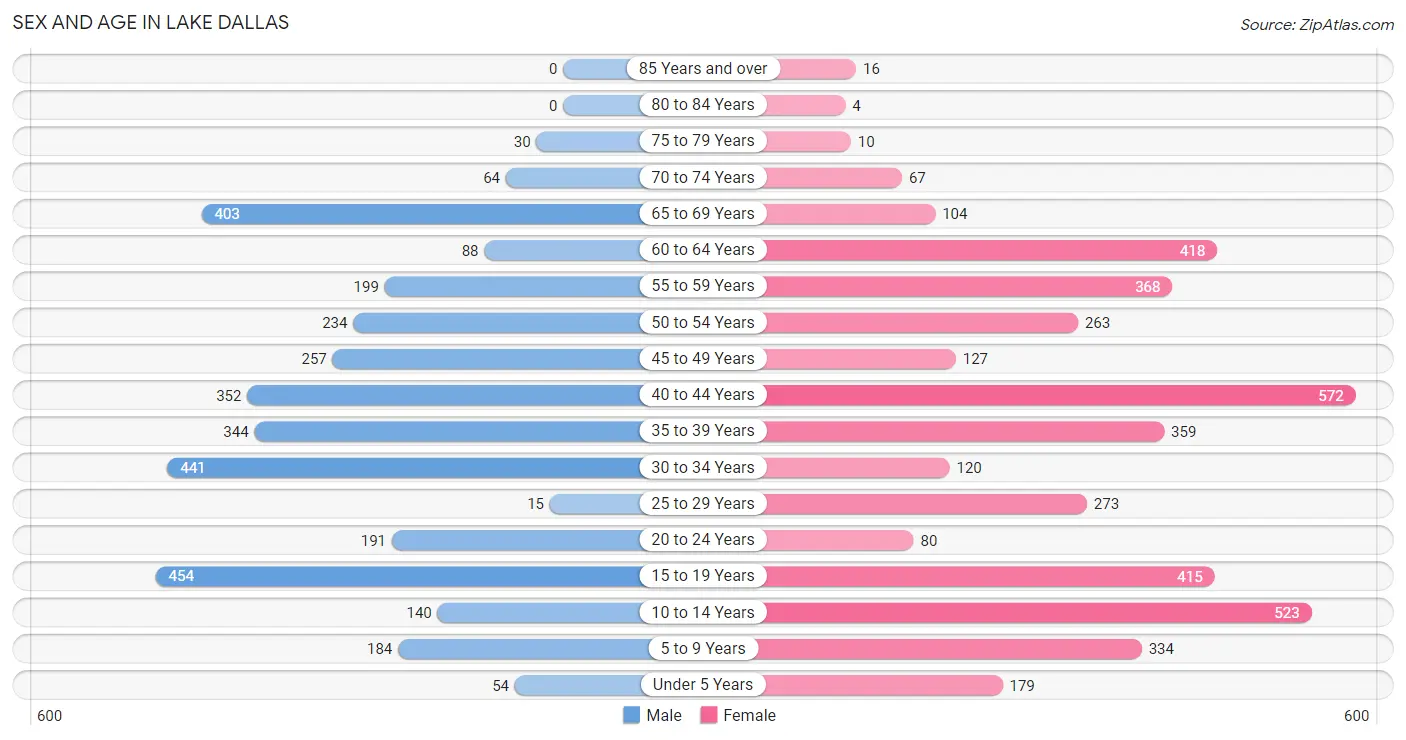
Sex and Age in Lake Dallas
Sex and Age in Lake Dallas
The most populous age groups in Lake Dallas are 15 to 19 Years (454 | 13.2%) for men and 40 to 44 Years (572 | 13.5%) for women.
| Age Bracket | Male | Female |
| Under 5 Years | 54 (1.6%) | 179 (4.2%) |
| 5 to 9 Years | 184 (5.3%) | 334 (7.9%) |
| 10 to 14 Years | 140 (4.1%) | 523 (12.4%) |
| 15 to 19 Years | 454 (13.2%) | 415 (9.8%) |
| 20 to 24 Years | 191 (5.5%) | 80 (1.9%) |
| 25 to 29 Years | 15 (0.4%) | 273 (6.5%) |
| 30 to 34 Years | 441 (12.8%) | 120 (2.8%) |
| 35 to 39 Years | 344 (10.0%) | 359 (8.5%) |
| 40 to 44 Years | 352 (10.2%) | 572 (13.5%) |
| 45 to 49 Years | 257 (7.4%) | 127 (3.0%) |
| 50 to 54 Years | 234 (6.8%) | 263 (6.2%) |
| 55 to 59 Years | 199 (5.8%) | 368 (8.7%) |
| 60 to 64 Years | 88 (2.5%) | 418 (9.9%) |
| 65 to 69 Years | 403 (11.7%) | 104 (2.5%) |
| 70 to 74 Years | 64 (1.9%) | 67 (1.6%) |
| 75 to 79 Years | 30 (0.9%) | 10 (0.2%) |
| 80 to 84 Years | 0 (0.0%) | 4 (0.1%) |
| 85 Years and over | 0 (0.0%) | 16 (0.4%) |
| Total | 3,450 (100.0%) | 4,232 (100.0%) |
Families and Households in Lake Dallas
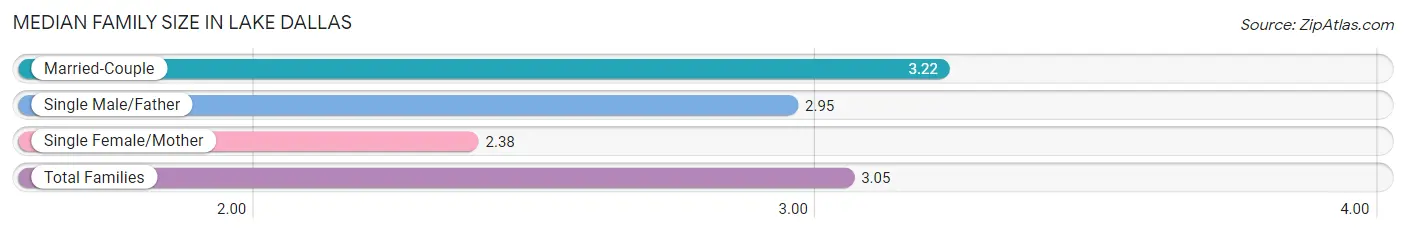
Median Family Size in Lake Dallas
The median family size in Lake Dallas is 3.05 persons per family, with married-couple families (1,626 | 72.5%) accounting for the largest median family size of 3.22 persons per family. On the other hand, single female/mother families (384 | 17.1%) represent the smallest median family size with 2.38 persons per family.
| Family Type | # Families | Family Size |
| Married-Couple | 1,626 (72.5%) | 3.22 |
| Single Male/Father | 232 (10.3%) | 2.95 |
| Single Female/Mother | 384 (17.1%) | 2.38 |
| Total Families | 2,242 (100.0%) | 3.05 |
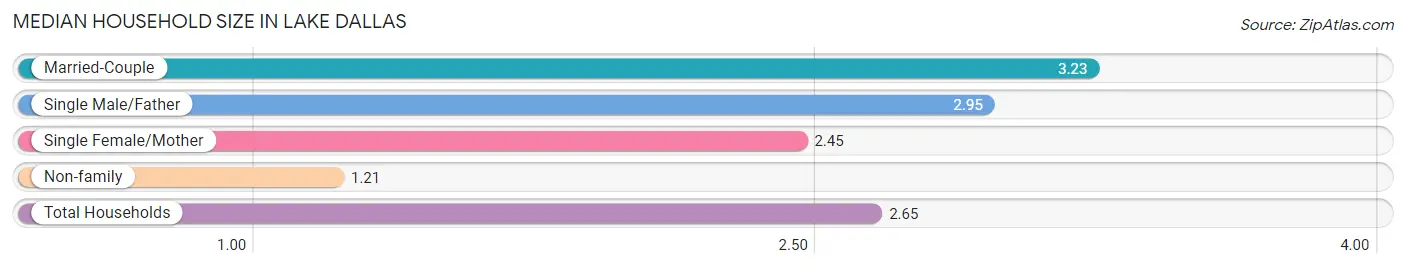
Median Household Size in Lake Dallas
The median household size in Lake Dallas is 2.65 persons per household, with married-couple households (1,626 | 56.4%) accounting for the largest median household size of 3.23 persons per household. non-family households (643 | 22.3%) represent the smallest median household size with 1.21 persons per household.
| Household Type | # Households | Household Size |
| Married-Couple | 1,626 (56.4%) | 3.23 |
| Single Male/Father | 232 (8.0%) | 2.95 |
| Single Female/Mother | 384 (13.3%) | 2.45 |
| Non-family | 643 (22.3%) | 1.21 |
| Total Households | 2,885 (100.0%) | 2.65 |
Household Size by Marriage Status in Lake Dallas
Out of a total of 2,885 households in Lake Dallas, 2,242 (77.7%) are family households, while 643 (22.3%) are nonfamily households. The most numerous type of family households are 2-person households, comprising 857, and the most common type of nonfamily households are 1-person households, comprising 541.
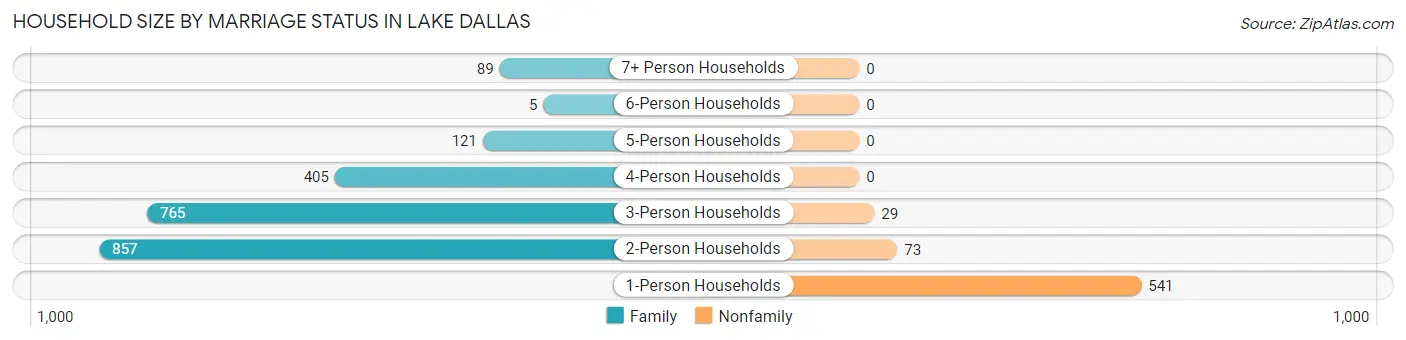
| Household Size | Family Households | Nonfamily Households |
| 1-Person Households | - | 541 (18.8%) |
| 2-Person Households | 857 (29.7%) | 73 (2.5%) |
| 3-Person Households | 765 (26.5%) | 29 (1.0%) |
| 4-Person Households | 405 (14.0%) | 0 (0.0%) |
| 5-Person Households | 121 (4.2%) | 0 (0.0%) |
| 6-Person Households | 5 (0.2%) | 0 (0.0%) |
| 7+ Person Households | 89 (3.1%) | 0 (0.0%) |
| Total | 2,242 (77.7%) | 643 (22.3%) |
Female Fertility in Lake Dallas
Fertility by Age in Lake Dallas
Average fertility rate in Lake Dallas is 56.0 births per 1,000 women. Women in the age bracket of 20 to 34 years have the highest fertility rate with 197.0 births per 1,000 women. Women in the age bracket of 20 to 34 years acount for 81.6% of all women with births.
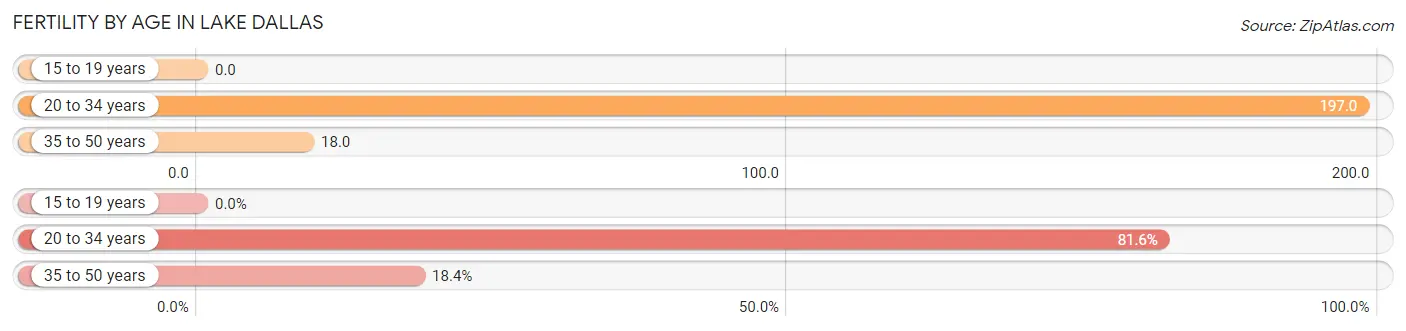
| Age Bracket | Women with Births | Births / 1,000 Women |
| 15 to 19 years | 0 (0.0%) | 0.0 |
| 20 to 34 years | 93 (81.6%) | 197.0 |
| 35 to 50 years | 21 (18.4%) | 18.0 |
| Total | 114 (100.0%) | 56.0 |
Fertility by Age by Marriage Status in Lake Dallas
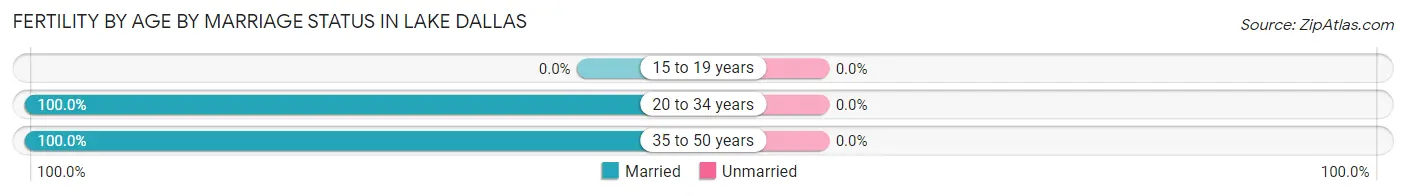
| Age Bracket | Married | Unmarried |
| 15 to 19 years | 0 (0.0%) | 0 (0.0%) |
| 20 to 34 years | 93 (100.0%) | 0 (0.0%) |
| 35 to 50 years | 21 (100.0%) | 0 (0.0%) |
| Total | 114 (100.0%) | 0 (0.0%) |
Fertility by Education in Lake Dallas
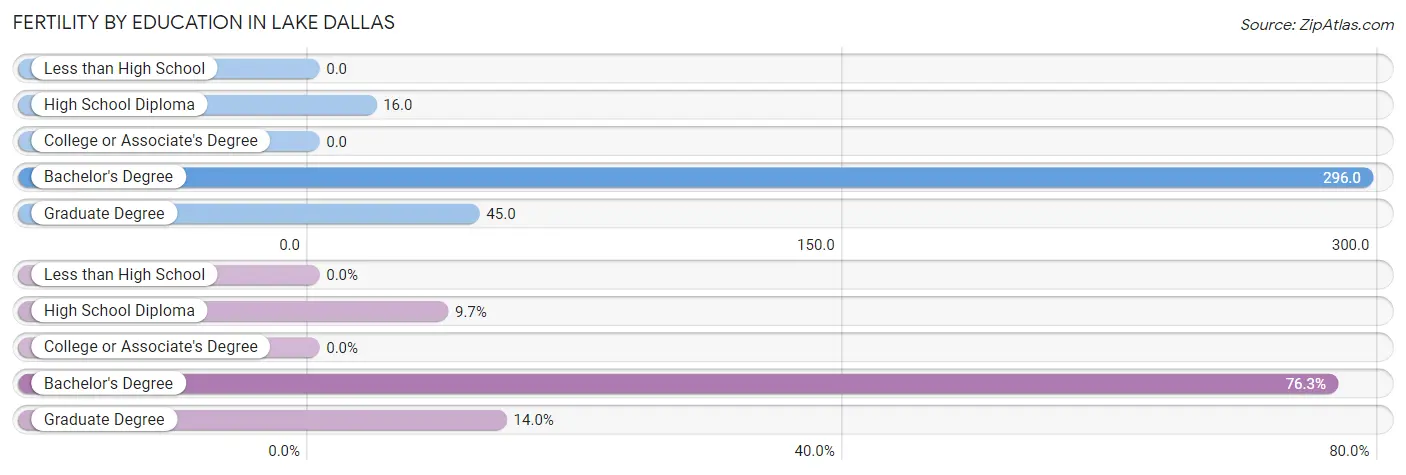
| Educational Attainment | Women with Births | Births / 1,000 Women |
| Less than High School | 0 (0.0%) | 0.0 |
| High School Diploma | 11 (9.7%) | 16.0 |
| College or Associate's Degree | 0 (0.0%) | 0.0 |
| Bachelor's Degree | 87 (76.3%) | 296.0 |
| Graduate Degree | 16 (14.0%) | 45.0 |
| Total | 114 (100.0%) | 56.0 |
Fertility by Education by Marriage Status in Lake Dallas
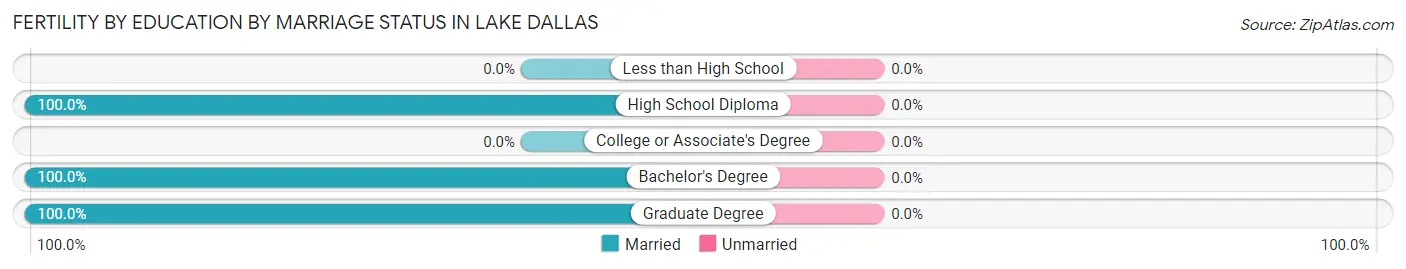
| Educational Attainment | Married | Unmarried |
| Less than High School | 0 (0.0%) | 0 (0.0%) |
| High School Diploma | 11 (100.0%) | 0 (0.0%) |
| College or Associate's Degree | 0 (0.0%) | 0 (0.0%) |
| Bachelor's Degree | 87 (100.0%) | 0 (0.0%) |
| Graduate Degree | 16 (100.0%) | 0 (0.0%) |
| Total | 114 (100.0%) | 0 (0.0%) |
Employment Characteristics in Lake Dallas
Employment by Class of Employer in Lake Dallas
Among the 4,169 employed individuals in Lake Dallas, private company employees (3,347 | 80.3%), local government employees (364 | 8.7%), and self-employed (not incorporated) (265 | 6.4%) make up the most common classes of employment.
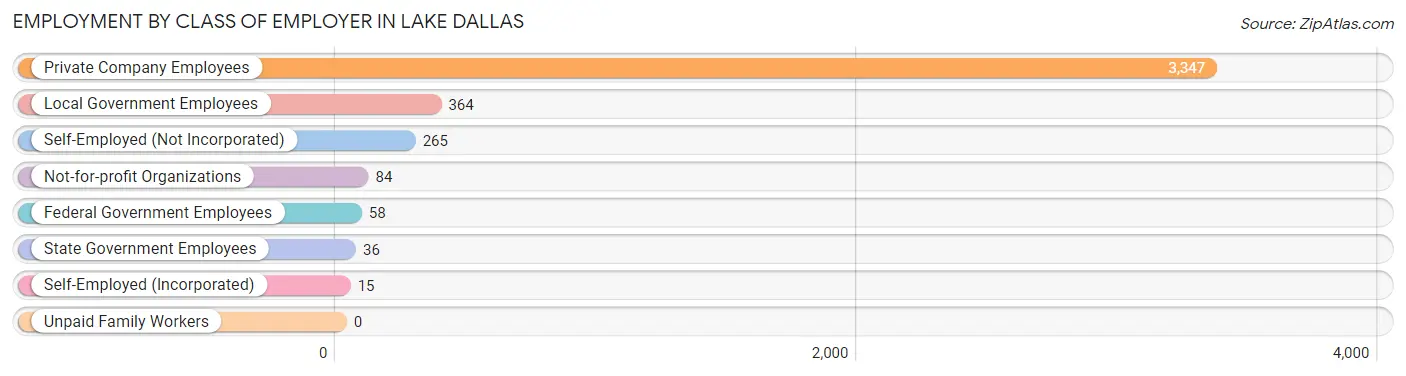
| Employer Class | # Employees | % Employees |
| Private Company Employees | 3,347 | 80.3% |
| Self-Employed (Incorporated) | 15 | 0.4% |
| Self-Employed (Not Incorporated) | 265 | 6.4% |
| Not-for-profit Organizations | 84 | 2.0% |
| Local Government Employees | 364 | 8.7% |
| State Government Employees | 36 | 0.9% |
| Federal Government Employees | 58 | 1.4% |
| Unpaid Family Workers | 0 | 0.0% |
| Total | 4,169 | 100.0% |
Employment Status by Age in Lake Dallas
According to the labor force statistics for Lake Dallas, out of the total population over 16 years of age (6,017), 72.1% or 4,338 individuals are in the labor force, with 2.7% or 117 of them unemployed. The age group with the highest labor force participation rate is 30 to 34 years, with 99.1% or 556 individuals in the labor force. Within the labor force, the 20 to 24 years age range has the highest percentage of unemployed individuals, with 20.9% or 40 of them being unemployed.
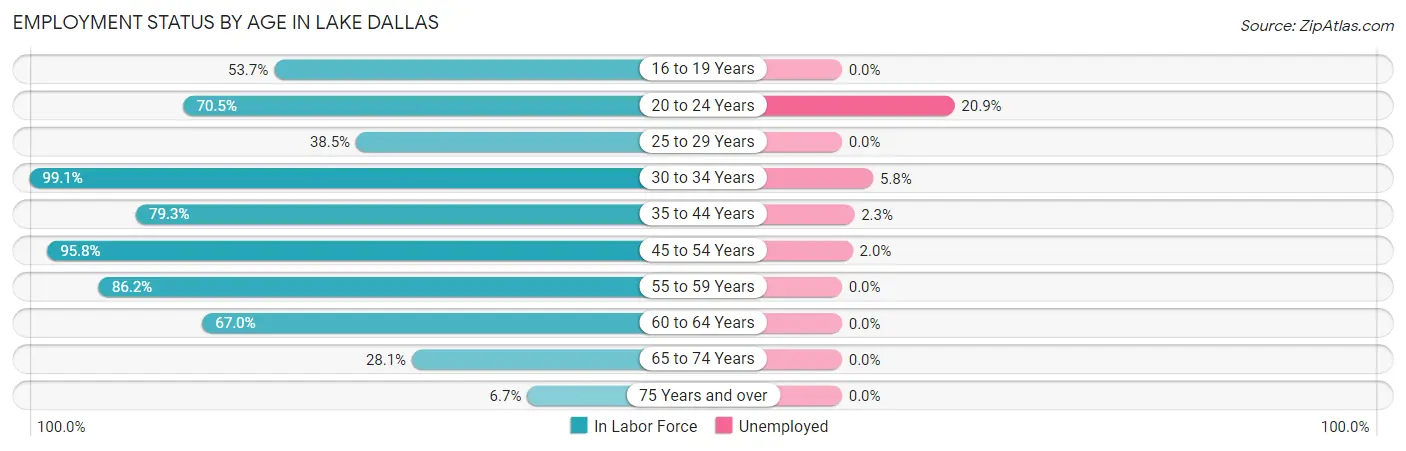
| Age Bracket | In Labor Force | Unemployed |
| 16 to 19 Years | 332 (53.7%) | 0 (0.0%) |
| 20 to 24 Years | 191 (70.5%) | 40 (20.9%) |
| 25 to 29 Years | 111 (38.5%) | 0 (0.0%) |
| 30 to 34 Years | 556 (99.1%) | 32 (5.8%) |
| 35 to 44 Years | 1,290 (79.3%) | 30 (2.3%) |
| 45 to 54 Years | 844 (95.8%) | 17 (2.0%) |
| 55 to 59 Years | 489 (86.2%) | 0 (0.0%) |
| 60 to 64 Years | 339 (67.0%) | 0 (0.0%) |
| 65 to 74 Years | 179 (28.1%) | 0 (0.0%) |
| 75 Years and over | 4 (6.7%) | 0 (0.0%) |
| Total | 4,338 (72.1%) | 117 (2.7%) |
Employment Status by Educational Attainment in Lake Dallas
According to labor force statistics for Lake Dallas, 81.9% of individuals (3,628) out of the total population between 25 and 64 years of age (4,430) are in the labor force, with 2.2% or 80 of them being unemployed. The group with the highest labor force participation rate are those with the educational attainment of bachelor's degree or higher, with 90.8% or 1,220 individuals in the labor force. Within the labor force, individuals with college / associate degree education have the highest percentage of unemployment, with 5.4% or 55 of them being unemployed.
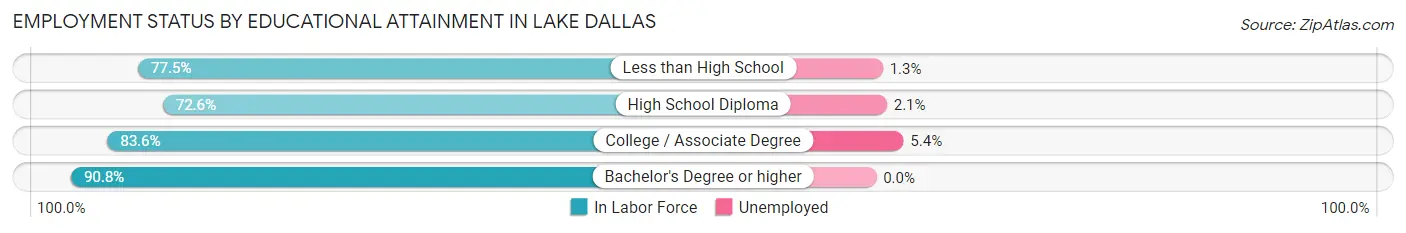
| Educational Attainment | In Labor Force | Unemployed |
| Less than High School | 560 (77.5%) | 9 (1.3%) |
| High School Diploma | 823 (72.6%) | 24 (2.1%) |
| College / Associate Degree | 1,027 (83.6%) | 66 (5.4%) |
| Bachelor's Degree or higher | 1,220 (90.8%) | 0 (0.0%) |
| Total | 3,628 (81.9%) | 97 (2.2%) |
Employment Occupations by Sex in Lake Dallas
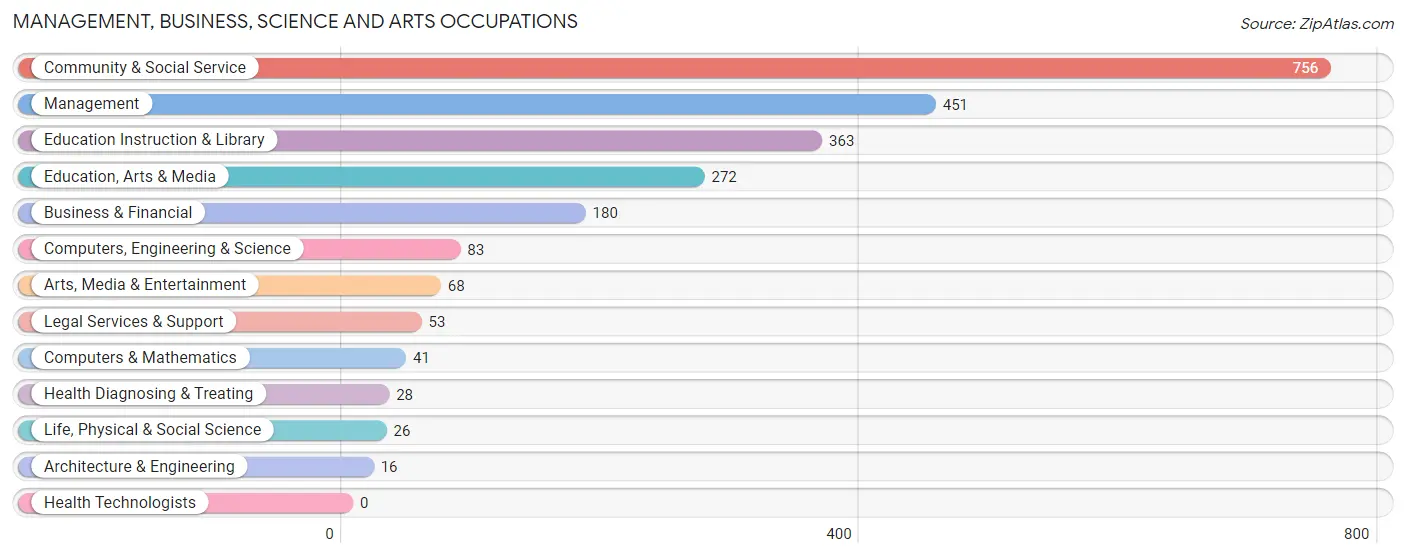
Management, Business, Science and Arts Occupations
The most common Management, Business, Science and Arts occupations in Lake Dallas are Community & Social Service (756 | 17.9%), Management (451 | 10.7%), Education Instruction & Library (363 | 8.6%), Education, Arts & Media (272 | 6.5%), and Business & Financial (180 | 4.3%).
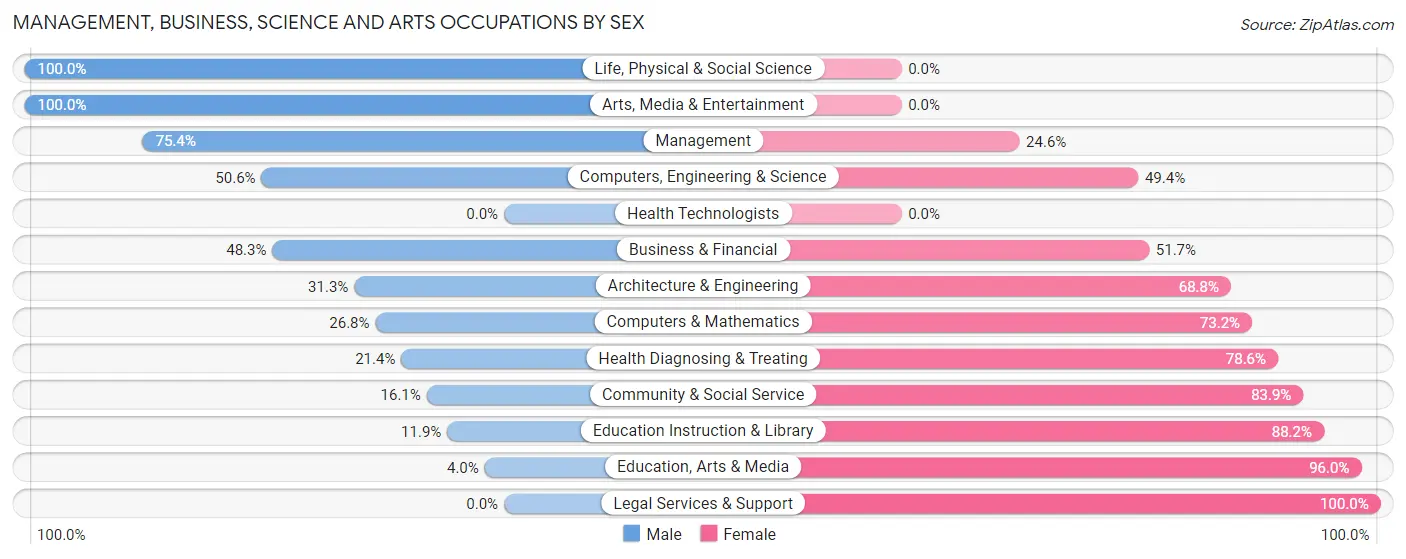
Management, Business, Science and Arts Occupations by Sex
Within the Management, Business, Science and Arts occupations in Lake Dallas, the most male-oriented occupations are Life, Physical & Social Science (100.0%), Arts, Media & Entertainment (100.0%), and Management (75.4%), while the most female-oriented occupations are Legal Services & Support (100.0%), Education, Arts & Media (96.0%), and Education Instruction & Library (88.1%).
| Occupation | Male | Female |
| Management | 340 (75.4%) | 111 (24.6%) |
| Business & Financial | 87 (48.3%) | 93 (51.7%) |
| Computers, Engineering & Science | 42 (50.6%) | 41 (49.4%) |
| Computers & Mathematics | 11 (26.8%) | 30 (73.2%) |
| Architecture & Engineering | 5 (31.2%) | 11 (68.8%) |
| Life, Physical & Social Science | 26 (100.0%) | 0 (0.0%) |
| Community & Social Service | 122 (16.1%) | 634 (83.9%) |
| Education, Arts & Media | 11 (4.0%) | 261 (96.0%) |
| Legal Services & Support | 0 (0.0%) | 53 (100.0%) |
| Education Instruction & Library | 43 (11.8%) | 320 (88.1%) |
| Arts, Media & Entertainment | 68 (100.0%) | 0 (0.0%) |
| Health Diagnosing & Treating | 6 (21.4%) | 22 (78.6%) |
| Health Technologists | 0 (0.0%) | 0 (0.0%) |
| Total (Category) | 597 (39.9%) | 901 (60.2%) |
| Total (Overall) | 2,327 (55.2%) | 1,890 (44.8%) |
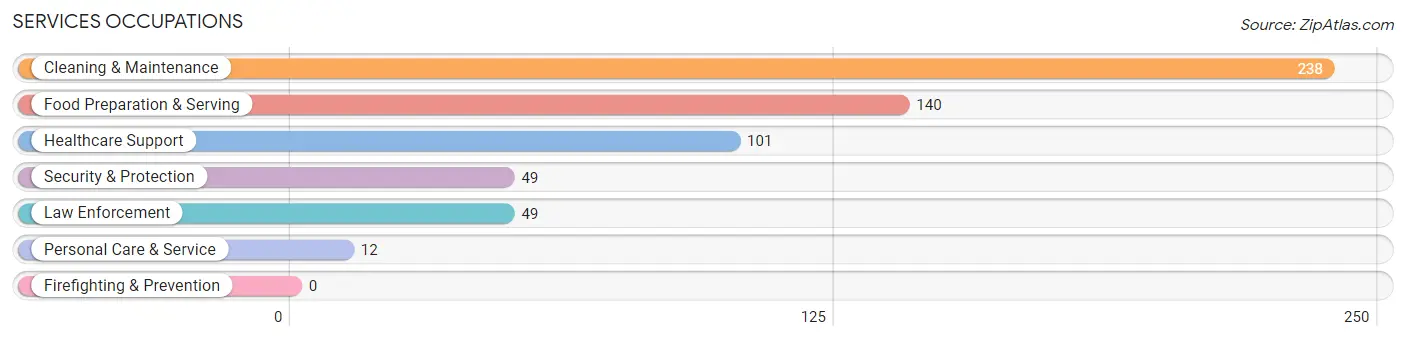
Services Occupations
The most common Services occupations in Lake Dallas are Cleaning & Maintenance (238 | 5.6%), Food Preparation & Serving (140 | 3.3%), Healthcare Support (101 | 2.4%), Security & Protection (49 | 1.2%), and Law Enforcement (49 | 1.2%).
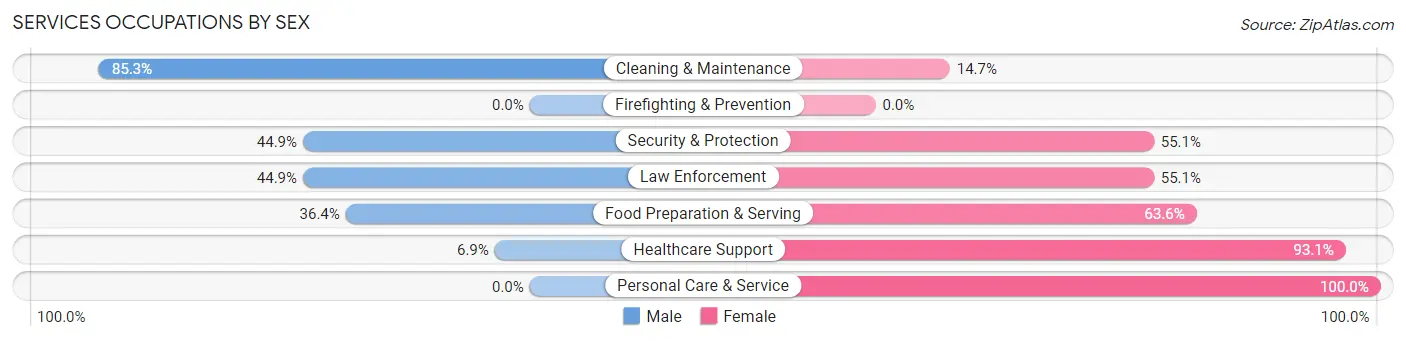
Services Occupations by Sex
Within the Services occupations in Lake Dallas, the most male-oriented occupations are Cleaning & Maintenance (85.3%), Security & Protection (44.9%), and Law Enforcement (44.9%), while the most female-oriented occupations are Personal Care & Service (100.0%), Healthcare Support (93.1%), and Food Preparation & Serving (63.6%).
| Occupation | Male | Female |
| Healthcare Support | 7 (6.9%) | 94 (93.1%) |
| Security & Protection | 22 (44.9%) | 27 (55.1%) |
| Firefighting & Prevention | 0 (0.0%) | 0 (0.0%) |
| Law Enforcement | 22 (44.9%) | 27 (55.1%) |
| Food Preparation & Serving | 51 (36.4%) | 89 (63.6%) |
| Cleaning & Maintenance | 203 (85.3%) | 35 (14.7%) |
| Personal Care & Service | 0 (0.0%) | 12 (100.0%) |
| Total (Category) | 283 (52.4%) | 257 (47.6%) |
| Total (Overall) | 2,327 (55.2%) | 1,890 (44.8%) |
Sales and Office Occupations
The most common Sales and Office occupations in Lake Dallas are Office & Administration (799 | 19.0%), and Sales & Related (475 | 11.3%).
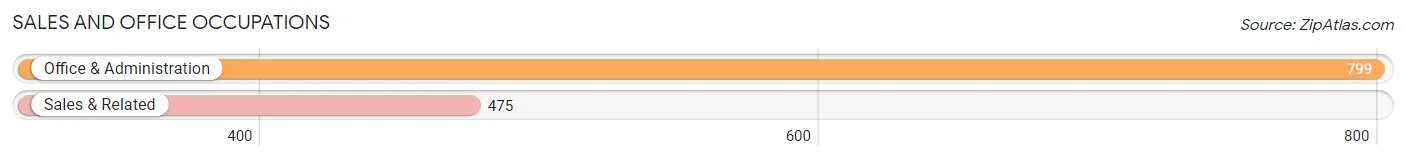
Sales and Office Occupations by Sex

| Occupation | Male | Female |
| Sales & Related | 429 (90.3%) | 46 (9.7%) |
| Office & Administration | 144 (18.0%) | 655 (82.0%) |
| Total (Category) | 573 (45.0%) | 701 (55.0%) |
| Total (Overall) | 2,327 (55.2%) | 1,890 (44.8%) |
Natural Resources, Construction and Maintenance Occupations
The most common Natural Resources, Construction and Maintenance occupations in Lake Dallas are Construction & Extraction (399 | 9.5%), and Installation, Maintenance & Repair (243 | 5.8%).
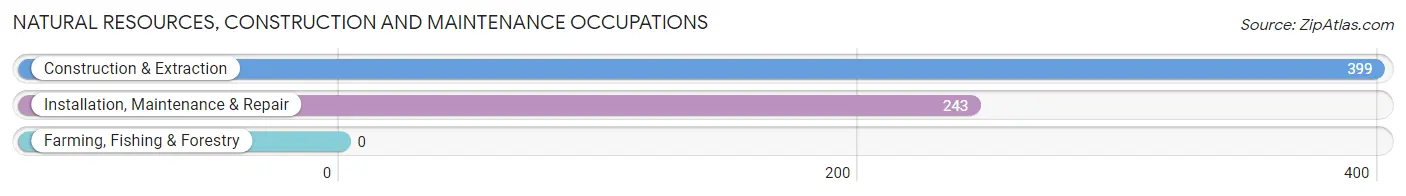
Natural Resources, Construction and Maintenance Occupations by Sex
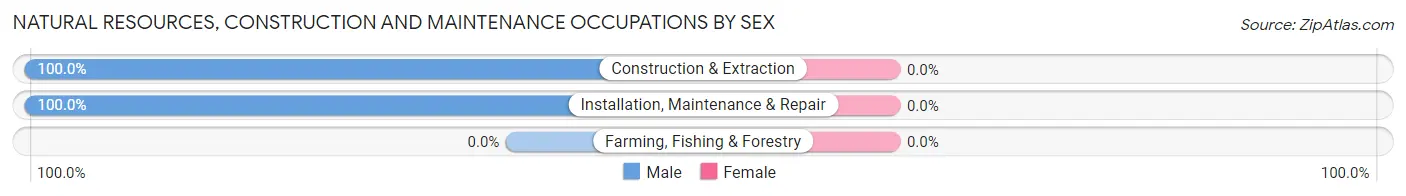
| Occupation | Male | Female |
| Farming, Fishing & Forestry | 0 (0.0%) | 0 (0.0%) |
| Construction & Extraction | 399 (100.0%) | 0 (0.0%) |
| Installation, Maintenance & Repair | 243 (100.0%) | 0 (0.0%) |
| Total (Category) | 642 (100.0%) | 0 (0.0%) |
| Total (Overall) | 2,327 (55.2%) | 1,890 (44.8%) |
Production, Transportation and Moving Occupations
The most common Production, Transportation and Moving occupations in Lake Dallas are Production (114 | 2.7%), Material Moving (94 | 2.2%), and Transportation (55 | 1.3%).
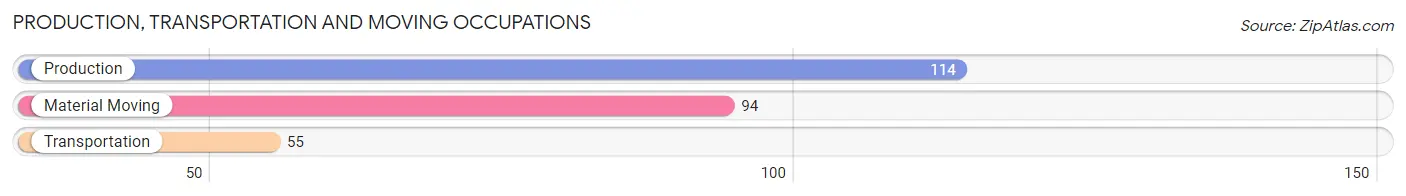
Production, Transportation and Moving Occupations by Sex
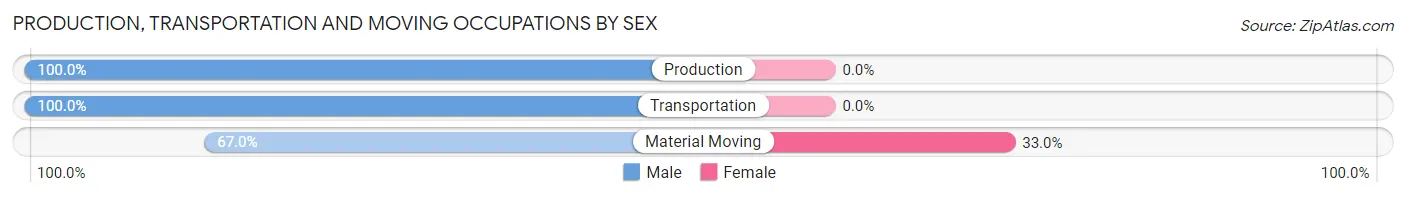
| Occupation | Male | Female |
| Production | 114 (100.0%) | 0 (0.0%) |
| Transportation | 55 (100.0%) | 0 (0.0%) |
| Material Moving | 63 (67.0%) | 31 (33.0%) |
| Total (Category) | 232 (88.2%) | 31 (11.8%) |
| Total (Overall) | 2,327 (55.2%) | 1,890 (44.8%) |
Employment Industries by Sex in Lake Dallas
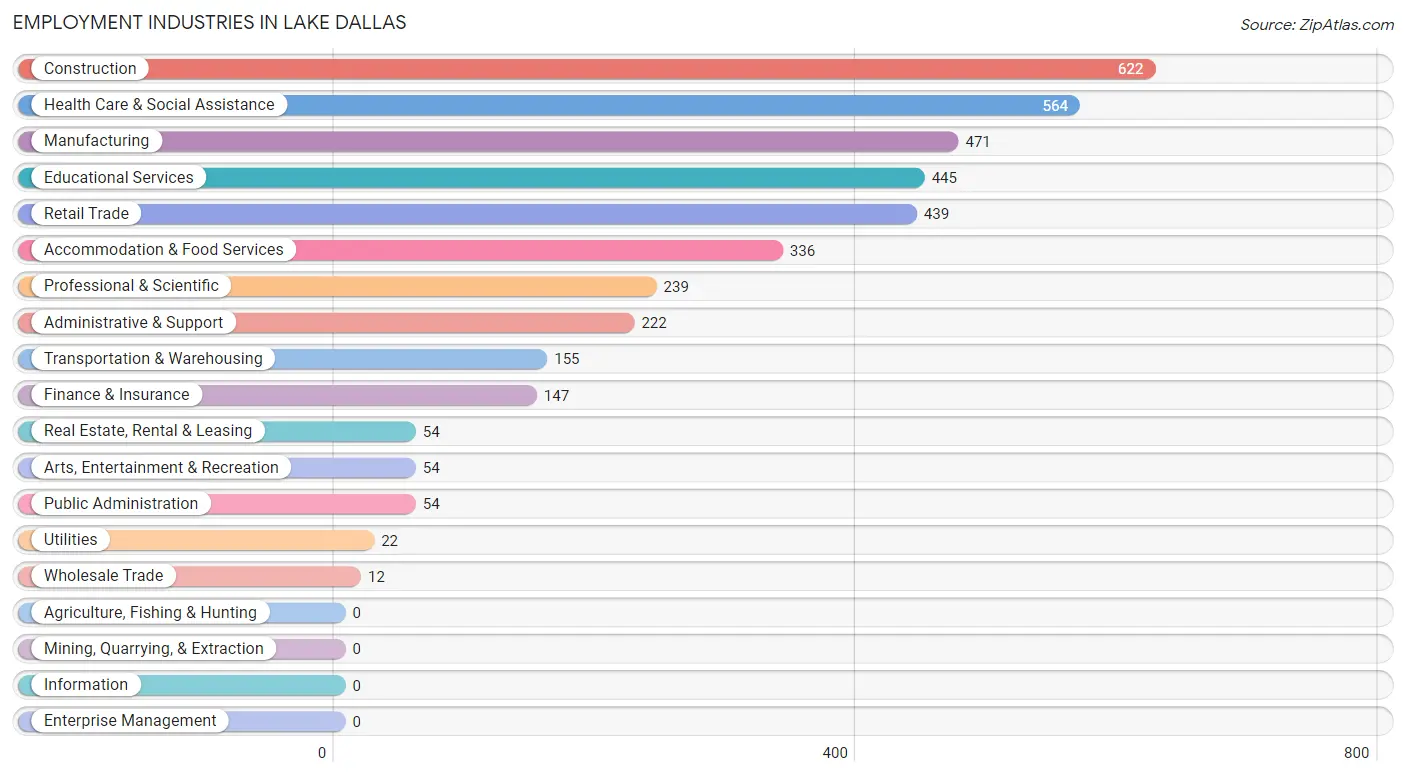
Employment Industries in Lake Dallas
The major employment industries in Lake Dallas include Construction (622 | 14.7%), Health Care & Social Assistance (564 | 13.4%), Manufacturing (471 | 11.2%), Educational Services (445 | 10.5%), and Retail Trade (439 | 10.4%).
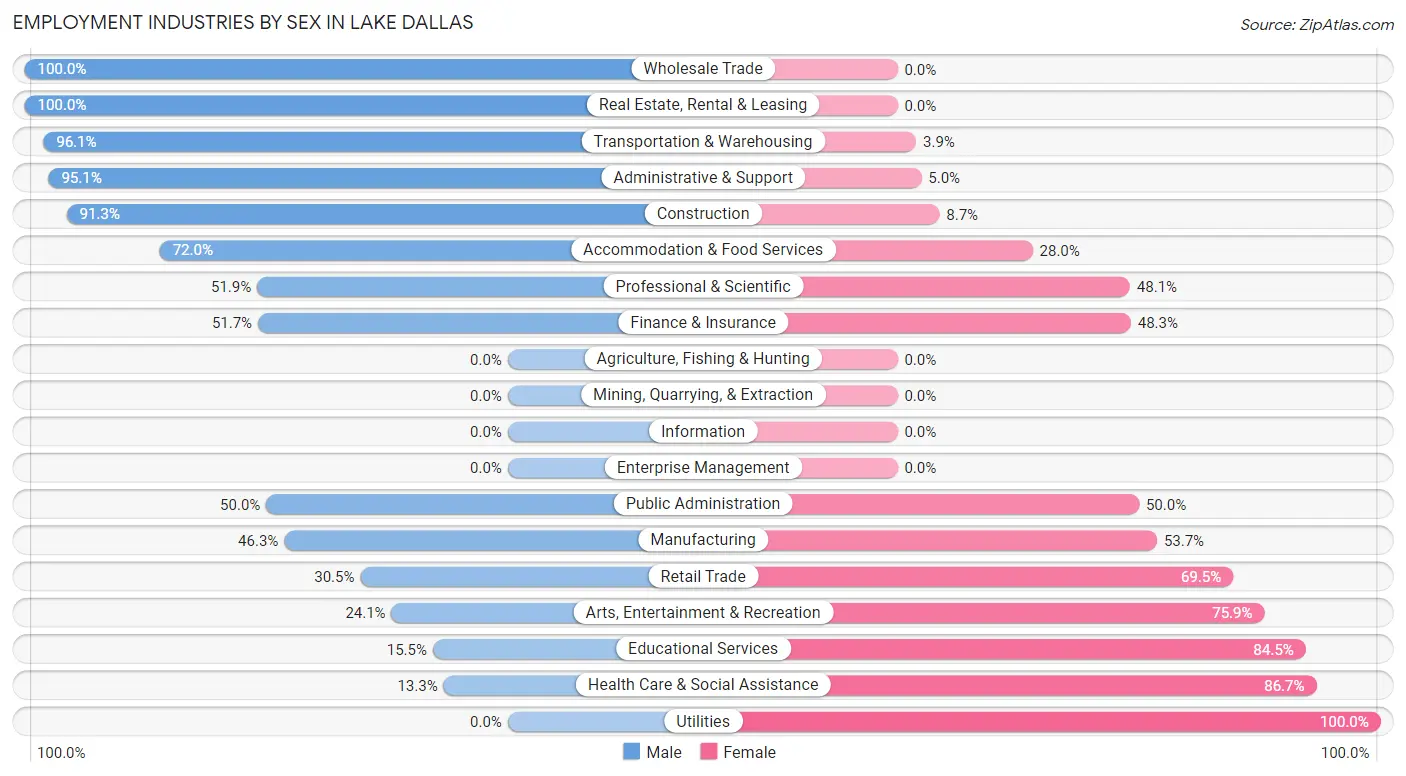
Employment Industries by Sex in Lake Dallas
The Lake Dallas industries that see more men than women are Wholesale Trade (100.0%), Real Estate, Rental & Leasing (100.0%), and Transportation & Warehousing (96.1%), whereas the industries that tend to have a higher number of women are Utilities (100.0%), Health Care & Social Assistance (86.7%), and Educational Services (84.5%).
| Industry | Male | Female |
| Agriculture, Fishing & Hunting | 0 (0.0%) | 0 (0.0%) |
| Mining, Quarrying, & Extraction | 0 (0.0%) | 0 (0.0%) |
| Construction | 568 (91.3%) | 54 (8.7%) |
| Manufacturing | 218 (46.3%) | 253 (53.7%) |
| Wholesale Trade | 12 (100.0%) | 0 (0.0%) |
| Retail Trade | 134 (30.5%) | 305 (69.5%) |
| Transportation & Warehousing | 149 (96.1%) | 6 (3.9%) |
| Utilities | 0 (0.0%) | 22 (100.0%) |
| Information | 0 (0.0%) | 0 (0.0%) |
| Finance & Insurance | 76 (51.7%) | 71 (48.3%) |
| Real Estate, Rental & Leasing | 54 (100.0%) | 0 (0.0%) |
| Professional & Scientific | 124 (51.9%) | 115 (48.1%) |
| Enterprise Management | 0 (0.0%) | 0 (0.0%) |
| Administrative & Support | 211 (95.1%) | 11 (5.0%) |
| Educational Services | 69 (15.5%) | 376 (84.5%) |
| Health Care & Social Assistance | 75 (13.3%) | 489 (86.7%) |
| Arts, Entertainment & Recreation | 13 (24.1%) | 41 (75.9%) |
| Accommodation & Food Services | 242 (72.0%) | 94 (28.0%) |
| Public Administration | 27 (50.0%) | 27 (50.0%) |
| Total | 2,327 (55.2%) | 1,890 (44.8%) |
Education in Lake Dallas
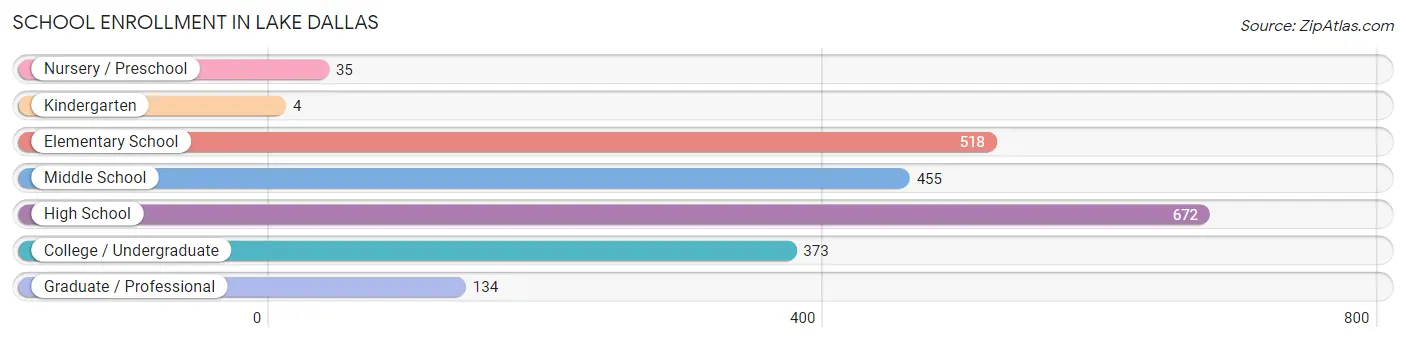
School Enrollment in Lake Dallas
The most common levels of schooling among the 2,191 students in Lake Dallas are high school (672 | 30.7%), elementary school (518 | 23.6%), and middle school (455 | 20.8%).
| School Level | # Students | % Students |
| Nursery / Preschool | 35 | 1.6% |
| Kindergarten | 4 | 0.2% |
| Elementary School | 518 | 23.6% |
| Middle School | 455 | 20.8% |
| High School | 672 | 30.7% |
| College / Undergraduate | 373 | 17.0% |
| Graduate / Professional | 134 | 6.1% |
| Total | 2,191 | 100.0% |
School Enrollment by Age by Funding Source in Lake Dallas
Out of a total of 2,191 students who are enrolled in schools in Lake Dallas, 464 (21.2%) attend a private institution, while the remaining 1,727 (78.8%) are enrolled in public schools. The age group of 35 years and over has the highest likelihood of being enrolled in private schools, with 81 (100.0% in the age bracket) enrolled. Conversely, the age group of 10 to 14 year olds has the lowest likelihood of being enrolled in a private school, with 619 (93.4% in the age bracket) attending a public institution.
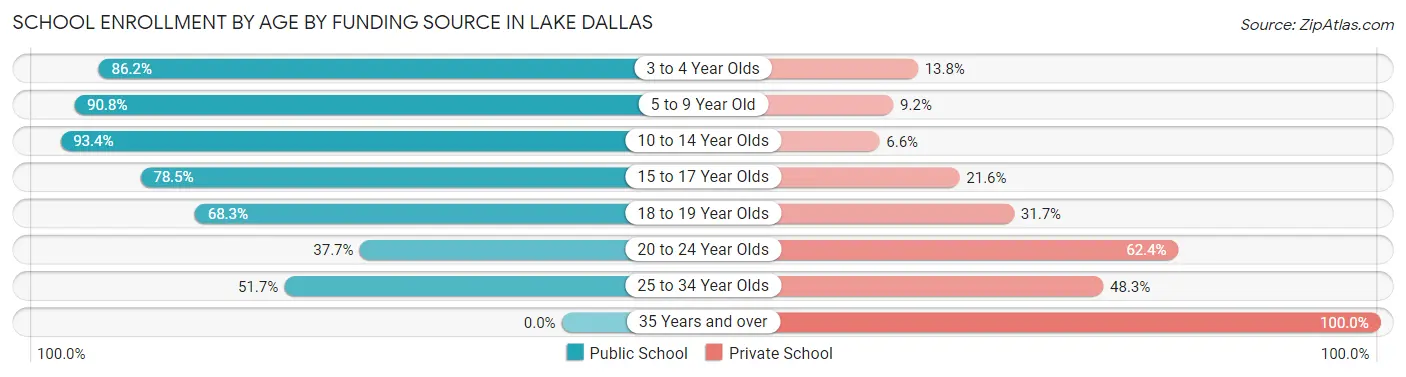
| Age Bracket | Public School | Private School |
| 3 to 4 Year Olds | 25 (86.2%) | 4 (13.8%) |
| 5 to 9 Year Old | 433 (90.8%) | 44 (9.2%) |
| 10 to 14 Year Olds | 619 (93.4%) | 44 (6.6%) |
| 15 to 17 Year Olds | 335 (78.4%) | 92 (21.5%) |
| 18 to 19 Year Olds | 252 (68.3%) | 117 (31.7%) |
| 20 to 24 Year Olds | 32 (37.7%) | 53 (62.4%) |
| 25 to 34 Year Olds | 31 (51.7%) | 29 (48.3%) |
| 35 Years and over | 0 (0.0%) | 81 (100.0%) |
| Total | 1,727 (78.8%) | 464 (21.2%) |
Educational Attainment by Field of Study in Lake Dallas
Business (383 | 26.5%), education (289 | 20.0%), social sciences (274 | 19.0%), visual & performing arts (131 | 9.1%), and computers & mathematics (112 | 7.7%) are the most common fields of study among 1,445 individuals in Lake Dallas who have obtained a bachelor's degree or higher.
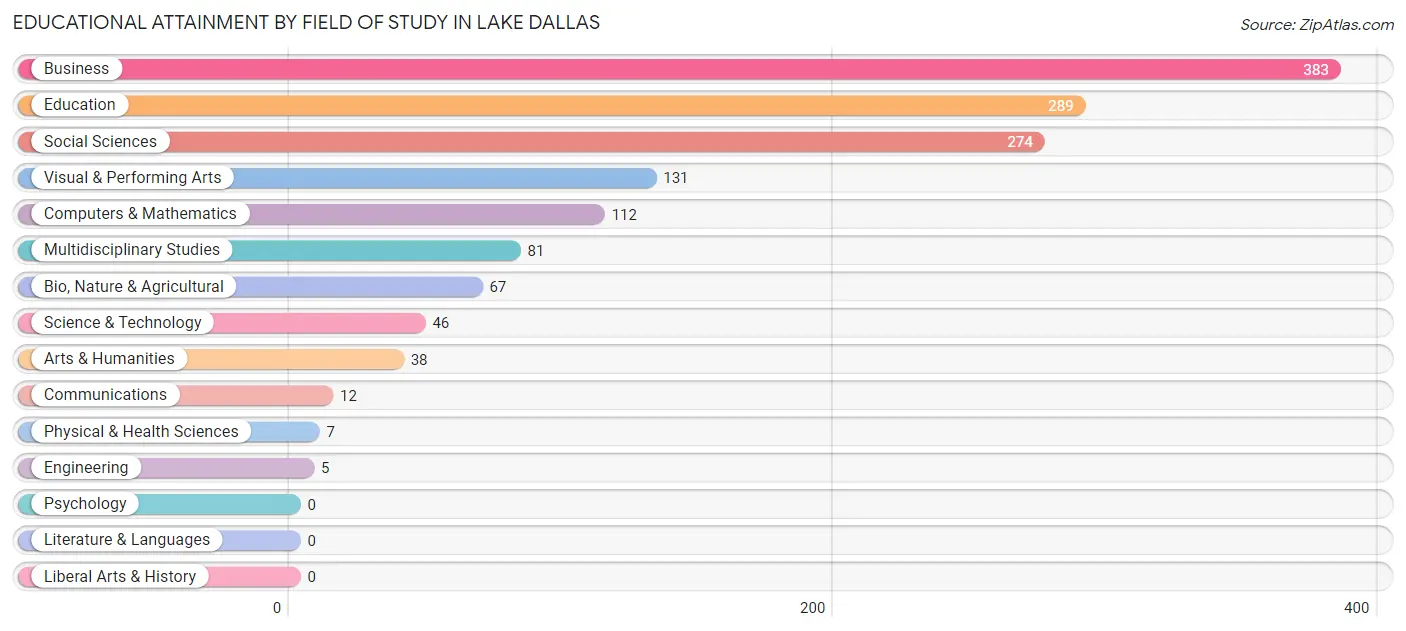
| Field of Study | # Graduates | % Graduates |
| Computers & Mathematics | 112 | 7.7% |
| Bio, Nature & Agricultural | 67 | 4.6% |
| Physical & Health Sciences | 7 | 0.5% |
| Psychology | 0 | 0.0% |
| Social Sciences | 274 | 19.0% |
| Engineering | 5 | 0.4% |
| Multidisciplinary Studies | 81 | 5.6% |
| Science & Technology | 46 | 3.2% |
| Business | 383 | 26.5% |
| Education | 289 | 20.0% |
| Literature & Languages | 0 | 0.0% |
| Liberal Arts & History | 0 | 0.0% |
| Visual & Performing Arts | 131 | 9.1% |
| Communications | 12 | 0.8% |
| Arts & Humanities | 38 | 2.6% |
| Total | 1,445 | 100.0% |
Transportation & Commute in Lake Dallas
Vehicle Availability by Sex in Lake Dallas
The most prevalent vehicle ownership categories in Lake Dallas are males with 2 vehicles (1,305, accounting for 56.1%) and females with 2 vehicles (1,040, making up 70.9%).
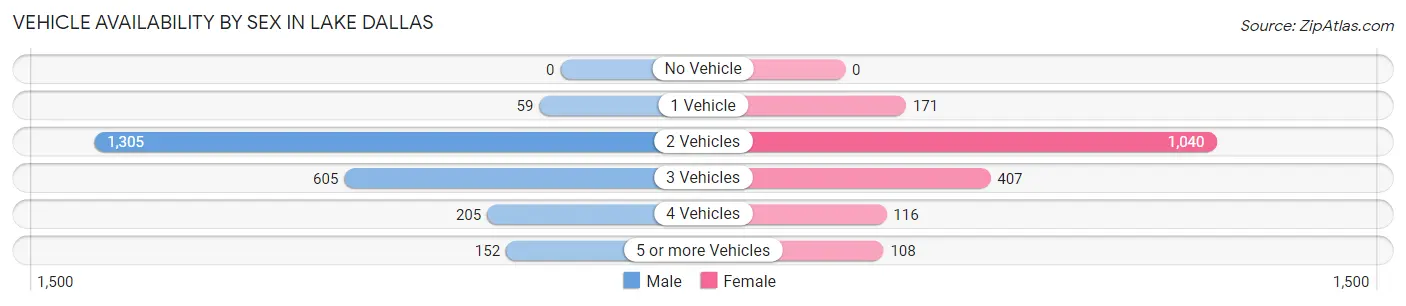
| Vehicles Available | Male | Female |
| No Vehicle | 0 (0.0%) | 0 (0.0%) |
| 1 Vehicle | 59 (2.5%) | 171 (9.3%) |
| 2 Vehicles | 1,305 (56.1%) | 1,040 (56.5%) |
| 3 Vehicles | 605 (26.0%) | 407 (22.1%) |
| 4 Vehicles | 205 (8.8%) | 116 (6.3%) |
| 5 or more Vehicles | 152 (6.5%) | 108 (5.9%) |
| Total | 2,326 (100.0%) | 1,842 (100.0%) |
Commute Time in Lake Dallas
The most frequently occuring commute durations in Lake Dallas are 20 to 24 minutes (957 commuters, 25.1%), 45 to 59 minutes (561 commuters, 14.7%), and 30 to 34 minutes (482 commuters, 12.7%).
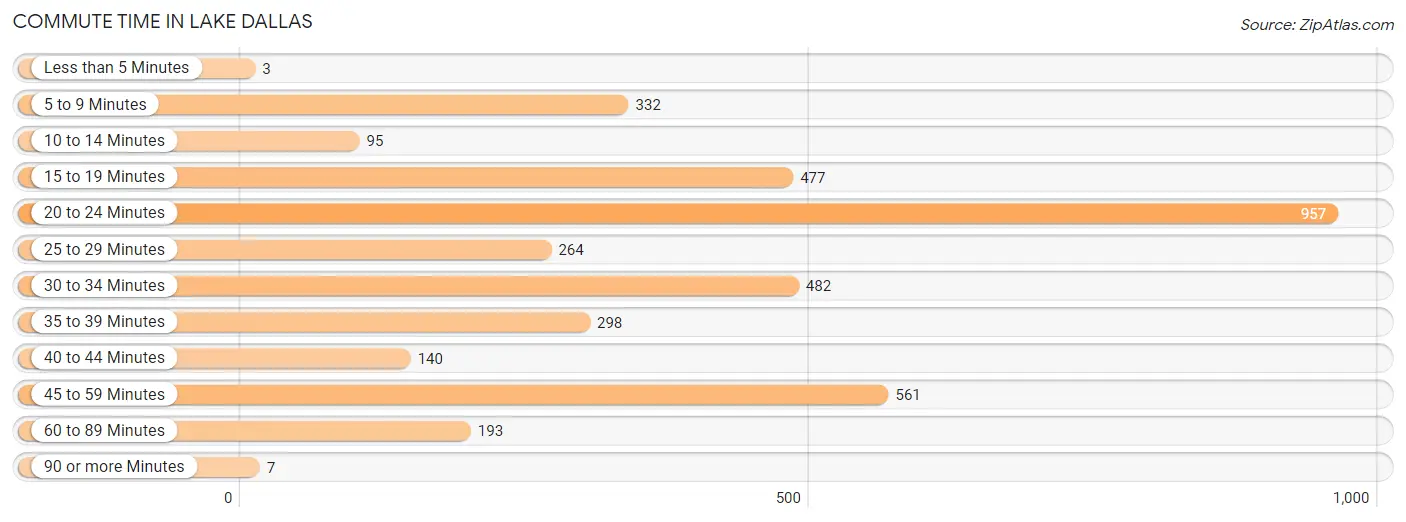
| Commute Time | # Commuters | % Commuters |
| Less than 5 Minutes | 3 | 0.1% |
| 5 to 9 Minutes | 332 | 8.7% |
| 10 to 14 Minutes | 95 | 2.5% |
| 15 to 19 Minutes | 477 | 12.5% |
| 20 to 24 Minutes | 957 | 25.1% |
| 25 to 29 Minutes | 264 | 6.9% |
| 30 to 34 Minutes | 482 | 12.7% |
| 35 to 39 Minutes | 298 | 7.8% |
| 40 to 44 Minutes | 140 | 3.7% |
| 45 to 59 Minutes | 561 | 14.7% |
| 60 to 89 Minutes | 193 | 5.1% |
| 90 or more Minutes | 7 | 0.2% |
Commute Time by Sex in Lake Dallas
The most common commute times in Lake Dallas are 15 to 19 minutes (423 commuters, 20.1%) for males and 20 to 24 minutes (728 commuters, 42.6%) for females.
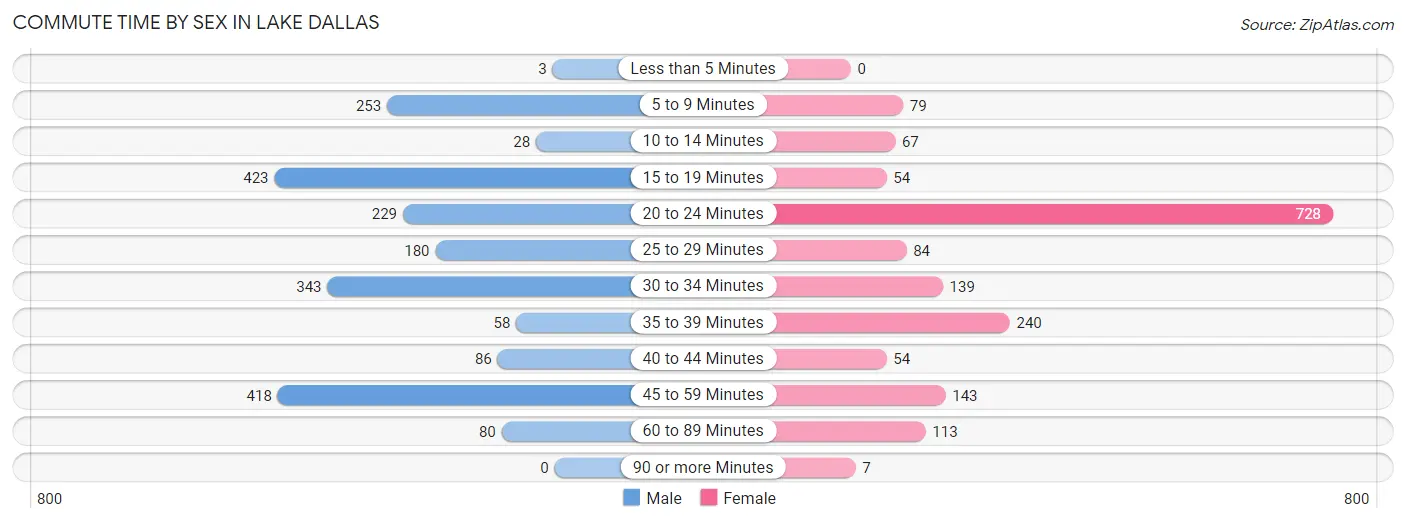
| Commute Time | Male | Female |
| Less than 5 Minutes | 3 (0.1%) | 0 (0.0%) |
| 5 to 9 Minutes | 253 (12.0%) | 79 (4.6%) |
| 10 to 14 Minutes | 28 (1.3%) | 67 (3.9%) |
| 15 to 19 Minutes | 423 (20.1%) | 54 (3.2%) |
| 20 to 24 Minutes | 229 (10.9%) | 728 (42.6%) |
| 25 to 29 Minutes | 180 (8.6%) | 84 (4.9%) |
| 30 to 34 Minutes | 343 (16.3%) | 139 (8.1%) |
| 35 to 39 Minutes | 58 (2.8%) | 240 (14.1%) |
| 40 to 44 Minutes | 86 (4.1%) | 54 (3.2%) |
| 45 to 59 Minutes | 418 (19.9%) | 143 (8.4%) |
| 60 to 89 Minutes | 80 (3.8%) | 113 (6.6%) |
| 90 or more Minutes | 0 (0.0%) | 7 (0.4%) |
Time of Departure to Work by Sex in Lake Dallas
The most frequent times of departure to work in Lake Dallas are 7:00 AM to 7:29 AM (552, 26.3%) for males and 8:00 AM to 8:29 AM (495, 29.0%) for females.
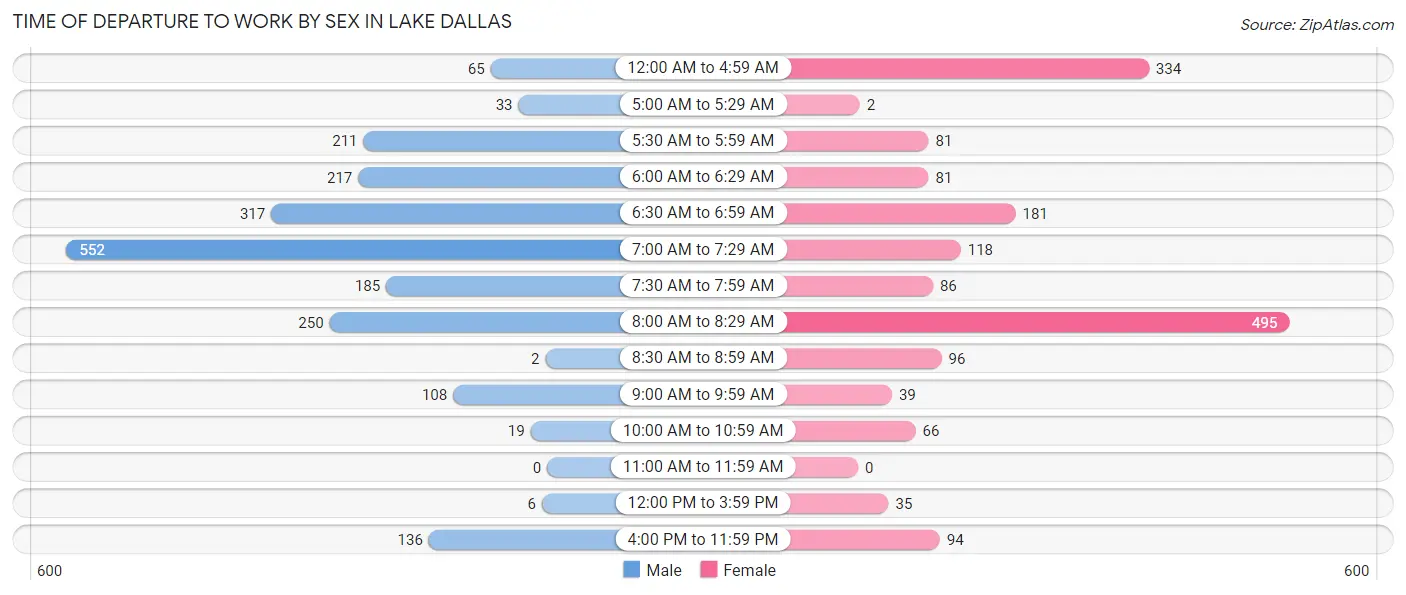
| Time of Departure | Male | Female |
| 12:00 AM to 4:59 AM | 65 (3.1%) | 334 (19.6%) |
| 5:00 AM to 5:29 AM | 33 (1.6%) | 2 (0.1%) |
| 5:30 AM to 5:59 AM | 211 (10.0%) | 81 (4.7%) |
| 6:00 AM to 6:29 AM | 217 (10.3%) | 81 (4.7%) |
| 6:30 AM to 6:59 AM | 317 (15.1%) | 181 (10.6%) |
| 7:00 AM to 7:29 AM | 552 (26.3%) | 118 (6.9%) |
| 7:30 AM to 7:59 AM | 185 (8.8%) | 86 (5.0%) |
| 8:00 AM to 8:29 AM | 250 (11.9%) | 495 (29.0%) |
| 8:30 AM to 8:59 AM | 2 (0.1%) | 96 (5.6%) |
| 9:00 AM to 9:59 AM | 108 (5.1%) | 39 (2.3%) |
| 10:00 AM to 10:59 AM | 19 (0.9%) | 66 (3.9%) |
| 11:00 AM to 11:59 AM | 0 (0.0%) | 0 (0.0%) |
| 12:00 PM to 3:59 PM | 6 (0.3%) | 35 (2.1%) |
| 4:00 PM to 11:59 PM | 136 (6.5%) | 94 (5.5%) |
| Total | 2,101 (100.0%) | 1,708 (100.0%) |
Housing Occupancy in Lake Dallas
Occupancy by Ownership in Lake Dallas
Of the total 2,885 dwellings in Lake Dallas, owner-occupied units account for 2,092 (72.5%), while renter-occupied units make up 793 (27.5%).
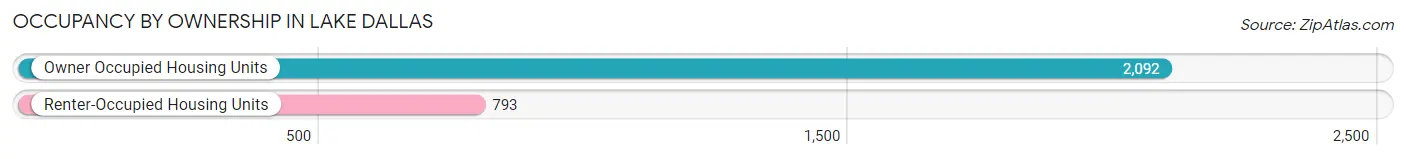
| Occupancy | # Housing Units | % Housing Units |
| Owner Occupied Housing Units | 2,092 | 72.5% |
| Renter-Occupied Housing Units | 793 | 27.5% |
| Total Occupied Housing Units | 2,885 | 100.0% |
Occupancy by Household Size in Lake Dallas
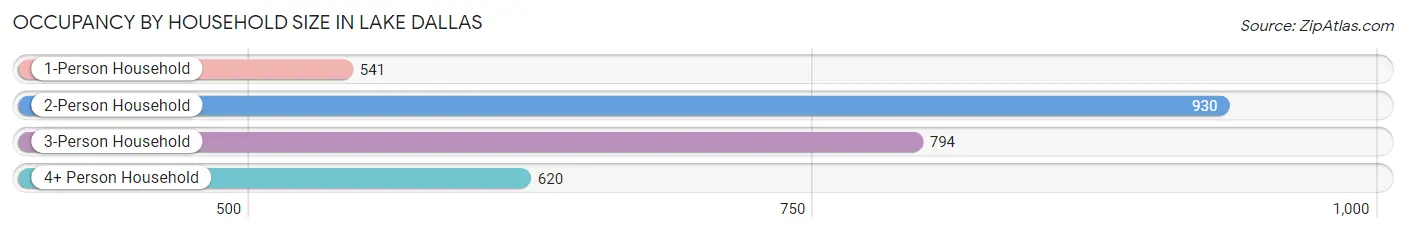
| Household Size | # Housing Units | % Housing Units |
| 1-Person Household | 541 | 18.8% |
| 2-Person Household | 930 | 32.2% |
| 3-Person Household | 794 | 27.5% |
| 4+ Person Household | 620 | 21.5% |
| Total Housing Units | 2,885 | 100.0% |
Occupancy by Ownership by Household Size in Lake Dallas
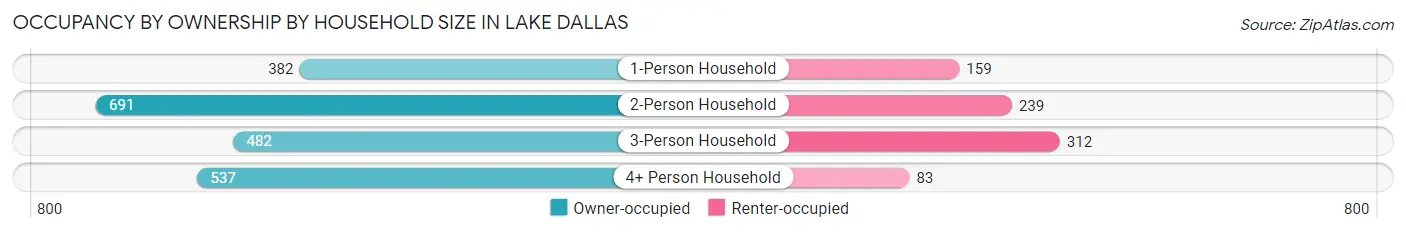
| Household Size | Owner-occupied | Renter-occupied |
| 1-Person Household | 382 (70.6%) | 159 (29.4%) |
| 2-Person Household | 691 (74.3%) | 239 (25.7%) |
| 3-Person Household | 482 (60.7%) | 312 (39.3%) |
| 4+ Person Household | 537 (86.6%) | 83 (13.4%) |
| Total Housing Units | 2,092 (72.5%) | 793 (27.5%) |
Occupancy by Educational Attainment in Lake Dallas
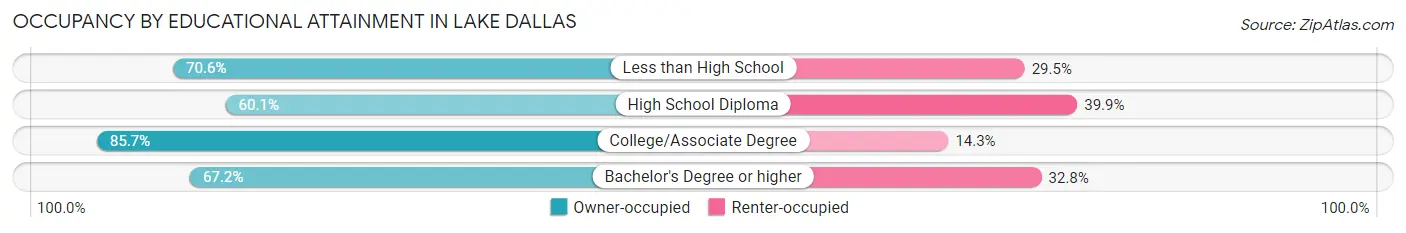
| Household Size | Owner-occupied | Renter-occupied |
| Less than High School | 206 (70.6%) | 86 (29.4%) |
| High School Diploma | 359 (60.1%) | 238 (39.9%) |
| College/Associate Degree | 861 (85.7%) | 144 (14.3%) |
| Bachelor's Degree or higher | 666 (67.2%) | 325 (32.8%) |
Occupancy by Age of Householder in Lake Dallas
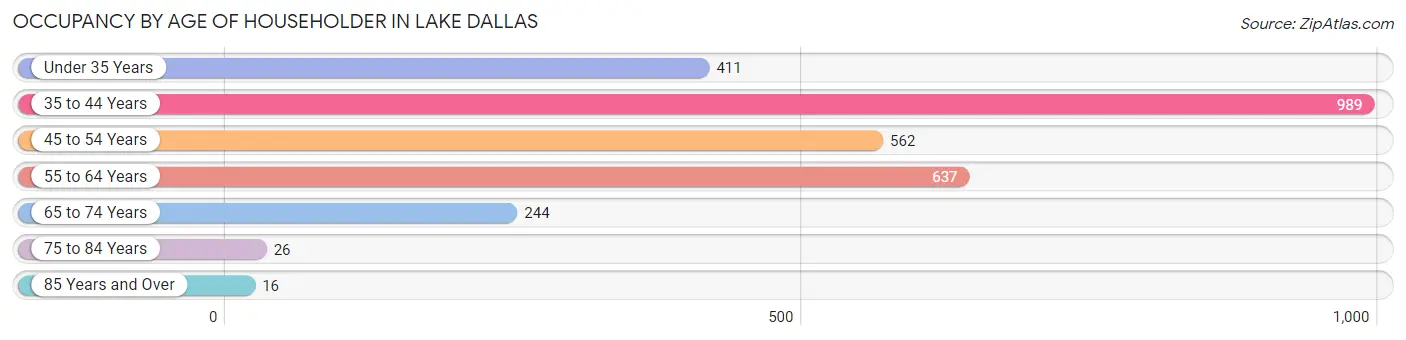
| Age Bracket | # Households | % Households |
| Under 35 Years | 411 | 14.2% |
| 35 to 44 Years | 989 | 34.3% |
| 45 to 54 Years | 562 | 19.5% |
| 55 to 64 Years | 637 | 22.1% |
| 65 to 74 Years | 244 | 8.5% |
| 75 to 84 Years | 26 | 0.9% |
| 85 Years and Over | 16 | 0.5% |
| Total | 2,885 | 100.0% |
Housing Finances in Lake Dallas
Median Income by Occupancy in Lake Dallas
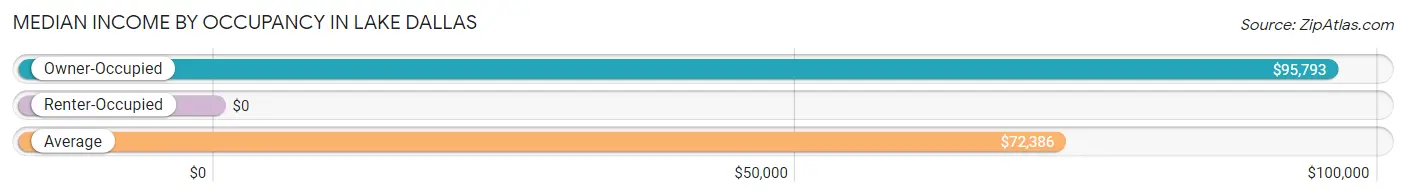
| Occupancy Type | # Households | Median Income |
| Owner-Occupied | 2,092 (72.5%) | $95,793 |
| Renter-Occupied | 793 (27.5%) | $0 |
| Average | 2,885 (100.0%) | $72,386 |
Occupancy by Householder Income Bracket in Lake Dallas
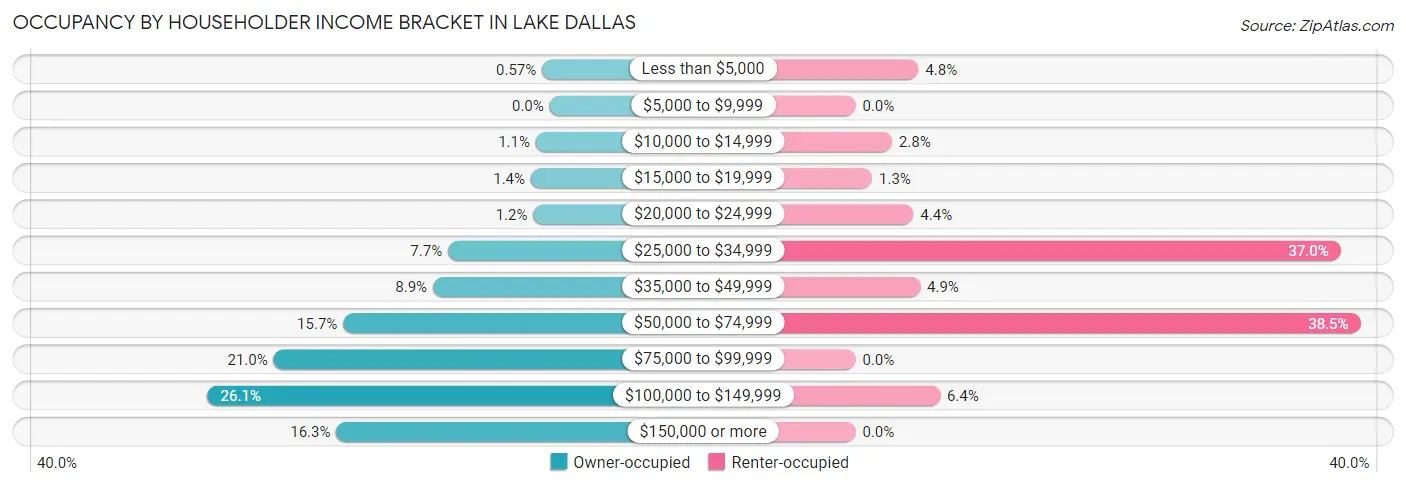
| Income Bracket | Owner-occupied | Renter-occupied |
| Less than $5,000 | 12 (0.6%) | 38 (4.8%) |
| $5,000 to $9,999 | 0 (0.0%) | 0 (0.0%) |
| $10,000 to $14,999 | 22 (1.1%) | 22 (2.8%) |
| $15,000 to $19,999 | 30 (1.4%) | 10 (1.3%) |
| $20,000 to $24,999 | 26 (1.2%) | 35 (4.4%) |
| $25,000 to $34,999 | 162 (7.7%) | 293 (36.9%) |
| $35,000 to $49,999 | 186 (8.9%) | 39 (4.9%) |
| $50,000 to $74,999 | 329 (15.7%) | 305 (38.5%) |
| $75,000 to $99,999 | 440 (21.0%) | 0 (0.0%) |
| $100,000 to $149,999 | 545 (26.1%) | 51 (6.4%) |
| $150,000 or more | 340 (16.3%) | 0 (0.0%) |
| Total | 2,092 (100.0%) | 793 (100.0%) |
Monthly Housing Cost Tiers in Lake Dallas
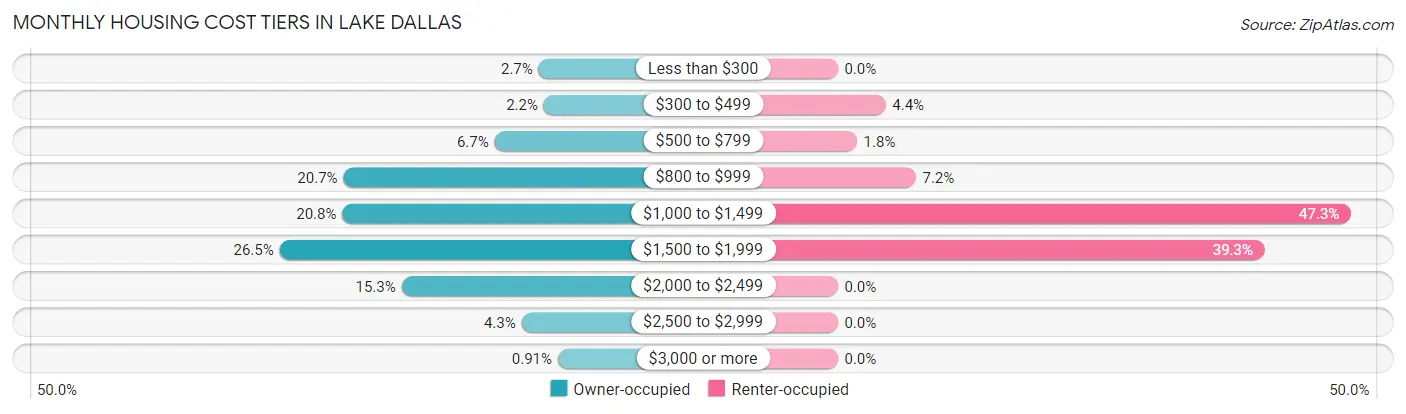
| Monthly Cost | Owner-occupied | Renter-occupied |
| Less than $300 | 56 (2.7%) | 0 (0.0%) |
| $300 to $499 | 46 (2.2%) | 35 (4.4%) |
| $500 to $799 | 141 (6.7%) | 14 (1.8%) |
| $800 to $999 | 432 (20.6%) | 57 (7.2%) |
| $1,000 to $1,499 | 434 (20.7%) | 375 (47.3%) |
| $1,500 to $1,999 | 555 (26.5%) | 312 (39.3%) |
| $2,000 to $2,499 | 320 (15.3%) | 0 (0.0%) |
| $2,500 to $2,999 | 89 (4.3%) | 0 (0.0%) |
| $3,000 or more | 19 (0.9%) | 0 (0.0%) |
| Total | 2,092 (100.0%) | 793 (100.0%) |
Physical Housing Characteristics in Lake Dallas
Housing Structures in Lake Dallas
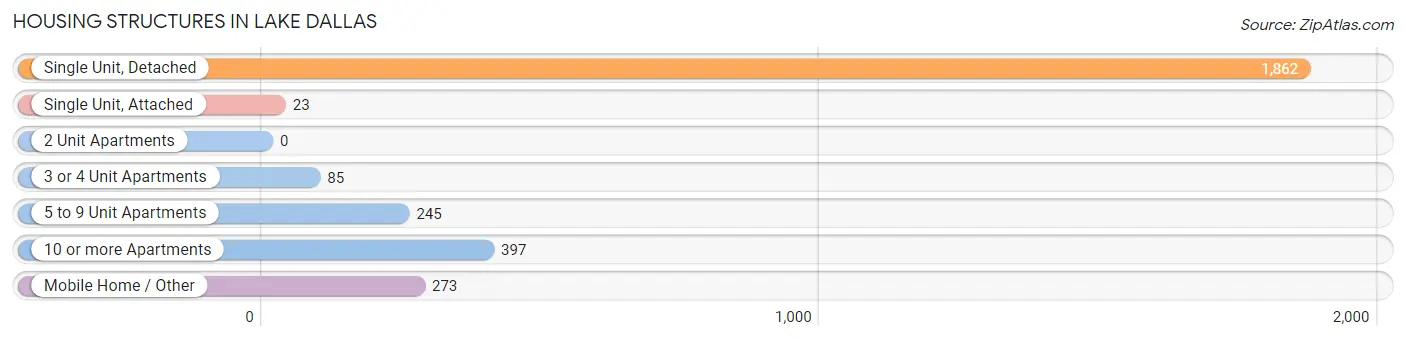
| Structure Type | # Housing Units | % Housing Units |
| Single Unit, Detached | 1,862 | 64.5% |
| Single Unit, Attached | 23 | 0.8% |
| 2 Unit Apartments | 0 | 0.0% |
| 3 or 4 Unit Apartments | 85 | 2.9% |
| 5 to 9 Unit Apartments | 245 | 8.5% |
| 10 or more Apartments | 397 | 13.8% |
| Mobile Home / Other | 273 | 9.5% |
| Total | 2,885 | 100.0% |
Housing Structures by Occupancy in Lake Dallas
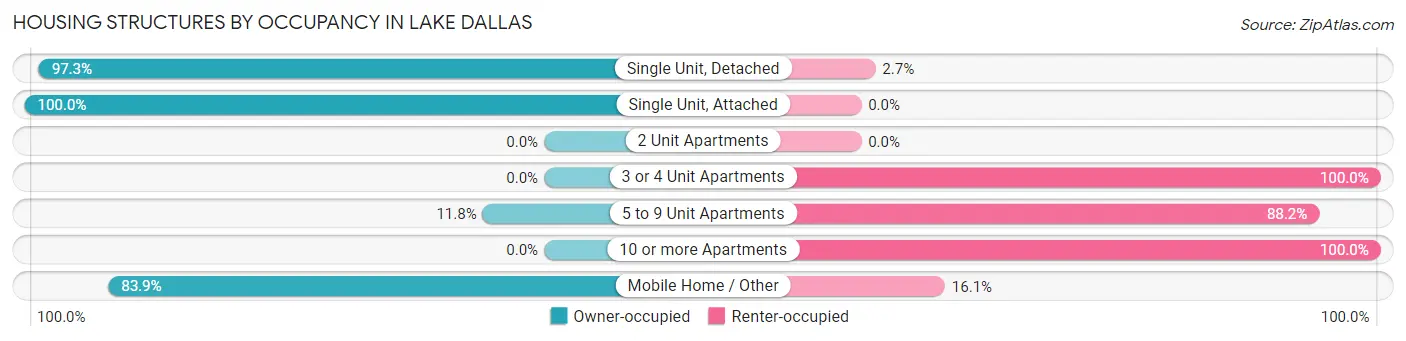
| Structure Type | Owner-occupied | Renter-occupied |
| Single Unit, Detached | 1,811 (97.3%) | 51 (2.7%) |
| Single Unit, Attached | 23 (100.0%) | 0 (0.0%) |
| 2 Unit Apartments | 0 (0.0%) | 0 (0.0%) |
| 3 or 4 Unit Apartments | 0 (0.0%) | 85 (100.0%) |
| 5 to 9 Unit Apartments | 29 (11.8%) | 216 (88.2%) |
| 10 or more Apartments | 0 (0.0%) | 397 (100.0%) |
| Mobile Home / Other | 229 (83.9%) | 44 (16.1%) |
| Total | 2,092 (72.5%) | 793 (27.5%) |
Housing Structures by Number of Rooms in Lake Dallas
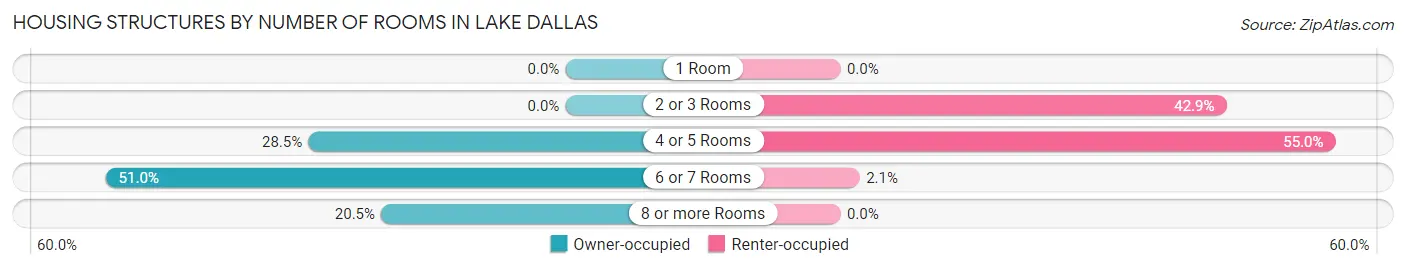
| Number of Rooms | Owner-occupied | Renter-occupied |
| 1 Room | 0 (0.0%) | 0 (0.0%) |
| 2 or 3 Rooms | 0 (0.0%) | 340 (42.9%) |
| 4 or 5 Rooms | 597 (28.5%) | 436 (55.0%) |
| 6 or 7 Rooms | 1,067 (51.0%) | 17 (2.1%) |
| 8 or more Rooms | 428 (20.5%) | 0 (0.0%) |
| Total | 2,092 (100.0%) | 793 (100.0%) |
Housing Structure by Heating Type in Lake Dallas
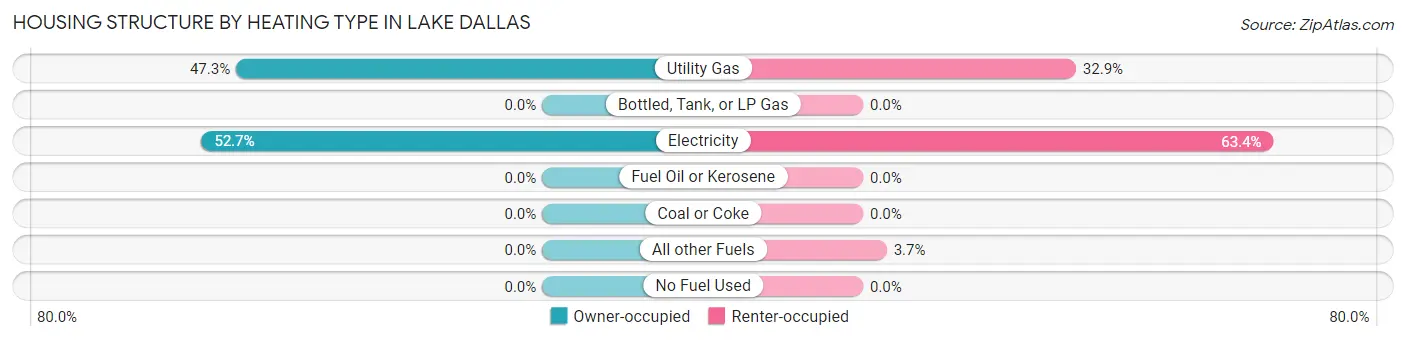
| Heating Type | Owner-occupied | Renter-occupied |
| Utility Gas | 990 (47.3%) | 261 (32.9%) |
| Bottled, Tank, or LP Gas | 0 (0.0%) | 0 (0.0%) |
| Electricity | 1,102 (52.7%) | 503 (63.4%) |
| Fuel Oil or Kerosene | 0 (0.0%) | 0 (0.0%) |
| Coal or Coke | 0 (0.0%) | 0 (0.0%) |
| All other Fuels | 0 (0.0%) | 29 (3.7%) |
| No Fuel Used | 0 (0.0%) | 0 (0.0%) |
| Total | 2,092 (100.0%) | 793 (100.0%) |
Household Vehicle Usage in Lake Dallas
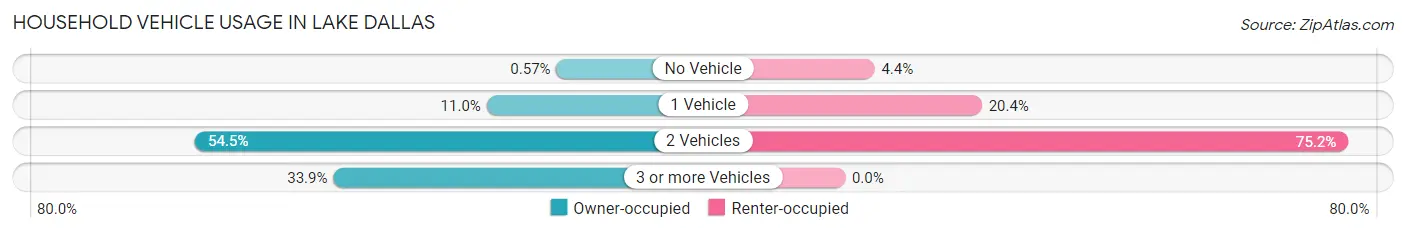
| Vehicles per Household | Owner-occupied | Renter-occupied |
| No Vehicle | 12 (0.6%) | 35 (4.4%) |
| 1 Vehicle | 230 (11.0%) | 162 (20.4%) |
| 2 Vehicles | 1,141 (54.5%) | 596 (75.2%) |
| 3 or more Vehicles | 709 (33.9%) | 0 (0.0%) |
| Total | 2,092 (100.0%) | 793 (100.0%) |
Real Estate & Mortgages in Lake Dallas
Real Estate and Mortgage Overview in Lake Dallas
| Characteristic | Without Mortgage | With Mortgage |
| Housing Units | 686 | 1,406 |
| Median Property Value | $199,000 | $240,200 |
| Median Household Income | $50,909 | $305 |
| Monthly Housing Costs | $913 | $19 |
| Real Estate Taxes | $3,316 | $11 |
Property Value by Mortgage Status in Lake Dallas
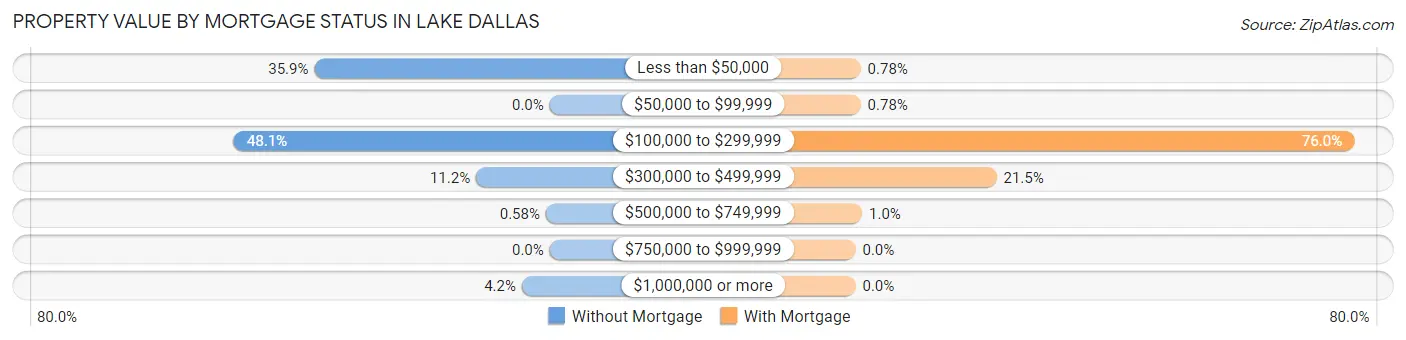
| Property Value | Without Mortgage | With Mortgage |
| Less than $50,000 | 246 (35.9%) | 11 (0.8%) |
| $50,000 to $99,999 | 0 (0.0%) | 11 (0.8%) |
| $100,000 to $299,999 | 330 (48.1%) | 1,068 (76.0%) |
| $300,000 to $499,999 | 77 (11.2%) | 302 (21.5%) |
| $500,000 to $749,999 | 4 (0.6%) | 14 (1.0%) |
| $750,000 to $999,999 | 0 (0.0%) | 0 (0.0%) |
| $1,000,000 or more | 29 (4.2%) | 0 (0.0%) |
| Total | 686 (100.0%) | 1,406 (100.0%) |
Household Income by Mortgage Status in Lake Dallas
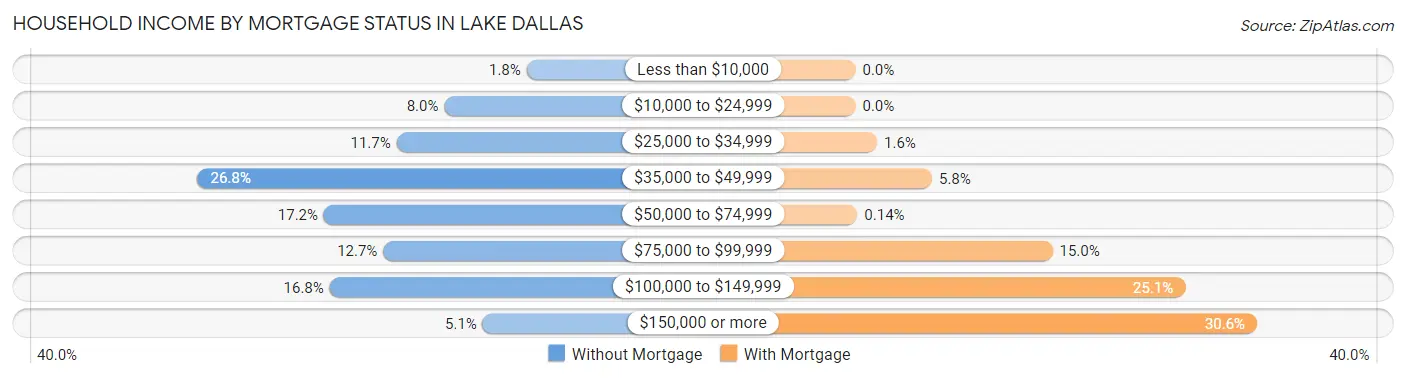
| Household Income | Without Mortgage | With Mortgage |
| Less than $10,000 | 12 (1.8%) | 0 (0.0%) |
| $10,000 to $24,999 | 55 (8.0%) | 0 (0.0%) |
| $25,000 to $34,999 | 80 (11.7%) | 23 (1.6%) |
| $35,000 to $49,999 | 184 (26.8%) | 82 (5.8%) |
| $50,000 to $74,999 | 118 (17.2%) | 2 (0.1%) |
| $75,000 to $99,999 | 87 (12.7%) | 211 (15.0%) |
| $100,000 to $149,999 | 115 (16.8%) | 353 (25.1%) |
| $150,000 or more | 35 (5.1%) | 430 (30.6%) |
| Total | 686 (100.0%) | 1,406 (100.0%) |
Property Value to Household Income Ratio in Lake Dallas
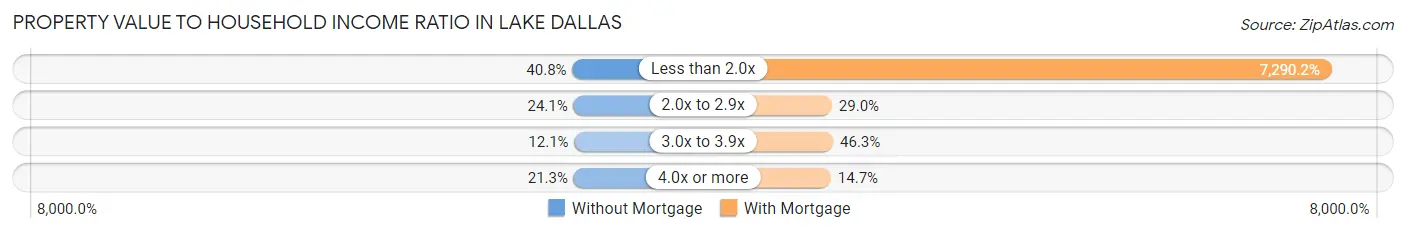
| Value-to-Income Ratio | Without Mortgage | With Mortgage |
| Less than 2.0x | 280 (40.8%) | 102,500 (7,290.2%) |
| 2.0x to 2.9x | 165 (24.0%) | 408 (29.0%) |
| 3.0x to 3.9x | 83 (12.1%) | 651 (46.3%) |
| 4.0x or more | 146 (21.3%) | 206 (14.6%) |
| Total | 686 (100.0%) | 1,406 (100.0%) |
Real Estate Taxes by Mortgage Status in Lake Dallas

| Property Taxes | Without Mortgage | With Mortgage |
| Less than $800 | 193 (28.1%) | 0 (0.0%) |
| $800 to $1,499 | 15 (2.2%) | 0 (0.0%) |
| $800 to $1,499 | 396 (57.7%) | 0 (0.0%) |
| Total | 686 (100.0%) | 1,406 (100.0%) |
Health & Disability in Lake Dallas
Health Insurance Coverage by Age in Lake Dallas
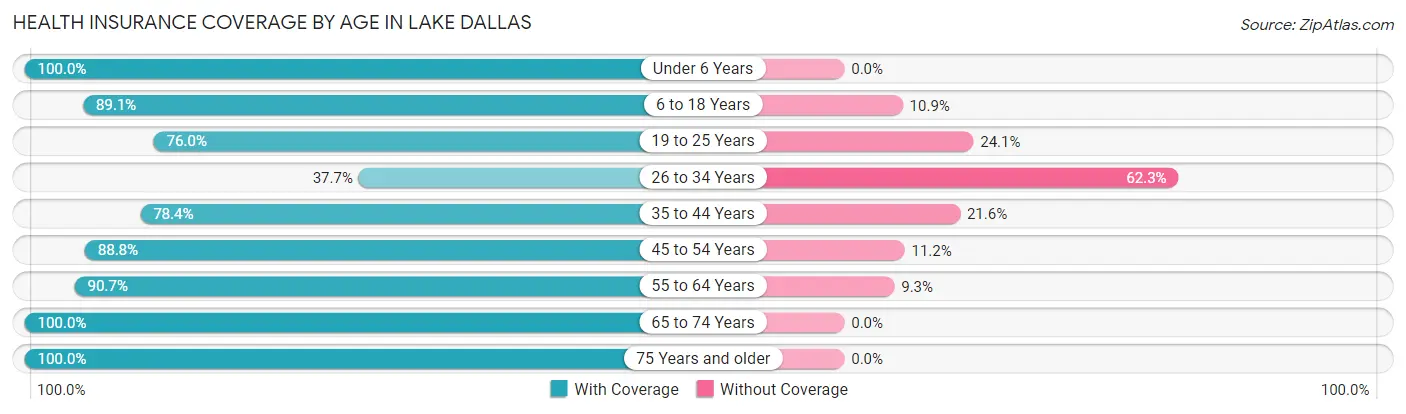
| Age Bracket | With Coverage | Without Coverage |
| Under 6 Years | 280 (100.0%) | 0 (0.0%) |
| 6 to 18 Years | 1,458 (89.1%) | 178 (10.9%) |
| 19 to 25 Years | 537 (75.9%) | 170 (24.0%) |
| 26 to 34 Years | 294 (37.7%) | 486 (62.3%) |
| 35 to 44 Years | 1,276 (78.4%) | 351 (21.6%) |
| 45 to 54 Years | 782 (88.8%) | 99 (11.2%) |
| 55 to 64 Years | 973 (90.7%) | 100 (9.3%) |
| 65 to 74 Years | 638 (100.0%) | 0 (0.0%) |
| 75 Years and older | 60 (100.0%) | 0 (0.0%) |
| Total | 6,298 (82.0%) | 1,384 (18.0%) |
Health Insurance Coverage by Citizenship Status in Lake Dallas

| Citizenship Status | With Coverage | Without Coverage |
| Native Born | 280 (100.0%) | 0 (0.0%) |
| Foreign Born, Citizen | 1,458 (89.1%) | 178 (10.9%) |
| Foreign Born, not a Citizen | 537 (75.9%) | 170 (24.0%) |
Health Insurance Coverage by Household Income in Lake Dallas
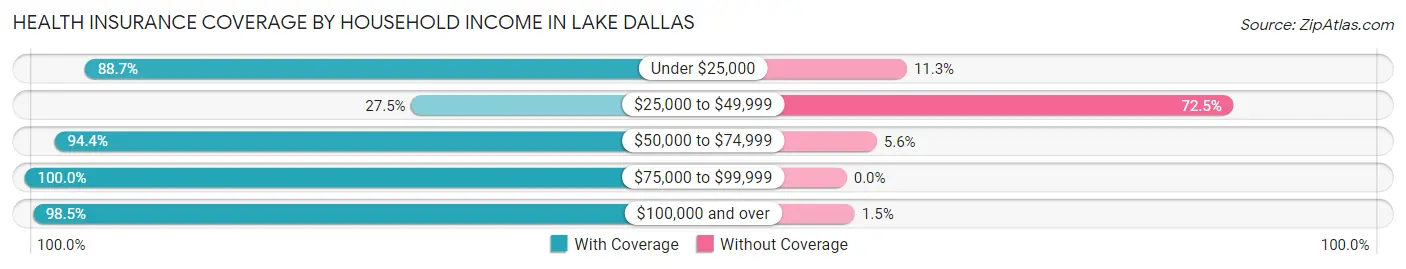
| Household Income | With Coverage | Without Coverage |
| Under $25,000 | 244 (88.7%) | 31 (11.3%) |
| $25,000 to $49,999 | 459 (27.5%) | 1,208 (72.5%) |
| $50,000 to $74,999 | 1,542 (94.4%) | 92 (5.6%) |
| $75,000 to $99,999 | 922 (100.0%) | 0 (0.0%) |
| $100,000 and over | 3,112 (98.5%) | 48 (1.5%) |
Public vs Private Health Insurance Coverage by Age in Lake Dallas
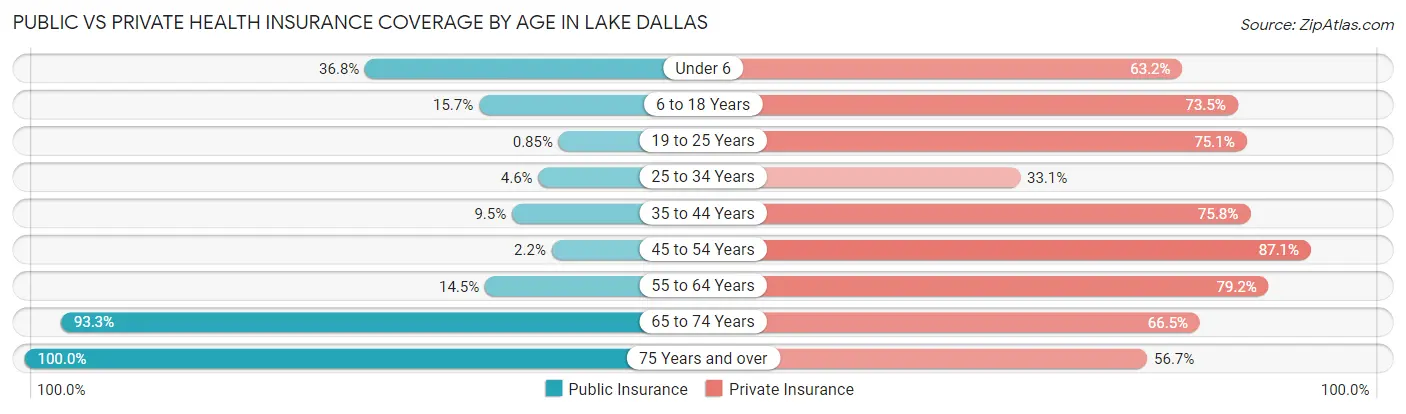
| Age Bracket | Public Insurance | Private Insurance |
| Under 6 | 103 (36.8%) | 177 (63.2%) |
| 6 to 18 Years | 256 (15.7%) | 1,202 (73.5%) |
| 19 to 25 Years | 6 (0.9%) | 531 (75.1%) |
| 25 to 34 Years | 36 (4.6%) | 258 (33.1%) |
| 35 to 44 Years | 155 (9.5%) | 1,233 (75.8%) |
| 45 to 54 Years | 19 (2.2%) | 767 (87.1%) |
| 55 to 64 Years | 156 (14.5%) | 850 (79.2%) |
| 65 to 74 Years | 595 (93.3%) | 424 (66.5%) |
| 75 Years and over | 60 (100.0%) | 34 (56.7%) |
| Total | 1,386 (18.0%) | 5,476 (71.3%) |
Disability Status by Sex by Age in Lake Dallas
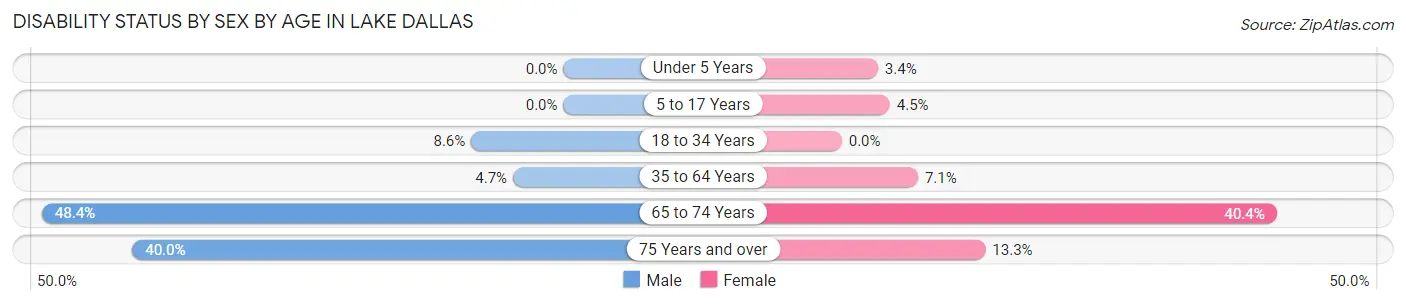
| Age Bracket | Male | Female |
| Under 5 Years | 0 (0.0%) | 6 (3.4%) |
| 5 to 17 Years | 0 (0.0%) | 51 (4.5%) |
| 18 to 34 Years | 82 (8.6%) | 0 (0.0%) |
| 35 to 64 Years | 69 (4.7%) | 149 (7.1%) |
| 65 to 74 Years | 226 (48.4%) | 69 (40.4%) |
| 75 Years and over | 12 (40.0%) | 4 (13.3%) |
Disability Class by Sex by Age in Lake Dallas
Disability Class: Hearing Difficulty
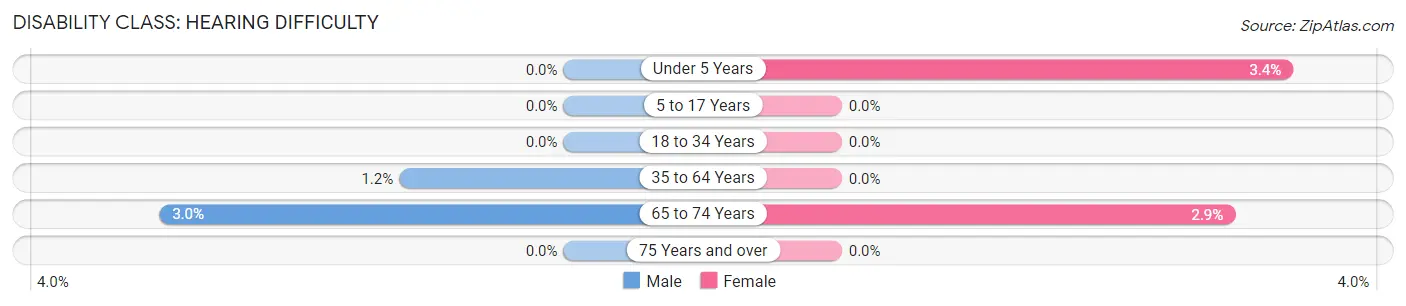
| Age Bracket | Male | Female |
| Under 5 Years | 0 (0.0%) | 6 (3.4%) |
| 5 to 17 Years | 0 (0.0%) | 0 (0.0%) |
| 18 to 34 Years | 0 (0.0%) | 0 (0.0%) |
| 35 to 64 Years | 18 (1.2%) | 0 (0.0%) |
| 65 to 74 Years | 14 (3.0%) | 5 (2.9%) |
| 75 Years and over | 0 (0.0%) | 0 (0.0%) |
Disability Class: Vision Difficulty
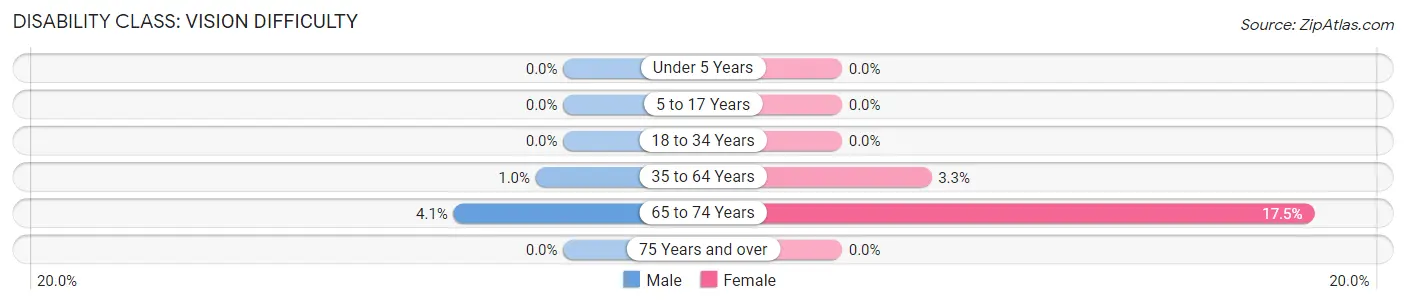
| Age Bracket | Male | Female |
| Under 5 Years | 0 (0.0%) | 0 (0.0%) |
| 5 to 17 Years | 0 (0.0%) | 0 (0.0%) |
| 18 to 34 Years | 0 (0.0%) | 0 (0.0%) |
| 35 to 64 Years | 15 (1.0%) | 70 (3.3%) |
| 65 to 74 Years | 19 (4.1%) | 30 (17.5%) |
| 75 Years and over | 0 (0.0%) | 0 (0.0%) |
Disability Class: Cognitive Difficulty
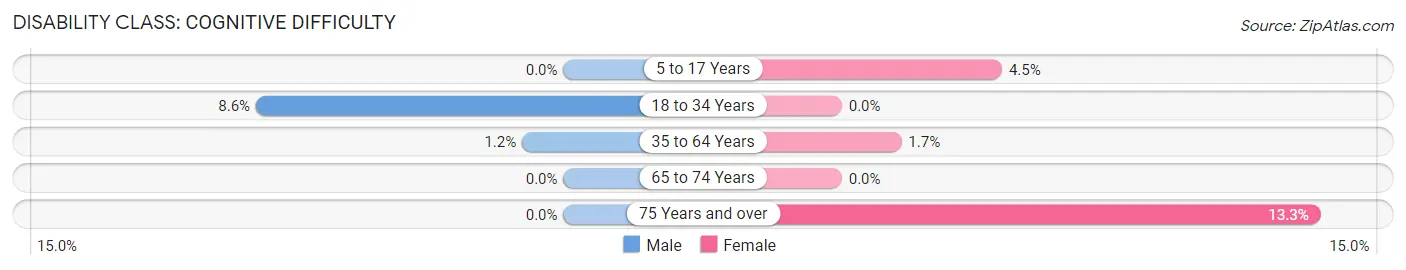
| Age Bracket | Male | Female |
| 5 to 17 Years | 0 (0.0%) | 51 (4.5%) |
| 18 to 34 Years | 82 (8.6%) | 0 (0.0%) |
| 35 to 64 Years | 17 (1.1%) | 35 (1.7%) |
| 65 to 74 Years | 0 (0.0%) | 0 (0.0%) |
| 75 Years and over | 0 (0.0%) | 4 (13.3%) |
Disability Class: Ambulatory Difficulty
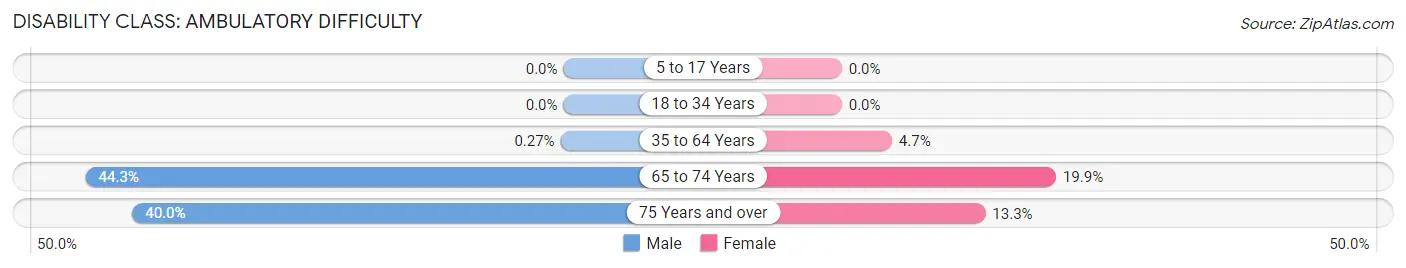
| Age Bracket | Male | Female |
| 5 to 17 Years | 0 (0.0%) | 0 (0.0%) |
| 18 to 34 Years | 0 (0.0%) | 0 (0.0%) |
| 35 to 64 Years | 4 (0.3%) | 98 (4.6%) |
| 65 to 74 Years | 207 (44.3%) | 34 (19.9%) |
| 75 Years and over | 12 (40.0%) | 4 (13.3%) |
Disability Class: Self-Care Difficulty
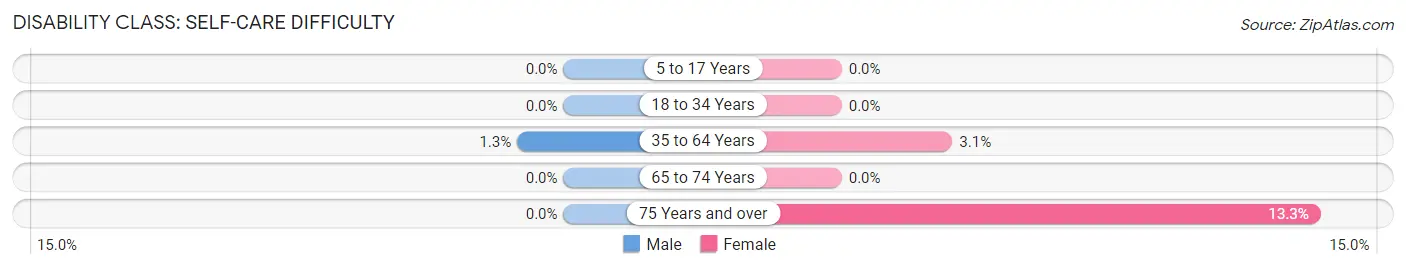
| Age Bracket | Male | Female |
| 5 to 17 Years | 0 (0.0%) | 0 (0.0%) |
| 18 to 34 Years | 0 (0.0%) | 0 (0.0%) |
| 35 to 64 Years | 19 (1.3%) | 65 (3.1%) |
| 65 to 74 Years | 0 (0.0%) | 0 (0.0%) |
| 75 Years and over | 0 (0.0%) | 4 (13.3%) |
Technology Access in Lake Dallas
Computing Device Access in Lake Dallas
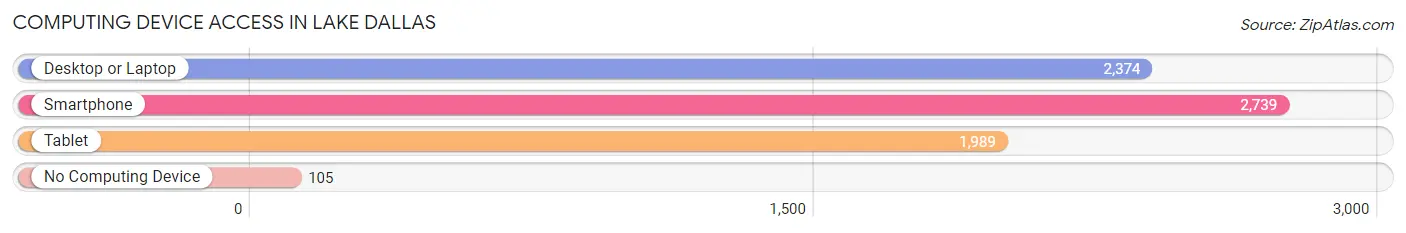
| Device Type | # Households | % Households |
| Desktop or Laptop | 2,374 | 82.3% |
| Smartphone | 2,739 | 94.9% |
| Tablet | 1,989 | 68.9% |
| No Computing Device | 105 | 3.6% |
| Total | 2,885 | 100.0% |
Internet Access in Lake Dallas
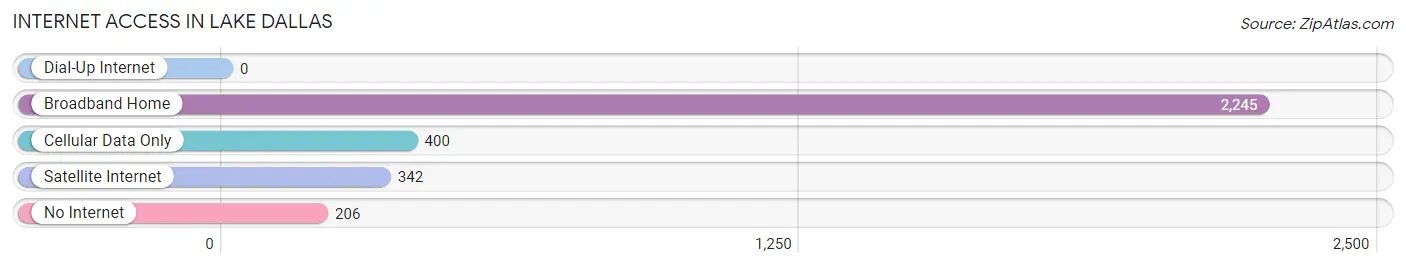
| Internet Type | # Households | % Households |
| Dial-Up Internet | 0 | 0.0% |
| Broadband Home | 2,245 | 77.8% |
| Cellular Data Only | 400 | 13.9% |
| Satellite Internet | 342 | 11.8% |
| No Internet | 206 | 7.1% |
| Total | 2,885 | 100.0% |
Lake Dallas Summary
History
Lake Dallas is a city located in Denton County, Texas, United States. It is part of the Dallas-Fort Worth-Arlington metropolitan area. The city was founded in 1856 and incorporated in 1925. It is located on the shores of Lake Lewisville, a large reservoir on the Elm Fork of the Trinity River. The city was originally known as Garza, after the Garza family who settled in the area in the late 1800s. The name was changed to Lake Dallas in 1925 when the city was incorporated.
The city has a rich history that dates back to the early days of the Republic of Texas. The area was first settled by the Garza family in the late 1800s. The family was of Mexican descent and had come to the area from Mexico. They established a ranch and began to raise cattle and horses. The area was also home to several Native American tribes, including the Comanche, Kiowa, and Wichita.
In 1856, the first post office was established in the area and the town was named Garza. The town grew slowly over the next few decades, but it wasn’t until the early 1900s that the town began to really take off. In 1925, the town was officially incorporated and the name was changed to Lake Dallas.
The city continued to grow throughout the 20th century, and by the 2000s, it had become a thriving suburb of the Dallas-Fort Worth metroplex. The city is now home to a population of over 7,000 people and is a popular destination for outdoor recreation, shopping, and dining.
Geography
Lake Dallas is located in Denton County, Texas, in the Dallas-Fort Worth-Arlington metropolitan area. It is situated on the shores of Lake Lewisville, a large reservoir on the Elm Fork of the Trinity River. The city is located about 25 miles north of downtown Dallas and about 20 miles south of Denton.
The city has a total area of 4.2 square miles, all of which is land. The terrain is mostly flat, with some rolling hills in the northern part of the city. The climate is humid subtropical, with hot summers and mild winters.
Economy
The economy of Lake Dallas is largely based on tourism and retail. The city is home to several popular attractions, including the Lake Dallas Marina, the Lake Dallas Golf Course, and the Lake Dallas Nature Preserve. The city is also home to several retail stores, restaurants, and other businesses.
The city is also home to several manufacturing and industrial businesses. The city is home to several large companies, including the Lake Dallas Manufacturing Company, which produces a variety of products, including automotive parts, medical supplies, and industrial equipment.
Demographics
As of the 2010 census, the population of Lake Dallas was 7,105. The racial makeup of the city was 79.3% White, 8.2% African American, 0.5% Native American, 0.7% Asian, 0.1% Pacific Islander, 8.7% from other races, and 2.5% from two or more races. Hispanic or Latino of any race were 18.2% of the population.
The median household income in the city was $50,945, and the median family income was $60,945. The per capita income for the city was $25,945. About 8.3% of families and 10.2% of the population were below the poverty line, including 14.2% of those under age 18 and 6.2% of those age 65 or over.
The city is served by the Lake Dallas Independent School District. The district has four elementary schools, one middle school, and one high school. The city is also home to several private schools, including Lake Dallas Christian Academy and Lake Dallas Montessori School.
Common Questions
What is Per Capita Income in Lake Dallas?
Per Capita income in Lake Dallas is $34,390.
What is the Median Family Income in Lake Dallas?
Median Family Income in Lake Dallas is $87,885.
What is the Median Household income in Lake Dallas?
Median Household Income in Lake Dallas is $72,386.
What is Income or Wage Gap in Lake Dallas?
Income or Wage Gap in Lake Dallas is 5.4%.
Women in Lake Dallas earn 94.6 cents for every dollar earned by a man.
What is Inequality or Gini Index in Lake Dallas?
Inequality or Gini Index in Lake Dallas is 0.39.
What is the Total Population of Lake Dallas?
Total Population of Lake Dallas is 7,682.
What is the Total Male Population of Lake Dallas?
Total Male Population of Lake Dallas is 3,450.
What is the Total Female Population of Lake Dallas?
Total Female Population of Lake Dallas is 4,232.
What is the Ratio of Males per 100 Females in Lake Dallas?
There are 81.52 Males per 100 Females in Lake Dallas.
What is the Ratio of Females per 100 Males in Lake Dallas?
There are 122.67 Females per 100 Males in Lake Dallas.
What is the Median Population Age in Lake Dallas?
Median Population Age in Lake Dallas is 38.9 Years.
What is the Average Family Size in Lake Dallas
Average Family Size in Lake Dallas is 3.0 People.
What is the Average Household Size in Lake Dallas
Average Household Size in Lake Dallas is 2.6 People.
How Large is the Labor Force in Lake Dallas?
There are 4,338 People in the Labor Forcein in Lake Dallas.
What is the Percentage of People in the Labor Force in Lake Dallas?
72.1% of People are in the Labor Force in Lake Dallas.
What is the Unemployment Rate in Lake Dallas?
Unemployment Rate in Lake Dallas is 2.7%.