La Vernia, TX Map & Demographics
La Vernia Map
La Vernia Overview
$35,252
PER CAPITA INCOME
$95,962
AVG FAMILY INCOME
$74,167
AVG HOUSEHOLD INCOME
44.4%
WAGE / INCOME GAP [ % ]
55.6¢/ $1
WAGE / INCOME GAP [ $ ]
0.49
INEQUALITY / GINI INDEX
1,140
TOTAL POPULATION
508
MALE POPULATION
632
FEMALE POPULATION
80.38
MALES / 100 FEMALES
124.41
FEMALES / 100 MALES
45.3
MEDIAN AGE
3.0
AVG FAMILY SIZE
2.4
AVG HOUSEHOLD SIZE
542
LABOR FORCE [ PEOPLE ]
58.2%
PERCENT IN LABOR FORCE
4.6%
UNEMPLOYMENT RATE
La Vernia Zip Codes
La Vernia Area Codes
Income in La Vernia
Income Overview in La Vernia
Per Capita Income in La Vernia is $35,252, while median incomes of families and households are $95,962 and $74,167 respectively.
| Characteristic | Number | Measure |
| Per Capita Income | 1,140 | $35,252 |
| Median Family Income | 300 | $95,962 |
| Mean Family Income | 300 | $109,665 |
| Median Household Income | 472 | $74,167 |
| Mean Household Income | 472 | $83,399 |
| Income Deficit | 300 | $0 |
| Wage / Income Gap (%) | 1,140 | 44.37% |
| Wage / Income Gap ($) | 1,140 | 55.63¢ per $1 |
| Gini / Inequality Index | 1,140 | 0.49 |
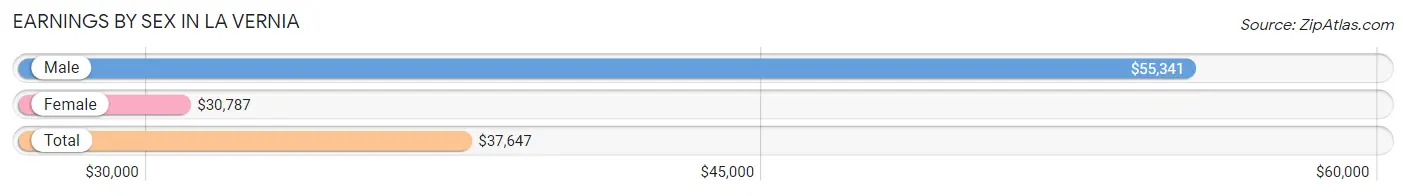
Earnings by Sex in La Vernia
Average Earnings in La Vernia are $37,647, $55,341 for men and $30,787 for women, a difference of 44.4%.
| Sex | Number | Average Earnings |
| Male | 269 (50.6%) | $55,341 |
| Female | 263 (49.4%) | $30,787 |
| Total | 532 (100.0%) | $37,647 |
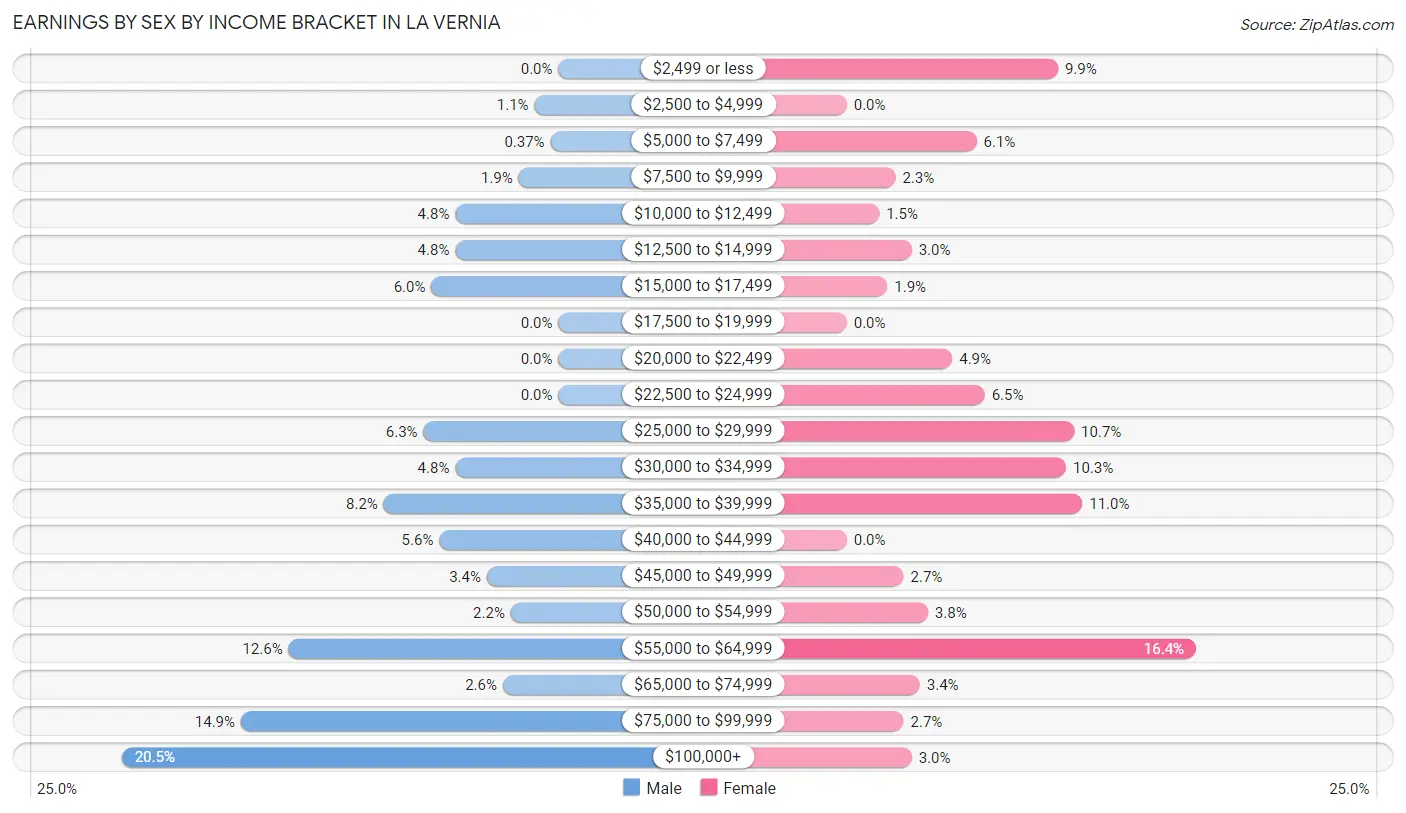
Earnings by Sex by Income Bracket in La Vernia
The most common earnings brackets in La Vernia are $100,000+ for men (55 | 20.4%) and $55,000 to $64,999 for women (43 | 16.4%).
| Income | Male | Female |
| $2,499 or less | 0 (0.0%) | 26 (9.9%) |
| $2,500 to $4,999 | 3 (1.1%) | 0 (0.0%) |
| $5,000 to $7,499 | 1 (0.4%) | 16 (6.1%) |
| $7,500 to $9,999 | 5 (1.9%) | 6 (2.3%) |
| $10,000 to $12,499 | 13 (4.8%) | 4 (1.5%) |
| $12,500 to $14,999 | 13 (4.8%) | 8 (3.0%) |
| $15,000 to $17,499 | 16 (5.9%) | 5 (1.9%) |
| $17,500 to $19,999 | 0 (0.0%) | 0 (0.0%) |
| $20,000 to $22,499 | 0 (0.0%) | 13 (4.9%) |
| $22,500 to $24,999 | 0 (0.0%) | 17 (6.5%) |
| $25,000 to $29,999 | 17 (6.3%) | 28 (10.6%) |
| $30,000 to $34,999 | 13 (4.8%) | 27 (10.3%) |
| $35,000 to $39,999 | 22 (8.2%) | 29 (11.0%) |
| $40,000 to $44,999 | 15 (5.6%) | 0 (0.0%) |
| $45,000 to $49,999 | 9 (3.4%) | 7 (2.7%) |
| $50,000 to $54,999 | 6 (2.2%) | 10 (3.8%) |
| $55,000 to $64,999 | 34 (12.6%) | 43 (16.4%) |
| $65,000 to $74,999 | 7 (2.6%) | 9 (3.4%) |
| $75,000 to $99,999 | 40 (14.9%) | 7 (2.7%) |
| $100,000+ | 55 (20.4%) | 8 (3.0%) |
| Total | 269 (100.0%) | 263 (100.0%) |
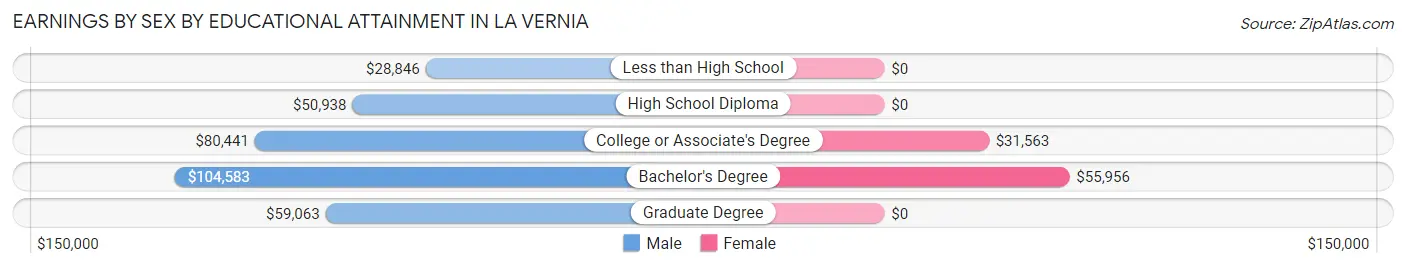
Earnings by Sex by Educational Attainment in La Vernia
Average earnings in La Vernia are $60,000 for men and $31,563 for women, a difference of 47.4%. Men with an educational attainment of bachelor's degree enjoy the highest average annual earnings of $104,583, while those with less than high school education earn the least with $28,846. Women with an educational attainment of bachelor's degree earn the most with the average annual earnings of $55,956, while those with college or associate's degree education have the smallest earnings of $31,563.
| Educational Attainment | Male Income | Female Income |
| Less than High School | $28,846 | $0 |
| High School Diploma | $50,938 | $0 |
| College or Associate's Degree | $80,441 | $31,563 |
| Bachelor's Degree | $104,583 | $55,956 |
| Graduate Degree | $59,063 | $0 |
| Total | $60,000 | $31,563 |
Family Income in La Vernia
Family Income Brackets in La Vernia
According to the La Vernia family income data, there are 73 families falling into the $100,000 to $149,999 income range, which is the most common income bracket and makes up 24.3% of all families.
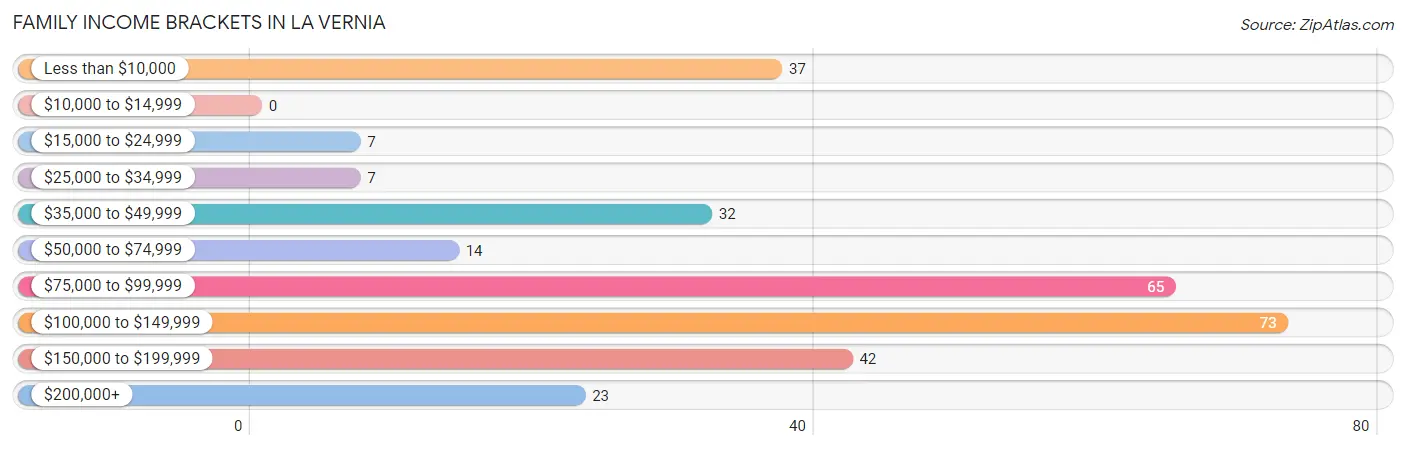
| Income Bracket | # Families | % Families |
| Less than $10,000 | 37 | 12.3% |
| $10,000 to $14,999 | 0 | 0.0% |
| $15,000 to $24,999 | 7 | 2.3% |
| $25,000 to $34,999 | 7 | 2.3% |
| $35,000 to $49,999 | 32 | 10.7% |
| $50,000 to $74,999 | 14 | 4.7% |
| $75,000 to $99,999 | 65 | 21.7% |
| $100,000 to $149,999 | 73 | 24.3% |
| $150,000 to $199,999 | 42 | 14.0% |
| $200,000+ | 23 | 7.7% |
Family Income by Famaliy Size in La Vernia
5-person families (14 | 4.7%) account for the highest median family income in La Vernia with $133,125 per family, while 2-person families (139 | 46.3%) have the highest median income of $44,844 per family member.
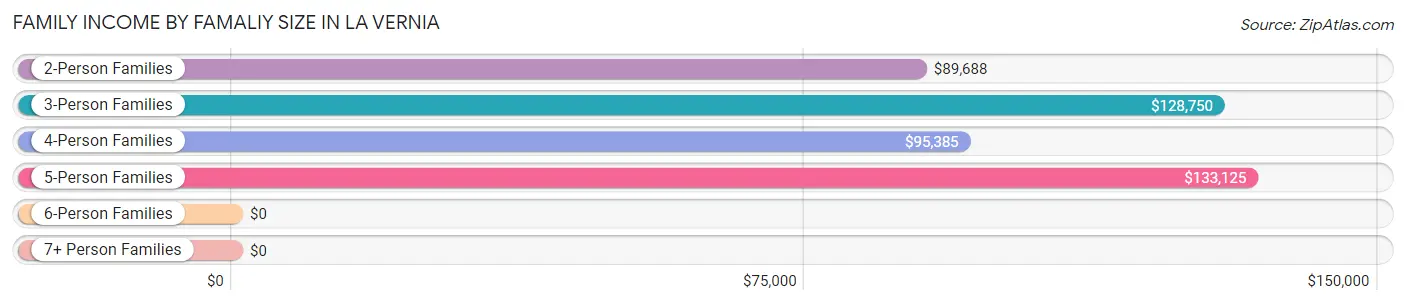
| Income Bracket | # Families | Median Income |
| 2-Person Families | 139 (46.3%) | $89,688 |
| 3-Person Families | 60 (20.0%) | $128,750 |
| 4-Person Families | 82 (27.3%) | $95,385 |
| 5-Person Families | 14 (4.7%) | $133,125 |
| 6-Person Families | 5 (1.7%) | $0 |
| 7+ Person Families | 0 (0.0%) | $0 |
| Total | 300 (100.0%) | $95,962 |
Family Income by Number of Earners in La Vernia
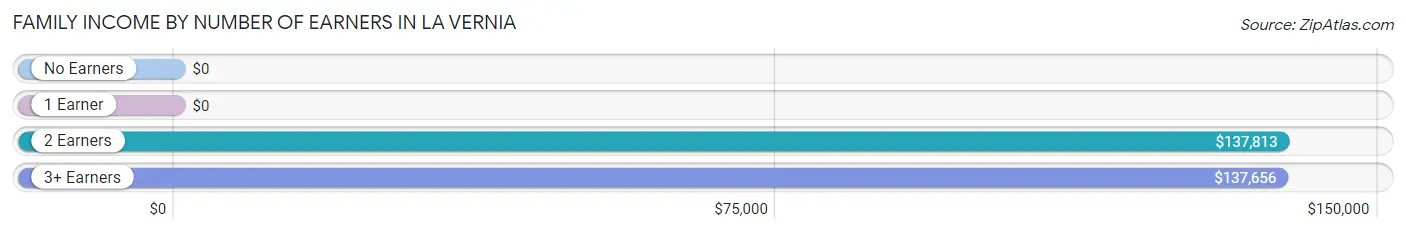
| Number of Earners | # Families | Median Income |
| No Earners | 43 (14.3%) | $0 |
| 1 Earner | 95 (31.7%) | $0 |
| 2 Earners | 133 (44.3%) | $137,813 |
| 3+ Earners | 29 (9.7%) | $137,656 |
| Total | 300 (100.0%) | $95,962 |
Household Income in La Vernia
Household Income Brackets in La Vernia
With 124 households falling in the category, the $15,000 to $24,999 income range is the most frequent in La Vernia, accounting for 26.3% of all households. In contrast, only 17 households (3.6%) fall into the less than $10,000 income bracket, making it the least populous group.
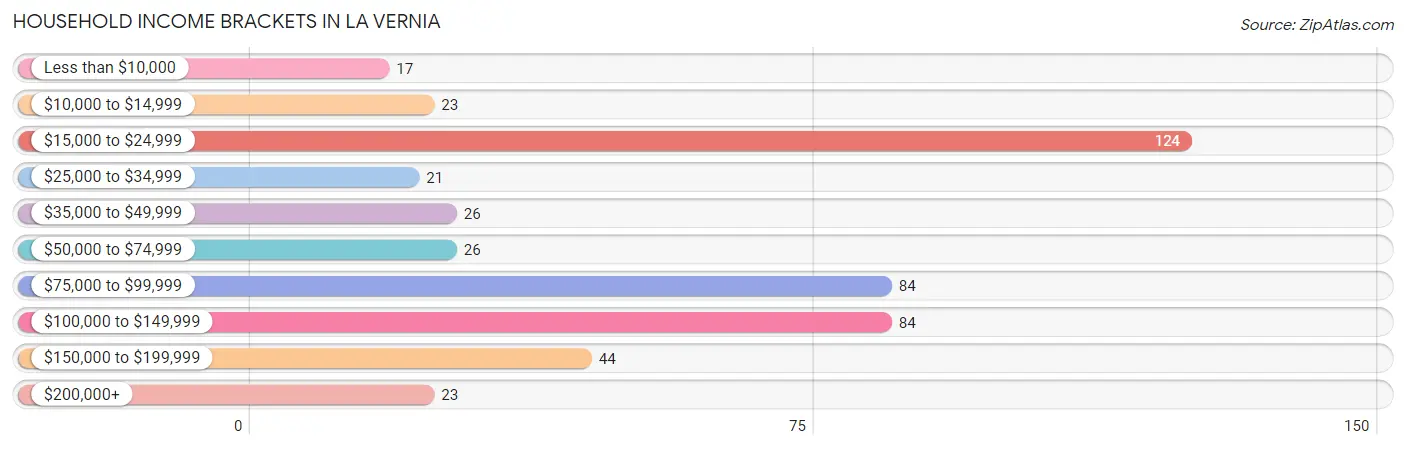
| Income Bracket | # Households | % Households |
| Less than $10,000 | 17 | 3.6% |
| $10,000 to $14,999 | 23 | 4.9% |
| $15,000 to $24,999 | 124 | 26.3% |
| $25,000 to $34,999 | 21 | 4.4% |
| $35,000 to $49,999 | 26 | 5.5% |
| $50,000 to $74,999 | 26 | 5.5% |
| $75,000 to $99,999 | 84 | 17.8% |
| $100,000 to $149,999 | 84 | 17.8% |
| $150,000 to $199,999 | 44 | 9.3% |
| $200,000+ | 23 | 4.9% |
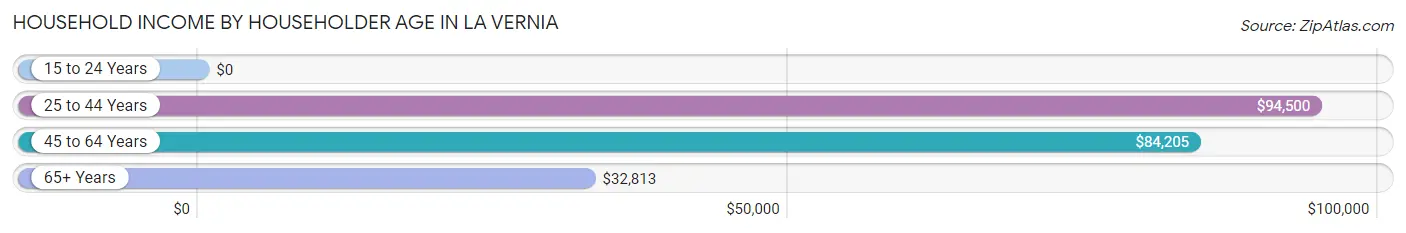
Household Income by Householder Age in La Vernia
The median household income in La Vernia is $74,167, with the highest median household income of $94,500 found in the 25 to 44 years age bracket for the primary householder. A total of 108 households (22.9%) fall into this category. Meanwhile, the 15 to 24 years age bracket for the primary householder has the lowest median household income of $0, with 2 households (0.4%) in this group.
| Income Bracket | # Households | Median Income |
| 15 to 24 Years | 2 (0.4%) | $0 |
| 25 to 44 Years | 108 (22.9%) | $94,500 |
| 45 to 64 Years | 207 (43.9%) | $84,205 |
| 65+ Years | 155 (32.8%) | $32,813 |
| Total | 472 (100.0%) | $74,167 |
Poverty in La Vernia
Income Below Poverty by Sex and Age in La Vernia
With 5.1% poverty level for males and 24.8% for females among the residents of La Vernia, 75 year old and over males and 6 to 11 year old females are the most vulnerable to poverty, with 15 males (31.2%) and 30 females (85.7%) in their respective age groups living below the poverty level.
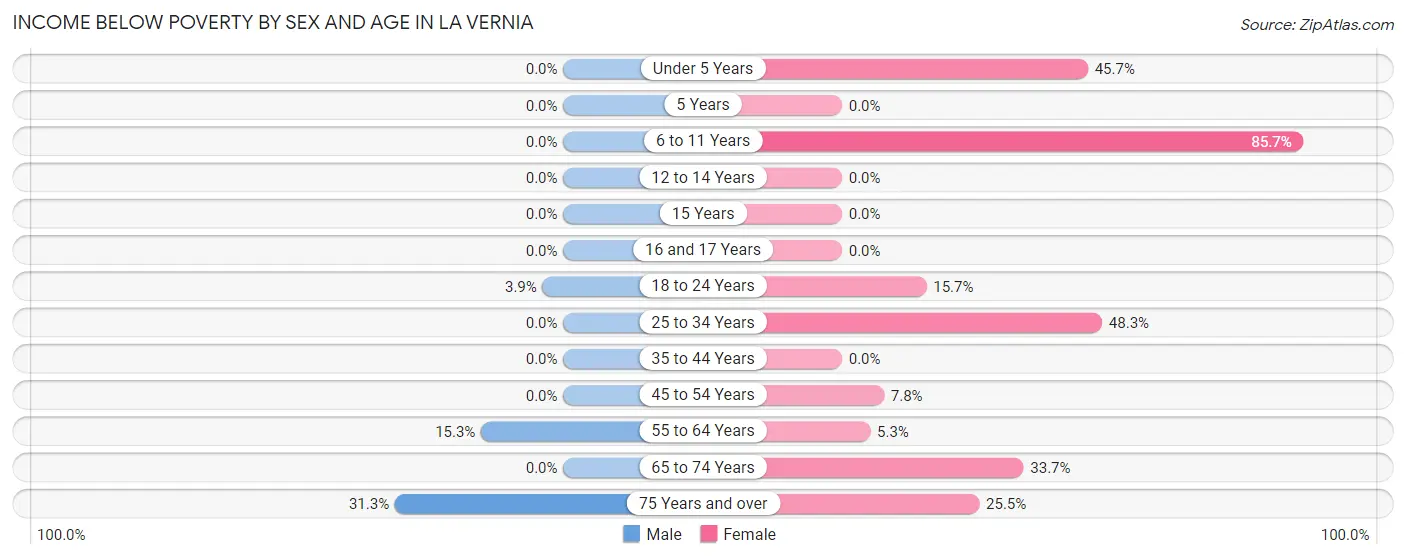
| Age Bracket | Male | Female |
| Under 5 Years | 0 (0.0%) | 21 (45.7%) |
| 5 Years | 0 (0.0%) | 0 (0.0%) |
| 6 to 11 Years | 0 (0.0%) | 30 (85.7%) |
| 12 to 14 Years | 0 (0.0%) | 0 (0.0%) |
| 15 Years | 0 (0.0%) | 0 (0.0%) |
| 16 and 17 Years | 0 (0.0%) | 0 (0.0%) |
| 18 to 24 Years | 2 (3.8%) | 8 (15.7%) |
| 25 to 34 Years | 0 (0.0%) | 42 (48.3%) |
| 35 to 44 Years | 0 (0.0%) | 0 (0.0%) |
| 45 to 54 Years | 0 (0.0%) | 5 (7.8%) |
| 55 to 64 Years | 9 (15.2%) | 7 (5.3%) |
| 65 to 74 Years | 0 (0.0%) | 31 (33.7%) |
| 75 Years and over | 15 (31.2%) | 13 (25.5%) |
| Total | 26 (5.1%) | 157 (24.8%) |
Income Above Poverty by Sex and Age in La Vernia
According to the poverty statistics in La Vernia, males aged under 5 years and females aged 12 to 14 years are the age groups that are most secure financially, with 100.0% of males and 100.0% of females in these age groups living above the poverty line.
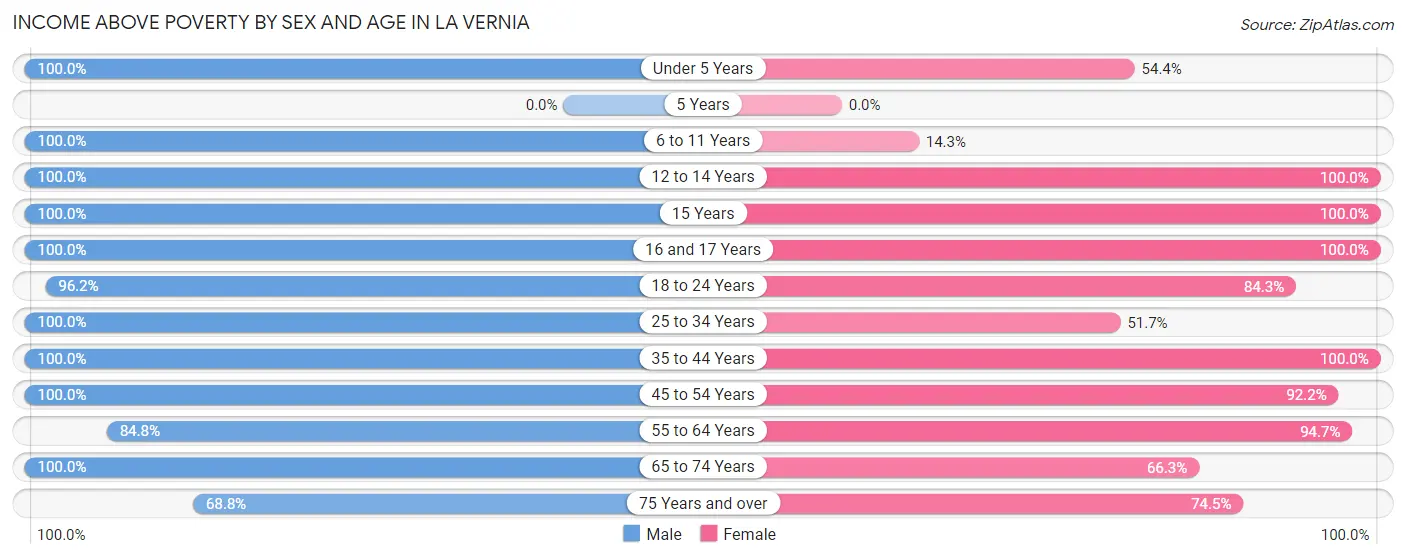
| Age Bracket | Male | Female |
| Under 5 Years | 34 (100.0%) | 25 (54.3%) |
| 5 Years | 0 (0.0%) | 0 (0.0%) |
| 6 to 11 Years | 32 (100.0%) | 5 (14.3%) |
| 12 to 14 Years | 35 (100.0%) | 18 (100.0%) |
| 15 Years | 4 (100.0%) | 4 (100.0%) |
| 16 and 17 Years | 12 (100.0%) | 18 (100.0%) |
| 18 to 24 Years | 50 (96.2%) | 43 (84.3%) |
| 25 to 34 Years | 54 (100.0%) | 45 (51.7%) |
| 35 to 44 Years | 47 (100.0%) | 33 (100.0%) |
| 45 to 54 Years | 76 (100.0%) | 59 (92.2%) |
| 55 to 64 Years | 50 (84.8%) | 126 (94.7%) |
| 65 to 74 Years | 55 (100.0%) | 61 (66.3%) |
| 75 Years and over | 33 (68.8%) | 38 (74.5%) |
| Total | 482 (94.9%) | 475 (75.2%) |
Income Below Poverty Among Married-Couple Families in La Vernia
The poverty statistics for married-couple families in La Vernia show that 9.8% or 23 of the total 234 families live below the poverty line. Families with no children have the highest poverty rate of 15.4%, comprising of 23 families. On the other hand, families with 1 or 2 children have the lowest poverty rate of 0.0%, which includes 0 families.
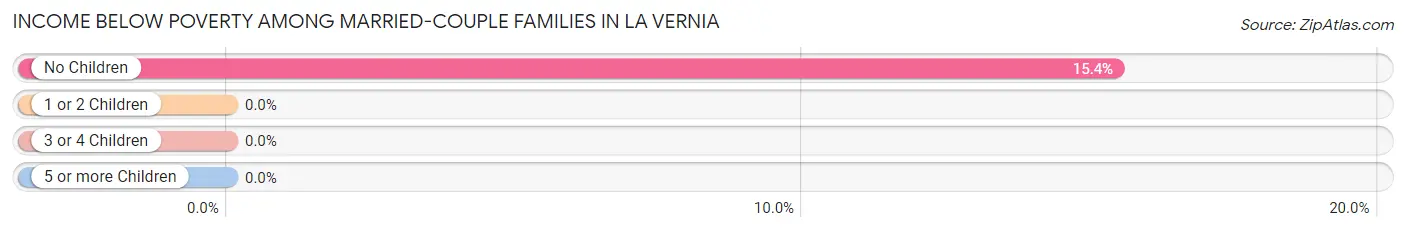
| Children | Above Poverty | Below Poverty |
| No Children | 126 (84.6%) | 23 (15.4%) |
| 1 or 2 Children | 71 (100.0%) | 0 (0.0%) |
| 3 or 4 Children | 14 (100.0%) | 0 (0.0%) |
| 5 or more Children | 0 (0.0%) | 0 (0.0%) |
| Total | 211 (90.2%) | 23 (9.8%) |
Income Below Poverty Among Single-Parent Households in La Vernia
According to the poverty data in La Vernia, 7.1% or 1 single-father households and 38.5% or 20 single-mother households are living below the poverty line. Among single-father households, those with no children have the highest poverty rate, with 1 households (14.3%) experiencing poverty. Likewise, among single-mother households, those with 3 or 4 children have the highest poverty rate, with 20 households (100.0%) falling below the poverty line.
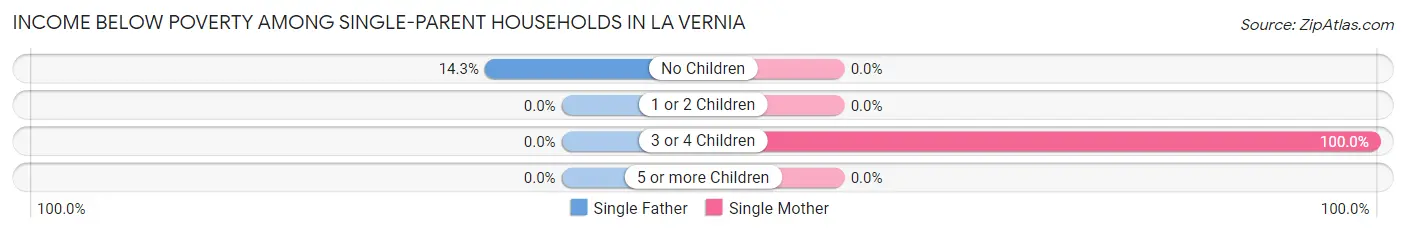
| Children | Single Father | Single Mother |
| No Children | 1 (14.3%) | 0 (0.0%) |
| 1 or 2 Children | 0 (0.0%) | 0 (0.0%) |
| 3 or 4 Children | 0 (0.0%) | 20 (100.0%) |
| 5 or more Children | 0 (0.0%) | 0 (0.0%) |
| Total | 1 (7.1%) | 20 (38.5%) |
Income Below Poverty Among Married-Couple vs Single-Parent Households in La Vernia
The poverty data for La Vernia shows that 23 of the married-couple family households (9.8%) and 21 of the single-parent households (31.8%) are living below the poverty level. Within the married-couple family households, those with no children have the highest poverty rate, with 23 households (15.4%) falling below the poverty line. Among the single-parent households, those with 3 or 4 children have the highest poverty rate, with 20 household (100.0%) living below poverty.
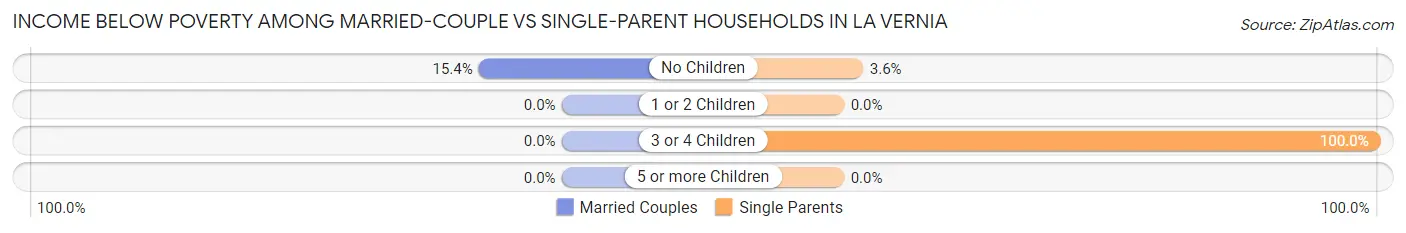
| Children | Married-Couple Families | Single-Parent Households |
| No Children | 23 (15.4%) | 1 (3.6%) |
| 1 or 2 Children | 0 (0.0%) | 0 (0.0%) |
| 3 or 4 Children | 0 (0.0%) | 20 (100.0%) |
| 5 or more Children | 0 (0.0%) | 0 (0.0%) |
| Total | 23 (9.8%) | 21 (31.8%) |
Race in La Vernia
The most populous races in La Vernia are White / Caucasian (930 | 81.6%), Hispanic or Latino (360 | 31.6%), and Two or more Races (174 | 15.3%).
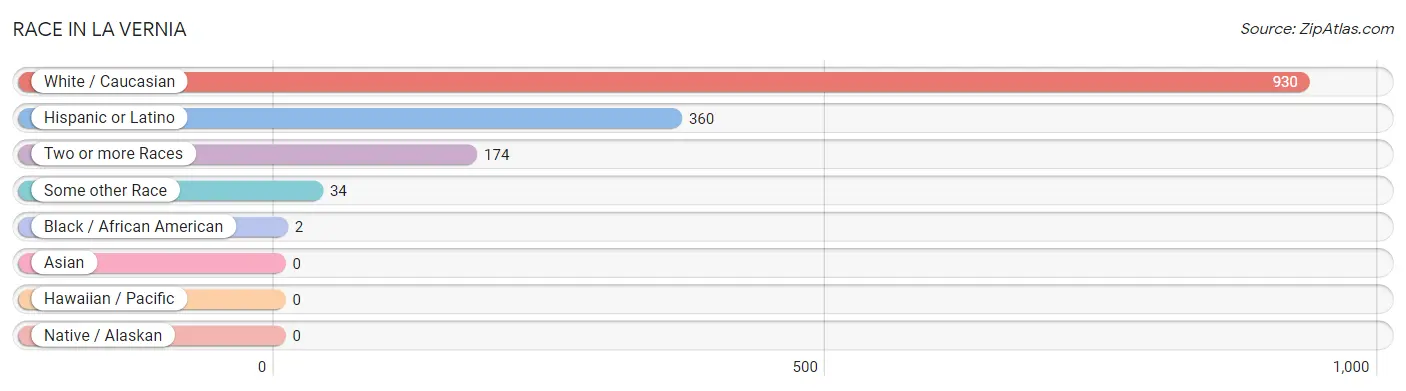
| Race | # Population | % Population |
| Asian | 0 | 0.0% |
| Black / African American | 2 | 0.2% |
| Hawaiian / Pacific | 0 | 0.0% |
| Hispanic or Latino | 360 | 31.6% |
| Native / Alaskan | 0 | 0.0% |
| White / Caucasian | 930 | 81.6% |
| Two or more Races | 174 | 15.3% |
| Some other Race | 34 | 3.0% |
| Total | 1,140 | 100.0% |
Ancestry in La Vernia
The most populous ancestries reported in La Vernia are Mexican (319 | 28.0%), German (219 | 19.2%), English (165 | 14.5%), Irish (100 | 8.8%), and American (64 | 5.6%), together accounting for 76.0% of all La Vernia residents.
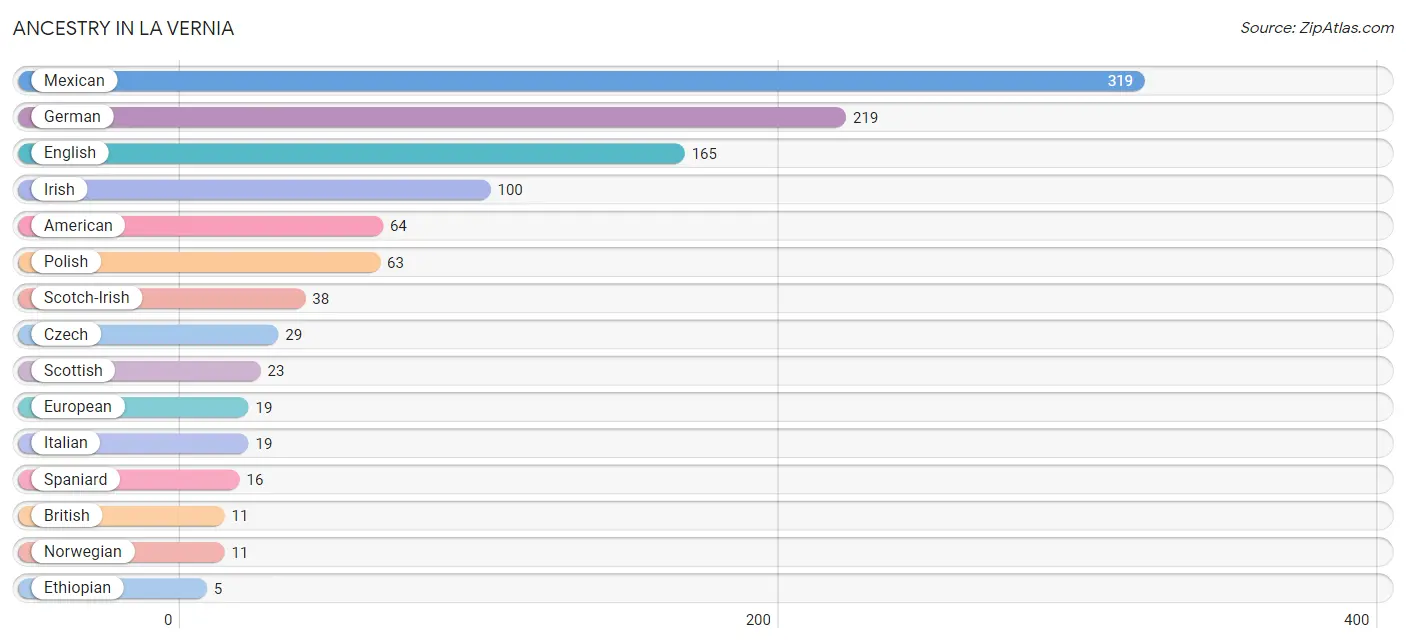
| Ancestry | # Population | % Population |
| American | 64 | 5.6% |
| British | 11 | 1.0% |
| Central American | 2 | 0.2% |
| Cherokee | 2 | 0.2% |
| Czech | 29 | 2.5% |
| Dutch | 1 | 0.1% |
| Eastern European | 3 | 0.3% |
| English | 165 | 14.5% |
| Ethiopian | 5 | 0.4% |
| European | 19 | 1.7% |
| French | 3 | 0.3% |
| German | 219 | 19.2% |
| Honduran | 2 | 0.2% |
| Irish | 100 | 8.8% |
| Italian | 19 | 1.7% |
| Mexican | 319 | 28.0% |
| Norwegian | 11 | 1.0% |
| Polish | 63 | 5.5% |
| Scotch-Irish | 38 | 3.3% |
| Scottish | 23 | 2.0% |
| Spaniard | 16 | 1.4% |
| Subsaharan African | 5 | 0.4% |
| Swedish | 4 | 0.4% |
| Swiss | 5 | 0.4% | View All 24 Rows |
Immigrants in La Vernia
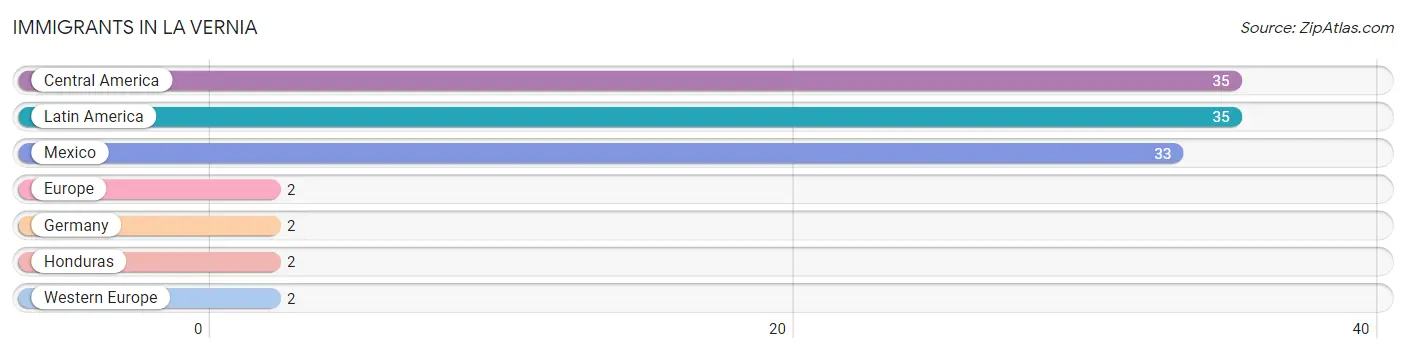
The most numerous immigrant groups reported in La Vernia came from Central America (35 | 3.1%), Latin America (35 | 3.1%), Mexico (33 | 2.9%), Europe (2 | 0.2%), and Germany (2 | 0.2%), together accounting for 9.4% of all La Vernia residents.
| Immigration Origin | # Population | % Population |
| Central America | 35 | 3.1% |
| Europe | 2 | 0.2% |
| Germany | 2 | 0.2% |
| Honduras | 2 | 0.2% |
| Latin America | 35 | 3.1% |
| Mexico | 33 | 2.9% |
| Western Europe | 2 | 0.2% | View All 7 Rows |
Sex and Age in La Vernia
Sex and Age in La Vernia
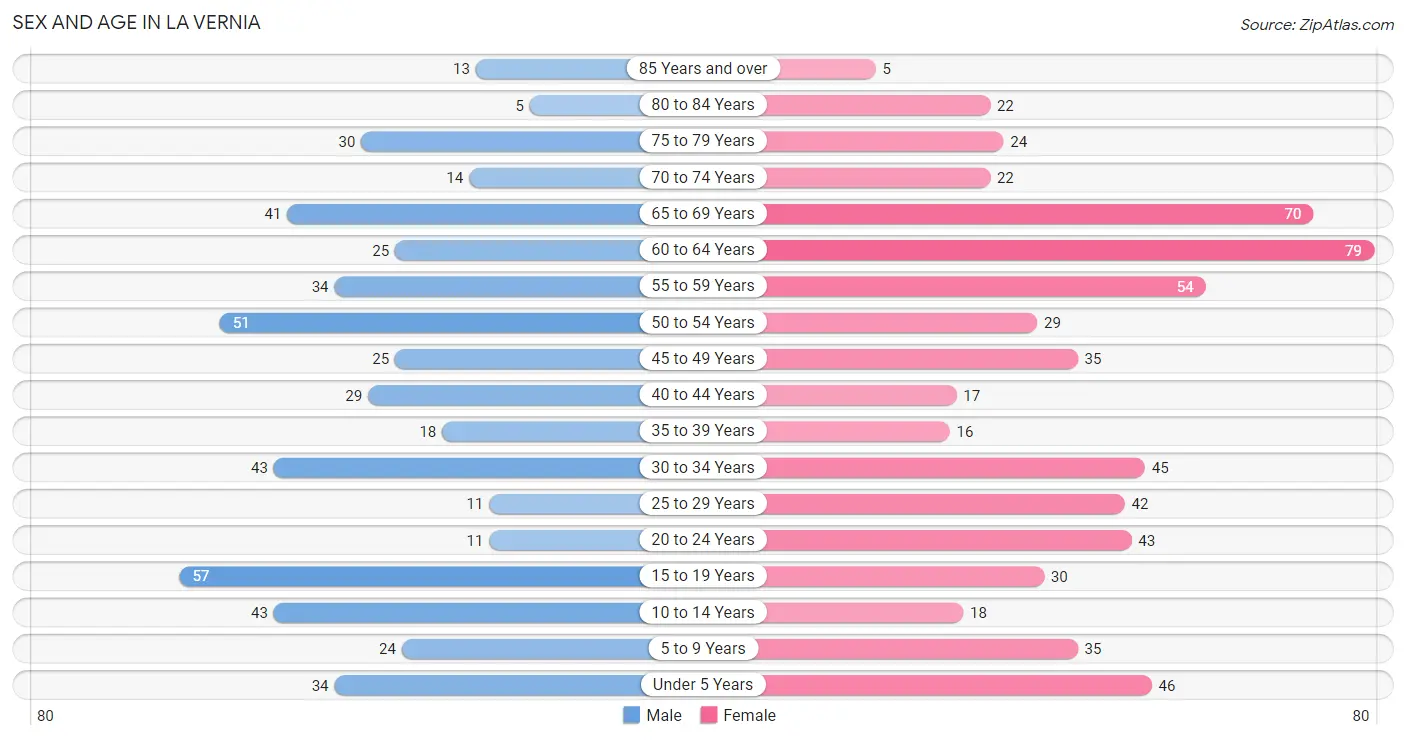
The most populous age groups in La Vernia are 15 to 19 Years (57 | 11.2%) for men and 60 to 64 Years (79 | 12.5%) for women.
| Age Bracket | Male | Female |
| Under 5 Years | 34 (6.7%) | 46 (7.3%) |
| 5 to 9 Years | 24 (4.7%) | 35 (5.5%) |
| 10 to 14 Years | 43 (8.5%) | 18 (2.9%) |
| 15 to 19 Years | 57 (11.2%) | 30 (4.8%) |
| 20 to 24 Years | 11 (2.2%) | 43 (6.8%) |
| 25 to 29 Years | 11 (2.2%) | 42 (6.7%) |
| 30 to 34 Years | 43 (8.5%) | 45 (7.1%) |
| 35 to 39 Years | 18 (3.5%) | 16 (2.5%) |
| 40 to 44 Years | 29 (5.7%) | 17 (2.7%) |
| 45 to 49 Years | 25 (4.9%) | 35 (5.5%) |
| 50 to 54 Years | 51 (10.0%) | 29 (4.6%) |
| 55 to 59 Years | 34 (6.7%) | 54 (8.5%) |
| 60 to 64 Years | 25 (4.9%) | 79 (12.5%) |
| 65 to 69 Years | 41 (8.1%) | 70 (11.1%) |
| 70 to 74 Years | 14 (2.8%) | 22 (3.5%) |
| 75 to 79 Years | 30 (5.9%) | 24 (3.8%) |
| 80 to 84 Years | 5 (1.0%) | 22 (3.5%) |
| 85 Years and over | 13 (2.6%) | 5 (0.8%) |
| Total | 508 (100.0%) | 632 (100.0%) |
Families and Households in La Vernia
Median Family Size in La Vernia
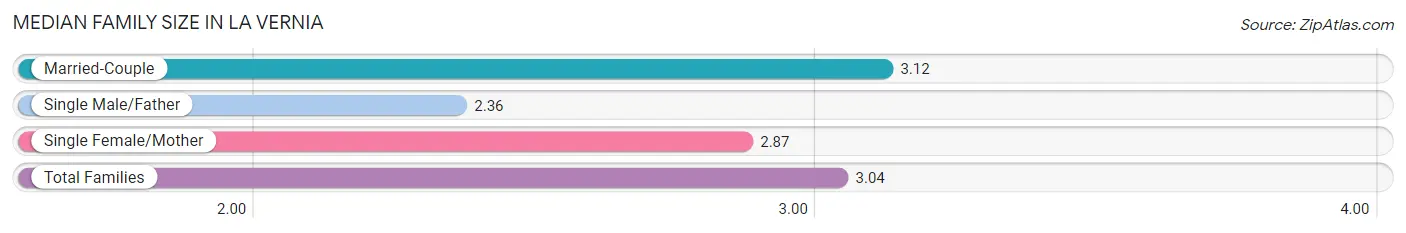
The median family size in La Vernia is 3.04 persons per family, with married-couple families (234 | 78.0%) accounting for the largest median family size of 3.12 persons per family. On the other hand, single male/father families (14 | 4.7%) represent the smallest median family size with 2.36 persons per family.
| Family Type | # Families | Family Size |
| Married-Couple | 234 (78.0%) | 3.12 |
| Single Male/Father | 14 (4.7%) | 2.36 |
| Single Female/Mother | 52 (17.3%) | 2.87 |
| Total Families | 300 (100.0%) | 3.04 |
Median Household Size in La Vernia
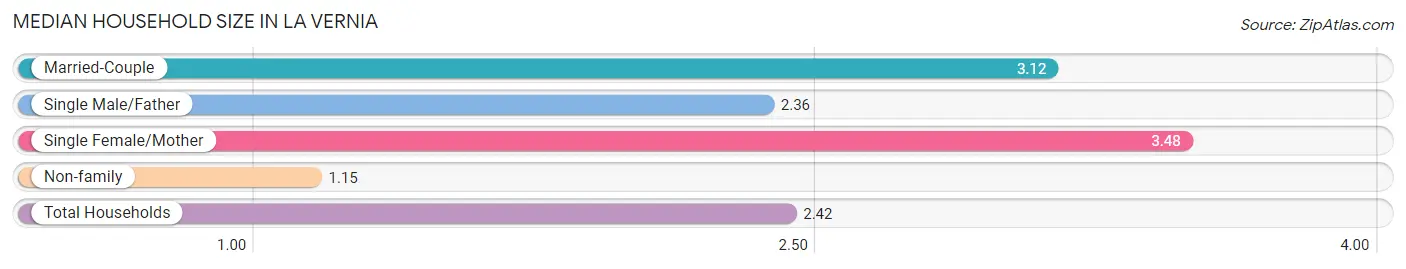
The median household size in La Vernia is 2.42 persons per household, with single female/mother households (52 | 11.0%) accounting for the largest median household size of 3.48 persons per household. non-family households (172 | 36.4%) represent the smallest median household size with 1.15 persons per household.
| Household Type | # Households | Household Size |
| Married-Couple | 234 (49.6%) | 3.12 |
| Single Male/Father | 14 (3.0%) | 2.36 |
| Single Female/Mother | 52 (11.0%) | 3.48 |
| Non-family | 172 (36.4%) | 1.15 |
| Total Households | 472 (100.0%) | 2.42 |
Household Size by Marriage Status in La Vernia
Out of a total of 472 households in La Vernia, 300 (63.6%) are family households, while 172 (36.4%) are nonfamily households. The most numerous type of family households are 2-person households, comprising 124, and the most common type of nonfamily households are 1-person households, comprising 166.
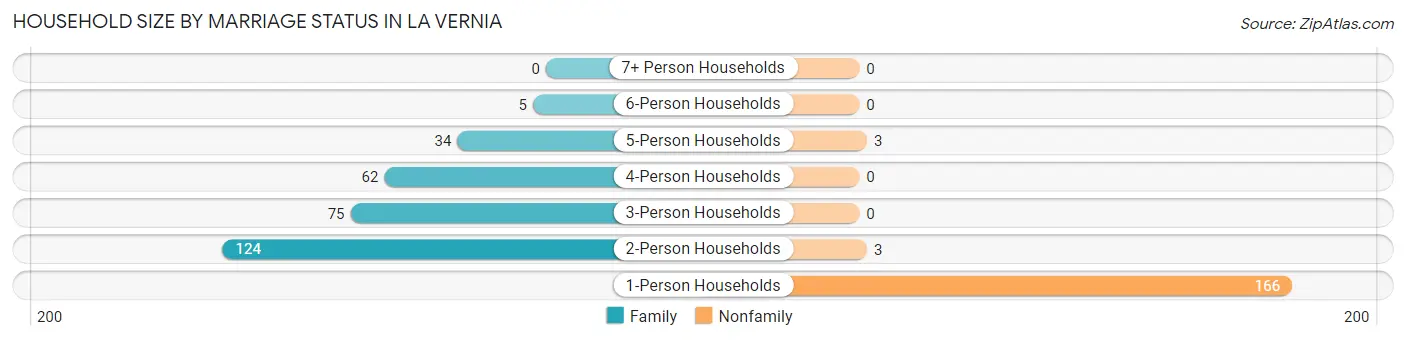
| Household Size | Family Households | Nonfamily Households |
| 1-Person Households | - | 166 (35.2%) |
| 2-Person Households | 124 (26.3%) | 3 (0.6%) |
| 3-Person Households | 75 (15.9%) | 0 (0.0%) |
| 4-Person Households | 62 (13.1%) | 0 (0.0%) |
| 5-Person Households | 34 (7.2%) | 3 (0.6%) |
| 6-Person Households | 5 (1.1%) | 0 (0.0%) |
| 7+ Person Households | 0 (0.0%) | 0 (0.0%) |
| Total | 300 (63.6%) | 172 (36.4%) |
Female Fertility in La Vernia
Fertility by Age in La Vernia
Average fertility rate in La Vernia is 83.0 births per 1,000 women. Women in the age bracket of 20 to 34 years have the highest fertility rate with 108.0 births per 1,000 women. Women in the age bracket of 20 to 34 years acount for 73.7% of all women with births.
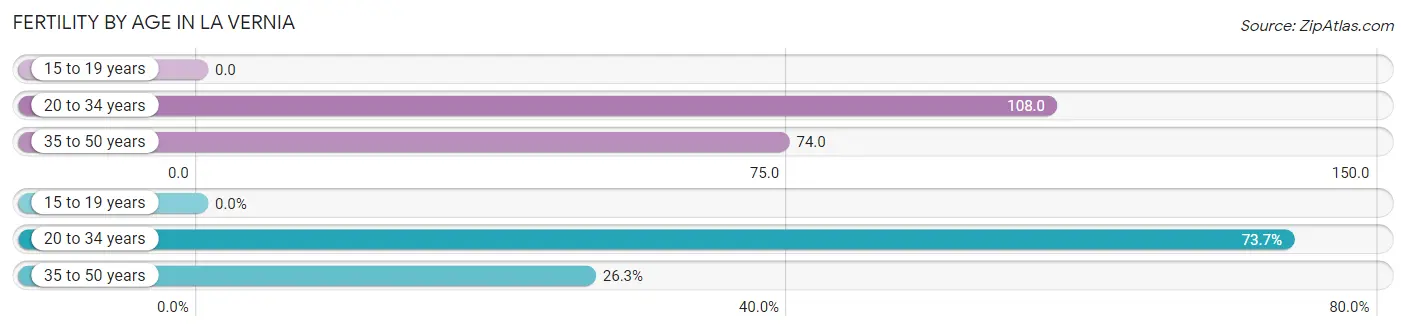
| Age Bracket | Women with Births | Births / 1,000 Women |
| 15 to 19 years | 0 (0.0%) | 0.0 |
| 20 to 34 years | 14 (73.7%) | 108.0 |
| 35 to 50 years | 5 (26.3%) | 74.0 |
| Total | 19 (100.0%) | 83.0 |
Fertility by Age by Marriage Status in La Vernia
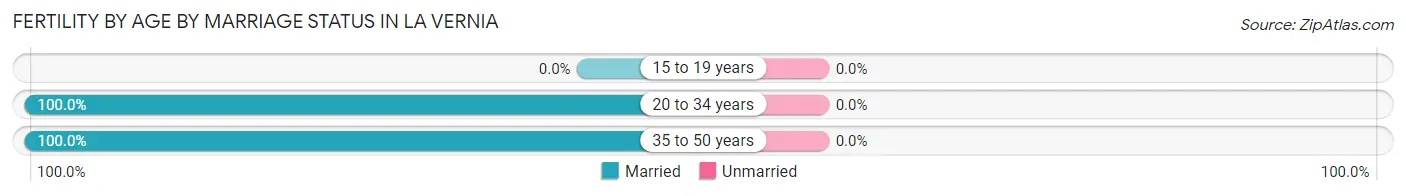
| Age Bracket | Married | Unmarried |
| 15 to 19 years | 0 (0.0%) | 0 (0.0%) |
| 20 to 34 years | 14 (100.0%) | 0 (0.0%) |
| 35 to 50 years | 5 (100.0%) | 0 (0.0%) |
| Total | 19 (100.0%) | 0 (0.0%) |
Fertility by Education in La Vernia
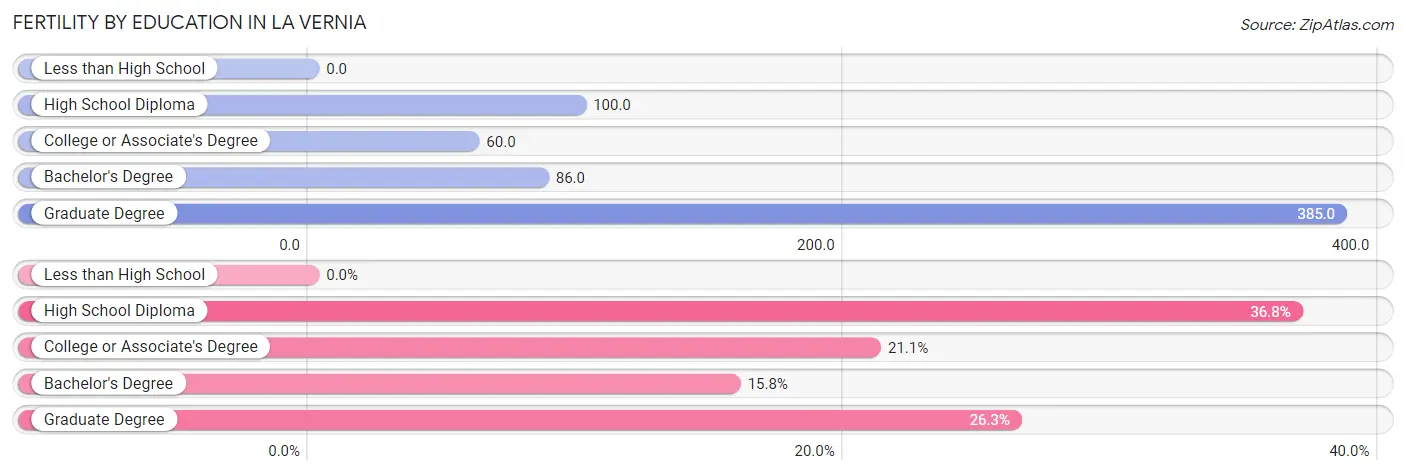
| Educational Attainment | Women with Births | Births / 1,000 Women |
| Less than High School | 0 (0.0%) | 0.0 |
| High School Diploma | 7 (36.8%) | 100.0 |
| College or Associate's Degree | 4 (21.0%) | 60.0 |
| Bachelor's Degree | 3 (15.8%) | 86.0 |
| Graduate Degree | 5 (26.3%) | 385.0 |
| Total | 19 (100.0%) | 83.0 |
Fertility by Education by Marriage Status in La Vernia
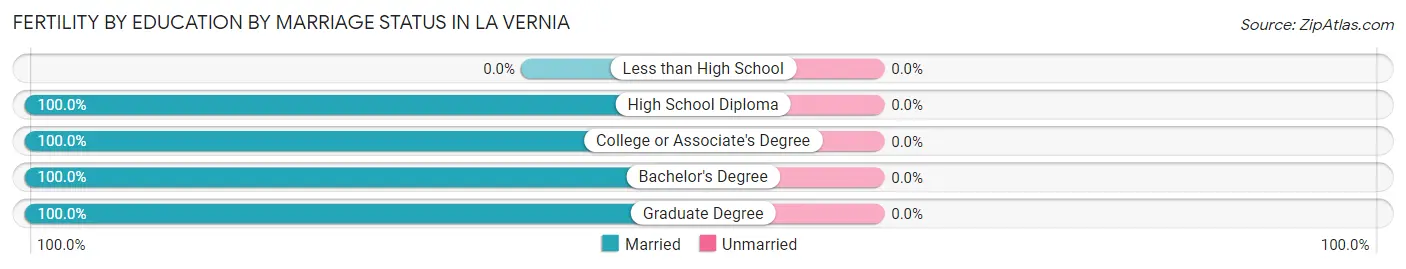
| Educational Attainment | Married | Unmarried |
| Less than High School | 0 (0.0%) | 0 (0.0%) |
| High School Diploma | 7 (100.0%) | 0 (0.0%) |
| College or Associate's Degree | 4 (100.0%) | 0 (0.0%) |
| Bachelor's Degree | 3 (100.0%) | 0 (0.0%) |
| Graduate Degree | 5 (100.0%) | 0 (0.0%) |
| Total | 19 (100.0%) | 0 (0.0%) |
Employment Characteristics in La Vernia
Employment by Class of Employer in La Vernia
Among the 514 employed individuals in La Vernia, private company employees (328 | 63.8%), local government employees (57 | 11.1%), and self-employed (not incorporated) (53 | 10.3%) make up the most common classes of employment.
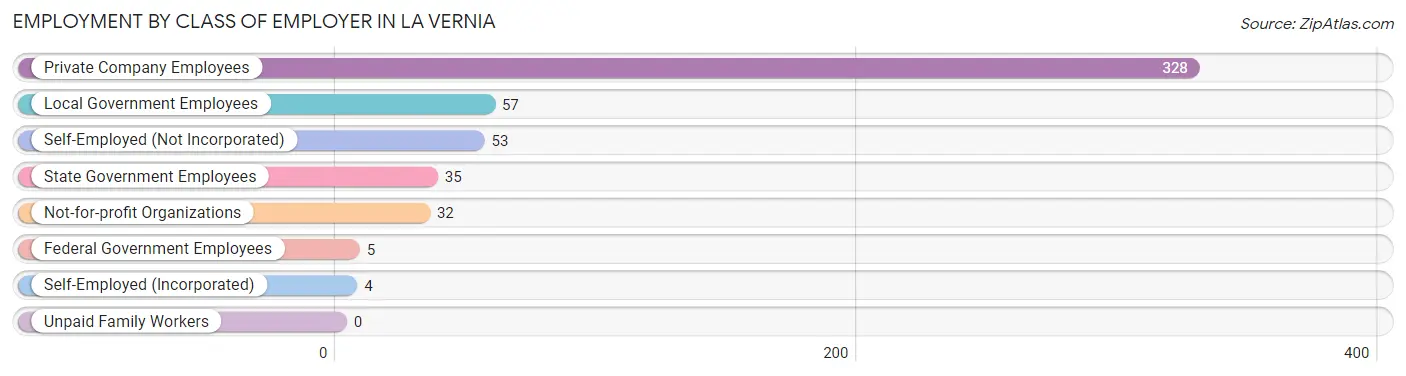
| Employer Class | # Employees | % Employees |
| Private Company Employees | 328 | 63.8% |
| Self-Employed (Incorporated) | 4 | 0.8% |
| Self-Employed (Not Incorporated) | 53 | 10.3% |
| Not-for-profit Organizations | 32 | 6.2% |
| Local Government Employees | 57 | 11.1% |
| State Government Employees | 35 | 6.8% |
| Federal Government Employees | 5 | 1.0% |
| Unpaid Family Workers | 0 | 0.0% |
| Total | 514 | 100.0% |
Employment Status by Age in La Vernia
According to the labor force statistics for La Vernia, out of the total population over 16 years of age (932), 58.2% or 542 individuals are in the labor force, with 4.6% or 25 of them unemployed. The age group with the highest labor force participation rate is 20 to 24 years, with 100.0% or 54 individuals in the labor force. Within the labor force, the 16 to 19 years age range has the highest percentage of unemployed individuals, with 29.3% or 12 of them being unemployed.
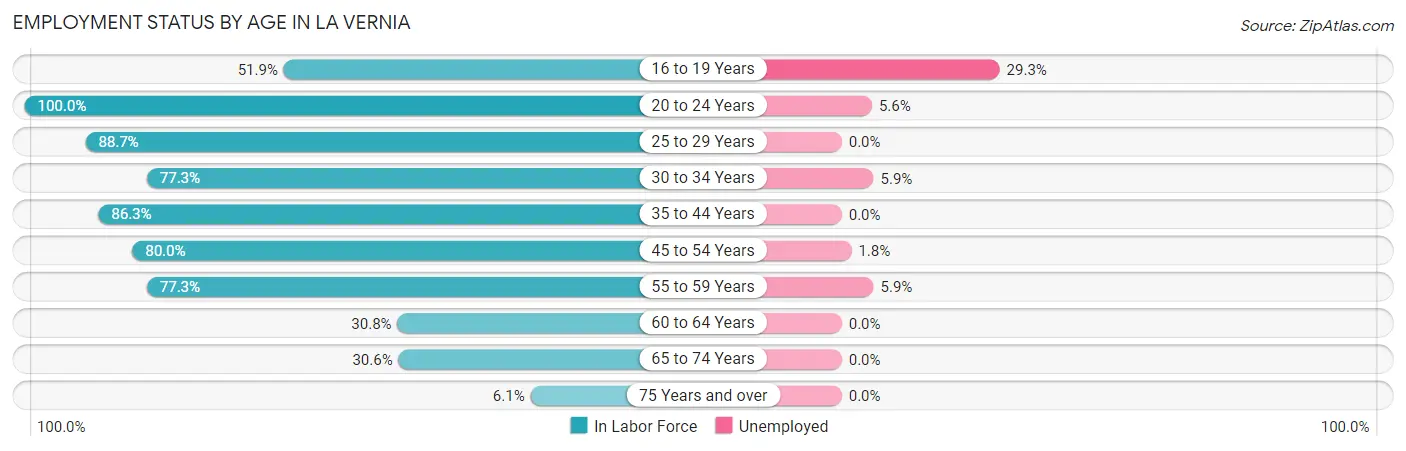
| Age Bracket | In Labor Force | Unemployed |
| 16 to 19 Years | 41 (51.9%) | 12 (29.3%) |
| 20 to 24 Years | 54 (100.0%) | 3 (5.6%) |
| 25 to 29 Years | 47 (88.7%) | 0 (0.0%) |
| 30 to 34 Years | 68 (77.3%) | 4 (5.9%) |
| 35 to 44 Years | 69 (86.3%) | 0 (0.0%) |
| 45 to 54 Years | 112 (80.0%) | 2 (1.8%) |
| 55 to 59 Years | 68 (77.3%) | 4 (5.9%) |
| 60 to 64 Years | 32 (30.8%) | 0 (0.0%) |
| 65 to 74 Years | 45 (30.6%) | 0 (0.0%) |
| 75 Years and over | 6 (6.1%) | 0 (0.0%) |
| Total | 542 (58.2%) | 25 (4.6%) |
Employment Status by Educational Attainment in La Vernia
According to labor force statistics for La Vernia, 71.6% of individuals (396) out of the total population between 25 and 64 years of age (553) are in the labor force, with 2.5% or 10 of them being unemployed. The group with the highest labor force participation rate are those with the educational attainment of less than high school, with 98.1% or 53 individuals in the labor force. Within the labor force, individuals with less than high school education have the highest percentage of unemployment, with 9.4% or 5 of them being unemployed.
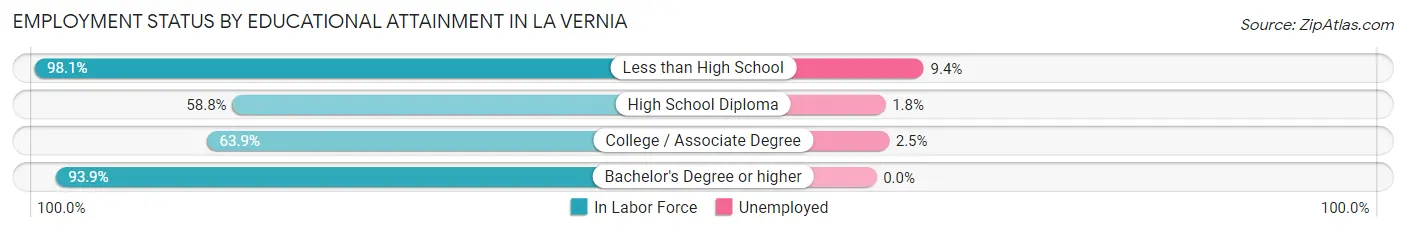
| Educational Attainment | In Labor Force | Unemployed |
| Less than High School | 53 (98.1%) | 5 (9.4%) |
| High School Diploma | 114 (58.8%) | 3 (1.8%) |
| College / Associate Degree | 122 (63.9%) | 5 (2.5%) |
| Bachelor's Degree or higher | 107 (93.9%) | 0 (0.0%) |
| Total | 396 (71.6%) | 14 (2.5%) |
Employment Occupations by Sex in La Vernia
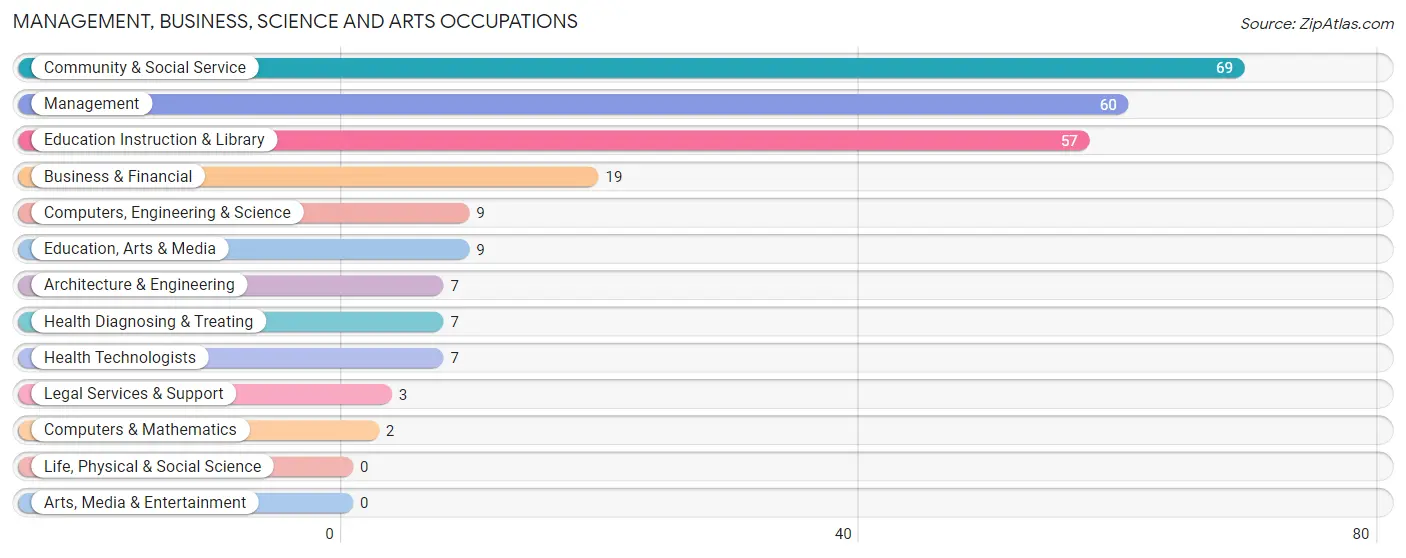
Management, Business, Science and Arts Occupations
The most common Management, Business, Science and Arts occupations in La Vernia are Community & Social Service (69 | 13.4%), Management (60 | 11.6%), Education Instruction & Library (57 | 11.0%), Business & Financial (19 | 3.7%), and Computers, Engineering & Science (9 | 1.7%).
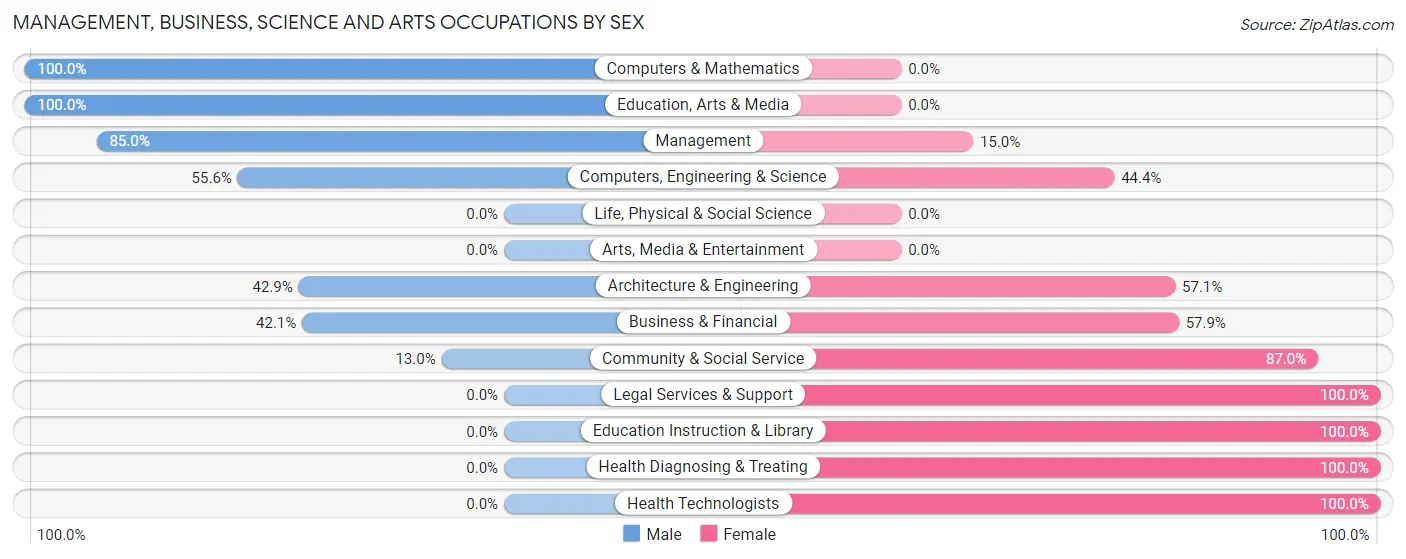
Management, Business, Science and Arts Occupations by Sex
Within the Management, Business, Science and Arts occupations in La Vernia, the most male-oriented occupations are Computers & Mathematics (100.0%), Education, Arts & Media (100.0%), and Management (85.0%), while the most female-oriented occupations are Legal Services & Support (100.0%), Education Instruction & Library (100.0%), and Health Diagnosing & Treating (100.0%).
| Occupation | Male | Female |
| Management | 51 (85.0%) | 9 (15.0%) |
| Business & Financial | 8 (42.1%) | 11 (57.9%) |
| Computers, Engineering & Science | 5 (55.6%) | 4 (44.4%) |
| Computers & Mathematics | 2 (100.0%) | 0 (0.0%) |
| Architecture & Engineering | 3 (42.9%) | 4 (57.1%) |
| Life, Physical & Social Science | 0 (0.0%) | 0 (0.0%) |
| Community & Social Service | 9 (13.0%) | 60 (87.0%) |
| Education, Arts & Media | 9 (100.0%) | 0 (0.0%) |
| Legal Services & Support | 0 (0.0%) | 3 (100.0%) |
| Education Instruction & Library | 0 (0.0%) | 57 (100.0%) |
| Arts, Media & Entertainment | 0 (0.0%) | 0 (0.0%) |
| Health Diagnosing & Treating | 0 (0.0%) | 7 (100.0%) |
| Health Technologists | 0 (0.0%) | 7 (100.0%) |
| Total (Category) | 73 (44.5%) | 91 (55.5%) |
| Total (Overall) | 261 (50.5%) | 256 (49.5%) |
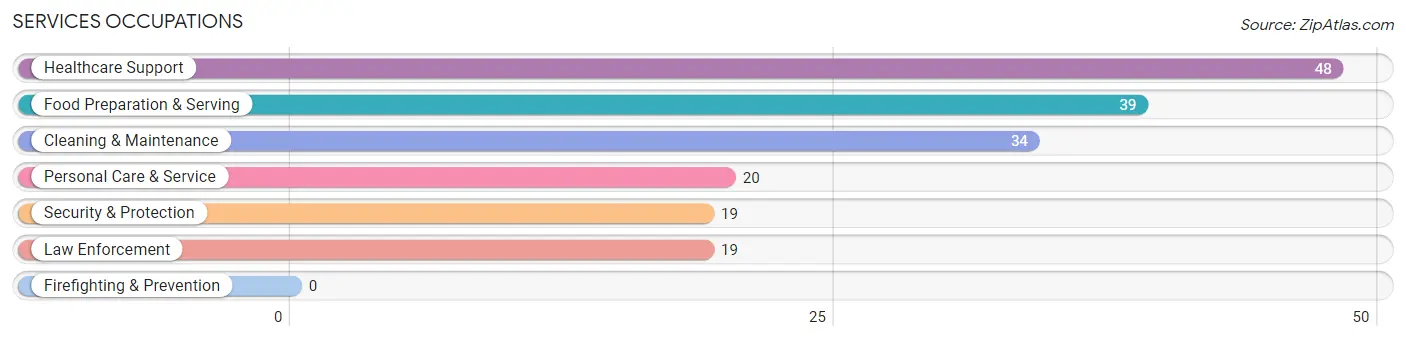
Services Occupations
The most common Services occupations in La Vernia are Healthcare Support (48 | 9.3%), Food Preparation & Serving (39 | 7.5%), Cleaning & Maintenance (34 | 6.6%), Personal Care & Service (20 | 3.9%), and Security & Protection (19 | 3.7%).
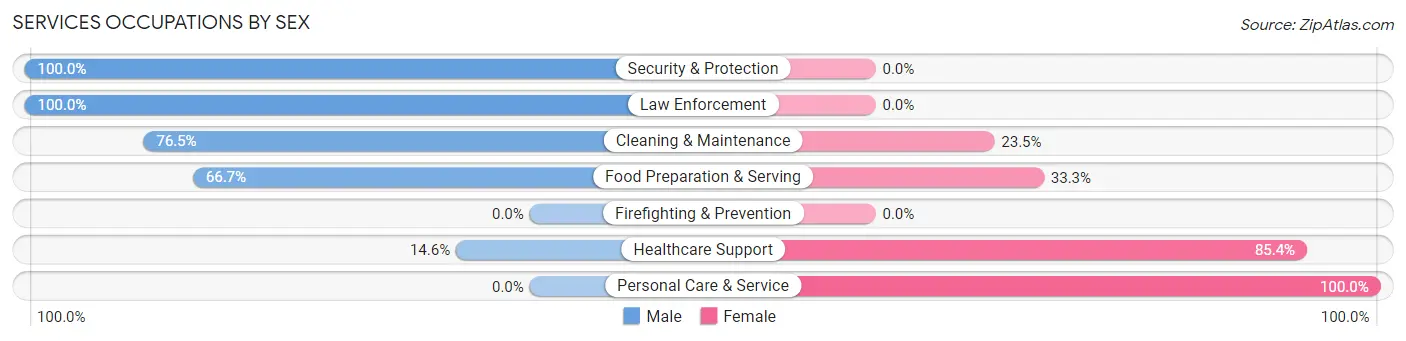
Services Occupations by Sex
Within the Services occupations in La Vernia, the most male-oriented occupations are Security & Protection (100.0%), Law Enforcement (100.0%), and Cleaning & Maintenance (76.5%), while the most female-oriented occupations are Personal Care & Service (100.0%), Healthcare Support (85.4%), and Food Preparation & Serving (33.3%).
| Occupation | Male | Female |
| Healthcare Support | 7 (14.6%) | 41 (85.4%) |
| Security & Protection | 19 (100.0%) | 0 (0.0%) |
| Firefighting & Prevention | 0 (0.0%) | 0 (0.0%) |
| Law Enforcement | 19 (100.0%) | 0 (0.0%) |
| Food Preparation & Serving | 26 (66.7%) | 13 (33.3%) |
| Cleaning & Maintenance | 26 (76.5%) | 8 (23.5%) |
| Personal Care & Service | 0 (0.0%) | 20 (100.0%) |
| Total (Category) | 78 (48.7%) | 82 (51.2%) |
| Total (Overall) | 261 (50.5%) | 256 (49.5%) |
Sales and Office Occupations
The most common Sales and Office occupations in La Vernia are Office & Administration (48 | 9.3%), and Sales & Related (16 | 3.1%).
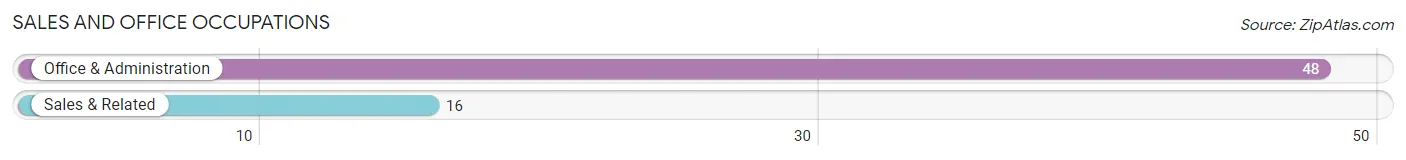
Sales and Office Occupations by Sex
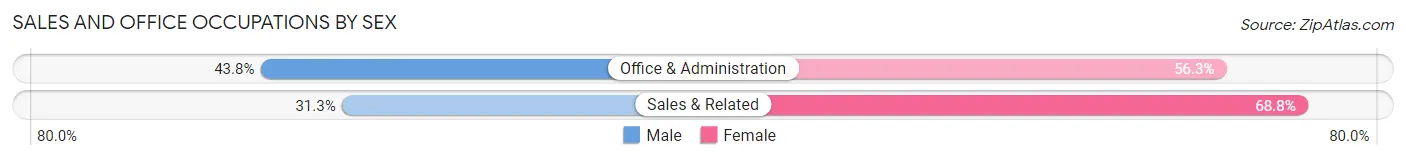
| Occupation | Male | Female |
| Sales & Related | 5 (31.2%) | 11 (68.8%) |
| Office & Administration | 21 (43.8%) | 27 (56.2%) |
| Total (Category) | 26 (40.6%) | 38 (59.4%) |
| Total (Overall) | 261 (50.5%) | 256 (49.5%) |
Natural Resources, Construction and Maintenance Occupations
The most common Natural Resources, Construction and Maintenance occupations in La Vernia are Construction & Extraction (43 | 8.3%), and Installation, Maintenance & Repair (28 | 5.4%).
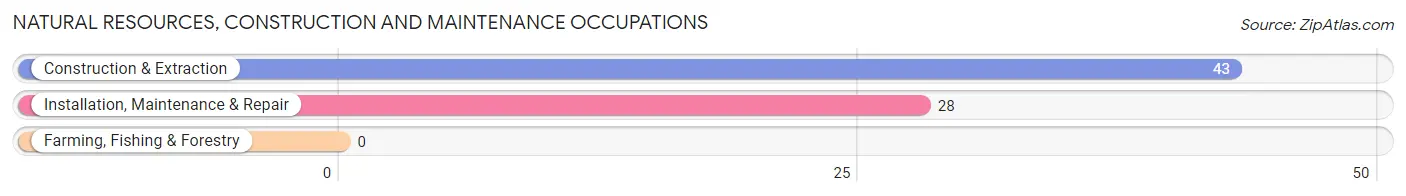
Natural Resources, Construction and Maintenance Occupations by Sex
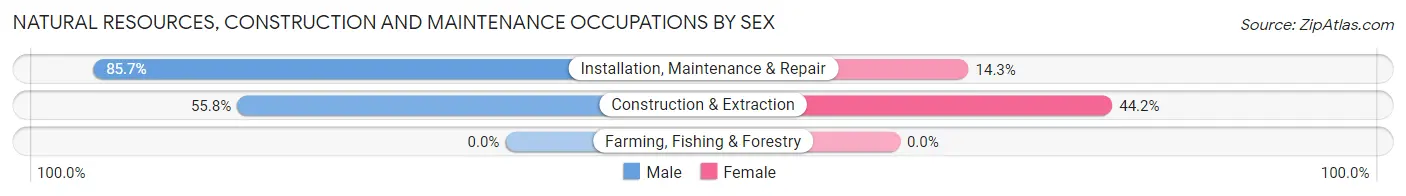
| Occupation | Male | Female |
| Farming, Fishing & Forestry | 0 (0.0%) | 0 (0.0%) |
| Construction & Extraction | 24 (55.8%) | 19 (44.2%) |
| Installation, Maintenance & Repair | 24 (85.7%) | 4 (14.3%) |
| Total (Category) | 48 (67.6%) | 23 (32.4%) |
| Total (Overall) | 261 (50.5%) | 256 (49.5%) |
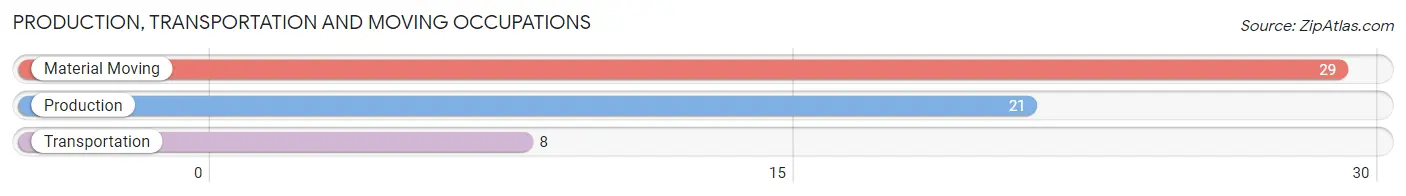
Production, Transportation and Moving Occupations
The most common Production, Transportation and Moving occupations in La Vernia are Material Moving (29 | 5.6%), Production (21 | 4.1%), and Transportation (8 | 1.5%).
Production, Transportation and Moving Occupations by Sex
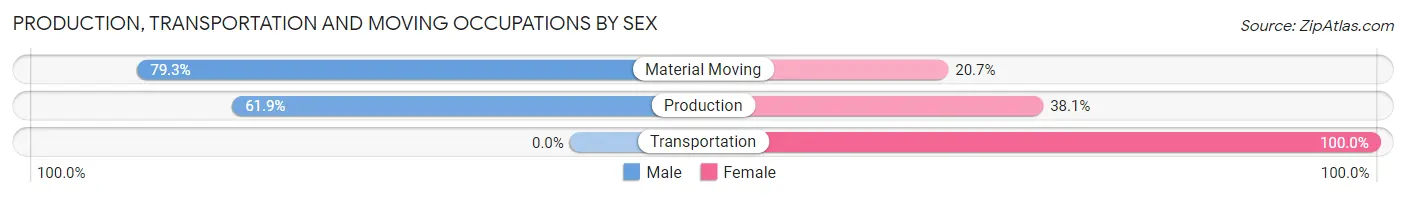
| Occupation | Male | Female |
| Production | 13 (61.9%) | 8 (38.1%) |
| Transportation | 0 (0.0%) | 8 (100.0%) |
| Material Moving | 23 (79.3%) | 6 (20.7%) |
| Total (Category) | 36 (62.1%) | 22 (37.9%) |
| Total (Overall) | 261 (50.5%) | 256 (49.5%) |
Employment Industries by Sex in La Vernia
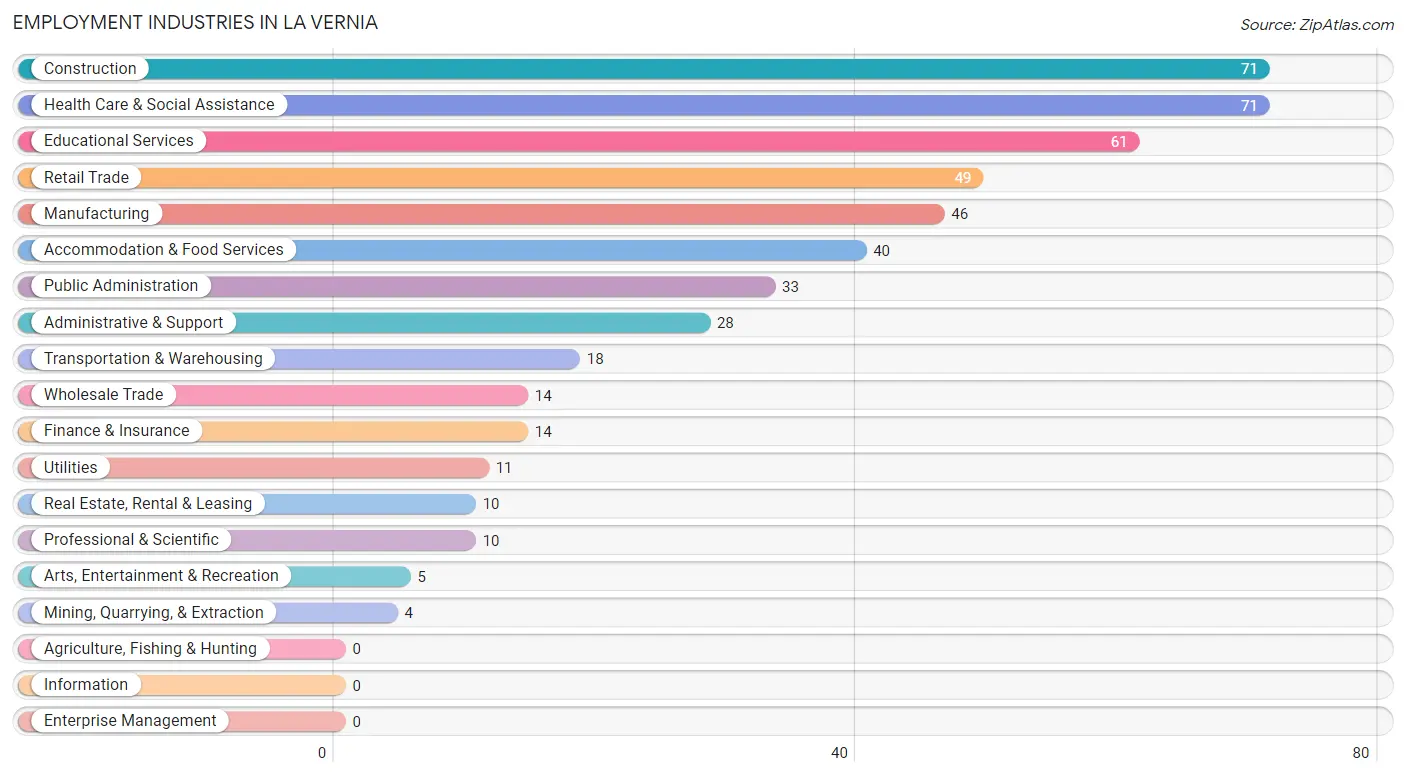
Employment Industries in La Vernia
The major employment industries in La Vernia include Construction (71 | 13.7%), Health Care & Social Assistance (71 | 13.7%), Educational Services (61 | 11.8%), Retail Trade (49 | 9.5%), and Manufacturing (46 | 8.9%).
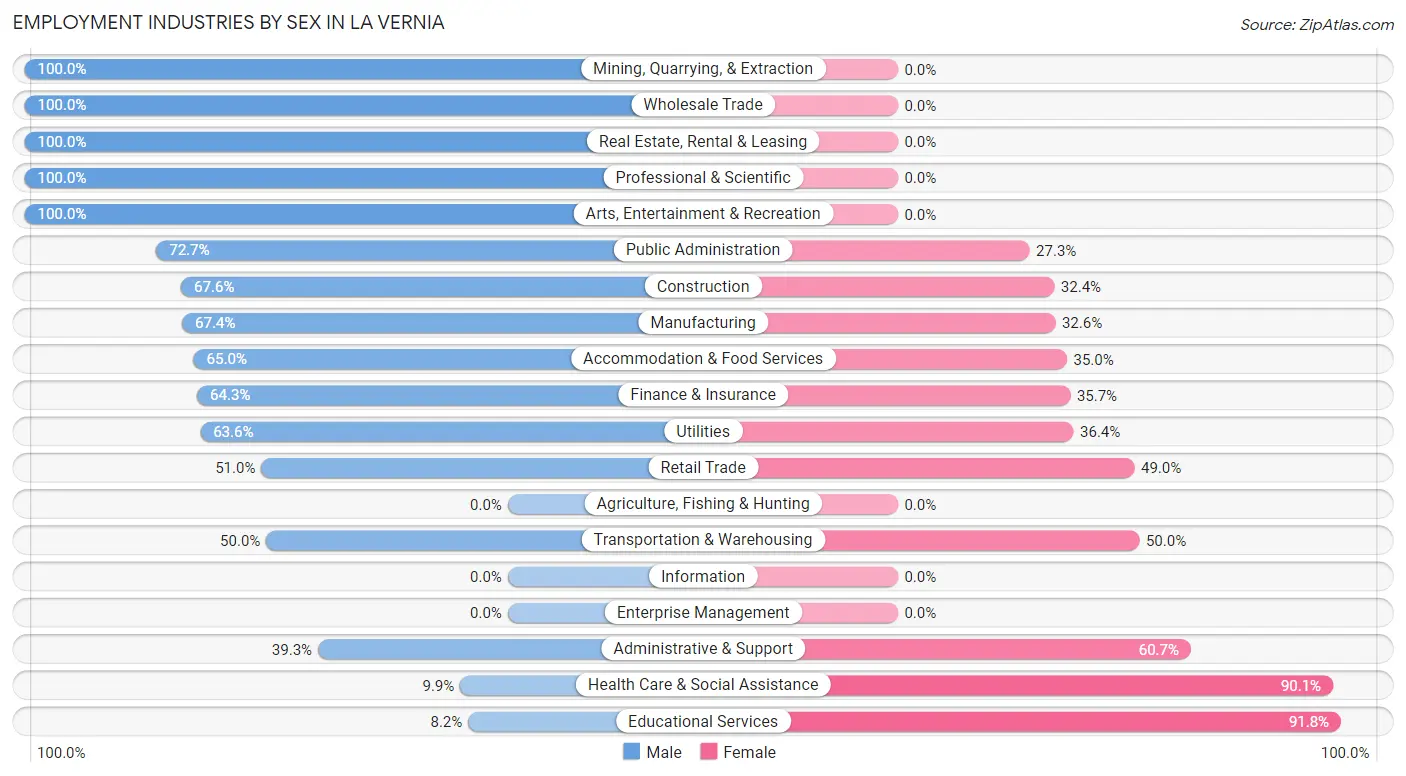
Employment Industries by Sex in La Vernia
The La Vernia industries that see more men than women are Mining, Quarrying, & Extraction (100.0%), Wholesale Trade (100.0%), and Real Estate, Rental & Leasing (100.0%), whereas the industries that tend to have a higher number of women are Educational Services (91.8%), Health Care & Social Assistance (90.1%), and Administrative & Support (60.7%).
| Industry | Male | Female |
| Agriculture, Fishing & Hunting | 0 (0.0%) | 0 (0.0%) |
| Mining, Quarrying, & Extraction | 4 (100.0%) | 0 (0.0%) |
| Construction | 48 (67.6%) | 23 (32.4%) |
| Manufacturing | 31 (67.4%) | 15 (32.6%) |
| Wholesale Trade | 14 (100.0%) | 0 (0.0%) |
| Retail Trade | 25 (51.0%) | 24 (49.0%) |
| Transportation & Warehousing | 9 (50.0%) | 9 (50.0%) |
| Utilities | 7 (63.6%) | 4 (36.4%) |
| Information | 0 (0.0%) | 0 (0.0%) |
| Finance & Insurance | 9 (64.3%) | 5 (35.7%) |
| Real Estate, Rental & Leasing | 10 (100.0%) | 0 (0.0%) |
| Professional & Scientific | 10 (100.0%) | 0 (0.0%) |
| Enterprise Management | 0 (0.0%) | 0 (0.0%) |
| Administrative & Support | 11 (39.3%) | 17 (60.7%) |
| Educational Services | 5 (8.2%) | 56 (91.8%) |
| Health Care & Social Assistance | 7 (9.9%) | 64 (90.1%) |
| Arts, Entertainment & Recreation | 5 (100.0%) | 0 (0.0%) |
| Accommodation & Food Services | 26 (65.0%) | 14 (35.0%) |
| Public Administration | 24 (72.7%) | 9 (27.3%) |
| Total | 261 (50.5%) | 256 (49.5%) |
Education in La Vernia
School Enrollment in La Vernia
The most common levels of schooling among the 214 students in La Vernia are middle school (63 | 29.4%), high school (62 | 29.0%), and elementary school (46 | 21.5%).
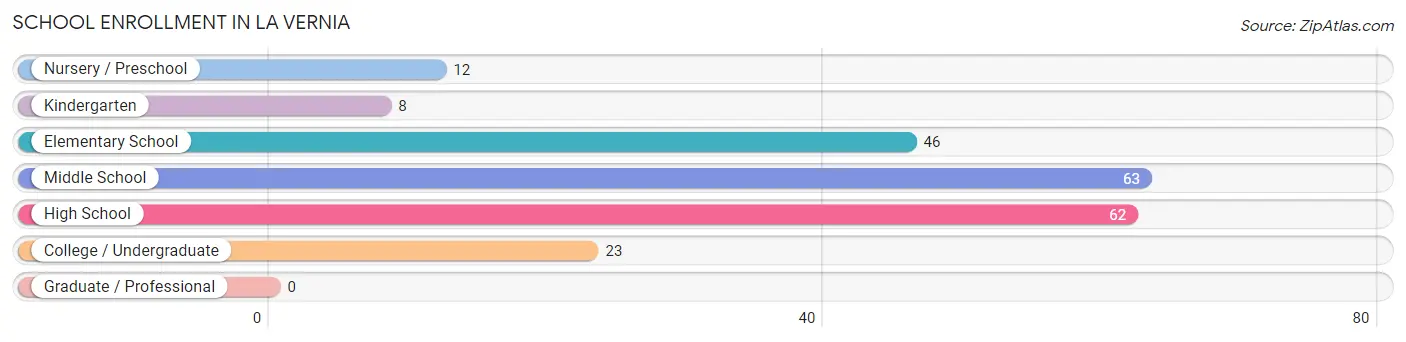
| School Level | # Students | % Students |
| Nursery / Preschool | 12 | 5.6% |
| Kindergarten | 8 | 3.7% |
| Elementary School | 46 | 21.5% |
| Middle School | 63 | 29.4% |
| High School | 62 | 29.0% |
| College / Undergraduate | 23 | 10.7% |
| Graduate / Professional | 0 | 0.0% |
| Total | 214 | 100.0% |
School Enrollment by Age by Funding Source in La Vernia
Out of a total of 214 students who are enrolled in schools in La Vernia, 32 (15.0%) attend a private institution, while the remaining 182 (85.0%) are enrolled in public schools. The age group of 25 to 34 year olds has the highest likelihood of being enrolled in private schools, with 3 (100.0% in the age bracket) enrolled. Conversely, the age group of 15 to 17 year olds has the lowest likelihood of being enrolled in a private school, with 38 (100.0% in the age bracket) attending a public institution.
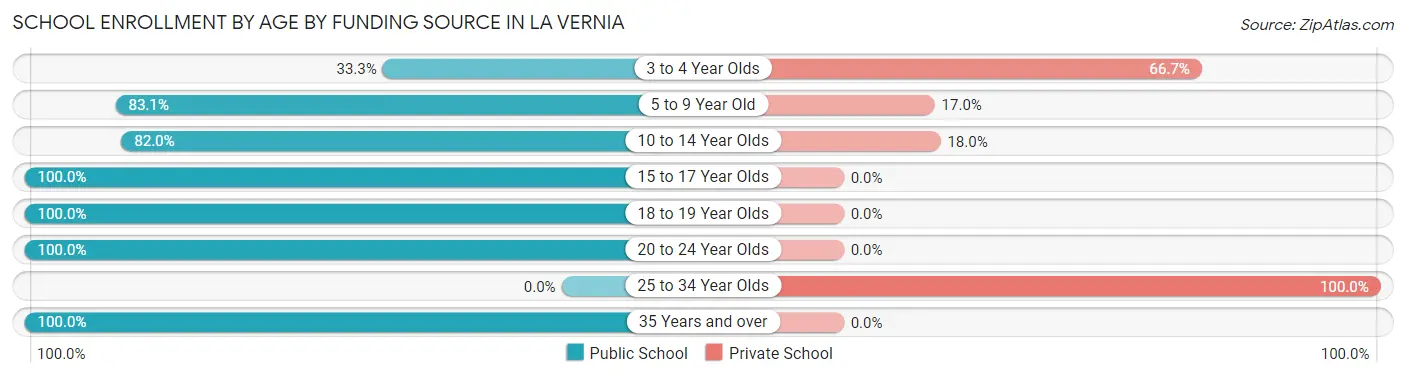
| Age Bracket | Public School | Private School |
| 3 to 4 Year Olds | 4 (33.3%) | 8 (66.7%) |
| 5 to 9 Year Old | 49 (83.1%) | 10 (17.0%) |
| 10 to 14 Year Olds | 50 (82.0%) | 11 (18.0%) |
| 15 to 17 Year Olds | 38 (100.0%) | 0 (0.0%) |
| 18 to 19 Year Olds | 21 (100.0%) | 0 (0.0%) |
| 20 to 24 Year Olds | 13 (100.0%) | 0 (0.0%) |
| 25 to 34 Year Olds | 0 (0.0%) | 3 (100.0%) |
| 35 Years and over | 7 (100.0%) | 0 (0.0%) |
| Total | 182 (85.0%) | 32 (15.0%) |
Educational Attainment by Field of Study in La Vernia
Engineering (29 | 16.4%), education (29 | 16.4%), psychology (26 | 14.7%), business (24 | 13.6%), and arts & humanities (22 | 12.4%) are the most common fields of study among 177 individuals in La Vernia who have obtained a bachelor's degree or higher.
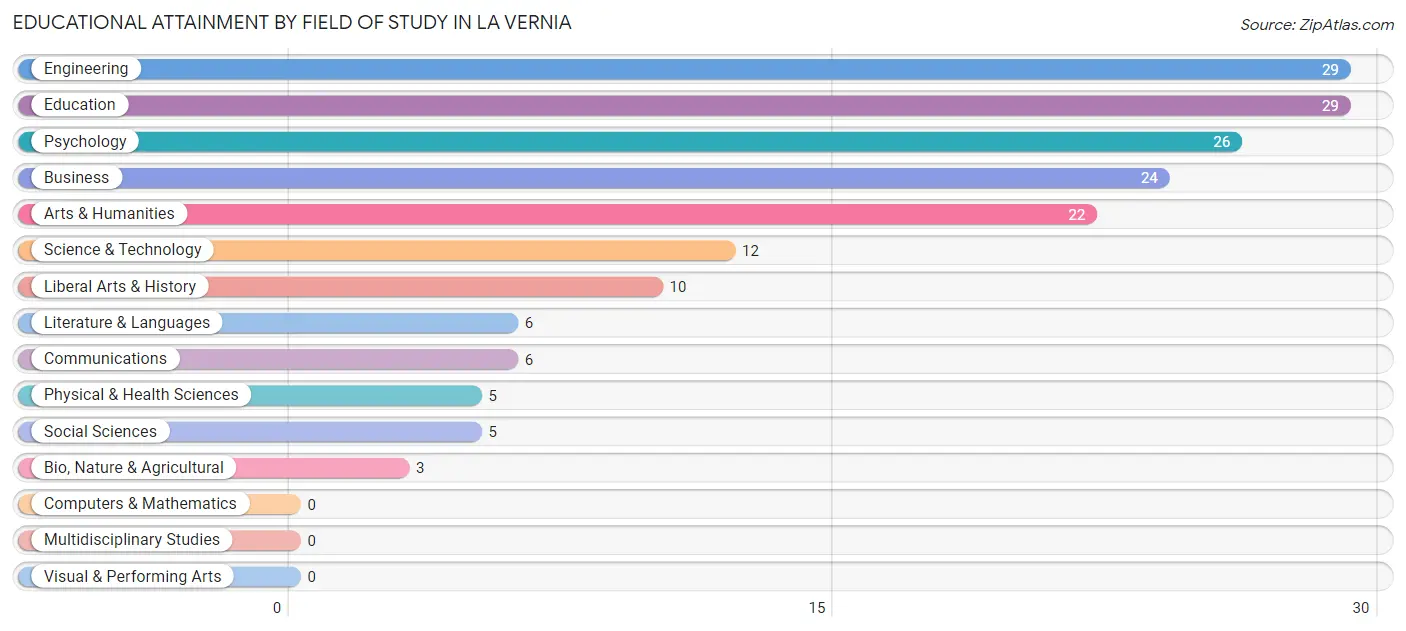
| Field of Study | # Graduates | % Graduates |
| Computers & Mathematics | 0 | 0.0% |
| Bio, Nature & Agricultural | 3 | 1.7% |
| Physical & Health Sciences | 5 | 2.8% |
| Psychology | 26 | 14.7% |
| Social Sciences | 5 | 2.8% |
| Engineering | 29 | 16.4% |
| Multidisciplinary Studies | 0 | 0.0% |
| Science & Technology | 12 | 6.8% |
| Business | 24 | 13.6% |
| Education | 29 | 16.4% |
| Literature & Languages | 6 | 3.4% |
| Liberal Arts & History | 10 | 5.7% |
| Visual & Performing Arts | 0 | 0.0% |
| Communications | 6 | 3.4% |
| Arts & Humanities | 22 | 12.4% |
| Total | 177 | 100.0% |
Transportation & Commute in La Vernia
Vehicle Availability by Sex in La Vernia
The most prevalent vehicle ownership categories in La Vernia are males with 2 vehicles (114, accounting for 44.2%) and females with 2 vehicles (107, making up 44.5%).
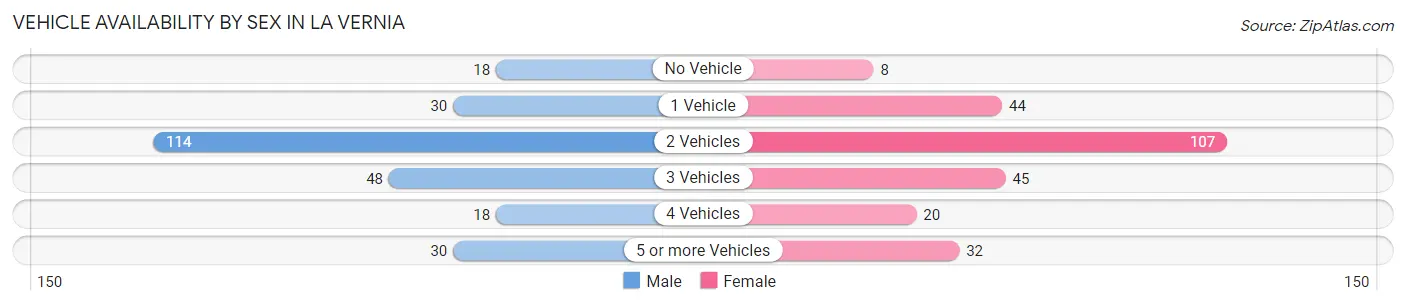
| Vehicles Available | Male | Female |
| No Vehicle | 18 (7.0%) | 8 (3.1%) |
| 1 Vehicle | 30 (11.6%) | 44 (17.2%) |
| 2 Vehicles | 114 (44.2%) | 107 (41.8%) |
| 3 Vehicles | 48 (18.6%) | 45 (17.6%) |
| 4 Vehicles | 18 (7.0%) | 20 (7.8%) |
| 5 or more Vehicles | 30 (11.6%) | 32 (12.5%) |
| Total | 258 (100.0%) | 256 (100.0%) |
Commute Time in La Vernia
The most frequently occuring commute durations in La Vernia are 45 to 59 minutes (105 commuters, 22.3%), 30 to 34 minutes (99 commuters, 21.1%), and 5 to 9 minutes (56 commuters, 11.9%).
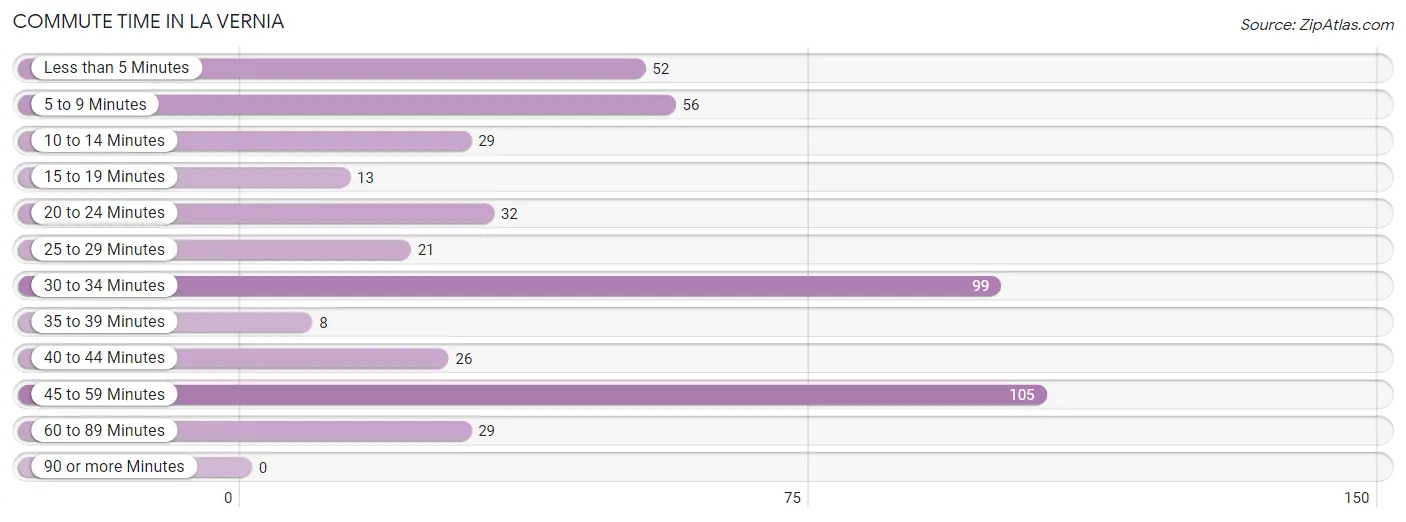
| Commute Time | # Commuters | % Commuters |
| Less than 5 Minutes | 52 | 11.1% |
| 5 to 9 Minutes | 56 | 11.9% |
| 10 to 14 Minutes | 29 | 6.2% |
| 15 to 19 Minutes | 13 | 2.8% |
| 20 to 24 Minutes | 32 | 6.8% |
| 25 to 29 Minutes | 21 | 4.5% |
| 30 to 34 Minutes | 99 | 21.1% |
| 35 to 39 Minutes | 8 | 1.7% |
| 40 to 44 Minutes | 26 | 5.5% |
| 45 to 59 Minutes | 105 | 22.3% |
| 60 to 89 Minutes | 29 | 6.2% |
| 90 or more Minutes | 0 | 0.0% |
Commute Time by Sex in La Vernia
The most common commute times in La Vernia are 45 to 59 minutes (68 commuters, 27.0%) for males and 30 to 34 minutes (51 commuters, 23.4%) for females.
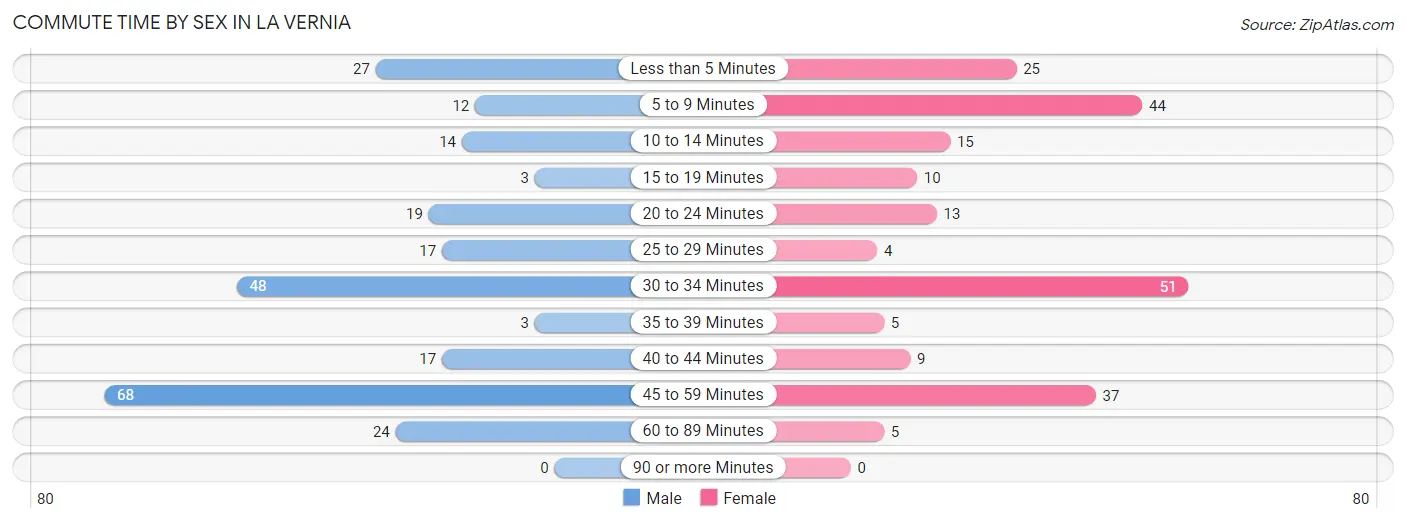
| Commute Time | Male | Female |
| Less than 5 Minutes | 27 (10.7%) | 25 (11.5%) |
| 5 to 9 Minutes | 12 (4.8%) | 44 (20.2%) |
| 10 to 14 Minutes | 14 (5.6%) | 15 (6.9%) |
| 15 to 19 Minutes | 3 (1.2%) | 10 (4.6%) |
| 20 to 24 Minutes | 19 (7.5%) | 13 (6.0%) |
| 25 to 29 Minutes | 17 (6.8%) | 4 (1.8%) |
| 30 to 34 Minutes | 48 (19.1%) | 51 (23.4%) |
| 35 to 39 Minutes | 3 (1.2%) | 5 (2.3%) |
| 40 to 44 Minutes | 17 (6.8%) | 9 (4.1%) |
| 45 to 59 Minutes | 68 (27.0%) | 37 (17.0%) |
| 60 to 89 Minutes | 24 (9.5%) | 5 (2.3%) |
| 90 or more Minutes | 0 (0.0%) | 0 (0.0%) |
Time of Departure to Work by Sex in La Vernia
The most frequent times of departure to work in La Vernia are 6:00 AM to 6:29 AM (80, 31.8%) for males and 7:30 AM to 7:59 AM (61, 28.0%) for females.
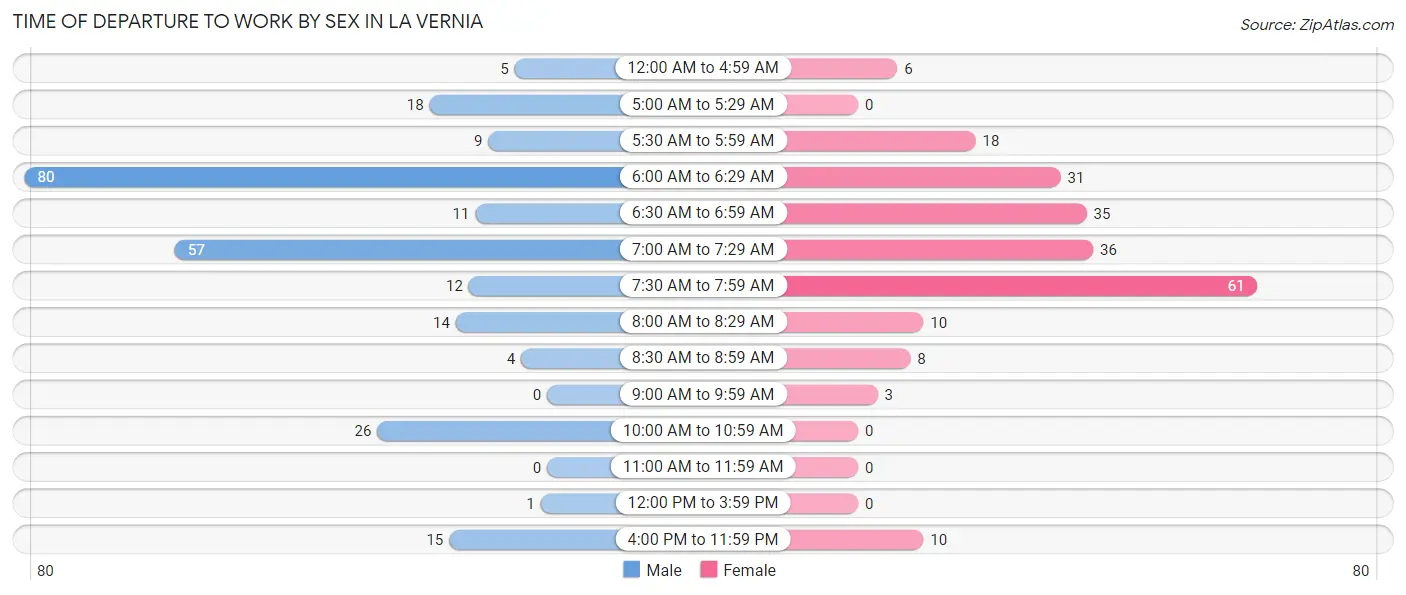
| Time of Departure | Male | Female |
| 12:00 AM to 4:59 AM | 5 (2.0%) | 6 (2.8%) |
| 5:00 AM to 5:29 AM | 18 (7.1%) | 0 (0.0%) |
| 5:30 AM to 5:59 AM | 9 (3.6%) | 18 (8.3%) |
| 6:00 AM to 6:29 AM | 80 (31.8%) | 31 (14.2%) |
| 6:30 AM to 6:59 AM | 11 (4.4%) | 35 (16.1%) |
| 7:00 AM to 7:29 AM | 57 (22.6%) | 36 (16.5%) |
| 7:30 AM to 7:59 AM | 12 (4.8%) | 61 (28.0%) |
| 8:00 AM to 8:29 AM | 14 (5.6%) | 10 (4.6%) |
| 8:30 AM to 8:59 AM | 4 (1.6%) | 8 (3.7%) |
| 9:00 AM to 9:59 AM | 0 (0.0%) | 3 (1.4%) |
| 10:00 AM to 10:59 AM | 26 (10.3%) | 0 (0.0%) |
| 11:00 AM to 11:59 AM | 0 (0.0%) | 0 (0.0%) |
| 12:00 PM to 3:59 PM | 1 (0.4%) | 0 (0.0%) |
| 4:00 PM to 11:59 PM | 15 (5.9%) | 10 (4.6%) |
| Total | 252 (100.0%) | 218 (100.0%) |
Housing Occupancy in La Vernia
Occupancy by Ownership in La Vernia
Of the total 472 dwellings in La Vernia, owner-occupied units account for 248 (52.5%), while renter-occupied units make up 224 (47.5%).
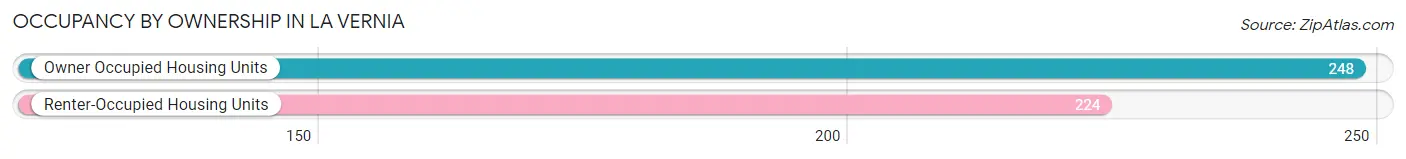
| Occupancy | # Housing Units | % Housing Units |
| Owner Occupied Housing Units | 248 | 52.5% |
| Renter-Occupied Housing Units | 224 | 47.5% |
| Total Occupied Housing Units | 472 | 100.0% |
Occupancy by Household Size in La Vernia
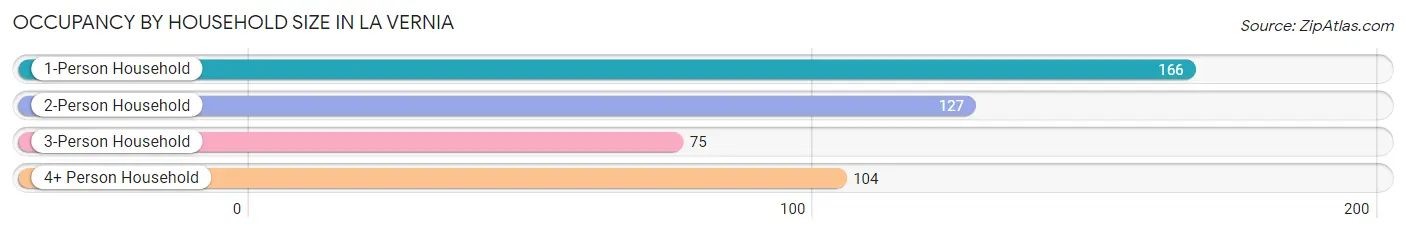
| Household Size | # Housing Units | % Housing Units |
| 1-Person Household | 166 | 35.2% |
| 2-Person Household | 127 | 26.9% |
| 3-Person Household | 75 | 15.9% |
| 4+ Person Household | 104 | 22.0% |
| Total Housing Units | 472 | 100.0% |
Occupancy by Ownership by Household Size in La Vernia
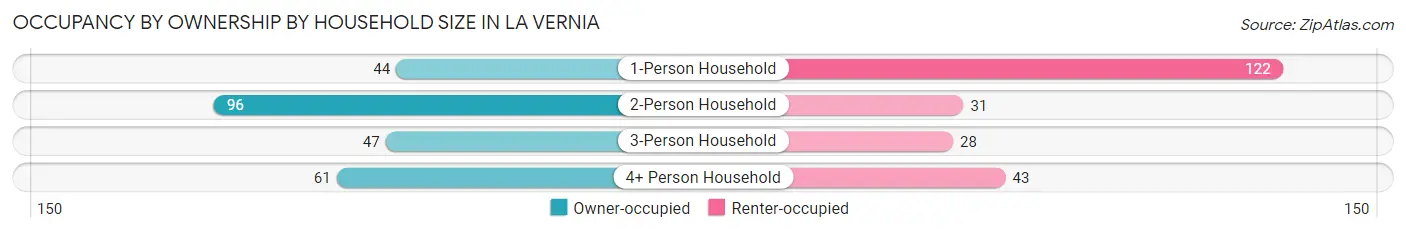
| Household Size | Owner-occupied | Renter-occupied |
| 1-Person Household | 44 (26.5%) | 122 (73.5%) |
| 2-Person Household | 96 (75.6%) | 31 (24.4%) |
| 3-Person Household | 47 (62.7%) | 28 (37.3%) |
| 4+ Person Household | 61 (58.7%) | 43 (41.3%) |
| Total Housing Units | 248 (52.5%) | 224 (47.5%) |
Occupancy by Educational Attainment in La Vernia
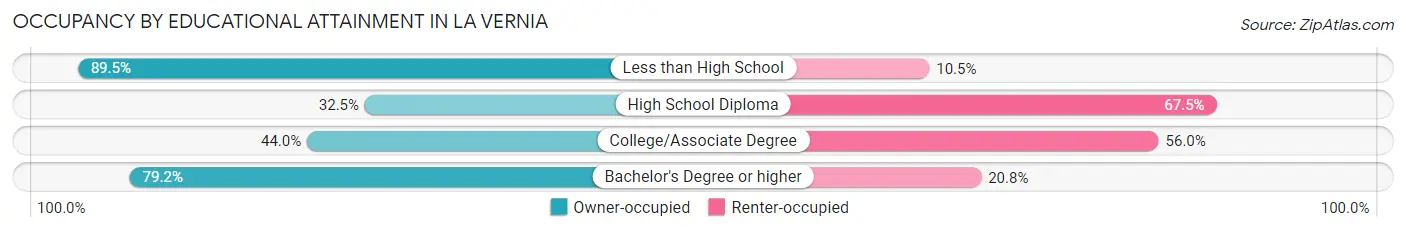
| Household Size | Owner-occupied | Renter-occupied |
| Less than High School | 51 (89.5%) | 6 (10.5%) |
| High School Diploma | 55 (32.5%) | 114 (67.5%) |
| College/Associate Degree | 66 (44.0%) | 84 (56.0%) |
| Bachelor's Degree or higher | 76 (79.2%) | 20 (20.8%) |
Occupancy by Age of Householder in La Vernia
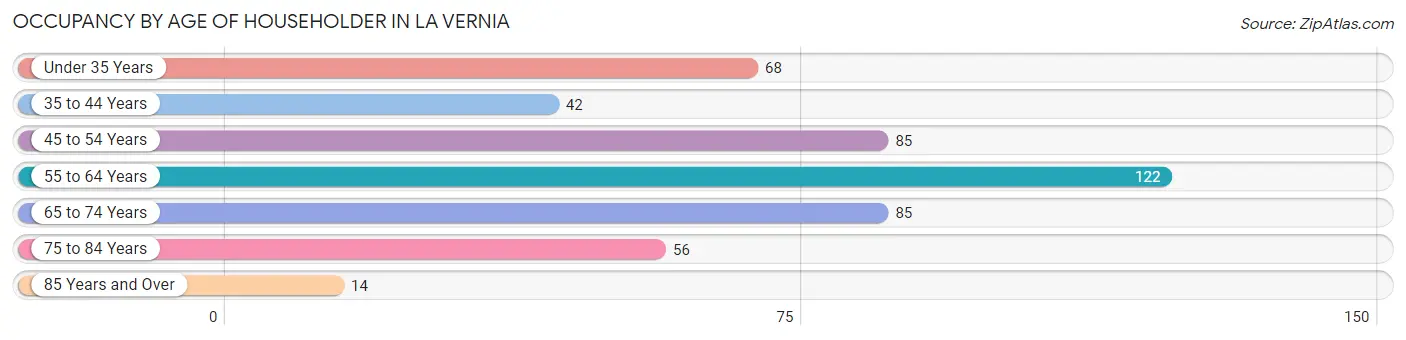
| Age Bracket | # Households | % Households |
| Under 35 Years | 68 | 14.4% |
| 35 to 44 Years | 42 | 8.9% |
| 45 to 54 Years | 85 | 18.0% |
| 55 to 64 Years | 122 | 25.9% |
| 65 to 74 Years | 85 | 18.0% |
| 75 to 84 Years | 56 | 11.9% |
| 85 Years and Over | 14 | 3.0% |
| Total | 472 | 100.0% |
Housing Finances in La Vernia
Median Income by Occupancy in La Vernia
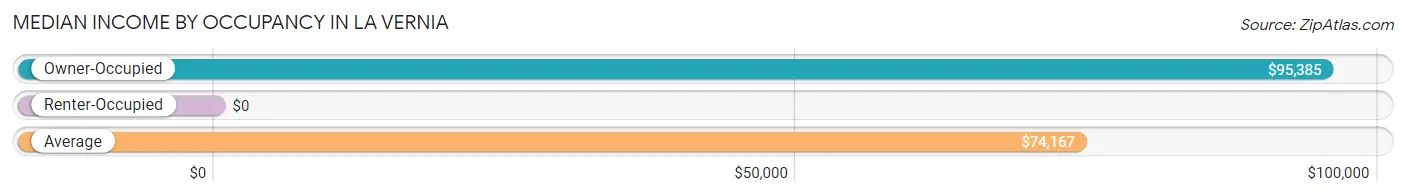
| Occupancy Type | # Households | Median Income |
| Owner-Occupied | 248 (52.5%) | $95,385 |
| Renter-Occupied | 224 (47.5%) | $0 |
| Average | 472 (100.0%) | $74,167 |
Occupancy by Householder Income Bracket in La Vernia
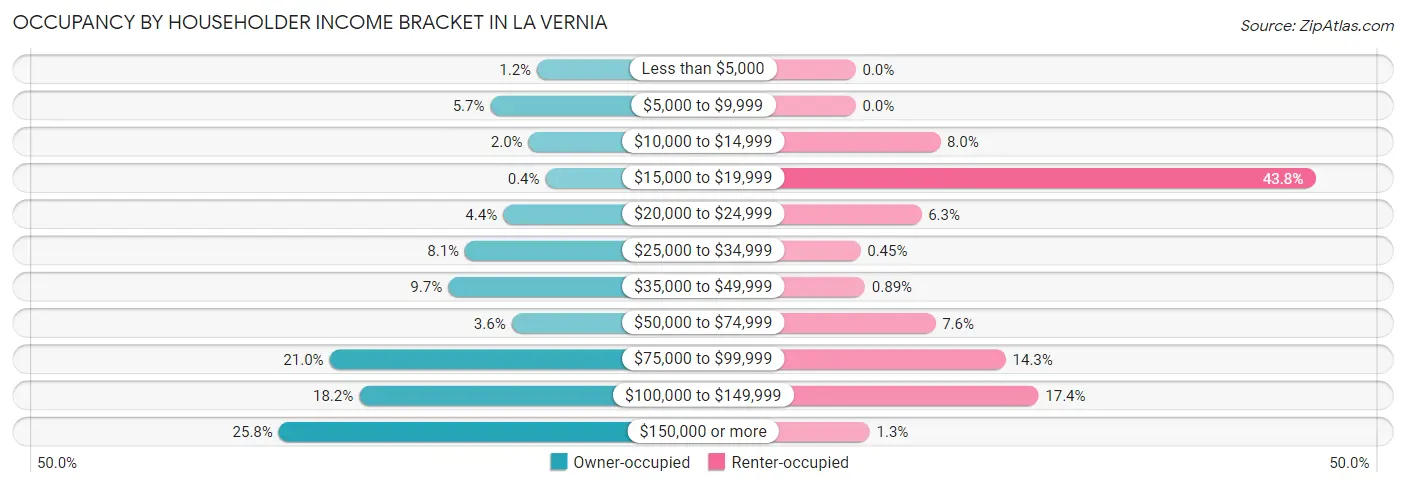
| Income Bracket | Owner-occupied | Renter-occupied |
| Less than $5,000 | 3 (1.2%) | 0 (0.0%) |
| $5,000 to $9,999 | 14 (5.7%) | 0 (0.0%) |
| $10,000 to $14,999 | 5 (2.0%) | 18 (8.0%) |
| $15,000 to $19,999 | 1 (0.4%) | 98 (43.8%) |
| $20,000 to $24,999 | 11 (4.4%) | 14 (6.2%) |
| $25,000 to $34,999 | 20 (8.1%) | 1 (0.4%) |
| $35,000 to $49,999 | 24 (9.7%) | 2 (0.9%) |
| $50,000 to $74,999 | 9 (3.6%) | 17 (7.6%) |
| $75,000 to $99,999 | 52 (21.0%) | 32 (14.3%) |
| $100,000 to $149,999 | 45 (18.1%) | 39 (17.4%) |
| $150,000 or more | 64 (25.8%) | 3 (1.3%) |
| Total | 248 (100.0%) | 224 (100.0%) |
Monthly Housing Cost Tiers in La Vernia
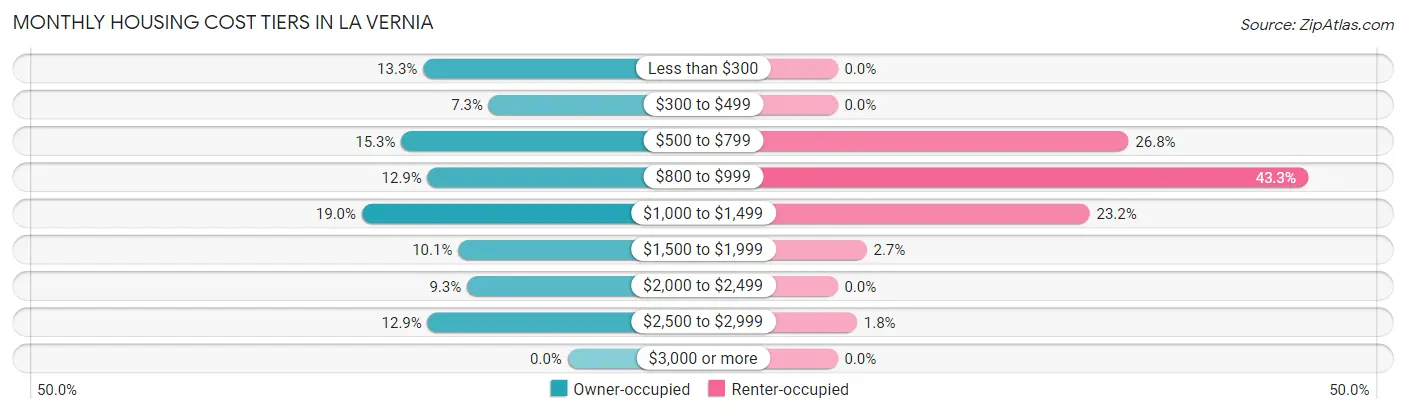
| Monthly Cost | Owner-occupied | Renter-occupied |
| Less than $300 | 33 (13.3%) | 0 (0.0%) |
| $300 to $499 | 18 (7.3%) | 0 (0.0%) |
| $500 to $799 | 38 (15.3%) | 60 (26.8%) |
| $800 to $999 | 32 (12.9%) | 97 (43.3%) |
| $1,000 to $1,499 | 47 (19.0%) | 52 (23.2%) |
| $1,500 to $1,999 | 25 (10.1%) | 6 (2.7%) |
| $2,000 to $2,499 | 23 (9.3%) | 0 (0.0%) |
| $2,500 to $2,999 | 32 (12.9%) | 4 (1.8%) |
| $3,000 or more | 0 (0.0%) | 0 (0.0%) |
| Total | 248 (100.0%) | 224 (100.0%) |
Physical Housing Characteristics in La Vernia
Housing Structures in La Vernia
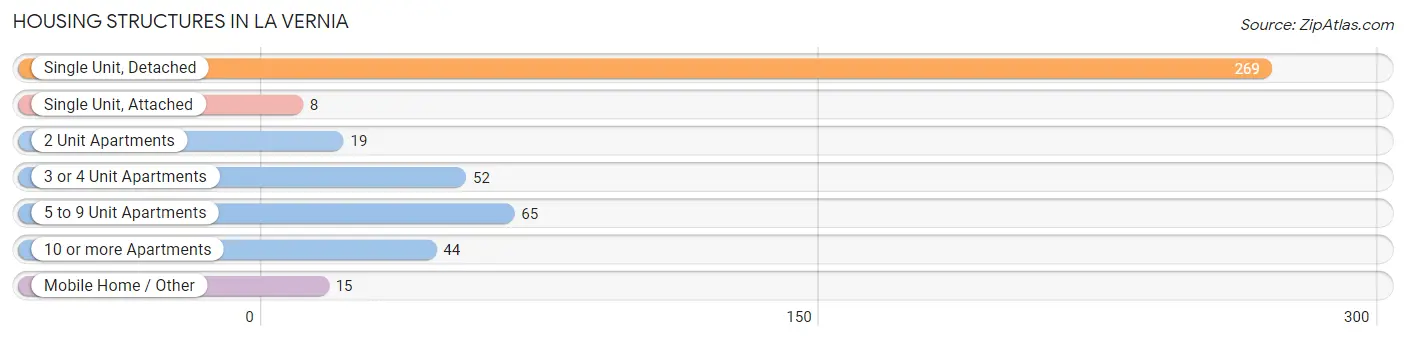
| Structure Type | # Housing Units | % Housing Units |
| Single Unit, Detached | 269 | 57.0% |
| Single Unit, Attached | 8 | 1.7% |
| 2 Unit Apartments | 19 | 4.0% |
| 3 or 4 Unit Apartments | 52 | 11.0% |
| 5 to 9 Unit Apartments | 65 | 13.8% |
| 10 or more Apartments | 44 | 9.3% |
| Mobile Home / Other | 15 | 3.2% |
| Total | 472 | 100.0% |
Housing Structures by Occupancy in La Vernia
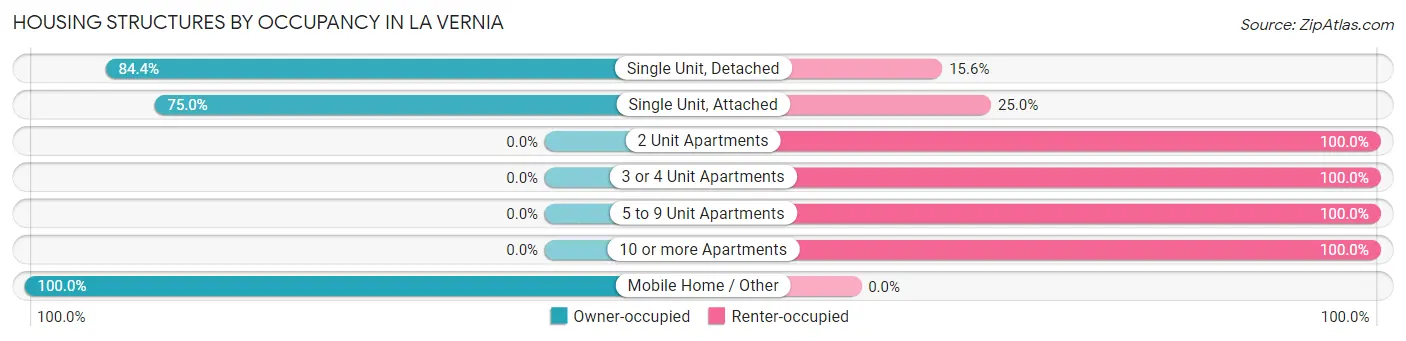
| Structure Type | Owner-occupied | Renter-occupied |
| Single Unit, Detached | 227 (84.4%) | 42 (15.6%) |
| Single Unit, Attached | 6 (75.0%) | 2 (25.0%) |
| 2 Unit Apartments | 0 (0.0%) | 19 (100.0%) |
| 3 or 4 Unit Apartments | 0 (0.0%) | 52 (100.0%) |
| 5 to 9 Unit Apartments | 0 (0.0%) | 65 (100.0%) |
| 10 or more Apartments | 0 (0.0%) | 44 (100.0%) |
| Mobile Home / Other | 15 (100.0%) | 0 (0.0%) |
| Total | 248 (52.5%) | 224 (47.5%) |
Housing Structures by Number of Rooms in La Vernia
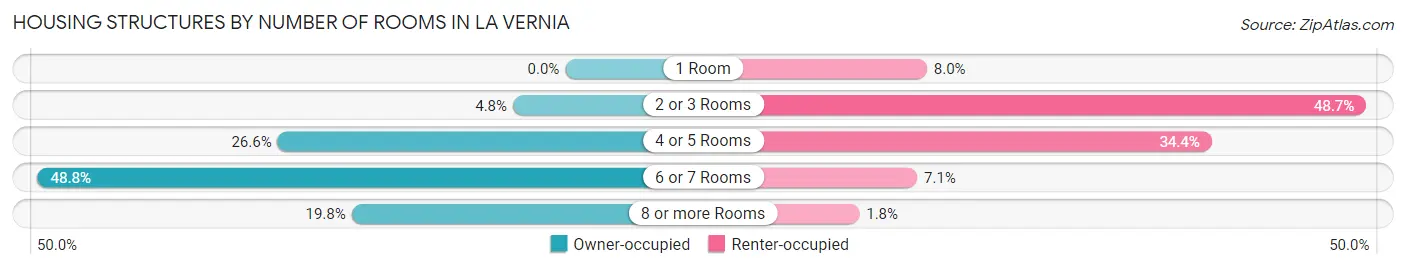
| Number of Rooms | Owner-occupied | Renter-occupied |
| 1 Room | 0 (0.0%) | 18 (8.0%) |
| 2 or 3 Rooms | 12 (4.8%) | 109 (48.7%) |
| 4 or 5 Rooms | 66 (26.6%) | 77 (34.4%) |
| 6 or 7 Rooms | 121 (48.8%) | 16 (7.1%) |
| 8 or more Rooms | 49 (19.8%) | 4 (1.8%) |
| Total | 248 (100.0%) | 224 (100.0%) |
Housing Structure by Heating Type in La Vernia
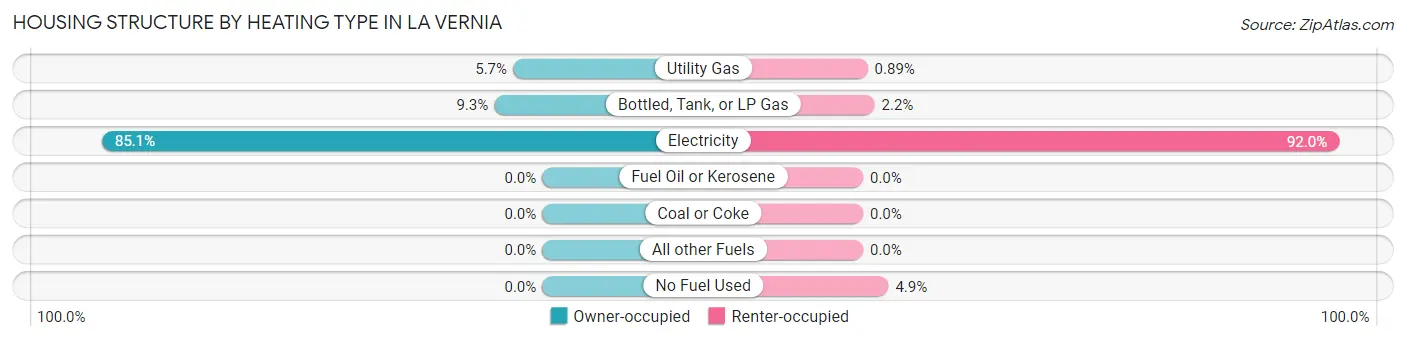
| Heating Type | Owner-occupied | Renter-occupied |
| Utility Gas | 14 (5.7%) | 2 (0.9%) |
| Bottled, Tank, or LP Gas | 23 (9.3%) | 5 (2.2%) |
| Electricity | 211 (85.1%) | 206 (92.0%) |
| Fuel Oil or Kerosene | 0 (0.0%) | 0 (0.0%) |
| Coal or Coke | 0 (0.0%) | 0 (0.0%) |
| All other Fuels | 0 (0.0%) | 0 (0.0%) |
| No Fuel Used | 0 (0.0%) | 11 (4.9%) |
| Total | 248 (100.0%) | 224 (100.0%) |
Household Vehicle Usage in La Vernia
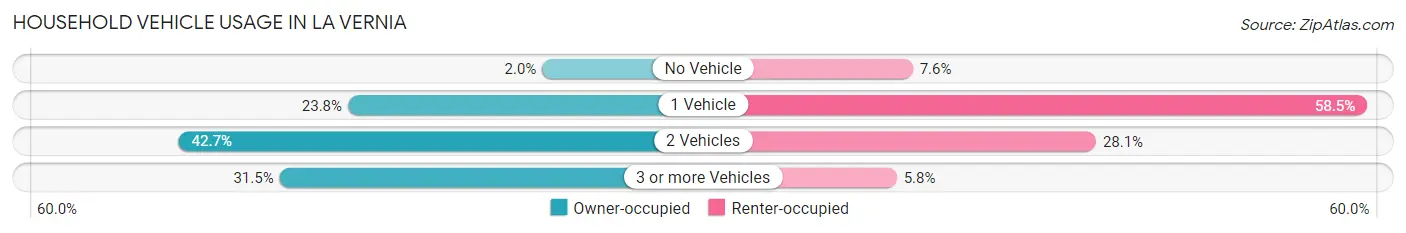
| Vehicles per Household | Owner-occupied | Renter-occupied |
| No Vehicle | 5 (2.0%) | 17 (7.6%) |
| 1 Vehicle | 59 (23.8%) | 131 (58.5%) |
| 2 Vehicles | 106 (42.7%) | 63 (28.1%) |
| 3 or more Vehicles | 78 (31.5%) | 13 (5.8%) |
| Total | 248 (100.0%) | 224 (100.0%) |
Real Estate & Mortgages in La Vernia
Real Estate and Mortgage Overview in La Vernia
| Characteristic | Without Mortgage | With Mortgage |
| Housing Units | 129 | 119 |
| Median Property Value | $164,700 | $279,200 |
| Median Household Income | $42,083 | $50 |
| Monthly Housing Costs | $603 | $0 |
| Real Estate Taxes | $2,346 | $7 |
Property Value by Mortgage Status in La Vernia
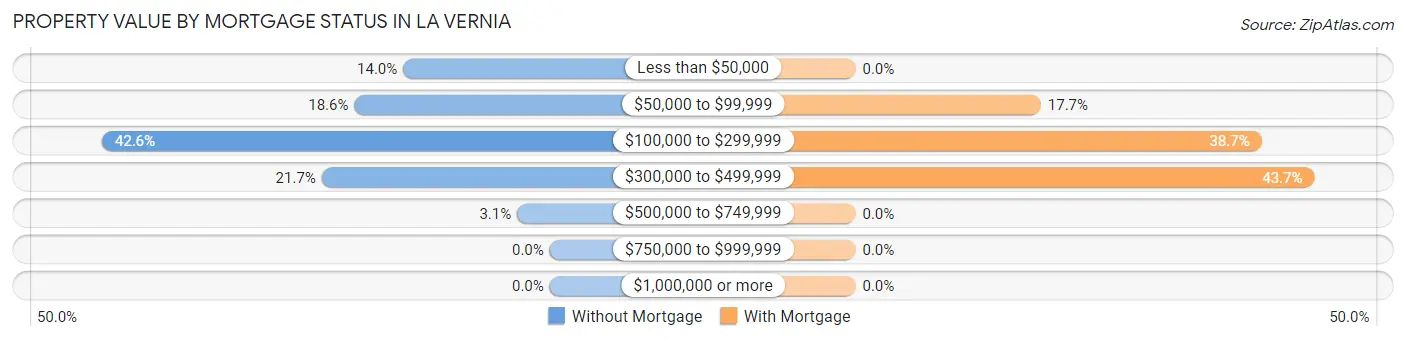
| Property Value | Without Mortgage | With Mortgage |
| Less than $50,000 | 18 (14.0%) | 0 (0.0%) |
| $50,000 to $99,999 | 24 (18.6%) | 21 (17.6%) |
| $100,000 to $299,999 | 55 (42.6%) | 46 (38.7%) |
| $300,000 to $499,999 | 28 (21.7%) | 52 (43.7%) |
| $500,000 to $749,999 | 4 (3.1%) | 0 (0.0%) |
| $750,000 to $999,999 | 0 (0.0%) | 0 (0.0%) |
| $1,000,000 or more | 0 (0.0%) | 0 (0.0%) |
| Total | 129 (100.0%) | 119 (100.0%) |
Household Income by Mortgage Status in La Vernia
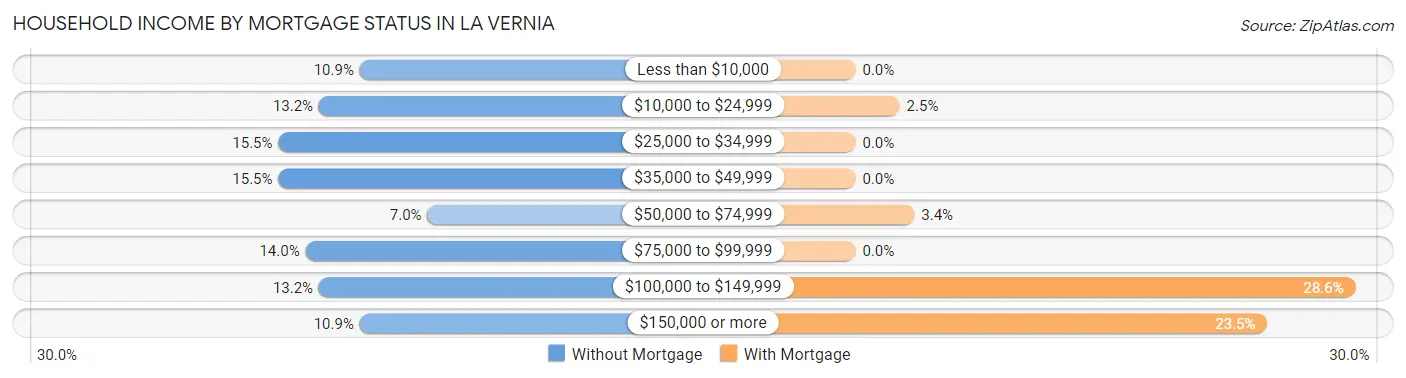
| Household Income | Without Mortgage | With Mortgage |
| Less than $10,000 | 14 (10.8%) | 0 (0.0%) |
| $10,000 to $24,999 | 17 (13.2%) | 3 (2.5%) |
| $25,000 to $34,999 | 20 (15.5%) | 0 (0.0%) |
| $35,000 to $49,999 | 20 (15.5%) | 0 (0.0%) |
| $50,000 to $74,999 | 9 (7.0%) | 4 (3.4%) |
| $75,000 to $99,999 | 18 (14.0%) | 0 (0.0%) |
| $100,000 to $149,999 | 17 (13.2%) | 34 (28.6%) |
| $150,000 or more | 14 (10.8%) | 28 (23.5%) |
| Total | 129 (100.0%) | 119 (100.0%) |
Property Value to Household Income Ratio in La Vernia
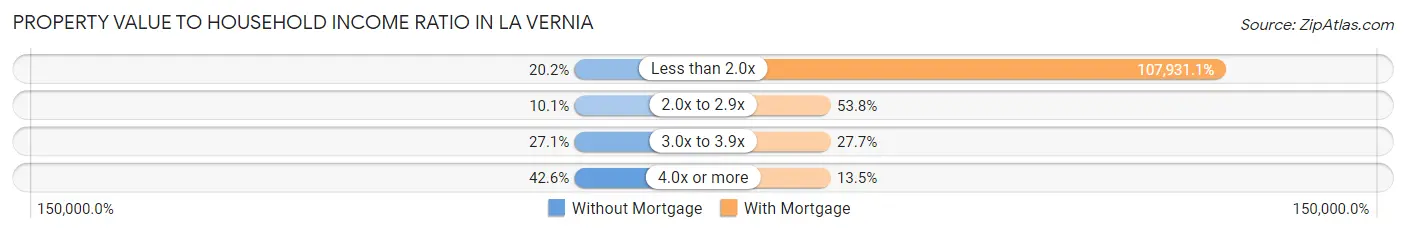
| Value-to-Income Ratio | Without Mortgage | With Mortgage |
| Less than 2.0x | 26 (20.2%) | 128,438 (107,931.1%) |
| 2.0x to 2.9x | 13 (10.1%) | 64 (53.8%) |
| 3.0x to 3.9x | 35 (27.1%) | 33 (27.7%) |
| 4.0x or more | 55 (42.6%) | 16 (13.5%) |
| Total | 129 (100.0%) | 119 (100.0%) |
Real Estate Taxes by Mortgage Status in La Vernia
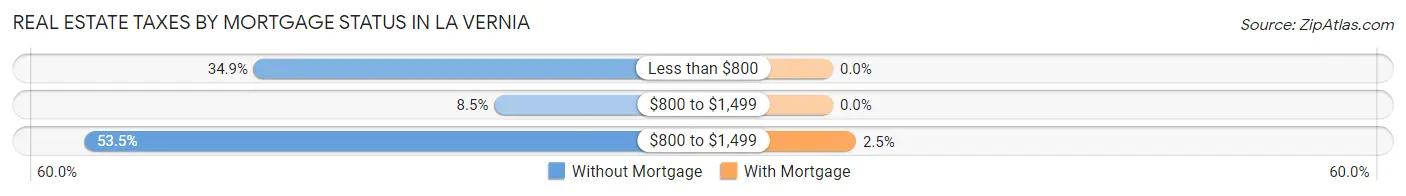
| Property Taxes | Without Mortgage | With Mortgage |
| Less than $800 | 45 (34.9%) | 0 (0.0%) |
| $800 to $1,499 | 11 (8.5%) | 0 (0.0%) |
| $800 to $1,499 | 69 (53.5%) | 3 (2.5%) |
| Total | 129 (100.0%) | 119 (100.0%) |
Health & Disability in La Vernia
Health Insurance Coverage by Age in La Vernia
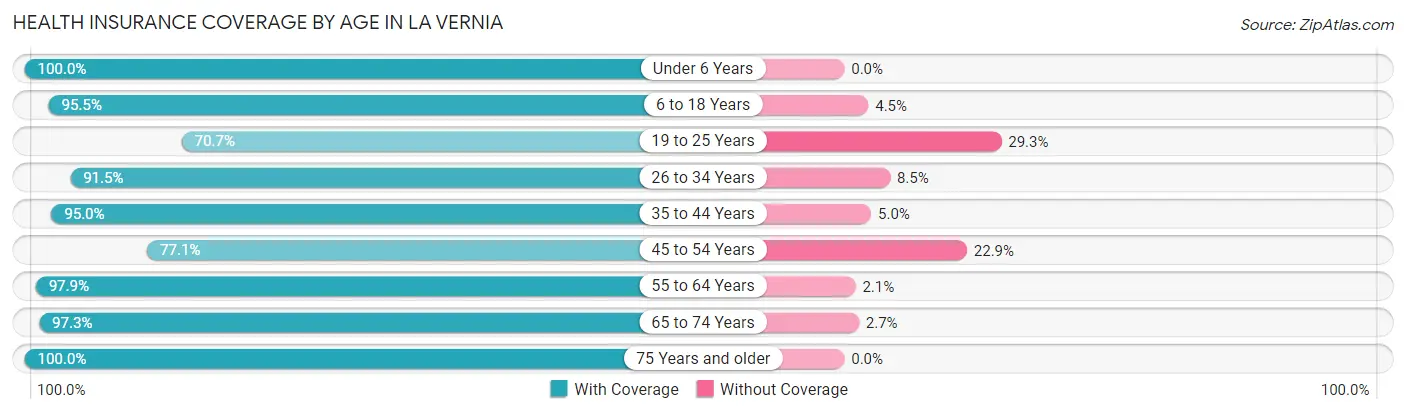
| Age Bracket | With Coverage | Without Coverage |
| Under 6 Years | 80 (100.0%) | 0 (0.0%) |
| 6 to 18 Years | 171 (95.5%) | 8 (4.5%) |
| 19 to 25 Years | 58 (70.7%) | 24 (29.3%) |
| 26 to 34 Years | 129 (91.5%) | 12 (8.5%) |
| 35 to 44 Years | 76 (95.0%) | 4 (5.0%) |
| 45 to 54 Years | 108 (77.1%) | 32 (22.9%) |
| 55 to 64 Years | 188 (97.9%) | 4 (2.1%) |
| 65 to 74 Years | 143 (97.3%) | 4 (2.7%) |
| 75 Years and older | 99 (100.0%) | 0 (0.0%) |
| Total | 1,052 (92.3%) | 88 (7.7%) |
Health Insurance Coverage by Citizenship Status in La Vernia
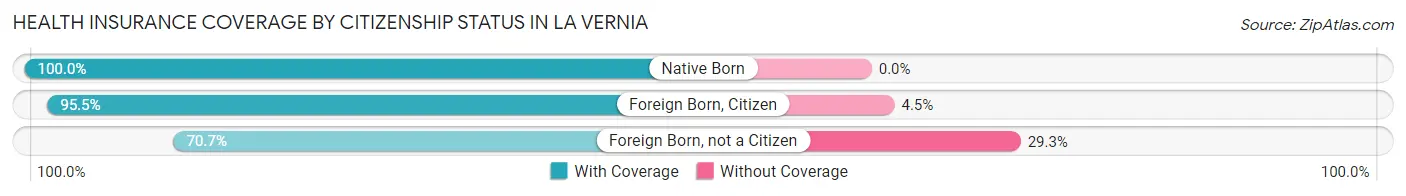
| Citizenship Status | With Coverage | Without Coverage |
| Native Born | 80 (100.0%) | 0 (0.0%) |
| Foreign Born, Citizen | 171 (95.5%) | 8 (4.5%) |
| Foreign Born, not a Citizen | 58 (70.7%) | 24 (29.3%) |
Health Insurance Coverage by Household Income in La Vernia
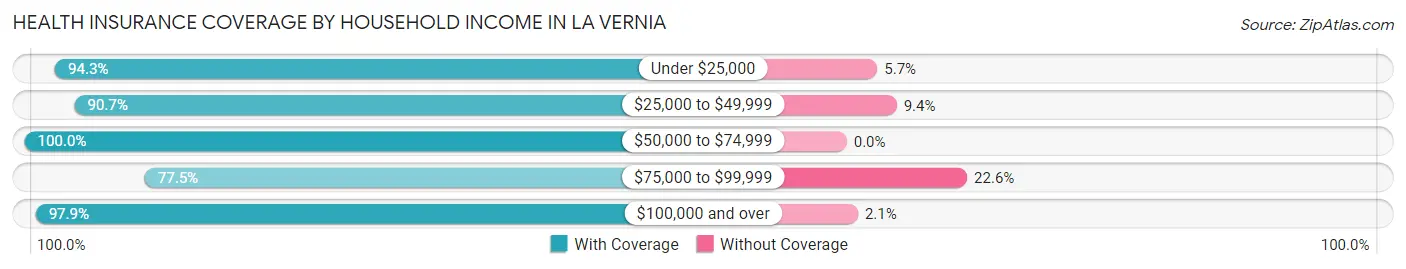
| Household Income | With Coverage | Without Coverage |
| Under $25,000 | 247 (94.3%) | 15 (5.7%) |
| $25,000 to $49,999 | 97 (90.6%) | 10 (9.3%) |
| $50,000 to $74,999 | 58 (100.0%) | 0 (0.0%) |
| $75,000 to $99,999 | 182 (77.4%) | 53 (22.6%) |
| $100,000 and over | 468 (97.9%) | 10 (2.1%) |
Public vs Private Health Insurance Coverage by Age in La Vernia
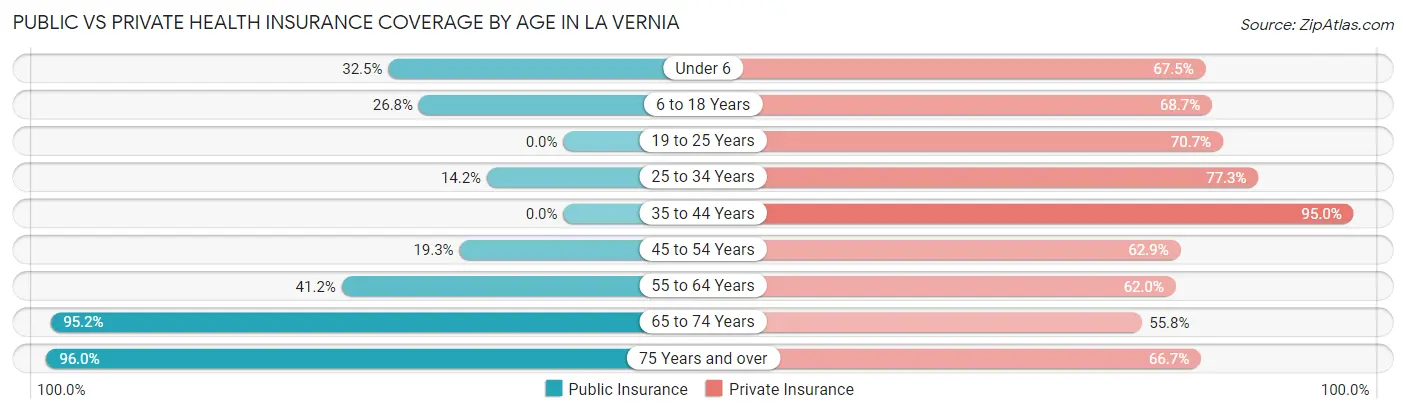
| Age Bracket | Public Insurance | Private Insurance |
| Under 6 | 26 (32.5%) | 54 (67.5%) |
| 6 to 18 Years | 48 (26.8%) | 123 (68.7%) |
| 19 to 25 Years | 0 (0.0%) | 58 (70.7%) |
| 25 to 34 Years | 20 (14.2%) | 109 (77.3%) |
| 35 to 44 Years | 0 (0.0%) | 76 (95.0%) |
| 45 to 54 Years | 27 (19.3%) | 88 (62.9%) |
| 55 to 64 Years | 79 (41.1%) | 119 (62.0%) |
| 65 to 74 Years | 140 (95.2%) | 82 (55.8%) |
| 75 Years and over | 95 (96.0%) | 66 (66.7%) |
| Total | 435 (38.2%) | 775 (68.0%) |
Disability Status by Sex by Age in La Vernia
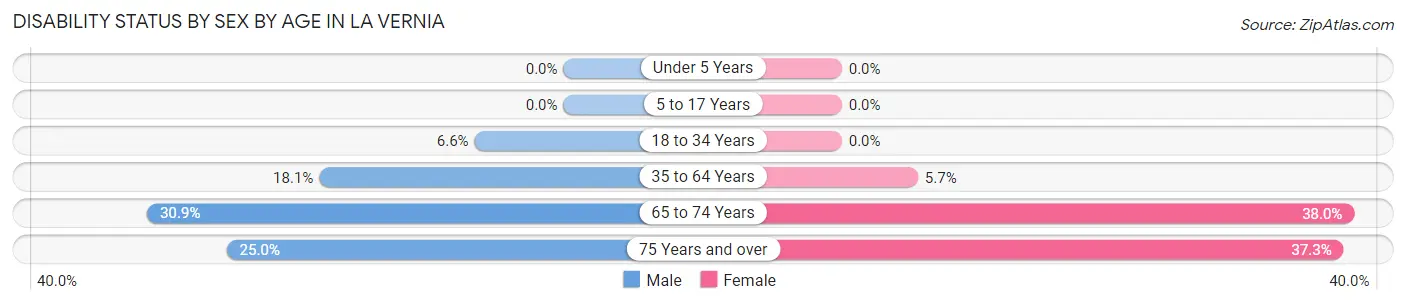
| Age Bracket | Male | Female |
| Under 5 Years | 0 (0.0%) | 0 (0.0%) |
| 5 to 17 Years | 0 (0.0%) | 0 (0.0%) |
| 18 to 34 Years | 7 (6.6%) | 0 (0.0%) |
| 35 to 64 Years | 33 (18.1%) | 13 (5.7%) |
| 65 to 74 Years | 17 (30.9%) | 35 (38.0%) |
| 75 Years and over | 12 (25.0%) | 19 (37.2%) |
Disability Class by Sex by Age in La Vernia
Disability Class: Hearing Difficulty
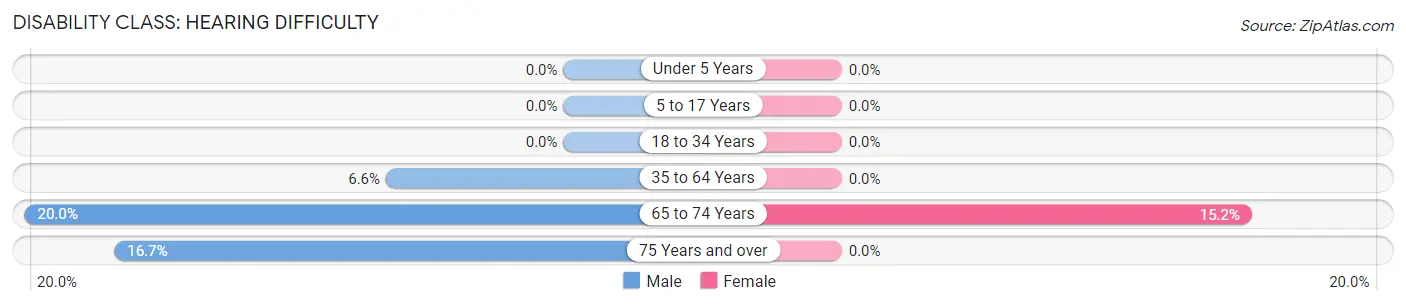
| Age Bracket | Male | Female |
| Under 5 Years | 0 (0.0%) | 0 (0.0%) |
| 5 to 17 Years | 0 (0.0%) | 0 (0.0%) |
| 18 to 34 Years | 0 (0.0%) | 0 (0.0%) |
| 35 to 64 Years | 12 (6.6%) | 0 (0.0%) |
| 65 to 74 Years | 11 (20.0%) | 14 (15.2%) |
| 75 Years and over | 8 (16.7%) | 0 (0.0%) |
Disability Class: Vision Difficulty
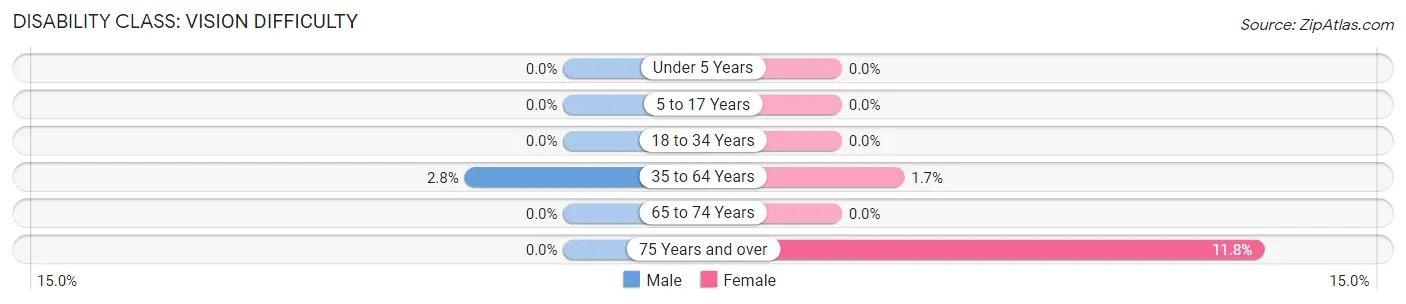
| Age Bracket | Male | Female |
| Under 5 Years | 0 (0.0%) | 0 (0.0%) |
| 5 to 17 Years | 0 (0.0%) | 0 (0.0%) |
| 18 to 34 Years | 0 (0.0%) | 0 (0.0%) |
| 35 to 64 Years | 5 (2.8%) | 4 (1.7%) |
| 65 to 74 Years | 0 (0.0%) | 0 (0.0%) |
| 75 Years and over | 0 (0.0%) | 6 (11.8%) |
Disability Class: Cognitive Difficulty
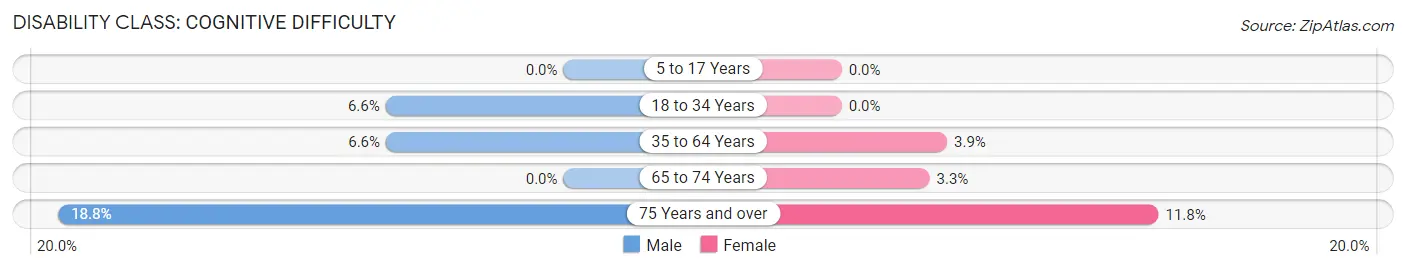
| Age Bracket | Male | Female |
| 5 to 17 Years | 0 (0.0%) | 0 (0.0%) |
| 18 to 34 Years | 7 (6.6%) | 0 (0.0%) |
| 35 to 64 Years | 12 (6.6%) | 9 (3.9%) |
| 65 to 74 Years | 0 (0.0%) | 3 (3.3%) |
| 75 Years and over | 9 (18.8%) | 6 (11.8%) |
Disability Class: Ambulatory Difficulty
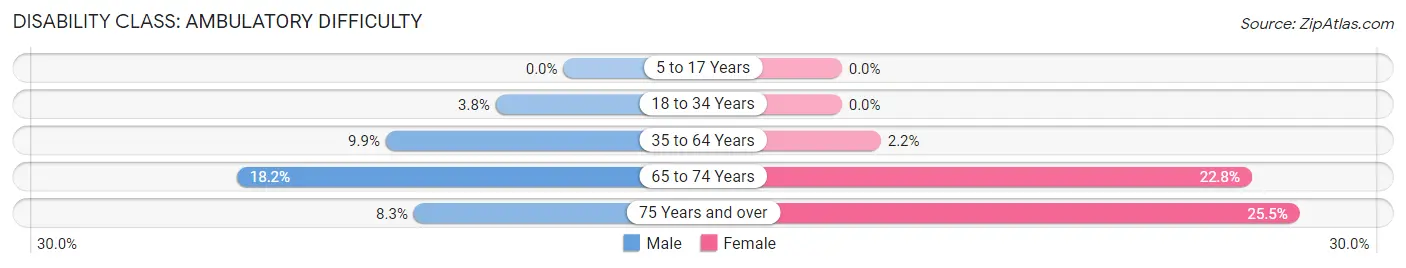
| Age Bracket | Male | Female |
| 5 to 17 Years | 0 (0.0%) | 0 (0.0%) |
| 18 to 34 Years | 4 (3.8%) | 0 (0.0%) |
| 35 to 64 Years | 18 (9.9%) | 5 (2.2%) |
| 65 to 74 Years | 10 (18.2%) | 21 (22.8%) |
| 75 Years and over | 4 (8.3%) | 13 (25.5%) |
Disability Class: Self-Care Difficulty
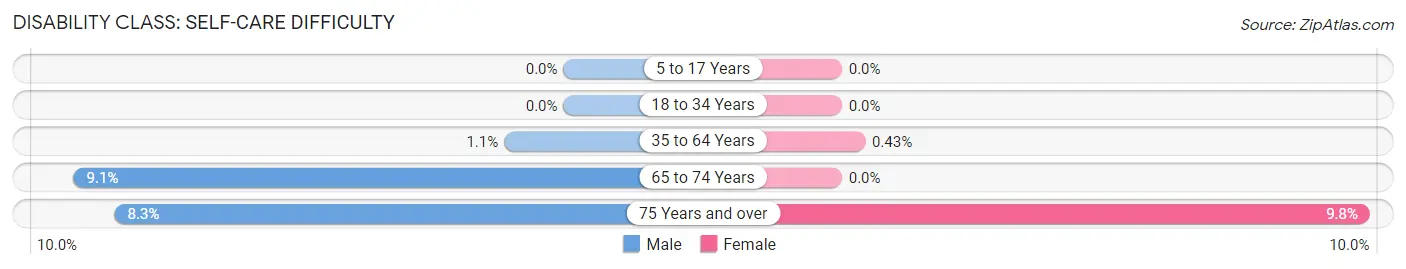
| Age Bracket | Male | Female |
| 5 to 17 Years | 0 (0.0%) | 0 (0.0%) |
| 18 to 34 Years | 0 (0.0%) | 0 (0.0%) |
| 35 to 64 Years | 2 (1.1%) | 1 (0.4%) |
| 65 to 74 Years | 5 (9.1%) | 0 (0.0%) |
| 75 Years and over | 4 (8.3%) | 5 (9.8%) |
Technology Access in La Vernia
Computing Device Access in La Vernia
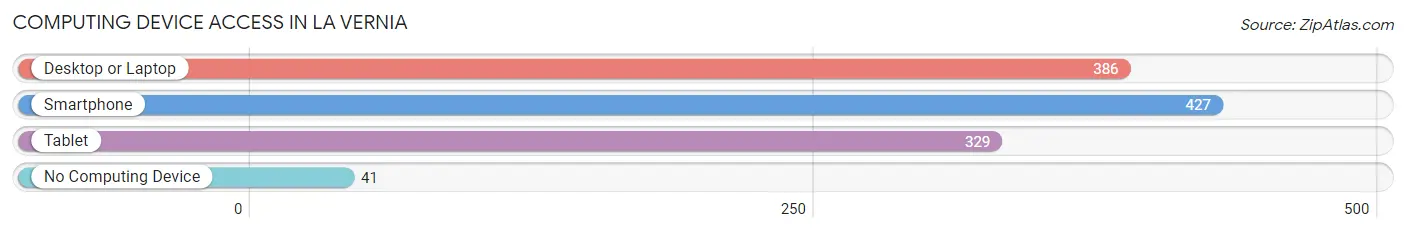
| Device Type | # Households | % Households |
| Desktop or Laptop | 386 | 81.8% |
| Smartphone | 427 | 90.5% |
| Tablet | 329 | 69.7% |
| No Computing Device | 41 | 8.7% |
| Total | 472 | 100.0% |
Internet Access in La Vernia
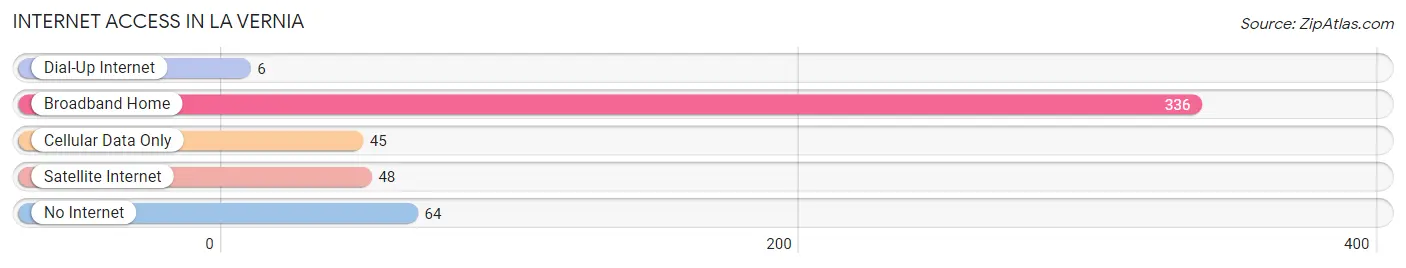
| Internet Type | # Households | % Households |
| Dial-Up Internet | 6 | 1.3% |
| Broadband Home | 336 | 71.2% |
| Cellular Data Only | 45 | 9.5% |
| Satellite Internet | 48 | 10.2% |
| No Internet | 64 | 13.6% |
| Total | 472 | 100.0% |
La Vernia Summary
History
La Vernia is a small town located in Wilson County, Texas. It is situated about 25 miles east of San Antonio and is part of the San Antonio-New Braunfels Metropolitan Statistical Area. The town was founded in 1876 by German immigrants who named it after their hometown of Lavern, Germany. The town was originally a farming community, but it has since grown to become a bedroom community for San Antonio.
The first settlers in La Vernia were German immigrants who arrived in the area in 1876. They were attracted to the area by the fertile soil and the abundance of water. The settlers built a school, a church, and a general store. The town was officially incorporated in 1883.
In the early 1900s, La Vernia experienced a period of growth and prosperity. The town was home to several businesses, including a cotton gin, a blacksmith shop, and a gristmill. The town also had a post office, a bank, and a hotel.
In the 1920s, the town began to decline as the population shifted to larger cities. The Great Depression further exacerbated the decline, and by the 1940s, the town was nearly abandoned.
In the 1950s, the town began to experience a resurgence as people moved back to the area. The population grew steadily throughout the 1960s and 1970s, and the town was officially reincorporated in 1979.
Today, La Vernia is a small, rural town with a population of about 1,500. The town is home to several businesses, including a grocery store, a hardware store, and a few restaurants. The town is also home to a museum, a library, and a community center.
Geography
La Vernia is located in Wilson County, Texas, about 25 miles east of San Antonio. The town is situated on the banks of the San Antonio River and is surrounded by rolling hills and farmland. The town is located in the Edwards Plateau region of Texas, which is characterized by its limestone hills and cedar trees.
The climate in La Vernia is hot and humid in the summer and mild in the winter. The average temperature in the summer is around 90 degrees Fahrenheit, and the average temperature in the winter is around 50 degrees Fahrenheit. The town receives an average of 33 inches of rain per year.
Economy
The economy of La Vernia is largely based on agriculture. The town is home to several farms, which produce a variety of crops, including cotton, corn, and hay. The town is also home to several businesses, including a grocery store, a hardware store, and a few restaurants.
The town is also home to several manufacturing companies, including a metal fabrication plant and a plastics manufacturing plant. The town is also home to a few small businesses, including a bakery, a florist, and a furniture store.
Demographics
As of the 2010 census, the population of La Vernia was 1,491. The racial makeup of the town was 94.3% White, 0.7% African American, 0.3% Native American, 0.2% Asian, 0.1% Pacific Islander, 2.7% from other races, and 1.9% from two or more races. Hispanic or Latino of any race were 8.2% of the population.
The median household income in La Vernia was $50,938, and the median family income was $58,750. The per capita income was $21,945. About 8.2% of families and 10.2% of the population were below the poverty line, including 14.2% of those under age 18 and 8.3% of those age 65 or over.
Common Questions
What is Per Capita Income in La Vernia?
Per Capita income in La Vernia is $35,252.
What is the Median Family Income in La Vernia?
Median Family Income in La Vernia is $95,962.
What is the Median Household income in La Vernia?
Median Household Income in La Vernia is $74,167.
What is Income or Wage Gap in La Vernia?
Income or Wage Gap in La Vernia is 44.4%.
Women in La Vernia earn 55.6 cents for every dollar earned by a man.
What is Inequality or Gini Index in La Vernia?
Inequality or Gini Index in La Vernia is 0.49.
What is the Total Population of La Vernia?
Total Population of La Vernia is 1,140.
What is the Total Male Population of La Vernia?
Total Male Population of La Vernia is 508.
What is the Total Female Population of La Vernia?
Total Female Population of La Vernia is 632.
What is the Ratio of Males per 100 Females in La Vernia?
There are 80.38 Males per 100 Females in La Vernia.
What is the Ratio of Females per 100 Males in La Vernia?
There are 124.41 Females per 100 Males in La Vernia.
What is the Median Population Age in La Vernia?
Median Population Age in La Vernia is 45.3 Years.
What is the Average Family Size in La Vernia
Average Family Size in La Vernia is 3.0 People.
What is the Average Household Size in La Vernia
Average Household Size in La Vernia is 2.4 People.
How Large is the Labor Force in La Vernia?
There are 542 People in the Labor Forcein in La Vernia.
What is the Percentage of People in the Labor Force in La Vernia?
58.2% of People are in the Labor Force in La Vernia.
What is the Unemployment Rate in La Vernia?
Unemployment Rate in La Vernia is 4.6%.