La Joya, TX Map & Demographics
La Joya Map
La Joya Overview
$17,711
PER CAPITA INCOME
$51,385
AVG FAMILY INCOME
$51,412
AVG HOUSEHOLD INCOME
36.2%
WAGE / INCOME GAP [ % ]
63.8¢/ $1
WAGE / INCOME GAP [ $ ]
0.40
INEQUALITY / GINI INDEX
4,525
TOTAL POPULATION
2,071
MALE POPULATION
2,454
FEMALE POPULATION
84.39
MALES / 100 FEMALES
118.49
FEMALES / 100 MALES
30.1
MEDIAN AGE
4.0
AVG FAMILY SIZE
3.5
AVG HOUSEHOLD SIZE
1,897
LABOR FORCE [ PEOPLE ]
56.4%
PERCENT IN LABOR FORCE
7.3%
UNEMPLOYMENT RATE
La Joya Zip Codes
La Joya Area Codes
Income in La Joya
Income Overview in La Joya
Per Capita Income in La Joya is $17,711, while median incomes of families and households are $51,385 and $51,412 respectively.
| Characteristic | Number | Measure |
| Per Capita Income | 4,525 | $17,711 |
| Median Family Income | 1,052 | $51,385 |
| Mean Family Income | 1,052 | $64,097 |
| Median Household Income | 1,289 | $51,412 |
| Mean Household Income | 1,289 | $60,979 |
| Income Deficit | 1,052 | $0 |
| Wage / Income Gap (%) | 4,525 | 36.16% |
| Wage / Income Gap ($) | 4,525 | 63.84¢ per $1 |
| Gini / Inequality Index | 4,525 | 0.40 |
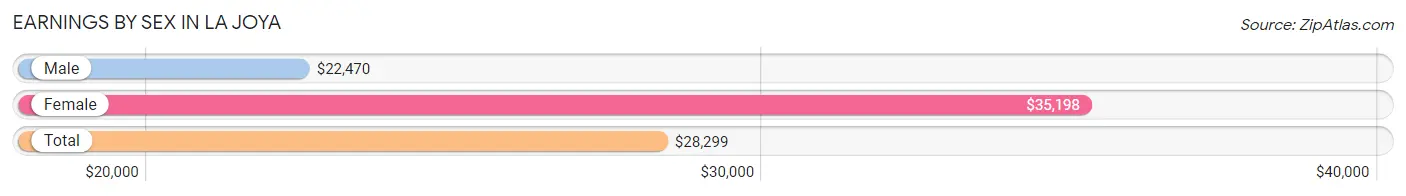
Earnings by Sex in La Joya
Average Earnings in La Joya are $28,299, $22,470 for men and $35,198 for women, a difference of 36.2%.
| Sex | Number | Average Earnings |
| Male | 1,014 (55.7%) | $22,470 |
| Female | 806 (44.3%) | $35,198 |
| Total | 1,820 (100.0%) | $28,299 |
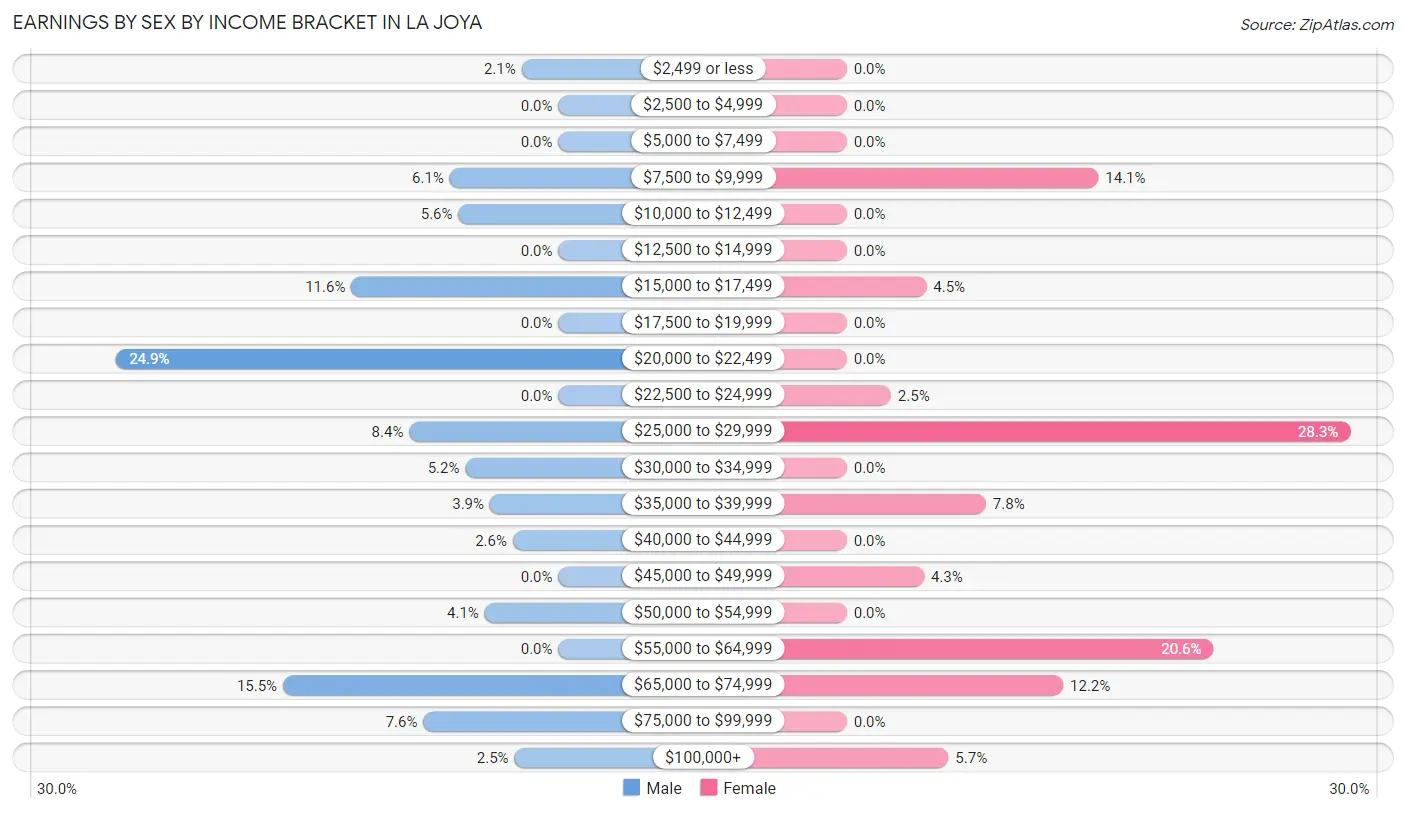
Earnings by Sex by Income Bracket in La Joya
The most common earnings brackets in La Joya are $20,000 to $22,499 for men (252 | 24.8%) and $25,000 to $29,999 for women (228 | 28.3%).
| Income | Male | Female |
| $2,499 or less | 21 (2.1%) | 0 (0.0%) |
| $2,500 to $4,999 | 0 (0.0%) | 0 (0.0%) |
| $5,000 to $7,499 | 0 (0.0%) | 0 (0.0%) |
| $7,500 to $9,999 | 62 (6.1%) | 114 (14.1%) |
| $10,000 to $12,499 | 57 (5.6%) | 0 (0.0%) |
| $12,500 to $14,999 | 0 (0.0%) | 0 (0.0%) |
| $15,000 to $17,499 | 118 (11.6%) | 36 (4.5%) |
| $17,500 to $19,999 | 0 (0.0%) | 0 (0.0%) |
| $20,000 to $22,499 | 252 (24.8%) | 0 (0.0%) |
| $22,500 to $24,999 | 0 (0.0%) | 20 (2.5%) |
| $25,000 to $29,999 | 85 (8.4%) | 228 (28.3%) |
| $30,000 to $34,999 | 53 (5.2%) | 0 (0.0%) |
| $35,000 to $39,999 | 39 (3.8%) | 63 (7.8%) |
| $40,000 to $44,999 | 26 (2.6%) | 0 (0.0%) |
| $45,000 to $49,999 | 0 (0.0%) | 35 (4.3%) |
| $50,000 to $54,999 | 42 (4.1%) | 0 (0.0%) |
| $55,000 to $64,999 | 0 (0.0%) | 166 (20.6%) |
| $65,000 to $74,999 | 157 (15.5%) | 98 (12.2%) |
| $75,000 to $99,999 | 77 (7.6%) | 0 (0.0%) |
| $100,000+ | 25 (2.5%) | 46 (5.7%) |
| Total | 1,014 (100.0%) | 806 (100.0%) |
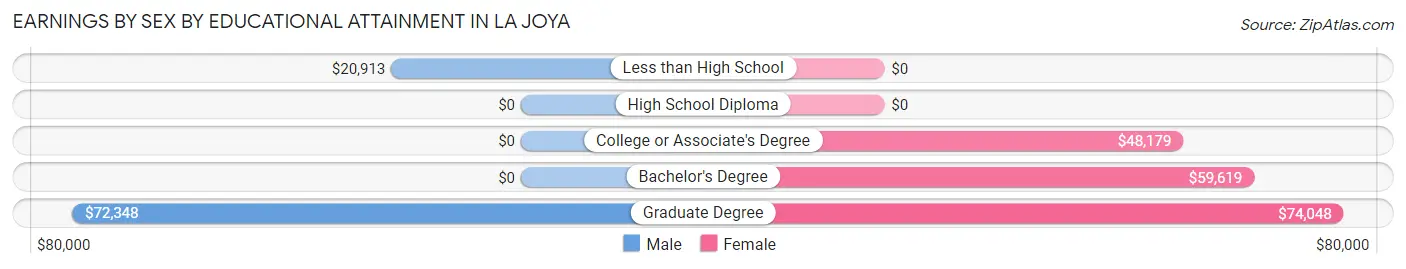
Earnings by Sex by Educational Attainment in La Joya
Average earnings in La Joya are $22,421 for men and $36,567 for women, a difference of 38.7%. Men with an educational attainment of graduate degree enjoy the highest average annual earnings of $72,348, while those with less than high school education earn the least with $20,913. Women with an educational attainment of graduate degree earn the most with the average annual earnings of $74,048, while those with college or associate's degree education have the smallest earnings of $48,179.
| Educational Attainment | Male Income | Female Income |
| Less than High School | $20,913 | $0 |
| High School Diploma | - | - |
| College or Associate's Degree | - | - |
| Bachelor's Degree | - | - |
| Graduate Degree | $72,348 | $74,048 |
| Total | $22,421 | $36,567 |
Family Income in La Joya
Family Income Brackets in La Joya
According to the La Joya family income data, there are 244 families falling into the $75,000 to $99,999 income range, which is the most common income bracket and makes up 23.2% of all families.
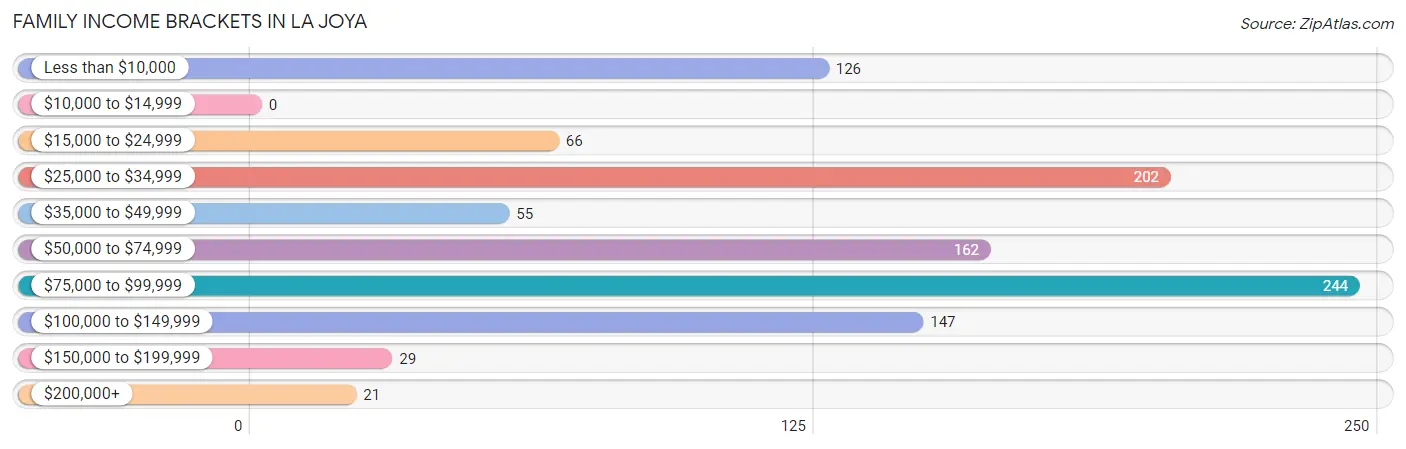
| Income Bracket | # Families | % Families |
| Less than $10,000 | 126 | 12.0% |
| $10,000 to $14,999 | 0 | 0.0% |
| $15,000 to $24,999 | 66 | 6.3% |
| $25,000 to $34,999 | 202 | 19.2% |
| $35,000 to $49,999 | 55 | 5.2% |
| $50,000 to $74,999 | 162 | 15.4% |
| $75,000 to $99,999 | 244 | 23.2% |
| $100,000 to $149,999 | 147 | 14.0% |
| $150,000 to $199,999 | 29 | 2.8% |
| $200,000+ | 21 | 2.0% |
Family Income by Famaliy Size in La Joya
4-person families (341 | 32.4%) account for the highest median family income in La Joya with $78,316 per family, while 4-person families (341 | 32.4%) have the highest median income of $19,579 per family member.
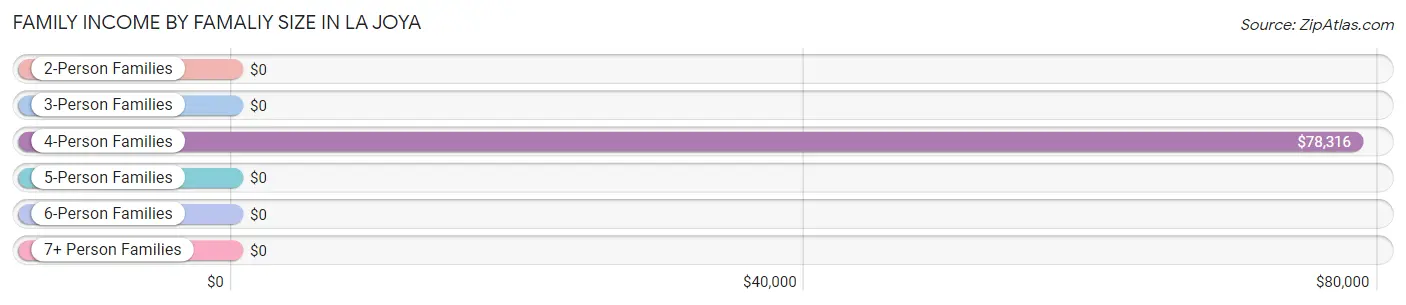
| Income Bracket | # Families | Median Income |
| 2-Person Families | 93 (8.8%) | $0 |
| 3-Person Families | 404 (38.4%) | $0 |
| 4-Person Families | 341 (32.4%) | $78,316 |
| 5-Person Families | 83 (7.9%) | $0 |
| 6-Person Families | 83 (7.9%) | $0 |
| 7+ Person Families | 48 (4.6%) | $0 |
| Total | 1,052 (100.0%) | $51,385 |
Family Income by Number of Earners in La Joya
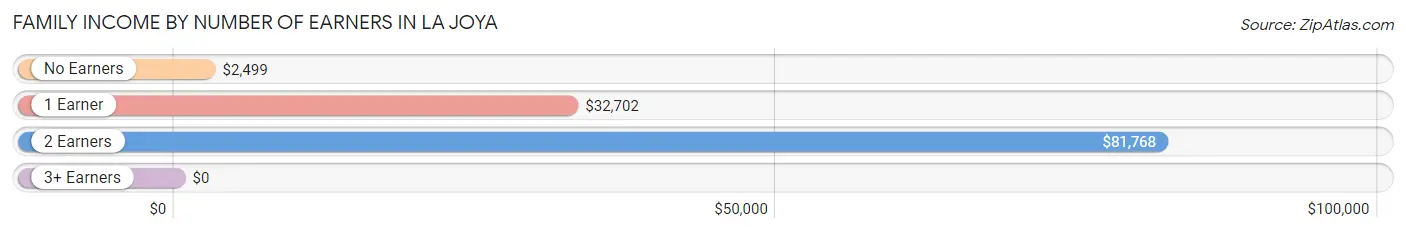
| Number of Earners | # Families | Median Income |
| No Earners | 112 (10.6%) | $2,499 |
| 1 Earner | 432 (41.1%) | $32,702 |
| 2 Earners | 428 (40.7%) | $81,768 |
| 3+ Earners | 80 (7.6%) | $0 |
| Total | 1,052 (100.0%) | $51,385 |
Household Income in La Joya
Household Income Brackets in La Joya
With 282 households falling in the category, the $50,000 to $74,999 income range is the most frequent in La Joya, accounting for 21.9% of all households. In contrast, only 21 households (1.6%) fall into the $200,000+ income bracket, making it the least populous group.
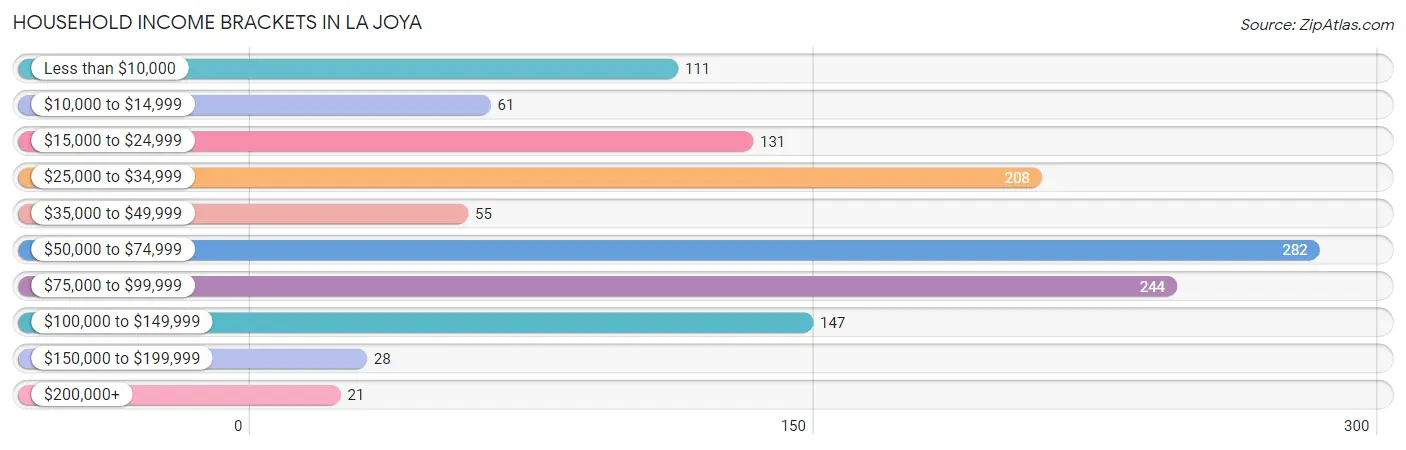
| Income Bracket | # Households | % Households |
| Less than $10,000 | 111 | 8.6% |
| $10,000 to $14,999 | 61 | 4.7% |
| $15,000 to $24,999 | 131 | 10.2% |
| $25,000 to $34,999 | 208 | 16.1% |
| $35,000 to $49,999 | 55 | 4.3% |
| $50,000 to $74,999 | 282 | 21.9% |
| $75,000 to $99,999 | 244 | 18.9% |
| $100,000 to $149,999 | 147 | 11.4% |
| $150,000 to $199,999 | 28 | 2.2% |
| $200,000+ | 21 | 1.6% |
Household Income by Householder Age in La Joya
The median household income in La Joya is $51,412, with the highest median household income of $79,789 found in the 45 to 64 years age bracket for the primary householder. A total of 331 households (25.7%) fall into this category. Meanwhile, the 15 to 24 years age bracket for the primary householder has the lowest median household income of $0, with 39 households (3.0%) in this group.
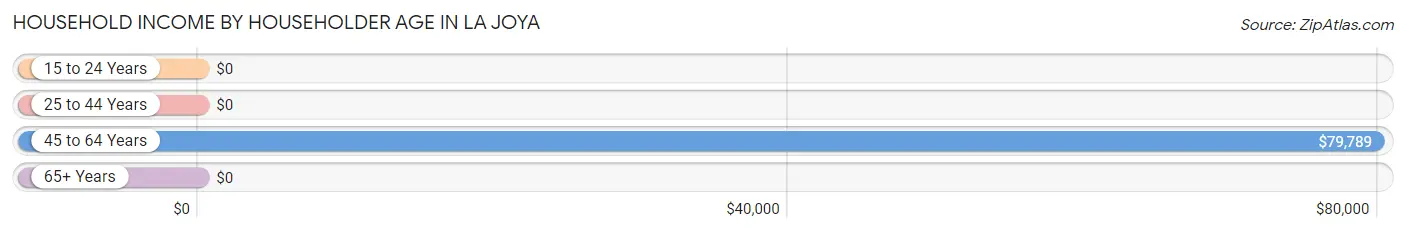
| Income Bracket | # Households | Median Income |
| 15 to 24 Years | 39 (3.0%) | $0 |
| 25 to 44 Years | 643 (49.9%) | $0 |
| 45 to 64 Years | 331 (25.7%) | $79,789 |
| 65+ Years | 276 (21.4%) | $0 |
| Total | 1,289 (100.0%) | $51,412 |
Poverty in La Joya
Income Below Poverty by Sex and Age in La Joya
With 25.8% poverty level for males and 24.0% for females among the residents of La Joya, under 5 year old males and 65 to 74 year old females are the most vulnerable to poverty, with 133 males (93.7%) and 61 females (62.9%) in their respective age groups living below the poverty level.
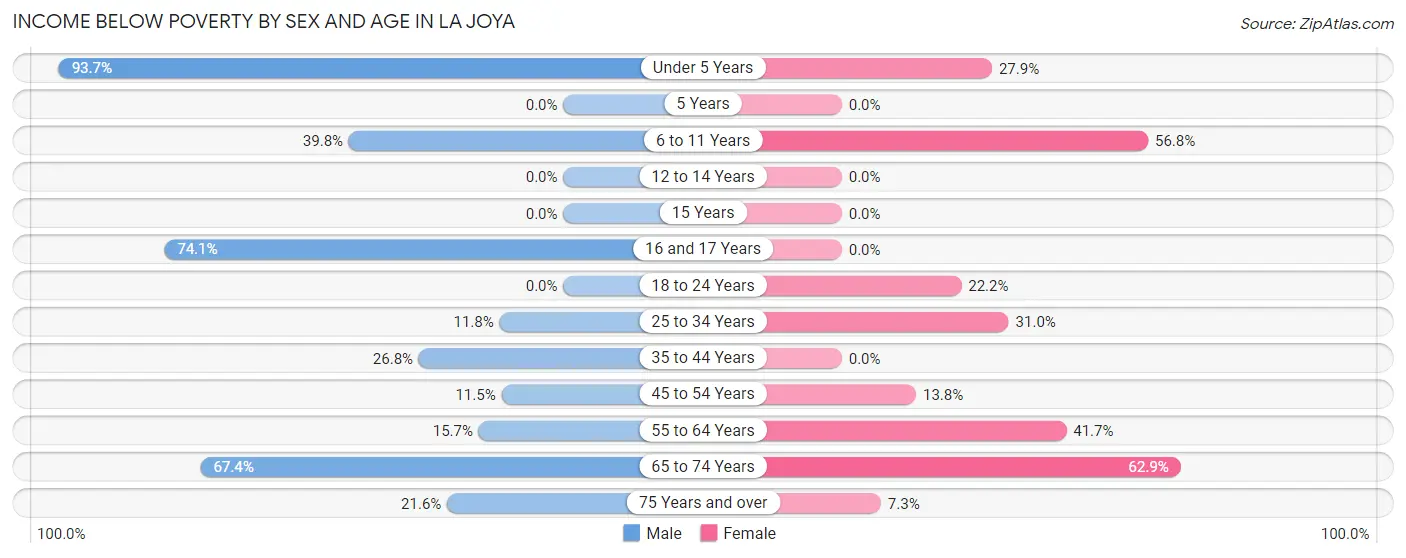
| Age Bracket | Male | Female |
| Under 5 Years | 133 (93.7%) | 75 (27.9%) |
| 5 Years | 0 (0.0%) | 0 (0.0%) |
| 6 to 11 Years | 78 (39.8%) | 108 (56.8%) |
| 12 to 14 Years | 0 (0.0%) | 0 (0.0%) |
| 15 Years | 0 (0.0%) | 0 (0.0%) |
| 16 and 17 Years | 60 (74.1%) | 0 (0.0%) |
| 18 to 24 Years | 0 (0.0%) | 57 (22.2%) |
| 25 to 34 Years | 67 (11.8%) | 166 (31.0%) |
| 35 to 44 Years | 63 (26.8%) | 0 (0.0%) |
| 45 to 54 Years | 38 (11.5%) | 58 (13.8%) |
| 55 to 64 Years | 8 (15.7%) | 55 (41.7%) |
| 65 to 74 Years | 66 (67.3%) | 61 (62.9%) |
| 75 Years and over | 22 (21.6%) | 9 (7.3%) |
| Total | 535 (25.8%) | 589 (24.0%) |
Income Above Poverty by Sex and Age in La Joya
According to the poverty statistics in La Joya, males aged 5 years and females aged 5 years are the age groups that are most secure financially, with 100.0% of males and 100.0% of females in these age groups living above the poverty line.
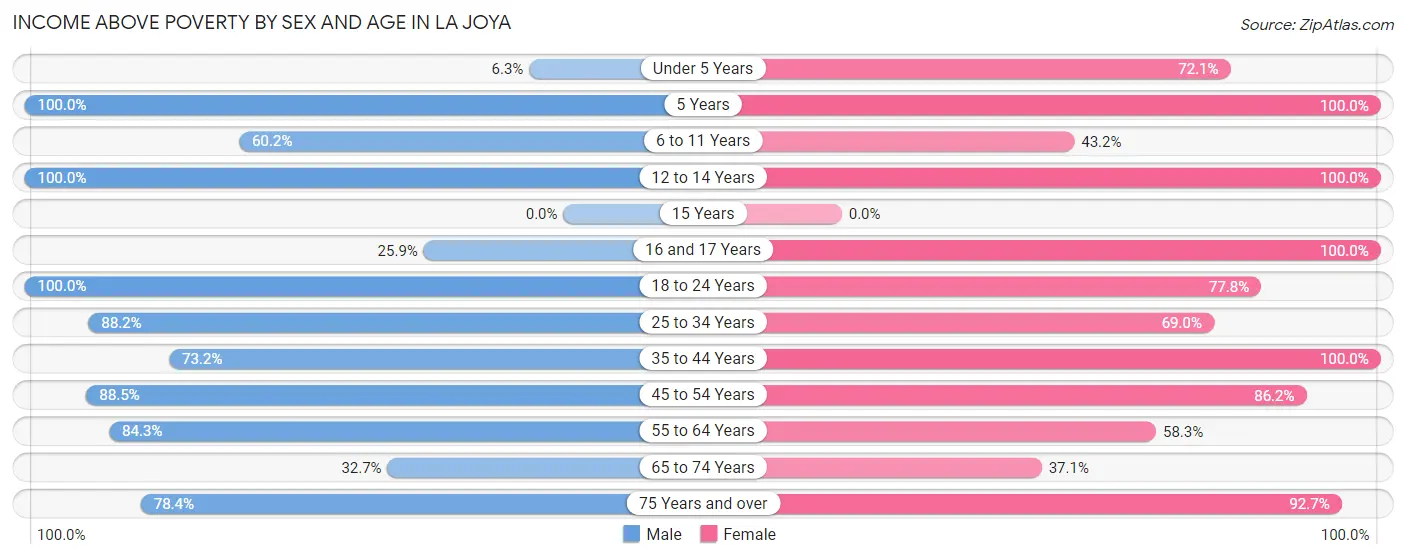
| Age Bracket | Male | Female |
| Under 5 Years | 9 (6.3%) | 194 (72.1%) |
| 5 Years | 125 (100.0%) | 40 (100.0%) |
| 6 to 11 Years | 118 (60.2%) | 82 (43.2%) |
| 12 to 14 Years | 44 (100.0%) | 156 (100.0%) |
| 15 Years | 0 (0.0%) | 0 (0.0%) |
| 16 and 17 Years | 21 (25.9%) | 61 (100.0%) |
| 18 to 24 Years | 100 (100.0%) | 200 (77.8%) |
| 25 to 34 Years | 499 (88.2%) | 370 (69.0%) |
| 35 to 44 Years | 172 (73.2%) | 171 (100.0%) |
| 45 to 54 Years | 293 (88.5%) | 363 (86.2%) |
| 55 to 64 Years | 43 (84.3%) | 77 (58.3%) |
| 65 to 74 Years | 32 (32.7%) | 36 (37.1%) |
| 75 Years and over | 80 (78.4%) | 115 (92.7%) |
| Total | 1,536 (74.2%) | 1,865 (76.0%) |
Income Below Poverty Among Married-Couple Families in La Joya
The poverty statistics for married-couple families in La Joya show that 9.7% or 58 of the total 600 families live below the poverty line. Families with no children have the highest poverty rate of 21.5%, comprising of 58 families. On the other hand, families with 1 or 2 children have the lowest poverty rate of 0.0%, which includes 0 families.
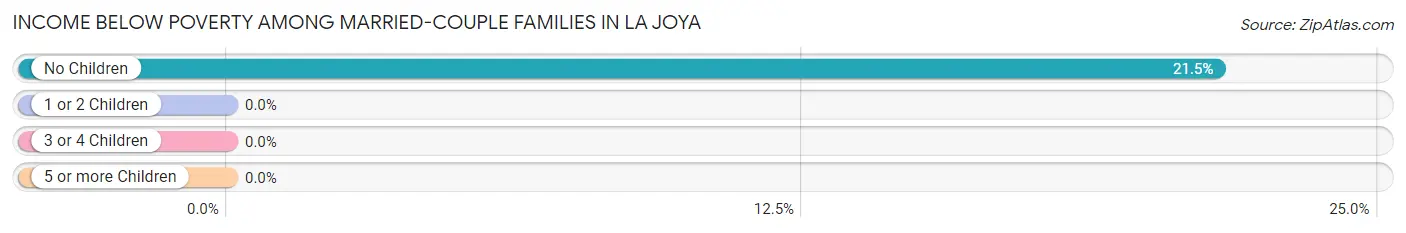
| Children | Above Poverty | Below Poverty |
| No Children | 212 (78.5%) | 58 (21.5%) |
| 1 or 2 Children | 258 (100.0%) | 0 (0.0%) |
| 3 or 4 Children | 72 (100.0%) | 0 (0.0%) |
| 5 or more Children | 0 (0.0%) | 0 (0.0%) |
| Total | 542 (90.3%) | 58 (9.7%) |
Income Below Poverty Among Single-Parent Households in La Joya
According to the poverty data in La Joya, 43.5% or 30 single-father households and 43.3% or 166 single-mother households are living below the poverty line. Among single-father households, those with no children have the highest poverty rate, with 22 households (100.0%) experiencing poverty. Likewise, among single-mother households, those with 3 or 4 children have the highest poverty rate, with 101 households (100.0%) falling below the poverty line.
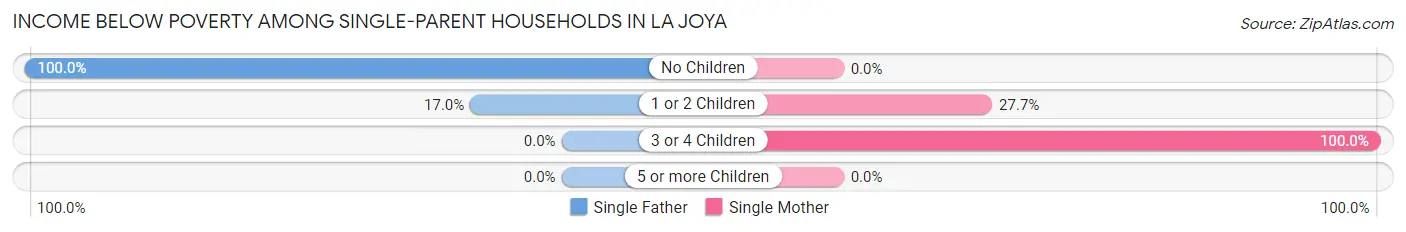
| Children | Single Father | Single Mother |
| No Children | 22 (100.0%) | 0 (0.0%) |
| 1 or 2 Children | 8 (17.0%) | 65 (27.7%) |
| 3 or 4 Children | 0 (0.0%) | 101 (100.0%) |
| 5 or more Children | 0 (0.0%) | 0 (0.0%) |
| Total | 30 (43.5%) | 166 (43.3%) |
Income Below Poverty Among Married-Couple vs Single-Parent Households in La Joya
The poverty data for La Joya shows that 58 of the married-couple family households (9.7%) and 196 of the single-parent households (43.4%) are living below the poverty level. Within the married-couple family households, those with no children have the highest poverty rate, with 58 households (21.5%) falling below the poverty line. Among the single-parent households, those with 3 or 4 children have the highest poverty rate, with 101 household (100.0%) living below poverty.
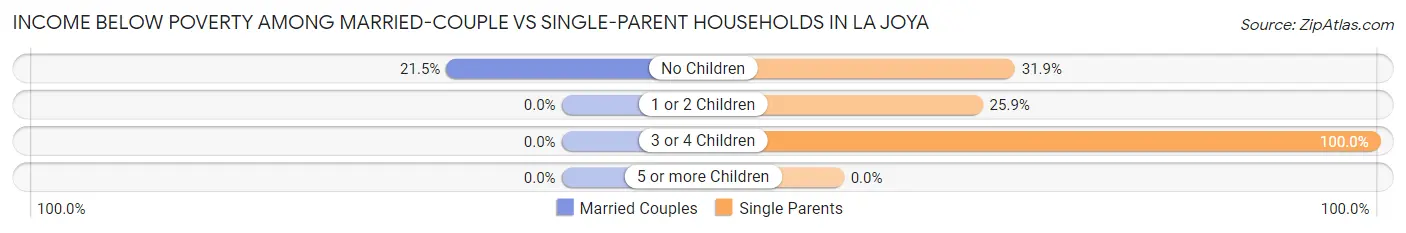
| Children | Married-Couple Families | Single-Parent Households |
| No Children | 58 (21.5%) | 22 (31.9%) |
| 1 or 2 Children | 0 (0.0%) | 73 (25.9%) |
| 3 or 4 Children | 0 (0.0%) | 101 (100.0%) |
| 5 or more Children | 0 (0.0%) | 0 (0.0%) |
| Total | 58 (9.7%) | 196 (43.4%) |
Race in La Joya
The most populous races in La Joya are Hispanic or Latino (4,246 | 93.8%), White / Caucasian (2,261 | 50.0%), and Two or more Races (1,959 | 43.3%).
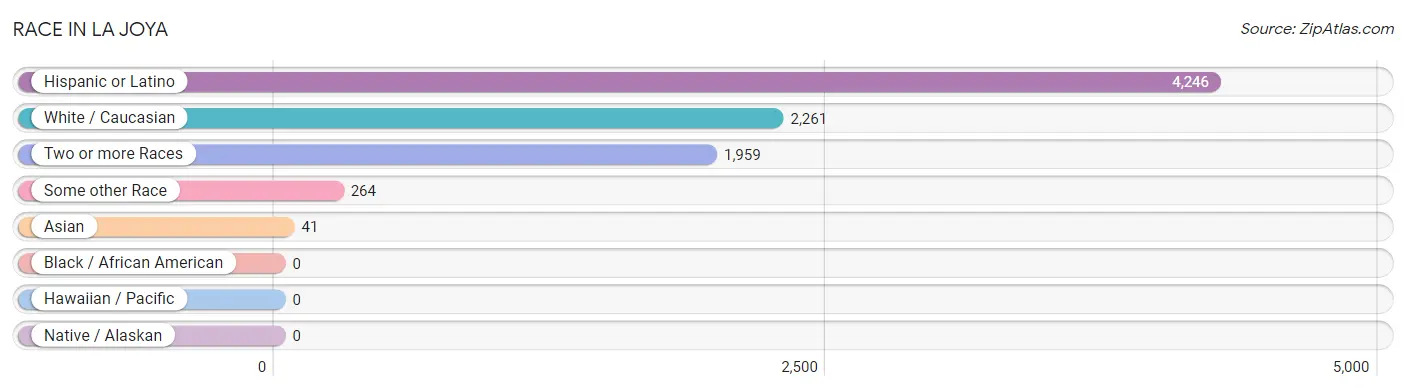
| Race | # Population | % Population |
| Asian | 41 | 0.9% |
| Black / African American | 0 | 0.0% |
| Hawaiian / Pacific | 0 | 0.0% |
| Hispanic or Latino | 4,246 | 93.8% |
| Native / Alaskan | 0 | 0.0% |
| White / Caucasian | 2,261 | 50.0% |
| Two or more Races | 1,959 | 43.3% |
| Some other Race | 264 | 5.8% |
| Total | 4,525 | 100.0% |
Ancestry in La Joya
The most populous ancestries reported in La Joya are Mexican (4,018 | 88.8%), American (208 | 4.6%), Irish (50 | 1.1%), and Sri Lankan (41 | 0.9%), together accounting for 95.4% of all La Joya residents.
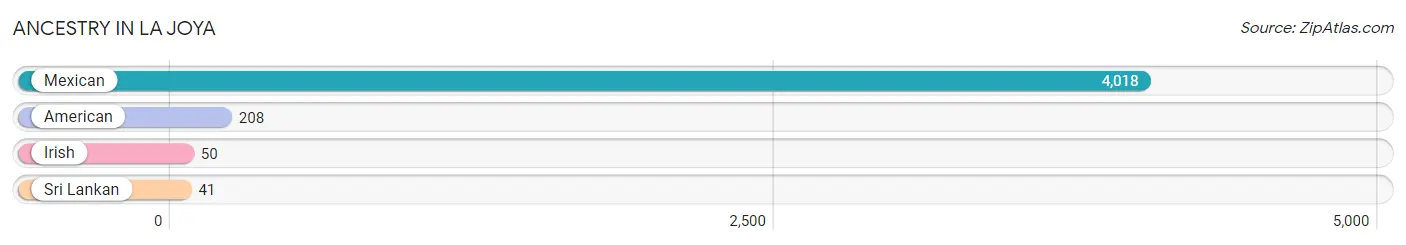
| Ancestry | # Population | % Population |
| American | 208 | 4.6% |
| Irish | 50 | 1.1% |
| Mexican | 4,018 | 88.8% |
| Sri Lankan | 41 | 0.9% | View All 4 Rows |
Immigrants in La Joya
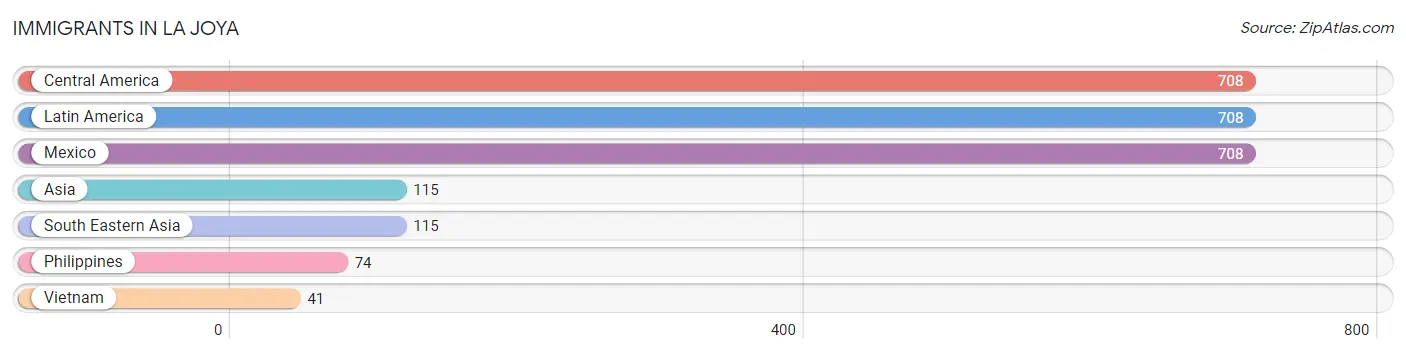
The most numerous immigrant groups reported in La Joya came from Central America (708 | 15.7%), Latin America (708 | 15.7%), Mexico (708 | 15.7%), Asia (115 | 2.5%), and South Eastern Asia (115 | 2.5%), together accounting for 52.0% of all La Joya residents.
| Immigration Origin | # Population | % Population |
| Asia | 115 | 2.5% |
| Central America | 708 | 15.7% |
| Latin America | 708 | 15.7% |
| Mexico | 708 | 15.7% |
| Philippines | 74 | 1.6% |
| South Eastern Asia | 115 | 2.5% |
| Vietnam | 41 | 0.9% | View All 7 Rows |
Sex and Age in La Joya
Sex and Age in La Joya
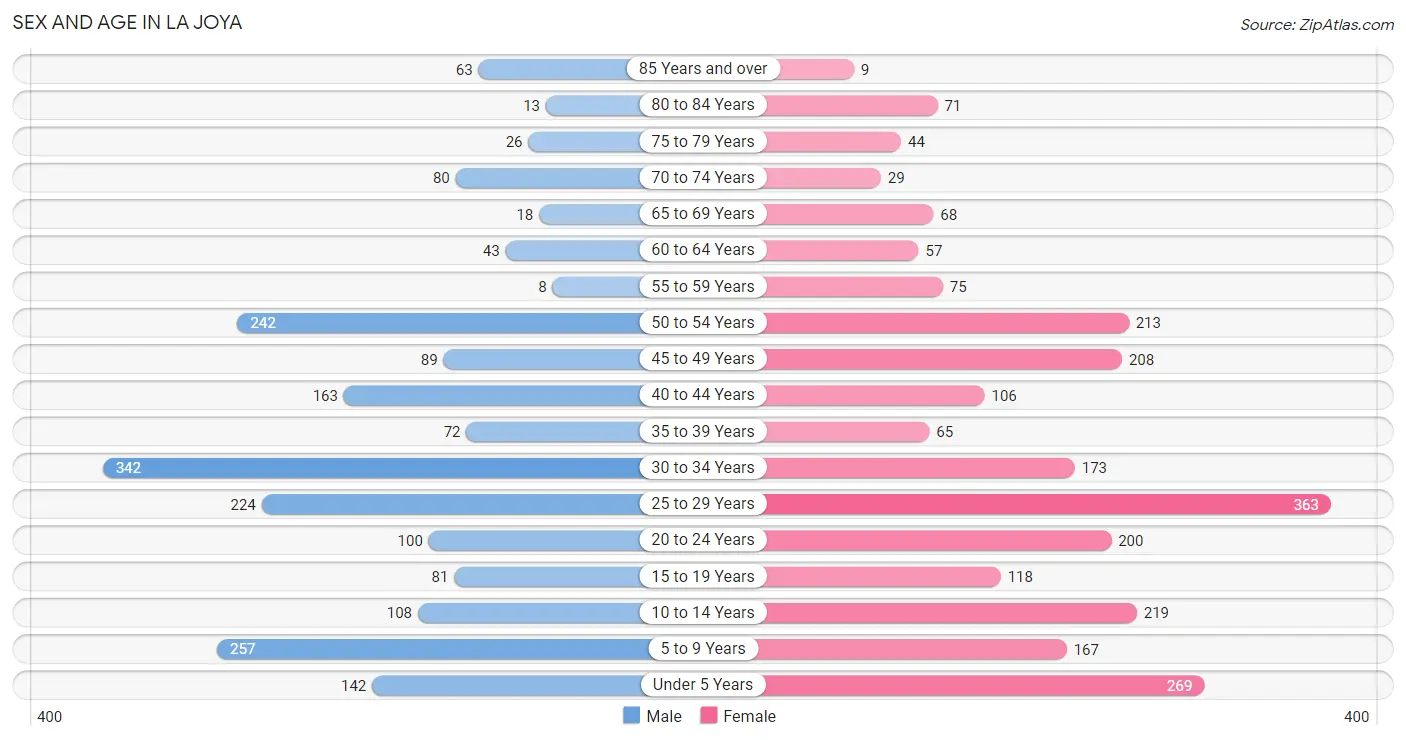
The most populous age groups in La Joya are 30 to 34 Years (342 | 16.5%) for men and 25 to 29 Years (363 | 14.8%) for women.
| Age Bracket | Male | Female |
| Under 5 Years | 142 (6.9%) | 269 (11.0%) |
| 5 to 9 Years | 257 (12.4%) | 167 (6.8%) |
| 10 to 14 Years | 108 (5.2%) | 219 (8.9%) |
| 15 to 19 Years | 81 (3.9%) | 118 (4.8%) |
| 20 to 24 Years | 100 (4.8%) | 200 (8.2%) |
| 25 to 29 Years | 224 (10.8%) | 363 (14.8%) |
| 30 to 34 Years | 342 (16.5%) | 173 (7.0%) |
| 35 to 39 Years | 72 (3.5%) | 65 (2.6%) |
| 40 to 44 Years | 163 (7.9%) | 106 (4.3%) |
| 45 to 49 Years | 89 (4.3%) | 208 (8.5%) |
| 50 to 54 Years | 242 (11.7%) | 213 (8.7%) |
| 55 to 59 Years | 8 (0.4%) | 75 (3.1%) |
| 60 to 64 Years | 43 (2.1%) | 57 (2.3%) |
| 65 to 69 Years | 18 (0.9%) | 68 (2.8%) |
| 70 to 74 Years | 80 (3.9%) | 29 (1.2%) |
| 75 to 79 Years | 26 (1.3%) | 44 (1.8%) |
| 80 to 84 Years | 13 (0.6%) | 71 (2.9%) |
| 85 Years and over | 63 (3.0%) | 9 (0.4%) |
| Total | 2,071 (100.0%) | 2,454 (100.0%) |
Families and Households in La Joya
Median Family Size in La Joya
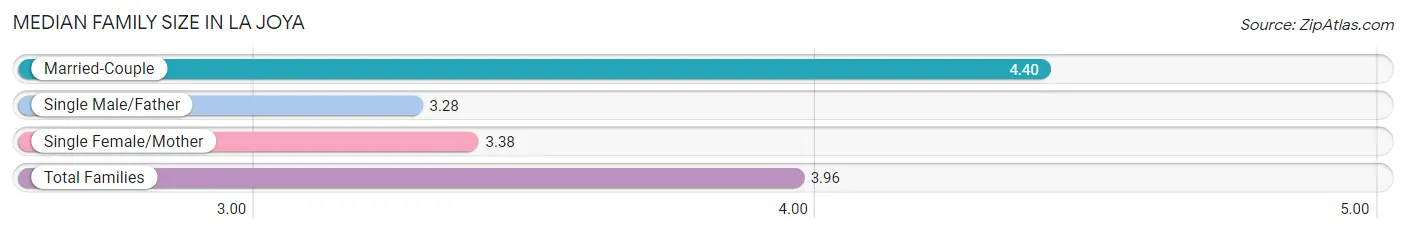
The median family size in La Joya is 3.96 persons per family, with married-couple families (600 | 57.0%) accounting for the largest median family size of 4.4 persons per family. On the other hand, single male/father families (69 | 6.6%) represent the smallest median family size with 3.28 persons per family.
| Family Type | # Families | Family Size |
| Married-Couple | 600 (57.0%) | 4.40 |
| Single Male/Father | 69 (6.6%) | 3.28 |
| Single Female/Mother | 383 (36.4%) | 3.38 |
| Total Families | 1,052 (100.0%) | 3.96 |
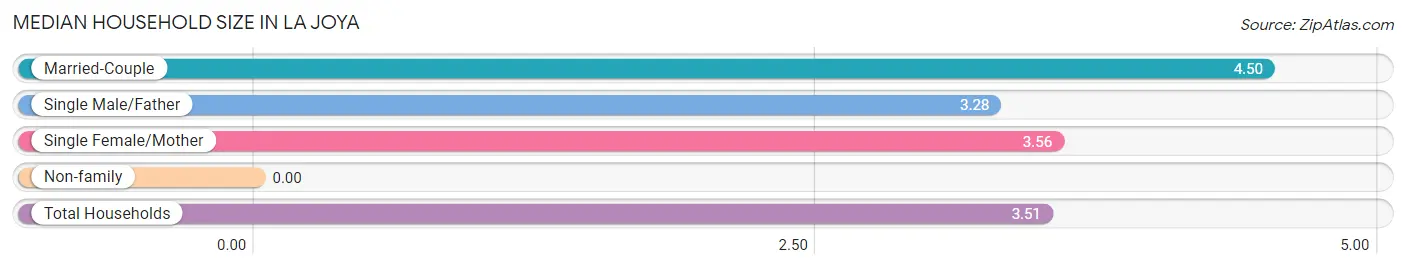
Median Household Size in La Joya
| Household Type | # Households | Household Size |
| Married-Couple | 600 (46.6%) | 4.50 |
| Single Male/Father | 69 (5.3%) | 3.28 |
| Single Female/Mother | 383 (29.7%) | 3.56 |
| Non-family | 237 (18.4%) | - |
| Total Households | 1,289 (100.0%) | 3.51 |
Household Size by Marriage Status in La Joya
Out of a total of 1,289 households in La Joya, 1,052 (81.6%) are family households, while 237 (18.4%) are nonfamily households. The most numerous type of family households are 4-person households, comprising 406, and the most common type of nonfamily households are 1-person households, comprising 237.
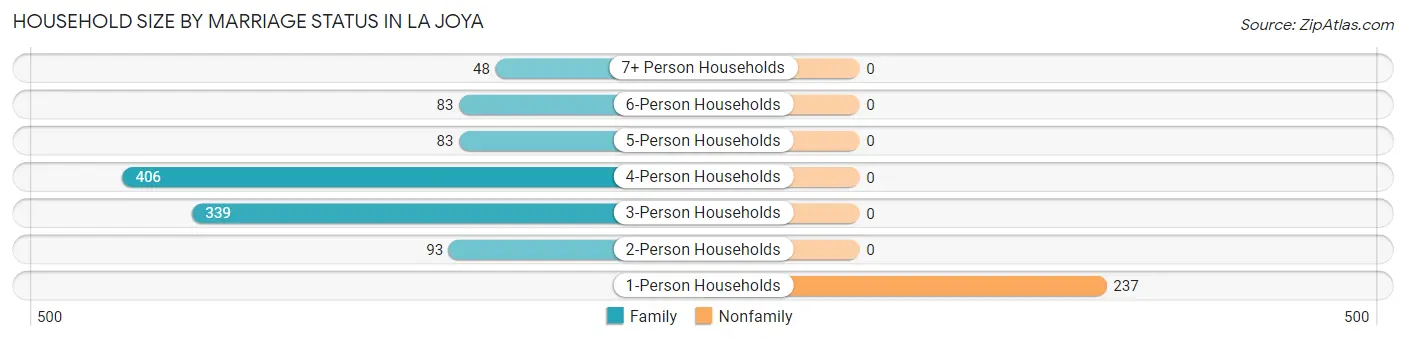
| Household Size | Family Households | Nonfamily Households |
| 1-Person Households | - | 237 (18.4%) |
| 2-Person Households | 93 (7.2%) | 0 (0.0%) |
| 3-Person Households | 339 (26.3%) | 0 (0.0%) |
| 4-Person Households | 406 (31.5%) | 0 (0.0%) |
| 5-Person Households | 83 (6.4%) | 0 (0.0%) |
| 6-Person Households | 83 (6.4%) | 0 (0.0%) |
| 7+ Person Households | 48 (3.7%) | 0 (0.0%) |
| Total | 1,052 (81.6%) | 237 (18.4%) |
Female Fertility in La Joya
Fertility by Age in La Joya
Average fertility rate in La Joya is 95.0 births per 1,000 women. Women in the age bracket of 20 to 34 years have the highest fertility rate with 159.0 births per 1,000 women. Women in the age bracket of 20 to 34 years acount for 100.0% of all women with births.
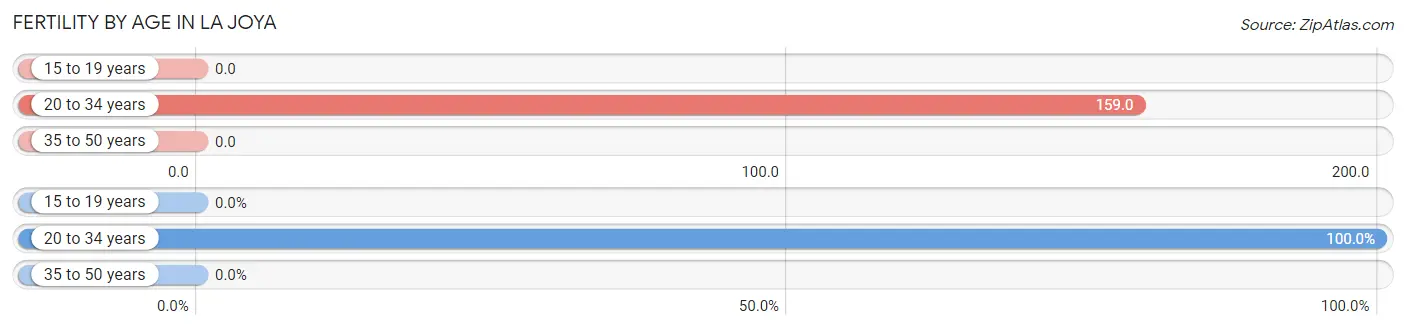
| Age Bracket | Women with Births | Births / 1,000 Women |
| 15 to 19 years | 0 (0.0%) | 0.0 |
| 20 to 34 years | 117 (100.0%) | 159.0 |
| 35 to 50 years | 0 (0.0%) | 0.0 |
| Total | 117 (100.0%) | 95.0 |
Fertility by Age by Marriage Status in La Joya
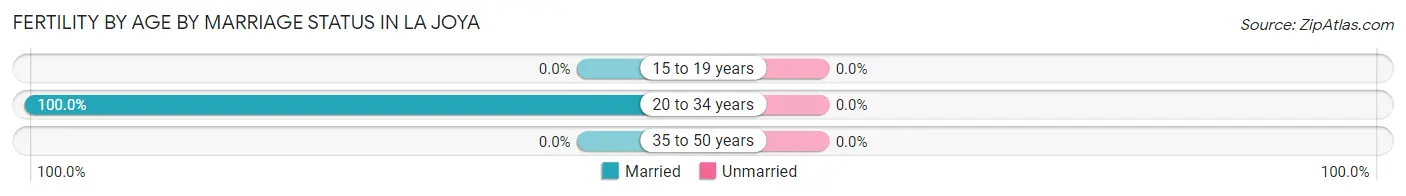
| Age Bracket | Married | Unmarried |
| 15 to 19 years | 0 (0.0%) | 0 (0.0%) |
| 20 to 34 years | 117 (100.0%) | 0 (0.0%) |
| 35 to 50 years | 0 (0.0%) | 0 (0.0%) |
| Total | 117 (100.0%) | 0 (0.0%) |
Fertility by Education in La Joya
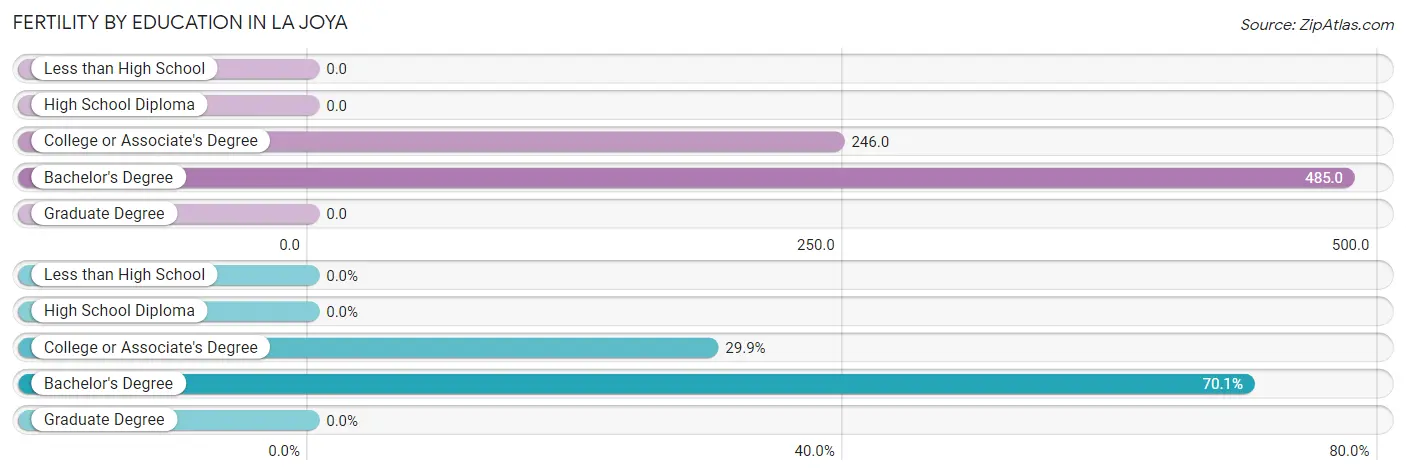
| Educational Attainment | Women with Births | Births / 1,000 Women |
| Less than High School | 0 (0.0%) | 0.0 |
| High School Diploma | 0 (0.0%) | 0.0 |
| College or Associate's Degree | 35 (29.9%) | 246.0 |
| Bachelor's Degree | 82 (70.1%) | 485.0 |
| Graduate Degree | 0 (0.0%) | 0.0 |
| Total | 117 (100.0%) | 95.0 |
Fertility by Education by Marriage Status in La Joya
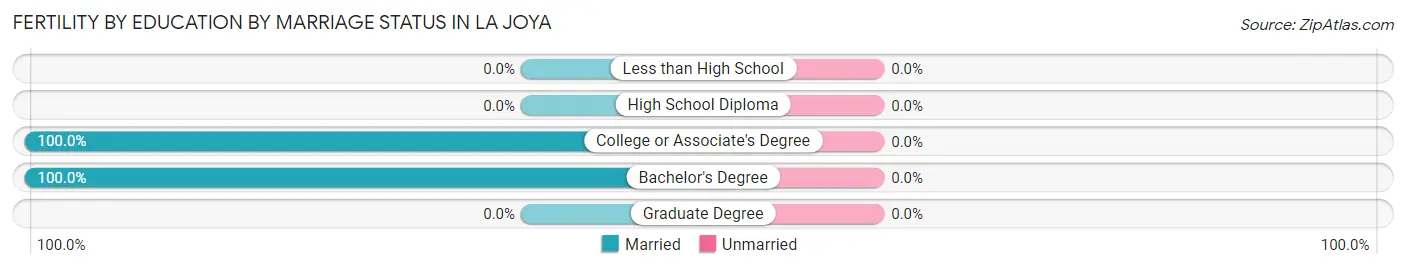
| Educational Attainment | Married | Unmarried |
| Less than High School | 0 (0.0%) | 0 (0.0%) |
| High School Diploma | 0 (0.0%) | 0 (0.0%) |
| College or Associate's Degree | 35 (100.0%) | 0 (0.0%) |
| Bachelor's Degree | 82 (100.0%) | 0 (0.0%) |
| Graduate Degree | 0 (0.0%) | 0 (0.0%) |
| Total | 117 (100.0%) | 0 (0.0%) |
Employment Characteristics in La Joya
Employment by Class of Employer in La Joya
Among the 1,615 employed individuals in La Joya, private company employees (954 | 59.1%), local government employees (364 | 22.5%), and self-employed (not incorporated) (132 | 8.2%) make up the most common classes of employment.
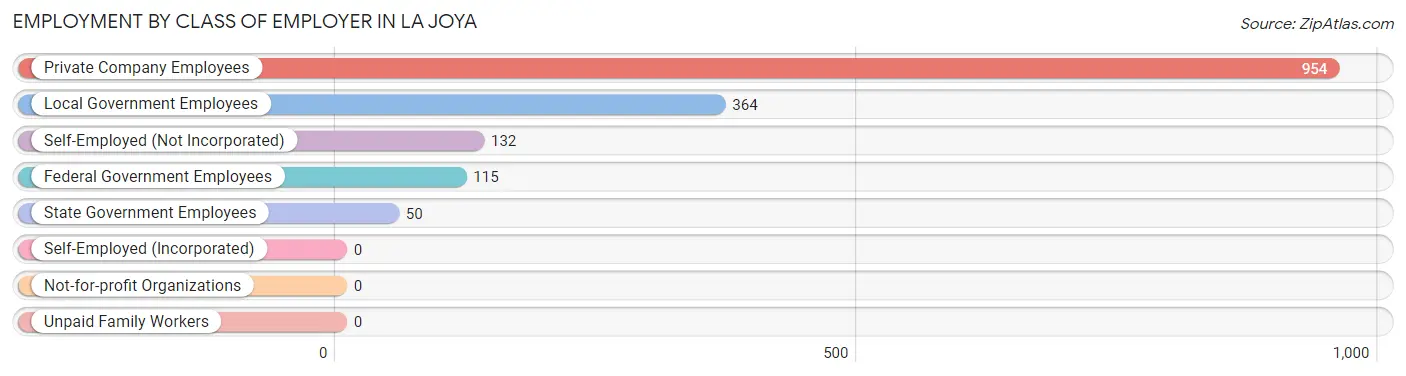
| Employer Class | # Employees | % Employees |
| Private Company Employees | 954 | 59.1% |
| Self-Employed (Incorporated) | 0 | 0.0% |
| Self-Employed (Not Incorporated) | 132 | 8.2% |
| Not-for-profit Organizations | 0 | 0.0% |
| Local Government Employees | 364 | 22.5% |
| State Government Employees | 50 | 3.1% |
| Federal Government Employees | 115 | 7.1% |
| Unpaid Family Workers | 0 | 0.0% |
| Total | 1,615 | 100.0% |
Employment Status by Age in La Joya
According to the labor force statistics for La Joya, out of the total population over 16 years of age (3,363), 56.4% or 1,897 individuals are in the labor force, with 7.3% or 138 of them unemployed. The age group with the highest labor force participation rate is 35 to 44 years, with 100.0% or 406 individuals in the labor force. Within the labor force, the 20 to 24 years age range has the highest percentage of unemployed individuals, with 36.3% or 78 of them being unemployed.
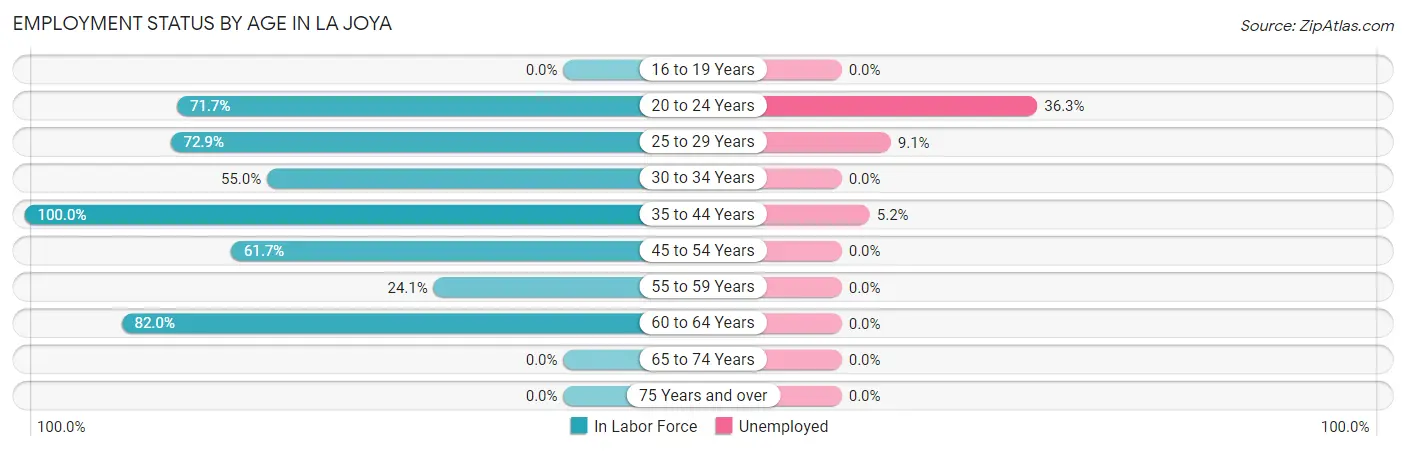
| Age Bracket | In Labor Force | Unemployed |
| 16 to 19 Years | 0 (0.0%) | 0 (0.0%) |
| 20 to 24 Years | 215 (71.7%) | 78 (36.3%) |
| 25 to 29 Years | 428 (72.9%) | 39 (9.1%) |
| 30 to 34 Years | 283 (55.0%) | 0 (0.0%) |
| 35 to 44 Years | 406 (100.0%) | 21 (5.2%) |
| 45 to 54 Years | 464 (61.7%) | 0 (0.0%) |
| 55 to 59 Years | 20 (24.1%) | 0 (0.0%) |
| 60 to 64 Years | 82 (82.0%) | 0 (0.0%) |
| 65 to 74 Years | 0 (0.0%) | 0 (0.0%) |
| 75 Years and over | 0 (0.0%) | 0 (0.0%) |
| Total | 1,897 (56.4%) | 138 (7.3%) |
Employment Status by Educational Attainment in La Joya
According to labor force statistics for La Joya, 68.9% of individuals (1,683) out of the total population between 25 and 64 years of age (2,443) are in the labor force, with 3.6% or 61 of them being unemployed. The group with the highest labor force participation rate are those with the educational attainment of bachelor's degree or higher, with 88.0% or 566 individuals in the labor force. Within the labor force, individuals with less than high school education have the highest percentage of unemployment, with 10.6% or 39 of them being unemployed.
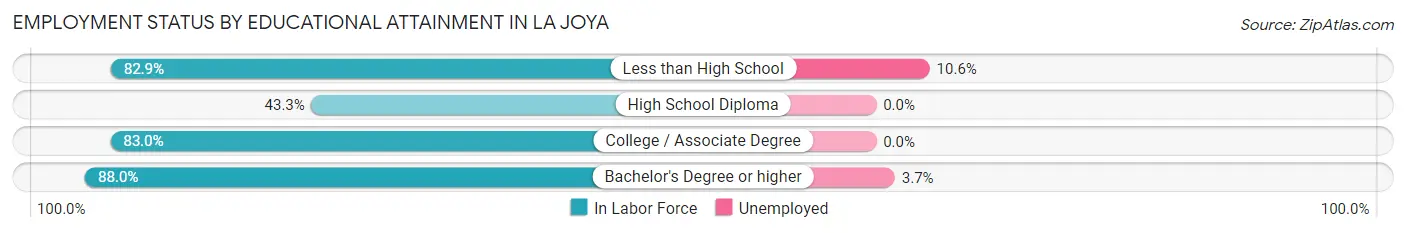
| Educational Attainment | In Labor Force | Unemployed |
| Less than High School | 368 (82.9%) | 47 (10.6%) |
| High School Diploma | 411 (43.3%) | 0 (0.0%) |
| College / Associate Degree | 338 (83.0%) | 0 (0.0%) |
| Bachelor's Degree or higher | 566 (88.0%) | 24 (3.7%) |
| Total | 1,683 (68.9%) | 88 (3.6%) |
Employment Occupations by Sex in La Joya
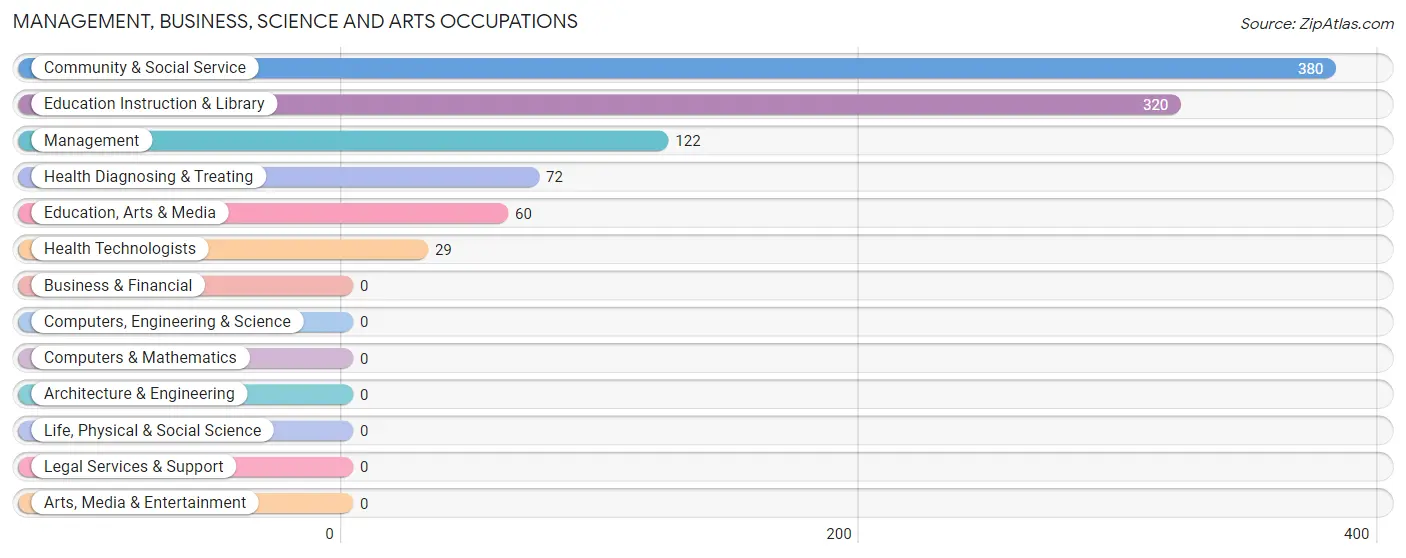
Management, Business, Science and Arts Occupations
The most common Management, Business, Science and Arts occupations in La Joya are Community & Social Service (380 | 21.6%), Education Instruction & Library (320 | 18.2%), Management (122 | 6.9%), Health Diagnosing & Treating (72 | 4.1%), and Education, Arts & Media (60 | 3.4%).
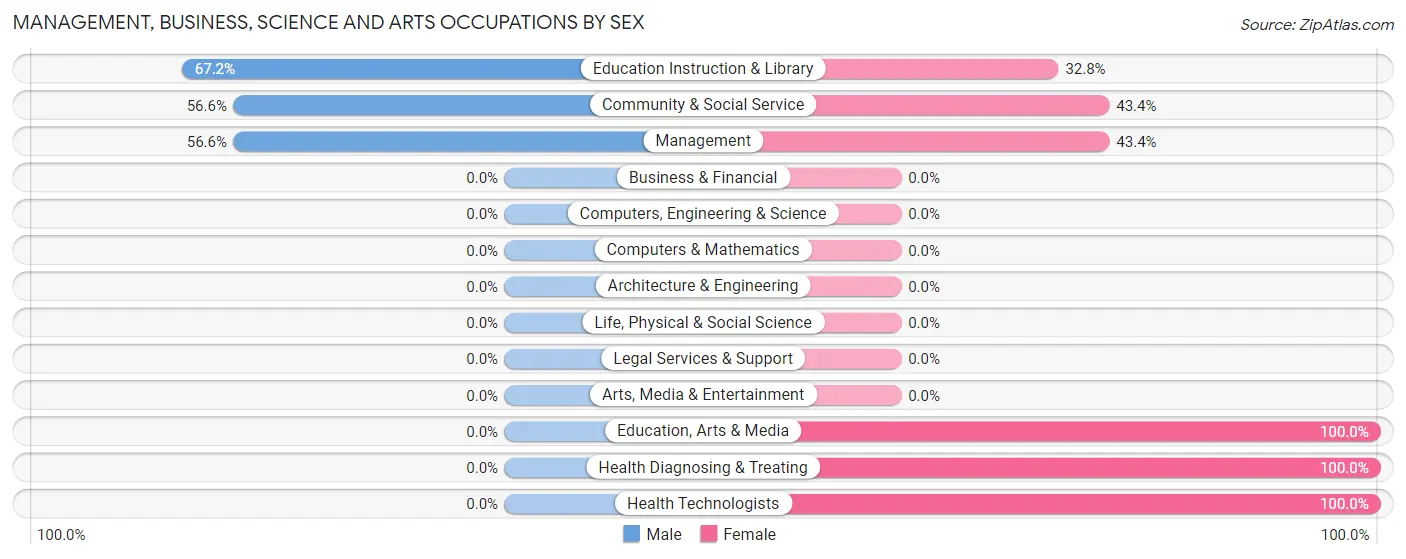
Management, Business, Science and Arts Occupations by Sex
Within the Management, Business, Science and Arts occupations in La Joya, the most male-oriented occupations are Education Instruction & Library (67.2%), Community & Social Service (56.6%), and Management (56.6%), while the most female-oriented occupations are Education, Arts & Media (100.0%), Health Diagnosing & Treating (100.0%), and Health Technologists (100.0%).
| Occupation | Male | Female |
| Management | 69 (56.6%) | 53 (43.4%) |
| Business & Financial | 0 (0.0%) | 0 (0.0%) |
| Computers, Engineering & Science | 0 (0.0%) | 0 (0.0%) |
| Computers & Mathematics | 0 (0.0%) | 0 (0.0%) |
| Architecture & Engineering | 0 (0.0%) | 0 (0.0%) |
| Life, Physical & Social Science | 0 (0.0%) | 0 (0.0%) |
| Community & Social Service | 215 (56.6%) | 165 (43.4%) |
| Education, Arts & Media | 0 (0.0%) | 60 (100.0%) |
| Legal Services & Support | 0 (0.0%) | 0 (0.0%) |
| Education Instruction & Library | 215 (67.2%) | 105 (32.8%) |
| Arts, Media & Entertainment | 0 (0.0%) | 0 (0.0%) |
| Health Diagnosing & Treating | 0 (0.0%) | 72 (100.0%) |
| Health Technologists | 0 (0.0%) | 29 (100.0%) |
| Total (Category) | 284 (49.5%) | 290 (50.5%) |
| Total (Overall) | 993 (56.4%) | 767 (43.6%) |
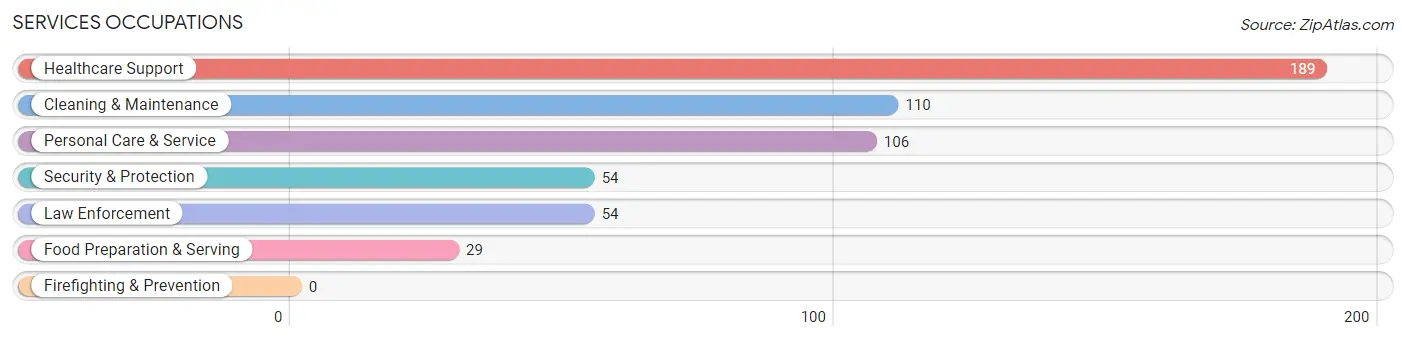
Services Occupations
The most common Services occupations in La Joya are Healthcare Support (189 | 10.7%), Cleaning & Maintenance (110 | 6.2%), Personal Care & Service (106 | 6.0%), Security & Protection (54 | 3.1%), and Law Enforcement (54 | 3.1%).
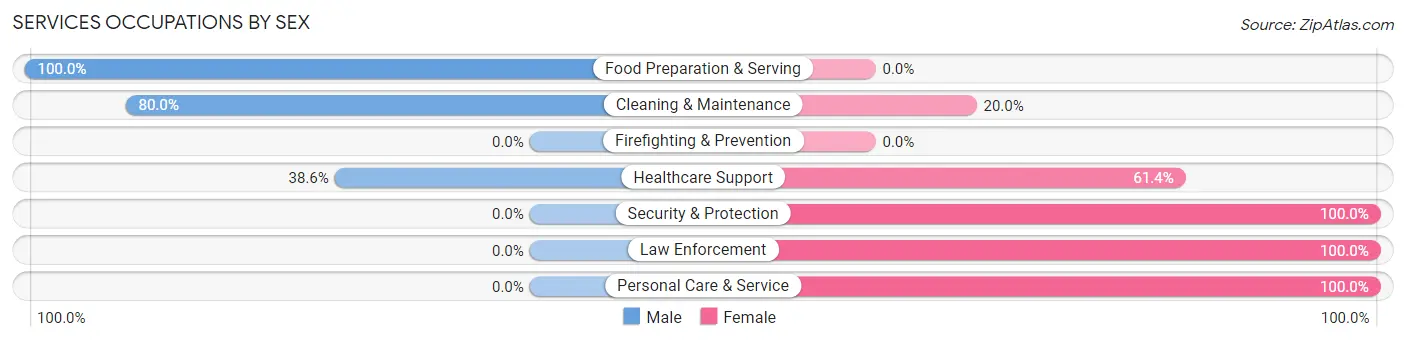
Services Occupations by Sex
Within the Services occupations in La Joya, the most male-oriented occupations are Food Preparation & Serving (100.0%), Cleaning & Maintenance (80.0%), and Healthcare Support (38.6%), while the most female-oriented occupations are Security & Protection (100.0%), Law Enforcement (100.0%), and Personal Care & Service (100.0%).
| Occupation | Male | Female |
| Healthcare Support | 73 (38.6%) | 116 (61.4%) |
| Security & Protection | 0 (0.0%) | 54 (100.0%) |
| Firefighting & Prevention | 0 (0.0%) | 0 (0.0%) |
| Law Enforcement | 0 (0.0%) | 54 (100.0%) |
| Food Preparation & Serving | 29 (100.0%) | 0 (0.0%) |
| Cleaning & Maintenance | 88 (80.0%) | 22 (20.0%) |
| Personal Care & Service | 0 (0.0%) | 106 (100.0%) |
| Total (Category) | 190 (38.9%) | 298 (61.1%) |
| Total (Overall) | 993 (56.4%) | 767 (43.6%) |
Sales and Office Occupations
The most common Sales and Office occupations in La Joya are Office & Administration (255 | 14.5%), and Sales & Related (44 | 2.5%).
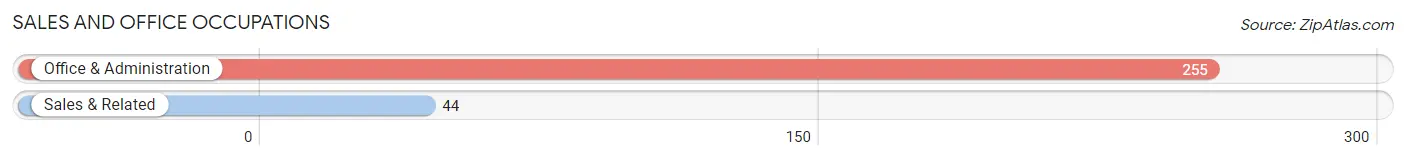
Sales and Office Occupations by Sex
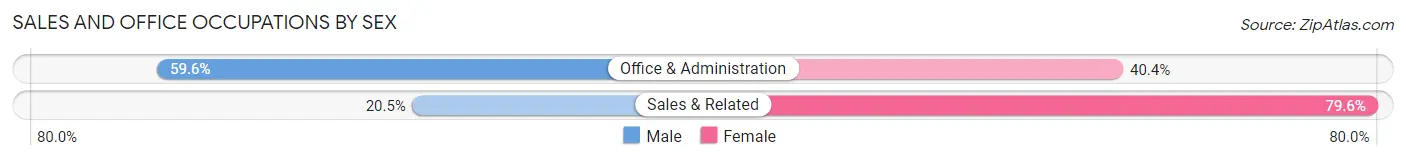
| Occupation | Male | Female |
| Sales & Related | 9 (20.4%) | 35 (79.5%) |
| Office & Administration | 152 (59.6%) | 103 (40.4%) |
| Total (Category) | 161 (53.8%) | 138 (46.2%) |
| Total (Overall) | 993 (56.4%) | 767 (43.6%) |
Natural Resources, Construction and Maintenance Occupations
The most common Natural Resources, Construction and Maintenance occupations in La Joya are , and Construction & Extraction (137 | 7.8%).
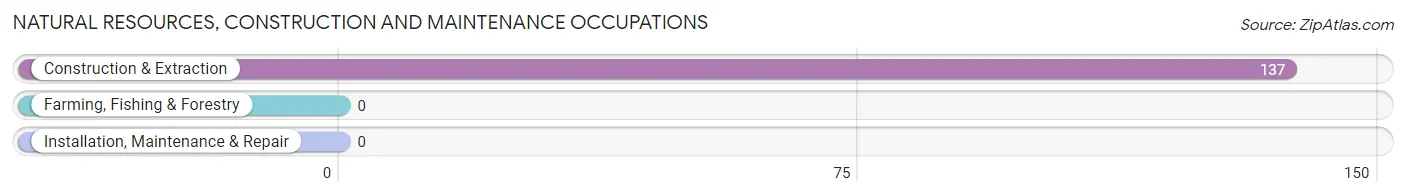
Natural Resources, Construction and Maintenance Occupations by Sex
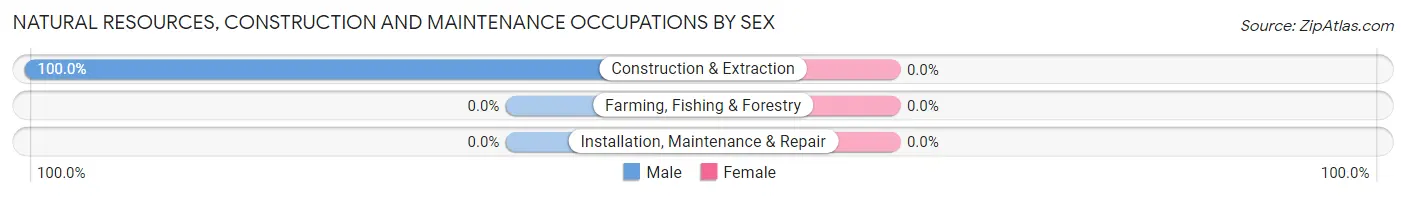
| Occupation | Male | Female |
| Farming, Fishing & Forestry | 0 (0.0%) | 0 (0.0%) |
| Construction & Extraction | 137 (100.0%) | 0 (0.0%) |
| Installation, Maintenance & Repair | 0 (0.0%) | 0 (0.0%) |
| Total (Category) | 137 (100.0%) | 0 (0.0%) |
| Total (Overall) | 993 (56.4%) | 767 (43.6%) |
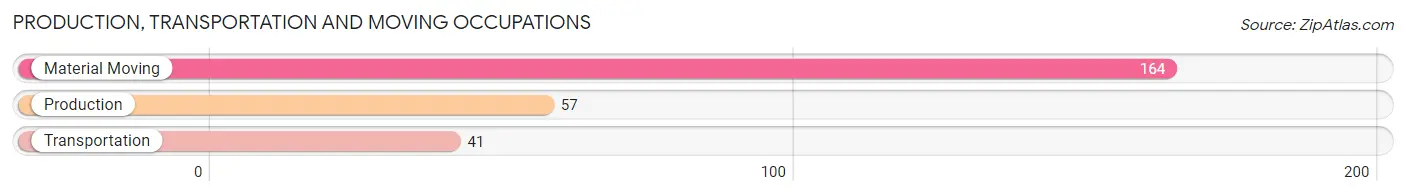
Production, Transportation and Moving Occupations
The most common Production, Transportation and Moving occupations in La Joya are Material Moving (164 | 9.3%), Production (57 | 3.2%), and Transportation (41 | 2.3%).
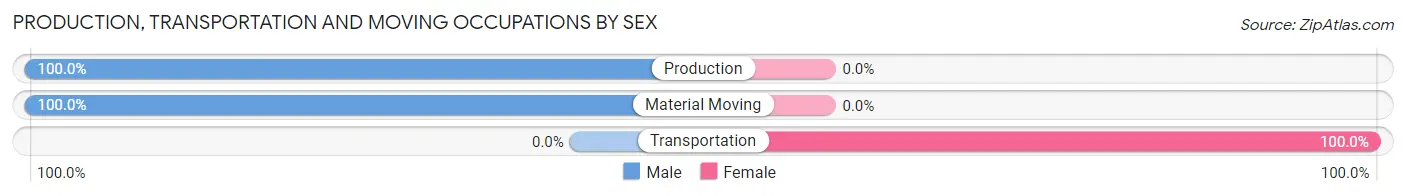
Production, Transportation and Moving Occupations by Sex
| Occupation | Male | Female |
| Production | 57 (100.0%) | 0 (0.0%) |
| Transportation | 0 (0.0%) | 41 (100.0%) |
| Material Moving | 164 (100.0%) | 0 (0.0%) |
| Total (Category) | 221 (84.4%) | 41 (15.7%) |
| Total (Overall) | 993 (56.4%) | 767 (43.6%) |
Employment Industries by Sex in La Joya
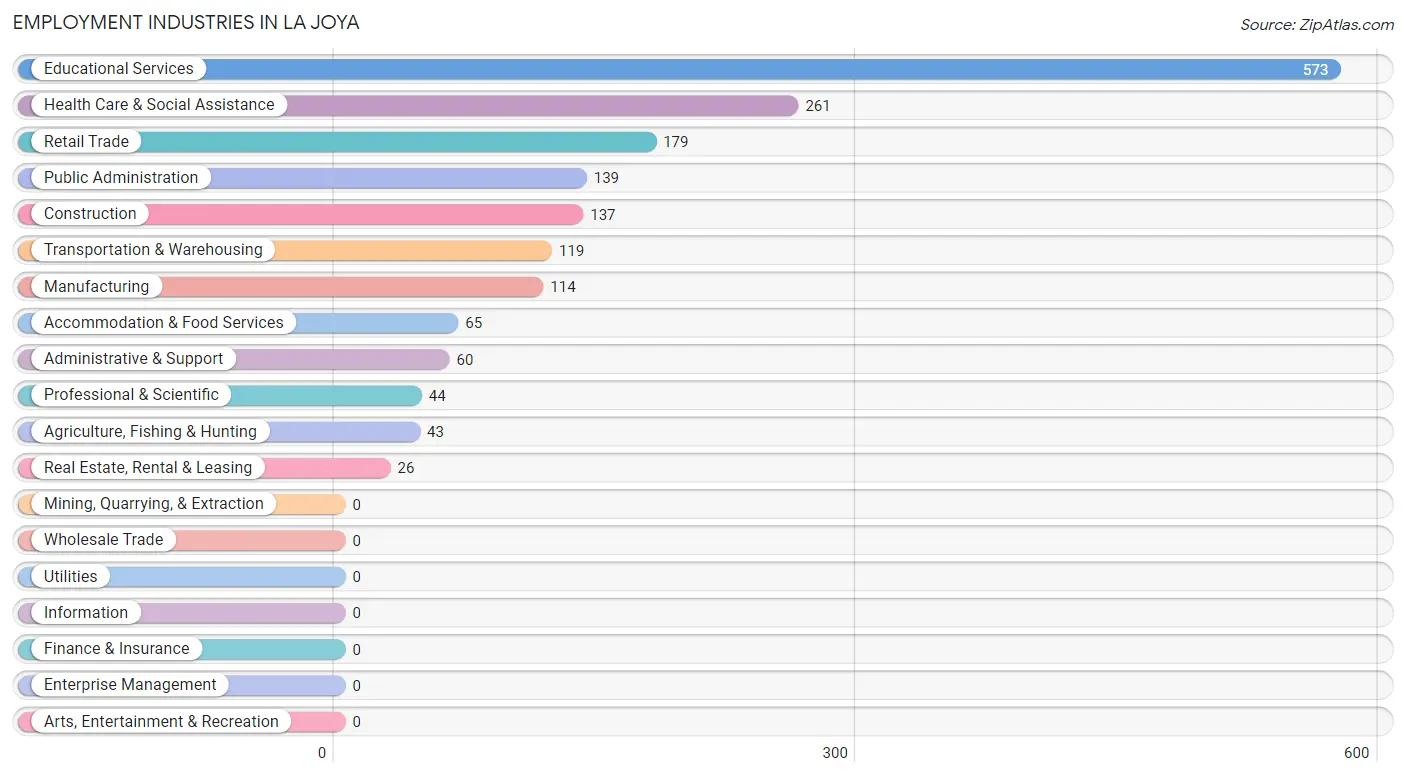
Employment Industries in La Joya
The major employment industries in La Joya include Educational Services (573 | 32.6%), Health Care & Social Assistance (261 | 14.8%), Retail Trade (179 | 10.2%), Public Administration (139 | 7.9%), and Construction (137 | 7.8%).
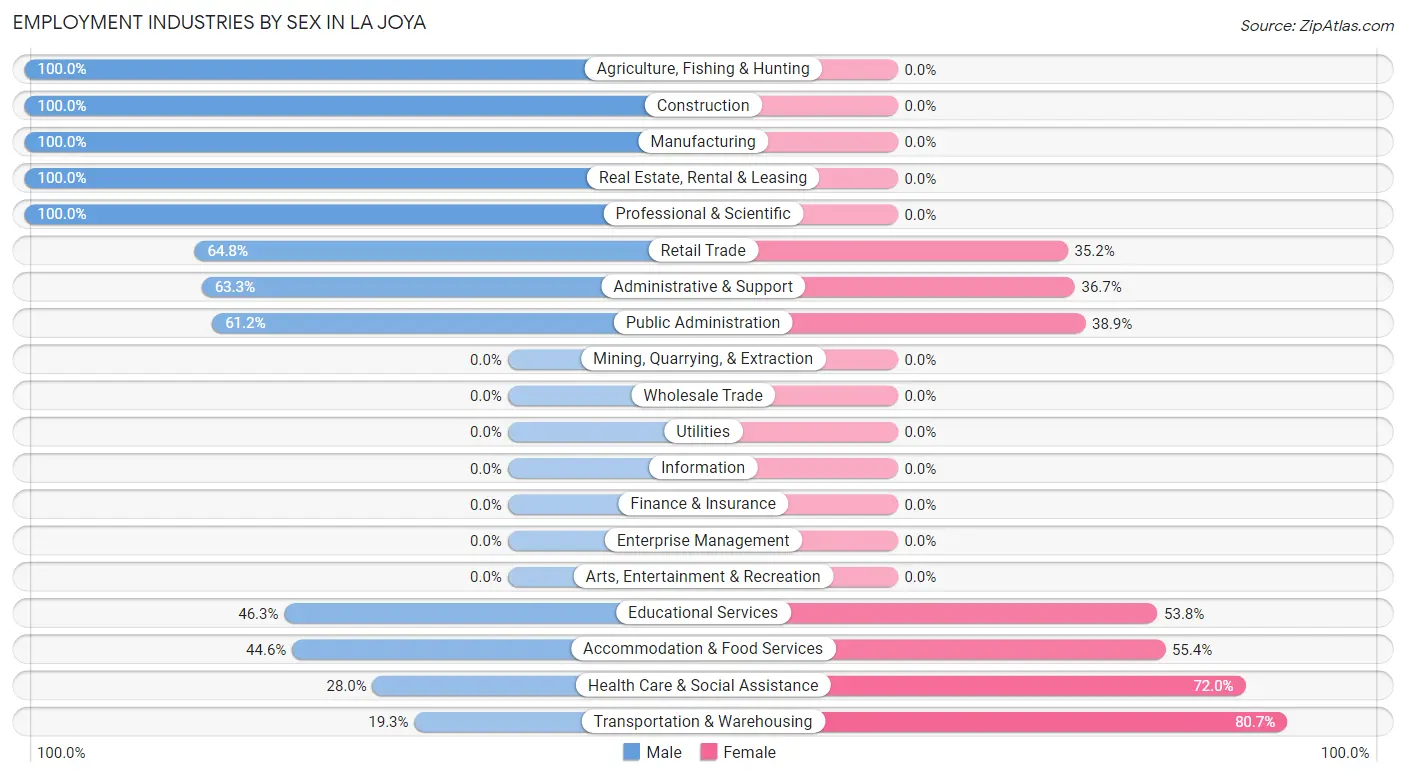
Employment Industries by Sex in La Joya
The La Joya industries that see more men than women are Agriculture, Fishing & Hunting (100.0%), Construction (100.0%), and Manufacturing (100.0%), whereas the industries that tend to have a higher number of women are Transportation & Warehousing (80.7%), Health Care & Social Assistance (72.0%), and Accommodation & Food Services (55.4%).
| Industry | Male | Female |
| Agriculture, Fishing & Hunting | 43 (100.0%) | 0 (0.0%) |
| Mining, Quarrying, & Extraction | 0 (0.0%) | 0 (0.0%) |
| Construction | 137 (100.0%) | 0 (0.0%) |
| Manufacturing | 114 (100.0%) | 0 (0.0%) |
| Wholesale Trade | 0 (0.0%) | 0 (0.0%) |
| Retail Trade | 116 (64.8%) | 63 (35.2%) |
| Transportation & Warehousing | 23 (19.3%) | 96 (80.7%) |
| Utilities | 0 (0.0%) | 0 (0.0%) |
| Information | 0 (0.0%) | 0 (0.0%) |
| Finance & Insurance | 0 (0.0%) | 0 (0.0%) |
| Real Estate, Rental & Leasing | 26 (100.0%) | 0 (0.0%) |
| Professional & Scientific | 44 (100.0%) | 0 (0.0%) |
| Enterprise Management | 0 (0.0%) | 0 (0.0%) |
| Administrative & Support | 38 (63.3%) | 22 (36.7%) |
| Educational Services | 265 (46.3%) | 308 (53.7%) |
| Health Care & Social Assistance | 73 (28.0%) | 188 (72.0%) |
| Arts, Entertainment & Recreation | 0 (0.0%) | 0 (0.0%) |
| Accommodation & Food Services | 29 (44.6%) | 36 (55.4%) |
| Public Administration | 85 (61.2%) | 54 (38.9%) |
| Total | 993 (56.4%) | 767 (43.6%) |
Education in La Joya
School Enrollment in La Joya
The most common levels of schooling among the 986 students in La Joya are elementary school (284 | 28.8%), middle school (257 | 26.1%), and high school (244 | 24.7%).
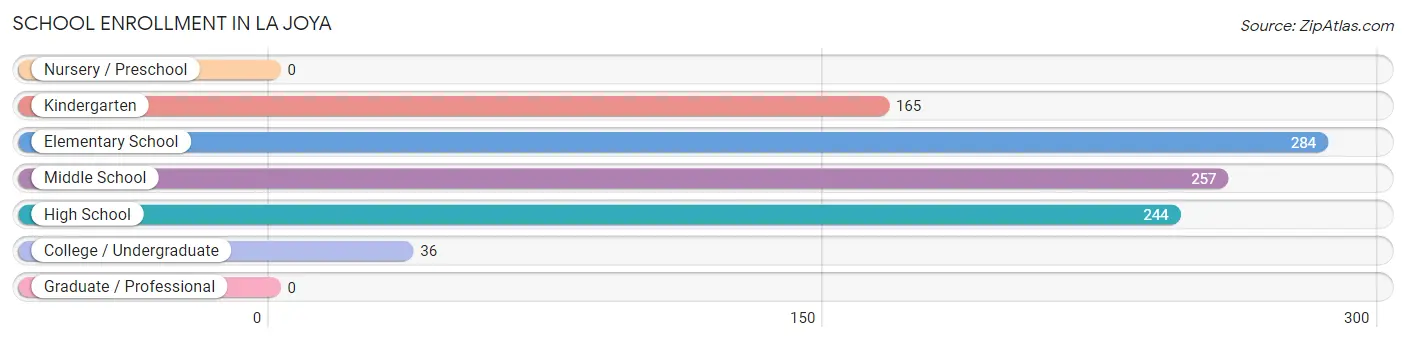
| School Level | # Students | % Students |
| Nursery / Preschool | 0 | 0.0% |
| Kindergarten | 165 | 16.7% |
| Elementary School | 284 | 28.8% |
| Middle School | 257 | 26.1% |
| High School | 244 | 24.7% |
| College / Undergraduate | 36 | 3.6% |
| Graduate / Professional | 0 | 0.0% |
| Total | 986 | 100.0% |
School Enrollment by Age by Funding Source in La Joya
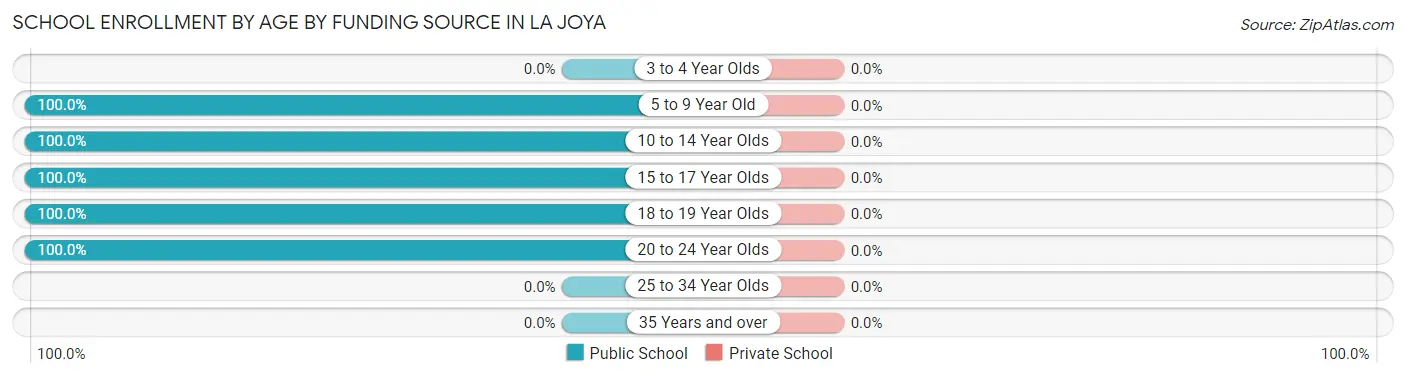
| Age Bracket | Public School | Private School |
| 3 to 4 Year Olds | 0 (0.0%) | 0 (0.0%) |
| 5 to 9 Year Old | 424 (100.0%) | 0 (0.0%) |
| 10 to 14 Year Olds | 327 (100.0%) | 0 (0.0%) |
| 15 to 17 Year Olds | 142 (100.0%) | 0 (0.0%) |
| 18 to 19 Year Olds | 57 (100.0%) | 0 (0.0%) |
| 20 to 24 Year Olds | 36 (100.0%) | 0 (0.0%) |
| 25 to 34 Year Olds | 0 (0.0%) | 0 (0.0%) |
| 35 Years and over | 0 (0.0%) | 0 (0.0%) |
| Total | 986 (100.0%) | 0 (0.0%) |
Educational Attainment by Field of Study in La Joya
Arts & humanities (116 | 16.4%), science & technology (111 | 15.7%), business (101 | 14.3%), physical & health sciences (77 | 10.9%), and psychology (77 | 10.9%) are the most common fields of study among 708 individuals in La Joya who have obtained a bachelor's degree or higher.
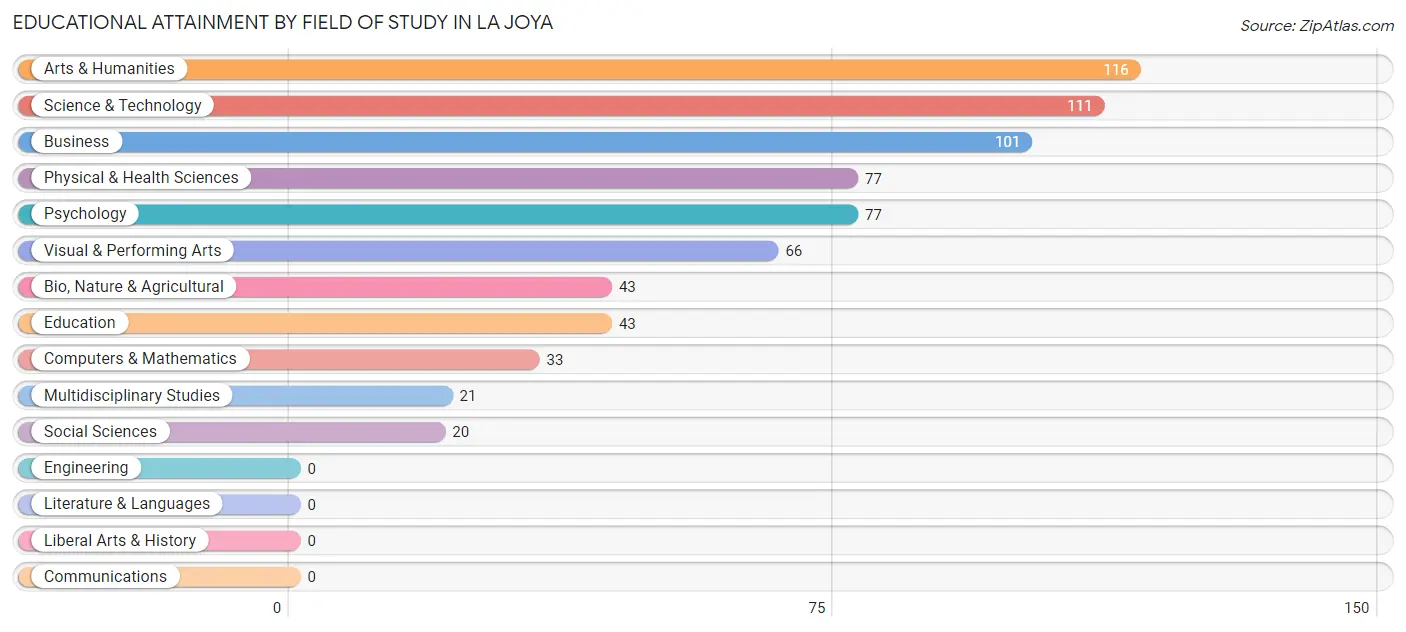
| Field of Study | # Graduates | % Graduates |
| Computers & Mathematics | 33 | 4.7% |
| Bio, Nature & Agricultural | 43 | 6.1% |
| Physical & Health Sciences | 77 | 10.9% |
| Psychology | 77 | 10.9% |
| Social Sciences | 20 | 2.8% |
| Engineering | 0 | 0.0% |
| Multidisciplinary Studies | 21 | 3.0% |
| Science & Technology | 111 | 15.7% |
| Business | 101 | 14.3% |
| Education | 43 | 6.1% |
| Literature & Languages | 0 | 0.0% |
| Liberal Arts & History | 0 | 0.0% |
| Visual & Performing Arts | 66 | 9.3% |
| Communications | 0 | 0.0% |
| Arts & Humanities | 116 | 16.4% |
| Total | 708 | 100.0% |
Transportation & Commute in La Joya
Vehicle Availability by Sex in La Joya
The most prevalent vehicle ownership categories in La Joya are males with 3 vehicles (407, accounting for 41.0%) and females with 3 vehicles (175, making up 65.4%).
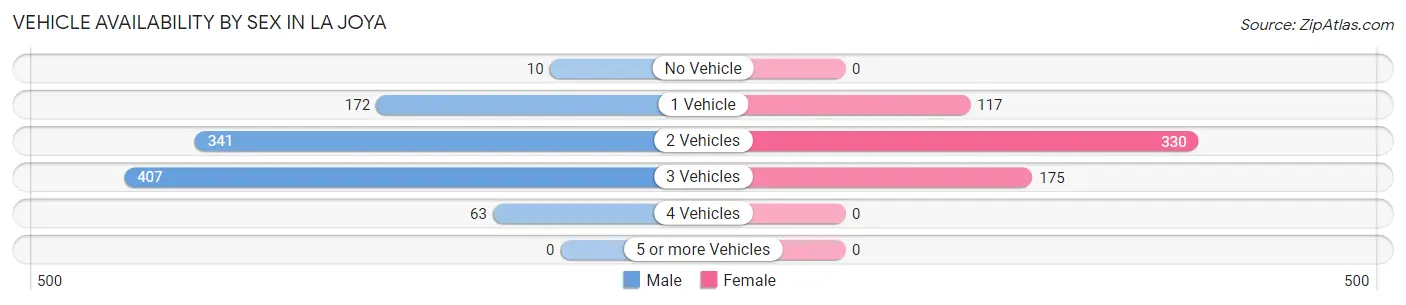
| Vehicles Available | Male | Female |
| No Vehicle | 10 (1.0%) | 0 (0.0%) |
| 1 Vehicle | 172 (17.3%) | 117 (18.8%) |
| 2 Vehicles | 341 (34.3%) | 330 (53.0%) |
| 3 Vehicles | 407 (41.0%) | 175 (28.1%) |
| 4 Vehicles | 63 (6.3%) | 0 (0.0%) |
| 5 or more Vehicles | 0 (0.0%) | 0 (0.0%) |
| Total | 993 (100.0%) | 622 (100.0%) |
Commute Time in La Joya
The most frequently occuring commute durations in La Joya are 25 to 29 minutes (279 commuters, 17.7%), 20 to 24 minutes (272 commuters, 17.3%), and 10 to 14 minutes (266 commuters, 16.9%).
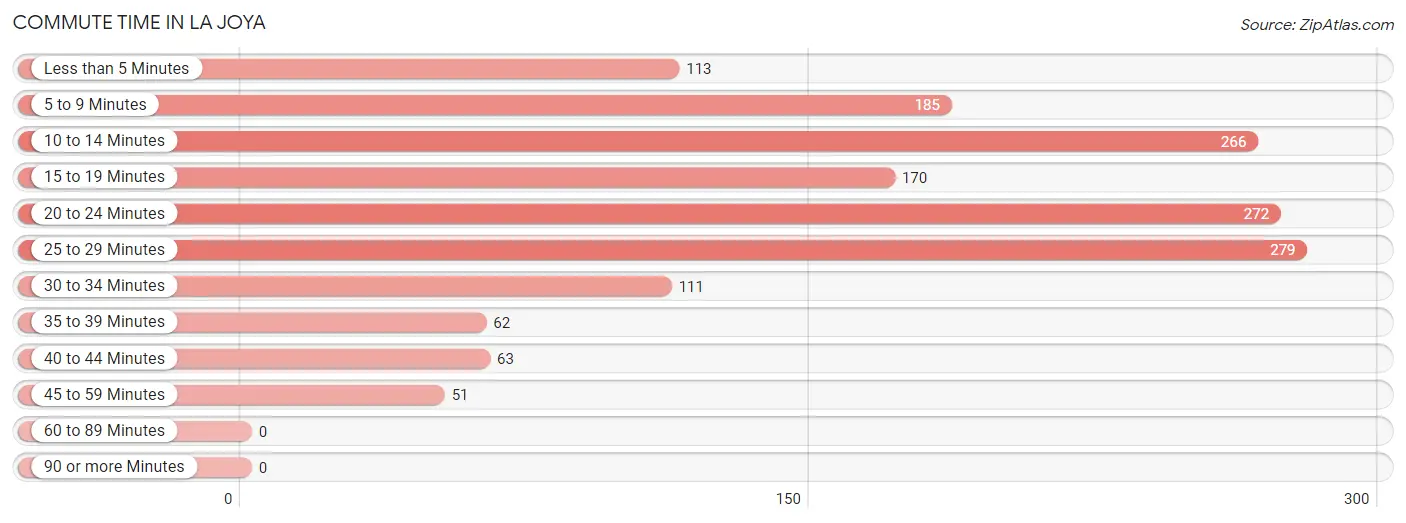
| Commute Time | # Commuters | % Commuters |
| Less than 5 Minutes | 113 | 7.2% |
| 5 to 9 Minutes | 185 | 11.8% |
| 10 to 14 Minutes | 266 | 16.9% |
| 15 to 19 Minutes | 170 | 10.8% |
| 20 to 24 Minutes | 272 | 17.3% |
| 25 to 29 Minutes | 279 | 17.7% |
| 30 to 34 Minutes | 111 | 7.1% |
| 35 to 39 Minutes | 62 | 3.9% |
| 40 to 44 Minutes | 63 | 4.0% |
| 45 to 59 Minutes | 51 | 3.2% |
| 60 to 89 Minutes | 0 | 0.0% |
| 90 or more Minutes | 0 | 0.0% |
Commute Time by Sex in La Joya
The most common commute times in La Joya are 25 to 29 minutes (243 commuters, 25.6%) for males and 15 to 19 minutes (170 commuters, 27.3%) for females.
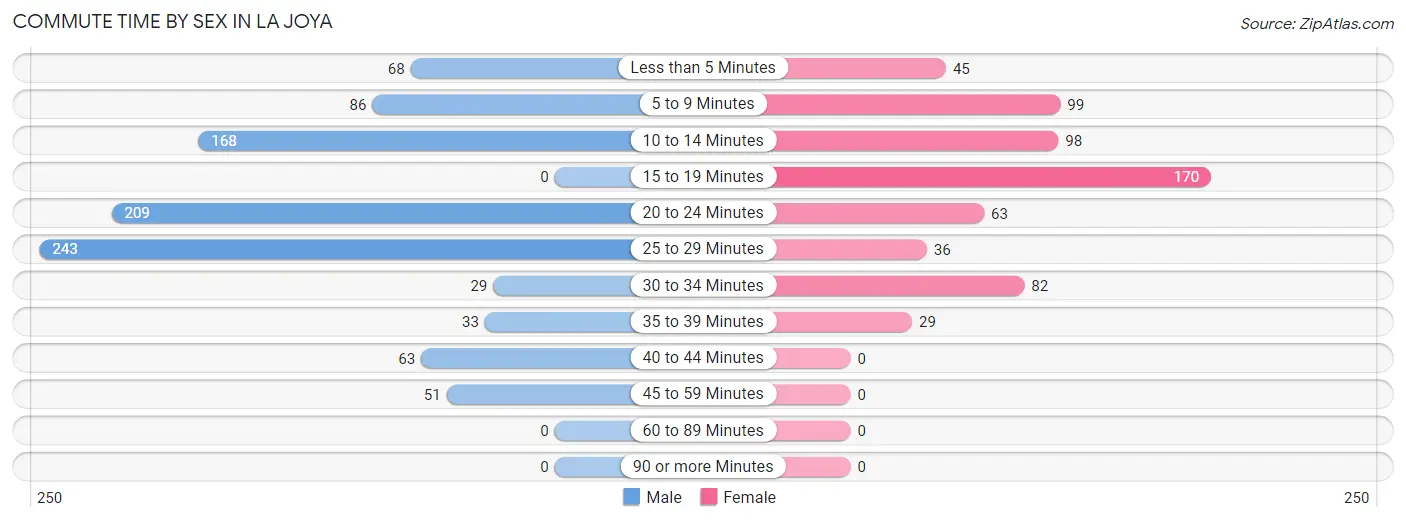
| Commute Time | Male | Female |
| Less than 5 Minutes | 68 (7.2%) | 45 (7.2%) |
| 5 to 9 Minutes | 86 (9.0%) | 99 (15.9%) |
| 10 to 14 Minutes | 168 (17.7%) | 98 (15.8%) |
| 15 to 19 Minutes | 0 (0.0%) | 170 (27.3%) |
| 20 to 24 Minutes | 209 (22.0%) | 63 (10.1%) |
| 25 to 29 Minutes | 243 (25.6%) | 36 (5.8%) |
| 30 to 34 Minutes | 29 (3.0%) | 82 (13.2%) |
| 35 to 39 Minutes | 33 (3.5%) | 29 (4.7%) |
| 40 to 44 Minutes | 63 (6.6%) | 0 (0.0%) |
| 45 to 59 Minutes | 51 (5.4%) | 0 (0.0%) |
| 60 to 89 Minutes | 0 (0.0%) | 0 (0.0%) |
| 90 or more Minutes | 0 (0.0%) | 0 (0.0%) |
Time of Departure to Work by Sex in La Joya
The most frequent times of departure to work in La Joya are 7:30 AM to 7:59 AM (252, 26.5%) for males and 7:00 AM to 7:29 AM (344, 55.3%) for females.
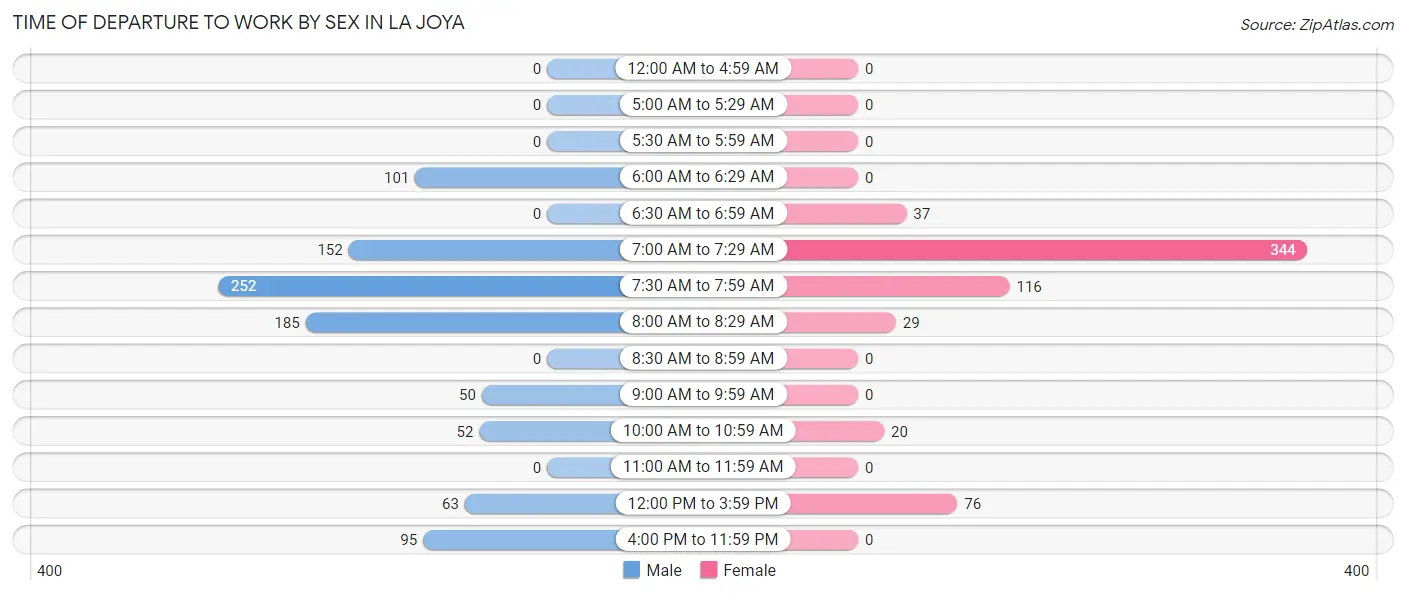
| Time of Departure | Male | Female |
| 12:00 AM to 4:59 AM | 0 (0.0%) | 0 (0.0%) |
| 5:00 AM to 5:29 AM | 0 (0.0%) | 0 (0.0%) |
| 5:30 AM to 5:59 AM | 0 (0.0%) | 0 (0.0%) |
| 6:00 AM to 6:29 AM | 101 (10.6%) | 0 (0.0%) |
| 6:30 AM to 6:59 AM | 0 (0.0%) | 37 (5.9%) |
| 7:00 AM to 7:29 AM | 152 (16.0%) | 344 (55.3%) |
| 7:30 AM to 7:59 AM | 252 (26.5%) | 116 (18.6%) |
| 8:00 AM to 8:29 AM | 185 (19.5%) | 29 (4.7%) |
| 8:30 AM to 8:59 AM | 0 (0.0%) | 0 (0.0%) |
| 9:00 AM to 9:59 AM | 50 (5.3%) | 0 (0.0%) |
| 10:00 AM to 10:59 AM | 52 (5.5%) | 20 (3.2%) |
| 11:00 AM to 11:59 AM | 0 (0.0%) | 0 (0.0%) |
| 12:00 PM to 3:59 PM | 63 (6.6%) | 76 (12.2%) |
| 4:00 PM to 11:59 PM | 95 (10.0%) | 0 (0.0%) |
| Total | 950 (100.0%) | 622 (100.0%) |
Housing Occupancy in La Joya
Occupancy by Ownership in La Joya
Of the total 1,289 dwellings in La Joya, owner-occupied units account for 800 (62.1%), while renter-occupied units make up 489 (37.9%).
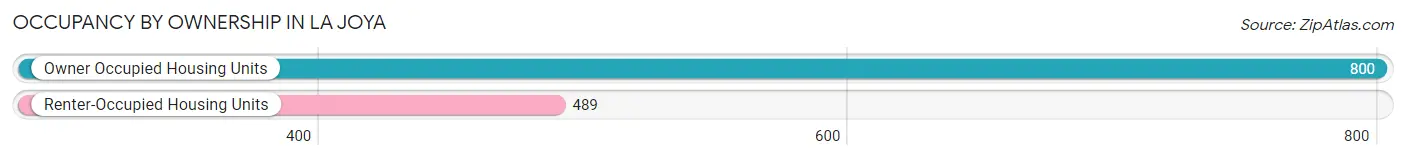
| Occupancy | # Housing Units | % Housing Units |
| Owner Occupied Housing Units | 800 | 62.1% |
| Renter-Occupied Housing Units | 489 | 37.9% |
| Total Occupied Housing Units | 1,289 | 100.0% |
Occupancy by Household Size in La Joya
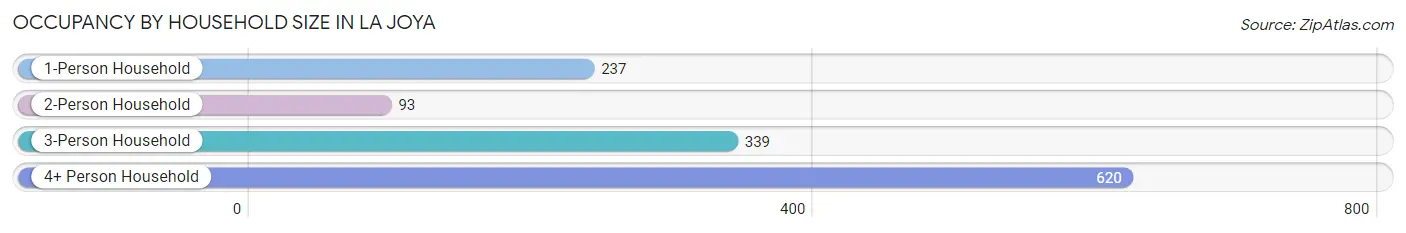
| Household Size | # Housing Units | % Housing Units |
| 1-Person Household | 237 | 18.4% |
| 2-Person Household | 93 | 7.2% |
| 3-Person Household | 339 | 26.3% |
| 4+ Person Household | 620 | 48.1% |
| Total Housing Units | 1,289 | 100.0% |
Occupancy by Ownership by Household Size in La Joya
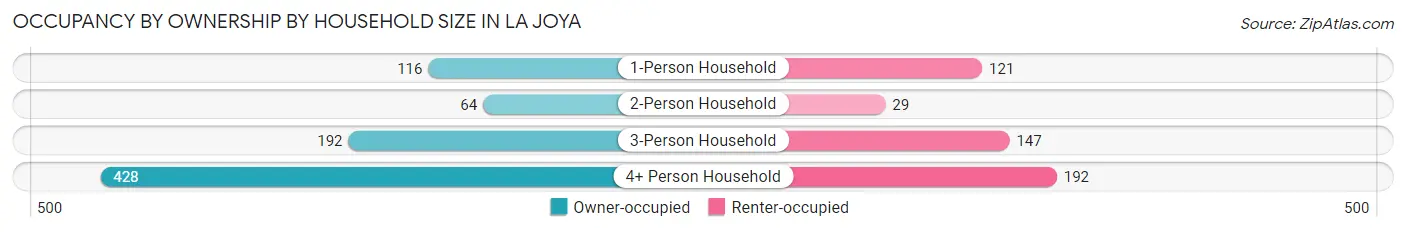
| Household Size | Owner-occupied | Renter-occupied |
| 1-Person Household | 116 (48.9%) | 121 (51.0%) |
| 2-Person Household | 64 (68.8%) | 29 (31.2%) |
| 3-Person Household | 192 (56.6%) | 147 (43.4%) |
| 4+ Person Household | 428 (69.0%) | 192 (31.0%) |
| Total Housing Units | 800 (62.1%) | 489 (37.9%) |
Occupancy by Educational Attainment in La Joya
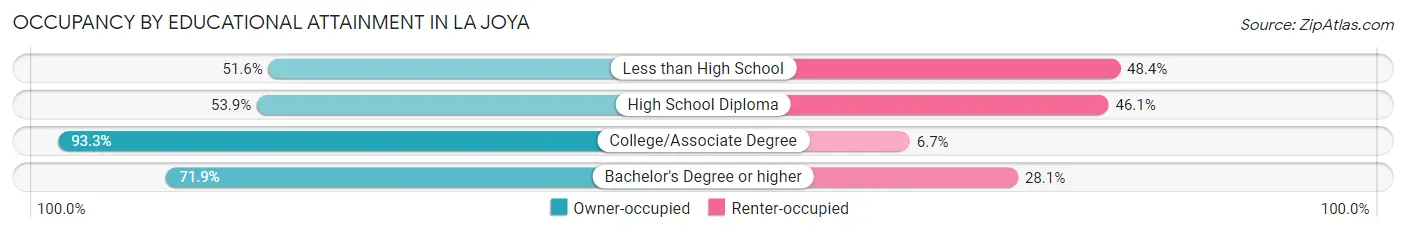
| Household Size | Owner-occupied | Renter-occupied |
| Less than High School | 220 (51.6%) | 206 (48.4%) |
| High School Diploma | 179 (53.9%) | 153 (46.1%) |
| College/Associate Degree | 84 (93.3%) | 6 (6.7%) |
| Bachelor's Degree or higher | 317 (71.9%) | 124 (28.1%) |
Occupancy by Age of Householder in La Joya
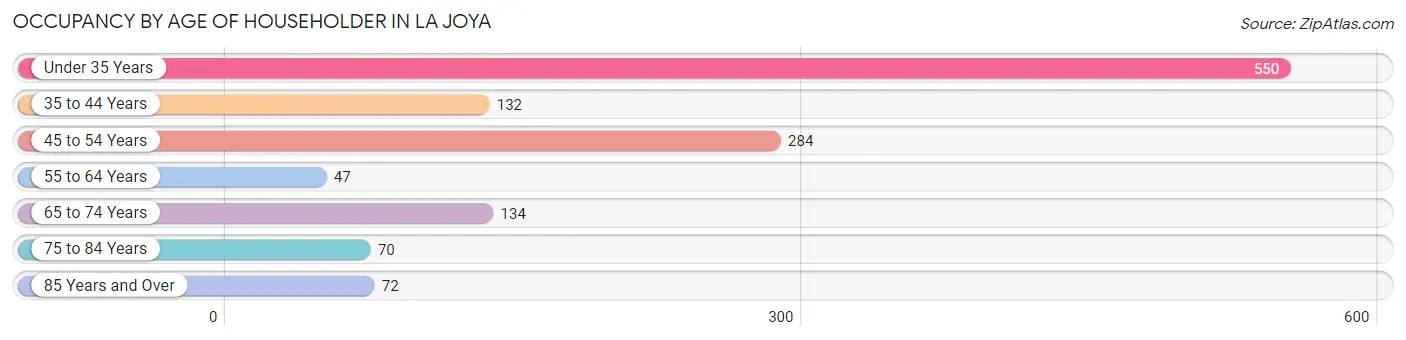
| Age Bracket | # Households | % Households |
| Under 35 Years | 550 | 42.7% |
| 35 to 44 Years | 132 | 10.2% |
| 45 to 54 Years | 284 | 22.0% |
| 55 to 64 Years | 47 | 3.6% |
| 65 to 74 Years | 134 | 10.4% |
| 75 to 84 Years | 70 | 5.4% |
| 85 Years and Over | 72 | 5.6% |
| Total | 1,289 | 100.0% |
Housing Finances in La Joya
Median Income by Occupancy in La Joya
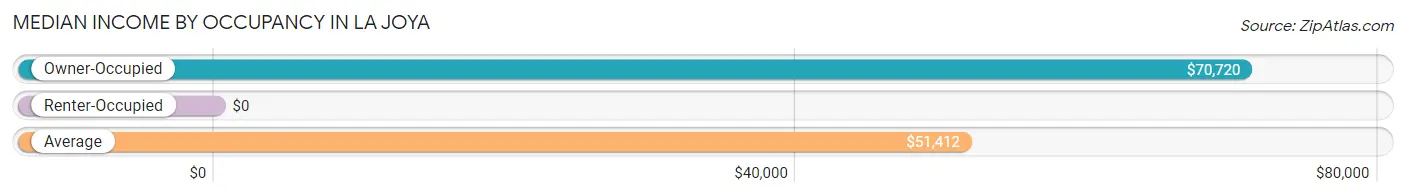
| Occupancy Type | # Households | Median Income |
| Owner-Occupied | 800 (62.1%) | $70,720 |
| Renter-Occupied | 489 (37.9%) | $0 |
| Average | 1,289 (100.0%) | $51,412 |
Occupancy by Householder Income Bracket in La Joya
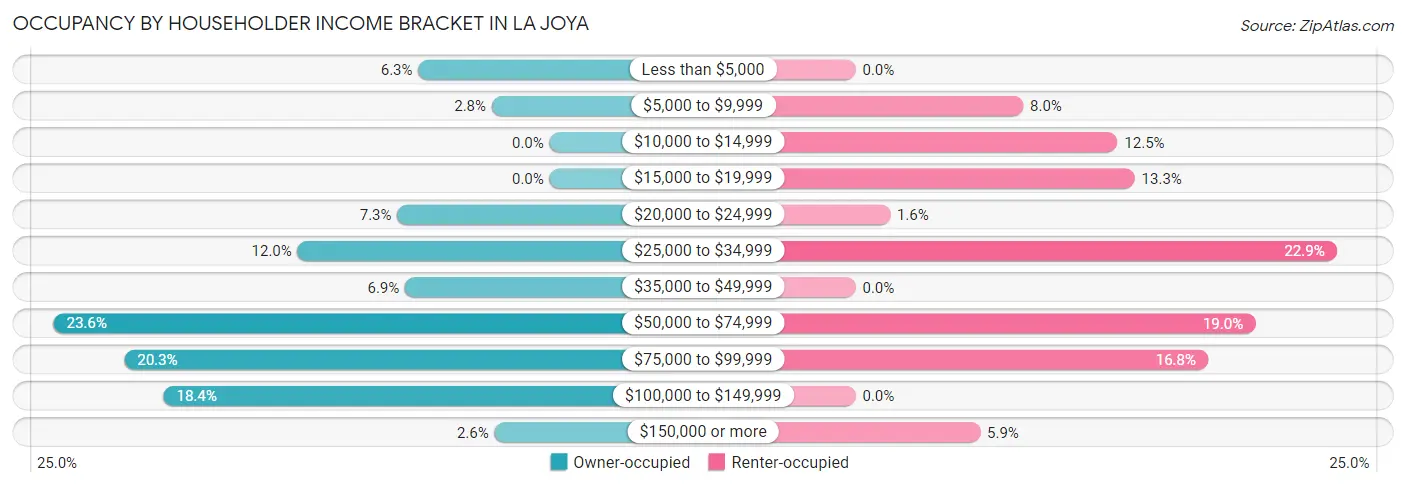
| Income Bracket | Owner-occupied | Renter-occupied |
| Less than $5,000 | 50 (6.2%) | 0 (0.0%) |
| $5,000 to $9,999 | 22 (2.8%) | 39 (8.0%) |
| $10,000 to $14,999 | 0 (0.0%) | 61 (12.5%) |
| $15,000 to $19,999 | 0 (0.0%) | 65 (13.3%) |
| $20,000 to $24,999 | 58 (7.2%) | 8 (1.6%) |
| $25,000 to $34,999 | 96 (12.0%) | 112 (22.9%) |
| $35,000 to $49,999 | 55 (6.9%) | 0 (0.0%) |
| $50,000 to $74,999 | 189 (23.6%) | 93 (19.0%) |
| $75,000 to $99,999 | 162 (20.3%) | 82 (16.8%) |
| $100,000 to $149,999 | 147 (18.4%) | 0 (0.0%) |
| $150,000 or more | 21 (2.6%) | 29 (5.9%) |
| Total | 800 (100.0%) | 489 (100.0%) |
Monthly Housing Cost Tiers in La Joya
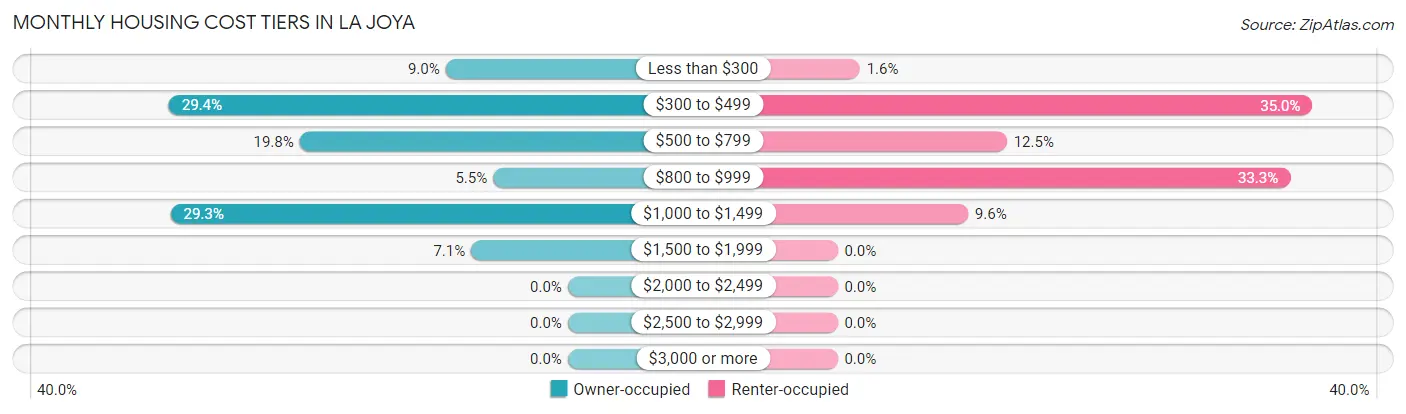
| Monthly Cost | Owner-occupied | Renter-occupied |
| Less than $300 | 72 (9.0%) | 8 (1.6%) |
| $300 to $499 | 235 (29.4%) | 171 (35.0%) |
| $500 to $799 | 158 (19.8%) | 61 (12.5%) |
| $800 to $999 | 44 (5.5%) | 163 (33.3%) |
| $1,000 to $1,499 | 234 (29.2%) | 47 (9.6%) |
| $1,500 to $1,999 | 57 (7.1%) | 0 (0.0%) |
| $2,000 to $2,499 | 0 (0.0%) | 0 (0.0%) |
| $2,500 to $2,999 | 0 (0.0%) | 0 (0.0%) |
| $3,000 or more | 0 (0.0%) | 0 (0.0%) |
| Total | 800 (100.0%) | 489 (100.0%) |
Physical Housing Characteristics in La Joya
Housing Structures in La Joya
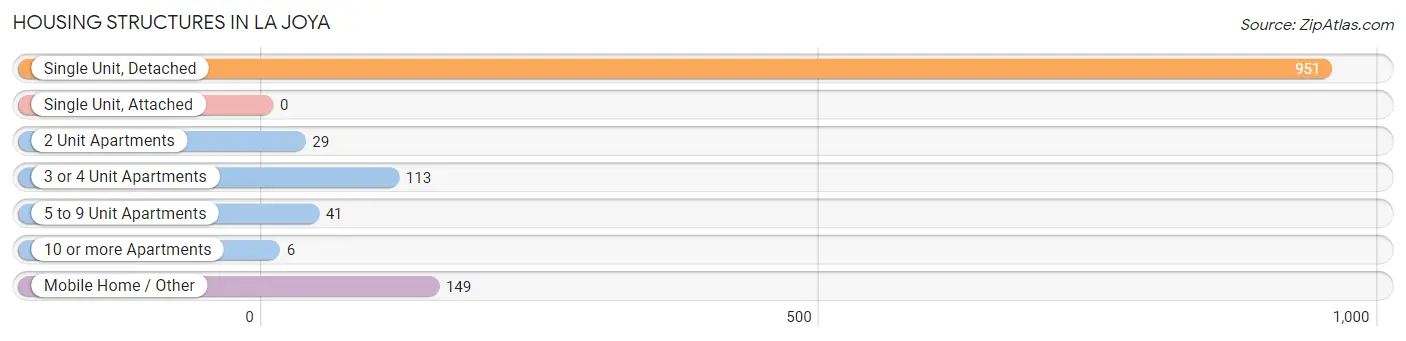
| Structure Type | # Housing Units | % Housing Units |
| Single Unit, Detached | 951 | 73.8% |
| Single Unit, Attached | 0 | 0.0% |
| 2 Unit Apartments | 29 | 2.2% |
| 3 or 4 Unit Apartments | 113 | 8.8% |
| 5 to 9 Unit Apartments | 41 | 3.2% |
| 10 or more Apartments | 6 | 0.5% |
| Mobile Home / Other | 149 | 11.6% |
| Total | 1,289 | 100.0% |
Housing Structures by Occupancy in La Joya
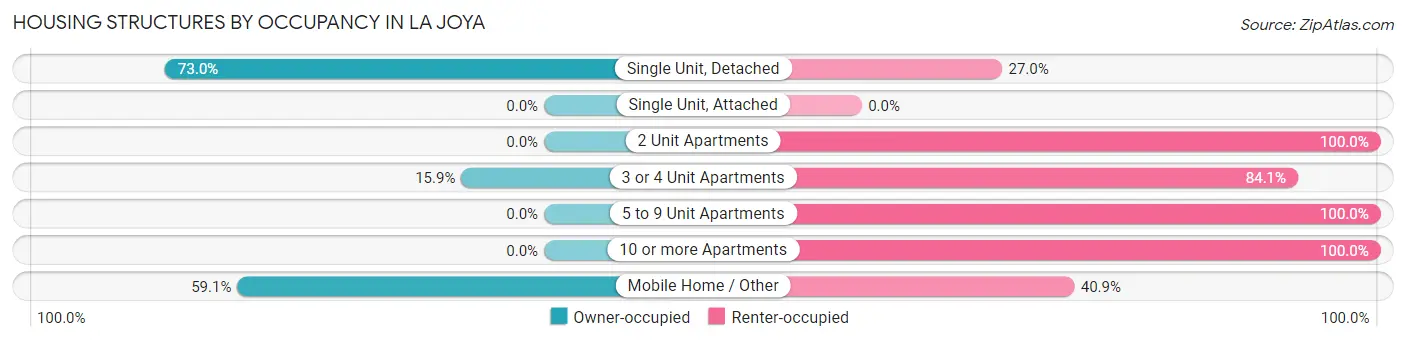
| Structure Type | Owner-occupied | Renter-occupied |
| Single Unit, Detached | 694 (73.0%) | 257 (27.0%) |
| Single Unit, Attached | 0 (0.0%) | 0 (0.0%) |
| 2 Unit Apartments | 0 (0.0%) | 29 (100.0%) |
| 3 or 4 Unit Apartments | 18 (15.9%) | 95 (84.1%) |
| 5 to 9 Unit Apartments | 0 (0.0%) | 41 (100.0%) |
| 10 or more Apartments | 0 (0.0%) | 6 (100.0%) |
| Mobile Home / Other | 88 (59.1%) | 61 (40.9%) |
| Total | 800 (62.1%) | 489 (37.9%) |
Housing Structures by Number of Rooms in La Joya
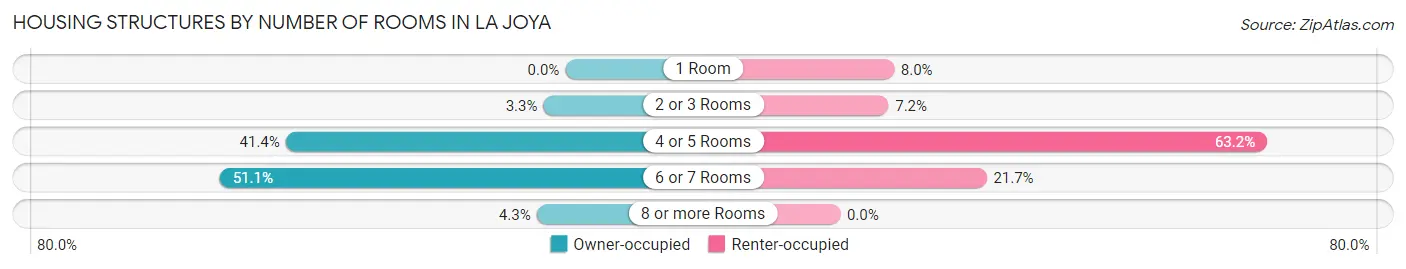
| Number of Rooms | Owner-occupied | Renter-occupied |
| 1 Room | 0 (0.0%) | 39 (8.0%) |
| 2 or 3 Rooms | 26 (3.3%) | 35 (7.2%) |
| 4 or 5 Rooms | 331 (41.4%) | 309 (63.2%) |
| 6 or 7 Rooms | 409 (51.1%) | 106 (21.7%) |
| 8 or more Rooms | 34 (4.3%) | 0 (0.0%) |
| Total | 800 (100.0%) | 489 (100.0%) |
Housing Structure by Heating Type in La Joya
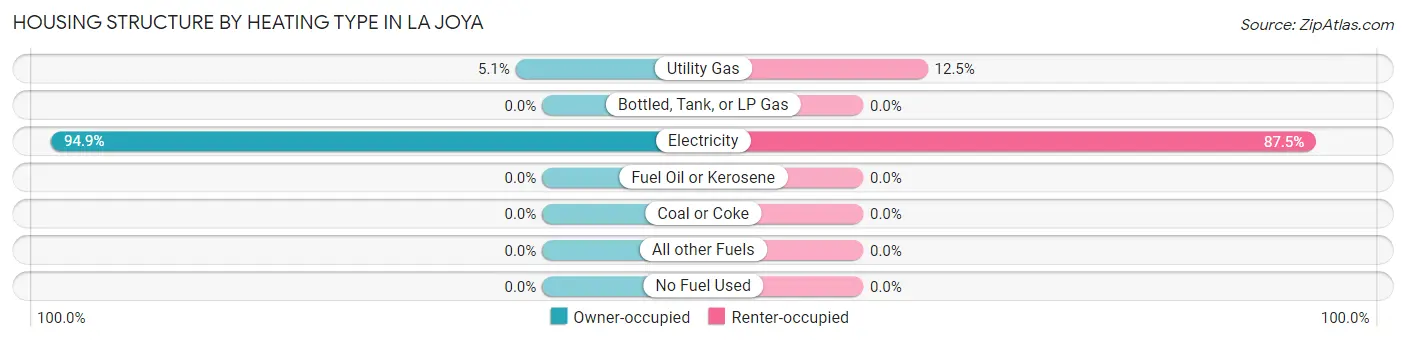
| Heating Type | Owner-occupied | Renter-occupied |
| Utility Gas | 41 (5.1%) | 61 (12.5%) |
| Bottled, Tank, or LP Gas | 0 (0.0%) | 0 (0.0%) |
| Electricity | 759 (94.9%) | 428 (87.5%) |
| Fuel Oil or Kerosene | 0 (0.0%) | 0 (0.0%) |
| Coal or Coke | 0 (0.0%) | 0 (0.0%) |
| All other Fuels | 0 (0.0%) | 0 (0.0%) |
| No Fuel Used | 0 (0.0%) | 0 (0.0%) |
| Total | 800 (100.0%) | 489 (100.0%) |
Household Vehicle Usage in La Joya
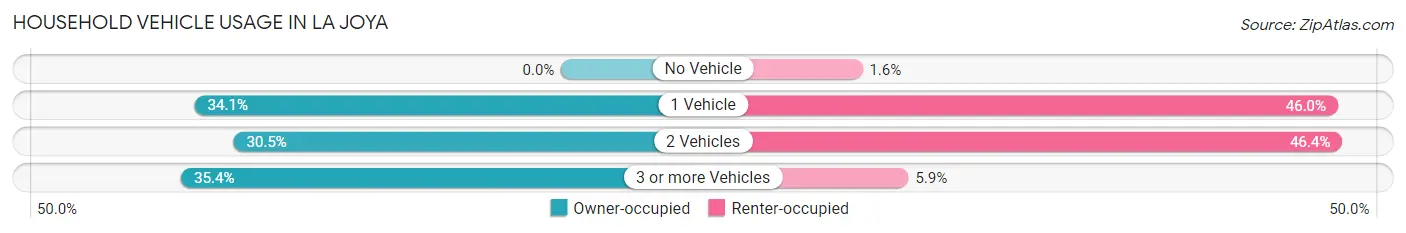
| Vehicles per Household | Owner-occupied | Renter-occupied |
| No Vehicle | 0 (0.0%) | 8 (1.6%) |
| 1 Vehicle | 273 (34.1%) | 225 (46.0%) |
| 2 Vehicles | 244 (30.5%) | 227 (46.4%) |
| 3 or more Vehicles | 283 (35.4%) | 29 (5.9%) |
| Total | 800 (100.0%) | 489 (100.0%) |
Real Estate & Mortgages in La Joya
Real Estate and Mortgage Overview in La Joya
| Characteristic | Without Mortgage | With Mortgage |
| Housing Units | 407 | 393 |
| Median Property Value | $62,800 | $135,900 |
| Median Household Income | $50,804 | $0 |
| Monthly Housing Costs | $428 | $0 |
| Real Estate Taxes | $1,253 | $18 |
Property Value by Mortgage Status in La Joya
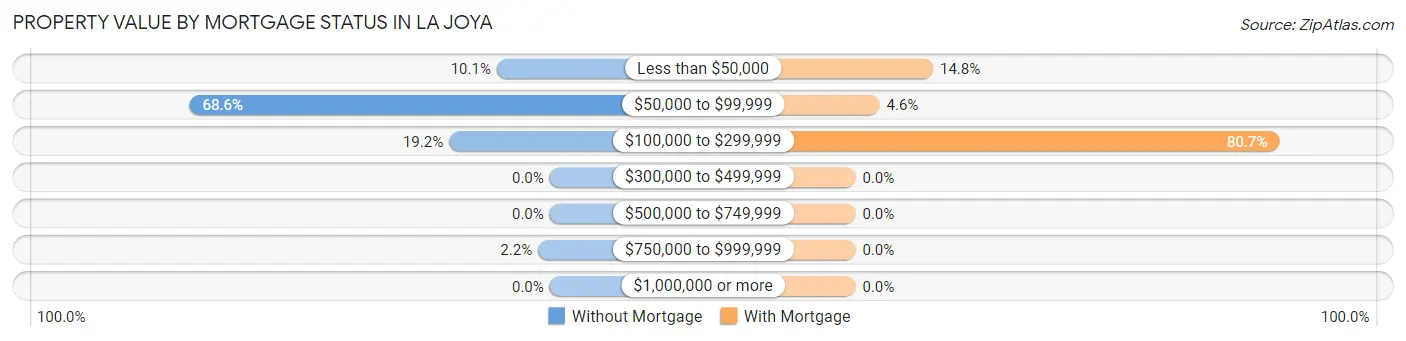
| Property Value | Without Mortgage | With Mortgage |
| Less than $50,000 | 41 (10.1%) | 58 (14.8%) |
| $50,000 to $99,999 | 279 (68.5%) | 18 (4.6%) |
| $100,000 to $299,999 | 78 (19.2%) | 317 (80.7%) |
| $300,000 to $499,999 | 0 (0.0%) | 0 (0.0%) |
| $500,000 to $749,999 | 0 (0.0%) | 0 (0.0%) |
| $750,000 to $999,999 | 9 (2.2%) | 0 (0.0%) |
| $1,000,000 or more | 0 (0.0%) | 0 (0.0%) |
| Total | 407 (100.0%) | 393 (100.0%) |
Household Income by Mortgage Status in La Joya
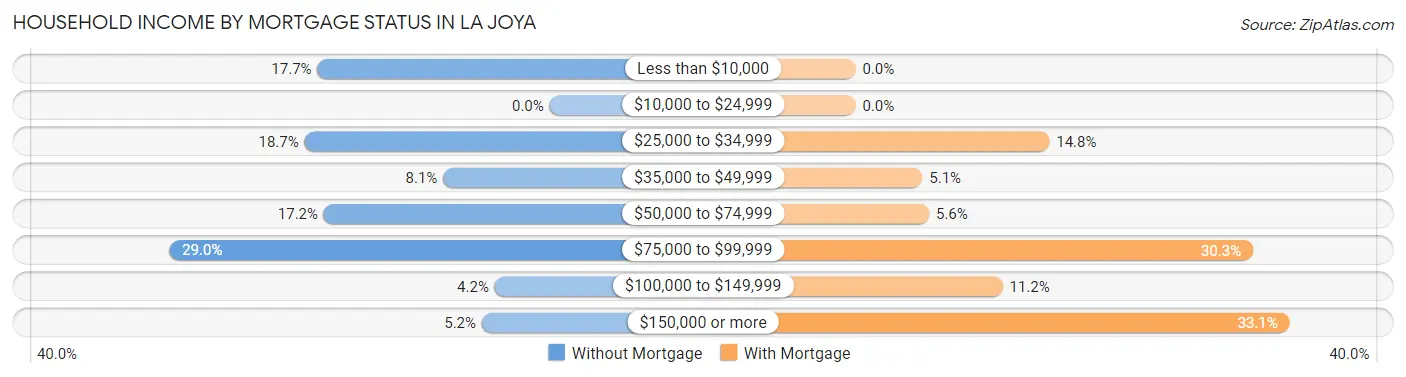
| Household Income | Without Mortgage | With Mortgage |
| Less than $10,000 | 72 (17.7%) | 0 (0.0%) |
| $10,000 to $24,999 | 0 (0.0%) | 0 (0.0%) |
| $25,000 to $34,999 | 76 (18.7%) | 58 (14.8%) |
| $35,000 to $49,999 | 33 (8.1%) | 20 (5.1%) |
| $50,000 to $74,999 | 70 (17.2%) | 22 (5.6%) |
| $75,000 to $99,999 | 118 (29.0%) | 119 (30.3%) |
| $100,000 to $149,999 | 17 (4.2%) | 44 (11.2%) |
| $150,000 or more | 21 (5.2%) | 130 (33.1%) |
| Total | 407 (100.0%) | 393 (100.0%) |
Property Value to Household Income Ratio in La Joya
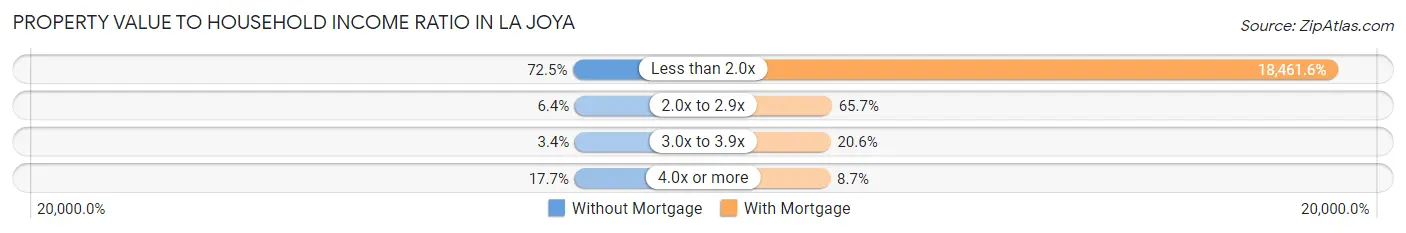
| Value-to-Income Ratio | Without Mortgage | With Mortgage |
| Less than 2.0x | 295 (72.5%) | 72,554 (18,461.6%) |
| 2.0x to 2.9x | 26 (6.4%) | 258 (65.6%) |
| 3.0x to 3.9x | 14 (3.4%) | 81 (20.6%) |
| 4.0x or more | 72 (17.7%) | 34 (8.6%) |
| Total | 407 (100.0%) | 393 (100.0%) |
Real Estate Taxes by Mortgage Status in La Joya
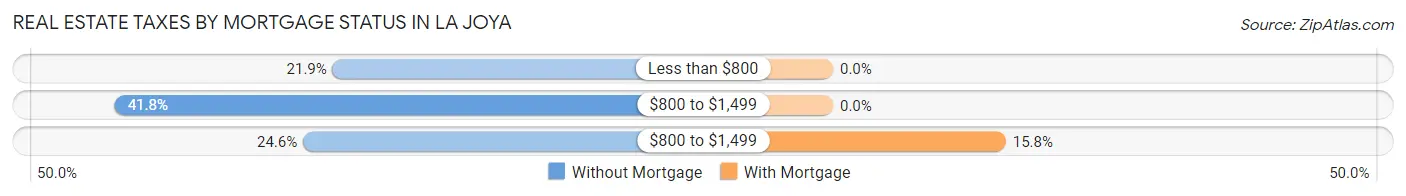
| Property Taxes | Without Mortgage | With Mortgage |
| Less than $800 | 89 (21.9%) | 0 (0.0%) |
| $800 to $1,499 | 170 (41.8%) | 0 (0.0%) |
| $800 to $1,499 | 100 (24.6%) | 62 (15.8%) |
| Total | 407 (100.0%) | 393 (100.0%) |
Health & Disability in La Joya
Health Insurance Coverage by Age in La Joya
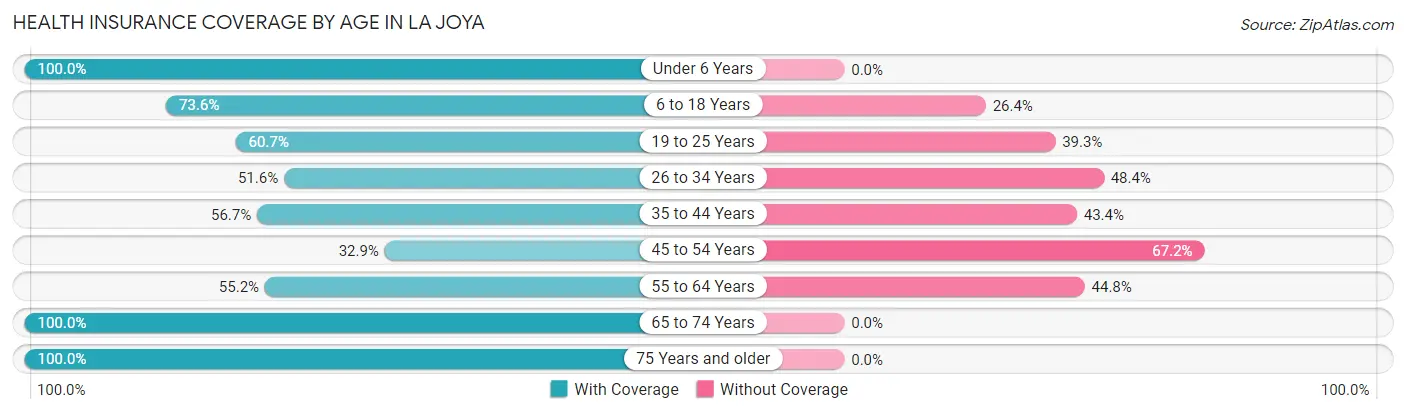
| Age Bracket | With Coverage | Without Coverage |
| Under 6 Years | 576 (100.0%) | 0 (0.0%) |
| 6 to 18 Years | 578 (73.6%) | 207 (26.4%) |
| 19 to 25 Years | 182 (60.7%) | 118 (39.3%) |
| 26 to 34 Years | 569 (51.6%) | 533 (48.4%) |
| 35 to 44 Years | 230 (56.7%) | 176 (43.3%) |
| 45 to 54 Years | 247 (32.9%) | 505 (67.1%) |
| 55 to 64 Years | 101 (55.2%) | 82 (44.8%) |
| 65 to 74 Years | 195 (100.0%) | 0 (0.0%) |
| 75 Years and older | 226 (100.0%) | 0 (0.0%) |
| Total | 2,904 (64.2%) | 1,621 (35.8%) |
Health Insurance Coverage by Citizenship Status in La Joya
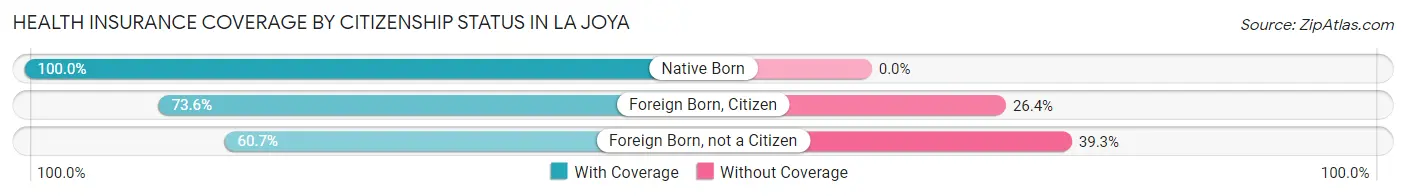
| Citizenship Status | With Coverage | Without Coverage |
| Native Born | 576 (100.0%) | 0 (0.0%) |
| Foreign Born, Citizen | 578 (73.6%) | 207 (26.4%) |
| Foreign Born, not a Citizen | 182 (60.7%) | 118 (39.3%) |
Health Insurance Coverage by Household Income in La Joya
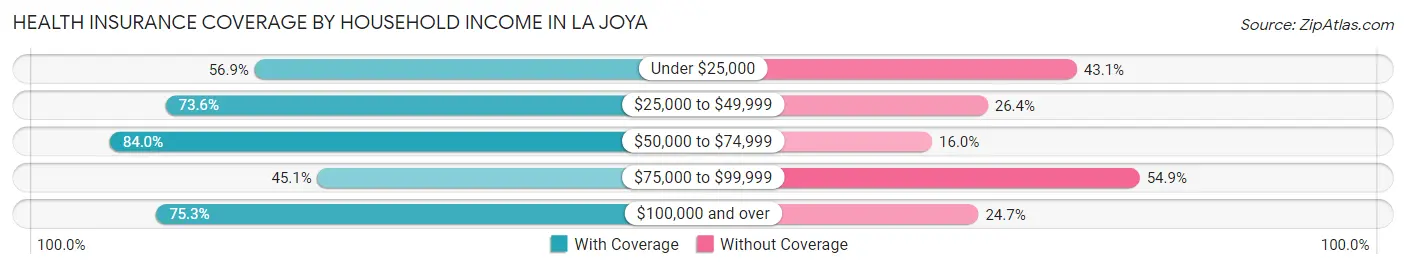
| Household Income | With Coverage | Without Coverage |
| Under $25,000 | 442 (56.9%) | 335 (43.1%) |
| $25,000 to $49,999 | 649 (73.6%) | 233 (26.4%) |
| $50,000 to $74,999 | 573 (84.0%) | 109 (16.0%) |
| $75,000 to $99,999 | 605 (45.1%) | 736 (54.9%) |
| $100,000 and over | 635 (75.3%) | 208 (24.7%) |
Public vs Private Health Insurance Coverage by Age in La Joya
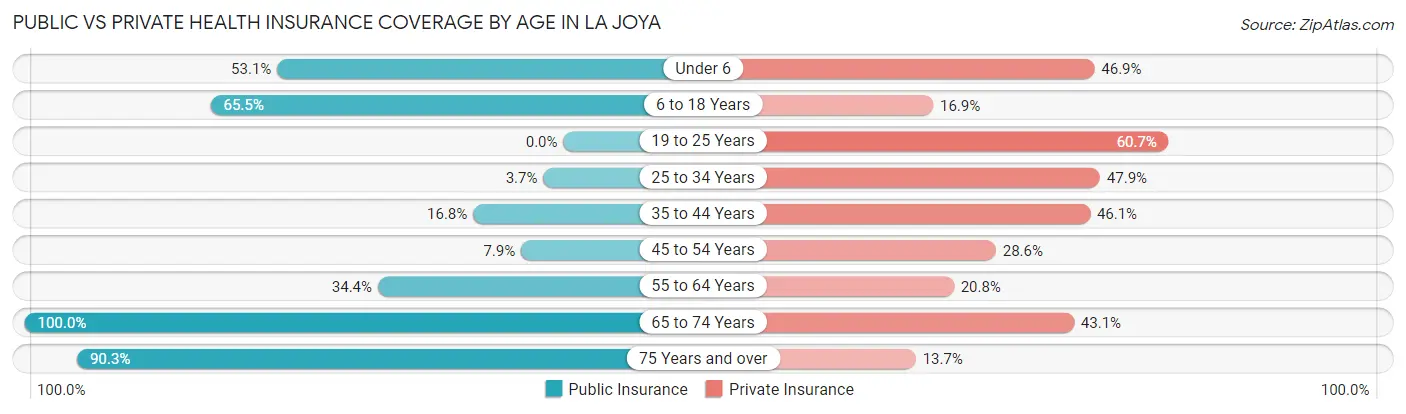
| Age Bracket | Public Insurance | Private Insurance |
| Under 6 | 306 (53.1%) | 270 (46.9%) |
| 6 to 18 Years | 514 (65.5%) | 133 (16.9%) |
| 19 to 25 Years | 0 (0.0%) | 182 (60.7%) |
| 25 to 34 Years | 41 (3.7%) | 528 (47.9%) |
| 35 to 44 Years | 68 (16.8%) | 187 (46.1%) |
| 45 to 54 Years | 59 (7.9%) | 215 (28.6%) |
| 55 to 64 Years | 63 (34.4%) | 38 (20.8%) |
| 65 to 74 Years | 195 (100.0%) | 84 (43.1%) |
| 75 Years and over | 204 (90.3%) | 31 (13.7%) |
| Total | 1,450 (32.0%) | 1,668 (36.9%) |
Disability Status by Sex by Age in La Joya
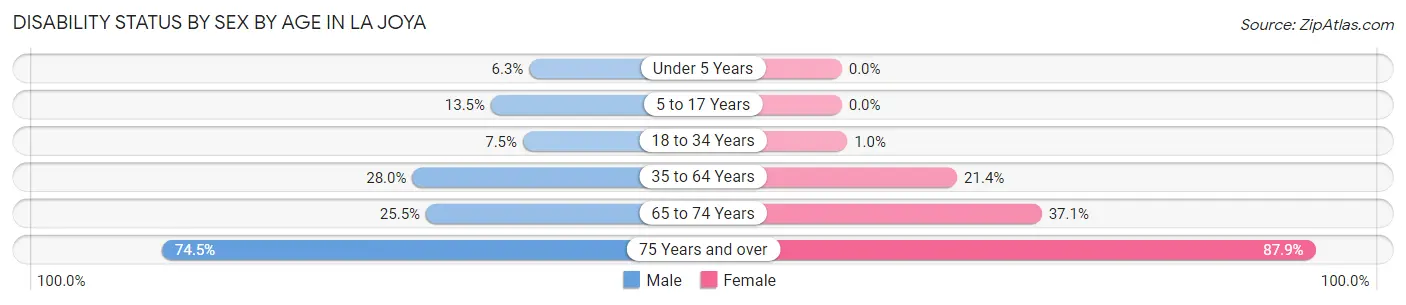
| Age Bracket | Male | Female |
| Under 5 Years | 9 (6.3%) | 0 (0.0%) |
| 5 to 17 Years | 60 (13.5%) | 0 (0.0%) |
| 18 to 34 Years | 50 (7.5%) | 8 (1.0%) |
| 35 to 64 Years | 173 (28.0%) | 155 (21.4%) |
| 65 to 74 Years | 25 (25.5%) | 36 (37.1%) |
| 75 Years and over | 76 (74.5%) | 109 (87.9%) |
Disability Class by Sex by Age in La Joya
Disability Class: Hearing Difficulty
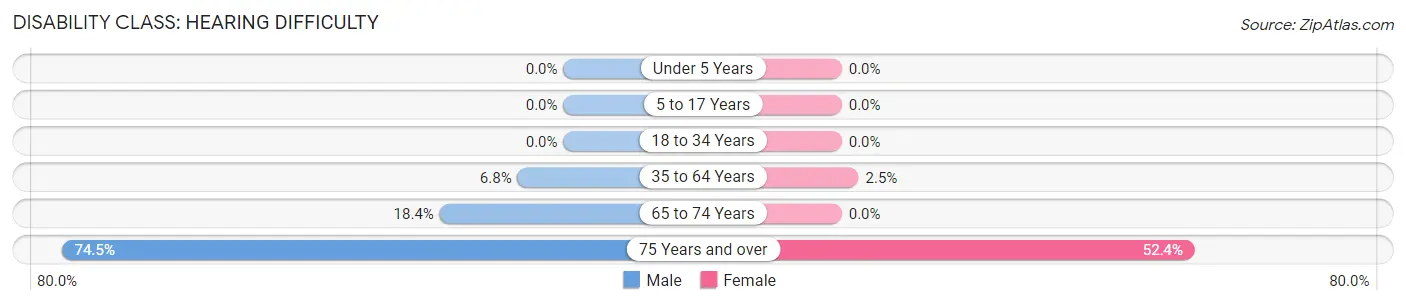
| Age Bracket | Male | Female |
| Under 5 Years | 0 (0.0%) | 0 (0.0%) |
| 5 to 17 Years | 0 (0.0%) | 0 (0.0%) |
| 18 to 34 Years | 0 (0.0%) | 0 (0.0%) |
| 35 to 64 Years | 42 (6.8%) | 18 (2.5%) |
| 65 to 74 Years | 18 (18.4%) | 0 (0.0%) |
| 75 Years and over | 76 (74.5%) | 65 (52.4%) |
Disability Class: Vision Difficulty
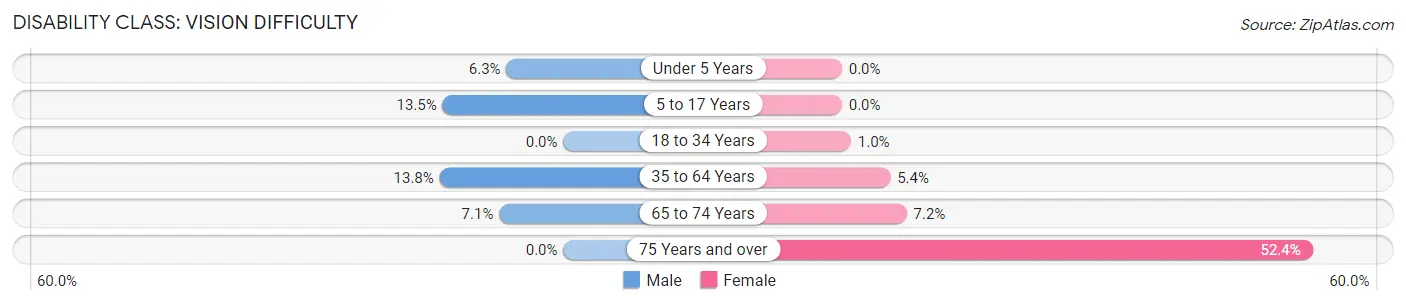
| Age Bracket | Male | Female |
| Under 5 Years | 9 (6.3%) | 0 (0.0%) |
| 5 to 17 Years | 60 (13.5%) | 0 (0.0%) |
| 18 to 34 Years | 0 (0.0%) | 8 (1.0%) |
| 35 to 64 Years | 85 (13.8%) | 39 (5.4%) |
| 65 to 74 Years | 7 (7.1%) | 7 (7.2%) |
| 75 Years and over | 0 (0.0%) | 65 (52.4%) |
Disability Class: Cognitive Difficulty
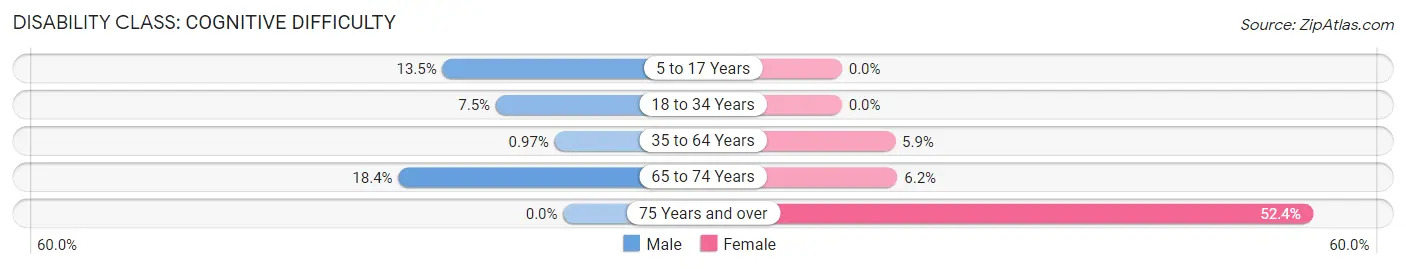
| Age Bracket | Male | Female |
| 5 to 17 Years | 60 (13.5%) | 0 (0.0%) |
| 18 to 34 Years | 50 (7.5%) | 0 (0.0%) |
| 35 to 64 Years | 6 (1.0%) | 43 (5.9%) |
| 65 to 74 Years | 18 (18.4%) | 6 (6.2%) |
| 75 Years and over | 0 (0.0%) | 65 (52.4%) |
Disability Class: Ambulatory Difficulty
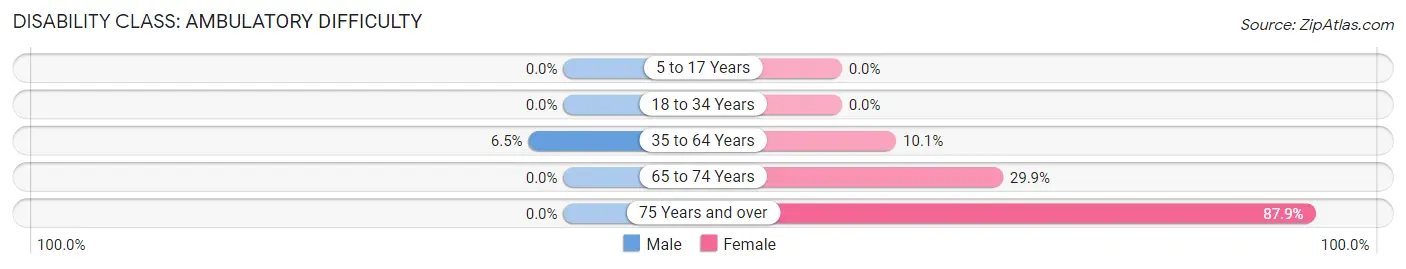
| Age Bracket | Male | Female |
| 5 to 17 Years | 0 (0.0%) | 0 (0.0%) |
| 18 to 34 Years | 0 (0.0%) | 0 (0.0%) |
| 35 to 64 Years | 40 (6.5%) | 73 (10.1%) |
| 65 to 74 Years | 0 (0.0%) | 29 (29.9%) |
| 75 Years and over | 0 (0.0%) | 109 (87.9%) |
Disability Class: Self-Care Difficulty
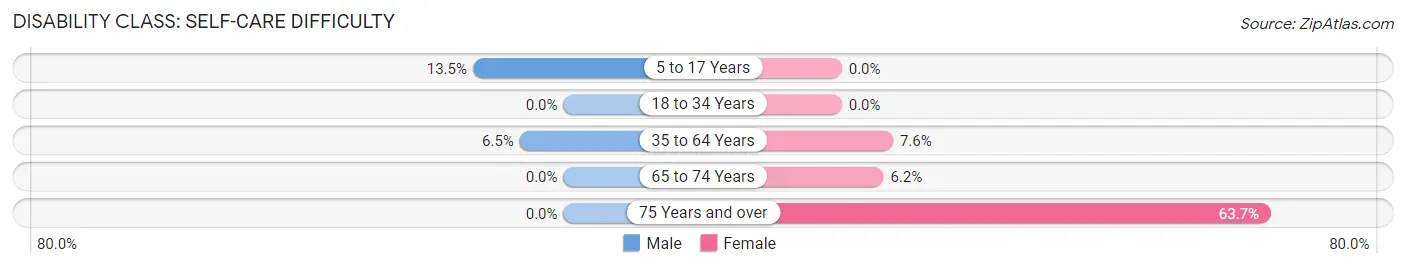
| Age Bracket | Male | Female |
| 5 to 17 Years | 60 (13.5%) | 0 (0.0%) |
| 18 to 34 Years | 0 (0.0%) | 0 (0.0%) |
| 35 to 64 Years | 40 (6.5%) | 55 (7.6%) |
| 65 to 74 Years | 0 (0.0%) | 6 (6.2%) |
| 75 Years and over | 0 (0.0%) | 79 (63.7%) |
Technology Access in La Joya
Computing Device Access in La Joya
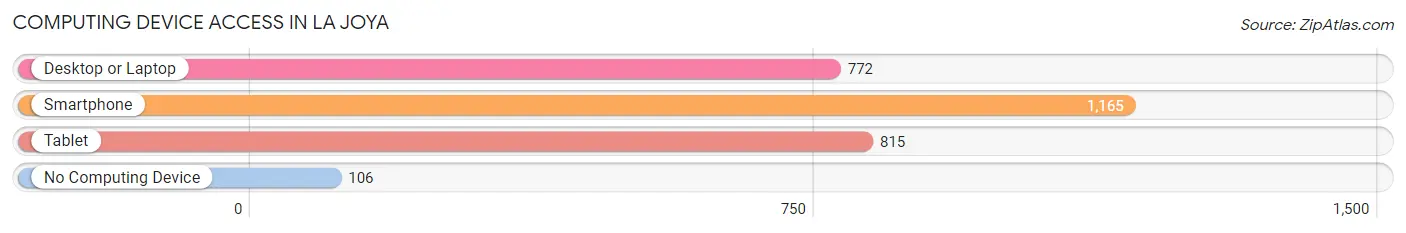
| Device Type | # Households | % Households |
| Desktop or Laptop | 772 | 59.9% |
| Smartphone | 1,165 | 90.4% |
| Tablet | 815 | 63.2% |
| No Computing Device | 106 | 8.2% |
| Total | 1,289 | 100.0% |
Internet Access in La Joya
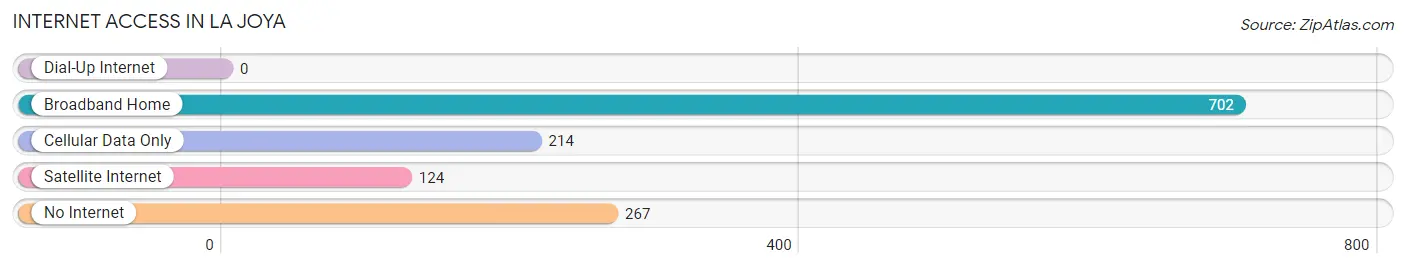
| Internet Type | # Households | % Households |
| Dial-Up Internet | 0 | 0.0% |
| Broadband Home | 702 | 54.5% |
| Cellular Data Only | 214 | 16.6% |
| Satellite Internet | 124 | 9.6% |
| No Internet | 267 | 20.7% |
| Total | 1,289 | 100.0% |
La Joya Summary
History
La Joya, Texas is a small city located in Hidalgo County, Texas. It is part of the McAllen–Edinburg–Mission Metropolitan Statistical Area. The city was founded in the late 19th century and has a population of approximately 15,000 people.
The area that is now La Joya was originally inhabited by the Coahuiltecan Indians. The first European settlers arrived in the area in the late 19th century. The town was originally called La Joya del Norte, which translates to “The Jewel of the North”. The name was chosen to reflect the beauty of the area.
In the early 20th century, the town began to grow and develop. The first school was built in 1910 and the first post office was established in 1911. The town was officially incorporated in 1925.
In the 1950s, the town began to experience a population boom due to the influx of Mexican immigrants. This influx of immigrants helped to shape the culture and economy of the town.
Geography
La Joya is located in Hidalgo County, Texas. It is situated in the Rio Grande Valley, which is a region of south Texas that is known for its fertile soil and warm climate. The city is located approximately 20 miles west of McAllen and 30 miles south of Edinburg.
The city has a total area of 2.3 square miles, all of which is land. The terrain is mostly flat and the soil is sandy and loamy. The climate is subtropical and the average temperature is around 75 degrees Fahrenheit.
Economy
The economy of La Joya is largely based on agriculture. The city is home to several large farms that produce a variety of crops, including cotton, corn, sorghum, and vegetables. The city is also home to several food processing plants, which process and package the crops for sale.
In addition to agriculture, the city is also home to several manufacturing plants. These plants produce a variety of products, including furniture, clothing, and electronics.
The city is also home to several retail stores, restaurants, and other businesses. The city is home to a large shopping mall, which is a popular destination for locals and tourists alike.
Demographics
As of the 2010 census, the population of La Joya was 15,302. The racial makeup of the city was 79.3% Hispanic or Latino, 17.2% White, 1.2% African American, 0.7% Native American, 0.2% Asian, and 1.6% from other races.
The median household income in La Joya was $25,945, and the median family income was $30,917. The per capita income was $11,845. About 24.3% of the population was below the poverty line.
Conclusion
La Joya, Texas is a small city located in Hidalgo County, Texas. It is part of the McAllen–Edinburg–Mission Metropolitan Statistical Area. The city was founded in the late 19th century and has a population of approximately 15,000 people. The economy of La Joya is largely based on agriculture, manufacturing, and retail. The racial makeup of the city is 79.3% Hispanic or Latino, 17.2% White, 1.2% African American, 0.7% Native American, 0.2% Asian, and 1.6% from other races. The median household income in La Joya was $25,945, and the median family income was $30,917. About 24.3% of the population was below the poverty line. La Joya is a vibrant city with a rich history and culture.
Common Questions
What is Per Capita Income in La Joya?
Per Capita income in La Joya is $17,711.
What is the Median Family Income in La Joya?
Median Family Income in La Joya is $51,385.
What is the Median Household income in La Joya?
Median Household Income in La Joya is $51,412.
What is Income or Wage Gap in La Joya?
Income or Wage Gap in La Joya is 36.2%.
Women in La Joya earn 63.8 cents for every dollar earned by a man.
What is Inequality or Gini Index in La Joya?
Inequality or Gini Index in La Joya is 0.40.
What is the Total Population of La Joya?
Total Population of La Joya is 4,525.
What is the Total Male Population of La Joya?
Total Male Population of La Joya is 2,071.
What is the Total Female Population of La Joya?
Total Female Population of La Joya is 2,454.
What is the Ratio of Males per 100 Females in La Joya?
There are 84.39 Males per 100 Females in La Joya.
What is the Ratio of Females per 100 Males in La Joya?
There are 118.49 Females per 100 Males in La Joya.
What is the Median Population Age in La Joya?
Median Population Age in La Joya is 30.1 Years.
What is the Average Family Size in La Joya
Average Family Size in La Joya is 4.0 People.
What is the Average Household Size in La Joya
Average Household Size in La Joya is 3.5 People.
How Large is the Labor Force in La Joya?
There are 1,897 People in the Labor Forcein in La Joya.
What is the Percentage of People in the Labor Force in La Joya?
56.4% of People are in the Labor Force in La Joya.
What is the Unemployment Rate in La Joya?
Unemployment Rate in La Joya is 7.3%.