Knox City, TX Map & Demographics
Knox City Map
Knox City Overview
$20,217
PER CAPITA INCOME
$64,188
AVG FAMILY INCOME
$37,368
AVG HOUSEHOLD INCOME
58.1%
WAGE / INCOME GAP [ % ]
41.9¢/ $1
WAGE / INCOME GAP [ $ ]
0.43
INEQUALITY / GINI INDEX
898
TOTAL POPULATION
490
MALE POPULATION
408
FEMALE POPULATION
120.10
MALES / 100 FEMALES
83.27
FEMALES / 100 MALES
37.6
MEDIAN AGE
3.8
AVG FAMILY SIZE
2.6
AVG HOUSEHOLD SIZE
316
LABOR FORCE [ PEOPLE ]
42.9%
PERCENT IN LABOR FORCE
1.3%
UNEMPLOYMENT RATE
Knox City Zip Codes
Knox City Area Codes
Income in Knox City
Income Overview in Knox City
Per Capita Income in Knox City is $20,217, while median incomes of families and households are $64,188 and $37,368 respectively.
| Characteristic | Number | Measure |
| Per Capita Income | 898 | $20,217 |
| Median Family Income | 181 | $64,188 |
| Mean Family Income | 181 | $66,284 |
| Median Household Income | 320 | $37,368 |
| Mean Household Income | 320 | $50,118 |
| Income Deficit | 181 | $0 |
| Wage / Income Gap (%) | 898 | 58.14% |
| Wage / Income Gap ($) | 898 | 41.86¢ per $1 |
| Gini / Inequality Index | 898 | 0.43 |
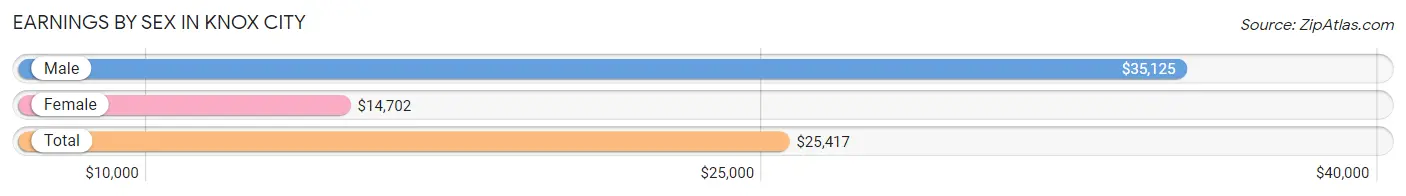
Earnings by Sex in Knox City
Average Earnings in Knox City are $25,417, $35,125 for men and $14,702 for women, a difference of 58.1%.
| Sex | Number | Average Earnings |
| Male | 224 (64.9%) | $35,125 |
| Female | 121 (35.1%) | $14,702 |
| Total | 345 (100.0%) | $25,417 |
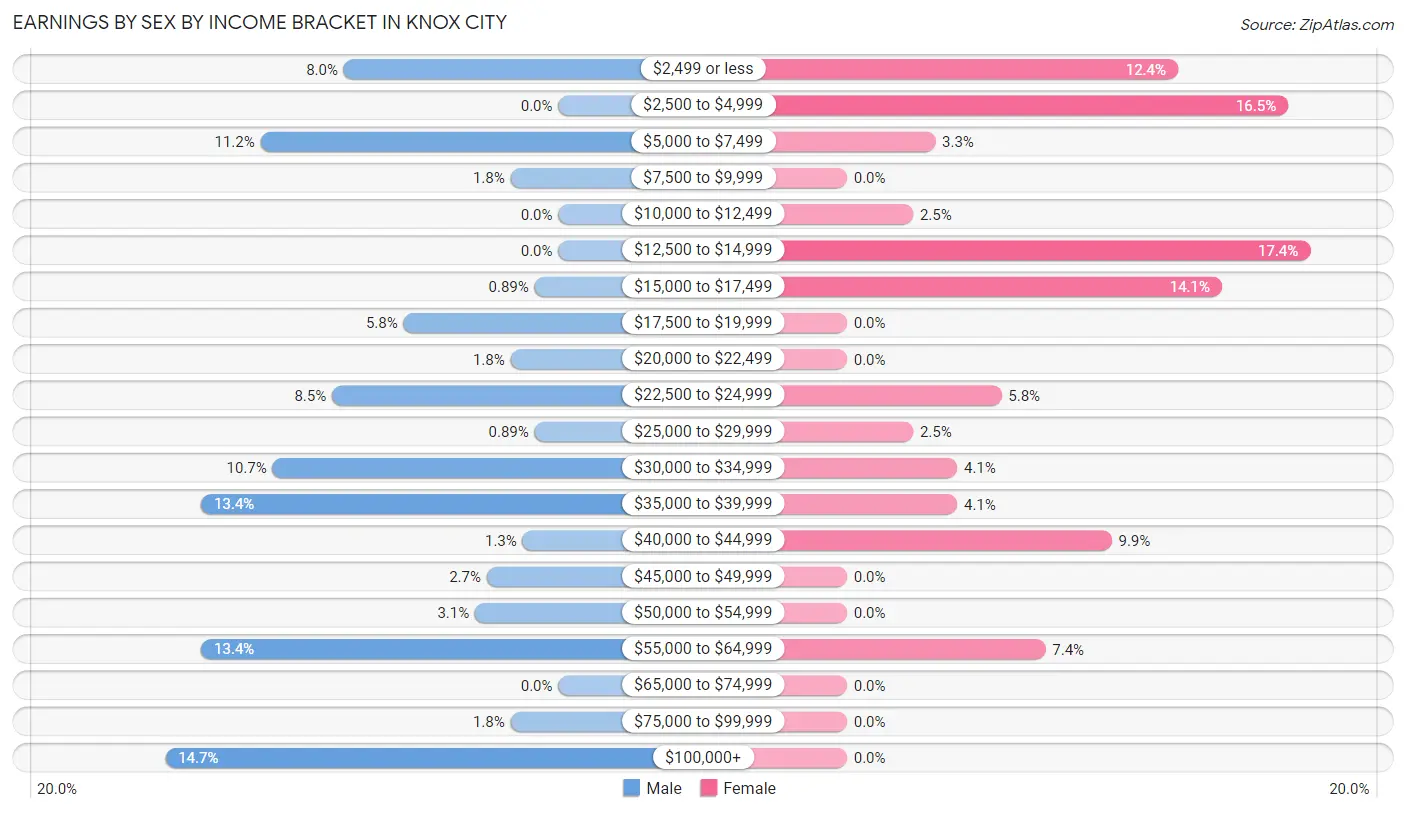
Earnings by Sex by Income Bracket in Knox City
The most common earnings brackets in Knox City are $100,000+ for men (33 | 14.7%) and $12,500 to $14,999 for women (21 | 17.4%).
| Income | Male | Female |
| $2,499 or less | 18 (8.0%) | 15 (12.4%) |
| $2,500 to $4,999 | 0 (0.0%) | 20 (16.5%) |
| $5,000 to $7,499 | 25 (11.2%) | 4 (3.3%) |
| $7,500 to $9,999 | 4 (1.8%) | 0 (0.0%) |
| $10,000 to $12,499 | 0 (0.0%) | 3 (2.5%) |
| $12,500 to $14,999 | 0 (0.0%) | 21 (17.4%) |
| $15,000 to $17,499 | 2 (0.9%) | 17 (14.1%) |
| $17,500 to $19,999 | 13 (5.8%) | 0 (0.0%) |
| $20,000 to $22,499 | 4 (1.8%) | 0 (0.0%) |
| $22,500 to $24,999 | 19 (8.5%) | 7 (5.8%) |
| $25,000 to $29,999 | 2 (0.9%) | 3 (2.5%) |
| $30,000 to $34,999 | 24 (10.7%) | 5 (4.1%) |
| $35,000 to $39,999 | 30 (13.4%) | 5 (4.1%) |
| $40,000 to $44,999 | 3 (1.3%) | 12 (9.9%) |
| $45,000 to $49,999 | 6 (2.7%) | 0 (0.0%) |
| $50,000 to $54,999 | 7 (3.1%) | 0 (0.0%) |
| $55,000 to $64,999 | 30 (13.4%) | 9 (7.4%) |
| $65,000 to $74,999 | 0 (0.0%) | 0 (0.0%) |
| $75,000 to $99,999 | 4 (1.8%) | 0 (0.0%) |
| $100,000+ | 33 (14.7%) | 0 (0.0%) |
| Total | 224 (100.0%) | 121 (100.0%) |
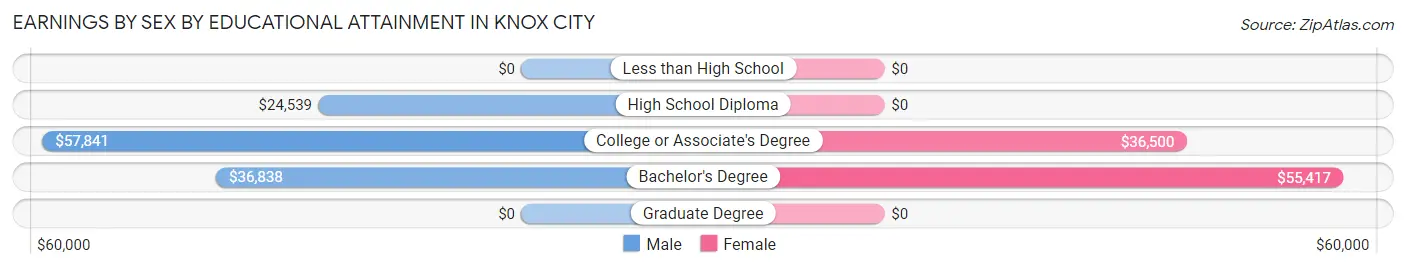
Earnings by Sex by Educational Attainment in Knox City
Average earnings in Knox City are $35,938 for men and $15,156 for women, a difference of 57.8%. Men with an educational attainment of college or associate's degree enjoy the highest average annual earnings of $57,841, while those with high school diploma education earn the least with $24,539. Women with an educational attainment of bachelor's degree earn the most with the average annual earnings of $55,417, while those with college or associate's degree education have the smallest earnings of $36,500.
| Educational Attainment | Male Income | Female Income |
| Less than High School | - | - |
| High School Diploma | $24,539 | $0 |
| College or Associate's Degree | $57,841 | $36,500 |
| Bachelor's Degree | $36,838 | $55,417 |
| Graduate Degree | - | - |
| Total | $35,938 | $15,156 |
Family Income in Knox City
Family Income Brackets in Knox City
According to the Knox City family income data, there are 43 families falling into the $50,000 to $74,999 income range, which is the most common income bracket and makes up 23.8% of all families.
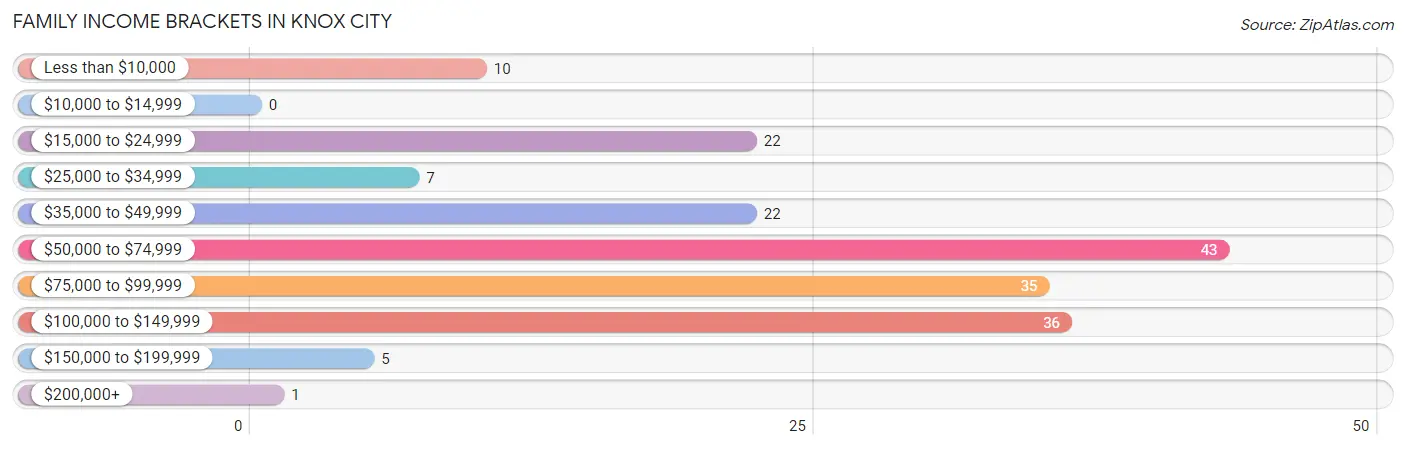
| Income Bracket | # Families | % Families |
| Less than $10,000 | 10 | 5.5% |
| $10,000 to $14,999 | 0 | 0.0% |
| $15,000 to $24,999 | 22 | 12.2% |
| $25,000 to $34,999 | 7 | 3.9% |
| $35,000 to $49,999 | 22 | 12.2% |
| $50,000 to $74,999 | 43 | 23.8% |
| $75,000 to $99,999 | 35 | 19.3% |
| $100,000 to $149,999 | 36 | 19.9% |
| $150,000 to $199,999 | 5 | 2.8% |
| $200,000+ | 1 | 0.6% |
Family Income by Famaliy Size in Knox City
4-person families (43 | 23.8%) account for the highest median family income in Knox City with $101,875 per family, while 2-person families (85 | 47.0%) have the highest median income of $29,062 per family member.
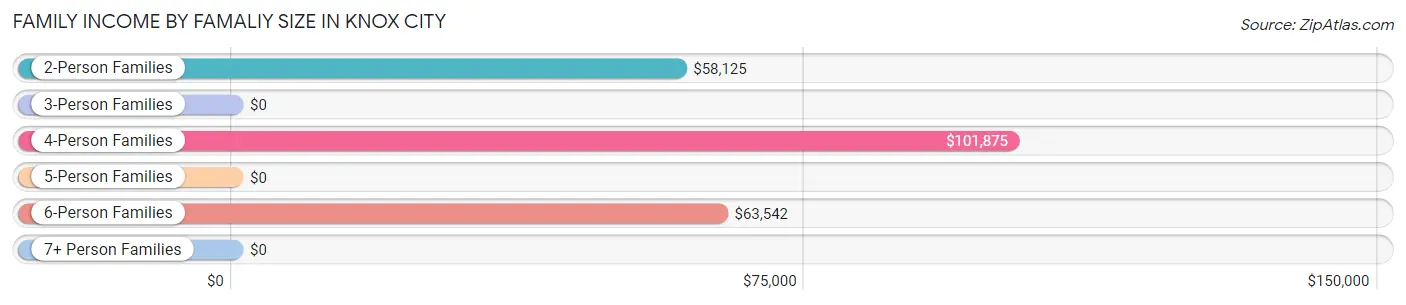
| Income Bracket | # Families | Median Income |
| 2-Person Families | 85 (47.0%) | $58,125 |
| 3-Person Families | 20 (11.1%) | $0 |
| 4-Person Families | 43 (23.8%) | $101,875 |
| 5-Person Families | 12 (6.6%) | $0 |
| 6-Person Families | 21 (11.6%) | $63,542 |
| 7+ Person Families | 0 (0.0%) | $0 |
| Total | 181 (100.0%) | $64,188 |
Family Income by Number of Earners in Knox City
The median family income in Knox City is $64,188, with families comprising 3+ earners (6) having the highest median family income of $101,500, while families with 1 earner (77) have the lowest median family income of $38,482, accounting for 3.3% and 42.5% of families, respectively.
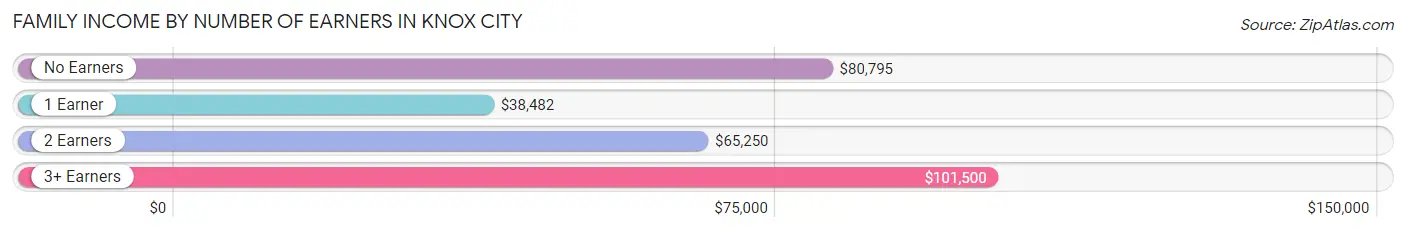
| Number of Earners | # Families | Median Income |
| No Earners | 23 (12.7%) | $80,795 |
| 1 Earner | 77 (42.5%) | $38,482 |
| 2 Earners | 75 (41.4%) | $65,250 |
| 3+ Earners | 6 (3.3%) | $101,500 |
| Total | 181 (100.0%) | $64,188 |
Household Income in Knox City
Household Income Brackets in Knox City
With 88 households falling in the category, the $15,000 to $24,999 income range is the most frequent in Knox City, accounting for 27.5% of all households. In contrast, only 3 households (0.9%) fall into the $200,000+ income bracket, making it the least populous group.
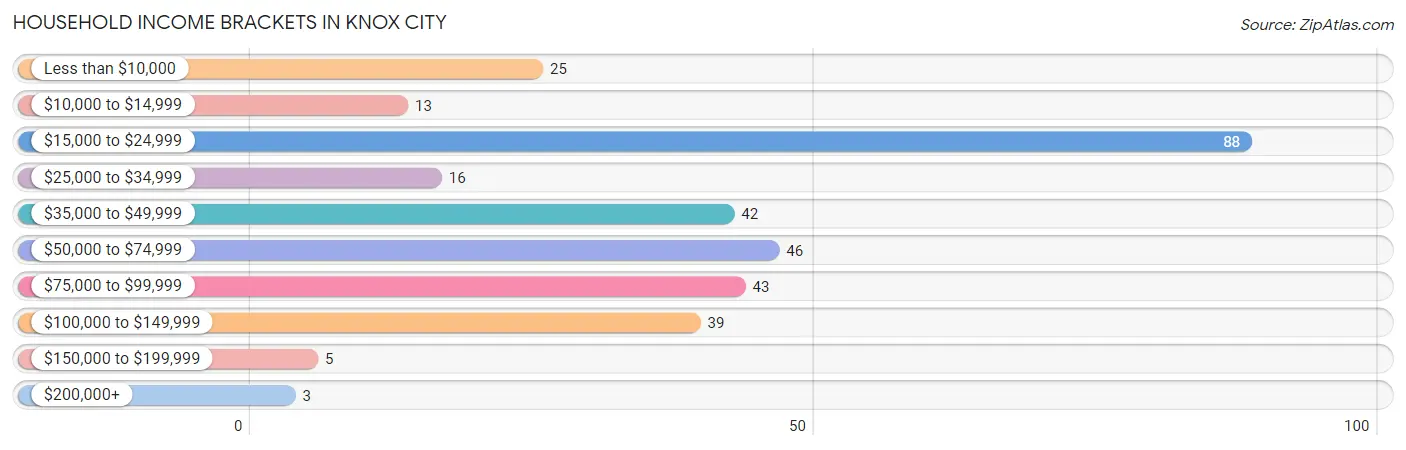
| Income Bracket | # Households | % Households |
| Less than $10,000 | 25 | 7.8% |
| $10,000 to $14,999 | 13 | 4.1% |
| $15,000 to $24,999 | 88 | 27.5% |
| $25,000 to $34,999 | 16 | 5.0% |
| $35,000 to $49,999 | 42 | 13.1% |
| $50,000 to $74,999 | 46 | 14.4% |
| $75,000 to $99,999 | 43 | 13.4% |
| $100,000 to $149,999 | 39 | 12.2% |
| $150,000 to $199,999 | 5 | 1.6% |
| $200,000+ | 3 | 0.9% |
Household Income by Householder Age in Knox City
The median household income in Knox City is $37,368, with the highest median household income of $62,708 found in the 25 to 44 years age bracket for the primary householder. A total of 101 households (31.6%) fall into this category. Meanwhile, the 15 to 24 years age bracket for the primary householder has the lowest median household income of $0, with 9 households (2.8%) in this group.
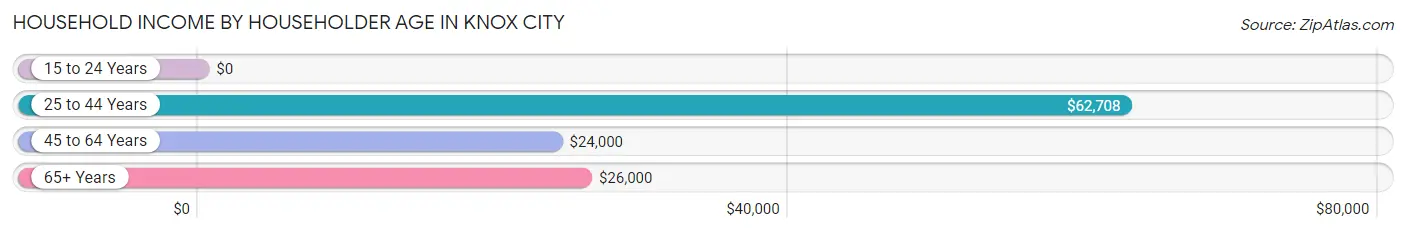
| Income Bracket | # Households | Median Income |
| 15 to 24 Years | 9 (2.8%) | $0 |
| 25 to 44 Years | 101 (31.6%) | $62,708 |
| 45 to 64 Years | 110 (34.4%) | $24,000 |
| 65+ Years | 100 (31.2%) | $26,000 |
| Total | 320 (100.0%) | $37,368 |
Poverty in Knox City
Income Below Poverty by Sex and Age in Knox City
With 10.2% poverty level for males and 15.8% for females among the residents of Knox City, 12 to 14 year old males and 12 to 14 year old females are the most vulnerable to poverty, with 15 males (100.0%) and 9 females (50.0%) in their respective age groups living below the poverty level.
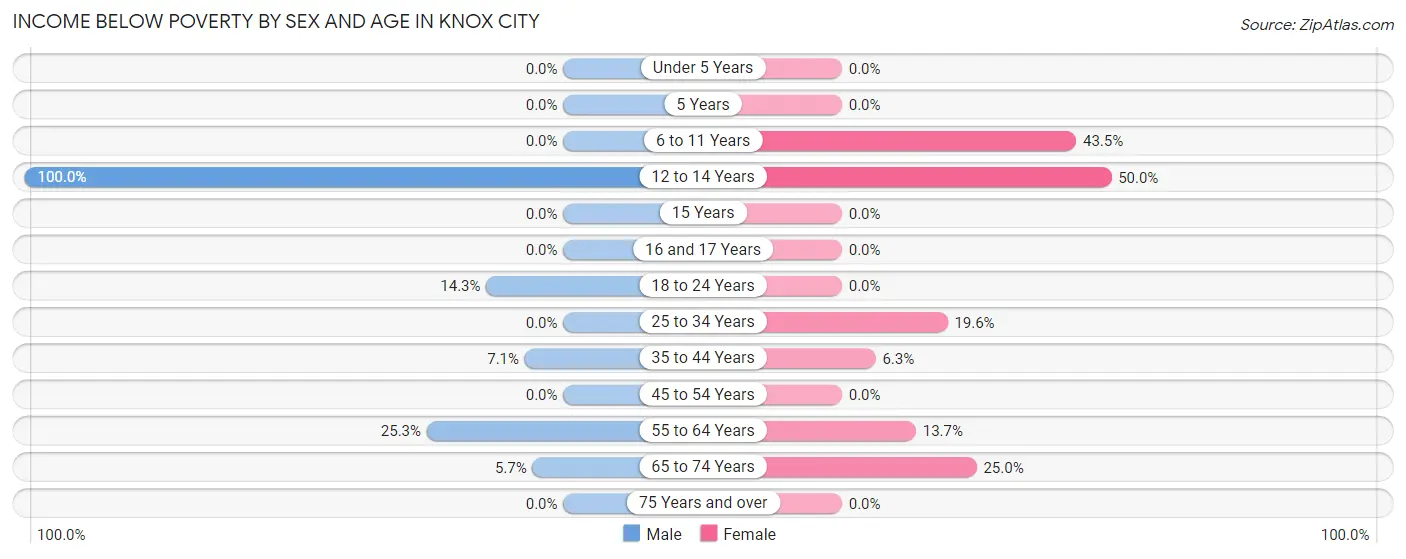
| Age Bracket | Male | Female |
| Under 5 Years | 0 (0.0%) | 0 (0.0%) |
| 5 Years | 0 (0.0%) | 0 (0.0%) |
| 6 to 11 Years | 0 (0.0%) | 20 (43.5%) |
| 12 to 14 Years | 15 (100.0%) | 9 (50.0%) |
| 15 Years | 0 (0.0%) | 0 (0.0%) |
| 16 and 17 Years | 0 (0.0%) | 0 (0.0%) |
| 18 to 24 Years | 7 (14.3%) | 0 (0.0%) |
| 25 to 34 Years | 0 (0.0%) | 10 (19.6%) |
| 35 to 44 Years | 4 (7.1%) | 2 (6.2%) |
| 45 to 54 Years | 0 (0.0%) | 0 (0.0%) |
| 55 to 64 Years | 19 (25.3%) | 7 (13.7%) |
| 65 to 74 Years | 2 (5.7%) | 12 (25.0%) |
| 75 Years and over | 0 (0.0%) | 0 (0.0%) |
| Total | 47 (10.2%) | 60 (15.8%) |
Income Above Poverty by Sex and Age in Knox City
According to the poverty statistics in Knox City, males aged under 5 years and females aged under 5 years are the age groups that are most secure financially, with 100.0% of males and 100.0% of females in these age groups living above the poverty line.
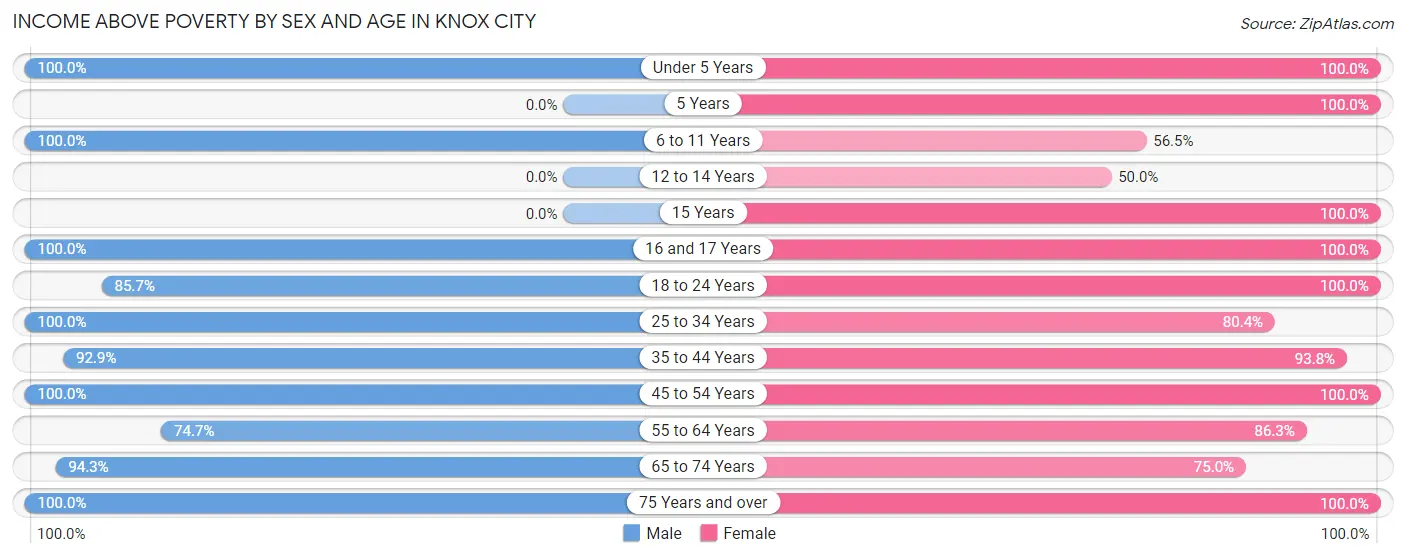
| Age Bracket | Male | Female |
| Under 5 Years | 16 (100.0%) | 14 (100.0%) |
| 5 Years | 0 (0.0%) | 3 (100.0%) |
| 6 to 11 Years | 45 (100.0%) | 26 (56.5%) |
| 12 to 14 Years | 0 (0.0%) | 9 (50.0%) |
| 15 Years | 0 (0.0%) | 4 (100.0%) |
| 16 and 17 Years | 48 (100.0%) | 21 (100.0%) |
| 18 to 24 Years | 42 (85.7%) | 36 (100.0%) |
| 25 to 34 Years | 56 (100.0%) | 41 (80.4%) |
| 35 to 44 Years | 52 (92.9%) | 30 (93.8%) |
| 45 to 54 Years | 60 (100.0%) | 25 (100.0%) |
| 55 to 64 Years | 56 (74.7%) | 44 (86.3%) |
| 65 to 74 Years | 33 (94.3%) | 36 (75.0%) |
| 75 Years and over | 7 (100.0%) | 30 (100.0%) |
| Total | 415 (89.8%) | 319 (84.2%) |
Income Below Poverty Among Married-Couple Families in Knox City
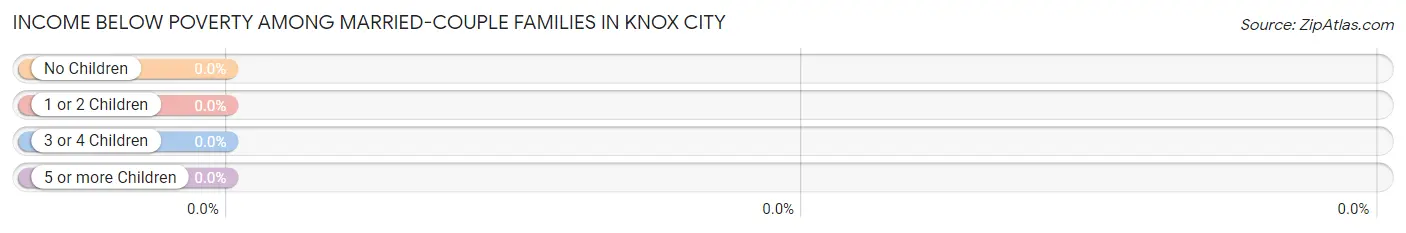
| Children | Above Poverty | Below Poverty |
| No Children | 56 (100.0%) | 0 (0.0%) |
| 1 or 2 Children | 46 (100.0%) | 0 (0.0%) |
| 3 or 4 Children | 25 (100.0%) | 0 (0.0%) |
| 5 or more Children | 0 (0.0%) | 0 (0.0%) |
| Total | 127 (100.0%) | 0 (0.0%) |
Income Below Poverty Among Single-Parent Households in Knox City
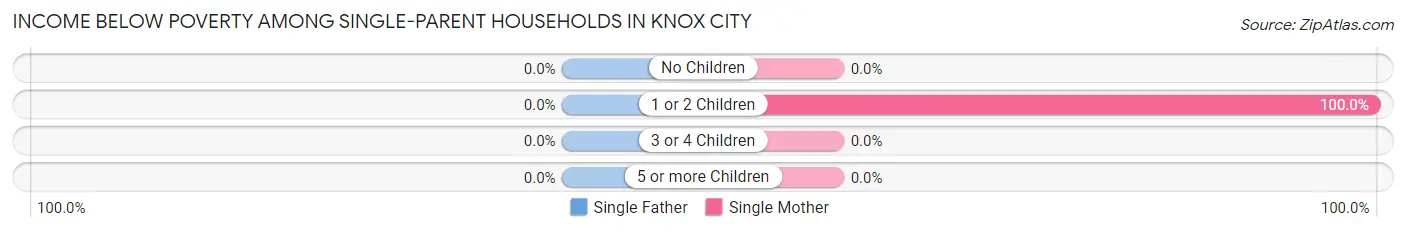
| Children | Single Father | Single Mother |
| No Children | 0 (0.0%) | 0 (0.0%) |
| 1 or 2 Children | 0 (0.0%) | 14 (100.0%) |
| 3 or 4 Children | 0 (0.0%) | 0 (0.0%) |
| 5 or more Children | 0 (0.0%) | 0 (0.0%) |
| Total | 0 (0.0%) | 14 (48.3%) |
Income Below Poverty Among Married-Couple vs Single-Parent Households in Knox City
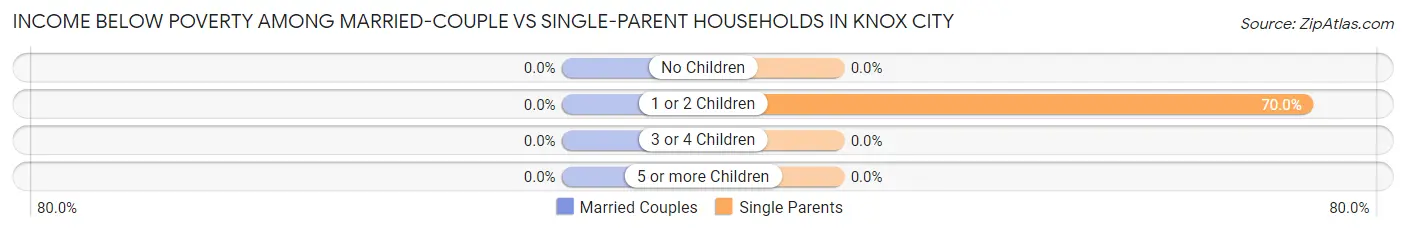
| Children | Married-Couple Families | Single-Parent Households |
| No Children | 0 (0.0%) | 0 (0.0%) |
| 1 or 2 Children | 0 (0.0%) | 14 (70.0%) |
| 3 or 4 Children | 0 (0.0%) | 0 (0.0%) |
| 5 or more Children | 0 (0.0%) | 0 (0.0%) |
| Total | 0 (0.0%) | 14 (25.9%) |
Race in Knox City
The most populous races in Knox City are White / Caucasian (739 | 82.3%), Hispanic or Latino (323 | 36.0%), and Two or more Races (63 | 7.0%).
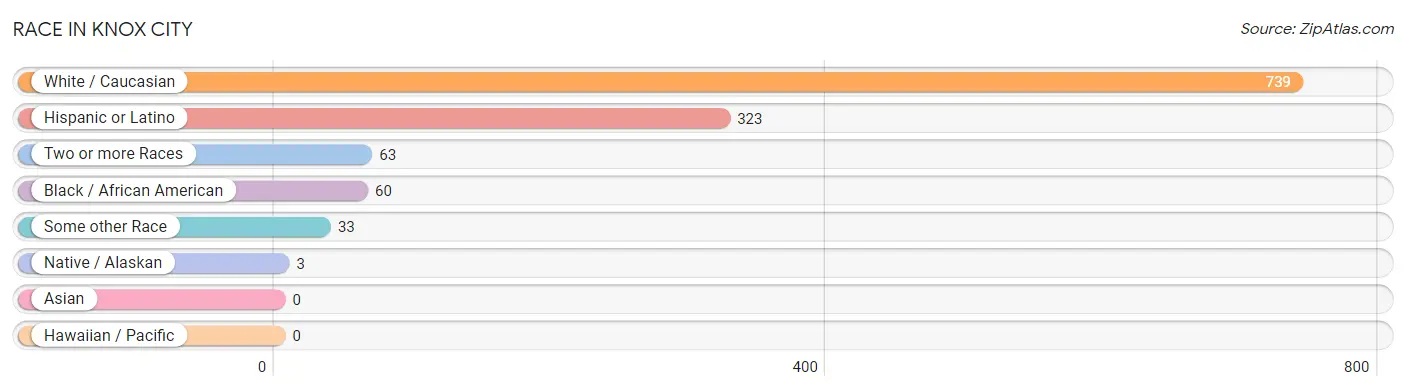
| Race | # Population | % Population |
| Asian | 0 | 0.0% |
| Black / African American | 60 | 6.7% |
| Hawaiian / Pacific | 0 | 0.0% |
| Hispanic or Latino | 323 | 36.0% |
| Native / Alaskan | 3 | 0.3% |
| White / Caucasian | 739 | 82.3% |
| Two or more Races | 63 | 7.0% |
| Some other Race | 33 | 3.7% |
| Total | 898 | 100.0% |
Ancestry in Knox City
The most populous ancestries reported in Knox City are Mexican (263 | 29.3%), American (125 | 13.9%), Irish (90 | 10.0%), English (82 | 9.1%), and German (76 | 8.5%), together accounting for 70.8% of all Knox City residents.
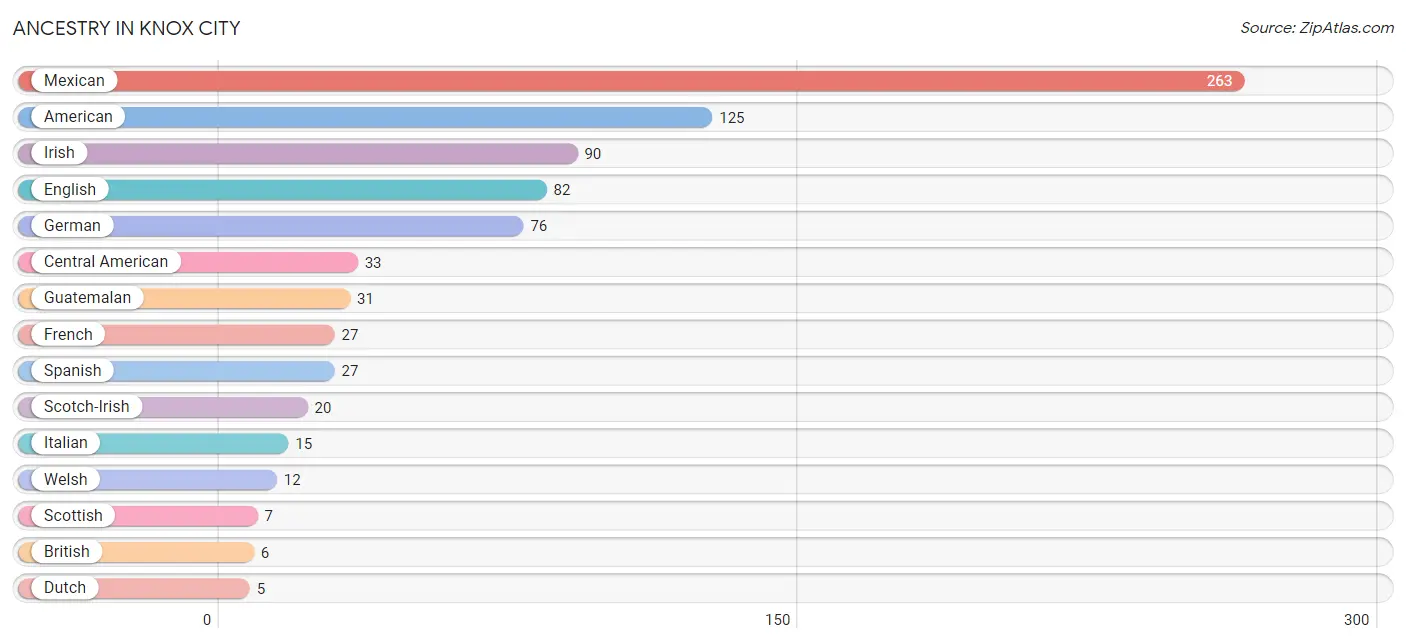
| Ancestry | # Population | % Population |
| American | 125 | 13.9% |
| Blackfeet | 2 | 0.2% |
| British | 6 | 0.7% |
| Central American | 33 | 3.7% |
| Chickasaw | 3 | 0.3% |
| Comanche | 2 | 0.2% |
| Dutch | 5 | 0.6% |
| English | 82 | 9.1% |
| French | 27 | 3.0% |
| German | 76 | 8.5% |
| Guatemalan | 31 | 3.5% |
| Irish | 90 | 10.0% |
| Italian | 15 | 1.7% |
| Mexican | 263 | 29.3% |
| Polish | 3 | 0.3% |
| Salvadoran | 2 | 0.2% |
| Scotch-Irish | 20 | 2.2% |
| Scottish | 7 | 0.8% |
| Spanish | 27 | 3.0% |
| Swedish | 5 | 0.6% |
| Swiss | 4 | 0.4% |
| Welsh | 12 | 1.3% | View All 22 Rows |
Immigrants in Knox City
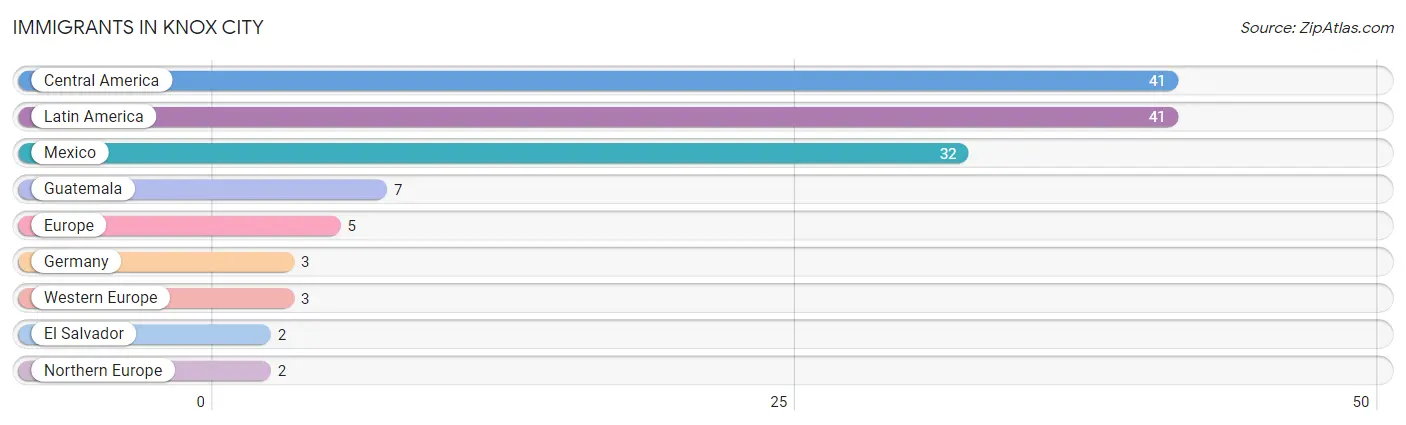
The most numerous immigrant groups reported in Knox City came from Central America (41 | 4.6%), Latin America (41 | 4.6%), Mexico (32 | 3.6%), Guatemala (7 | 0.8%), and Europe (5 | 0.6%), together accounting for 14.0% of all Knox City residents.
| Immigration Origin | # Population | % Population |
| Central America | 41 | 4.6% |
| El Salvador | 2 | 0.2% |
| Europe | 5 | 0.6% |
| Germany | 3 | 0.3% |
| Guatemala | 7 | 0.8% |
| Latin America | 41 | 4.6% |
| Mexico | 32 | 3.6% |
| Northern Europe | 2 | 0.2% |
| Western Europe | 3 | 0.3% | View All 9 Rows |
Sex and Age in Knox City
Sex and Age in Knox City
The most populous age groups in Knox City are 15 to 19 Years (80 | 16.3%) for men and 5 to 9 Years (49 | 12.0%) for women.

| Age Bracket | Male | Female |
| Under 5 Years | 16 (3.3%) | 14 (3.4%) |
| 5 to 9 Years | 45 (9.2%) | 49 (12.0%) |
| 10 to 14 Years | 15 (3.1%) | 18 (4.4%) |
| 15 to 19 Years | 80 (16.3%) | 33 (8.1%) |
| 20 to 24 Years | 17 (3.5%) | 28 (6.9%) |
| 25 to 29 Years | 49 (10.0%) | 5 (1.2%) |
| 30 to 34 Years | 7 (1.4%) | 46 (11.3%) |
| 35 to 39 Years | 29 (5.9%) | 25 (6.1%) |
| 40 to 44 Years | 27 (5.5%) | 7 (1.7%) |
| 45 to 49 Years | 23 (4.7%) | 13 (3.2%) |
| 50 to 54 Years | 37 (7.5%) | 16 (3.9%) |
| 55 to 59 Years | 49 (10.0%) | 13 (3.2%) |
| 60 to 64 Years | 30 (6.1%) | 43 (10.5%) |
| 65 to 69 Years | 15 (3.1%) | 21 (5.1%) |
| 70 to 74 Years | 32 (6.5%) | 34 (8.3%) |
| 75 to 79 Years | 2 (0.4%) | 15 (3.7%) |
| 80 to 84 Years | 7 (1.4%) | 17 (4.2%) |
| 85 Years and over | 10 (2.0%) | 11 (2.7%) |
| Total | 490 (100.0%) | 408 (100.0%) |
Families and Households in Knox City
Median Family Size in Knox City
The median family size in Knox City is 3.78 persons per family, with single female/mother families (29 | 16.0%) accounting for the largest median family size of 4.66 persons per family. On the other hand, single male/father families (25 | 13.8%) represent the smallest median family size with 1.84 persons per family.
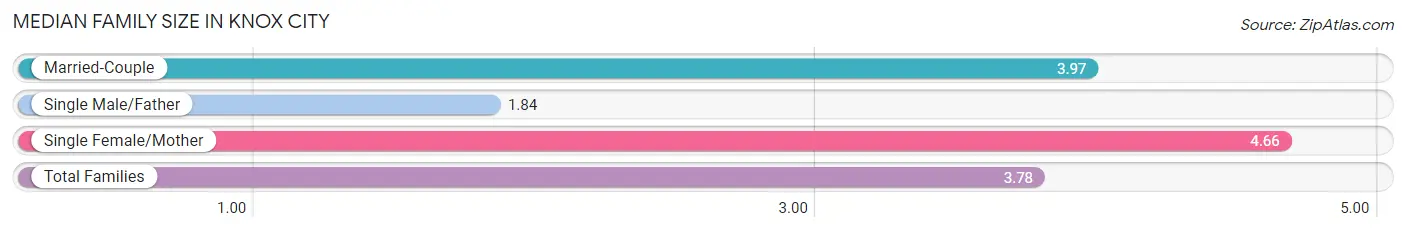
| Family Type | # Families | Family Size |
| Married-Couple | 127 (70.2%) | 3.97 |
| Single Male/Father | 25 (13.8%) | 1.84 |
| Single Female/Mother | 29 (16.0%) | 4.66 |
| Total Families | 181 (100.0%) | 3.78 |
Median Household Size in Knox City
The median household size in Knox City is 2.63 persons per household, with single female/mother households (29 | 9.1%) accounting for the largest median household size of 4.66 persons per household. non-family households (139 | 43.4%) represent the smallest median household size with 1.11 persons per household.
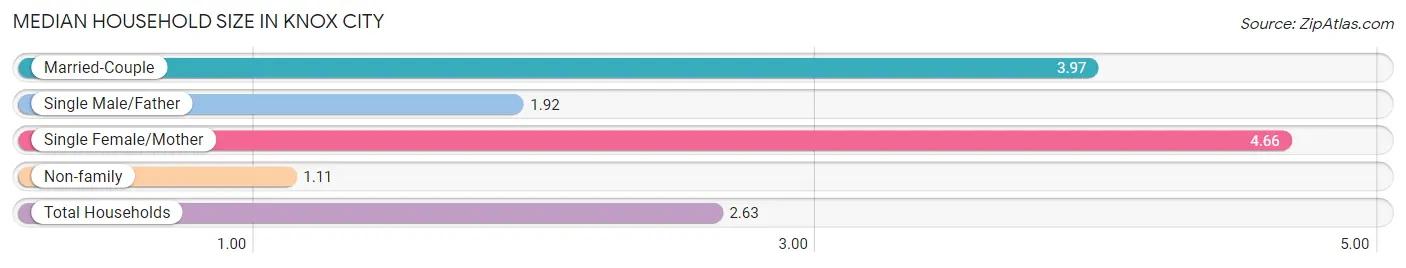
| Household Type | # Households | Household Size |
| Married-Couple | 127 (39.7%) | 3.97 |
| Single Male/Father | 25 (7.8%) | 1.92 |
| Single Female/Mother | 29 (9.1%) | 4.66 |
| Non-family | 139 (43.4%) | 1.11 |
| Total Households | 320 (100.0%) | 2.63 |
Household Size by Marriage Status in Knox City
Out of a total of 320 households in Knox City, 181 (56.6%) are family households, while 139 (43.4%) are nonfamily households. The most numerous type of family households are 2-person households, comprising 81, and the most common type of nonfamily households are 1-person households, comprising 129.
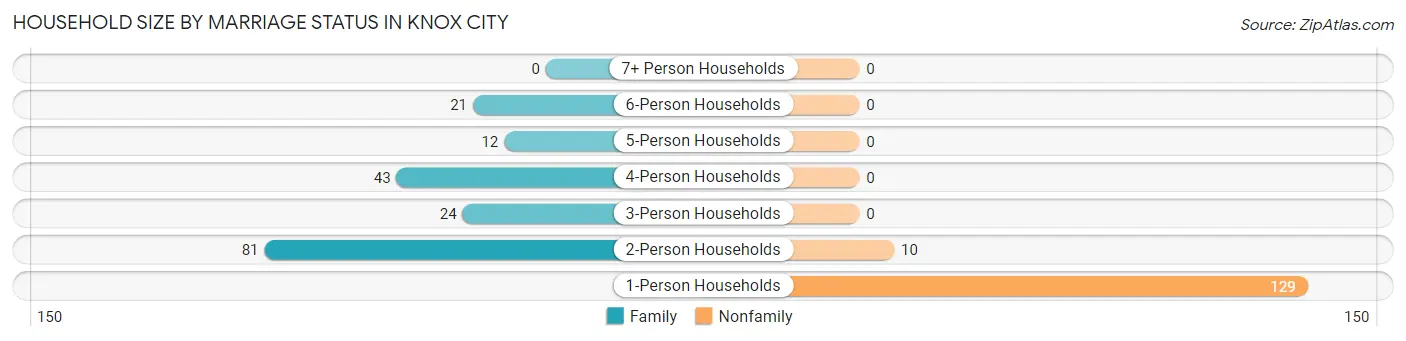
| Household Size | Family Households | Nonfamily Households |
| 1-Person Households | - | 129 (40.3%) |
| 2-Person Households | 81 (25.3%) | 10 (3.1%) |
| 3-Person Households | 24 (7.5%) | 0 (0.0%) |
| 4-Person Households | 43 (13.4%) | 0 (0.0%) |
| 5-Person Households | 12 (3.7%) | 0 (0.0%) |
| 6-Person Households | 21 (6.6%) | 0 (0.0%) |
| 7+ Person Households | 0 (0.0%) | 0 (0.0%) |
| Total | 181 (56.6%) | 139 (43.4%) |
Female Fertility in Knox City
Fertility by Age in Knox City
Average fertility rate in Knox City is 83.0 births per 1,000 women. Women in the age bracket of 20 to 34 years have the highest fertility rate with 165.0 births per 1,000 women. Women in the age bracket of 20 to 34 years acount for 100.0% of all women with births.
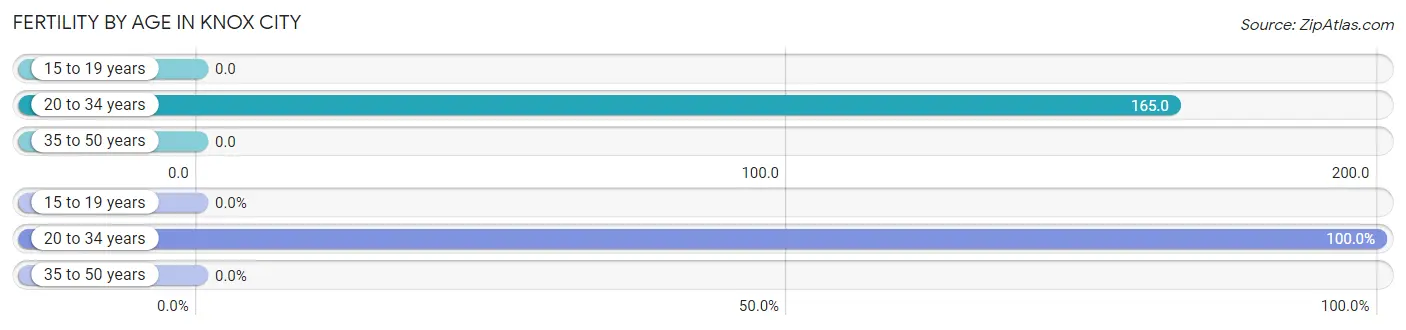
| Age Bracket | Women with Births | Births / 1,000 Women |
| 15 to 19 years | 0 (0.0%) | 0.0 |
| 20 to 34 years | 13 (100.0%) | 165.0 |
| 35 to 50 years | 0 (0.0%) | 0.0 |
| Total | 13 (100.0%) | 83.0 |
Fertility by Age by Marriage Status in Knox City
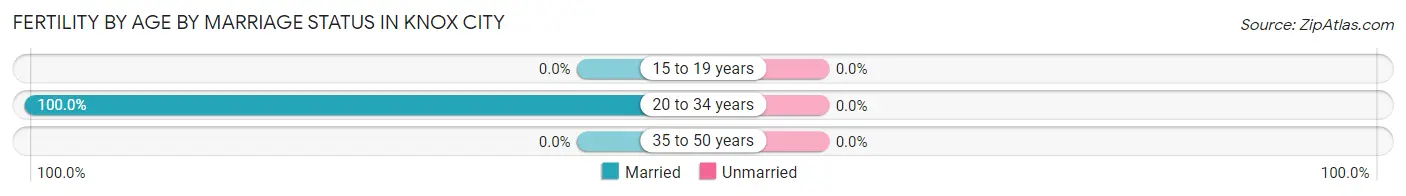
| Age Bracket | Married | Unmarried |
| 15 to 19 years | 0 (0.0%) | 0 (0.0%) |
| 20 to 34 years | 13 (100.0%) | 0 (0.0%) |
| 35 to 50 years | 0 (0.0%) | 0 (0.0%) |
| Total | 13 (100.0%) | 0 (0.0%) |
Fertility by Education in Knox City
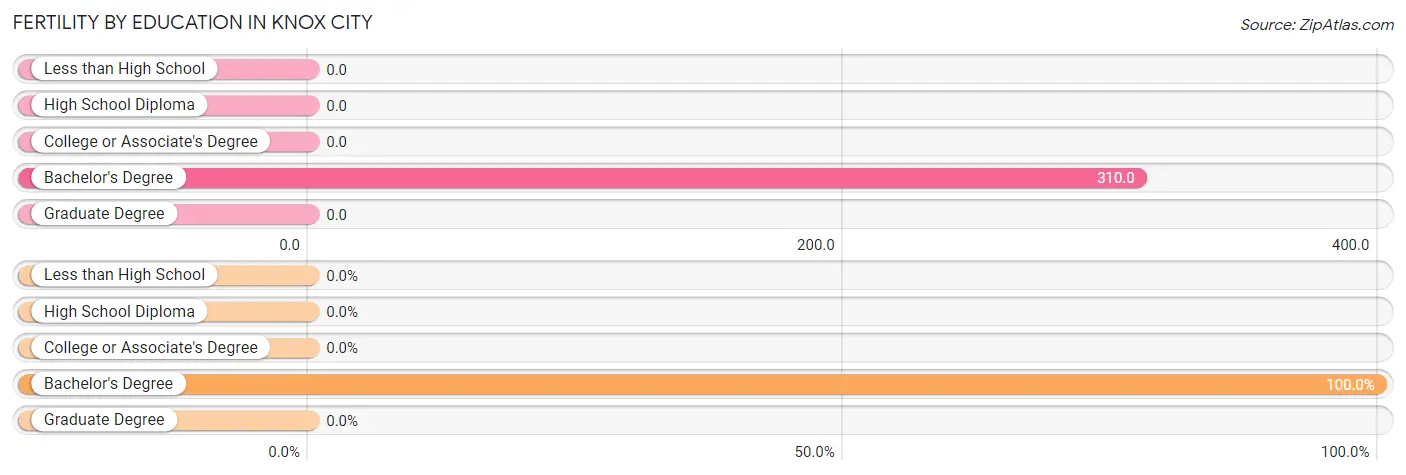
| Educational Attainment | Women with Births | Births / 1,000 Women |
| Less than High School | 0 (0.0%) | 0.0 |
| High School Diploma | 0 (0.0%) | 0.0 |
| College or Associate's Degree | 0 (0.0%) | 0.0 |
| Bachelor's Degree | 13 (100.0%) | 310.0 |
| Graduate Degree | 0 (0.0%) | 0.0 |
| Total | 13 (100.0%) | 83.0 |
Fertility by Education by Marriage Status in Knox City
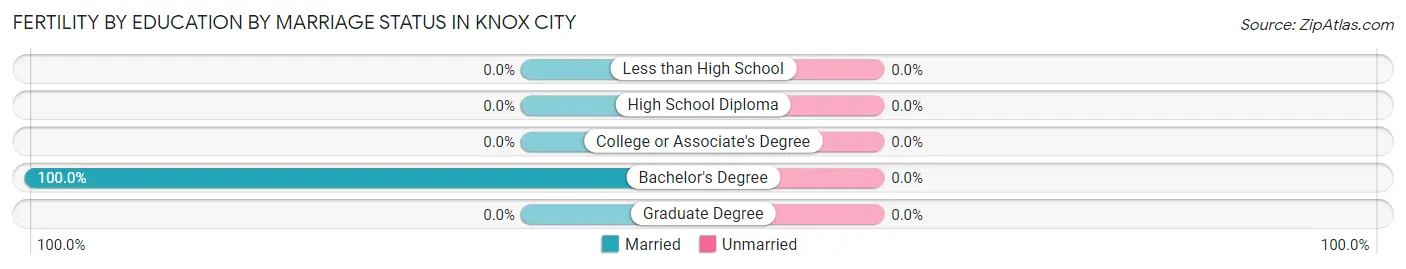
| Educational Attainment | Married | Unmarried |
| Less than High School | 0 (0.0%) | 0 (0.0%) |
| High School Diploma | 0 (0.0%) | 0 (0.0%) |
| College or Associate's Degree | 0 (0.0%) | 0 (0.0%) |
| Bachelor's Degree | 13 (100.0%) | 0 (0.0%) |
| Graduate Degree | 0 (0.0%) | 0 (0.0%) |
| Total | 13 (100.0%) | 0 (0.0%) |
Employment Characteristics in Knox City
Employment by Class of Employer in Knox City
Among the 288 employed individuals in Knox City, private company employees (128 | 44.4%), local government employees (61 | 21.2%), and self-employed (incorporated) (43 | 14.9%) make up the most common classes of employment.
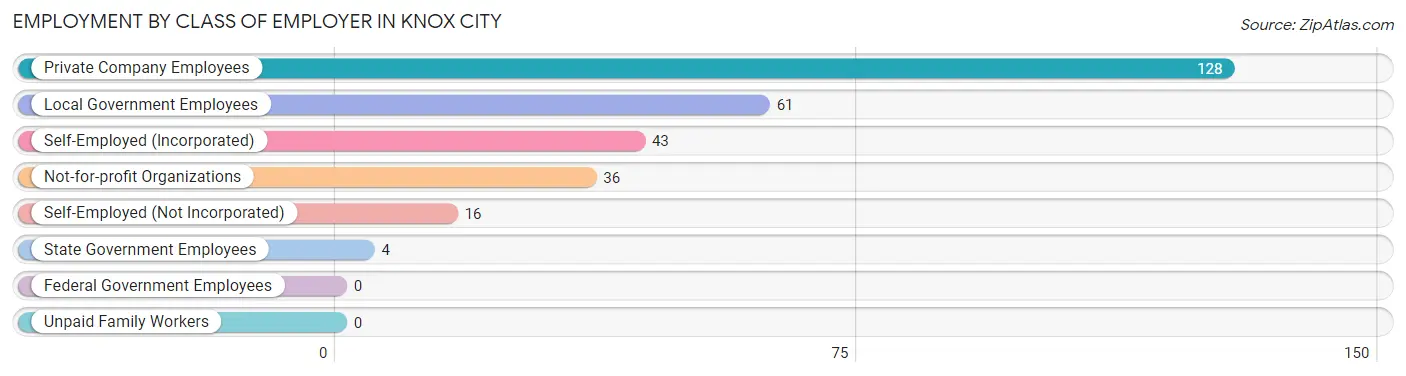
| Employer Class | # Employees | % Employees |
| Private Company Employees | 128 | 44.4% |
| Self-Employed (Incorporated) | 43 | 14.9% |
| Self-Employed (Not Incorporated) | 16 | 5.6% |
| Not-for-profit Organizations | 36 | 12.5% |
| Local Government Employees | 61 | 21.2% |
| State Government Employees | 4 | 1.4% |
| Federal Government Employees | 0 | 0.0% |
| Unpaid Family Workers | 0 | 0.0% |
| Total | 288 | 100.0% |
Employment Status by Age in Knox City
According to the labor force statistics for Knox City, out of the total population over 16 years of age (737), 42.9% or 316 individuals are in the labor force, with 1.3% or 4 of them unemployed. The age group with the highest labor force participation rate is 25 to 29 years, with 92.6% or 50 individuals in the labor force. Within the labor force, the 55 to 59 years age range has the highest percentage of unemployed individuals, with 7.1% or 3 of them being unemployed.
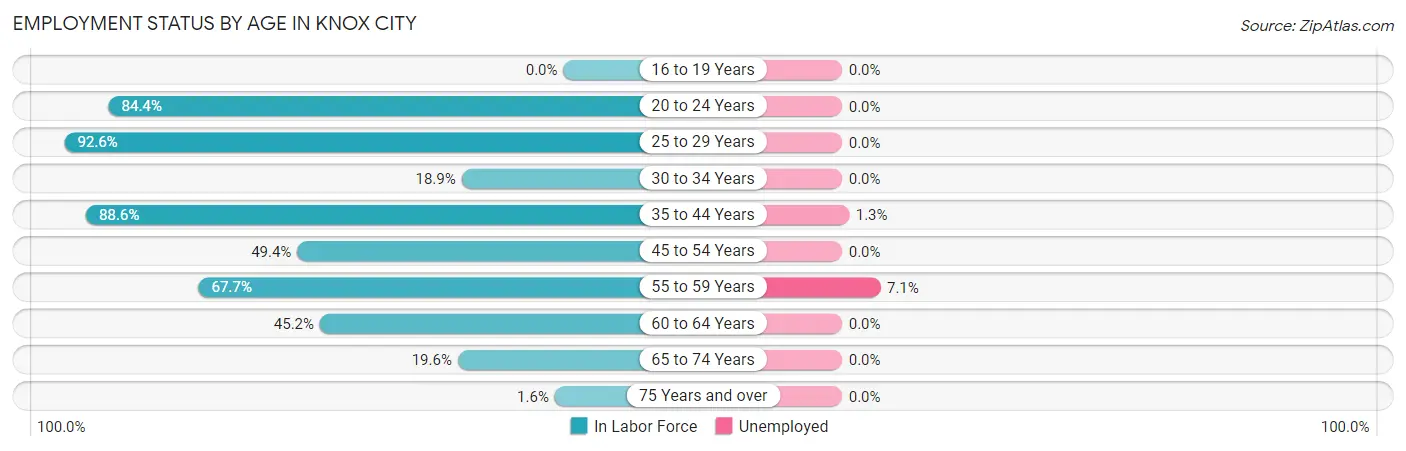
| Age Bracket | In Labor Force | Unemployed |
| 16 to 19 Years | 0 (0.0%) | 0 (0.0%) |
| 20 to 24 Years | 38 (84.4%) | 0 (0.0%) |
| 25 to 29 Years | 50 (92.6%) | 0 (0.0%) |
| 30 to 34 Years | 10 (18.9%) | 0 (0.0%) |
| 35 to 44 Years | 78 (88.6%) | 1 (1.3%) |
| 45 to 54 Years | 44 (49.4%) | 0 (0.0%) |
| 55 to 59 Years | 42 (67.7%) | 3 (7.1%) |
| 60 to 64 Years | 33 (45.2%) | 0 (0.0%) |
| 65 to 74 Years | 20 (19.6%) | 0 (0.0%) |
| 75 Years and over | 1 (1.6%) | 0 (0.0%) |
| Total | 316 (42.9%) | 4 (1.3%) |
Employment Status by Educational Attainment in Knox City
According to labor force statistics for Knox City, 61.3% of individuals (257) out of the total population between 25 and 64 years of age (419) are in the labor force, with 1.6% or 4 of them being unemployed. The group with the highest labor force participation rate are those with the educational attainment of college / associate degree, with 87.1% or 128 individuals in the labor force. Within the labor force, individuals with less than high school education have the highest percentage of unemployment, with 11.4% or 4 of them being unemployed.
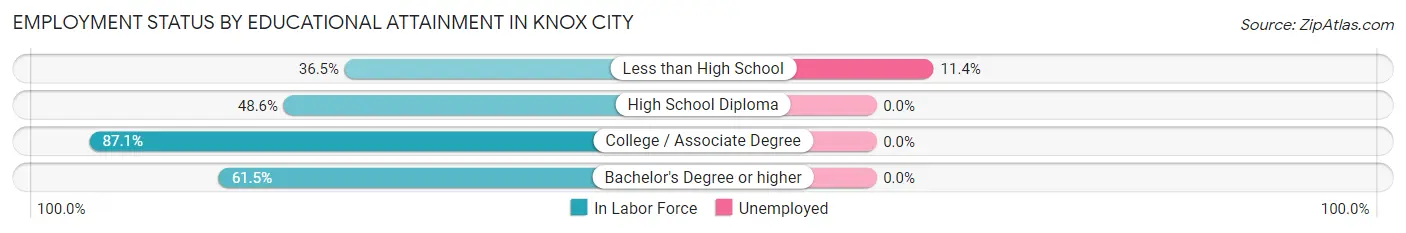
| Educational Attainment | In Labor Force | Unemployed |
| Less than High School | 35 (36.5%) | 11 (11.4%) |
| High School Diploma | 54 (48.6%) | 0 (0.0%) |
| College / Associate Degree | 128 (87.1%) | 0 (0.0%) |
| Bachelor's Degree or higher | 40 (61.5%) | 0 (0.0%) |
| Total | 257 (61.3%) | 7 (1.6%) |
Employment Occupations by Sex in Knox City
Management, Business, Science and Arts Occupations
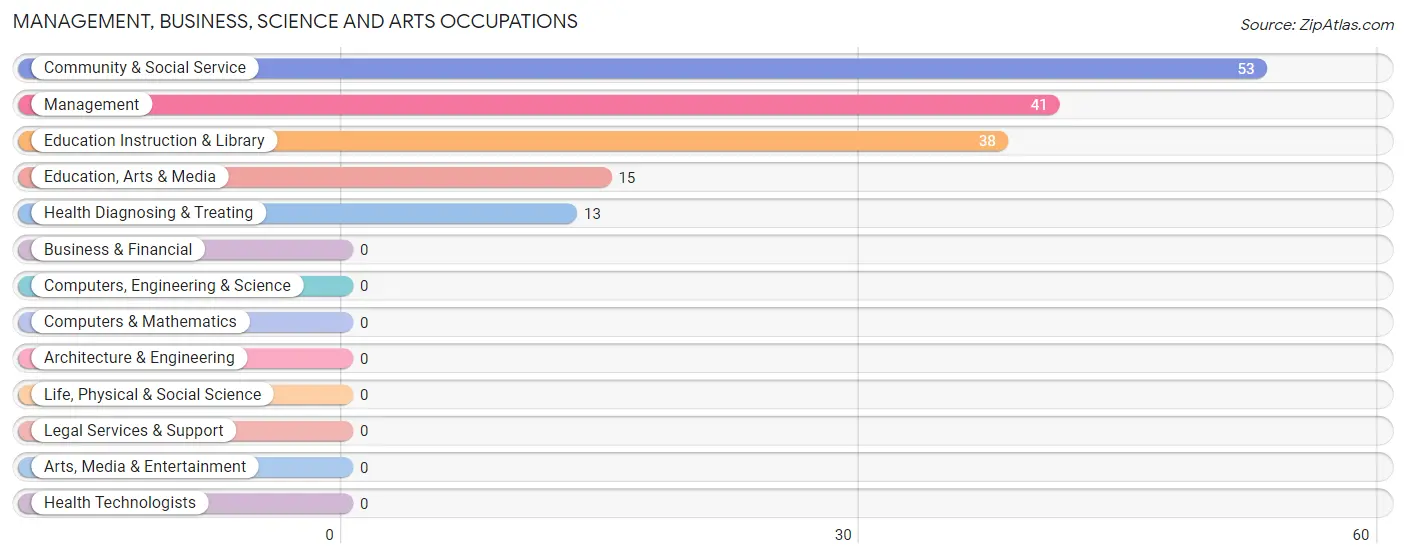
The most common Management, Business, Science and Arts occupations in Knox City are Community & Social Service (53 | 17.0%), Management (41 | 13.1%), Education Instruction & Library (38 | 12.2%), Education, Arts & Media (15 | 4.8%), and Health Diagnosing & Treating (13 | 4.2%).
Management, Business, Science and Arts Occupations by Sex
Within the Management, Business, Science and Arts occupations in Knox City, the most male-oriented occupations are Education, Arts & Media (86.7%), Community & Social Service (60.4%), and Management (58.5%), while the most female-oriented occupations are Health Diagnosing & Treating (100.0%), Education Instruction & Library (50.0%), and Management (41.5%).
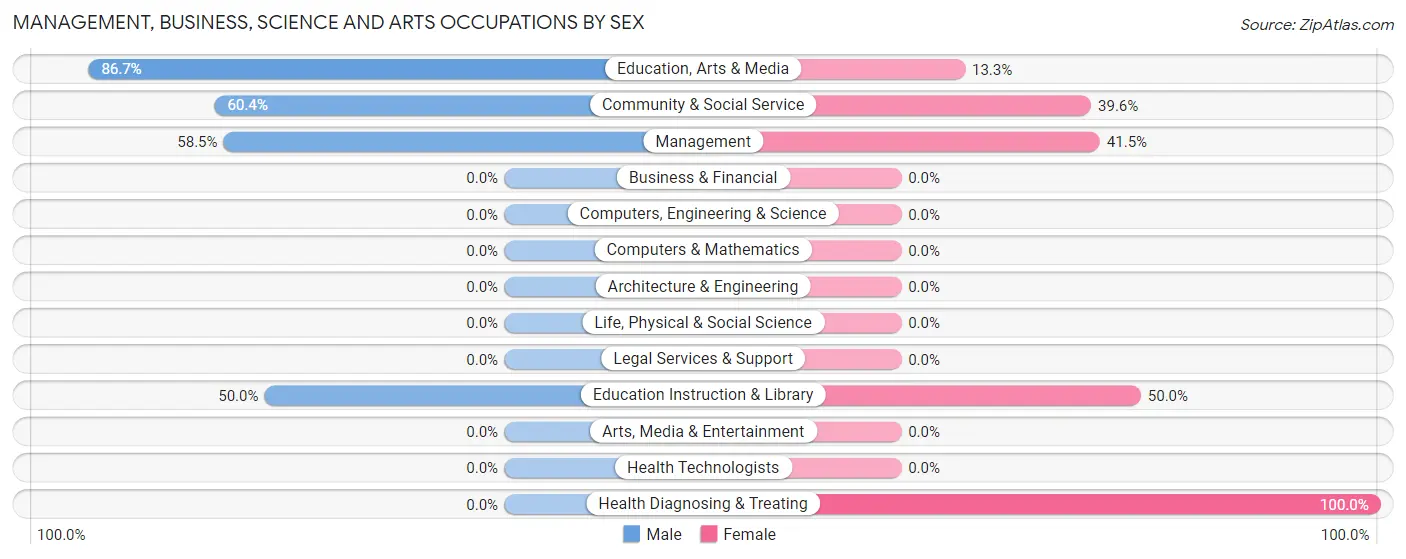
| Occupation | Male | Female |
| Management | 24 (58.5%) | 17 (41.5%) |
| Business & Financial | 0 (0.0%) | 0 (0.0%) |
| Computers, Engineering & Science | 0 (0.0%) | 0 (0.0%) |
| Computers & Mathematics | 0 (0.0%) | 0 (0.0%) |
| Architecture & Engineering | 0 (0.0%) | 0 (0.0%) |
| Life, Physical & Social Science | 0 (0.0%) | 0 (0.0%) |
| Community & Social Service | 32 (60.4%) | 21 (39.6%) |
| Education, Arts & Media | 13 (86.7%) | 2 (13.3%) |
| Legal Services & Support | 0 (0.0%) | 0 (0.0%) |
| Education Instruction & Library | 19 (50.0%) | 19 (50.0%) |
| Arts, Media & Entertainment | 0 (0.0%) | 0 (0.0%) |
| Health Diagnosing & Treating | 0 (0.0%) | 13 (100.0%) |
| Health Technologists | 0 (0.0%) | 0 (0.0%) |
| Total (Category) | 56 (52.3%) | 51 (47.7%) |
| Total (Overall) | 206 (66.0%) | 106 (34.0%) |
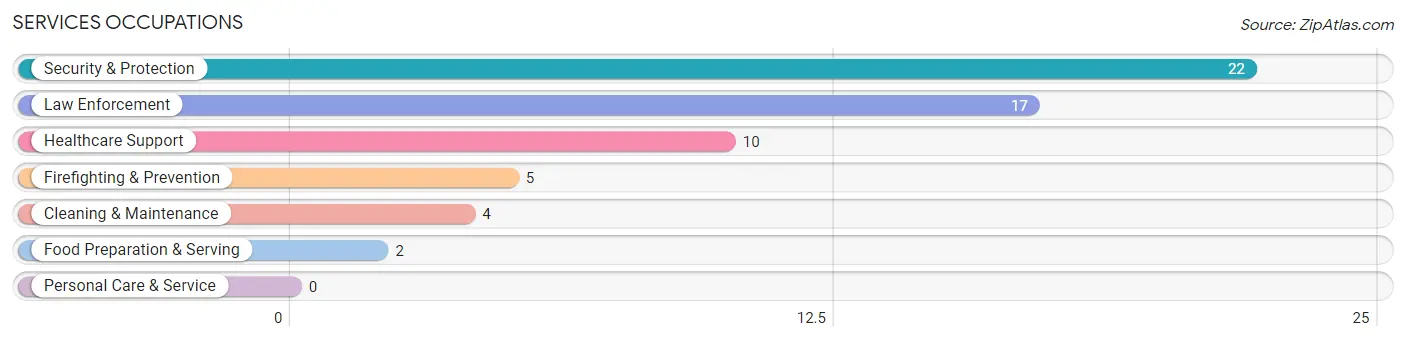
Services Occupations
The most common Services occupations in Knox City are Security & Protection (22 | 7.0%), Law Enforcement (17 | 5.4%), Healthcare Support (10 | 3.2%), Firefighting & Prevention (5 | 1.6%), and Cleaning & Maintenance (4 | 1.3%).
Services Occupations by Sex
Within the Services occupations in Knox City, the most male-oriented occupations are Security & Protection (100.0%), Firefighting & Prevention (100.0%), and Law Enforcement (100.0%), while the most female-oriented occupations are Healthcare Support (100.0%), and Food Preparation & Serving (100.0%).
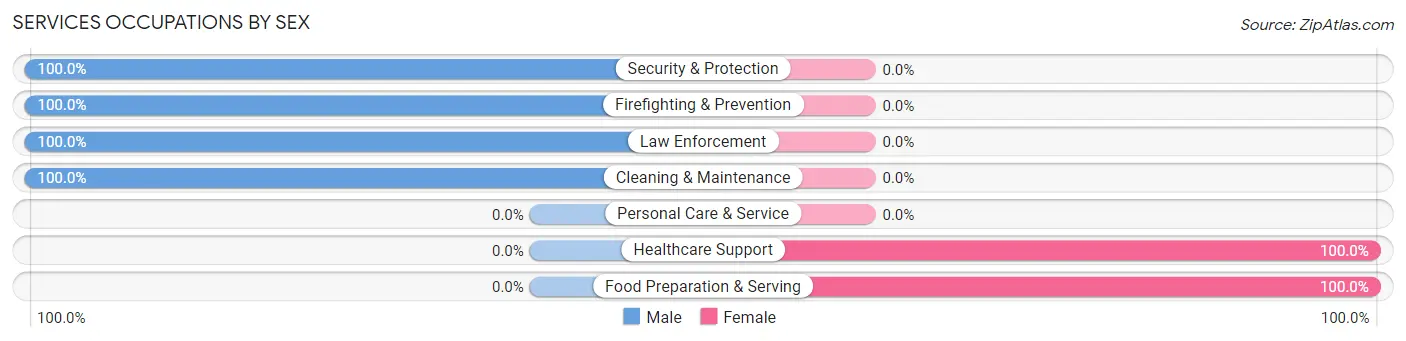
| Occupation | Male | Female |
| Healthcare Support | 0 (0.0%) | 10 (100.0%) |
| Security & Protection | 22 (100.0%) | 0 (0.0%) |
| Firefighting & Prevention | 5 (100.0%) | 0 (0.0%) |
| Law Enforcement | 17 (100.0%) | 0 (0.0%) |
| Food Preparation & Serving | 0 (0.0%) | 2 (100.0%) |
| Cleaning & Maintenance | 4 (100.0%) | 0 (0.0%) |
| Personal Care & Service | 0 (0.0%) | 0 (0.0%) |
| Total (Category) | 26 (68.4%) | 12 (31.6%) |
| Total (Overall) | 206 (66.0%) | 106 (34.0%) |
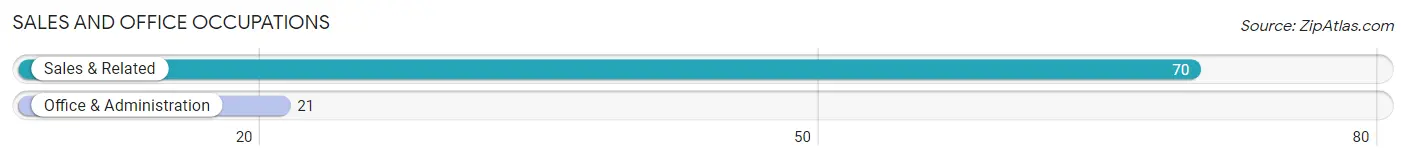
Sales and Office Occupations
The most common Sales and Office occupations in Knox City are Sales & Related (70 | 22.4%), and Office & Administration (21 | 6.7%).
Sales and Office Occupations by Sex
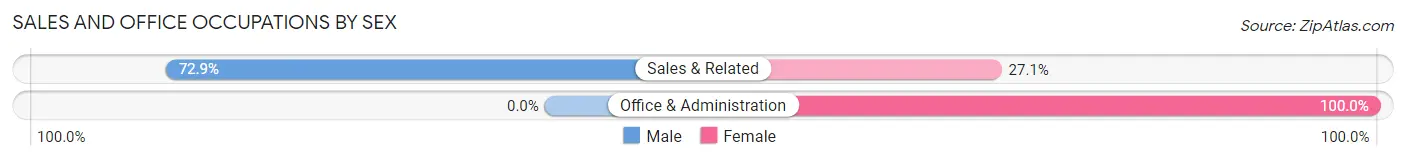
| Occupation | Male | Female |
| Sales & Related | 51 (72.9%) | 19 (27.1%) |
| Office & Administration | 0 (0.0%) | 21 (100.0%) |
| Total (Category) | 51 (56.0%) | 40 (44.0%) |
| Total (Overall) | 206 (66.0%) | 106 (34.0%) |
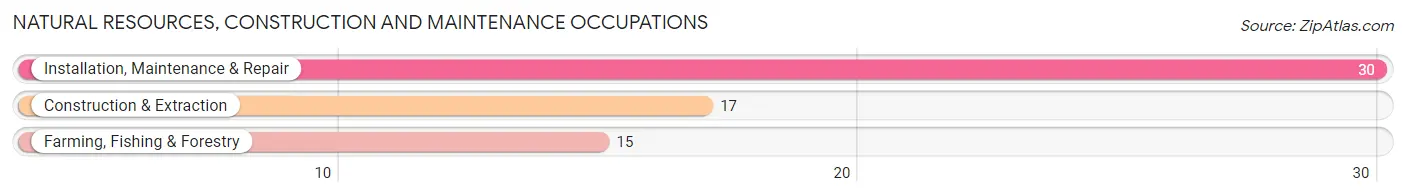
Natural Resources, Construction and Maintenance Occupations
The most common Natural Resources, Construction and Maintenance occupations in Knox City are Installation, Maintenance & Repair (30 | 9.6%), Construction & Extraction (17 | 5.4%), and Farming, Fishing & Forestry (15 | 4.8%).
Natural Resources, Construction and Maintenance Occupations by Sex
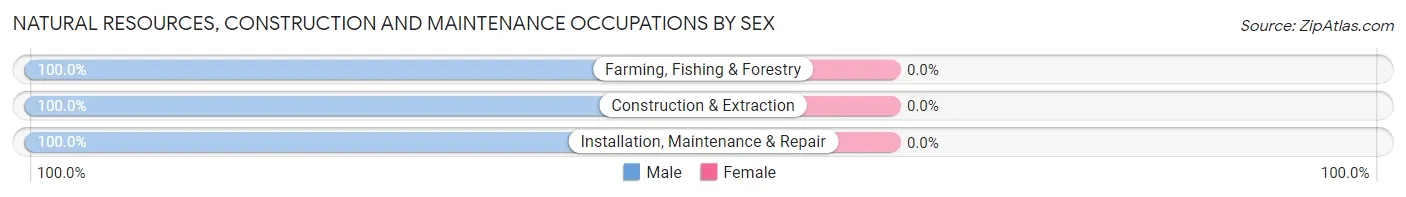
| Occupation | Male | Female |
| Farming, Fishing & Forestry | 15 (100.0%) | 0 (0.0%) |
| Construction & Extraction | 17 (100.0%) | 0 (0.0%) |
| Installation, Maintenance & Repair | 30 (100.0%) | 0 (0.0%) |
| Total (Category) | 62 (100.0%) | 0 (0.0%) |
| Total (Overall) | 206 (66.0%) | 106 (34.0%) |
Production, Transportation and Moving Occupations
The most common Production, Transportation and Moving occupations in Knox City are Transportation (11 | 3.5%), and Production (3 | 1.0%).
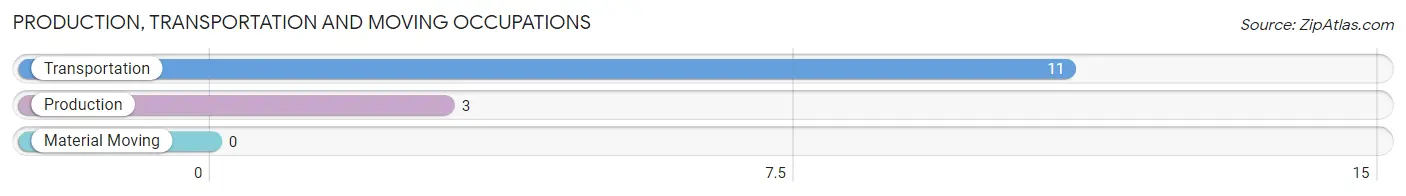
Production, Transportation and Moving Occupations by Sex
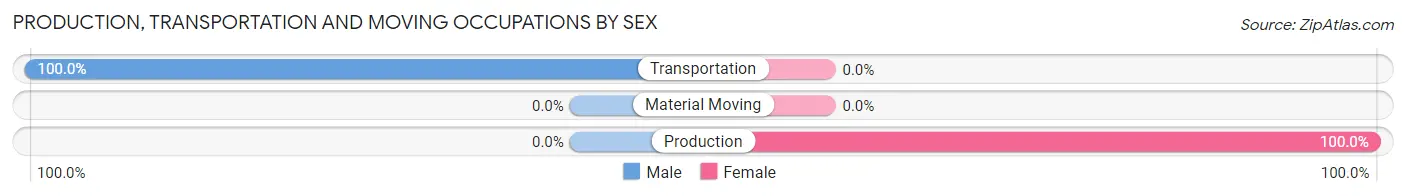
| Occupation | Male | Female |
| Production | 0 (0.0%) | 3 (100.0%) |
| Transportation | 11 (100.0%) | 0 (0.0%) |
| Material Moving | 0 (0.0%) | 0 (0.0%) |
| Total (Category) | 11 (78.6%) | 3 (21.4%) |
| Total (Overall) | 206 (66.0%) | 106 (34.0%) |
Employment Industries by Sex in Knox City
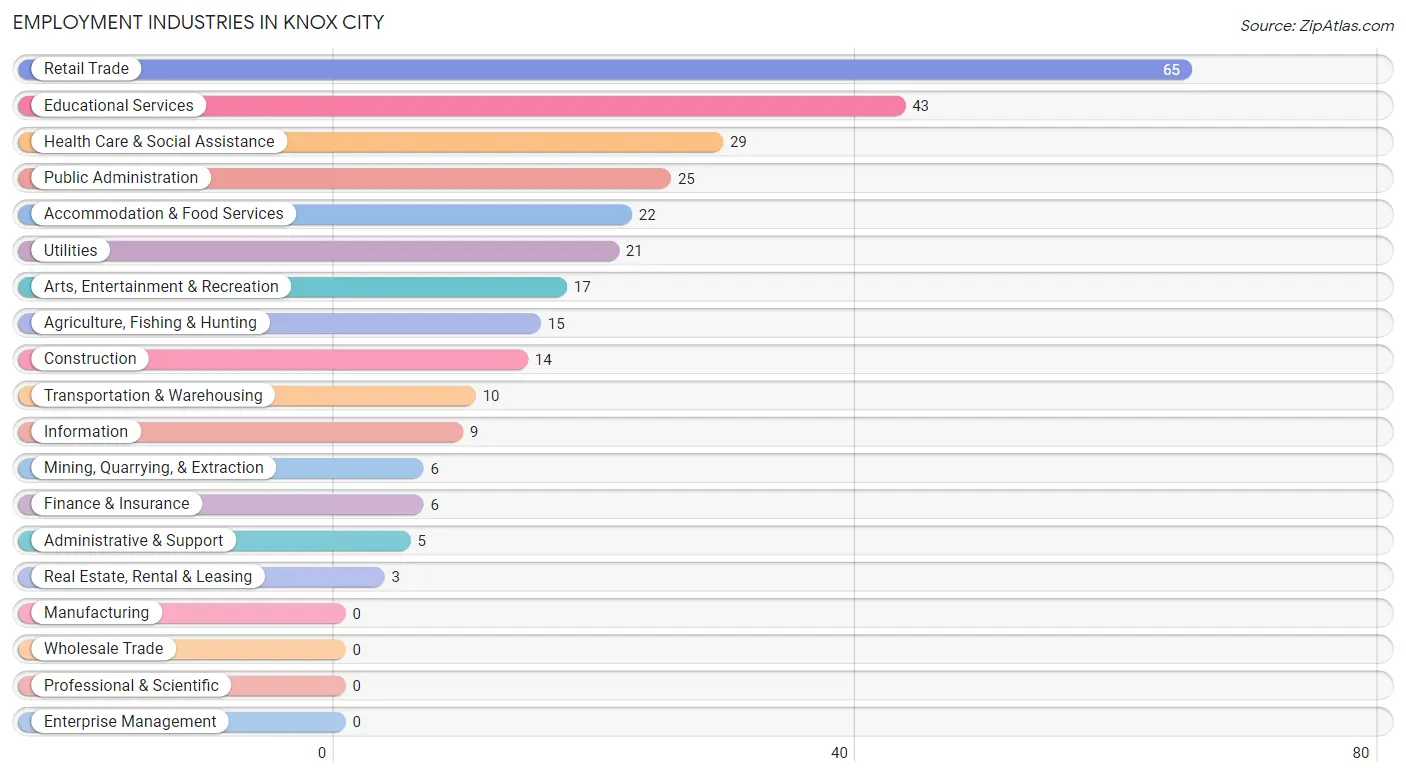
Employment Industries in Knox City
The major employment industries in Knox City include Retail Trade (65 | 20.8%), Educational Services (43 | 13.8%), Health Care & Social Assistance (29 | 9.3%), Public Administration (25 | 8.0%), and Accommodation & Food Services (22 | 7.0%).
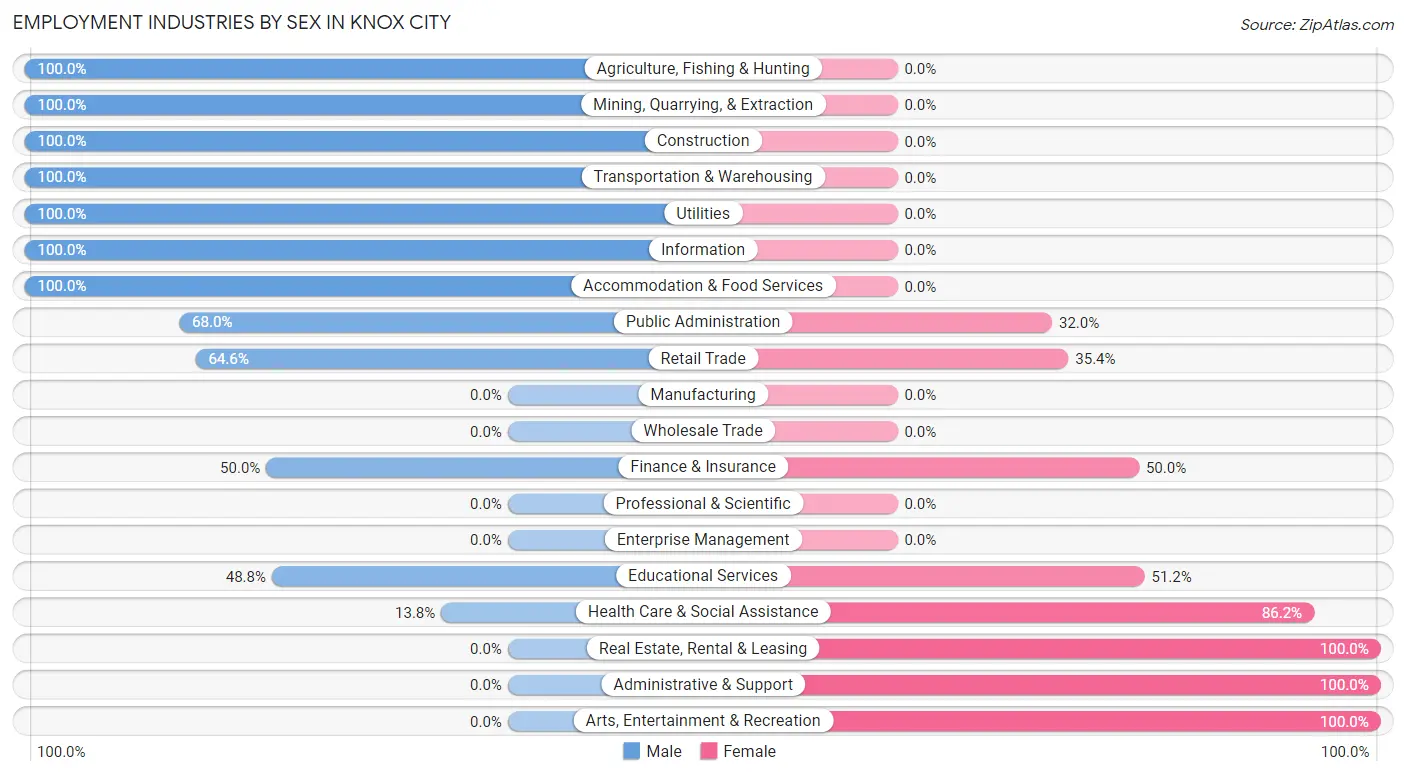
Employment Industries by Sex in Knox City
The Knox City industries that see more men than women are Agriculture, Fishing & Hunting (100.0%), Mining, Quarrying, & Extraction (100.0%), and Construction (100.0%), whereas the industries that tend to have a higher number of women are Real Estate, Rental & Leasing (100.0%), Administrative & Support (100.0%), and Arts, Entertainment & Recreation (100.0%).
| Industry | Male | Female |
| Agriculture, Fishing & Hunting | 15 (100.0%) | 0 (0.0%) |
| Mining, Quarrying, & Extraction | 6 (100.0%) | 0 (0.0%) |
| Construction | 14 (100.0%) | 0 (0.0%) |
| Manufacturing | 0 (0.0%) | 0 (0.0%) |
| Wholesale Trade | 0 (0.0%) | 0 (0.0%) |
| Retail Trade | 42 (64.6%) | 23 (35.4%) |
| Transportation & Warehousing | 10 (100.0%) | 0 (0.0%) |
| Utilities | 21 (100.0%) | 0 (0.0%) |
| Information | 9 (100.0%) | 0 (0.0%) |
| Finance & Insurance | 3 (50.0%) | 3 (50.0%) |
| Real Estate, Rental & Leasing | 0 (0.0%) | 3 (100.0%) |
| Professional & Scientific | 0 (0.0%) | 0 (0.0%) |
| Enterprise Management | 0 (0.0%) | 0 (0.0%) |
| Administrative & Support | 0 (0.0%) | 5 (100.0%) |
| Educational Services | 21 (48.8%) | 22 (51.2%) |
| Health Care & Social Assistance | 4 (13.8%) | 25 (86.2%) |
| Arts, Entertainment & Recreation | 0 (0.0%) | 17 (100.0%) |
| Accommodation & Food Services | 22 (100.0%) | 0 (0.0%) |
| Public Administration | 17 (68.0%) | 8 (32.0%) |
| Total | 206 (66.0%) | 106 (34.0%) |
Education in Knox City
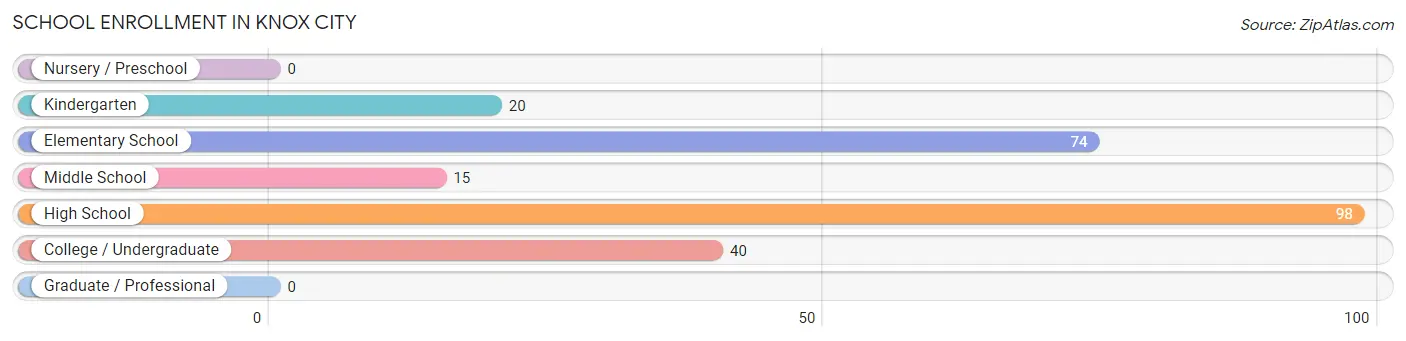
School Enrollment in Knox City
The most common levels of schooling among the 247 students in Knox City are high school (98 | 39.7%), elementary school (74 | 30.0%), and college / undergraduate (40 | 16.2%).
| School Level | # Students | % Students |
| Nursery / Preschool | 0 | 0.0% |
| Kindergarten | 20 | 8.1% |
| Elementary School | 74 | 30.0% |
| Middle School | 15 | 6.1% |
| High School | 98 | 39.7% |
| College / Undergraduate | 40 | 16.2% |
| Graduate / Professional | 0 | 0.0% |
| Total | 247 | 100.0% |
School Enrollment by Age by Funding Source in Knox City
Out of a total of 247 students who are enrolled in schools in Knox City, 40 (16.2%) attend a private institution, while the remaining 207 (83.8%) are enrolled in public schools. The age group of 15 to 17 year olds has the highest likelihood of being enrolled in private schools, with 30 (43.5% in the age bracket) enrolled. Conversely, the age group of 10 to 14 year olds has the lowest likelihood of being enrolled in a private school, with 33 (100.0% in the age bracket) attending a public institution.
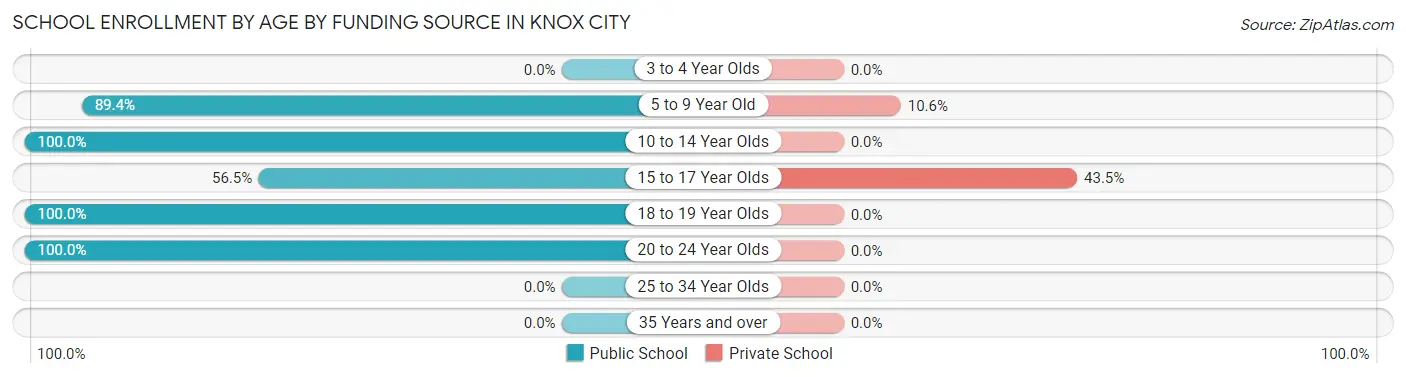
| Age Bracket | Public School | Private School |
| 3 to 4 Year Olds | 0 (0.0%) | 0 (0.0%) |
| 5 to 9 Year Old | 84 (89.4%) | 10 (10.6%) |
| 10 to 14 Year Olds | 33 (100.0%) | 0 (0.0%) |
| 15 to 17 Year Olds | 39 (56.5%) | 30 (43.5%) |
| 18 to 19 Year Olds | 32 (100.0%) | 0 (0.0%) |
| 20 to 24 Year Olds | 19 (100.0%) | 0 (0.0%) |
| 25 to 34 Year Olds | 0 (0.0%) | 0 (0.0%) |
| 35 Years and over | 0 (0.0%) | 0 (0.0%) |
| Total | 207 (83.8%) | 40 (16.2%) |
Educational Attainment by Field of Study in Knox City
Education (37 | 37.8%), arts & humanities (18 | 18.4%), science & technology (10 | 10.2%), social sciences (9 | 9.2%), and bio, nature & agricultural (8 | 8.2%) are the most common fields of study among 98 individuals in Knox City who have obtained a bachelor's degree or higher.
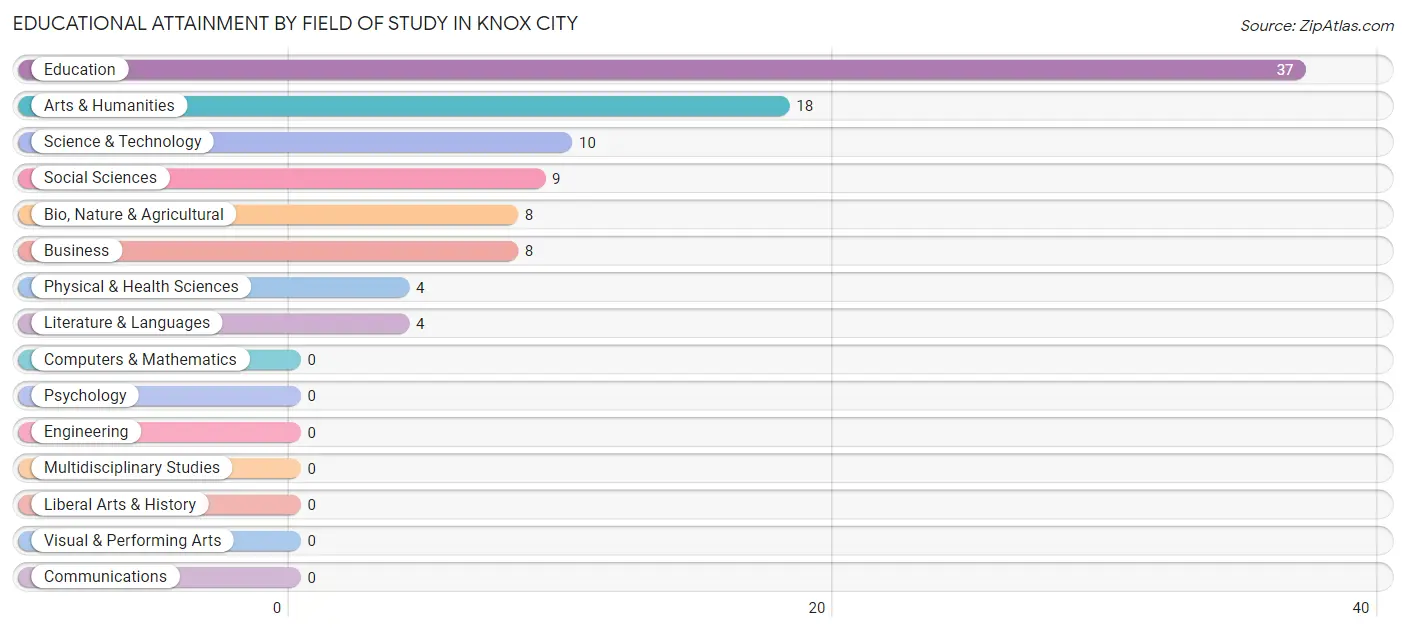
| Field of Study | # Graduates | % Graduates |
| Computers & Mathematics | 0 | 0.0% |
| Bio, Nature & Agricultural | 8 | 8.2% |
| Physical & Health Sciences | 4 | 4.1% |
| Psychology | 0 | 0.0% |
| Social Sciences | 9 | 9.2% |
| Engineering | 0 | 0.0% |
| Multidisciplinary Studies | 0 | 0.0% |
| Science & Technology | 10 | 10.2% |
| Business | 8 | 8.2% |
| Education | 37 | 37.8% |
| Literature & Languages | 4 | 4.1% |
| Liberal Arts & History | 0 | 0.0% |
| Visual & Performing Arts | 0 | 0.0% |
| Communications | 0 | 0.0% |
| Arts & Humanities | 18 | 18.4% |
| Total | 98 | 100.0% |
Transportation & Commute in Knox City
Vehicle Availability by Sex in Knox City
The most prevalent vehicle ownership categories in Knox City are males with 2 vehicles (100, accounting for 50.0%) and females with 2 vehicles (32, making up 113.6%).
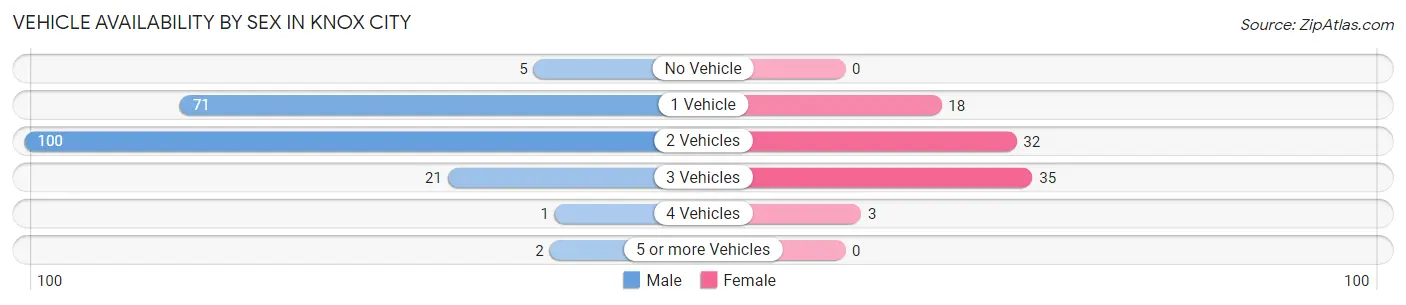
| Vehicles Available | Male | Female |
| No Vehicle | 5 (2.5%) | 0 (0.0%) |
| 1 Vehicle | 71 (35.5%) | 18 (20.4%) |
| 2 Vehicles | 100 (50.0%) | 32 (36.4%) |
| 3 Vehicles | 21 (10.5%) | 35 (39.8%) |
| 4 Vehicles | 1 (0.5%) | 3 (3.4%) |
| 5 or more Vehicles | 2 (1.0%) | 0 (0.0%) |
| Total | 200 (100.0%) | 88 (100.0%) |
Commute Time in Knox City
The most frequently occuring commute durations in Knox City are less than 5 minutes (120 commuters, 48.0%), 5 to 9 minutes (39 commuters, 15.6%), and 10 to 14 minutes (34 commuters, 13.6%).
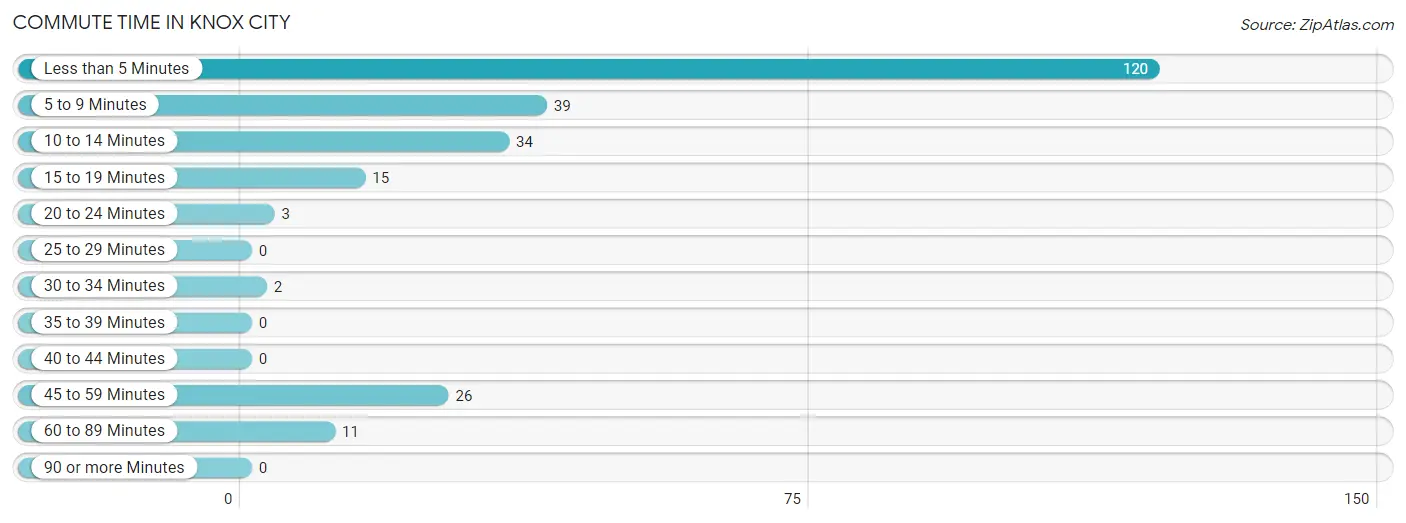
| Commute Time | # Commuters | % Commuters |
| Less than 5 Minutes | 120 | 48.0% |
| 5 to 9 Minutes | 39 | 15.6% |
| 10 to 14 Minutes | 34 | 13.6% |
| 15 to 19 Minutes | 15 | 6.0% |
| 20 to 24 Minutes | 3 | 1.2% |
| 25 to 29 Minutes | 0 | 0.0% |
| 30 to 34 Minutes | 2 | 0.8% |
| 35 to 39 Minutes | 0 | 0.0% |
| 40 to 44 Minutes | 0 | 0.0% |
| 45 to 59 Minutes | 26 | 10.4% |
| 60 to 89 Minutes | 11 | 4.4% |
| 90 or more Minutes | 0 | 0.0% |
Commute Time by Sex in Knox City
The most common commute times in Knox City are less than 5 minutes (76 commuters, 44.2%) for males and less than 5 minutes (44 commuters, 56.4%) for females.
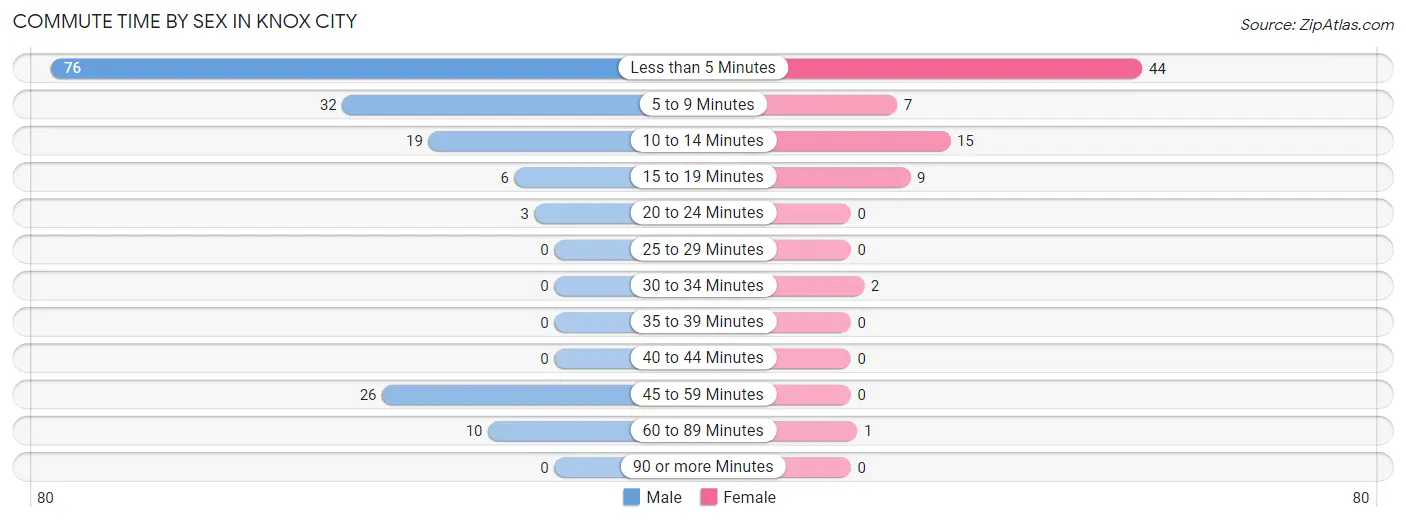
| Commute Time | Male | Female |
| Less than 5 Minutes | 76 (44.2%) | 44 (56.4%) |
| 5 to 9 Minutes | 32 (18.6%) | 7 (9.0%) |
| 10 to 14 Minutes | 19 (11.1%) | 15 (19.2%) |
| 15 to 19 Minutes | 6 (3.5%) | 9 (11.5%) |
| 20 to 24 Minutes | 3 (1.7%) | 0 (0.0%) |
| 25 to 29 Minutes | 0 (0.0%) | 0 (0.0%) |
| 30 to 34 Minutes | 0 (0.0%) | 2 (2.6%) |
| 35 to 39 Minutes | 0 (0.0%) | 0 (0.0%) |
| 40 to 44 Minutes | 0 (0.0%) | 0 (0.0%) |
| 45 to 59 Minutes | 26 (15.1%) | 0 (0.0%) |
| 60 to 89 Minutes | 10 (5.8%) | 1 (1.3%) |
| 90 or more Minutes | 0 (0.0%) | 0 (0.0%) |
Time of Departure to Work by Sex in Knox City
The most frequent times of departure to work in Knox City are 5:30 AM to 5:59 AM (66, 38.4%) for males and 7:30 AM to 7:59 AM (24, 30.8%) for females.
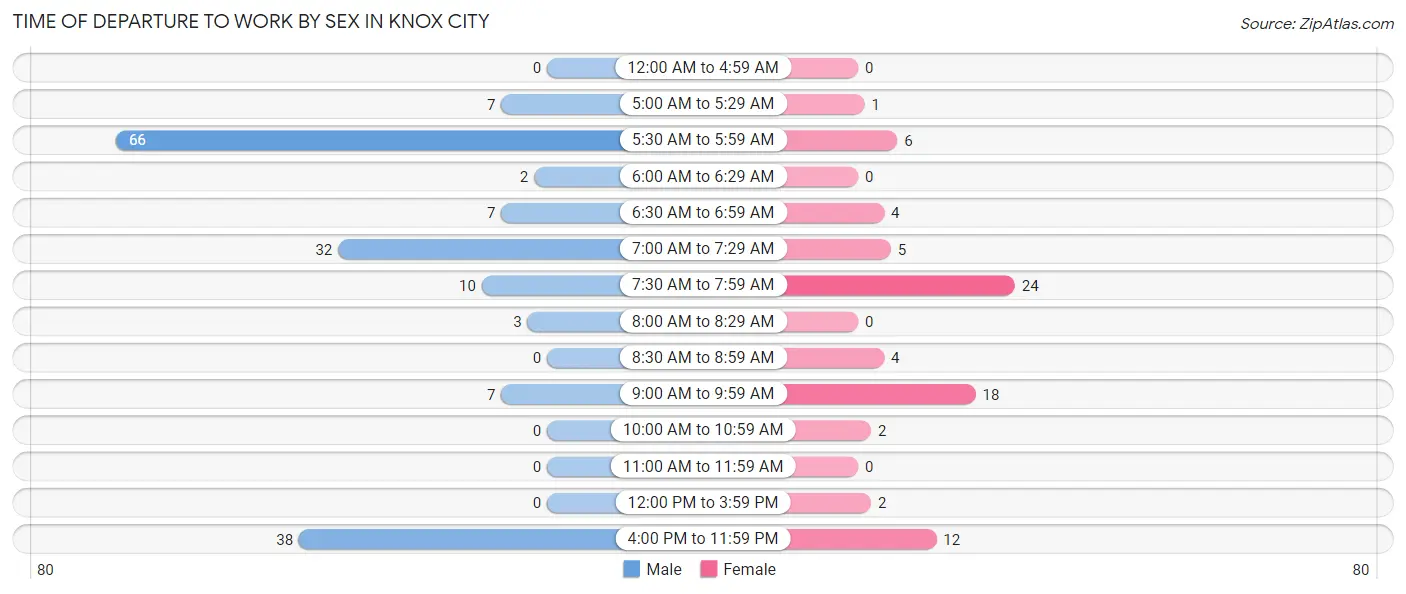
| Time of Departure | Male | Female |
| 12:00 AM to 4:59 AM | 0 (0.0%) | 0 (0.0%) |
| 5:00 AM to 5:29 AM | 7 (4.1%) | 1 (1.3%) |
| 5:30 AM to 5:59 AM | 66 (38.4%) | 6 (7.7%) |
| 6:00 AM to 6:29 AM | 2 (1.2%) | 0 (0.0%) |
| 6:30 AM to 6:59 AM | 7 (4.1%) | 4 (5.1%) |
| 7:00 AM to 7:29 AM | 32 (18.6%) | 5 (6.4%) |
| 7:30 AM to 7:59 AM | 10 (5.8%) | 24 (30.8%) |
| 8:00 AM to 8:29 AM | 3 (1.7%) | 0 (0.0%) |
| 8:30 AM to 8:59 AM | 0 (0.0%) | 4 (5.1%) |
| 9:00 AM to 9:59 AM | 7 (4.1%) | 18 (23.1%) |
| 10:00 AM to 10:59 AM | 0 (0.0%) | 2 (2.6%) |
| 11:00 AM to 11:59 AM | 0 (0.0%) | 0 (0.0%) |
| 12:00 PM to 3:59 PM | 0 (0.0%) | 2 (2.6%) |
| 4:00 PM to 11:59 PM | 38 (22.1%) | 12 (15.4%) |
| Total | 172 (100.0%) | 78 (100.0%) |
Housing Occupancy in Knox City
Occupancy by Ownership in Knox City
Of the total 320 dwellings in Knox City, owner-occupied units account for 255 (79.7%), while renter-occupied units make up 65 (20.3%).
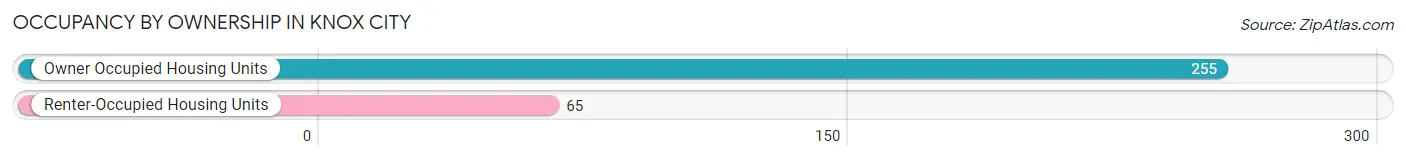
| Occupancy | # Housing Units | % Housing Units |
| Owner Occupied Housing Units | 255 | 79.7% |
| Renter-Occupied Housing Units | 65 | 20.3% |
| Total Occupied Housing Units | 320 | 100.0% |
Occupancy by Household Size in Knox City
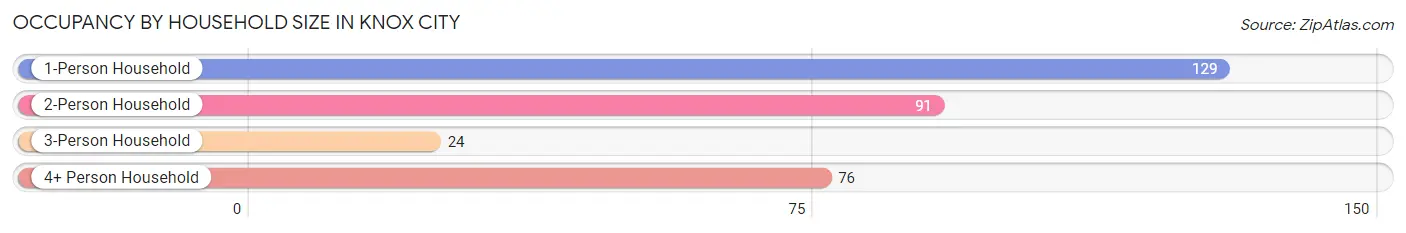
| Household Size | # Housing Units | % Housing Units |
| 1-Person Household | 129 | 40.3% |
| 2-Person Household | 91 | 28.4% |
| 3-Person Household | 24 | 7.5% |
| 4+ Person Household | 76 | 23.7% |
| Total Housing Units | 320 | 100.0% |
Occupancy by Ownership by Household Size in Knox City
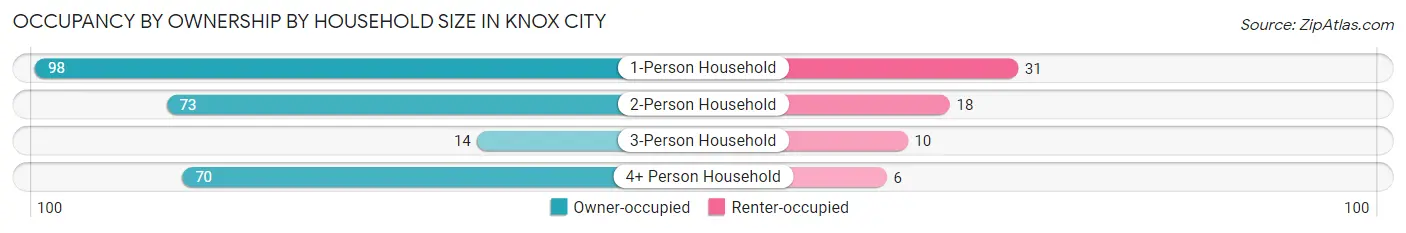
| Household Size | Owner-occupied | Renter-occupied |
| 1-Person Household | 98 (76.0%) | 31 (24.0%) |
| 2-Person Household | 73 (80.2%) | 18 (19.8%) |
| 3-Person Household | 14 (58.3%) | 10 (41.7%) |
| 4+ Person Household | 70 (92.1%) | 6 (7.9%) |
| Total Housing Units | 255 (79.7%) | 65 (20.3%) |
Occupancy by Educational Attainment in Knox City
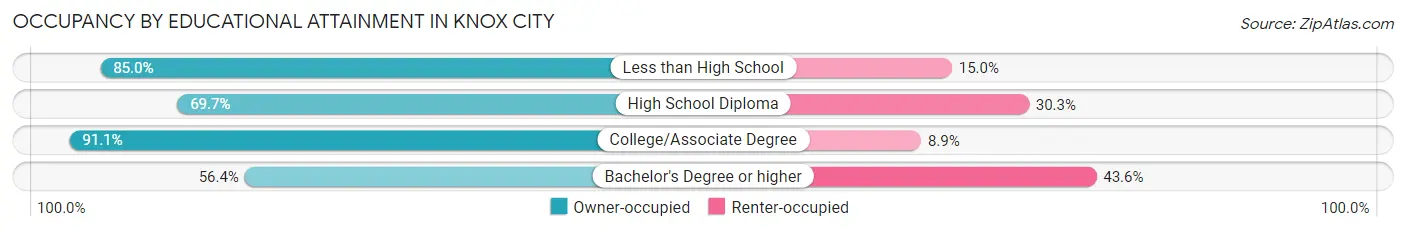
| Household Size | Owner-occupied | Renter-occupied |
| Less than High School | 17 (85.0%) | 3 (15.0%) |
| High School Diploma | 53 (69.7%) | 23 (30.3%) |
| College/Associate Degree | 154 (91.1%) | 15 (8.9%) |
| Bachelor's Degree or higher | 31 (56.4%) | 24 (43.6%) |
Occupancy by Age of Householder in Knox City
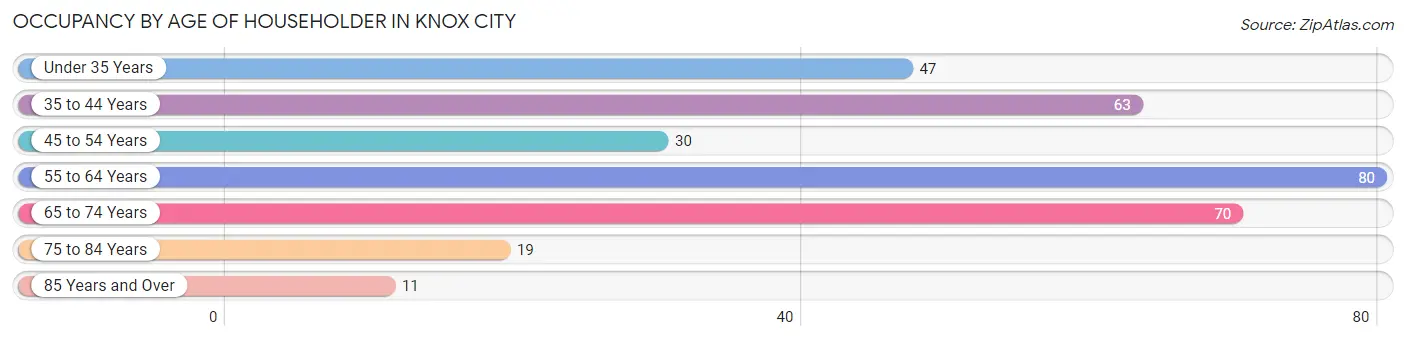
| Age Bracket | # Households | % Households |
| Under 35 Years | 47 | 14.7% |
| 35 to 44 Years | 63 | 19.7% |
| 45 to 54 Years | 30 | 9.4% |
| 55 to 64 Years | 80 | 25.0% |
| 65 to 74 Years | 70 | 21.9% |
| 75 to 84 Years | 19 | 5.9% |
| 85 Years and Over | 11 | 3.4% |
| Total | 320 | 100.0% |
Housing Finances in Knox City
Median Income by Occupancy in Knox City
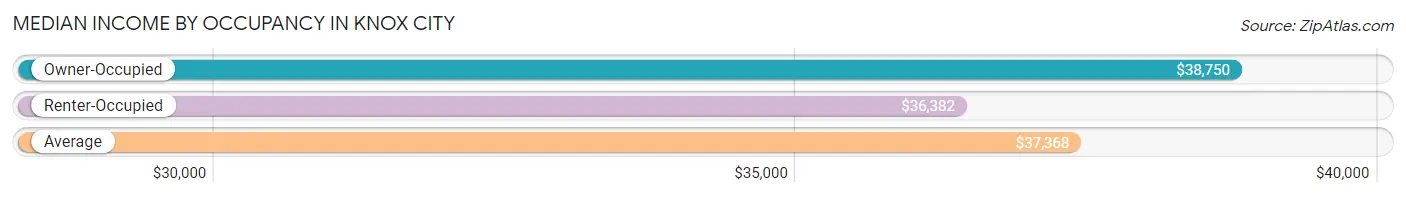
| Occupancy Type | # Households | Median Income |
| Owner-Occupied | 255 (79.7%) | $38,750 |
| Renter-Occupied | 65 (20.3%) | $36,382 |
| Average | 320 (100.0%) | $37,368 |
Occupancy by Householder Income Bracket in Knox City
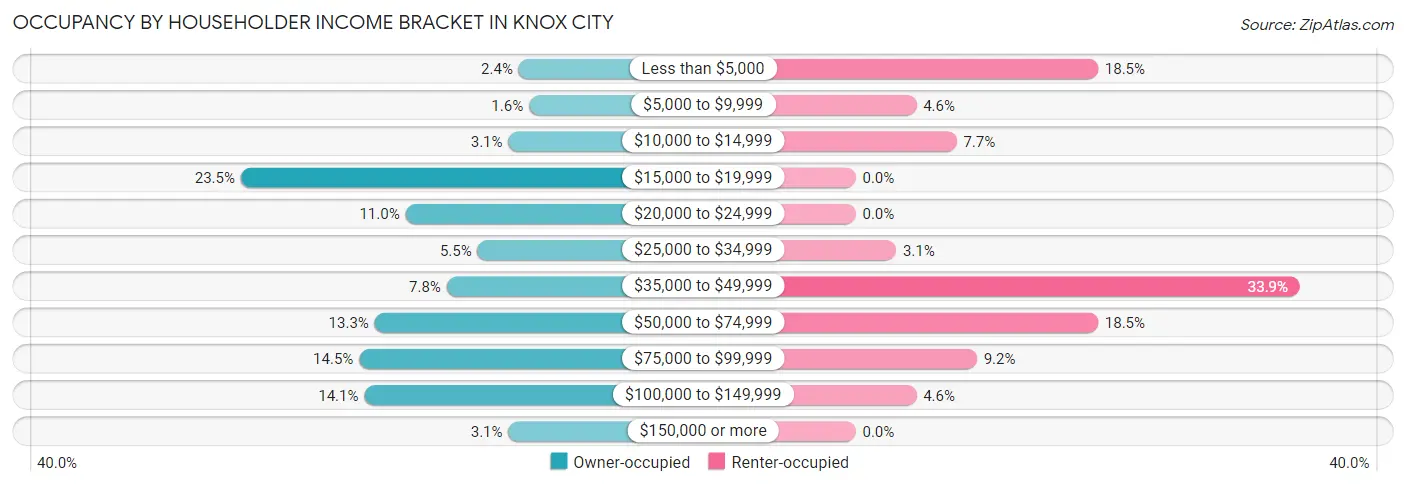
| Income Bracket | Owner-occupied | Renter-occupied |
| Less than $5,000 | 6 (2.4%) | 12 (18.5%) |
| $5,000 to $9,999 | 4 (1.6%) | 3 (4.6%) |
| $10,000 to $14,999 | 8 (3.1%) | 5 (7.7%) |
| $15,000 to $19,999 | 60 (23.5%) | 0 (0.0%) |
| $20,000 to $24,999 | 28 (11.0%) | 0 (0.0%) |
| $25,000 to $34,999 | 14 (5.5%) | 2 (3.1%) |
| $35,000 to $49,999 | 20 (7.8%) | 22 (33.9%) |
| $50,000 to $74,999 | 34 (13.3%) | 12 (18.5%) |
| $75,000 to $99,999 | 37 (14.5%) | 6 (9.2%) |
| $100,000 to $149,999 | 36 (14.1%) | 3 (4.6%) |
| $150,000 or more | 8 (3.1%) | 0 (0.0%) |
| Total | 255 (100.0%) | 65 (100.0%) |
Monthly Housing Cost Tiers in Knox City
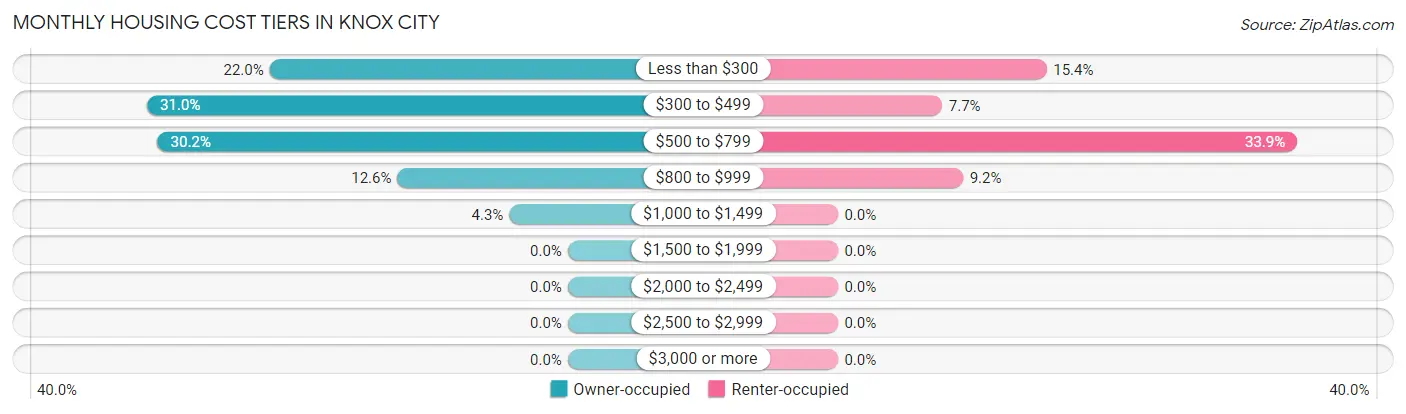
| Monthly Cost | Owner-occupied | Renter-occupied |
| Less than $300 | 56 (22.0%) | 10 (15.4%) |
| $300 to $499 | 79 (31.0%) | 5 (7.7%) |
| $500 to $799 | 77 (30.2%) | 22 (33.9%) |
| $800 to $999 | 32 (12.6%) | 6 (9.2%) |
| $1,000 to $1,499 | 11 (4.3%) | 0 (0.0%) |
| $1,500 to $1,999 | 0 (0.0%) | 0 (0.0%) |
| $2,000 to $2,499 | 0 (0.0%) | 0 (0.0%) |
| $2,500 to $2,999 | 0 (0.0%) | 0 (0.0%) |
| $3,000 or more | 0 (0.0%) | 0 (0.0%) |
| Total | 255 (100.0%) | 65 (100.0%) |
Physical Housing Characteristics in Knox City
Housing Structures in Knox City
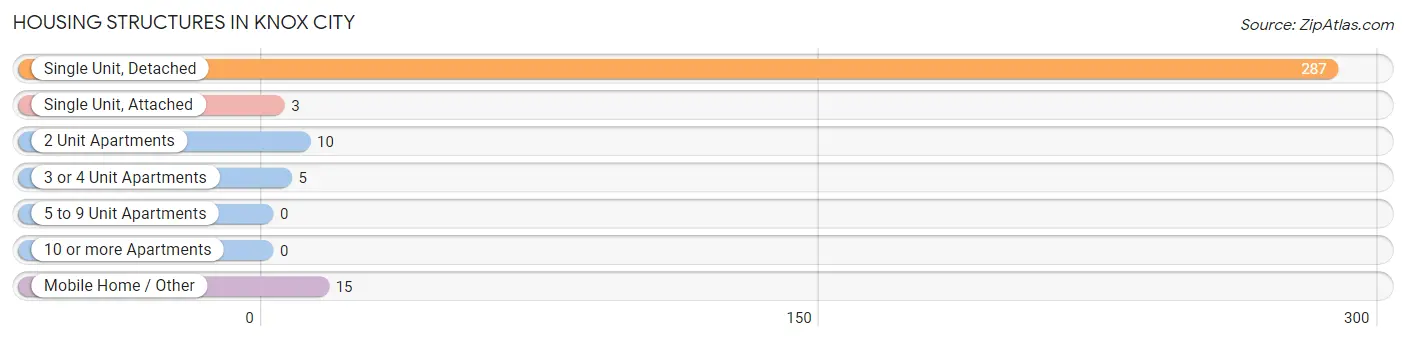
| Structure Type | # Housing Units | % Housing Units |
| Single Unit, Detached | 287 | 89.7% |
| Single Unit, Attached | 3 | 0.9% |
| 2 Unit Apartments | 10 | 3.1% |
| 3 or 4 Unit Apartments | 5 | 1.6% |
| 5 to 9 Unit Apartments | 0 | 0.0% |
| 10 or more Apartments | 0 | 0.0% |
| Mobile Home / Other | 15 | 4.7% |
| Total | 320 | 100.0% |
Housing Structures by Occupancy in Knox City
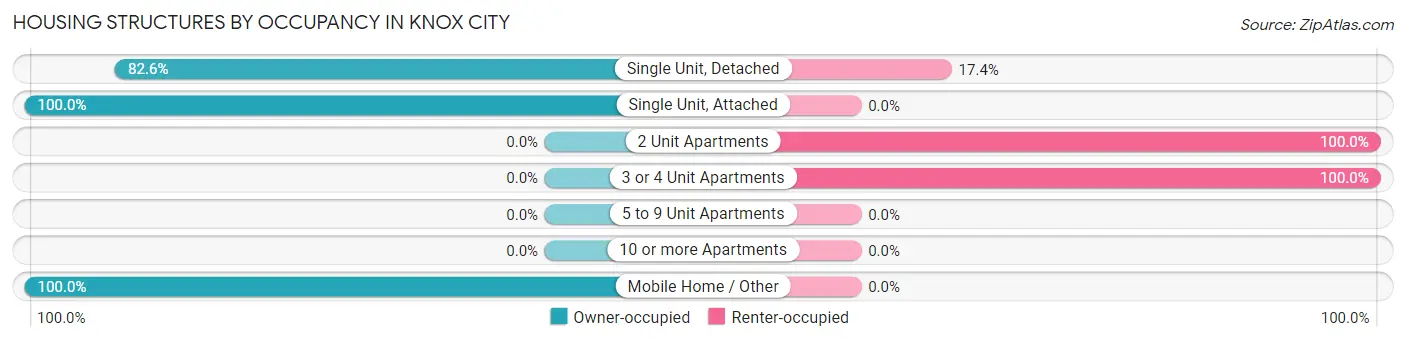
| Structure Type | Owner-occupied | Renter-occupied |
| Single Unit, Detached | 237 (82.6%) | 50 (17.4%) |
| Single Unit, Attached | 3 (100.0%) | 0 (0.0%) |
| 2 Unit Apartments | 0 (0.0%) | 10 (100.0%) |
| 3 or 4 Unit Apartments | 0 (0.0%) | 5 (100.0%) |
| 5 to 9 Unit Apartments | 0 (0.0%) | 0 (0.0%) |
| 10 or more Apartments | 0 (0.0%) | 0 (0.0%) |
| Mobile Home / Other | 15 (100.0%) | 0 (0.0%) |
| Total | 255 (79.7%) | 65 (20.3%) |
Housing Structures by Number of Rooms in Knox City
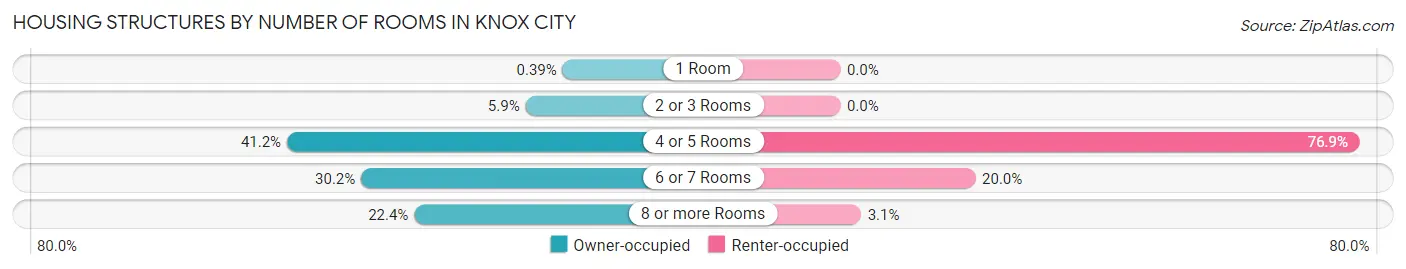
| Number of Rooms | Owner-occupied | Renter-occupied |
| 1 Room | 1 (0.4%) | 0 (0.0%) |
| 2 or 3 Rooms | 15 (5.9%) | 0 (0.0%) |
| 4 or 5 Rooms | 105 (41.2%) | 50 (76.9%) |
| 6 or 7 Rooms | 77 (30.2%) | 13 (20.0%) |
| 8 or more Rooms | 57 (22.4%) | 2 (3.1%) |
| Total | 255 (100.0%) | 65 (100.0%) |
Housing Structure by Heating Type in Knox City
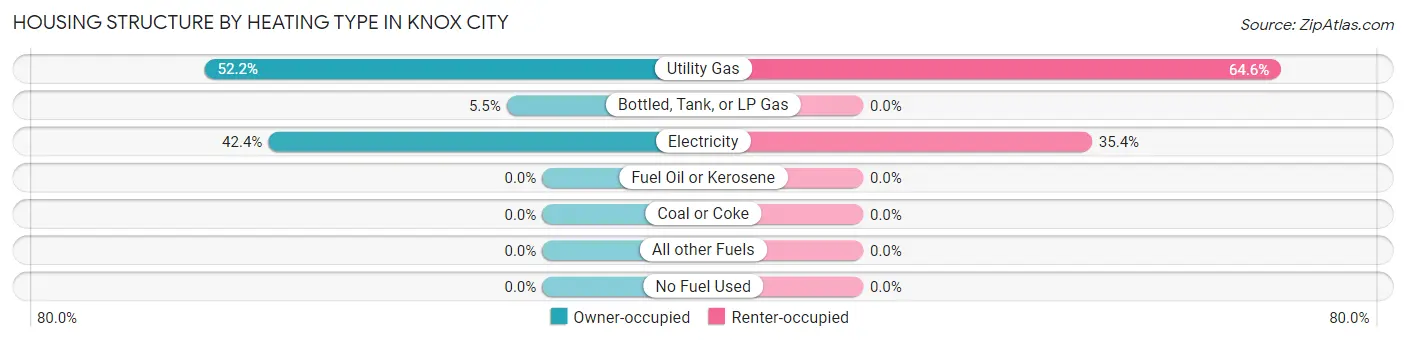
| Heating Type | Owner-occupied | Renter-occupied |
| Utility Gas | 133 (52.2%) | 42 (64.6%) |
| Bottled, Tank, or LP Gas | 14 (5.5%) | 0 (0.0%) |
| Electricity | 108 (42.3%) | 23 (35.4%) |
| Fuel Oil or Kerosene | 0 (0.0%) | 0 (0.0%) |
| Coal or Coke | 0 (0.0%) | 0 (0.0%) |
| All other Fuels | 0 (0.0%) | 0 (0.0%) |
| No Fuel Used | 0 (0.0%) | 0 (0.0%) |
| Total | 255 (100.0%) | 65 (100.0%) |
Household Vehicle Usage in Knox City
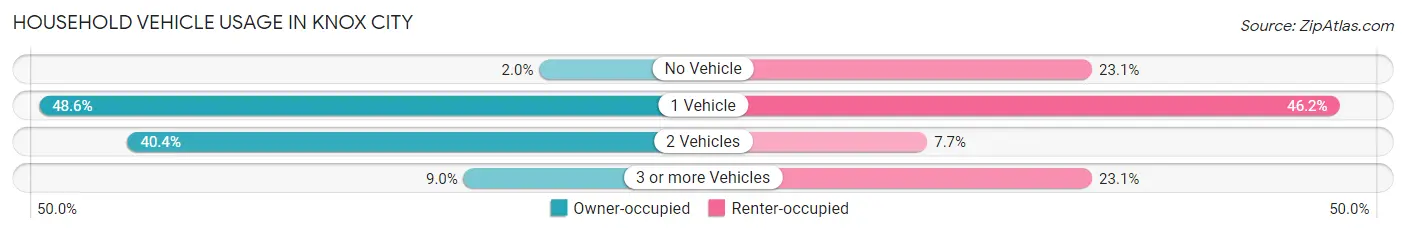
| Vehicles per Household | Owner-occupied | Renter-occupied |
| No Vehicle | 5 (2.0%) | 15 (23.1%) |
| 1 Vehicle | 124 (48.6%) | 30 (46.2%) |
| 2 Vehicles | 103 (40.4%) | 5 (7.7%) |
| 3 or more Vehicles | 23 (9.0%) | 15 (23.1%) |
| Total | 255 (100.0%) | 65 (100.0%) |
Real Estate & Mortgages in Knox City
Real Estate and Mortgage Overview in Knox City
| Characteristic | Without Mortgage | With Mortgage |
| Housing Units | 200 | 55 |
| Median Property Value | $45,200 | $62,100 |
| Median Household Income | $38,333 | $0 |
| Monthly Housing Costs | $382 | $0 |
| Real Estate Taxes | $744 | $20 |
Property Value by Mortgage Status in Knox City
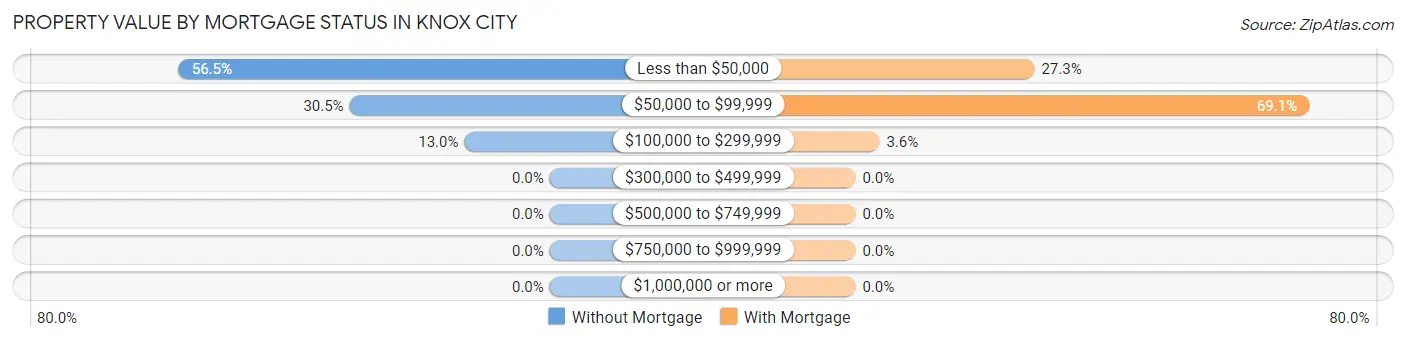
| Property Value | Without Mortgage | With Mortgage |
| Less than $50,000 | 113 (56.5%) | 15 (27.3%) |
| $50,000 to $99,999 | 61 (30.5%) | 38 (69.1%) |
| $100,000 to $299,999 | 26 (13.0%) | 2 (3.6%) |
| $300,000 to $499,999 | 0 (0.0%) | 0 (0.0%) |
| $500,000 to $749,999 | 0 (0.0%) | 0 (0.0%) |
| $750,000 to $999,999 | 0 (0.0%) | 0 (0.0%) |
| $1,000,000 or more | 0 (0.0%) | 0 (0.0%) |
| Total | 200 (100.0%) | 55 (100.0%) |
Household Income by Mortgage Status in Knox City
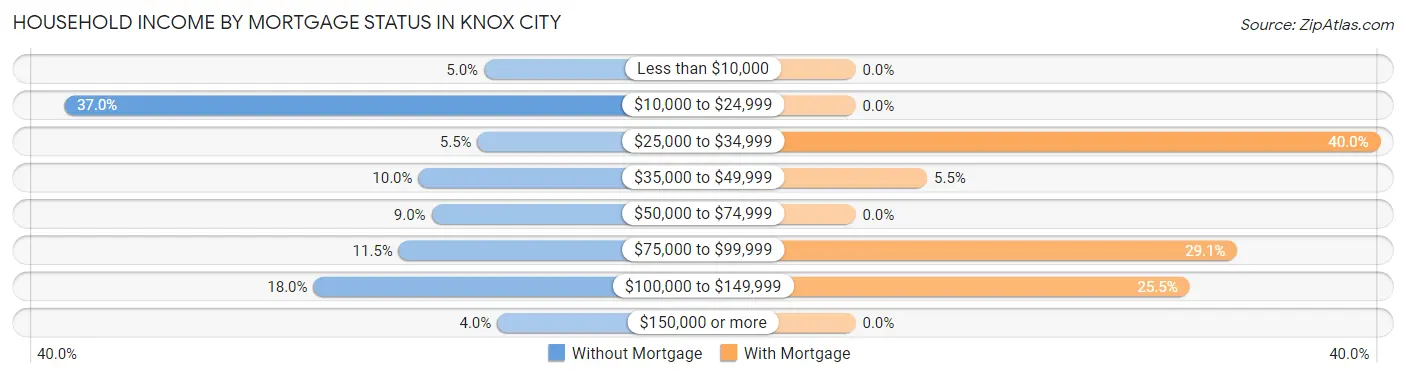
| Household Income | Without Mortgage | With Mortgage |
| Less than $10,000 | 10 (5.0%) | 0 (0.0%) |
| $10,000 to $24,999 | 74 (37.0%) | 0 (0.0%) |
| $25,000 to $34,999 | 11 (5.5%) | 22 (40.0%) |
| $35,000 to $49,999 | 20 (10.0%) | 3 (5.4%) |
| $50,000 to $74,999 | 18 (9.0%) | 0 (0.0%) |
| $75,000 to $99,999 | 23 (11.5%) | 16 (29.1%) |
| $100,000 to $149,999 | 36 (18.0%) | 14 (25.5%) |
| $150,000 or more | 8 (4.0%) | 0 (0.0%) |
| Total | 200 (100.0%) | 55 (100.0%) |
Property Value to Household Income Ratio in Knox City
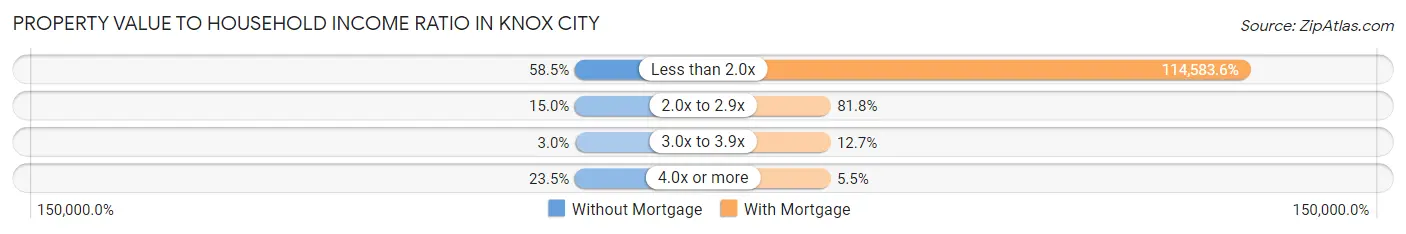
| Value-to-Income Ratio | Without Mortgage | With Mortgage |
| Less than 2.0x | 117 (58.5%) | 63,021 (114,583.6%) |
| 2.0x to 2.9x | 30 (15.0%) | 45 (81.8%) |
| 3.0x to 3.9x | 6 (3.0%) | 7 (12.7%) |
| 4.0x or more | 47 (23.5%) | 3 (5.4%) |
| Total | 200 (100.0%) | 55 (100.0%) |
Real Estate Taxes by Mortgage Status in Knox City
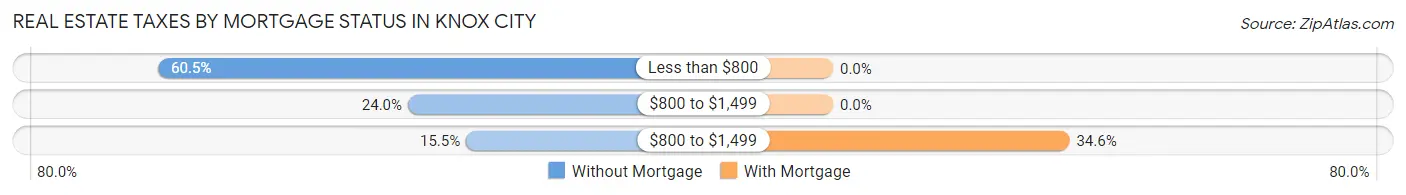
| Property Taxes | Without Mortgage | With Mortgage |
| Less than $800 | 121 (60.5%) | 0 (0.0%) |
| $800 to $1,499 | 48 (24.0%) | 0 (0.0%) |
| $800 to $1,499 | 31 (15.5%) | 19 (34.5%) |
| Total | 200 (100.0%) | 55 (100.0%) |
Health & Disability in Knox City
Health Insurance Coverage by Age in Knox City
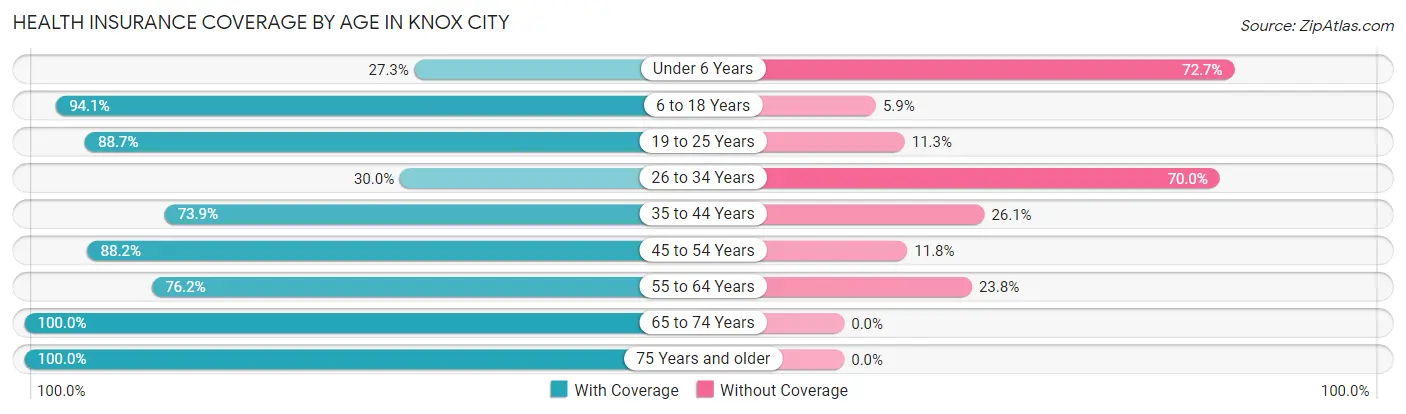
| Age Bracket | With Coverage | Without Coverage |
| Under 6 Years | 9 (27.3%) | 24 (72.7%) |
| 6 to 18 Years | 223 (94.1%) | 14 (5.9%) |
| 19 to 25 Years | 55 (88.7%) | 7 (11.3%) |
| 26 to 34 Years | 27 (30.0%) | 63 (70.0%) |
| 35 to 44 Years | 65 (73.9%) | 23 (26.1%) |
| 45 to 54 Years | 75 (88.2%) | 10 (11.8%) |
| 55 to 64 Years | 96 (76.2%) | 30 (23.8%) |
| 65 to 74 Years | 83 (100.0%) | 0 (0.0%) |
| 75 Years and older | 37 (100.0%) | 0 (0.0%) |
| Total | 670 (79.7%) | 171 (20.3%) |
Health Insurance Coverage by Citizenship Status in Knox City
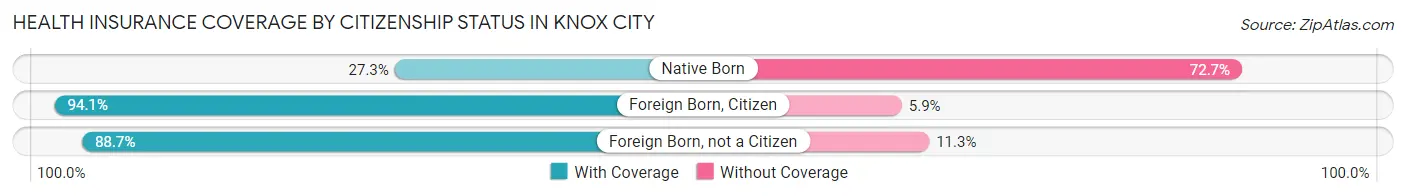
| Citizenship Status | With Coverage | Without Coverage |
| Native Born | 9 (27.3%) | 24 (72.7%) |
| Foreign Born, Citizen | 223 (94.1%) | 14 (5.9%) |
| Foreign Born, not a Citizen | 55 (88.7%) | 7 (11.3%) |
Health Insurance Coverage by Household Income in Knox City
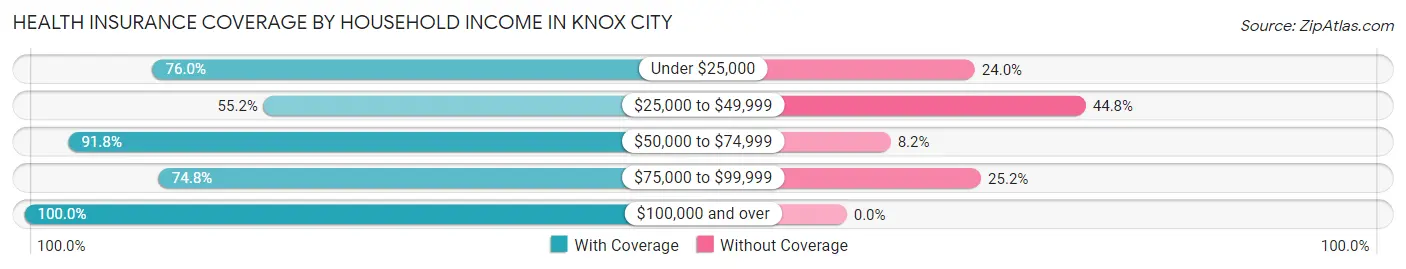
| Household Income | With Coverage | Without Coverage |
| Under $25,000 | 133 (76.0%) | 42 (24.0%) |
| $25,000 to $49,999 | 90 (55.2%) | 73 (44.8%) |
| $50,000 to $74,999 | 212 (91.8%) | 19 (8.2%) |
| $75,000 to $99,999 | 110 (74.8%) | 37 (25.2%) |
| $100,000 and over | 125 (100.0%) | 0 (0.0%) |
Public vs Private Health Insurance Coverage by Age in Knox City
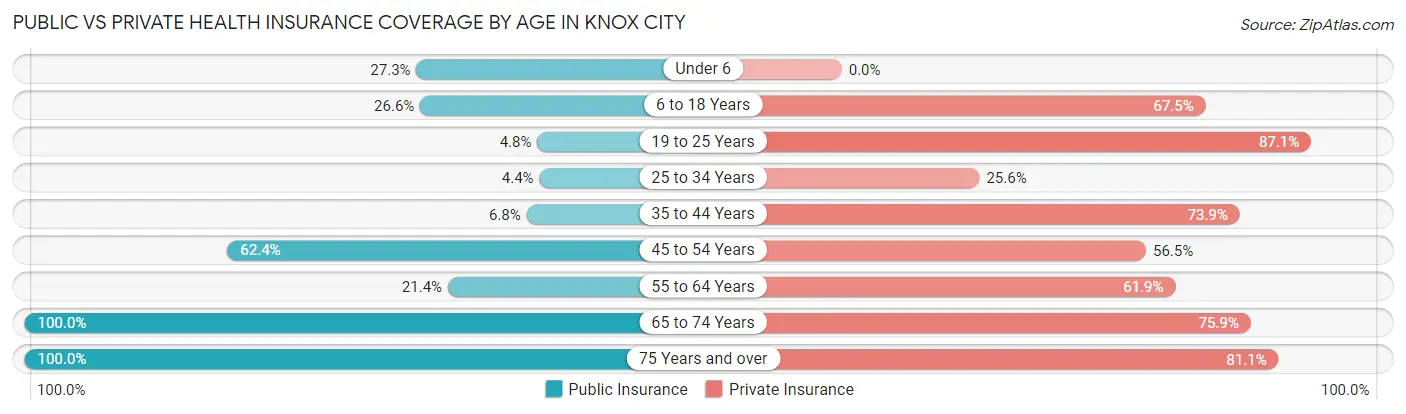
| Age Bracket | Public Insurance | Private Insurance |
| Under 6 | 9 (27.3%) | 0 (0.0%) |
| 6 to 18 Years | 63 (26.6%) | 160 (67.5%) |
| 19 to 25 Years | 3 (4.8%) | 54 (87.1%) |
| 25 to 34 Years | 4 (4.4%) | 23 (25.6%) |
| 35 to 44 Years | 6 (6.8%) | 65 (73.9%) |
| 45 to 54 Years | 53 (62.4%) | 48 (56.5%) |
| 55 to 64 Years | 27 (21.4%) | 78 (61.9%) |
| 65 to 74 Years | 83 (100.0%) | 63 (75.9%) |
| 75 Years and over | 37 (100.0%) | 30 (81.1%) |
| Total | 285 (33.9%) | 521 (62.0%) |
Disability Status by Sex by Age in Knox City
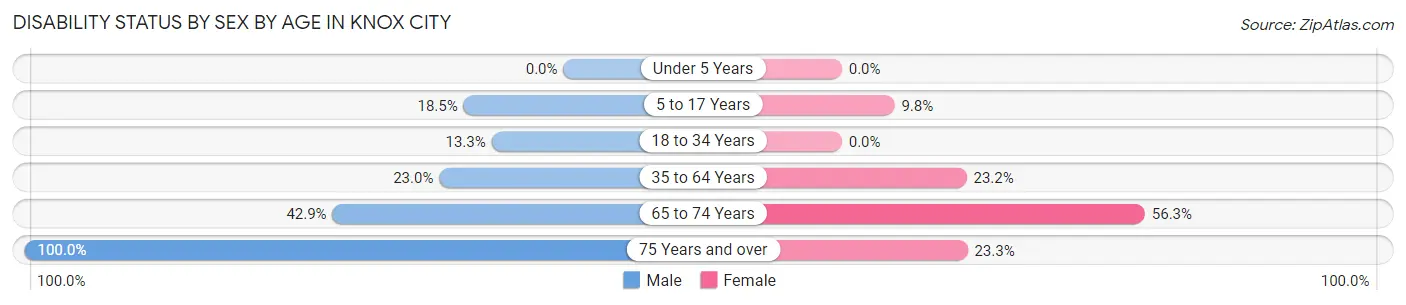
| Age Bracket | Male | Female |
| Under 5 Years | 0 (0.0%) | 0 (0.0%) |
| 5 to 17 Years | 20 (18.5%) | 9 (9.8%) |
| 18 to 34 Years | 14 (13.3%) | 0 (0.0%) |
| 35 to 64 Years | 44 (23.0%) | 25 (23.2%) |
| 65 to 74 Years | 15 (42.9%) | 27 (56.2%) |
| 75 Years and over | 7 (100.0%) | 7 (23.3%) |
Disability Class by Sex by Age in Knox City
Disability Class: Hearing Difficulty
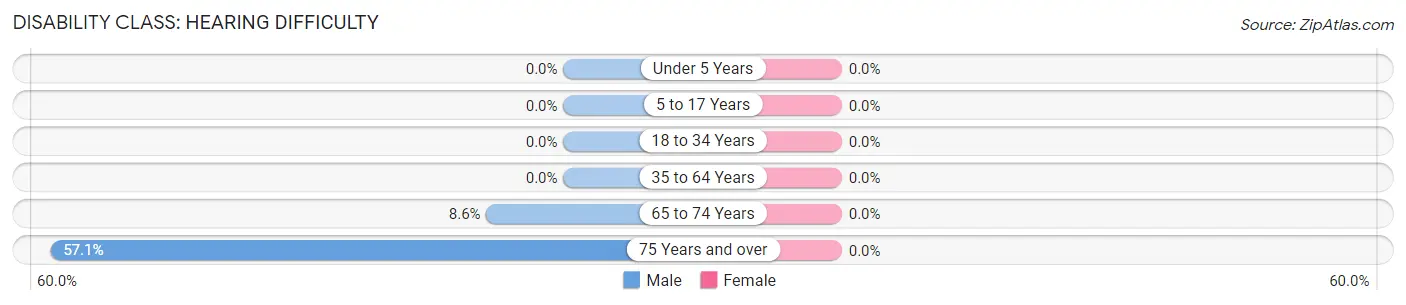
| Age Bracket | Male | Female |
| Under 5 Years | 0 (0.0%) | 0 (0.0%) |
| 5 to 17 Years | 0 (0.0%) | 0 (0.0%) |
| 18 to 34 Years | 0 (0.0%) | 0 (0.0%) |
| 35 to 64 Years | 0 (0.0%) | 0 (0.0%) |
| 65 to 74 Years | 3 (8.6%) | 0 (0.0%) |
| 75 Years and over | 4 (57.1%) | 0 (0.0%) |
Disability Class: Vision Difficulty
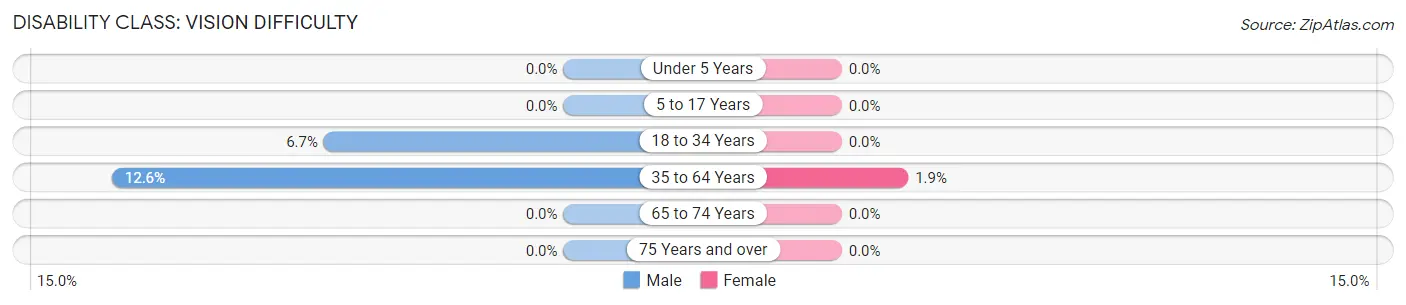
| Age Bracket | Male | Female |
| Under 5 Years | 0 (0.0%) | 0 (0.0%) |
| 5 to 17 Years | 0 (0.0%) | 0 (0.0%) |
| 18 to 34 Years | 7 (6.7%) | 0 (0.0%) |
| 35 to 64 Years | 24 (12.6%) | 2 (1.8%) |
| 65 to 74 Years | 0 (0.0%) | 0 (0.0%) |
| 75 Years and over | 0 (0.0%) | 0 (0.0%) |
Disability Class: Cognitive Difficulty
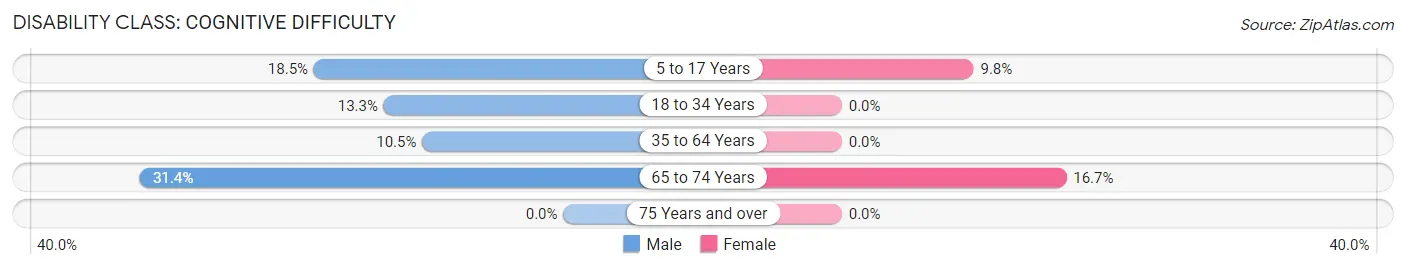
| Age Bracket | Male | Female |
| 5 to 17 Years | 20 (18.5%) | 9 (9.8%) |
| 18 to 34 Years | 14 (13.3%) | 0 (0.0%) |
| 35 to 64 Years | 20 (10.5%) | 0 (0.0%) |
| 65 to 74 Years | 11 (31.4%) | 8 (16.7%) |
| 75 Years and over | 0 (0.0%) | 0 (0.0%) |
Disability Class: Ambulatory Difficulty
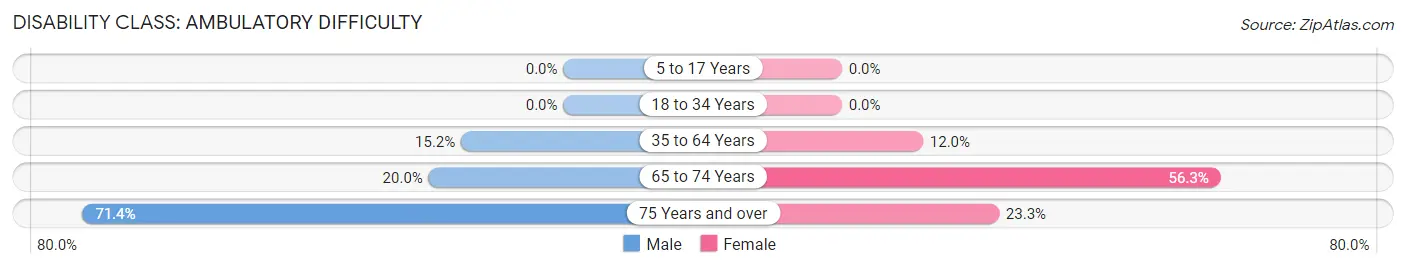
| Age Bracket | Male | Female |
| 5 to 17 Years | 0 (0.0%) | 0 (0.0%) |
| 18 to 34 Years | 0 (0.0%) | 0 (0.0%) |
| 35 to 64 Years | 29 (15.2%) | 13 (12.0%) |
| 65 to 74 Years | 7 (20.0%) | 27 (56.2%) |
| 75 Years and over | 5 (71.4%) | 7 (23.3%) |
Disability Class: Self-Care Difficulty
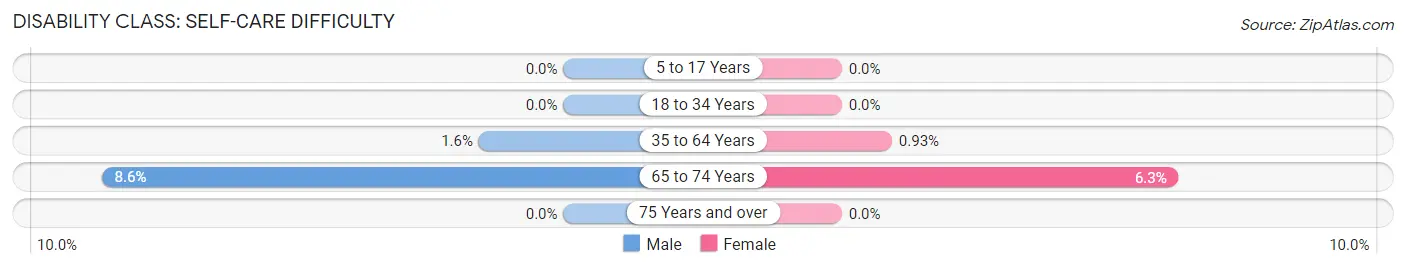
| Age Bracket | Male | Female |
| 5 to 17 Years | 0 (0.0%) | 0 (0.0%) |
| 18 to 34 Years | 0 (0.0%) | 0 (0.0%) |
| 35 to 64 Years | 3 (1.6%) | 1 (0.9%) |
| 65 to 74 Years | 3 (8.6%) | 3 (6.2%) |
| 75 Years and over | 0 (0.0%) | 0 (0.0%) |
Technology Access in Knox City
Computing Device Access in Knox City
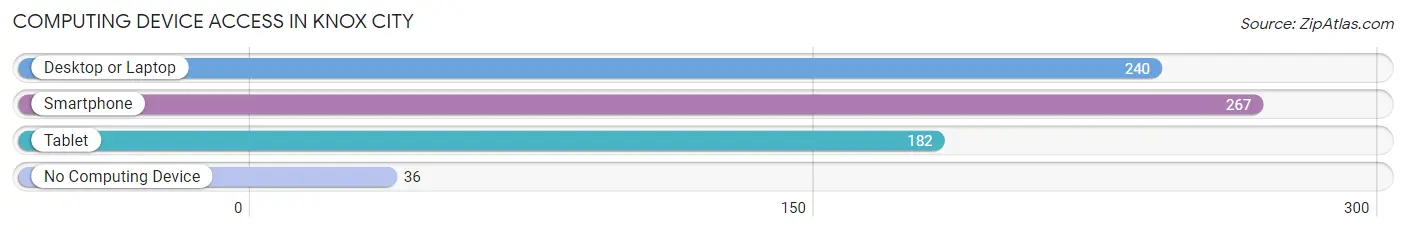
| Device Type | # Households | % Households |
| Desktop or Laptop | 240 | 75.0% |
| Smartphone | 267 | 83.4% |
| Tablet | 182 | 56.9% |
| No Computing Device | 36 | 11.3% |
| Total | 320 | 100.0% |
Internet Access in Knox City
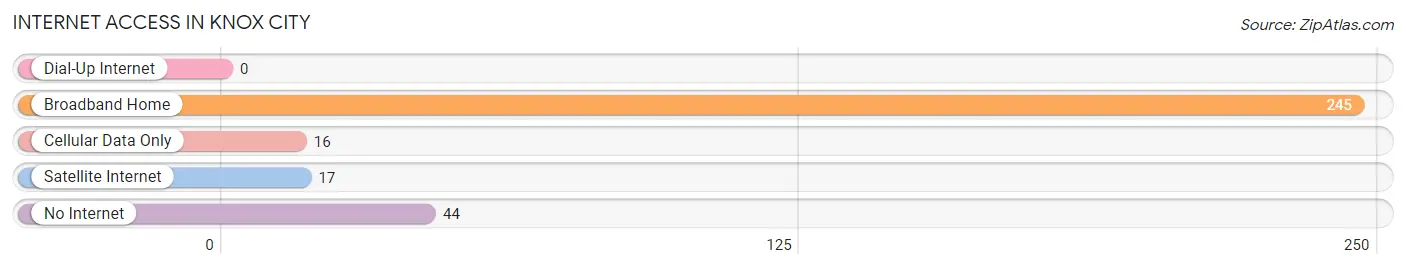
| Internet Type | # Households | % Households |
| Dial-Up Internet | 0 | 0.0% |
| Broadband Home | 245 | 76.6% |
| Cellular Data Only | 16 | 5.0% |
| Satellite Internet | 17 | 5.3% |
| No Internet | 44 | 13.8% |
| Total | 320 | 100.0% |
Knox City Summary
Knox City is a small town located in Knox County, Texas, United States. It is situated in the rolling hills of the Texas Panhandle, approximately 100 miles northwest of Abilene. The town was founded in 1891 and named after General Henry Knox, a Revolutionary War hero. The population of Knox City was 1,093 at the 2010 census.
History
Knox City was founded in 1891 by a group of settlers from the nearby town of Benjamin. The town was named after General Henry Knox, a Revolutionary War hero. The settlers chose the site because of its proximity to the Santa Fe Railroad, which had recently been built through the area.
The town quickly grew and by 1900, it had a population of over 500. The town was incorporated in 1909 and by 1910, the population had grown to 1,000.
In the early 1900s, Knox City was a thriving agricultural center. The town was home to several cotton gins, a flour mill, and a cottonseed oil mill. The town also had several stores, a bank, a hotel, and a newspaper.
In the 1920s, the town began to decline as the railroad moved its operations to other towns. The Great Depression further weakened the town's economy and by 1940, the population had dropped to just over 500.
The town began to recover in the 1950s and by 1960, the population had grown to 1,000. The town continued to grow and by 2000, the population had reached 1,093.
Geography
Knox City is located in the rolling hills of the Texas Panhandle, approximately 100 miles northwest of Abilene. The town is situated at the intersection of U.S. Highway 82 and State Highway 6.
The climate in Knox City is semi-arid, with hot summers and mild winters. The average annual temperature is 64°F (18°C). The average annual precipitation is 22 inches (56 cm).
Economy
The economy of Knox City is largely based on agriculture. The town is home to several cotton gins, a flour mill, and a cottonseed oil mill. The town also has several stores, a bank, a hotel, and a newspaper.
The town is also home to several manufacturing companies, including a furniture factory, a plastics factory, and a metal fabrication plant.
Demographics
As of the 2010 census, the population of Knox City was 1,093. The racial makeup of the town was 94.3% White, 0.7% African American, 0.3% Native American, 0.2% Asian, 0.1% Pacific Islander, 2.7% from other races, and 1.9% from two or more races. Hispanic or Latino of any race were 5.2% of the population.
The median income for a household in the town was $30,000, and the median income for a family was $35,000. The per capita income for the town was $15,000. About 16.7% of families and 19.2% of the population were below the poverty line, including 25.2% of those under age 18 and 10.3% of those age 65 or over.
Common Questions
What is Per Capita Income in Knox City?
Per Capita income in Knox City is $20,217.
What is the Median Family Income in Knox City?
Median Family Income in Knox City is $64,188.
What is the Median Household income in Knox City?
Median Household Income in Knox City is $37,368.
What is Income or Wage Gap in Knox City?
Income or Wage Gap in Knox City is 58.1%.
Women in Knox City earn 41.9 cents for every dollar earned by a man.
What is Inequality or Gini Index in Knox City?
Inequality or Gini Index in Knox City is 0.43.
What is the Total Population of Knox City?
Total Population of Knox City is 898.
What is the Total Male Population of Knox City?
Total Male Population of Knox City is 490.
What is the Total Female Population of Knox City?
Total Female Population of Knox City is 408.
What is the Ratio of Males per 100 Females in Knox City?
There are 120.10 Males per 100 Females in Knox City.
What is the Ratio of Females per 100 Males in Knox City?
There are 83.27 Females per 100 Males in Knox City.
What is the Median Population Age in Knox City?
Median Population Age in Knox City is 37.6 Years.
What is the Average Family Size in Knox City
Average Family Size in Knox City is 3.8 People.
What is the Average Household Size in Knox City
Average Household Size in Knox City is 2.6 People.
How Large is the Labor Force in Knox City?
There are 316 People in the Labor Forcein in Knox City.
What is the Percentage of People in the Labor Force in Knox City?
42.9% of People are in the Labor Force in Knox City.
What is the Unemployment Rate in Knox City?
Unemployment Rate in Knox City is 1.3%.