Kendleton, TX Map & Demographics
Kendleton Map
Kendleton Overview
$50,121
PER CAPITA INCOME
$61,250
AVG FAMILY INCOME
$42,679
AVG HOUSEHOLD INCOME
0.67
INEQUALITY / GINI INDEX
239
TOTAL POPULATION
104
MALE POPULATION
135
FEMALE POPULATION
77.04
MALES / 100 FEMALES
129.81
FEMALES / 100 MALES
51.4
MEDIAN AGE
2.8
AVG FAMILY SIZE
1.9
AVG HOUSEHOLD SIZE
94
LABOR FORCE [ PEOPLE ]
43.7%
PERCENT IN LABOR FORCE
Kendleton Zip Codes
Income in Kendleton
Income Overview in Kendleton
Per Capita Income in Kendleton is $50,121, while median incomes of families and households are $61,250 and $42,679 respectively.
| Characteristic | Number | Measure |
| Per Capita Income | 239 | $50,121 |
| Median Family Income | 54 | $61,250 |
| Mean Family Income | 54 | $61,065 |
| Median Household Income | 123 | $42,679 |
| Mean Household Income | 123 | $99,407 |
| Income Deficit | 54 | $0 |
| Wage / Income Gap (%) | 239 | 0.00% |
| Wage / Income Gap ($) | 239 | 100.00¢ per $1 |
| Gini / Inequality Index | 239 | 0.67 |
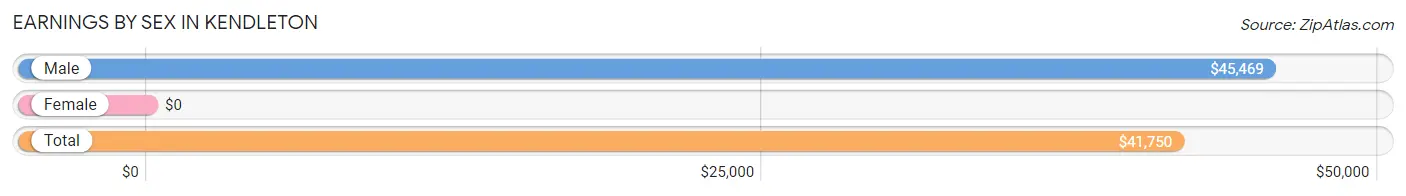
Earnings by Sex in Kendleton
| Sex | Number | Average Earnings |
| Male | 61 (60.4%) | $45,469 |
| Female | 40 (39.6%) | $0 |
| Total | 101 (100.0%) | $41,750 |
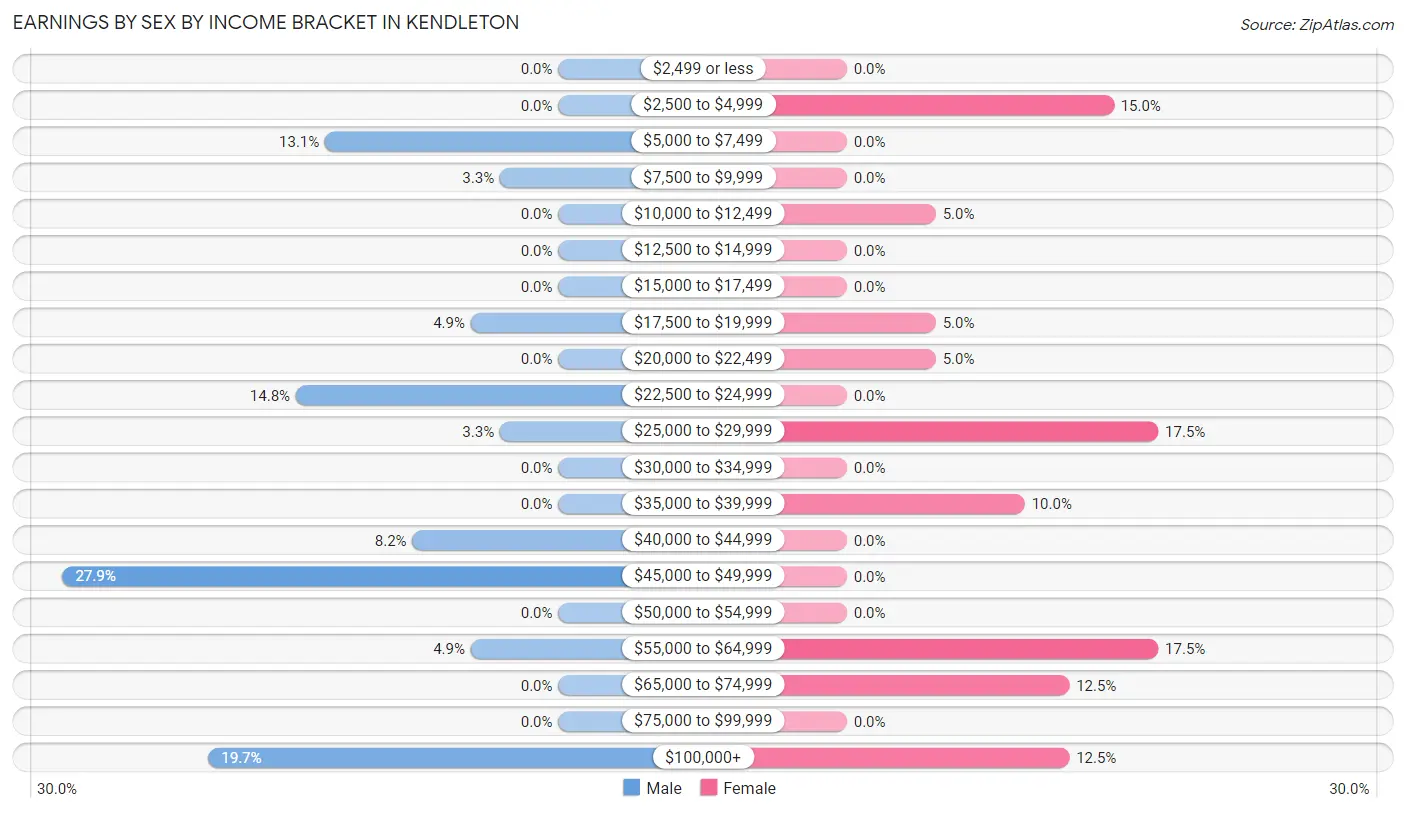
Earnings by Sex by Income Bracket in Kendleton
The most common earnings brackets in Kendleton are $45,000 to $49,999 for men (17 | 27.9%) and $25,000 to $29,999 for women (7 | 17.5%).
| Income | Male | Female |
| $2,499 or less | 0 (0.0%) | 0 (0.0%) |
| $2,500 to $4,999 | 0 (0.0%) | 6 (15.0%) |
| $5,000 to $7,499 | 8 (13.1%) | 0 (0.0%) |
| $7,500 to $9,999 | 2 (3.3%) | 0 (0.0%) |
| $10,000 to $12,499 | 0 (0.0%) | 2 (5.0%) |
| $12,500 to $14,999 | 0 (0.0%) | 0 (0.0%) |
| $15,000 to $17,499 | 0 (0.0%) | 0 (0.0%) |
| $17,500 to $19,999 | 3 (4.9%) | 2 (5.0%) |
| $20,000 to $22,499 | 0 (0.0%) | 2 (5.0%) |
| $22,500 to $24,999 | 9 (14.7%) | 0 (0.0%) |
| $25,000 to $29,999 | 2 (3.3%) | 7 (17.5%) |
| $30,000 to $34,999 | 0 (0.0%) | 0 (0.0%) |
| $35,000 to $39,999 | 0 (0.0%) | 4 (10.0%) |
| $40,000 to $44,999 | 5 (8.2%) | 0 (0.0%) |
| $45,000 to $49,999 | 17 (27.9%) | 0 (0.0%) |
| $50,000 to $54,999 | 0 (0.0%) | 0 (0.0%) |
| $55,000 to $64,999 | 3 (4.9%) | 7 (17.5%) |
| $65,000 to $74,999 | 0 (0.0%) | 5 (12.5%) |
| $75,000 to $99,999 | 0 (0.0%) | 0 (0.0%) |
| $100,000+ | 12 (19.7%) | 5 (12.5%) |
| Total | 61 (100.0%) | 40 (100.0%) |
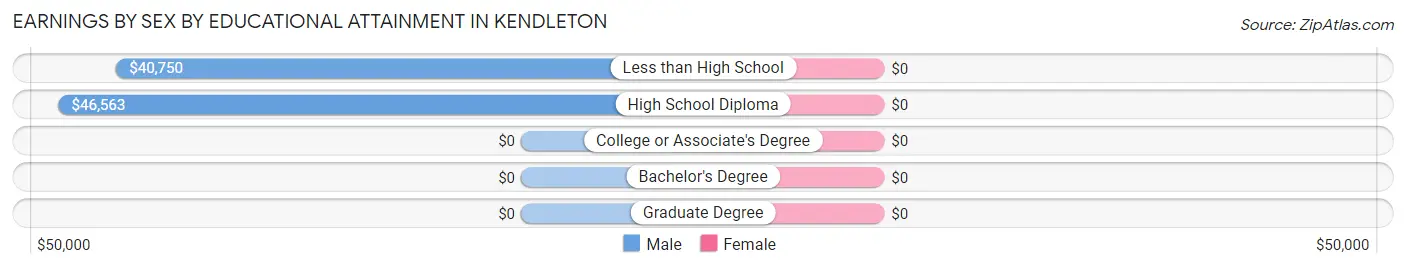
Earnings by Sex by Educational Attainment in Kendleton
| Educational Attainment | Male Income | Female Income |
| Less than High School | $40,750 | $0 |
| High School Diploma | $46,563 | $0 |
| College or Associate's Degree | - | - |
| Bachelor's Degree | - | - |
| Graduate Degree | - | - |
| Total | $45,469 | $0 |
Family Income in Kendleton
Family Income Brackets in Kendleton
According to the Kendleton family income data, there are 13 families falling into the $50,000 to $74,999 income range, which is the most common income bracket and makes up 24.1% of all families.
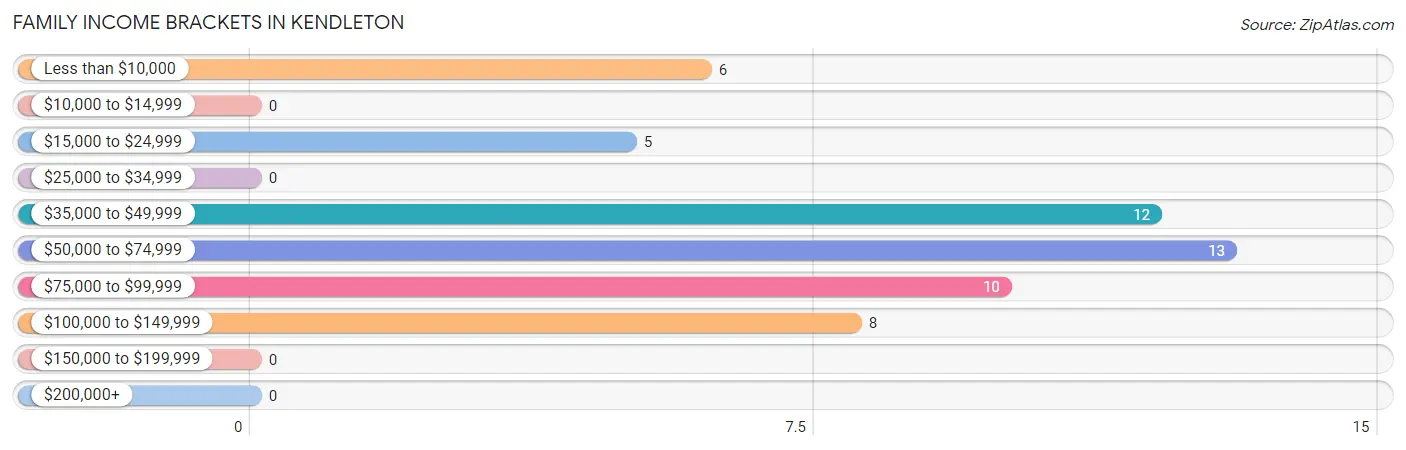
| Income Bracket | # Families | % Families |
| Less than $10,000 | 6 | 11.1% |
| $10,000 to $14,999 | 0 | 0.0% |
| $15,000 to $24,999 | 5 | 9.3% |
| $25,000 to $34,999 | 0 | 0.0% |
| $35,000 to $49,999 | 12 | 22.2% |
| $50,000 to $74,999 | 13 | 24.1% |
| $75,000 to $99,999 | 10 | 18.5% |
| $100,000 to $149,999 | 8 | 14.8% |
| $150,000 to $199,999 | 0 | 0.0% |
| $200,000+ | 0 | 0.0% |
Family Income by Famaliy Size in Kendleton
3-person families (14 | 25.9%) account for the highest median family income in Kendleton with $44,286 per family, while 3-person families (14 | 25.9%) have the highest median income of $14,762 per family member.
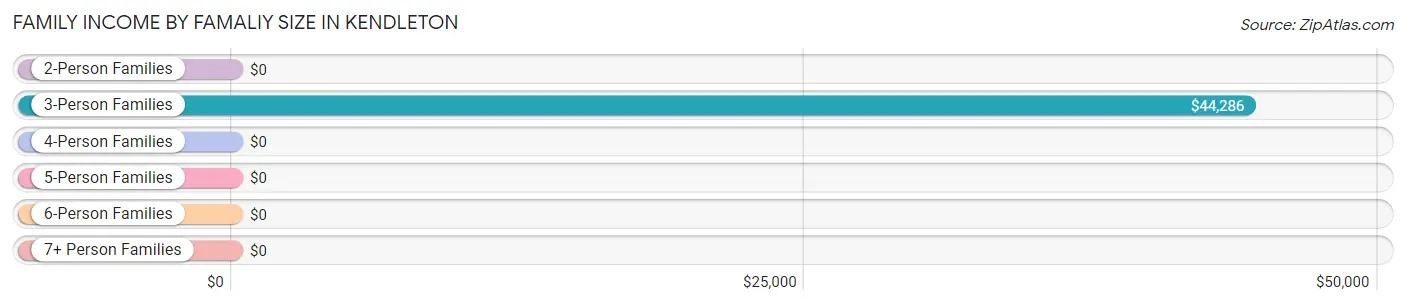
| Income Bracket | # Families | Median Income |
| 2-Person Families | 27 (50.0%) | $0 |
| 3-Person Families | 14 (25.9%) | $44,286 |
| 4-Person Families | 3 (5.6%) | $0 |
| 5-Person Families | 10 (18.5%) | $0 |
| 6-Person Families | 0 (0.0%) | $0 |
| 7+ Person Families | 0 (0.0%) | $0 |
| Total | 54 (100.0%) | $61,250 |
Family Income by Number of Earners in Kendleton
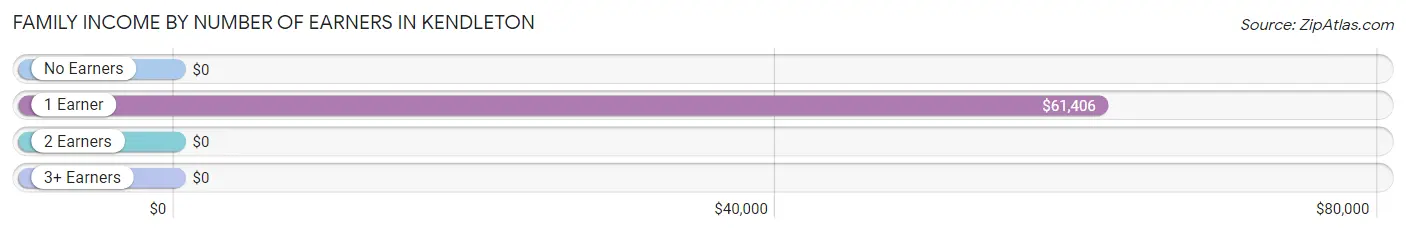
| Number of Earners | # Families | Median Income |
| No Earners | 12 (22.2%) | $0 |
| 1 Earner | 27 (50.0%) | $61,406 |
| 2 Earners | 12 (22.2%) | $0 |
| 3+ Earners | 3 (5.6%) | $0 |
| Total | 54 (100.0%) | $61,250 |
Household Income in Kendleton
Household Income Brackets in Kendleton
With 22 households falling in the category, the $35,000 to $49,999 income range is the most frequent in Kendleton, accounting for 17.9% of all households.
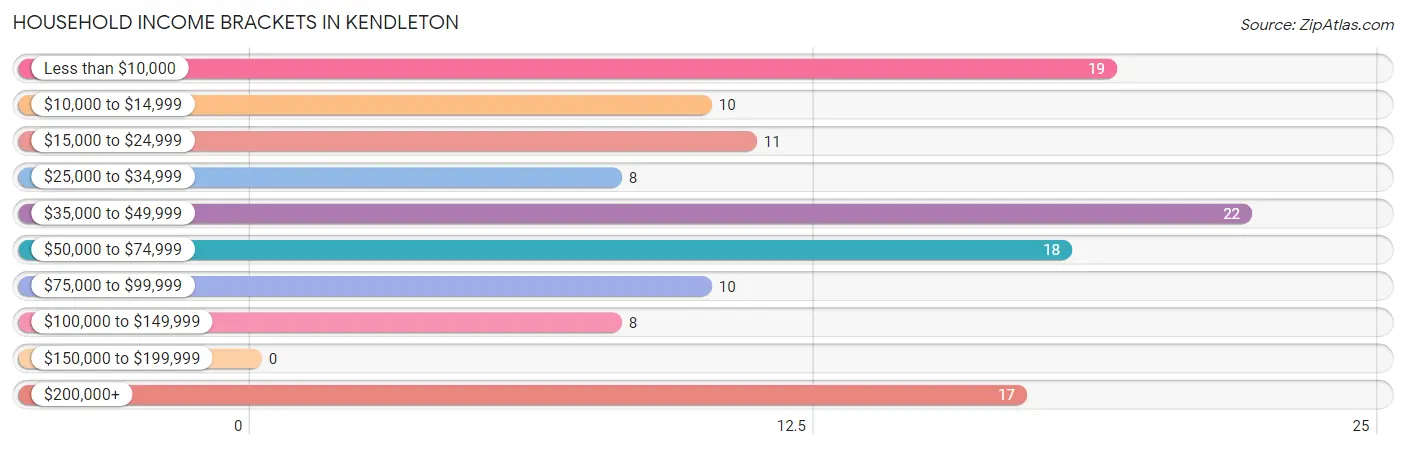
| Income Bracket | # Households | % Households |
| Less than $10,000 | 19 | 15.4% |
| $10,000 to $14,999 | 10 | 8.1% |
| $15,000 to $24,999 | 11 | 8.9% |
| $25,000 to $34,999 | 8 | 6.5% |
| $35,000 to $49,999 | 22 | 17.9% |
| $50,000 to $74,999 | 18 | 14.6% |
| $75,000 to $99,999 | 10 | 8.1% |
| $100,000 to $149,999 | 8 | 6.5% |
| $150,000 to $199,999 | 0 | 0.0% |
| $200,000+ | 17 | 13.8% |
Household Income by Householder Age in Kendleton
The median household income in Kendleton is $42,679, with the highest median household income of $203,229 found in the 25 to 44 years age bracket for the primary householder. A total of 17 households (13.8%) fall into this category. Meanwhile, the 15 to 24 years age bracket for the primary householder has the lowest median household income of $0, with 10 households (8.1%) in this group.
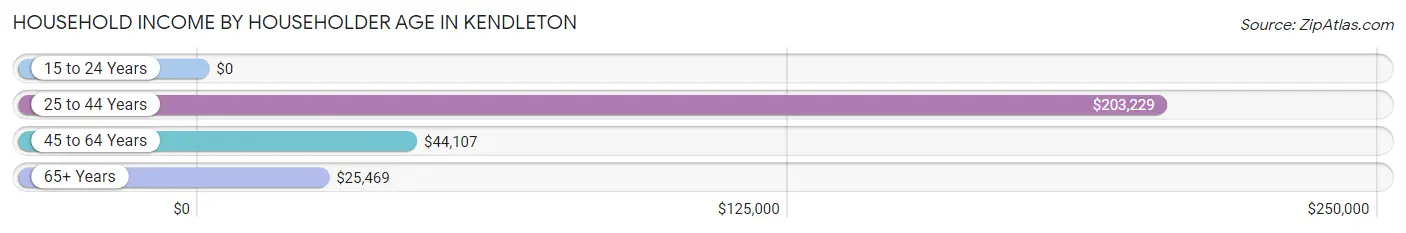
| Income Bracket | # Households | Median Income |
| 15 to 24 Years | 10 (8.1%) | $0 |
| 25 to 44 Years | 17 (13.8%) | $203,229 |
| 45 to 64 Years | 35 (28.5%) | $44,107 |
| 65+ Years | 61 (49.6%) | $25,469 |
| Total | 123 (100.0%) | $42,679 |
Poverty in Kendleton
Income Below Poverty by Sex and Age in Kendleton
With 16.4% poverty level for males and 20.3% for females among the residents of Kendleton, 15 year old males and 35 to 44 year old females are the most vulnerable to poverty, with 3 males (100.0%) and 2 females (50.0%) in their respective age groups living below the poverty level.
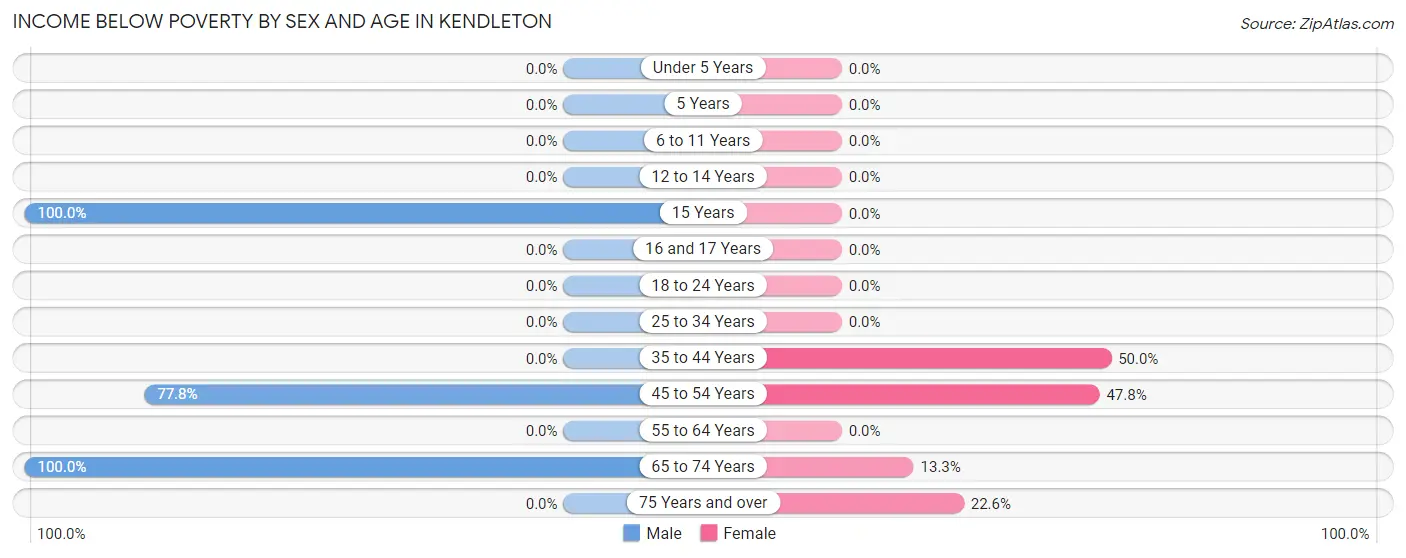
| Age Bracket | Male | Female |
| Under 5 Years | 0 (0.0%) | 0 (0.0%) |
| 5 Years | 0 (0.0%) | 0 (0.0%) |
| 6 to 11 Years | 0 (0.0%) | 0 (0.0%) |
| 12 to 14 Years | 0 (0.0%) | 0 (0.0%) |
| 15 Years | 3 (100.0%) | 0 (0.0%) |
| 16 and 17 Years | 0 (0.0%) | 0 (0.0%) |
| 18 to 24 Years | 0 (0.0%) | 0 (0.0%) |
| 25 to 34 Years | 0 (0.0%) | 0 (0.0%) |
| 35 to 44 Years | 0 (0.0%) | 2 (50.0%) |
| 45 to 54 Years | 7 (77.8%) | 11 (47.8%) |
| 55 to 64 Years | 0 (0.0%) | 0 (0.0%) |
| 65 to 74 Years | 7 (100.0%) | 2 (13.3%) |
| 75 Years and over | 0 (0.0%) | 12 (22.6%) |
| Total | 17 (16.4%) | 27 (20.3%) |
Income Above Poverty by Sex and Age in Kendleton
According to the poverty statistics in Kendleton, males aged under 5 years and females aged under 5 years are the age groups that are most secure financially, with 100.0% of males and 100.0% of females in these age groups living above the poverty line.
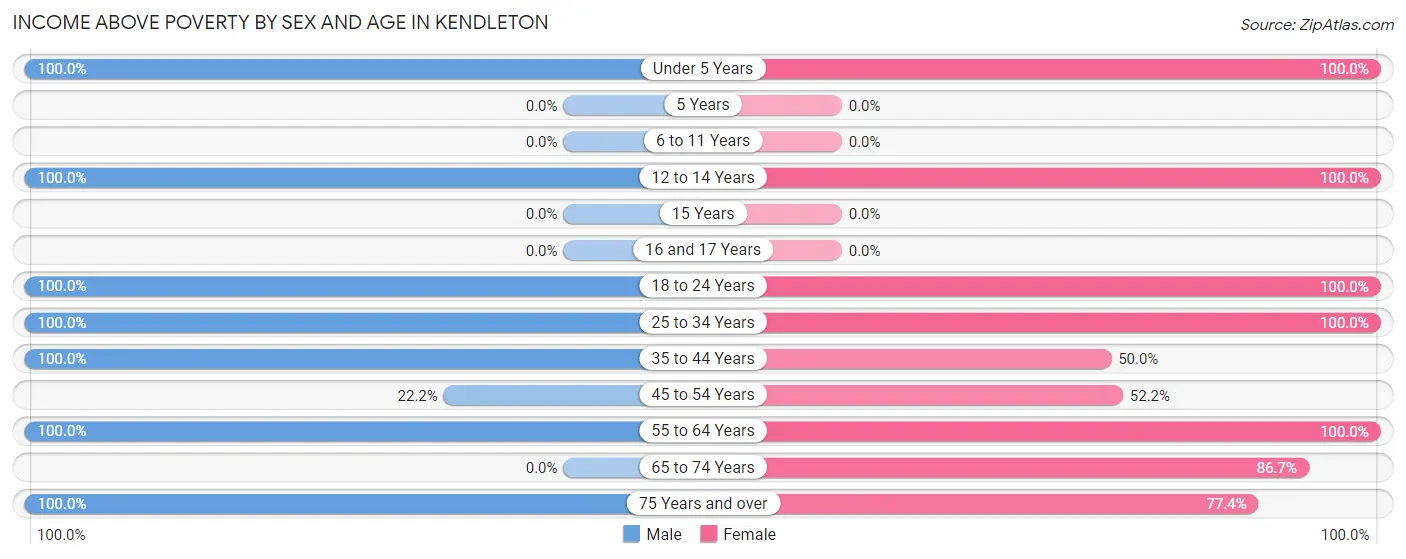
| Age Bracket | Male | Female |
| Under 5 Years | 8 (100.0%) | 3 (100.0%) |
| 5 Years | 0 (0.0%) | 0 (0.0%) |
| 6 to 11 Years | 0 (0.0%) | 0 (0.0%) |
| 12 to 14 Years | 1 (100.0%) | 7 (100.0%) |
| 15 Years | 0 (0.0%) | 0 (0.0%) |
| 16 and 17 Years | 0 (0.0%) | 0 (0.0%) |
| 18 to 24 Years | 4 (100.0%) | 10 (100.0%) |
| 25 to 34 Years | 21 (100.0%) | 3 (100.0%) |
| 35 to 44 Years | 30 (100.0%) | 2 (50.0%) |
| 45 to 54 Years | 2 (22.2%) | 12 (52.2%) |
| 55 to 64 Years | 13 (100.0%) | 15 (100.0%) |
| 65 to 74 Years | 0 (0.0%) | 13 (86.7%) |
| 75 Years and over | 8 (100.0%) | 41 (77.4%) |
| Total | 87 (83.7%) | 106 (79.7%) |
Income Below Poverty Among Married-Couple Families in Kendleton
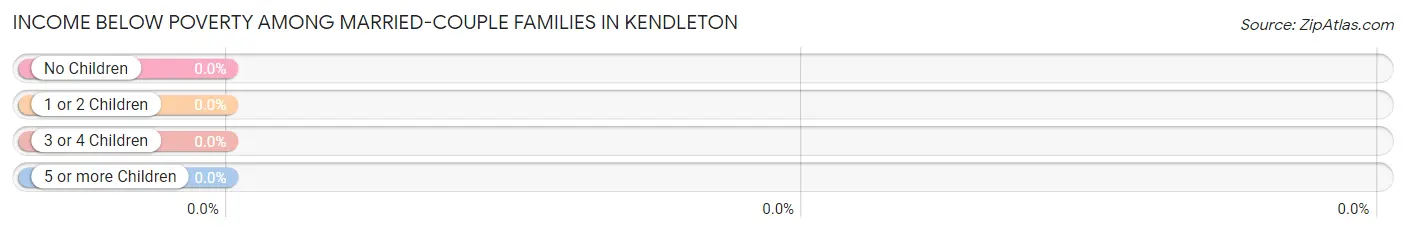
| Children | Above Poverty | Below Poverty |
| No Children | 8 (100.0%) | 0 (0.0%) |
| 1 or 2 Children | 13 (100.0%) | 0 (0.0%) |
| 3 or 4 Children | 0 (0.0%) | 0 (0.0%) |
| 5 or more Children | 0 (0.0%) | 0 (0.0%) |
| Total | 21 (100.0%) | 0 (0.0%) |
Income Below Poverty Among Single-Parent Households in Kendleton
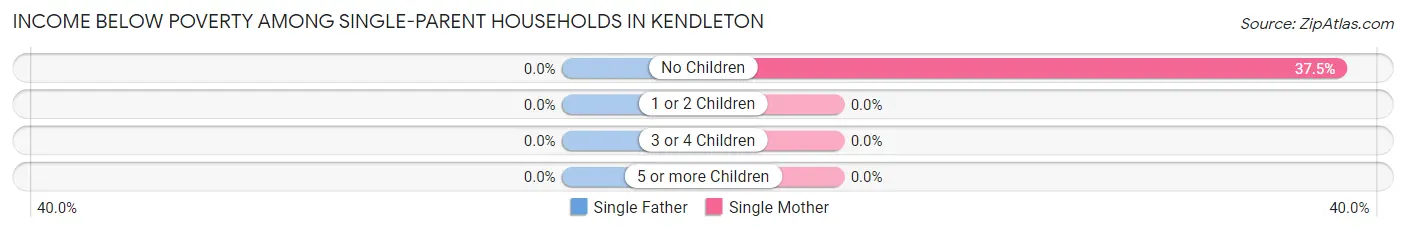
| Children | Single Father | Single Mother |
| No Children | 0 (0.0%) | 6 (37.5%) |
| 1 or 2 Children | 0 (0.0%) | 0 (0.0%) |
| 3 or 4 Children | 0 (0.0%) | 0 (0.0%) |
| 5 or more Children | 0 (0.0%) | 0 (0.0%) |
| Total | 0 (0.0%) | 6 (24.0%) |
Income Below Poverty Among Married-Couple vs Single-Parent Households in Kendleton
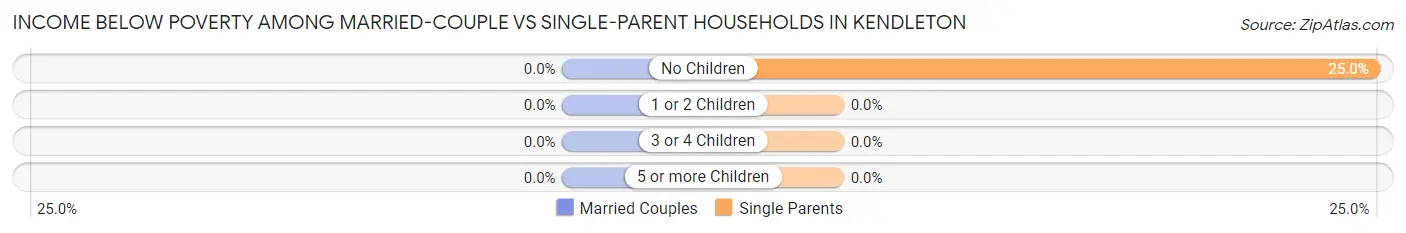
| Children | Married-Couple Families | Single-Parent Households |
| No Children | 0 (0.0%) | 6 (25.0%) |
| 1 or 2 Children | 0 (0.0%) | 0 (0.0%) |
| 3 or 4 Children | 0 (0.0%) | 0 (0.0%) |
| 5 or more Children | 0 (0.0%) | 0 (0.0%) |
| Total | 0 (0.0%) | 6 (18.2%) |
Race in Kendleton
The most populous races in Kendleton are Black / African American (157 | 65.7%), Hispanic or Latino (81 | 33.9%), and White / Caucasian (49 | 20.5%).
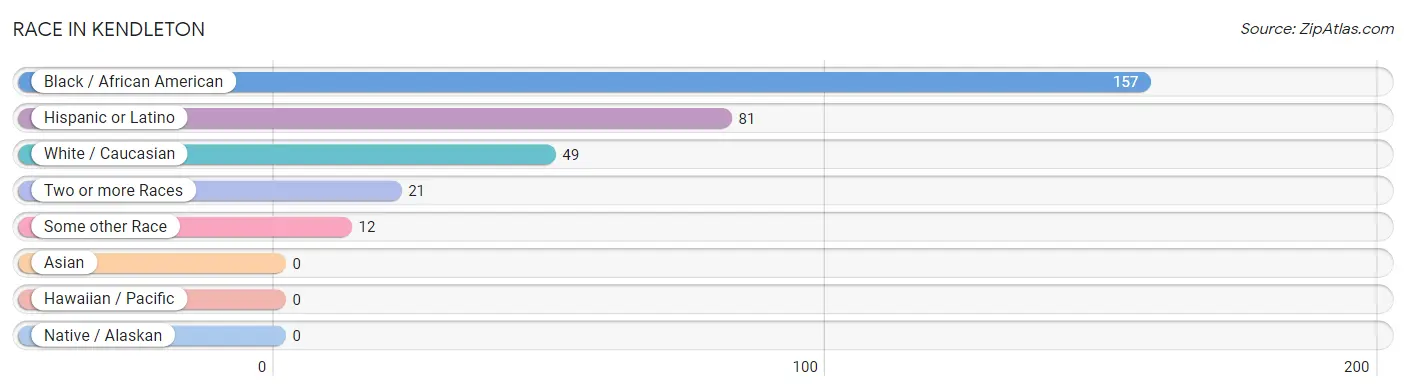
| Race | # Population | % Population |
| Asian | 0 | 0.0% |
| Black / African American | 157 | 65.7% |
| Hawaiian / Pacific | 0 | 0.0% |
| Hispanic or Latino | 81 | 33.9% |
| Native / Alaskan | 0 | 0.0% |
| White / Caucasian | 49 | 20.5% |
| Two or more Races | 21 | 8.8% |
| Some other Race | 12 | 5.0% |
| Total | 239 | 100.0% |
Ancestry in Kendleton
The most populous ancestries reported in Kendleton are Mexican (81 | 33.9%), African (14 | 5.9%), Subsaharan African (14 | 5.9%), and American (13 | 5.4%), together accounting for 51.0% of all Kendleton residents.
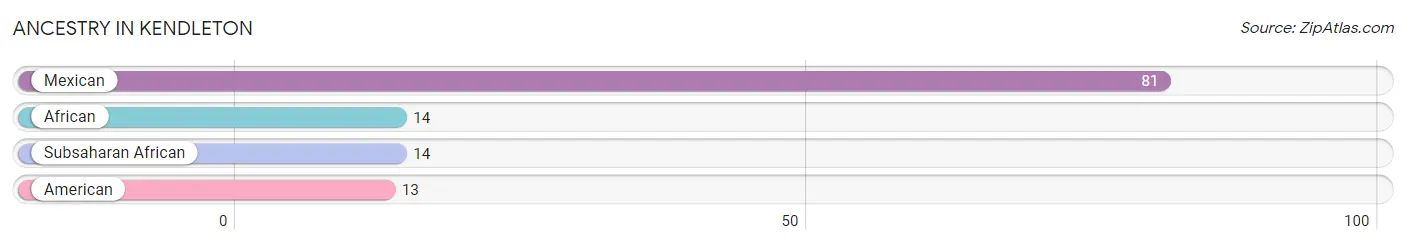
| Ancestry | # Population | % Population |
| African | 14 | 5.9% |
| American | 13 | 5.4% |
| Mexican | 81 | 33.9% |
| Subsaharan African | 14 | 5.9% | View All 4 Rows |
Immigrants in Kendleton
The most numerous immigrant groups reported in Kendleton came from Central America (27 | 11.3%), Latin America (27 | 11.3%), and Mexico (27 | 11.3%), together accounting for 33.9% of all Kendleton residents.
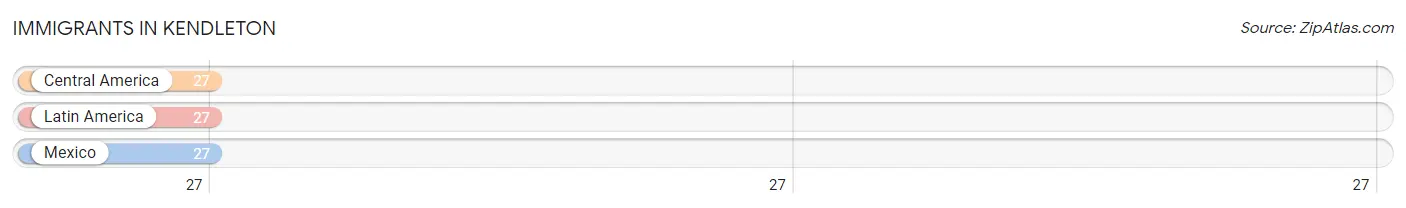
| Immigration Origin | # Population | % Population |
| Central America | 27 | 11.3% |
| Latin America | 27 | 11.3% |
| Mexico | 27 | 11.3% | View All 3 Rows |
Sex and Age in Kendleton
Sex and Age in Kendleton
The most populous age groups in Kendleton are 35 to 39 Years (20 | 19.2%) for men and 80 to 84 Years (29 | 21.5%) for women.
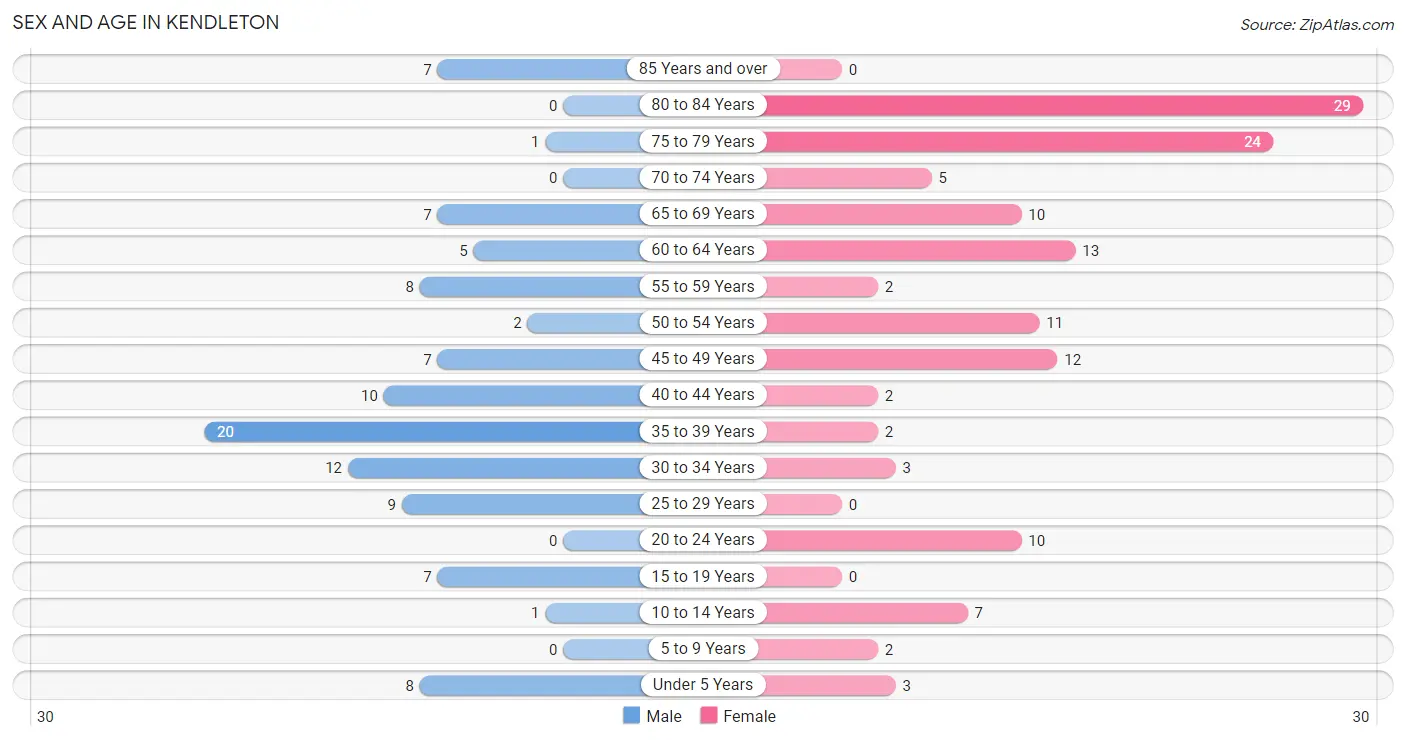
| Age Bracket | Male | Female |
| Under 5 Years | 8 (7.7%) | 3 (2.2%) |
| 5 to 9 Years | 0 (0.0%) | 2 (1.5%) |
| 10 to 14 Years | 1 (1.0%) | 7 (5.2%) |
| 15 to 19 Years | 7 (6.7%) | 0 (0.0%) |
| 20 to 24 Years | 0 (0.0%) | 10 (7.4%) |
| 25 to 29 Years | 9 (8.6%) | 0 (0.0%) |
| 30 to 34 Years | 12 (11.5%) | 3 (2.2%) |
| 35 to 39 Years | 20 (19.2%) | 2 (1.5%) |
| 40 to 44 Years | 10 (9.6%) | 2 (1.5%) |
| 45 to 49 Years | 7 (6.7%) | 12 (8.9%) |
| 50 to 54 Years | 2 (1.9%) | 11 (8.2%) |
| 55 to 59 Years | 8 (7.7%) | 2 (1.5%) |
| 60 to 64 Years | 5 (4.8%) | 13 (9.6%) |
| 65 to 69 Years | 7 (6.7%) | 10 (7.4%) |
| 70 to 74 Years | 0 (0.0%) | 5 (3.7%) |
| 75 to 79 Years | 1 (1.0%) | 24 (17.8%) |
| 80 to 84 Years | 0 (0.0%) | 29 (21.5%) |
| 85 Years and over | 7 (6.7%) | 0 (0.0%) |
| Total | 104 (100.0%) | 135 (100.0%) |
Families and Households in Kendleton
Median Family Size in Kendleton
The median family size in Kendleton is 2.83 persons per family, with married-couple families (21 | 38.9%) accounting for the largest median family size of 3.29 persons per family. On the other hand, single male/father families (8 | 14.8%) represent the smallest median family size with 1.75 persons per family.
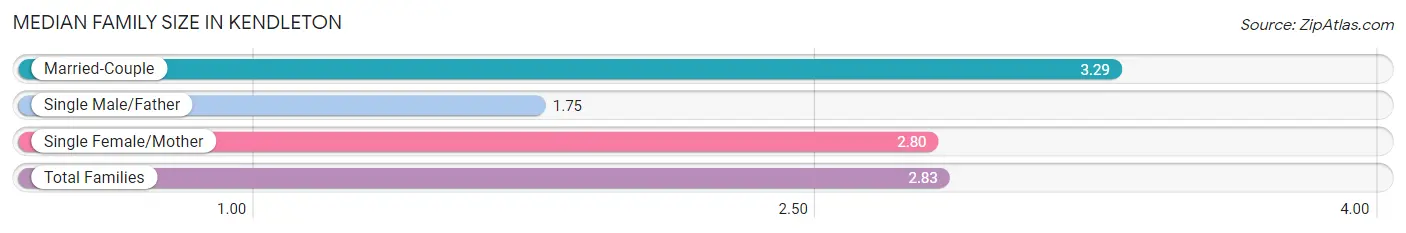
| Family Type | # Families | Family Size |
| Married-Couple | 21 (38.9%) | 3.29 |
| Single Male/Father | 8 (14.8%) | 1.75 |
| Single Female/Mother | 25 (46.3%) | 2.80 |
| Total Families | 54 (100.0%) | 2.83 |
Median Household Size in Kendleton
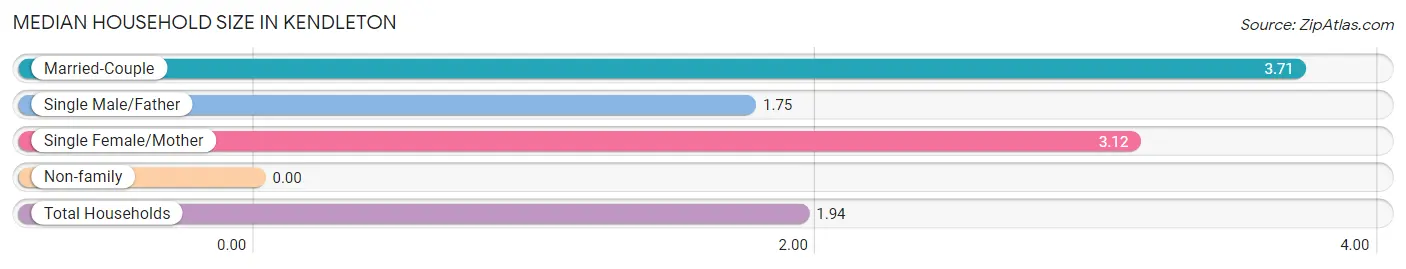
| Household Type | # Households | Household Size |
| Married-Couple | 21 (17.1%) | 3.71 |
| Single Male/Father | 8 (6.5%) | 1.75 |
| Single Female/Mother | 25 (20.3%) | 3.12 |
| Non-family | 69 (56.1%) | - |
| Total Households | 123 (100.0%) | 1.94 |
Household Size by Marriage Status in Kendleton
Out of a total of 123 households in Kendleton, 54 (43.9%) are family households, while 69 (56.1%) are nonfamily households. The most numerous type of family households are 2-person households, comprising 21, and the most common type of nonfamily households are 1-person households, comprising 69.
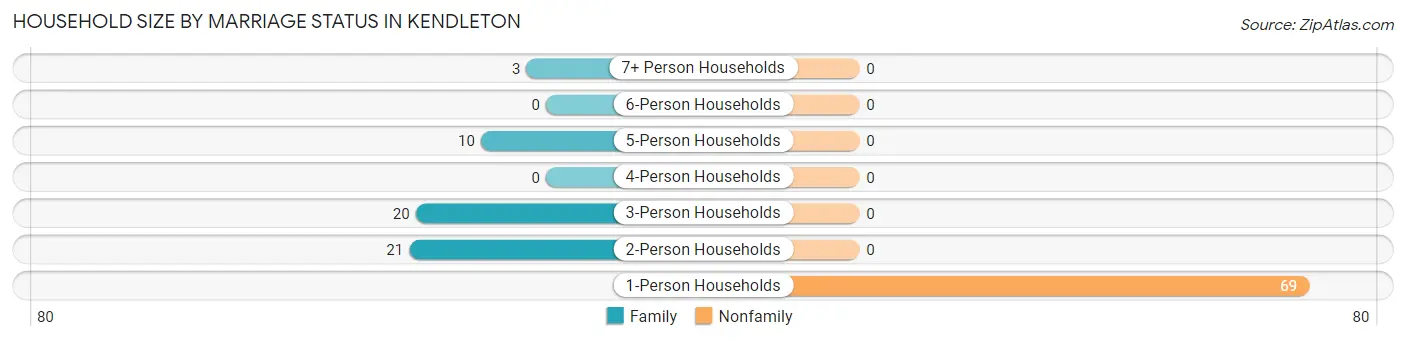
| Household Size | Family Households | Nonfamily Households |
| 1-Person Households | - | 69 (56.1%) |
| 2-Person Households | 21 (17.1%) | 0 (0.0%) |
| 3-Person Households | 20 (16.3%) | 0 (0.0%) |
| 4-Person Households | 0 (0.0%) | 0 (0.0%) |
| 5-Person Households | 10 (8.1%) | 0 (0.0%) |
| 6-Person Households | 0 (0.0%) | 0 (0.0%) |
| 7+ Person Households | 3 (2.4%) | 0 (0.0%) |
| Total | 54 (43.9%) | 69 (56.1%) |
Female Fertility in Kendleton
Fertility by Age in Kendleton
Average fertility rate in Kendleton is 345.0 births per 1,000 women. Women in the age bracket of 20 to 34 years have the highest fertility rate with 769.0 births per 1,000 women. Women in the age bracket of 20 to 34 years acount for 100.0% of all women with births.
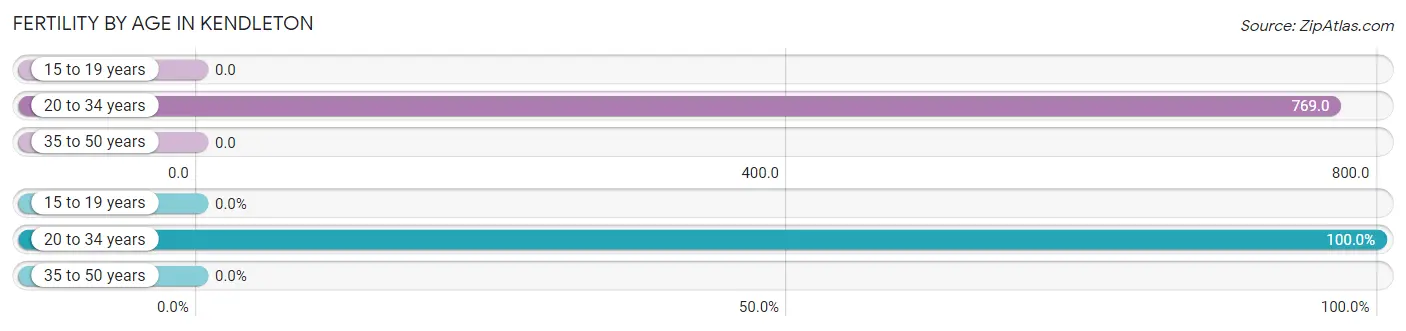
| Age Bracket | Women with Births | Births / 1,000 Women |
| 15 to 19 years | 0 (0.0%) | 0.0 |
| 20 to 34 years | 10 (100.0%) | 769.0 |
| 35 to 50 years | 0 (0.0%) | 0.0 |
| Total | 10 (100.0%) | 345.0 |
Fertility by Age by Marriage Status in Kendleton
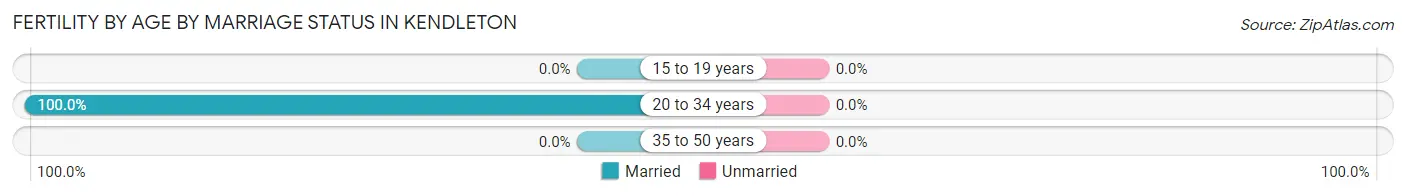
| Age Bracket | Married | Unmarried |
| 15 to 19 years | 0 (0.0%) | 0 (0.0%) |
| 20 to 34 years | 10 (100.0%) | 0 (0.0%) |
| 35 to 50 years | 0 (0.0%) | 0 (0.0%) |
| Total | 10 (100.0%) | 0 (0.0%) |
Fertility by Education in Kendleton
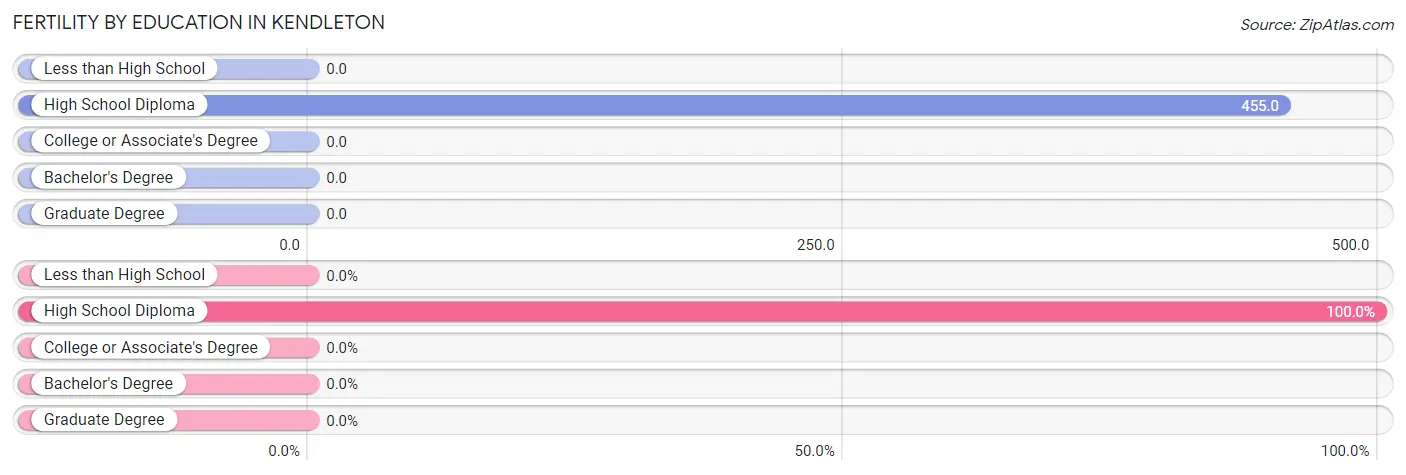
| Educational Attainment | Women with Births | Births / 1,000 Women |
| Less than High School | 0 (0.0%) | 0.0 |
| High School Diploma | 10 (100.0%) | 455.0 |
| College or Associate's Degree | 0 (0.0%) | 0.0 |
| Bachelor's Degree | 0 (0.0%) | 0.0 |
| Graduate Degree | 0 (0.0%) | 0.0 |
| Total | 10 (100.0%) | 345.0 |
Fertility by Education by Marriage Status in Kendleton
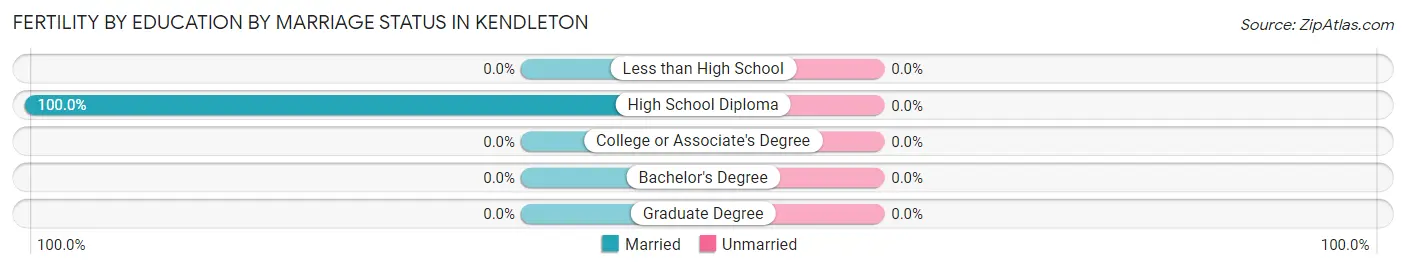
| Educational Attainment | Married | Unmarried |
| Less than High School | 0 (0.0%) | 0 (0.0%) |
| High School Diploma | 10 (100.0%) | 0 (0.0%) |
| College or Associate's Degree | 0 (0.0%) | 0 (0.0%) |
| Bachelor's Degree | 0 (0.0%) | 0 (0.0%) |
| Graduate Degree | 0 (0.0%) | 0 (0.0%) |
| Total | 10 (100.0%) | 0 (0.0%) |
Employment Characteristics in Kendleton
Employment by Class of Employer in Kendleton
Among the 94 employed individuals in Kendleton, private company employees (63 | 67.0%), self-employed (not incorporated) (9 | 9.6%), and state government employees (9 | 9.6%) make up the most common classes of employment.
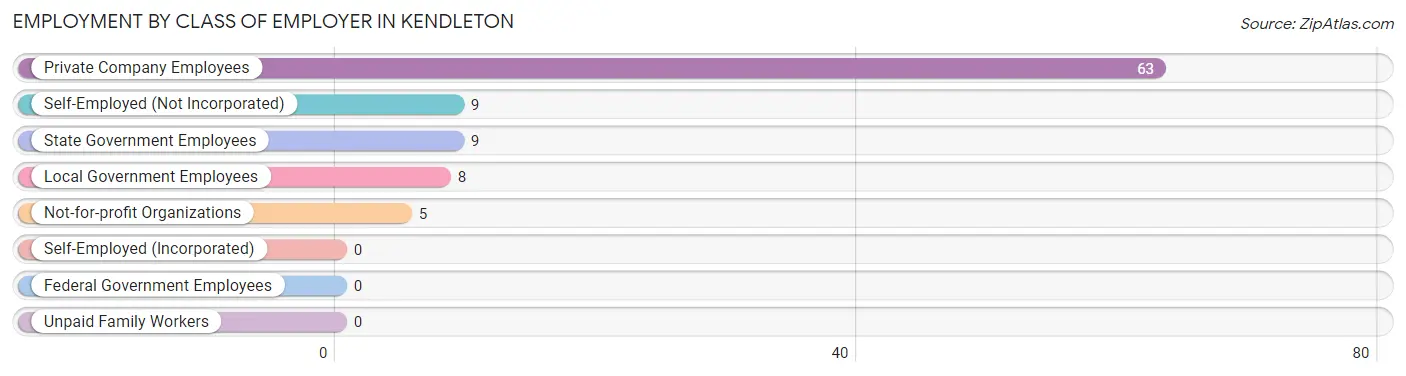
| Employer Class | # Employees | % Employees |
| Private Company Employees | 63 | 67.0% |
| Self-Employed (Incorporated) | 0 | 0.0% |
| Self-Employed (Not Incorporated) | 9 | 9.6% |
| Not-for-profit Organizations | 5 | 5.3% |
| Local Government Employees | 8 | 8.5% |
| State Government Employees | 9 | 9.6% |
| Federal Government Employees | 0 | 0.0% |
| Unpaid Family Workers | 0 | 0.0% |
| Total | 94 | 100.0% |
Employment Status by Age in Kendleton
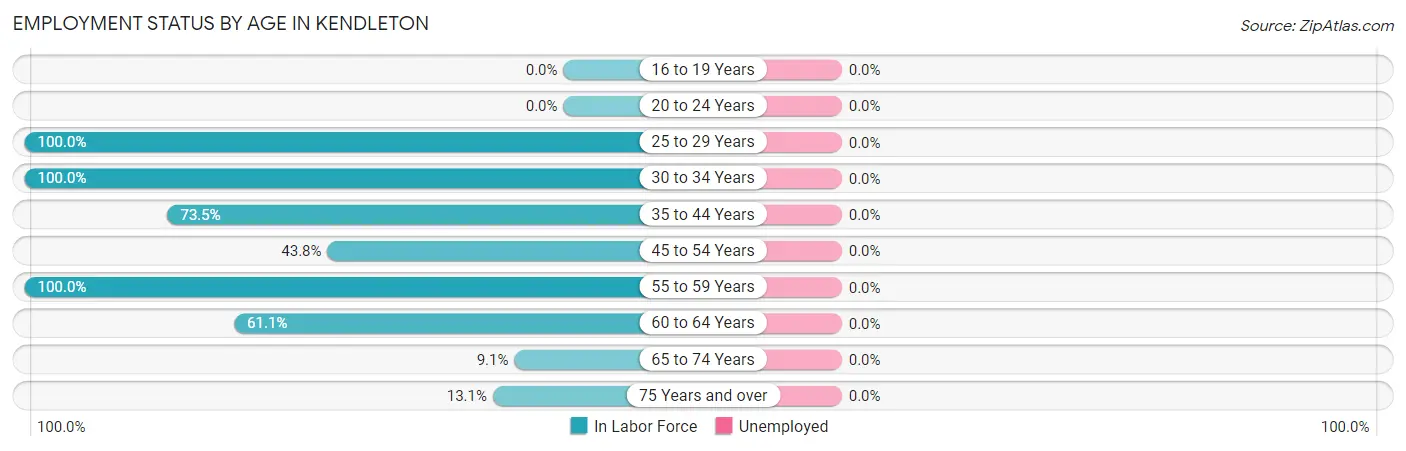
| Age Bracket | In Labor Force | Unemployed |
| 16 to 19 Years | 0 (0.0%) | 0 (0.0%) |
| 20 to 24 Years | 0 (0.0%) | 0 (0.0%) |
| 25 to 29 Years | 9 (100.0%) | 0 (0.0%) |
| 30 to 34 Years | 15 (100.0%) | 0 (0.0%) |
| 35 to 44 Years | 25 (73.5%) | 0 (0.0%) |
| 45 to 54 Years | 14 (43.8%) | 0 (0.0%) |
| 55 to 59 Years | 10 (100.0%) | 0 (0.0%) |
| 60 to 64 Years | 11 (61.1%) | 0 (0.0%) |
| 65 to 74 Years | 2 (9.1%) | 0 (0.0%) |
| 75 Years and over | 8 (13.1%) | 0 (0.0%) |
| Total | 94 (43.7%) | 0 (0.0%) |
Employment Status by Educational Attainment in Kendleton
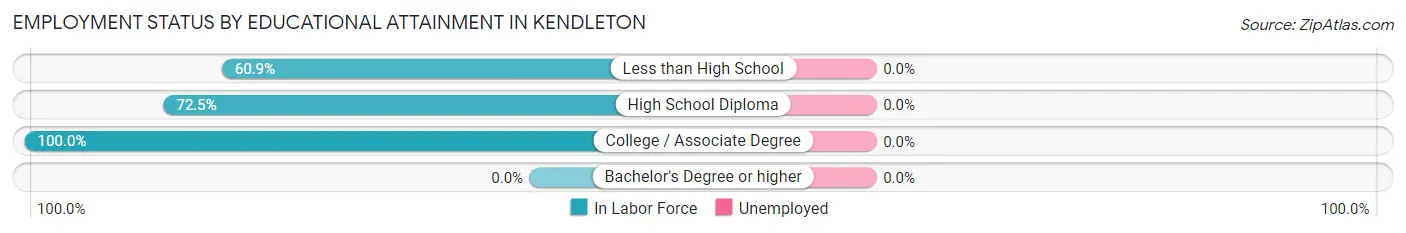
| Educational Attainment | In Labor Force | Unemployed |
| Less than High School | 14 (60.9%) | 0 (0.0%) |
| High School Diploma | 66 (72.5%) | 0 (0.0%) |
| College / Associate Degree | 4 (100.0%) | 0 (0.0%) |
| Bachelor's Degree or higher | 0 (0.0%) | 0 (0.0%) |
| Total | 84 (71.2%) | 0 (0.0%) |
Employment Occupations by Sex in Kendleton
Management, Business, Science and Arts Occupations
The most common Management, Business, Science and Arts occupations in Kendleton are Management (12 | 12.8%), and Health Diagnosing & Treating (4 | 4.3%).
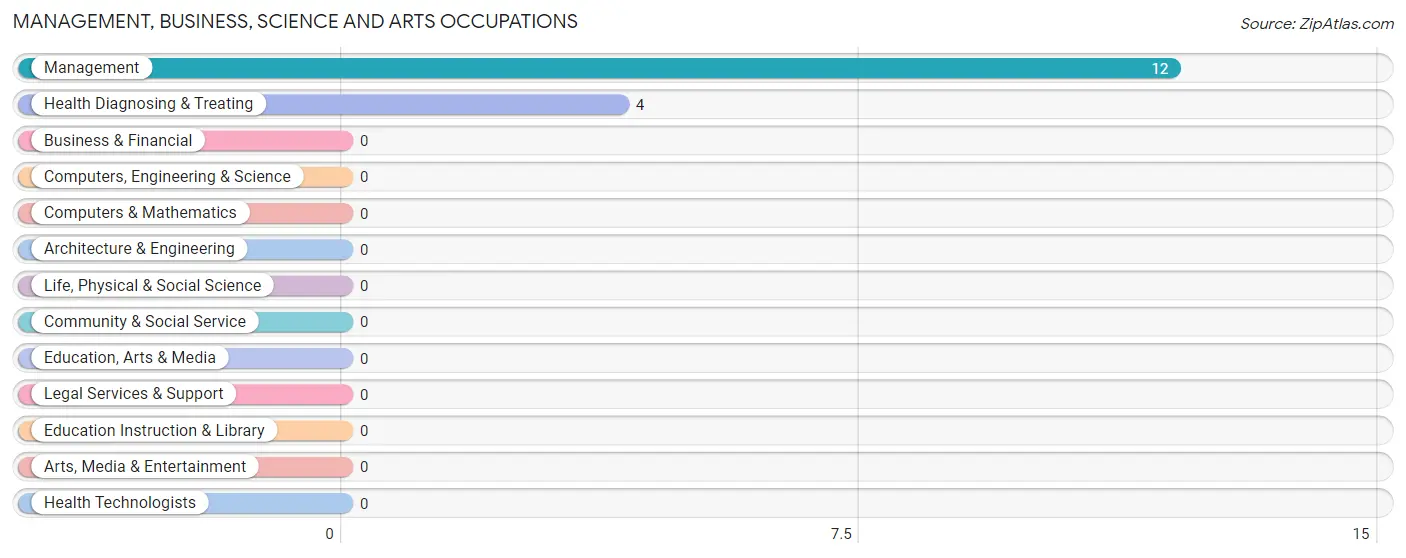
Management, Business, Science and Arts Occupations by Sex
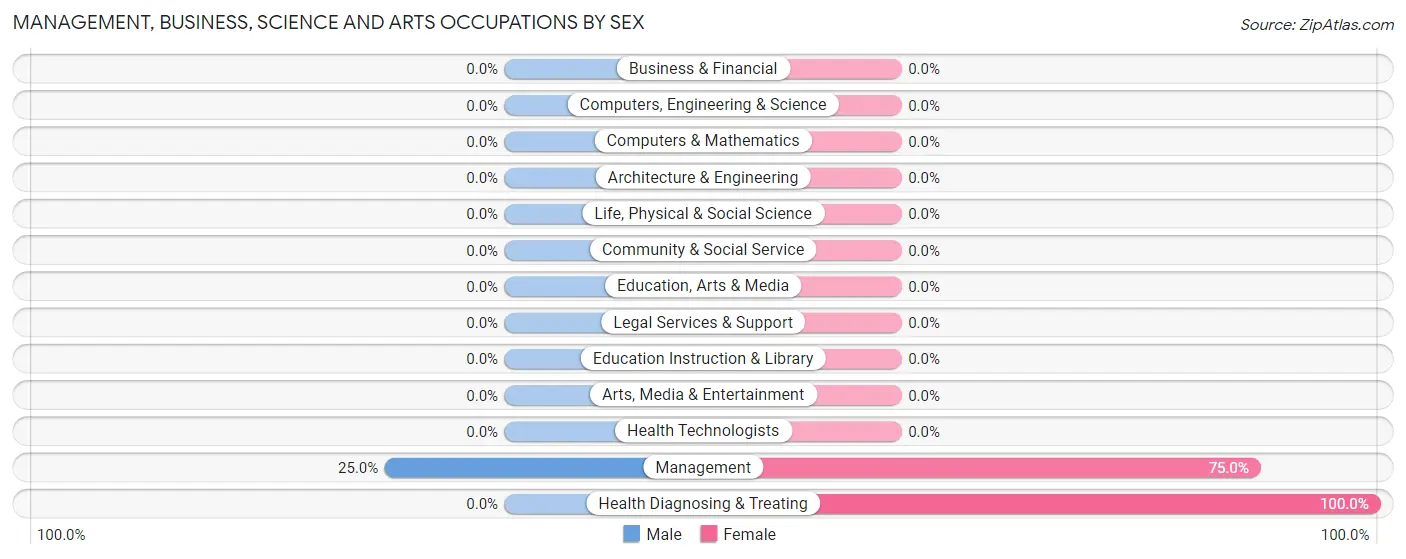
| Occupation | Male | Female |
| Management | 3 (25.0%) | 9 (75.0%) |
| Business & Financial | 0 (0.0%) | 0 (0.0%) |
| Computers, Engineering & Science | 0 (0.0%) | 0 (0.0%) |
| Computers & Mathematics | 0 (0.0%) | 0 (0.0%) |
| Architecture & Engineering | 0 (0.0%) | 0 (0.0%) |
| Life, Physical & Social Science | 0 (0.0%) | 0 (0.0%) |
| Community & Social Service | 0 (0.0%) | 0 (0.0%) |
| Education, Arts & Media | 0 (0.0%) | 0 (0.0%) |
| Legal Services & Support | 0 (0.0%) | 0 (0.0%) |
| Education Instruction & Library | 0 (0.0%) | 0 (0.0%) |
| Arts, Media & Entertainment | 0 (0.0%) | 0 (0.0%) |
| Health Diagnosing & Treating | 0 (0.0%) | 4 (100.0%) |
| Health Technologists | 0 (0.0%) | 0 (0.0%) |
| Total (Category) | 3 (18.8%) | 13 (81.2%) |
| Total (Overall) | 61 (64.9%) | 33 (35.1%) |
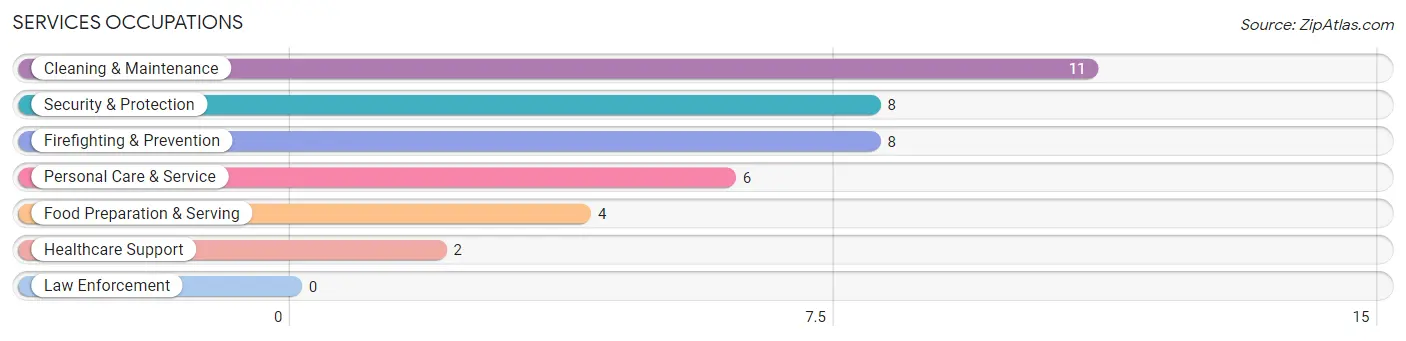
Services Occupations
The most common Services occupations in Kendleton are Cleaning & Maintenance (11 | 11.7%), Security & Protection (8 | 8.5%), Firefighting & Prevention (8 | 8.5%), Personal Care & Service (6 | 6.4%), and Food Preparation & Serving (4 | 4.3%).
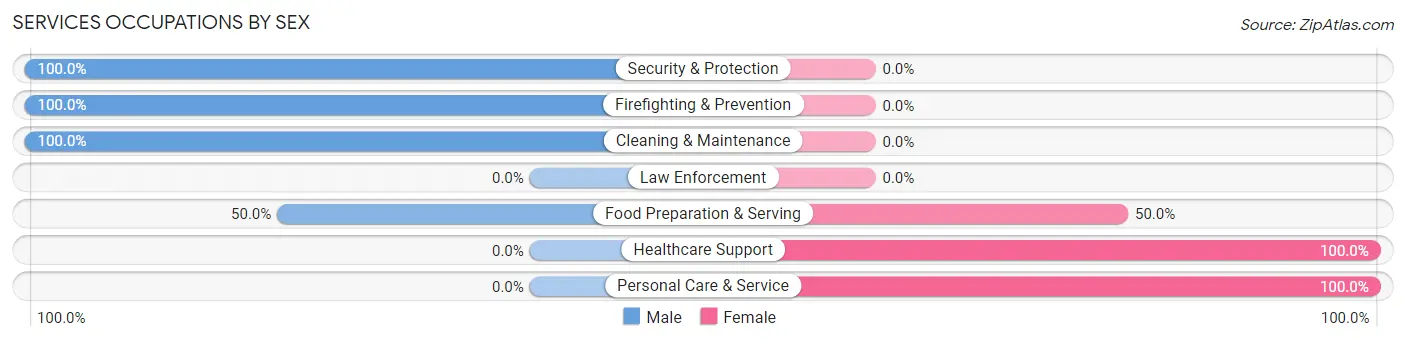
Services Occupations by Sex
Within the Services occupations in Kendleton, the most male-oriented occupations are Security & Protection (100.0%), Firefighting & Prevention (100.0%), and Cleaning & Maintenance (100.0%), while the most female-oriented occupations are Healthcare Support (100.0%), Personal Care & Service (100.0%), and Food Preparation & Serving (50.0%).
| Occupation | Male | Female |
| Healthcare Support | 0 (0.0%) | 2 (100.0%) |
| Security & Protection | 8 (100.0%) | 0 (0.0%) |
| Firefighting & Prevention | 8 (100.0%) | 0 (0.0%) |
| Law Enforcement | 0 (0.0%) | 0 (0.0%) |
| Food Preparation & Serving | 2 (50.0%) | 2 (50.0%) |
| Cleaning & Maintenance | 11 (100.0%) | 0 (0.0%) |
| Personal Care & Service | 0 (0.0%) | 6 (100.0%) |
| Total (Category) | 21 (67.7%) | 10 (32.3%) |
| Total (Overall) | 61 (64.9%) | 33 (35.1%) |
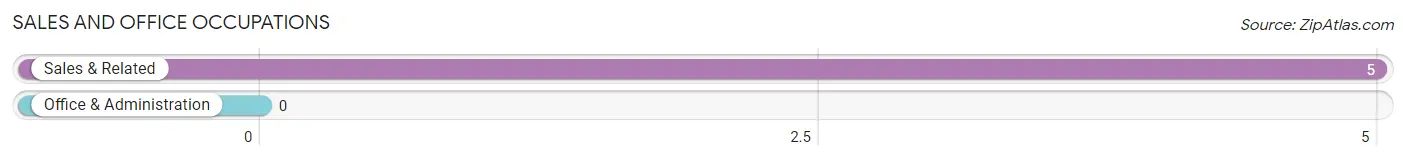
Sales and Office Occupations
The most common Sales and Office occupations in Kendleton are , and Sales & Related (5 | 5.3%).
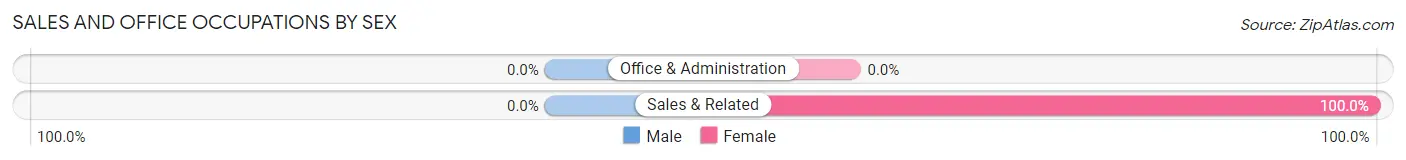
Sales and Office Occupations by Sex
| Occupation | Male | Female |
| Sales & Related | 0 (0.0%) | 5 (100.0%) |
| Office & Administration | 0 (0.0%) | 0 (0.0%) |
| Total (Category) | 0 (0.0%) | 5 (100.0%) |
| Total (Overall) | 61 (64.9%) | 33 (35.1%) |
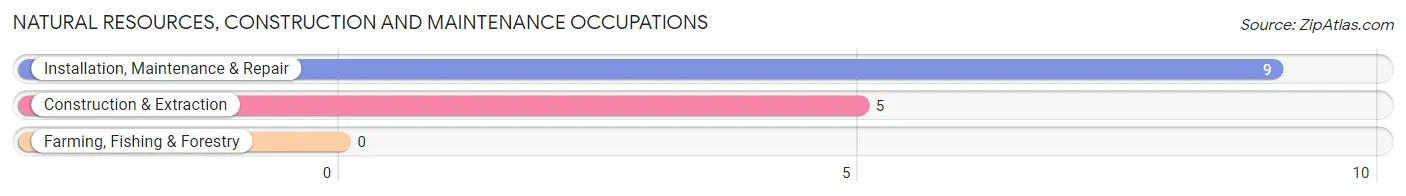
Natural Resources, Construction and Maintenance Occupations
The most common Natural Resources, Construction and Maintenance occupations in Kendleton are Installation, Maintenance & Repair (9 | 9.6%), and Construction & Extraction (5 | 5.3%).
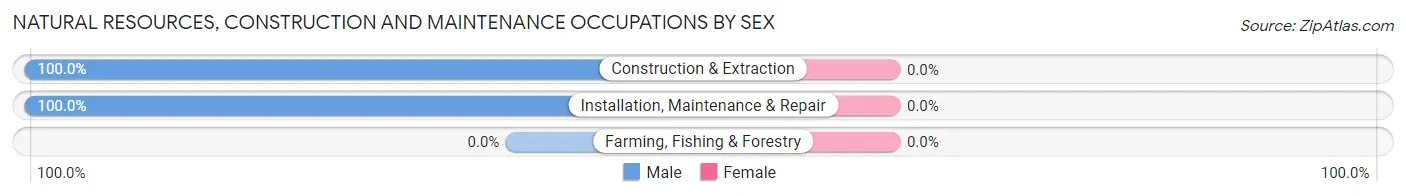
Natural Resources, Construction and Maintenance Occupations by Sex
| Occupation | Male | Female |
| Farming, Fishing & Forestry | 0 (0.0%) | 0 (0.0%) |
| Construction & Extraction | 5 (100.0%) | 0 (0.0%) |
| Installation, Maintenance & Repair | 9 (100.0%) | 0 (0.0%) |
| Total (Category) | 14 (100.0%) | 0 (0.0%) |
| Total (Overall) | 61 (64.9%) | 33 (35.1%) |
Production, Transportation and Moving Occupations
The most common Production, Transportation and Moving occupations in Kendleton are Material Moving (16 | 17.0%), and Production (12 | 12.8%).
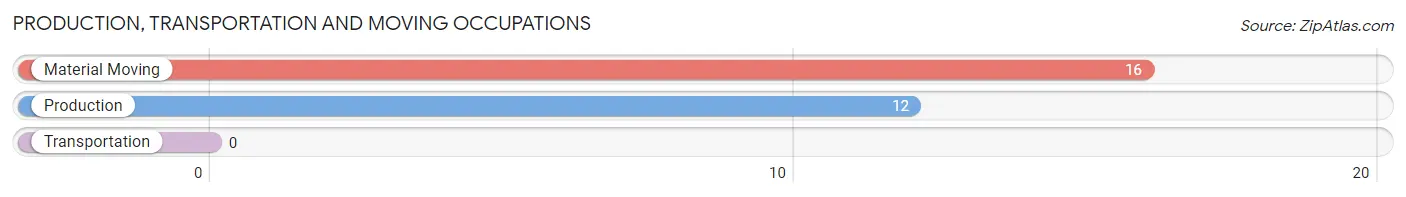
Production, Transportation and Moving Occupations by Sex
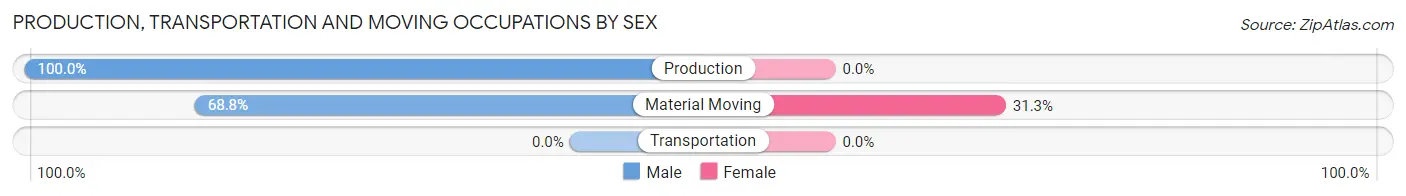
| Occupation | Male | Female |
| Production | 12 (100.0%) | 0 (0.0%) |
| Transportation | 0 (0.0%) | 0 (0.0%) |
| Material Moving | 11 (68.8%) | 5 (31.2%) |
| Total (Category) | 23 (82.1%) | 5 (17.9%) |
| Total (Overall) | 61 (64.9%) | 33 (35.1%) |
Employment Industries by Sex in Kendleton
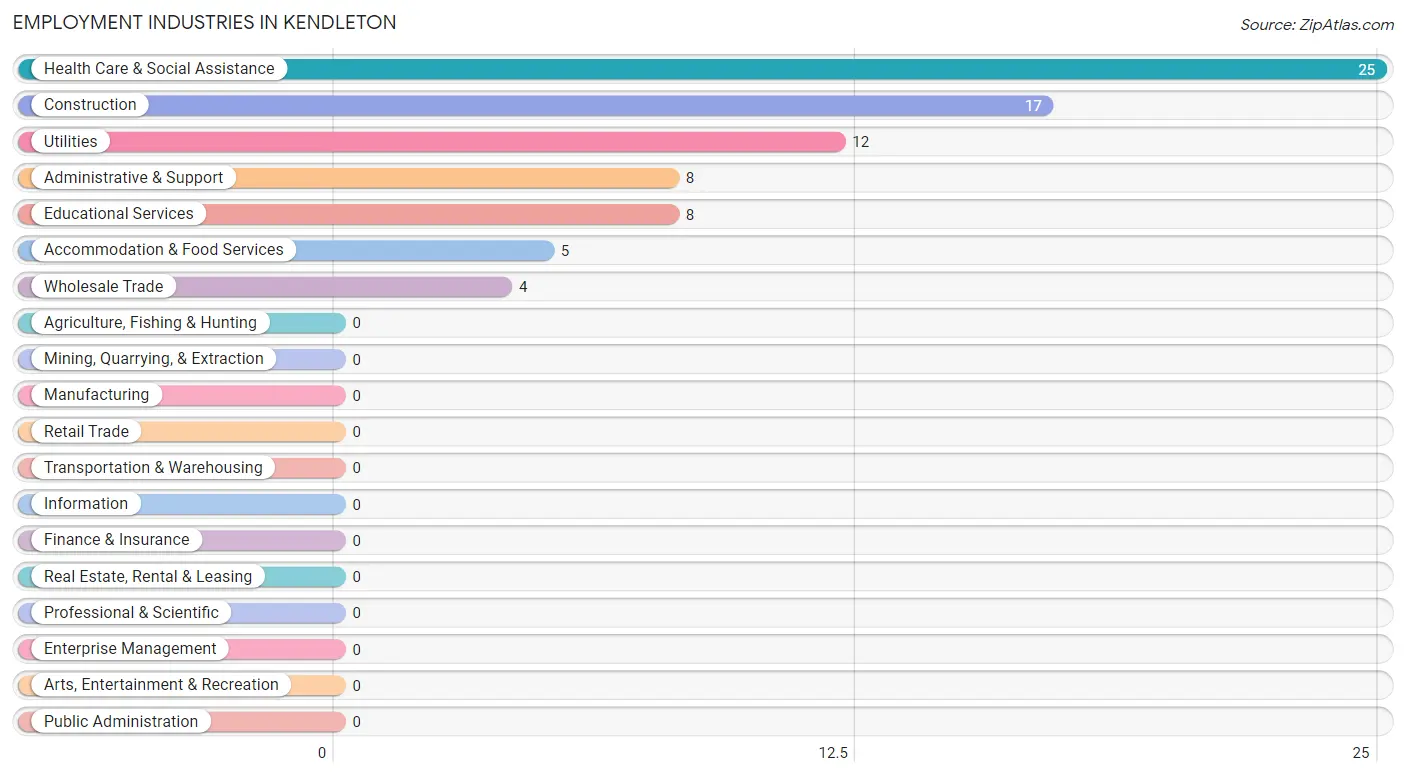
Employment Industries in Kendleton
The major employment industries in Kendleton include Health Care & Social Assistance (25 | 26.6%), Construction (17 | 18.1%), Utilities (12 | 12.8%), Administrative & Support (8 | 8.5%), and Educational Services (8 | 8.5%).
Employment Industries by Sex in Kendleton
The Kendleton industries that see more men than women are Construction (100.0%), Utilities (100.0%), and Educational Services (100.0%), whereas the industries that tend to have a higher number of women are Accommodation & Food Services (100.0%), Administrative & Support (62.5%), and Health Care & Social Assistance (60.0%).
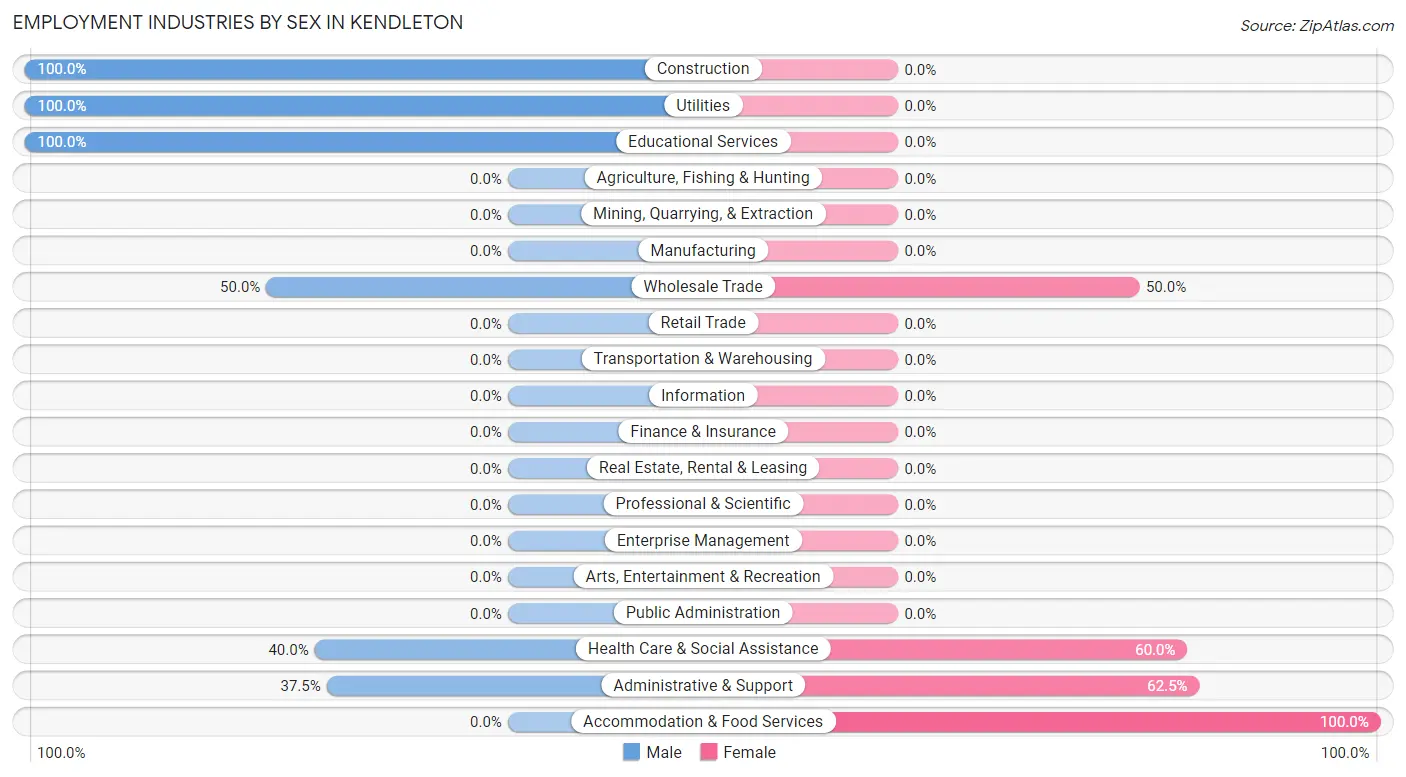
| Industry | Male | Female |
| Agriculture, Fishing & Hunting | 0 (0.0%) | 0 (0.0%) |
| Mining, Quarrying, & Extraction | 0 (0.0%) | 0 (0.0%) |
| Construction | 17 (100.0%) | 0 (0.0%) |
| Manufacturing | 0 (0.0%) | 0 (0.0%) |
| Wholesale Trade | 2 (50.0%) | 2 (50.0%) |
| Retail Trade | 0 (0.0%) | 0 (0.0%) |
| Transportation & Warehousing | 0 (0.0%) | 0 (0.0%) |
| Utilities | 12 (100.0%) | 0 (0.0%) |
| Information | 0 (0.0%) | 0 (0.0%) |
| Finance & Insurance | 0 (0.0%) | 0 (0.0%) |
| Real Estate, Rental & Leasing | 0 (0.0%) | 0 (0.0%) |
| Professional & Scientific | 0 (0.0%) | 0 (0.0%) |
| Enterprise Management | 0 (0.0%) | 0 (0.0%) |
| Administrative & Support | 3 (37.5%) | 5 (62.5%) |
| Educational Services | 8 (100.0%) | 0 (0.0%) |
| Health Care & Social Assistance | 10 (40.0%) | 15 (60.0%) |
| Arts, Entertainment & Recreation | 0 (0.0%) | 0 (0.0%) |
| Accommodation & Food Services | 0 (0.0%) | 5 (100.0%) |
| Public Administration | 0 (0.0%) | 0 (0.0%) |
| Total | 61 (64.9%) | 33 (35.1%) |
Education in Kendleton
School Enrollment in Kendleton
The most common levels of schooling among the 12 students in Kendleton are middle school (8 | 66.7%), and high school (4 | 33.3%).
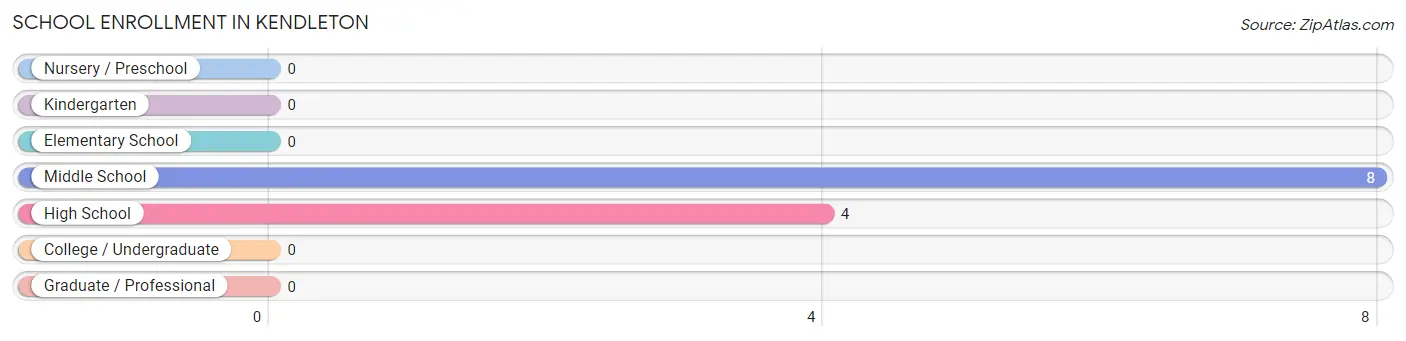
| School Level | # Students | % Students |
| Nursery / Preschool | 0 | 0.0% |
| Kindergarten | 0 | 0.0% |
| Elementary School | 0 | 0.0% |
| Middle School | 8 | 66.7% |
| High School | 4 | 33.3% |
| College / Undergraduate | 0 | 0.0% |
| Graduate / Professional | 0 | 0.0% |
| Total | 12 | 100.0% |
School Enrollment by Age by Funding Source in Kendleton
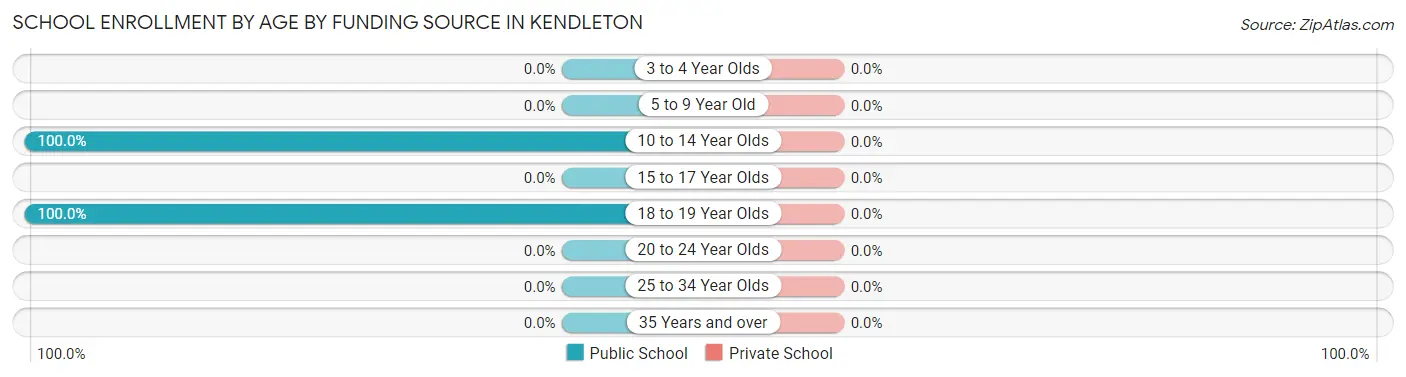
| Age Bracket | Public School | Private School |
| 3 to 4 Year Olds | 0 (0.0%) | 0 (0.0%) |
| 5 to 9 Year Old | 0 (0.0%) | 0 (0.0%) |
| 10 to 14 Year Olds | 8 (100.0%) | 0 (0.0%) |
| 15 to 17 Year Olds | 0 (0.0%) | 0 (0.0%) |
| 18 to 19 Year Olds | 4 (100.0%) | 0 (0.0%) |
| 20 to 24 Year Olds | 0 (0.0%) | 0 (0.0%) |
| 25 to 34 Year Olds | 0 (0.0%) | 0 (0.0%) |
| 35 Years and over | 0 (0.0%) | 0 (0.0%) |
| Total | 12 (100.0%) | 0 (0.0%) |
Educational Attainment by Field of Study in Kendleton
, and education (6 | 100.0%) are the most common fields of study among 6 individuals in Kendleton who have obtained a bachelor's degree or higher.
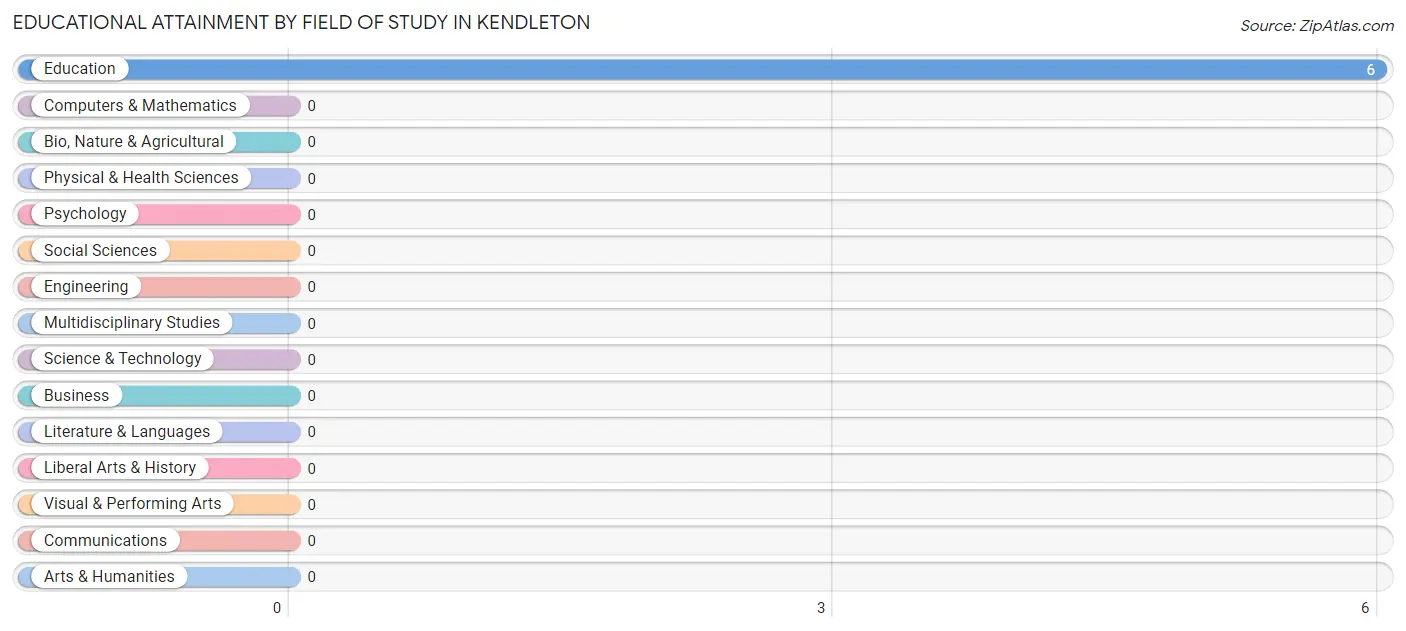
| Field of Study | # Graduates | % Graduates |
| Computers & Mathematics | 0 | 0.0% |
| Bio, Nature & Agricultural | 0 | 0.0% |
| Physical & Health Sciences | 0 | 0.0% |
| Psychology | 0 | 0.0% |
| Social Sciences | 0 | 0.0% |
| Engineering | 0 | 0.0% |
| Multidisciplinary Studies | 0 | 0.0% |
| Science & Technology | 0 | 0.0% |
| Business | 0 | 0.0% |
| Education | 6 | 100.0% |
| Literature & Languages | 0 | 0.0% |
| Liberal Arts & History | 0 | 0.0% |
| Visual & Performing Arts | 0 | 0.0% |
| Communications | 0 | 0.0% |
| Arts & Humanities | 0 | 0.0% |
| Total | 6 | 100.0% |
Transportation & Commute in Kendleton
Vehicle Availability by Sex in Kendleton
The most prevalent vehicle ownership categories in Kendleton are males with 1 vehicle (36, accounting for 59.0%) and females with 1 vehicle (22, making up 109.1%).
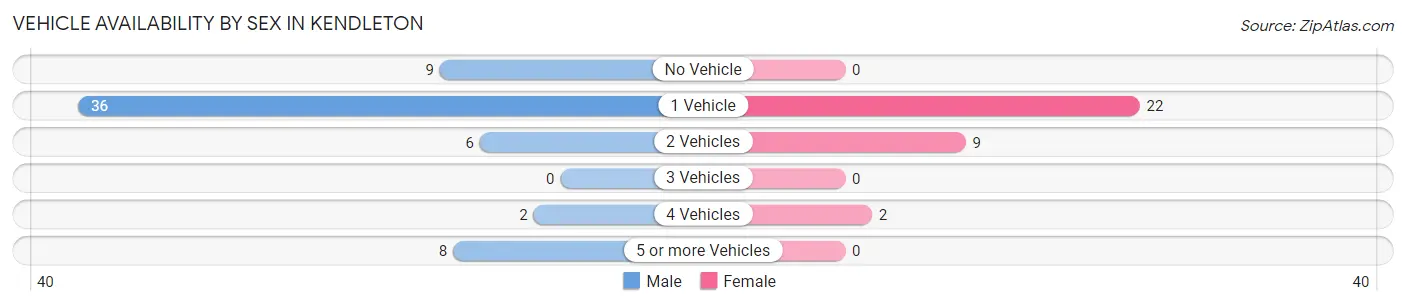
| Vehicles Available | Male | Female |
| No Vehicle | 9 (14.7%) | 0 (0.0%) |
| 1 Vehicle | 36 (59.0%) | 22 (66.7%) |
| 2 Vehicles | 6 (9.8%) | 9 (27.3%) |
| 3 Vehicles | 0 (0.0%) | 0 (0.0%) |
| 4 Vehicles | 2 (3.3%) | 2 (6.1%) |
| 5 or more Vehicles | 8 (13.1%) | 0 (0.0%) |
| Total | 61 (100.0%) | 33 (100.0%) |
Commute Time in Kendleton
The most frequently occuring commute durations in Kendleton are 30 to 34 minutes (20 commuters, 24.4%), 10 to 14 minutes (14 commuters, 17.1%), and 45 to 59 minutes (12 commuters, 14.6%).
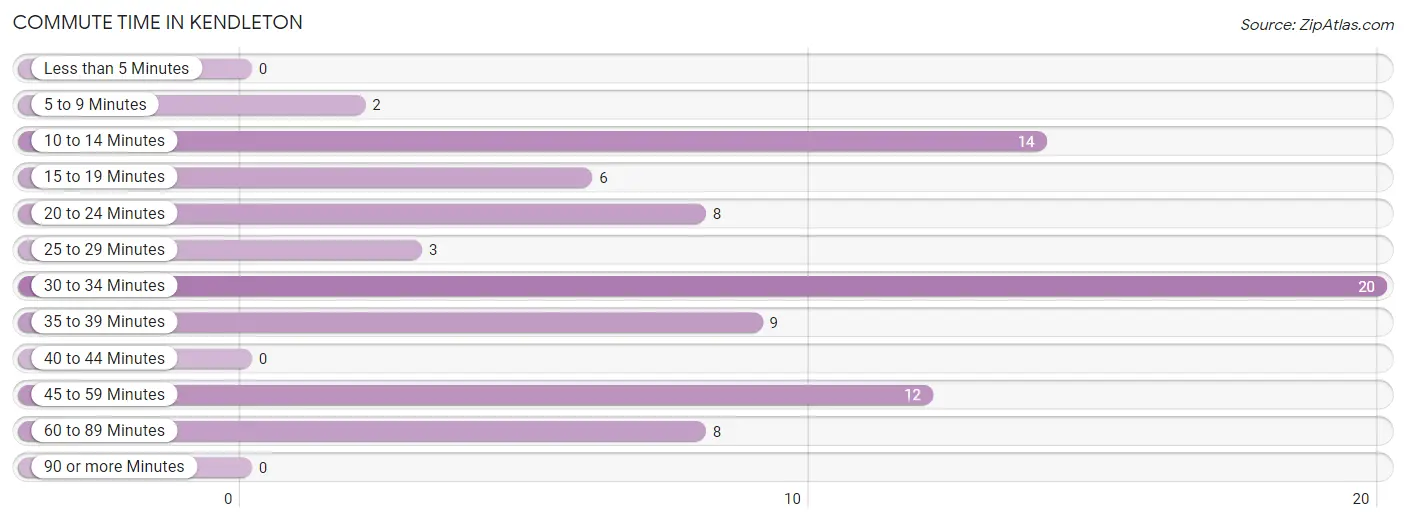
| Commute Time | # Commuters | % Commuters |
| Less than 5 Minutes | 0 | 0.0% |
| 5 to 9 Minutes | 2 | 2.4% |
| 10 to 14 Minutes | 14 | 17.1% |
| 15 to 19 Minutes | 6 | 7.3% |
| 20 to 24 Minutes | 8 | 9.8% |
| 25 to 29 Minutes | 3 | 3.7% |
| 30 to 34 Minutes | 20 | 24.4% |
| 35 to 39 Minutes | 9 | 11.0% |
| 40 to 44 Minutes | 0 | 0.0% |
| 45 to 59 Minutes | 12 | 14.6% |
| 60 to 89 Minutes | 8 | 9.8% |
| 90 or more Minutes | 0 | 0.0% |
Commute Time by Sex in Kendleton
The most common commute times in Kendleton are 30 to 34 minutes (9 commuters, 18.4%) for males and 30 to 34 minutes (11 commuters, 33.3%) for females.
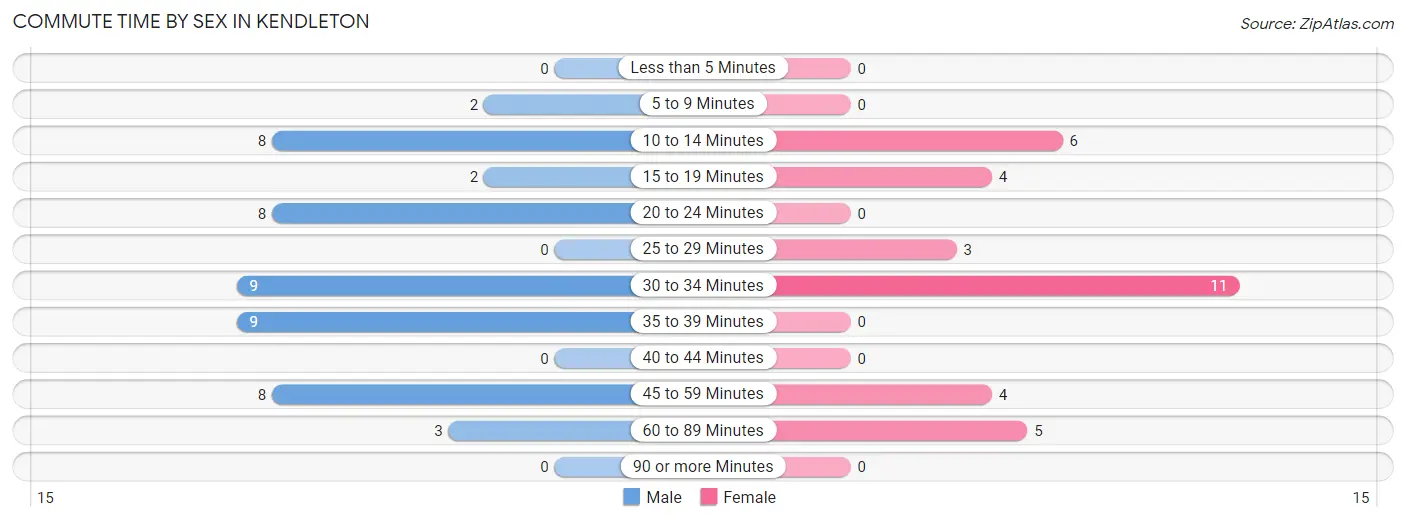
| Commute Time | Male | Female |
| Less than 5 Minutes | 0 (0.0%) | 0 (0.0%) |
| 5 to 9 Minutes | 2 (4.1%) | 0 (0.0%) |
| 10 to 14 Minutes | 8 (16.3%) | 6 (18.2%) |
| 15 to 19 Minutes | 2 (4.1%) | 4 (12.1%) |
| 20 to 24 Minutes | 8 (16.3%) | 0 (0.0%) |
| 25 to 29 Minutes | 0 (0.0%) | 3 (9.1%) |
| 30 to 34 Minutes | 9 (18.4%) | 11 (33.3%) |
| 35 to 39 Minutes | 9 (18.4%) | 0 (0.0%) |
| 40 to 44 Minutes | 0 (0.0%) | 0 (0.0%) |
| 45 to 59 Minutes | 8 (16.3%) | 4 (12.1%) |
| 60 to 89 Minutes | 3 (6.1%) | 5 (15.1%) |
| 90 or more Minutes | 0 (0.0%) | 0 (0.0%) |
Time of Departure to Work by Sex in Kendleton
The most frequent times of departure to work in Kendleton are 6:00 AM to 6:29 AM (15, 30.6%) for males and 12:00 PM to 3:59 PM (13, 39.4%) for females.
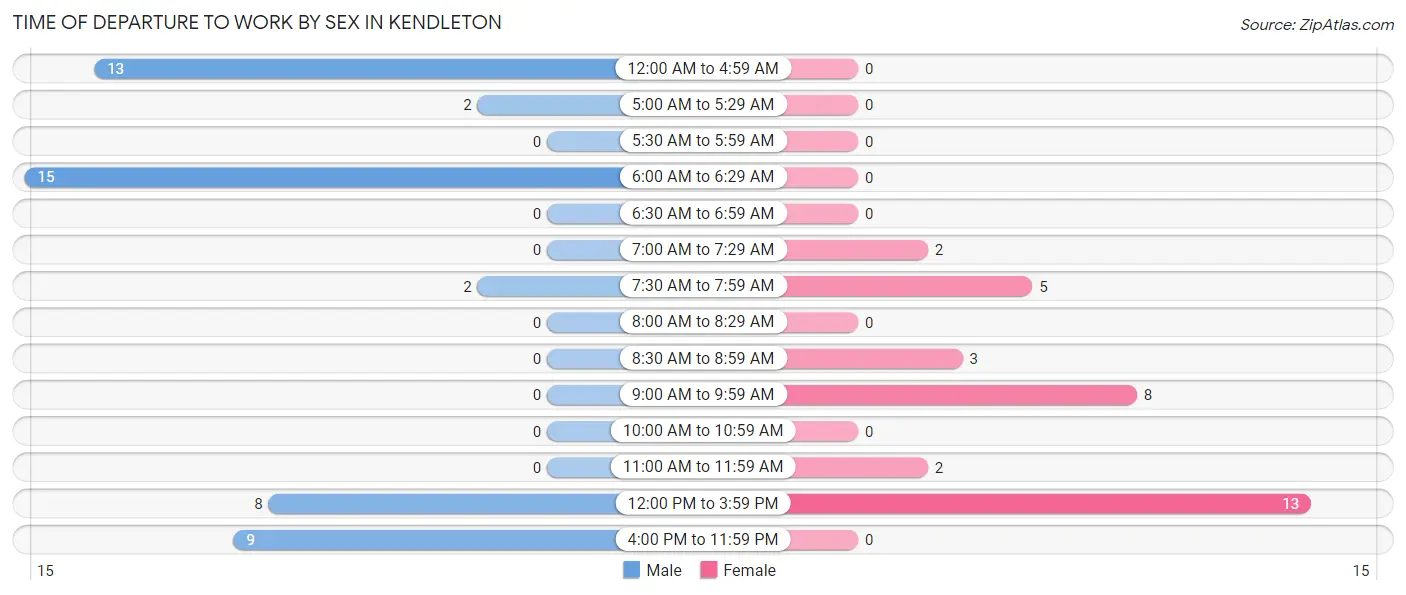
| Time of Departure | Male | Female |
| 12:00 AM to 4:59 AM | 13 (26.5%) | 0 (0.0%) |
| 5:00 AM to 5:29 AM | 2 (4.1%) | 0 (0.0%) |
| 5:30 AM to 5:59 AM | 0 (0.0%) | 0 (0.0%) |
| 6:00 AM to 6:29 AM | 15 (30.6%) | 0 (0.0%) |
| 6:30 AM to 6:59 AM | 0 (0.0%) | 0 (0.0%) |
| 7:00 AM to 7:29 AM | 0 (0.0%) | 2 (6.1%) |
| 7:30 AM to 7:59 AM | 2 (4.1%) | 5 (15.1%) |
| 8:00 AM to 8:29 AM | 0 (0.0%) | 0 (0.0%) |
| 8:30 AM to 8:59 AM | 0 (0.0%) | 3 (9.1%) |
| 9:00 AM to 9:59 AM | 0 (0.0%) | 8 (24.2%) |
| 10:00 AM to 10:59 AM | 0 (0.0%) | 0 (0.0%) |
| 11:00 AM to 11:59 AM | 0 (0.0%) | 2 (6.1%) |
| 12:00 PM to 3:59 PM | 8 (16.3%) | 13 (39.4%) |
| 4:00 PM to 11:59 PM | 9 (18.4%) | 0 (0.0%) |
| Total | 49 (100.0%) | 33 (100.0%) |
Housing Occupancy in Kendleton
Occupancy by Ownership in Kendleton
Of the total 123 dwellings in Kendleton, owner-occupied units account for 75 (61.0%), while renter-occupied units make up 48 (39.0%).
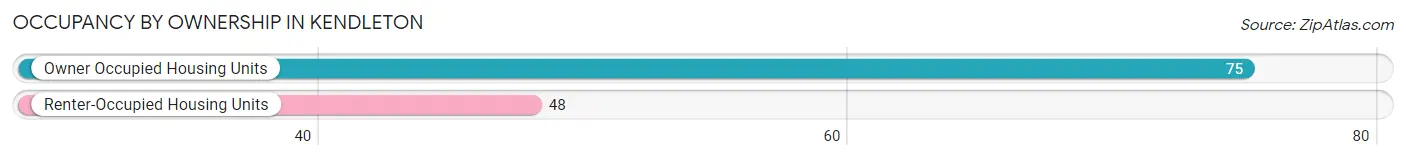
| Occupancy | # Housing Units | % Housing Units |
| Owner Occupied Housing Units | 75 | 61.0% |
| Renter-Occupied Housing Units | 48 | 39.0% |
| Total Occupied Housing Units | 123 | 100.0% |
Occupancy by Household Size in Kendleton
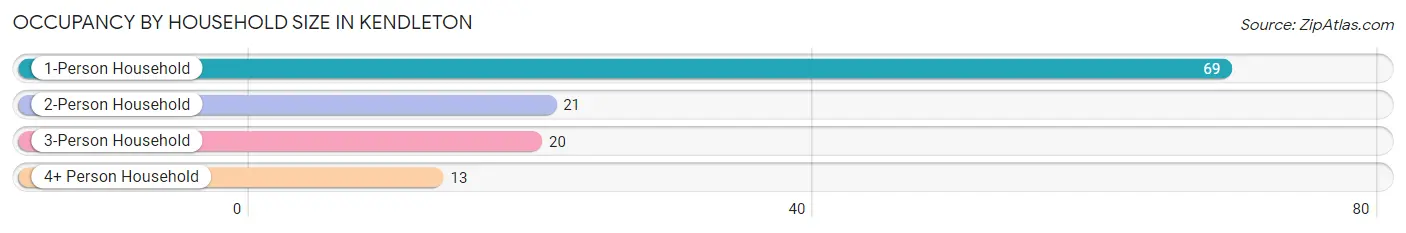
| Household Size | # Housing Units | % Housing Units |
| 1-Person Household | 69 | 56.1% |
| 2-Person Household | 21 | 17.1% |
| 3-Person Household | 20 | 16.3% |
| 4+ Person Household | 13 | 10.6% |
| Total Housing Units | 123 | 100.0% |
Occupancy by Ownership by Household Size in Kendleton
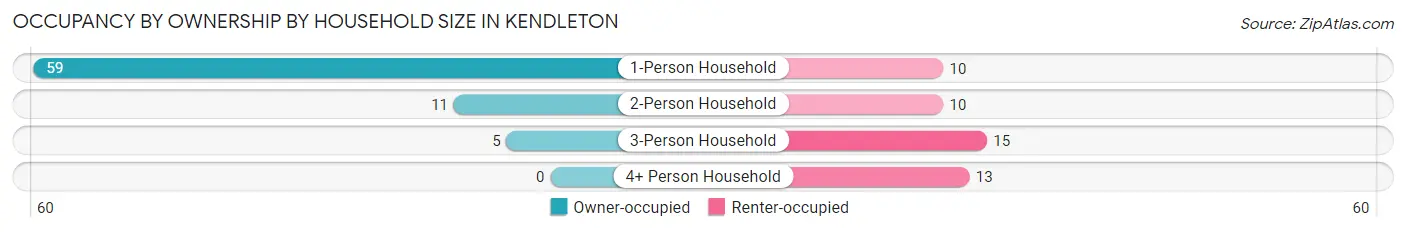
| Household Size | Owner-occupied | Renter-occupied |
| 1-Person Household | 59 (85.5%) | 10 (14.5%) |
| 2-Person Household | 11 (52.4%) | 10 (47.6%) |
| 3-Person Household | 5 (25.0%) | 15 (75.0%) |
| 4+ Person Household | 0 (0.0%) | 13 (100.0%) |
| Total Housing Units | 75 (61.0%) | 48 (39.0%) |
Occupancy by Educational Attainment in Kendleton
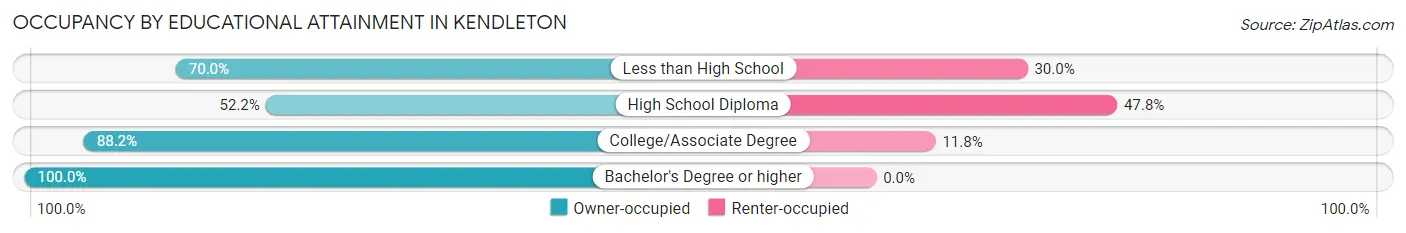
| Household Size | Owner-occupied | Renter-occupied |
| Less than High School | 7 (70.0%) | 3 (30.0%) |
| High School Diploma | 47 (52.2%) | 43 (47.8%) |
| College/Associate Degree | 15 (88.2%) | 2 (11.8%) |
| Bachelor's Degree or higher | 6 (100.0%) | 0 (0.0%) |
Occupancy by Age of Householder in Kendleton
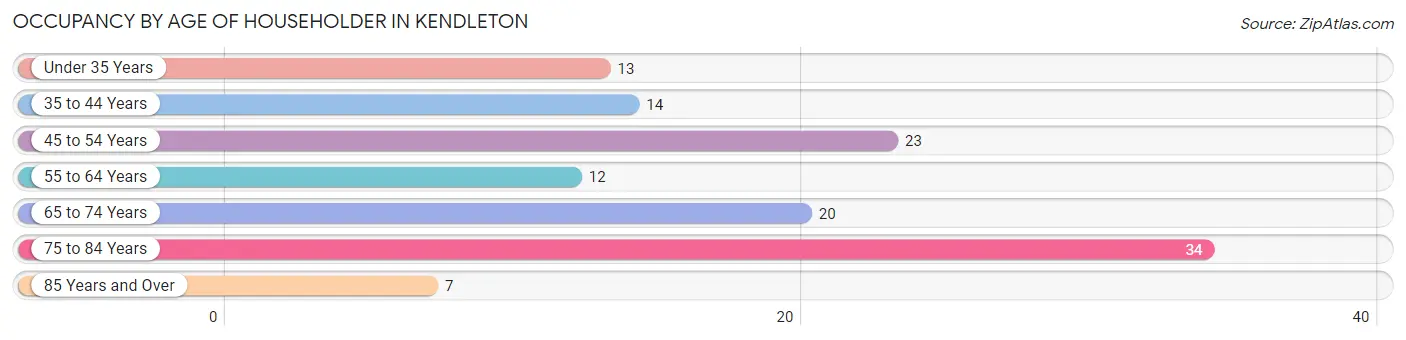
| Age Bracket | # Households | % Households |
| Under 35 Years | 13 | 10.6% |
| 35 to 44 Years | 14 | 11.4% |
| 45 to 54 Years | 23 | 18.7% |
| 55 to 64 Years | 12 | 9.8% |
| 65 to 74 Years | 20 | 16.3% |
| 75 to 84 Years | 34 | 27.6% |
| 85 Years and Over | 7 | 5.7% |
| Total | 123 | 100.0% |
Housing Finances in Kendleton
Median Income by Occupancy in Kendleton
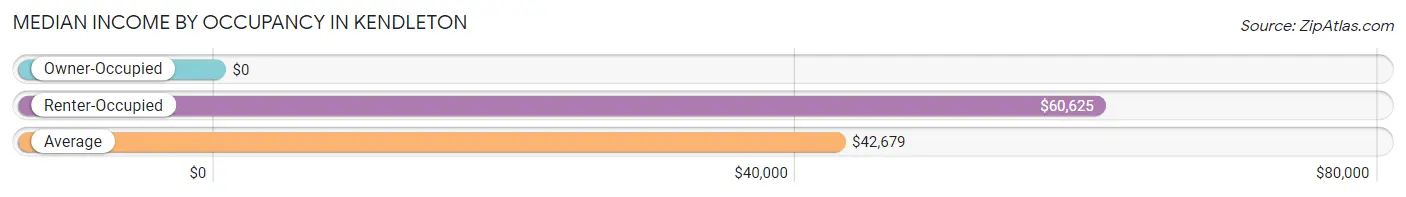
| Occupancy Type | # Households | Median Income |
| Owner-Occupied | 75 (61.0%) | $0 |
| Renter-Occupied | 48 (39.0%) | $60,625 |
| Average | 123 (100.0%) | $42,679 |
Occupancy by Householder Income Bracket in Kendleton
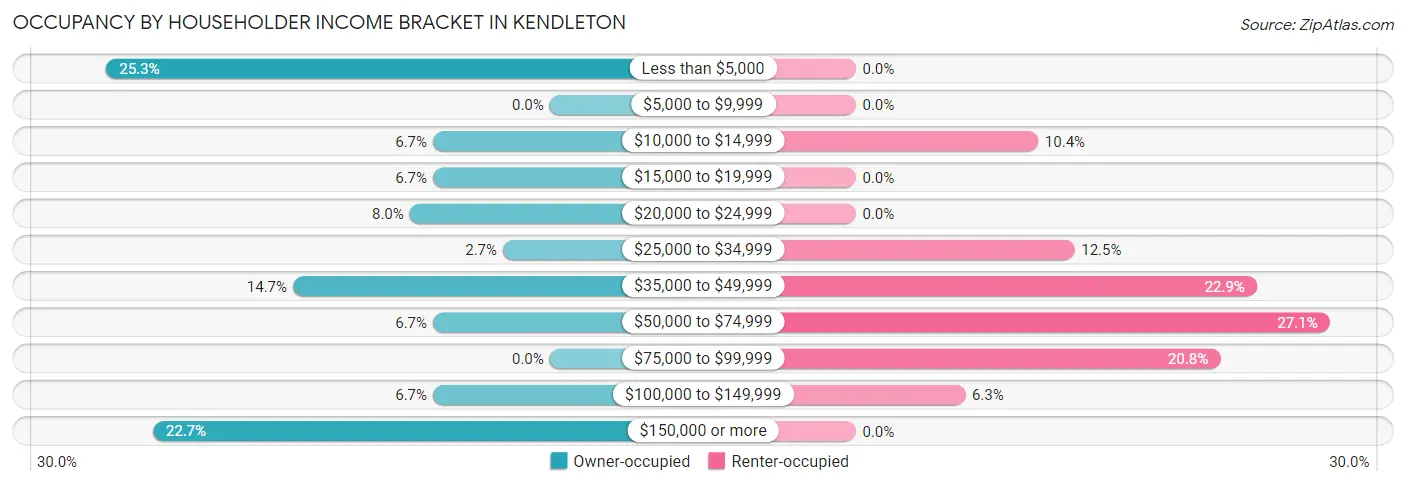
| Income Bracket | Owner-occupied | Renter-occupied |
| Less than $5,000 | 19 (25.3%) | 0 (0.0%) |
| $5,000 to $9,999 | 0 (0.0%) | 0 (0.0%) |
| $10,000 to $14,999 | 5 (6.7%) | 5 (10.4%) |
| $15,000 to $19,999 | 5 (6.7%) | 0 (0.0%) |
| $20,000 to $24,999 | 6 (8.0%) | 0 (0.0%) |
| $25,000 to $34,999 | 2 (2.7%) | 6 (12.5%) |
| $35,000 to $49,999 | 11 (14.7%) | 11 (22.9%) |
| $50,000 to $74,999 | 5 (6.7%) | 13 (27.1%) |
| $75,000 to $99,999 | 0 (0.0%) | 10 (20.8%) |
| $100,000 to $149,999 | 5 (6.7%) | 3 (6.2%) |
| $150,000 or more | 17 (22.7%) | 0 (0.0%) |
| Total | 75 (100.0%) | 48 (100.0%) |
Monthly Housing Cost Tiers in Kendleton
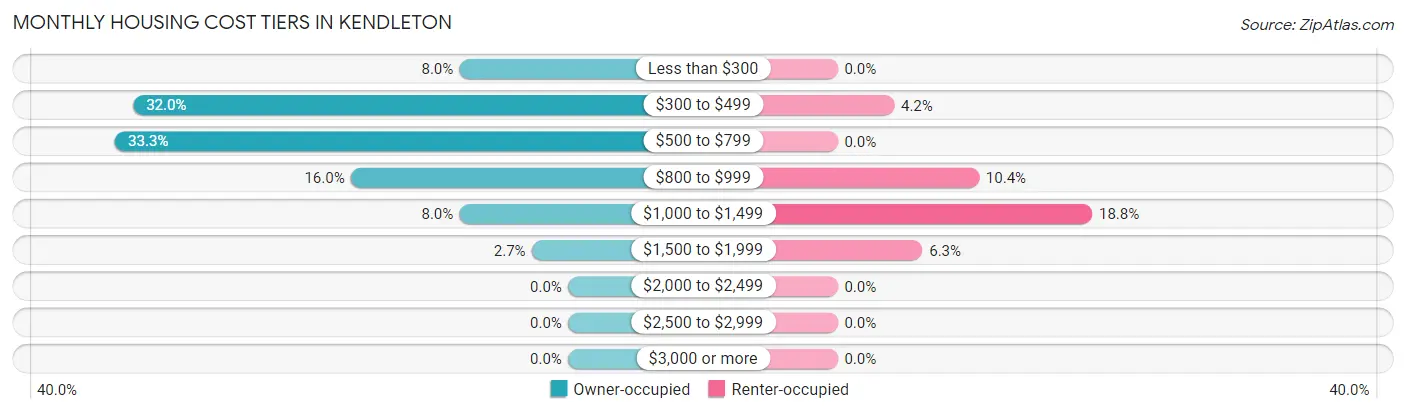
| Monthly Cost | Owner-occupied | Renter-occupied |
| Less than $300 | 6 (8.0%) | 0 (0.0%) |
| $300 to $499 | 24 (32.0%) | 2 (4.2%) |
| $500 to $799 | 25 (33.3%) | 0 (0.0%) |
| $800 to $999 | 12 (16.0%) | 5 (10.4%) |
| $1,000 to $1,499 | 6 (8.0%) | 9 (18.8%) |
| $1,500 to $1,999 | 2 (2.7%) | 3 (6.2%) |
| $2,000 to $2,499 | 0 (0.0%) | 0 (0.0%) |
| $2,500 to $2,999 | 0 (0.0%) | 0 (0.0%) |
| $3,000 or more | 0 (0.0%) | 0 (0.0%) |
| Total | 75 (100.0%) | 48 (100.0%) |
Physical Housing Characteristics in Kendleton
Housing Structures in Kendleton
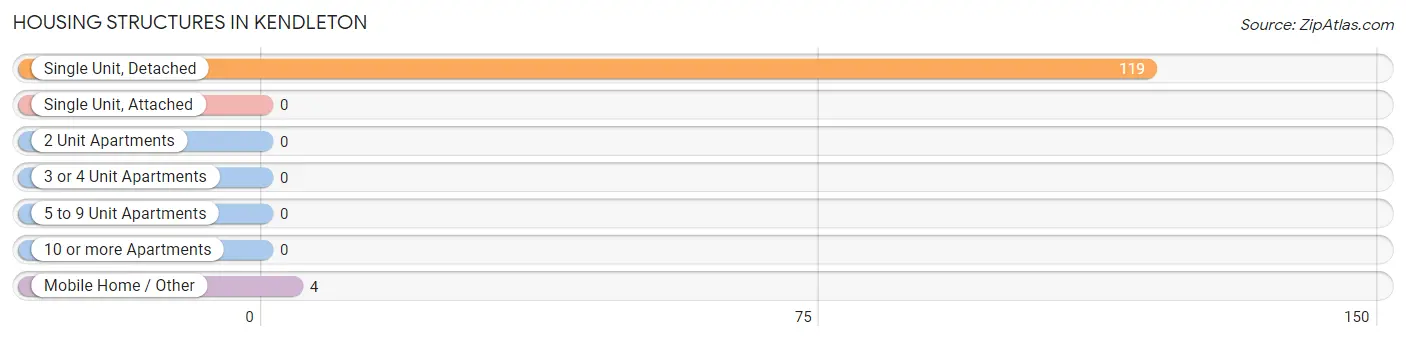
| Structure Type | # Housing Units | % Housing Units |
| Single Unit, Detached | 119 | 96.8% |
| Single Unit, Attached | 0 | 0.0% |
| 2 Unit Apartments | 0 | 0.0% |
| 3 or 4 Unit Apartments | 0 | 0.0% |
| 5 to 9 Unit Apartments | 0 | 0.0% |
| 10 or more Apartments | 0 | 0.0% |
| Mobile Home / Other | 4 | 3.3% |
| Total | 123 | 100.0% |
Housing Structures by Occupancy in Kendleton
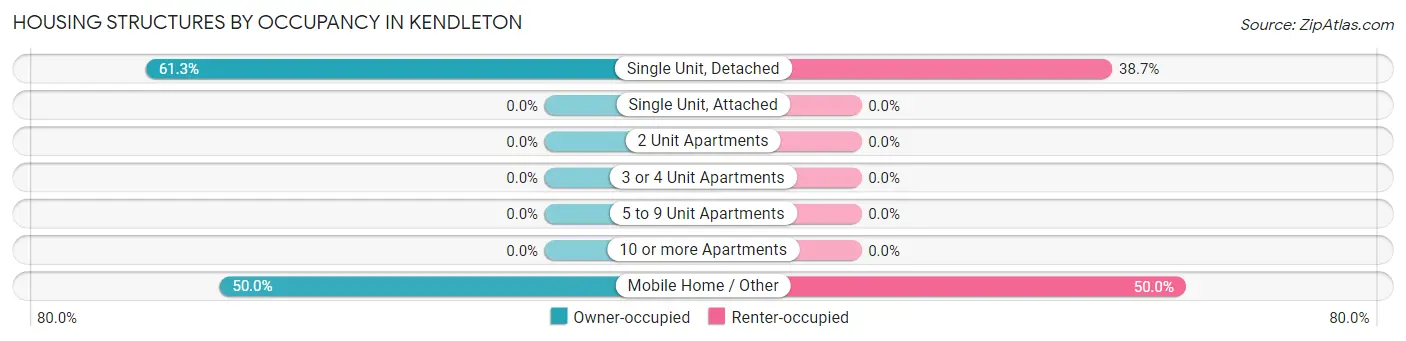
| Structure Type | Owner-occupied | Renter-occupied |
| Single Unit, Detached | 73 (61.3%) | 46 (38.7%) |
| Single Unit, Attached | 0 (0.0%) | 0 (0.0%) |
| 2 Unit Apartments | 0 (0.0%) | 0 (0.0%) |
| 3 or 4 Unit Apartments | 0 (0.0%) | 0 (0.0%) |
| 5 to 9 Unit Apartments | 0 (0.0%) | 0 (0.0%) |
| 10 or more Apartments | 0 (0.0%) | 0 (0.0%) |
| Mobile Home / Other | 2 (50.0%) | 2 (50.0%) |
| Total | 75 (61.0%) | 48 (39.0%) |
Housing Structures by Number of Rooms in Kendleton

| Number of Rooms | Owner-occupied | Renter-occupied |
| 1 Room | 0 (0.0%) | 0 (0.0%) |
| 2 or 3 Rooms | 0 (0.0%) | 0 (0.0%) |
| 4 or 5 Rooms | 39 (52.0%) | 12 (25.0%) |
| 6 or 7 Rooms | 31 (41.3%) | 30 (62.5%) |
| 8 or more Rooms | 5 (6.7%) | 6 (12.5%) |
| Total | 75 (100.0%) | 48 (100.0%) |
Housing Structure by Heating Type in Kendleton
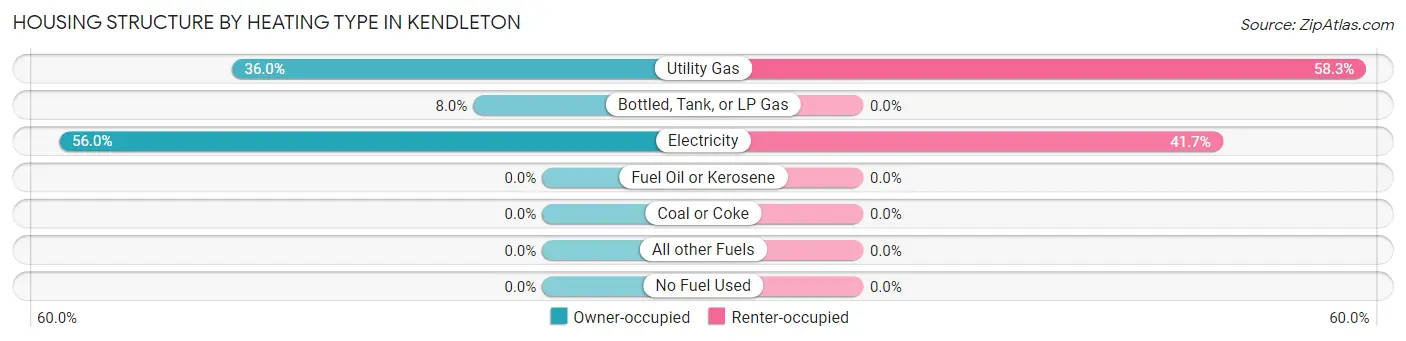
| Heating Type | Owner-occupied | Renter-occupied |
| Utility Gas | 27 (36.0%) | 28 (58.3%) |
| Bottled, Tank, or LP Gas | 6 (8.0%) | 0 (0.0%) |
| Electricity | 42 (56.0%) | 20 (41.7%) |
| Fuel Oil or Kerosene | 0 (0.0%) | 0 (0.0%) |
| Coal or Coke | 0 (0.0%) | 0 (0.0%) |
| All other Fuels | 0 (0.0%) | 0 (0.0%) |
| No Fuel Used | 0 (0.0%) | 0 (0.0%) |
| Total | 75 (100.0%) | 48 (100.0%) |
Household Vehicle Usage in Kendleton
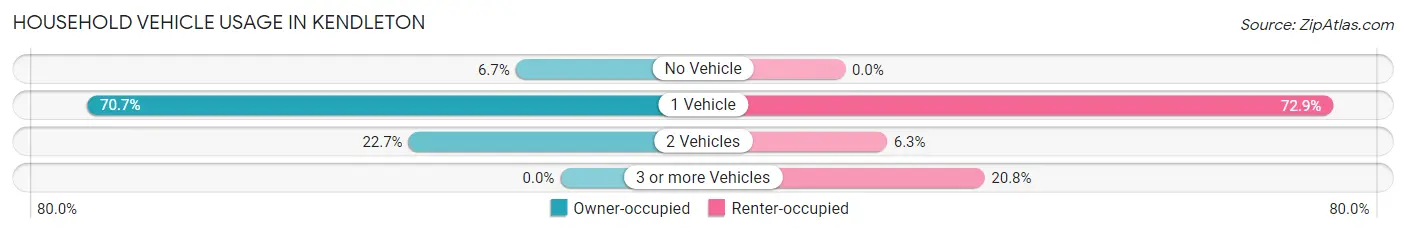
| Vehicles per Household | Owner-occupied | Renter-occupied |
| No Vehicle | 5 (6.7%) | 0 (0.0%) |
| 1 Vehicle | 53 (70.7%) | 35 (72.9%) |
| 2 Vehicles | 17 (22.7%) | 3 (6.2%) |
| 3 or more Vehicles | 0 (0.0%) | 10 (20.8%) |
| Total | 75 (100.0%) | 48 (100.0%) |
Real Estate & Mortgages in Kendleton
Real Estate and Mortgage Overview in Kendleton
| Characteristic | Without Mortgage | With Mortgage |
| Housing Units | 55 | 20 |
| Median Property Value | $100,800 | $107,100 |
| Median Household Income | - | - |
| Monthly Housing Costs | $484 | $0 |
| Real Estate Taxes | $1,115 | $0 |
Property Value by Mortgage Status in Kendleton
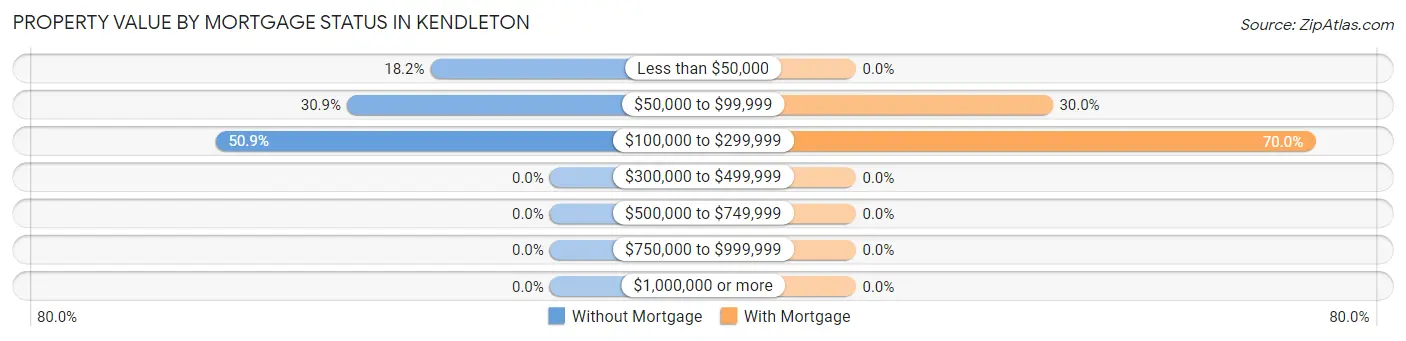
| Property Value | Without Mortgage | With Mortgage |
| Less than $50,000 | 10 (18.2%) | 0 (0.0%) |
| $50,000 to $99,999 | 17 (30.9%) | 6 (30.0%) |
| $100,000 to $299,999 | 28 (50.9%) | 14 (70.0%) |
| $300,000 to $499,999 | 0 (0.0%) | 0 (0.0%) |
| $500,000 to $749,999 | 0 (0.0%) | 0 (0.0%) |
| $750,000 to $999,999 | 0 (0.0%) | 0 (0.0%) |
| $1,000,000 or more | 0 (0.0%) | 0 (0.0%) |
| Total | 55 (100.0%) | 20 (100.0%) |
Household Income by Mortgage Status in Kendleton
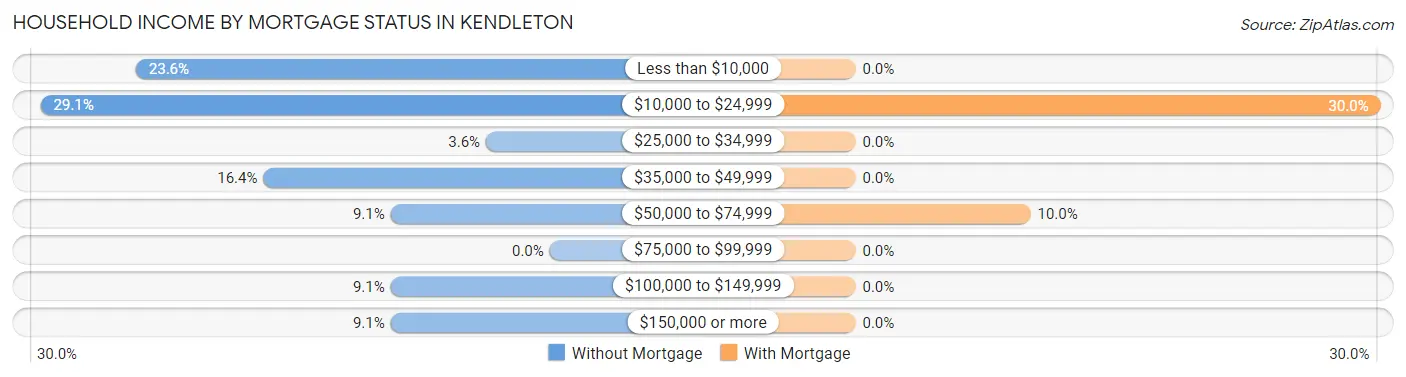
| Household Income | Without Mortgage | With Mortgage |
| Less than $10,000 | 13 (23.6%) | 0 (0.0%) |
| $10,000 to $24,999 | 16 (29.1%) | 6 (30.0%) |
| $25,000 to $34,999 | 2 (3.6%) | 0 (0.0%) |
| $35,000 to $49,999 | 9 (16.4%) | 0 (0.0%) |
| $50,000 to $74,999 | 5 (9.1%) | 2 (10.0%) |
| $75,000 to $99,999 | 0 (0.0%) | 0 (0.0%) |
| $100,000 to $149,999 | 5 (9.1%) | 0 (0.0%) |
| $150,000 or more | 5 (9.1%) | 0 (0.0%) |
| Total | 55 (100.0%) | 20 (100.0%) |
Property Value to Household Income Ratio in Kendleton

| Value-to-Income Ratio | Without Mortgage | With Mortgage |
| Less than 2.0x | 19 (34.5%) | 0 (0.0%) |
| 2.0x to 2.9x | 7 (12.7%) | 12 (60.0%) |
| 3.0x to 3.9x | 5 (9.1%) | 0 (0.0%) |
| 4.0x or more | 11 (20.0%) | 2 (10.0%) |
| Total | 55 (100.0%) | 20 (100.0%) |
Real Estate Taxes by Mortgage Status in Kendleton
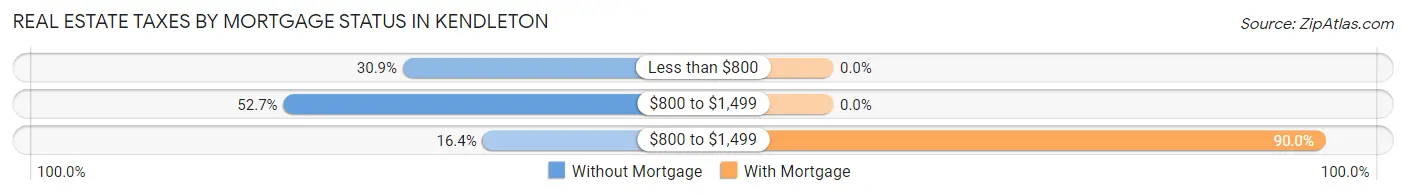
| Property Taxes | Without Mortgage | With Mortgage |
| Less than $800 | 17 (30.9%) | 0 (0.0%) |
| $800 to $1,499 | 29 (52.7%) | 0 (0.0%) |
| $800 to $1,499 | 9 (16.4%) | 18 (90.0%) |
| Total | 55 (100.0%) | 20 (100.0%) |
Health & Disability in Kendleton
Health Insurance Coverage by Age in Kendleton
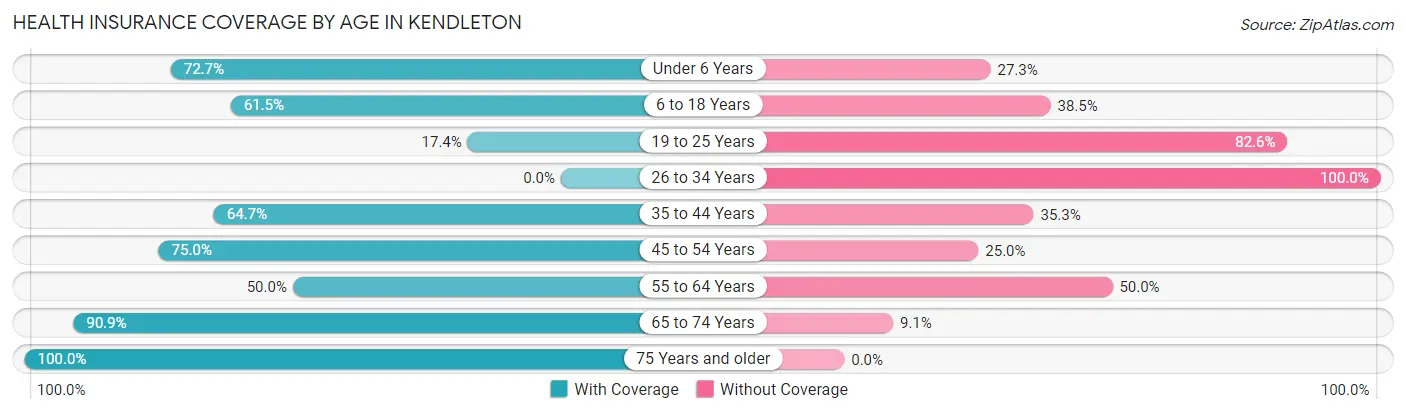
| Age Bracket | With Coverage | Without Coverage |
| Under 6 Years | 8 (72.7%) | 3 (27.3%) |
| 6 to 18 Years | 8 (61.5%) | 5 (38.5%) |
| 19 to 25 Years | 4 (17.4%) | 19 (82.6%) |
| 26 to 34 Years | 0 (0.0%) | 15 (100.0%) |
| 35 to 44 Years | 22 (64.7%) | 12 (35.3%) |
| 45 to 54 Years | 24 (75.0%) | 8 (25.0%) |
| 55 to 64 Years | 14 (50.0%) | 14 (50.0%) |
| 65 to 74 Years | 20 (90.9%) | 2 (9.1%) |
| 75 Years and older | 61 (100.0%) | 0 (0.0%) |
| Total | 161 (67.4%) | 78 (32.6%) |
Health Insurance Coverage by Citizenship Status in Kendleton
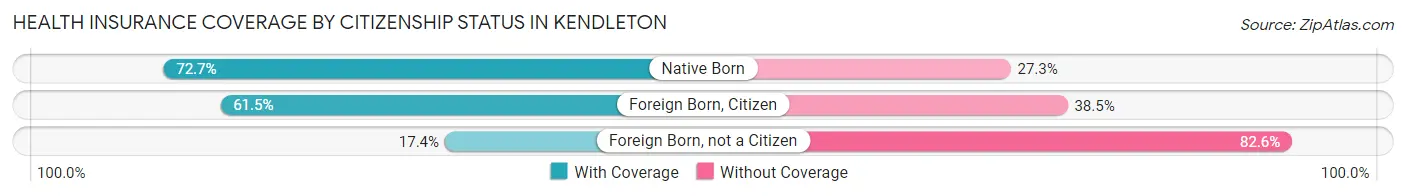
| Citizenship Status | With Coverage | Without Coverage |
| Native Born | 8 (72.7%) | 3 (27.3%) |
| Foreign Born, Citizen | 8 (61.5%) | 5 (38.5%) |
| Foreign Born, not a Citizen | 4 (17.4%) | 19 (82.6%) |
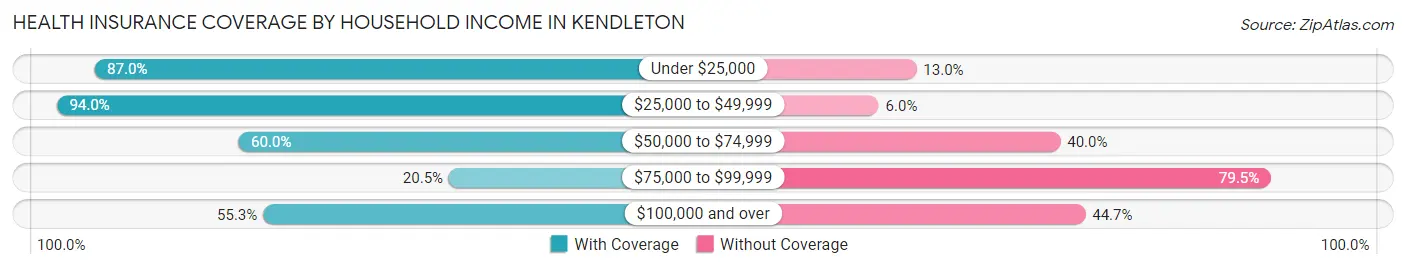
Health Insurance Coverage by Household Income in Kendleton
| Household Income | With Coverage | Without Coverage |
| Under $25,000 | 40 (87.0%) | 6 (13.0%) |
| $25,000 to $49,999 | 63 (94.0%) | 4 (6.0%) |
| $50,000 to $74,999 | 24 (60.0%) | 16 (40.0%) |
| $75,000 to $99,999 | 8 (20.5%) | 31 (79.5%) |
| $100,000 and over | 26 (55.3%) | 21 (44.7%) |
Public vs Private Health Insurance Coverage by Age in Kendleton
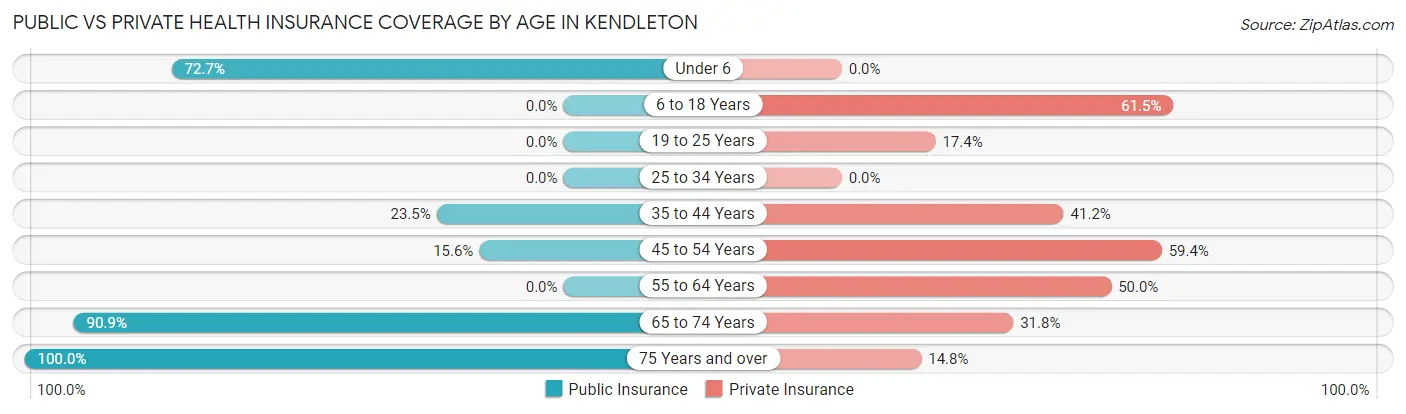
| Age Bracket | Public Insurance | Private Insurance |
| Under 6 | 8 (72.7%) | 0 (0.0%) |
| 6 to 18 Years | 0 (0.0%) | 8 (61.5%) |
| 19 to 25 Years | 0 (0.0%) | 4 (17.4%) |
| 25 to 34 Years | 0 (0.0%) | 0 (0.0%) |
| 35 to 44 Years | 8 (23.5%) | 14 (41.2%) |
| 45 to 54 Years | 5 (15.6%) | 19 (59.4%) |
| 55 to 64 Years | 0 (0.0%) | 14 (50.0%) |
| 65 to 74 Years | 20 (90.9%) | 7 (31.8%) |
| 75 Years and over | 61 (100.0%) | 9 (14.7%) |
| Total | 102 (42.7%) | 75 (31.4%) |
Disability Status by Sex by Age in Kendleton
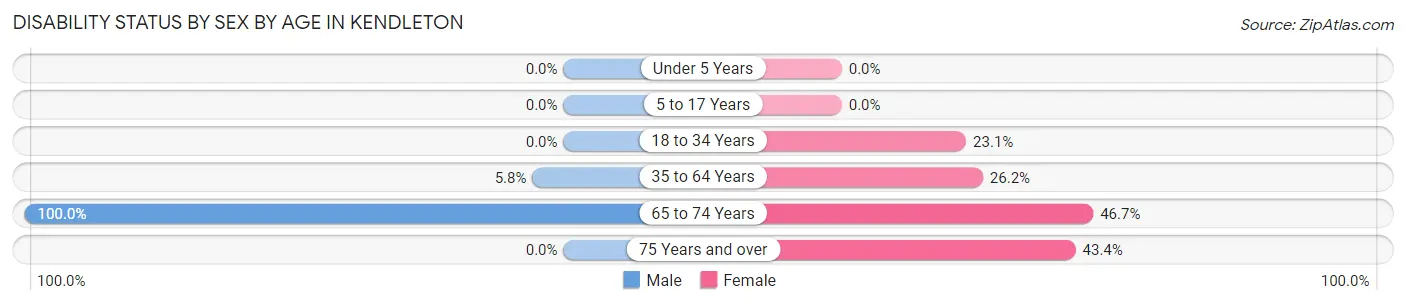
| Age Bracket | Male | Female |
| Under 5 Years | 0 (0.0%) | 0 (0.0%) |
| 5 to 17 Years | 0 (0.0%) | 0 (0.0%) |
| 18 to 34 Years | 0 (0.0%) | 3 (23.1%) |
| 35 to 64 Years | 3 (5.8%) | 11 (26.2%) |
| 65 to 74 Years | 7 (100.0%) | 7 (46.7%) |
| 75 Years and over | 0 (0.0%) | 23 (43.4%) |
Disability Class by Sex by Age in Kendleton
Disability Class: Hearing Difficulty
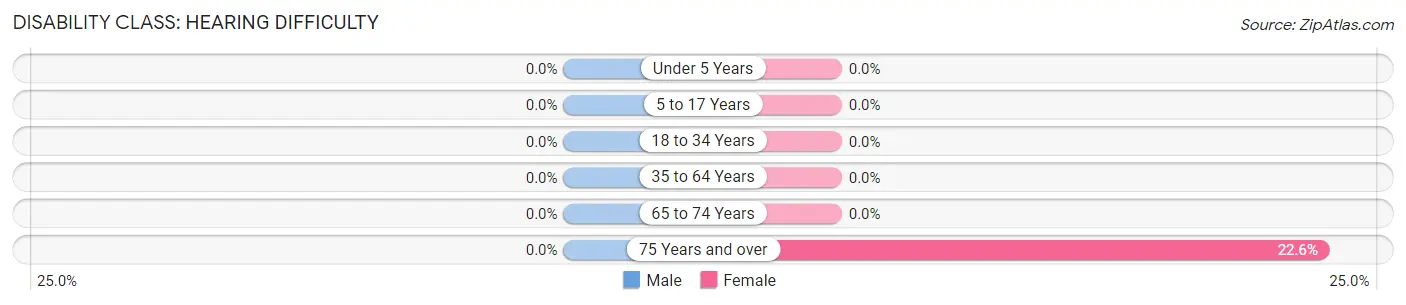
| Age Bracket | Male | Female |
| Under 5 Years | 0 (0.0%) | 0 (0.0%) |
| 5 to 17 Years | 0 (0.0%) | 0 (0.0%) |
| 18 to 34 Years | 0 (0.0%) | 0 (0.0%) |
| 35 to 64 Years | 0 (0.0%) | 0 (0.0%) |
| 65 to 74 Years | 0 (0.0%) | 0 (0.0%) |
| 75 Years and over | 0 (0.0%) | 12 (22.6%) |
Disability Class: Vision Difficulty
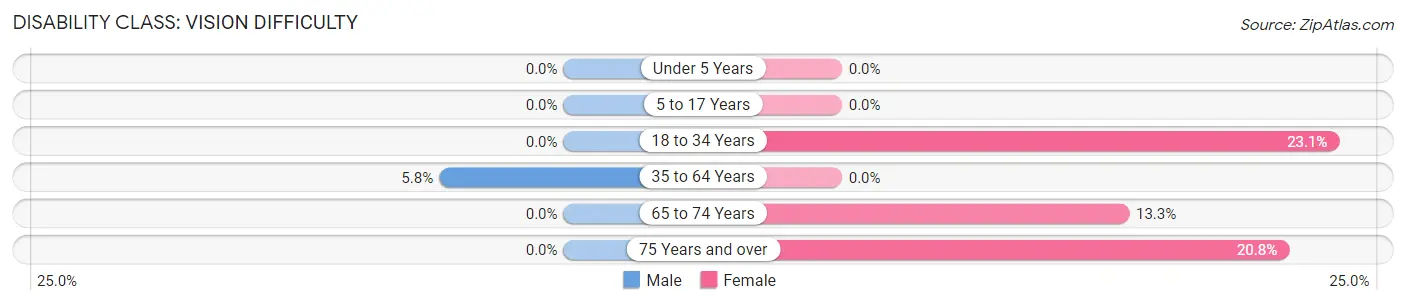
| Age Bracket | Male | Female |
| Under 5 Years | 0 (0.0%) | 0 (0.0%) |
| 5 to 17 Years | 0 (0.0%) | 0 (0.0%) |
| 18 to 34 Years | 0 (0.0%) | 3 (23.1%) |
| 35 to 64 Years | 3 (5.8%) | 0 (0.0%) |
| 65 to 74 Years | 0 (0.0%) | 2 (13.3%) |
| 75 Years and over | 0 (0.0%) | 11 (20.7%) |
Disability Class: Cognitive Difficulty
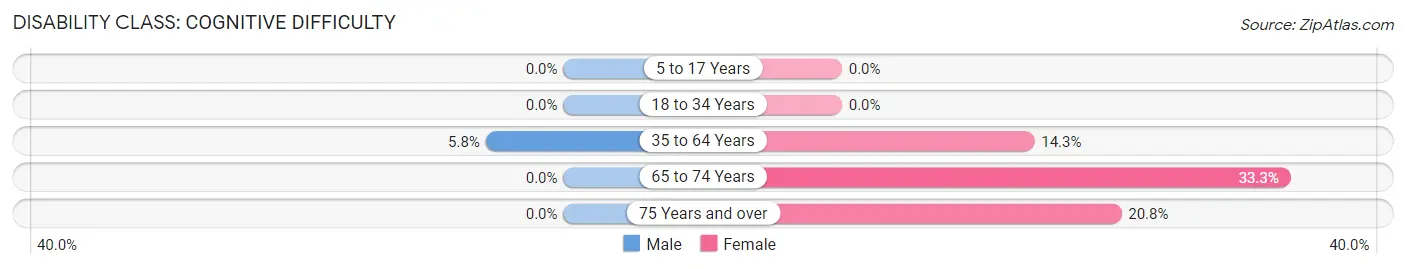
| Age Bracket | Male | Female |
| 5 to 17 Years | 0 (0.0%) | 0 (0.0%) |
| 18 to 34 Years | 0 (0.0%) | 0 (0.0%) |
| 35 to 64 Years | 3 (5.8%) | 6 (14.3%) |
| 65 to 74 Years | 0 (0.0%) | 5 (33.3%) |
| 75 Years and over | 0 (0.0%) | 11 (20.7%) |
Disability Class: Ambulatory Difficulty
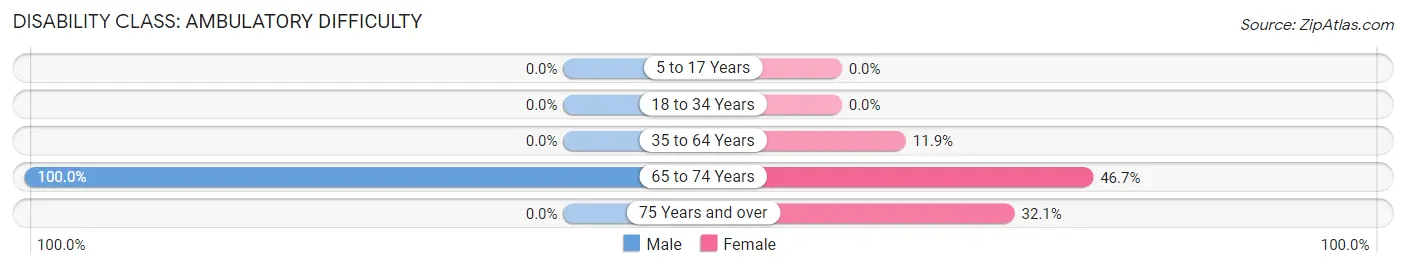
| Age Bracket | Male | Female |
| 5 to 17 Years | 0 (0.0%) | 0 (0.0%) |
| 18 to 34 Years | 0 (0.0%) | 0 (0.0%) |
| 35 to 64 Years | 0 (0.0%) | 5 (11.9%) |
| 65 to 74 Years | 7 (100.0%) | 7 (46.7%) |
| 75 Years and over | 0 (0.0%) | 17 (32.1%) |
Disability Class: Self-Care Difficulty
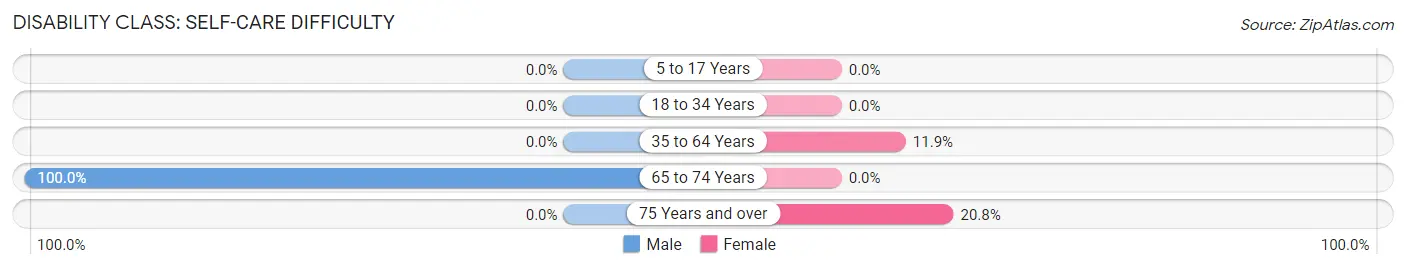
| Age Bracket | Male | Female |
| 5 to 17 Years | 0 (0.0%) | 0 (0.0%) |
| 18 to 34 Years | 0 (0.0%) | 0 (0.0%) |
| 35 to 64 Years | 0 (0.0%) | 5 (11.9%) |
| 65 to 74 Years | 7 (100.0%) | 0 (0.0%) |
| 75 Years and over | 0 (0.0%) | 11 (20.7%) |
Technology Access in Kendleton
Computing Device Access in Kendleton
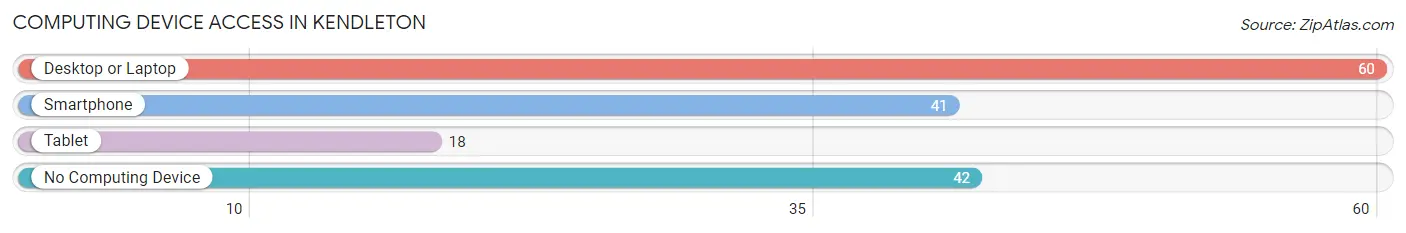
| Device Type | # Households | % Households |
| Desktop or Laptop | 60 | 48.8% |
| Smartphone | 41 | 33.3% |
| Tablet | 18 | 14.6% |
| No Computing Device | 42 | 34.2% |
| Total | 123 | 100.0% |
Internet Access in Kendleton
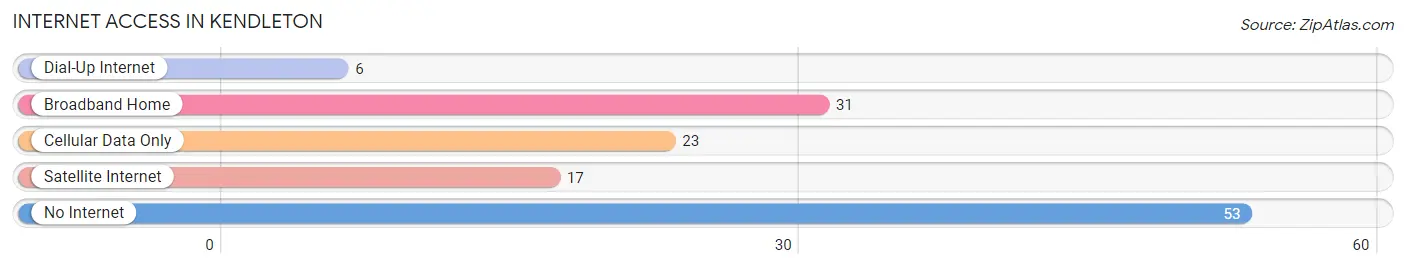
| Internet Type | # Households | % Households |
| Dial-Up Internet | 6 | 4.9% |
| Broadband Home | 31 | 25.2% |
| Cellular Data Only | 23 | 18.7% |
| Satellite Internet | 17 | 13.8% |
| No Internet | 53 | 43.1% |
| Total | 123 | 100.0% |
Kendleton Summary
Kendleton, Texas is a small town located in Fort Bend County, Texas. It is situated about 25 miles southwest of Houston and is part of the Houston–The Woodlands–Sugar Land metropolitan area. The town was founded in 1883 and was named after the Kendleton family, who were among the first settlers in the area.
History
Kendleton was founded in 1883 by the Kendleton family, who were among the first settlers in the area. The town was originally known as Kendleton Station, as it was a stop on the Gulf, Colorado and Santa Fe Railway. The town was officially incorporated in 1891 and was named after the Kendleton family.
In the early 1900s, the town was a thriving agricultural center, with cotton, corn, and other crops being grown in the area. The town also had a number of businesses, including a general store, a blacksmith shop, and a hotel.
In the 1920s, the town began to decline as the railroad stopped running through the area. The population decreased and many of the businesses closed. In the 1940s, the town was revitalized when oil was discovered in the area. The population increased and new businesses opened.
Geography
Kendleton is located in Fort Bend County, Texas, about 25 miles southwest of Houston. The town is situated on the banks of the Brazos River and is part of the Houston–The Woodlands–Sugar Land metropolitan area. The town has a total area of 1.2 square miles, all of which is land.
Economy
Kendleton’s economy is largely based on agriculture and oil production. The town is home to several farms, which produce cotton, corn, and other crops. The town also has several oil wells, which produce oil and natural gas.
In addition to agriculture and oil production, the town also has a number of small businesses, including restaurants, convenience stores, and auto repair shops. The town also has a number of churches and a post office.
Demographics
As of the 2010 census, Kendleton had a population of 1,072. The racial makeup of the town was 79.2% African American, 17.2% White, 0.7% Native American, 0.3% Asian, and 2.6% from other races. The median household income was $25,938 and the median family income was $30,625.
Conclusion
Kendleton, Texas is a small town located in Fort Bend County, Texas. It was founded in 1883 and was named after the Kendleton family, who were among the first settlers in the area. The town’s economy is largely based on agriculture and oil production. As of the 2010 census, Kendleton had a population of 1,072. The racial makeup of the town was 79.2% African American, 17.2% White, 0.7% Native American, 0.3% Asian, and 2.6% from other races. The median household income was $25,938 and the median family income was $30,625.
Common Questions
What is Per Capita Income in Kendleton?
Per Capita income in Kendleton is $50,121.
What is the Median Family Income in Kendleton?
Median Family Income in Kendleton is $61,250.
What is the Median Household income in Kendleton?
Median Household Income in Kendleton is $42,679.
What is Inequality or Gini Index in Kendleton?
Inequality or Gini Index in Kendleton is 0.67.
What is the Total Population of Kendleton?
Total Population of Kendleton is 239.
What is the Total Male Population of Kendleton?
Total Male Population of Kendleton is 104.
What is the Total Female Population of Kendleton?
Total Female Population of Kendleton is 135.
What is the Ratio of Males per 100 Females in Kendleton?
There are 77.04 Males per 100 Females in Kendleton.
What is the Ratio of Females per 100 Males in Kendleton?
There are 129.81 Females per 100 Males in Kendleton.
What is the Median Population Age in Kendleton?
Median Population Age in Kendleton is 51.4 Years.
What is the Average Family Size in Kendleton
Average Family Size in Kendleton is 2.8 People.
What is the Average Household Size in Kendleton
Average Household Size in Kendleton is 1.9 People.
How Large is the Labor Force in Kendleton?
There are 94 People in the Labor Forcein in Kendleton.
What is the Percentage of People in the Labor Force in Kendleton?
43.7% of People are in the Labor Force in Kendleton.