Kemp, TX Map & Demographics
Kemp Map
Kemp Overview
$26,810
PER CAPITA INCOME
$79,837
AVG FAMILY INCOME
$55,650
AVG HOUSEHOLD INCOME
14.3%
WAGE / INCOME GAP [ % ]
85.7¢/ $1
WAGE / INCOME GAP [ $ ]
$5,600
FAMILY INCOME DEFICIT
0.41
INEQUALITY / GINI INDEX
1,419
TOTAL POPULATION
656
MALE POPULATION
763
FEMALE POPULATION
85.98
MALES / 100 FEMALES
116.31
FEMALES / 100 MALES
40.3
MEDIAN AGE
3.4
AVG FAMILY SIZE
2.5
AVG HOUSEHOLD SIZE
650
LABOR FORCE [ PEOPLE ]
57.3%
PERCENT IN LABOR FORCE
4.2%
UNEMPLOYMENT RATE
Kemp Zip Codes
Income in Kemp
Income Overview in Kemp
Per Capita Income in Kemp is $26,810, while median incomes of families and households are $79,837 and $55,650 respectively.
| Characteristic | Number | Measure |
| Per Capita Income | 1,419 | $26,810 |
| Median Family Income | 319 | $79,837 |
| Mean Family Income | 319 | $86,648 |
| Median Household Income | 511 | $55,650 |
| Mean Household Income | 511 | $69,538 |
| Income Deficit | 319 | $5,600 |
| Wage / Income Gap (%) | 1,419 | 14.31% |
| Wage / Income Gap ($) | 1,419 | 85.69¢ per $1 |
| Gini / Inequality Index | 1,419 | 0.41 |
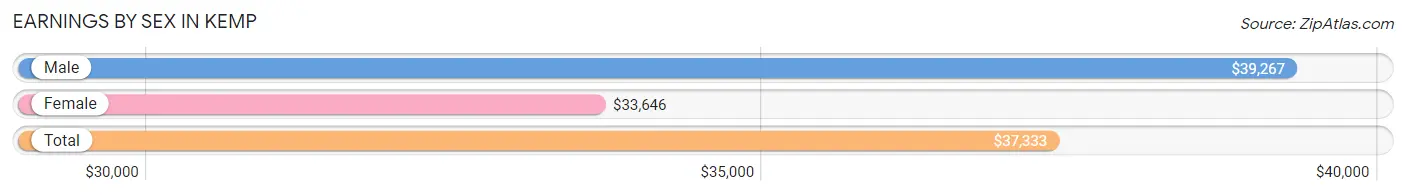
Earnings by Sex in Kemp
Average Earnings in Kemp are $37,333, $39,267 for men and $33,646 for women, a difference of 14.3%.
| Sex | Number | Average Earnings |
| Male | 387 (58.8%) | $39,267 |
| Female | 271 (41.2%) | $33,646 |
| Total | 658 (100.0%) | $37,333 |
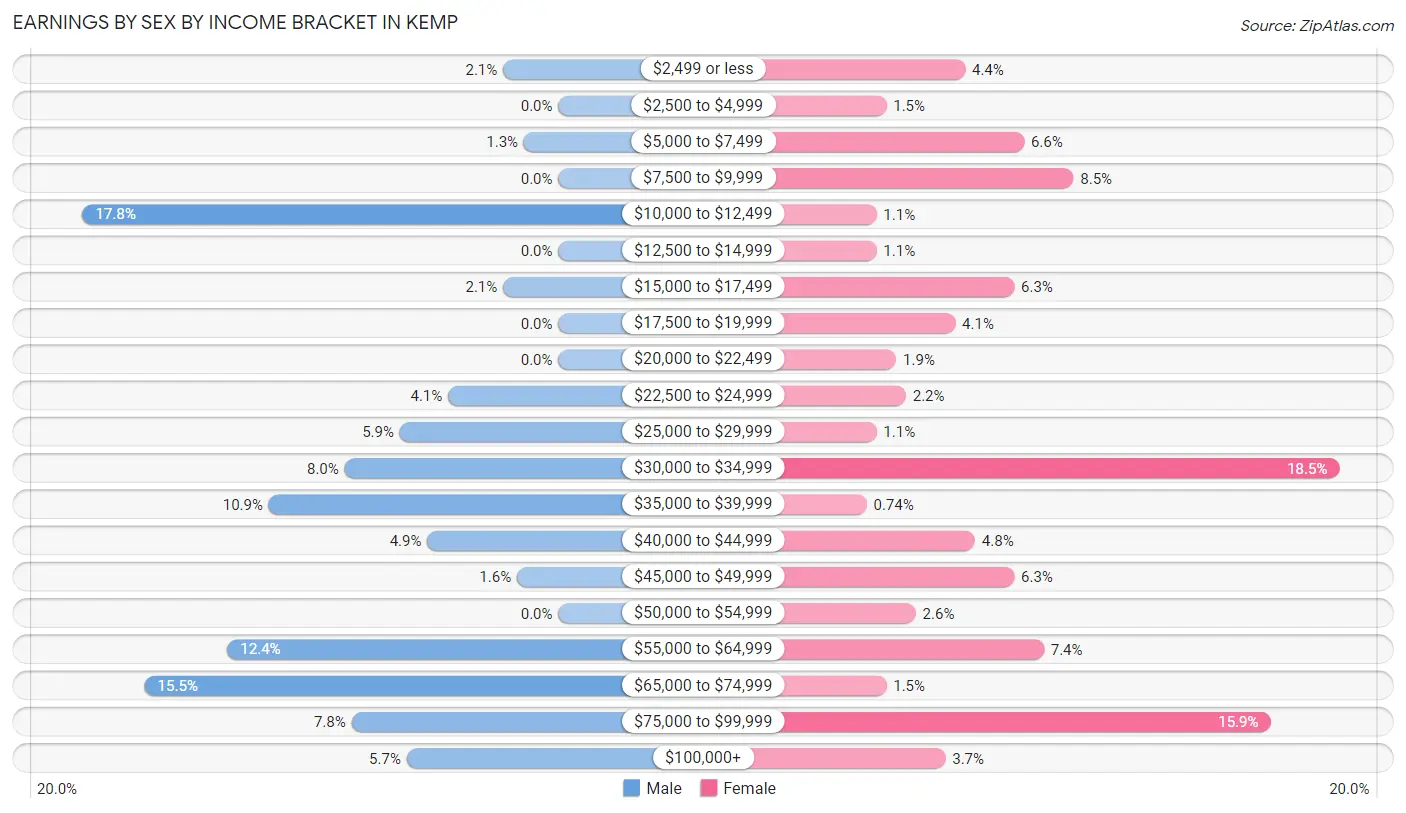
Earnings by Sex by Income Bracket in Kemp
The most common earnings brackets in Kemp are $10,000 to $12,499 for men (69 | 17.8%) and $30,000 to $34,999 for women (50 | 18.4%).
| Income | Male | Female |
| $2,499 or less | 8 (2.1%) | 12 (4.4%) |
| $2,500 to $4,999 | 0 (0.0%) | 4 (1.5%) |
| $5,000 to $7,499 | 5 (1.3%) | 18 (6.6%) |
| $7,500 to $9,999 | 0 (0.0%) | 23 (8.5%) |
| $10,000 to $12,499 | 69 (17.8%) | 3 (1.1%) |
| $12,500 to $14,999 | 0 (0.0%) | 3 (1.1%) |
| $15,000 to $17,499 | 8 (2.1%) | 17 (6.3%) |
| $17,500 to $19,999 | 0 (0.0%) | 11 (4.1%) |
| $20,000 to $22,499 | 0 (0.0%) | 5 (1.8%) |
| $22,500 to $24,999 | 16 (4.1%) | 6 (2.2%) |
| $25,000 to $29,999 | 23 (5.9%) | 3 (1.1%) |
| $30,000 to $34,999 | 31 (8.0%) | 50 (18.4%) |
| $35,000 to $39,999 | 42 (10.8%) | 2 (0.7%) |
| $40,000 to $44,999 | 19 (4.9%) | 13 (4.8%) |
| $45,000 to $49,999 | 6 (1.5%) | 17 (6.3%) |
| $50,000 to $54,999 | 0 (0.0%) | 7 (2.6%) |
| $55,000 to $64,999 | 48 (12.4%) | 20 (7.4%) |
| $65,000 to $74,999 | 60 (15.5%) | 4 (1.5%) |
| $75,000 to $99,999 | 30 (7.7%) | 43 (15.9%) |
| $100,000+ | 22 (5.7%) | 10 (3.7%) |
| Total | 387 (100.0%) | 271 (100.0%) |
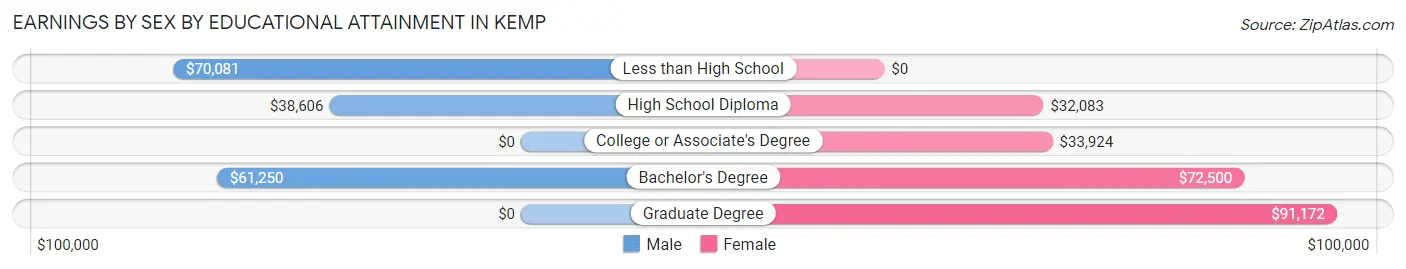
Earnings by Sex by Educational Attainment in Kemp
Average earnings in Kemp are $44,375 for men and $34,028 for women, a difference of 23.3%. Men with an educational attainment of less than high school enjoy the highest average annual earnings of $70,081, while those with high school diploma education earn the least with $38,606. Women with an educational attainment of graduate degree earn the most with the average annual earnings of $91,172, while those with high school diploma education have the smallest earnings of $32,083.
| Educational Attainment | Male Income | Female Income |
| Less than High School | $70,081 | $0 |
| High School Diploma | $38,606 | $32,083 |
| College or Associate's Degree | - | - |
| Bachelor's Degree | $61,250 | $72,500 |
| Graduate Degree | - | - |
| Total | $44,375 | $34,028 |
Family Income in Kemp
Family Income Brackets in Kemp
According to the Kemp family income data, there are 93 families falling into the $75,000 to $99,999 income range, which is the most common income bracket and makes up 29.1% of all families. Conversely, the less than $10,000 income bracket is the least frequent group with only 6 families (1.9%) belonging to this category.
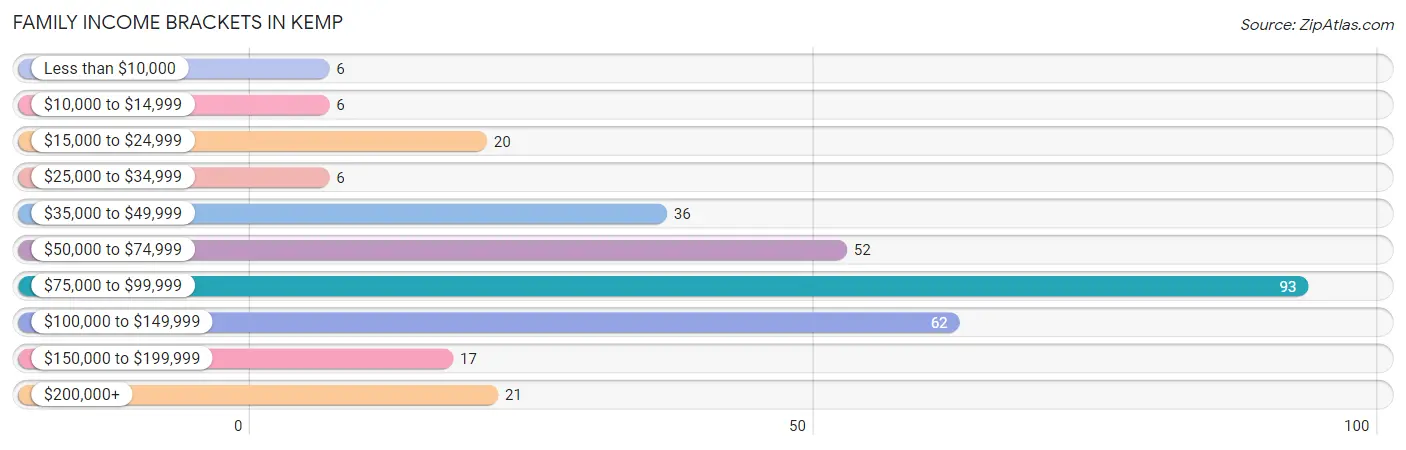
| Income Bracket | # Families | % Families |
| Less than $10,000 | 6 | 1.9% |
| $10,000 to $14,999 | 6 | 1.9% |
| $15,000 to $24,999 | 20 | 6.3% |
| $25,000 to $34,999 | 6 | 1.9% |
| $35,000 to $49,999 | 36 | 11.3% |
| $50,000 to $74,999 | 52 | 16.3% |
| $75,000 to $99,999 | 93 | 29.2% |
| $100,000 to $149,999 | 62 | 19.4% |
| $150,000 to $199,999 | 17 | 5.3% |
| $200,000+ | 21 | 6.6% |
Family Income by Famaliy Size in Kemp
2-person families (109 | 34.2%) account for the highest median family income in Kemp with $83,984 per family, while 2-person families (109 | 34.2%) have the highest median income of $41,992 per family member.
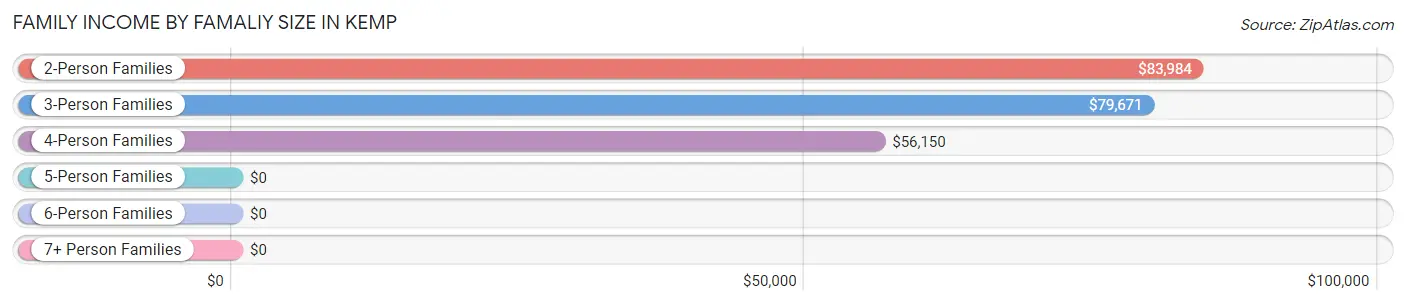
| Income Bracket | # Families | Median Income |
| 2-Person Families | 109 (34.2%) | $83,984 |
| 3-Person Families | 85 (26.7%) | $79,671 |
| 4-Person Families | 93 (29.1%) | $56,150 |
| 5-Person Families | 15 (4.7%) | $0 |
| 6-Person Families | 11 (3.5%) | $0 |
| 7+ Person Families | 6 (1.9%) | $0 |
| Total | 319 (100.0%) | $79,837 |
Family Income by Number of Earners in Kemp
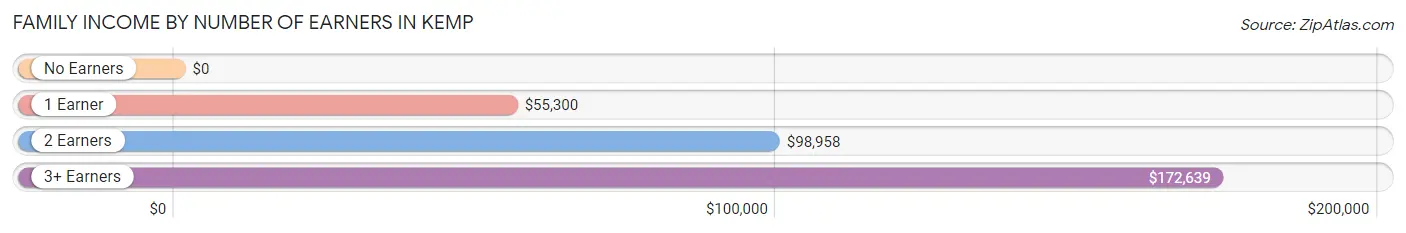
| Number of Earners | # Families | Median Income |
| No Earners | 26 (8.2%) | $0 |
| 1 Earner | 126 (39.5%) | $55,300 |
| 2 Earners | 138 (43.3%) | $98,958 |
| 3+ Earners | 29 (9.1%) | $172,639 |
| Total | 319 (100.0%) | $79,837 |
Household Income in Kemp
Household Income Brackets in Kemp
With 113 households falling in the category, the $75,000 to $99,999 income range is the most frequent in Kemp, accounting for 22.1% of all households. In contrast, only 21 households (4.1%) fall into the $200,000+ income bracket, making it the least populous group.
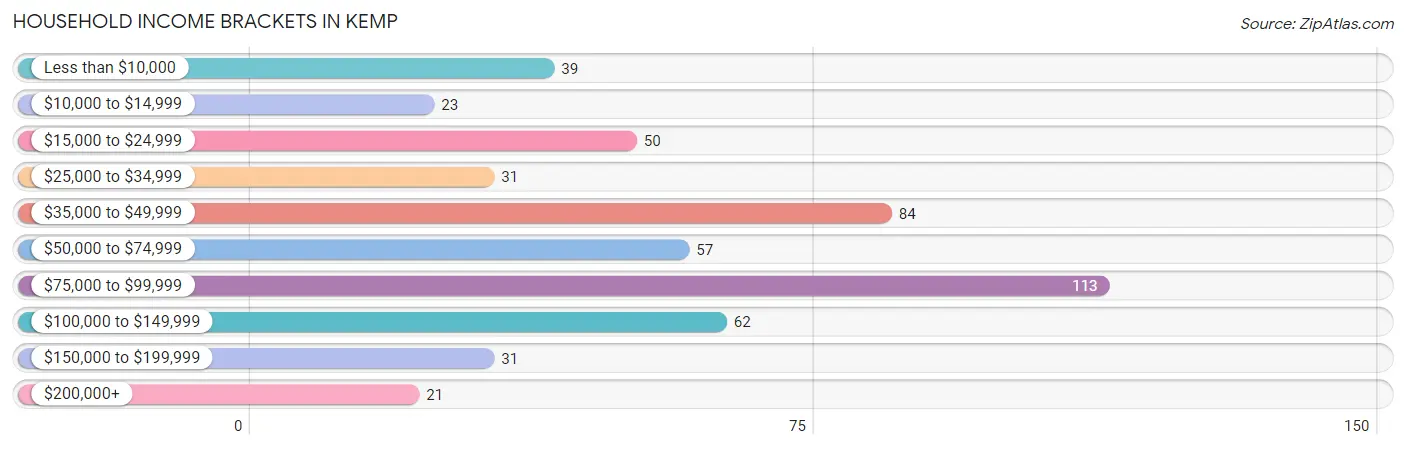
| Income Bracket | # Households | % Households |
| Less than $10,000 | 39 | 7.6% |
| $10,000 to $14,999 | 23 | 4.5% |
| $15,000 to $24,999 | 50 | 9.8% |
| $25,000 to $34,999 | 31 | 6.1% |
| $35,000 to $49,999 | 84 | 16.4% |
| $50,000 to $74,999 | 57 | 11.2% |
| $75,000 to $99,999 | 113 | 22.1% |
| $100,000 to $149,999 | 62 | 12.1% |
| $150,000 to $199,999 | 31 | 6.1% |
| $200,000+ | 21 | 4.1% |
Household Income by Householder Age in Kemp
The median household income in Kemp is $55,650, with the highest median household income of $81,875 found in the 45 to 64 years age bracket for the primary householder. A total of 219 households (42.9%) fall into this category. Meanwhile, the 15 to 24 years age bracket for the primary householder has the lowest median household income of $0, with 4 households (0.8%) in this group.
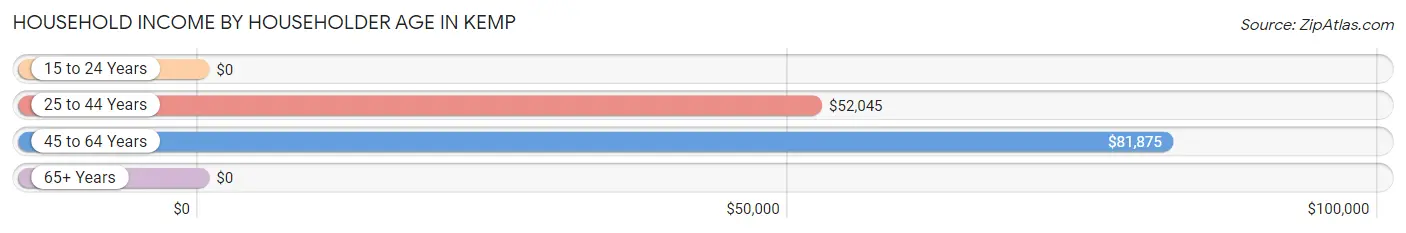
| Income Bracket | # Households | Median Income |
| 15 to 24 Years | 4 (0.8%) | $0 |
| 25 to 44 Years | 176 (34.4%) | $52,045 |
| 45 to 64 Years | 219 (42.9%) | $81,875 |
| 65+ Years | 112 (21.9%) | $0 |
| Total | 511 (100.0%) | $55,650 |
Poverty in Kemp
Income Below Poverty by Sex and Age in Kemp
With 16.9% poverty level for males and 15.4% for females among the residents of Kemp, 5 year old males and 18 to 24 year old females are the most vulnerable to poverty, with 6 males (100.0%) and 18 females (48.6%) in their respective age groups living below the poverty level.
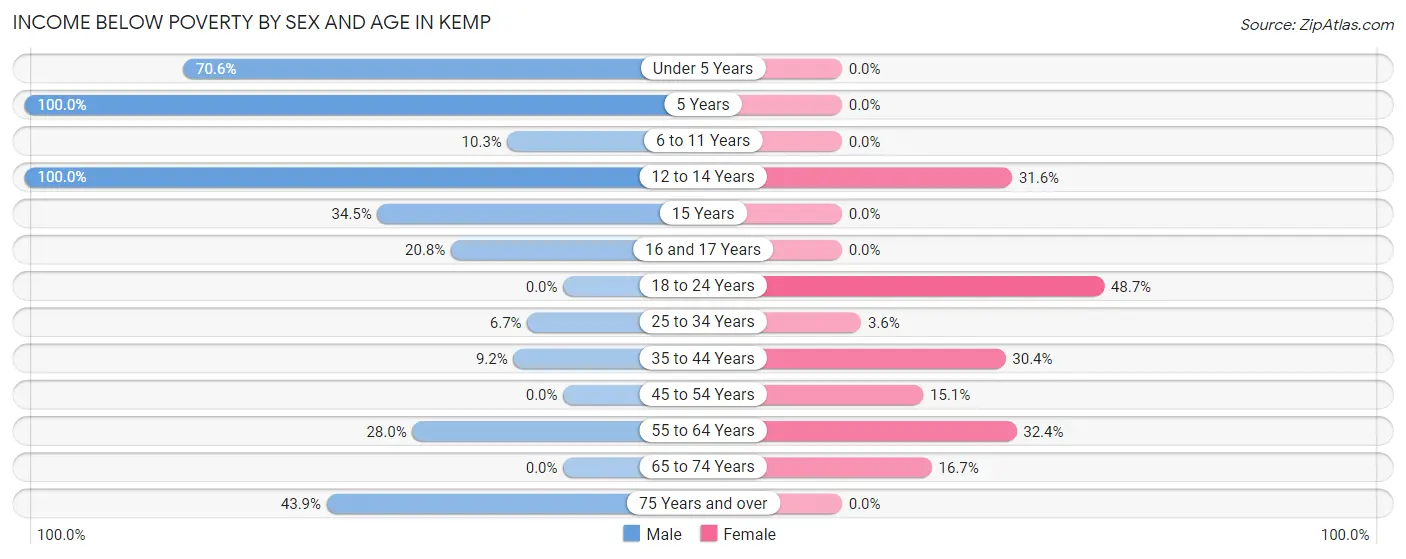
| Age Bracket | Male | Female |
| Under 5 Years | 12 (70.6%) | 0 (0.0%) |
| 5 Years | 6 (100.0%) | 0 (0.0%) |
| 6 to 11 Years | 6 (10.3%) | 0 (0.0%) |
| 12 to 14 Years | 3 (100.0%) | 12 (31.6%) |
| 15 Years | 10 (34.5%) | 0 (0.0%) |
| 16 and 17 Years | 10 (20.8%) | 0 (0.0%) |
| 18 to 24 Years | 0 (0.0%) | 18 (48.6%) |
| 25 to 34 Years | 6 (6.7%) | 3 (3.6%) |
| 35 to 44 Years | 11 (9.2%) | 17 (30.4%) |
| 45 to 54 Years | 0 (0.0%) | 16 (15.1%) |
| 55 to 64 Years | 28 (28.0%) | 23 (32.4%) |
| 65 to 74 Years | 0 (0.0%) | 10 (16.7%) |
| 75 Years and over | 18 (43.9%) | 0 (0.0%) |
| Total | 110 (16.9%) | 99 (15.4%) |
Income Above Poverty by Sex and Age in Kemp
According to the poverty statistics in Kemp, males aged 18 to 24 years and females aged under 5 years are the age groups that are most secure financially, with 100.0% of males and 100.0% of females in these age groups living above the poverty line.
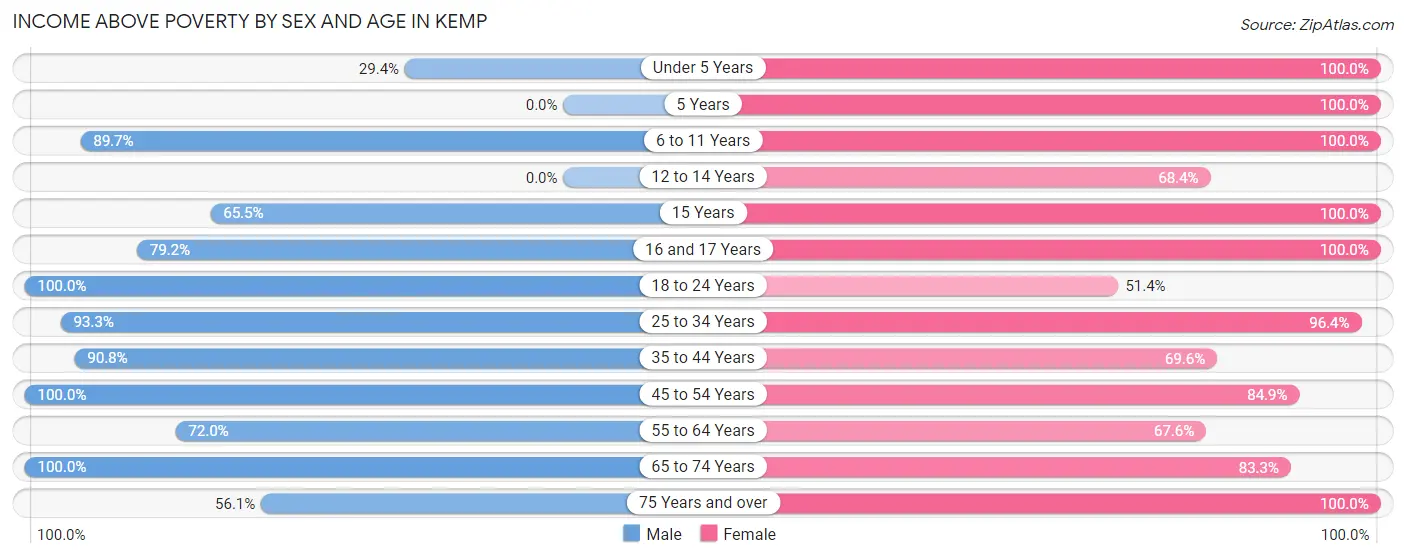
| Age Bracket | Male | Female |
| Under 5 Years | 5 (29.4%) | 74 (100.0%) |
| 5 Years | 0 (0.0%) | 7 (100.0%) |
| 6 to 11 Years | 52 (89.7%) | 40 (100.0%) |
| 12 to 14 Years | 0 (0.0%) | 26 (68.4%) |
| 15 Years | 19 (65.5%) | 13 (100.0%) |
| 16 and 17 Years | 38 (79.2%) | 13 (100.0%) |
| 18 to 24 Years | 24 (100.0%) | 19 (51.3%) |
| 25 to 34 Years | 84 (93.3%) | 81 (96.4%) |
| 35 to 44 Years | 108 (90.8%) | 39 (69.6%) |
| 45 to 54 Years | 86 (100.0%) | 90 (84.9%) |
| 55 to 64 Years | 72 (72.0%) | 48 (67.6%) |
| 65 to 74 Years | 29 (100.0%) | 50 (83.3%) |
| 75 Years and over | 23 (56.1%) | 45 (100.0%) |
| Total | 540 (83.1%) | 545 (84.6%) |
Income Below Poverty Among Married-Couple Families in Kemp
The poverty statistics for married-couple families in Kemp show that 9.4% or 24 of the total 255 families live below the poverty line. Families with 3 or 4 children have the highest poverty rate of 37.9%, comprising of 11 families. On the other hand, families with 1 or 2 children have the lowest poverty rate of 2.8%, which includes 4 families.
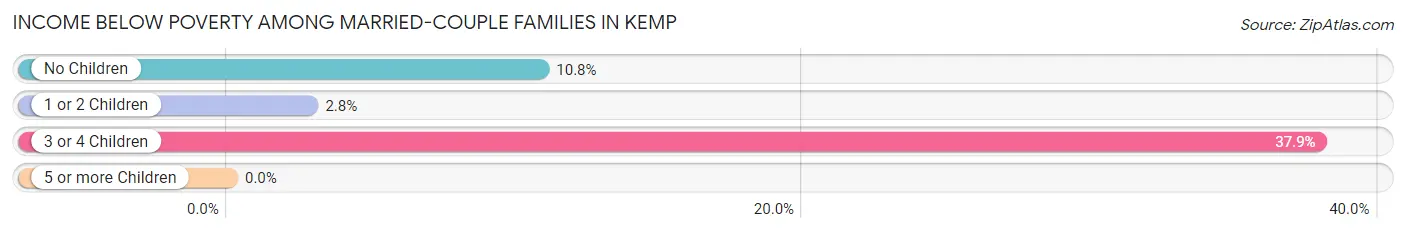
| Children | Above Poverty | Below Poverty |
| No Children | 74 (89.2%) | 9 (10.8%) |
| 1 or 2 Children | 139 (97.2%) | 4 (2.8%) |
| 3 or 4 Children | 18 (62.1%) | 11 (37.9%) |
| 5 or more Children | 0 (0.0%) | 0 (0.0%) |
| Total | 231 (90.6%) | 24 (9.4%) |
Income Below Poverty Among Single-Parent Households in Kemp
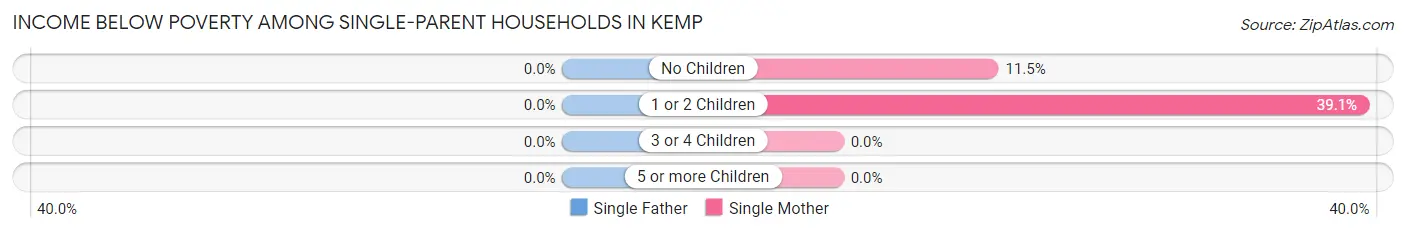
| Children | Single Father | Single Mother |
| No Children | 0 (0.0%) | 3 (11.5%) |
| 1 or 2 Children | 0 (0.0%) | 9 (39.1%) |
| 3 or 4 Children | 0 (0.0%) | 0 (0.0%) |
| 5 or more Children | 0 (0.0%) | 0 (0.0%) |
| Total | 0 (0.0%) | 12 (24.5%) |
Income Below Poverty Among Married-Couple vs Single-Parent Households in Kemp
The poverty data for Kemp shows that 24 of the married-couple family households (9.4%) and 12 of the single-parent households (18.8%) are living below the poverty level. Within the married-couple family households, those with 3 or 4 children have the highest poverty rate, with 11 households (37.9%) falling below the poverty line. Among the single-parent households, those with 1 or 2 children have the highest poverty rate, with 9 household (32.1%) living below poverty.
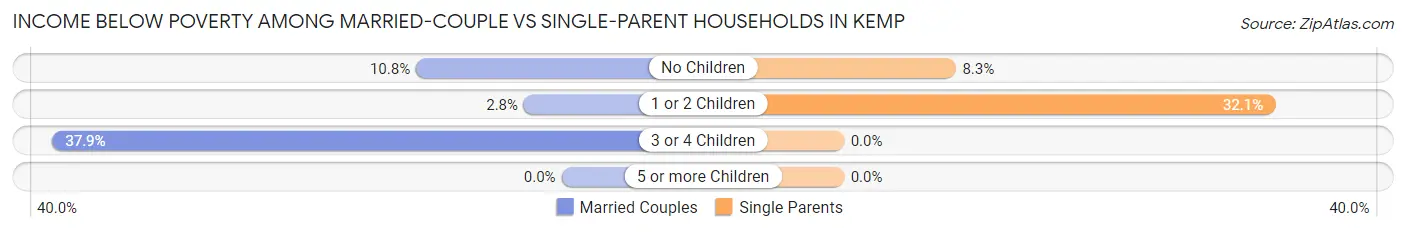
| Children | Married-Couple Families | Single-Parent Households |
| No Children | 9 (10.8%) | 3 (8.3%) |
| 1 or 2 Children | 4 (2.8%) | 9 (32.1%) |
| 3 or 4 Children | 11 (37.9%) | 0 (0.0%) |
| 5 or more Children | 0 (0.0%) | 0 (0.0%) |
| Total | 24 (9.4%) | 12 (18.8%) |
Race in Kemp
The most populous races in Kemp are White / Caucasian (1,195 | 84.2%), Hispanic or Latino (256 | 18.0%), and Two or more Races (110 | 7.7%).
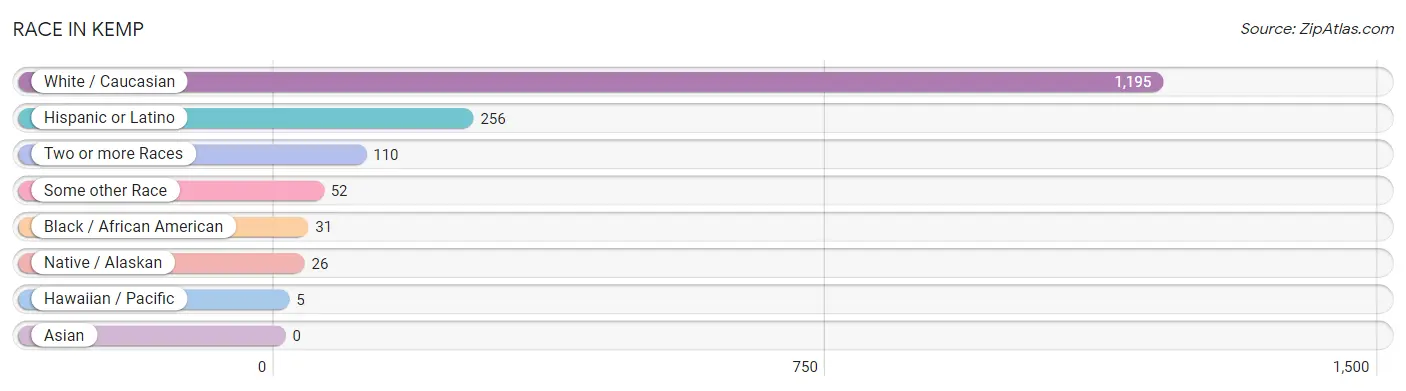
| Race | # Population | % Population |
| Asian | 0 | 0.0% |
| Black / African American | 31 | 2.2% |
| Hawaiian / Pacific | 5 | 0.4% |
| Hispanic or Latino | 256 | 18.0% |
| Native / Alaskan | 26 | 1.8% |
| White / Caucasian | 1,195 | 84.2% |
| Two or more Races | 110 | 7.7% |
| Some other Race | 52 | 3.7% |
| Total | 1,419 | 100.0% |
Ancestry in Kemp
The most populous ancestries reported in Kemp are Mexican (215 | 15.1%), German (192 | 13.5%), Irish (189 | 13.3%), English (95 | 6.7%), and American (56 | 4.0%), together accounting for 52.6% of all Kemp residents.
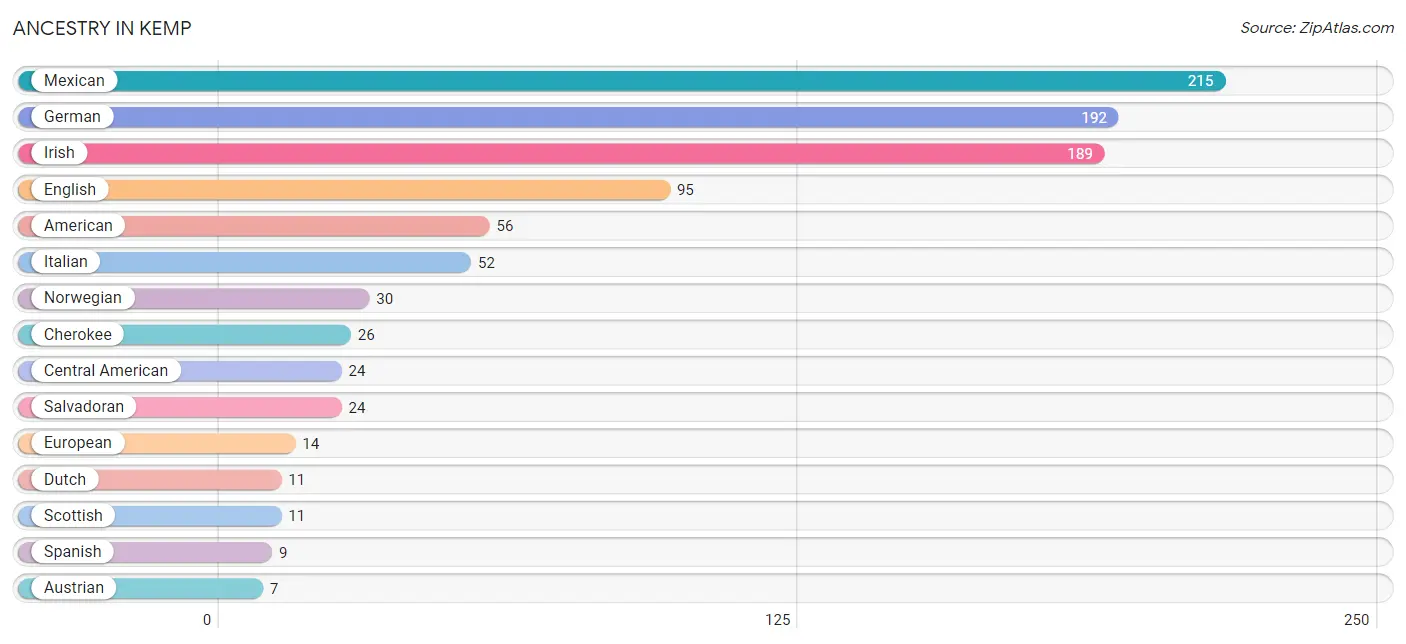
| Ancestry | # Population | % Population |
| American | 56 | 4.0% |
| Austrian | 7 | 0.5% |
| Central American | 24 | 1.7% |
| Cherokee | 26 | 1.8% |
| Czechoslovakian | 3 | 0.2% |
| Dutch | 11 | 0.8% |
| Dutch West Indian | 3 | 0.2% |
| English | 95 | 6.7% |
| European | 14 | 1.0% |
| French | 5 | 0.4% |
| German | 192 | 13.5% |
| Irish | 189 | 13.3% |
| Italian | 52 | 3.7% |
| Mexican | 215 | 15.1% |
| Norwegian | 30 | 2.1% |
| Puerto Rican | 3 | 0.2% |
| Salvadoran | 24 | 1.7% |
| Scotch-Irish | 5 | 0.4% |
| Scottish | 11 | 0.8% |
| Spanish | 9 | 0.6% |
| Swedish | 7 | 0.5% | View All 21 Rows |
Immigrants in Kemp
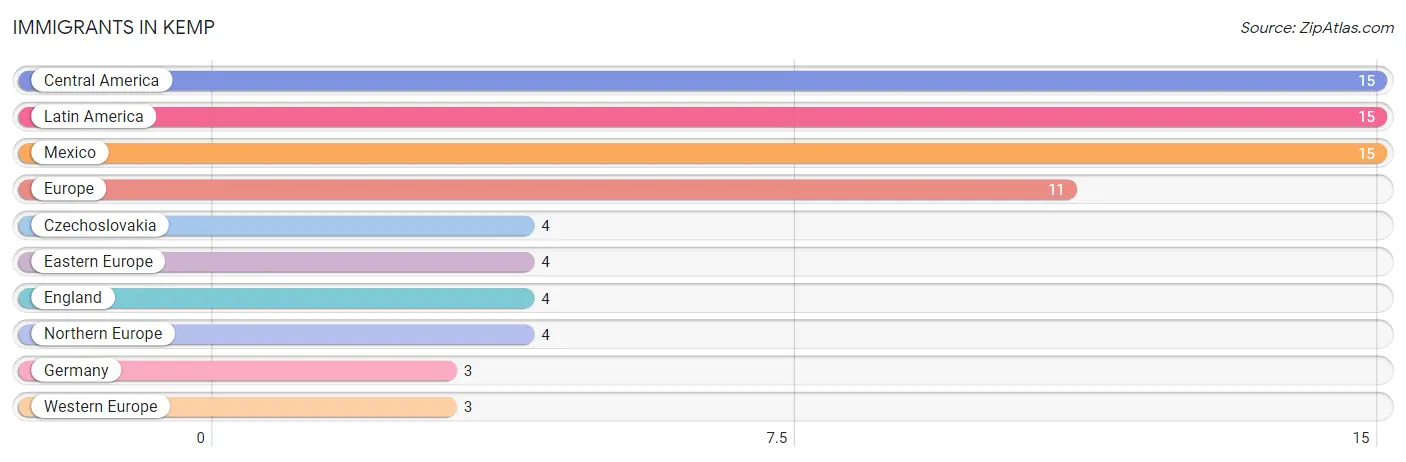
The most numerous immigrant groups reported in Kemp came from Central America (15 | 1.1%), Latin America (15 | 1.1%), Mexico (15 | 1.1%), Europe (11 | 0.8%), and Czechoslovakia (4 | 0.3%), together accounting for 4.2% of all Kemp residents.
| Immigration Origin | # Population | % Population |
| Central America | 15 | 1.1% |
| Czechoslovakia | 4 | 0.3% |
| Eastern Europe | 4 | 0.3% |
| England | 4 | 0.3% |
| Europe | 11 | 0.8% |
| Germany | 3 | 0.2% |
| Latin America | 15 | 1.1% |
| Mexico | 15 | 1.1% |
| Northern Europe | 4 | 0.3% |
| Western Europe | 3 | 0.2% | View All 10 Rows |
Sex and Age in Kemp
Sex and Age in Kemp
The most populous age groups in Kemp are 15 to 19 Years (90 | 13.7%) for men and Under 5 Years (74 | 9.7%) for women.
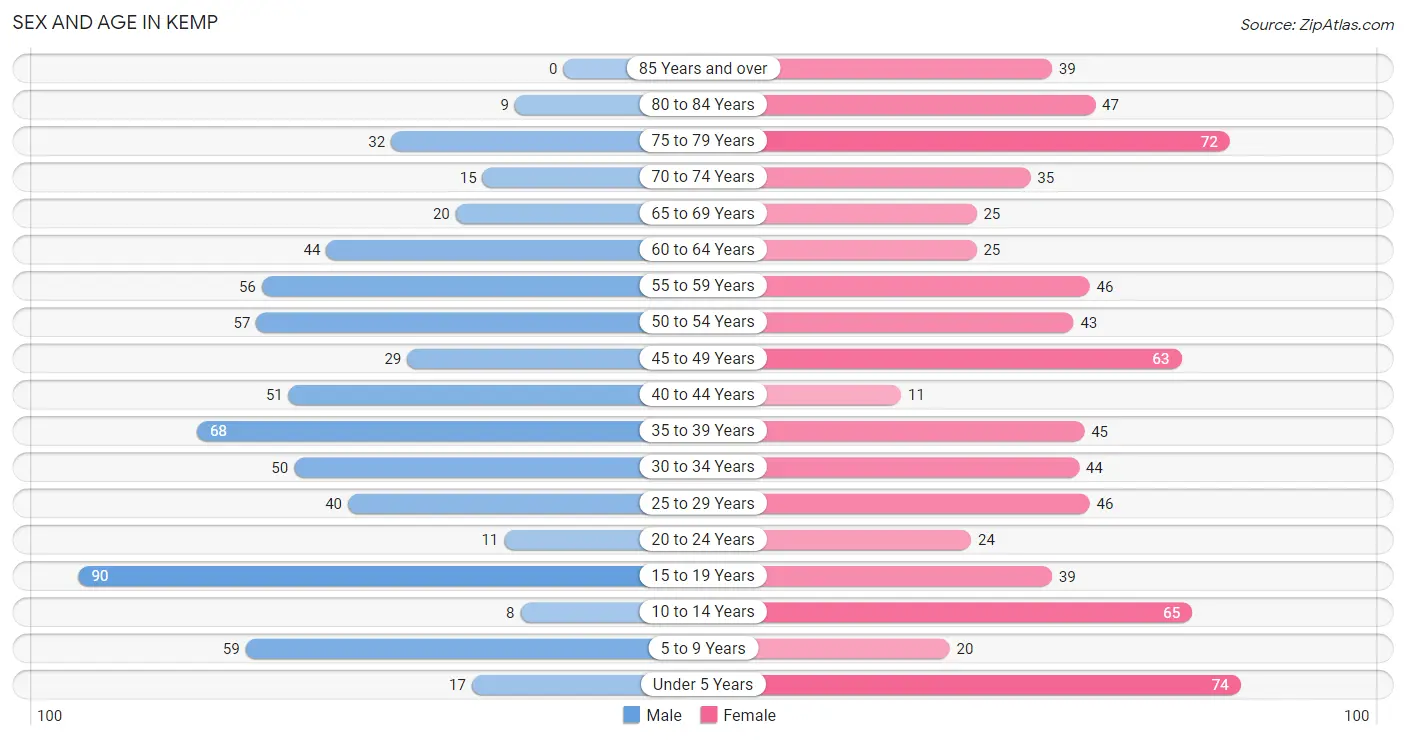
| Age Bracket | Male | Female |
| Under 5 Years | 17 (2.6%) | 74 (9.7%) |
| 5 to 9 Years | 59 (9.0%) | 20 (2.6%) |
| 10 to 14 Years | 8 (1.2%) | 65 (8.5%) |
| 15 to 19 Years | 90 (13.7%) | 39 (5.1%) |
| 20 to 24 Years | 11 (1.7%) | 24 (3.2%) |
| 25 to 29 Years | 40 (6.1%) | 46 (6.0%) |
| 30 to 34 Years | 50 (7.6%) | 44 (5.8%) |
| 35 to 39 Years | 68 (10.4%) | 45 (5.9%) |
| 40 to 44 Years | 51 (7.8%) | 11 (1.4%) |
| 45 to 49 Years | 29 (4.4%) | 63 (8.3%) |
| 50 to 54 Years | 57 (8.7%) | 43 (5.6%) |
| 55 to 59 Years | 56 (8.5%) | 46 (6.0%) |
| 60 to 64 Years | 44 (6.7%) | 25 (3.3%) |
| 65 to 69 Years | 20 (3.0%) | 25 (3.3%) |
| 70 to 74 Years | 15 (2.3%) | 35 (4.6%) |
| 75 to 79 Years | 32 (4.9%) | 72 (9.4%) |
| 80 to 84 Years | 9 (1.4%) | 47 (6.2%) |
| 85 Years and over | 0 (0.0%) | 39 (5.1%) |
| Total | 656 (100.0%) | 763 (100.0%) |
Families and Households in Kemp
Median Family Size in Kemp
The median family size in Kemp is 3.38 persons per family, with married-couple families (255 | 79.9%) accounting for the largest median family size of 3.63 persons per family. On the other hand, single male/father families (15 | 4.7%) represent the smallest median family size with 2.13 persons per family.
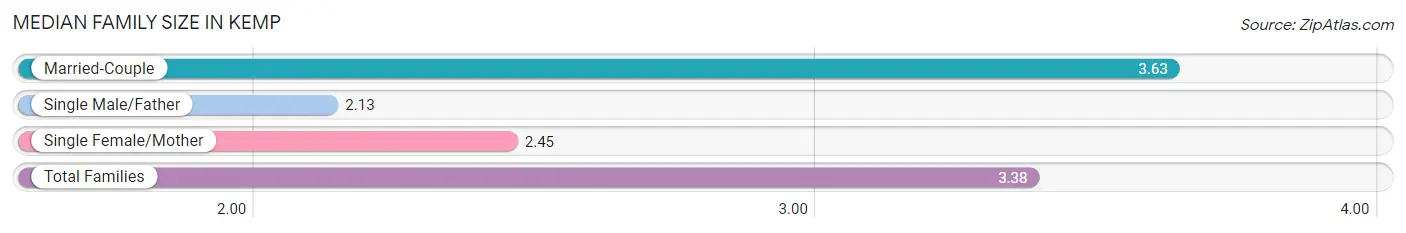
| Family Type | # Families | Family Size |
| Married-Couple | 255 (79.9%) | 3.63 |
| Single Male/Father | 15 (4.7%) | 2.13 |
| Single Female/Mother | 49 (15.4%) | 2.45 |
| Total Families | 319 (100.0%) | 3.38 |
Median Household Size in Kemp
The median household size in Kemp is 2.53 persons per household, with married-couple households (255 | 49.9%) accounting for the largest median household size of 3.63 persons per household. non-family households (192 | 37.6%) represent the smallest median household size with 1.13 persons per household.
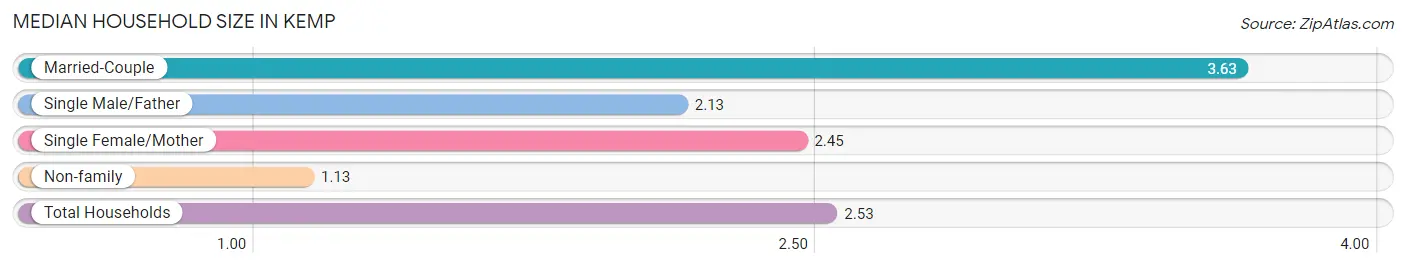
| Household Type | # Households | Household Size |
| Married-Couple | 255 (49.9%) | 3.63 |
| Single Male/Father | 15 (2.9%) | 2.13 |
| Single Female/Mother | 49 (9.6%) | 2.45 |
| Non-family | 192 (37.6%) | 1.13 |
| Total Households | 511 (100.0%) | 2.53 |
Household Size by Marriage Status in Kemp
Out of a total of 511 households in Kemp, 319 (62.4%) are family households, while 192 (37.6%) are nonfamily households. The most numerous type of family households are 2-person households, comprising 109, and the most common type of nonfamily households are 1-person households, comprising 180.
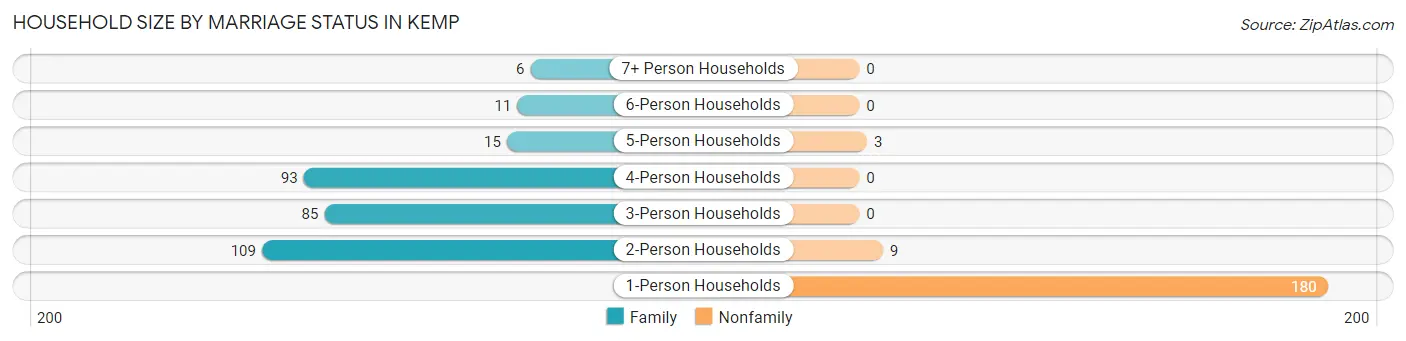
| Household Size | Family Households | Nonfamily Households |
| 1-Person Households | - | 180 (35.2%) |
| 2-Person Households | 109 (21.3%) | 9 (1.8%) |
| 3-Person Households | 85 (16.6%) | 0 (0.0%) |
| 4-Person Households | 93 (18.2%) | 0 (0.0%) |
| 5-Person Households | 15 (2.9%) | 3 (0.6%) |
| 6-Person Households | 11 (2.1%) | 0 (0.0%) |
| 7+ Person Households | 6 (1.2%) | 0 (0.0%) |
| Total | 319 (62.4%) | 192 (37.6%) |
Female Fertility in Kemp
Fertility by Age in Kemp
Average fertility rate in Kemp is 22.0 births per 1,000 women. Women in the age bracket of 20 to 34 years have the highest fertility rate with 53.0 births per 1,000 women. Women in the age bracket of 20 to 34 years acount for 100.0% of all women with births.
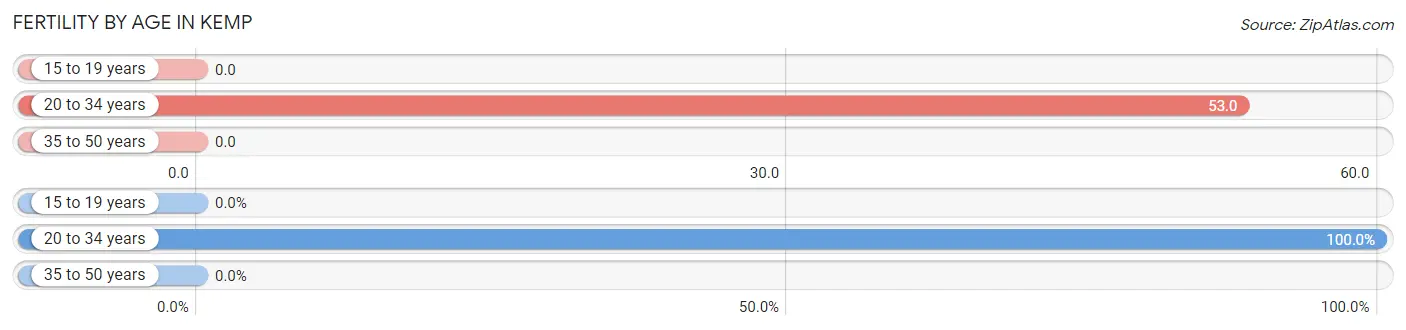
| Age Bracket | Women with Births | Births / 1,000 Women |
| 15 to 19 years | 0 (0.0%) | 0.0 |
| 20 to 34 years | 6 (100.0%) | 53.0 |
| 35 to 50 years | 0 (0.0%) | 0.0 |
| Total | 6 (100.0%) | 22.0 |
Fertility by Age by Marriage Status in Kemp
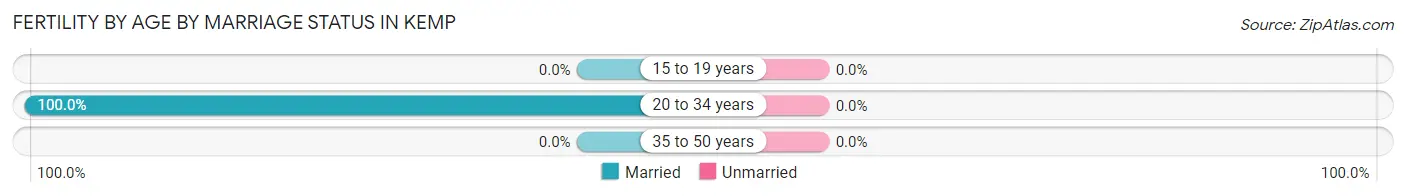
| Age Bracket | Married | Unmarried |
| 15 to 19 years | 0 (0.0%) | 0 (0.0%) |
| 20 to 34 years | 6 (100.0%) | 0 (0.0%) |
| 35 to 50 years | 0 (0.0%) | 0 (0.0%) |
| Total | 6 (100.0%) | 0 (0.0%) |
Fertility by Education in Kemp
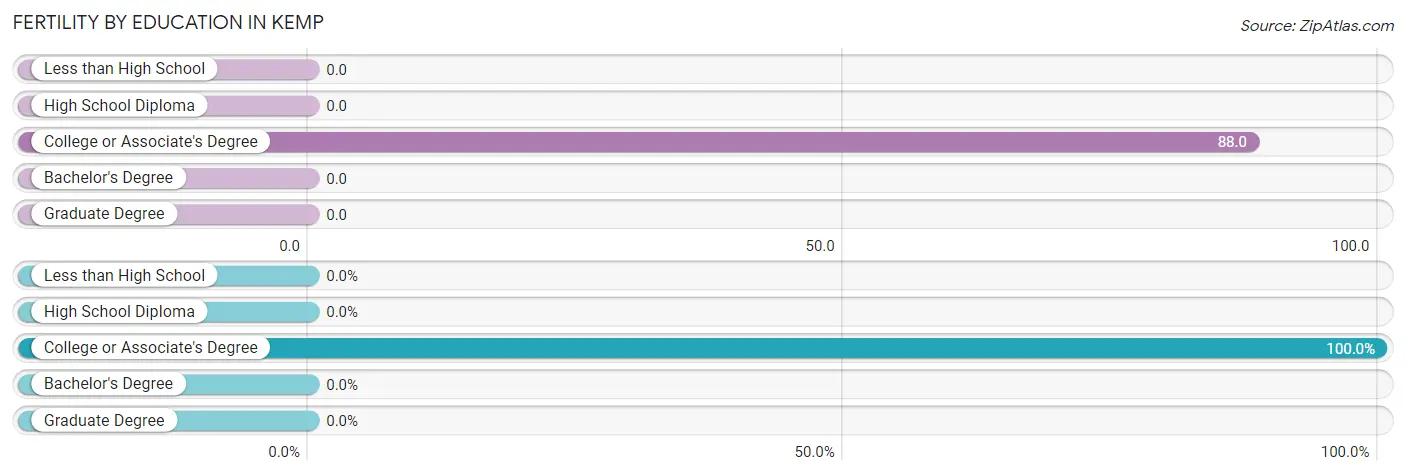
| Educational Attainment | Women with Births | Births / 1,000 Women |
| Less than High School | 0 (0.0%) | 0.0 |
| High School Diploma | 0 (0.0%) | 0.0 |
| College or Associate's Degree | 6 (100.0%) | 88.0 |
| Bachelor's Degree | 0 (0.0%) | 0.0 |
| Graduate Degree | 0 (0.0%) | 0.0 |
| Total | 6 (100.0%) | 22.0 |
Fertility by Education by Marriage Status in Kemp
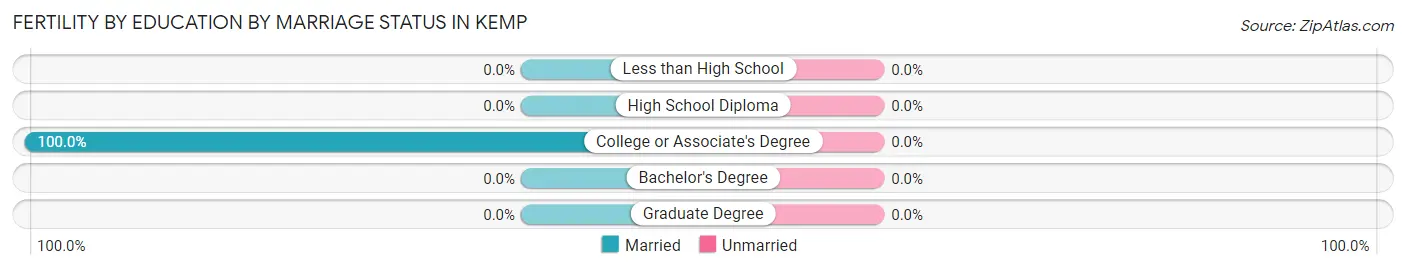
| Educational Attainment | Married | Unmarried |
| Less than High School | 0 (0.0%) | 0 (0.0%) |
| High School Diploma | 0 (0.0%) | 0 (0.0%) |
| College or Associate's Degree | 6 (100.0%) | 0 (0.0%) |
| Bachelor's Degree | 0 (0.0%) | 0 (0.0%) |
| Graduate Degree | 0 (0.0%) | 0 (0.0%) |
| Total | 6 (100.0%) | 0 (0.0%) |
Employment Characteristics in Kemp
Employment by Class of Employer in Kemp
Among the 557 employed individuals in Kemp, private company employees (324 | 58.2%), self-employed (not incorporated) (64 | 11.5%), and not-for-profit organizations (62 | 11.1%) make up the most common classes of employment.
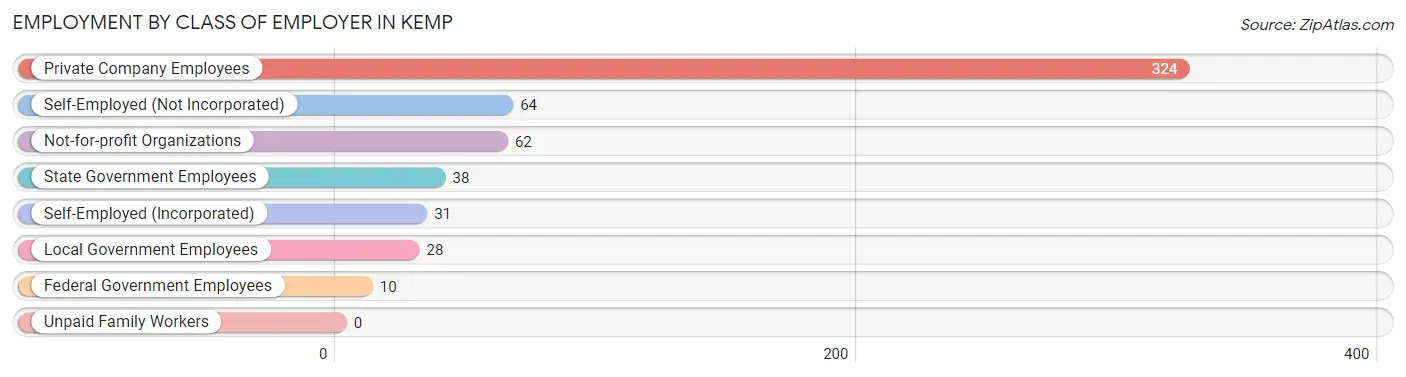
| Employer Class | # Employees | % Employees |
| Private Company Employees | 324 | 58.2% |
| Self-Employed (Incorporated) | 31 | 5.6% |
| Self-Employed (Not Incorporated) | 64 | 11.5% |
| Not-for-profit Organizations | 62 | 11.1% |
| Local Government Employees | 28 | 5.0% |
| State Government Employees | 38 | 6.8% |
| Federal Government Employees | 10 | 1.8% |
| Unpaid Family Workers | 0 | 0.0% |
| Total | 557 | 100.0% |
Employment Status by Age in Kemp
According to the labor force statistics for Kemp, out of the total population over 16 years of age (1,134), 57.3% or 650 individuals are in the labor force, with 4.2% or 27 of them unemployed. The age group with the highest labor force participation rate is 30 to 34 years, with 88.3% or 83 individuals in the labor force. Within the labor force, the 60 to 64 years age range has the highest percentage of unemployed individuals, with 37.0% or 10 of them being unemployed.
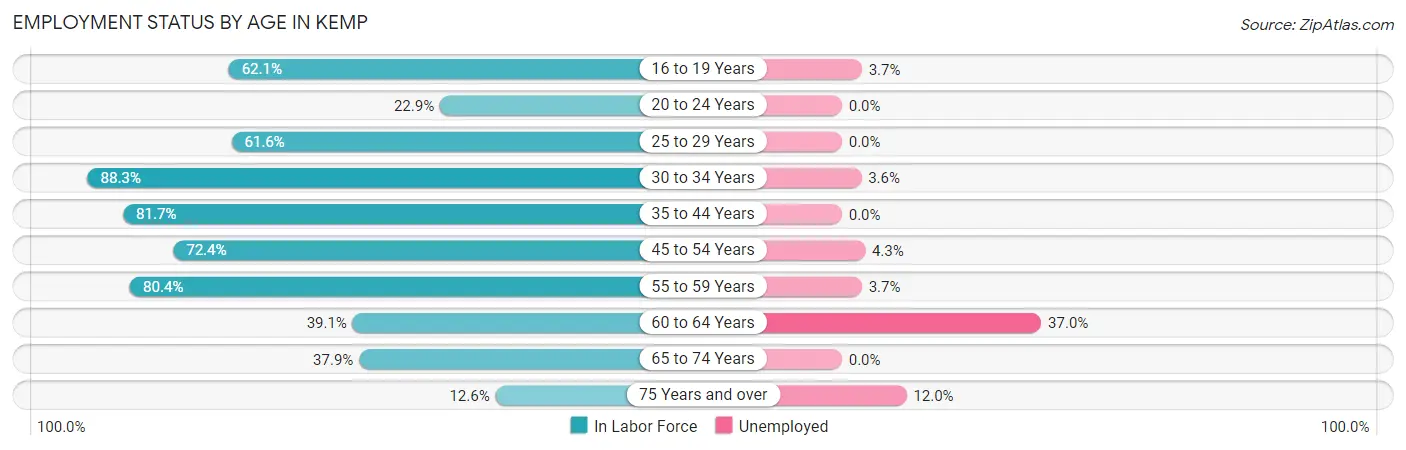
| Age Bracket | In Labor Force | Unemployed |
| 16 to 19 Years | 54 (62.1%) | 2 (3.7%) |
| 20 to 24 Years | 8 (22.9%) | 0 (0.0%) |
| 25 to 29 Years | 53 (61.6%) | 0 (0.0%) |
| 30 to 34 Years | 83 (88.3%) | 3 (3.6%) |
| 35 to 44 Years | 143 (81.7%) | 0 (0.0%) |
| 45 to 54 Years | 139 (72.4%) | 6 (4.3%) |
| 55 to 59 Years | 82 (80.4%) | 3 (3.7%) |
| 60 to 64 Years | 27 (39.1%) | 10 (37.0%) |
| 65 to 74 Years | 36 (37.9%) | 0 (0.0%) |
| 75 Years and over | 25 (12.6%) | 3 (12.0%) |
| Total | 650 (57.3%) | 27 (4.2%) |
Employment Status by Educational Attainment in Kemp
According to labor force statistics for Kemp, 73.4% of individuals (527) out of the total population between 25 and 64 years of age (718) are in the labor force, with 4.2% or 22 of them being unemployed. The group with the highest labor force participation rate are those with the educational attainment of college / associate degree, with 92.2% or 178 individuals in the labor force. Within the labor force, individuals with high school diploma education have the highest percentage of unemployment, with 6.8% or 13 of them being unemployed.
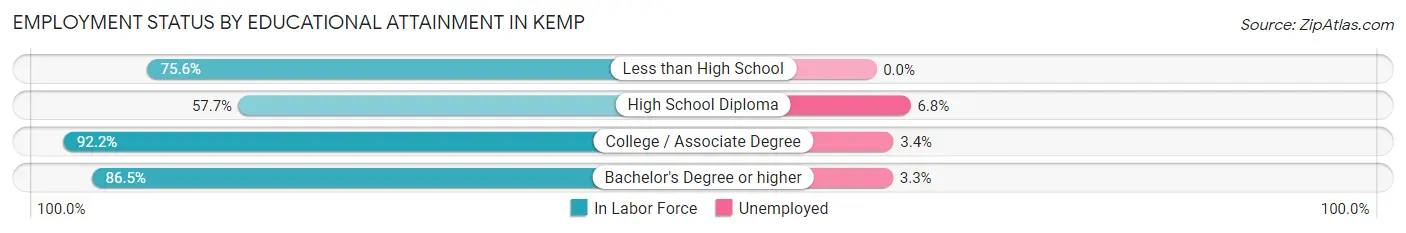
| Educational Attainment | In Labor Force | Unemployed |
| Less than High School | 68 (75.6%) | 0 (0.0%) |
| High School Diploma | 191 (57.7%) | 23 (6.8%) |
| College / Associate Degree | 178 (92.2%) | 7 (3.4%) |
| Bachelor's Degree or higher | 90 (86.5%) | 3 (3.3%) |
| Total | 527 (73.4%) | 30 (4.2%) |
Employment Occupations by Sex in Kemp
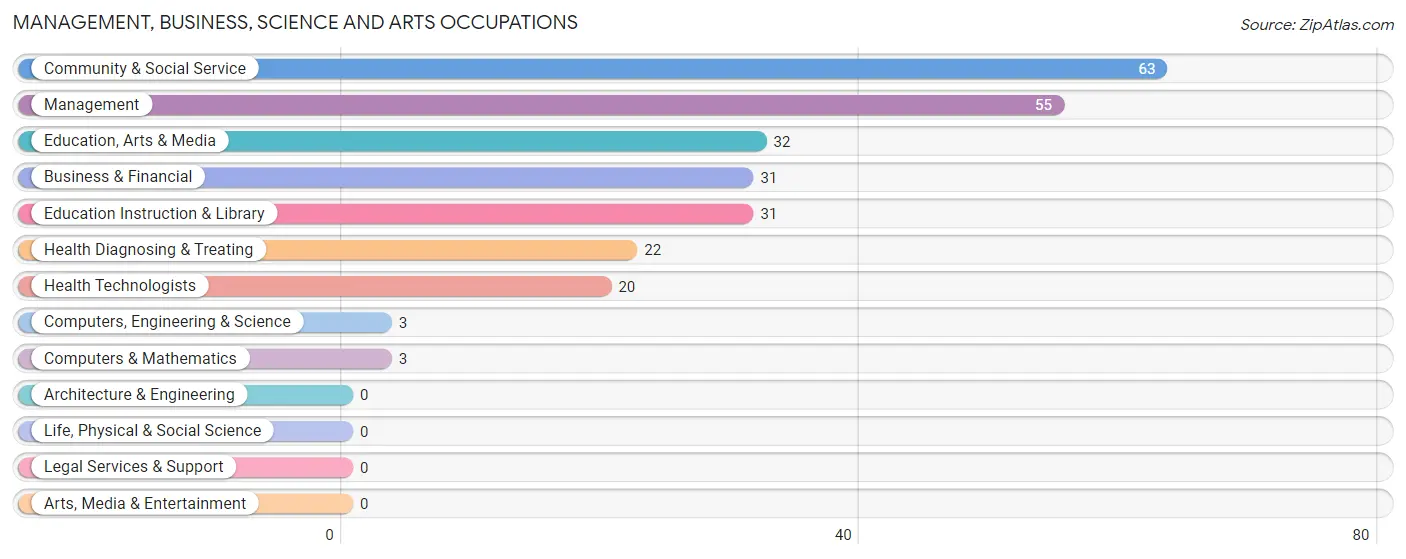
Management, Business, Science and Arts Occupations
The most common Management, Business, Science and Arts occupations in Kemp are Community & Social Service (63 | 10.1%), Management (55 | 8.8%), Education, Arts & Media (32 | 5.1%), Business & Financial (31 | 5.0%), and Education Instruction & Library (31 | 5.0%).
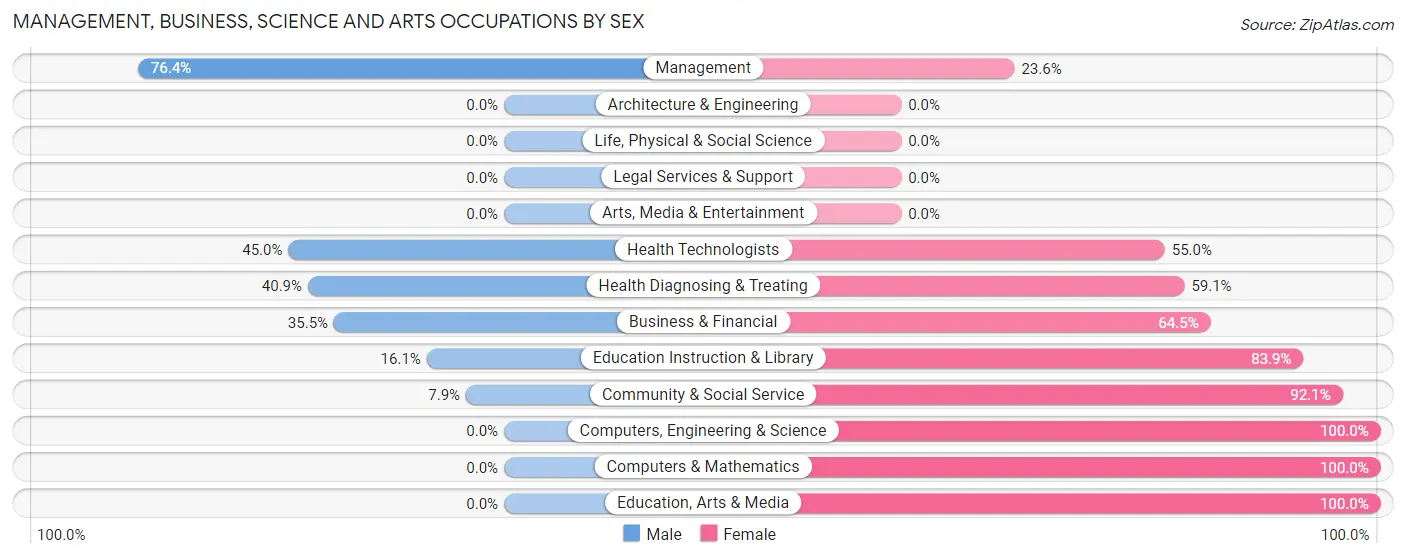
Management, Business, Science and Arts Occupations by Sex
Within the Management, Business, Science and Arts occupations in Kemp, the most male-oriented occupations are Management (76.4%), Health Technologists (45.0%), and Health Diagnosing & Treating (40.9%), while the most female-oriented occupations are Computers, Engineering & Science (100.0%), Computers & Mathematics (100.0%), and Education, Arts & Media (100.0%).
| Occupation | Male | Female |
| Management | 42 (76.4%) | 13 (23.6%) |
| Business & Financial | 11 (35.5%) | 20 (64.5%) |
| Computers, Engineering & Science | 0 (0.0%) | 3 (100.0%) |
| Computers & Mathematics | 0 (0.0%) | 3 (100.0%) |
| Architecture & Engineering | 0 (0.0%) | 0 (0.0%) |
| Life, Physical & Social Science | 0 (0.0%) | 0 (0.0%) |
| Community & Social Service | 5 (7.9%) | 58 (92.1%) |
| Education, Arts & Media | 0 (0.0%) | 32 (100.0%) |
| Legal Services & Support | 0 (0.0%) | 0 (0.0%) |
| Education Instruction & Library | 5 (16.1%) | 26 (83.9%) |
| Arts, Media & Entertainment | 0 (0.0%) | 0 (0.0%) |
| Health Diagnosing & Treating | 9 (40.9%) | 13 (59.1%) |
| Health Technologists | 9 (45.0%) | 11 (55.0%) |
| Total (Category) | 67 (38.5%) | 107 (61.5%) |
| Total (Overall) | 357 (57.3%) | 266 (42.7%) |
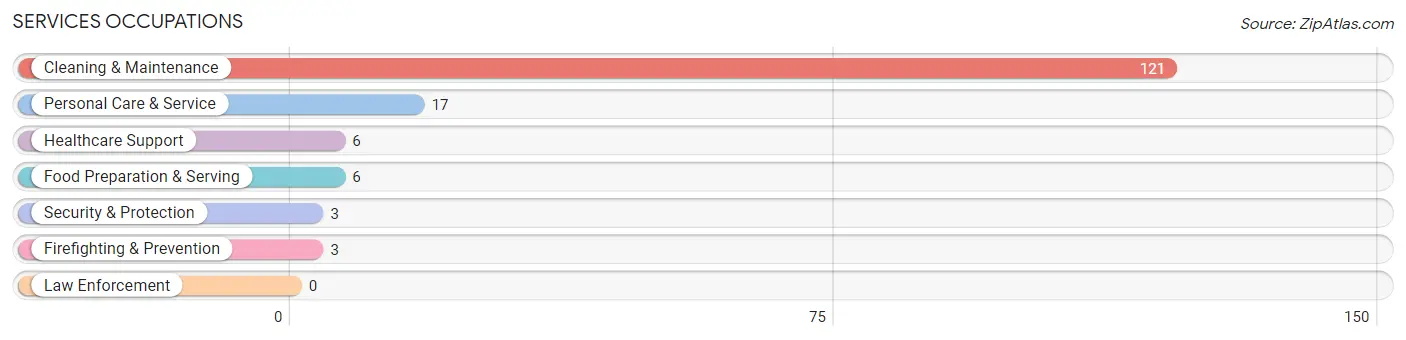
Services Occupations
The most common Services occupations in Kemp are Cleaning & Maintenance (121 | 19.4%), Personal Care & Service (17 | 2.7%), Healthcare Support (6 | 1.0%), Food Preparation & Serving (6 | 1.0%), and Security & Protection (3 | 0.5%).
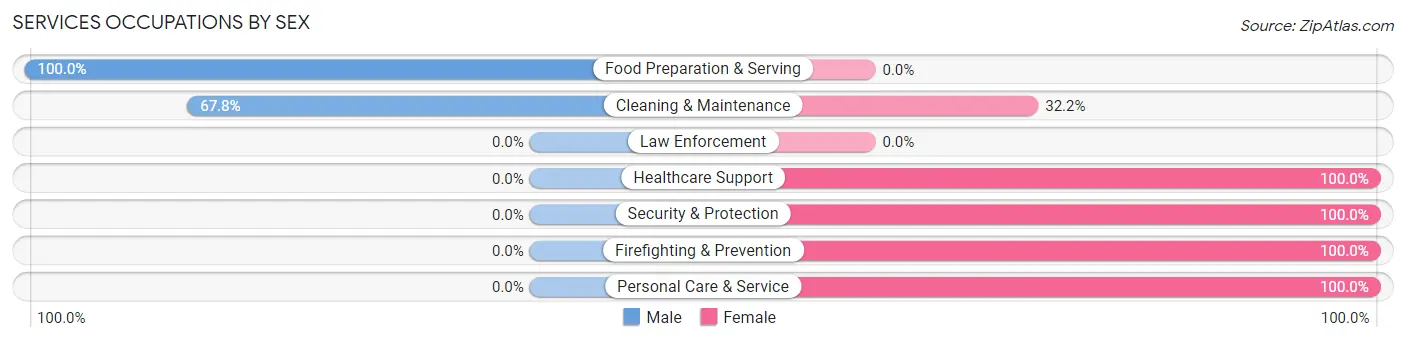
Services Occupations by Sex
Within the Services occupations in Kemp, the most male-oriented occupations are Food Preparation & Serving (100.0%), and Cleaning & Maintenance (67.8%), while the most female-oriented occupations are Healthcare Support (100.0%), Security & Protection (100.0%), and Firefighting & Prevention (100.0%).
| Occupation | Male | Female |
| Healthcare Support | 0 (0.0%) | 6 (100.0%) |
| Security & Protection | 0 (0.0%) | 3 (100.0%) |
| Firefighting & Prevention | 0 (0.0%) | 3 (100.0%) |
| Law Enforcement | 0 (0.0%) | 0 (0.0%) |
| Food Preparation & Serving | 6 (100.0%) | 0 (0.0%) |
| Cleaning & Maintenance | 82 (67.8%) | 39 (32.2%) |
| Personal Care & Service | 0 (0.0%) | 17 (100.0%) |
| Total (Category) | 88 (57.5%) | 65 (42.5%) |
| Total (Overall) | 357 (57.3%) | 266 (42.7%) |
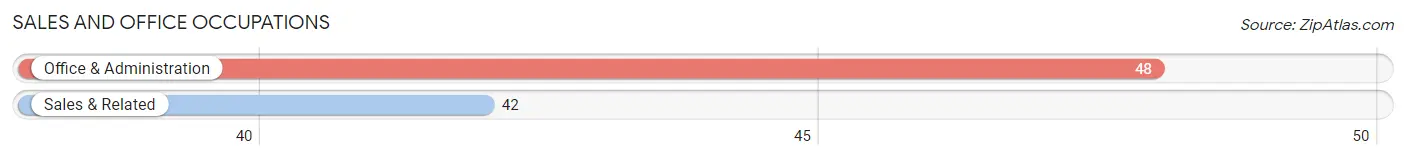
Sales and Office Occupations
The most common Sales and Office occupations in Kemp are Office & Administration (48 | 7.7%), and Sales & Related (42 | 6.7%).
Sales and Office Occupations by Sex
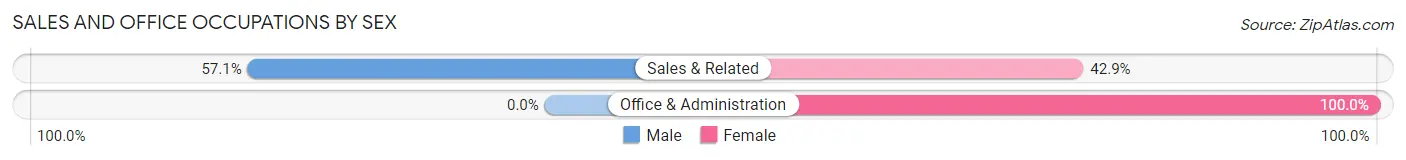
| Occupation | Male | Female |
| Sales & Related | 24 (57.1%) | 18 (42.9%) |
| Office & Administration | 0 (0.0%) | 48 (100.0%) |
| Total (Category) | 24 (26.7%) | 66 (73.3%) |
| Total (Overall) | 357 (57.3%) | 266 (42.7%) |
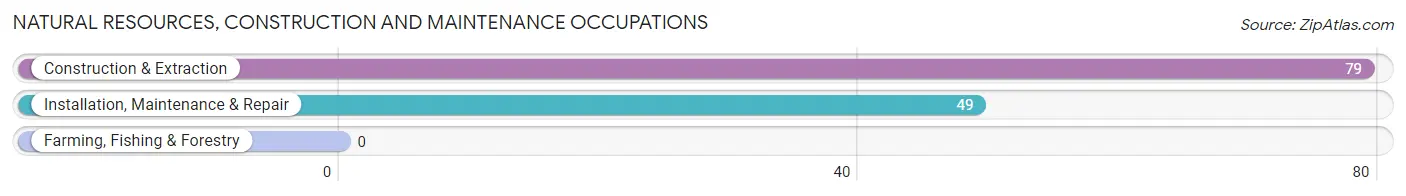
Natural Resources, Construction and Maintenance Occupations
The most common Natural Resources, Construction and Maintenance occupations in Kemp are Construction & Extraction (79 | 12.7%), and Installation, Maintenance & Repair (49 | 7.9%).
Natural Resources, Construction and Maintenance Occupations by Sex
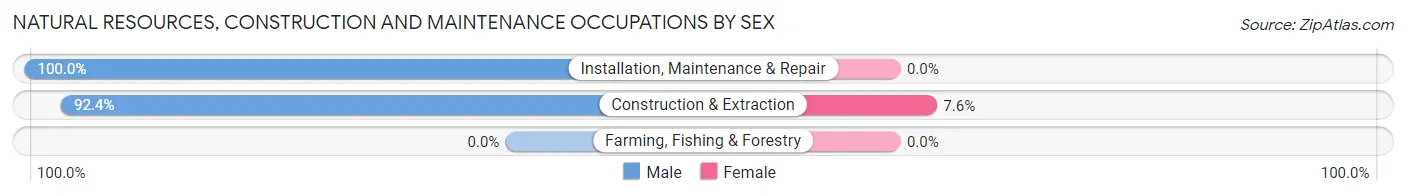
| Occupation | Male | Female |
| Farming, Fishing & Forestry | 0 (0.0%) | 0 (0.0%) |
| Construction & Extraction | 73 (92.4%) | 6 (7.6%) |
| Installation, Maintenance & Repair | 49 (100.0%) | 0 (0.0%) |
| Total (Category) | 122 (95.3%) | 6 (4.7%) |
| Total (Overall) | 357 (57.3%) | 266 (42.7%) |
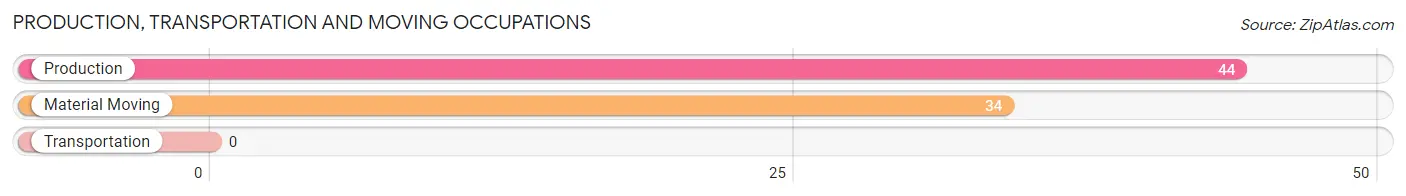
Production, Transportation and Moving Occupations
The most common Production, Transportation and Moving occupations in Kemp are Production (44 | 7.1%), and Material Moving (34 | 5.5%).
Production, Transportation and Moving Occupations by Sex
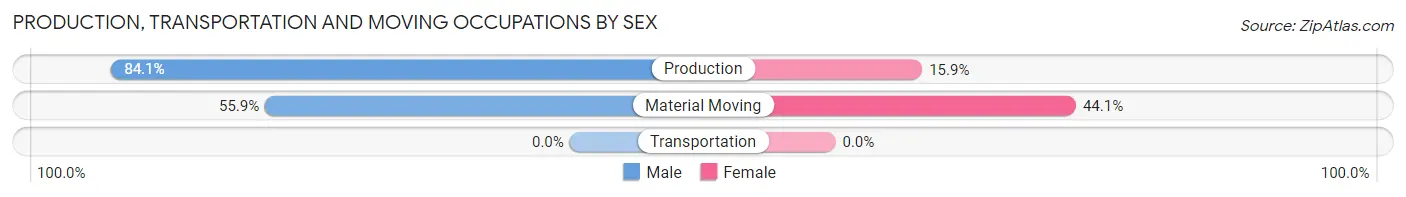
| Occupation | Male | Female |
| Production | 37 (84.1%) | 7 (15.9%) |
| Transportation | 0 (0.0%) | 0 (0.0%) |
| Material Moving | 19 (55.9%) | 15 (44.1%) |
| Total (Category) | 56 (71.8%) | 22 (28.2%) |
| Total (Overall) | 357 (57.3%) | 266 (42.7%) |
Employment Industries by Sex in Kemp
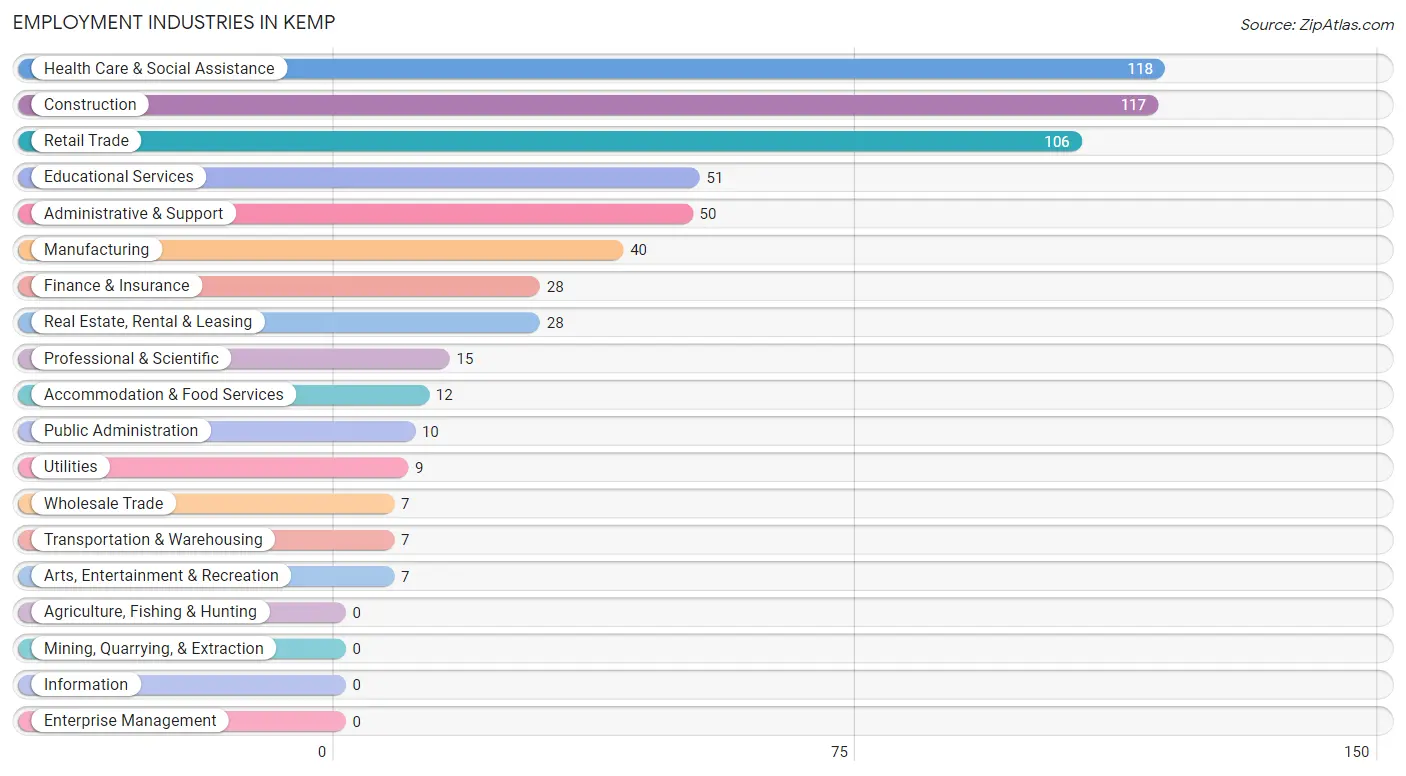
Employment Industries in Kemp
The major employment industries in Kemp include Health Care & Social Assistance (118 | 18.9%), Construction (117 | 18.8%), Retail Trade (106 | 17.0%), Educational Services (51 | 8.2%), and Administrative & Support (50 | 8.0%).
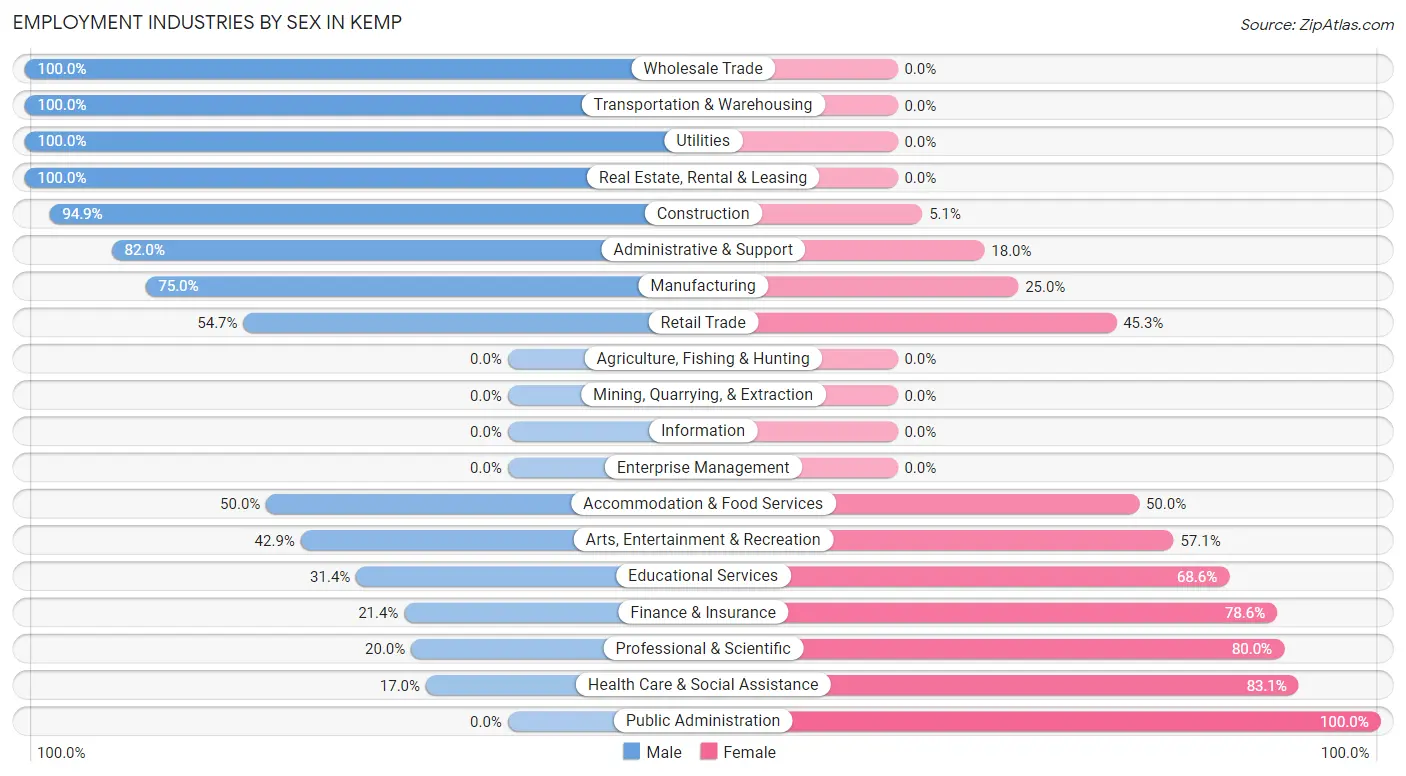
Employment Industries by Sex in Kemp
The Kemp industries that see more men than women are Wholesale Trade (100.0%), Transportation & Warehousing (100.0%), and Utilities (100.0%), whereas the industries that tend to have a higher number of women are Public Administration (100.0%), Health Care & Social Assistance (83.1%), and Professional & Scientific (80.0%).
| Industry | Male | Female |
| Agriculture, Fishing & Hunting | 0 (0.0%) | 0 (0.0%) |
| Mining, Quarrying, & Extraction | 0 (0.0%) | 0 (0.0%) |
| Construction | 111 (94.9%) | 6 (5.1%) |
| Manufacturing | 30 (75.0%) | 10 (25.0%) |
| Wholesale Trade | 7 (100.0%) | 0 (0.0%) |
| Retail Trade | 58 (54.7%) | 48 (45.3%) |
| Transportation & Warehousing | 7 (100.0%) | 0 (0.0%) |
| Utilities | 9 (100.0%) | 0 (0.0%) |
| Information | 0 (0.0%) | 0 (0.0%) |
| Finance & Insurance | 6 (21.4%) | 22 (78.6%) |
| Real Estate, Rental & Leasing | 28 (100.0%) | 0 (0.0%) |
| Professional & Scientific | 3 (20.0%) | 12 (80.0%) |
| Enterprise Management | 0 (0.0%) | 0 (0.0%) |
| Administrative & Support | 41 (82.0%) | 9 (18.0%) |
| Educational Services | 16 (31.4%) | 35 (68.6%) |
| Health Care & Social Assistance | 20 (17.0%) | 98 (83.1%) |
| Arts, Entertainment & Recreation | 3 (42.9%) | 4 (57.1%) |
| Accommodation & Food Services | 6 (50.0%) | 6 (50.0%) |
| Public Administration | 0 (0.0%) | 10 (100.0%) |
| Total | 357 (57.3%) | 266 (42.7%) |
Education in Kemp
School Enrollment in Kemp
The most common levels of schooling among the 289 students in Kemp are high school (116 | 40.1%), elementary school (70 | 24.2%), and middle school (41 | 14.2%).
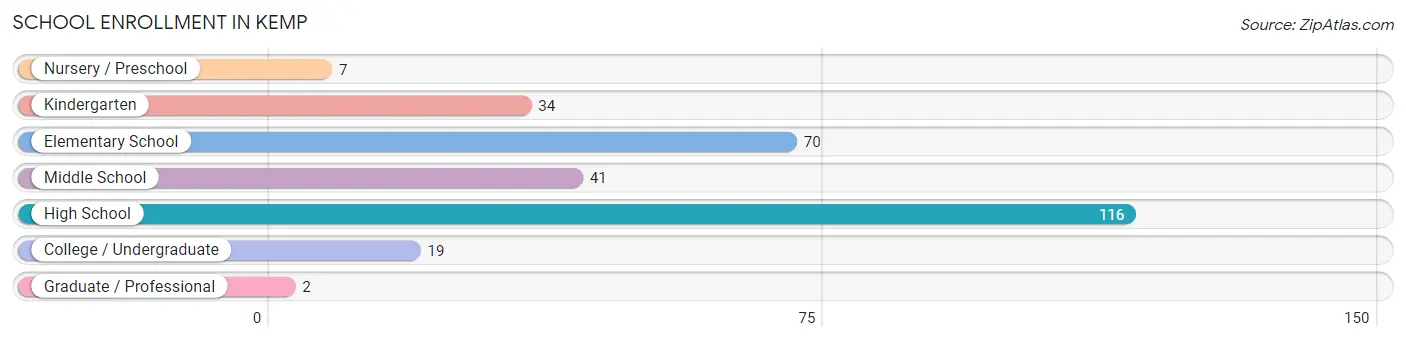
| School Level | # Students | % Students |
| Nursery / Preschool | 7 | 2.4% |
| Kindergarten | 34 | 11.8% |
| Elementary School | 70 | 24.2% |
| Middle School | 41 | 14.2% |
| High School | 116 | 40.1% |
| College / Undergraduate | 19 | 6.6% |
| Graduate / Professional | 2 | 0.7% |
| Total | 289 | 100.0% |
School Enrollment by Age by Funding Source in Kemp
Out of a total of 289 students who are enrolled in schools in Kemp, 60 (20.8%) attend a private institution, while the remaining 229 (79.2%) are enrolled in public schools. The age group of 3 to 4 year olds has the highest likelihood of being enrolled in private schools, with 7 (100.0% in the age bracket) enrolled. Conversely, the age group of 5 to 9 year old has the lowest likelihood of being enrolled in a private school, with 72 (100.0% in the age bracket) attending a public institution.
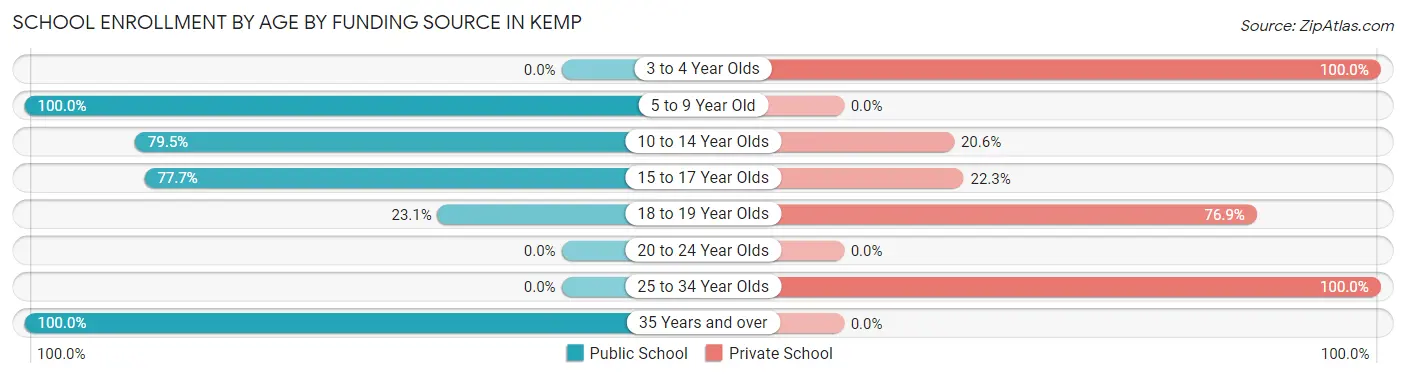
| Age Bracket | Public School | Private School |
| 3 to 4 Year Olds | 0 (0.0%) | 7 (100.0%) |
| 5 to 9 Year Old | 72 (100.0%) | 0 (0.0%) |
| 10 to 14 Year Olds | 58 (79.4%) | 15 (20.5%) |
| 15 to 17 Year Olds | 80 (77.7%) | 23 (22.3%) |
| 18 to 19 Year Olds | 3 (23.1%) | 10 (76.9%) |
| 20 to 24 Year Olds | 0 (0.0%) | 0 (0.0%) |
| 25 to 34 Year Olds | 0 (0.0%) | 5 (100.0%) |
| 35 Years and over | 16 (100.0%) | 0 (0.0%) |
| Total | 229 (79.2%) | 60 (20.8%) |
Educational Attainment by Field of Study in Kemp
Communications (44 | 31.0%), bio, nature & agricultural (35 | 24.6%), education (22 | 15.5%), business (12 | 8.5%), and science & technology (11 | 7.7%) are the most common fields of study among 142 individuals in Kemp who have obtained a bachelor's degree or higher.
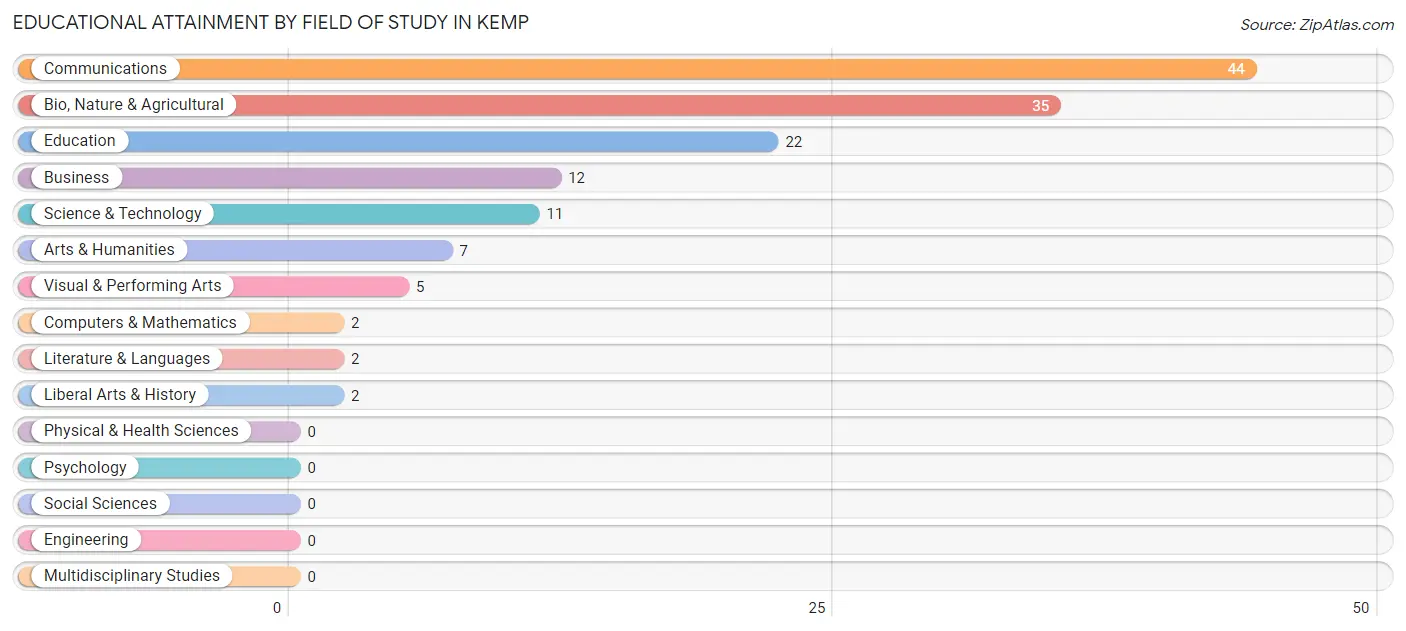
| Field of Study | # Graduates | % Graduates |
| Computers & Mathematics | 2 | 1.4% |
| Bio, Nature & Agricultural | 35 | 24.6% |
| Physical & Health Sciences | 0 | 0.0% |
| Psychology | 0 | 0.0% |
| Social Sciences | 0 | 0.0% |
| Engineering | 0 | 0.0% |
| Multidisciplinary Studies | 0 | 0.0% |
| Science & Technology | 11 | 7.7% |
| Business | 12 | 8.5% |
| Education | 22 | 15.5% |
| Literature & Languages | 2 | 1.4% |
| Liberal Arts & History | 2 | 1.4% |
| Visual & Performing Arts | 5 | 3.5% |
| Communications | 44 | 31.0% |
| Arts & Humanities | 7 | 4.9% |
| Total | 142 | 100.0% |
Transportation & Commute in Kemp
Vehicle Availability by Sex in Kemp
The most prevalent vehicle ownership categories in Kemp are males with 2 vehicles (96, accounting for 33.0%) and females with 2 vehicles (32, making up 36.1%).
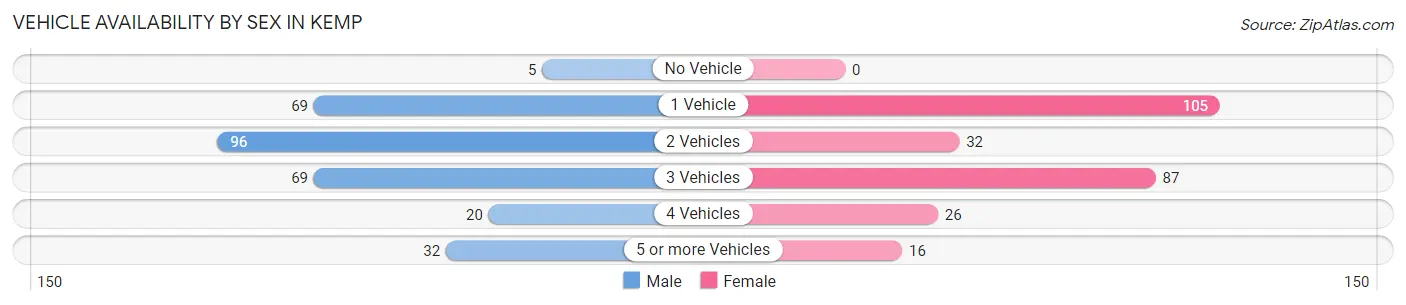
| Vehicles Available | Male | Female |
| No Vehicle | 5 (1.7%) | 0 (0.0%) |
| 1 Vehicle | 69 (23.7%) | 105 (39.5%) |
| 2 Vehicles | 96 (33.0%) | 32 (12.0%) |
| 3 Vehicles | 69 (23.7%) | 87 (32.7%) |
| 4 Vehicles | 20 (6.9%) | 26 (9.8%) |
| 5 or more Vehicles | 32 (11.0%) | 16 (6.0%) |
| Total | 291 (100.0%) | 266 (100.0%) |
Commute Time in Kemp
The most frequently occuring commute durations in Kemp are 60 to 89 minutes (88 commuters, 18.1%), 45 to 59 minutes (76 commuters, 15.7%), and 90 or more minutes (65 commuters, 13.4%).
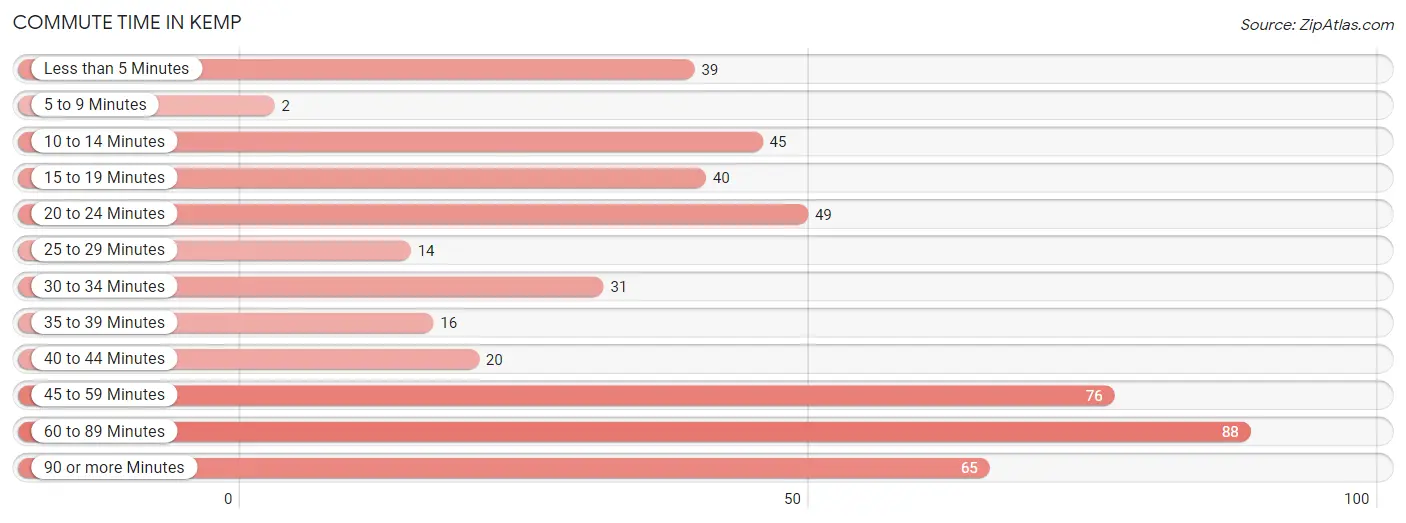
| Commute Time | # Commuters | % Commuters |
| Less than 5 Minutes | 39 | 8.0% |
| 5 to 9 Minutes | 2 | 0.4% |
| 10 to 14 Minutes | 45 | 9.3% |
| 15 to 19 Minutes | 40 | 8.3% |
| 20 to 24 Minutes | 49 | 10.1% |
| 25 to 29 Minutes | 14 | 2.9% |
| 30 to 34 Minutes | 31 | 6.4% |
| 35 to 39 Minutes | 16 | 3.3% |
| 40 to 44 Minutes | 20 | 4.1% |
| 45 to 59 Minutes | 76 | 15.7% |
| 60 to 89 Minutes | 88 | 18.1% |
| 90 or more Minutes | 65 | 13.4% |
Commute Time by Sex in Kemp
The most common commute times in Kemp are 60 to 89 minutes (62 commuters, 21.7%) for males and less than 5 minutes (34 commuters, 17.0%) for females.
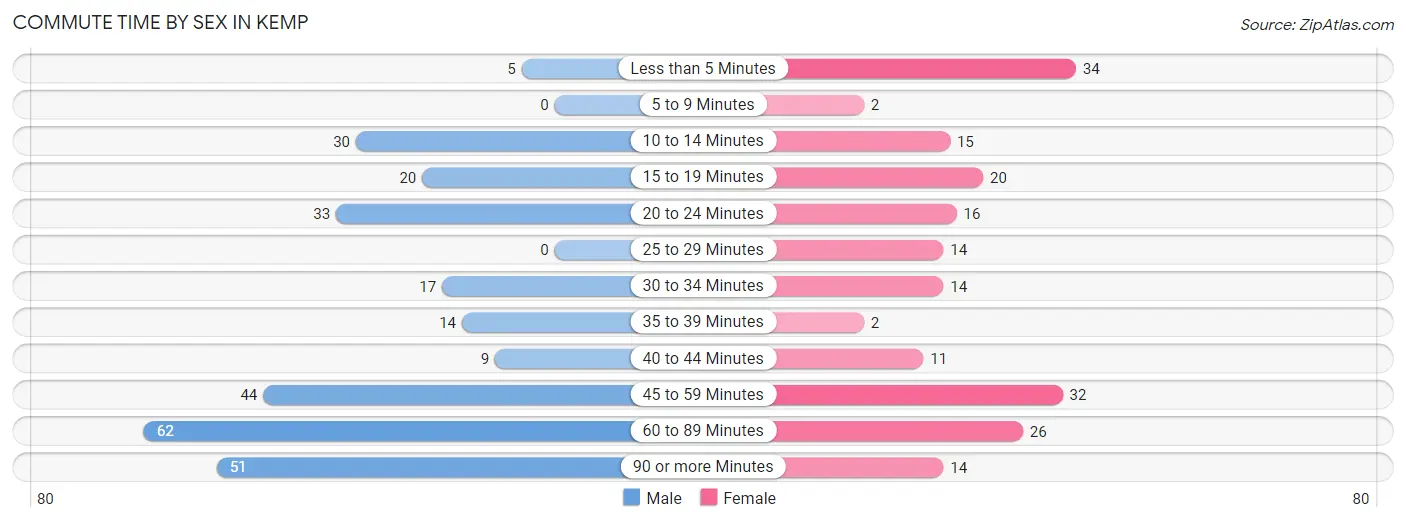
| Commute Time | Male | Female |
| Less than 5 Minutes | 5 (1.8%) | 34 (17.0%) |
| 5 to 9 Minutes | 0 (0.0%) | 2 (1.0%) |
| 10 to 14 Minutes | 30 (10.5%) | 15 (7.5%) |
| 15 to 19 Minutes | 20 (7.0%) | 20 (10.0%) |
| 20 to 24 Minutes | 33 (11.6%) | 16 (8.0%) |
| 25 to 29 Minutes | 0 (0.0%) | 14 (7.0%) |
| 30 to 34 Minutes | 17 (6.0%) | 14 (7.0%) |
| 35 to 39 Minutes | 14 (4.9%) | 2 (1.0%) |
| 40 to 44 Minutes | 9 (3.2%) | 11 (5.5%) |
| 45 to 59 Minutes | 44 (15.4%) | 32 (16.0%) |
| 60 to 89 Minutes | 62 (21.7%) | 26 (13.0%) |
| 90 or more Minutes | 51 (17.9%) | 14 (7.0%) |
Time of Departure to Work by Sex in Kemp
The most frequent times of departure to work in Kemp are 6:30 AM to 6:59 AM (60, 21.0%) for males and 12:00 PM to 3:59 PM (57, 28.5%) for females.
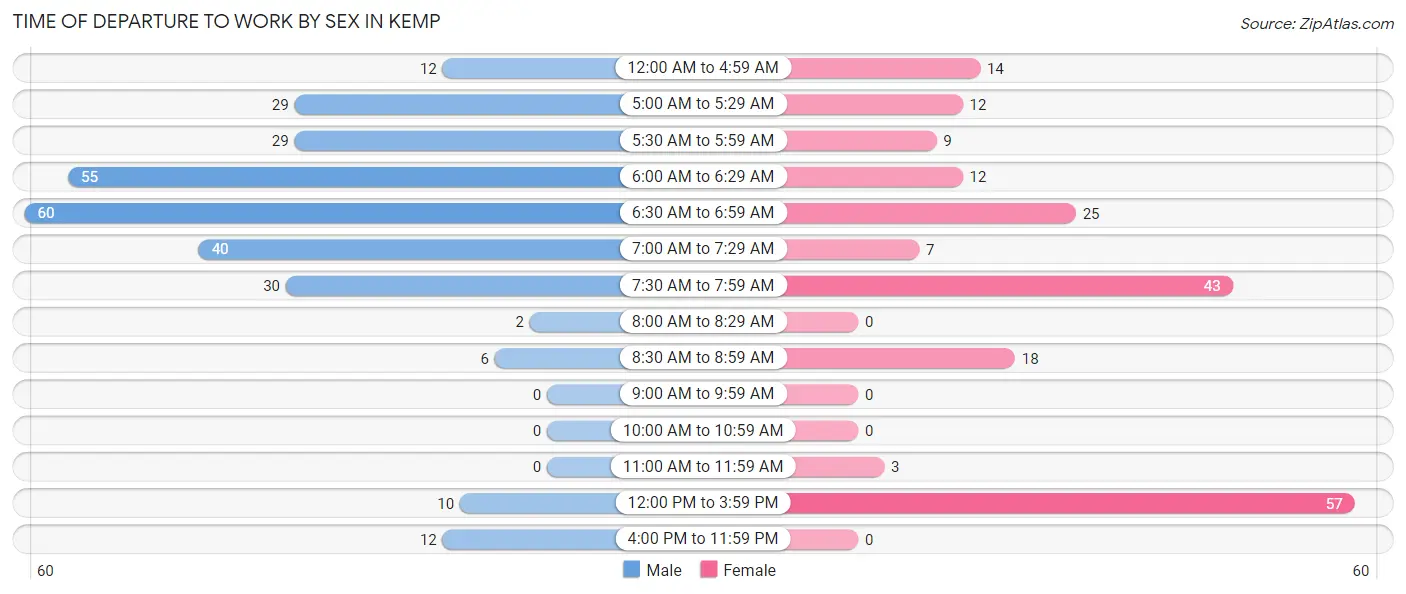
| Time of Departure | Male | Female |
| 12:00 AM to 4:59 AM | 12 (4.2%) | 14 (7.0%) |
| 5:00 AM to 5:29 AM | 29 (10.2%) | 12 (6.0%) |
| 5:30 AM to 5:59 AM | 29 (10.2%) | 9 (4.5%) |
| 6:00 AM to 6:29 AM | 55 (19.3%) | 12 (6.0%) |
| 6:30 AM to 6:59 AM | 60 (21.0%) | 25 (12.5%) |
| 7:00 AM to 7:29 AM | 40 (14.0%) | 7 (3.5%) |
| 7:30 AM to 7:59 AM | 30 (10.5%) | 43 (21.5%) |
| 8:00 AM to 8:29 AM | 2 (0.7%) | 0 (0.0%) |
| 8:30 AM to 8:59 AM | 6 (2.1%) | 18 (9.0%) |
| 9:00 AM to 9:59 AM | 0 (0.0%) | 0 (0.0%) |
| 10:00 AM to 10:59 AM | 0 (0.0%) | 0 (0.0%) |
| 11:00 AM to 11:59 AM | 0 (0.0%) | 3 (1.5%) |
| 12:00 PM to 3:59 PM | 10 (3.5%) | 57 (28.5%) |
| 4:00 PM to 11:59 PM | 12 (4.2%) | 0 (0.0%) |
| Total | 285 (100.0%) | 200 (100.0%) |
Housing Occupancy in Kemp
Occupancy by Ownership in Kemp
Of the total 511 dwellings in Kemp, owner-occupied units account for 323 (63.2%), while renter-occupied units make up 188 (36.8%).
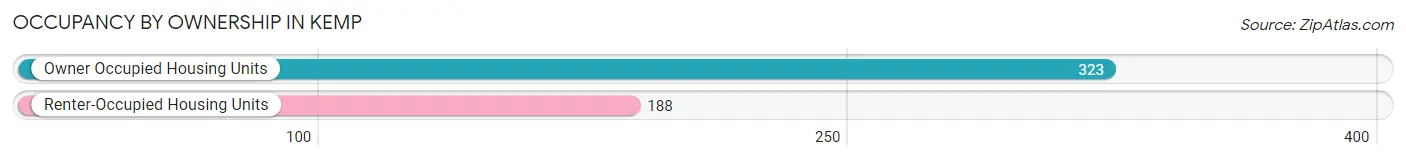
| Occupancy | # Housing Units | % Housing Units |
| Owner Occupied Housing Units | 323 | 63.2% |
| Renter-Occupied Housing Units | 188 | 36.8% |
| Total Occupied Housing Units | 511 | 100.0% |
Occupancy by Household Size in Kemp
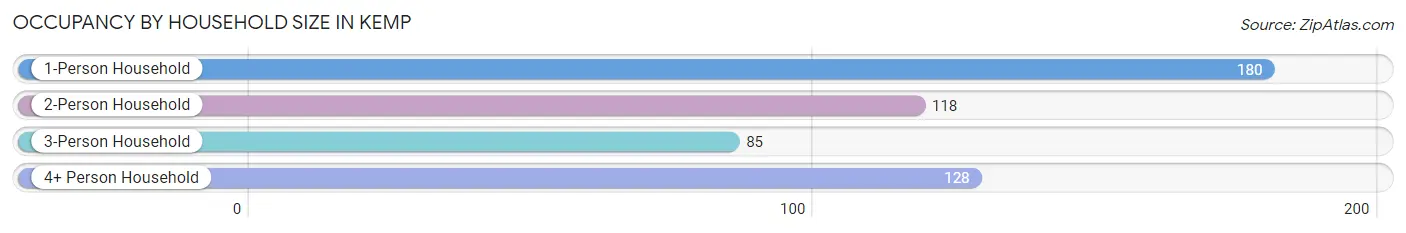
| Household Size | # Housing Units | % Housing Units |
| 1-Person Household | 180 | 35.2% |
| 2-Person Household | 118 | 23.1% |
| 3-Person Household | 85 | 16.6% |
| 4+ Person Household | 128 | 25.1% |
| Total Housing Units | 511 | 100.0% |
Occupancy by Ownership by Household Size in Kemp
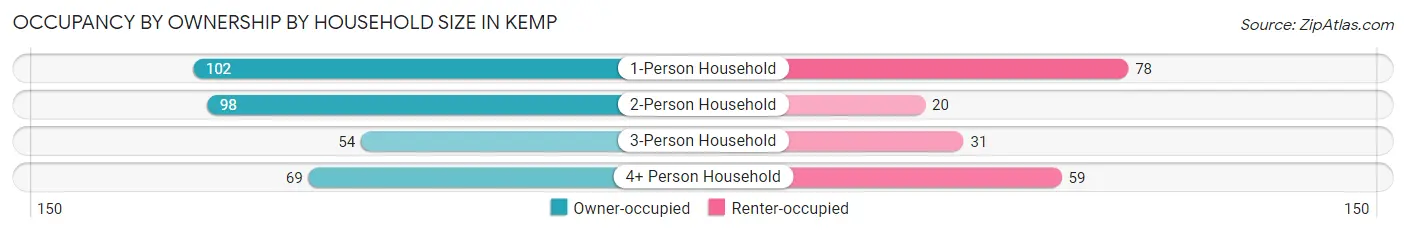
| Household Size | Owner-occupied | Renter-occupied |
| 1-Person Household | 102 (56.7%) | 78 (43.3%) |
| 2-Person Household | 98 (83.1%) | 20 (17.0%) |
| 3-Person Household | 54 (63.5%) | 31 (36.5%) |
| 4+ Person Household | 69 (53.9%) | 59 (46.1%) |
| Total Housing Units | 323 (63.2%) | 188 (36.8%) |
Occupancy by Educational Attainment in Kemp
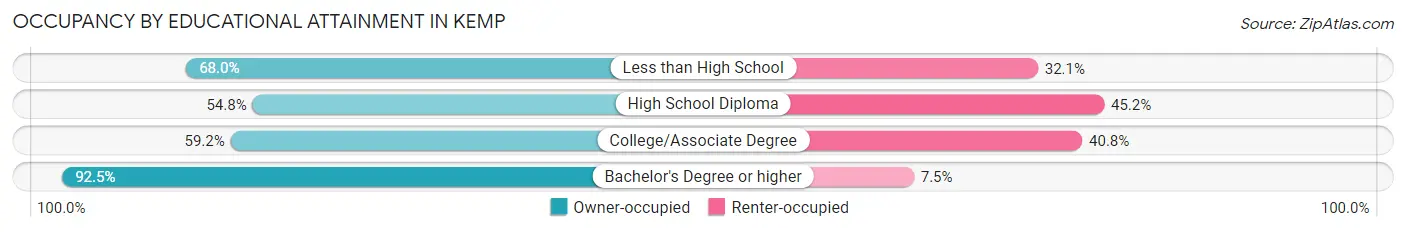
| Household Size | Owner-occupied | Renter-occupied |
| Less than High School | 53 (67.9%) | 25 (32.1%) |
| High School Diploma | 108 (54.8%) | 89 (45.2%) |
| College/Associate Degree | 100 (59.2%) | 69 (40.8%) |
| Bachelor's Degree or higher | 62 (92.5%) | 5 (7.5%) |
Occupancy by Age of Householder in Kemp
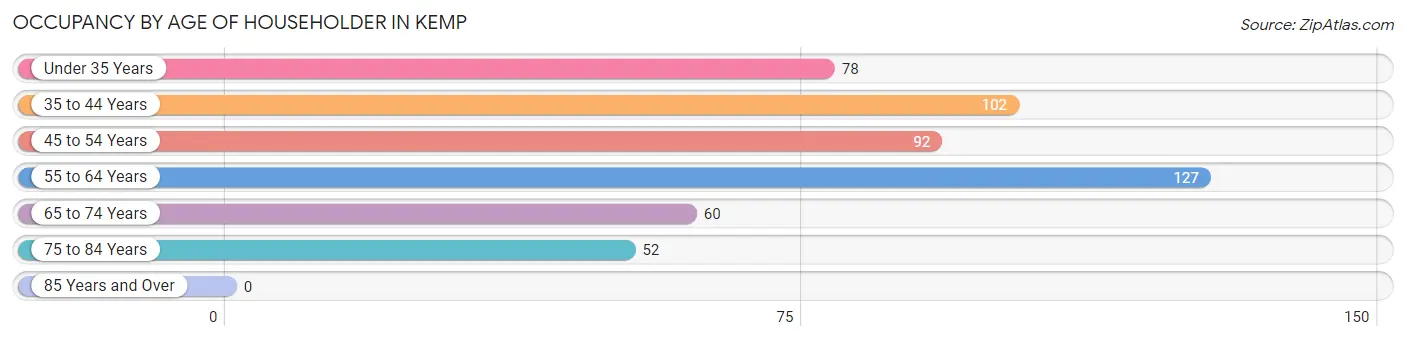
| Age Bracket | # Households | % Households |
| Under 35 Years | 78 | 15.3% |
| 35 to 44 Years | 102 | 20.0% |
| 45 to 54 Years | 92 | 18.0% |
| 55 to 64 Years | 127 | 24.8% |
| 65 to 74 Years | 60 | 11.7% |
| 75 to 84 Years | 52 | 10.2% |
| 85 Years and Over | 0 | 0.0% |
| Total | 511 | 100.0% |
Housing Finances in Kemp
Median Income by Occupancy in Kemp
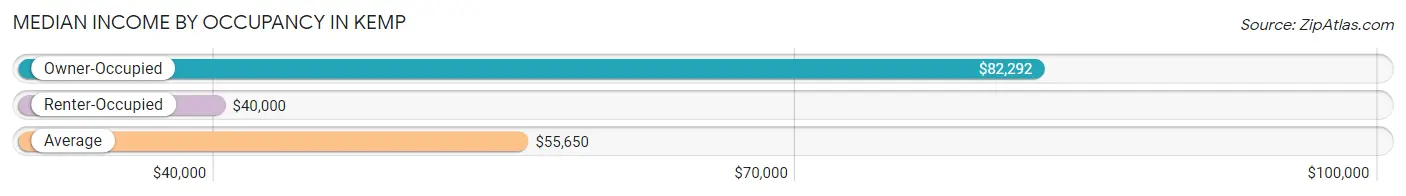
| Occupancy Type | # Households | Median Income |
| Owner-Occupied | 323 (63.2%) | $82,292 |
| Renter-Occupied | 188 (36.8%) | $40,000 |
| Average | 511 (100.0%) | $55,650 |
Occupancy by Householder Income Bracket in Kemp
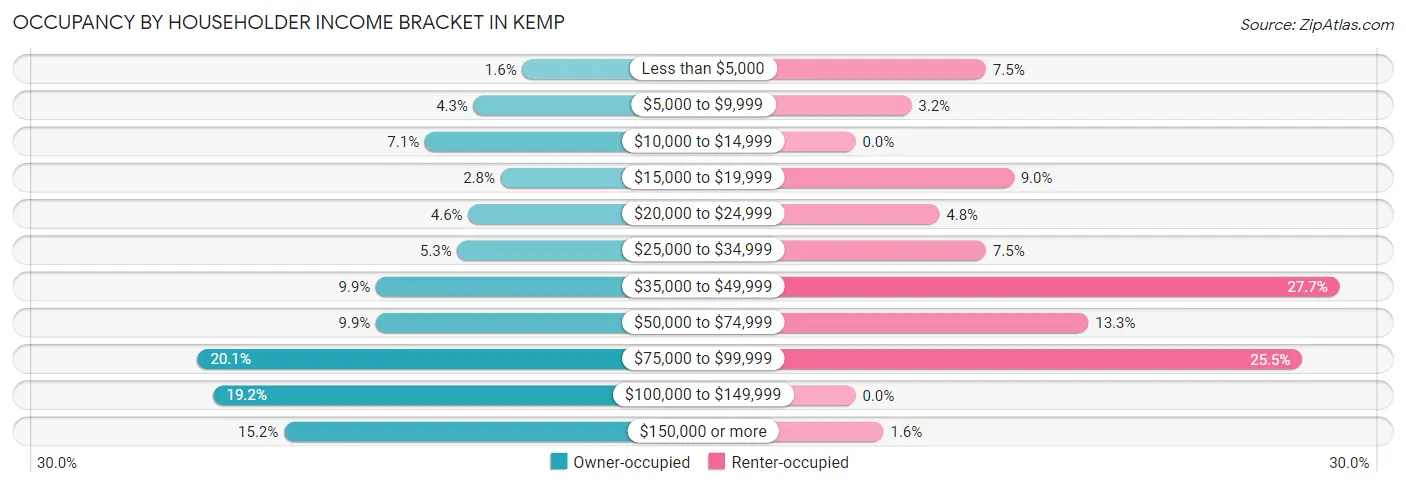
| Income Bracket | Owner-occupied | Renter-occupied |
| Less than $5,000 | 5 (1.5%) | 14 (7.4%) |
| $5,000 to $9,999 | 14 (4.3%) | 6 (3.2%) |
| $10,000 to $14,999 | 23 (7.1%) | 0 (0.0%) |
| $15,000 to $19,999 | 9 (2.8%) | 17 (9.0%) |
| $20,000 to $24,999 | 15 (4.6%) | 9 (4.8%) |
| $25,000 to $34,999 | 17 (5.3%) | 14 (7.4%) |
| $35,000 to $49,999 | 32 (9.9%) | 52 (27.7%) |
| $50,000 to $74,999 | 32 (9.9%) | 25 (13.3%) |
| $75,000 to $99,999 | 65 (20.1%) | 48 (25.5%) |
| $100,000 to $149,999 | 62 (19.2%) | 0 (0.0%) |
| $150,000 or more | 49 (15.2%) | 3 (1.6%) |
| Total | 323 (100.0%) | 188 (100.0%) |
Monthly Housing Cost Tiers in Kemp
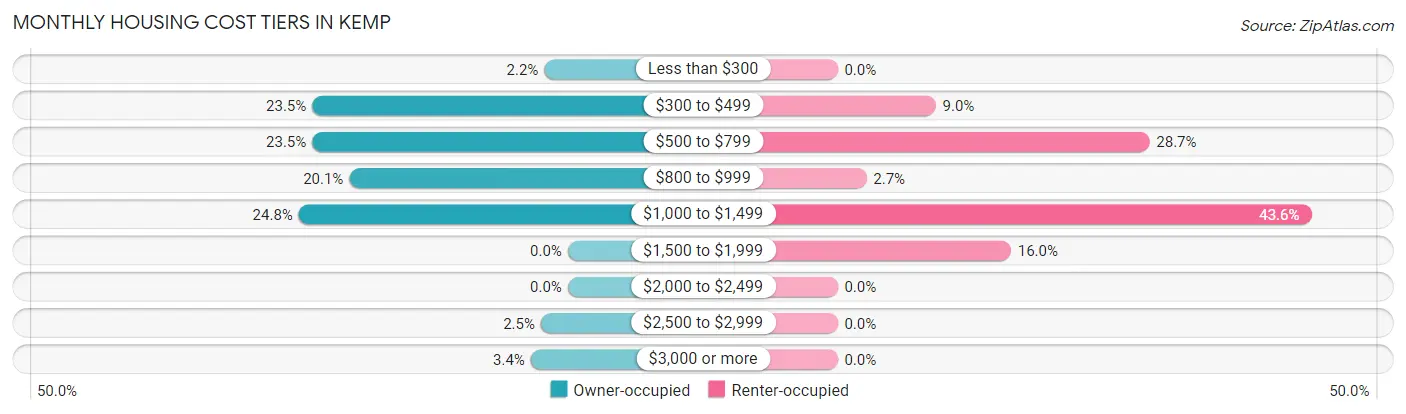
| Monthly Cost | Owner-occupied | Renter-occupied |
| Less than $300 | 7 (2.2%) | 0 (0.0%) |
| $300 to $499 | 76 (23.5%) | 17 (9.0%) |
| $500 to $799 | 76 (23.5%) | 54 (28.7%) |
| $800 to $999 | 65 (20.1%) | 5 (2.7%) |
| $1,000 to $1,499 | 80 (24.8%) | 82 (43.6%) |
| $1,500 to $1,999 | 0 (0.0%) | 30 (16.0%) |
| $2,000 to $2,499 | 0 (0.0%) | 0 (0.0%) |
| $2,500 to $2,999 | 8 (2.5%) | 0 (0.0%) |
| $3,000 or more | 11 (3.4%) | 0 (0.0%) |
| Total | 323 (100.0%) | 188 (100.0%) |
Physical Housing Characteristics in Kemp
Housing Structures in Kemp
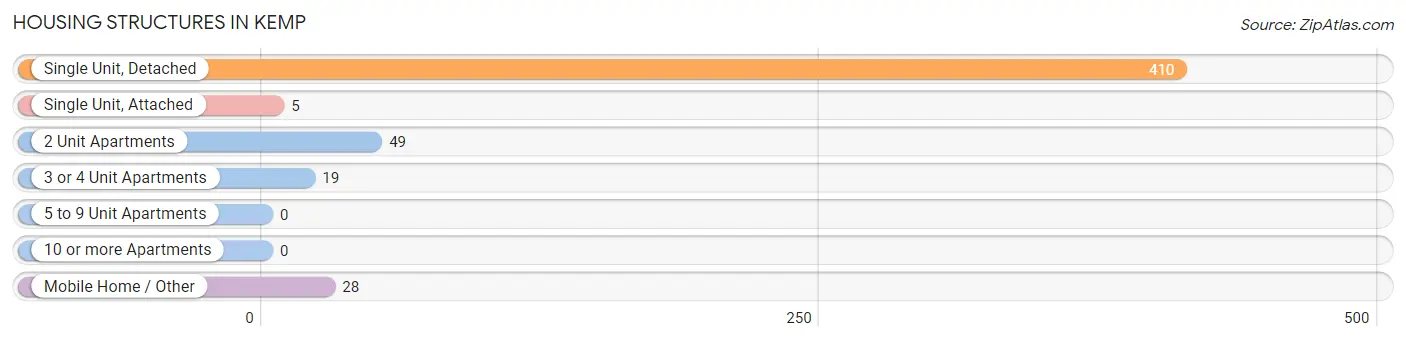
| Structure Type | # Housing Units | % Housing Units |
| Single Unit, Detached | 410 | 80.2% |
| Single Unit, Attached | 5 | 1.0% |
| 2 Unit Apartments | 49 | 9.6% |
| 3 or 4 Unit Apartments | 19 | 3.7% |
| 5 to 9 Unit Apartments | 0 | 0.0% |
| 10 or more Apartments | 0 | 0.0% |
| Mobile Home / Other | 28 | 5.5% |
| Total | 511 | 100.0% |
Housing Structures by Occupancy in Kemp
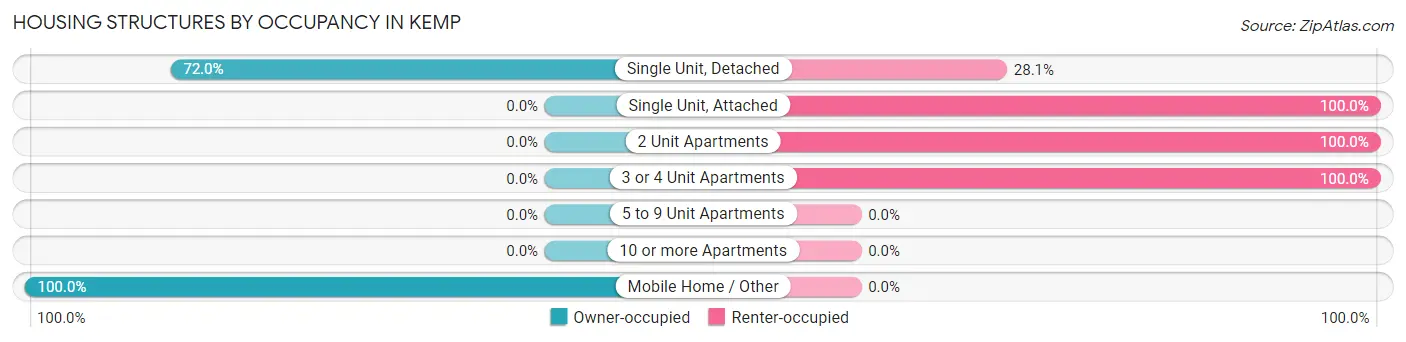
| Structure Type | Owner-occupied | Renter-occupied |
| Single Unit, Detached | 295 (72.0%) | 115 (28.1%) |
| Single Unit, Attached | 0 (0.0%) | 5 (100.0%) |
| 2 Unit Apartments | 0 (0.0%) | 49 (100.0%) |
| 3 or 4 Unit Apartments | 0 (0.0%) | 19 (100.0%) |
| 5 to 9 Unit Apartments | 0 (0.0%) | 0 (0.0%) |
| 10 or more Apartments | 0 (0.0%) | 0 (0.0%) |
| Mobile Home / Other | 28 (100.0%) | 0 (0.0%) |
| Total | 323 (63.2%) | 188 (36.8%) |
Housing Structures by Number of Rooms in Kemp
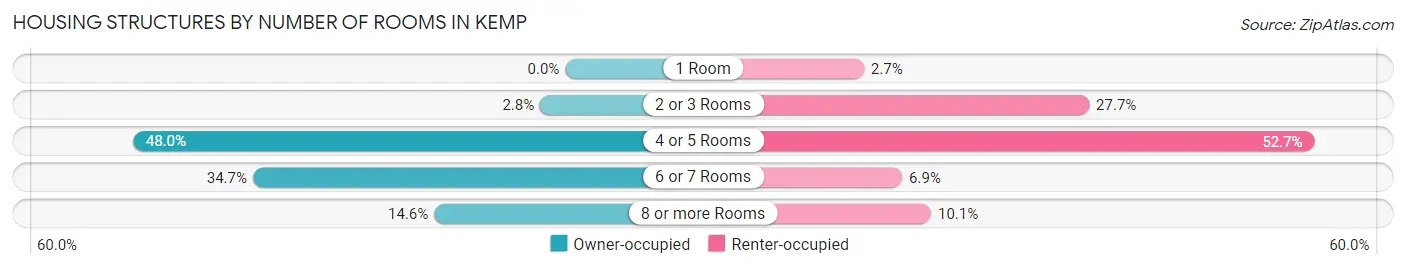
| Number of Rooms | Owner-occupied | Renter-occupied |
| 1 Room | 0 (0.0%) | 5 (2.7%) |
| 2 or 3 Rooms | 9 (2.8%) | 52 (27.7%) |
| 4 or 5 Rooms | 155 (48.0%) | 99 (52.7%) |
| 6 or 7 Rooms | 112 (34.7%) | 13 (6.9%) |
| 8 or more Rooms | 47 (14.5%) | 19 (10.1%) |
| Total | 323 (100.0%) | 188 (100.0%) |
Housing Structure by Heating Type in Kemp
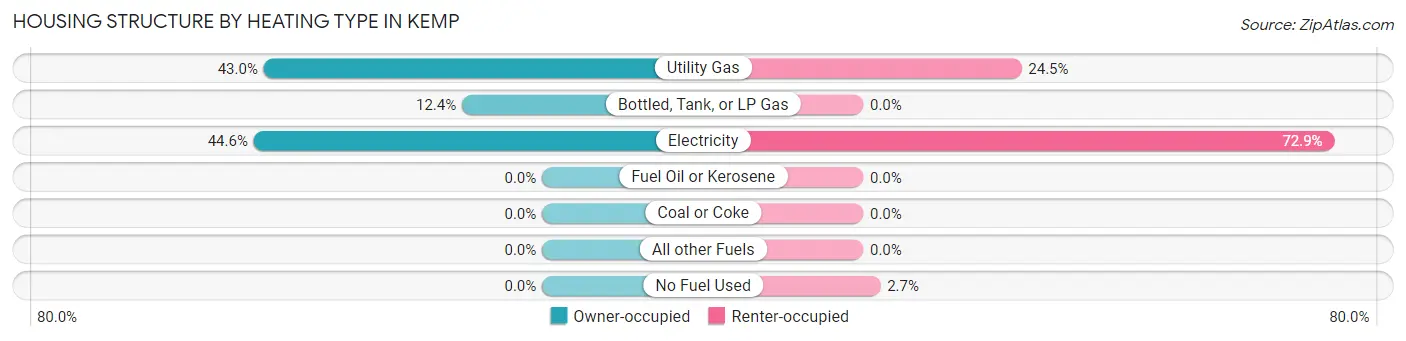
| Heating Type | Owner-occupied | Renter-occupied |
| Utility Gas | 139 (43.0%) | 46 (24.5%) |
| Bottled, Tank, or LP Gas | 40 (12.4%) | 0 (0.0%) |
| Electricity | 144 (44.6%) | 137 (72.9%) |
| Fuel Oil or Kerosene | 0 (0.0%) | 0 (0.0%) |
| Coal or Coke | 0 (0.0%) | 0 (0.0%) |
| All other Fuels | 0 (0.0%) | 0 (0.0%) |
| No Fuel Used | 0 (0.0%) | 5 (2.7%) |
| Total | 323 (100.0%) | 188 (100.0%) |
Household Vehicle Usage in Kemp
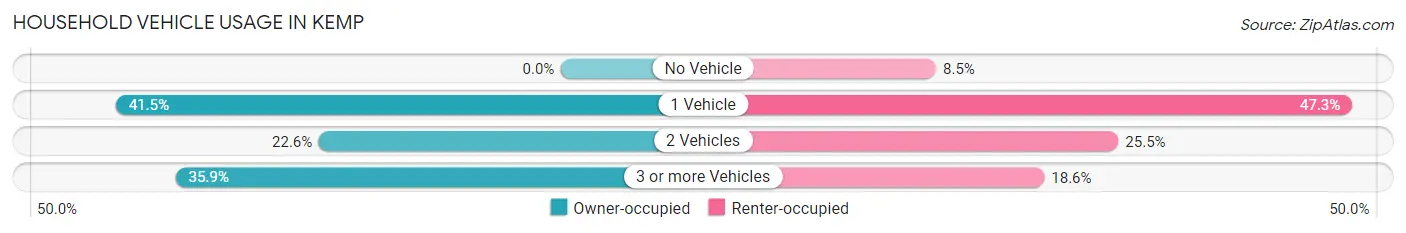
| Vehicles per Household | Owner-occupied | Renter-occupied |
| No Vehicle | 0 (0.0%) | 16 (8.5%) |
| 1 Vehicle | 134 (41.5%) | 89 (47.3%) |
| 2 Vehicles | 73 (22.6%) | 48 (25.5%) |
| 3 or more Vehicles | 116 (35.9%) | 35 (18.6%) |
| Total | 323 (100.0%) | 188 (100.0%) |
Real Estate & Mortgages in Kemp
Real Estate and Mortgage Overview in Kemp
| Characteristic | Without Mortgage | With Mortgage |
| Housing Units | 207 | 116 |
| Median Property Value | $99,200 | $158,900 |
| Median Household Income | $84,625 | $15 |
| Monthly Housing Costs | $585 | $11 |
| Real Estate Taxes | $1,417 | $4 |
Property Value by Mortgage Status in Kemp
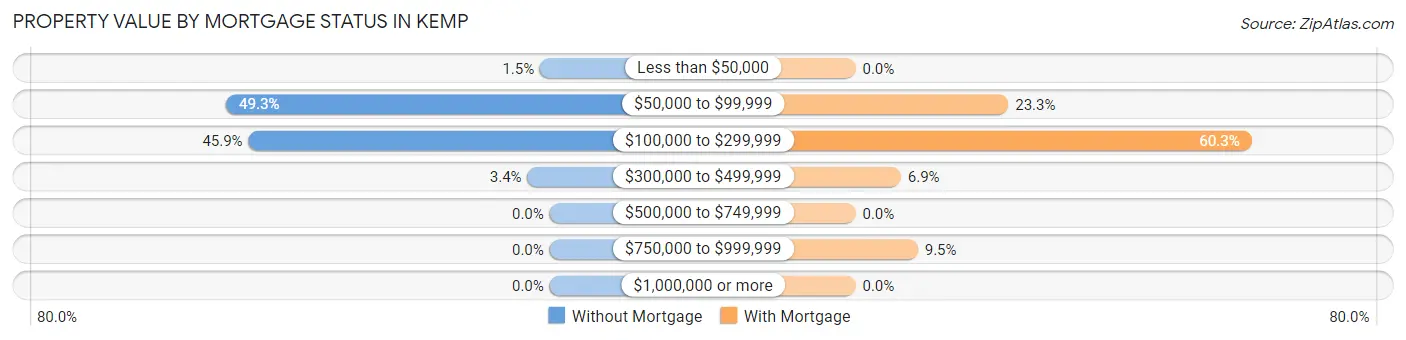
| Property Value | Without Mortgage | With Mortgage |
| Less than $50,000 | 3 (1.5%) | 0 (0.0%) |
| $50,000 to $99,999 | 102 (49.3%) | 27 (23.3%) |
| $100,000 to $299,999 | 95 (45.9%) | 70 (60.3%) |
| $300,000 to $499,999 | 7 (3.4%) | 8 (6.9%) |
| $500,000 to $749,999 | 0 (0.0%) | 0 (0.0%) |
| $750,000 to $999,999 | 0 (0.0%) | 11 (9.5%) |
| $1,000,000 or more | 0 (0.0%) | 0 (0.0%) |
| Total | 207 (100.0%) | 116 (100.0%) |
Household Income by Mortgage Status in Kemp
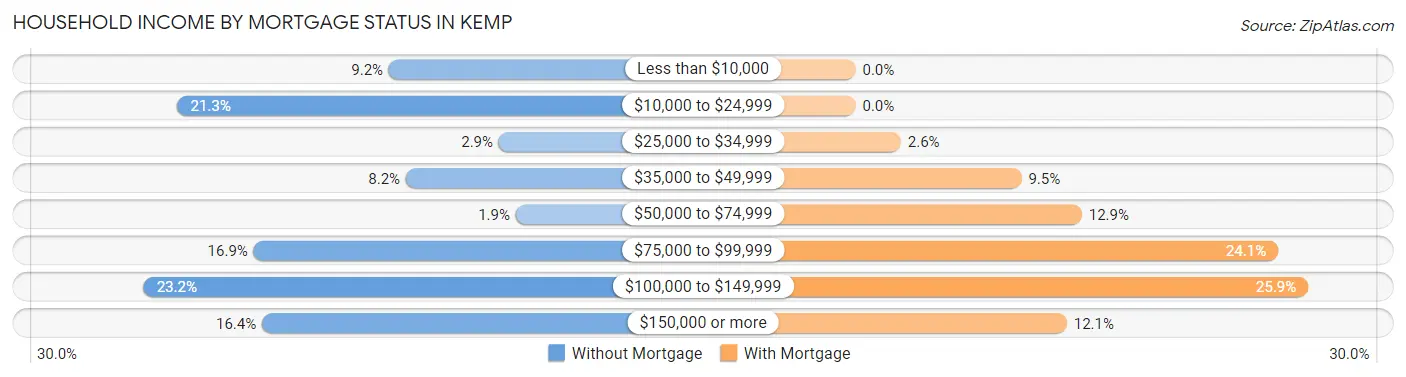
| Household Income | Without Mortgage | With Mortgage |
| Less than $10,000 | 19 (9.2%) | 0 (0.0%) |
| $10,000 to $24,999 | 44 (21.3%) | 0 (0.0%) |
| $25,000 to $34,999 | 6 (2.9%) | 3 (2.6%) |
| $35,000 to $49,999 | 17 (8.2%) | 11 (9.5%) |
| $50,000 to $74,999 | 4 (1.9%) | 15 (12.9%) |
| $75,000 to $99,999 | 35 (16.9%) | 28 (24.1%) |
| $100,000 to $149,999 | 48 (23.2%) | 30 (25.9%) |
| $150,000 or more | 34 (16.4%) | 14 (12.1%) |
| Total | 207 (100.0%) | 116 (100.0%) |
Property Value to Household Income Ratio in Kemp
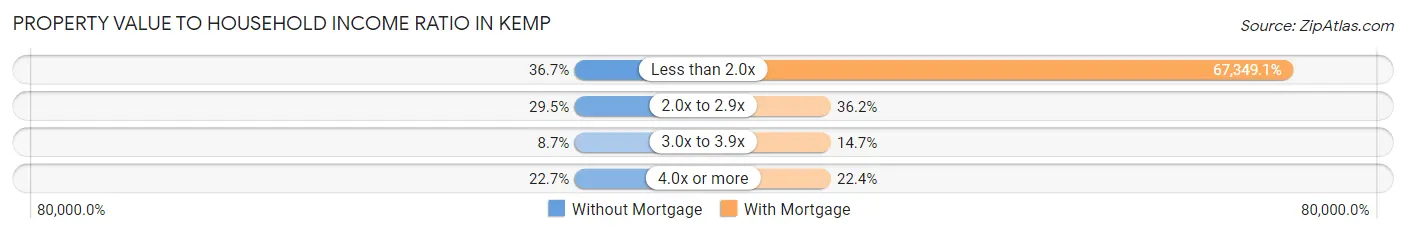
| Value-to-Income Ratio | Without Mortgage | With Mortgage |
| Less than 2.0x | 76 (36.7%) | 78,125 (67,349.1%) |
| 2.0x to 2.9x | 61 (29.5%) | 42 (36.2%) |
| 3.0x to 3.9x | 18 (8.7%) | 17 (14.7%) |
| 4.0x or more | 47 (22.7%) | 26 (22.4%) |
| Total | 207 (100.0%) | 116 (100.0%) |
Real Estate Taxes by Mortgage Status in Kemp
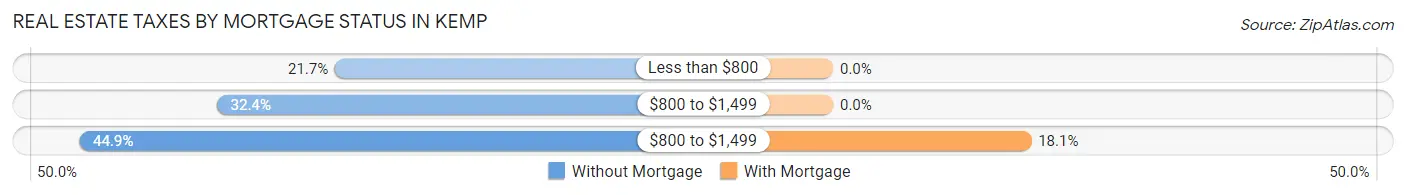
| Property Taxes | Without Mortgage | With Mortgage |
| Less than $800 | 45 (21.7%) | 0 (0.0%) |
| $800 to $1,499 | 67 (32.4%) | 0 (0.0%) |
| $800 to $1,499 | 93 (44.9%) | 21 (18.1%) |
| Total | 207 (100.0%) | 116 (100.0%) |
Health & Disability in Kemp
Health Insurance Coverage by Age in Kemp
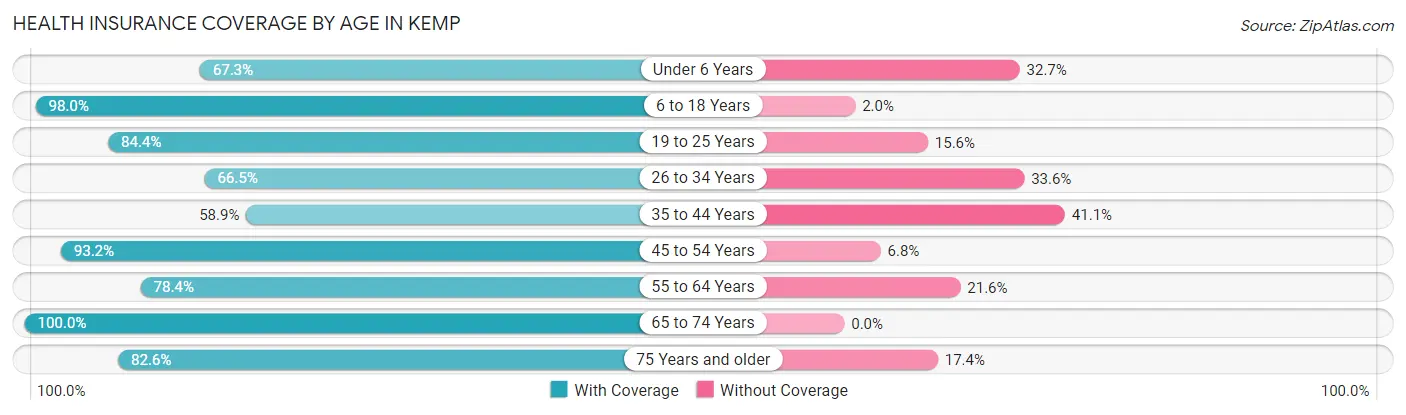
| Age Bracket | With Coverage | Without Coverage |
| Under 6 Years | 70 (67.3%) | 34 (32.7%) |
| 6 to 18 Years | 240 (98.0%) | 5 (2.0%) |
| 19 to 25 Years | 65 (84.4%) | 12 (15.6%) |
| 26 to 34 Years | 103 (66.4%) | 52 (33.6%) |
| 35 to 44 Years | 103 (58.9%) | 72 (41.1%) |
| 45 to 54 Years | 179 (93.2%) | 13 (6.8%) |
| 55 to 64 Years | 134 (78.4%) | 37 (21.6%) |
| 65 to 74 Years | 89 (100.0%) | 0 (0.0%) |
| 75 Years and older | 71 (82.6%) | 15 (17.4%) |
| Total | 1,054 (81.5%) | 240 (18.5%) |
Health Insurance Coverage by Citizenship Status in Kemp
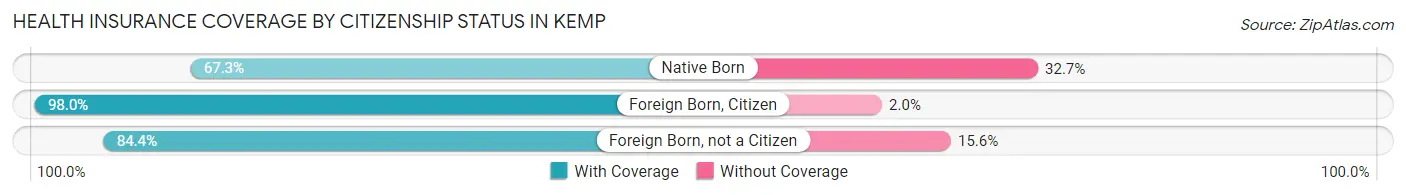
| Citizenship Status | With Coverage | Without Coverage |
| Native Born | 70 (67.3%) | 34 (32.7%) |
| Foreign Born, Citizen | 240 (98.0%) | 5 (2.0%) |
| Foreign Born, not a Citizen | 65 (84.4%) | 12 (15.6%) |
Health Insurance Coverage by Household Income in Kemp
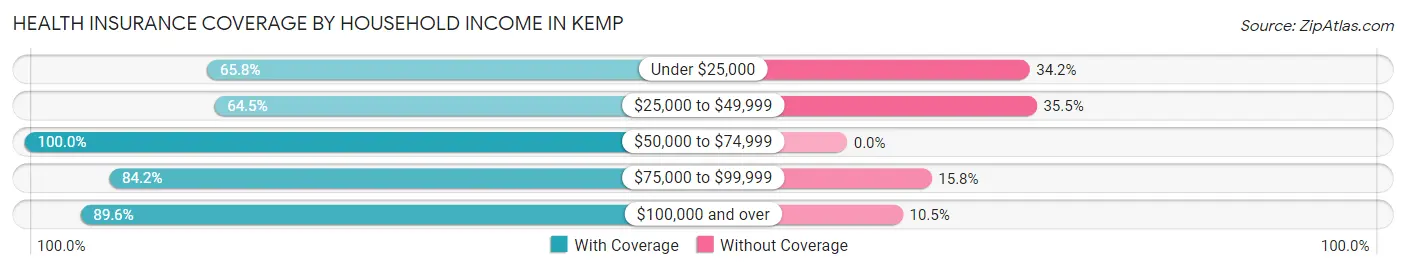
| Household Income | With Coverage | Without Coverage |
| Under $25,000 | 127 (65.8%) | 66 (34.2%) |
| $25,000 to $49,999 | 156 (64.5%) | 86 (35.5%) |
| $50,000 to $74,999 | 183 (100.0%) | 0 (0.0%) |
| $75,000 to $99,999 | 271 (84.2%) | 51 (15.8%) |
| $100,000 and over | 317 (89.5%) | 37 (10.4%) |
Public vs Private Health Insurance Coverage by Age in Kemp
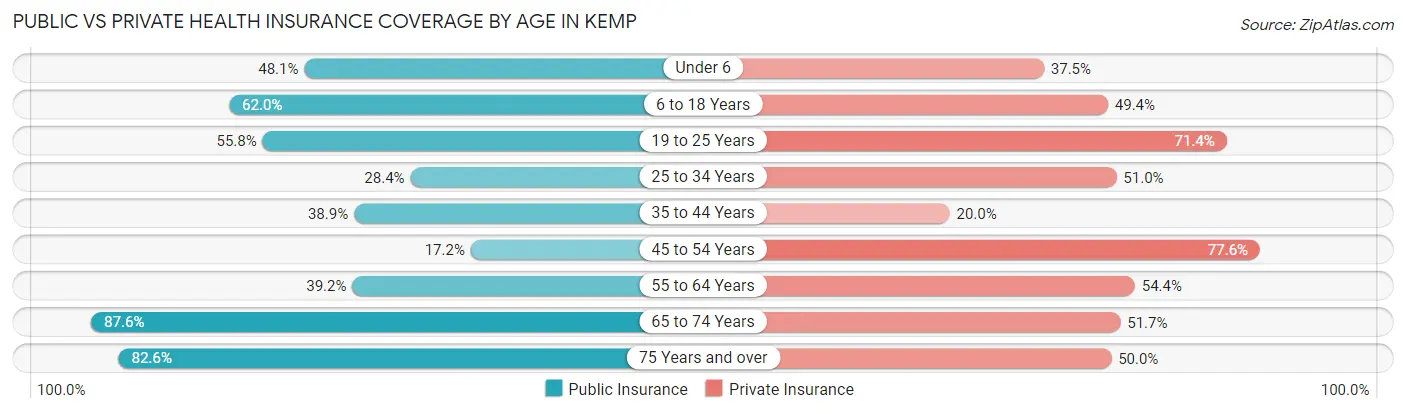
| Age Bracket | Public Insurance | Private Insurance |
| Under 6 | 50 (48.1%) | 39 (37.5%) |
| 6 to 18 Years | 152 (62.0%) | 121 (49.4%) |
| 19 to 25 Years | 43 (55.8%) | 55 (71.4%) |
| 25 to 34 Years | 44 (28.4%) | 79 (51.0%) |
| 35 to 44 Years | 68 (38.9%) | 35 (20.0%) |
| 45 to 54 Years | 33 (17.2%) | 149 (77.6%) |
| 55 to 64 Years | 67 (39.2%) | 93 (54.4%) |
| 65 to 74 Years | 78 (87.6%) | 46 (51.7%) |
| 75 Years and over | 71 (82.6%) | 43 (50.0%) |
| Total | 606 (46.8%) | 660 (51.0%) |
Disability Status by Sex by Age in Kemp
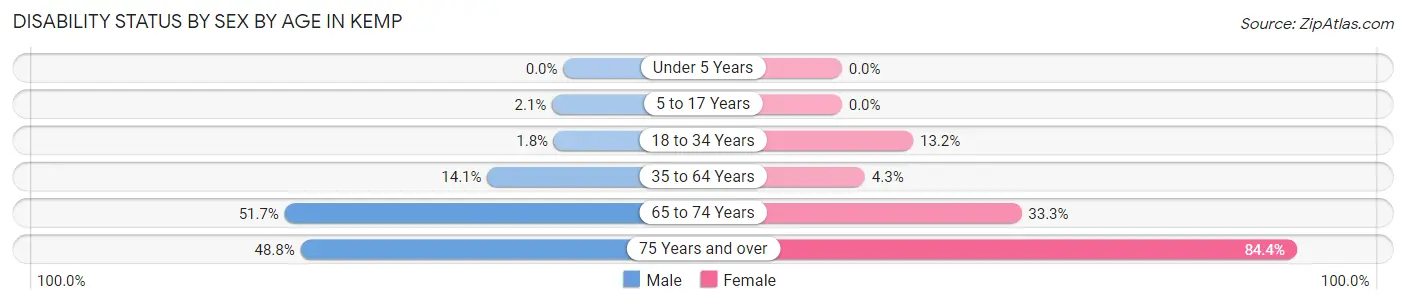
| Age Bracket | Male | Female |
| Under 5 Years | 0 (0.0%) | 0 (0.0%) |
| 5 to 17 Years | 3 (2.1%) | 0 (0.0%) |
| 18 to 34 Years | 2 (1.8%) | 16 (13.2%) |
| 35 to 64 Years | 43 (14.1%) | 10 (4.3%) |
| 65 to 74 Years | 15 (51.7%) | 20 (33.3%) |
| 75 Years and over | 20 (48.8%) | 38 (84.4%) |
Disability Class by Sex by Age in Kemp
Disability Class: Hearing Difficulty
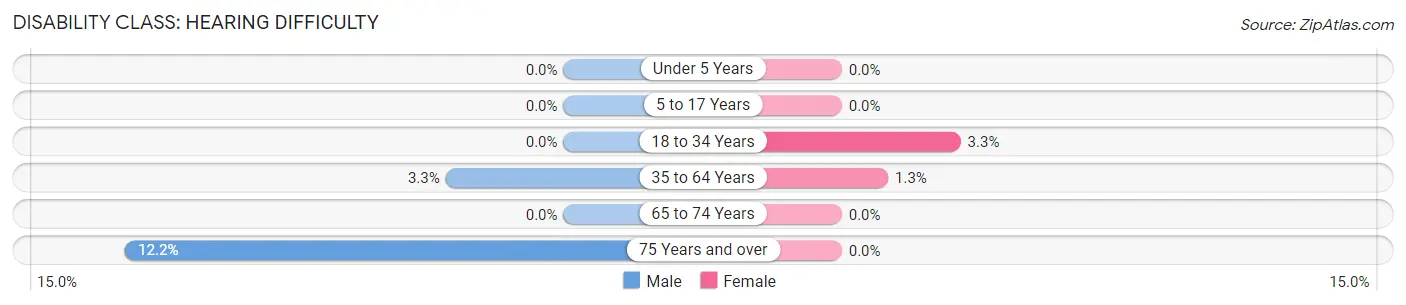
| Age Bracket | Male | Female |
| Under 5 Years | 0 (0.0%) | 0 (0.0%) |
| 5 to 17 Years | 0 (0.0%) | 0 (0.0%) |
| 18 to 34 Years | 0 (0.0%) | 4 (3.3%) |
| 35 to 64 Years | 10 (3.3%) | 3 (1.3%) |
| 65 to 74 Years | 0 (0.0%) | 0 (0.0%) |
| 75 Years and over | 5 (12.2%) | 0 (0.0%) |
Disability Class: Vision Difficulty
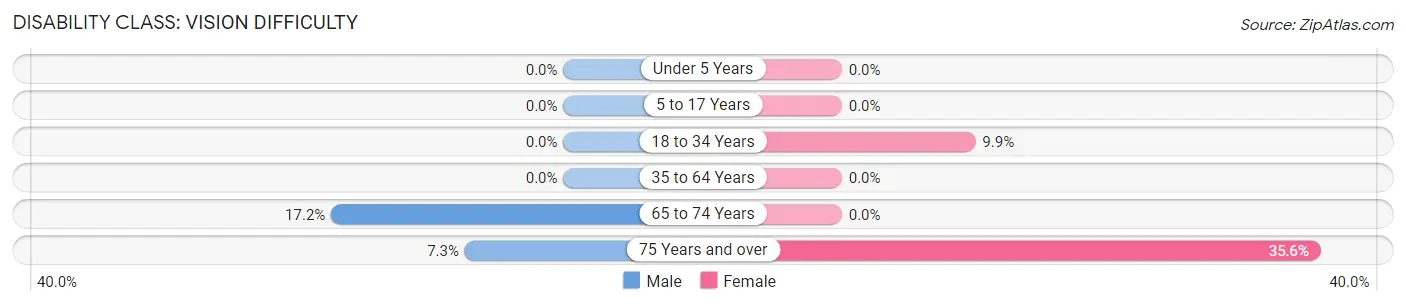
| Age Bracket | Male | Female |
| Under 5 Years | 0 (0.0%) | 0 (0.0%) |
| 5 to 17 Years | 0 (0.0%) | 0 (0.0%) |
| 18 to 34 Years | 0 (0.0%) | 12 (9.9%) |
| 35 to 64 Years | 0 (0.0%) | 0 (0.0%) |
| 65 to 74 Years | 5 (17.2%) | 0 (0.0%) |
| 75 Years and over | 3 (7.3%) | 16 (35.6%) |
Disability Class: Cognitive Difficulty
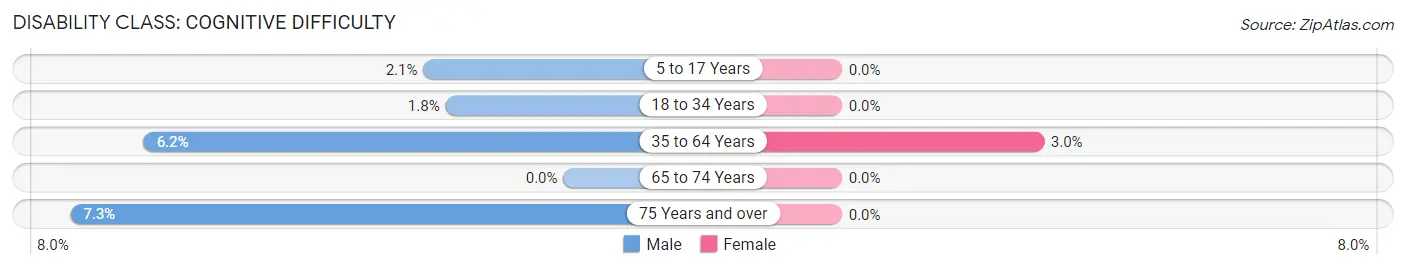
| Age Bracket | Male | Female |
| 5 to 17 Years | 3 (2.1%) | 0 (0.0%) |
| 18 to 34 Years | 2 (1.8%) | 0 (0.0%) |
| 35 to 64 Years | 19 (6.2%) | 7 (3.0%) |
| 65 to 74 Years | 0 (0.0%) | 0 (0.0%) |
| 75 Years and over | 3 (7.3%) | 0 (0.0%) |
Disability Class: Ambulatory Difficulty
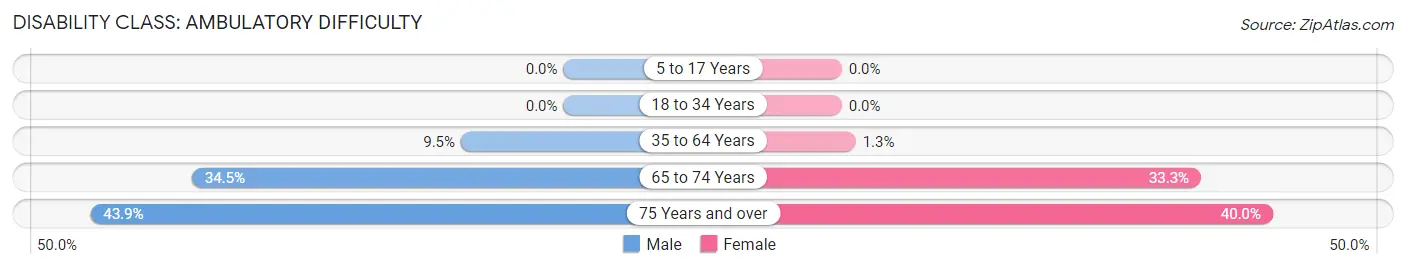
| Age Bracket | Male | Female |
| 5 to 17 Years | 0 (0.0%) | 0 (0.0%) |
| 18 to 34 Years | 0 (0.0%) | 0 (0.0%) |
| 35 to 64 Years | 29 (9.5%) | 3 (1.3%) |
| 65 to 74 Years | 10 (34.5%) | 20 (33.3%) |
| 75 Years and over | 18 (43.9%) | 18 (40.0%) |
Disability Class: Self-Care Difficulty
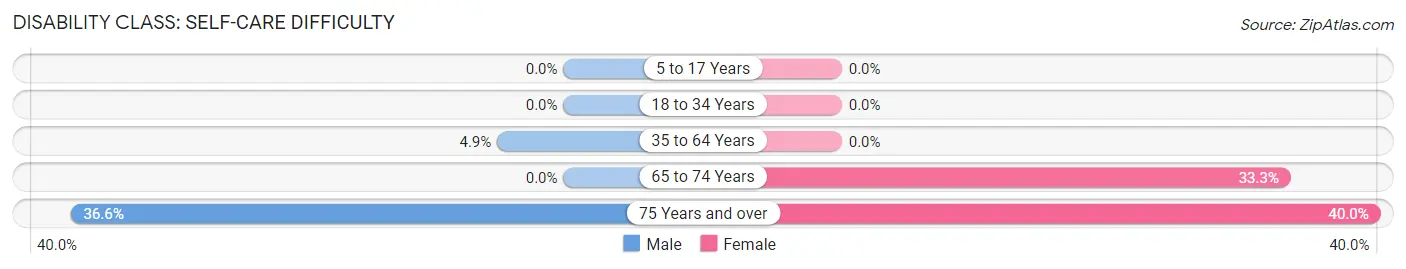
| Age Bracket | Male | Female |
| 5 to 17 Years | 0 (0.0%) | 0 (0.0%) |
| 18 to 34 Years | 0 (0.0%) | 0 (0.0%) |
| 35 to 64 Years | 15 (4.9%) | 0 (0.0%) |
| 65 to 74 Years | 0 (0.0%) | 20 (33.3%) |
| 75 Years and over | 15 (36.6%) | 18 (40.0%) |
Technology Access in Kemp
Computing Device Access in Kemp
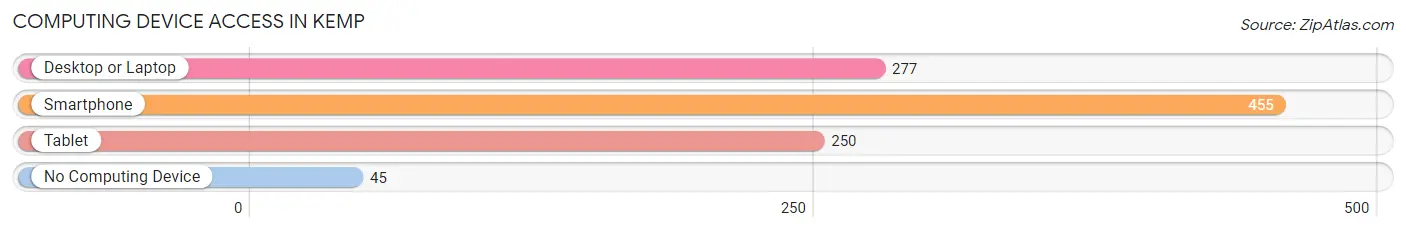
| Device Type | # Households | % Households |
| Desktop or Laptop | 277 | 54.2% |
| Smartphone | 455 | 89.0% |
| Tablet | 250 | 48.9% |
| No Computing Device | 45 | 8.8% |
| Total | 511 | 100.0% |
Internet Access in Kemp
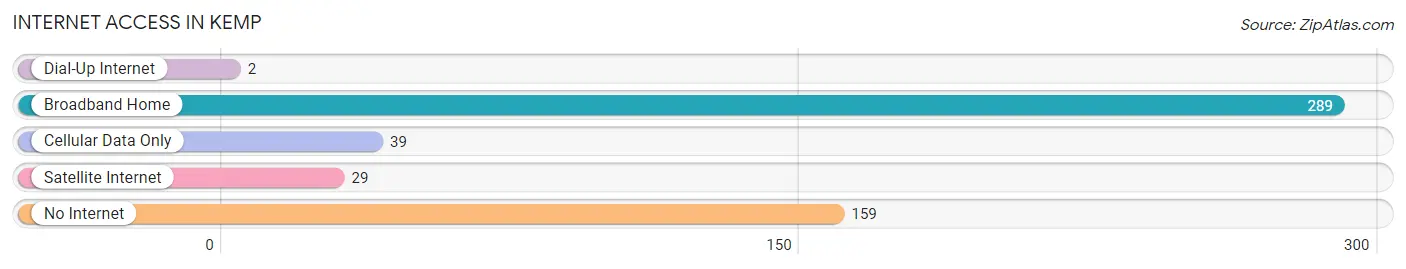
| Internet Type | # Households | % Households |
| Dial-Up Internet | 2 | 0.4% |
| Broadband Home | 289 | 56.6% |
| Cellular Data Only | 39 | 7.6% |
| Satellite Internet | 29 | 5.7% |
| No Internet | 159 | 31.1% |
| Total | 511 | 100.0% |
Kemp Summary
Kemp, Texas is a small town located in Kaufman County, Texas, United States. It is situated about 30 miles east of Dallas and is part of the Dallas-Fort Worth Metroplex. The population of Kemp was 1,717 at the 2010 census.
History
Kemp was founded in 1848 by William Kemp, a settler from Tennessee. The town was originally known as Kemp's Prairie, and was later shortened to Kemp. The town was incorporated in 1873.
Kemp was a farming community until the early 1900s, when the railroad came through the area. This allowed for the development of the town, and it soon became a center for cotton production. The town also had a number of businesses, including a bank, a hotel, a general store, and a post office.
In the 1920s, Kemp was a thriving community with a population of over 1,000. The town had a number of businesses, including a movie theater, a drug store, and a variety of other stores.
Geography
Kemp is located at 32°45'25" North, 96°25'45" West (32.756944, -96.429167). The town is situated on the western edge of Kaufman County, about 30 miles east of Dallas.
The town is located in the Blackland Prairie region of Texas, and is characterized by flat terrain and fertile soil. The area is known for its cotton production, and the town is surrounded by cotton fields.
Economy
Kemp's economy is largely based on agriculture. The town is surrounded by cotton fields, and cotton is the main crop grown in the area. Other crops grown in the area include corn, soybeans, and wheat.
The town also has a number of businesses, including a bank, a hotel, a general store, and a post office. There are also a number of restaurants and other small businesses in the town.
Demographics
As of the 2010 census, the population of Kemp was 1,717. The racial makeup of the town was 79.2% White, 16.2% Hispanic or Latino, 1.3% African American, 0.7% Native American, 0.3% Asian, and 2.5% from other races.
The median household income in Kemp was $37,917, and the median family income was $45,625. The per capita income in the town was $17,917.
Conclusion
Kemp, Texas is a small town located in Kaufman County, Texas, United States. It is situated about 30 miles east of Dallas and is part of the Dallas-Fort Worth Metroplex. The town was founded in 1848 by William Kemp, and was originally known as Kemp's Prairie. The town was incorporated in 1873 and has a population of 1,717 as of the 2010 census. The town's economy is largely based on agriculture, with cotton being the main crop grown in the area. The town also has a number of businesses, including a bank, a hotel, a general store, and a post office. The racial makeup of the town is 79.2% White, 16.2% Hispanic or Latino, 1.3% African American, 0.7% Native American, 0.3% Asian, and 2.5% from other races. The median household income in Kemp was $37,917, and the median family income was $45,625.
Common Questions
What is Per Capita Income in Kemp?
Per Capita income in Kemp is $26,810.
What is the Median Family Income in Kemp?
Median Family Income in Kemp is $79,837.
What is the Median Household income in Kemp?
Median Household Income in Kemp is $55,650.
What is Income or Wage Gap in Kemp?
Income or Wage Gap in Kemp is 14.3%.
Women in Kemp earn 85.7 cents for every dollar earned by a man.
What is Family Income Deficit in Kemp?
Family Income Deficit in Kemp is $5,600.
Families that are below poverty line in Kemp earn $5,600 less on average than the poverty threshold level.
What is Inequality or Gini Index in Kemp?
Inequality or Gini Index in Kemp is 0.41.
What is the Total Population of Kemp?
Total Population of Kemp is 1,419.
What is the Total Male Population of Kemp?
Total Male Population of Kemp is 656.
What is the Total Female Population of Kemp?
Total Female Population of Kemp is 763.
What is the Ratio of Males per 100 Females in Kemp?
There are 85.98 Males per 100 Females in Kemp.
What is the Ratio of Females per 100 Males in Kemp?
There are 116.31 Females per 100 Males in Kemp.
What is the Median Population Age in Kemp?
Median Population Age in Kemp is 40.3 Years.
What is the Average Family Size in Kemp
Average Family Size in Kemp is 3.4 People.
What is the Average Household Size in Kemp
Average Household Size in Kemp is 2.5 People.
How Large is the Labor Force in Kemp?
There are 650 People in the Labor Forcein in Kemp.
What is the Percentage of People in the Labor Force in Kemp?
57.3% of People are in the Labor Force in Kemp.
What is the Unemployment Rate in Kemp?
Unemployment Rate in Kemp is 4.2%.