Jefferson, TX Map & Demographics
Jefferson Map
Jefferson Overview
$27,669
PER CAPITA INCOME
$53,140
AVG FAMILY INCOME
$47,524
AVG HOUSEHOLD INCOME
16.3%
WAGE / INCOME GAP [ % ]
83.7¢/ $1
WAGE / INCOME GAP [ $ ]
0.51
INEQUALITY / GINI INDEX
2,077
TOTAL POPULATION
855
MALE POPULATION
1,222
FEMALE POPULATION
69.97
MALES / 100 FEMALES
142.92
FEMALES / 100 MALES
42.9
MEDIAN AGE
2.9
AVG FAMILY SIZE
2.1
AVG HOUSEHOLD SIZE
984
LABOR FORCE [ PEOPLE ]
57.7%
PERCENT IN LABOR FORCE
10.8%
UNEMPLOYMENT RATE
Jefferson Zip Codes
Income in Jefferson
Income Overview in Jefferson
Per Capita Income in Jefferson is $27,669, while median incomes of families and households are $53,140 and $47,524 respectively.
| Characteristic | Number | Measure |
| Per Capita Income | 2,077 | $27,669 |
| Median Family Income | 525 | $53,140 |
| Mean Family Income | 525 | $83,615 |
| Median Household Income | 936 | $47,524 |
| Mean Household Income | 936 | $61,489 |
| Income Deficit | 525 | $0 |
| Wage / Income Gap (%) | 2,077 | 16.28% |
| Wage / Income Gap ($) | 2,077 | 83.72¢ per $1 |
| Gini / Inequality Index | 2,077 | 0.51 |
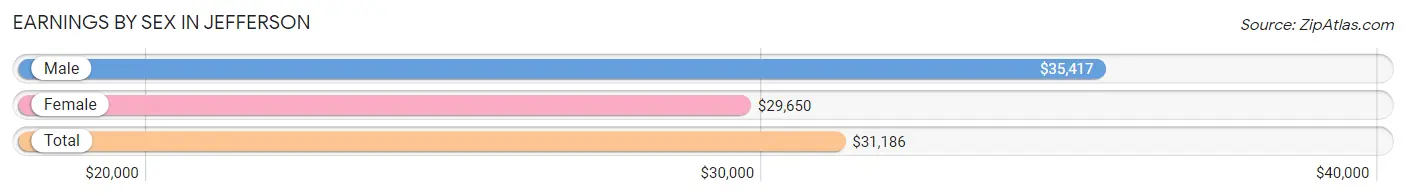
Earnings by Sex in Jefferson
Average Earnings in Jefferson are $31,186, $35,417 for men and $29,650 for women, a difference of 16.3%.
| Sex | Number | Average Earnings |
| Male | 359 (37.4%) | $35,417 |
| Female | 600 (62.6%) | $29,650 |
| Total | 959 (100.0%) | $31,186 |
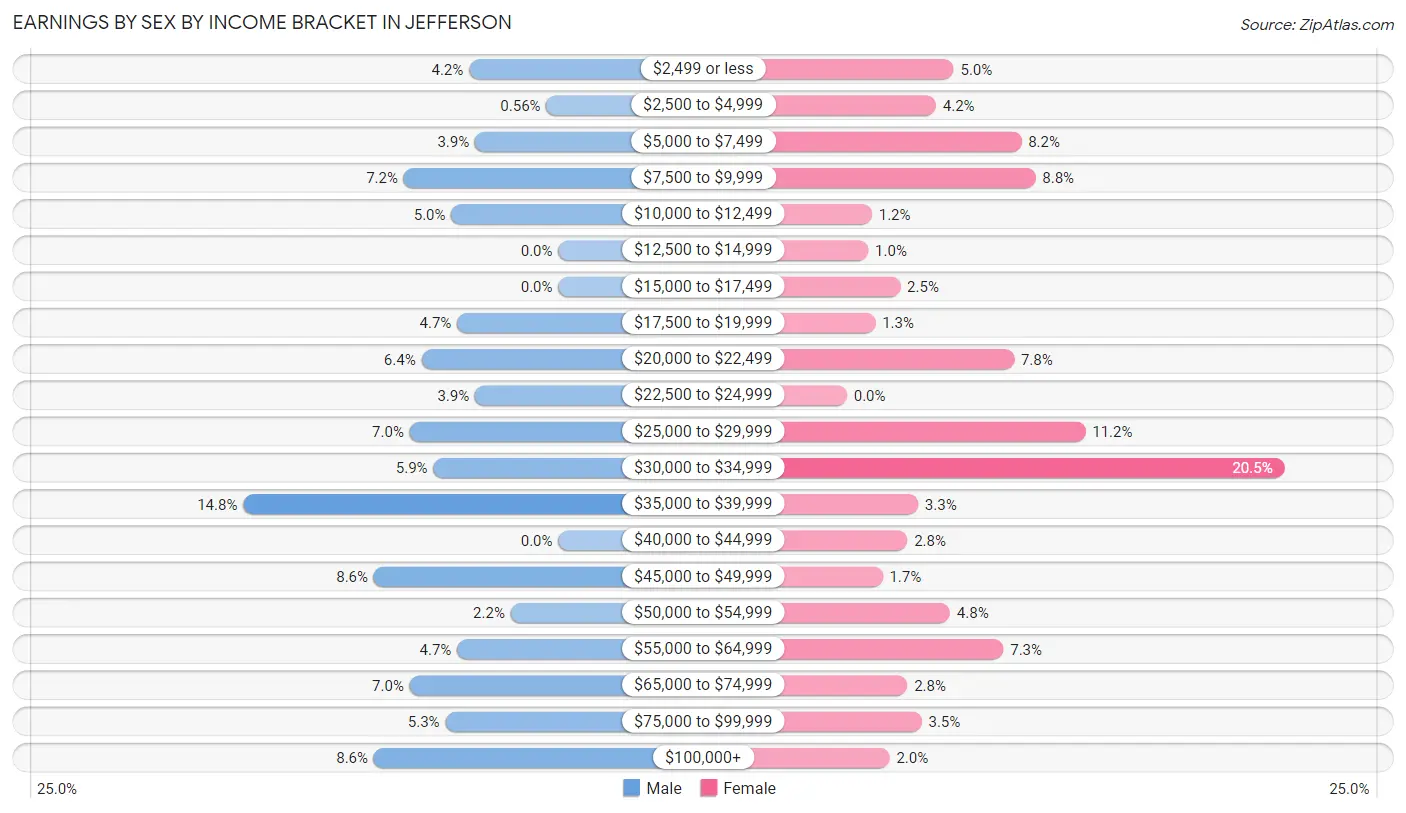
Earnings by Sex by Income Bracket in Jefferson
The most common earnings brackets in Jefferson are $35,000 to $39,999 for men (53 | 14.8%) and $30,000 to $34,999 for women (123 | 20.5%).
| Income | Male | Female |
| $2,499 or less | 15 (4.2%) | 30 (5.0%) |
| $2,500 to $4,999 | 2 (0.6%) | 25 (4.2%) |
| $5,000 to $7,499 | 14 (3.9%) | 49 (8.2%) |
| $7,500 to $9,999 | 26 (7.2%) | 53 (8.8%) |
| $10,000 to $12,499 | 18 (5.0%) | 7 (1.2%) |
| $12,500 to $14,999 | 0 (0.0%) | 6 (1.0%) |
| $15,000 to $17,499 | 0 (0.0%) | 15 (2.5%) |
| $17,500 to $19,999 | 17 (4.7%) | 8 (1.3%) |
| $20,000 to $22,499 | 23 (6.4%) | 47 (7.8%) |
| $22,500 to $24,999 | 14 (3.9%) | 0 (0.0%) |
| $25,000 to $29,999 | 25 (7.0%) | 67 (11.2%) |
| $30,000 to $34,999 | 21 (5.9%) | 123 (20.5%) |
| $35,000 to $39,999 | 53 (14.8%) | 20 (3.3%) |
| $40,000 to $44,999 | 0 (0.0%) | 17 (2.8%) |
| $45,000 to $49,999 | 31 (8.6%) | 10 (1.7%) |
| $50,000 to $54,999 | 8 (2.2%) | 29 (4.8%) |
| $55,000 to $64,999 | 17 (4.7%) | 44 (7.3%) |
| $65,000 to $74,999 | 25 (7.0%) | 17 (2.8%) |
| $75,000 to $99,999 | 19 (5.3%) | 21 (3.5%) |
| $100,000+ | 31 (8.6%) | 12 (2.0%) |
| Total | 359 (100.0%) | 600 (100.0%) |
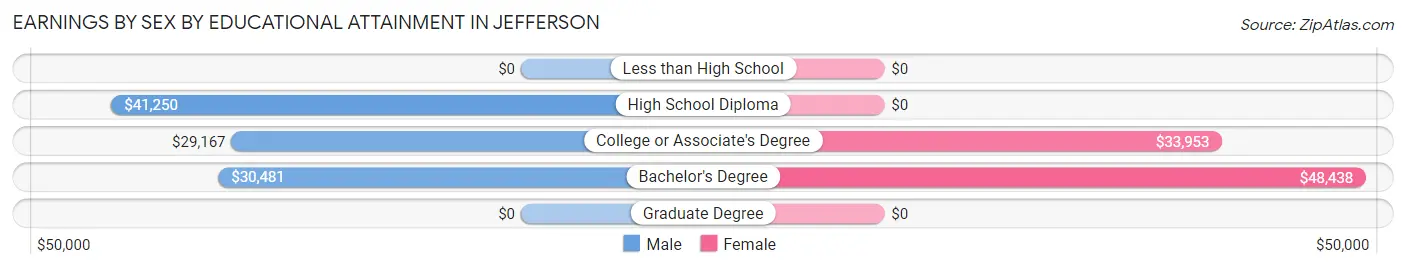
Earnings by Sex by Educational Attainment in Jefferson
Average earnings in Jefferson are $35,370 for men and $32,526 for women, a difference of 8.0%. Men with an educational attainment of high school diploma enjoy the highest average annual earnings of $41,250, while those with college or associate's degree education earn the least with $29,167. Women with an educational attainment of bachelor's degree earn the most with the average annual earnings of $48,438, while those with college or associate's degree education have the smallest earnings of $33,953.
| Educational Attainment | Male Income | Female Income |
| Less than High School | - | - |
| High School Diploma | $41,250 | $0 |
| College or Associate's Degree | $29,167 | $33,953 |
| Bachelor's Degree | $30,481 | $48,438 |
| Graduate Degree | - | - |
| Total | $35,370 | $32,526 |
Family Income in Jefferson
Family Income Brackets in Jefferson
According to the Jefferson family income data, there are 155 families falling into the $35,000 to $49,999 income range, which is the most common income bracket and makes up 29.5% of all families.
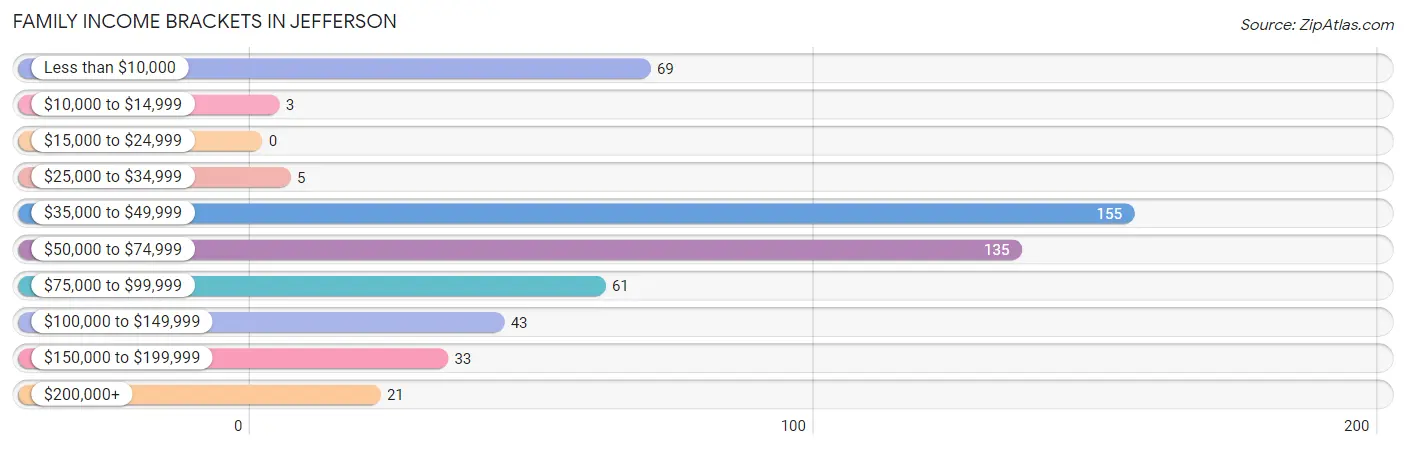
| Income Bracket | # Families | % Families |
| Less than $10,000 | 69 | 13.1% |
| $10,000 to $14,999 | 3 | 0.6% |
| $15,000 to $24,999 | 0 | 0.0% |
| $25,000 to $34,999 | 5 | 1.0% |
| $35,000 to $49,999 | 155 | 29.5% |
| $50,000 to $74,999 | 135 | 25.7% |
| $75,000 to $99,999 | 61 | 11.6% |
| $100,000 to $149,999 | 43 | 8.2% |
| $150,000 to $199,999 | 33 | 6.3% |
| $200,000+ | 21 | 4.0% |
Family Income by Famaliy Size in Jefferson
2-person families (266 | 50.7%) account for the highest median family income in Jefferson with $62,000 per family, while 2-person families (266 | 50.7%) have the highest median income of $31,000 per family member.
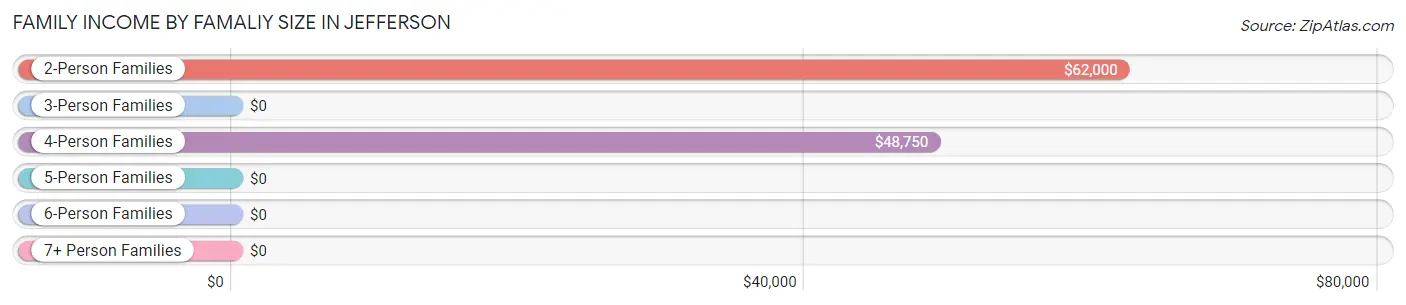
| Income Bracket | # Families | Median Income |
| 2-Person Families | 266 (50.7%) | $62,000 |
| 3-Person Families | 88 (16.8%) | $0 |
| 4-Person Families | 116 (22.1%) | $48,750 |
| 5-Person Families | 32 (6.1%) | $0 |
| 6-Person Families | 23 (4.4%) | $0 |
| 7+ Person Families | 0 (0.0%) | $0 |
| Total | 525 (100.0%) | $53,140 |
Family Income by Number of Earners in Jefferson
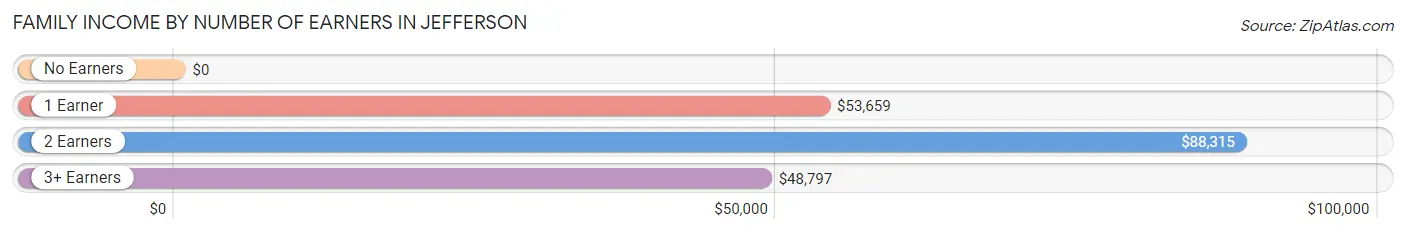
| Number of Earners | # Families | Median Income |
| No Earners | 81 (15.4%) | $0 |
| 1 Earner | 186 (35.4%) | $53,659 |
| 2 Earners | 163 (31.0%) | $88,315 |
| 3+ Earners | 95 (18.1%) | $48,797 |
| Total | 525 (100.0%) | $53,140 |
Household Income in Jefferson
Household Income Brackets in Jefferson
With 224 households falling in the category, the $35,000 to $49,999 income range is the most frequent in Jefferson, accounting for 23.9% of all households. In contrast, only 25 households (2.7%) fall into the $200,000+ income bracket, making it the least populous group.
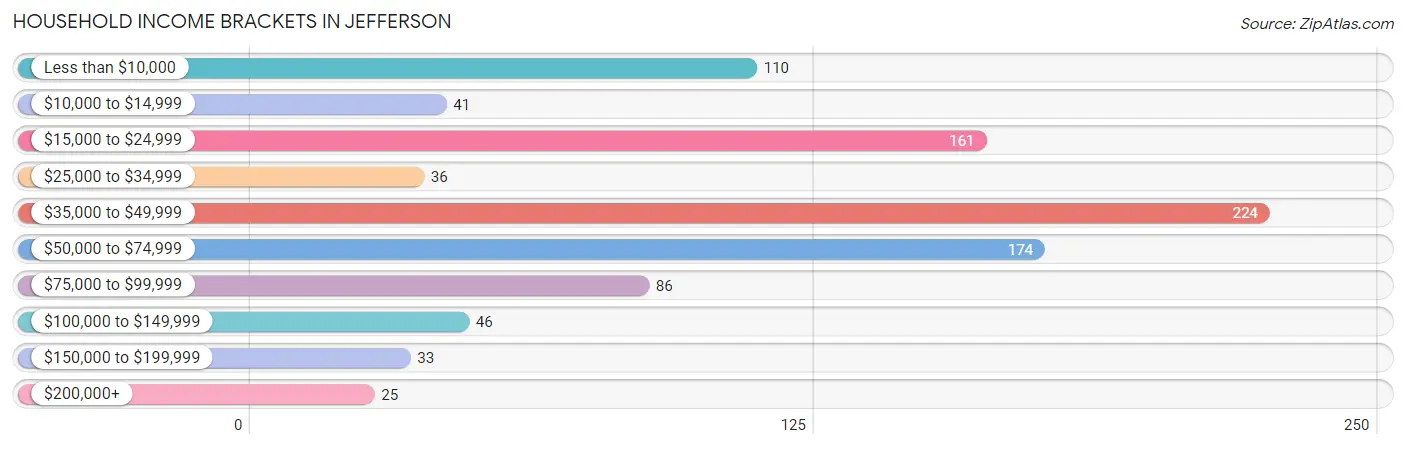
| Income Bracket | # Households | % Households |
| Less than $10,000 | 110 | 11.8% |
| $10,000 to $14,999 | 41 | 4.4% |
| $15,000 to $24,999 | 161 | 17.2% |
| $25,000 to $34,999 | 36 | 3.8% |
| $35,000 to $49,999 | 224 | 23.9% |
| $50,000 to $74,999 | 174 | 18.6% |
| $75,000 to $99,999 | 86 | 9.2% |
| $100,000 to $149,999 | 46 | 4.9% |
| $150,000 to $199,999 | 33 | 3.5% |
| $200,000+ | 25 | 2.7% |
Household Income by Householder Age in Jefferson
The median household income in Jefferson is $47,524, with the highest median household income of $48,693 found in the 25 to 44 years age bracket for the primary householder. A total of 316 households (33.8%) fall into this category. Meanwhile, the 15 to 24 years age bracket for the primary householder has the lowest median household income of $0, with 3 households (0.3%) in this group.
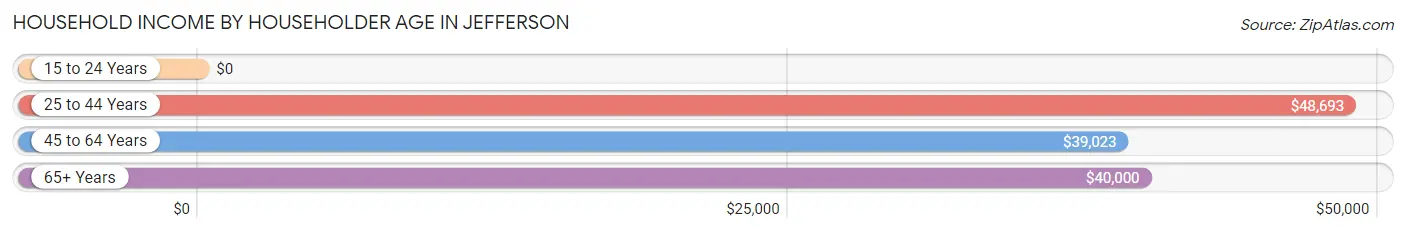
| Income Bracket | # Households | Median Income |
| 15 to 24 Years | 3 (0.3%) | $0 |
| 25 to 44 Years | 316 (33.8%) | $48,693 |
| 45 to 64 Years | 265 (28.3%) | $39,023 |
| 65+ Years | 352 (37.6%) | $40,000 |
| Total | 936 (100.0%) | $47,524 |
Poverty in Jefferson
Income Below Poverty by Sex and Age in Jefferson
With 20.7% poverty level for males and 19.3% for females among the residents of Jefferson, under 5 year old males and under 5 year old females are the most vulnerable to poverty, with 33 males (91.7%) and 53 females (76.8%) in their respective age groups living below the poverty level.
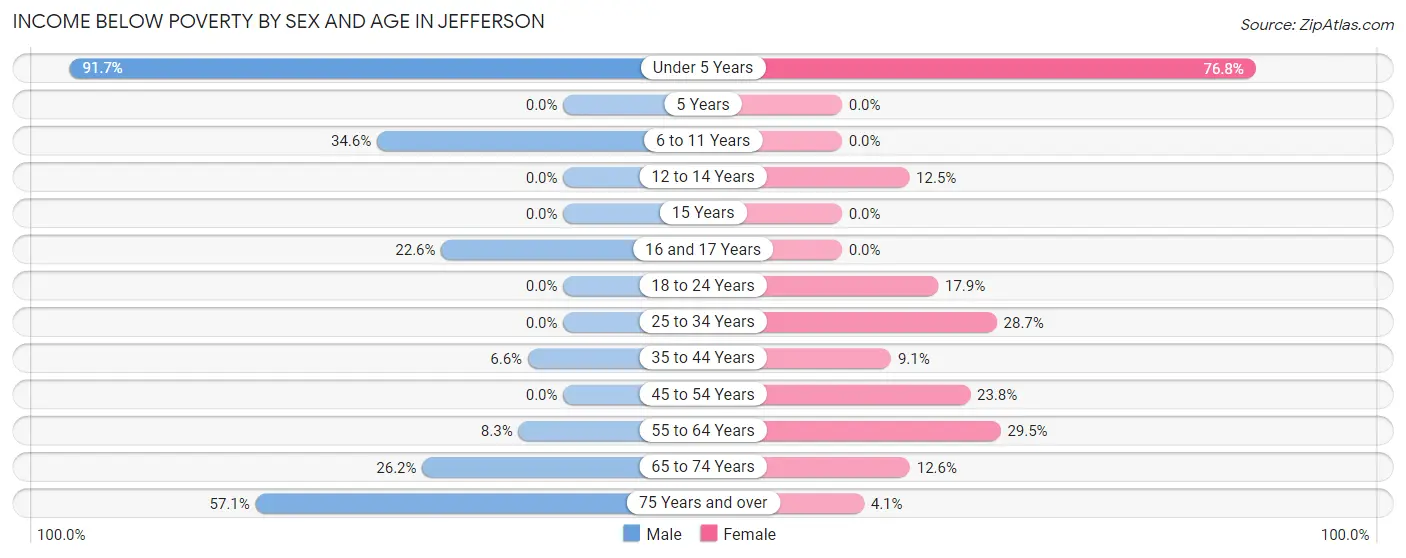
| Age Bracket | Male | Female |
| Under 5 Years | 33 (91.7%) | 53 (76.8%) |
| 5 Years | 0 (0.0%) | 0 (0.0%) |
| 6 to 11 Years | 37 (34.6%) | 0 (0.0%) |
| 12 to 14 Years | 0 (0.0%) | 9 (12.5%) |
| 15 Years | 0 (0.0%) | 0 (0.0%) |
| 16 and 17 Years | 12 (22.6%) | 0 (0.0%) |
| 18 to 24 Years | 0 (0.0%) | 20 (17.9%) |
| 25 to 34 Years | 0 (0.0%) | 25 (28.7%) |
| 35 to 44 Years | 9 (6.6%) | 21 (9.1%) |
| 45 to 54 Years | 0 (0.0%) | 25 (23.8%) |
| 55 to 64 Years | 9 (8.3%) | 43 (29.4%) |
| 65 to 74 Years | 39 (26.2%) | 25 (12.6%) |
| 75 Years and over | 28 (57.1%) | 4 (4.1%) |
| Total | 167 (20.7%) | 225 (19.3%) |
Income Above Poverty by Sex and Age in Jefferson
According to the poverty statistics in Jefferson, males aged 12 to 14 years and females aged 5 years are the age groups that are most secure financially, with 100.0% of males and 100.0% of females in these age groups living above the poverty line.
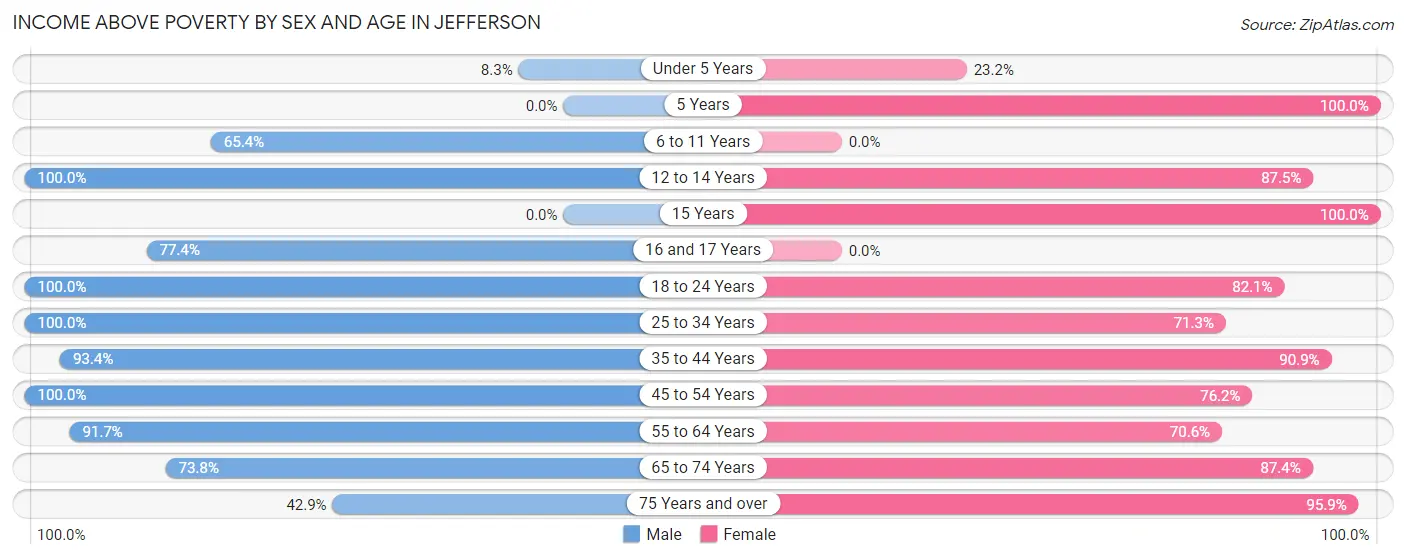
| Age Bracket | Male | Female |
| Under 5 Years | 3 (8.3%) | 16 (23.2%) |
| 5 Years | 0 (0.0%) | 17 (100.0%) |
| 6 to 11 Years | 70 (65.4%) | 0 (0.0%) |
| 12 to 14 Years | 39 (100.0%) | 63 (87.5%) |
| 15 Years | 0 (0.0%) | 32 (100.0%) |
| 16 and 17 Years | 41 (77.4%) | 0 (0.0%) |
| 18 to 24 Years | 46 (100.0%) | 92 (82.1%) |
| 25 to 34 Years | 48 (100.0%) | 62 (71.3%) |
| 35 to 44 Years | 128 (93.4%) | 209 (90.9%) |
| 45 to 54 Years | 36 (100.0%) | 80 (76.2%) |
| 55 to 64 Years | 99 (91.7%) | 103 (70.6%) |
| 65 to 74 Years | 110 (73.8%) | 173 (87.4%) |
| 75 Years and over | 21 (42.9%) | 94 (95.9%) |
| Total | 641 (79.3%) | 941 (80.7%) |
Income Below Poverty Among Married-Couple Families in Jefferson
The poverty statistics for married-couple families in Jefferson show that 2.6% or 8 of the total 308 families live below the poverty line. Families with no children have the highest poverty rate of 3.7%, comprising of 8 families. On the other hand, families with 1 or 2 children have the lowest poverty rate of 0.0%, which includes 0 families.
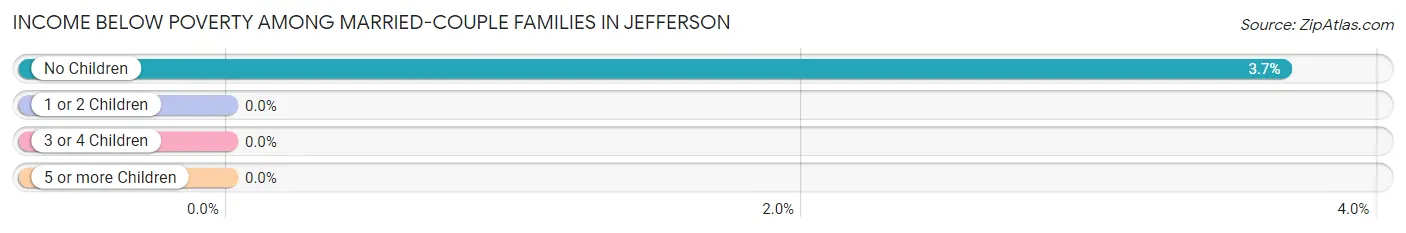
| Children | Above Poverty | Below Poverty |
| No Children | 210 (96.3%) | 8 (3.7%) |
| 1 or 2 Children | 62 (100.0%) | 0 (0.0%) |
| 3 or 4 Children | 28 (100.0%) | 0 (0.0%) |
| 5 or more Children | 0 (0.0%) | 0 (0.0%) |
| Total | 300 (97.4%) | 8 (2.6%) |
Income Below Poverty Among Single-Parent Households in Jefferson
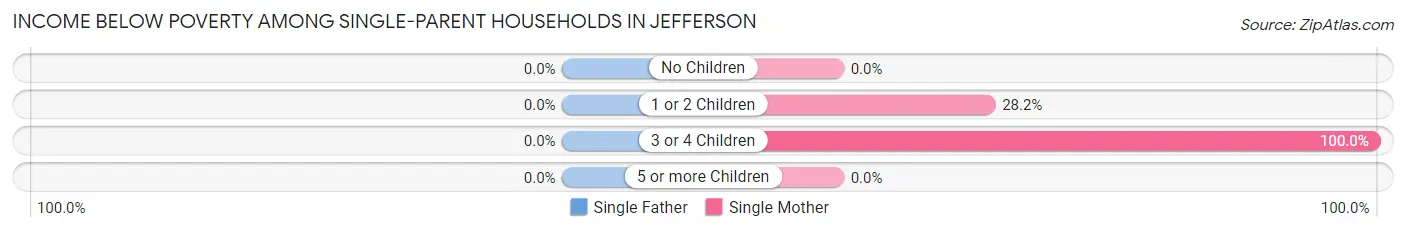
| Children | Single Father | Single Mother |
| No Children | 0 (0.0%) | 0 (0.0%) |
| 1 or 2 Children | 0 (0.0%) | 46 (28.2%) |
| 3 or 4 Children | 0 (0.0%) | 18 (100.0%) |
| 5 or more Children | 0 (0.0%) | 0 (0.0%) |
| Total | 0 (0.0%) | 64 (29.5%) |
Income Below Poverty Among Married-Couple vs Single-Parent Households in Jefferson
The poverty data for Jefferson shows that 8 of the married-couple family households (2.6%) and 64 of the single-parent households (29.5%) are living below the poverty level. Within the married-couple family households, those with no children have the highest poverty rate, with 8 households (3.7%) falling below the poverty line. Among the single-parent households, those with 3 or 4 children have the highest poverty rate, with 18 household (100.0%) living below poverty.
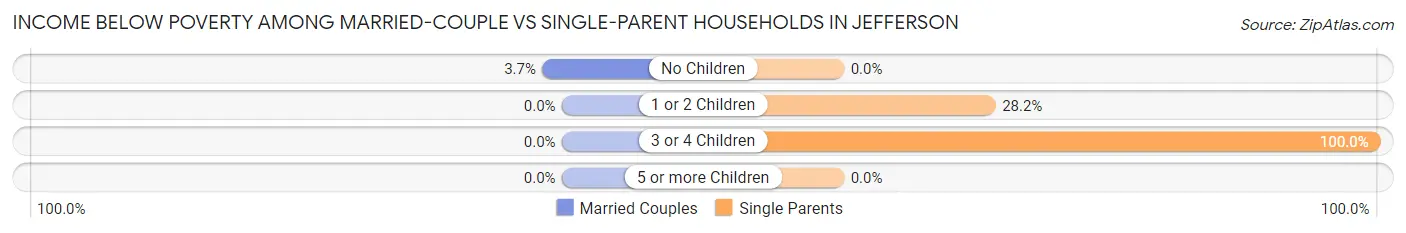
| Children | Married-Couple Families | Single-Parent Households |
| No Children | 8 (3.7%) | 0 (0.0%) |
| 1 or 2 Children | 0 (0.0%) | 46 (28.2%) |
| 3 or 4 Children | 0 (0.0%) | 18 (100.0%) |
| 5 or more Children | 0 (0.0%) | 0 (0.0%) |
| Total | 8 (2.6%) | 64 (29.5%) |
Race in Jefferson
The most populous races in Jefferson are Black / African American (1,060 | 51.0%), White / Caucasian (873 | 42.0%), and Two or more Races (64 | 3.1%).
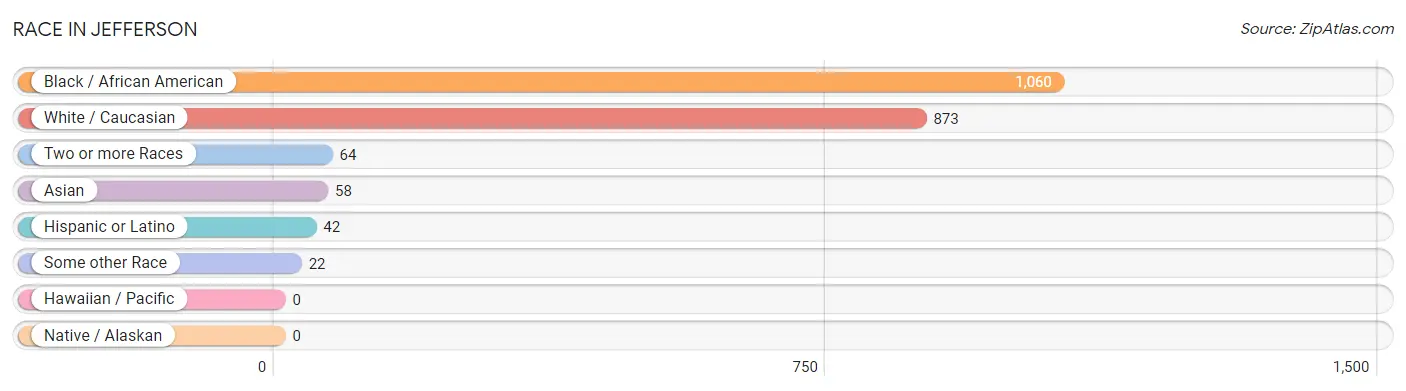
| Race | # Population | % Population |
| Asian | 58 | 2.8% |
| Black / African American | 1,060 | 51.0% |
| Hawaiian / Pacific | 0 | 0.0% |
| Hispanic or Latino | 42 | 2.0% |
| Native / Alaskan | 0 | 0.0% |
| White / Caucasian | 873 | 42.0% |
| Two or more Races | 64 | 3.1% |
| Some other Race | 22 | 1.1% |
| Total | 2,077 | 100.0% |
Ancestry in Jefferson
The most populous ancestries reported in Jefferson are American (638 | 30.7%), English (243 | 11.7%), Irish (133 | 6.4%), German (110 | 5.3%), and Korean (46 | 2.2%), together accounting for 56.3% of all Jefferson residents.
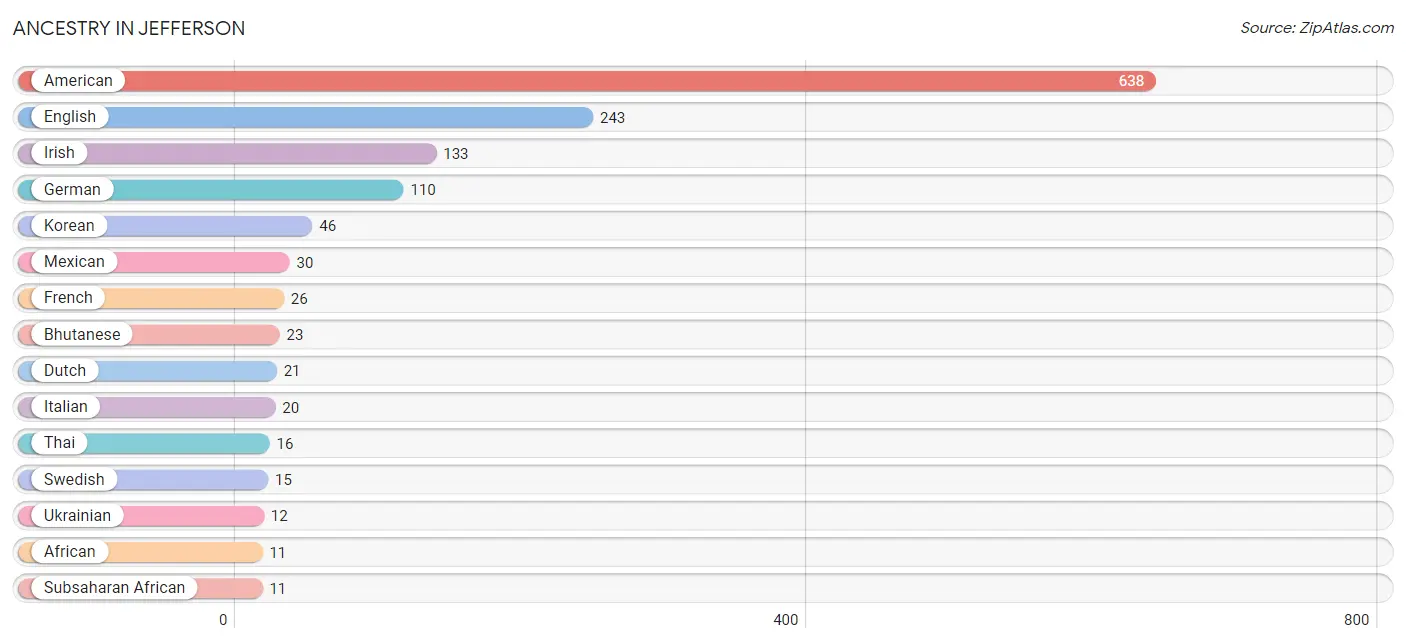
| Ancestry | # Population | % Population |
| African | 11 | 0.5% |
| American | 638 | 30.7% |
| Bhutanese | 23 | 1.1% |
| British | 5 | 0.2% |
| Dutch | 21 | 1.0% |
| English | 243 | 11.7% |
| European | 10 | 0.5% |
| French | 26 | 1.3% |
| German | 110 | 5.3% |
| Irish | 133 | 6.4% |
| Italian | 20 | 1.0% |
| Korean | 46 | 2.2% |
| Mexican | 30 | 1.4% |
| Norwegian | 5 | 0.2% |
| Scandinavian | 6 | 0.3% |
| Scotch-Irish | 5 | 0.2% |
| Scottish | 4 | 0.2% |
| Spaniard | 6 | 0.3% |
| Subsaharan African | 11 | 0.5% |
| Swedish | 15 | 0.7% |
| Swiss | 5 | 0.2% |
| Thai | 16 | 0.8% |
| Ukrainian | 12 | 0.6% | View All 23 Rows |
Immigrants in Jefferson
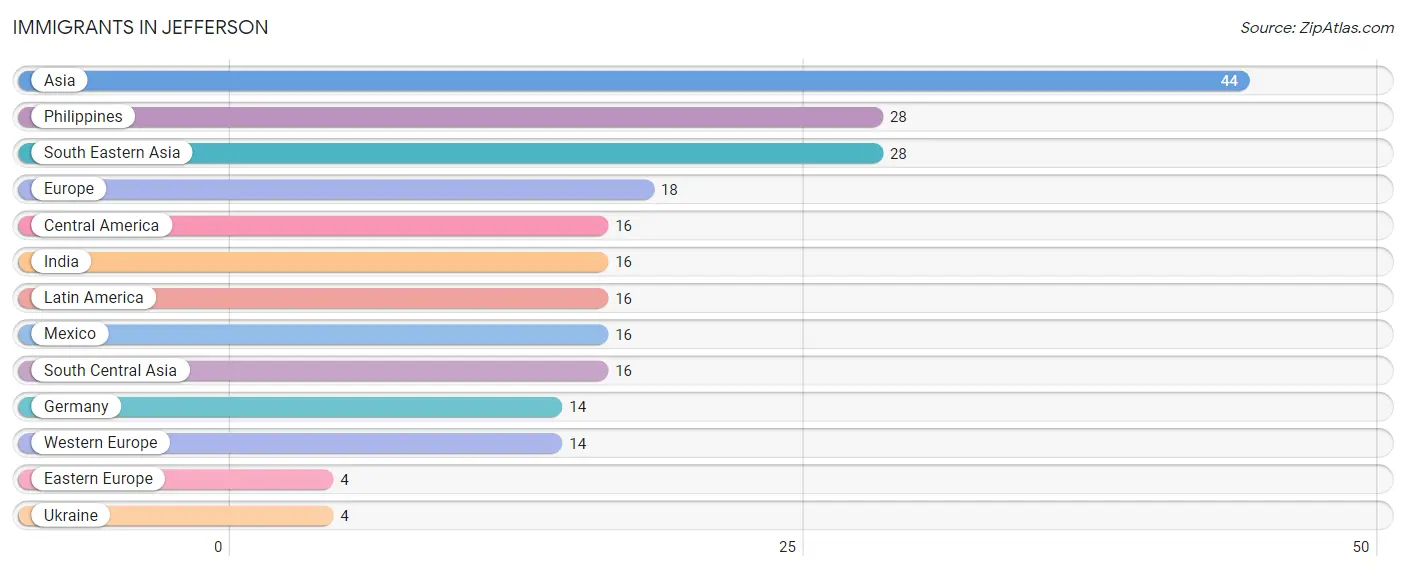
The most numerous immigrant groups reported in Jefferson came from Asia (44 | 2.1%), Philippines (28 | 1.3%), South Eastern Asia (28 | 1.3%), Europe (18 | 0.9%), and Central America (16 | 0.8%), together accounting for 6.5% of all Jefferson residents.
| Immigration Origin | # Population | % Population |
| Asia | 44 | 2.1% |
| Central America | 16 | 0.8% |
| Eastern Europe | 4 | 0.2% |
| Europe | 18 | 0.9% |
| Germany | 14 | 0.7% |
| India | 16 | 0.8% |
| Latin America | 16 | 0.8% |
| Mexico | 16 | 0.8% |
| Philippines | 28 | 1.3% |
| South Central Asia | 16 | 0.8% |
| South Eastern Asia | 28 | 1.3% |
| Ukraine | 4 | 0.2% |
| Western Europe | 14 | 0.7% | View All 13 Rows |
Sex and Age in Jefferson
Sex and Age in Jefferson
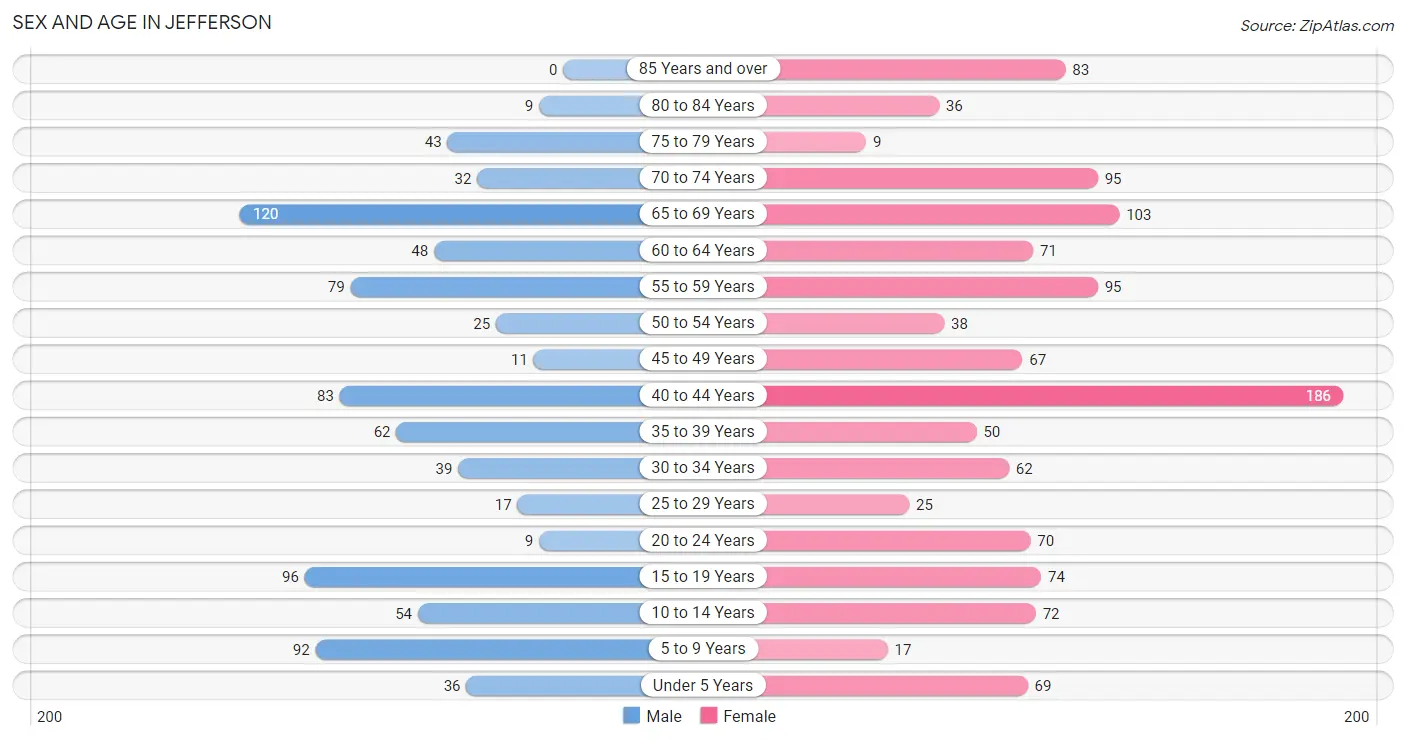
The most populous age groups in Jefferson are 65 to 69 Years (120 | 14.0%) for men and 40 to 44 Years (186 | 15.2%) for women.
| Age Bracket | Male | Female |
| Under 5 Years | 36 (4.2%) | 69 (5.7%) |
| 5 to 9 Years | 92 (10.8%) | 17 (1.4%) |
| 10 to 14 Years | 54 (6.3%) | 72 (5.9%) |
| 15 to 19 Years | 96 (11.2%) | 74 (6.1%) |
| 20 to 24 Years | 9 (1.1%) | 70 (5.7%) |
| 25 to 29 Years | 17 (2.0%) | 25 (2.1%) |
| 30 to 34 Years | 39 (4.6%) | 62 (5.1%) |
| 35 to 39 Years | 62 (7.2%) | 50 (4.1%) |
| 40 to 44 Years | 83 (9.7%) | 186 (15.2%) |
| 45 to 49 Years | 11 (1.3%) | 67 (5.5%) |
| 50 to 54 Years | 25 (2.9%) | 38 (3.1%) |
| 55 to 59 Years | 79 (9.2%) | 95 (7.8%) |
| 60 to 64 Years | 48 (5.6%) | 71 (5.8%) |
| 65 to 69 Years | 120 (14.0%) | 103 (8.4%) |
| 70 to 74 Years | 32 (3.7%) | 95 (7.8%) |
| 75 to 79 Years | 43 (5.0%) | 9 (0.7%) |
| 80 to 84 Years | 9 (1.1%) | 36 (2.9%) |
| 85 Years and over | 0 (0.0%) | 83 (6.8%) |
| Total | 855 (100.0%) | 1,222 (100.0%) |
Families and Households in Jefferson
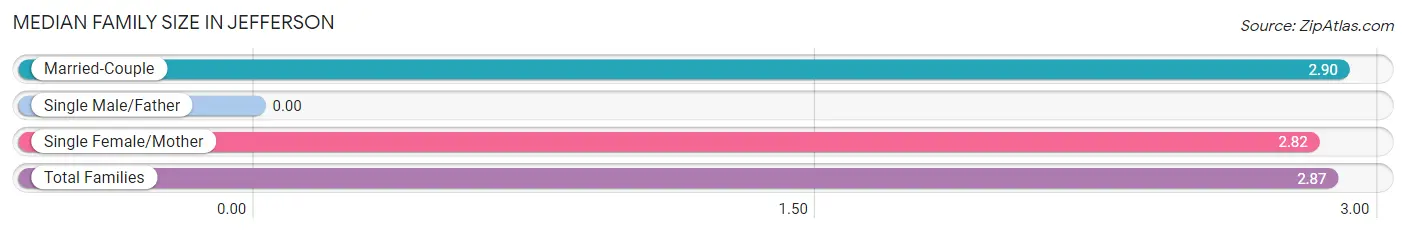
Median Family Size in Jefferson
| Family Type | # Families | Family Size |
| Married-Couple | 308 (58.7%) | 2.90 |
| Single Male/Father | 0 (0.0%) | - |
| Single Female/Mother | 217 (41.3%) | 2.82 |
| Total Families | 525 (100.0%) | 2.87 |
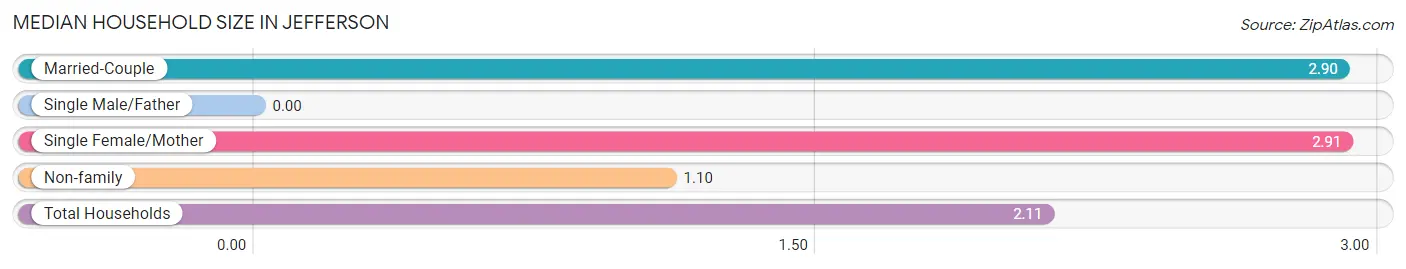
Median Household Size in Jefferson
| Household Type | # Households | Household Size |
| Married-Couple | 308 (32.9%) | 2.90 |
| Single Male/Father | 0 (0.0%) | - |
| Single Female/Mother | 217 (23.2%) | 2.91 |
| Non-family | 411 (43.9%) | 1.10 |
| Total Households | 936 (100.0%) | 2.11 |
Household Size by Marriage Status in Jefferson
Out of a total of 936 households in Jefferson, 525 (56.1%) are family households, while 411 (43.9%) are nonfamily households. The most numerous type of family households are 2-person households, comprising 262, and the most common type of nonfamily households are 1-person households, comprising 398.
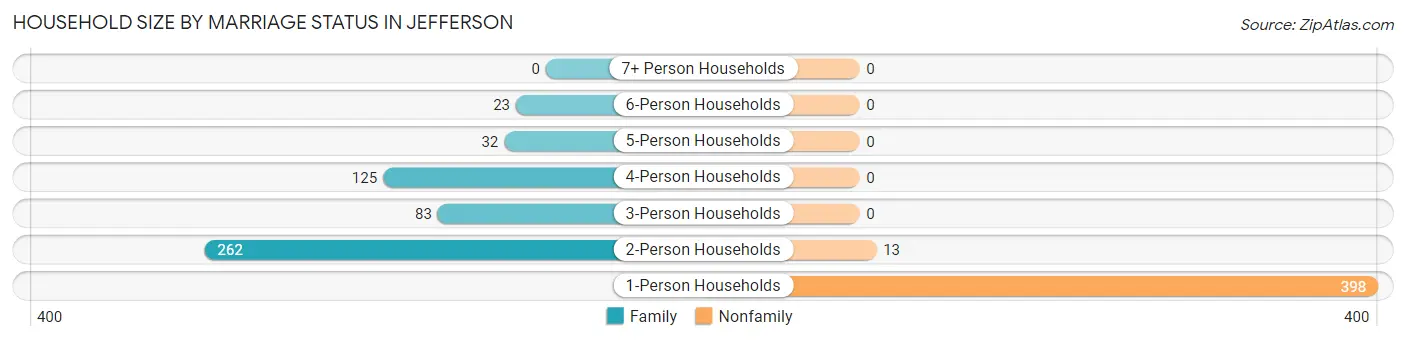
| Household Size | Family Households | Nonfamily Households |
| 1-Person Households | - | 398 (42.5%) |
| 2-Person Households | 262 (28.0%) | 13 (1.4%) |
| 3-Person Households | 83 (8.9%) | 0 (0.0%) |
| 4-Person Households | 125 (13.4%) | 0 (0.0%) |
| 5-Person Households | 32 (3.4%) | 0 (0.0%) |
| 6-Person Households | 23 (2.5%) | 0 (0.0%) |
| 7+ Person Households | 0 (0.0%) | 0 (0.0%) |
| Total | 525 (56.1%) | 411 (43.9%) |
Female Fertility in Jefferson
Fertility by Age in Jefferson
Average fertility rate in Jefferson is 44.0 births per 1,000 women. Women in the age bracket of 20 to 34 years have the highest fertility rate with 153.0 births per 1,000 women. Women in the age bracket of 20 to 34 years acount for 100.0% of all women with births.
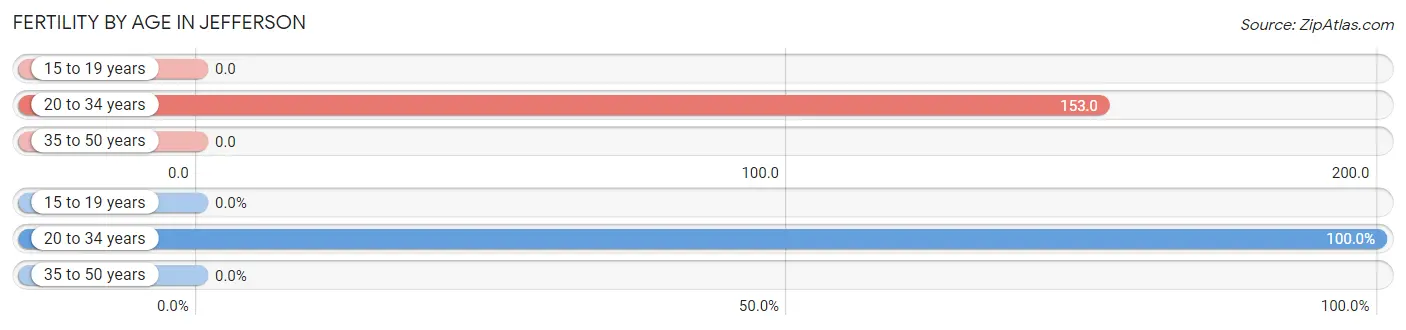
| Age Bracket | Women with Births | Births / 1,000 Women |
| 15 to 19 years | 0 (0.0%) | 0.0 |
| 20 to 34 years | 24 (100.0%) | 153.0 |
| 35 to 50 years | 0 (0.0%) | 0.0 |
| Total | 24 (100.0%) | 44.0 |
Fertility by Age by Marriage Status in Jefferson
16.7% of women with births (24) in Jefferson are married. The highest percentage of unmarried women with births falls into 20 to 34 years age bracket with 83.3% of them unmarried at the time of birth, while the lowest percentage of unmarried women with births belong to 20 to 34 years age bracket with 83.3% of them unmarried.
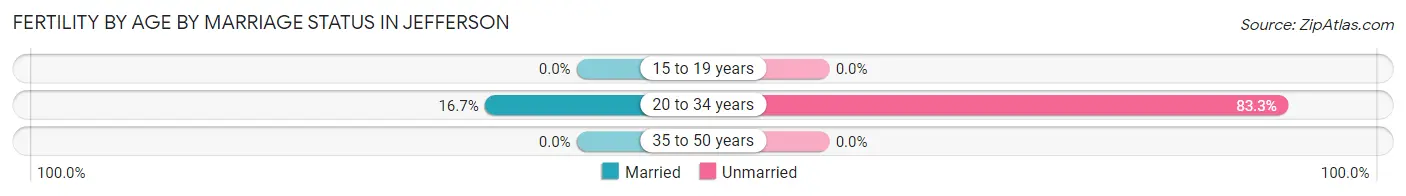
| Age Bracket | Married | Unmarried |
| 15 to 19 years | 0 (0.0%) | 0 (0.0%) |
| 20 to 34 years | 4 (16.7%) | 20 (83.3%) |
| 35 to 50 years | 0 (0.0%) | 0 (0.0%) |
| Total | 4 (16.7%) | 20 (83.3%) |
Fertility by Education in Jefferson
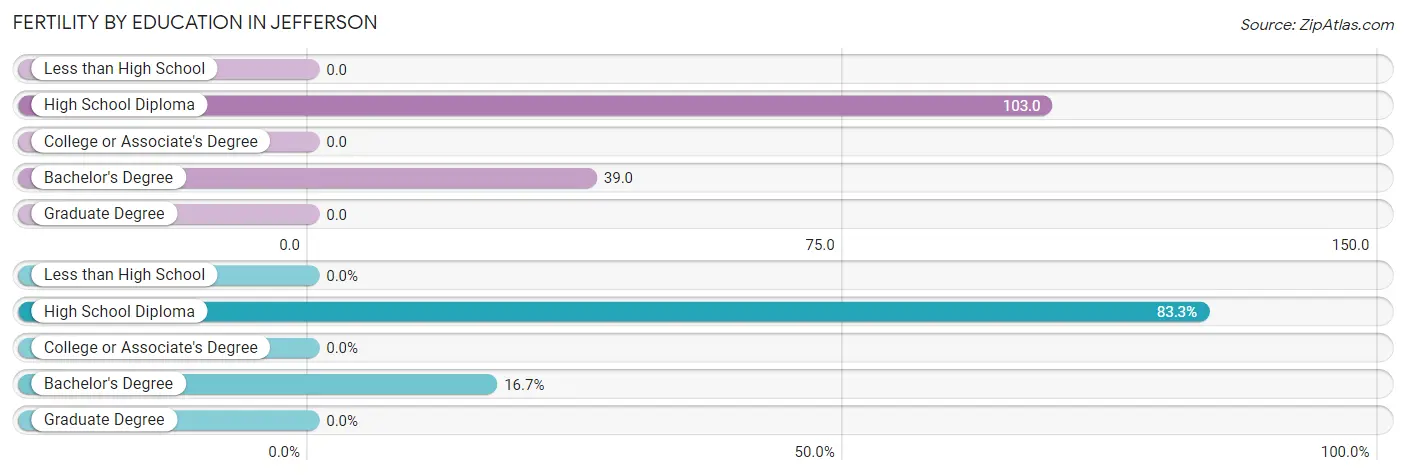
| Educational Attainment | Women with Births | Births / 1,000 Women |
| Less than High School | 0 (0.0%) | 0.0 |
| High School Diploma | 20 (83.3%) | 103.0 |
| College or Associate's Degree | 0 (0.0%) | 0.0 |
| Bachelor's Degree | 4 (16.7%) | 39.0 |
| Graduate Degree | 0 (0.0%) | 0.0 |
| Total | 24 (100.0%) | 44.0 |
Fertility by Education by Marriage Status in Jefferson
83.3% of women with births in Jefferson are unmarried. Women with the educational attainment of bachelor's degree are most likely to be married with 100.0% of them married at childbirth, while women with the educational attainment of high school diploma are least likely to be married with 100.0% of them unmarried at childbirth.
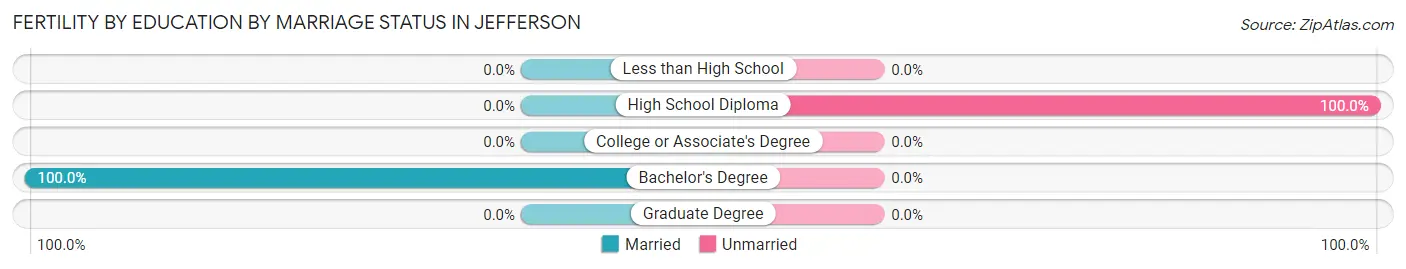
| Educational Attainment | Married | Unmarried |
| Less than High School | 0 (0.0%) | 0 (0.0%) |
| High School Diploma | 0 (0.0%) | 20 (100.0%) |
| College or Associate's Degree | 0 (0.0%) | 0 (0.0%) |
| Bachelor's Degree | 4 (100.0%) | 0 (0.0%) |
| Graduate Degree | 0 (0.0%) | 0 (0.0%) |
| Total | 4 (16.7%) | 20 (83.3%) |
Employment Characteristics in Jefferson
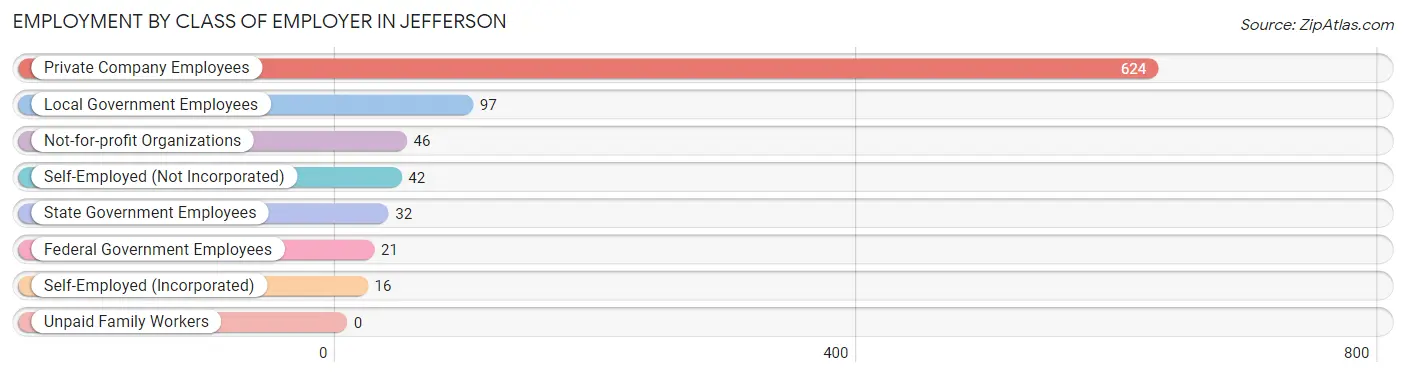
Employment by Class of Employer in Jefferson
Among the 878 employed individuals in Jefferson, private company employees (624 | 71.1%), local government employees (97 | 11.1%), and not-for-profit organizations (46 | 5.2%) make up the most common classes of employment.
| Employer Class | # Employees | % Employees |
| Private Company Employees | 624 | 71.1% |
| Self-Employed (Incorporated) | 16 | 1.8% |
| Self-Employed (Not Incorporated) | 42 | 4.8% |
| Not-for-profit Organizations | 46 | 5.2% |
| Local Government Employees | 97 | 11.1% |
| State Government Employees | 32 | 3.6% |
| Federal Government Employees | 21 | 2.4% |
| Unpaid Family Workers | 0 | 0.0% |
| Total | 878 | 100.0% |
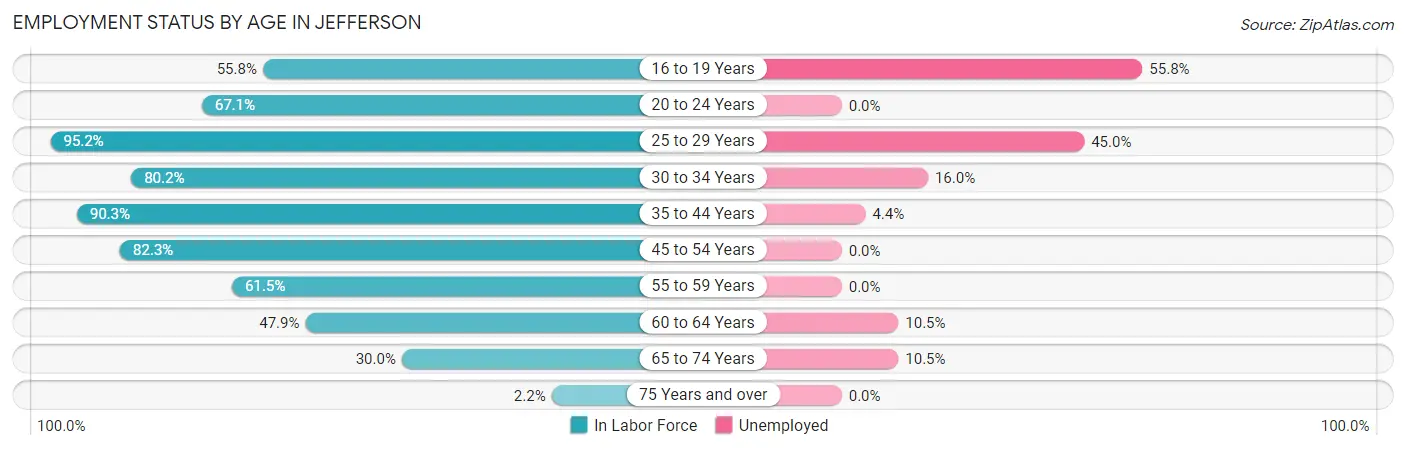
Employment Status by Age in Jefferson
According to the labor force statistics for Jefferson, out of the total population over 16 years of age (1,705), 57.7% or 984 individuals are in the labor force, with 10.8% or 106 of them unemployed. The age group with the highest labor force participation rate is 25 to 29 years, with 95.2% or 40 individuals in the labor force. Within the labor force, the 16 to 19 years age range has the highest percentage of unemployed individuals, with 55.8% or 43 of them being unemployed.
| Age Bracket | In Labor Force | Unemployed |
| 16 to 19 Years | 77 (55.8%) | 43 (55.8%) |
| 20 to 24 Years | 53 (67.1%) | 0 (0.0%) |
| 25 to 29 Years | 40 (95.2%) | 18 (45.0%) |
| 30 to 34 Years | 81 (80.2%) | 13 (16.0%) |
| 35 to 44 Years | 344 (90.3%) | 15 (4.4%) |
| 45 to 54 Years | 116 (82.3%) | 0 (0.0%) |
| 55 to 59 Years | 107 (61.5%) | 0 (0.0%) |
| 60 to 64 Years | 57 (47.9%) | 6 (10.5%) |
| 65 to 74 Years | 105 (30.0%) | 11 (10.5%) |
| 75 Years and over | 4 (2.2%) | 0 (0.0%) |
| Total | 984 (57.7%) | 106 (10.8%) |
Employment Status by Educational Attainment in Jefferson
According to labor force statistics for Jefferson, 77.8% of individuals (745) out of the total population between 25 and 64 years of age (958) are in the labor force, with 7.0% or 52 of them being unemployed. The group with the highest labor force participation rate are those with the educational attainment of bachelor's degree or higher, with 88.5% or 184 individuals in the labor force. Within the labor force, individuals with high school diploma education have the highest percentage of unemployment, with 8.2% or 22 of them being unemployed.
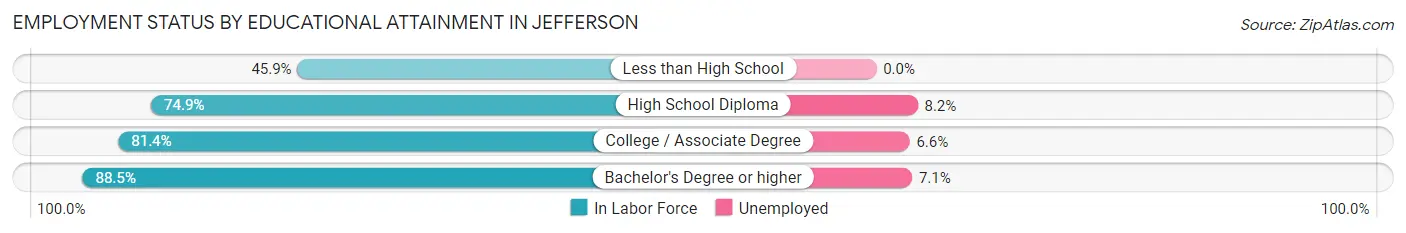
| Educational Attainment | In Labor Force | Unemployed |
| Less than High School | 34 (45.9%) | 0 (0.0%) |
| High School Diploma | 268 (74.9%) | 29 (8.2%) |
| College / Associate Degree | 259 (81.4%) | 21 (6.6%) |
| Bachelor's Degree or higher | 184 (88.5%) | 15 (7.1%) |
| Total | 745 (77.8%) | 67 (7.0%) |
Employment Occupations by Sex in Jefferson
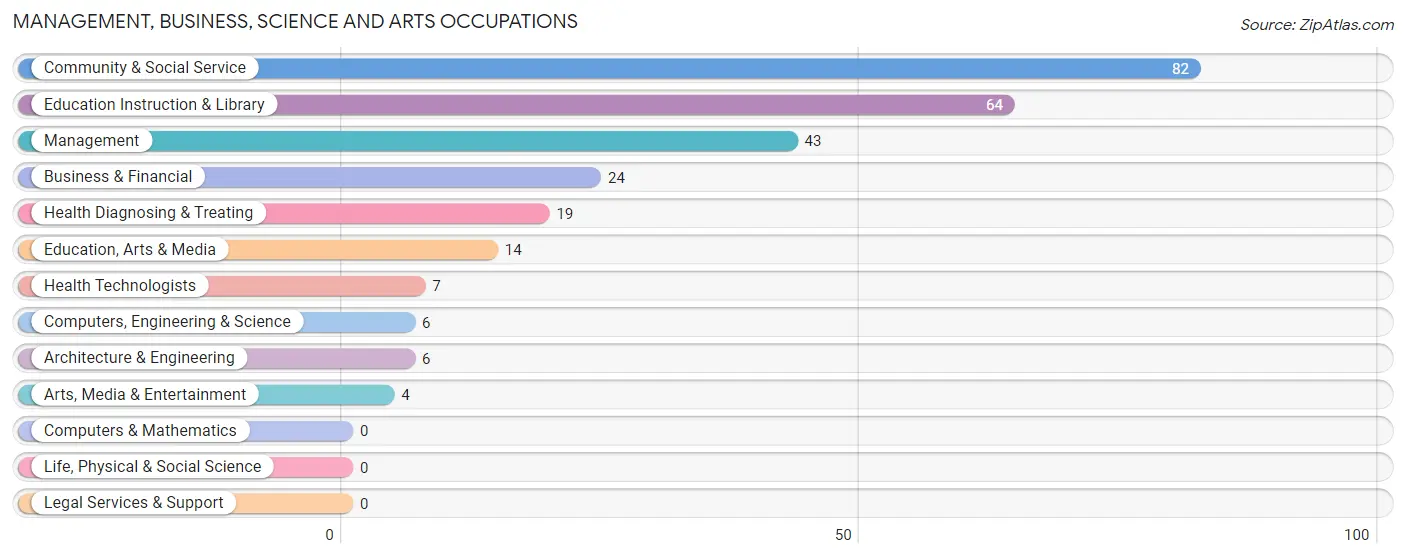
Management, Business, Science and Arts Occupations
The most common Management, Business, Science and Arts occupations in Jefferson are Community & Social Service (82 | 9.3%), Education Instruction & Library (64 | 7.3%), Management (43 | 4.9%), Business & Financial (24 | 2.7%), and Health Diagnosing & Treating (19 | 2.2%).
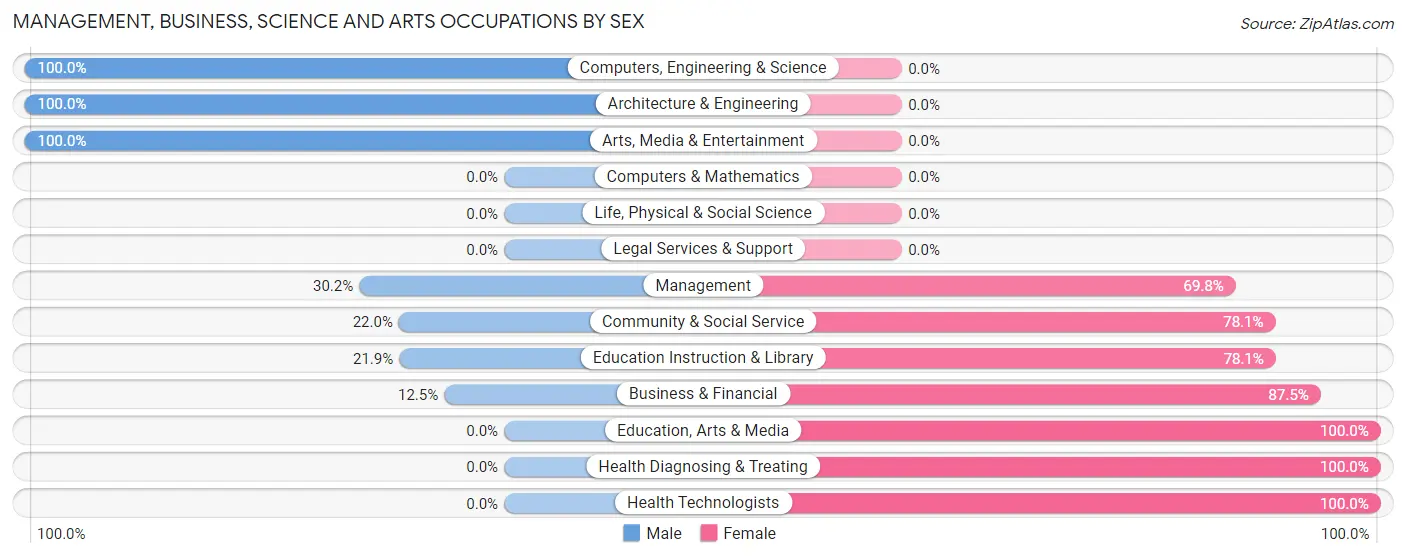
Management, Business, Science and Arts Occupations by Sex
Within the Management, Business, Science and Arts occupations in Jefferson, the most male-oriented occupations are Computers, Engineering & Science (100.0%), Architecture & Engineering (100.0%), and Arts, Media & Entertainment (100.0%), while the most female-oriented occupations are Education, Arts & Media (100.0%), Health Diagnosing & Treating (100.0%), and Health Technologists (100.0%).
| Occupation | Male | Female |
| Management | 13 (30.2%) | 30 (69.8%) |
| Business & Financial | 3 (12.5%) | 21 (87.5%) |
| Computers, Engineering & Science | 6 (100.0%) | 0 (0.0%) |
| Computers & Mathematics | 0 (0.0%) | 0 (0.0%) |
| Architecture & Engineering | 6 (100.0%) | 0 (0.0%) |
| Life, Physical & Social Science | 0 (0.0%) | 0 (0.0%) |
| Community & Social Service | 18 (22.0%) | 64 (78.0%) |
| Education, Arts & Media | 0 (0.0%) | 14 (100.0%) |
| Legal Services & Support | 0 (0.0%) | 0 (0.0%) |
| Education Instruction & Library | 14 (21.9%) | 50 (78.1%) |
| Arts, Media & Entertainment | 4 (100.0%) | 0 (0.0%) |
| Health Diagnosing & Treating | 0 (0.0%) | 19 (100.0%) |
| Health Technologists | 0 (0.0%) | 7 (100.0%) |
| Total (Category) | 40 (23.0%) | 134 (77.0%) |
| Total (Overall) | 325 (37.0%) | 553 (63.0%) |
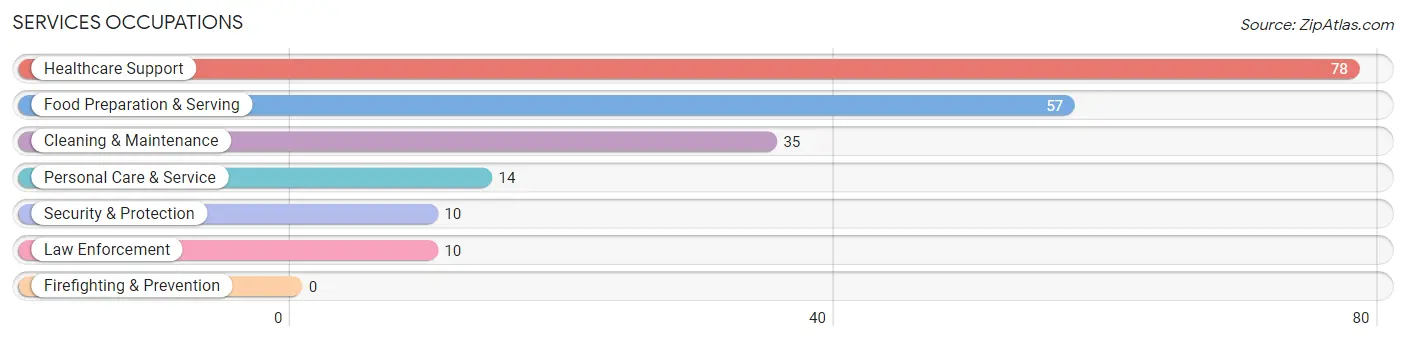
Services Occupations
The most common Services occupations in Jefferson are Healthcare Support (78 | 8.9%), Food Preparation & Serving (57 | 6.5%), Cleaning & Maintenance (35 | 4.0%), Personal Care & Service (14 | 1.6%), and Security & Protection (10 | 1.1%).
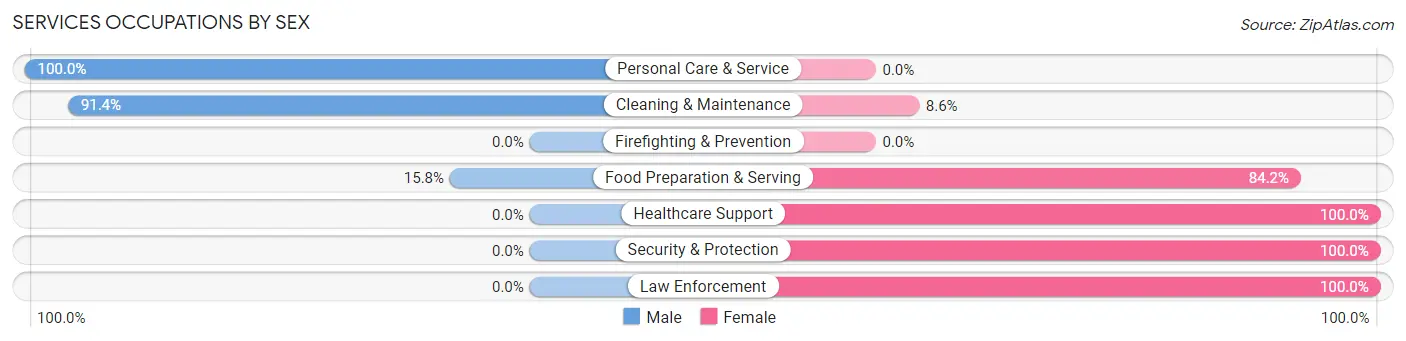
Services Occupations by Sex
Within the Services occupations in Jefferson, the most male-oriented occupations are Personal Care & Service (100.0%), Cleaning & Maintenance (91.4%), and Food Preparation & Serving (15.8%), while the most female-oriented occupations are Healthcare Support (100.0%), Security & Protection (100.0%), and Law Enforcement (100.0%).
| Occupation | Male | Female |
| Healthcare Support | 0 (0.0%) | 78 (100.0%) |
| Security & Protection | 0 (0.0%) | 10 (100.0%) |
| Firefighting & Prevention | 0 (0.0%) | 0 (0.0%) |
| Law Enforcement | 0 (0.0%) | 10 (100.0%) |
| Food Preparation & Serving | 9 (15.8%) | 48 (84.2%) |
| Cleaning & Maintenance | 32 (91.4%) | 3 (8.6%) |
| Personal Care & Service | 14 (100.0%) | 0 (0.0%) |
| Total (Category) | 55 (28.3%) | 139 (71.7%) |
| Total (Overall) | 325 (37.0%) | 553 (63.0%) |
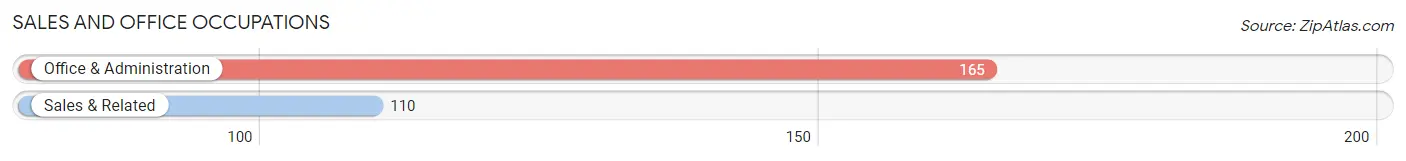
Sales and Office Occupations
The most common Sales and Office occupations in Jefferson are Office & Administration (165 | 18.8%), and Sales & Related (110 | 12.5%).
Sales and Office Occupations by Sex
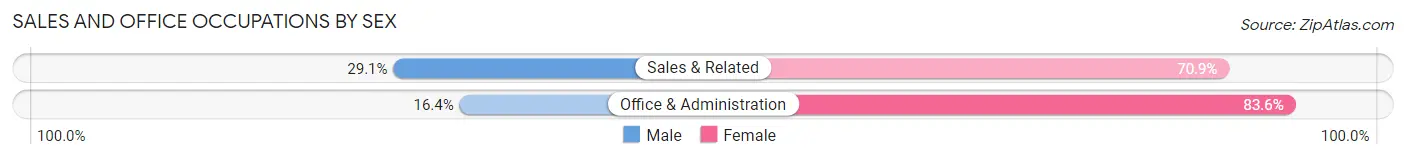
| Occupation | Male | Female |
| Sales & Related | 32 (29.1%) | 78 (70.9%) |
| Office & Administration | 27 (16.4%) | 138 (83.6%) |
| Total (Category) | 59 (21.4%) | 216 (78.5%) |
| Total (Overall) | 325 (37.0%) | 553 (63.0%) |
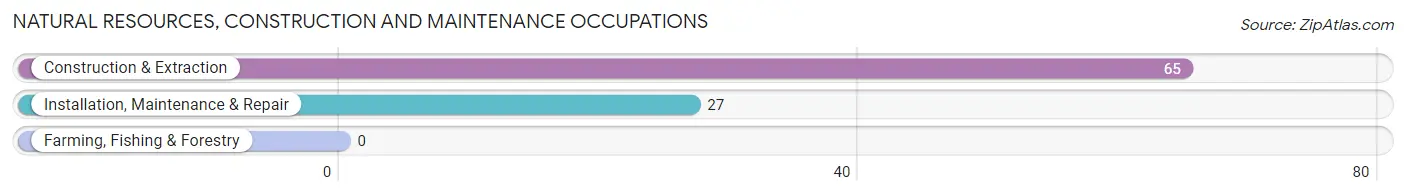
Natural Resources, Construction and Maintenance Occupations
The most common Natural Resources, Construction and Maintenance occupations in Jefferson are Construction & Extraction (65 | 7.4%), and Installation, Maintenance & Repair (27 | 3.1%).
Natural Resources, Construction and Maintenance Occupations by Sex
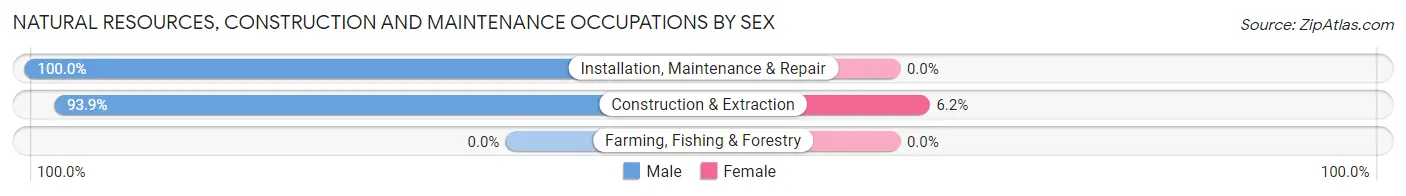
| Occupation | Male | Female |
| Farming, Fishing & Forestry | 0 (0.0%) | 0 (0.0%) |
| Construction & Extraction | 61 (93.9%) | 4 (6.1%) |
| Installation, Maintenance & Repair | 27 (100.0%) | 0 (0.0%) |
| Total (Category) | 88 (95.7%) | 4 (4.3%) |
| Total (Overall) | 325 (37.0%) | 553 (63.0%) |
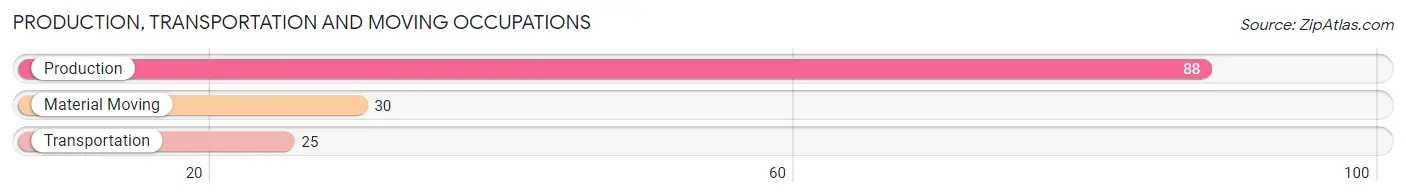
Production, Transportation and Moving Occupations
The most common Production, Transportation and Moving occupations in Jefferson are Production (88 | 10.0%), Material Moving (30 | 3.4%), and Transportation (25 | 2.9%).
Production, Transportation and Moving Occupations by Sex
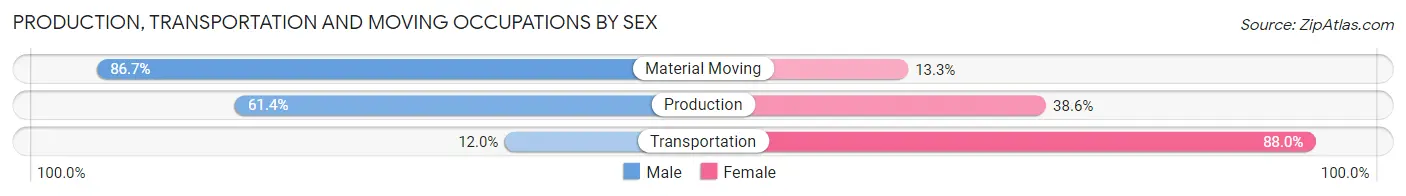
| Occupation | Male | Female |
| Production | 54 (61.4%) | 34 (38.6%) |
| Transportation | 3 (12.0%) | 22 (88.0%) |
| Material Moving | 26 (86.7%) | 4 (13.3%) |
| Total (Category) | 83 (58.0%) | 60 (42.0%) |
| Total (Overall) | 325 (37.0%) | 553 (63.0%) |
Employment Industries by Sex in Jefferson
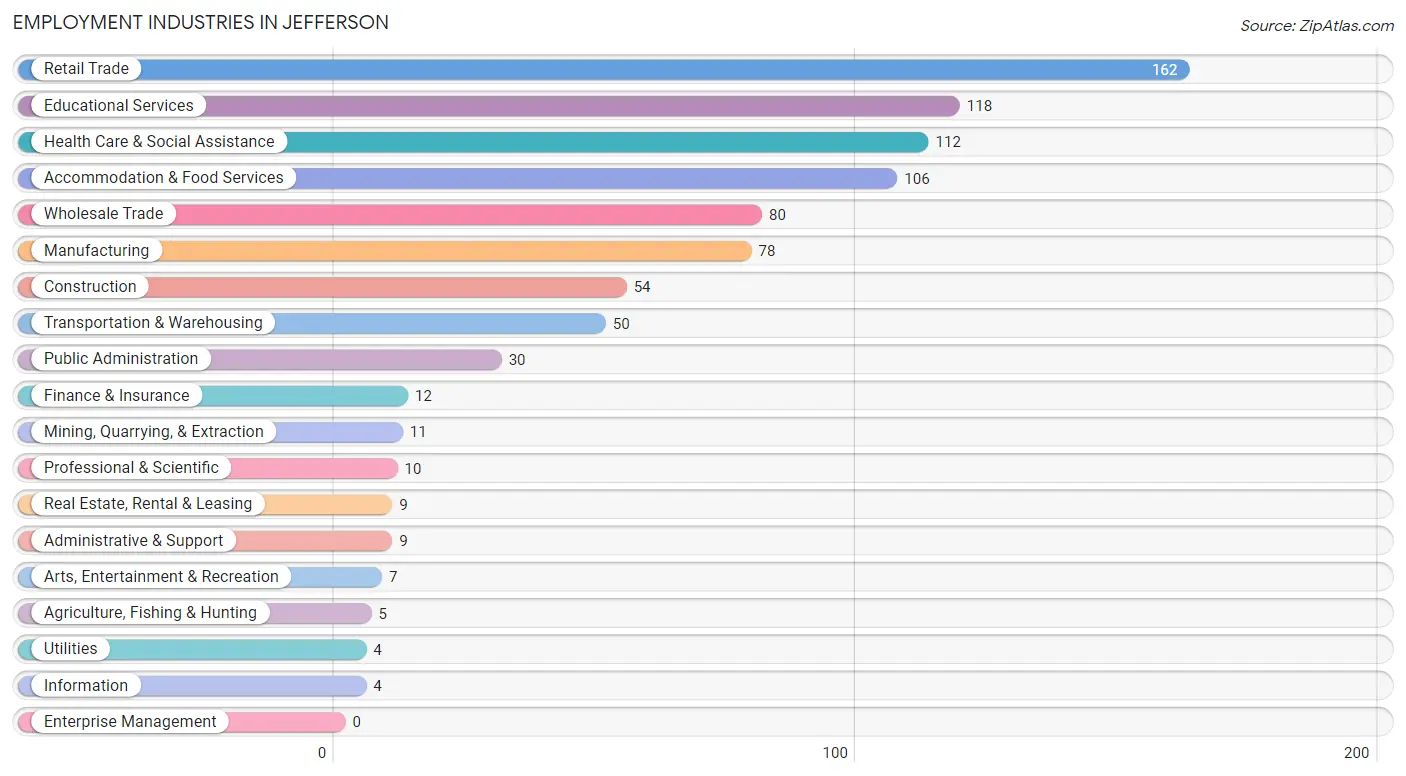
Employment Industries in Jefferson
The major employment industries in Jefferson include Retail Trade (162 | 18.4%), Educational Services (118 | 13.4%), Health Care & Social Assistance (112 | 12.8%), Accommodation & Food Services (106 | 12.1%), and Wholesale Trade (80 | 9.1%).
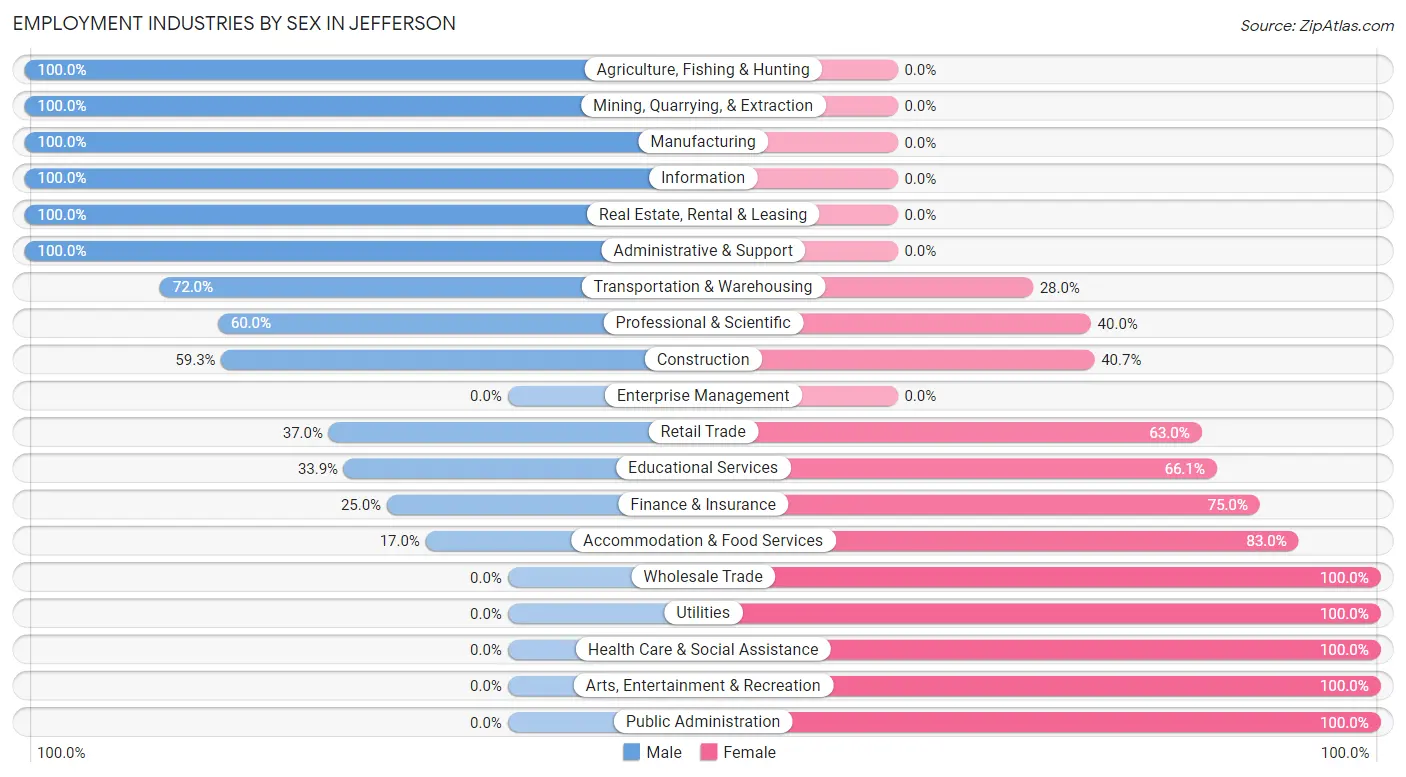
Employment Industries by Sex in Jefferson
The Jefferson industries that see more men than women are Agriculture, Fishing & Hunting (100.0%), Mining, Quarrying, & Extraction (100.0%), and Manufacturing (100.0%), whereas the industries that tend to have a higher number of women are Wholesale Trade (100.0%), Utilities (100.0%), and Health Care & Social Assistance (100.0%).
| Industry | Male | Female |
| Agriculture, Fishing & Hunting | 5 (100.0%) | 0 (0.0%) |
| Mining, Quarrying, & Extraction | 11 (100.0%) | 0 (0.0%) |
| Construction | 32 (59.3%) | 22 (40.7%) |
| Manufacturing | 78 (100.0%) | 0 (0.0%) |
| Wholesale Trade | 0 (0.0%) | 80 (100.0%) |
| Retail Trade | 60 (37.0%) | 102 (63.0%) |
| Transportation & Warehousing | 36 (72.0%) | 14 (28.0%) |
| Utilities | 0 (0.0%) | 4 (100.0%) |
| Information | 4 (100.0%) | 0 (0.0%) |
| Finance & Insurance | 3 (25.0%) | 9 (75.0%) |
| Real Estate, Rental & Leasing | 9 (100.0%) | 0 (0.0%) |
| Professional & Scientific | 6 (60.0%) | 4 (40.0%) |
| Enterprise Management | 0 (0.0%) | 0 (0.0%) |
| Administrative & Support | 9 (100.0%) | 0 (0.0%) |
| Educational Services | 40 (33.9%) | 78 (66.1%) |
| Health Care & Social Assistance | 0 (0.0%) | 112 (100.0%) |
| Arts, Entertainment & Recreation | 0 (0.0%) | 7 (100.0%) |
| Accommodation & Food Services | 18 (17.0%) | 88 (83.0%) |
| Public Administration | 0 (0.0%) | 30 (100.0%) |
| Total | 325 (37.0%) | 553 (63.0%) |
Education in Jefferson
School Enrollment in Jefferson
The most common levels of schooling among the 337 students in Jefferson are middle school (128 | 38.0%), high school (107 | 31.8%), and elementary school (72 | 21.4%).
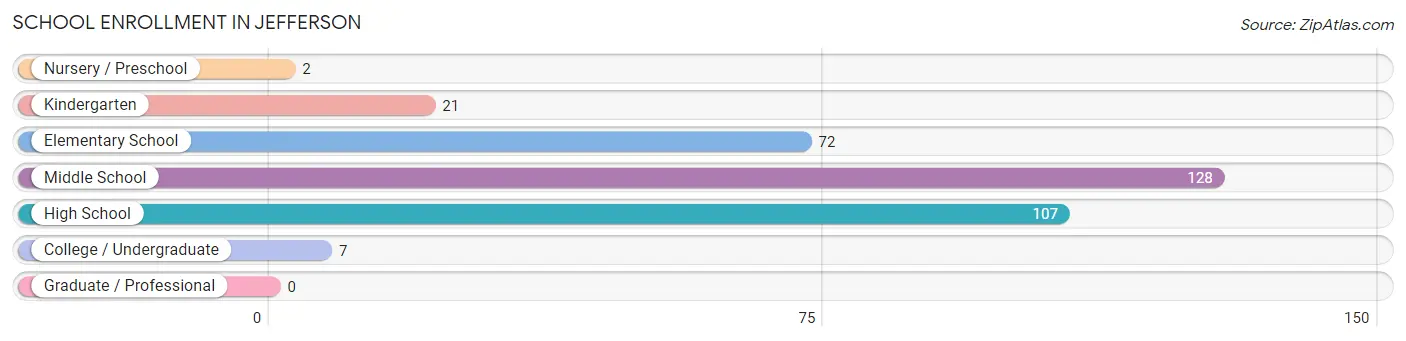
| School Level | # Students | % Students |
| Nursery / Preschool | 2 | 0.6% |
| Kindergarten | 21 | 6.2% |
| Elementary School | 72 | 21.4% |
| Middle School | 128 | 38.0% |
| High School | 107 | 31.8% |
| College / Undergraduate | 7 | 2.1% |
| Graduate / Professional | 0 | 0.0% |
| Total | 337 | 100.0% |
School Enrollment by Age by Funding Source in Jefferson
Out of a total of 337 students who are enrolled in schools in Jefferson, 57 (16.9%) attend a private institution, while the remaining 280 (83.1%) are enrolled in public schools. The age group of 5 to 9 year old has the highest likelihood of being enrolled in private schools, with 34 (31.2% in the age bracket) enrolled. Conversely, the age group of 3 to 4 year olds has the lowest likelihood of being enrolled in a private school, with 2 (100.0% in the age bracket) attending a public institution.
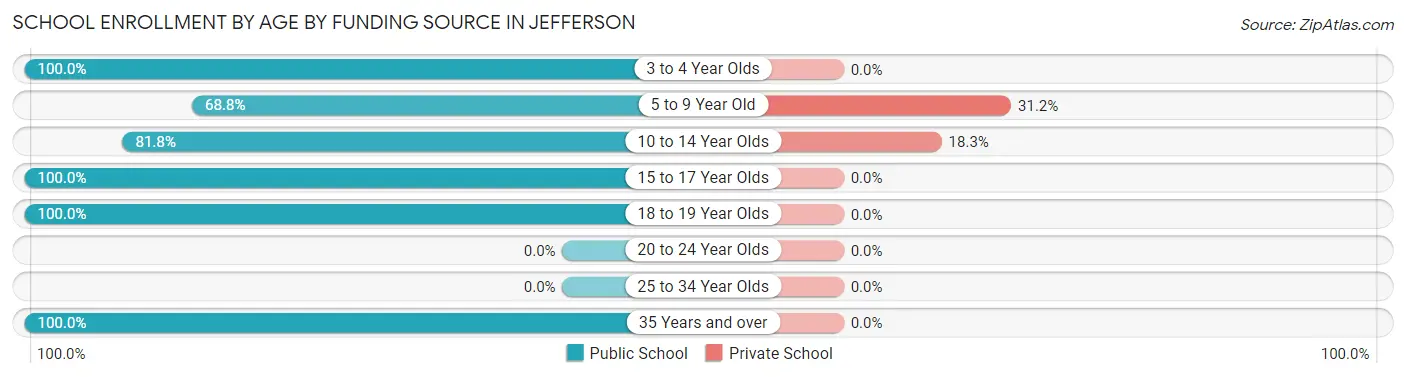
| Age Bracket | Public School | Private School |
| 3 to 4 Year Olds | 2 (100.0%) | 0 (0.0%) |
| 5 to 9 Year Old | 75 (68.8%) | 34 (31.2%) |
| 10 to 14 Year Olds | 103 (81.8%) | 23 (18.2%) |
| 15 to 17 Year Olds | 85 (100.0%) | 0 (0.0%) |
| 18 to 19 Year Olds | 8 (100.0%) | 0 (0.0%) |
| 20 to 24 Year Olds | 0 (0.0%) | 0 (0.0%) |
| 25 to 34 Year Olds | 0 (0.0%) | 0 (0.0%) |
| 35 Years and over | 7 (100.0%) | 0 (0.0%) |
| Total | 280 (83.1%) | 57 (16.9%) |
Educational Attainment by Field of Study in Jefferson
Business (81 | 20.9%), education (70 | 18.1%), liberal arts & history (62 | 16.0%), science & technology (35 | 9.0%), and arts & humanities (31 | 8.0%) are the most common fields of study among 387 individuals in Jefferson who have obtained a bachelor's degree or higher.
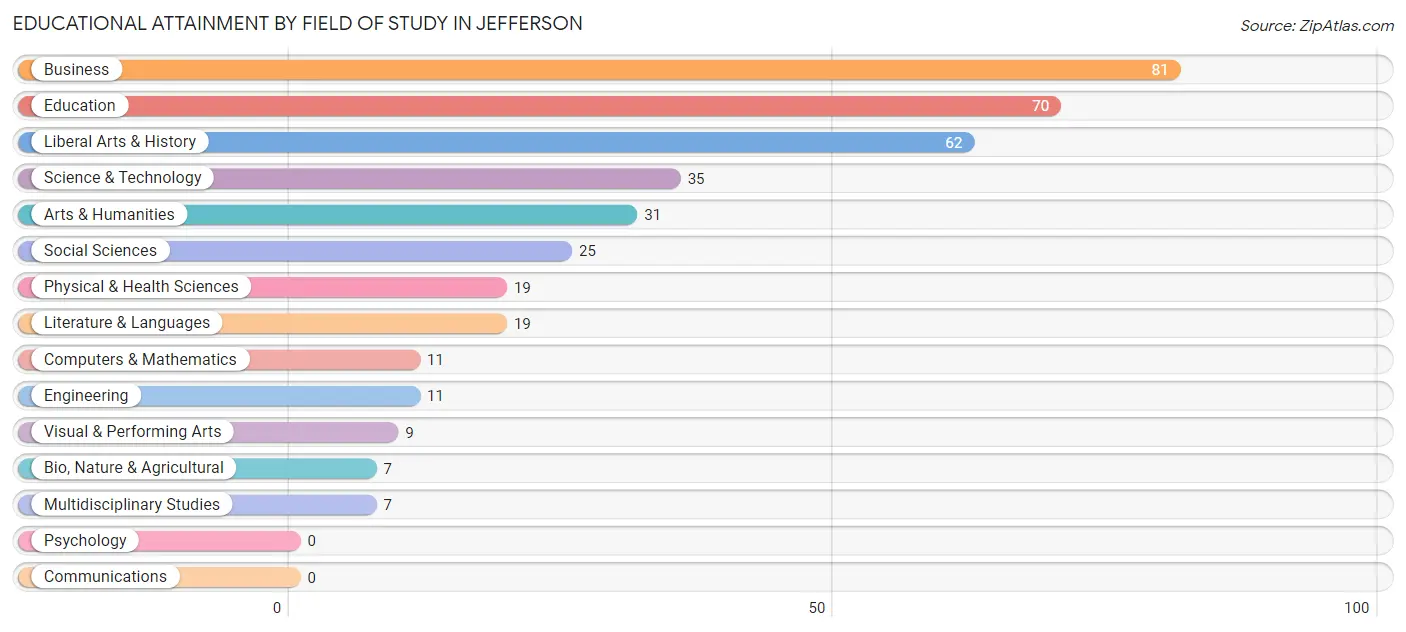
| Field of Study | # Graduates | % Graduates |
| Computers & Mathematics | 11 | 2.8% |
| Bio, Nature & Agricultural | 7 | 1.8% |
| Physical & Health Sciences | 19 | 4.9% |
| Psychology | 0 | 0.0% |
| Social Sciences | 25 | 6.5% |
| Engineering | 11 | 2.8% |
| Multidisciplinary Studies | 7 | 1.8% |
| Science & Technology | 35 | 9.0% |
| Business | 81 | 20.9% |
| Education | 70 | 18.1% |
| Literature & Languages | 19 | 4.9% |
| Liberal Arts & History | 62 | 16.0% |
| Visual & Performing Arts | 9 | 2.3% |
| Communications | 0 | 0.0% |
| Arts & Humanities | 31 | 8.0% |
| Total | 387 | 100.0% |
Transportation & Commute in Jefferson
Vehicle Availability by Sex in Jefferson
The most prevalent vehicle ownership categories in Jefferson are males with 2 vehicles (136, accounting for 41.8%) and females with 2 vehicles (151, making up 24.6%).
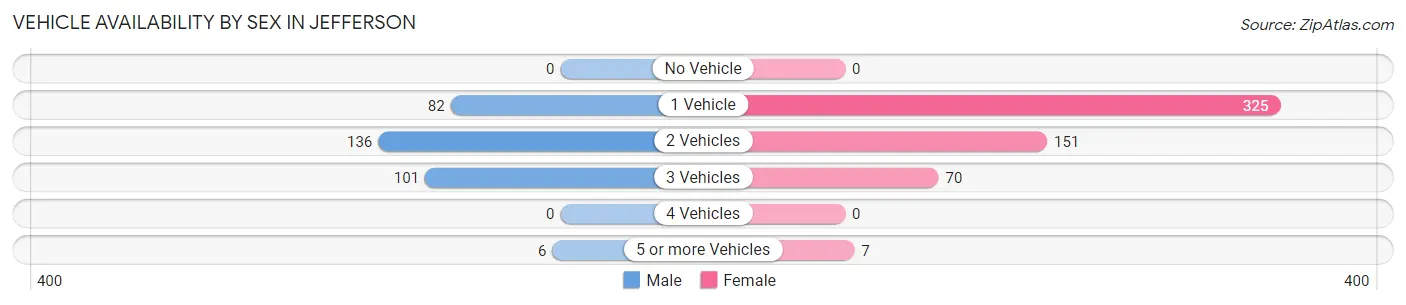
| Vehicles Available | Male | Female |
| No Vehicle | 0 (0.0%) | 0 (0.0%) |
| 1 Vehicle | 82 (25.2%) | 325 (58.8%) |
| 2 Vehicles | 136 (41.8%) | 151 (27.3%) |
| 3 Vehicles | 101 (31.1%) | 70 (12.7%) |
| 4 Vehicles | 0 (0.0%) | 0 (0.0%) |
| 5 or more Vehicles | 6 (1.8%) | 7 (1.3%) |
| Total | 325 (100.0%) | 553 (100.0%) |
Commute Time in Jefferson
The most frequently occuring commute durations in Jefferson are 20 to 24 minutes (193 commuters, 23.0%), 30 to 34 minutes (109 commuters, 13.0%), and 10 to 14 minutes (102 commuters, 12.1%).
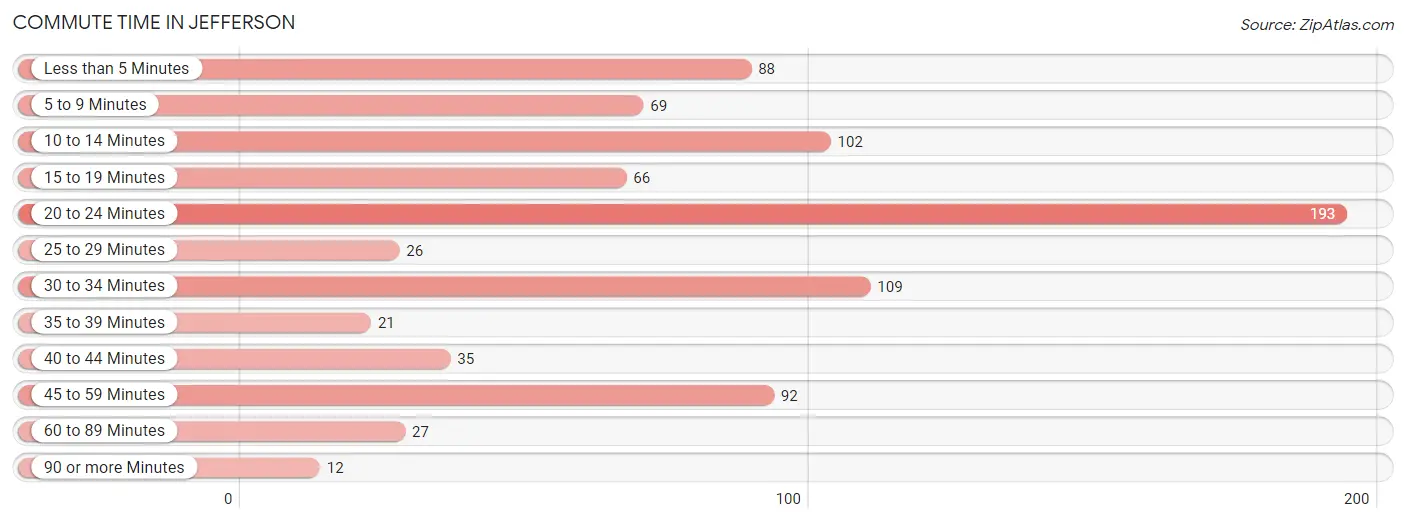
| Commute Time | # Commuters | % Commuters |
| Less than 5 Minutes | 88 | 10.5% |
| 5 to 9 Minutes | 69 | 8.2% |
| 10 to 14 Minutes | 102 | 12.1% |
| 15 to 19 Minutes | 66 | 7.9% |
| 20 to 24 Minutes | 193 | 23.0% |
| 25 to 29 Minutes | 26 | 3.1% |
| 30 to 34 Minutes | 109 | 13.0% |
| 35 to 39 Minutes | 21 | 2.5% |
| 40 to 44 Minutes | 35 | 4.2% |
| 45 to 59 Minutes | 92 | 11.0% |
| 60 to 89 Minutes | 27 | 3.2% |
| 90 or more Minutes | 12 | 1.4% |
Commute Time by Sex in Jefferson
The most common commute times in Jefferson are 45 to 59 minutes (58 commuters, 18.8%) for males and 20 to 24 minutes (152 commuters, 28.6%) for females.
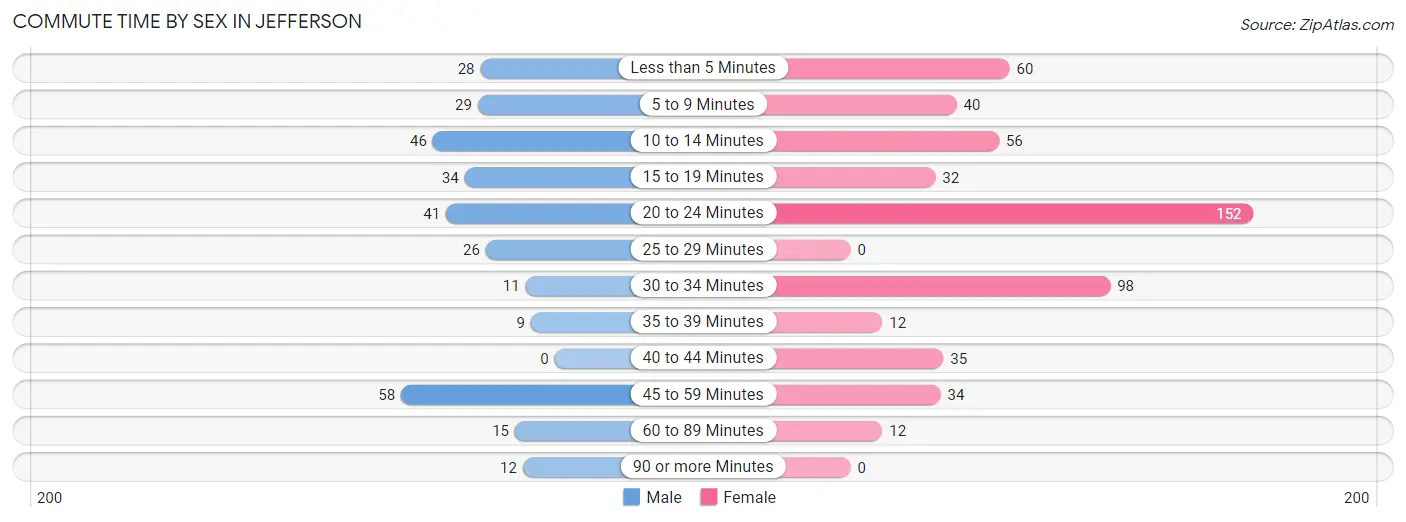
| Commute Time | Male | Female |
| Less than 5 Minutes | 28 (9.1%) | 60 (11.3%) |
| 5 to 9 Minutes | 29 (9.4%) | 40 (7.5%) |
| 10 to 14 Minutes | 46 (14.9%) | 56 (10.5%) |
| 15 to 19 Minutes | 34 (11.0%) | 32 (6.0%) |
| 20 to 24 Minutes | 41 (13.3%) | 152 (28.6%) |
| 25 to 29 Minutes | 26 (8.4%) | 0 (0.0%) |
| 30 to 34 Minutes | 11 (3.6%) | 98 (18.5%) |
| 35 to 39 Minutes | 9 (2.9%) | 12 (2.3%) |
| 40 to 44 Minutes | 0 (0.0%) | 35 (6.6%) |
| 45 to 59 Minutes | 58 (18.8%) | 34 (6.4%) |
| 60 to 89 Minutes | 15 (4.9%) | 12 (2.3%) |
| 90 or more Minutes | 12 (3.9%) | 0 (0.0%) |
Time of Departure to Work by Sex in Jefferson
The most frequent times of departure to work in Jefferson are 5:30 AM to 5:59 AM (46, 14.9%) for males and 7:00 AM to 7:29 AM (161, 30.3%) for females.
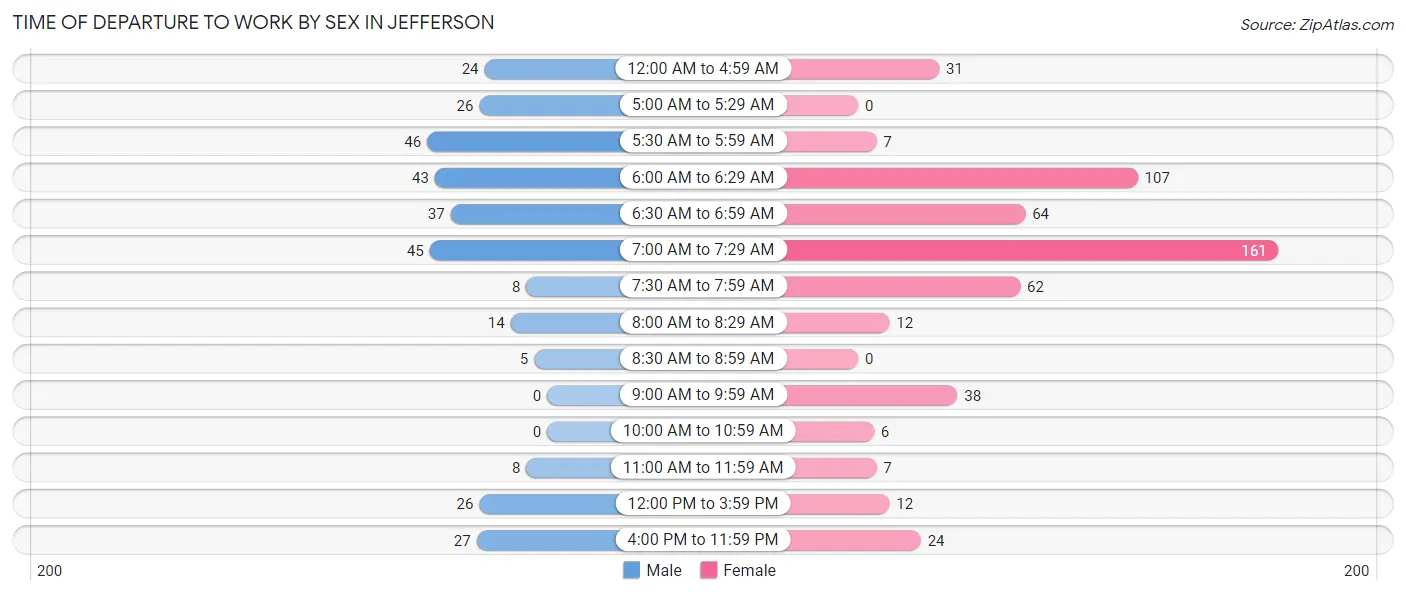
| Time of Departure | Male | Female |
| 12:00 AM to 4:59 AM | 24 (7.8%) | 31 (5.8%) |
| 5:00 AM to 5:29 AM | 26 (8.4%) | 0 (0.0%) |
| 5:30 AM to 5:59 AM | 46 (14.9%) | 7 (1.3%) |
| 6:00 AM to 6:29 AM | 43 (13.9%) | 107 (20.2%) |
| 6:30 AM to 6:59 AM | 37 (12.0%) | 64 (12.0%) |
| 7:00 AM to 7:29 AM | 45 (14.6%) | 161 (30.3%) |
| 7:30 AM to 7:59 AM | 8 (2.6%) | 62 (11.7%) |
| 8:00 AM to 8:29 AM | 14 (4.5%) | 12 (2.3%) |
| 8:30 AM to 8:59 AM | 5 (1.6%) | 0 (0.0%) |
| 9:00 AM to 9:59 AM | 0 (0.0%) | 38 (7.2%) |
| 10:00 AM to 10:59 AM | 0 (0.0%) | 6 (1.1%) |
| 11:00 AM to 11:59 AM | 8 (2.6%) | 7 (1.3%) |
| 12:00 PM to 3:59 PM | 26 (8.4%) | 12 (2.3%) |
| 4:00 PM to 11:59 PM | 27 (8.7%) | 24 (4.5%) |
| Total | 309 (100.0%) | 531 (100.0%) |
Housing Occupancy in Jefferson
Occupancy by Ownership in Jefferson
Of the total 936 dwellings in Jefferson, owner-occupied units account for 484 (51.7%), while renter-occupied units make up 452 (48.3%).
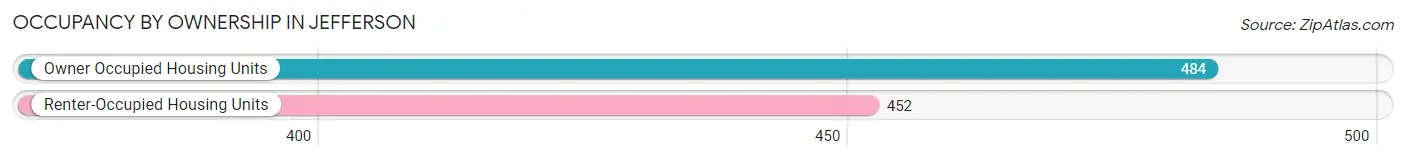
| Occupancy | # Housing Units | % Housing Units |
| Owner Occupied Housing Units | 484 | 51.7% |
| Renter-Occupied Housing Units | 452 | 48.3% |
| Total Occupied Housing Units | 936 | 100.0% |
Occupancy by Household Size in Jefferson
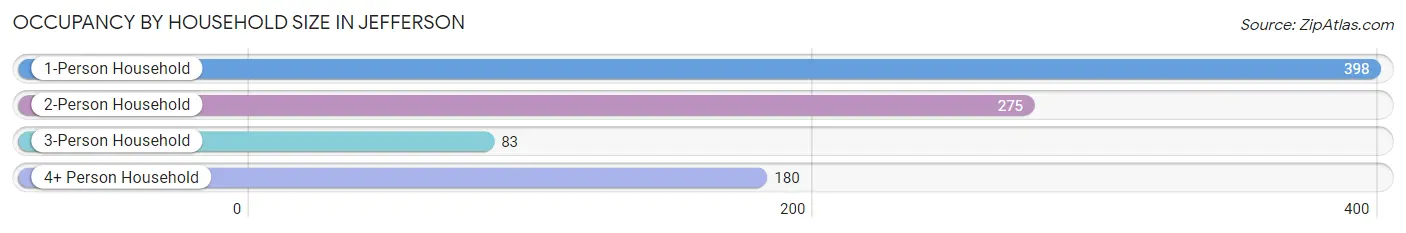
| Household Size | # Housing Units | % Housing Units |
| 1-Person Household | 398 | 42.5% |
| 2-Person Household | 275 | 29.4% |
| 3-Person Household | 83 | 8.9% |
| 4+ Person Household | 180 | 19.2% |
| Total Housing Units | 936 | 100.0% |
Occupancy by Ownership by Household Size in Jefferson
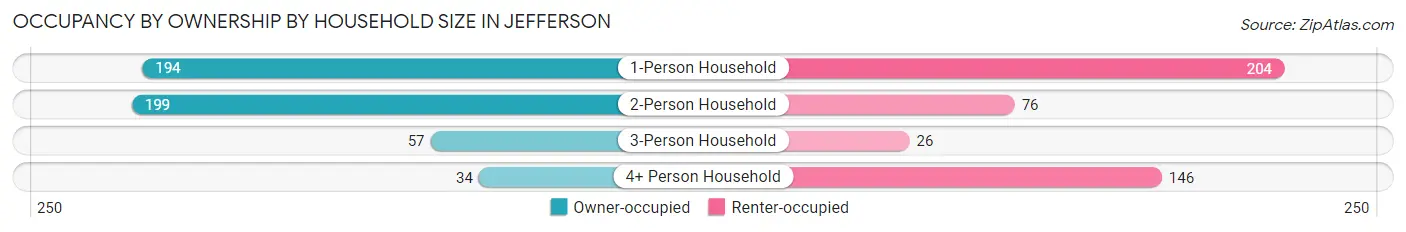
| Household Size | Owner-occupied | Renter-occupied |
| 1-Person Household | 194 (48.7%) | 204 (51.3%) |
| 2-Person Household | 199 (72.4%) | 76 (27.6%) |
| 3-Person Household | 57 (68.7%) | 26 (31.3%) |
| 4+ Person Household | 34 (18.9%) | 146 (81.1%) |
| Total Housing Units | 484 (51.7%) | 452 (48.3%) |
Occupancy by Educational Attainment in Jefferson
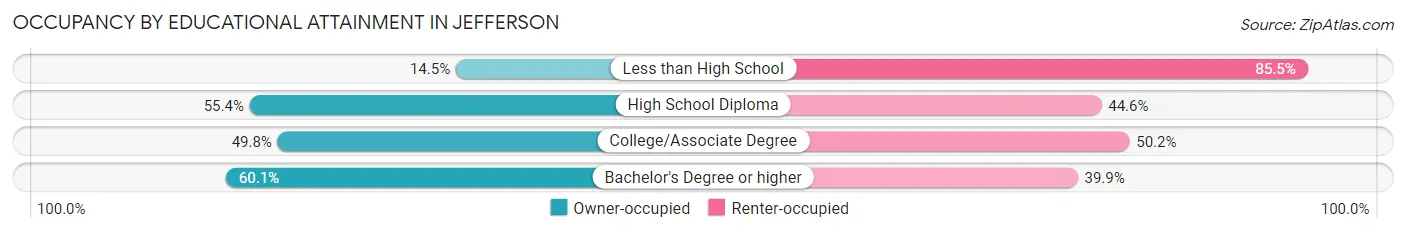
| Household Size | Owner-occupied | Renter-occupied |
| Less than High School | 11 (14.5%) | 65 (85.5%) |
| High School Diploma | 186 (55.4%) | 150 (44.6%) |
| College/Associate Degree | 135 (49.8%) | 136 (50.2%) |
| Bachelor's Degree or higher | 152 (60.1%) | 101 (39.9%) |
Occupancy by Age of Householder in Jefferson
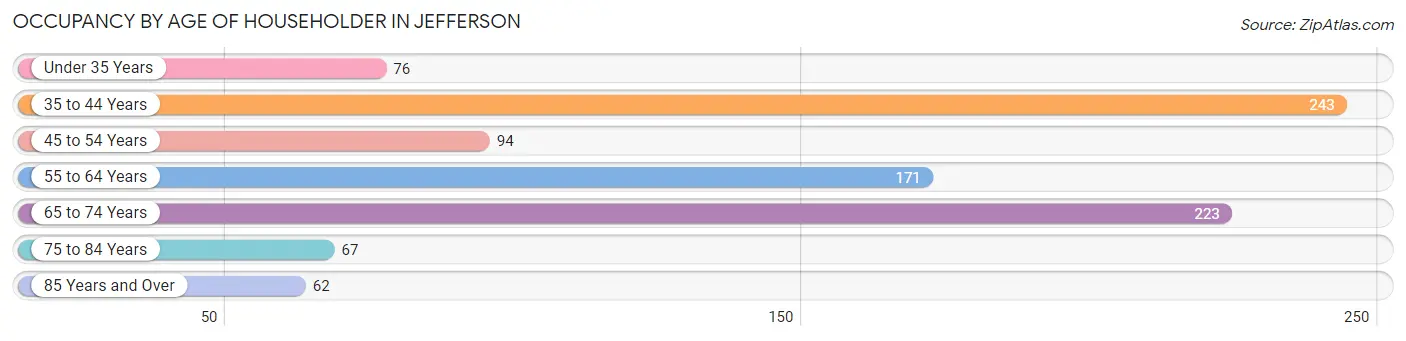
| Age Bracket | # Households | % Households |
| Under 35 Years | 76 | 8.1% |
| 35 to 44 Years | 243 | 26.0% |
| 45 to 54 Years | 94 | 10.0% |
| 55 to 64 Years | 171 | 18.3% |
| 65 to 74 Years | 223 | 23.8% |
| 75 to 84 Years | 67 | 7.2% |
| 85 Years and Over | 62 | 6.6% |
| Total | 936 | 100.0% |
Housing Finances in Jefferson
Median Income by Occupancy in Jefferson
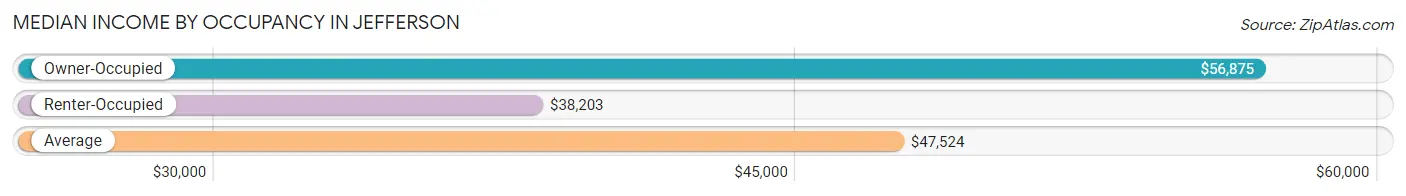
| Occupancy Type | # Households | Median Income |
| Owner-Occupied | 484 (51.7%) | $56,875 |
| Renter-Occupied | 452 (48.3%) | $38,203 |
| Average | 936 (100.0%) | $47,524 |
Occupancy by Householder Income Bracket in Jefferson
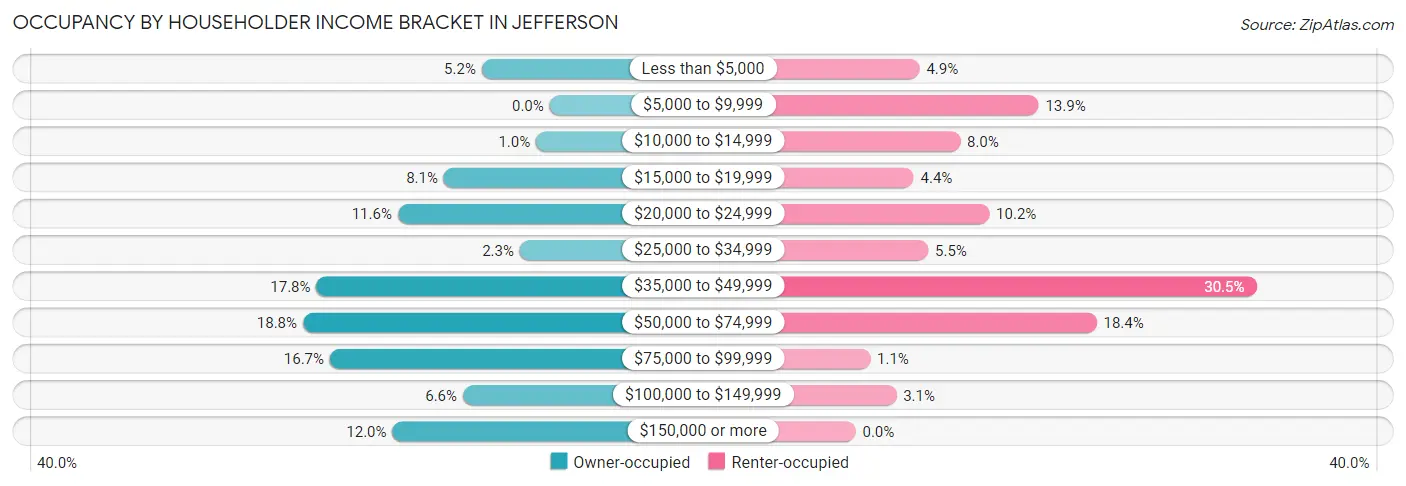
| Income Bracket | Owner-occupied | Renter-occupied |
| Less than $5,000 | 25 (5.2%) | 22 (4.9%) |
| $5,000 to $9,999 | 0 (0.0%) | 63 (13.9%) |
| $10,000 to $14,999 | 5 (1.0%) | 36 (8.0%) |
| $15,000 to $19,999 | 39 (8.1%) | 20 (4.4%) |
| $20,000 to $24,999 | 56 (11.6%) | 46 (10.2%) |
| $25,000 to $34,999 | 11 (2.3%) | 25 (5.5%) |
| $35,000 to $49,999 | 86 (17.8%) | 138 (30.5%) |
| $50,000 to $74,999 | 91 (18.8%) | 83 (18.4%) |
| $75,000 to $99,999 | 81 (16.7%) | 5 (1.1%) |
| $100,000 to $149,999 | 32 (6.6%) | 14 (3.1%) |
| $150,000 or more | 58 (12.0%) | 0 (0.0%) |
| Total | 484 (100.0%) | 452 (100.0%) |
Monthly Housing Cost Tiers in Jefferson
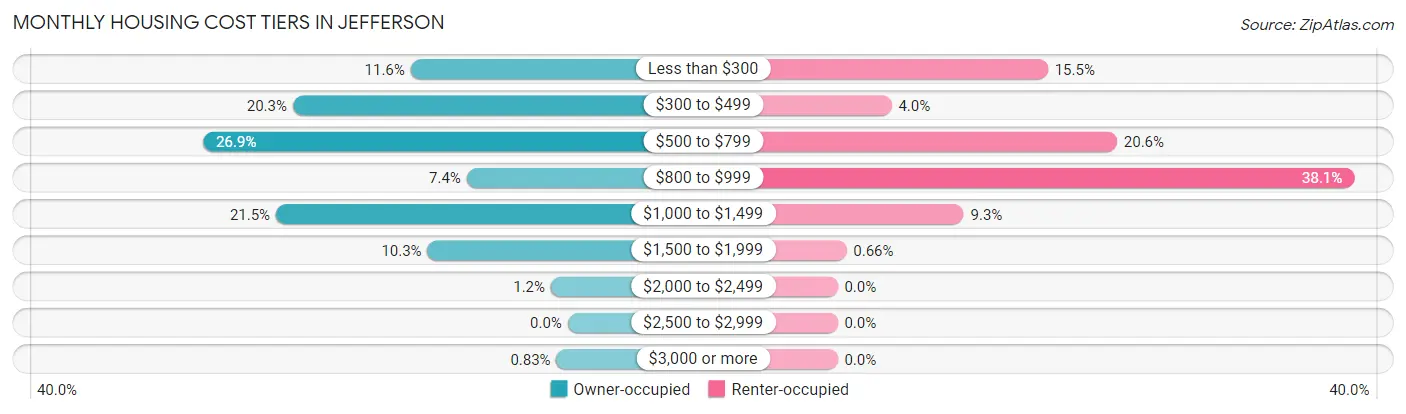
| Monthly Cost | Owner-occupied | Renter-occupied |
| Less than $300 | 56 (11.6%) | 70 (15.5%) |
| $300 to $499 | 98 (20.3%) | 18 (4.0%) |
| $500 to $799 | 130 (26.9%) | 93 (20.6%) |
| $800 to $999 | 36 (7.4%) | 172 (38.1%) |
| $1,000 to $1,499 | 104 (21.5%) | 42 (9.3%) |
| $1,500 to $1,999 | 50 (10.3%) | 3 (0.7%) |
| $2,000 to $2,499 | 6 (1.2%) | 0 (0.0%) |
| $2,500 to $2,999 | 0 (0.0%) | 0 (0.0%) |
| $3,000 or more | 4 (0.8%) | 0 (0.0%) |
| Total | 484 (100.0%) | 452 (100.0%) |
Physical Housing Characteristics in Jefferson
Housing Structures in Jefferson
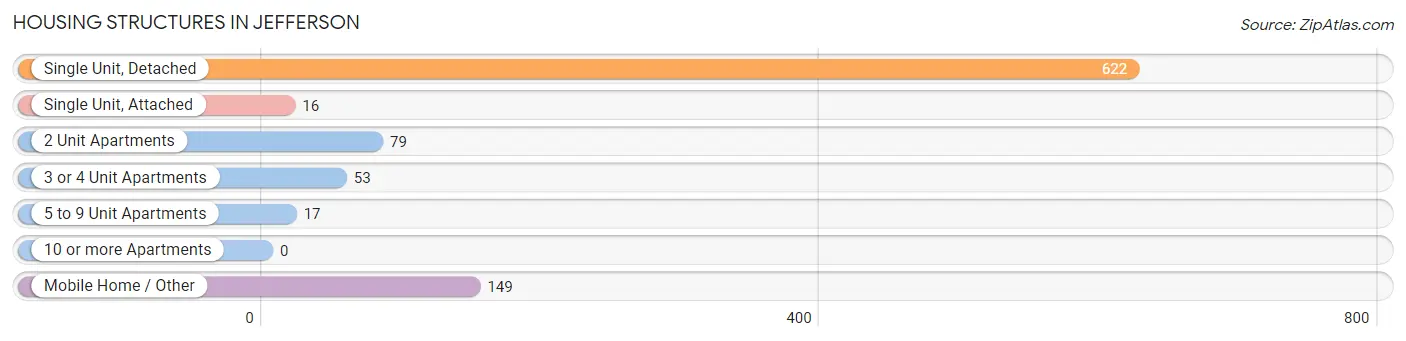
| Structure Type | # Housing Units | % Housing Units |
| Single Unit, Detached | 622 | 66.4% |
| Single Unit, Attached | 16 | 1.7% |
| 2 Unit Apartments | 79 | 8.4% |
| 3 or 4 Unit Apartments | 53 | 5.7% |
| 5 to 9 Unit Apartments | 17 | 1.8% |
| 10 or more Apartments | 0 | 0.0% |
| Mobile Home / Other | 149 | 15.9% |
| Total | 936 | 100.0% |
Housing Structures by Occupancy in Jefferson
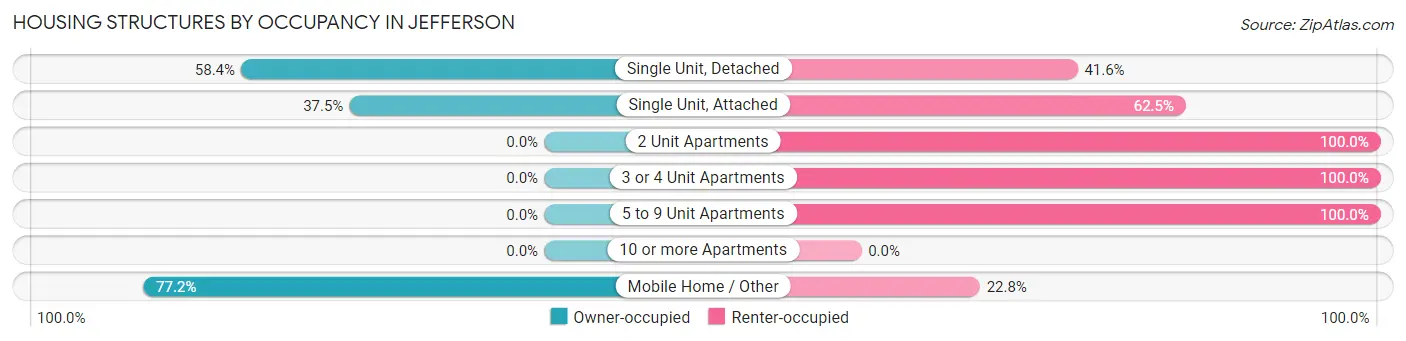
| Structure Type | Owner-occupied | Renter-occupied |
| Single Unit, Detached | 363 (58.4%) | 259 (41.6%) |
| Single Unit, Attached | 6 (37.5%) | 10 (62.5%) |
| 2 Unit Apartments | 0 (0.0%) | 79 (100.0%) |
| 3 or 4 Unit Apartments | 0 (0.0%) | 53 (100.0%) |
| 5 to 9 Unit Apartments | 0 (0.0%) | 17 (100.0%) |
| 10 or more Apartments | 0 (0.0%) | 0 (0.0%) |
| Mobile Home / Other | 115 (77.2%) | 34 (22.8%) |
| Total | 484 (51.7%) | 452 (48.3%) |
Housing Structures by Number of Rooms in Jefferson
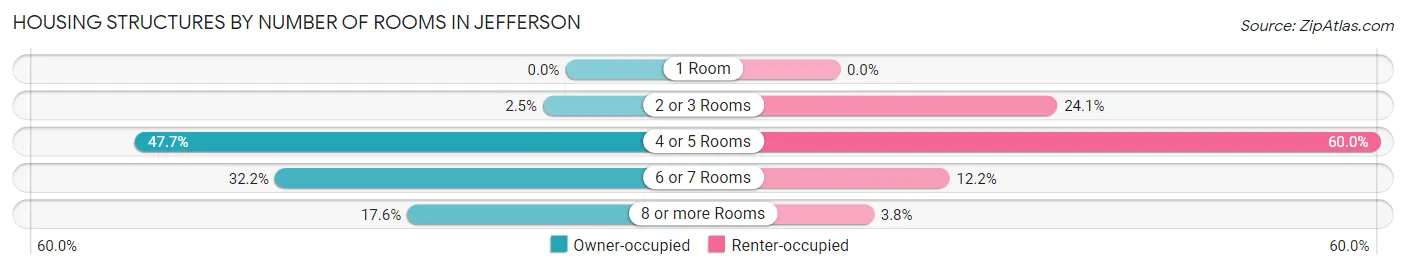
| Number of Rooms | Owner-occupied | Renter-occupied |
| 1 Room | 0 (0.0%) | 0 (0.0%) |
| 2 or 3 Rooms | 12 (2.5%) | 109 (24.1%) |
| 4 or 5 Rooms | 231 (47.7%) | 271 (60.0%) |
| 6 or 7 Rooms | 156 (32.2%) | 55 (12.2%) |
| 8 or more Rooms | 85 (17.6%) | 17 (3.8%) |
| Total | 484 (100.0%) | 452 (100.0%) |
Housing Structure by Heating Type in Jefferson
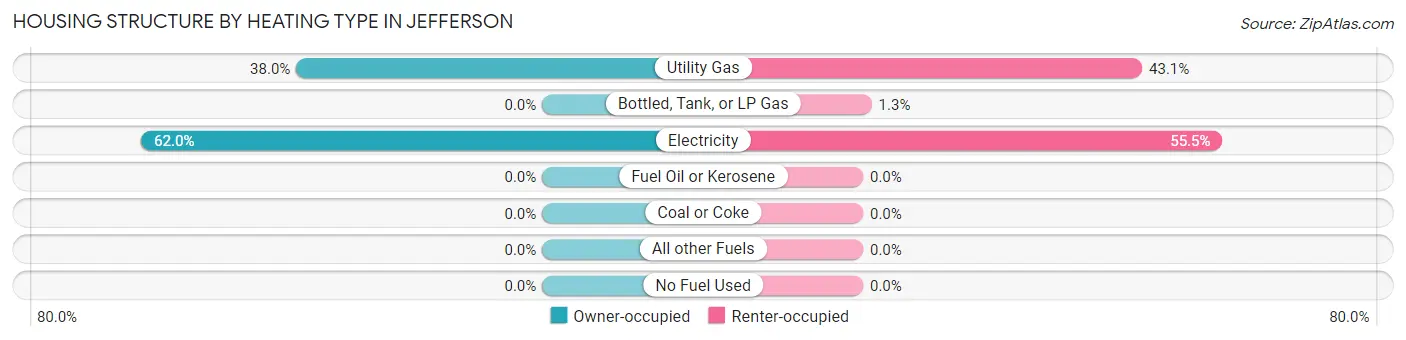
| Heating Type | Owner-occupied | Renter-occupied |
| Utility Gas | 184 (38.0%) | 195 (43.1%) |
| Bottled, Tank, or LP Gas | 0 (0.0%) | 6 (1.3%) |
| Electricity | 300 (62.0%) | 251 (55.5%) |
| Fuel Oil or Kerosene | 0 (0.0%) | 0 (0.0%) |
| Coal or Coke | 0 (0.0%) | 0 (0.0%) |
| All other Fuels | 0 (0.0%) | 0 (0.0%) |
| No Fuel Used | 0 (0.0%) | 0 (0.0%) |
| Total | 484 (100.0%) | 452 (100.0%) |
Household Vehicle Usage in Jefferson
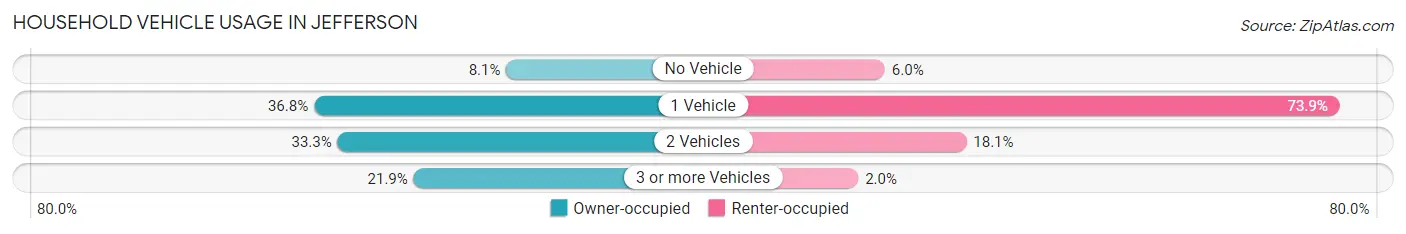
| Vehicles per Household | Owner-occupied | Renter-occupied |
| No Vehicle | 39 (8.1%) | 27 (6.0%) |
| 1 Vehicle | 178 (36.8%) | 334 (73.9%) |
| 2 Vehicles | 161 (33.3%) | 82 (18.1%) |
| 3 or more Vehicles | 106 (21.9%) | 9 (2.0%) |
| Total | 484 (100.0%) | 452 (100.0%) |
Real Estate & Mortgages in Jefferson
Real Estate and Mortgage Overview in Jefferson
| Characteristic | Without Mortgage | With Mortgage |
| Housing Units | 308 | 176 |
| Median Property Value | $156,800 | $92,000 |
| Median Household Income | $58,571 | $11 |
| Monthly Housing Costs | $500 | $0 |
| Real Estate Taxes | $1,423 | $0 |
Property Value by Mortgage Status in Jefferson
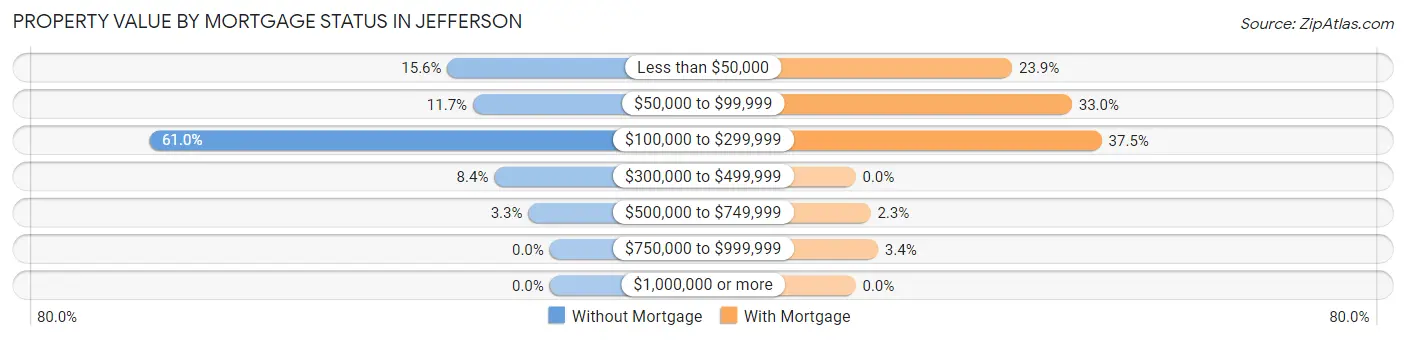
| Property Value | Without Mortgage | With Mortgage |
| Less than $50,000 | 48 (15.6%) | 42 (23.9%) |
| $50,000 to $99,999 | 36 (11.7%) | 58 (33.0%) |
| $100,000 to $299,999 | 188 (61.0%) | 66 (37.5%) |
| $300,000 to $499,999 | 26 (8.4%) | 0 (0.0%) |
| $500,000 to $749,999 | 10 (3.3%) | 4 (2.3%) |
| $750,000 to $999,999 | 0 (0.0%) | 6 (3.4%) |
| $1,000,000 or more | 0 (0.0%) | 0 (0.0%) |
| Total | 308 (100.0%) | 176 (100.0%) |
Household Income by Mortgage Status in Jefferson
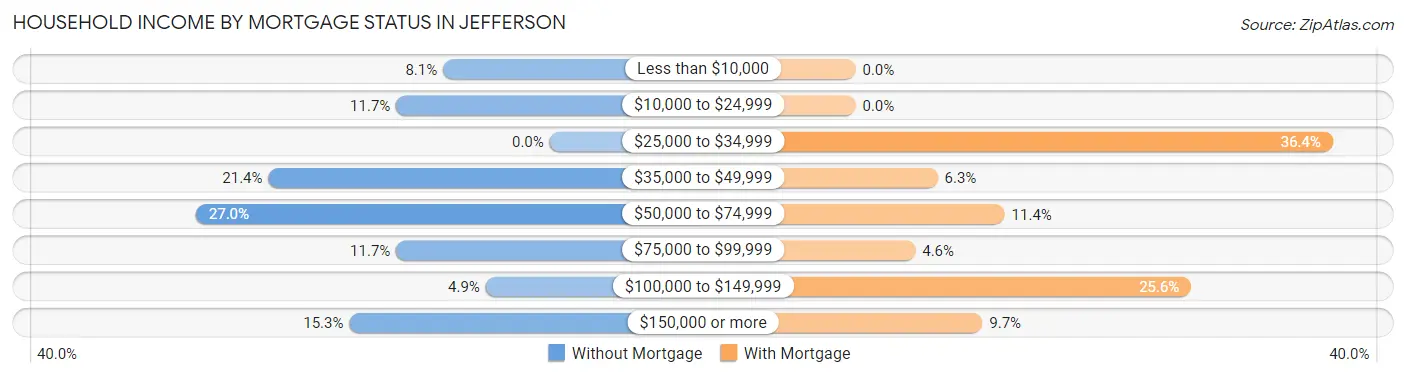
| Household Income | Without Mortgage | With Mortgage |
| Less than $10,000 | 25 (8.1%) | 0 (0.0%) |
| $10,000 to $24,999 | 36 (11.7%) | 0 (0.0%) |
| $25,000 to $34,999 | 0 (0.0%) | 64 (36.4%) |
| $35,000 to $49,999 | 66 (21.4%) | 11 (6.2%) |
| $50,000 to $74,999 | 83 (27.0%) | 20 (11.4%) |
| $75,000 to $99,999 | 36 (11.7%) | 8 (4.5%) |
| $100,000 to $149,999 | 15 (4.9%) | 45 (25.6%) |
| $150,000 or more | 47 (15.3%) | 17 (9.7%) |
| Total | 308 (100.0%) | 176 (100.0%) |
Property Value to Household Income Ratio in Jefferson
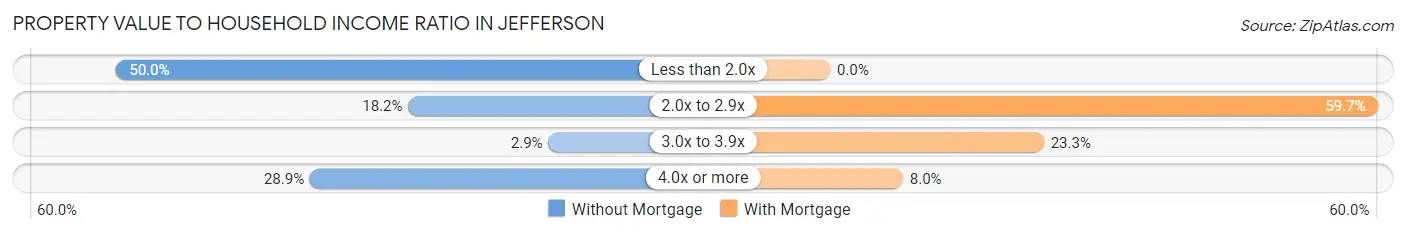
| Value-to-Income Ratio | Without Mortgage | With Mortgage |
| Less than 2.0x | 154 (50.0%) | 0 (0.0%) |
| 2.0x to 2.9x | 56 (18.2%) | 105 (59.7%) |
| 3.0x to 3.9x | 9 (2.9%) | 41 (23.3%) |
| 4.0x or more | 89 (28.9%) | 14 (8.0%) |
| Total | 308 (100.0%) | 176 (100.0%) |
Real Estate Taxes by Mortgage Status in Jefferson
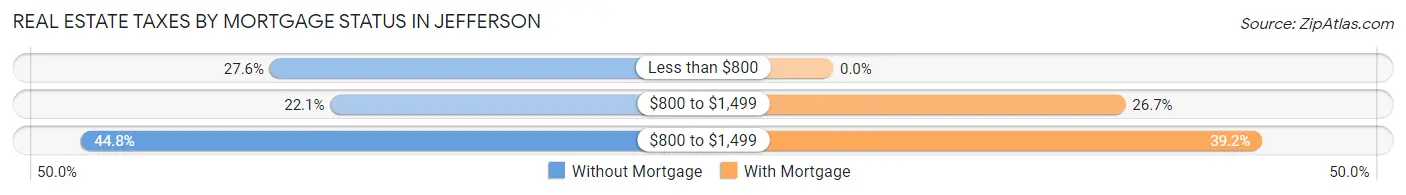
| Property Taxes | Without Mortgage | With Mortgage |
| Less than $800 | 85 (27.6%) | 0 (0.0%) |
| $800 to $1,499 | 68 (22.1%) | 47 (26.7%) |
| $800 to $1,499 | 138 (44.8%) | 69 (39.2%) |
| Total | 308 (100.0%) | 176 (100.0%) |
Health & Disability in Jefferson
Health Insurance Coverage by Age in Jefferson
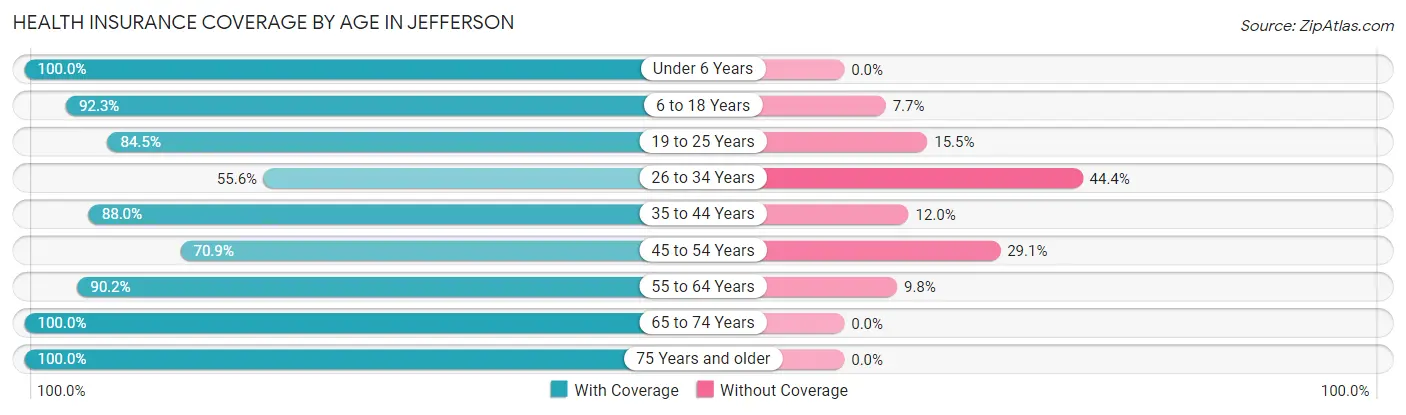
| Age Bracket | With Coverage | Without Coverage |
| Under 6 Years | 122 (100.0%) | 0 (0.0%) |
| 6 to 18 Years | 287 (92.3%) | 24 (7.7%) |
| 19 to 25 Years | 142 (84.5%) | 26 (15.5%) |
| 26 to 34 Years | 65 (55.6%) | 52 (44.4%) |
| 35 to 44 Years | 323 (88.0%) | 44 (12.0%) |
| 45 to 54 Years | 100 (70.9%) | 41 (29.1%) |
| 55 to 64 Years | 229 (90.2%) | 25 (9.8%) |
| 65 to 74 Years | 347 (100.0%) | 0 (0.0%) |
| 75 Years and older | 147 (100.0%) | 0 (0.0%) |
| Total | 1,762 (89.3%) | 212 (10.7%) |
Health Insurance Coverage by Citizenship Status in Jefferson
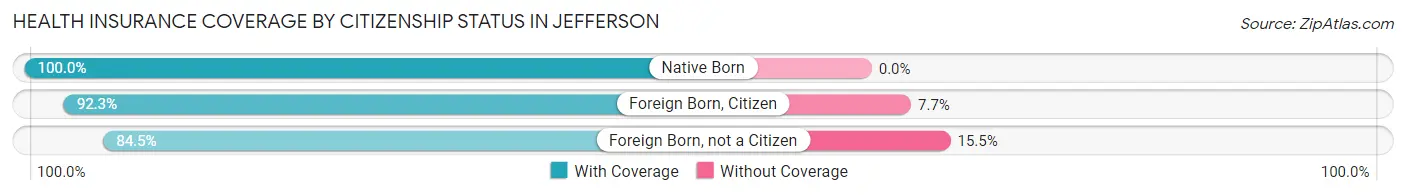
| Citizenship Status | With Coverage | Without Coverage |
| Native Born | 122 (100.0%) | 0 (0.0%) |
| Foreign Born, Citizen | 287 (92.3%) | 24 (7.7%) |
| Foreign Born, not a Citizen | 142 (84.5%) | 26 (15.5%) |
Health Insurance Coverage by Household Income in Jefferson
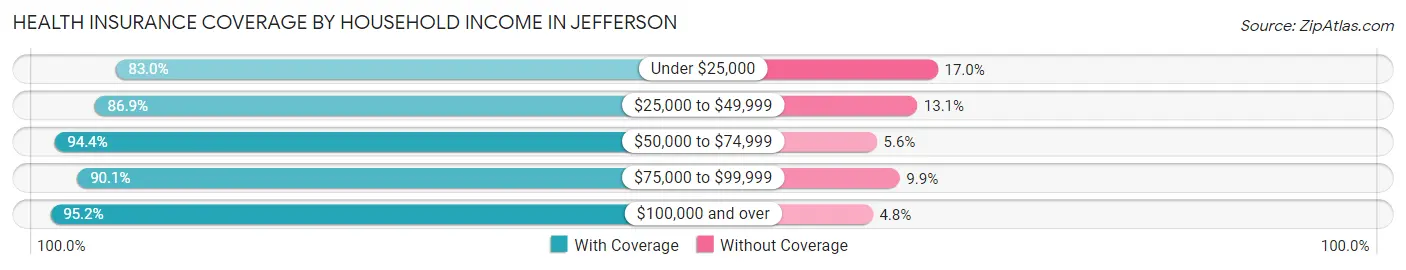
| Household Income | With Coverage | Without Coverage |
| Under $25,000 | 420 (83.0%) | 86 (17.0%) |
| $25,000 to $49,999 | 463 (86.9%) | 70 (13.1%) |
| $50,000 to $74,999 | 474 (94.4%) | 28 (5.6%) |
| $75,000 to $99,999 | 128 (90.1%) | 14 (9.9%) |
| $100,000 and over | 277 (95.2%) | 14 (4.8%) |
Public vs Private Health Insurance Coverage by Age in Jefferson
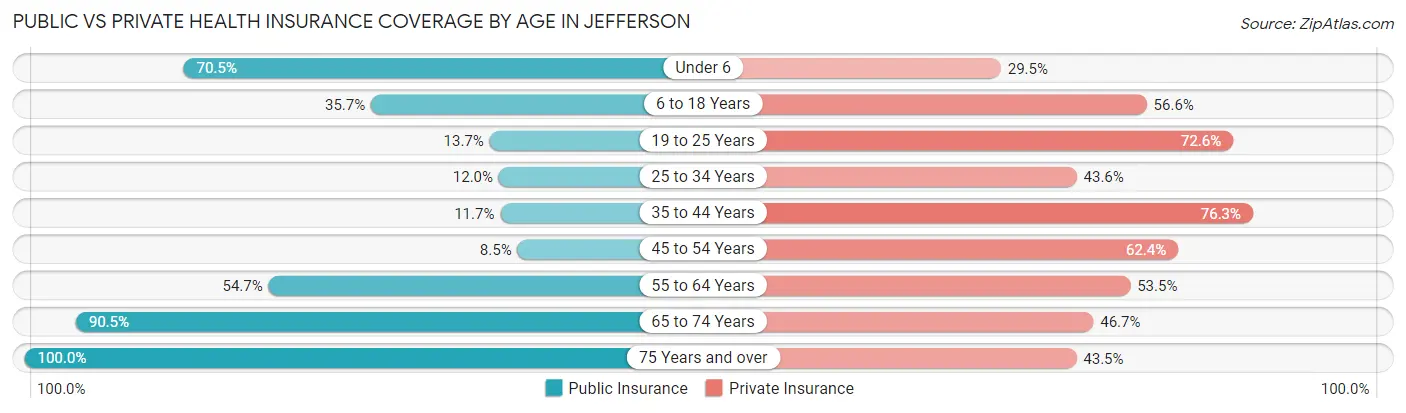
| Age Bracket | Public Insurance | Private Insurance |
| Under 6 | 86 (70.5%) | 36 (29.5%) |
| 6 to 18 Years | 111 (35.7%) | 176 (56.6%) |
| 19 to 25 Years | 23 (13.7%) | 122 (72.6%) |
| 25 to 34 Years | 14 (12.0%) | 51 (43.6%) |
| 35 to 44 Years | 43 (11.7%) | 280 (76.3%) |
| 45 to 54 Years | 12 (8.5%) | 88 (62.4%) |
| 55 to 64 Years | 139 (54.7%) | 136 (53.5%) |
| 65 to 74 Years | 314 (90.5%) | 162 (46.7%) |
| 75 Years and over | 147 (100.0%) | 64 (43.5%) |
| Total | 889 (45.0%) | 1,115 (56.5%) |
Disability Status by Sex by Age in Jefferson
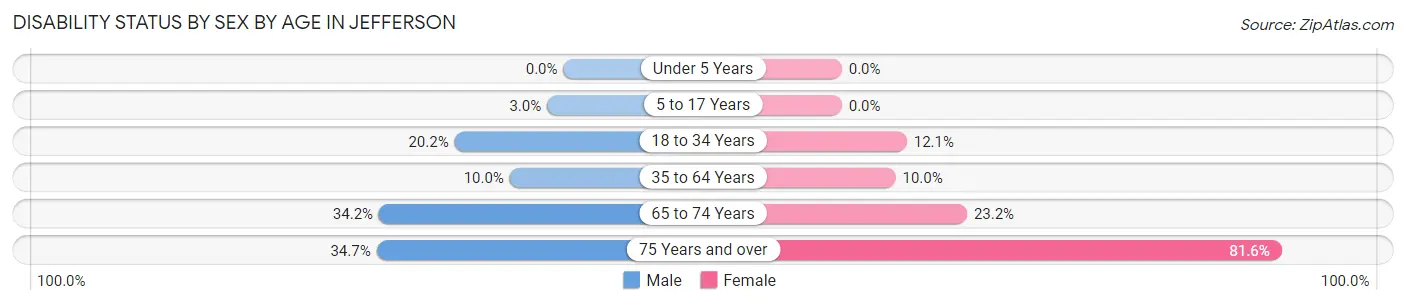
| Age Bracket | Male | Female |
| Under 5 Years | 0 (0.0%) | 0 (0.0%) |
| 5 to 17 Years | 6 (3.0%) | 0 (0.0%) |
| 18 to 34 Years | 19 (20.2%) | 24 (12.1%) |
| 35 to 64 Years | 28 (10.0%) | 48 (10.0%) |
| 65 to 74 Years | 51 (34.2%) | 46 (23.2%) |
| 75 Years and over | 17 (34.7%) | 80 (81.6%) |
Disability Class by Sex by Age in Jefferson
Disability Class: Hearing Difficulty
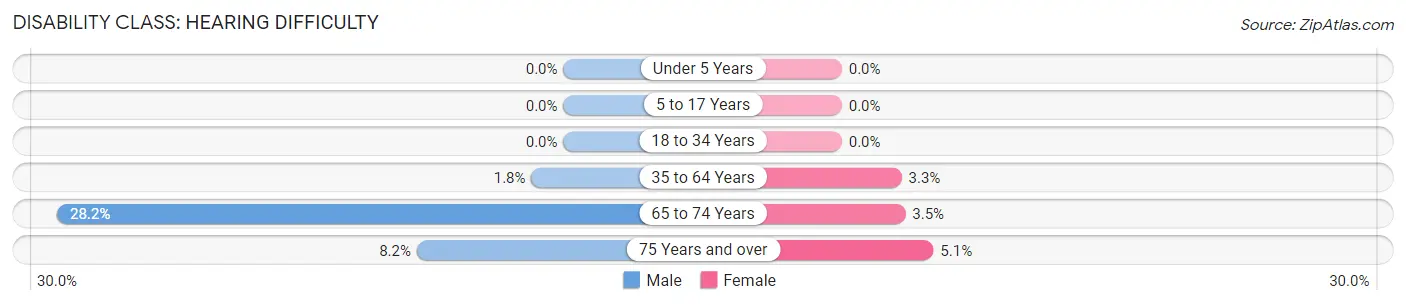
| Age Bracket | Male | Female |
| Under 5 Years | 0 (0.0%) | 0 (0.0%) |
| 5 to 17 Years | 0 (0.0%) | 0 (0.0%) |
| 18 to 34 Years | 0 (0.0%) | 0 (0.0%) |
| 35 to 64 Years | 5 (1.8%) | 16 (3.3%) |
| 65 to 74 Years | 42 (28.2%) | 7 (3.5%) |
| 75 Years and over | 4 (8.2%) | 5 (5.1%) |
Disability Class: Vision Difficulty
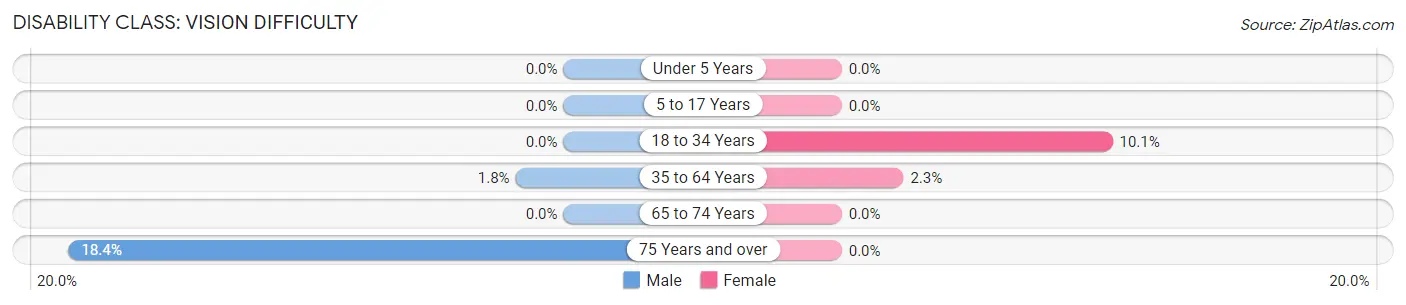
| Age Bracket | Male | Female |
| Under 5 Years | 0 (0.0%) | 0 (0.0%) |
| 5 to 17 Years | 0 (0.0%) | 0 (0.0%) |
| 18 to 34 Years | 0 (0.0%) | 20 (10.1%) |
| 35 to 64 Years | 5 (1.8%) | 11 (2.3%) |
| 65 to 74 Years | 0 (0.0%) | 0 (0.0%) |
| 75 Years and over | 9 (18.4%) | 0 (0.0%) |
Disability Class: Cognitive Difficulty
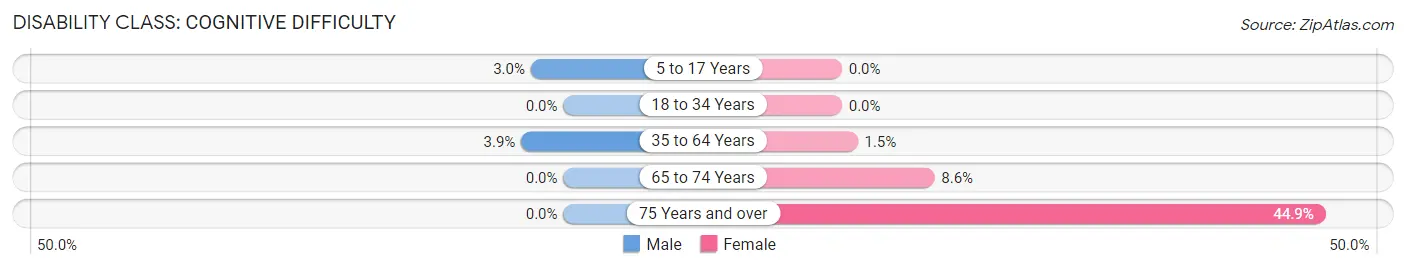
| Age Bracket | Male | Female |
| 5 to 17 Years | 6 (3.0%) | 0 (0.0%) |
| 18 to 34 Years | 0 (0.0%) | 0 (0.0%) |
| 35 to 64 Years | 11 (3.9%) | 7 (1.5%) |
| 65 to 74 Years | 0 (0.0%) | 17 (8.6%) |
| 75 Years and over | 0 (0.0%) | 44 (44.9%) |
Disability Class: Ambulatory Difficulty
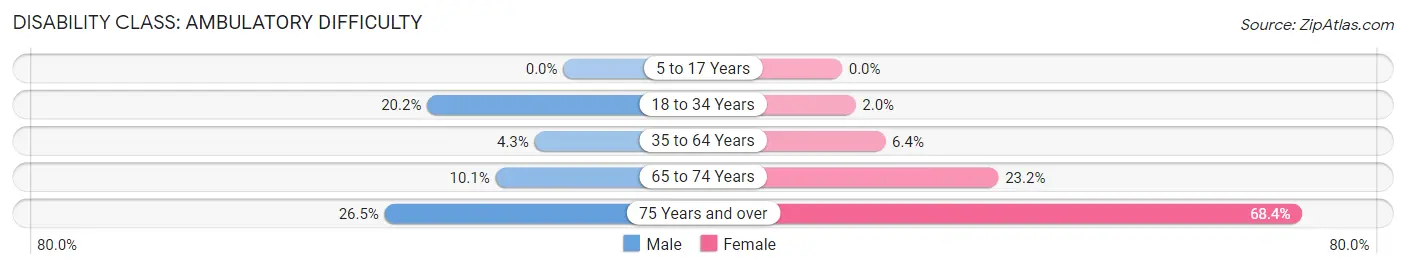
| Age Bracket | Male | Female |
| 5 to 17 Years | 0 (0.0%) | 0 (0.0%) |
| 18 to 34 Years | 19 (20.2%) | 4 (2.0%) |
| 35 to 64 Years | 12 (4.3%) | 31 (6.4%) |
| 65 to 74 Years | 15 (10.1%) | 46 (23.2%) |
| 75 Years and over | 13 (26.5%) | 67 (68.4%) |
Disability Class: Self-Care Difficulty
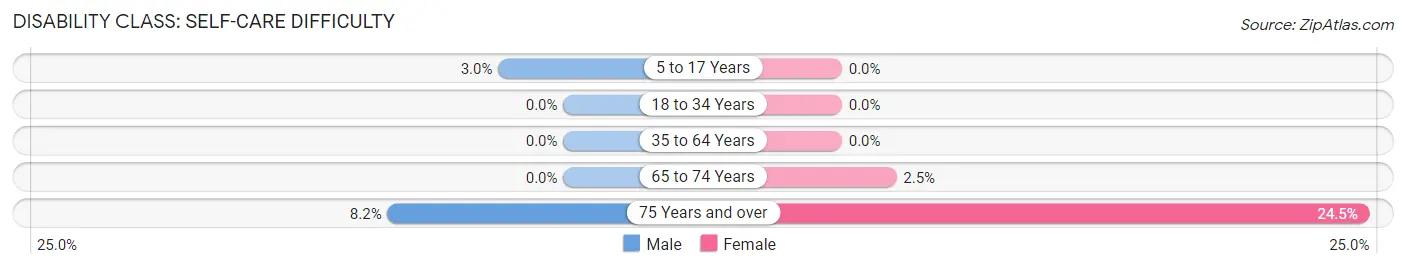
| Age Bracket | Male | Female |
| 5 to 17 Years | 6 (3.0%) | 0 (0.0%) |
| 18 to 34 Years | 0 (0.0%) | 0 (0.0%) |
| 35 to 64 Years | 0 (0.0%) | 0 (0.0%) |
| 65 to 74 Years | 0 (0.0%) | 5 (2.5%) |
| 75 Years and over | 4 (8.2%) | 24 (24.5%) |
Technology Access in Jefferson
Computing Device Access in Jefferson
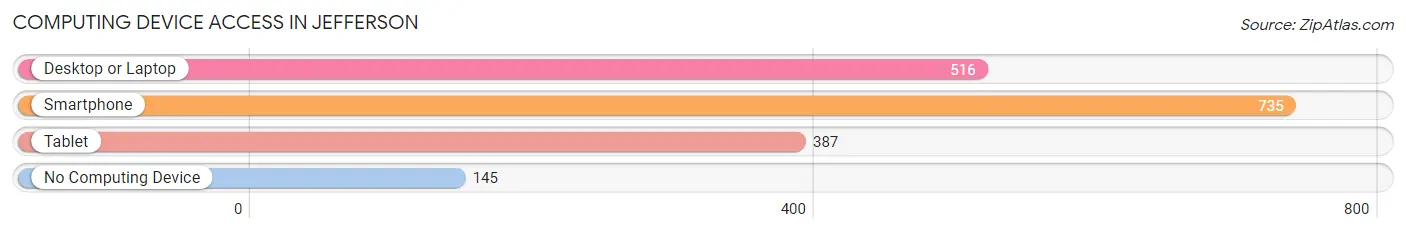
| Device Type | # Households | % Households |
| Desktop or Laptop | 516 | 55.1% |
| Smartphone | 735 | 78.5% |
| Tablet | 387 | 41.3% |
| No Computing Device | 145 | 15.5% |
| Total | 936 | 100.0% |
Internet Access in Jefferson
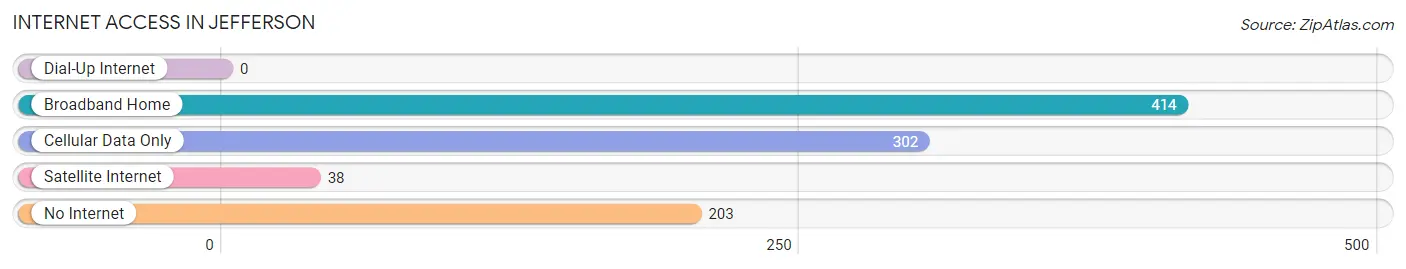
| Internet Type | # Households | % Households |
| Dial-Up Internet | 0 | 0.0% |
| Broadband Home | 414 | 44.2% |
| Cellular Data Only | 302 | 32.3% |
| Satellite Internet | 38 | 4.1% |
| No Internet | 203 | 21.7% |
| Total | 936 | 100.0% |
Jefferson Summary
Jefferson, Texas is a small town located in Marion County, Texas. It is situated on the banks of the Big Cypress Bayou, which is a tributary of the Red River. The town was founded in 1845 and is the county seat of Marion County. It is located about 100 miles east of Dallas and is part of the Longview-Marshall-Jefferson metropolitan area.
History
The area that is now Jefferson was first settled in 1845 by a group of settlers from the United States. The town was named after Thomas Jefferson, the third president of the United States. The town was officially incorporated in 1848 and was the first county seat of Marion County.
In the late 19th century, Jefferson became a major port on the Big Cypress Bayou. The town was a major center for the cotton industry and was home to several cotton mills. The town also had a large lumber industry and was home to several sawmills.
In the early 20th century, Jefferson was a major stop on the Texas and Pacific Railway. The town was also home to several large hotels and was a popular tourist destination.
Geography
Jefferson is located in the East Texas region of the state. The town is situated on the banks of the Big Cypress Bayou, which is a tributary of the Red River. The town is located about 100 miles east of Dallas and is part of the Longview-Marshall-Jefferson metropolitan area.
The town has a total area of 2.2 square miles, all of which is land. The town has a humid subtropical climate, with hot summers and mild winters.
Economy
The economy of Jefferson is largely based on agriculture and tourism. The town is home to several large farms and ranches, which produce a variety of crops, including cotton, corn, soybeans, and wheat. The town is also home to several large lumber mills and sawmills.
The town is also a popular tourist destination, with several historic sites, including the Jefferson Historical Museum and the Jefferson Carnegie Library. The town is also home to several festivals and events, including the annual Jefferson Rodeo and the Jefferson County Fair.
Demographics
As of the 2010 census, the population of Jefferson was 2,072. The town has a median household income of $31,250 and a median per capita income of $17,917. The town is predominantly white, with about 85% of the population being white. The town also has a small African American population, with about 8% of the population being African American. The town also has a small Hispanic population, with about 5% of the population being Hispanic.
Common Questions
What is Per Capita Income in Jefferson?
Per Capita income in Jefferson is $27,669.
What is the Median Family Income in Jefferson?
Median Family Income in Jefferson is $53,140.
What is the Median Household income in Jefferson?
Median Household Income in Jefferson is $47,524.
What is Income or Wage Gap in Jefferson?
Income or Wage Gap in Jefferson is 16.3%.
Women in Jefferson earn 83.7 cents for every dollar earned by a man.
What is Inequality or Gini Index in Jefferson?
Inequality or Gini Index in Jefferson is 0.51.
What is the Total Population of Jefferson?
Total Population of Jefferson is 2,077.
What is the Total Male Population of Jefferson?
Total Male Population of Jefferson is 855.
What is the Total Female Population of Jefferson?
Total Female Population of Jefferson is 1,222.
What is the Ratio of Males per 100 Females in Jefferson?
There are 69.97 Males per 100 Females in Jefferson.
What is the Ratio of Females per 100 Males in Jefferson?
There are 142.92 Females per 100 Males in Jefferson.
What is the Median Population Age in Jefferson?
Median Population Age in Jefferson is 42.9 Years.
What is the Average Family Size in Jefferson
Average Family Size in Jefferson is 2.9 People.
What is the Average Household Size in Jefferson
Average Household Size in Jefferson is 2.1 People.
How Large is the Labor Force in Jefferson?
There are 984 People in the Labor Forcein in Jefferson.
What is the Percentage of People in the Labor Force in Jefferson?
57.7% of People are in the Labor Force in Jefferson.
What is the Unemployment Rate in Jefferson?
Unemployment Rate in Jefferson is 10.8%.