Jarrell, TX Map & Demographics
Jarrell Map
Jarrell Overview
$36,682
PER CAPITA INCOME
$103,411
AVG FAMILY INCOME
$103,017
AVG HOUSEHOLD INCOME
27.7%
WAGE / INCOME GAP [ % ]
72.3¢/ $1
WAGE / INCOME GAP [ $ ]
0.34
INEQUALITY / GINI INDEX
2,132
TOTAL POPULATION
1,075
MALE POPULATION
1,057
FEMALE POPULATION
101.70
MALES / 100 FEMALES
98.33
FEMALES / 100 MALES
36.3
MEDIAN AGE
3.1
AVG FAMILY SIZE
2.9
AVG HOUSEHOLD SIZE
1,284
LABOR FORCE [ PEOPLE ]
76.6%
PERCENT IN LABOR FORCE
3.1%
UNEMPLOYMENT RATE
Jarrell Zip Codes
Jarrell Area Codes
Income in Jarrell
Income Overview in Jarrell
Per Capita Income in Jarrell is $36,682, while median incomes of families and households are $103,411 and $103,017 respectively.
| Characteristic | Number | Measure |
| Per Capita Income | 2,132 | $36,682 |
| Median Family Income | 617 | $103,411 |
| Mean Family Income | 617 | $106,330 |
| Median Household Income | 735 | $103,017 |
| Mean Household Income | 735 | $106,311 |
| Income Deficit | 617 | $0 |
| Wage / Income Gap (%) | 2,132 | 27.67% |
| Wage / Income Gap ($) | 2,132 | 72.33¢ per $1 |
| Gini / Inequality Index | 2,132 | 0.34 |
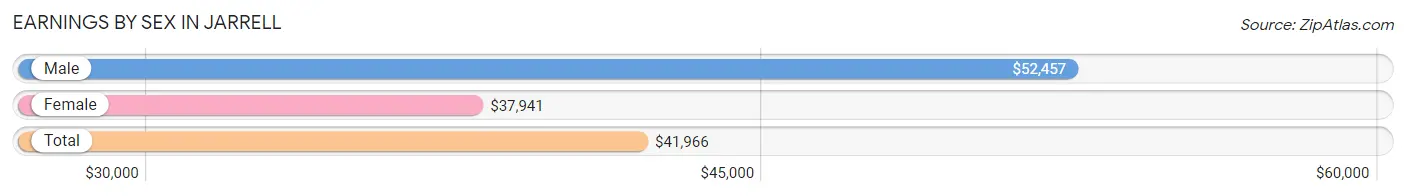
Earnings by Sex in Jarrell
Average Earnings in Jarrell are $41,966, $52,457 for men and $37,941 for women, a difference of 27.7%.
| Sex | Number | Average Earnings |
| Male | 765 (57.6%) | $52,457 |
| Female | 564 (42.4%) | $37,941 |
| Total | 1,329 (100.0%) | $41,966 |
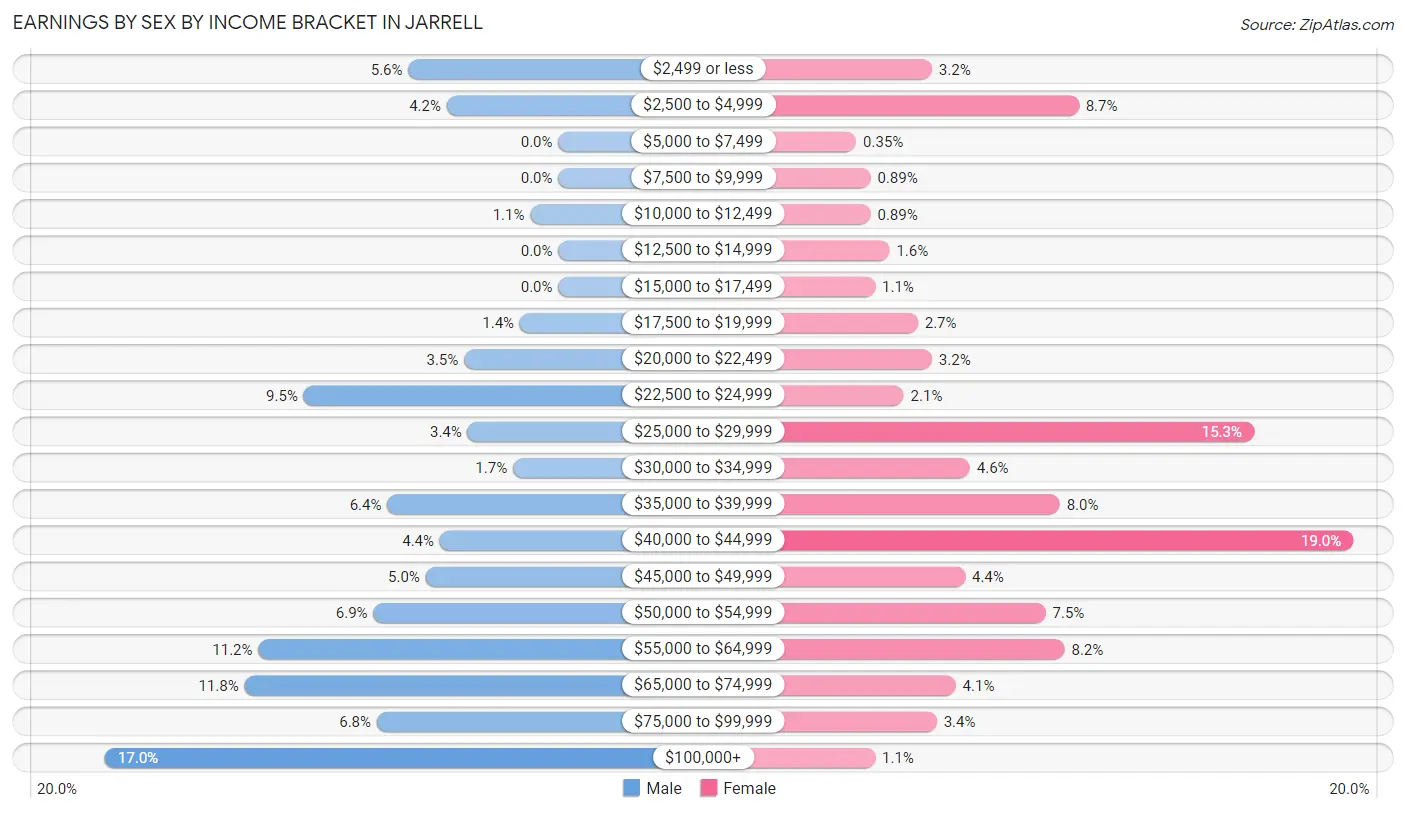
Earnings by Sex by Income Bracket in Jarrell
The most common earnings brackets in Jarrell are $100,000+ for men (130 | 17.0%) and $40,000 to $44,999 for women (107 | 19.0%).
| Income | Male | Female |
| $2,499 or less | 43 (5.6%) | 18 (3.2%) |
| $2,500 to $4,999 | 32 (4.2%) | 49 (8.7%) |
| $5,000 to $7,499 | 0 (0.0%) | 2 (0.4%) |
| $7,500 to $9,999 | 0 (0.0%) | 5 (0.9%) |
| $10,000 to $12,499 | 8 (1.1%) | 5 (0.9%) |
| $12,500 to $14,999 | 0 (0.0%) | 9 (1.6%) |
| $15,000 to $17,499 | 0 (0.0%) | 6 (1.1%) |
| $17,500 to $19,999 | 11 (1.4%) | 15 (2.7%) |
| $20,000 to $22,499 | 27 (3.5%) | 18 (3.2%) |
| $22,500 to $24,999 | 73 (9.5%) | 12 (2.1%) |
| $25,000 to $29,999 | 26 (3.4%) | 86 (15.2%) |
| $30,000 to $34,999 | 13 (1.7%) | 26 (4.6%) |
| $35,000 to $39,999 | 49 (6.4%) | 45 (8.0%) |
| $40,000 to $44,999 | 34 (4.4%) | 107 (19.0%) |
| $45,000 to $49,999 | 38 (5.0%) | 25 (4.4%) |
| $50,000 to $54,999 | 53 (6.9%) | 42 (7.4%) |
| $55,000 to $64,999 | 86 (11.2%) | 46 (8.2%) |
| $65,000 to $74,999 | 90 (11.8%) | 23 (4.1%) |
| $75,000 to $99,999 | 52 (6.8%) | 19 (3.4%) |
| $100,000+ | 130 (17.0%) | 6 (1.1%) |
| Total | 765 (100.0%) | 564 (100.0%) |
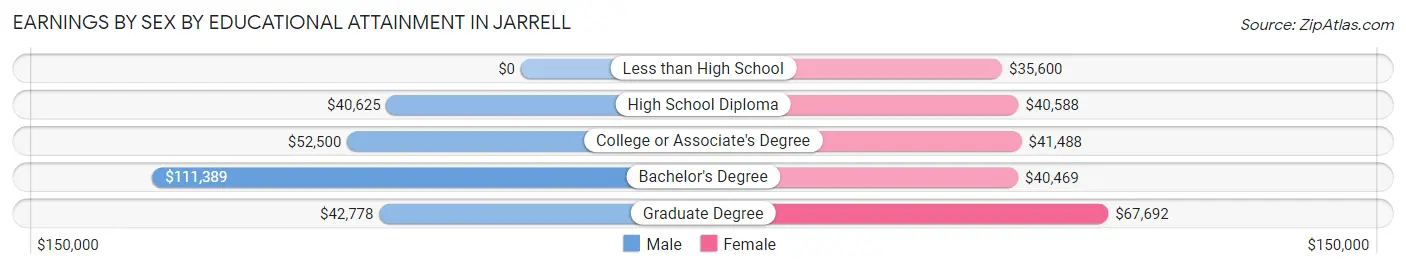
Earnings by Sex by Educational Attainment in Jarrell
Average earnings in Jarrell are $55,000 for men and $40,633 for women, a difference of 26.1%. Men with an educational attainment of bachelor's degree enjoy the highest average annual earnings of $111,389, while those with high school diploma education earn the least with $40,625. Women with an educational attainment of graduate degree earn the most with the average annual earnings of $67,692, while those with less than high school education have the smallest earnings of $35,600.
| Educational Attainment | Male Income | Female Income |
| Less than High School | - | - |
| High School Diploma | $40,625 | $40,588 |
| College or Associate's Degree | $52,500 | $41,488 |
| Bachelor's Degree | $111,389 | $40,469 |
| Graduate Degree | $42,778 | $67,692 |
| Total | $55,000 | $40,633 |
Family Income in Jarrell
Family Income Brackets in Jarrell
According to the Jarrell family income data, there are 241 families falling into the $100,000 to $149,999 income range, which is the most common income bracket and makes up 39.1% of all families.
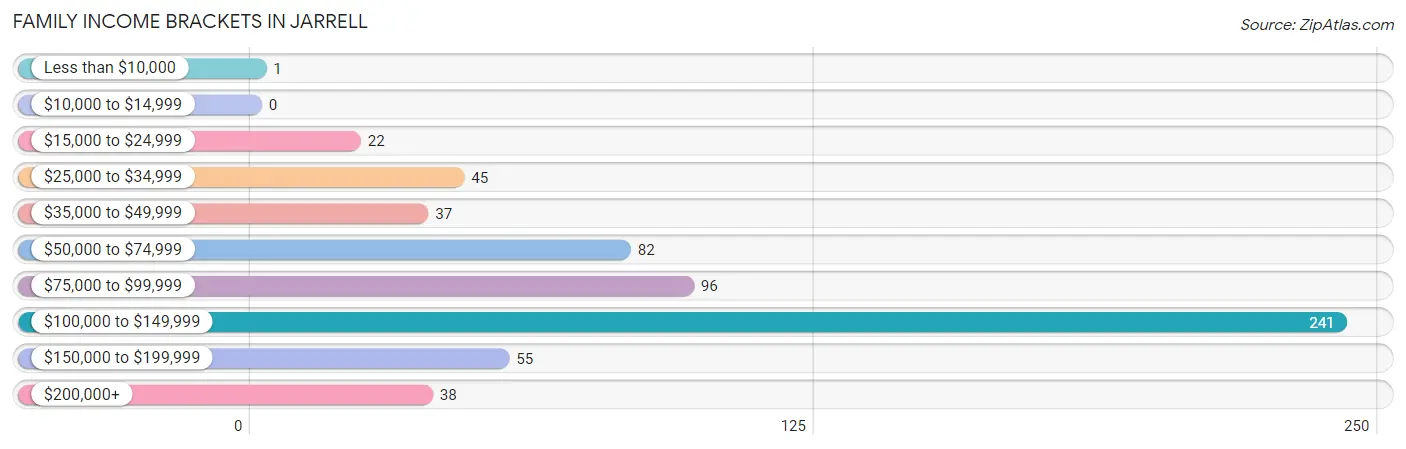
| Income Bracket | # Families | % Families |
| Less than $10,000 | 1 | 0.2% |
| $10,000 to $14,999 | 0 | 0.0% |
| $15,000 to $24,999 | 22 | 3.6% |
| $25,000 to $34,999 | 45 | 7.3% |
| $35,000 to $49,999 | 37 | 6.0% |
| $50,000 to $74,999 | 82 | 13.3% |
| $75,000 to $99,999 | 96 | 15.6% |
| $100,000 to $149,999 | 241 | 39.1% |
| $150,000 to $199,999 | 55 | 8.9% |
| $200,000+ | 38 | 6.2% |
Family Income by Famaliy Size in Jarrell
7+ person families (6 | 1.0%) account for the highest median family income in Jarrell with $140,000 per family, while 2-person families (279 | 45.2%) have the highest median income of $49,125 per family member.
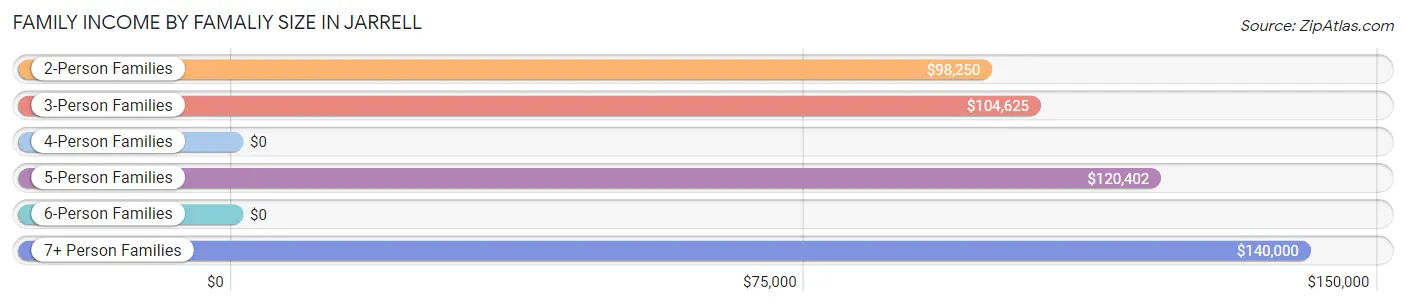
| Income Bracket | # Families | Median Income |
| 2-Person Families | 279 (45.2%) | $98,250 |
| 3-Person Families | 102 (16.5%) | $104,625 |
| 4-Person Families | 132 (21.4%) | $0 |
| 5-Person Families | 83 (13.5%) | $120,402 |
| 6-Person Families | 15 (2.4%) | $0 |
| 7+ Person Families | 6 (1.0%) | $140,000 |
| Total | 617 (100.0%) | $103,411 |
Family Income by Number of Earners in Jarrell
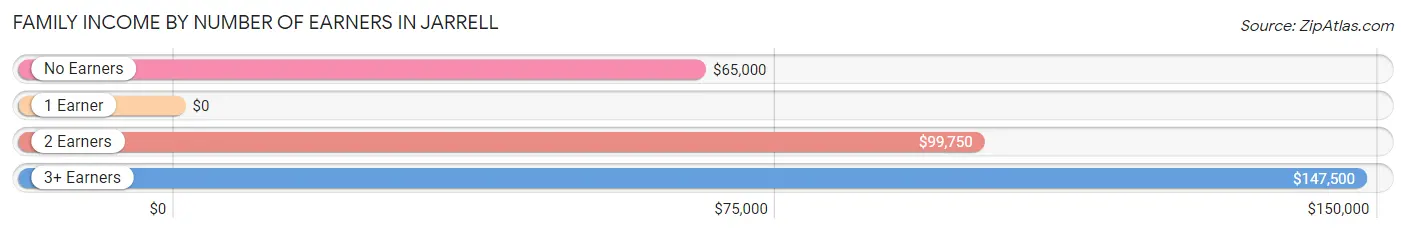
| Number of Earners | # Families | Median Income |
| No Earners | 22 (3.6%) | $65,000 |
| 1 Earner | 150 (24.3%) | $0 |
| 2 Earners | 319 (51.7%) | $99,750 |
| 3+ Earners | 126 (20.4%) | $147,500 |
| Total | 617 (100.0%) | $103,411 |
Household Income in Jarrell
Household Income Brackets in Jarrell
With 229 households falling in the category, the $100,000 to $149,999 income range is the most frequent in Jarrell, accounting for 31.2% of all households.
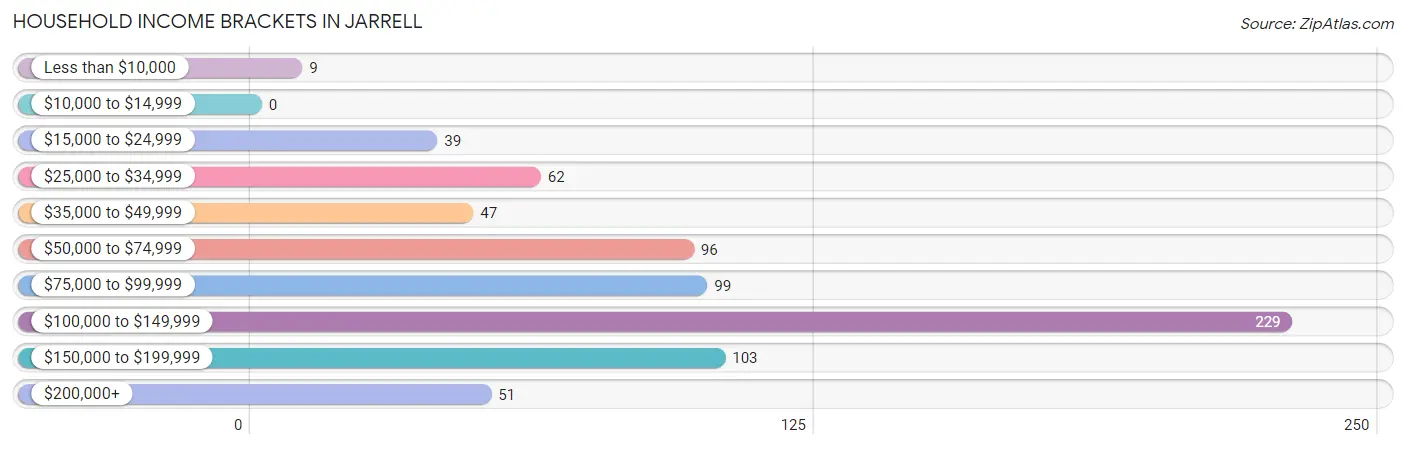
| Income Bracket | # Households | % Households |
| Less than $10,000 | 9 | 1.2% |
| $10,000 to $14,999 | 0 | 0.0% |
| $15,000 to $24,999 | 39 | 5.3% |
| $25,000 to $34,999 | 62 | 8.4% |
| $35,000 to $49,999 | 47 | 6.4% |
| $50,000 to $74,999 | 96 | 13.1% |
| $75,000 to $99,999 | 99 | 13.5% |
| $100,000 to $149,999 | 229 | 31.2% |
| $150,000 to $199,999 | 103 | 14.0% |
| $200,000+ | 51 | 6.9% |
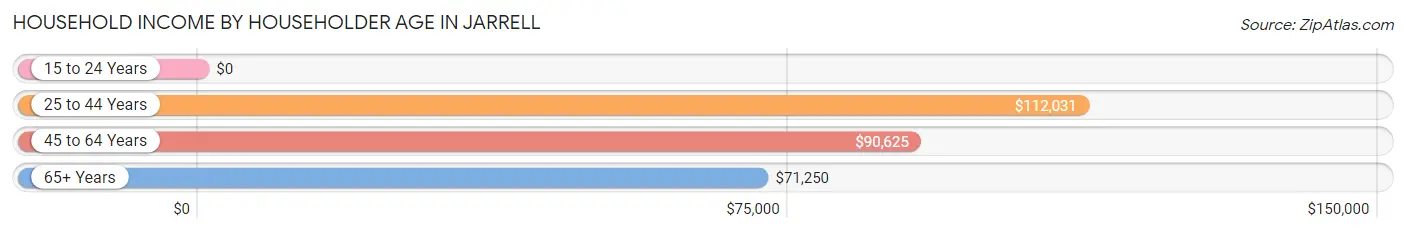
Household Income by Householder Age in Jarrell
The median household income in Jarrell is $103,017, with the highest median household income of $112,031 found in the 25 to 44 years age bracket for the primary householder. A total of 319 households (43.4%) fall into this category. Meanwhile, the 15 to 24 years age bracket for the primary householder has the lowest median household income of $0, with 19 households (2.6%) in this group.
| Income Bracket | # Households | Median Income |
| 15 to 24 Years | 19 (2.6%) | $0 |
| 25 to 44 Years | 319 (43.4%) | $112,031 |
| 45 to 64 Years | 255 (34.7%) | $90,625 |
| 65+ Years | 142 (19.3%) | $71,250 |
| Total | 735 (100.0%) | $103,017 |
Poverty in Jarrell
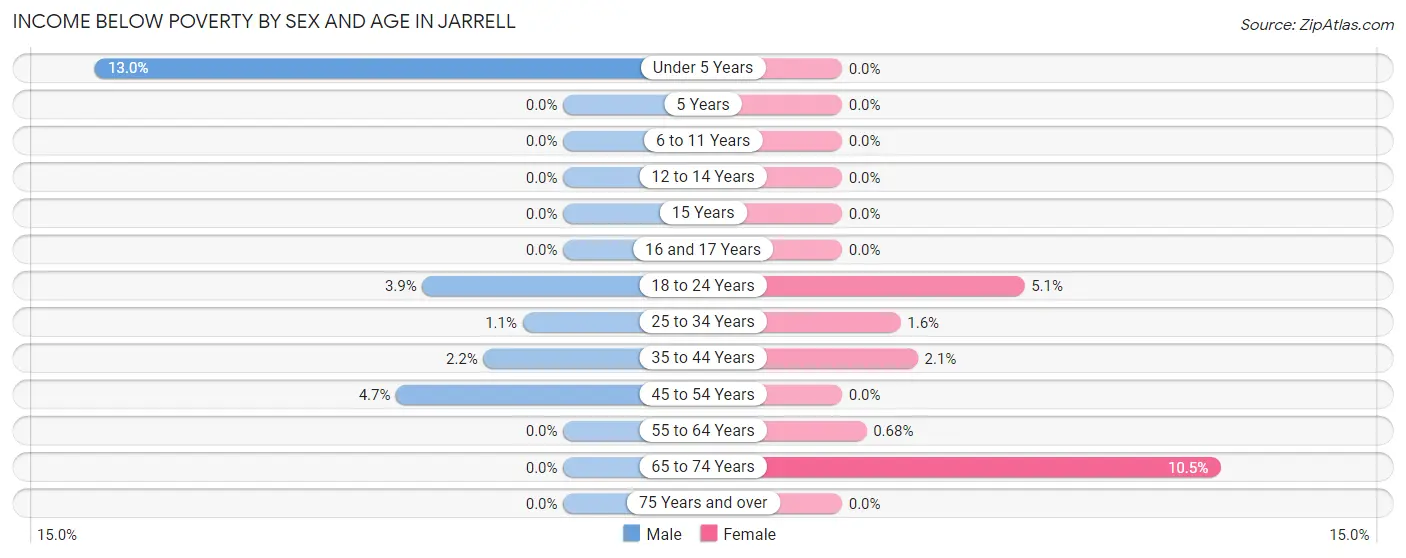
Income Below Poverty by Sex and Age in Jarrell
With 1.7% poverty level for males and 1.7% for females among the residents of Jarrell, under 5 year old males and 65 to 74 year old females are the most vulnerable to poverty, with 3 males (13.0%) and 8 females (10.5%) in their respective age groups living below the poverty level.
| Age Bracket | Male | Female |
| Under 5 Years | 3 (13.0%) | 0 (0.0%) |
| 5 Years | 0 (0.0%) | 0 (0.0%) |
| 6 to 11 Years | 0 (0.0%) | 0 (0.0%) |
| 12 to 14 Years | 0 (0.0%) | 0 (0.0%) |
| 15 Years | 0 (0.0%) | 0 (0.0%) |
| 16 and 17 Years | 0 (0.0%) | 0 (0.0%) |
| 18 to 24 Years | 4 (3.9%) | 3 (5.1%) |
| 25 to 34 Years | 2 (1.1%) | 2 (1.6%) |
| 35 to 44 Years | 5 (2.2%) | 4 (2.1%) |
| 45 to 54 Years | 4 (4.6%) | 0 (0.0%) |
| 55 to 64 Years | 0 (0.0%) | 1 (0.7%) |
| 65 to 74 Years | 0 (0.0%) | 8 (10.5%) |
| 75 Years and over | 0 (0.0%) | 0 (0.0%) |
| Total | 18 (1.7%) | 18 (1.7%) |
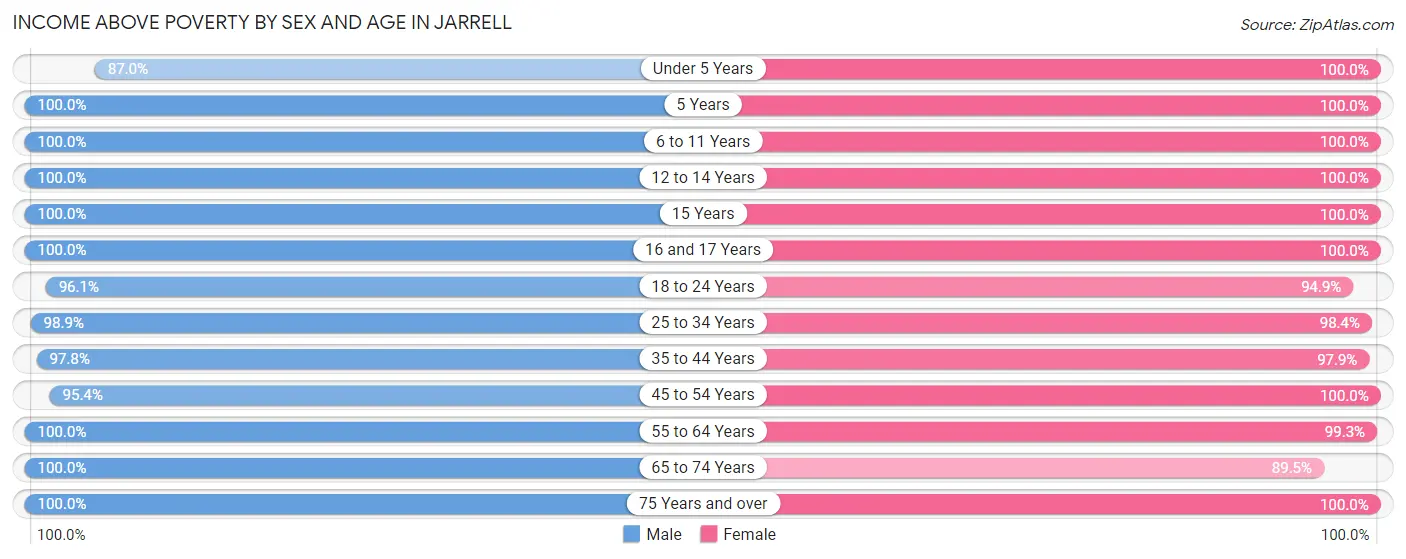
Income Above Poverty by Sex and Age in Jarrell
According to the poverty statistics in Jarrell, males aged 5 years and females aged under 5 years are the age groups that are most secure financially, with 100.0% of males and 100.0% of females in these age groups living above the poverty line.
| Age Bracket | Male | Female |
| Under 5 Years | 20 (87.0%) | 39 (100.0%) |
| 5 Years | 24 (100.0%) | 41 (100.0%) |
| 6 to 11 Years | 58 (100.0%) | 92 (100.0%) |
| 12 to 14 Years | 42 (100.0%) | 43 (100.0%) |
| 15 Years | 11 (100.0%) | 80 (100.0%) |
| 16 and 17 Years | 34 (100.0%) | 60 (100.0%) |
| 18 to 24 Years | 98 (96.1%) | 56 (94.9%) |
| 25 to 34 Years | 175 (98.9%) | 121 (98.4%) |
| 35 to 44 Years | 220 (97.8%) | 186 (97.9%) |
| 45 to 54 Years | 82 (95.4%) | 70 (100.0%) |
| 55 to 64 Years | 186 (100.0%) | 147 (99.3%) |
| 65 to 74 Years | 59 (100.0%) | 68 (89.5%) |
| 75 Years and over | 45 (100.0%) | 36 (100.0%) |
| Total | 1,054 (98.3%) | 1,039 (98.3%) |
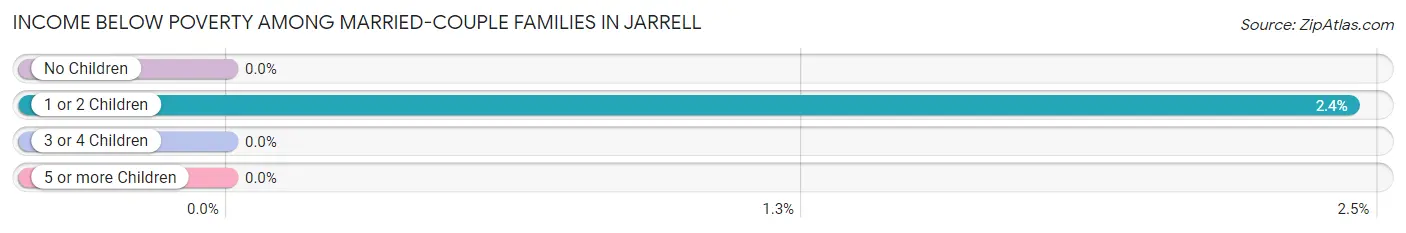
Income Below Poverty Among Married-Couple Families in Jarrell
The poverty statistics for married-couple families in Jarrell show that 0.8% or 4 of the total 487 families live below the poverty line. Families with 1 or 2 children have the highest poverty rate of 2.4%, comprising of 4 families. On the other hand, families with no children have the lowest poverty rate of 0.0%, which includes 0 families.
| Children | Above Poverty | Below Poverty |
| No Children | 262 (100.0%) | 0 (0.0%) |
| 1 or 2 Children | 160 (97.6%) | 4 (2.4%) |
| 3 or 4 Children | 61 (100.0%) | 0 (0.0%) |
| 5 or more Children | 0 (0.0%) | 0 (0.0%) |
| Total | 483 (99.2%) | 4 (0.8%) |
Income Below Poverty Among Single-Parent Households in Jarrell
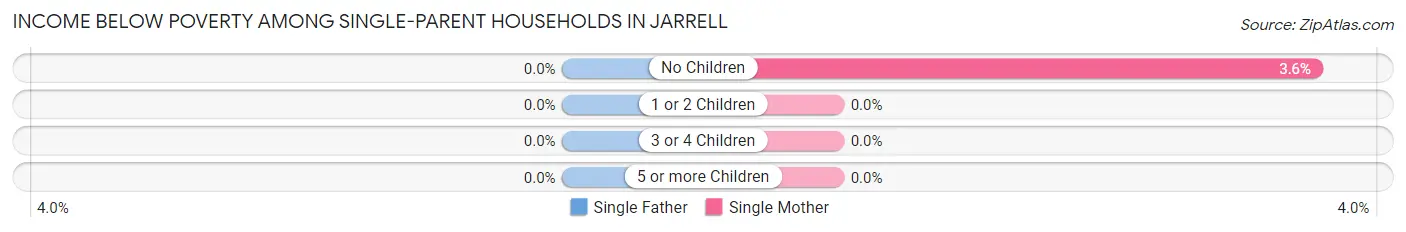
| Children | Single Father | Single Mother |
| No Children | 0 (0.0%) | 1 (3.6%) |
| 1 or 2 Children | 0 (0.0%) | 0 (0.0%) |
| 3 or 4 Children | 0 (0.0%) | 0 (0.0%) |
| 5 or more Children | 0 (0.0%) | 0 (0.0%) |
| Total | 0 (0.0%) | 1 (3.2%) |
Income Below Poverty Among Married-Couple vs Single-Parent Households in Jarrell
The poverty data for Jarrell shows that 4 of the married-couple family households (0.8%) and 1 of the single-parent households (0.8%) are living below the poverty level. Within the married-couple family households, those with 1 or 2 children have the highest poverty rate, with 4 households (2.4%) falling below the poverty line. Among the single-parent households, those with no children have the highest poverty rate, with 1 household (2.2%) living below poverty.
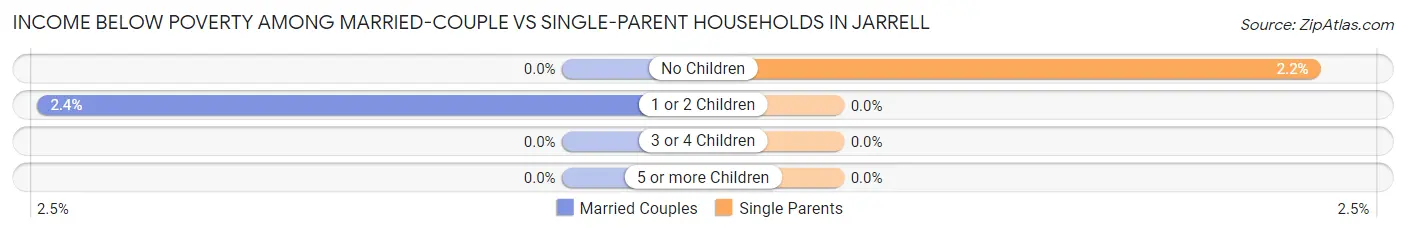
| Children | Married-Couple Families | Single-Parent Households |
| No Children | 0 (0.0%) | 1 (2.2%) |
| 1 or 2 Children | 4 (2.4%) | 0 (0.0%) |
| 3 or 4 Children | 0 (0.0%) | 0 (0.0%) |
| 5 or more Children | 0 (0.0%) | 0 (0.0%) |
| Total | 4 (0.8%) | 1 (0.8%) |
Race in Jarrell
The most populous races in Jarrell are White / Caucasian (1,297 | 60.8%), Hispanic or Latino (775 | 36.3%), and Some other Race (298 | 14.0%).
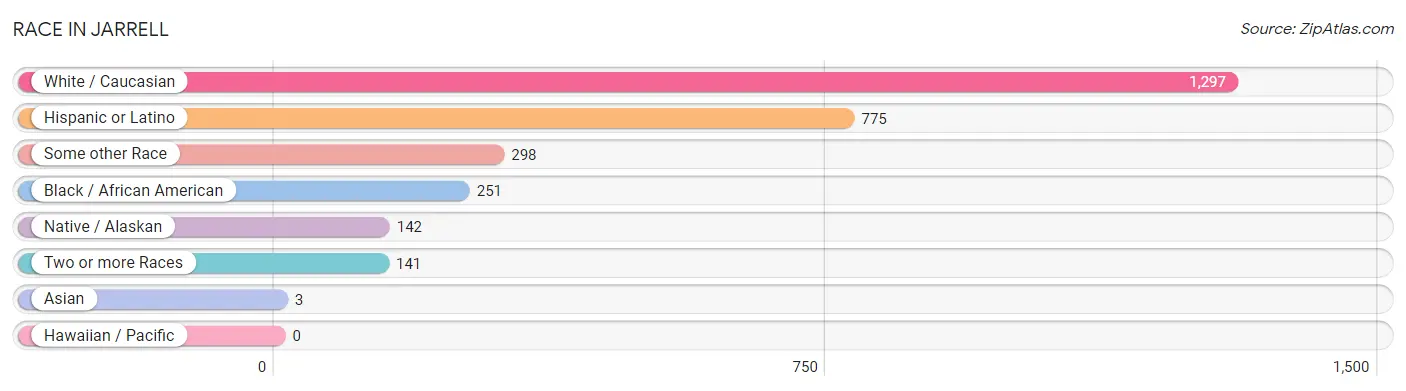
| Race | # Population | % Population |
| Asian | 3 | 0.1% |
| Black / African American | 251 | 11.8% |
| Hawaiian / Pacific | 0 | 0.0% |
| Hispanic or Latino | 775 | 36.3% |
| Native / Alaskan | 142 | 6.7% |
| White / Caucasian | 1,297 | 60.8% |
| Two or more Races | 141 | 6.6% |
| Some other Race | 298 | 14.0% |
| Total | 2,132 | 100.0% |
Ancestry in Jarrell
The most populous ancestries reported in Jarrell are Mexican (694 | 32.6%), German (297 | 13.9%), Mexican American Indian (148 | 6.9%), English (117 | 5.5%), and Irish (85 | 4.0%), together accounting for 62.9% of all Jarrell residents.
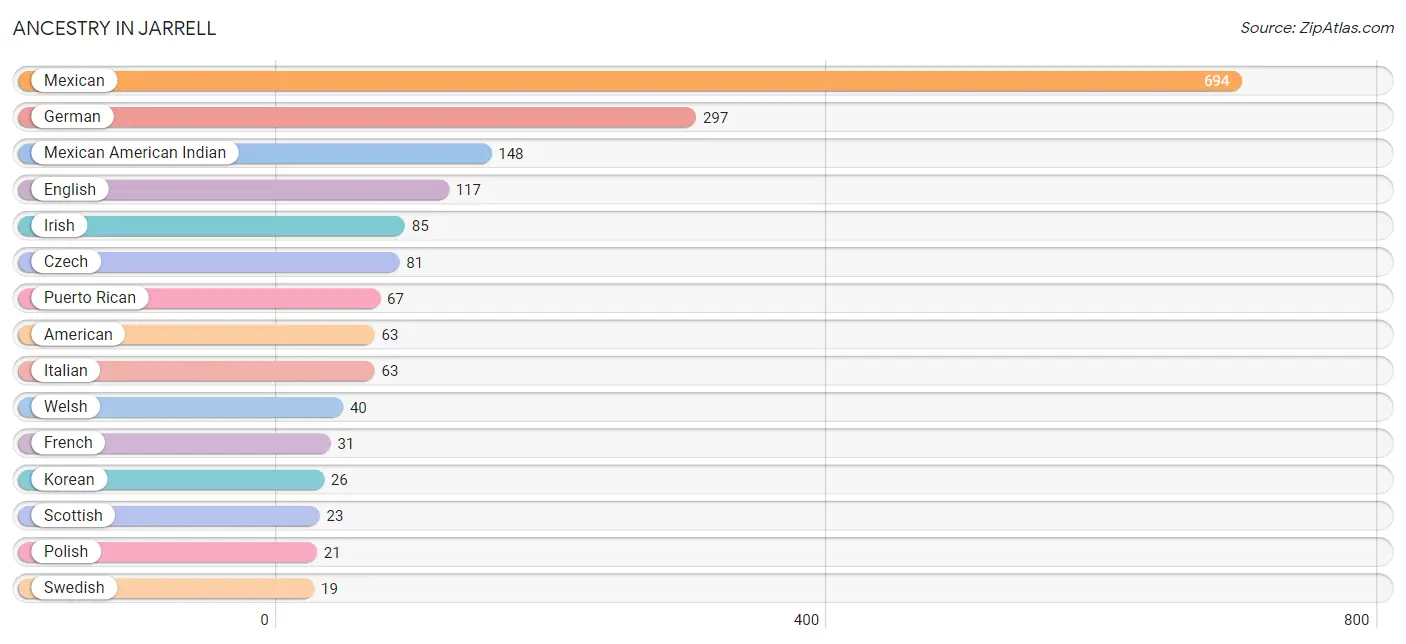
| Ancestry | # Population | % Population |
| American | 63 | 2.9% |
| Blackfeet | 2 | 0.1% |
| British | 10 | 0.5% |
| Central American | 7 | 0.3% |
| Central American Indian | 2 | 0.1% |
| Cherokee | 3 | 0.1% |
| Czech | 81 | 3.8% |
| Czechoslovakian | 2 | 0.1% |
| Dutch | 5 | 0.2% |
| English | 117 | 5.5% |
| European | 13 | 0.6% |
| Finnish | 3 | 0.1% |
| French | 31 | 1.5% |
| French Canadian | 5 | 0.2% |
| German | 297 | 13.9% |
| German Russian | 4 | 0.2% |
| Guatemalan | 2 | 0.1% |
| Honduran | 5 | 0.2% |
| Hungarian | 14 | 0.7% |
| Irish | 85 | 4.0% |
| Italian | 63 | 2.9% |
| Korean | 26 | 1.2% |
| Lithuanian | 2 | 0.1% |
| Mexican | 694 | 32.6% |
| Mexican American Indian | 148 | 6.9% |
| Norwegian | 13 | 0.6% |
| Polish | 21 | 1.0% |
| Puerto Rican | 67 | 3.1% |
| Scandinavian | 5 | 0.2% |
| Scotch-Irish | 15 | 0.7% |
| Scottish | 23 | 1.1% |
| Spaniard | 4 | 0.2% |
| Swedish | 19 | 0.9% |
| Turkish | 3 | 0.1% |
| Welsh | 40 | 1.9% | View All 35 Rows |
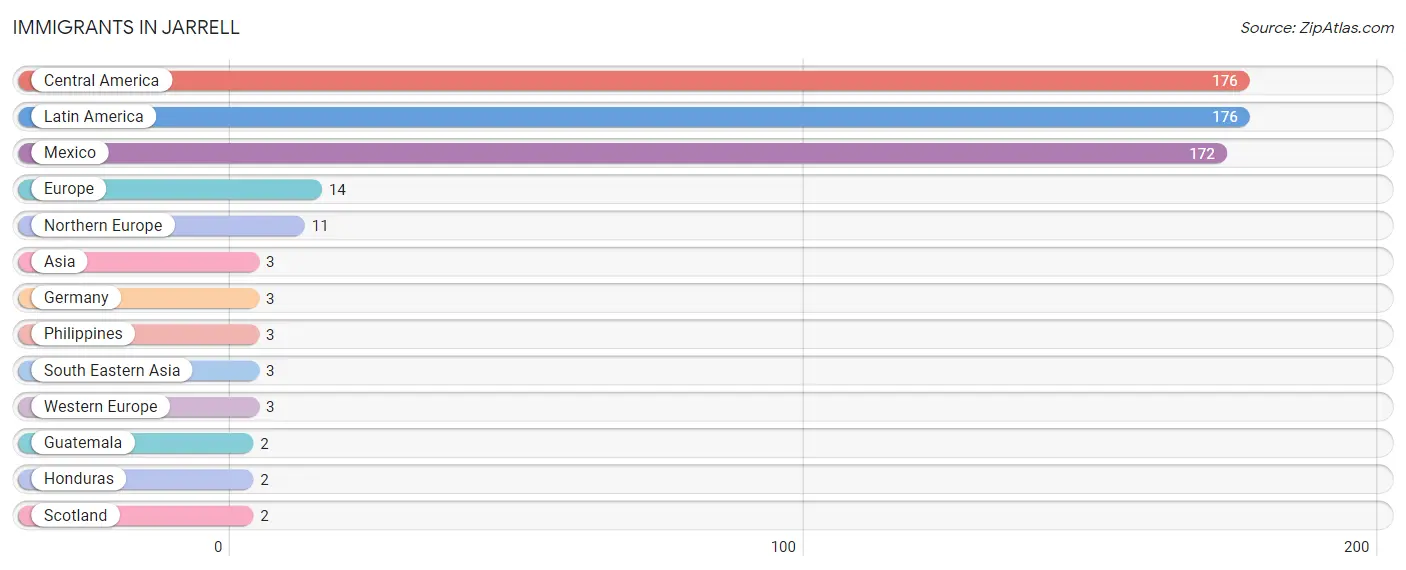
Immigrants in Jarrell
The most numerous immigrant groups reported in Jarrell came from Central America (176 | 8.3%), Latin America (176 | 8.3%), Mexico (172 | 8.1%), Europe (14 | 0.7%), and Northern Europe (11 | 0.5%), together accounting for 25.8% of all Jarrell residents.
| Immigration Origin | # Population | % Population |
| Asia | 3 | 0.1% |
| Central America | 176 | 8.3% |
| Europe | 14 | 0.7% |
| Germany | 3 | 0.1% |
| Guatemala | 2 | 0.1% |
| Honduras | 2 | 0.1% |
| Latin America | 176 | 8.3% |
| Mexico | 172 | 8.1% |
| Northern Europe | 11 | 0.5% |
| Philippines | 3 | 0.1% |
| Scotland | 2 | 0.1% |
| South Eastern Asia | 3 | 0.1% |
| Western Europe | 3 | 0.1% | View All 13 Rows |
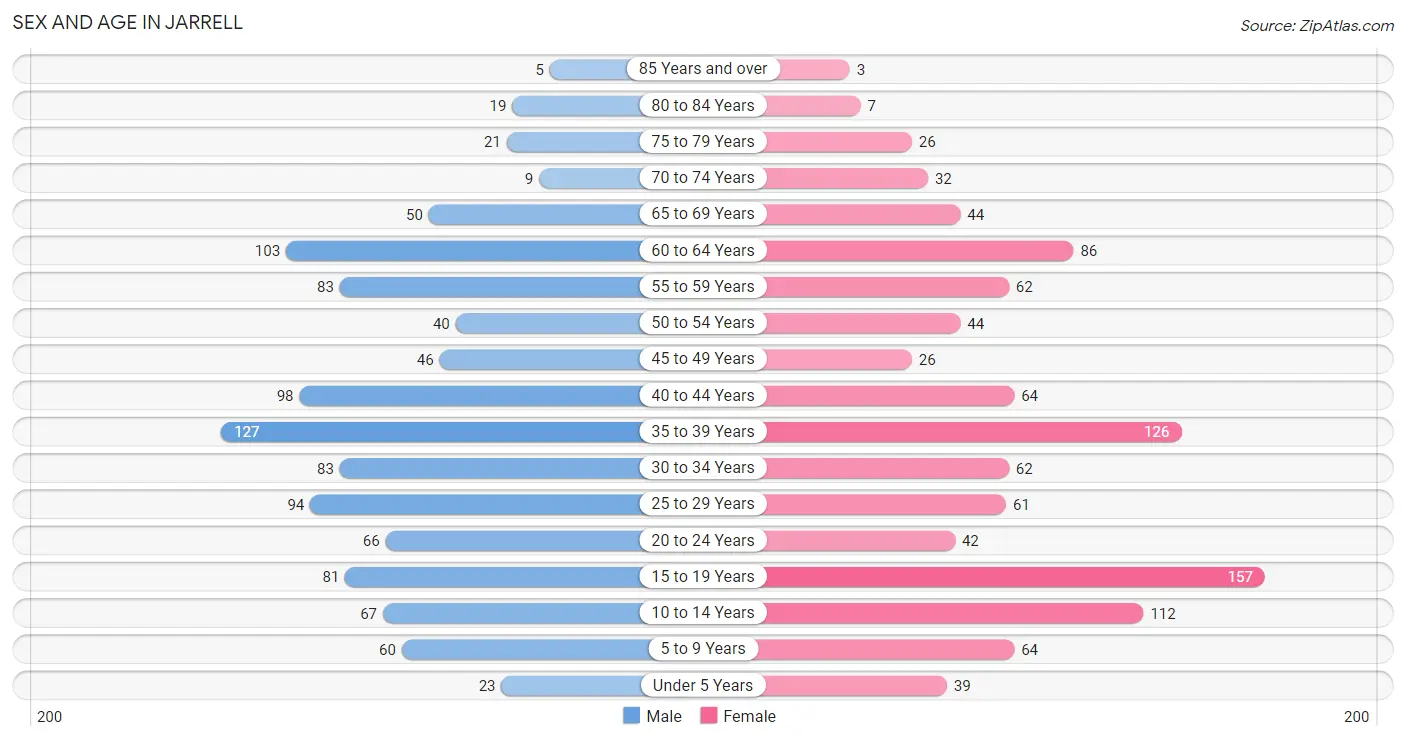
Sex and Age in Jarrell
Sex and Age in Jarrell
The most populous age groups in Jarrell are 35 to 39 Years (127 | 11.8%) for men and 15 to 19 Years (157 | 14.8%) for women.
| Age Bracket | Male | Female |
| Under 5 Years | 23 (2.1%) | 39 (3.7%) |
| 5 to 9 Years | 60 (5.6%) | 64 (6.0%) |
| 10 to 14 Years | 67 (6.2%) | 112 (10.6%) |
| 15 to 19 Years | 81 (7.5%) | 157 (14.8%) |
| 20 to 24 Years | 66 (6.1%) | 42 (4.0%) |
| 25 to 29 Years | 94 (8.7%) | 61 (5.8%) |
| 30 to 34 Years | 83 (7.7%) | 62 (5.9%) |
| 35 to 39 Years | 127 (11.8%) | 126 (11.9%) |
| 40 to 44 Years | 98 (9.1%) | 64 (6.0%) |
| 45 to 49 Years | 46 (4.3%) | 26 (2.5%) |
| 50 to 54 Years | 40 (3.7%) | 44 (4.2%) |
| 55 to 59 Years | 83 (7.7%) | 62 (5.9%) |
| 60 to 64 Years | 103 (9.6%) | 86 (8.1%) |
| 65 to 69 Years | 50 (4.6%) | 44 (4.2%) |
| 70 to 74 Years | 9 (0.8%) | 32 (3.0%) |
| 75 to 79 Years | 21 (1.9%) | 26 (2.5%) |
| 80 to 84 Years | 19 (1.8%) | 7 (0.7%) |
| 85 Years and over | 5 (0.5%) | 3 (0.3%) |
| Total | 1,075 (100.0%) | 1,057 (100.0%) |
Families and Households in Jarrell
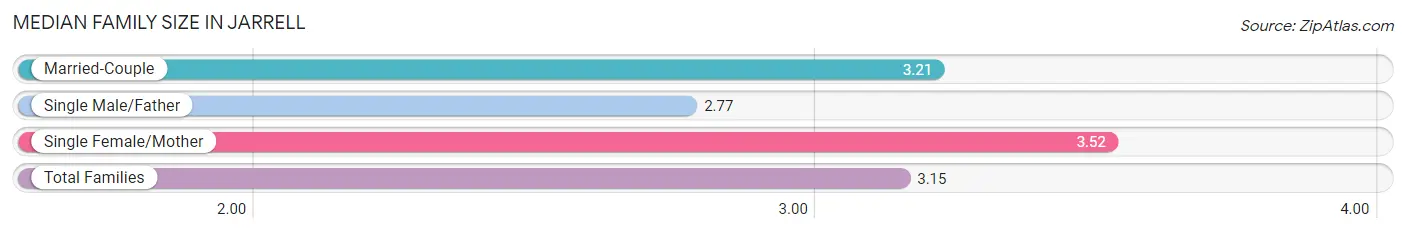
Median Family Size in Jarrell
The median family size in Jarrell is 3.15 persons per family, with single female/mother families (31 | 5.0%) accounting for the largest median family size of 3.52 persons per family. On the other hand, single male/father families (99 | 16.1%) represent the smallest median family size with 2.77 persons per family.
| Family Type | # Families | Family Size |
| Married-Couple | 487 (78.9%) | 3.21 |
| Single Male/Father | 99 (16.1%) | 2.77 |
| Single Female/Mother | 31 (5.0%) | 3.52 |
| Total Families | 617 (100.0%) | 3.15 |
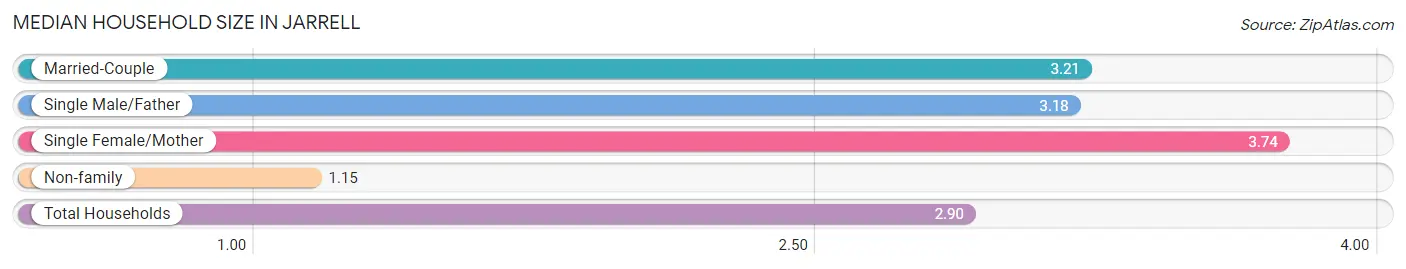
Median Household Size in Jarrell
The median household size in Jarrell is 2.90 persons per household, with single female/mother households (31 | 4.2%) accounting for the largest median household size of 3.74 persons per household. non-family households (118 | 16.1%) represent the smallest median household size with 1.15 persons per household.
| Household Type | # Households | Household Size |
| Married-Couple | 487 (66.3%) | 3.21 |
| Single Male/Father | 99 (13.5%) | 3.18 |
| Single Female/Mother | 31 (4.2%) | 3.74 |
| Non-family | 118 (16.1%) | 1.15 |
| Total Households | 735 (100.0%) | 2.90 |
Household Size by Marriage Status in Jarrell
Out of a total of 735 households in Jarrell, 617 (84.0%) are family households, while 118 (16.1%) are nonfamily households. The most numerous type of family households are 2-person households, comprising 233, and the most common type of nonfamily households are 1-person households, comprising 104.
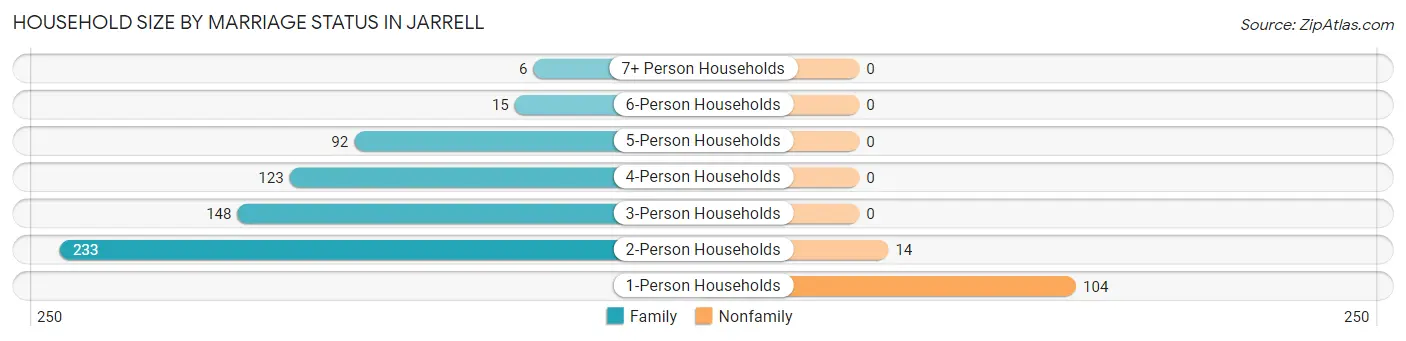
| Household Size | Family Households | Nonfamily Households |
| 1-Person Households | - | 104 (14.1%) |
| 2-Person Households | 233 (31.7%) | 14 (1.9%) |
| 3-Person Households | 148 (20.1%) | 0 (0.0%) |
| 4-Person Households | 123 (16.7%) | 0 (0.0%) |
| 5-Person Households | 92 (12.5%) | 0 (0.0%) |
| 6-Person Households | 15 (2.0%) | 0 (0.0%) |
| 7+ Person Households | 6 (0.8%) | 0 (0.0%) |
| Total | 617 (84.0%) | 118 (16.1%) |
Female Fertility in Jarrell
Fertility by Age in Jarrell
Average fertility rate in Jarrell is 28.0 births per 1,000 women. Women in the age bracket of 20 to 34 years have the highest fertility rate with 91.0 births per 1,000 women. Women in the age bracket of 20 to 34 years acount for 100.0% of all women with births.
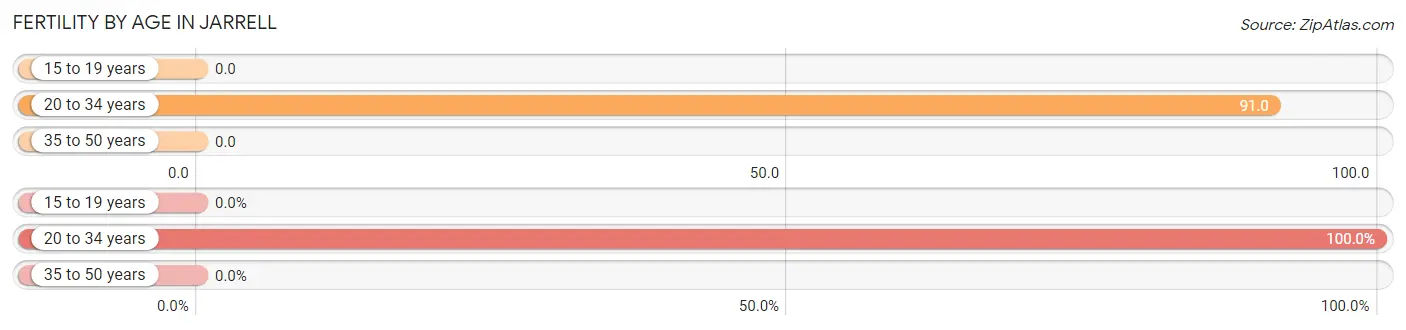
| Age Bracket | Women with Births | Births / 1,000 Women |
| 15 to 19 years | 0 (0.0%) | 0.0 |
| 20 to 34 years | 15 (100.0%) | 91.0 |
| 35 to 50 years | 0 (0.0%) | 0.0 |
| Total | 15 (100.0%) | 28.0 |
Fertility by Age by Marriage Status in Jarrell
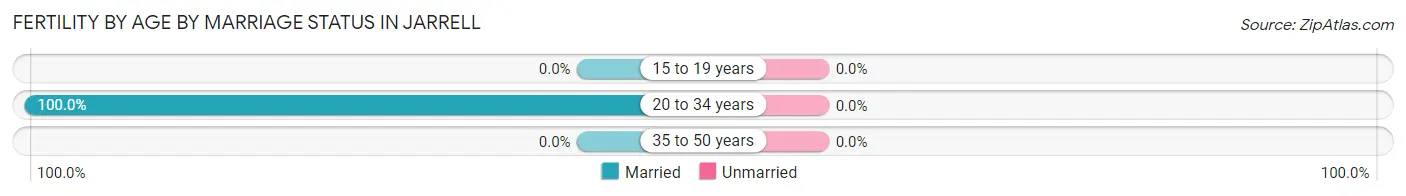
| Age Bracket | Married | Unmarried |
| 15 to 19 years | 0 (0.0%) | 0 (0.0%) |
| 20 to 34 years | 15 (100.0%) | 0 (0.0%) |
| 35 to 50 years | 0 (0.0%) | 0 (0.0%) |
| Total | 15 (100.0%) | 0 (0.0%) |
Fertility by Education in Jarrell
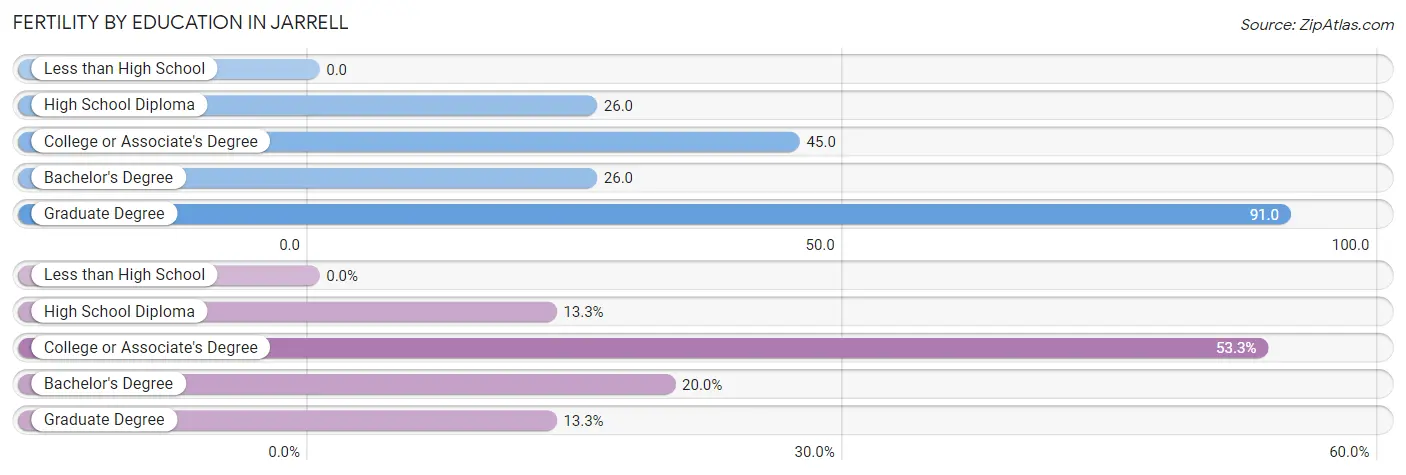
| Educational Attainment | Women with Births | Births / 1,000 Women |
| Less than High School | 0 (0.0%) | 0.0 |
| High School Diploma | 2 (13.3%) | 26.0 |
| College or Associate's Degree | 8 (53.3%) | 45.0 |
| Bachelor's Degree | 3 (20.0%) | 26.0 |
| Graduate Degree | 2 (13.3%) | 91.0 |
| Total | 15 (100.0%) | 28.0 |
Fertility by Education by Marriage Status in Jarrell
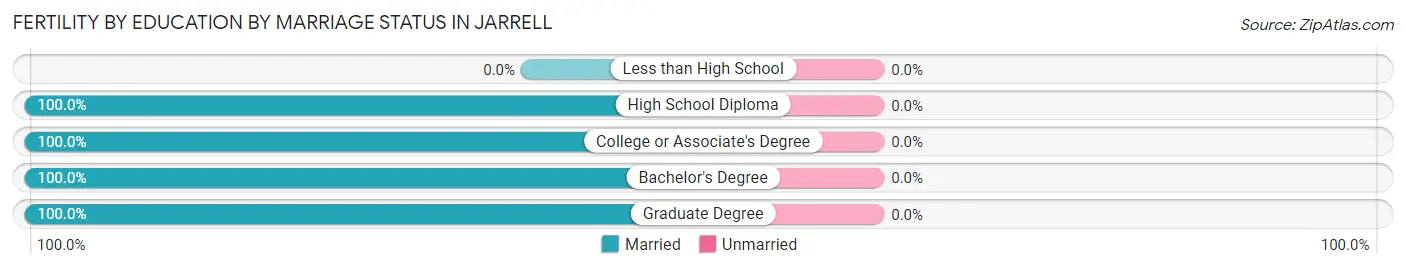
| Educational Attainment | Married | Unmarried |
| Less than High School | 0 (0.0%) | 0 (0.0%) |
| High School Diploma | 2 (100.0%) | 0 (0.0%) |
| College or Associate's Degree | 8 (100.0%) | 0 (0.0%) |
| Bachelor's Degree | 3 (100.0%) | 0 (0.0%) |
| Graduate Degree | 2 (100.0%) | 0 (0.0%) |
| Total | 15 (100.0%) | 0 (0.0%) |
Employment Characteristics in Jarrell
Employment by Class of Employer in Jarrell
Among the 1,228 employed individuals in Jarrell, private company employees (704 | 57.3%), local government employees (202 | 16.5%), and not-for-profit organizations (152 | 12.4%) make up the most common classes of employment.
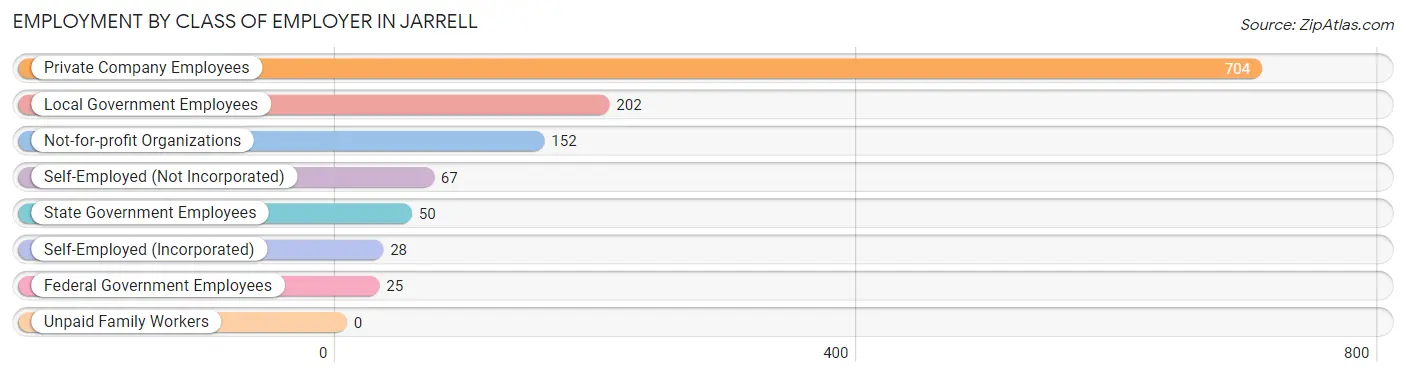
| Employer Class | # Employees | % Employees |
| Private Company Employees | 704 | 57.3% |
| Self-Employed (Incorporated) | 28 | 2.3% |
| Self-Employed (Not Incorporated) | 67 | 5.5% |
| Not-for-profit Organizations | 152 | 12.4% |
| Local Government Employees | 202 | 16.5% |
| State Government Employees | 50 | 4.1% |
| Federal Government Employees | 25 | 2.0% |
| Unpaid Family Workers | 0 | 0.0% |
| Total | 1,228 | 100.0% |
Employment Status by Age in Jarrell
According to the labor force statistics for Jarrell, out of the total population over 16 years of age (1,676), 76.6% or 1,284 individuals are in the labor force, with 3.1% or 40 of them unemployed. The age group with the highest labor force participation rate is 35 to 44 years, with 96.9% or 402 individuals in the labor force. Within the labor force, the 16 to 19 years age range has the highest percentage of unemployed individuals, with 20.2% or 19 of them being unemployed.
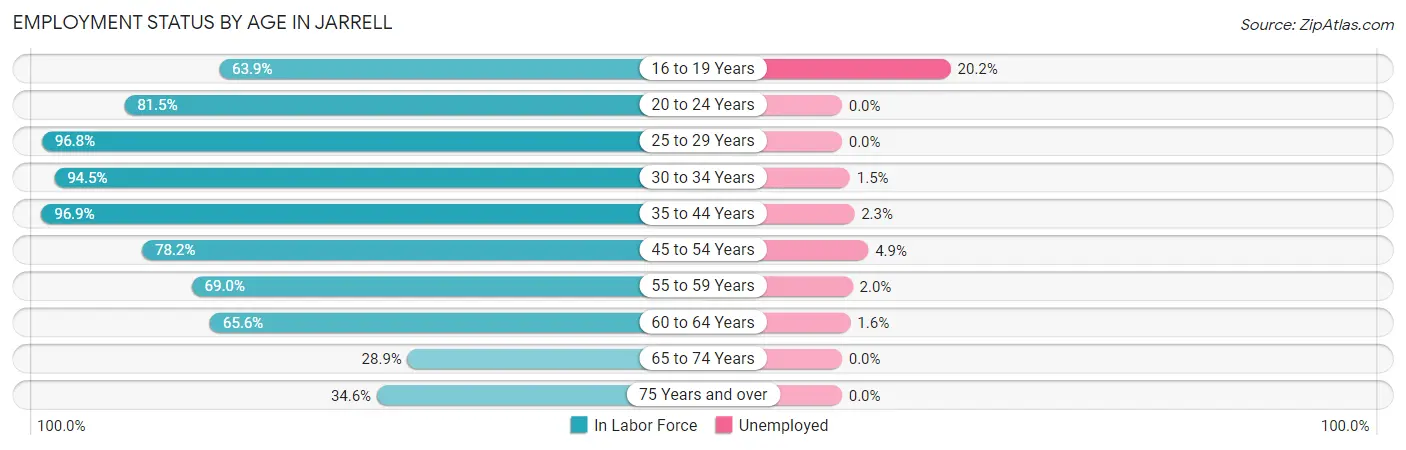
| Age Bracket | In Labor Force | Unemployed |
| 16 to 19 Years | 94 (63.9%) | 19 (20.2%) |
| 20 to 24 Years | 88 (81.5%) | 0 (0.0%) |
| 25 to 29 Years | 150 (96.8%) | 0 (0.0%) |
| 30 to 34 Years | 137 (94.5%) | 2 (1.5%) |
| 35 to 44 Years | 402 (96.9%) | 9 (2.3%) |
| 45 to 54 Years | 122 (78.2%) | 6 (4.9%) |
| 55 to 59 Years | 100 (69.0%) | 2 (2.0%) |
| 60 to 64 Years | 124 (65.6%) | 2 (1.6%) |
| 65 to 74 Years | 39 (28.9%) | 0 (0.0%) |
| 75 Years and over | 28 (34.6%) | 0 (0.0%) |
| Total | 1,284 (76.6%) | 40 (3.1%) |
Employment Status by Educational Attainment in Jarrell
According to labor force statistics for Jarrell, 85.9% of individuals (1,035) out of the total population between 25 and 64 years of age (1,205) are in the labor force, with 2.0% or 21 of them being unemployed. The group with the highest labor force participation rate are those with the educational attainment of bachelor's degree or higher, with 98.7% or 300 individuals in the labor force. Within the labor force, individuals with high school diploma education have the highest percentage of unemployment, with 5.1% or 16 of them being unemployed.
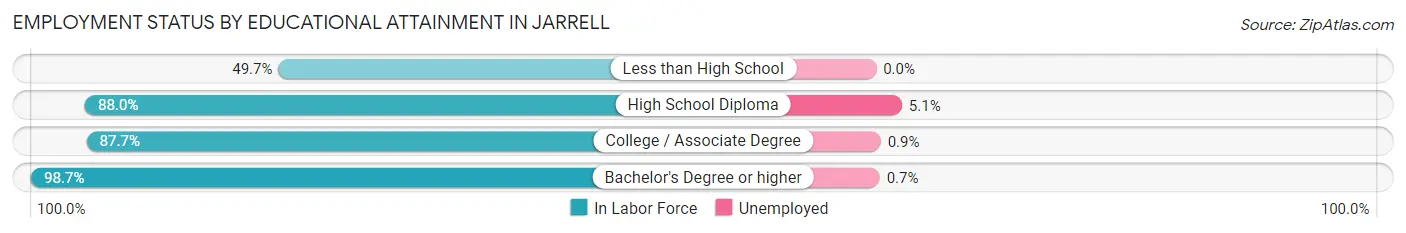
| Educational Attainment | In Labor Force | Unemployed |
| Less than High School | 73 (49.7%) | 0 (0.0%) |
| High School Diploma | 314 (88.0%) | 18 (5.1%) |
| College / Associate Degree | 348 (87.7%) | 4 (0.9%) |
| Bachelor's Degree or higher | 300 (98.7%) | 2 (0.7%) |
| Total | 1,035 (85.9%) | 24 (2.0%) |
Employment Occupations by Sex in Jarrell
Management, Business, Science and Arts Occupations
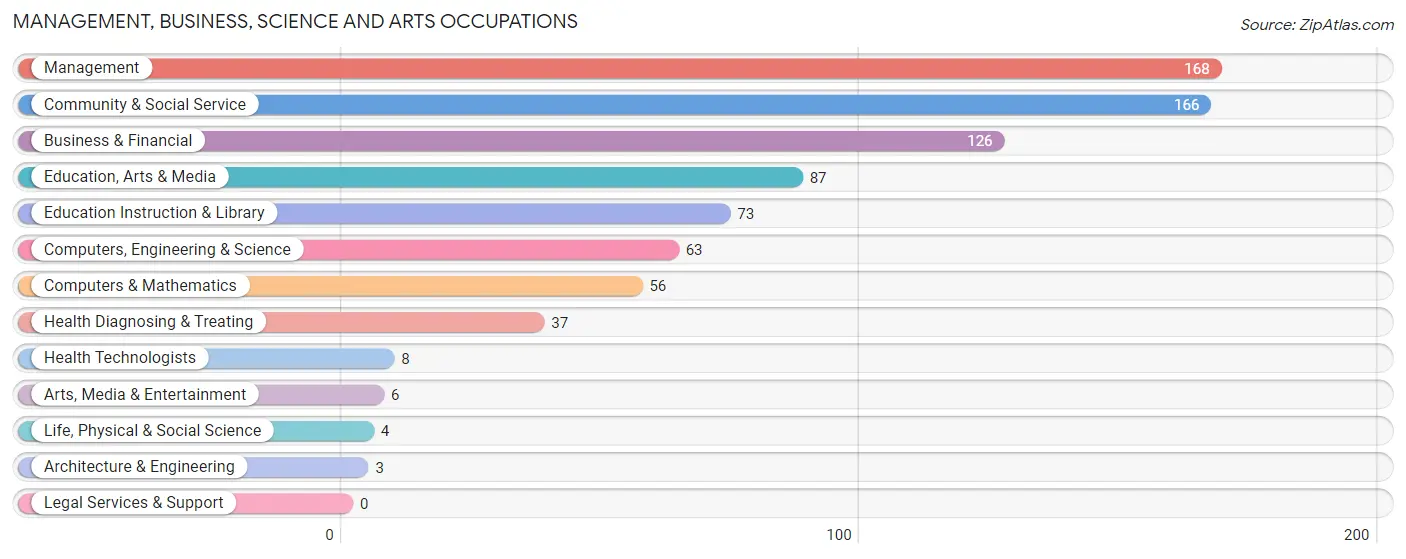
The most common Management, Business, Science and Arts occupations in Jarrell are Management (168 | 13.5%), Community & Social Service (166 | 13.4%), Business & Financial (126 | 10.2%), Education, Arts & Media (87 | 7.0%), and Education Instruction & Library (73 | 5.9%).
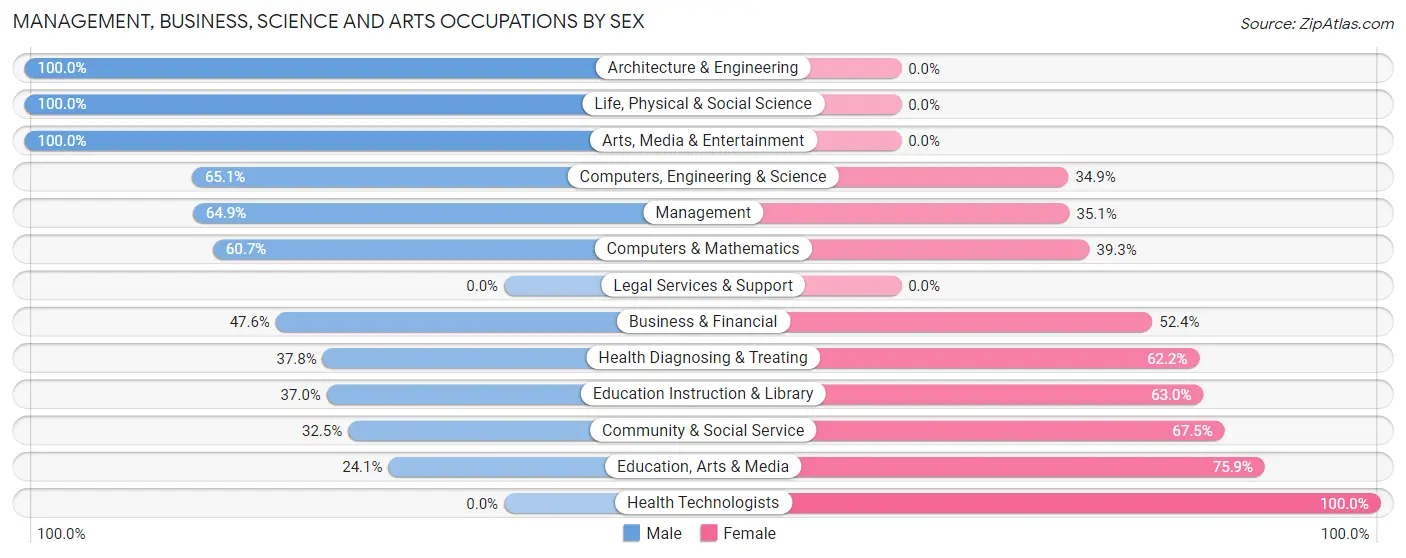
Management, Business, Science and Arts Occupations by Sex
Within the Management, Business, Science and Arts occupations in Jarrell, the most male-oriented occupations are Architecture & Engineering (100.0%), Life, Physical & Social Science (100.0%), and Arts, Media & Entertainment (100.0%), while the most female-oriented occupations are Health Technologists (100.0%), Education, Arts & Media (75.9%), and Community & Social Service (67.5%).
| Occupation | Male | Female |
| Management | 109 (64.9%) | 59 (35.1%) |
| Business & Financial | 60 (47.6%) | 66 (52.4%) |
| Computers, Engineering & Science | 41 (65.1%) | 22 (34.9%) |
| Computers & Mathematics | 34 (60.7%) | 22 (39.3%) |
| Architecture & Engineering | 3 (100.0%) | 0 (0.0%) |
| Life, Physical & Social Science | 4 (100.0%) | 0 (0.0%) |
| Community & Social Service | 54 (32.5%) | 112 (67.5%) |
| Education, Arts & Media | 21 (24.1%) | 66 (75.9%) |
| Legal Services & Support | 0 (0.0%) | 0 (0.0%) |
| Education Instruction & Library | 27 (37.0%) | 46 (63.0%) |
| Arts, Media & Entertainment | 6 (100.0%) | 0 (0.0%) |
| Health Diagnosing & Treating | 14 (37.8%) | 23 (62.2%) |
| Health Technologists | 0 (0.0%) | 8 (100.0%) |
| Total (Category) | 278 (49.6%) | 282 (50.4%) |
| Total (Overall) | 730 (58.8%) | 511 (41.2%) |
Services Occupations
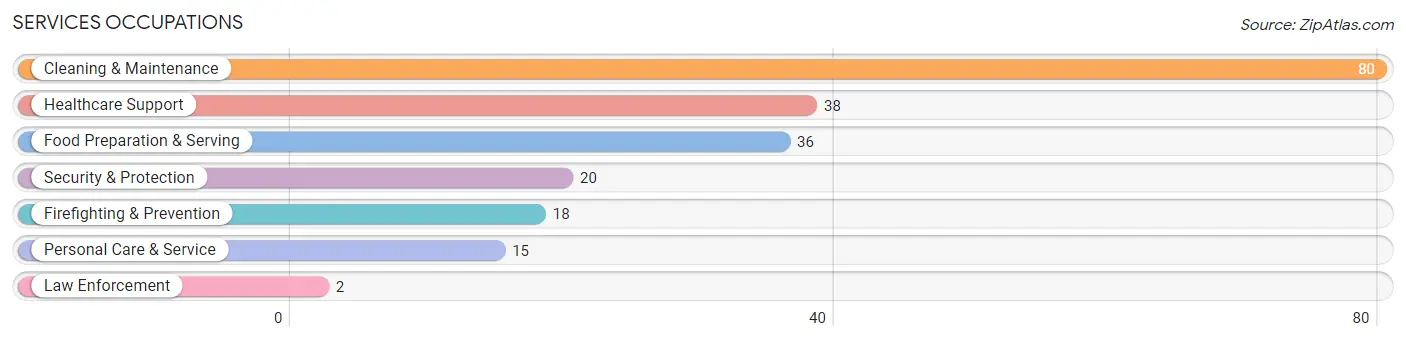
The most common Services occupations in Jarrell are Cleaning & Maintenance (80 | 6.5%), Healthcare Support (38 | 3.1%), Food Preparation & Serving (36 | 2.9%), Security & Protection (20 | 1.6%), and Firefighting & Prevention (18 | 1.5%).
Services Occupations by Sex
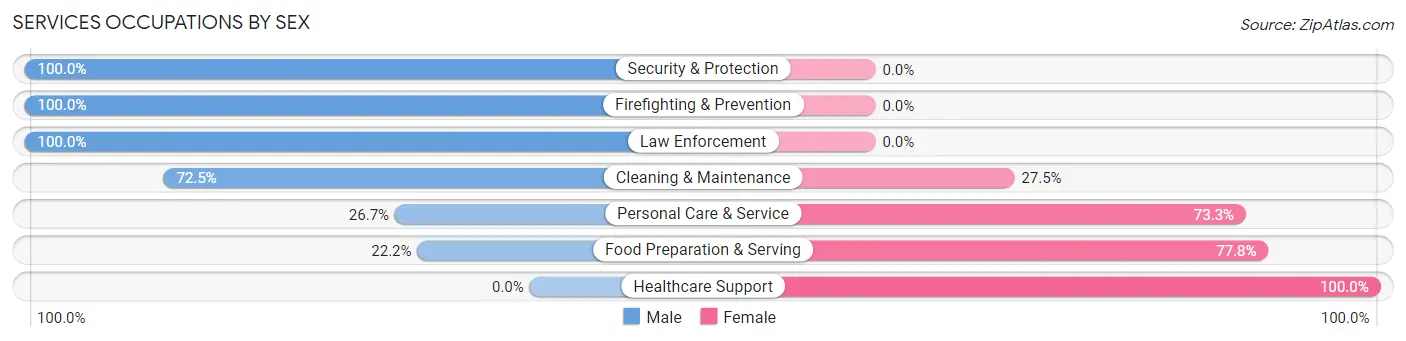
Within the Services occupations in Jarrell, the most male-oriented occupations are Security & Protection (100.0%), Firefighting & Prevention (100.0%), and Law Enforcement (100.0%), while the most female-oriented occupations are Healthcare Support (100.0%), Food Preparation & Serving (77.8%), and Personal Care & Service (73.3%).
| Occupation | Male | Female |
| Healthcare Support | 0 (0.0%) | 38 (100.0%) |
| Security & Protection | 20 (100.0%) | 0 (0.0%) |
| Firefighting & Prevention | 18 (100.0%) | 0 (0.0%) |
| Law Enforcement | 2 (100.0%) | 0 (0.0%) |
| Food Preparation & Serving | 8 (22.2%) | 28 (77.8%) |
| Cleaning & Maintenance | 58 (72.5%) | 22 (27.5%) |
| Personal Care & Service | 4 (26.7%) | 11 (73.3%) |
| Total (Category) | 90 (47.6%) | 99 (52.4%) |
| Total (Overall) | 730 (58.8%) | 511 (41.2%) |
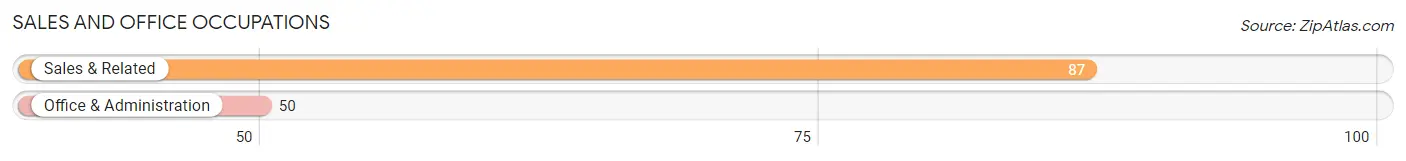
Sales and Office Occupations
The most common Sales and Office occupations in Jarrell are Sales & Related (87 | 7.0%), and Office & Administration (50 | 4.0%).
Sales and Office Occupations by Sex
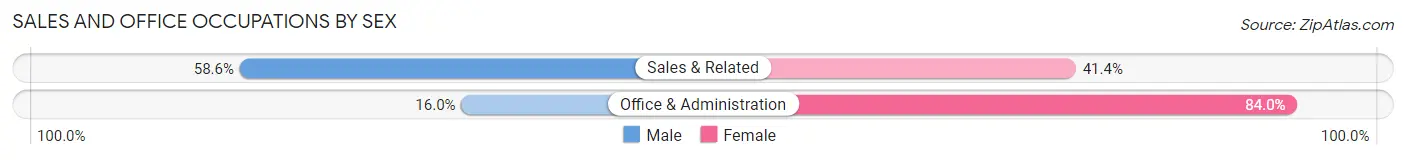
| Occupation | Male | Female |
| Sales & Related | 51 (58.6%) | 36 (41.4%) |
| Office & Administration | 8 (16.0%) | 42 (84.0%) |
| Total (Category) | 59 (43.1%) | 78 (56.9%) |
| Total (Overall) | 730 (58.8%) | 511 (41.2%) |
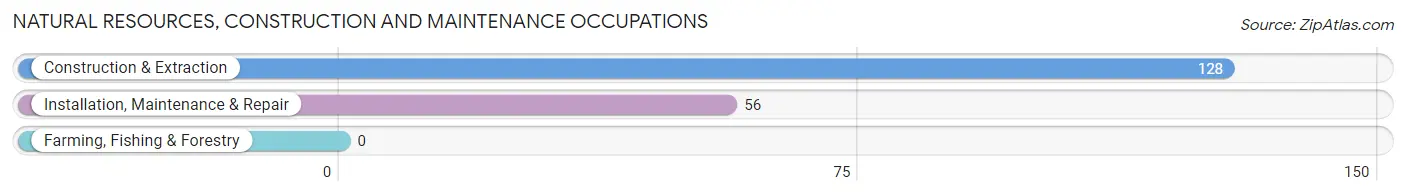
Natural Resources, Construction and Maintenance Occupations
The most common Natural Resources, Construction and Maintenance occupations in Jarrell are Construction & Extraction (128 | 10.3%), and Installation, Maintenance & Repair (56 | 4.5%).
Natural Resources, Construction and Maintenance Occupations by Sex
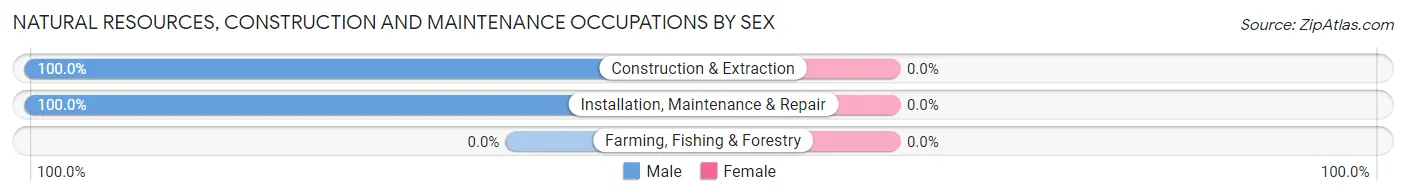
| Occupation | Male | Female |
| Farming, Fishing & Forestry | 0 (0.0%) | 0 (0.0%) |
| Construction & Extraction | 128 (100.0%) | 0 (0.0%) |
| Installation, Maintenance & Repair | 56 (100.0%) | 0 (0.0%) |
| Total (Category) | 184 (100.0%) | 0 (0.0%) |
| Total (Overall) | 730 (58.8%) | 511 (41.2%) |
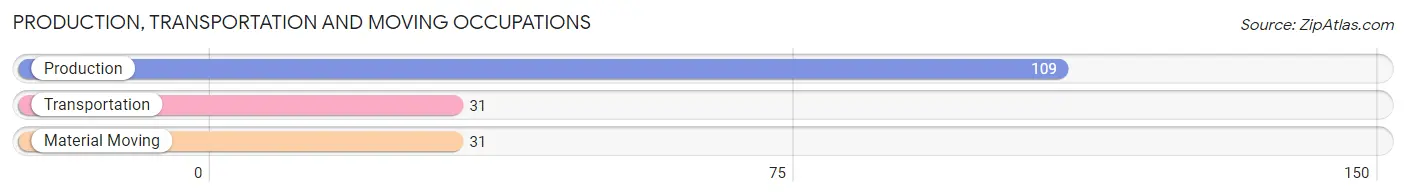
Production, Transportation and Moving Occupations
The most common Production, Transportation and Moving occupations in Jarrell are Production (109 | 8.8%), Transportation (31 | 2.5%), and Material Moving (31 | 2.5%).
Production, Transportation and Moving Occupations by Sex
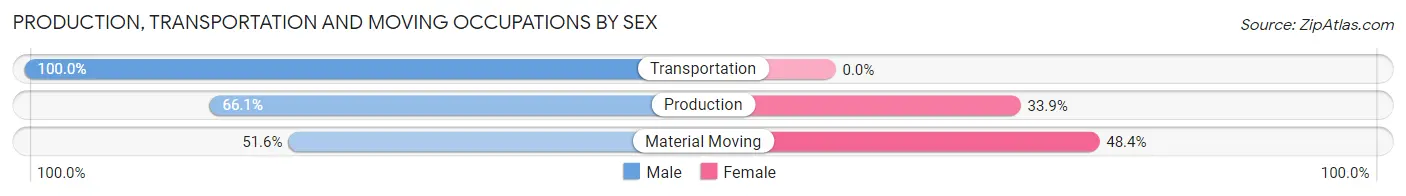
| Occupation | Male | Female |
| Production | 72 (66.1%) | 37 (33.9%) |
| Transportation | 31 (100.0%) | 0 (0.0%) |
| Material Moving | 16 (51.6%) | 15 (48.4%) |
| Total (Category) | 119 (69.6%) | 52 (30.4%) |
| Total (Overall) | 730 (58.8%) | 511 (41.2%) |
Employment Industries by Sex in Jarrell
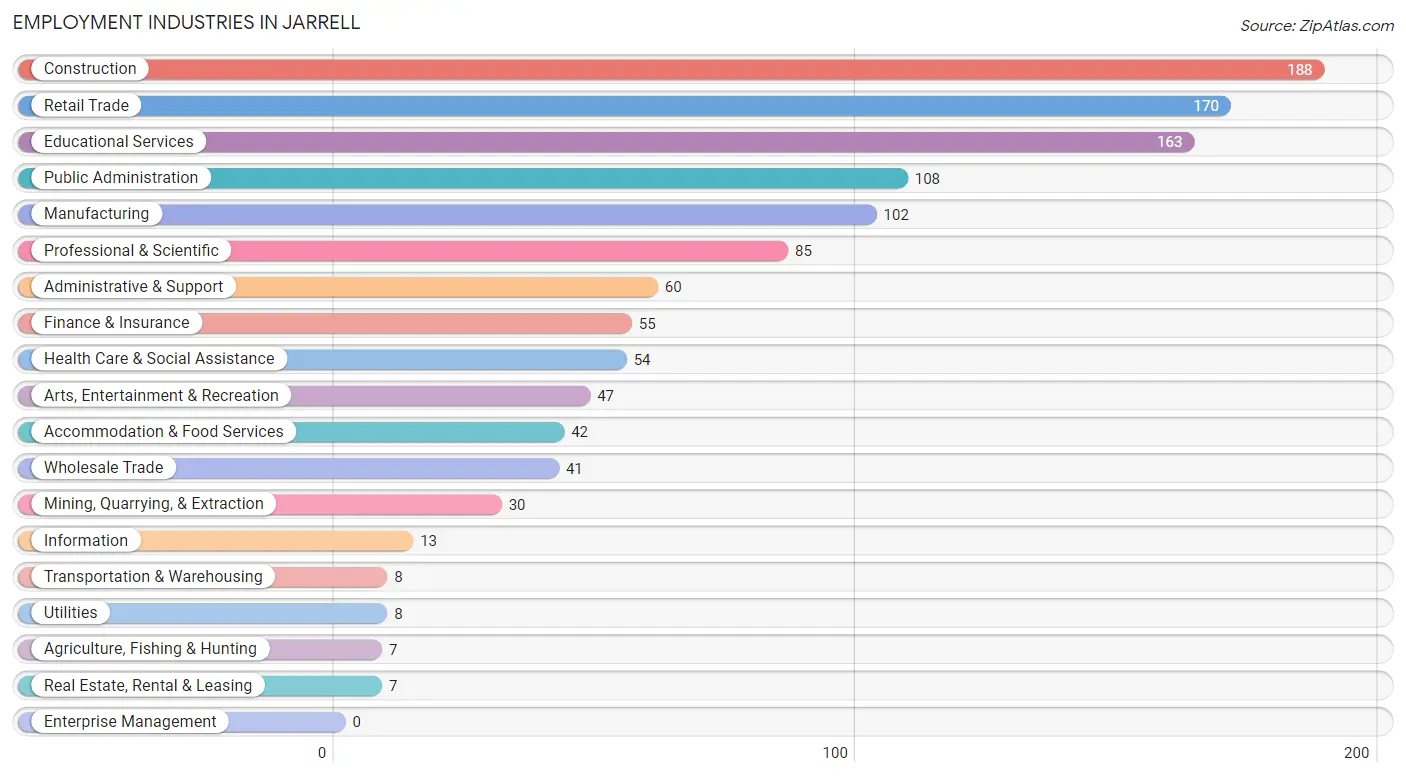
Employment Industries in Jarrell
The major employment industries in Jarrell include Construction (188 | 15.1%), Retail Trade (170 | 13.7%), Educational Services (163 | 13.1%), Public Administration (108 | 8.7%), and Manufacturing (102 | 8.2%).
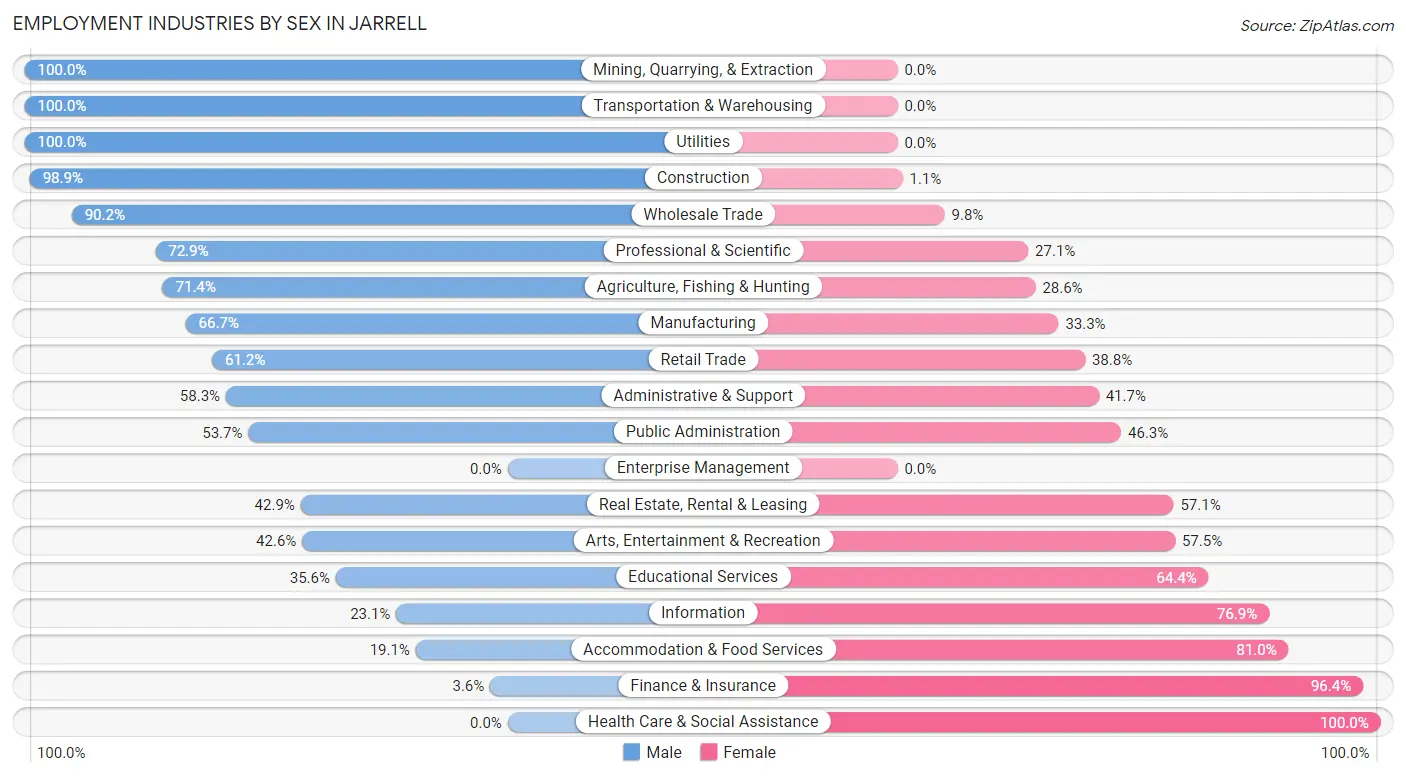
Employment Industries by Sex in Jarrell
The Jarrell industries that see more men than women are Mining, Quarrying, & Extraction (100.0%), Transportation & Warehousing (100.0%), and Utilities (100.0%), whereas the industries that tend to have a higher number of women are Health Care & Social Assistance (100.0%), Finance & Insurance (96.4%), and Accommodation & Food Services (80.9%).
| Industry | Male | Female |
| Agriculture, Fishing & Hunting | 5 (71.4%) | 2 (28.6%) |
| Mining, Quarrying, & Extraction | 30 (100.0%) | 0 (0.0%) |
| Construction | 186 (98.9%) | 2 (1.1%) |
| Manufacturing | 68 (66.7%) | 34 (33.3%) |
| Wholesale Trade | 37 (90.2%) | 4 (9.8%) |
| Retail Trade | 104 (61.2%) | 66 (38.8%) |
| Transportation & Warehousing | 8 (100.0%) | 0 (0.0%) |
| Utilities | 8 (100.0%) | 0 (0.0%) |
| Information | 3 (23.1%) | 10 (76.9%) |
| Finance & Insurance | 2 (3.6%) | 53 (96.4%) |
| Real Estate, Rental & Leasing | 3 (42.9%) | 4 (57.1%) |
| Professional & Scientific | 62 (72.9%) | 23 (27.1%) |
| Enterprise Management | 0 (0.0%) | 0 (0.0%) |
| Administrative & Support | 35 (58.3%) | 25 (41.7%) |
| Educational Services | 58 (35.6%) | 105 (64.4%) |
| Health Care & Social Assistance | 0 (0.0%) | 54 (100.0%) |
| Arts, Entertainment & Recreation | 20 (42.5%) | 27 (57.5%) |
| Accommodation & Food Services | 8 (19.1%) | 34 (80.9%) |
| Public Administration | 58 (53.7%) | 50 (46.3%) |
| Total | 730 (58.8%) | 511 (41.2%) |
Education in Jarrell
School Enrollment in Jarrell
The most common levels of schooling among the 608 students in Jarrell are high school (240 | 39.5%), middle school (126 | 20.7%), and elementary school (120 | 19.7%).
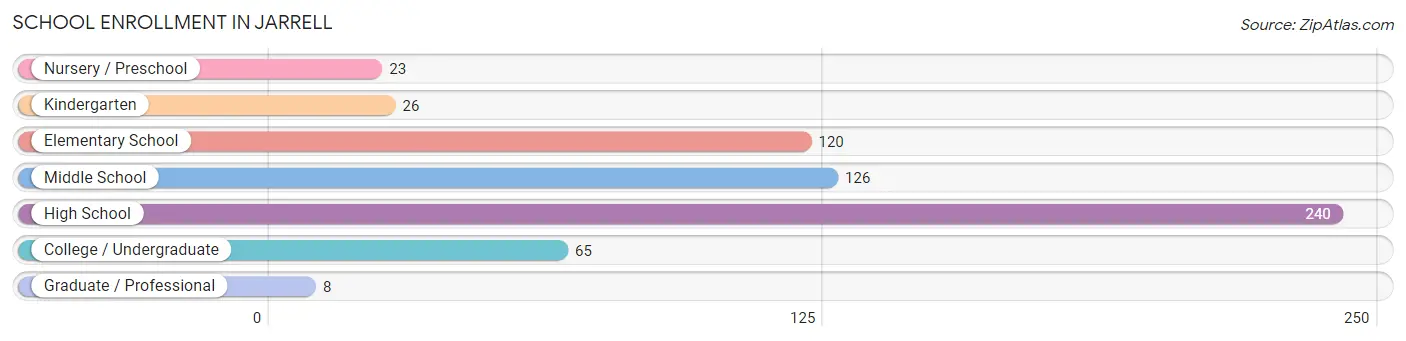
| School Level | # Students | % Students |
| Nursery / Preschool | 23 | 3.8% |
| Kindergarten | 26 | 4.3% |
| Elementary School | 120 | 19.7% |
| Middle School | 126 | 20.7% |
| High School | 240 | 39.5% |
| College / Undergraduate | 65 | 10.7% |
| Graduate / Professional | 8 | 1.3% |
| Total | 608 | 100.0% |
School Enrollment by Age by Funding Source in Jarrell
Out of a total of 608 students who are enrolled in schools in Jarrell, 94 (15.5%) attend a private institution, while the remaining 514 (84.5%) are enrolled in public schools. The age group of 35 years and over has the highest likelihood of being enrolled in private schools, with 33 (70.2% in the age bracket) enrolled. Conversely, the age group of 18 to 19 year olds has the lowest likelihood of being enrolled in a private school, with 40 (100.0% in the age bracket) attending a public institution.
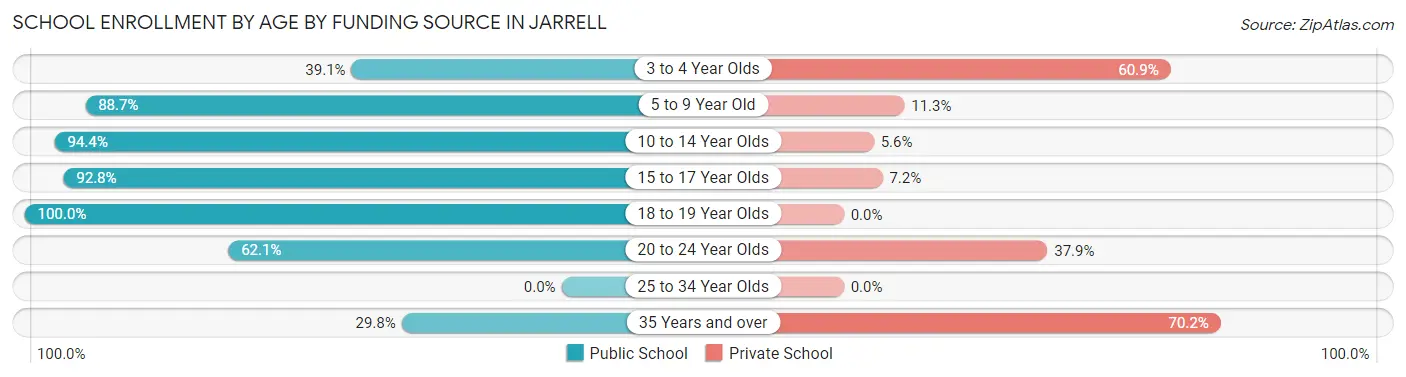
| Age Bracket | Public School | Private School |
| 3 to 4 Year Olds | 9 (39.1%) | 14 (60.9%) |
| 5 to 9 Year Old | 110 (88.7%) | 14 (11.3%) |
| 10 to 14 Year Olds | 169 (94.4%) | 10 (5.6%) |
| 15 to 17 Year Olds | 154 (92.8%) | 12 (7.2%) |
| 18 to 19 Year Olds | 40 (100.0%) | 0 (0.0%) |
| 20 to 24 Year Olds | 18 (62.1%) | 11 (37.9%) |
| 25 to 34 Year Olds | 0 (0.0%) | 0 (0.0%) |
| 35 Years and over | 14 (29.8%) | 33 (70.2%) |
| Total | 514 (84.5%) | 94 (15.5%) |
Educational Attainment by Field of Study in Jarrell
Business (89 | 23.5%), engineering (75 | 19.8%), arts & humanities (74 | 19.5%), education (34 | 9.0%), and literature & languages (23 | 6.1%) are the most common fields of study among 379 individuals in Jarrell who have obtained a bachelor's degree or higher.
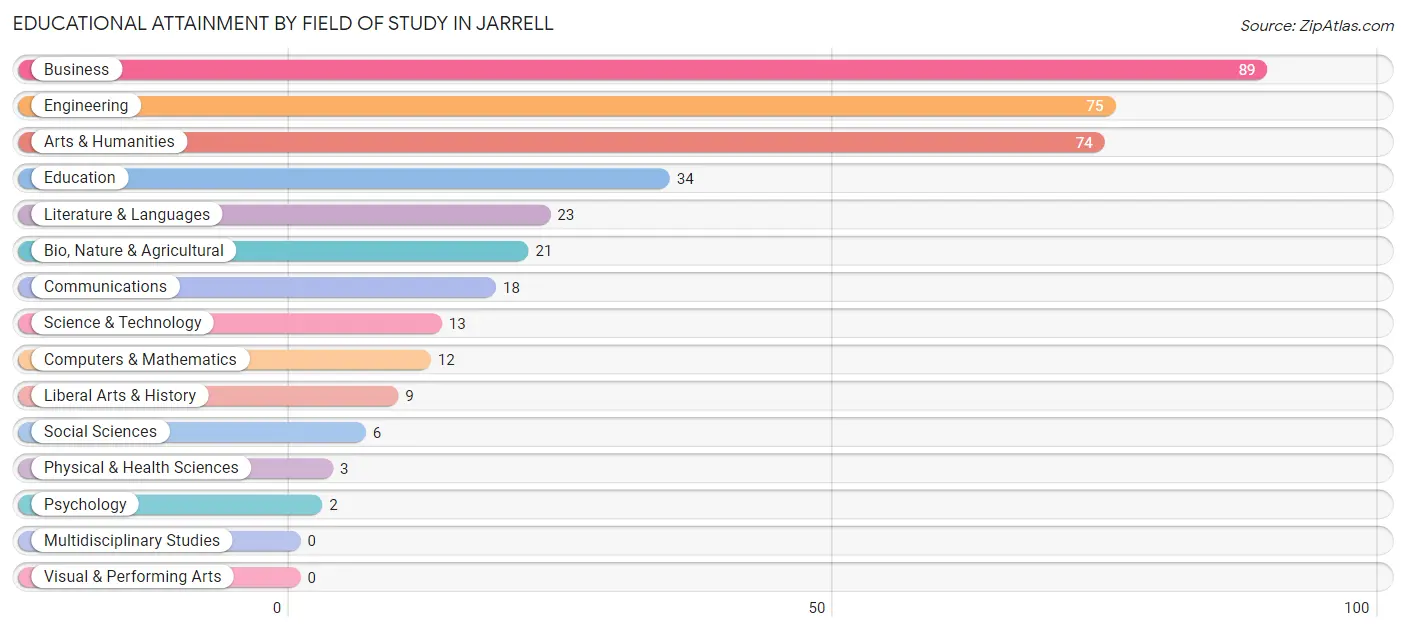
| Field of Study | # Graduates | % Graduates |
| Computers & Mathematics | 12 | 3.2% |
| Bio, Nature & Agricultural | 21 | 5.5% |
| Physical & Health Sciences | 3 | 0.8% |
| Psychology | 2 | 0.5% |
| Social Sciences | 6 | 1.6% |
| Engineering | 75 | 19.8% |
| Multidisciplinary Studies | 0 | 0.0% |
| Science & Technology | 13 | 3.4% |
| Business | 89 | 23.5% |
| Education | 34 | 9.0% |
| Literature & Languages | 23 | 6.1% |
| Liberal Arts & History | 9 | 2.4% |
| Visual & Performing Arts | 0 | 0.0% |
| Communications | 18 | 4.8% |
| Arts & Humanities | 74 | 19.5% |
| Total | 379 | 100.0% |
Transportation & Commute in Jarrell
Vehicle Availability by Sex in Jarrell
The most prevalent vehicle ownership categories in Jarrell are males with 2 vehicles (254, accounting for 35.1%) and females with 2 vehicles (159, making up 50.4%).
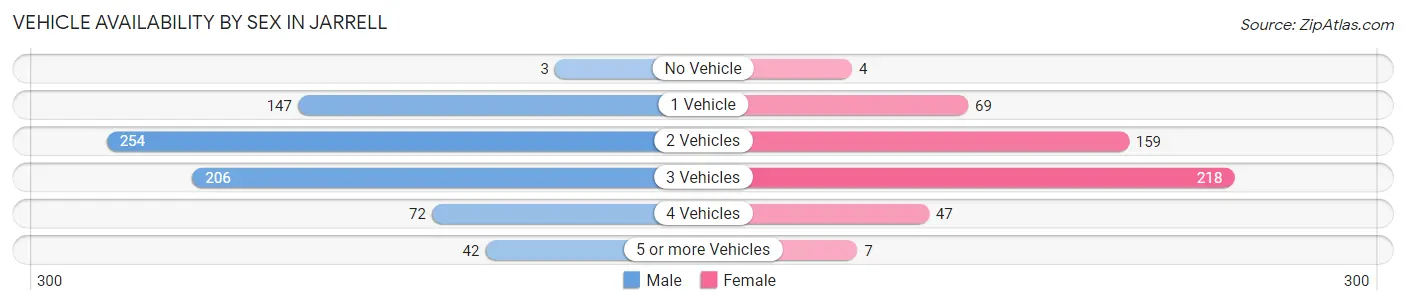
| Vehicles Available | Male | Female |
| No Vehicle | 3 (0.4%) | 4 (0.8%) |
| 1 Vehicle | 147 (20.3%) | 69 (13.7%) |
| 2 Vehicles | 254 (35.1%) | 159 (31.6%) |
| 3 Vehicles | 206 (28.4%) | 218 (43.2%) |
| 4 Vehicles | 72 (9.9%) | 47 (9.3%) |
| 5 or more Vehicles | 42 (5.8%) | 7 (1.4%) |
| Total | 724 (100.0%) | 504 (100.0%) |
Commute Time in Jarrell
The most frequently occuring commute durations in Jarrell are 30 to 34 minutes (337 commuters, 30.5%), 60 to 89 minutes (153 commuters, 13.9%), and 15 to 19 minutes (104 commuters, 9.4%).
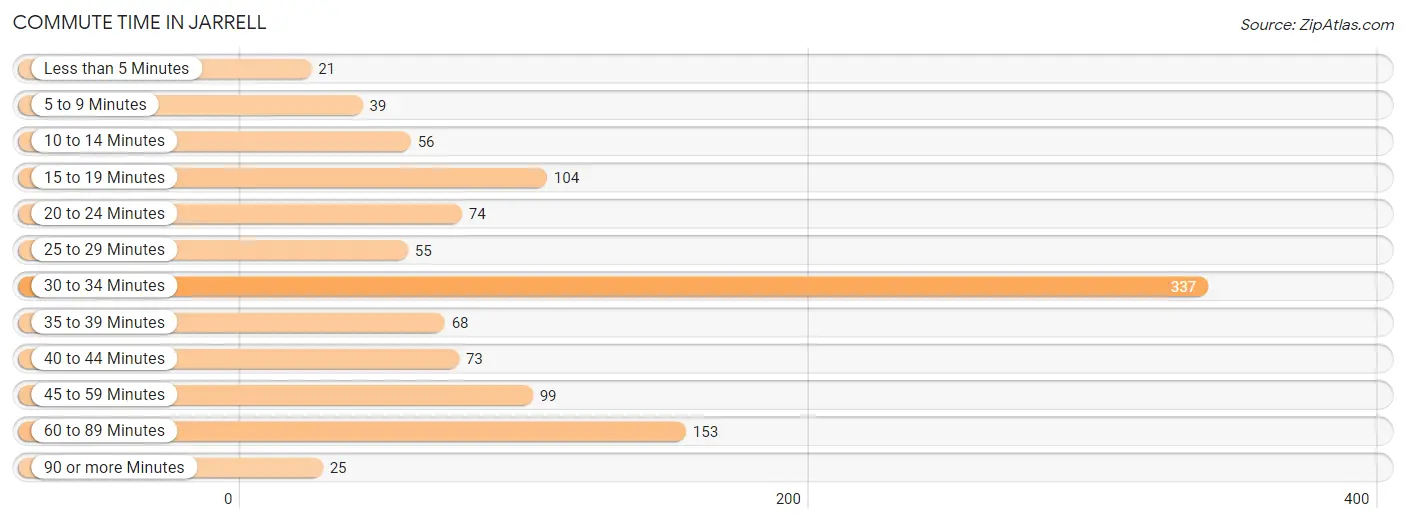
| Commute Time | # Commuters | % Commuters |
| Less than 5 Minutes | 21 | 1.9% |
| 5 to 9 Minutes | 39 | 3.5% |
| 10 to 14 Minutes | 56 | 5.1% |
| 15 to 19 Minutes | 104 | 9.4% |
| 20 to 24 Minutes | 74 | 6.7% |
| 25 to 29 Minutes | 55 | 5.0% |
| 30 to 34 Minutes | 337 | 30.5% |
| 35 to 39 Minutes | 68 | 6.2% |
| 40 to 44 Minutes | 73 | 6.6% |
| 45 to 59 Minutes | 99 | 9.0% |
| 60 to 89 Minutes | 153 | 13.9% |
| 90 or more Minutes | 25 | 2.3% |
Commute Time by Sex in Jarrell
The most common commute times in Jarrell are 30 to 34 minutes (200 commuters, 30.4%) for males and 30 to 34 minutes (137 commuters, 30.6%) for females.
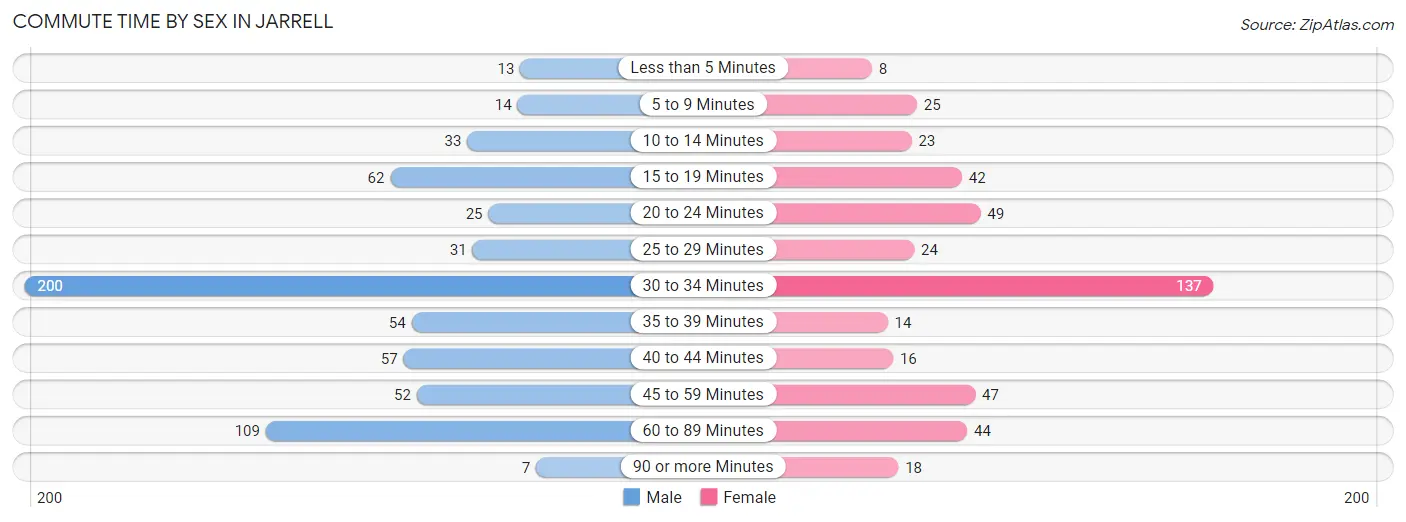
| Commute Time | Male | Female |
| Less than 5 Minutes | 13 (2.0%) | 8 (1.8%) |
| 5 to 9 Minutes | 14 (2.1%) | 25 (5.6%) |
| 10 to 14 Minutes | 33 (5.0%) | 23 (5.1%) |
| 15 to 19 Minutes | 62 (9.4%) | 42 (9.4%) |
| 20 to 24 Minutes | 25 (3.8%) | 49 (11.0%) |
| 25 to 29 Minutes | 31 (4.7%) | 24 (5.4%) |
| 30 to 34 Minutes | 200 (30.4%) | 137 (30.6%) |
| 35 to 39 Minutes | 54 (8.2%) | 14 (3.1%) |
| 40 to 44 Minutes | 57 (8.7%) | 16 (3.6%) |
| 45 to 59 Minutes | 52 (7.9%) | 47 (10.5%) |
| 60 to 89 Minutes | 109 (16.6%) | 44 (9.8%) |
| 90 or more Minutes | 7 (1.1%) | 18 (4.0%) |
Time of Departure to Work by Sex in Jarrell
The most frequent times of departure to work in Jarrell are 5:00 AM to 5:29 AM (159, 24.2%) for males and 8:00 AM to 8:29 AM (102, 22.8%) for females.
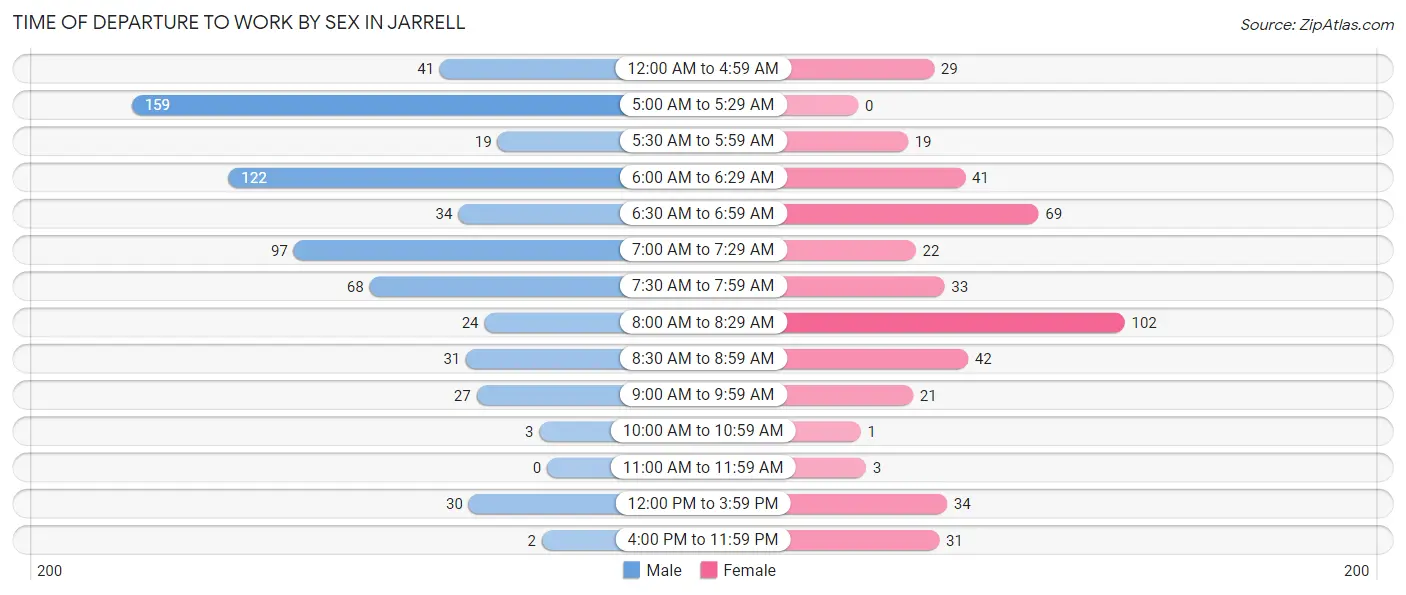
| Time of Departure | Male | Female |
| 12:00 AM to 4:59 AM | 41 (6.2%) | 29 (6.5%) |
| 5:00 AM to 5:29 AM | 159 (24.2%) | 0 (0.0%) |
| 5:30 AM to 5:59 AM | 19 (2.9%) | 19 (4.3%) |
| 6:00 AM to 6:29 AM | 122 (18.6%) | 41 (9.2%) |
| 6:30 AM to 6:59 AM | 34 (5.2%) | 69 (15.4%) |
| 7:00 AM to 7:29 AM | 97 (14.8%) | 22 (4.9%) |
| 7:30 AM to 7:59 AM | 68 (10.3%) | 33 (7.4%) |
| 8:00 AM to 8:29 AM | 24 (3.6%) | 102 (22.8%) |
| 8:30 AM to 8:59 AM | 31 (4.7%) | 42 (9.4%) |
| 9:00 AM to 9:59 AM | 27 (4.1%) | 21 (4.7%) |
| 10:00 AM to 10:59 AM | 3 (0.5%) | 1 (0.2%) |
| 11:00 AM to 11:59 AM | 0 (0.0%) | 3 (0.7%) |
| 12:00 PM to 3:59 PM | 30 (4.6%) | 34 (7.6%) |
| 4:00 PM to 11:59 PM | 2 (0.3%) | 31 (6.9%) |
| Total | 657 (100.0%) | 447 (100.0%) |
Housing Occupancy in Jarrell
Occupancy by Ownership in Jarrell
Of the total 735 dwellings in Jarrell, owner-occupied units account for 646 (87.9%), while renter-occupied units make up 89 (12.1%).
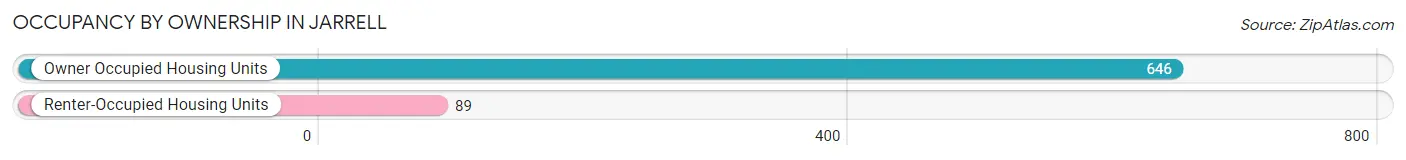
| Occupancy | # Housing Units | % Housing Units |
| Owner Occupied Housing Units | 646 | 87.9% |
| Renter-Occupied Housing Units | 89 | 12.1% |
| Total Occupied Housing Units | 735 | 100.0% |
Occupancy by Household Size in Jarrell
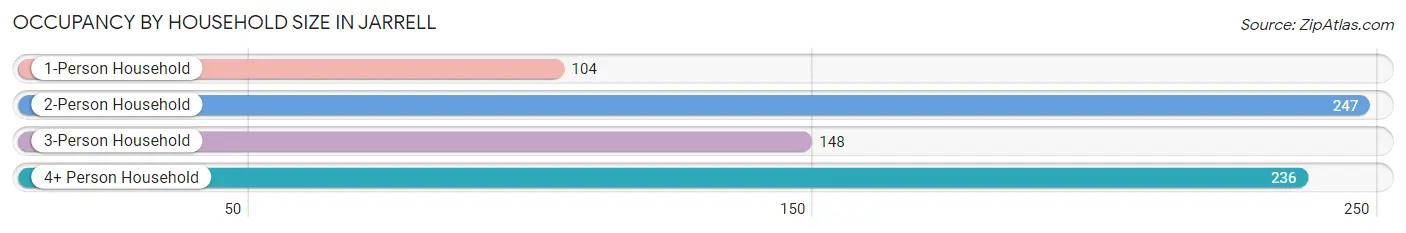
| Household Size | # Housing Units | % Housing Units |
| 1-Person Household | 104 | 14.1% |
| 2-Person Household | 247 | 33.6% |
| 3-Person Household | 148 | 20.1% |
| 4+ Person Household | 236 | 32.1% |
| Total Housing Units | 735 | 100.0% |
Occupancy by Ownership by Household Size in Jarrell
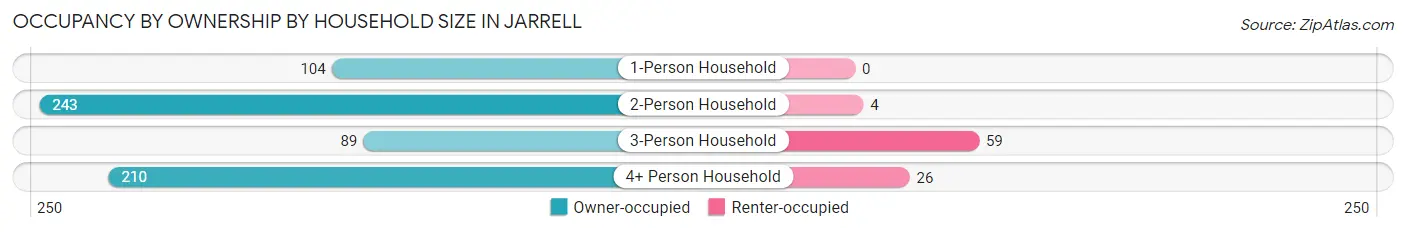
| Household Size | Owner-occupied | Renter-occupied |
| 1-Person Household | 104 (100.0%) | 0 (0.0%) |
| 2-Person Household | 243 (98.4%) | 4 (1.6%) |
| 3-Person Household | 89 (60.1%) | 59 (39.9%) |
| 4+ Person Household | 210 (89.0%) | 26 (11.0%) |
| Total Housing Units | 646 (87.9%) | 89 (12.1%) |
Occupancy by Educational Attainment in Jarrell
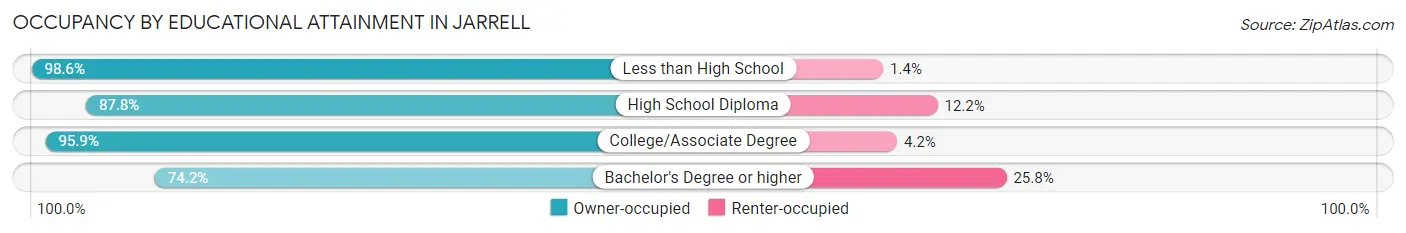
| Household Size | Owner-occupied | Renter-occupied |
| Less than High School | 71 (98.6%) | 1 (1.4%) |
| High School Diploma | 166 (87.8%) | 23 (12.2%) |
| College/Associate Degree | 254 (95.9%) | 11 (4.2%) |
| Bachelor's Degree or higher | 155 (74.2%) | 54 (25.8%) |
Occupancy by Age of Householder in Jarrell
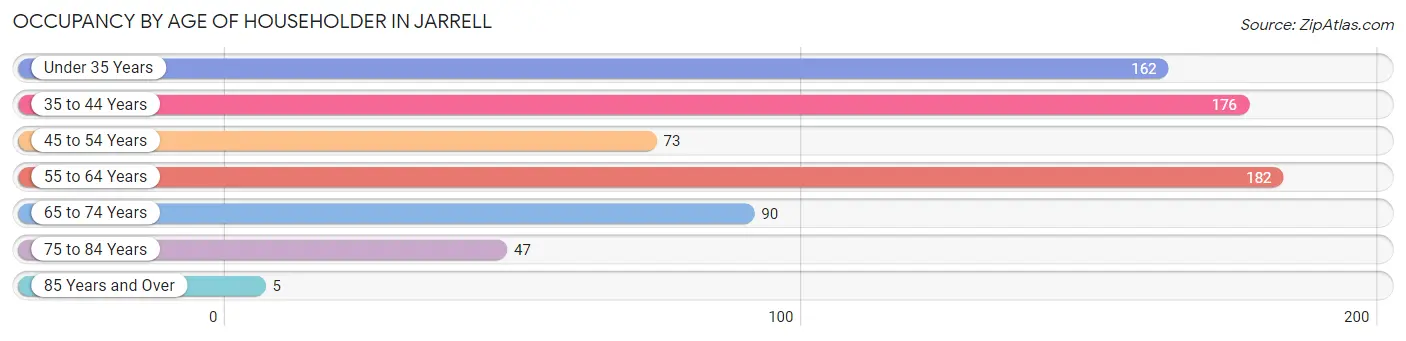
| Age Bracket | # Households | % Households |
| Under 35 Years | 162 | 22.0% |
| 35 to 44 Years | 176 | 23.9% |
| 45 to 54 Years | 73 | 9.9% |
| 55 to 64 Years | 182 | 24.8% |
| 65 to 74 Years | 90 | 12.2% |
| 75 to 84 Years | 47 | 6.4% |
| 85 Years and Over | 5 | 0.7% |
| Total | 735 | 100.0% |
Housing Finances in Jarrell
Median Income by Occupancy in Jarrell
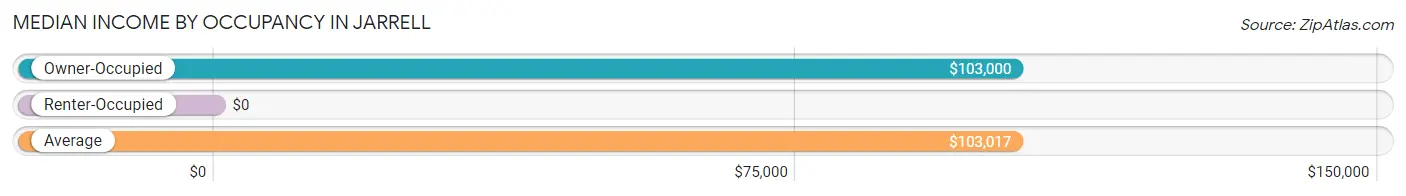
| Occupancy Type | # Households | Median Income |
| Owner-Occupied | 646 (87.9%) | $103,000 |
| Renter-Occupied | 89 (12.1%) | $0 |
| Average | 735 (100.0%) | $103,017 |
Occupancy by Householder Income Bracket in Jarrell
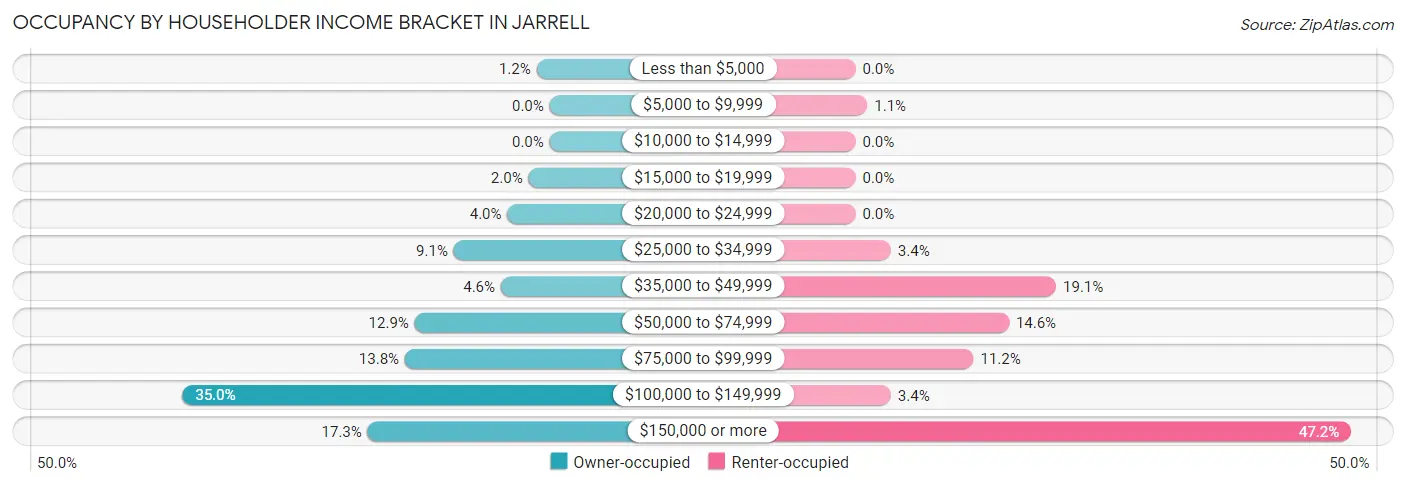
| Income Bracket | Owner-occupied | Renter-occupied |
| Less than $5,000 | 8 (1.2%) | 0 (0.0%) |
| $5,000 to $9,999 | 0 (0.0%) | 1 (1.1%) |
| $10,000 to $14,999 | 0 (0.0%) | 0 (0.0%) |
| $15,000 to $19,999 | 13 (2.0%) | 0 (0.0%) |
| $20,000 to $24,999 | 26 (4.0%) | 0 (0.0%) |
| $25,000 to $34,999 | 59 (9.1%) | 3 (3.4%) |
| $35,000 to $49,999 | 30 (4.6%) | 17 (19.1%) |
| $50,000 to $74,999 | 83 (12.9%) | 13 (14.6%) |
| $75,000 to $99,999 | 89 (13.8%) | 10 (11.2%) |
| $100,000 to $149,999 | 226 (35.0%) | 3 (3.4%) |
| $150,000 or more | 112 (17.3%) | 42 (47.2%) |
| Total | 646 (100.0%) | 89 (100.0%) |
Monthly Housing Cost Tiers in Jarrell
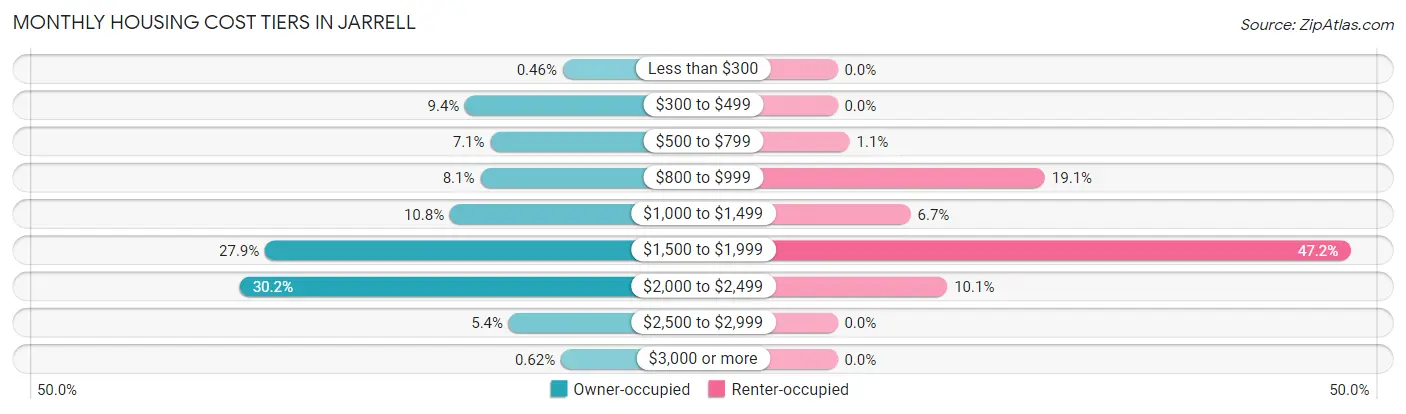
| Monthly Cost | Owner-occupied | Renter-occupied |
| Less than $300 | 3 (0.5%) | 0 (0.0%) |
| $300 to $499 | 61 (9.4%) | 0 (0.0%) |
| $500 to $799 | 46 (7.1%) | 1 (1.1%) |
| $800 to $999 | 52 (8.1%) | 17 (19.1%) |
| $1,000 to $1,499 | 70 (10.8%) | 6 (6.7%) |
| $1,500 to $1,999 | 180 (27.9%) | 42 (47.2%) |
| $2,000 to $2,499 | 195 (30.2%) | 9 (10.1%) |
| $2,500 to $2,999 | 35 (5.4%) | 0 (0.0%) |
| $3,000 or more | 4 (0.6%) | 0 (0.0%) |
| Total | 646 (100.0%) | 89 (100.0%) |
Physical Housing Characteristics in Jarrell
Housing Structures in Jarrell
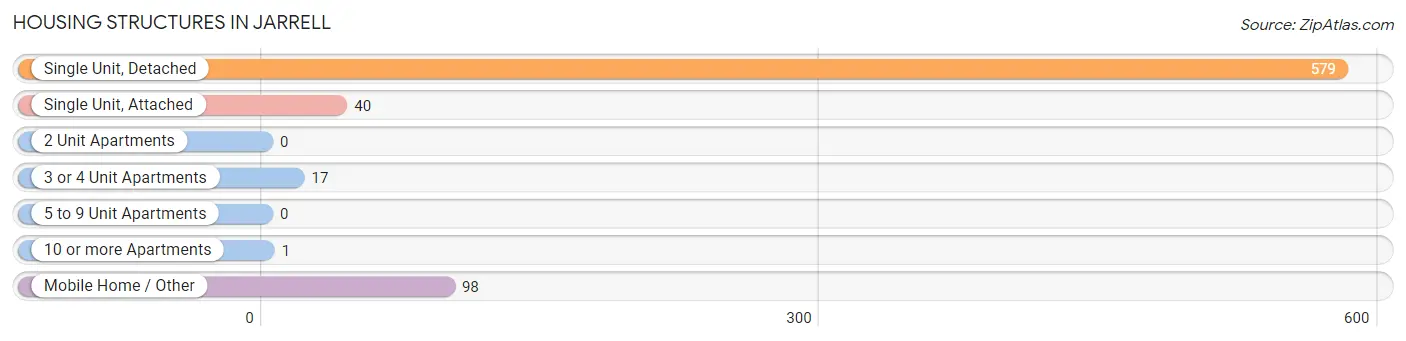
| Structure Type | # Housing Units | % Housing Units |
| Single Unit, Detached | 579 | 78.8% |
| Single Unit, Attached | 40 | 5.4% |
| 2 Unit Apartments | 0 | 0.0% |
| 3 or 4 Unit Apartments | 17 | 2.3% |
| 5 to 9 Unit Apartments | 0 | 0.0% |
| 10 or more Apartments | 1 | 0.1% |
| Mobile Home / Other | 98 | 13.3% |
| Total | 735 | 100.0% |
Housing Structures by Occupancy in Jarrell
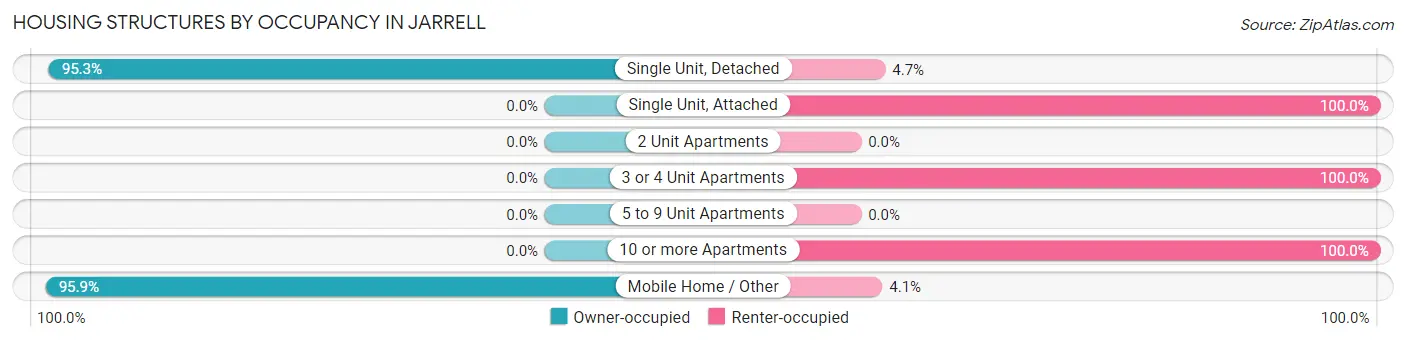
| Structure Type | Owner-occupied | Renter-occupied |
| Single Unit, Detached | 552 (95.3%) | 27 (4.7%) |
| Single Unit, Attached | 0 (0.0%) | 40 (100.0%) |
| 2 Unit Apartments | 0 (0.0%) | 0 (0.0%) |
| 3 or 4 Unit Apartments | 0 (0.0%) | 17 (100.0%) |
| 5 to 9 Unit Apartments | 0 (0.0%) | 0 (0.0%) |
| 10 or more Apartments | 0 (0.0%) | 1 (100.0%) |
| Mobile Home / Other | 94 (95.9%) | 4 (4.1%) |
| Total | 646 (87.9%) | 89 (12.1%) |
Housing Structures by Number of Rooms in Jarrell
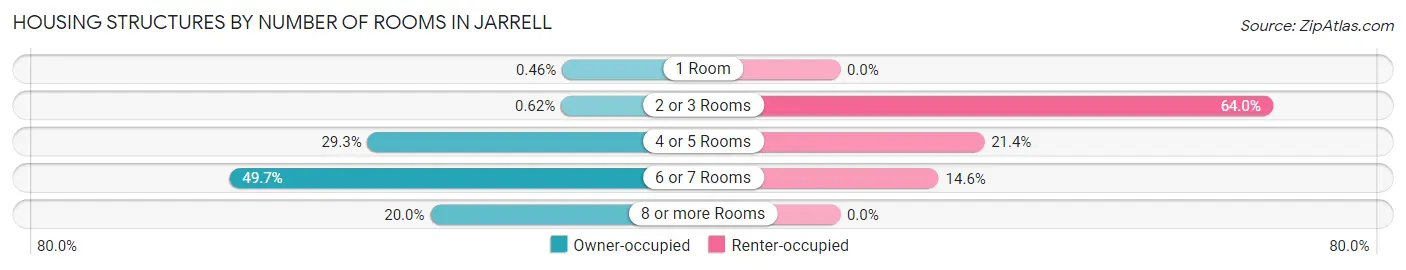
| Number of Rooms | Owner-occupied | Renter-occupied |
| 1 Room | 3 (0.5%) | 0 (0.0%) |
| 2 or 3 Rooms | 4 (0.6%) | 57 (64.0%) |
| 4 or 5 Rooms | 189 (29.3%) | 19 (21.3%) |
| 6 or 7 Rooms | 321 (49.7%) | 13 (14.6%) |
| 8 or more Rooms | 129 (20.0%) | 0 (0.0%) |
| Total | 646 (100.0%) | 89 (100.0%) |
Housing Structure by Heating Type in Jarrell
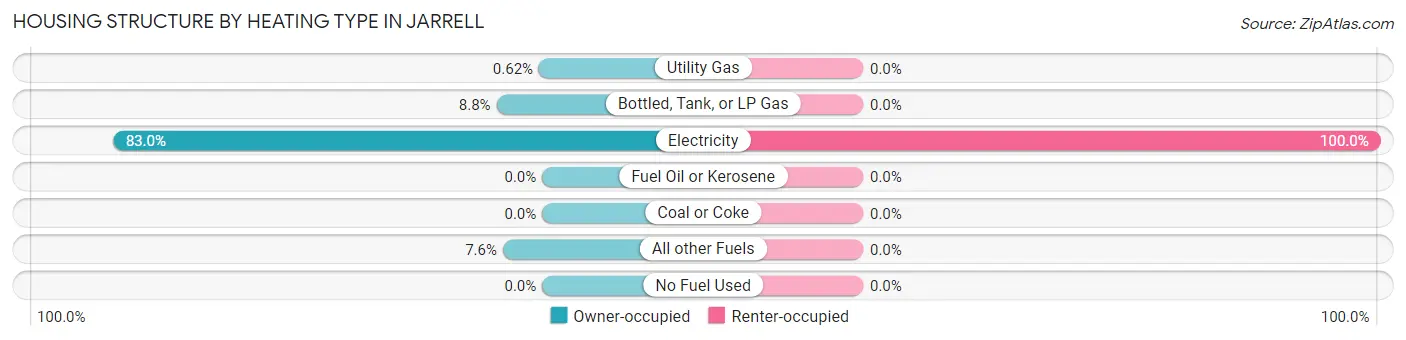
| Heating Type | Owner-occupied | Renter-occupied |
| Utility Gas | 4 (0.6%) | 0 (0.0%) |
| Bottled, Tank, or LP Gas | 57 (8.8%) | 0 (0.0%) |
| Electricity | 536 (83.0%) | 89 (100.0%) |
| Fuel Oil or Kerosene | 0 (0.0%) | 0 (0.0%) |
| Coal or Coke | 0 (0.0%) | 0 (0.0%) |
| All other Fuels | 49 (7.6%) | 0 (0.0%) |
| No Fuel Used | 0 (0.0%) | 0 (0.0%) |
| Total | 646 (100.0%) | 89 (100.0%) |
Household Vehicle Usage in Jarrell
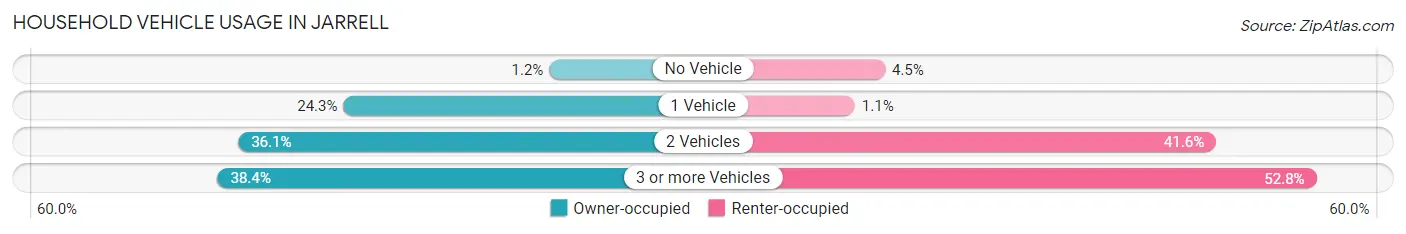
| Vehicles per Household | Owner-occupied | Renter-occupied |
| No Vehicle | 8 (1.2%) | 4 (4.5%) |
| 1 Vehicle | 157 (24.3%) | 1 (1.1%) |
| 2 Vehicles | 233 (36.1%) | 37 (41.6%) |
| 3 or more Vehicles | 248 (38.4%) | 47 (52.8%) |
| Total | 646 (100.0%) | 89 (100.0%) |
Real Estate & Mortgages in Jarrell
Real Estate and Mortgage Overview in Jarrell
| Characteristic | Without Mortgage | With Mortgage |
| Housing Units | 158 | 488 |
| Median Property Value | $228,400 | $306,200 |
| Median Household Income | $54,474 | $98 |
| Monthly Housing Costs | $705 | $4 |
| Real Estate Taxes | $3,300 | $0 |
Property Value by Mortgage Status in Jarrell
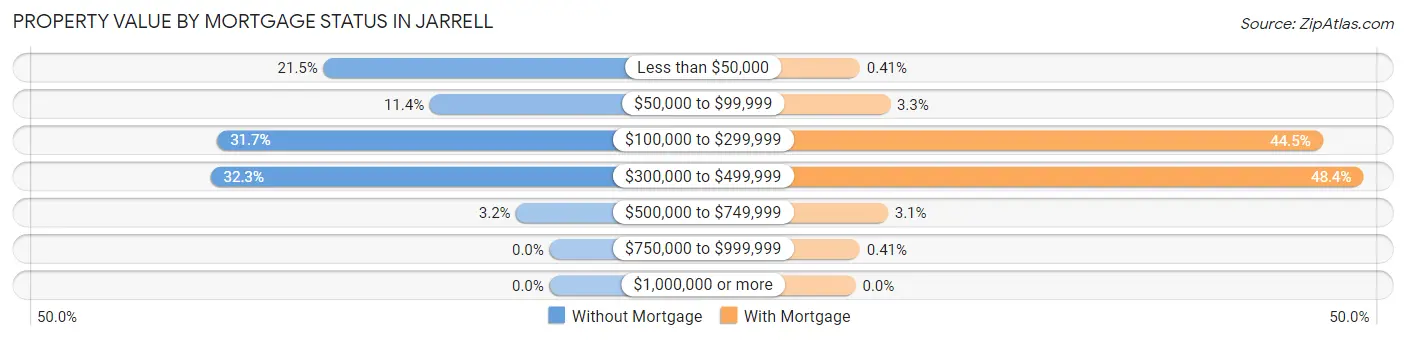
| Property Value | Without Mortgage | With Mortgage |
| Less than $50,000 | 34 (21.5%) | 2 (0.4%) |
| $50,000 to $99,999 | 18 (11.4%) | 16 (3.3%) |
| $100,000 to $299,999 | 50 (31.7%) | 217 (44.5%) |
| $300,000 to $499,999 | 51 (32.3%) | 236 (48.4%) |
| $500,000 to $749,999 | 5 (3.2%) | 15 (3.1%) |
| $750,000 to $999,999 | 0 (0.0%) | 2 (0.4%) |
| $1,000,000 or more | 0 (0.0%) | 0 (0.0%) |
| Total | 158 (100.0%) | 488 (100.0%) |
Household Income by Mortgage Status in Jarrell
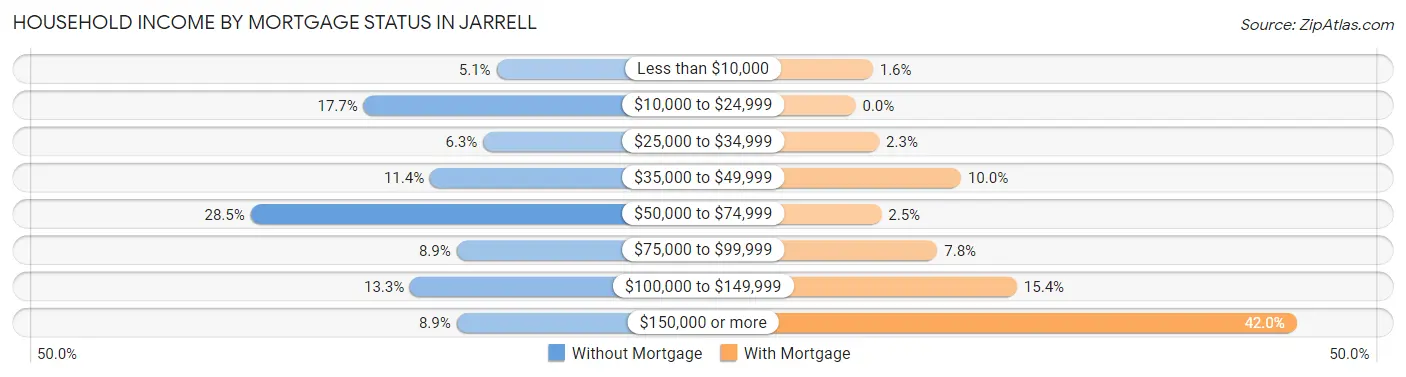
| Household Income | Without Mortgage | With Mortgage |
| Less than $10,000 | 8 (5.1%) | 8 (1.6%) |
| $10,000 to $24,999 | 28 (17.7%) | 0 (0.0%) |
| $25,000 to $34,999 | 10 (6.3%) | 11 (2.2%) |
| $35,000 to $49,999 | 18 (11.4%) | 49 (10.0%) |
| $50,000 to $74,999 | 45 (28.5%) | 12 (2.5%) |
| $75,000 to $99,999 | 14 (8.9%) | 38 (7.8%) |
| $100,000 to $149,999 | 21 (13.3%) | 75 (15.4%) |
| $150,000 or more | 14 (8.9%) | 205 (42.0%) |
| Total | 158 (100.0%) | 488 (100.0%) |
Property Value to Household Income Ratio in Jarrell
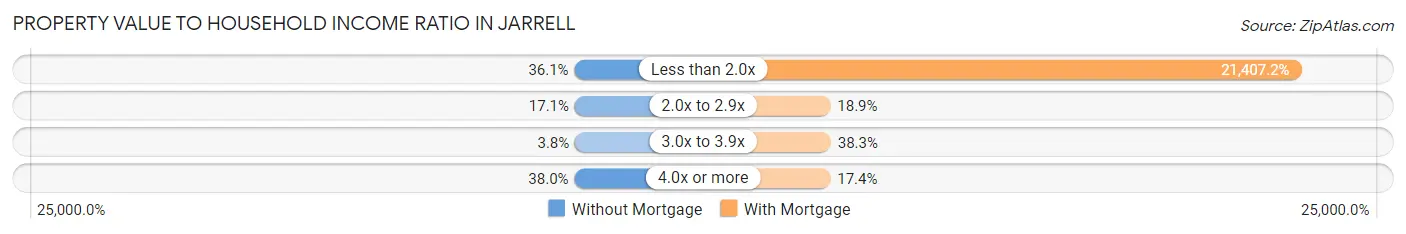
| Value-to-Income Ratio | Without Mortgage | With Mortgage |
| Less than 2.0x | 57 (36.1%) | 104,467 (21,407.2%) |
| 2.0x to 2.9x | 27 (17.1%) | 92 (18.9%) |
| 3.0x to 3.9x | 6 (3.8%) | 187 (38.3%) |
| 4.0x or more | 60 (38.0%) | 85 (17.4%) |
| Total | 158 (100.0%) | 488 (100.0%) |
Real Estate Taxes by Mortgage Status in Jarrell
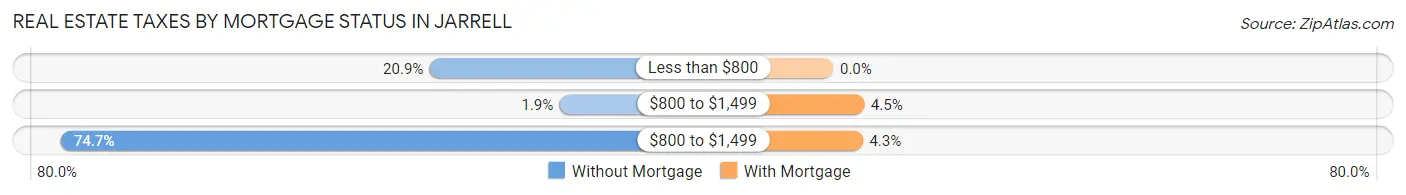
| Property Taxes | Without Mortgage | With Mortgage |
| Less than $800 | 33 (20.9%) | 0 (0.0%) |
| $800 to $1,499 | 3 (1.9%) | 22 (4.5%) |
| $800 to $1,499 | 118 (74.7%) | 21 (4.3%) |
| Total | 158 (100.0%) | 488 (100.0%) |
Health & Disability in Jarrell
Health Insurance Coverage by Age in Jarrell
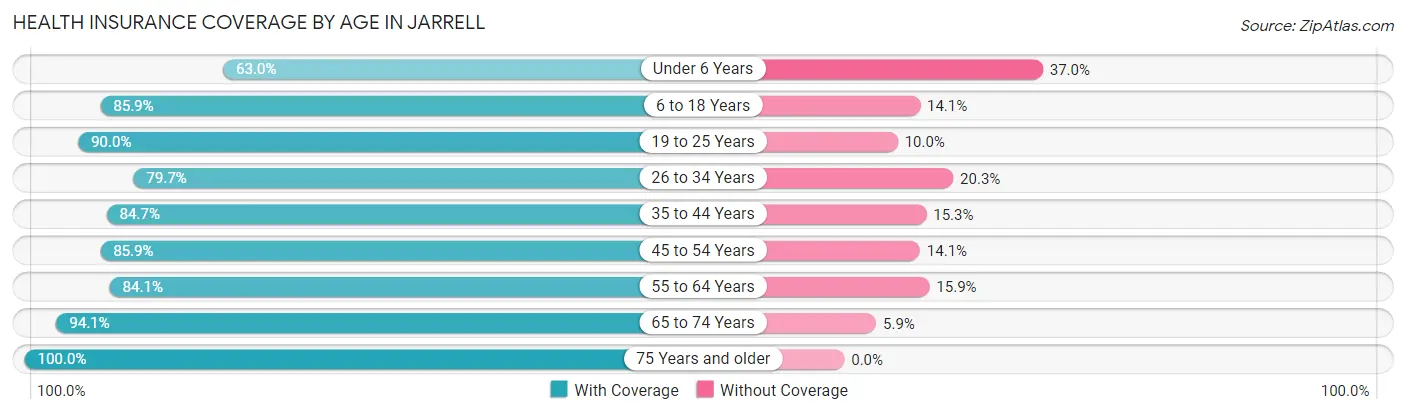
| Age Bracket | With Coverage | Without Coverage |
| Under 6 Years | 80 (63.0%) | 47 (37.0%) |
| 6 to 18 Years | 383 (85.9%) | 63 (14.1%) |
| 19 to 25 Years | 217 (90.0%) | 24 (10.0%) |
| 26 to 34 Years | 157 (79.7%) | 40 (20.3%) |
| 35 to 44 Years | 349 (84.7%) | 63 (15.3%) |
| 45 to 54 Years | 134 (85.9%) | 22 (14.1%) |
| 55 to 64 Years | 281 (84.1%) | 53 (15.9%) |
| 65 to 74 Years | 127 (94.1%) | 8 (5.9%) |
| 75 Years and older | 81 (100.0%) | 0 (0.0%) |
| Total | 1,809 (85.0%) | 320 (15.0%) |
Health Insurance Coverage by Citizenship Status in Jarrell
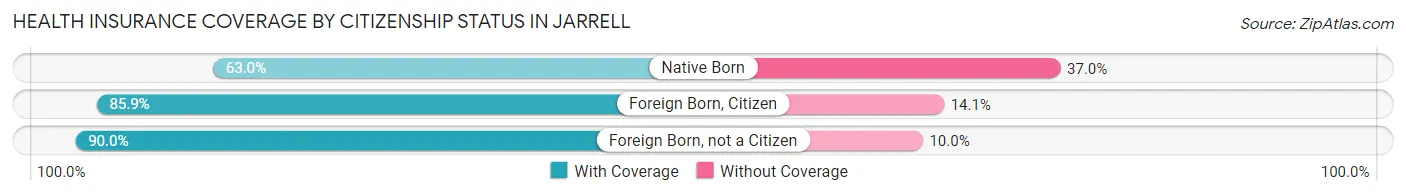
| Citizenship Status | With Coverage | Without Coverage |
| Native Born | 80 (63.0%) | 47 (37.0%) |
| Foreign Born, Citizen | 383 (85.9%) | 63 (14.1%) |
| Foreign Born, not a Citizen | 217 (90.0%) | 24 (10.0%) |
Health Insurance Coverage by Household Income in Jarrell
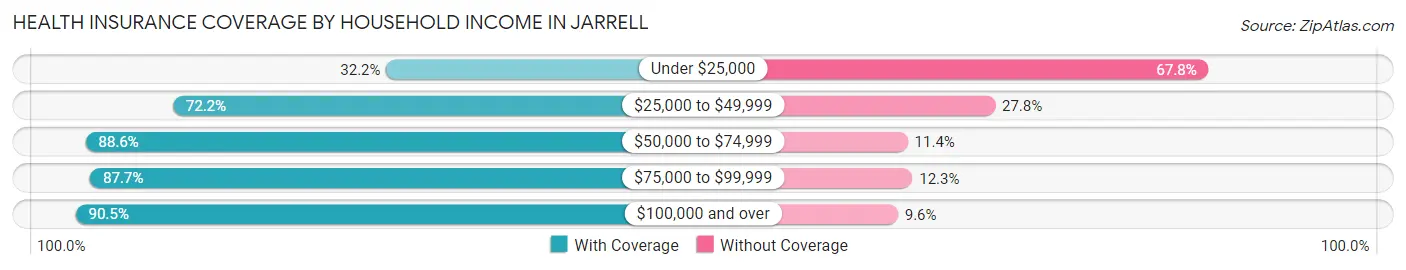
| Household Income | With Coverage | Without Coverage |
| Under $25,000 | 29 (32.2%) | 61 (67.8%) |
| $25,000 to $49,999 | 208 (72.2%) | 80 (27.8%) |
| $50,000 to $74,999 | 202 (88.6%) | 26 (11.4%) |
| $75,000 to $99,999 | 243 (87.7%) | 34 (12.3%) |
| $100,000 and over | 1,127 (90.4%) | 119 (9.6%) |
Public vs Private Health Insurance Coverage by Age in Jarrell
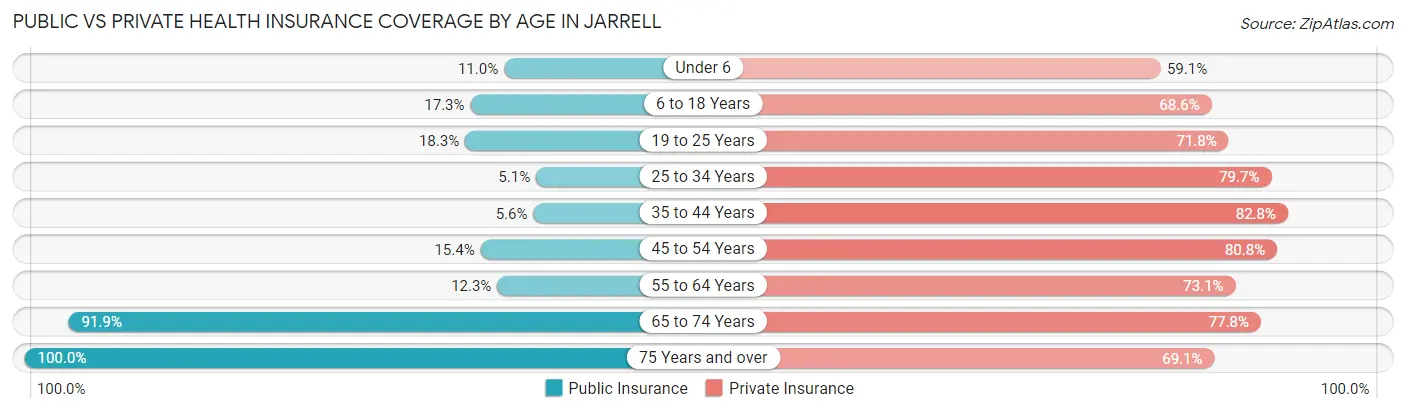
| Age Bracket | Public Insurance | Private Insurance |
| Under 6 | 14 (11.0%) | 75 (59.1%) |
| 6 to 18 Years | 77 (17.3%) | 306 (68.6%) |
| 19 to 25 Years | 44 (18.3%) | 173 (71.8%) |
| 25 to 34 Years | 10 (5.1%) | 157 (79.7%) |
| 35 to 44 Years | 23 (5.6%) | 341 (82.8%) |
| 45 to 54 Years | 24 (15.4%) | 126 (80.8%) |
| 55 to 64 Years | 41 (12.3%) | 244 (73.1%) |
| 65 to 74 Years | 124 (91.8%) | 105 (77.8%) |
| 75 Years and over | 81 (100.0%) | 56 (69.1%) |
| Total | 438 (20.6%) | 1,583 (74.4%) |
Disability Status by Sex by Age in Jarrell
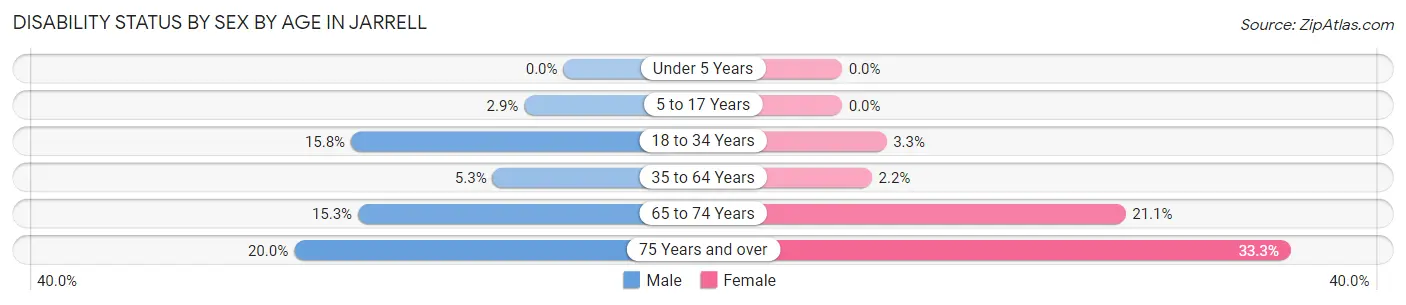
| Age Bracket | Male | Female |
| Under 5 Years | 0 (0.0%) | 0 (0.0%) |
| 5 to 17 Years | 5 (2.9%) | 0 (0.0%) |
| 18 to 34 Years | 44 (15.8%) | 6 (3.3%) |
| 35 to 64 Years | 26 (5.3%) | 9 (2.2%) |
| 65 to 74 Years | 9 (15.2%) | 16 (21.0%) |
| 75 Years and over | 9 (20.0%) | 12 (33.3%) |
Disability Class by Sex by Age in Jarrell
Disability Class: Hearing Difficulty
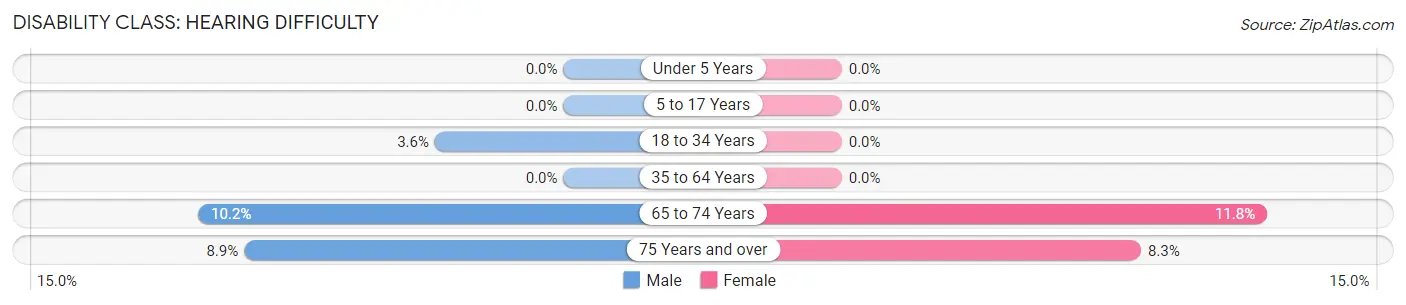
| Age Bracket | Male | Female |
| Under 5 Years | 0 (0.0%) | 0 (0.0%) |
| 5 to 17 Years | 0 (0.0%) | 0 (0.0%) |
| 18 to 34 Years | 10 (3.6%) | 0 (0.0%) |
| 35 to 64 Years | 0 (0.0%) | 0 (0.0%) |
| 65 to 74 Years | 6 (10.2%) | 9 (11.8%) |
| 75 Years and over | 4 (8.9%) | 3 (8.3%) |
Disability Class: Vision Difficulty
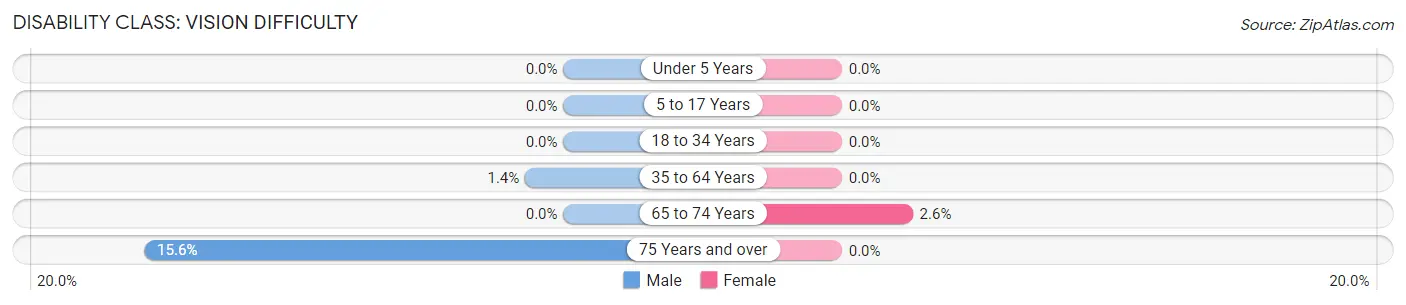
| Age Bracket | Male | Female |
| Under 5 Years | 0 (0.0%) | 0 (0.0%) |
| 5 to 17 Years | 0 (0.0%) | 0 (0.0%) |
| 18 to 34 Years | 0 (0.0%) | 0 (0.0%) |
| 35 to 64 Years | 7 (1.4%) | 0 (0.0%) |
| 65 to 74 Years | 0 (0.0%) | 2 (2.6%) |
| 75 Years and over | 7 (15.6%) | 0 (0.0%) |
Disability Class: Cognitive Difficulty
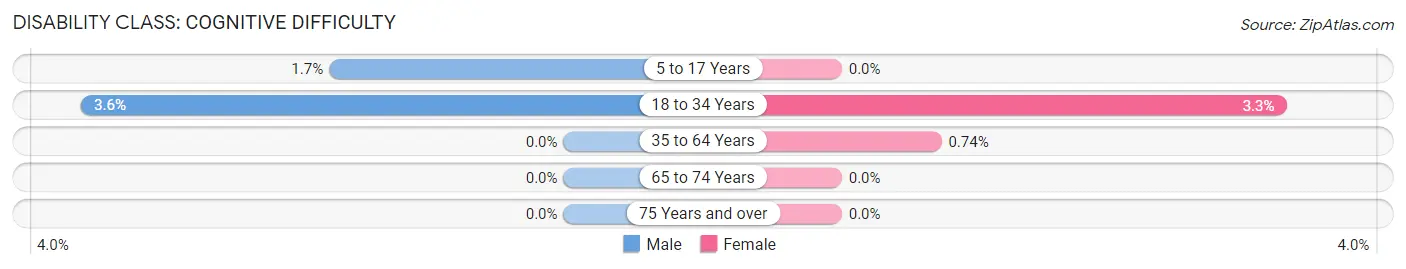
| Age Bracket | Male | Female |
| 5 to 17 Years | 3 (1.7%) | 0 (0.0%) |
| 18 to 34 Years | 10 (3.6%) | 6 (3.3%) |
| 35 to 64 Years | 0 (0.0%) | 3 (0.7%) |
| 65 to 74 Years | 0 (0.0%) | 0 (0.0%) |
| 75 Years and over | 0 (0.0%) | 0 (0.0%) |
Disability Class: Ambulatory Difficulty
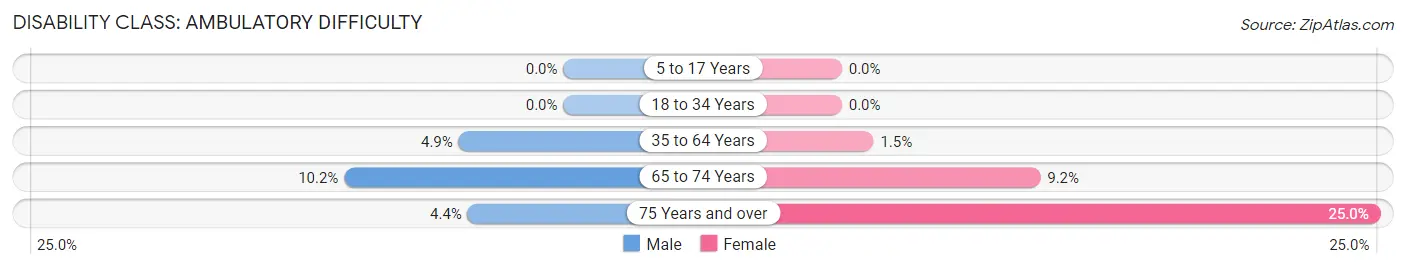
| Age Bracket | Male | Female |
| 5 to 17 Years | 0 (0.0%) | 0 (0.0%) |
| 18 to 34 Years | 0 (0.0%) | 0 (0.0%) |
| 35 to 64 Years | 24 (4.9%) | 6 (1.5%) |
| 65 to 74 Years | 6 (10.2%) | 7 (9.2%) |
| 75 Years and over | 2 (4.4%) | 9 (25.0%) |
Disability Class: Self-Care Difficulty
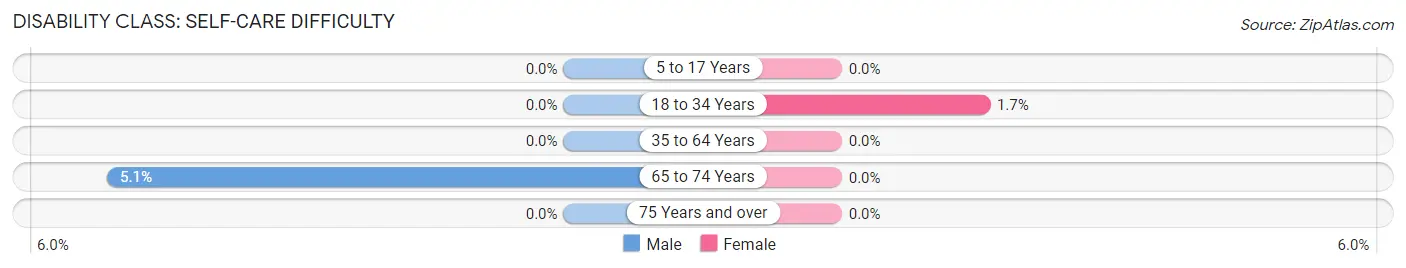
| Age Bracket | Male | Female |
| 5 to 17 Years | 0 (0.0%) | 0 (0.0%) |
| 18 to 34 Years | 0 (0.0%) | 3 (1.7%) |
| 35 to 64 Years | 0 (0.0%) | 0 (0.0%) |
| 65 to 74 Years | 3 (5.1%) | 0 (0.0%) |
| 75 Years and over | 0 (0.0%) | 0 (0.0%) |
Technology Access in Jarrell
Computing Device Access in Jarrell
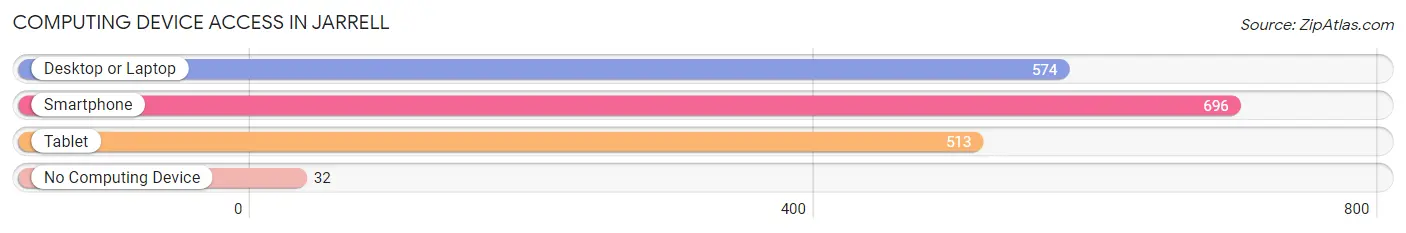
| Device Type | # Households | % Households |
| Desktop or Laptop | 574 | 78.1% |
| Smartphone | 696 | 94.7% |
| Tablet | 513 | 69.8% |
| No Computing Device | 32 | 4.3% |
| Total | 735 | 100.0% |
Internet Access in Jarrell
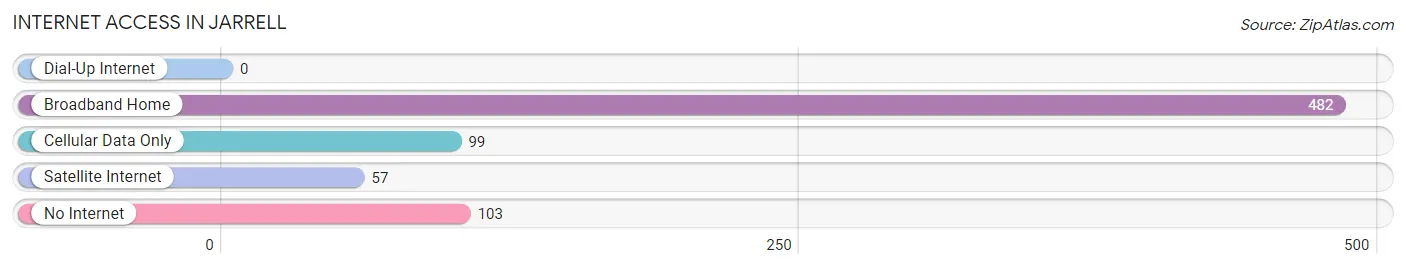
| Internet Type | # Households | % Households |
| Dial-Up Internet | 0 | 0.0% |
| Broadband Home | 482 | 65.6% |
| Cellular Data Only | 99 | 13.5% |
| Satellite Internet | 57 | 7.8% |
| No Internet | 103 | 14.0% |
| Total | 735 | 100.0% |
Jarrell Summary
Jarrell, Texas is a small town located in Williamson County, Texas, about 40 miles north of Austin. The town was founded in 1876 and has a population of 1,093 as of the 2010 census. The town is known for its rural charm and its proximity to the nearby cities of Georgetown and Round Rock.
History
Jarrell was founded in 1876 by a group of settlers from Kentucky and Tennessee. The town was named after a local rancher, William Jarrell, who owned a large amount of land in the area. The town was originally a farming community, but in the early 1900s, the railroad came through and the town began to grow. The railroad brought new businesses and industries to the area, and the town began to thrive.
In the 1920s, the town was home to a cotton gin, a blacksmith shop, a general store, and a post office. The town also had a school, which was built in 1921. The school was later renamed Jarrell High School and is still in operation today.
In the 1950s, the town began to experience a population boom as people moved to the area from other parts of the state. This growth continued into the 1960s and 1970s, and the town began to develop into a small city.
Geography
Jarrell is located in Williamson County, Texas, about 40 miles north of Austin. The town is situated on the banks of the San Gabriel River, which flows through the area. The town is surrounded by rolling hills and farmland, and is home to several parks and recreational areas.
The climate in Jarrell is generally mild, with hot summers and cool winters. The average temperature in the summer is around 90 degrees Fahrenheit, and the average temperature in the winter is around 50 degrees Fahrenheit.
Economy
The economy of Jarrell is largely based on agriculture and tourism. The town is home to several farms, which produce a variety of crops, including cotton, corn, and hay. The town is also home to several wineries, which attract tourists from all over the state.
In addition to agriculture and tourism, Jarrell is home to several small businesses, including restaurants, retail stores, and auto repair shops. The town is also home to a few manufacturing companies, which produce a variety of products, including furniture and clothing.
Demographics
As of the 2010 census, the population of Jarrell was 1,093. The racial makeup of the town was 94.3% White, 0.9% African American, 0.4% Native American, 0.2% Asian, 0.1% Pacific Islander, 2.3% from other races, and 1.8% from two or more races. Hispanic or Latino of any race were 5.2% of the population.
The median household income in Jarrell was $45,938, and the median family income was $50,625. The per capita income in the town was $20,945. About 11.2% of the population was below the poverty line.
Jarrell is a small town with a rich history and a vibrant economy. The town is home to a variety of businesses and industries, and is a popular destination for tourists from all over the state. The town is also home to a diverse population, with a variety of racial and ethnic backgrounds.
Common Questions
What is Per Capita Income in Jarrell?
Per Capita income in Jarrell is $36,682.
What is the Median Family Income in Jarrell?
Median Family Income in Jarrell is $103,411.
What is the Median Household income in Jarrell?
Median Household Income in Jarrell is $103,017.
What is Income or Wage Gap in Jarrell?
Income or Wage Gap in Jarrell is 27.7%.
Women in Jarrell earn 72.3 cents for every dollar earned by a man.
What is Inequality or Gini Index in Jarrell?
Inequality or Gini Index in Jarrell is 0.34.
What is the Total Population of Jarrell?
Total Population of Jarrell is 2,132.
What is the Total Male Population of Jarrell?
Total Male Population of Jarrell is 1,075.
What is the Total Female Population of Jarrell?
Total Female Population of Jarrell is 1,057.
What is the Ratio of Males per 100 Females in Jarrell?
There are 101.70 Males per 100 Females in Jarrell.
What is the Ratio of Females per 100 Males in Jarrell?
There are 98.33 Females per 100 Males in Jarrell.
What is the Median Population Age in Jarrell?
Median Population Age in Jarrell is 36.3 Years.
What is the Average Family Size in Jarrell
Average Family Size in Jarrell is 3.1 People.
What is the Average Household Size in Jarrell
Average Household Size in Jarrell is 2.9 People.
How Large is the Labor Force in Jarrell?
There are 1,284 People in the Labor Forcein in Jarrell.
What is the Percentage of People in the Labor Force in Jarrell?
76.6% of People are in the Labor Force in Jarrell.
What is the Unemployment Rate in Jarrell?
Unemployment Rate in Jarrell is 3.1%.