Iowa Park, TX Map & Demographics
Iowa Park Map
Iowa Park Overview
$34,128
PER CAPITA INCOME
$87,135
AVG FAMILY INCOME
$61,667
AVG HOUSEHOLD INCOME
30.5%
WAGE / INCOME GAP [ % ]
69.5¢/ $1
WAGE / INCOME GAP [ $ ]
0.40
INEQUALITY / GINI INDEX
6,529
TOTAL POPULATION
3,134
MALE POPULATION
3,395
FEMALE POPULATION
92.31
MALES / 100 FEMALES
108.33
FEMALES / 100 MALES
40.2
MEDIAN AGE
3.1
AVG FAMILY SIZE
2.4
AVG HOUSEHOLD SIZE
3,760
LABOR FORCE [ PEOPLE ]
73.9%
PERCENT IN LABOR FORCE
1.8%
UNEMPLOYMENT RATE
Iowa Park Zip Codes
Iowa Park Area Codes
Income in Iowa Park
Income Overview in Iowa Park
Per Capita Income in Iowa Park is $34,128, while median incomes of families and households are $87,135 and $61,667 respectively.
| Characteristic | Number | Measure |
| Per Capita Income | 6,529 | $34,128 |
| Median Family Income | 1,645 | $87,135 |
| Mean Family Income | 1,645 | $98,815 |
| Median Household Income | 2,732 | $61,667 |
| Mean Household Income | 2,732 | $80,266 |
| Income Deficit | 1,645 | $0 |
| Wage / Income Gap (%) | 6,529 | 30.49% |
| Wage / Income Gap ($) | 6,529 | 69.51¢ per $1 |
| Gini / Inequality Index | 6,529 | 0.40 |
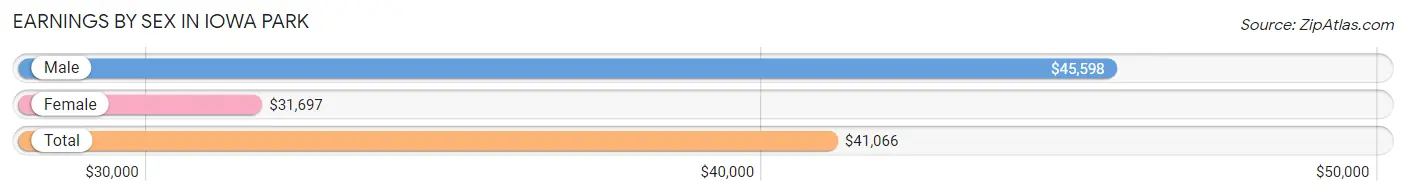
Earnings by Sex in Iowa Park
Average Earnings in Iowa Park are $41,066, $45,598 for men and $31,697 for women, a difference of 30.5%.
| Sex | Number | Average Earnings |
| Male | 1,873 (48.3%) | $45,598 |
| Female | 2,005 (51.7%) | $31,697 |
| Total | 3,878 (100.0%) | $41,066 |
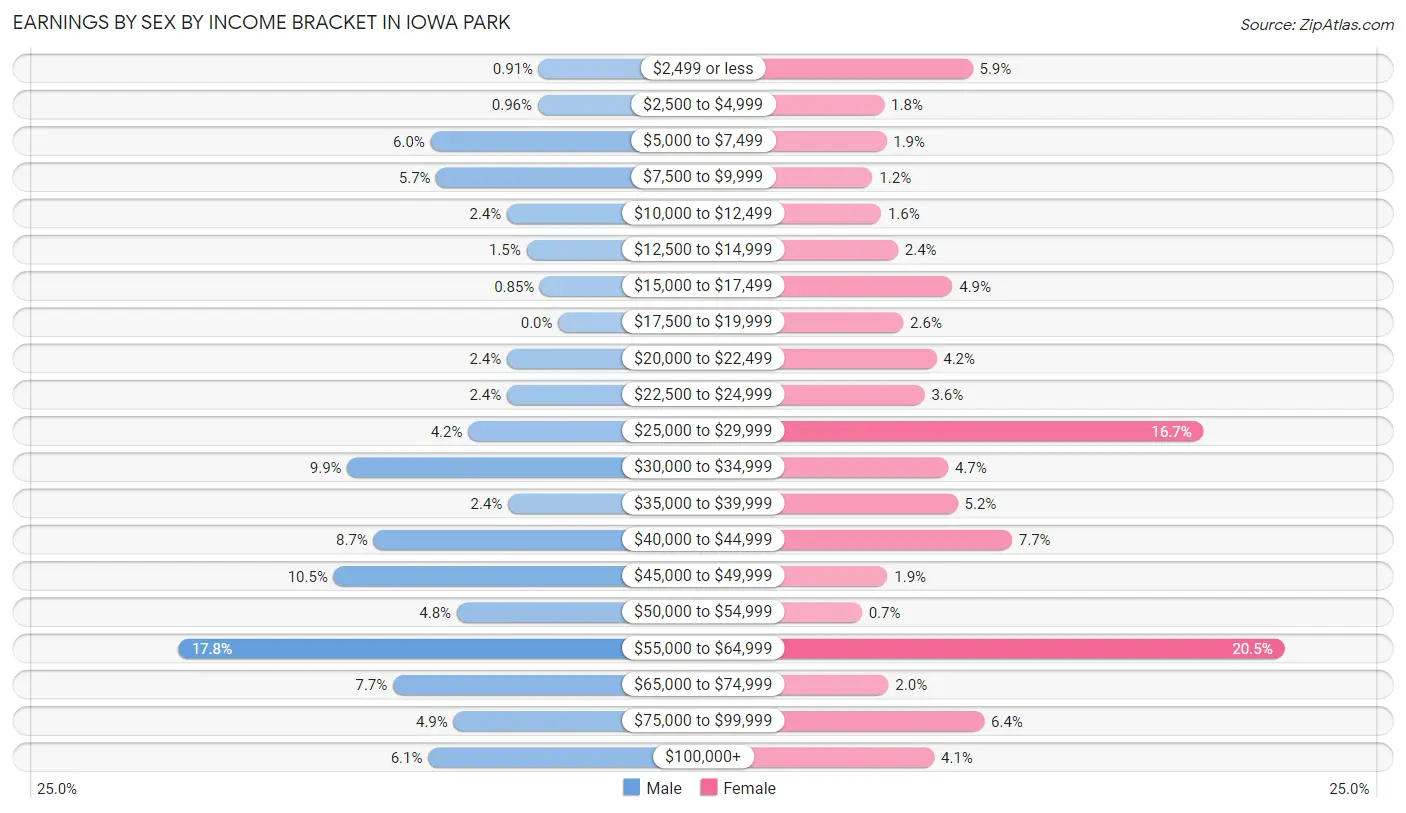
Earnings by Sex by Income Bracket in Iowa Park
The most common earnings brackets in Iowa Park are $55,000 to $64,999 for men (333 | 17.8%) and $55,000 to $64,999 for women (411 | 20.5%).
| Income | Male | Female |
| $2,499 or less | 17 (0.9%) | 118 (5.9%) |
| $2,500 to $4,999 | 18 (1.0%) | 35 (1.8%) |
| $5,000 to $7,499 | 112 (6.0%) | 37 (1.8%) |
| $7,500 to $9,999 | 107 (5.7%) | 24 (1.2%) |
| $10,000 to $12,499 | 45 (2.4%) | 32 (1.6%) |
| $12,500 to $14,999 | 28 (1.5%) | 48 (2.4%) |
| $15,000 to $17,499 | 16 (0.9%) | 99 (4.9%) |
| $17,500 to $19,999 | 0 (0.0%) | 53 (2.6%) |
| $20,000 to $22,499 | 45 (2.4%) | 84 (4.2%) |
| $22,500 to $24,999 | 45 (2.4%) | 73 (3.6%) |
| $25,000 to $29,999 | 79 (4.2%) | 335 (16.7%) |
| $30,000 to $34,999 | 185 (9.9%) | 95 (4.7%) |
| $35,000 to $39,999 | 44 (2.4%) | 104 (5.2%) |
| $40,000 to $44,999 | 162 (8.6%) | 155 (7.7%) |
| $45,000 to $49,999 | 197 (10.5%) | 38 (1.9%) |
| $50,000 to $54,999 | 89 (4.8%) | 14 (0.7%) |
| $55,000 to $64,999 | 333 (17.8%) | 411 (20.5%) |
| $65,000 to $74,999 | 145 (7.7%) | 39 (1.9%) |
| $75,000 to $99,999 | 92 (4.9%) | 129 (6.4%) |
| $100,000+ | 114 (6.1%) | 82 (4.1%) |
| Total | 1,873 (100.0%) | 2,005 (100.0%) |
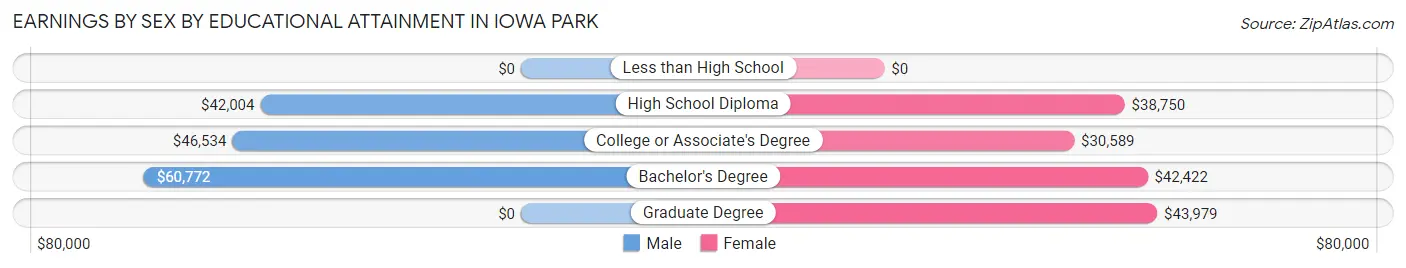
Earnings by Sex by Educational Attainment in Iowa Park
Average earnings in Iowa Park are $46,116 for men and $38,831 for women, a difference of 15.8%. Men with an educational attainment of bachelor's degree enjoy the highest average annual earnings of $60,772, while those with high school diploma education earn the least with $42,004. Women with an educational attainment of graduate degree earn the most with the average annual earnings of $43,979, while those with college or associate's degree education have the smallest earnings of $30,589.
| Educational Attainment | Male Income | Female Income |
| Less than High School | - | - |
| High School Diploma | $42,004 | $38,750 |
| College or Associate's Degree | $46,534 | $30,589 |
| Bachelor's Degree | $60,772 | $42,422 |
| Graduate Degree | - | - |
| Total | $46,116 | $38,831 |
Family Income in Iowa Park
Family Income Brackets in Iowa Park
According to the Iowa Park family income data, there are 326 families falling into the $100,000 to $149,999 income range, which is the most common income bracket and makes up 19.8% of all families.
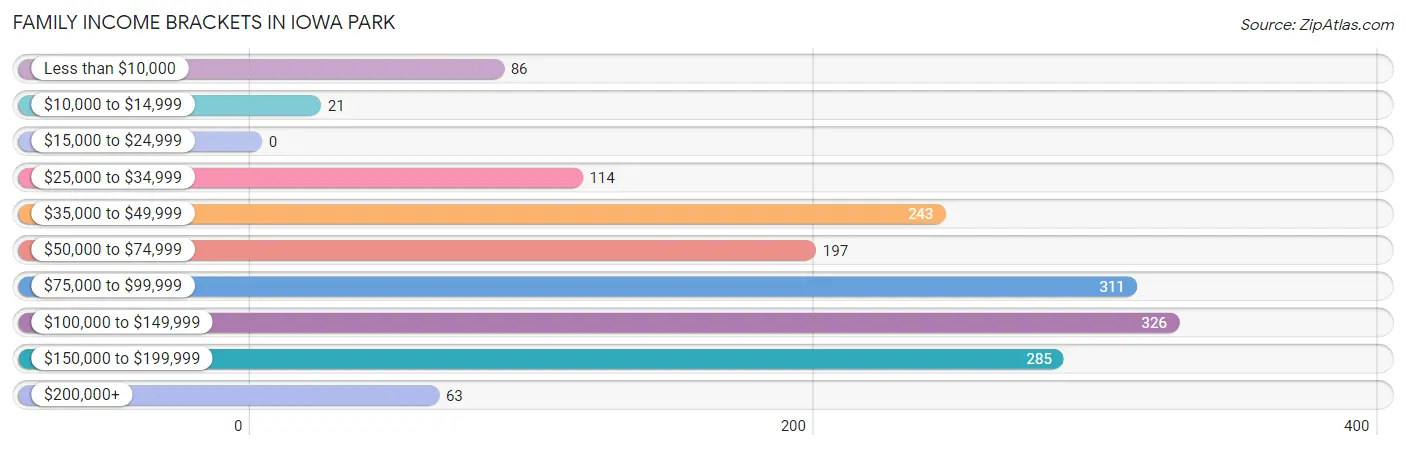
| Income Bracket | # Families | % Families |
| Less than $10,000 | 86 | 5.2% |
| $10,000 to $14,999 | 21 | 1.3% |
| $15,000 to $24,999 | 0 | 0.0% |
| $25,000 to $34,999 | 114 | 6.9% |
| $35,000 to $49,999 | 243 | 14.8% |
| $50,000 to $74,999 | 197 | 12.0% |
| $75,000 to $99,999 | 311 | 18.9% |
| $100,000 to $149,999 | 326 | 19.8% |
| $150,000 to $199,999 | 285 | 17.3% |
| $200,000+ | 63 | 3.8% |
Family Income by Famaliy Size in Iowa Park
2-person families (724 | 44.0%) account for the highest median family income in Iowa Park with $94,063 per family, while 2-person families (724 | 44.0%) have the highest median income of $47,032 per family member.
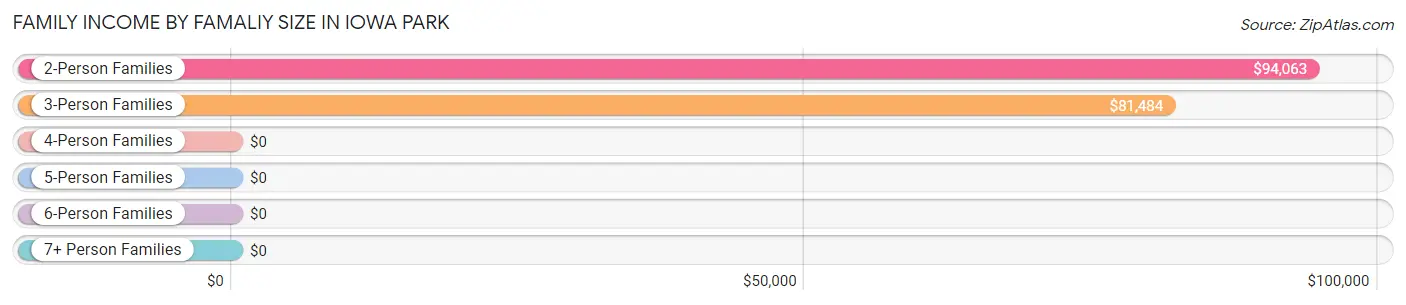
| Income Bracket | # Families | Median Income |
| 2-Person Families | 724 (44.0%) | $94,063 |
| 3-Person Families | 451 (27.4%) | $81,484 |
| 4-Person Families | 283 (17.2%) | $0 |
| 5-Person Families | 131 (8.0%) | $0 |
| 6-Person Families | 0 (0.0%) | $0 |
| 7+ Person Families | 56 (3.4%) | $0 |
| Total | 1,645 (100.0%) | $87,135 |
Family Income by Number of Earners in Iowa Park
The median family income in Iowa Park is $87,135, with families comprising 3+ earners (205) having the highest median family income of $180,014, while families with no earners (140) have the lowest median family income of $41,983, accounting for 12.5% and 8.5% of families, respectively.
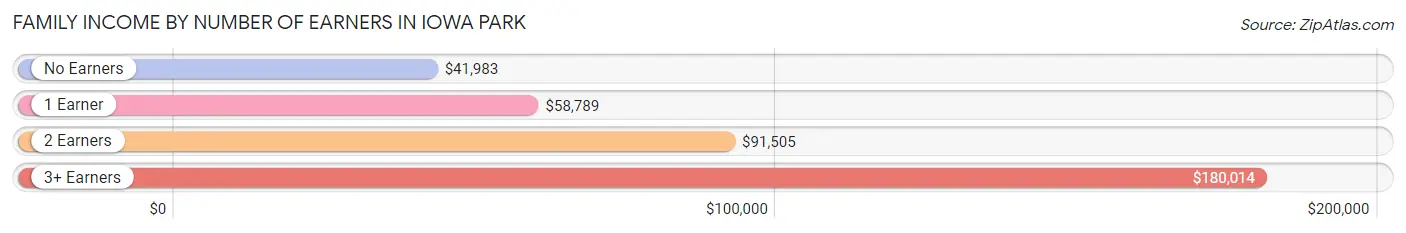
| Number of Earners | # Families | Median Income |
| No Earners | 140 (8.5%) | $41,983 |
| 1 Earner | 457 (27.8%) | $58,789 |
| 2 Earners | 843 (51.2%) | $91,505 |
| 3+ Earners | 205 (12.5%) | $180,014 |
| Total | 1,645 (100.0%) | $87,135 |
Household Income in Iowa Park
Household Income Brackets in Iowa Park
With 647 households falling in the category, the $50,000 to $74,999 income range is the most frequent in Iowa Park, accounting for 23.7% of all households. In contrast, only 46 households (1.7%) fall into the $10,000 to $14,999 income bracket, making it the least populous group.
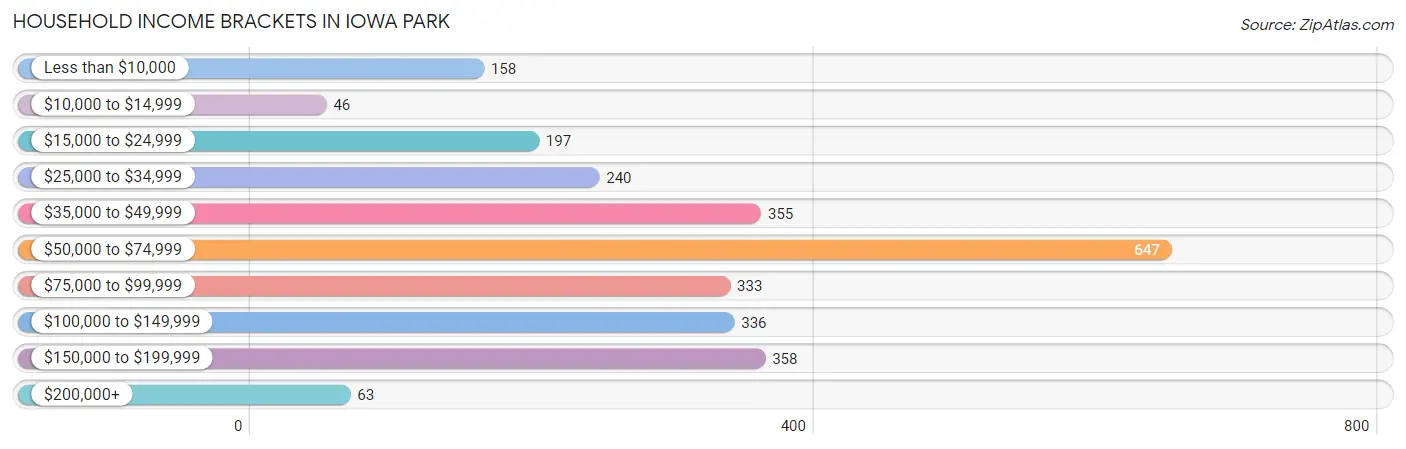
| Income Bracket | # Households | % Households |
| Less than $10,000 | 158 | 5.8% |
| $10,000 to $14,999 | 46 | 1.7% |
| $15,000 to $24,999 | 197 | 7.2% |
| $25,000 to $34,999 | 240 | 8.8% |
| $35,000 to $49,999 | 355 | 13.0% |
| $50,000 to $74,999 | 647 | 23.7% |
| $75,000 to $99,999 | 333 | 12.2% |
| $100,000 to $149,999 | 336 | 12.3% |
| $150,000 to $199,999 | 358 | 13.1% |
| $200,000+ | 63 | 2.3% |
Household Income by Householder Age in Iowa Park
The median household income in Iowa Park is $61,667, with the highest median household income of $92,734 found in the 45 to 64 years age bracket for the primary householder. A total of 994 households (36.4%) fall into this category. Meanwhile, the 15 to 24 years age bracket for the primary householder has the lowest median household income of $0, with 20 households (0.7%) in this group.
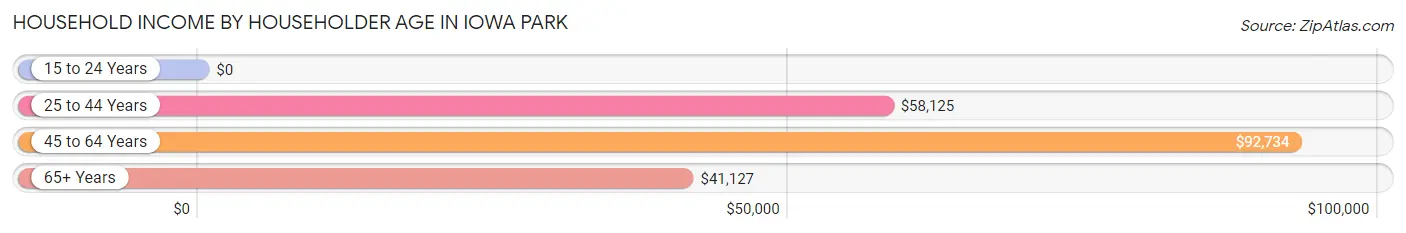
| Income Bracket | # Households | Median Income |
| 15 to 24 Years | 20 (0.7%) | $0 |
| 25 to 44 Years | 906 (33.2%) | $58,125 |
| 45 to 64 Years | 994 (36.4%) | $92,734 |
| 65+ Years | 812 (29.7%) | $41,127 |
| Total | 2,732 (100.0%) | $61,667 |
Poverty in Iowa Park
Income Below Poverty by Sex and Age in Iowa Park
With 4.6% poverty level for males and 8.5% for females among the residents of Iowa Park, under 5 year old males and 12 to 14 year old females are the most vulnerable to poverty, with 61 males (24.4%) and 45 females (49.4%) in their respective age groups living below the poverty level.
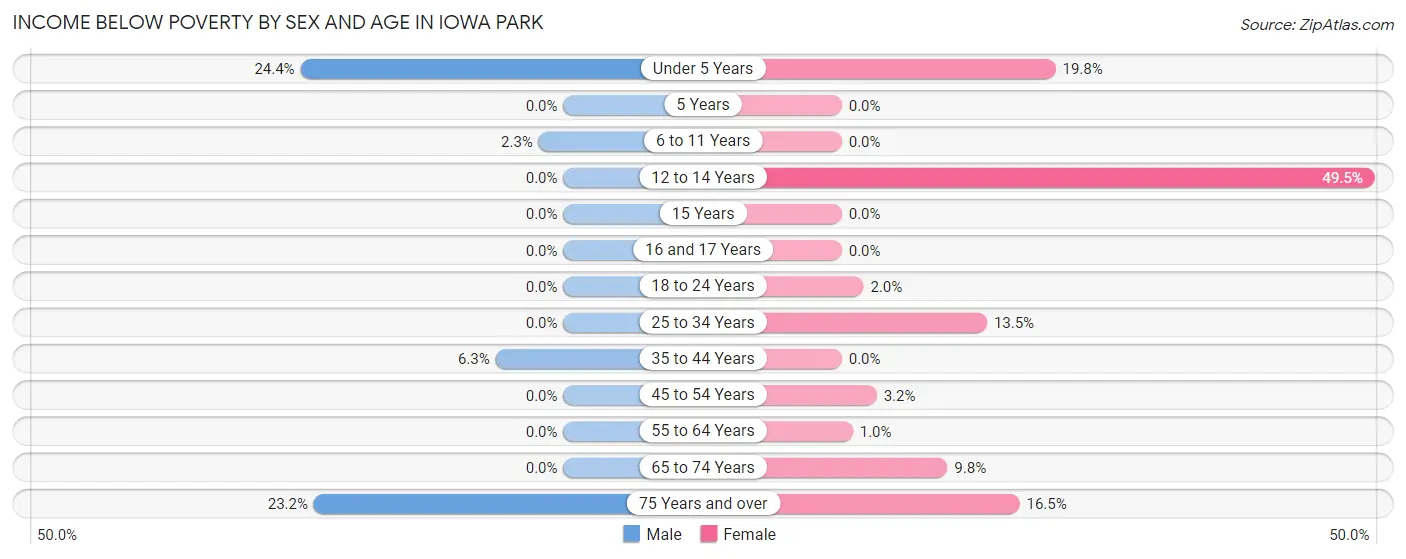
| Age Bracket | Male | Female |
| Under 5 Years | 61 (24.4%) | 49 (19.8%) |
| 5 Years | 0 (0.0%) | 0 (0.0%) |
| 6 to 11 Years | 10 (2.3%) | 0 (0.0%) |
| 12 to 14 Years | 0 (0.0%) | 45 (49.4%) |
| 15 Years | 0 (0.0%) | 0 (0.0%) |
| 16 and 17 Years | 0 (0.0%) | 0 (0.0%) |
| 18 to 24 Years | 0 (0.0%) | 5 (2.0%) |
| 25 to 34 Years | 0 (0.0%) | 68 (13.5%) |
| 35 to 44 Years | 29 (6.3%) | 0 (0.0%) |
| 45 to 54 Years | 0 (0.0%) | 19 (3.2%) |
| 55 to 64 Years | 0 (0.0%) | 4 (1.0%) |
| 65 to 74 Years | 0 (0.0%) | 30 (9.8%) |
| 75 Years and over | 41 (23.2%) | 67 (16.5%) |
| Total | 141 (4.6%) | 287 (8.5%) |
Income Above Poverty by Sex and Age in Iowa Park
According to the poverty statistics in Iowa Park, males aged 5 years and females aged 5 years are the age groups that are most secure financially, with 100.0% of males and 100.0% of females in these age groups living above the poverty line.
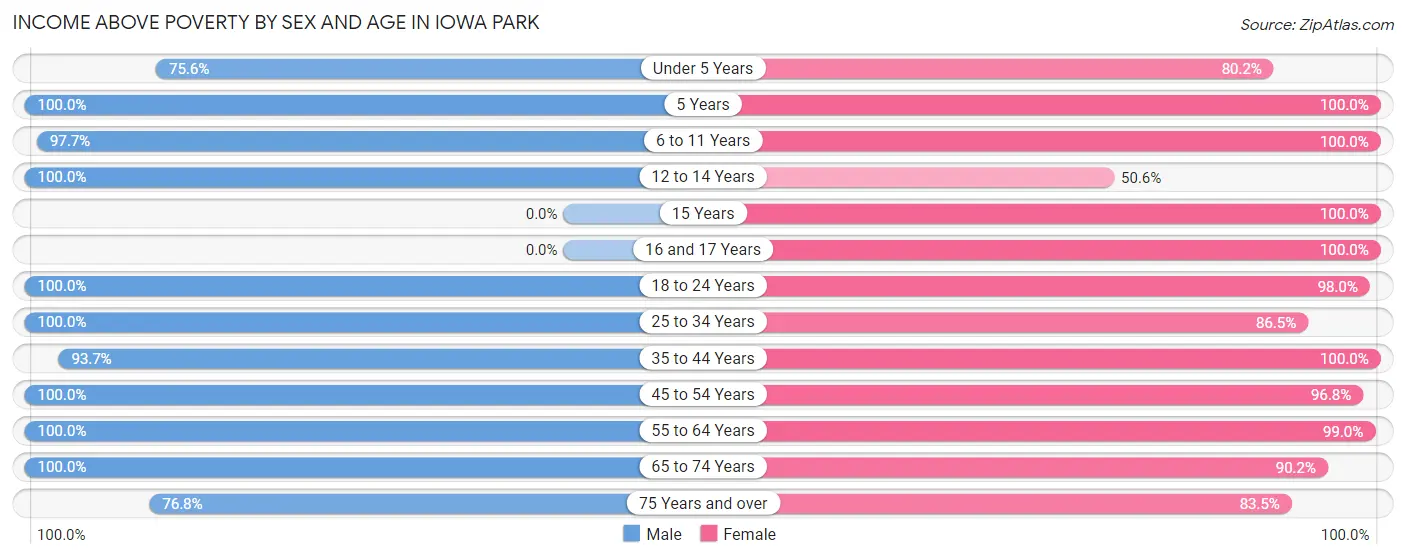
| Age Bracket | Male | Female |
| Under 5 Years | 189 (75.6%) | 198 (80.2%) |
| 5 Years | 65 (100.0%) | 55 (100.0%) |
| 6 to 11 Years | 427 (97.7%) | 192 (100.0%) |
| 12 to 14 Years | 44 (100.0%) | 46 (50.5%) |
| 15 Years | 0 (0.0%) | 11 (100.0%) |
| 16 and 17 Years | 0 (0.0%) | 26 (100.0%) |
| 18 to 24 Years | 298 (100.0%) | 244 (98.0%) |
| 25 to 34 Years | 344 (100.0%) | 437 (86.5%) |
| 35 to 44 Years | 432 (93.7%) | 303 (100.0%) |
| 45 to 54 Years | 267 (100.0%) | 567 (96.8%) |
| 55 to 64 Years | 516 (100.0%) | 387 (99.0%) |
| 65 to 74 Years | 220 (100.0%) | 276 (90.2%) |
| 75 Years and over | 136 (76.8%) | 339 (83.5%) |
| Total | 2,938 (95.4%) | 3,081 (91.5%) |
Income Below Poverty Among Married-Couple Families in Iowa Park
The poverty statistics for married-couple families in Iowa Park show that 1.5% or 18 of the total 1,185 families live below the poverty line. Families with 1 or 2 children have the highest poverty rate of 4.2%, comprising of 18 families. On the other hand, families with no children have the lowest poverty rate of 0.0%, which includes 0 families.
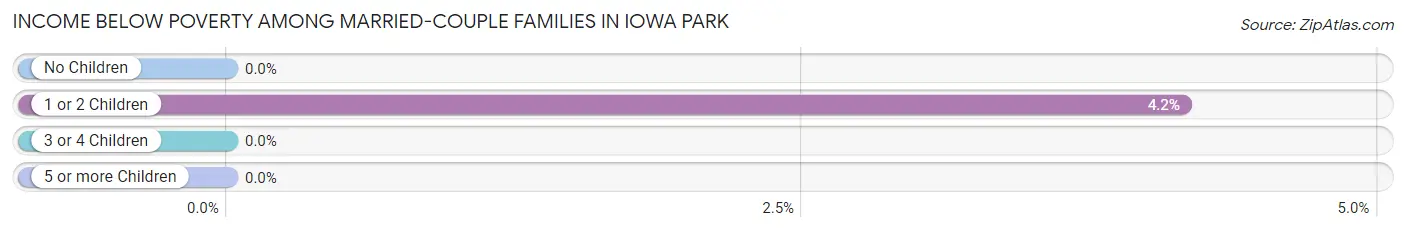
| Children | Above Poverty | Below Poverty |
| No Children | 662 (100.0%) | 0 (0.0%) |
| 1 or 2 Children | 416 (95.9%) | 18 (4.2%) |
| 3 or 4 Children | 89 (100.0%) | 0 (0.0%) |
| 5 or more Children | 0 (0.0%) | 0 (0.0%) |
| Total | 1,167 (98.5%) | 18 (1.5%) |
Income Below Poverty Among Single-Parent Households in Iowa Park
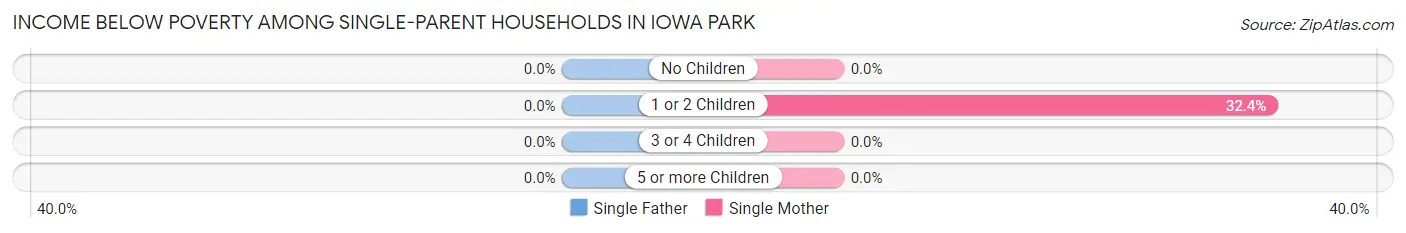
| Children | Single Father | Single Mother |
| No Children | 0 (0.0%) | 0 (0.0%) |
| 1 or 2 Children | 0 (0.0%) | 89 (32.4%) |
| 3 or 4 Children | 0 (0.0%) | 0 (0.0%) |
| 5 or more Children | 0 (0.0%) | 0 (0.0%) |
| Total | 0 (0.0%) | 89 (19.9%) |
Income Below Poverty Among Married-Couple vs Single-Parent Households in Iowa Park
The poverty data for Iowa Park shows that 18 of the married-couple family households (1.5%) and 89 of the single-parent households (19.4%) are living below the poverty level. Within the married-couple family households, those with 1 or 2 children have the highest poverty rate, with 18 households (4.2%) falling below the poverty line. Among the single-parent households, those with 1 or 2 children have the highest poverty rate, with 89 household (30.9%) living below poverty.
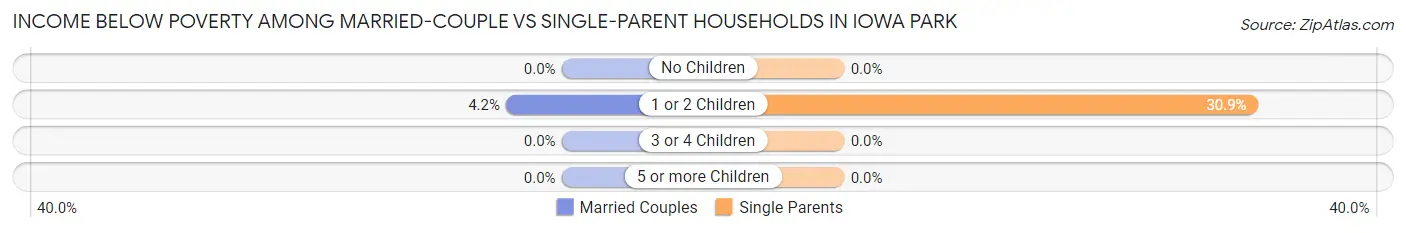
| Children | Married-Couple Families | Single-Parent Households |
| No Children | 0 (0.0%) | 0 (0.0%) |
| 1 or 2 Children | 18 (4.2%) | 89 (30.9%) |
| 3 or 4 Children | 0 (0.0%) | 0 (0.0%) |
| 5 or more Children | 0 (0.0%) | 0 (0.0%) |
| Total | 18 (1.5%) | 89 (19.4%) |
Race in Iowa Park
The most populous races in Iowa Park are White / Caucasian (5,980 | 91.6%), Hispanic or Latino (780 | 11.9%), and Two or more Races (428 | 6.6%).
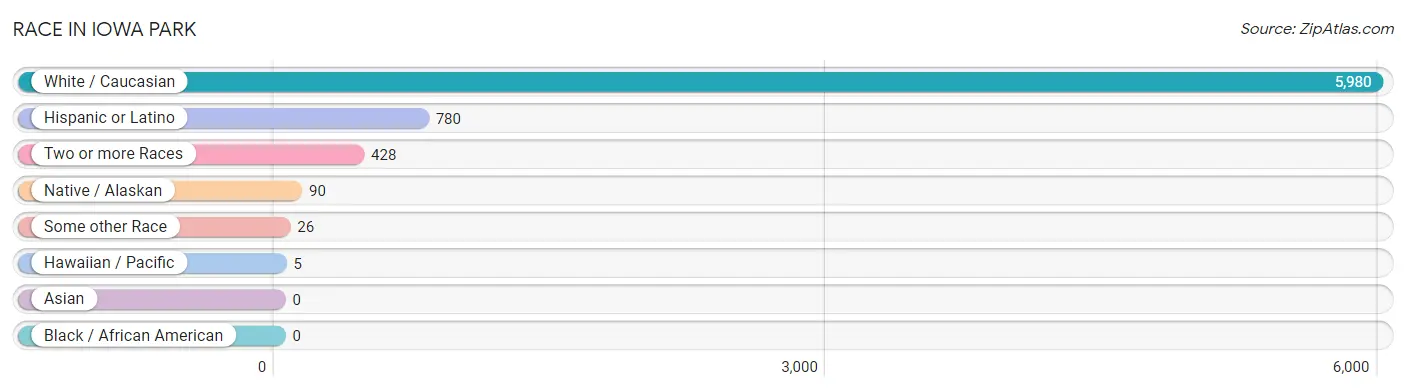
| Race | # Population | % Population |
| Asian | 0 | 0.0% |
| Black / African American | 0 | 0.0% |
| Hawaiian / Pacific | 5 | 0.1% |
| Hispanic or Latino | 780 | 11.9% |
| Native / Alaskan | 90 | 1.4% |
| White / Caucasian | 5,980 | 91.6% |
| Two or more Races | 428 | 6.6% |
| Some other Race | 26 | 0.4% |
| Total | 6,529 | 100.0% |
Ancestry in Iowa Park
The most populous ancestries reported in Iowa Park are German (1,235 | 18.9%), English (760 | 11.6%), American (586 | 9.0%), Mexican (577 | 8.8%), and Irish (444 | 6.8%), together accounting for 55.2% of all Iowa Park residents.
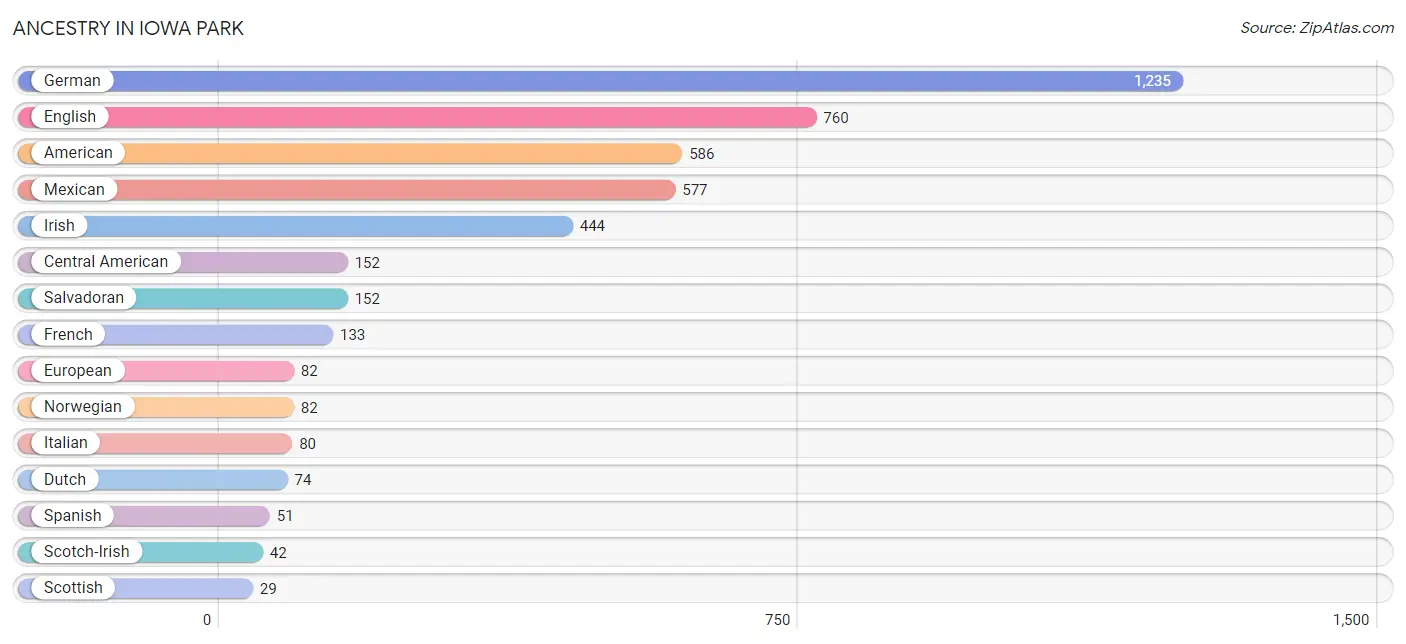
| Ancestry | # Population | % Population |
| American | 586 | 9.0% |
| Austrian | 12 | 0.2% |
| Blackfeet | 20 | 0.3% |
| British | 11 | 0.2% |
| Central American | 152 | 2.3% |
| Cherokee | 5 | 0.1% |
| Chickasaw | 6 | 0.1% |
| Dutch | 74 | 1.1% |
| English | 760 | 11.6% |
| European | 82 | 1.3% |
| French | 133 | 2.0% |
| French Canadian | 15 | 0.2% |
| German | 1,235 | 18.9% |
| Irish | 444 | 6.8% |
| Italian | 80 | 1.2% |
| Mexican | 577 | 8.8% |
| Native Hawaiian | 5 | 0.1% |
| Northern European | 27 | 0.4% |
| Norwegian | 82 | 1.3% |
| Salvadoran | 152 | 2.3% |
| Scandinavian | 24 | 0.4% |
| Scotch-Irish | 42 | 0.6% |
| Scottish | 29 | 0.4% |
| Spanish | 51 | 0.8% |
| Swedish | 15 | 0.2% | View All 25 Rows |
Immigrants in Iowa Park
The most numerous immigrant groups reported in Iowa Park came from Central America (84 | 1.3%), El Salvador (84 | 1.3%), Latin America (84 | 1.3%), Czechoslovakia (23 | 0.4%), and Eastern Europe (23 | 0.4%), together accounting for 4.6% of all Iowa Park residents.
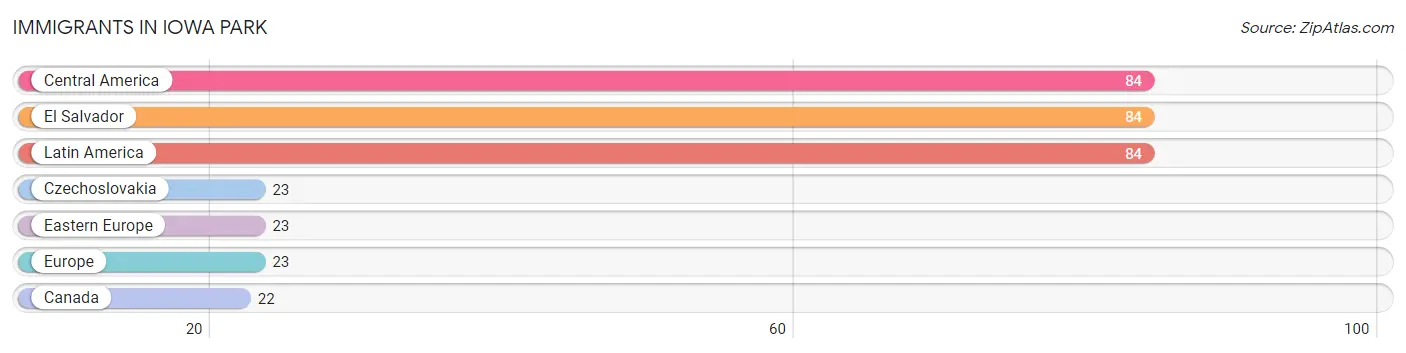
| Immigration Origin | # Population | % Population |
| Canada | 22 | 0.3% |
| Central America | 84 | 1.3% |
| Czechoslovakia | 23 | 0.4% |
| Eastern Europe | 23 | 0.4% |
| El Salvador | 84 | 1.3% |
| Europe | 23 | 0.4% |
| Latin America | 84 | 1.3% | View All 7 Rows |
Sex and Age in Iowa Park
Sex and Age in Iowa Park
The most populous age groups in Iowa Park are 5 to 9 Years (443 | 14.1%) for men and 50 to 54 Years (438 | 12.9%) for women.
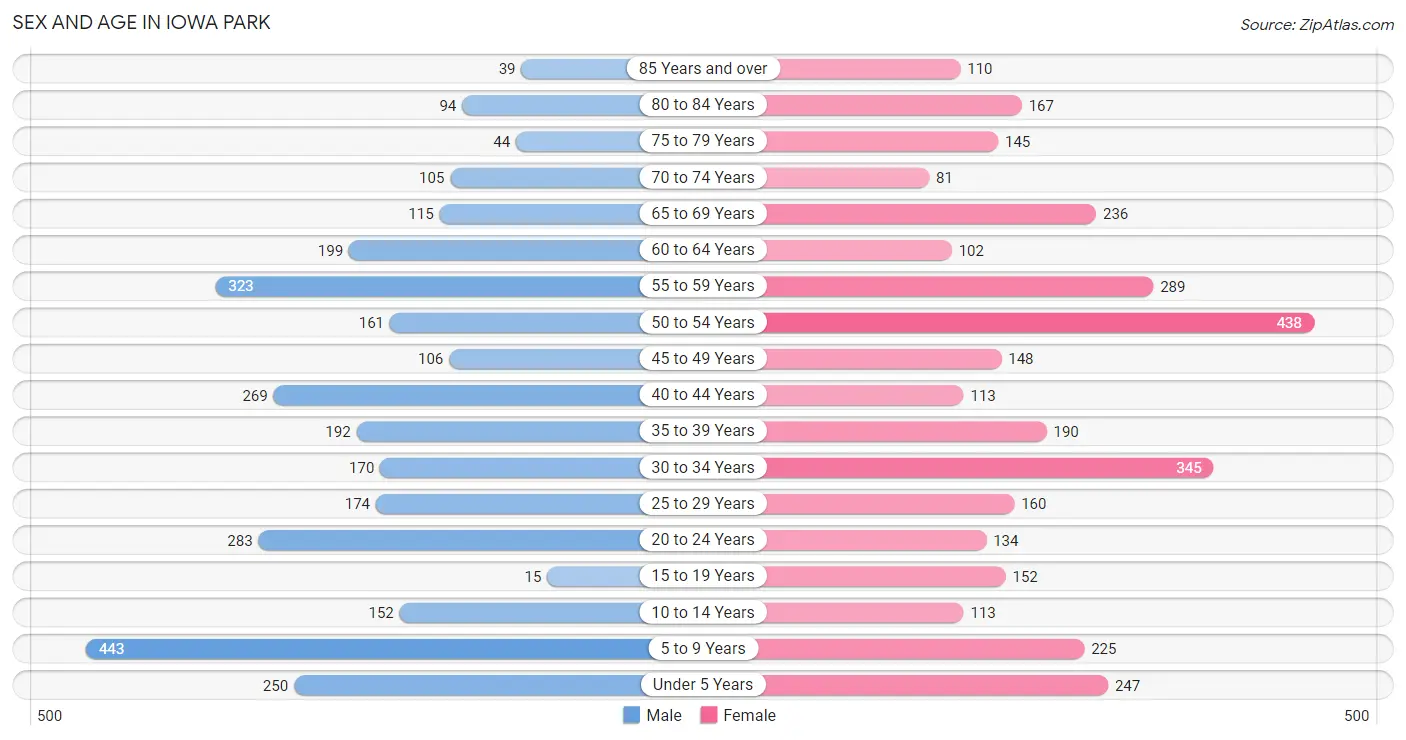
| Age Bracket | Male | Female |
| Under 5 Years | 250 (8.0%) | 247 (7.3%) |
| 5 to 9 Years | 443 (14.1%) | 225 (6.6%) |
| 10 to 14 Years | 152 (4.9%) | 113 (3.3%) |
| 15 to 19 Years | 15 (0.5%) | 152 (4.5%) |
| 20 to 24 Years | 283 (9.0%) | 134 (4.0%) |
| 25 to 29 Years | 174 (5.6%) | 160 (4.7%) |
| 30 to 34 Years | 170 (5.4%) | 345 (10.2%) |
| 35 to 39 Years | 192 (6.1%) | 190 (5.6%) |
| 40 to 44 Years | 269 (8.6%) | 113 (3.3%) |
| 45 to 49 Years | 106 (3.4%) | 148 (4.4%) |
| 50 to 54 Years | 161 (5.1%) | 438 (12.9%) |
| 55 to 59 Years | 323 (10.3%) | 289 (8.5%) |
| 60 to 64 Years | 199 (6.4%) | 102 (3.0%) |
| 65 to 69 Years | 115 (3.7%) | 236 (7.0%) |
| 70 to 74 Years | 105 (3.4%) | 81 (2.4%) |
| 75 to 79 Years | 44 (1.4%) | 145 (4.3%) |
| 80 to 84 Years | 94 (3.0%) | 167 (4.9%) |
| 85 Years and over | 39 (1.2%) | 110 (3.2%) |
| Total | 3,134 (100.0%) | 3,395 (100.0%) |
Families and Households in Iowa Park
Median Family Size in Iowa Park
The median family size in Iowa Park is 3.15 persons per family, with married-couple families (1,185 | 72.0%) accounting for the largest median family size of 3.3 persons per family. On the other hand, single male/father families (13 | 0.8%) represent the smallest median family size with 2.00 persons per family.
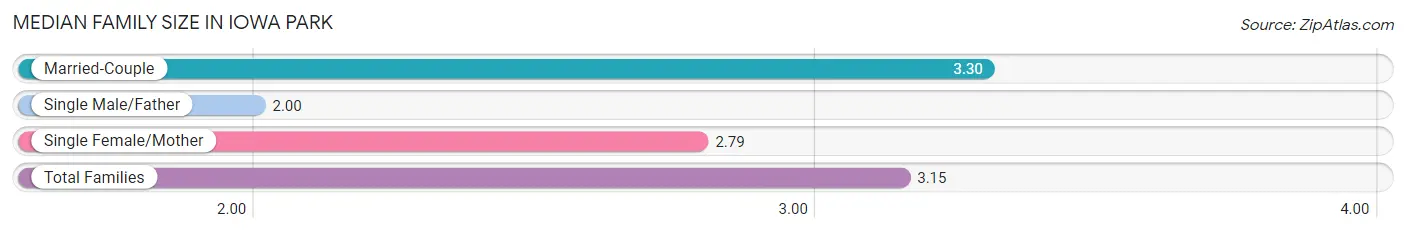
| Family Type | # Families | Family Size |
| Married-Couple | 1,185 (72.0%) | 3.30 |
| Single Male/Father | 13 (0.8%) | 2.00 |
| Single Female/Mother | 447 (27.2%) | 2.79 |
| Total Families | 1,645 (100.0%) | 3.15 |
Median Household Size in Iowa Park
The median household size in Iowa Park is 2.38 persons per household, with married-couple households (1,185 | 43.4%) accounting for the largest median household size of 3.31 persons per household. non-family households (1,087 | 39.8%) represent the smallest median household size with 1.09 persons per household.
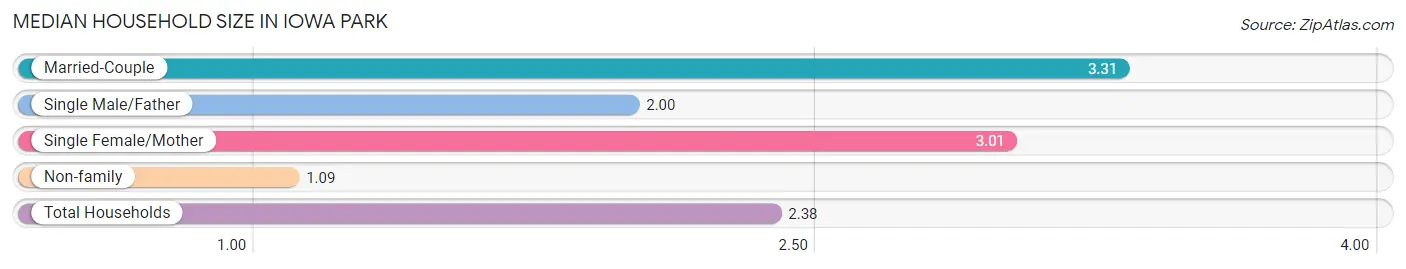
| Household Type | # Households | Household Size |
| Married-Couple | 1,185 (43.4%) | 3.31 |
| Single Male/Father | 13 (0.5%) | 2.00 |
| Single Female/Mother | 447 (16.4%) | 3.01 |
| Non-family | 1,087 (39.8%) | 1.09 |
| Total Households | 2,732 (100.0%) | 2.38 |
Household Size by Marriage Status in Iowa Park
Out of a total of 2,732 households in Iowa Park, 1,645 (60.2%) are family households, while 1,087 (39.8%) are nonfamily households. The most numerous type of family households are 2-person households, comprising 672, and the most common type of nonfamily households are 1-person households, comprising 1,015.
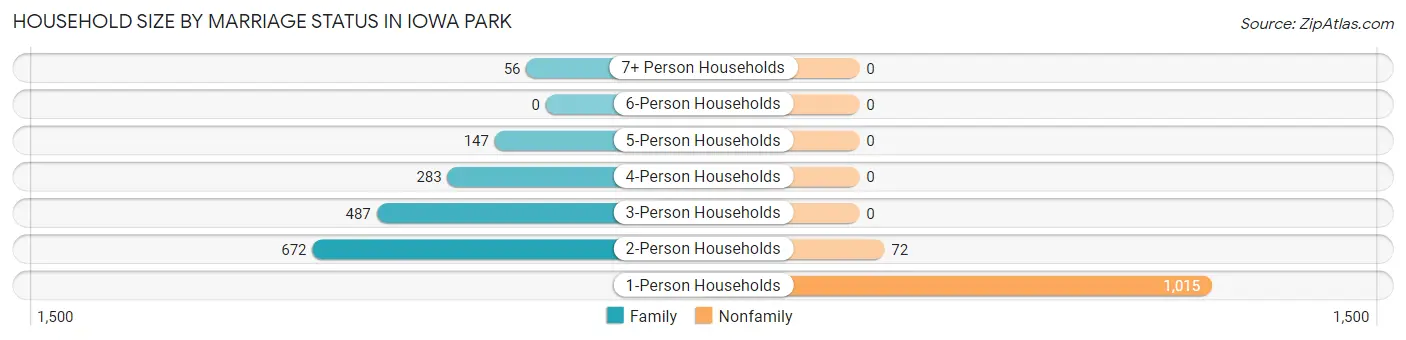
| Household Size | Family Households | Nonfamily Households |
| 1-Person Households | - | 1,015 (37.1%) |
| 2-Person Households | 672 (24.6%) | 72 (2.6%) |
| 3-Person Households | 487 (17.8%) | 0 (0.0%) |
| 4-Person Households | 283 (10.4%) | 0 (0.0%) |
| 5-Person Households | 147 (5.4%) | 0 (0.0%) |
| 6-Person Households | 0 (0.0%) | 0 (0.0%) |
| 7+ Person Households | 56 (2.1%) | 0 (0.0%) |
| Total | 1,645 (60.2%) | 1,087 (39.8%) |
Female Fertility in Iowa Park
Fertility by Age in Iowa Park
Average fertility rate in Iowa Park is 39.0 births per 1,000 women. Women in the age bracket of 20 to 34 years have the highest fertility rate with 77.0 births per 1,000 women. Women in the age bracket of 20 to 34 years acount for 100.0% of all women with births.
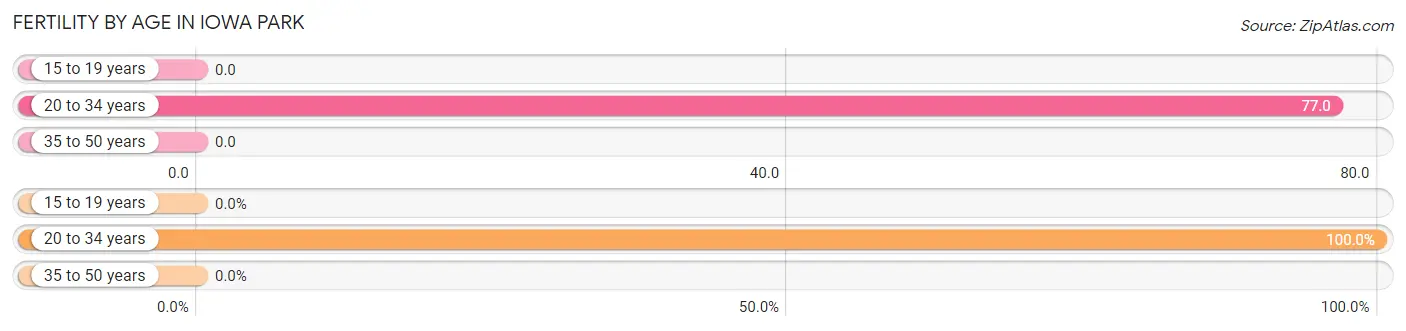
| Age Bracket | Women with Births | Births / 1,000 Women |
| 15 to 19 years | 0 (0.0%) | 0.0 |
| 20 to 34 years | 49 (100.0%) | 77.0 |
| 35 to 50 years | 0 (0.0%) | 0.0 |
| Total | 49 (100.0%) | 39.0 |
Fertility by Age by Marriage Status in Iowa Park
67.3% of women with births (49) in Iowa Park are married. The highest percentage of unmarried women with births falls into 20 to 34 years age bracket with 32.7% of them unmarried at the time of birth, while the lowest percentage of unmarried women with births belong to 20 to 34 years age bracket with 32.7% of them unmarried.
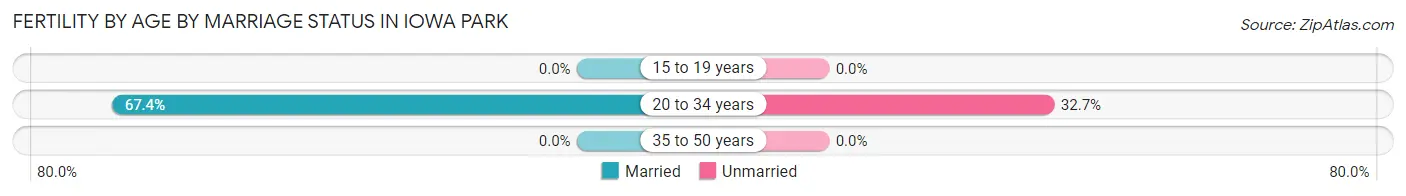
| Age Bracket | Married | Unmarried |
| 15 to 19 years | 0 (0.0%) | 0 (0.0%) |
| 20 to 34 years | 33 (67.3%) | 16 (32.7%) |
| 35 to 50 years | 0 (0.0%) | 0 (0.0%) |
| Total | 33 (67.3%) | 16 (32.7%) |
Fertility by Education in Iowa Park
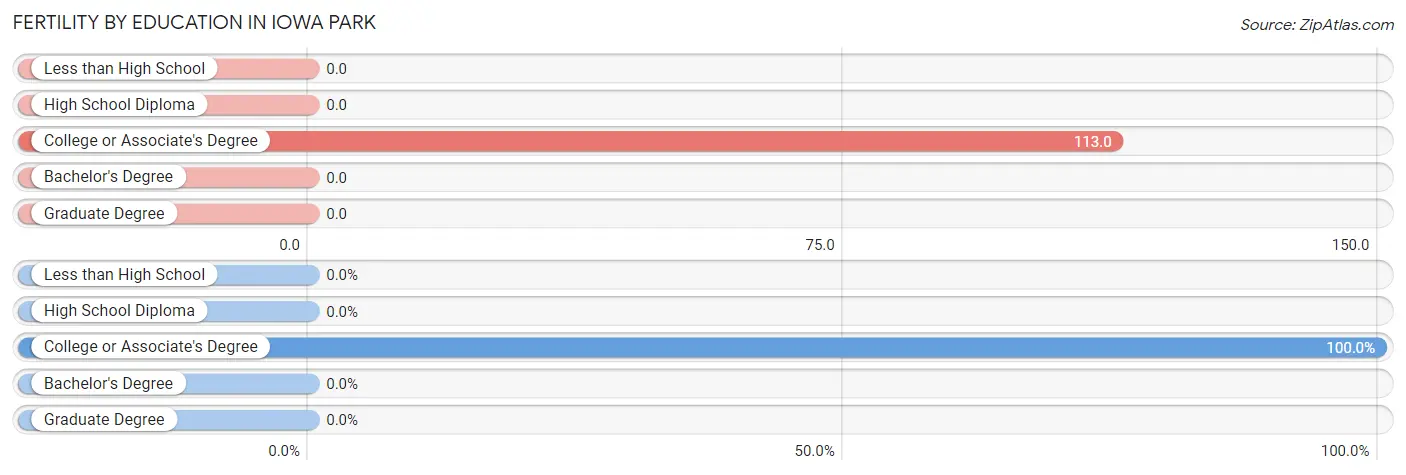
| Educational Attainment | Women with Births | Births / 1,000 Women |
| Less than High School | 0 (0.0%) | 0.0 |
| High School Diploma | 0 (0.0%) | 0.0 |
| College or Associate's Degree | 49 (100.0%) | 113.0 |
| Bachelor's Degree | 0 (0.0%) | 0.0 |
| Graduate Degree | 0 (0.0%) | 0.0 |
| Total | 49 (100.0%) | 39.0 |
Fertility by Education by Marriage Status in Iowa Park
32.7% of women with births in Iowa Park are unmarried. Women with the educational attainment of college or associate's degree are most likely to be married with 67.3% of them married at childbirth, while women with the educational attainment of college or associate's degree are least likely to be married with 32.7% of them unmarried at childbirth.
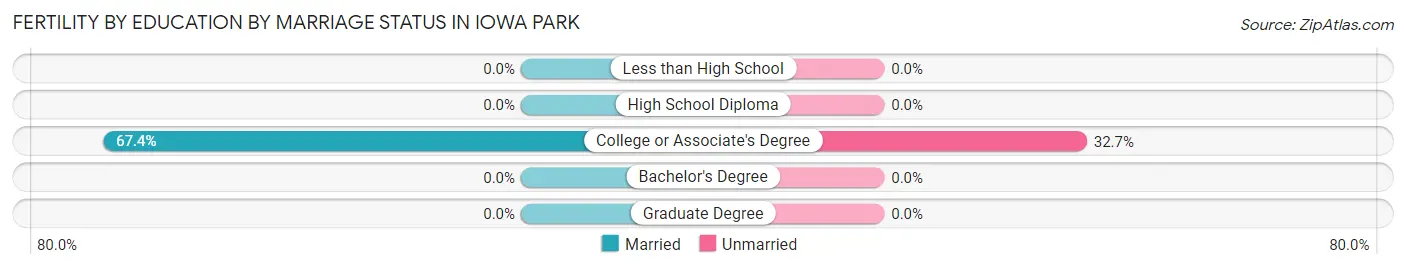
| Educational Attainment | Married | Unmarried |
| Less than High School | 0 (0.0%) | 0 (0.0%) |
| High School Diploma | 0 (0.0%) | 0 (0.0%) |
| College or Associate's Degree | 33 (67.3%) | 16 (32.7%) |
| Bachelor's Degree | 0 (0.0%) | 0 (0.0%) |
| Graduate Degree | 0 (0.0%) | 0 (0.0%) |
| Total | 33 (67.3%) | 16 (32.7%) |
Employment Characteristics in Iowa Park
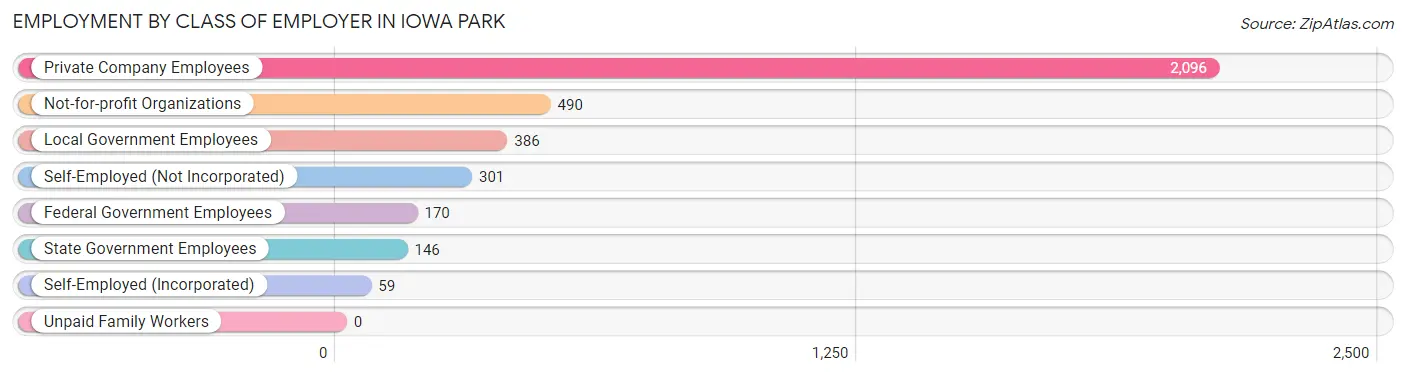
Employment by Class of Employer in Iowa Park
Among the 3,648 employed individuals in Iowa Park, private company employees (2,096 | 57.5%), not-for-profit organizations (490 | 13.4%), and local government employees (386 | 10.6%) make up the most common classes of employment.
| Employer Class | # Employees | % Employees |
| Private Company Employees | 2,096 | 57.5% |
| Self-Employed (Incorporated) | 59 | 1.6% |
| Self-Employed (Not Incorporated) | 301 | 8.3% |
| Not-for-profit Organizations | 490 | 13.4% |
| Local Government Employees | 386 | 10.6% |
| State Government Employees | 146 | 4.0% |
| Federal Government Employees | 170 | 4.7% |
| Unpaid Family Workers | 0 | 0.0% |
| Total | 3,648 | 100.0% |
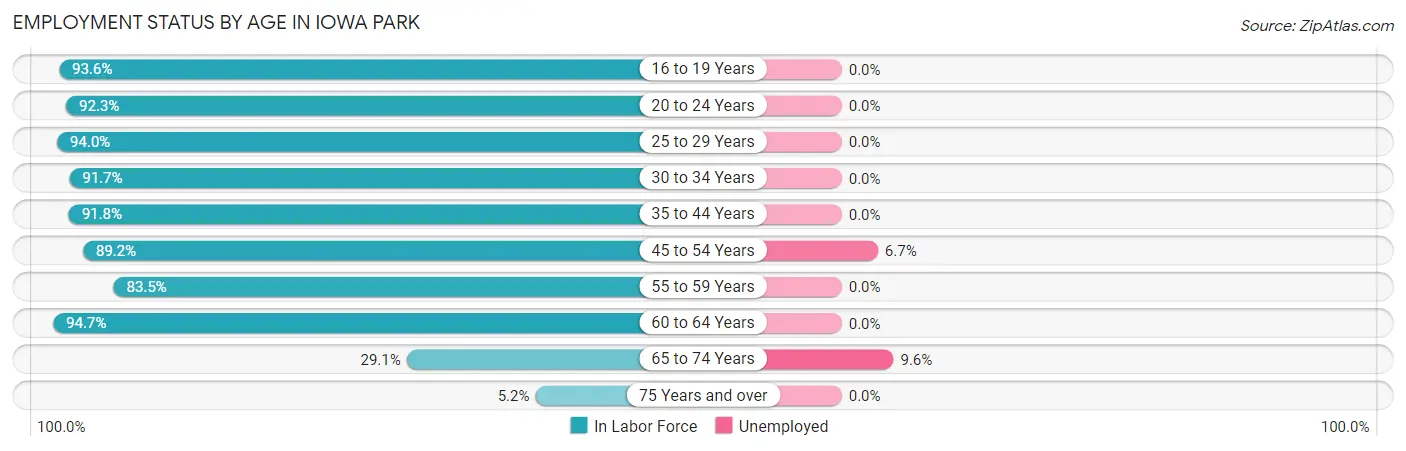
Employment Status by Age in Iowa Park
According to the labor force statistics for Iowa Park, out of the total population over 16 years of age (5,088), 73.9% or 3,760 individuals are in the labor force, with 1.8% or 68 of them unemployed. The age group with the highest labor force participation rate is 60 to 64 years, with 94.7% or 285 individuals in the labor force. Within the labor force, the 65 to 74 years age range has the highest percentage of unemployed individuals, with 9.6% or 15 of them being unemployed.
| Age Bracket | In Labor Force | Unemployed |
| 16 to 19 Years | 146 (93.6%) | 0 (0.0%) |
| 20 to 24 Years | 385 (92.3%) | 0 (0.0%) |
| 25 to 29 Years | 314 (94.0%) | 0 (0.0%) |
| 30 to 34 Years | 472 (91.7%) | 0 (0.0%) |
| 35 to 44 Years | 701 (91.8%) | 0 (0.0%) |
| 45 to 54 Years | 761 (89.2%) | 51 (6.7%) |
| 55 to 59 Years | 511 (83.5%) | 0 (0.0%) |
| 60 to 64 Years | 285 (94.7%) | 0 (0.0%) |
| 65 to 74 Years | 156 (29.1%) | 15 (9.6%) |
| 75 Years and over | 31 (5.2%) | 0 (0.0%) |
| Total | 3,760 (73.9%) | 68 (1.8%) |
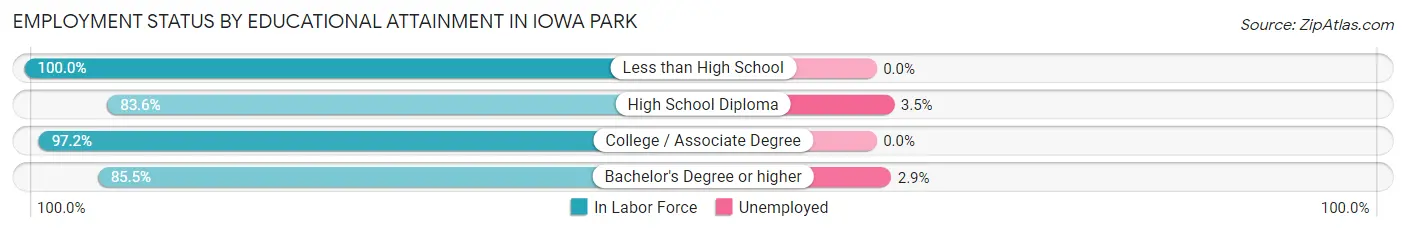
Employment Status by Educational Attainment in Iowa Park
According to labor force statistics for Iowa Park, 90.1% of individuals (3,044) out of the total population between 25 and 64 years of age (3,379) are in the labor force, with 1.7% or 52 of them being unemployed. The group with the highest labor force participation rate are those with the educational attainment of less than high school, with 100.0% or 123 individuals in the labor force. Within the labor force, individuals with high school diploma education have the highest percentage of unemployment, with 3.5% or 35 of them being unemployed.
| Educational Attainment | In Labor Force | Unemployed |
| Less than High School | 123 (100.0%) | 0 (0.0%) |
| High School Diploma | 1,001 (83.6%) | 42 (3.5%) |
| College / Associate Degree | 1,323 (97.2%) | 0 (0.0%) |
| Bachelor's Degree or higher | 597 (85.5%) | 20 (2.9%) |
| Total | 3,044 (90.1%) | 57 (1.7%) |
Employment Occupations by Sex in Iowa Park
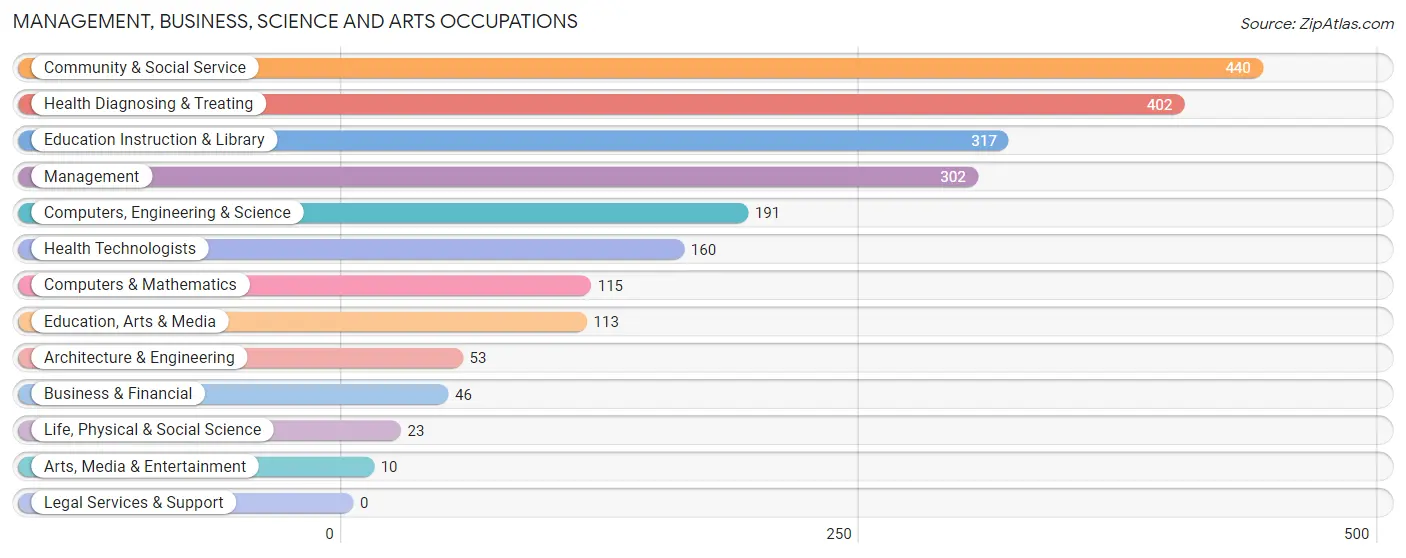
Management, Business, Science and Arts Occupations
The most common Management, Business, Science and Arts occupations in Iowa Park are Community & Social Service (440 | 12.2%), Health Diagnosing & Treating (402 | 11.1%), Education Instruction & Library (317 | 8.8%), Management (302 | 8.4%), and Computers, Engineering & Science (191 | 5.3%).
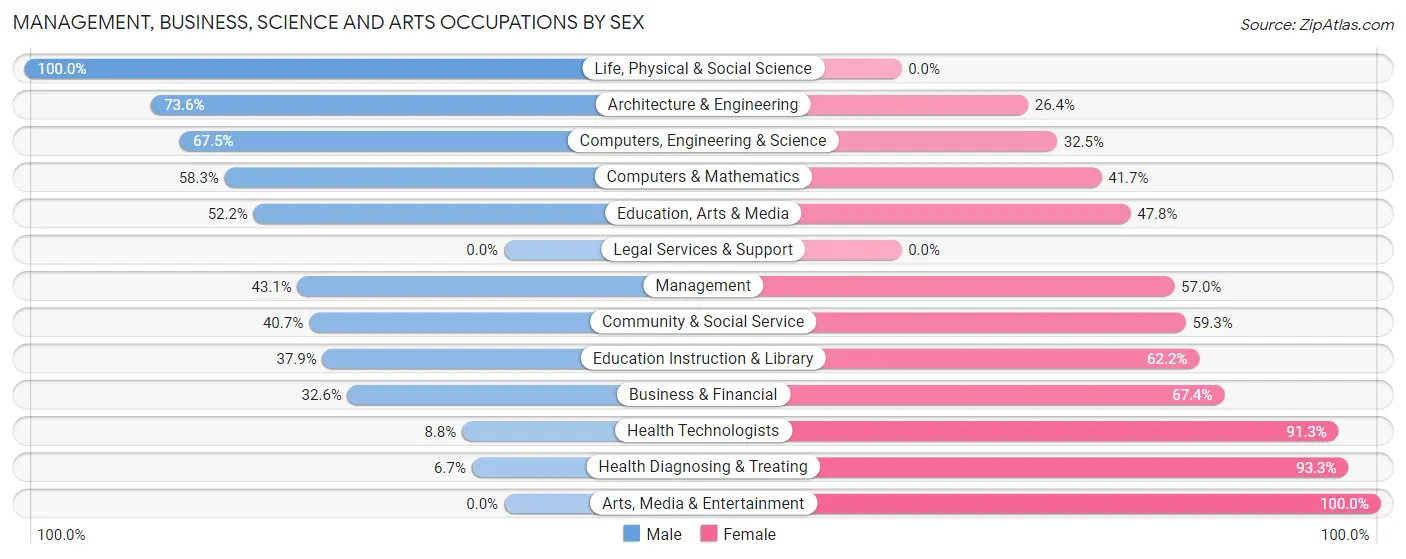
Management, Business, Science and Arts Occupations by Sex
Within the Management, Business, Science and Arts occupations in Iowa Park, the most male-oriented occupations are Life, Physical & Social Science (100.0%), Architecture & Engineering (73.6%), and Computers, Engineering & Science (67.5%), while the most female-oriented occupations are Arts, Media & Entertainment (100.0%), Health Diagnosing & Treating (93.3%), and Health Technologists (91.2%).
| Occupation | Male | Female |
| Management | 130 (43.0%) | 172 (57.0%) |
| Business & Financial | 15 (32.6%) | 31 (67.4%) |
| Computers, Engineering & Science | 129 (67.5%) | 62 (32.5%) |
| Computers & Mathematics | 67 (58.3%) | 48 (41.7%) |
| Architecture & Engineering | 39 (73.6%) | 14 (26.4%) |
| Life, Physical & Social Science | 23 (100.0%) | 0 (0.0%) |
| Community & Social Service | 179 (40.7%) | 261 (59.3%) |
| Education, Arts & Media | 59 (52.2%) | 54 (47.8%) |
| Legal Services & Support | 0 (0.0%) | 0 (0.0%) |
| Education Instruction & Library | 120 (37.9%) | 197 (62.2%) |
| Arts, Media & Entertainment | 0 (0.0%) | 10 (100.0%) |
| Health Diagnosing & Treating | 27 (6.7%) | 375 (93.3%) |
| Health Technologists | 14 (8.7%) | 146 (91.2%) |
| Total (Category) | 480 (34.8%) | 901 (65.2%) |
| Total (Overall) | 1,717 (47.5%) | 1,901 (52.5%) |
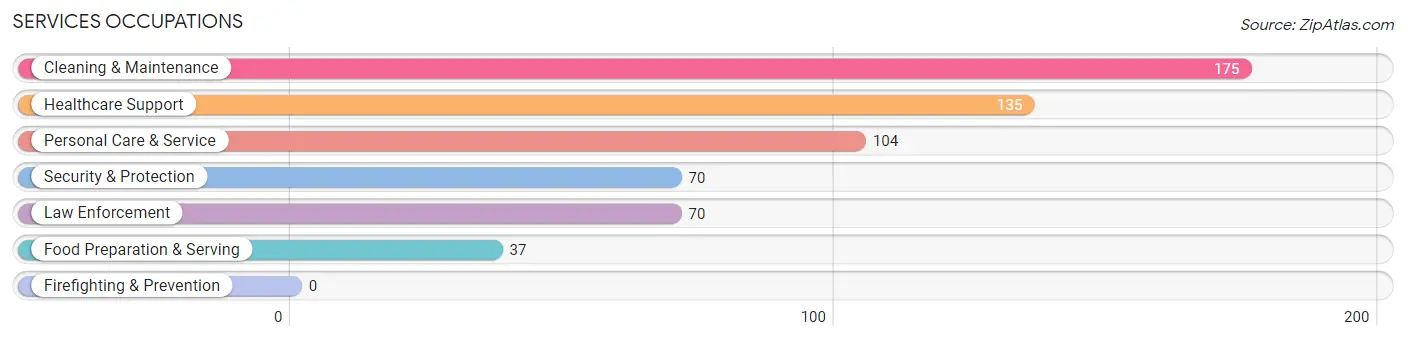
Services Occupations
The most common Services occupations in Iowa Park are Cleaning & Maintenance (175 | 4.8%), Healthcare Support (135 | 3.7%), Personal Care & Service (104 | 2.9%), Security & Protection (70 | 1.9%), and Law Enforcement (70 | 1.9%).
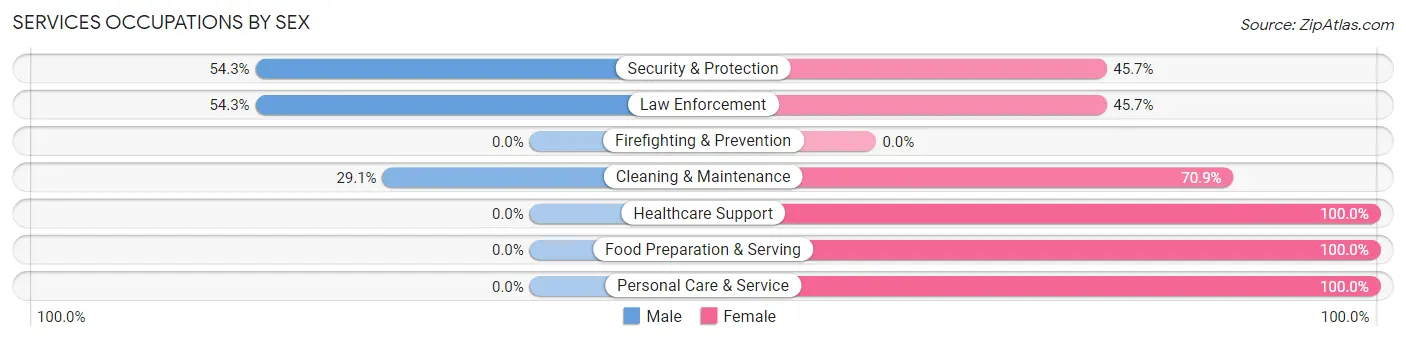
Services Occupations by Sex
Within the Services occupations in Iowa Park, the most male-oriented occupations are Security & Protection (54.3%), Law Enforcement (54.3%), and Cleaning & Maintenance (29.1%), while the most female-oriented occupations are Healthcare Support (100.0%), Food Preparation & Serving (100.0%), and Personal Care & Service (100.0%).
| Occupation | Male | Female |
| Healthcare Support | 0 (0.0%) | 135 (100.0%) |
| Security & Protection | 38 (54.3%) | 32 (45.7%) |
| Firefighting & Prevention | 0 (0.0%) | 0 (0.0%) |
| Law Enforcement | 38 (54.3%) | 32 (45.7%) |
| Food Preparation & Serving | 0 (0.0%) | 37 (100.0%) |
| Cleaning & Maintenance | 51 (29.1%) | 124 (70.9%) |
| Personal Care & Service | 0 (0.0%) | 104 (100.0%) |
| Total (Category) | 89 (17.1%) | 432 (82.9%) |
| Total (Overall) | 1,717 (47.5%) | 1,901 (52.5%) |
Sales and Office Occupations
The most common Sales and Office occupations in Iowa Park are Sales & Related (341 | 9.4%), and Office & Administration (173 | 4.8%).
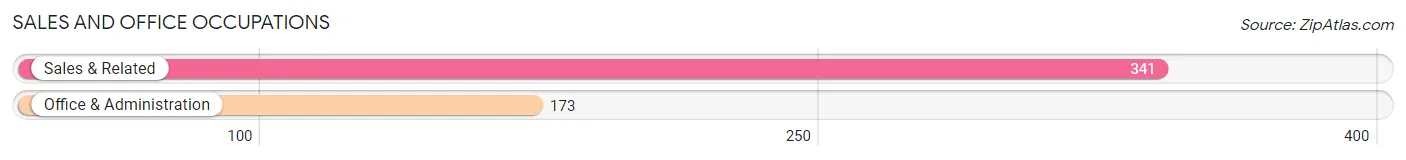
Sales and Office Occupations by Sex
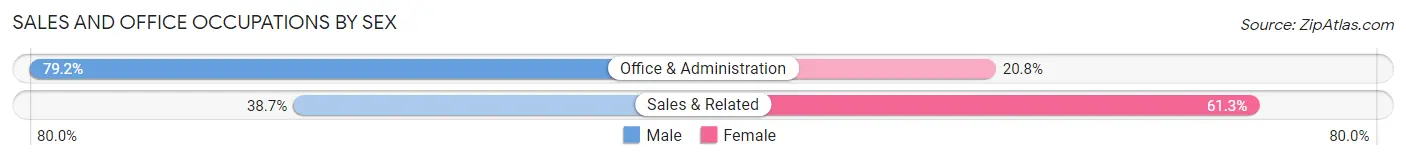
| Occupation | Male | Female |
| Sales & Related | 132 (38.7%) | 209 (61.3%) |
| Office & Administration | 137 (79.2%) | 36 (20.8%) |
| Total (Category) | 269 (52.3%) | 245 (47.7%) |
| Total (Overall) | 1,717 (47.5%) | 1,901 (52.5%) |
Natural Resources, Construction and Maintenance Occupations
The most common Natural Resources, Construction and Maintenance occupations in Iowa Park are Installation, Maintenance & Repair (374 | 10.3%), and Construction & Extraction (227 | 6.3%).
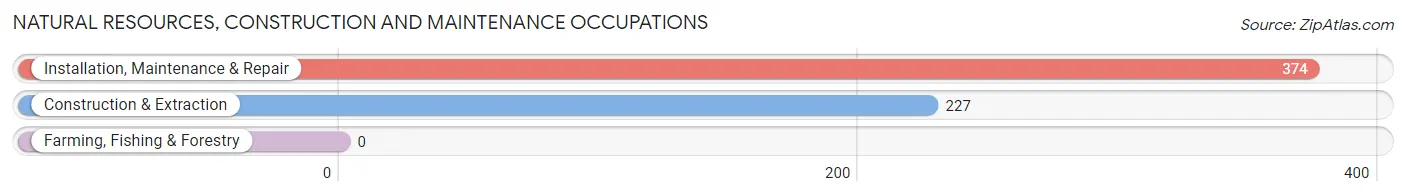
Natural Resources, Construction and Maintenance Occupations by Sex
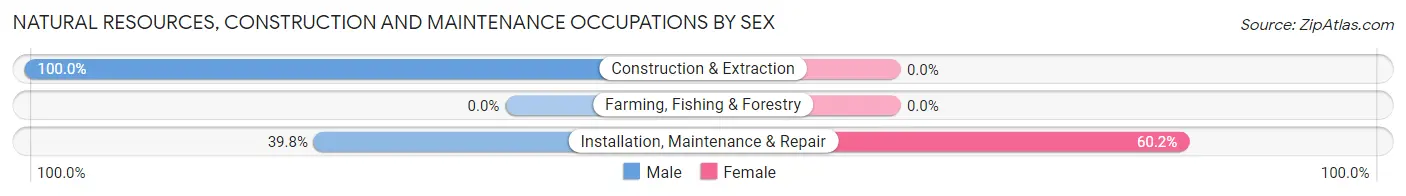
| Occupation | Male | Female |
| Farming, Fishing & Forestry | 0 (0.0%) | 0 (0.0%) |
| Construction & Extraction | 227 (100.0%) | 0 (0.0%) |
| Installation, Maintenance & Repair | 149 (39.8%) | 225 (60.2%) |
| Total (Category) | 376 (62.6%) | 225 (37.4%) |
| Total (Overall) | 1,717 (47.5%) | 1,901 (52.5%) |
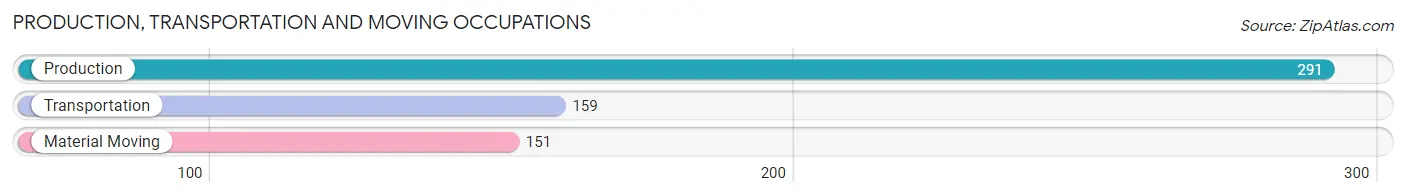
Production, Transportation and Moving Occupations
The most common Production, Transportation and Moving occupations in Iowa Park are Production (291 | 8.0%), Transportation (159 | 4.4%), and Material Moving (151 | 4.2%).
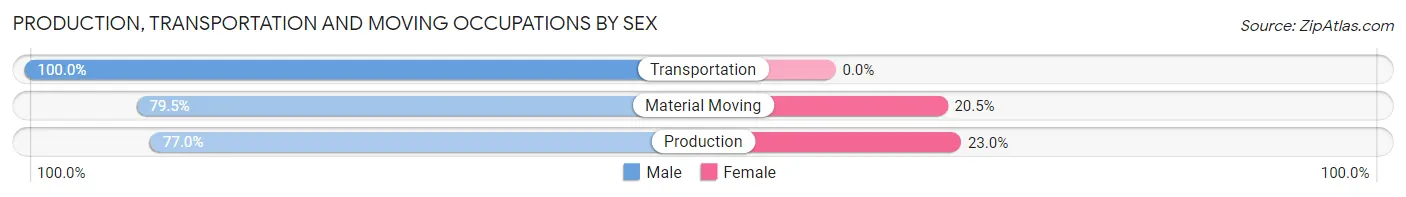
Production, Transportation and Moving Occupations by Sex
| Occupation | Male | Female |
| Production | 224 (77.0%) | 67 (23.0%) |
| Transportation | 159 (100.0%) | 0 (0.0%) |
| Material Moving | 120 (79.5%) | 31 (20.5%) |
| Total (Category) | 503 (83.7%) | 98 (16.3%) |
| Total (Overall) | 1,717 (47.5%) | 1,901 (52.5%) |
Employment Industries by Sex in Iowa Park
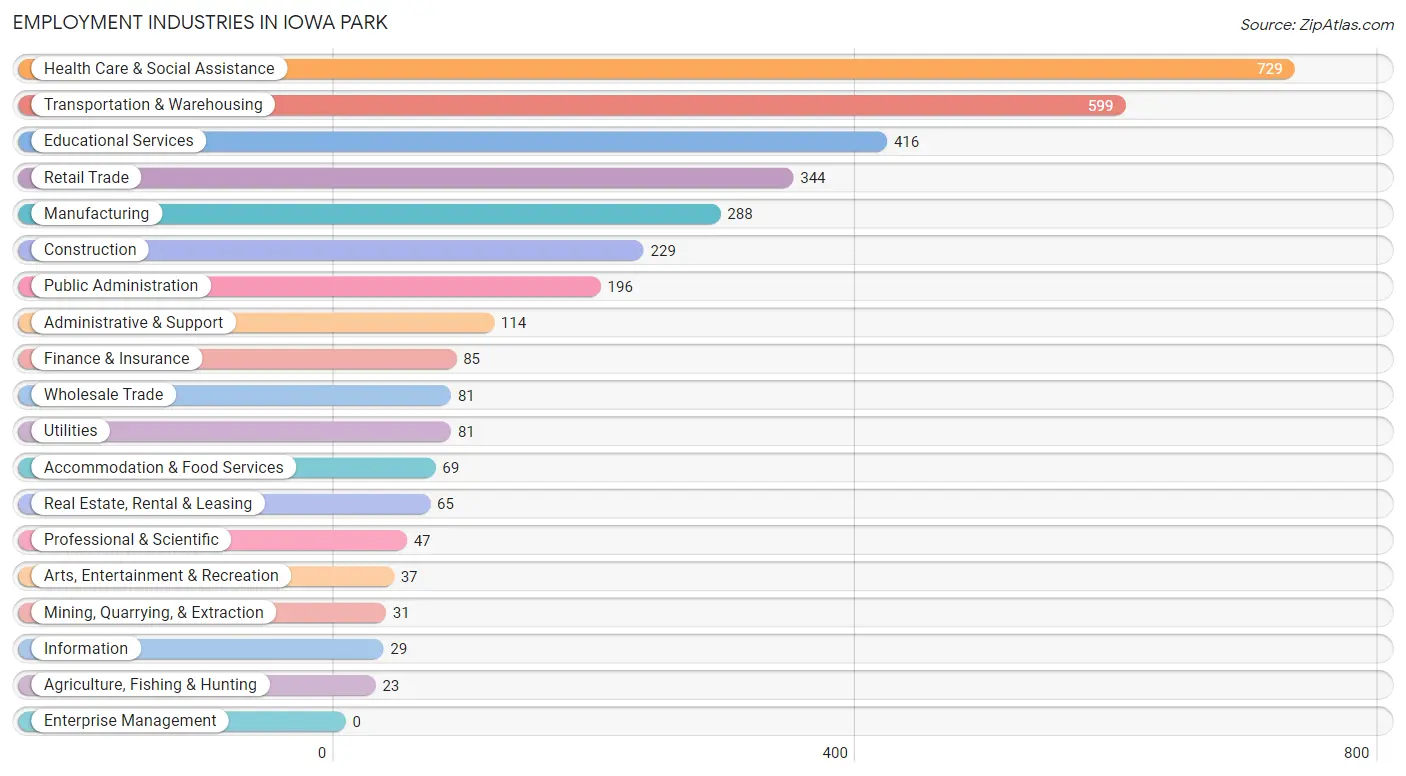
Employment Industries in Iowa Park
The major employment industries in Iowa Park include Health Care & Social Assistance (729 | 20.2%), Transportation & Warehousing (599 | 16.6%), Educational Services (416 | 11.5%), Retail Trade (344 | 9.5%), and Manufacturing (288 | 8.0%).
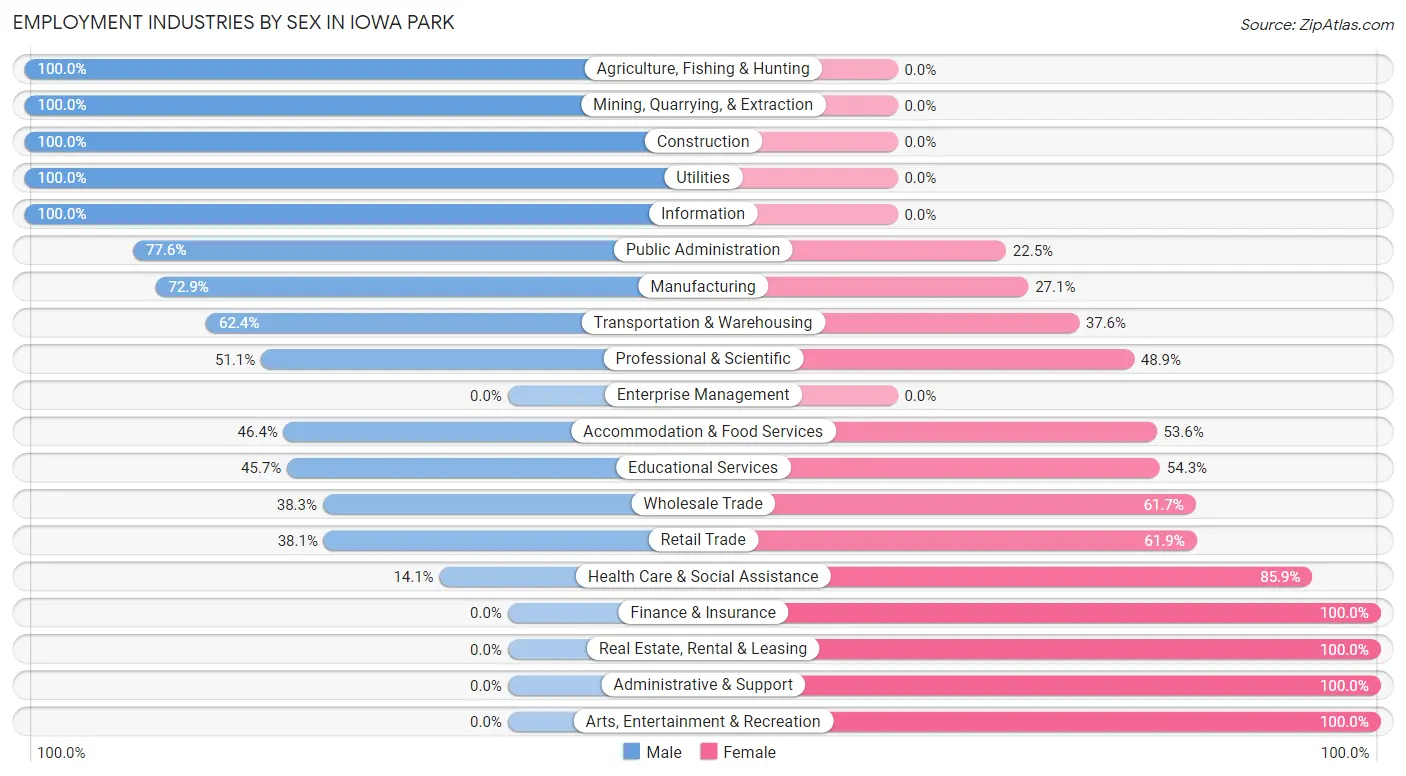
Employment Industries by Sex in Iowa Park
The Iowa Park industries that see more men than women are Agriculture, Fishing & Hunting (100.0%), Mining, Quarrying, & Extraction (100.0%), and Construction (100.0%), whereas the industries that tend to have a higher number of women are Finance & Insurance (100.0%), Real Estate, Rental & Leasing (100.0%), and Administrative & Support (100.0%).
| Industry | Male | Female |
| Agriculture, Fishing & Hunting | 23 (100.0%) | 0 (0.0%) |
| Mining, Quarrying, & Extraction | 31 (100.0%) | 0 (0.0%) |
| Construction | 229 (100.0%) | 0 (0.0%) |
| Manufacturing | 210 (72.9%) | 78 (27.1%) |
| Wholesale Trade | 31 (38.3%) | 50 (61.7%) |
| Retail Trade | 131 (38.1%) | 213 (61.9%) |
| Transportation & Warehousing | 374 (62.4%) | 225 (37.6%) |
| Utilities | 81 (100.0%) | 0 (0.0%) |
| Information | 29 (100.0%) | 0 (0.0%) |
| Finance & Insurance | 0 (0.0%) | 85 (100.0%) |
| Real Estate, Rental & Leasing | 0 (0.0%) | 65 (100.0%) |
| Professional & Scientific | 24 (51.1%) | 23 (48.9%) |
| Enterprise Management | 0 (0.0%) | 0 (0.0%) |
| Administrative & Support | 0 (0.0%) | 114 (100.0%) |
| Educational Services | 190 (45.7%) | 226 (54.3%) |
| Health Care & Social Assistance | 103 (14.1%) | 626 (85.9%) |
| Arts, Entertainment & Recreation | 0 (0.0%) | 37 (100.0%) |
| Accommodation & Food Services | 32 (46.4%) | 37 (53.6%) |
| Public Administration | 152 (77.5%) | 44 (22.5%) |
| Total | 1,717 (47.5%) | 1,901 (52.5%) |
Education in Iowa Park
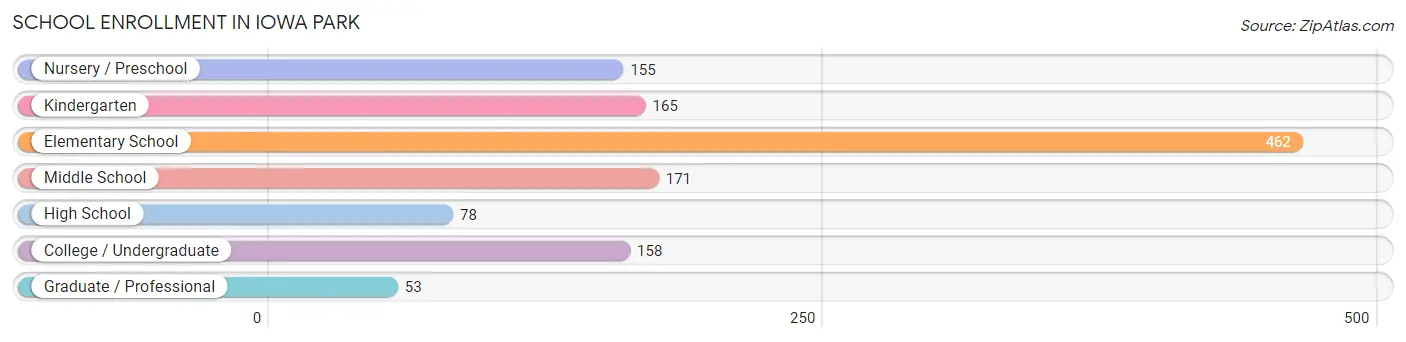
School Enrollment in Iowa Park
The most common levels of schooling among the 1,242 students in Iowa Park are elementary school (462 | 37.2%), middle school (171 | 13.8%), and kindergarten (165 | 13.3%).
| School Level | # Students | % Students |
| Nursery / Preschool | 155 | 12.5% |
| Kindergarten | 165 | 13.3% |
| Elementary School | 462 | 37.2% |
| Middle School | 171 | 13.8% |
| High School | 78 | 6.3% |
| College / Undergraduate | 158 | 12.7% |
| Graduate / Professional | 53 | 4.3% |
| Total | 1,242 | 100.0% |
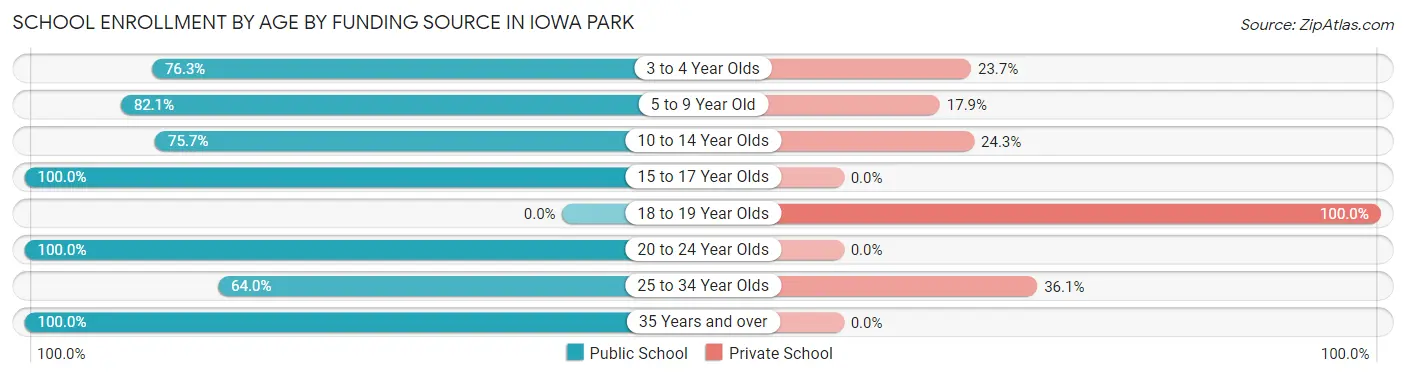
School Enrollment by Age by Funding Source in Iowa Park
Out of a total of 1,242 students who are enrolled in schools in Iowa Park, 270 (21.7%) attend a private institution, while the remaining 972 (78.3%) are enrolled in public schools. The age group of 18 to 19 year olds has the highest likelihood of being enrolled in private schools, with 37 (100.0% in the age bracket) enrolled. Conversely, the age group of 15 to 17 year olds has the lowest likelihood of being enrolled in a private school, with 37 (100.0% in the age bracket) attending a public institution.
| Age Bracket | Public School | Private School |
| 3 to 4 Year Olds | 90 (76.3%) | 28 (23.7%) |
| 5 to 9 Year Old | 513 (82.1%) | 112 (17.9%) |
| 10 to 14 Year Olds | 190 (75.7%) | 61 (24.3%) |
| 15 to 17 Year Olds | 37 (100.0%) | 0 (0.0%) |
| 18 to 19 Year Olds | 0 (0.0%) | 37 (100.0%) |
| 20 to 24 Year Olds | 5 (100.0%) | 0 (0.0%) |
| 25 to 34 Year Olds | 55 (63.9%) | 31 (36.0%) |
| 35 Years and over | 83 (100.0%) | 0 (0.0%) |
| Total | 972 (78.3%) | 270 (21.7%) |
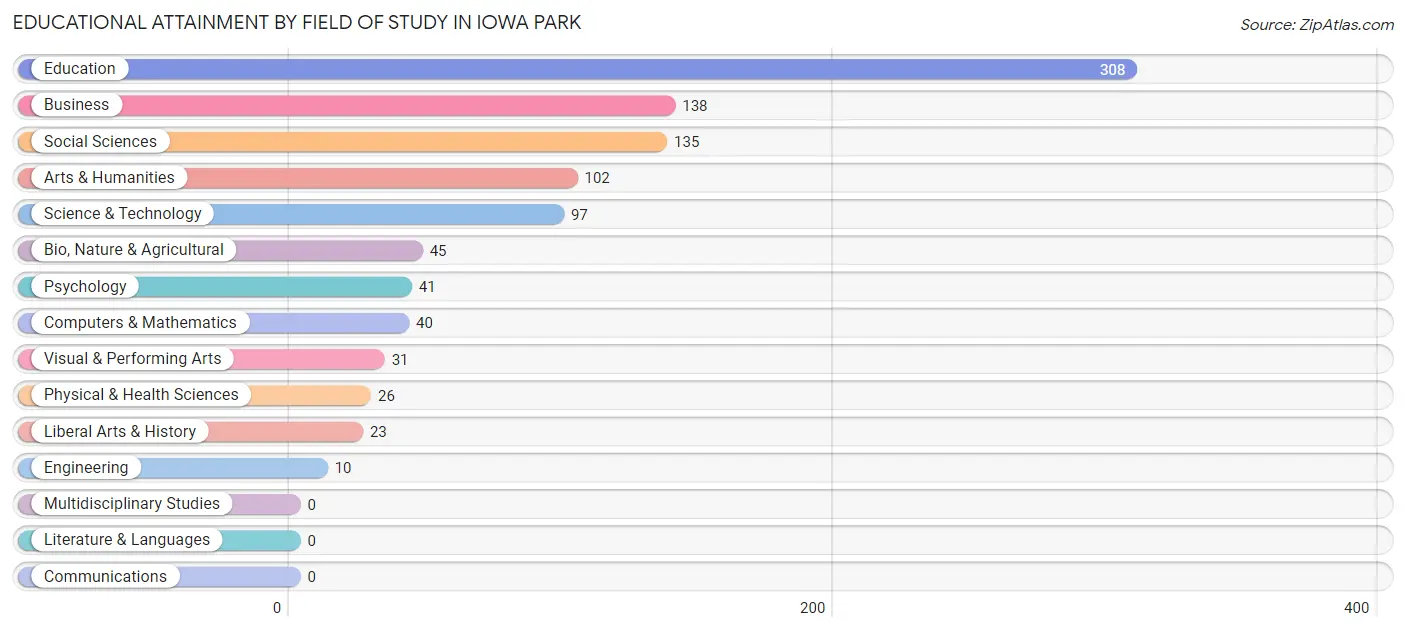
Educational Attainment by Field of Study in Iowa Park
Education (308 | 30.9%), business (138 | 13.9%), social sciences (135 | 13.6%), arts & humanities (102 | 10.2%), and science & technology (97 | 9.7%) are the most common fields of study among 996 individuals in Iowa Park who have obtained a bachelor's degree or higher.
| Field of Study | # Graduates | % Graduates |
| Computers & Mathematics | 40 | 4.0% |
| Bio, Nature & Agricultural | 45 | 4.5% |
| Physical & Health Sciences | 26 | 2.6% |
| Psychology | 41 | 4.1% |
| Social Sciences | 135 | 13.6% |
| Engineering | 10 | 1.0% |
| Multidisciplinary Studies | 0 | 0.0% |
| Science & Technology | 97 | 9.7% |
| Business | 138 | 13.9% |
| Education | 308 | 30.9% |
| Literature & Languages | 0 | 0.0% |
| Liberal Arts & History | 23 | 2.3% |
| Visual & Performing Arts | 31 | 3.1% |
| Communications | 0 | 0.0% |
| Arts & Humanities | 102 | 10.2% |
| Total | 996 | 100.0% |
Transportation & Commute in Iowa Park
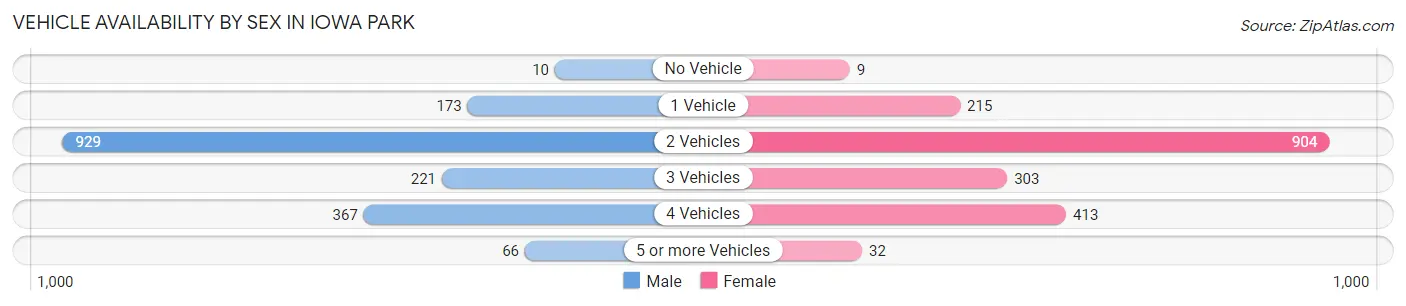
Vehicle Availability by Sex in Iowa Park
The most prevalent vehicle ownership categories in Iowa Park are males with 2 vehicles (929, accounting for 52.6%) and females with 2 vehicles (904, making up 49.5%).
| Vehicles Available | Male | Female |
| No Vehicle | 10 (0.6%) | 9 (0.5%) |
| 1 Vehicle | 173 (9.8%) | 215 (11.5%) |
| 2 Vehicles | 929 (52.6%) | 904 (48.2%) |
| 3 Vehicles | 221 (12.5%) | 303 (16.2%) |
| 4 Vehicles | 367 (20.8%) | 413 (22.0%) |
| 5 or more Vehicles | 66 (3.7%) | 32 (1.7%) |
| Total | 1,766 (100.0%) | 1,876 (100.0%) |
Commute Time in Iowa Park
The most frequently occuring commute durations in Iowa Park are 15 to 19 minutes (661 commuters, 18.9%), less than 5 minutes (640 commuters, 18.3%), and 5 to 9 minutes (639 commuters, 18.3%).
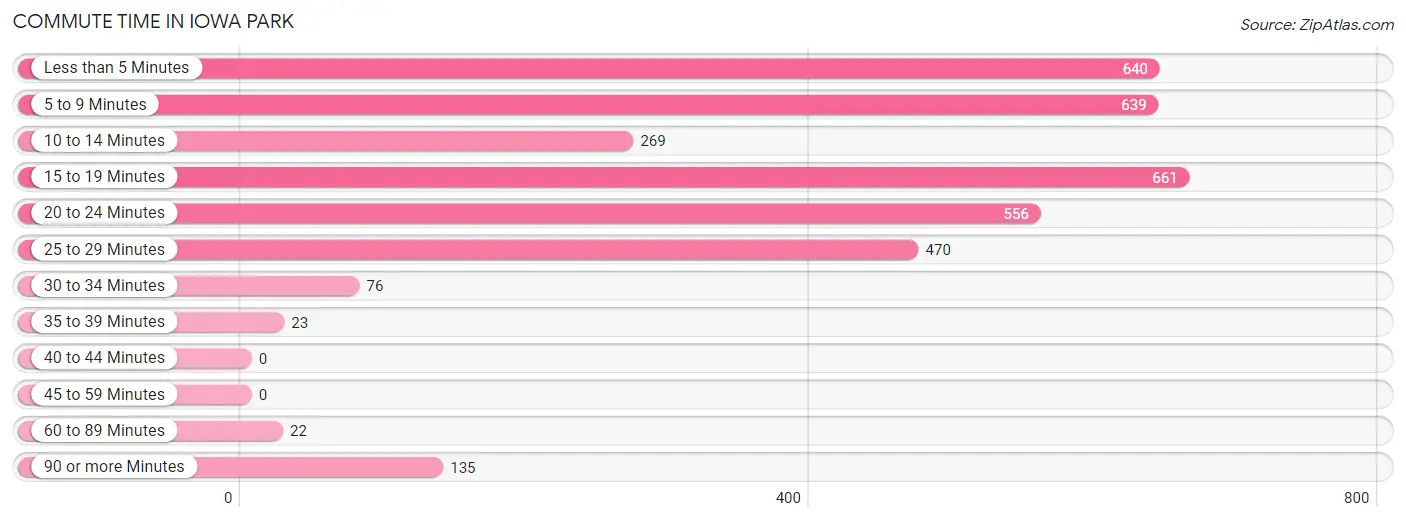
| Commute Time | # Commuters | % Commuters |
| Less than 5 Minutes | 640 | 18.3% |
| 5 to 9 Minutes | 639 | 18.3% |
| 10 to 14 Minutes | 269 | 7.7% |
| 15 to 19 Minutes | 661 | 18.9% |
| 20 to 24 Minutes | 556 | 15.9% |
| 25 to 29 Minutes | 470 | 13.5% |
| 30 to 34 Minutes | 76 | 2.2% |
| 35 to 39 Minutes | 23 | 0.7% |
| 40 to 44 Minutes | 0 | 0.0% |
| 45 to 59 Minutes | 0 | 0.0% |
| 60 to 89 Minutes | 22 | 0.6% |
| 90 or more Minutes | 135 | 3.9% |
Commute Time by Sex in Iowa Park
The most common commute times in Iowa Park are 5 to 9 minutes (494 commuters, 29.3%) for males and less than 5 minutes (396 commuters, 22.0%) for females.
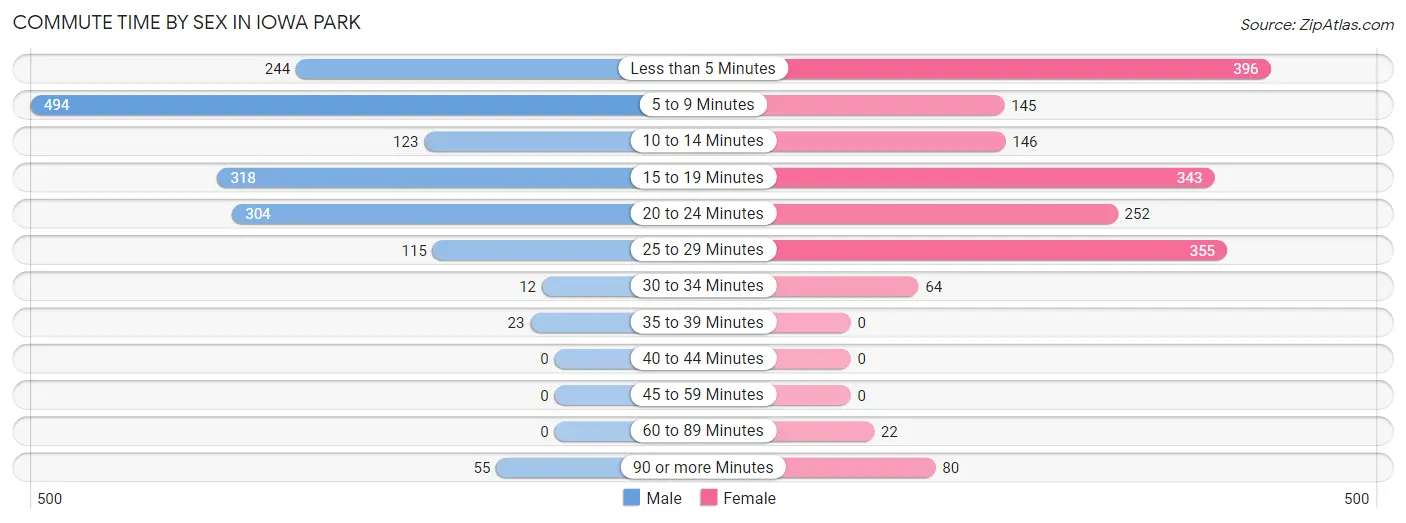
| Commute Time | Male | Female |
| Less than 5 Minutes | 244 (14.4%) | 396 (22.0%) |
| 5 to 9 Minutes | 494 (29.3%) | 145 (8.0%) |
| 10 to 14 Minutes | 123 (7.3%) | 146 (8.1%) |
| 15 to 19 Minutes | 318 (18.8%) | 343 (19.0%) |
| 20 to 24 Minutes | 304 (18.0%) | 252 (14.0%) |
| 25 to 29 Minutes | 115 (6.8%) | 355 (19.7%) |
| 30 to 34 Minutes | 12 (0.7%) | 64 (3.5%) |
| 35 to 39 Minutes | 23 (1.4%) | 0 (0.0%) |
| 40 to 44 Minutes | 0 (0.0%) | 0 (0.0%) |
| 45 to 59 Minutes | 0 (0.0%) | 0 (0.0%) |
| 60 to 89 Minutes | 0 (0.0%) | 22 (1.2%) |
| 90 or more Minutes | 55 (3.3%) | 80 (4.4%) |
Time of Departure to Work by Sex in Iowa Park
The most frequent times of departure to work in Iowa Park are 6:00 AM to 6:29 AM (283, 16.8%) for males and 12:00 AM to 4:59 AM (280, 15.5%) for females.
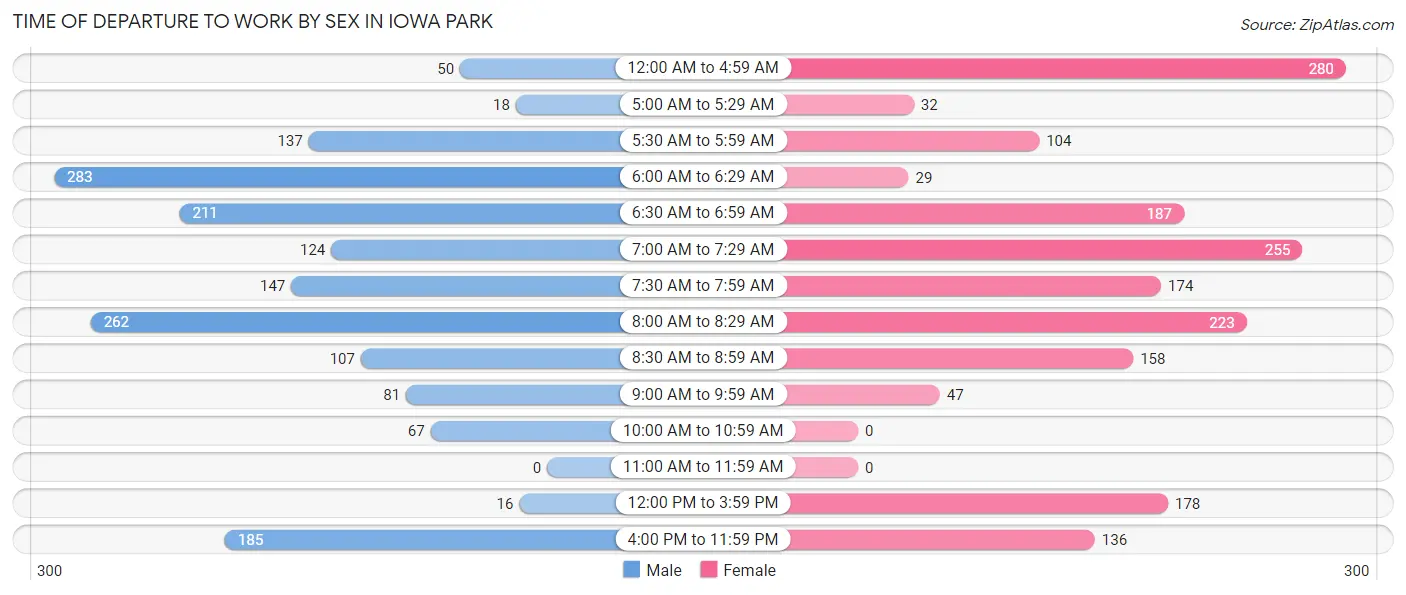
| Time of Departure | Male | Female |
| 12:00 AM to 4:59 AM | 50 (3.0%) | 280 (15.5%) |
| 5:00 AM to 5:29 AM | 18 (1.1%) | 32 (1.8%) |
| 5:30 AM to 5:59 AM | 137 (8.1%) | 104 (5.8%) |
| 6:00 AM to 6:29 AM | 283 (16.8%) | 29 (1.6%) |
| 6:30 AM to 6:59 AM | 211 (12.5%) | 187 (10.4%) |
| 7:00 AM to 7:29 AM | 124 (7.3%) | 255 (14.1%) |
| 7:30 AM to 7:59 AM | 147 (8.7%) | 174 (9.7%) |
| 8:00 AM to 8:29 AM | 262 (15.5%) | 223 (12.4%) |
| 8:30 AM to 8:59 AM | 107 (6.3%) | 158 (8.8%) |
| 9:00 AM to 9:59 AM | 81 (4.8%) | 47 (2.6%) |
| 10:00 AM to 10:59 AM | 67 (4.0%) | 0 (0.0%) |
| 11:00 AM to 11:59 AM | 0 (0.0%) | 0 (0.0%) |
| 12:00 PM to 3:59 PM | 16 (0.9%) | 178 (9.9%) |
| 4:00 PM to 11:59 PM | 185 (11.0%) | 136 (7.5%) |
| Total | 1,688 (100.0%) | 1,803 (100.0%) |
Housing Occupancy in Iowa Park
Occupancy by Ownership in Iowa Park
Of the total 2,732 dwellings in Iowa Park, owner-occupied units account for 2,262 (82.8%), while renter-occupied units make up 470 (17.2%).
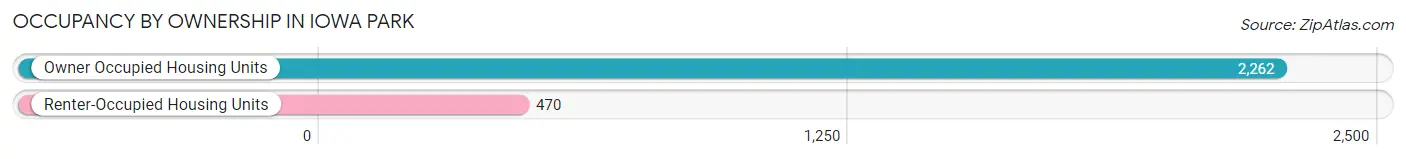
| Occupancy | # Housing Units | % Housing Units |
| Owner Occupied Housing Units | 2,262 | 82.8% |
| Renter-Occupied Housing Units | 470 | 17.2% |
| Total Occupied Housing Units | 2,732 | 100.0% |
Occupancy by Household Size in Iowa Park
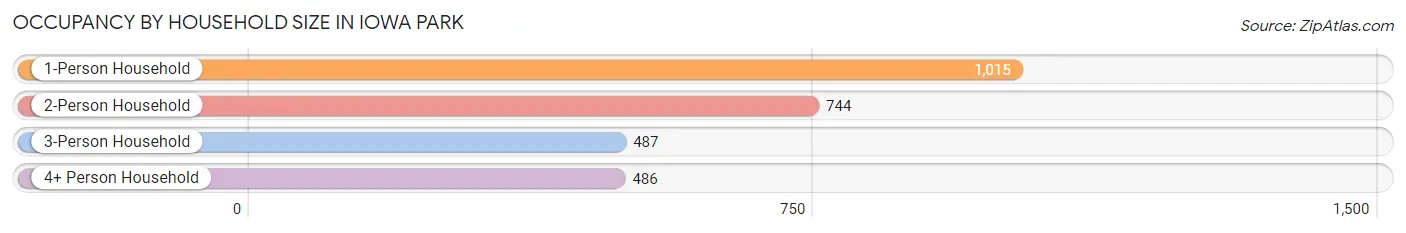
| Household Size | # Housing Units | % Housing Units |
| 1-Person Household | 1,015 | 37.1% |
| 2-Person Household | 744 | 27.2% |
| 3-Person Household | 487 | 17.8% |
| 4+ Person Household | 486 | 17.8% |
| Total Housing Units | 2,732 | 100.0% |
Occupancy by Ownership by Household Size in Iowa Park
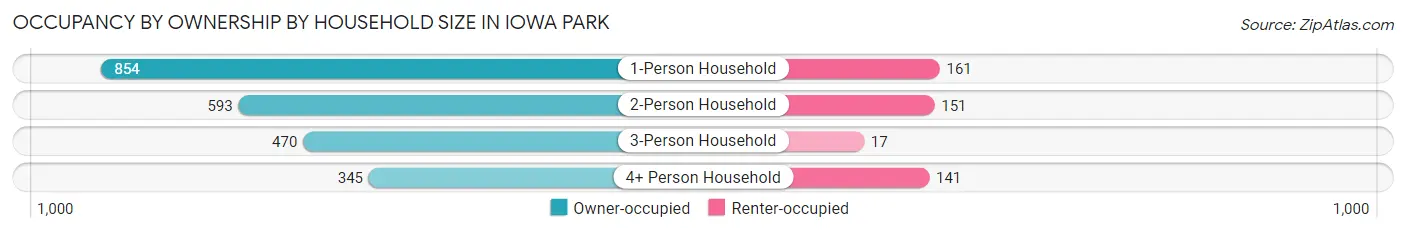
| Household Size | Owner-occupied | Renter-occupied |
| 1-Person Household | 854 (84.1%) | 161 (15.9%) |
| 2-Person Household | 593 (79.7%) | 151 (20.3%) |
| 3-Person Household | 470 (96.5%) | 17 (3.5%) |
| 4+ Person Household | 345 (71.0%) | 141 (29.0%) |
| Total Housing Units | 2,262 (82.8%) | 470 (17.2%) |
Occupancy by Educational Attainment in Iowa Park
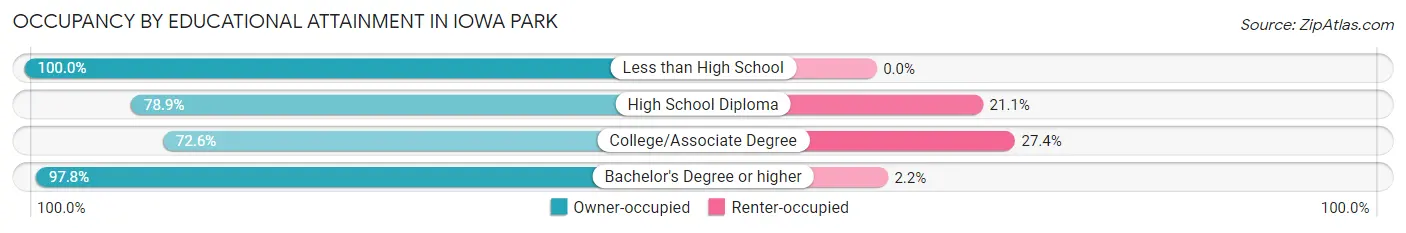
| Household Size | Owner-occupied | Renter-occupied |
| Less than High School | 257 (100.0%) | 0 (0.0%) |
| High School Diploma | 781 (78.9%) | 209 (21.1%) |
| College/Associate Degree | 656 (72.6%) | 248 (27.4%) |
| Bachelor's Degree or higher | 568 (97.8%) | 13 (2.2%) |
Occupancy by Age of Householder in Iowa Park
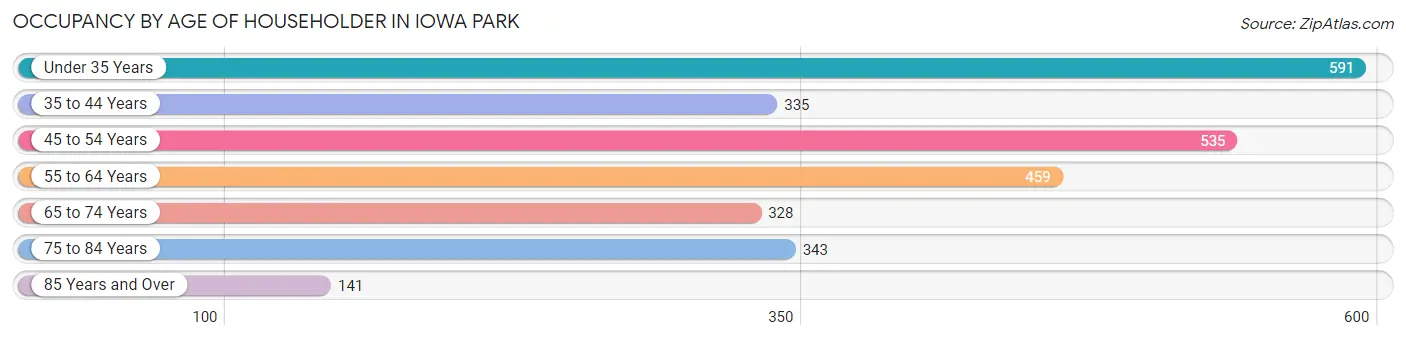
| Age Bracket | # Households | % Households |
| Under 35 Years | 591 | 21.6% |
| 35 to 44 Years | 335 | 12.3% |
| 45 to 54 Years | 535 | 19.6% |
| 55 to 64 Years | 459 | 16.8% |
| 65 to 74 Years | 328 | 12.0% |
| 75 to 84 Years | 343 | 12.6% |
| 85 Years and Over | 141 | 5.2% |
| Total | 2,732 | 100.0% |
Housing Finances in Iowa Park
Median Income by Occupancy in Iowa Park
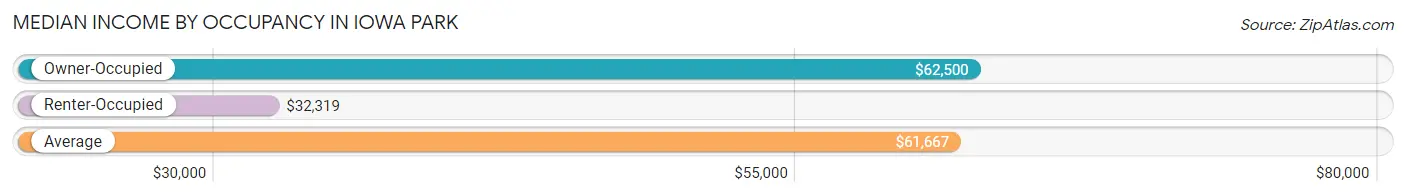
| Occupancy Type | # Households | Median Income |
| Owner-Occupied | 2,262 (82.8%) | $62,500 |
| Renter-Occupied | 470 (17.2%) | $32,319 |
| Average | 2,732 (100.0%) | $61,667 |
Occupancy by Householder Income Bracket in Iowa Park
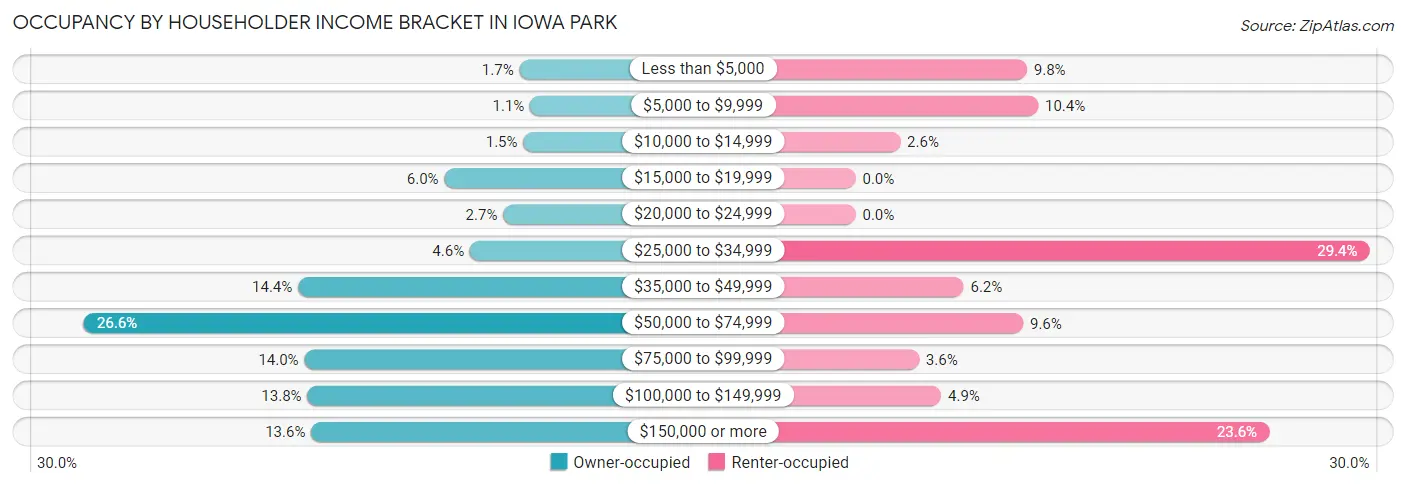
| Income Bracket | Owner-occupied | Renter-occupied |
| Less than $5,000 | 39 (1.7%) | 46 (9.8%) |
| $5,000 to $9,999 | 25 (1.1%) | 49 (10.4%) |
| $10,000 to $14,999 | 34 (1.5%) | 12 (2.5%) |
| $15,000 to $19,999 | 136 (6.0%) | 0 (0.0%) |
| $20,000 to $24,999 | 60 (2.6%) | 0 (0.0%) |
| $25,000 to $34,999 | 103 (4.5%) | 138 (29.4%) |
| $35,000 to $49,999 | 325 (14.4%) | 29 (6.2%) |
| $50,000 to $74,999 | 602 (26.6%) | 45 (9.6%) |
| $75,000 to $99,999 | 317 (14.0%) | 17 (3.6%) |
| $100,000 to $149,999 | 313 (13.8%) | 23 (4.9%) |
| $150,000 or more | 308 (13.6%) | 111 (23.6%) |
| Total | 2,262 (100.0%) | 470 (100.0%) |
Monthly Housing Cost Tiers in Iowa Park
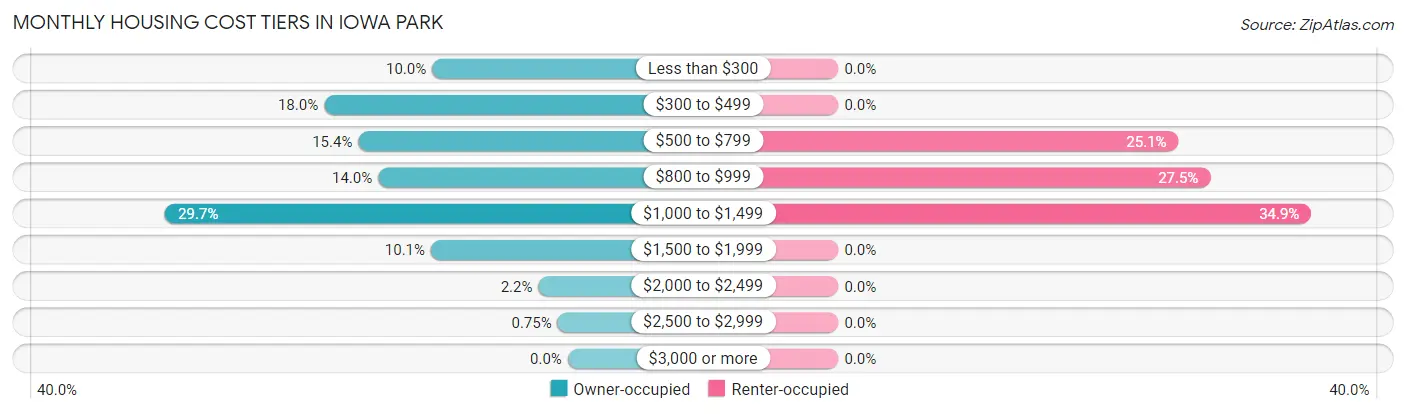
| Monthly Cost | Owner-occupied | Renter-occupied |
| Less than $300 | 226 (10.0%) | 0 (0.0%) |
| $300 to $499 | 406 (17.9%) | 0 (0.0%) |
| $500 to $799 | 349 (15.4%) | 118 (25.1%) |
| $800 to $999 | 316 (14.0%) | 129 (27.5%) |
| $1,000 to $1,499 | 671 (29.7%) | 164 (34.9%) |
| $1,500 to $1,999 | 228 (10.1%) | 0 (0.0%) |
| $2,000 to $2,499 | 49 (2.2%) | 0 (0.0%) |
| $2,500 to $2,999 | 17 (0.7%) | 0 (0.0%) |
| $3,000 or more | 0 (0.0%) | 0 (0.0%) |
| Total | 2,262 (100.0%) | 470 (100.0%) |
Physical Housing Characteristics in Iowa Park
Housing Structures in Iowa Park
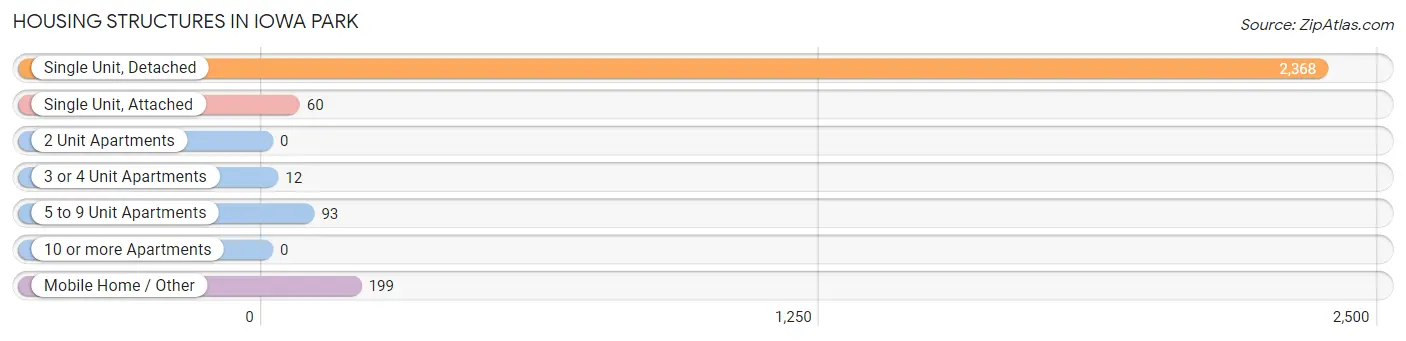
| Structure Type | # Housing Units | % Housing Units |
| Single Unit, Detached | 2,368 | 86.7% |
| Single Unit, Attached | 60 | 2.2% |
| 2 Unit Apartments | 0 | 0.0% |
| 3 or 4 Unit Apartments | 12 | 0.4% |
| 5 to 9 Unit Apartments | 93 | 3.4% |
| 10 or more Apartments | 0 | 0.0% |
| Mobile Home / Other | 199 | 7.3% |
| Total | 2,732 | 100.0% |
Housing Structures by Occupancy in Iowa Park
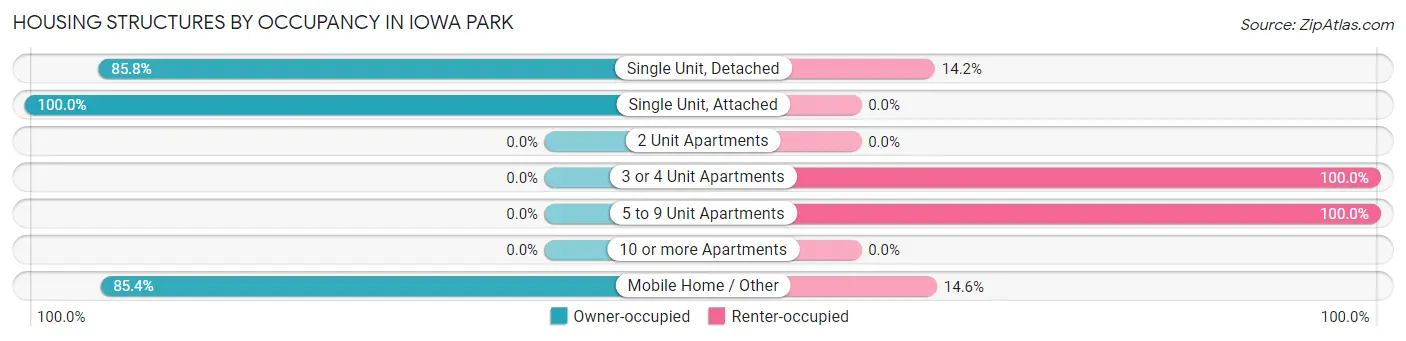
| Structure Type | Owner-occupied | Renter-occupied |
| Single Unit, Detached | 2,032 (85.8%) | 336 (14.2%) |
| Single Unit, Attached | 60 (100.0%) | 0 (0.0%) |
| 2 Unit Apartments | 0 (0.0%) | 0 (0.0%) |
| 3 or 4 Unit Apartments | 0 (0.0%) | 12 (100.0%) |
| 5 to 9 Unit Apartments | 0 (0.0%) | 93 (100.0%) |
| 10 or more Apartments | 0 (0.0%) | 0 (0.0%) |
| Mobile Home / Other | 170 (85.4%) | 29 (14.6%) |
| Total | 2,262 (82.8%) | 470 (17.2%) |
Housing Structures by Number of Rooms in Iowa Park
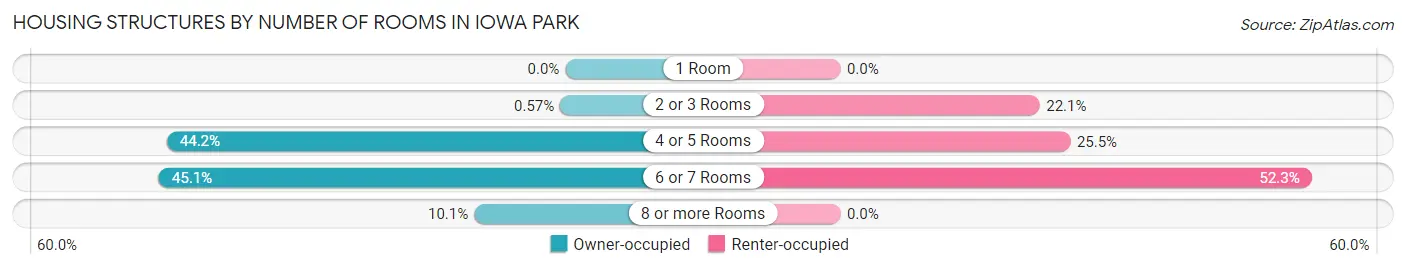
| Number of Rooms | Owner-occupied | Renter-occupied |
| 1 Room | 0 (0.0%) | 0 (0.0%) |
| 2 or 3 Rooms | 13 (0.6%) | 104 (22.1%) |
| 4 or 5 Rooms | 1,000 (44.2%) | 120 (25.5%) |
| 6 or 7 Rooms | 1,020 (45.1%) | 246 (52.3%) |
| 8 or more Rooms | 229 (10.1%) | 0 (0.0%) |
| Total | 2,262 (100.0%) | 470 (100.0%) |
Housing Structure by Heating Type in Iowa Park
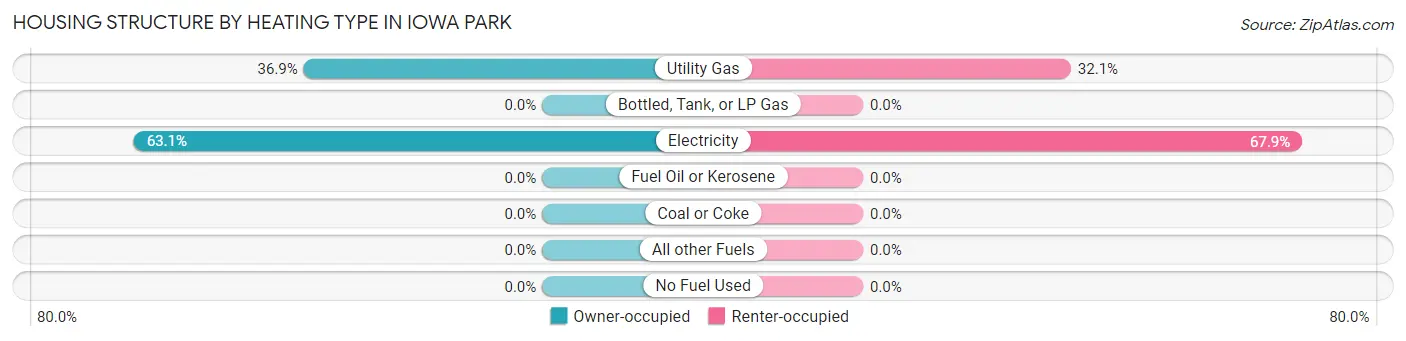
| Heating Type | Owner-occupied | Renter-occupied |
| Utility Gas | 834 (36.9%) | 151 (32.1%) |
| Bottled, Tank, or LP Gas | 0 (0.0%) | 0 (0.0%) |
| Electricity | 1,428 (63.1%) | 319 (67.9%) |
| Fuel Oil or Kerosene | 0 (0.0%) | 0 (0.0%) |
| Coal or Coke | 0 (0.0%) | 0 (0.0%) |
| All other Fuels | 0 (0.0%) | 0 (0.0%) |
| No Fuel Used | 0 (0.0%) | 0 (0.0%) |
| Total | 2,262 (100.0%) | 470 (100.0%) |
Household Vehicle Usage in Iowa Park
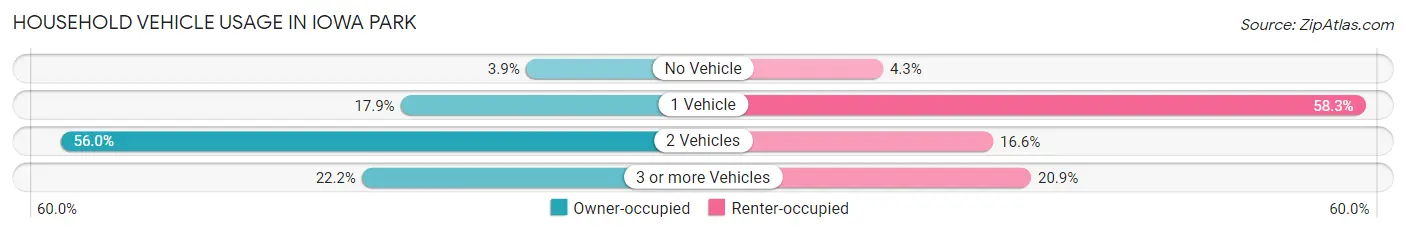
| Vehicles per Household | Owner-occupied | Renter-occupied |
| No Vehicle | 88 (3.9%) | 20 (4.3%) |
| 1 Vehicle | 405 (17.9%) | 274 (58.3%) |
| 2 Vehicles | 1,266 (56.0%) | 78 (16.6%) |
| 3 or more Vehicles | 503 (22.2%) | 98 (20.8%) |
| Total | 2,262 (100.0%) | 470 (100.0%) |
Real Estate & Mortgages in Iowa Park
Real Estate and Mortgage Overview in Iowa Park
| Characteristic | Without Mortgage | With Mortgage |
| Housing Units | 1,100 | 1,162 |
| Median Property Value | $106,000 | $123,800 |
| Median Household Income | $58,833 | $119 |
| Monthly Housing Costs | $413 | $0 |
| Real Estate Taxes | $1,353 | $50 |
Property Value by Mortgage Status in Iowa Park
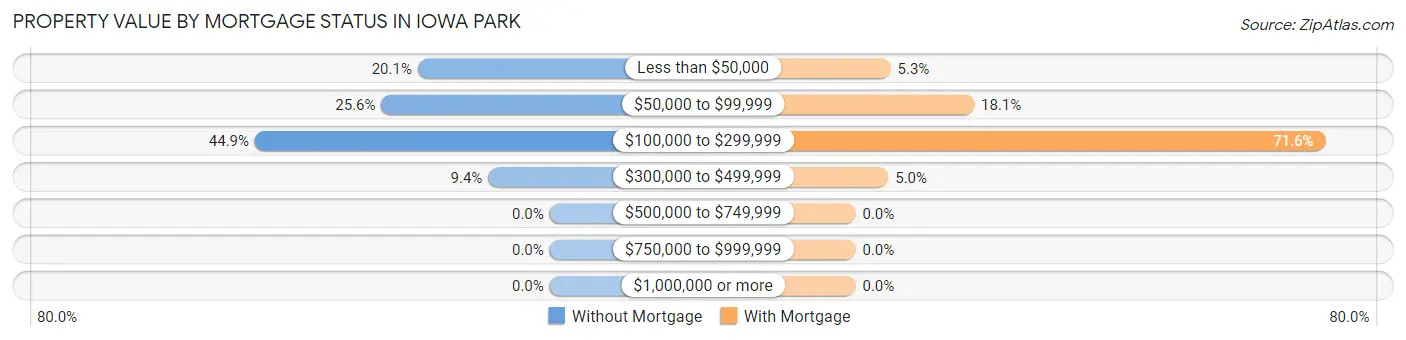
| Property Value | Without Mortgage | With Mortgage |
| Less than $50,000 | 221 (20.1%) | 62 (5.3%) |
| $50,000 to $99,999 | 282 (25.6%) | 210 (18.1%) |
| $100,000 to $299,999 | 494 (44.9%) | 832 (71.6%) |
| $300,000 to $499,999 | 103 (9.4%) | 58 (5.0%) |
| $500,000 to $749,999 | 0 (0.0%) | 0 (0.0%) |
| $750,000 to $999,999 | 0 (0.0%) | 0 (0.0%) |
| $1,000,000 or more | 0 (0.0%) | 0 (0.0%) |
| Total | 1,100 (100.0%) | 1,162 (100.0%) |
Household Income by Mortgage Status in Iowa Park
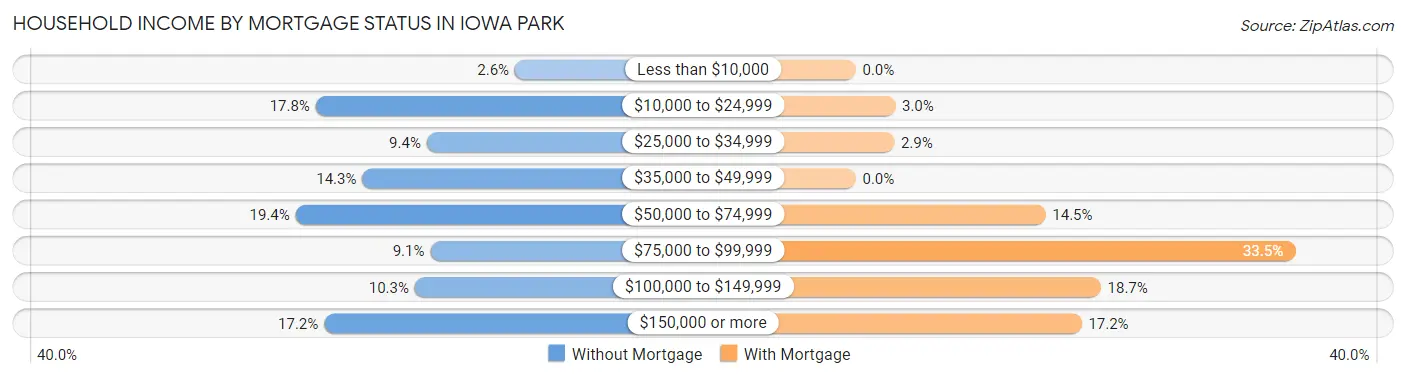
| Household Income | Without Mortgage | With Mortgage |
| Less than $10,000 | 29 (2.6%) | 0 (0.0%) |
| $10,000 to $24,999 | 196 (17.8%) | 35 (3.0%) |
| $25,000 to $34,999 | 103 (9.4%) | 34 (2.9%) |
| $35,000 to $49,999 | 157 (14.3%) | 0 (0.0%) |
| $50,000 to $74,999 | 213 (19.4%) | 168 (14.5%) |
| $75,000 to $99,999 | 100 (9.1%) | 389 (33.5%) |
| $100,000 to $149,999 | 113 (10.3%) | 217 (18.7%) |
| $150,000 or more | 189 (17.2%) | 200 (17.2%) |
| Total | 1,100 (100.0%) | 1,162 (100.0%) |
Property Value to Household Income Ratio in Iowa Park
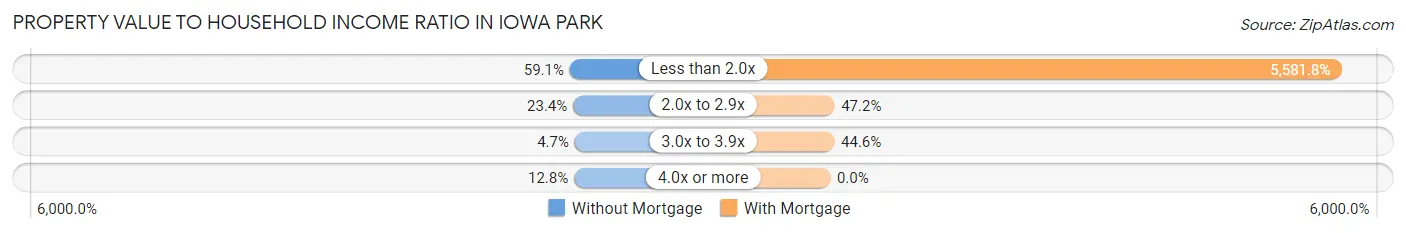
| Value-to-Income Ratio | Without Mortgage | With Mortgage |
| Less than 2.0x | 650 (59.1%) | 64,861 (5,581.8%) |
| 2.0x to 2.9x | 257 (23.4%) | 548 (47.2%) |
| 3.0x to 3.9x | 52 (4.7%) | 518 (44.6%) |
| 4.0x or more | 141 (12.8%) | 0 (0.0%) |
| Total | 1,100 (100.0%) | 1,162 (100.0%) |
Real Estate Taxes by Mortgage Status in Iowa Park
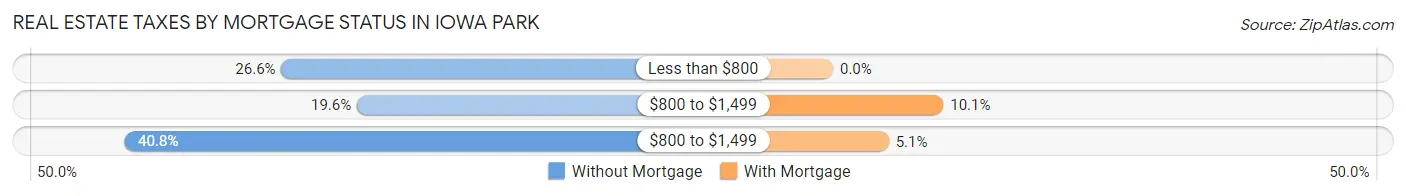
| Property Taxes | Without Mortgage | With Mortgage |
| Less than $800 | 292 (26.6%) | 0 (0.0%) |
| $800 to $1,499 | 216 (19.6%) | 117 (10.1%) |
| $800 to $1,499 | 449 (40.8%) | 59 (5.1%) |
| Total | 1,100 (100.0%) | 1,162 (100.0%) |
Health & Disability in Iowa Park
Health Insurance Coverage by Age in Iowa Park
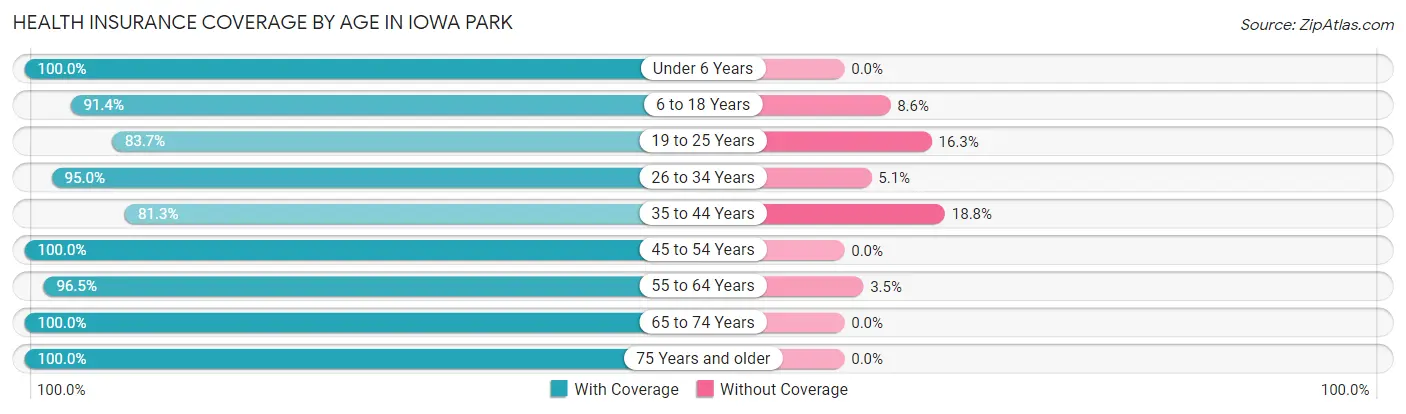
| Age Bracket | With Coverage | Without Coverage |
| Under 6 Years | 617 (100.0%) | 0 (0.0%) |
| 6 to 18 Years | 811 (91.4%) | 76 (8.6%) |
| 19 to 25 Years | 499 (83.7%) | 97 (16.3%) |
| 26 to 34 Years | 677 (95.0%) | 36 (5.1%) |
| 35 to 44 Years | 598 (81.2%) | 138 (18.8%) |
| 45 to 54 Years | 853 (100.0%) | 0 (0.0%) |
| 55 to 64 Years | 875 (96.5%) | 32 (3.5%) |
| 65 to 74 Years | 526 (100.0%) | 0 (0.0%) |
| 75 Years and older | 583 (100.0%) | 0 (0.0%) |
| Total | 6,039 (94.1%) | 379 (5.9%) |
Health Insurance Coverage by Citizenship Status in Iowa Park
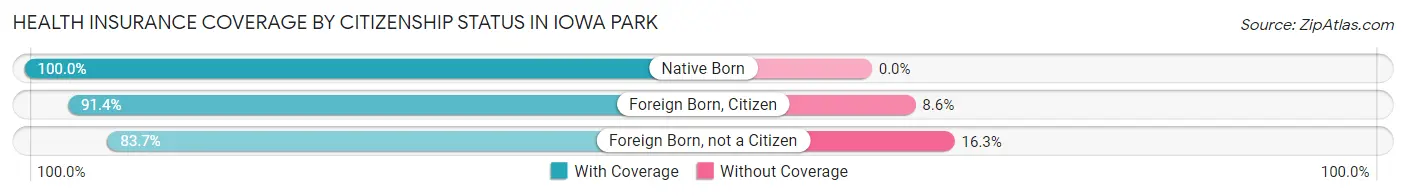
| Citizenship Status | With Coverage | Without Coverage |
| Native Born | 617 (100.0%) | 0 (0.0%) |
| Foreign Born, Citizen | 811 (91.4%) | 76 (8.6%) |
| Foreign Born, not a Citizen | 499 (83.7%) | 97 (16.3%) |
Health Insurance Coverage by Household Income in Iowa Park
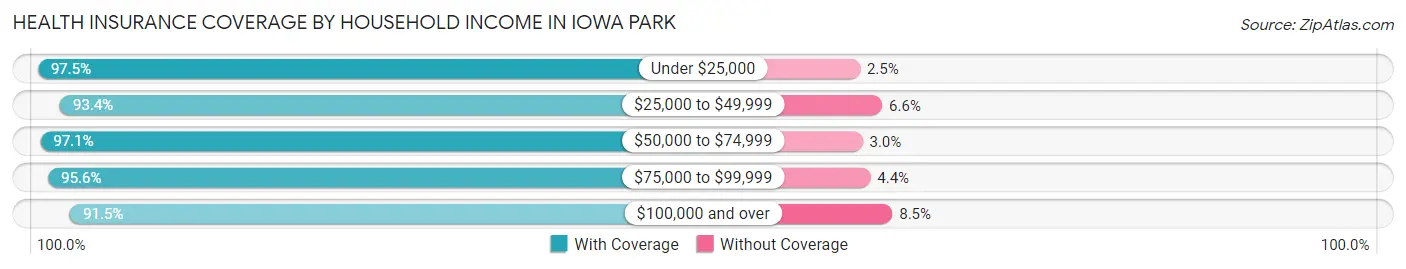
| Household Income | With Coverage | Without Coverage |
| Under $25,000 | 592 (97.5%) | 15 (2.5%) |
| $25,000 to $49,999 | 1,128 (93.4%) | 80 (6.6%) |
| $50,000 to $74,999 | 1,084 (97.1%) | 33 (2.9%) |
| $75,000 to $99,999 | 1,061 (95.6%) | 49 (4.4%) |
| $100,000 and over | 2,168 (91.5%) | 202 (8.5%) |
Public vs Private Health Insurance Coverage by Age in Iowa Park
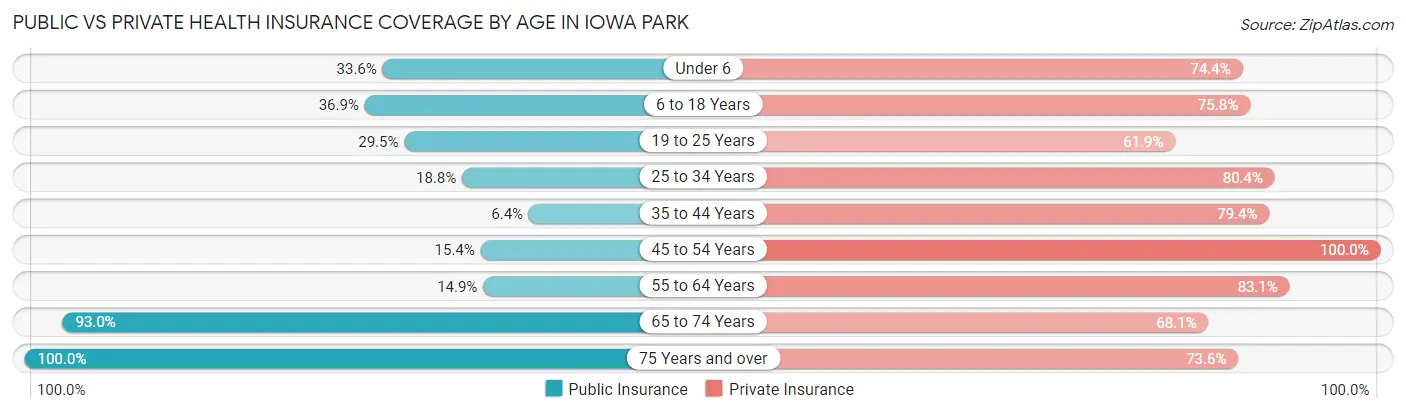
| Age Bracket | Public Insurance | Private Insurance |
| Under 6 | 207 (33.6%) | 459 (74.4%) |
| 6 to 18 Years | 327 (36.9%) | 672 (75.8%) |
| 19 to 25 Years | 176 (29.5%) | 369 (61.9%) |
| 25 to 34 Years | 134 (18.8%) | 573 (80.4%) |
| 35 to 44 Years | 47 (6.4%) | 584 (79.3%) |
| 45 to 54 Years | 131 (15.4%) | 853 (100.0%) |
| 55 to 64 Years | 135 (14.9%) | 754 (83.1%) |
| 65 to 74 Years | 489 (93.0%) | 358 (68.1%) |
| 75 Years and over | 583 (100.0%) | 429 (73.6%) |
| Total | 2,229 (34.7%) | 5,051 (78.7%) |
Disability Status by Sex by Age in Iowa Park
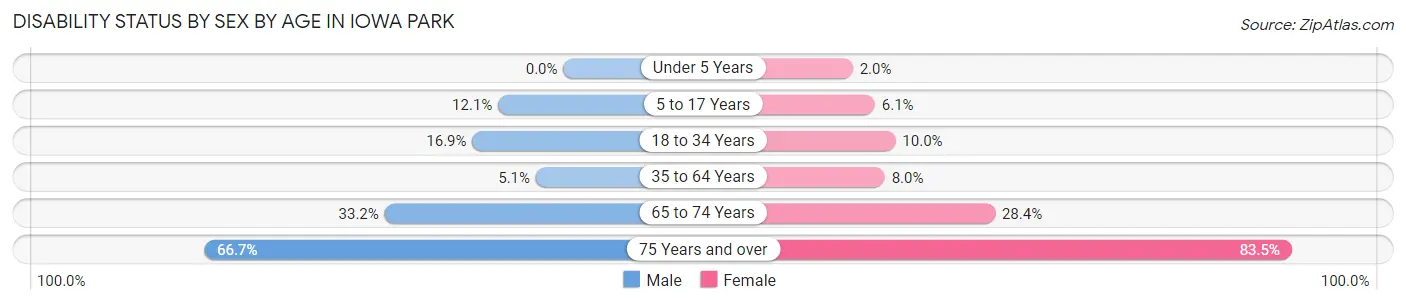
| Age Bracket | Male | Female |
| Under 5 Years | 0 (0.0%) | 5 (2.0%) |
| 5 to 17 Years | 72 (12.1%) | 23 (6.1%) |
| 18 to 34 Years | 100 (16.9%) | 75 (10.0%) |
| 35 to 64 Years | 62 (5.1%) | 102 (8.0%) |
| 65 to 74 Years | 73 (33.2%) | 87 (28.4%) |
| 75 Years and over | 118 (66.7%) | 339 (83.5%) |
Disability Class by Sex by Age in Iowa Park
Disability Class: Hearing Difficulty
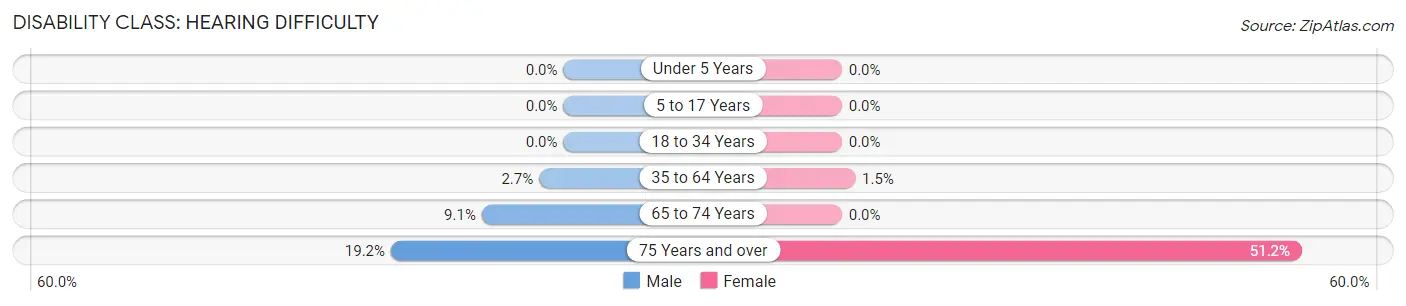
| Age Bracket | Male | Female |
| Under 5 Years | 0 (0.0%) | 0 (0.0%) |
| 5 to 17 Years | 0 (0.0%) | 0 (0.0%) |
| 18 to 34 Years | 0 (0.0%) | 0 (0.0%) |
| 35 to 64 Years | 33 (2.7%) | 19 (1.5%) |
| 65 to 74 Years | 20 (9.1%) | 0 (0.0%) |
| 75 Years and over | 34 (19.2%) | 208 (51.2%) |
Disability Class: Vision Difficulty
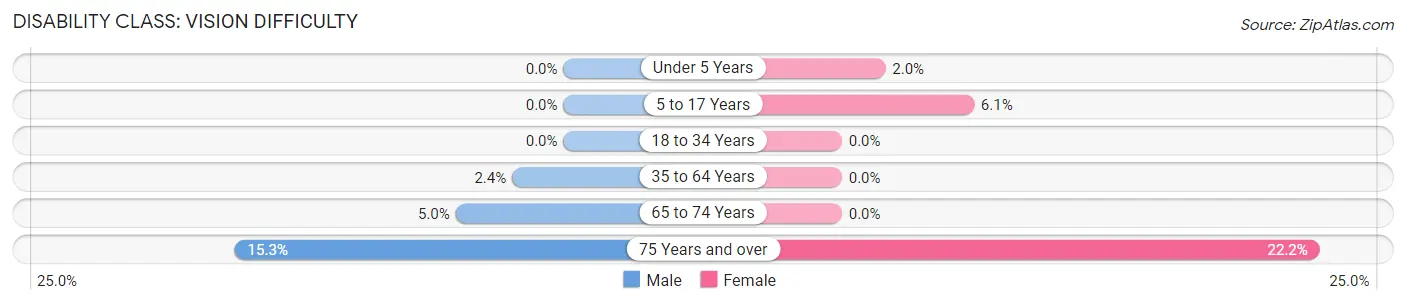
| Age Bracket | Male | Female |
| Under 5 Years | 0 (0.0%) | 5 (2.0%) |
| 5 to 17 Years | 0 (0.0%) | 23 (6.1%) |
| 18 to 34 Years | 0 (0.0%) | 0 (0.0%) |
| 35 to 64 Years | 29 (2.4%) | 0 (0.0%) |
| 65 to 74 Years | 11 (5.0%) | 0 (0.0%) |
| 75 Years and over | 27 (15.2%) | 90 (22.2%) |
Disability Class: Cognitive Difficulty
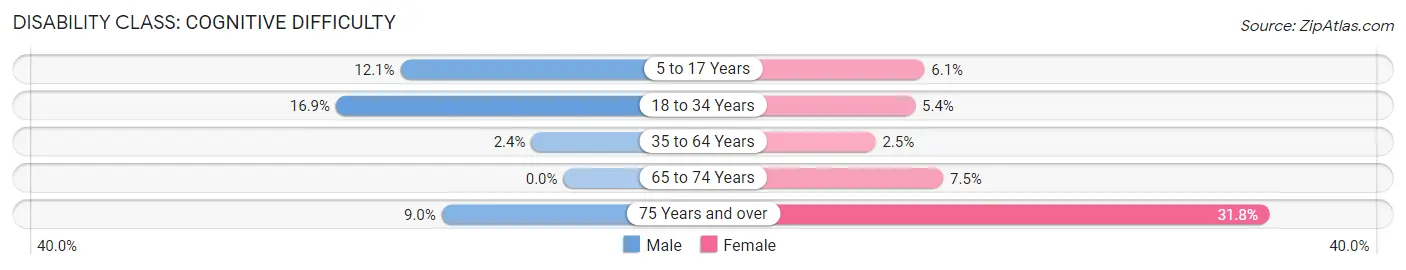
| Age Bracket | Male | Female |
| 5 to 17 Years | 72 (12.1%) | 23 (6.1%) |
| 18 to 34 Years | 100 (16.9%) | 41 (5.4%) |
| 35 to 64 Years | 29 (2.4%) | 32 (2.5%) |
| 65 to 74 Years | 0 (0.0%) | 23 (7.5%) |
| 75 Years and over | 16 (9.0%) | 129 (31.8%) |
Disability Class: Ambulatory Difficulty
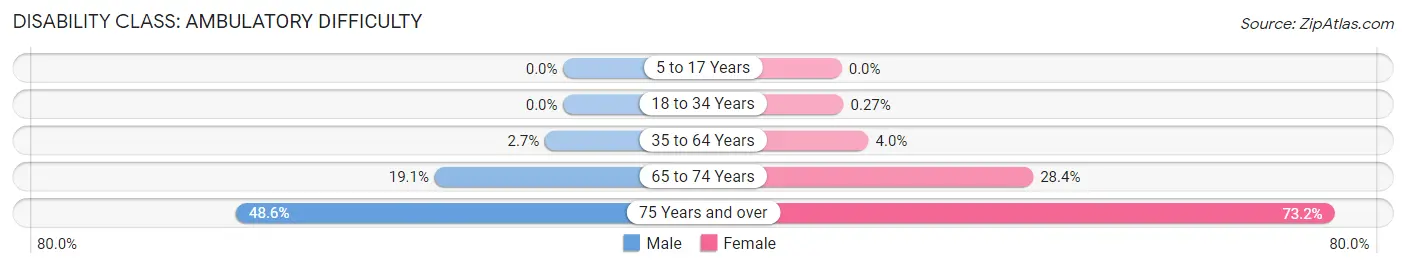
| Age Bracket | Male | Female |
| 5 to 17 Years | 0 (0.0%) | 0 (0.0%) |
| 18 to 34 Years | 0 (0.0%) | 2 (0.3%) |
| 35 to 64 Years | 33 (2.7%) | 51 (4.0%) |
| 65 to 74 Years | 42 (19.1%) | 87 (28.4%) |
| 75 Years and over | 86 (48.6%) | 297 (73.2%) |
Disability Class: Self-Care Difficulty
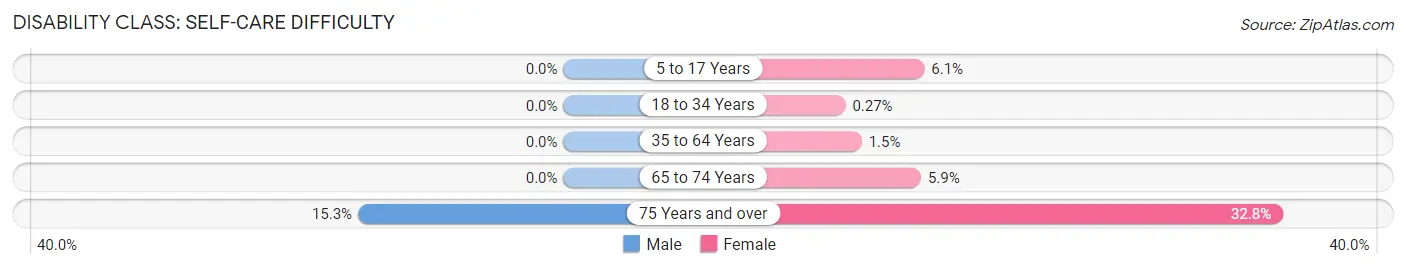
| Age Bracket | Male | Female |
| 5 to 17 Years | 0 (0.0%) | 23 (6.1%) |
| 18 to 34 Years | 0 (0.0%) | 2 (0.3%) |
| 35 to 64 Years | 0 (0.0%) | 19 (1.5%) |
| 65 to 74 Years | 0 (0.0%) | 18 (5.9%) |
| 75 Years and over | 27 (15.2%) | 133 (32.8%) |
Technology Access in Iowa Park
Computing Device Access in Iowa Park
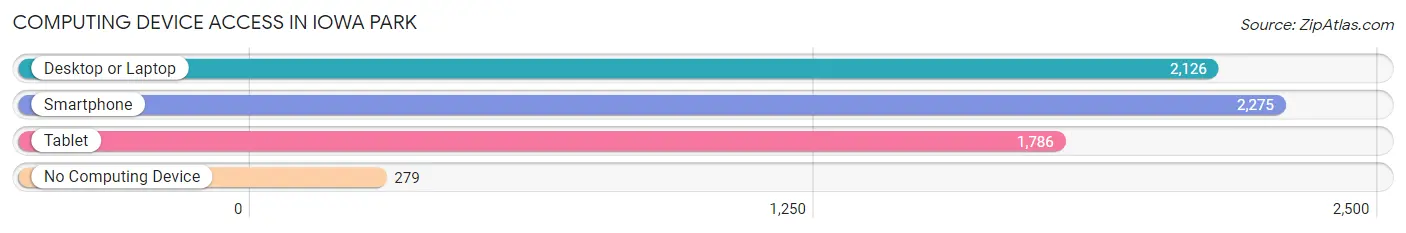
| Device Type | # Households | % Households |
| Desktop or Laptop | 2,126 | 77.8% |
| Smartphone | 2,275 | 83.3% |
| Tablet | 1,786 | 65.4% |
| No Computing Device | 279 | 10.2% |
| Total | 2,732 | 100.0% |
Internet Access in Iowa Park
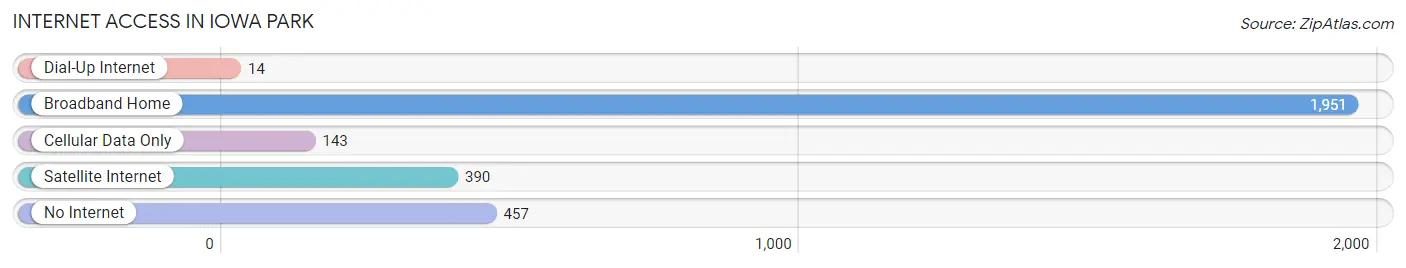
| Internet Type | # Households | % Households |
| Dial-Up Internet | 14 | 0.5% |
| Broadband Home | 1,951 | 71.4% |
| Cellular Data Only | 143 | 5.2% |
| Satellite Internet | 390 | 14.3% |
| No Internet | 457 | 16.7% |
| Total | 2,732 | 100.0% |
Iowa Park Summary
I Introduction
The city of Iowa Park, Texas is located in Wichita County in the north-central part of the state. It is situated on the western edge of the Wichita Falls metropolitan area and is home to a population of just over 6,000 people. The city is known for its small-town charm and its close proximity to the larger city of Wichita Falls. Iowa Park is a great place to live, work, and play, and its history, geography, economy, and demographics are all important aspects of the city’s identity.
II History
Iowa Park was founded in 1882 by a group of settlers from Iowa. The town was originally called “Iowa Colony” and was located on the banks of the Wichita River. The settlers were attracted to the area due to its fertile soil and abundant water supply. The town was officially incorporated in 1891 and was renamed “Iowa Park” in 1895.
The city’s economy was initially based on agriculture, but it soon diversified to include other industries such as oil and gas, manufacturing, and retail. The city’s population grew steadily throughout the 20th century, reaching a peak of 8,000 in the 1970s.
The city has a rich history of education, with the first school being established in 1883. The city is also home to Midwestern State University, which was founded in 1922.
III Geography
Iowa Park is located in the north-central part of Texas, approximately 100 miles northwest of Dallas. The city is situated on the western edge of the Wichita Falls metropolitan area and is bordered by the cities of Burkburnett, Wichita Falls, and Electra.
The city covers an area of 8.3 square miles and is located at an elevation of 1,000 feet. The climate is semi-arid, with hot summers and mild winters. The average annual temperature is 68 degrees Fahrenheit.
The city is located in the Red River Valley, which is a major agricultural region. The city is also located near Lake Arrowhead, which is a popular recreational area.
IV Economy
The economy of Iowa Park is largely based on agriculture, manufacturing, and retail. The city is home to several large employers, including Tyson Foods, Inc., which is the largest employer in the city. Other major employers include Walmart, Lowe’s, and the Iowa Park Independent School District.
The city is also home to several small businesses, including restaurants, shops, and other services. The city’s economy is also supported by tourism, as the city is located near several popular attractions, such as Lake Arrowhead and the Wichita Falls Museum of Art.
V Demographics
As of the 2010 census, the population of Iowa Park was 6,072. The population is predominantly white (90.2%), with a small percentage of African Americans (3.2%), Hispanics (3.1%), and Asians (1.2%). The median household income is $41,945, and the median age is 37.
The city is home to several churches, including the First United Methodist Church, the First Baptist Church, and the Church of Christ. The city is also home to several schools, including Iowa Park High School, Iowa Park Middle School, and Iowa Park Elementary School.
VI Conclusion
Iowa Park, Texas is a small city located in the north-central part of the state. The city is known for its small-town charm and its close proximity to the larger city of Wichita Falls. The city’s history, geography, economy, and demographics are all important aspects of the city’s identity. The city is home to several large employers, including Tyson Foods, Inc., and is also supported by tourism and small businesses. The population of Iowa Park is predominantly white, with a small percentage of African Americans, Hispanics, and Asians. The city is home to several churches and schools, and is a great place to live, work, and play.
Common Questions
What is Per Capita Income in Iowa Park?
Per Capita income in Iowa Park is $34,128.
What is the Median Family Income in Iowa Park?
Median Family Income in Iowa Park is $87,135.
What is the Median Household income in Iowa Park?
Median Household Income in Iowa Park is $61,667.
What is Income or Wage Gap in Iowa Park?
Income or Wage Gap in Iowa Park is 30.5%.
Women in Iowa Park earn 69.5 cents for every dollar earned by a man.
What is Inequality or Gini Index in Iowa Park?
Inequality or Gini Index in Iowa Park is 0.40.
What is the Total Population of Iowa Park?
Total Population of Iowa Park is 6,529.
What is the Total Male Population of Iowa Park?
Total Male Population of Iowa Park is 3,134.
What is the Total Female Population of Iowa Park?
Total Female Population of Iowa Park is 3,395.
What is the Ratio of Males per 100 Females in Iowa Park?
There are 92.31 Males per 100 Females in Iowa Park.
What is the Ratio of Females per 100 Males in Iowa Park?
There are 108.33 Females per 100 Males in Iowa Park.
What is the Median Population Age in Iowa Park?
Median Population Age in Iowa Park is 40.2 Years.
What is the Average Family Size in Iowa Park
Average Family Size in Iowa Park is 3.1 People.
What is the Average Household Size in Iowa Park
Average Household Size in Iowa Park is 2.4 People.
How Large is the Labor Force in Iowa Park?
There are 3,760 People in the Labor Forcein in Iowa Park.
What is the Percentage of People in the Labor Force in Iowa Park?
73.9% of People are in the Labor Force in Iowa Park.
What is the Unemployment Rate in Iowa Park?
Unemployment Rate in Iowa Park is 1.8%.