Ingram, TX Map & Demographics
Ingram Map
Ingram Overview
$21,876
PER CAPITA INCOME
$54,464
AVG FAMILY INCOME
$46,051
AVG HOUSEHOLD INCOME
40.9%
WAGE / INCOME GAP [ % ]
59.1¢/ $1
WAGE / INCOME GAP [ $ ]
$13,249
FAMILY INCOME DEFICIT
0.42
INEQUALITY / GINI INDEX
2,003
TOTAL POPULATION
995
MALE POPULATION
1,008
FEMALE POPULATION
98.71
MALES / 100 FEMALES
101.31
FEMALES / 100 MALES
34.0
MEDIAN AGE
3.5
AVG FAMILY SIZE
2.9
AVG HOUSEHOLD SIZE
1,070
LABOR FORCE [ PEOPLE ]
69.0%
PERCENT IN LABOR FORCE
4.4%
UNEMPLOYMENT RATE
Ingram Zip Codes
Ingram Area Codes
Income in Ingram
Income Overview in Ingram
Per Capita Income in Ingram is $21,876, while median incomes of families and households are $54,464 and $46,051 respectively.
| Characteristic | Number | Measure |
| Per Capita Income | 2,003 | $21,876 |
| Median Family Income | 516 | $54,464 |
| Mean Family Income | 516 | $64,957 |
| Median Household Income | 695 | $46,051 |
| Mean Household Income | 695 | $59,064 |
| Income Deficit | 516 | $13,249 |
| Wage / Income Gap (%) | 2,003 | 40.92% |
| Wage / Income Gap ($) | 2,003 | 59.08¢ per $1 |
| Gini / Inequality Index | 2,003 | 0.42 |
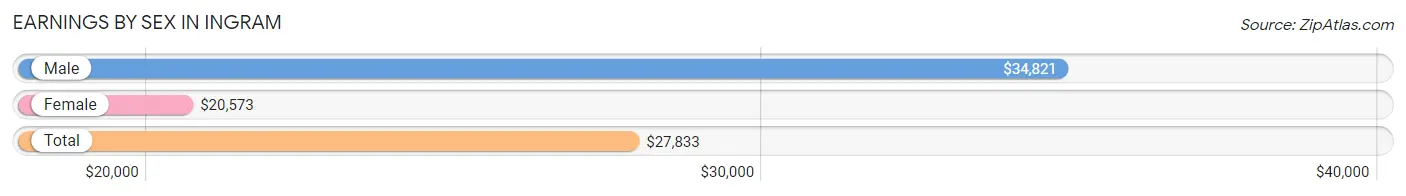
Earnings by Sex in Ingram
Average Earnings in Ingram are $27,833, $34,821 for men and $20,573 for women, a difference of 40.9%.
| Sex | Number | Average Earnings |
| Male | 573 (52.6%) | $34,821 |
| Female | 517 (47.4%) | $20,573 |
| Total | 1,090 (100.0%) | $27,833 |
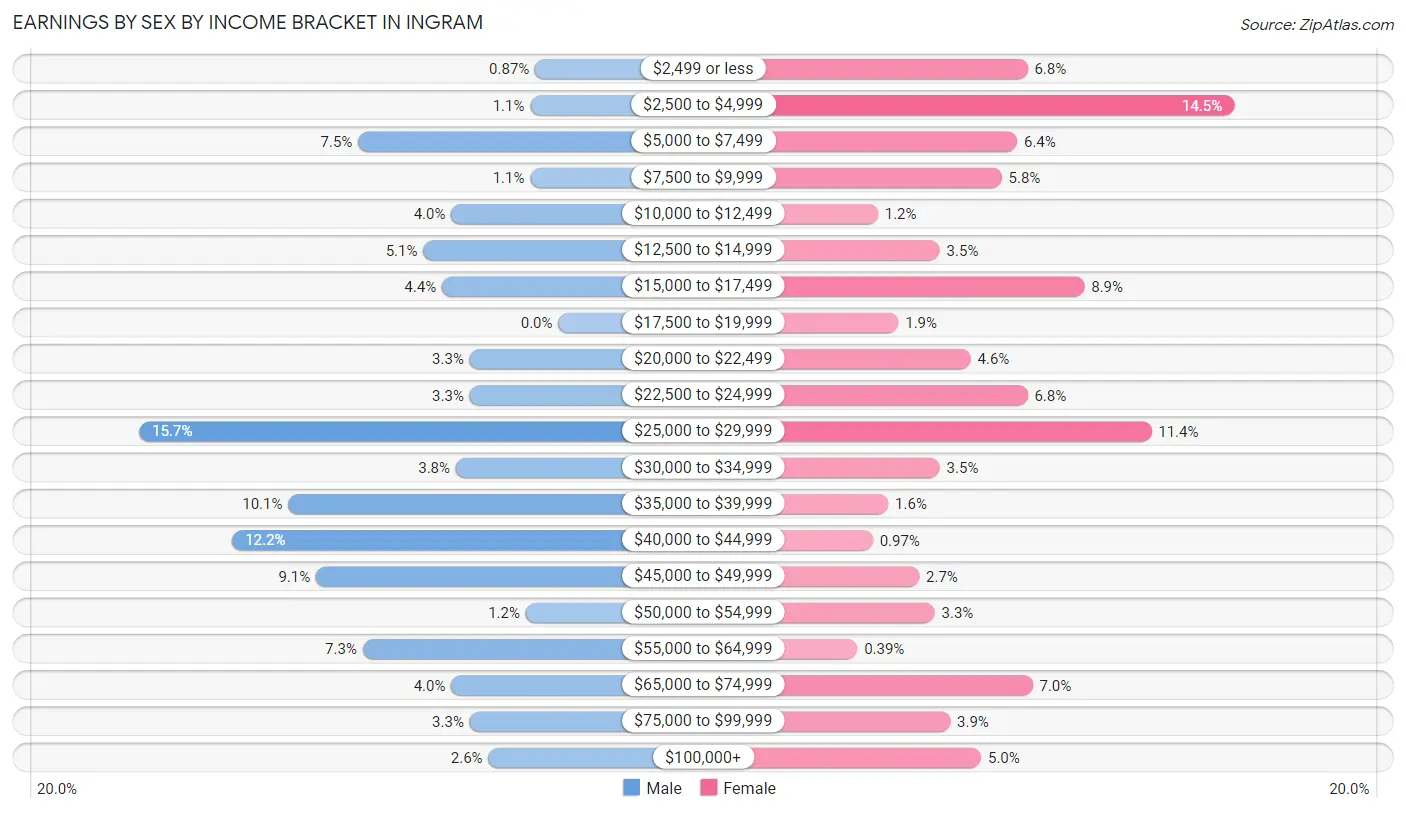
Earnings by Sex by Income Bracket in Ingram
The most common earnings brackets in Ingram are $25,000 to $29,999 for men (90 | 15.7%) and $2,500 to $4,999 for women (75 | 14.5%).
| Income | Male | Female |
| $2,499 or less | 5 (0.9%) | 35 (6.8%) |
| $2,500 to $4,999 | 6 (1.1%) | 75 (14.5%) |
| $5,000 to $7,499 | 43 (7.5%) | 33 (6.4%) |
| $7,500 to $9,999 | 6 (1.1%) | 30 (5.8%) |
| $10,000 to $12,499 | 23 (4.0%) | 6 (1.2%) |
| $12,500 to $14,999 | 29 (5.1%) | 18 (3.5%) |
| $15,000 to $17,499 | 25 (4.4%) | 46 (8.9%) |
| $17,500 to $19,999 | 0 (0.0%) | 10 (1.9%) |
| $20,000 to $22,499 | 19 (3.3%) | 24 (4.6%) |
| $22,500 to $24,999 | 19 (3.3%) | 35 (6.8%) |
| $25,000 to $29,999 | 90 (15.7%) | 59 (11.4%) |
| $30,000 to $34,999 | 22 (3.8%) | 18 (3.5%) |
| $35,000 to $39,999 | 58 (10.1%) | 8 (1.5%) |
| $40,000 to $44,999 | 70 (12.2%) | 5 (1.0%) |
| $45,000 to $49,999 | 52 (9.1%) | 14 (2.7%) |
| $50,000 to $54,999 | 7 (1.2%) | 17 (3.3%) |
| $55,000 to $64,999 | 42 (7.3%) | 2 (0.4%) |
| $65,000 to $74,999 | 23 (4.0%) | 36 (7.0%) |
| $75,000 to $99,999 | 19 (3.3%) | 20 (3.9%) |
| $100,000+ | 15 (2.6%) | 26 (5.0%) |
| Total | 573 (100.0%) | 517 (100.0%) |
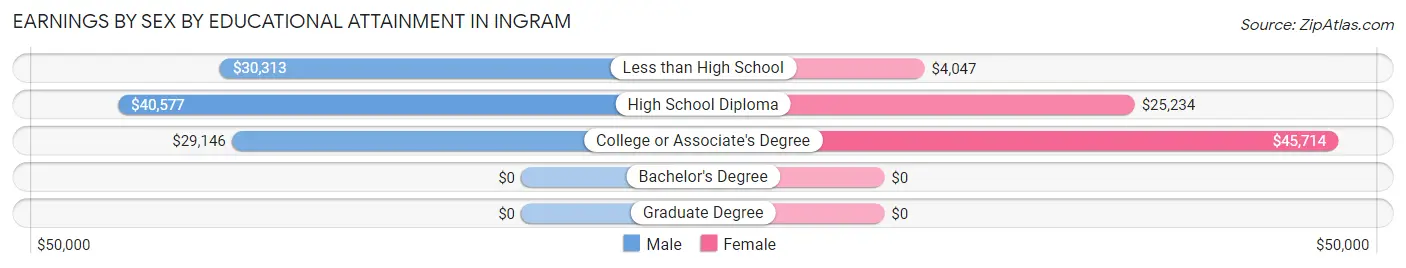
Earnings by Sex by Educational Attainment in Ingram
Average earnings in Ingram are $37,297 for men and $23,107 for women, a difference of 38.1%. Men with an educational attainment of high school diploma enjoy the highest average annual earnings of $40,577, while those with college or associate's degree education earn the least with $29,146. Women with an educational attainment of college or associate's degree earn the most with the average annual earnings of $45,714, while those with less than high school education have the smallest earnings of $4,047.
| Educational Attainment | Male Income | Female Income |
| Less than High School | $30,313 | $4,047 |
| High School Diploma | $40,577 | $25,234 |
| College or Associate's Degree | $29,146 | $45,714 |
| Bachelor's Degree | - | - |
| Graduate Degree | - | - |
| Total | $37,297 | $23,107 |
Family Income in Ingram
Family Income Brackets in Ingram
According to the Ingram family income data, there are 104 families falling into the $100,000 to $149,999 income range, which is the most common income bracket and makes up 20.2% of all families. Conversely, the $200,000+ income bracket is the least frequent group with only 6 families (1.2%) belonging to this category.
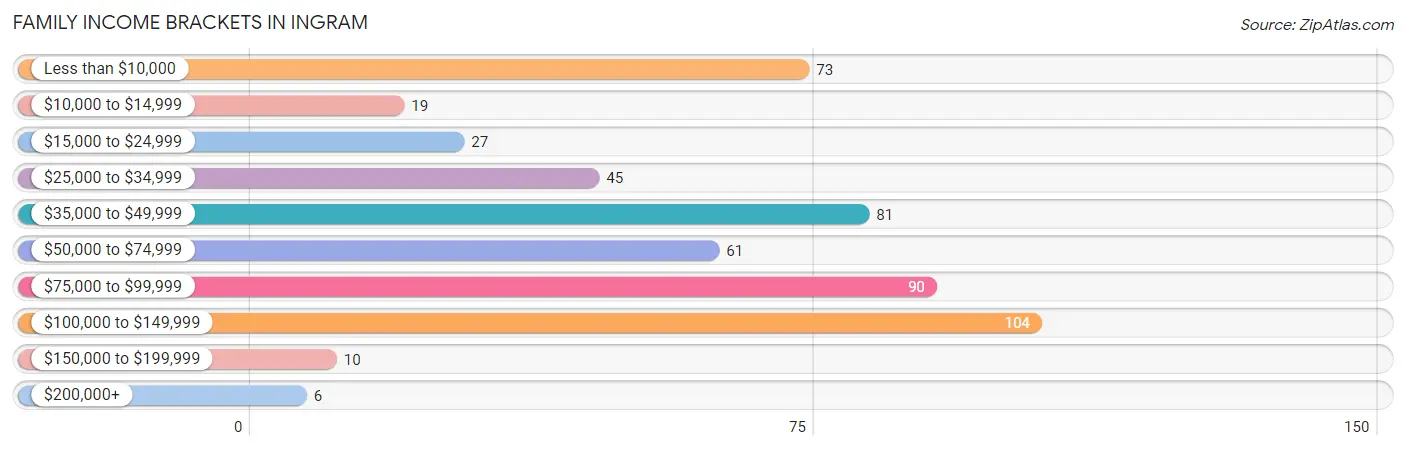
| Income Bracket | # Families | % Families |
| Less than $10,000 | 73 | 14.1% |
| $10,000 to $14,999 | 19 | 3.7% |
| $15,000 to $24,999 | 27 | 5.2% |
| $25,000 to $34,999 | 45 | 8.7% |
| $35,000 to $49,999 | 81 | 15.7% |
| $50,000 to $74,999 | 61 | 11.8% |
| $75,000 to $99,999 | 90 | 17.4% |
| $100,000 to $149,999 | 104 | 20.2% |
| $150,000 to $199,999 | 10 | 1.9% |
| $200,000+ | 6 | 1.2% |
Family Income by Famaliy Size in Ingram
4-person families (91 | 17.6%) account for the highest median family income in Ingram with $77,750 per family, while 3-person families (80 | 15.5%) have the highest median income of $24,792 per family member.
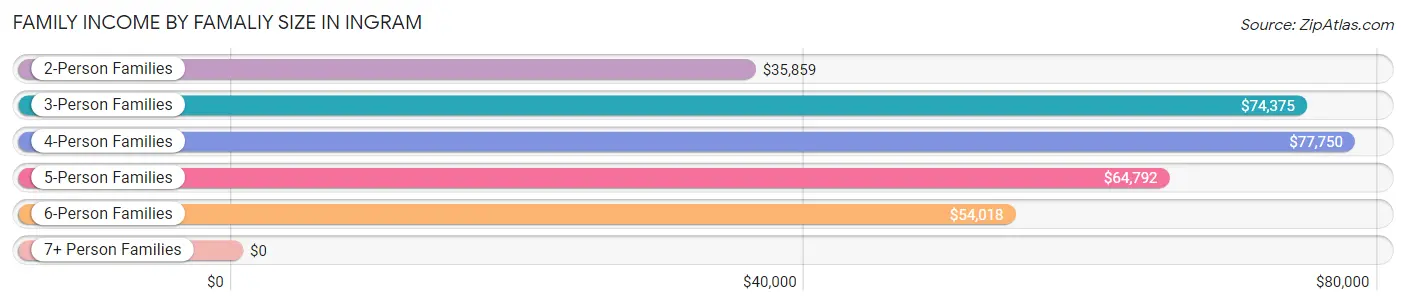
| Income Bracket | # Families | Median Income |
| 2-Person Families | 225 (43.6%) | $35,859 |
| 3-Person Families | 80 (15.5%) | $74,375 |
| 4-Person Families | 91 (17.6%) | $77,750 |
| 5-Person Families | 86 (16.7%) | $64,792 |
| 6-Person Families | 21 (4.1%) | $54,018 |
| 7+ Person Families | 13 (2.5%) | $0 |
| Total | 516 (100.0%) | $54,464 |
Family Income by Number of Earners in Ingram
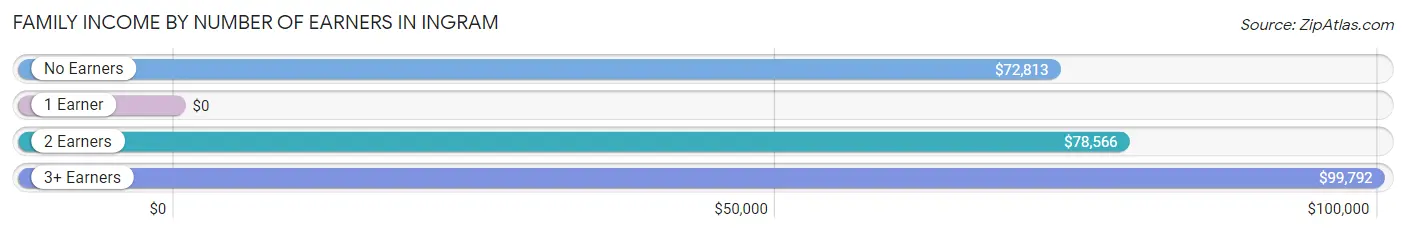
| Number of Earners | # Families | Median Income |
| No Earners | 40 (7.7%) | $72,813 |
| 1 Earner | 189 (36.6%) | $0 |
| 2 Earners | 223 (43.2%) | $78,566 |
| 3+ Earners | 64 (12.4%) | $99,792 |
| Total | 516 (100.0%) | $54,464 |
Household Income in Ingram
Household Income Brackets in Ingram
With 121 households falling in the category, the $25,000 to $34,999 income range is the most frequent in Ingram, accounting for 17.4% of all households. In contrast, only 6 households (0.9%) fall into the $200,000+ income bracket, making it the least populous group.
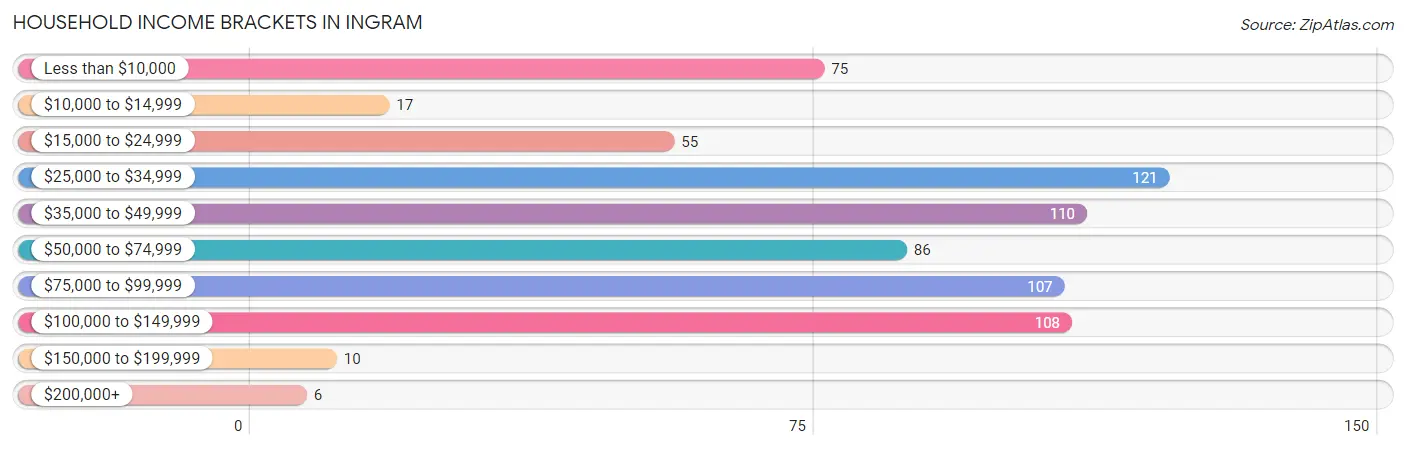
| Income Bracket | # Households | % Households |
| Less than $10,000 | 75 | 10.8% |
| $10,000 to $14,999 | 17 | 2.4% |
| $15,000 to $24,999 | 55 | 7.9% |
| $25,000 to $34,999 | 121 | 17.4% |
| $35,000 to $49,999 | 110 | 15.8% |
| $50,000 to $74,999 | 86 | 12.4% |
| $75,000 to $99,999 | 107 | 15.4% |
| $100,000 to $149,999 | 108 | 15.5% |
| $150,000 to $199,999 | 10 | 1.4% |
| $200,000+ | 6 | 0.9% |
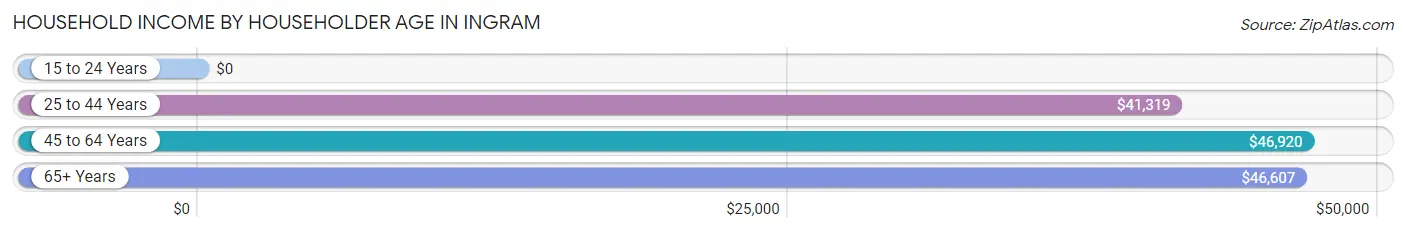
Household Income by Householder Age in Ingram
The median household income in Ingram is $46,051, with the highest median household income of $46,920 found in the 45 to 64 years age bracket for the primary householder. A total of 313 households (45.0%) fall into this category. Meanwhile, the 15 to 24 years age bracket for the primary householder has the lowest median household income of $0, with 7 households (1.0%) in this group.
| Income Bracket | # Households | Median Income |
| 15 to 24 Years | 7 (1.0%) | $0 |
| 25 to 44 Years | 253 (36.4%) | $41,319 |
| 45 to 64 Years | 313 (45.0%) | $46,920 |
| 65+ Years | 122 (17.5%) | $46,607 |
| Total | 695 (100.0%) | $46,051 |
Poverty in Ingram
Income Below Poverty by Sex and Age in Ingram
With 15.1% poverty level for males and 18.7% for females among the residents of Ingram, 5 year old males and 12 to 14 year old females are the most vulnerable to poverty, with 4 males (100.0%) and 10 females (41.7%) in their respective age groups living below the poverty level.
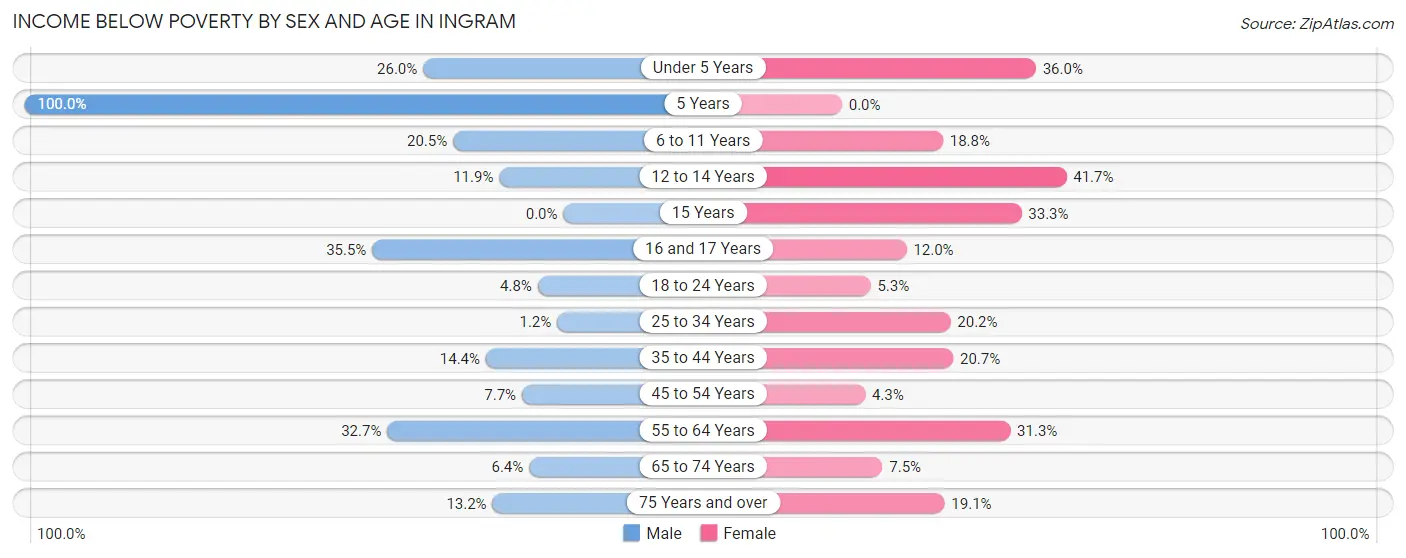
| Age Bracket | Male | Female |
| Under 5 Years | 19 (26.0%) | 18 (36.0%) |
| 5 Years | 4 (100.0%) | 0 (0.0%) |
| 6 to 11 Years | 17 (20.5%) | 24 (18.8%) |
| 12 to 14 Years | 5 (11.9%) | 10 (41.7%) |
| 15 Years | 0 (0.0%) | 4 (33.3%) |
| 16 and 17 Years | 11 (35.5%) | 6 (12.0%) |
| 18 to 24 Years | 4 (4.8%) | 5 (5.3%) |
| 25 to 34 Years | 2 (1.2%) | 27 (20.2%) |
| 35 to 44 Years | 21 (14.4%) | 19 (20.6%) |
| 45 to 54 Years | 7 (7.7%) | 4 (4.3%) |
| 55 to 64 Years | 51 (32.7%) | 60 (31.2%) |
| 65 to 74 Years | 4 (6.4%) | 7 (7.5%) |
| 75 Years and over | 5 (13.2%) | 4 (19.1%) |
| Total | 150 (15.1%) | 188 (18.7%) |
Income Above Poverty by Sex and Age in Ingram
According to the poverty statistics in Ingram, males aged 15 years and females aged 5 years are the age groups that are most secure financially, with 100.0% of males and 100.0% of females in these age groups living above the poverty line.
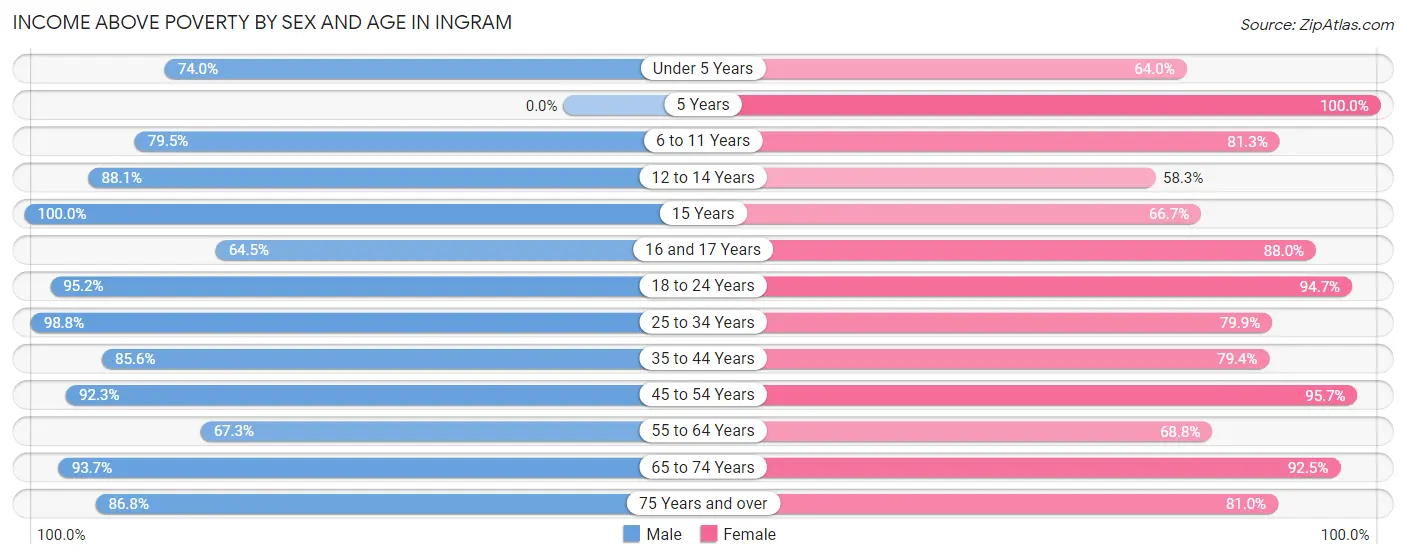
| Age Bracket | Male | Female |
| Under 5 Years | 54 (74.0%) | 32 (64.0%) |
| 5 Years | 0 (0.0%) | 23 (100.0%) |
| 6 to 11 Years | 66 (79.5%) | 104 (81.2%) |
| 12 to 14 Years | 37 (88.1%) | 14 (58.3%) |
| 15 Years | 8 (100.0%) | 8 (66.7%) |
| 16 and 17 Years | 20 (64.5%) | 44 (88.0%) |
| 18 to 24 Years | 80 (95.2%) | 89 (94.7%) |
| 25 to 34 Years | 171 (98.8%) | 107 (79.8%) |
| 35 to 44 Years | 125 (85.6%) | 73 (79.3%) |
| 45 to 54 Years | 84 (92.3%) | 89 (95.7%) |
| 55 to 64 Years | 105 (67.3%) | 132 (68.8%) |
| 65 to 74 Years | 59 (93.6%) | 86 (92.5%) |
| 75 Years and over | 33 (86.8%) | 17 (80.9%) |
| Total | 842 (84.9%) | 818 (81.3%) |
Income Below Poverty Among Married-Couple Families in Ingram
The poverty statistics for married-couple families in Ingram show that 19.9% or 80 of the total 402 families live below the poverty line. Families with no children have the highest poverty rate of 29.9%, comprising of 66 families. On the other hand, families with 1 or 2 children have the lowest poverty rate of 2.0%, which includes 2 families.
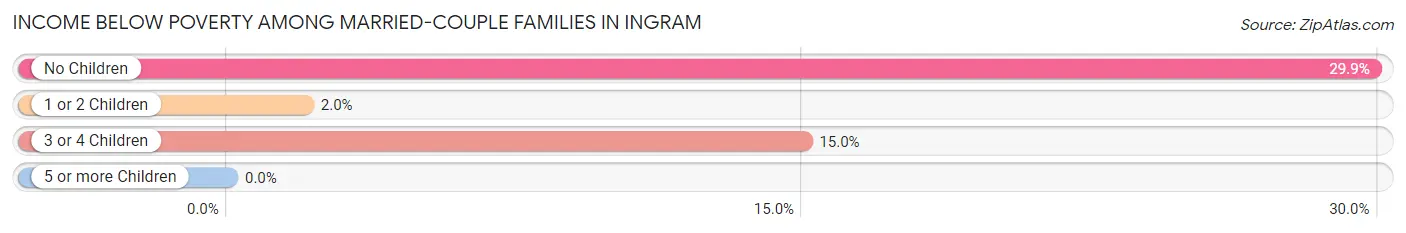
| Children | Above Poverty | Below Poverty |
| No Children | 155 (70.1%) | 66 (29.9%) |
| 1 or 2 Children | 99 (98.0%) | 2 (2.0%) |
| 3 or 4 Children | 68 (85.0%) | 12 (15.0%) |
| 5 or more Children | 0 (0.0%) | 0 (0.0%) |
| Total | 322 (80.1%) | 80 (19.9%) |
Income Below Poverty Among Single-Parent Households in Ingram
According to the poverty data in Ingram, 40.5% or 15 single-father households and 33.8% or 26 single-mother households are living below the poverty line. Among single-father households, those with 3 or 4 children have the highest poverty rate, with 9 households (100.0%) experiencing poverty. Likewise, among single-mother households, those with 3 or 4 children have the highest poverty rate, with 4 households (100.0%) falling below the poverty line.
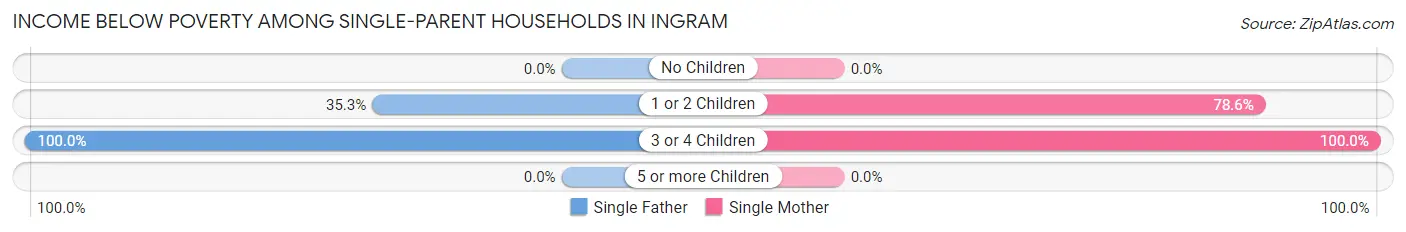
| Children | Single Father | Single Mother |
| No Children | 0 (0.0%) | 0 (0.0%) |
| 1 or 2 Children | 6 (35.3%) | 22 (78.6%) |
| 3 or 4 Children | 9 (100.0%) | 4 (100.0%) |
| 5 or more Children | 0 (0.0%) | 0 (0.0%) |
| Total | 15 (40.5%) | 26 (33.8%) |
Income Below Poverty Among Married-Couple vs Single-Parent Households in Ingram
The poverty data for Ingram shows that 80 of the married-couple family households (19.9%) and 41 of the single-parent households (36.0%) are living below the poverty level. Within the married-couple family households, those with no children have the highest poverty rate, with 66 households (29.9%) falling below the poverty line. Among the single-parent households, those with 3 or 4 children have the highest poverty rate, with 13 household (100.0%) living below poverty.
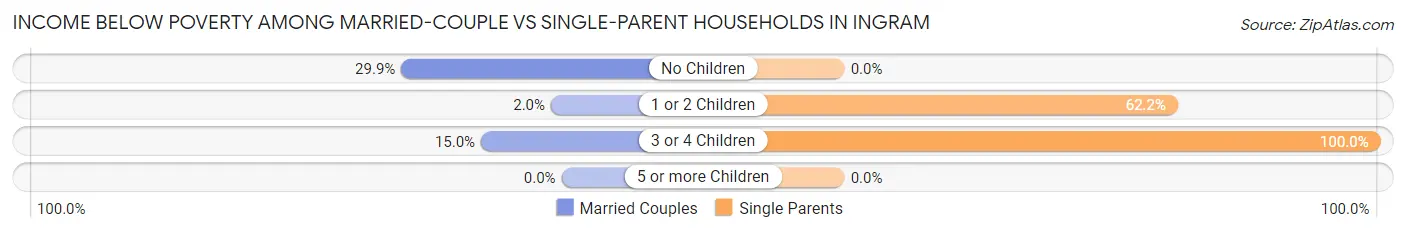
| Children | Married-Couple Families | Single-Parent Households |
| No Children | 66 (29.9%) | 0 (0.0%) |
| 1 or 2 Children | 2 (2.0%) | 28 (62.2%) |
| 3 or 4 Children | 12 (15.0%) | 13 (100.0%) |
| 5 or more Children | 0 (0.0%) | 0 (0.0%) |
| Total | 80 (19.9%) | 41 (36.0%) |
Race in Ingram
The most populous races in Ingram are White / Caucasian (1,484 | 74.1%), Hispanic or Latino (886 | 44.2%), and Two or more Races (336 | 16.8%).
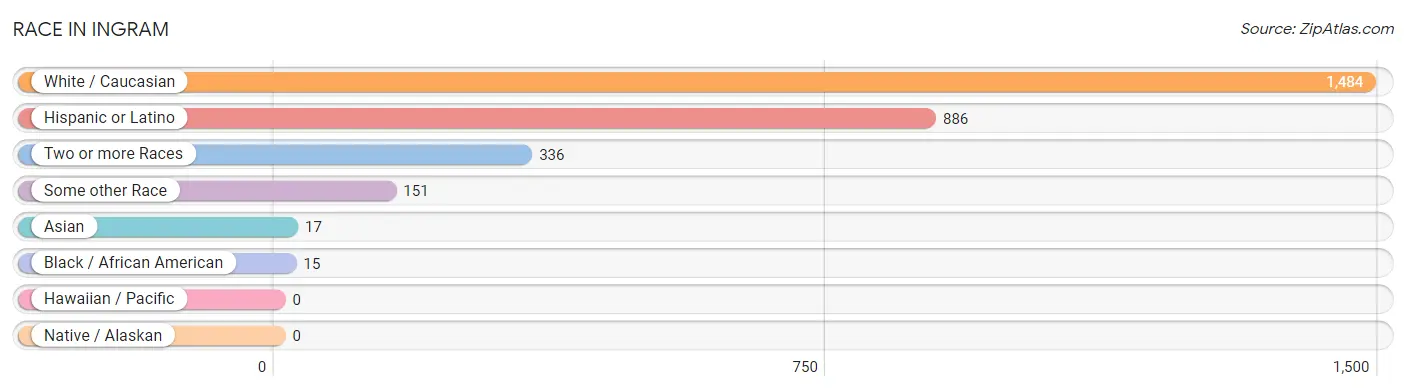
| Race | # Population | % Population |
| Asian | 17 | 0.9% |
| Black / African American | 15 | 0.7% |
| Hawaiian / Pacific | 0 | 0.0% |
| Hispanic or Latino | 886 | 44.2% |
| Native / Alaskan | 0 | 0.0% |
| White / Caucasian | 1,484 | 74.1% |
| Two or more Races | 336 | 16.8% |
| Some other Race | 151 | 7.5% |
| Total | 2,003 | 100.0% |
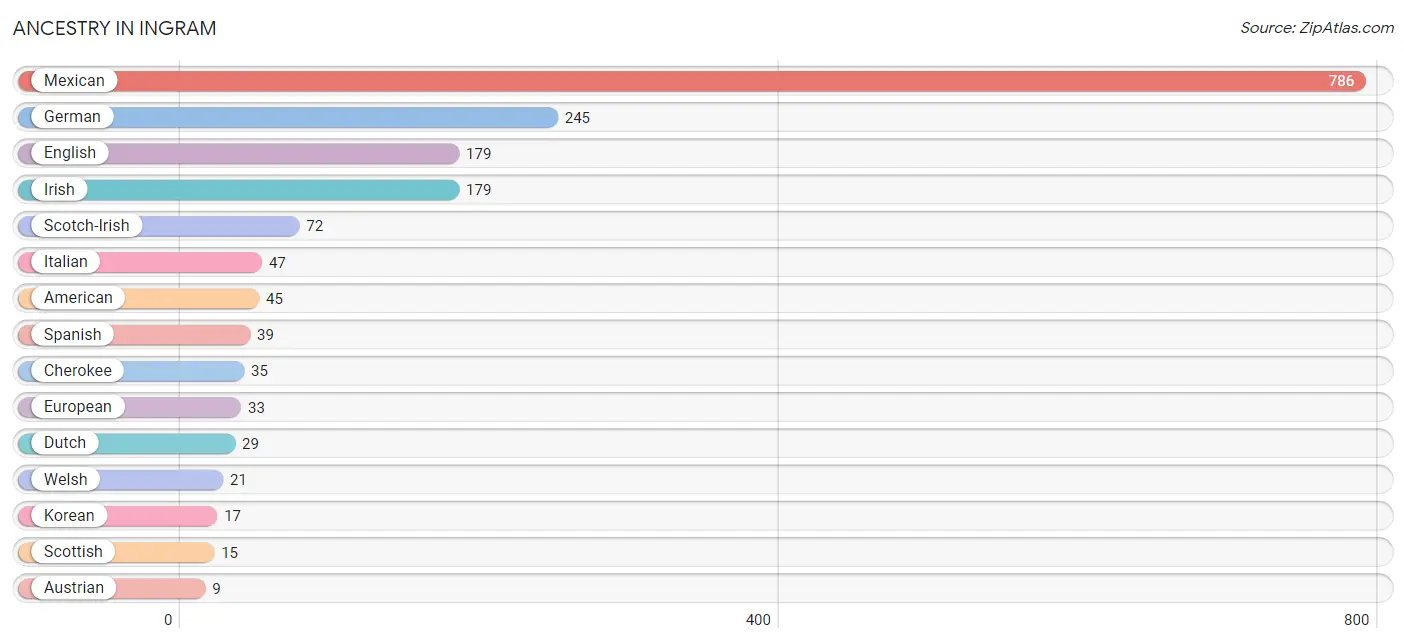
Ancestry in Ingram
The most populous ancestries reported in Ingram are Mexican (786 | 39.2%), German (245 | 12.2%), English (179 | 8.9%), Irish (179 | 8.9%), and Scotch-Irish (72 | 3.6%), together accounting for 72.9% of all Ingram residents.
| Ancestry | # Population | % Population |
| American | 45 | 2.2% |
| Austrian | 9 | 0.4% |
| British | 6 | 0.3% |
| Burmese | 9 | 0.4% |
| Cajun | 6 | 0.3% |
| Cherokee | 35 | 1.8% |
| Danish | 4 | 0.2% |
| Dutch | 29 | 1.5% |
| Dutch West Indian | 9 | 0.4% |
| Eastern European | 3 | 0.2% |
| English | 179 | 8.9% |
| European | 33 | 1.7% |
| French | 9 | 0.4% |
| German | 245 | 12.2% |
| Hungarian | 9 | 0.4% |
| Irish | 179 | 8.9% |
| Italian | 47 | 2.4% |
| Korean | 17 | 0.9% |
| Mexican | 786 | 39.2% |
| Northern European | 7 | 0.4% |
| Norwegian | 4 | 0.2% |
| Polish | 4 | 0.2% |
| Portuguese | 6 | 0.3% |
| Russian | 8 | 0.4% |
| Scandinavian | 6 | 0.3% |
| Scotch-Irish | 72 | 3.6% |
| Scottish | 15 | 0.7% |
| Spanish | 39 | 1.9% |
| Swedish | 4 | 0.2% |
| Welsh | 21 | 1.1% | View All 30 Rows |
Immigrants in Ingram
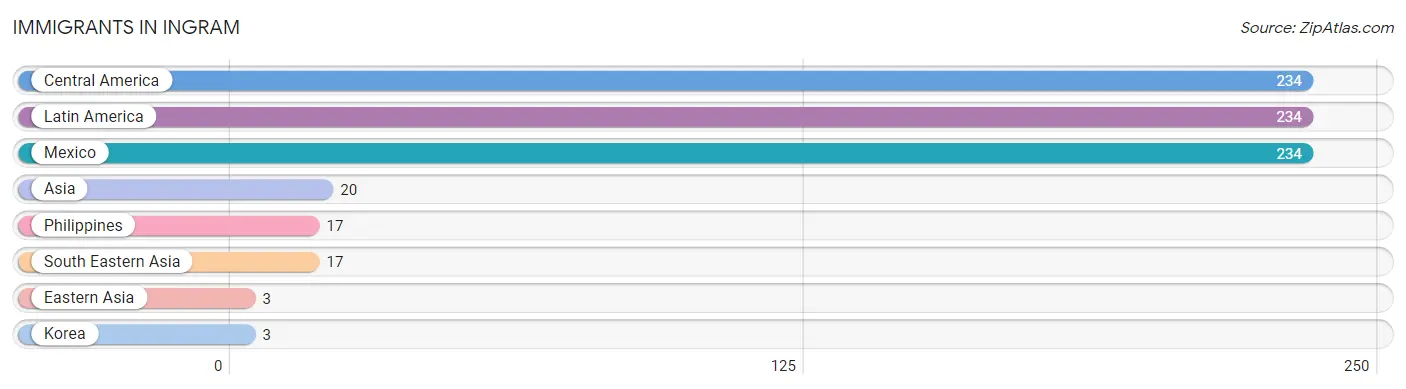
The most numerous immigrant groups reported in Ingram came from Central America (234 | 11.7%), Latin America (234 | 11.7%), Mexico (234 | 11.7%), Asia (20 | 1.0%), and Philippines (17 | 0.9%), together accounting for 36.9% of all Ingram residents.
| Immigration Origin | # Population | % Population |
| Asia | 20 | 1.0% |
| Central America | 234 | 11.7% |
| Eastern Asia | 3 | 0.2% |
| Korea | 3 | 0.2% |
| Latin America | 234 | 11.7% |
| Mexico | 234 | 11.7% |
| Philippines | 17 | 0.9% |
| South Eastern Asia | 17 | 0.9% | View All 8 Rows |
Sex and Age in Ingram
Sex and Age in Ingram
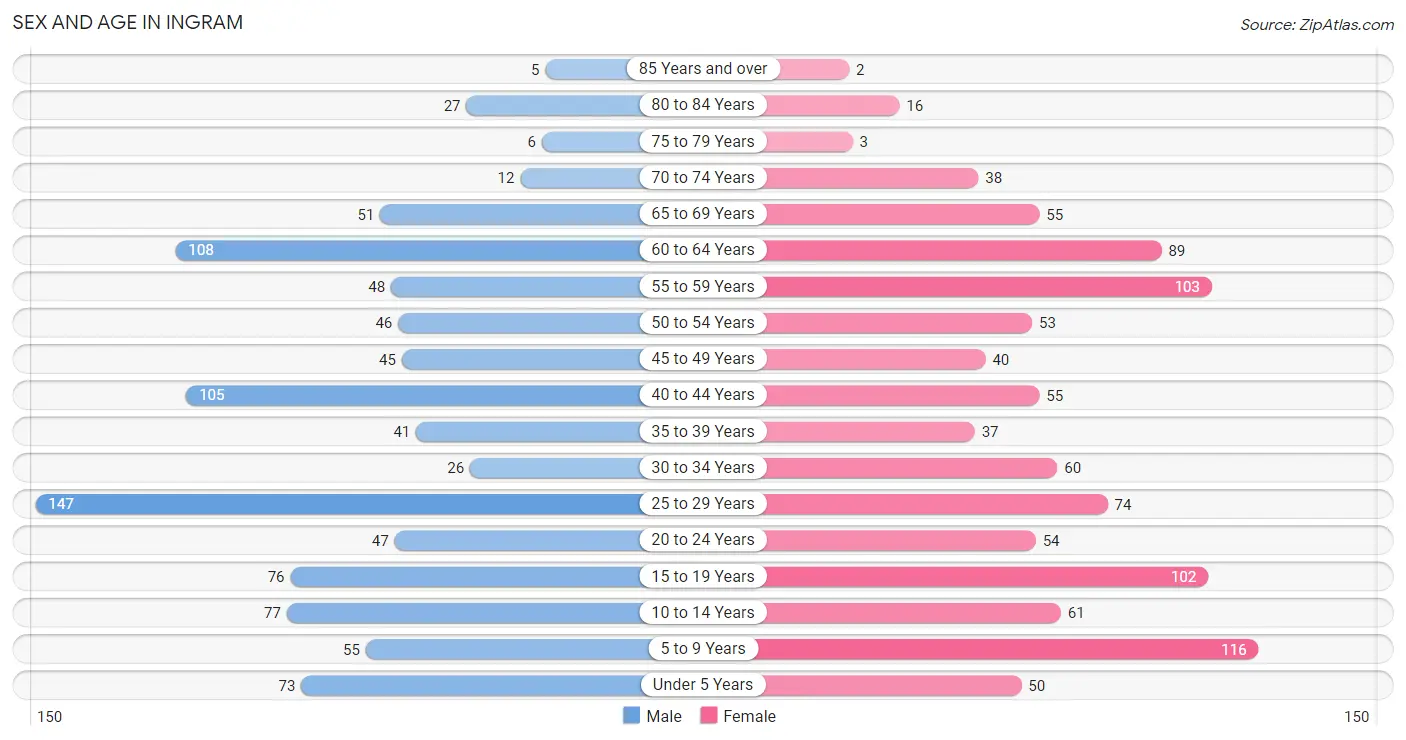
The most populous age groups in Ingram are 25 to 29 Years (147 | 14.8%) for men and 5 to 9 Years (116 | 11.5%) for women.
| Age Bracket | Male | Female |
| Under 5 Years | 73 (7.3%) | 50 (5.0%) |
| 5 to 9 Years | 55 (5.5%) | 116 (11.5%) |
| 10 to 14 Years | 77 (7.7%) | 61 (6.0%) |
| 15 to 19 Years | 76 (7.6%) | 102 (10.1%) |
| 20 to 24 Years | 47 (4.7%) | 54 (5.4%) |
| 25 to 29 Years | 147 (14.8%) | 74 (7.3%) |
| 30 to 34 Years | 26 (2.6%) | 60 (5.9%) |
| 35 to 39 Years | 41 (4.1%) | 37 (3.7%) |
| 40 to 44 Years | 105 (10.5%) | 55 (5.5%) |
| 45 to 49 Years | 45 (4.5%) | 40 (4.0%) |
| 50 to 54 Years | 46 (4.6%) | 53 (5.3%) |
| 55 to 59 Years | 48 (4.8%) | 103 (10.2%) |
| 60 to 64 Years | 108 (10.8%) | 89 (8.8%) |
| 65 to 69 Years | 51 (5.1%) | 55 (5.5%) |
| 70 to 74 Years | 12 (1.2%) | 38 (3.8%) |
| 75 to 79 Years | 6 (0.6%) | 3 (0.3%) |
| 80 to 84 Years | 27 (2.7%) | 16 (1.6%) |
| 85 Years and over | 5 (0.5%) | 2 (0.2%) |
| Total | 995 (100.0%) | 1,008 (100.0%) |
Families and Households in Ingram
Median Family Size in Ingram
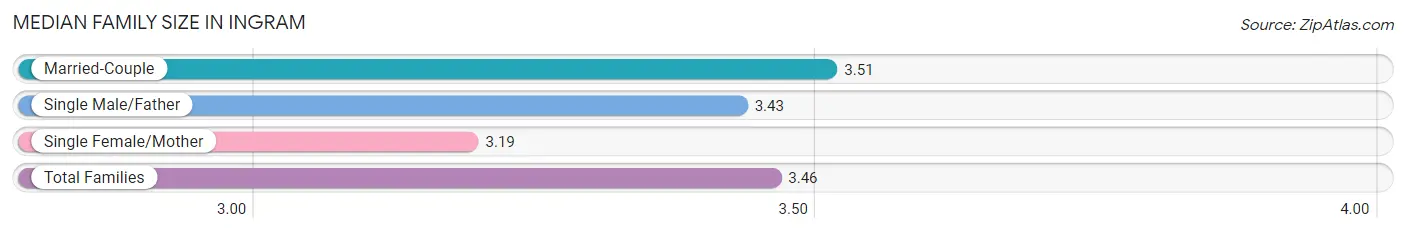
The median family size in Ingram is 3.46 persons per family, with married-couple families (402 | 77.9%) accounting for the largest median family size of 3.51 persons per family. On the other hand, single female/mother families (77 | 14.9%) represent the smallest median family size with 3.19 persons per family.
| Family Type | # Families | Family Size |
| Married-Couple | 402 (77.9%) | 3.51 |
| Single Male/Father | 37 (7.2%) | 3.43 |
| Single Female/Mother | 77 (14.9%) | 3.19 |
| Total Families | 516 (100.0%) | 3.46 |
Median Household Size in Ingram
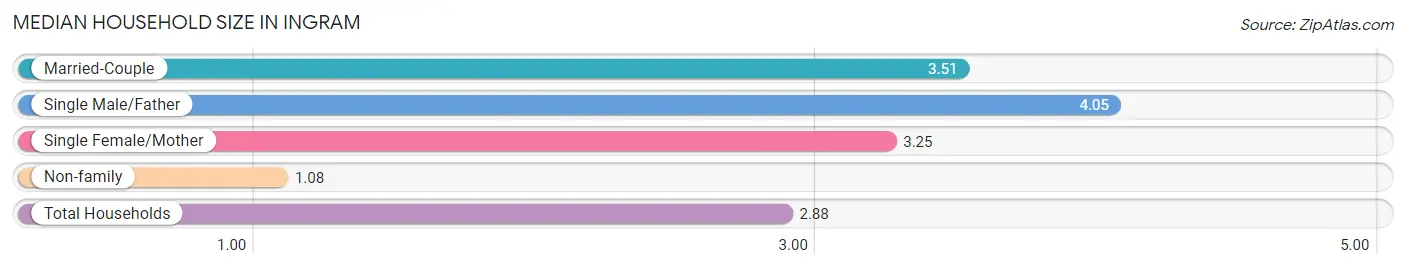
The median household size in Ingram is 2.88 persons per household, with single male/father households (37 | 5.3%) accounting for the largest median household size of 4.05 persons per household. non-family households (179 | 25.8%) represent the smallest median household size with 1.08 persons per household.
| Household Type | # Households | Household Size |
| Married-Couple | 402 (57.8%) | 3.51 |
| Single Male/Father | 37 (5.3%) | 4.05 |
| Single Female/Mother | 77 (11.1%) | 3.25 |
| Non-family | 179 (25.8%) | 1.08 |
| Total Households | 695 (100.0%) | 2.88 |
Household Size by Marriage Status in Ingram
Out of a total of 695 households in Ingram, 516 (74.2%) are family households, while 179 (25.8%) are nonfamily households. The most numerous type of family households are 2-person households, comprising 223, and the most common type of nonfamily households are 1-person households, comprising 166.
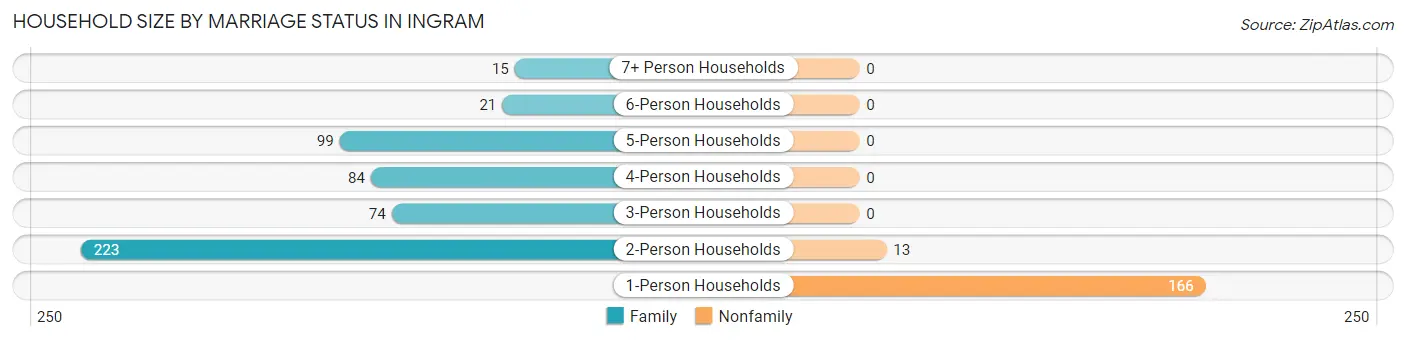
| Household Size | Family Households | Nonfamily Households |
| 1-Person Households | - | 166 (23.9%) |
| 2-Person Households | 223 (32.1%) | 13 (1.9%) |
| 3-Person Households | 74 (10.6%) | 0 (0.0%) |
| 4-Person Households | 84 (12.1%) | 0 (0.0%) |
| 5-Person Households | 99 (14.2%) | 0 (0.0%) |
| 6-Person Households | 21 (3.0%) | 0 (0.0%) |
| 7+ Person Households | 15 (2.2%) | 0 (0.0%) |
| Total | 516 (74.2%) | 179 (25.8%) |
Female Fertility in Ingram
Fertility by Age in Ingram
Average fertility rate in Ingram is 65.0 births per 1,000 women. Women in the age bracket of 20 to 34 years have the highest fertility rate with 122.0 births per 1,000 women. Women in the age bracket of 20 to 34 years acount for 82.1% of all women with births.
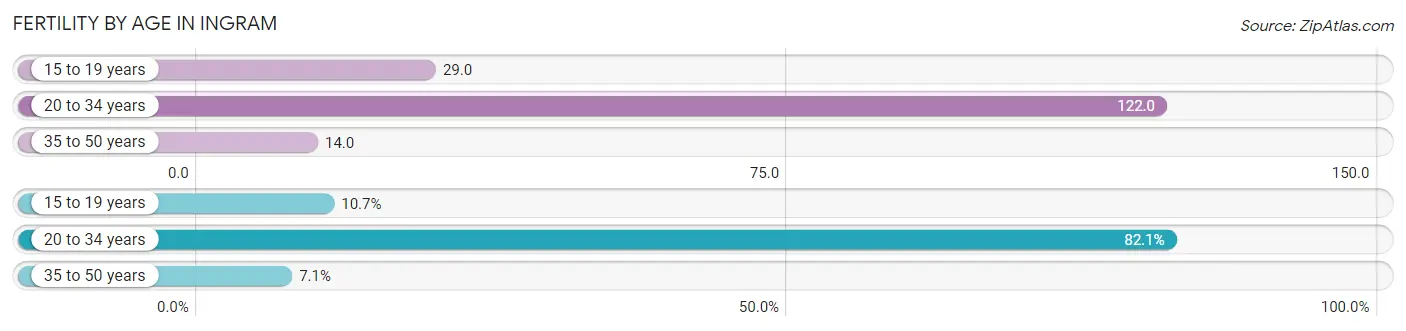
| Age Bracket | Women with Births | Births / 1,000 Women |
| 15 to 19 years | 3 (10.7%) | 29.0 |
| 20 to 34 years | 23 (82.1%) | 122.0 |
| 35 to 50 years | 2 (7.1%) | 14.0 |
| Total | 28 (100.0%) | 65.0 |
Fertility by Age by Marriage Status in Ingram
67.9% of women with births (28) in Ingram are married. The highest percentage of unmarried women with births falls into 15 to 19 years age bracket with 100.0% of them unmarried at the time of birth, while the lowest percentage of unmarried women with births belong to 35 to 50 years age bracket with 0.0% of them unmarried.
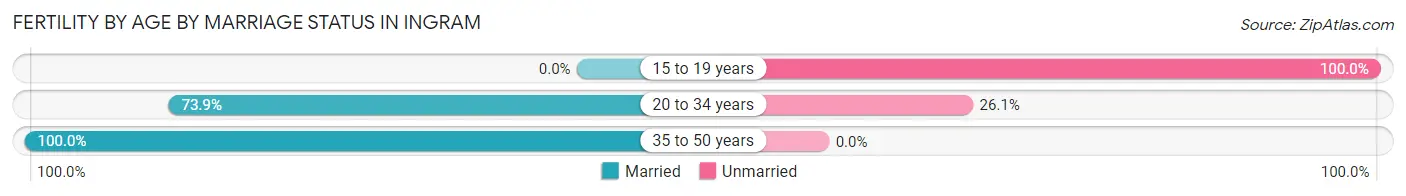
| Age Bracket | Married | Unmarried |
| 15 to 19 years | 0 (0.0%) | 3 (100.0%) |
| 20 to 34 years | 17 (73.9%) | 6 (26.1%) |
| 35 to 50 years | 2 (100.0%) | 0 (0.0%) |
| Total | 19 (67.9%) | 9 (32.1%) |
Fertility by Education in Ingram
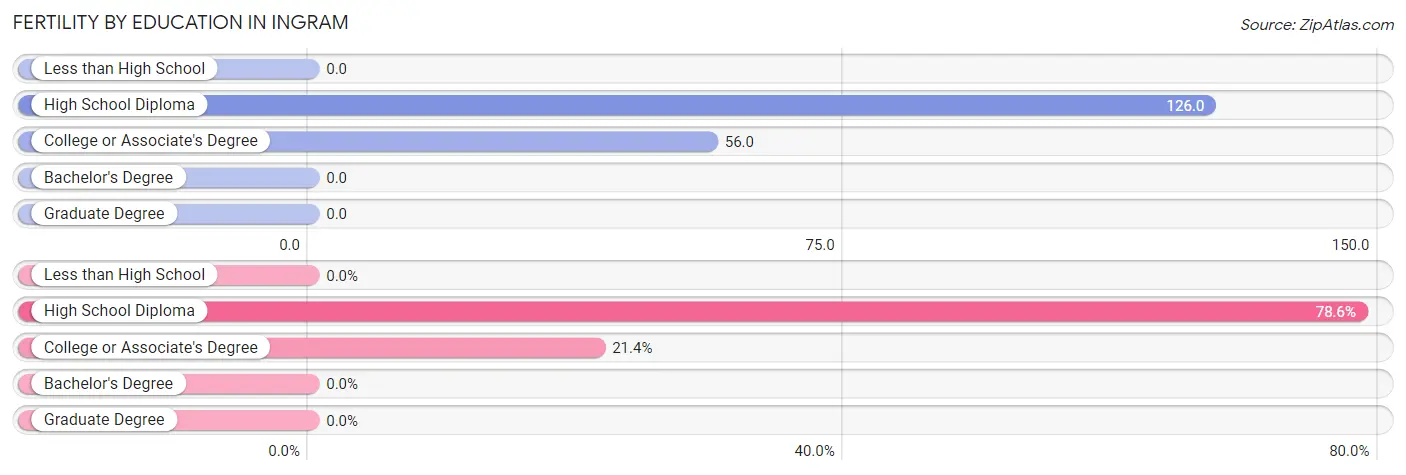
| Educational Attainment | Women with Births | Births / 1,000 Women |
| Less than High School | 0 (0.0%) | 0.0 |
| High School Diploma | 22 (78.6%) | 126.0 |
| College or Associate's Degree | 6 (21.4%) | 56.0 |
| Bachelor's Degree | 0 (0.0%) | 0.0 |
| Graduate Degree | 0 (0.0%) | 0.0 |
| Total | 28 (100.0%) | 65.0 |
Fertility by Education by Marriage Status in Ingram
32.1% of women with births in Ingram are unmarried. Women with the educational attainment of high school diploma are most likely to be married with 86.4% of them married at childbirth, while women with the educational attainment of college or associate's degree are least likely to be married with 100.0% of them unmarried at childbirth.
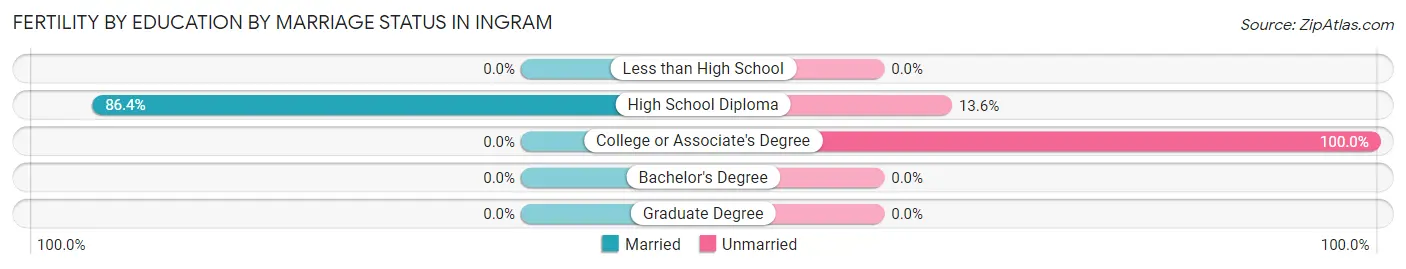
| Educational Attainment | Married | Unmarried |
| Less than High School | 0 (0.0%) | 0 (0.0%) |
| High School Diploma | 19 (86.4%) | 3 (13.6%) |
| College or Associate's Degree | 0 (0.0%) | 6 (100.0%) |
| Bachelor's Degree | 0 (0.0%) | 0 (0.0%) |
| Graduate Degree | 0 (0.0%) | 0 (0.0%) |
| Total | 19 (67.9%) | 9 (32.1%) |
Employment Characteristics in Ingram
Employment by Class of Employer in Ingram
Among the 973 employed individuals in Ingram, private company employees (670 | 68.9%), not-for-profit organizations (103 | 10.6%), and self-employed (not incorporated) (101 | 10.4%) make up the most common classes of employment.
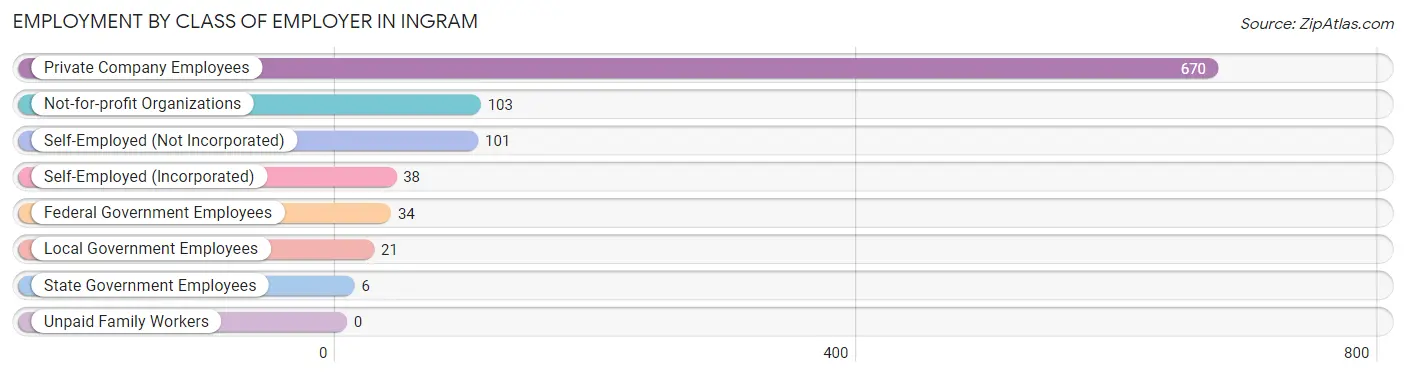
| Employer Class | # Employees | % Employees |
| Private Company Employees | 670 | 68.9% |
| Self-Employed (Incorporated) | 38 | 3.9% |
| Self-Employed (Not Incorporated) | 101 | 10.4% |
| Not-for-profit Organizations | 103 | 10.6% |
| Local Government Employees | 21 | 2.2% |
| State Government Employees | 6 | 0.6% |
| Federal Government Employees | 34 | 3.5% |
| Unpaid Family Workers | 0 | 0.0% |
| Total | 973 | 100.0% |
Employment Status by Age in Ingram
According to the labor force statistics for Ingram, out of the total population over 16 years of age (1,551), 69.0% or 1,070 individuals are in the labor force, with 4.4% or 47 of them unemployed. The age group with the highest labor force participation rate is 25 to 29 years, with 93.7% or 207 individuals in the labor force. Within the labor force, the 60 to 64 years age range has the highest percentage of unemployed individuals, with 20.0% or 21 of them being unemployed.
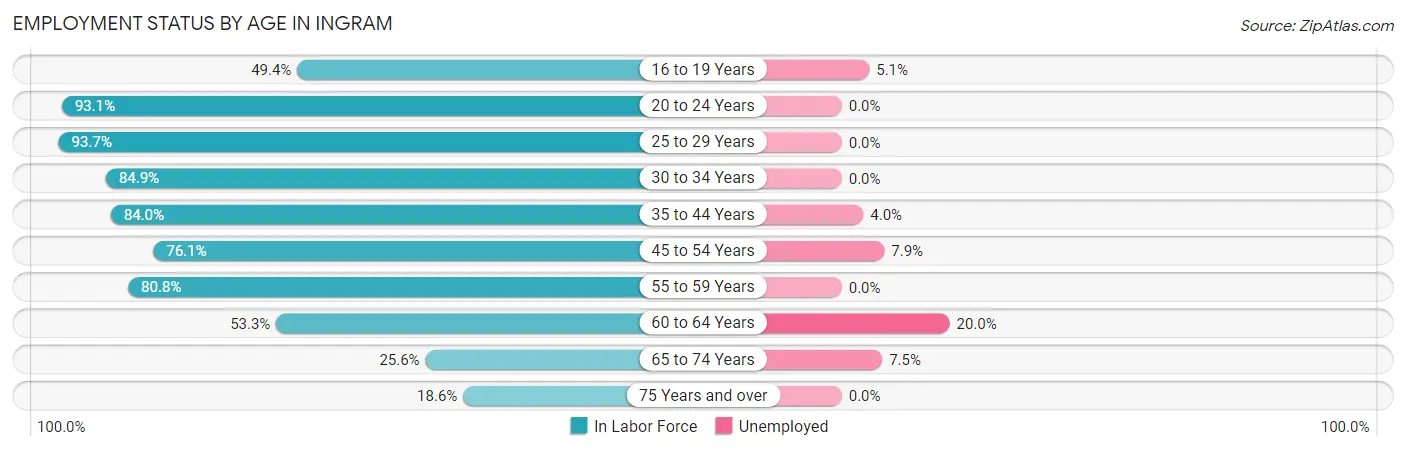
| Age Bracket | In Labor Force | Unemployed |
| 16 to 19 Years | 78 (49.4%) | 4 (5.1%) |
| 20 to 24 Years | 94 (93.1%) | 0 (0.0%) |
| 25 to 29 Years | 207 (93.7%) | 0 (0.0%) |
| 30 to 34 Years | 73 (84.9%) | 0 (0.0%) |
| 35 to 44 Years | 200 (84.0%) | 8 (4.0%) |
| 45 to 54 Years | 140 (76.1%) | 11 (7.9%) |
| 55 to 59 Years | 122 (80.8%) | 0 (0.0%) |
| 60 to 64 Years | 105 (53.3%) | 21 (20.0%) |
| 65 to 74 Years | 40 (25.6%) | 3 (7.5%) |
| 75 Years and over | 11 (18.6%) | 0 (0.0%) |
| Total | 1,070 (69.0%) | 47 (4.4%) |
Employment Status by Educational Attainment in Ingram
According to labor force statistics for Ingram, 78.6% of individuals (847) out of the total population between 25 and 64 years of age (1,077) are in the labor force, with 4.7% or 40 of them being unemployed. The group with the highest labor force participation rate are those with the educational attainment of bachelor's degree or higher, with 97.4% or 74 individuals in the labor force. Within the labor force, individuals with bachelor's degree or higher education have the highest percentage of unemployment, with 28.4% or 21 of them being unemployed.
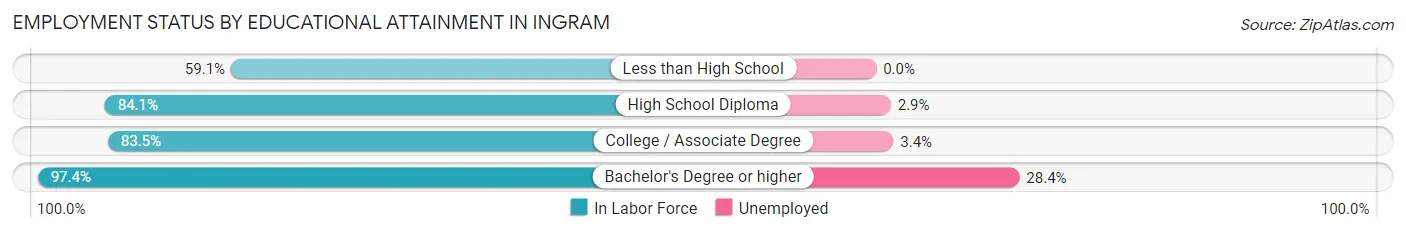
| Educational Attainment | In Labor Force | Unemployed |
| Less than High School | 159 (59.1%) | 0 (0.0%) |
| High School Diploma | 376 (84.1%) | 13 (2.9%) |
| College / Associate Degree | 238 (83.5%) | 10 (3.4%) |
| Bachelor's Degree or higher | 74 (97.4%) | 22 (28.4%) |
| Total | 847 (78.6%) | 51 (4.7%) |
Employment Occupations by Sex in Ingram
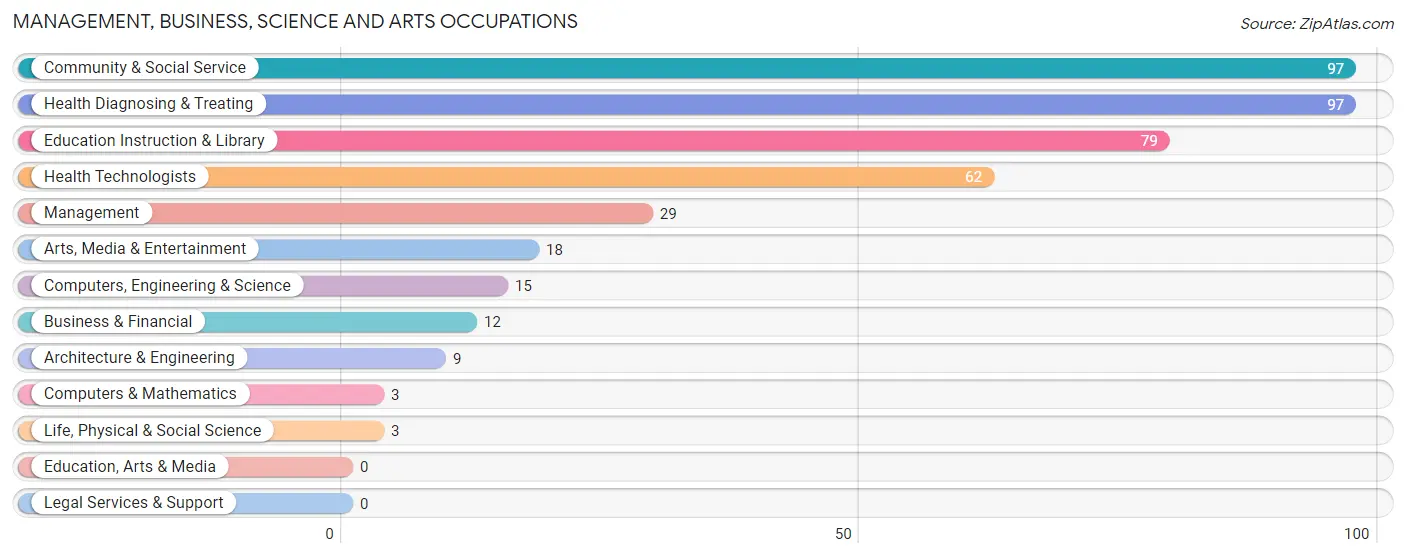
Management, Business, Science and Arts Occupations
The most common Management, Business, Science and Arts occupations in Ingram are Community & Social Service (97 | 9.5%), Health Diagnosing & Treating (97 | 9.5%), Education Instruction & Library (79 | 7.7%), Health Technologists (62 | 6.1%), and Management (29 | 2.8%).
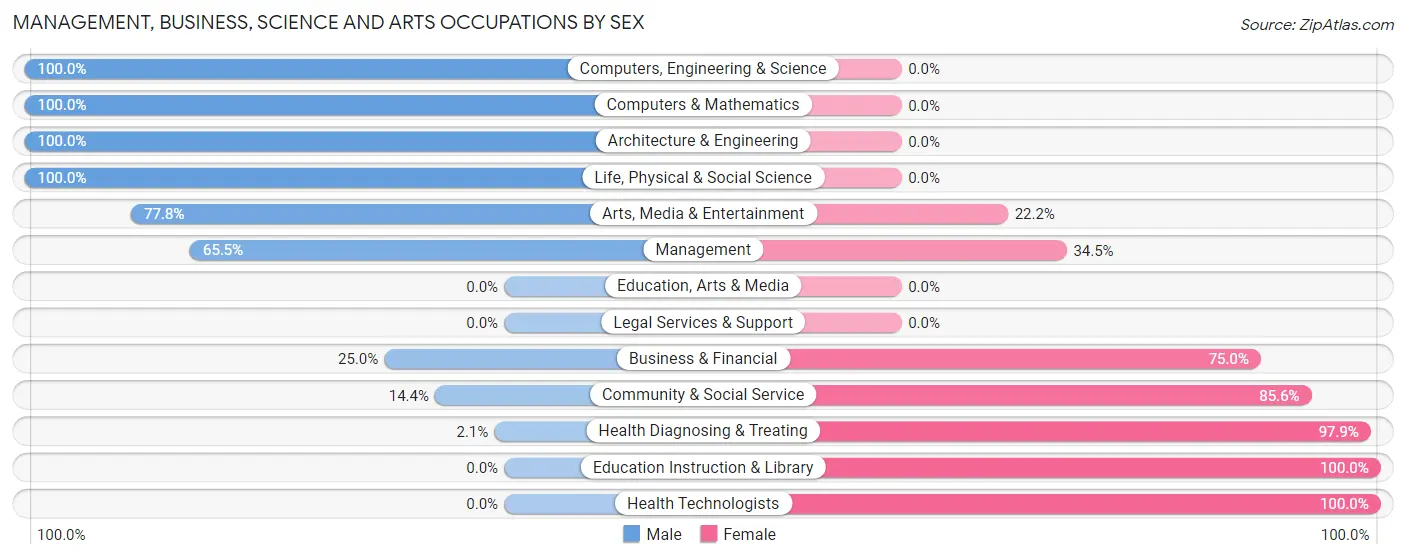
Management, Business, Science and Arts Occupations by Sex
Within the Management, Business, Science and Arts occupations in Ingram, the most male-oriented occupations are Computers, Engineering & Science (100.0%), Computers & Mathematics (100.0%), and Architecture & Engineering (100.0%), while the most female-oriented occupations are Education Instruction & Library (100.0%), Health Technologists (100.0%), and Health Diagnosing & Treating (97.9%).
| Occupation | Male | Female |
| Management | 19 (65.5%) | 10 (34.5%) |
| Business & Financial | 3 (25.0%) | 9 (75.0%) |
| Computers, Engineering & Science | 15 (100.0%) | 0 (0.0%) |
| Computers & Mathematics | 3 (100.0%) | 0 (0.0%) |
| Architecture & Engineering | 9 (100.0%) | 0 (0.0%) |
| Life, Physical & Social Science | 3 (100.0%) | 0 (0.0%) |
| Community & Social Service | 14 (14.4%) | 83 (85.6%) |
| Education, Arts & Media | 0 (0.0%) | 0 (0.0%) |
| Legal Services & Support | 0 (0.0%) | 0 (0.0%) |
| Education Instruction & Library | 0 (0.0%) | 79 (100.0%) |
| Arts, Media & Entertainment | 14 (77.8%) | 4 (22.2%) |
| Health Diagnosing & Treating | 2 (2.1%) | 95 (97.9%) |
| Health Technologists | 0 (0.0%) | 62 (100.0%) |
| Total (Category) | 53 (21.2%) | 197 (78.8%) |
| Total (Overall) | 553 (54.1%) | 470 (45.9%) |
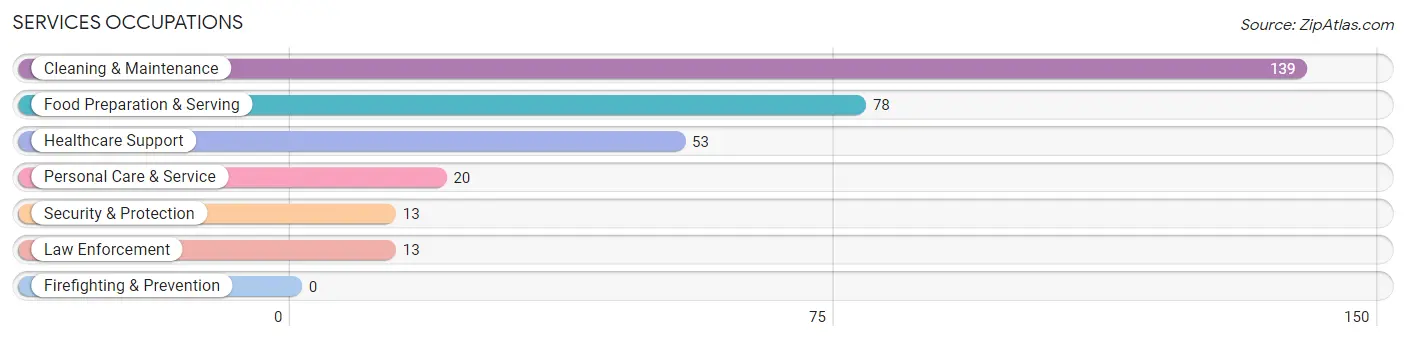
Services Occupations
The most common Services occupations in Ingram are Cleaning & Maintenance (139 | 13.6%), Food Preparation & Serving (78 | 7.6%), Healthcare Support (53 | 5.2%), Personal Care & Service (20 | 2.0%), and Security & Protection (13 | 1.3%).
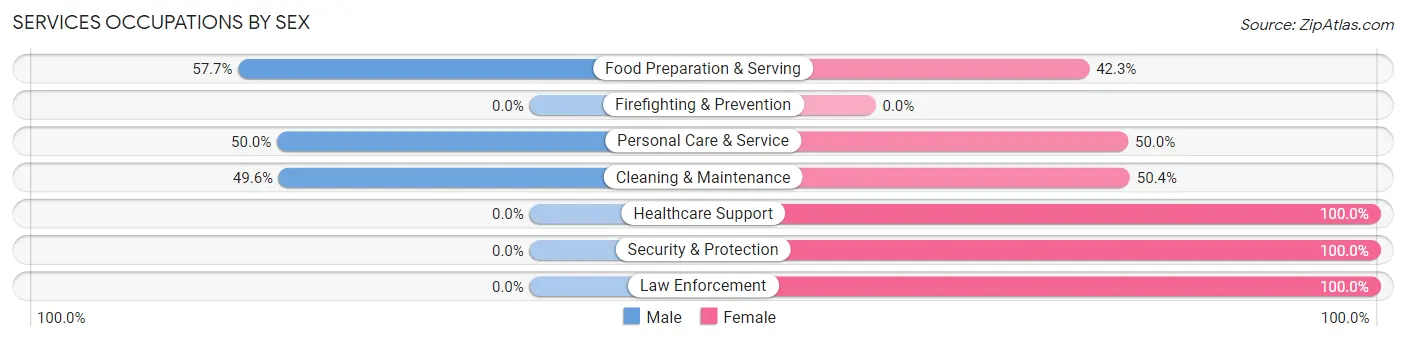
Services Occupations by Sex
Within the Services occupations in Ingram, the most male-oriented occupations are Food Preparation & Serving (57.7%), Personal Care & Service (50.0%), and Cleaning & Maintenance (49.6%), while the most female-oriented occupations are Healthcare Support (100.0%), Security & Protection (100.0%), and Law Enforcement (100.0%).
| Occupation | Male | Female |
| Healthcare Support | 0 (0.0%) | 53 (100.0%) |
| Security & Protection | 0 (0.0%) | 13 (100.0%) |
| Firefighting & Prevention | 0 (0.0%) | 0 (0.0%) |
| Law Enforcement | 0 (0.0%) | 13 (100.0%) |
| Food Preparation & Serving | 45 (57.7%) | 33 (42.3%) |
| Cleaning & Maintenance | 69 (49.6%) | 70 (50.4%) |
| Personal Care & Service | 10 (50.0%) | 10 (50.0%) |
| Total (Category) | 124 (40.9%) | 179 (59.1%) |
| Total (Overall) | 553 (54.1%) | 470 (45.9%) |
Sales and Office Occupations
The most common Sales and Office occupations in Ingram are Sales & Related (58 | 5.7%), and Office & Administration (50 | 4.9%).

Sales and Office Occupations by Sex
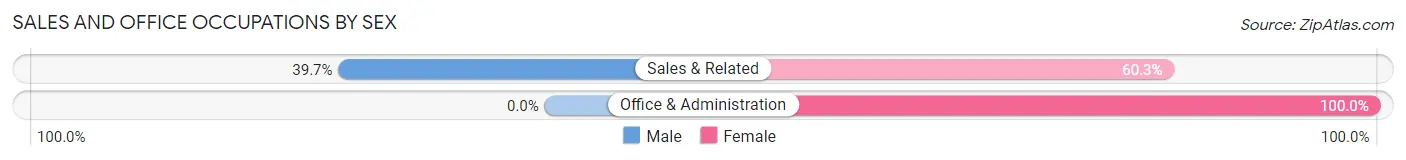
| Occupation | Male | Female |
| Sales & Related | 23 (39.7%) | 35 (60.3%) |
| Office & Administration | 0 (0.0%) | 50 (100.0%) |
| Total (Category) | 23 (21.3%) | 85 (78.7%) |
| Total (Overall) | 553 (54.1%) | 470 (45.9%) |
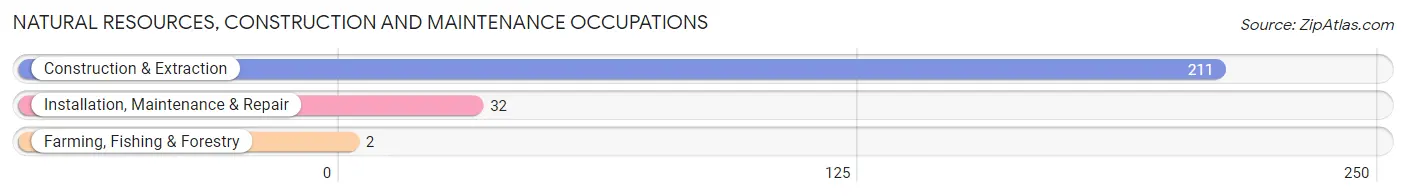
Natural Resources, Construction and Maintenance Occupations
The most common Natural Resources, Construction and Maintenance occupations in Ingram are Construction & Extraction (211 | 20.6%), Installation, Maintenance & Repair (32 | 3.1%), and Farming, Fishing & Forestry (2 | 0.2%).
Natural Resources, Construction and Maintenance Occupations by Sex
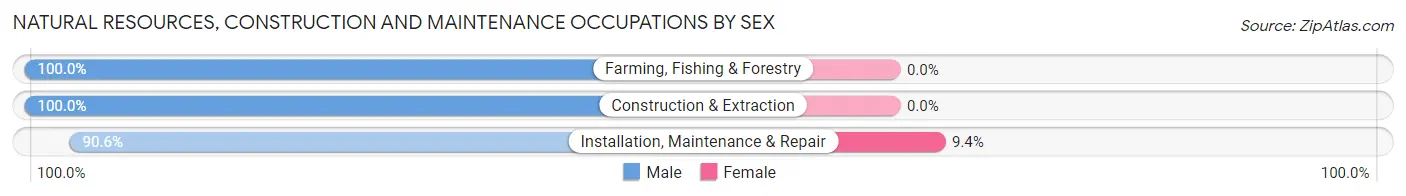
| Occupation | Male | Female |
| Farming, Fishing & Forestry | 2 (100.0%) | 0 (0.0%) |
| Construction & Extraction | 211 (100.0%) | 0 (0.0%) |
| Installation, Maintenance & Repair | 29 (90.6%) | 3 (9.4%) |
| Total (Category) | 242 (98.8%) | 3 (1.2%) |
| Total (Overall) | 553 (54.1%) | 470 (45.9%) |
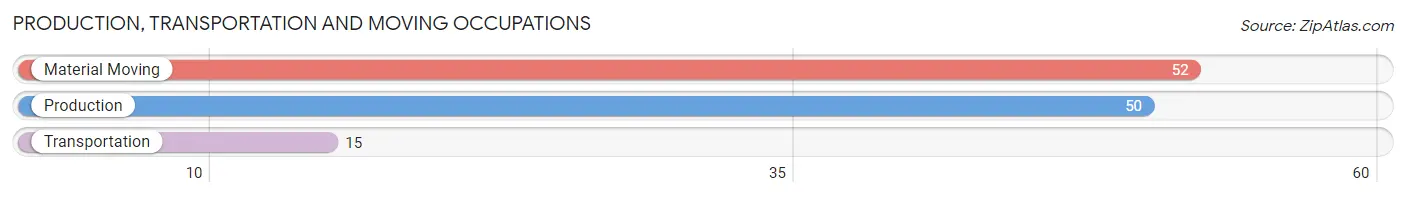
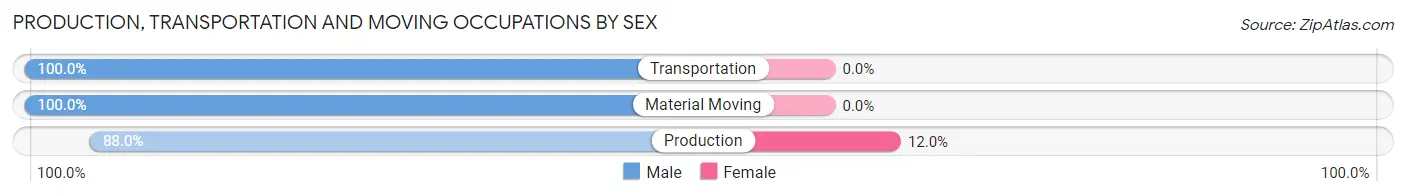
Production, Transportation and Moving Occupations
The most common Production, Transportation and Moving occupations in Ingram are Material Moving (52 | 5.1%), Production (50 | 4.9%), and Transportation (15 | 1.5%).
Production, Transportation and Moving Occupations by Sex
| Occupation | Male | Female |
| Production | 44 (88.0%) | 6 (12.0%) |
| Transportation | 15 (100.0%) | 0 (0.0%) |
| Material Moving | 52 (100.0%) | 0 (0.0%) |
| Total (Category) | 111 (94.9%) | 6 (5.1%) |
| Total (Overall) | 553 (54.1%) | 470 (45.9%) |
Employment Industries by Sex in Ingram
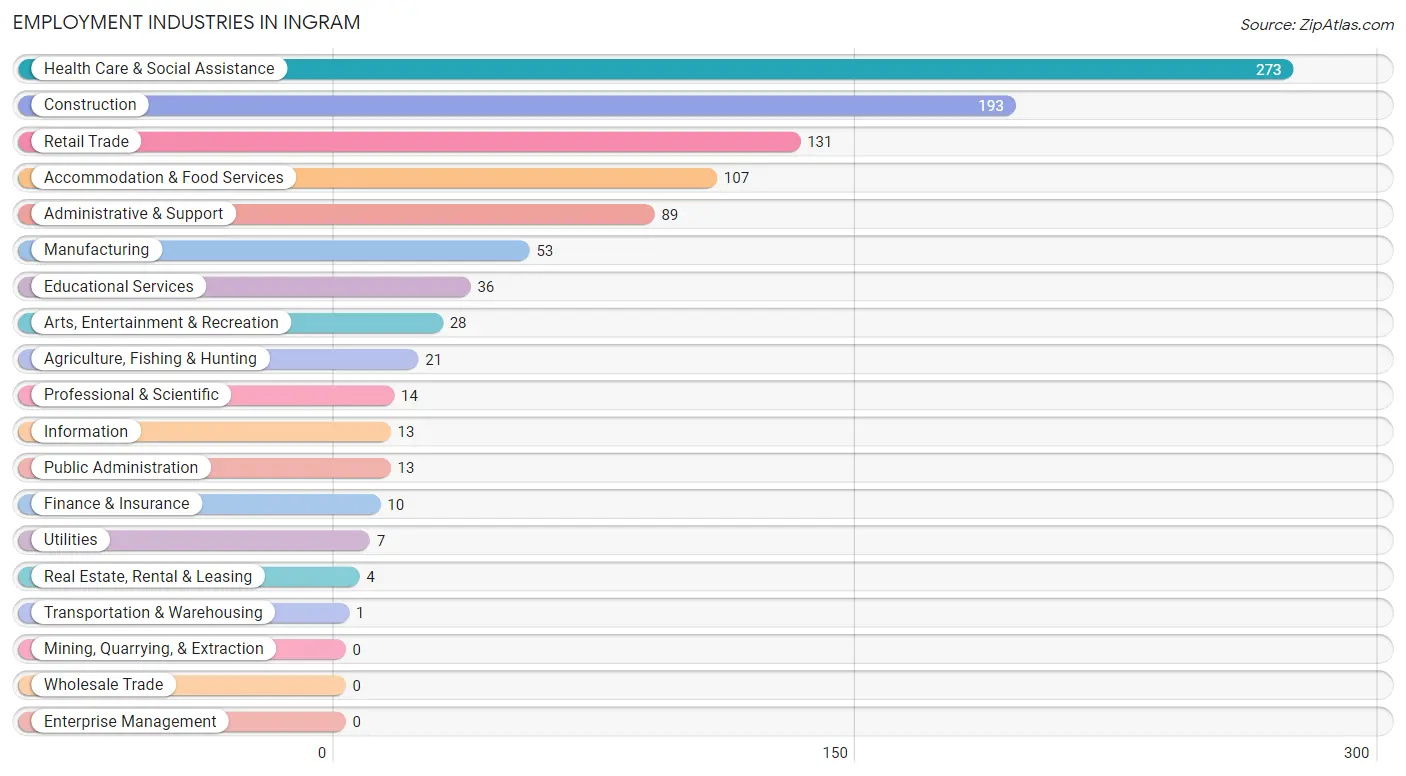
Employment Industries in Ingram
The major employment industries in Ingram include Health Care & Social Assistance (273 | 26.7%), Construction (193 | 18.9%), Retail Trade (131 | 12.8%), Accommodation & Food Services (107 | 10.5%), and Administrative & Support (89 | 8.7%).
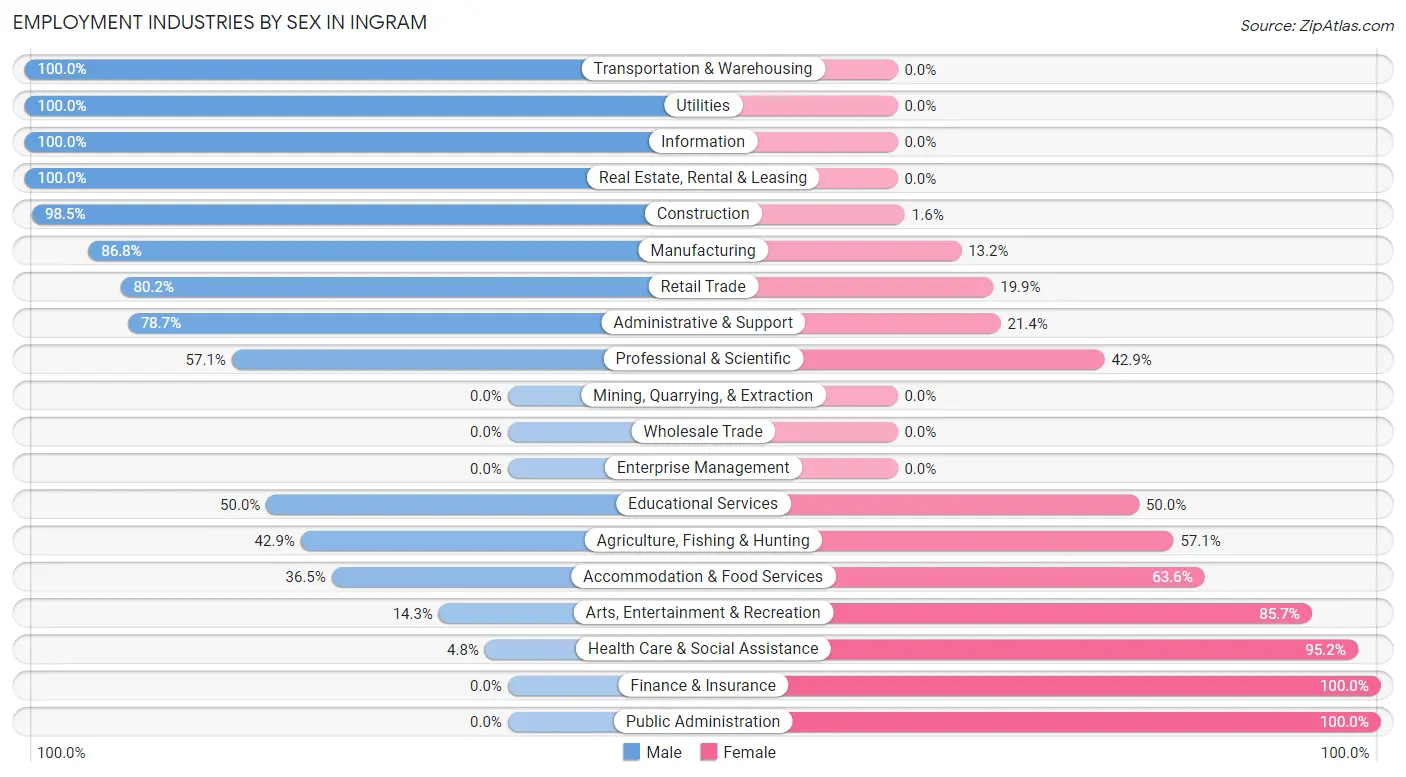
Employment Industries by Sex in Ingram
The Ingram industries that see more men than women are Transportation & Warehousing (100.0%), Utilities (100.0%), and Information (100.0%), whereas the industries that tend to have a higher number of women are Finance & Insurance (100.0%), Public Administration (100.0%), and Health Care & Social Assistance (95.2%).
| Industry | Male | Female |
| Agriculture, Fishing & Hunting | 9 (42.9%) | 12 (57.1%) |
| Mining, Quarrying, & Extraction | 0 (0.0%) | 0 (0.0%) |
| Construction | 190 (98.5%) | 3 (1.5%) |
| Manufacturing | 46 (86.8%) | 7 (13.2%) |
| Wholesale Trade | 0 (0.0%) | 0 (0.0%) |
| Retail Trade | 105 (80.1%) | 26 (19.9%) |
| Transportation & Warehousing | 1 (100.0%) | 0 (0.0%) |
| Utilities | 7 (100.0%) | 0 (0.0%) |
| Information | 13 (100.0%) | 0 (0.0%) |
| Finance & Insurance | 0 (0.0%) | 10 (100.0%) |
| Real Estate, Rental & Leasing | 4 (100.0%) | 0 (0.0%) |
| Professional & Scientific | 8 (57.1%) | 6 (42.9%) |
| Enterprise Management | 0 (0.0%) | 0 (0.0%) |
| Administrative & Support | 70 (78.6%) | 19 (21.3%) |
| Educational Services | 18 (50.0%) | 18 (50.0%) |
| Health Care & Social Assistance | 13 (4.8%) | 260 (95.2%) |
| Arts, Entertainment & Recreation | 4 (14.3%) | 24 (85.7%) |
| Accommodation & Food Services | 39 (36.4%) | 68 (63.5%) |
| Public Administration | 0 (0.0%) | 13 (100.0%) |
| Total | 553 (54.1%) | 470 (45.9%) |
Education in Ingram
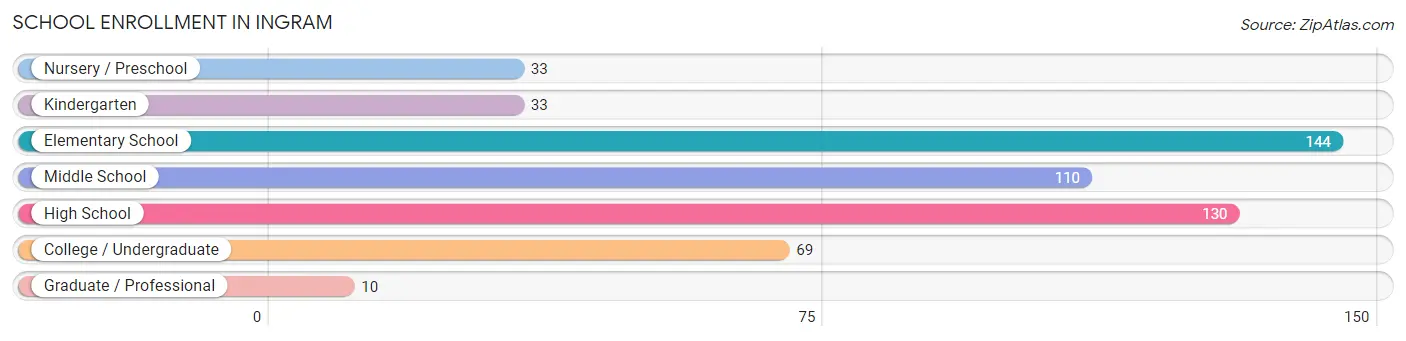
School Enrollment in Ingram
The most common levels of schooling among the 529 students in Ingram are elementary school (144 | 27.2%), high school (130 | 24.6%), and middle school (110 | 20.8%).
| School Level | # Students | % Students |
| Nursery / Preschool | 33 | 6.2% |
| Kindergarten | 33 | 6.2% |
| Elementary School | 144 | 27.2% |
| Middle School | 110 | 20.8% |
| High School | 130 | 24.6% |
| College / Undergraduate | 69 | 13.0% |
| Graduate / Professional | 10 | 1.9% |
| Total | 529 | 100.0% |
School Enrollment by Age by Funding Source in Ingram
Out of a total of 529 students who are enrolled in schools in Ingram, 64 (12.1%) attend a private institution, while the remaining 465 (87.9%) are enrolled in public schools. The age group of 35 years and over has the highest likelihood of being enrolled in private schools, with 37 (71.2% in the age bracket) enrolled. Conversely, the age group of 18 to 19 year olds has the lowest likelihood of being enrolled in a private school, with 28 (100.0% in the age bracket) attending a public institution.
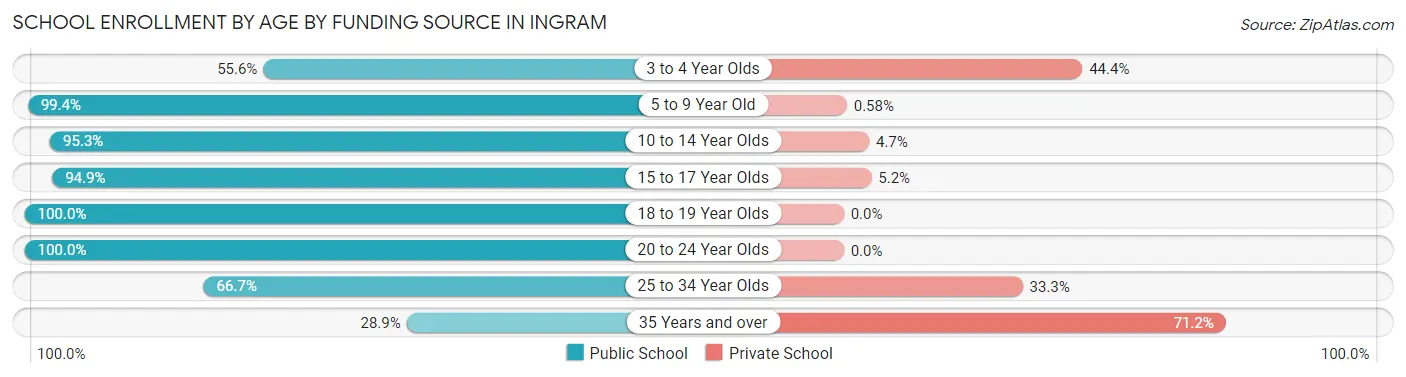
| Age Bracket | Public School | Private School |
| 3 to 4 Year Olds | 15 (55.6%) | 12 (44.4%) |
| 5 to 9 Year Old | 170 (99.4%) | 1 (0.6%) |
| 10 to 14 Year Olds | 121 (95.3%) | 6 (4.7%) |
| 15 to 17 Year Olds | 92 (94.9%) | 5 (5.1%) |
| 18 to 19 Year Olds | 28 (100.0%) | 0 (0.0%) |
| 20 to 24 Year Olds | 18 (100.0%) | 0 (0.0%) |
| 25 to 34 Year Olds | 6 (66.7%) | 3 (33.3%) |
| 35 Years and over | 15 (28.8%) | 37 (71.2%) |
| Total | 465 (87.9%) | 64 (12.1%) |
Educational Attainment by Field of Study in Ingram
Visual & performing arts (31 | 30.1%), business (21 | 20.4%), education (20 | 19.4%), bio, nature & agricultural (14 | 13.6%), and science & technology (6 | 5.8%) are the most common fields of study among 103 individuals in Ingram who have obtained a bachelor's degree or higher.
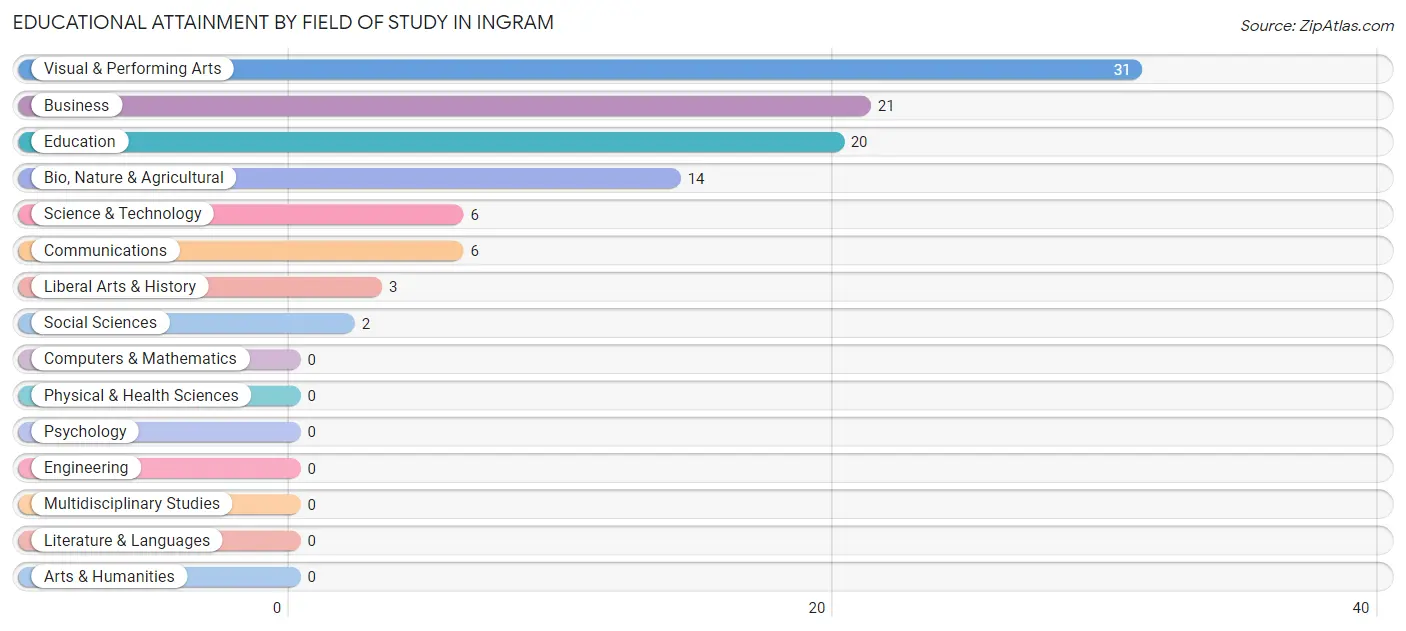
| Field of Study | # Graduates | % Graduates |
| Computers & Mathematics | 0 | 0.0% |
| Bio, Nature & Agricultural | 14 | 13.6% |
| Physical & Health Sciences | 0 | 0.0% |
| Psychology | 0 | 0.0% |
| Social Sciences | 2 | 1.9% |
| Engineering | 0 | 0.0% |
| Multidisciplinary Studies | 0 | 0.0% |
| Science & Technology | 6 | 5.8% |
| Business | 21 | 20.4% |
| Education | 20 | 19.4% |
| Literature & Languages | 0 | 0.0% |
| Liberal Arts & History | 3 | 2.9% |
| Visual & Performing Arts | 31 | 30.1% |
| Communications | 6 | 5.8% |
| Arts & Humanities | 0 | 0.0% |
| Total | 103 | 100.0% |
Transportation & Commute in Ingram
Vehicle Availability by Sex in Ingram
The most prevalent vehicle ownership categories in Ingram are males with 3 vehicles (139, accounting for 26.9%) and females with 3 vehicles (77, making up 30.4%).
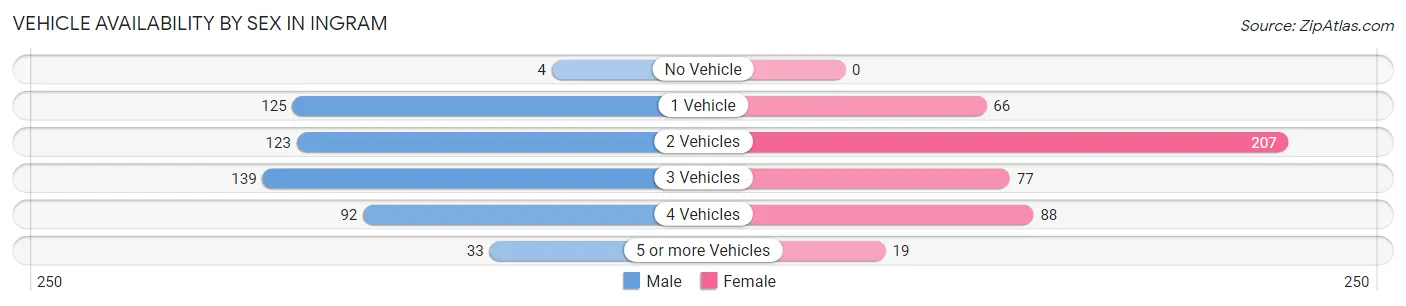
| Vehicles Available | Male | Female |
| No Vehicle | 4 (0.8%) | 0 (0.0%) |
| 1 Vehicle | 125 (24.2%) | 66 (14.4%) |
| 2 Vehicles | 123 (23.8%) | 207 (45.3%) |
| 3 Vehicles | 139 (26.9%) | 77 (16.9%) |
| 4 Vehicles | 92 (17.8%) | 88 (19.3%) |
| 5 or more Vehicles | 33 (6.4%) | 19 (4.2%) |
| Total | 516 (100.0%) | 457 (100.0%) |
Commute Time in Ingram
The most frequently occuring commute durations in Ingram are 15 to 19 minutes (227 commuters, 25.0%), 20 to 24 minutes (153 commuters, 16.8%), and 10 to 14 minutes (116 commuters, 12.8%).
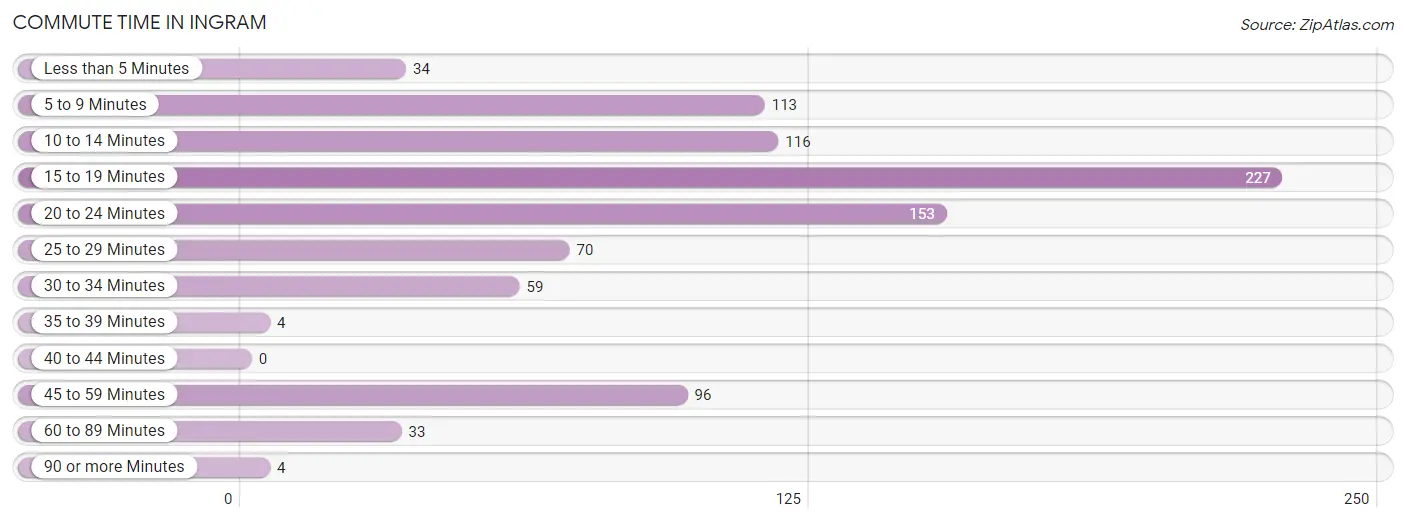
| Commute Time | # Commuters | % Commuters |
| Less than 5 Minutes | 34 | 3.7% |
| 5 to 9 Minutes | 113 | 12.4% |
| 10 to 14 Minutes | 116 | 12.8% |
| 15 to 19 Minutes | 227 | 25.0% |
| 20 to 24 Minutes | 153 | 16.8% |
| 25 to 29 Minutes | 70 | 7.7% |
| 30 to 34 Minutes | 59 | 6.5% |
| 35 to 39 Minutes | 4 | 0.4% |
| 40 to 44 Minutes | 0 | 0.0% |
| 45 to 59 Minutes | 96 | 10.6% |
| 60 to 89 Minutes | 33 | 3.6% |
| 90 or more Minutes | 4 | 0.4% |
Commute Time by Sex in Ingram
The most common commute times in Ingram are 15 to 19 minutes (136 commuters, 26.5%) for males and 15 to 19 minutes (91 commuters, 23.0%) for females.
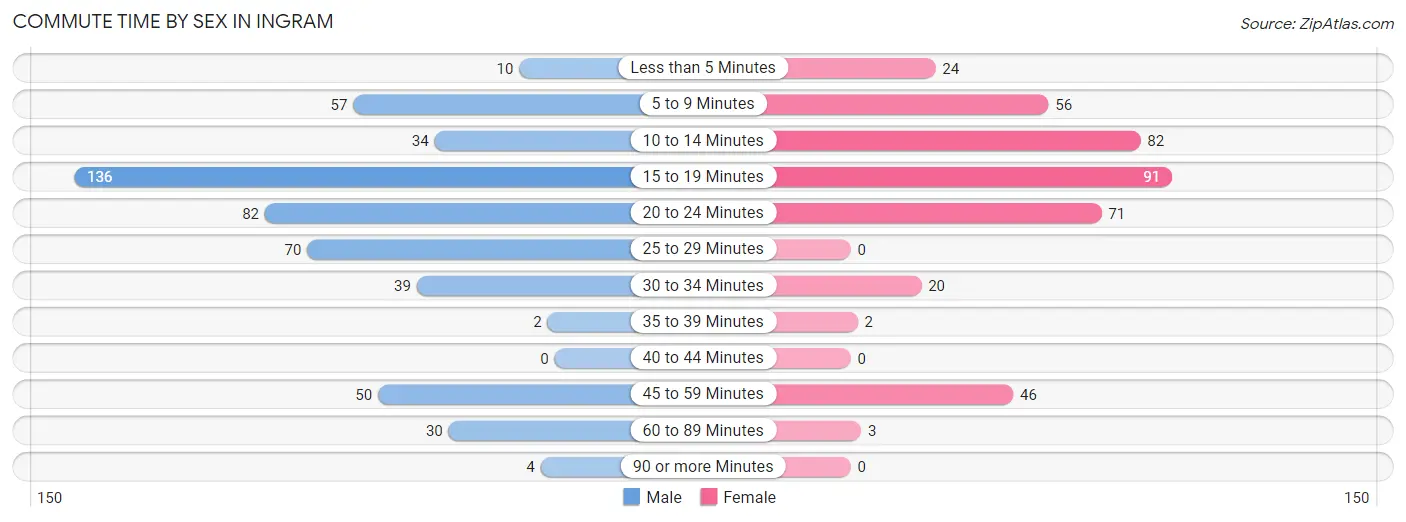
| Commute Time | Male | Female |
| Less than 5 Minutes | 10 (1.9%) | 24 (6.1%) |
| 5 to 9 Minutes | 57 (11.1%) | 56 (14.2%) |
| 10 to 14 Minutes | 34 (6.6%) | 82 (20.8%) |
| 15 to 19 Minutes | 136 (26.5%) | 91 (23.0%) |
| 20 to 24 Minutes | 82 (16.0%) | 71 (18.0%) |
| 25 to 29 Minutes | 70 (13.6%) | 0 (0.0%) |
| 30 to 34 Minutes | 39 (7.6%) | 20 (5.1%) |
| 35 to 39 Minutes | 2 (0.4%) | 2 (0.5%) |
| 40 to 44 Minutes | 0 (0.0%) | 0 (0.0%) |
| 45 to 59 Minutes | 50 (9.7%) | 46 (11.7%) |
| 60 to 89 Minutes | 30 (5.8%) | 3 (0.8%) |
| 90 or more Minutes | 4 (0.8%) | 0 (0.0%) |
Time of Departure to Work by Sex in Ingram
The most frequent times of departure to work in Ingram are 6:30 AM to 6:59 AM (135, 26.3%) for males and 7:30 AM to 7:59 AM (103, 26.1%) for females.
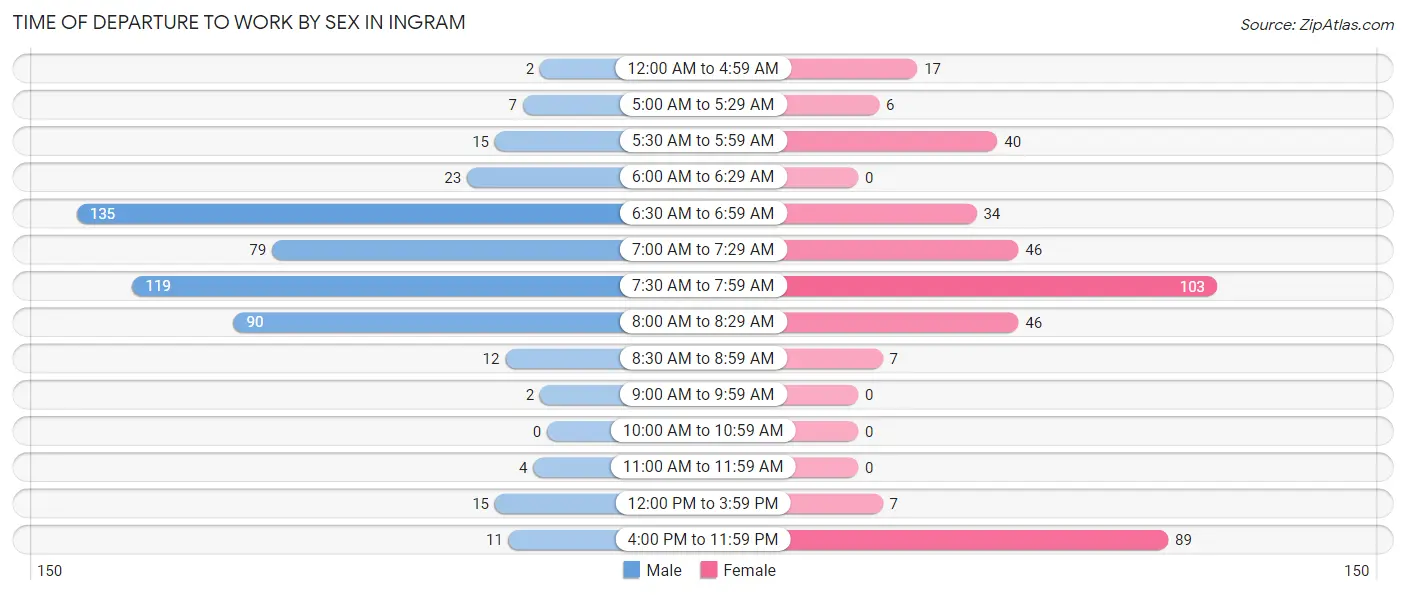
| Time of Departure | Male | Female |
| 12:00 AM to 4:59 AM | 2 (0.4%) | 17 (4.3%) |
| 5:00 AM to 5:29 AM | 7 (1.4%) | 6 (1.5%) |
| 5:30 AM to 5:59 AM | 15 (2.9%) | 40 (10.1%) |
| 6:00 AM to 6:29 AM | 23 (4.5%) | 0 (0.0%) |
| 6:30 AM to 6:59 AM | 135 (26.3%) | 34 (8.6%) |
| 7:00 AM to 7:29 AM | 79 (15.4%) | 46 (11.7%) |
| 7:30 AM to 7:59 AM | 119 (23.2%) | 103 (26.1%) |
| 8:00 AM to 8:29 AM | 90 (17.5%) | 46 (11.7%) |
| 8:30 AM to 8:59 AM | 12 (2.3%) | 7 (1.8%) |
| 9:00 AM to 9:59 AM | 2 (0.4%) | 0 (0.0%) |
| 10:00 AM to 10:59 AM | 0 (0.0%) | 0 (0.0%) |
| 11:00 AM to 11:59 AM | 4 (0.8%) | 0 (0.0%) |
| 12:00 PM to 3:59 PM | 15 (2.9%) | 7 (1.8%) |
| 4:00 PM to 11:59 PM | 11 (2.1%) | 89 (22.5%) |
| Total | 514 (100.0%) | 395 (100.0%) |
Housing Occupancy in Ingram
Occupancy by Ownership in Ingram
Of the total 695 dwellings in Ingram, owner-occupied units account for 413 (59.4%), while renter-occupied units make up 282 (40.6%).
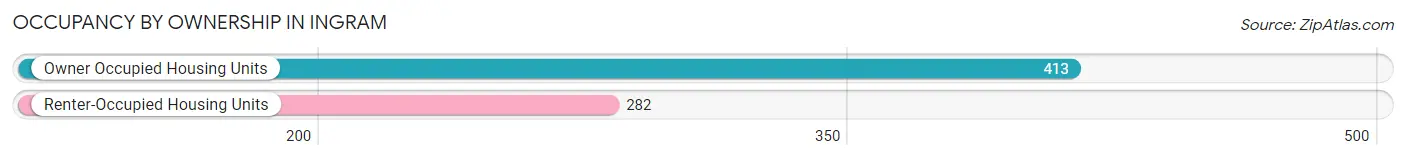
| Occupancy | # Housing Units | % Housing Units |
| Owner Occupied Housing Units | 413 | 59.4% |
| Renter-Occupied Housing Units | 282 | 40.6% |
| Total Occupied Housing Units | 695 | 100.0% |
Occupancy by Household Size in Ingram
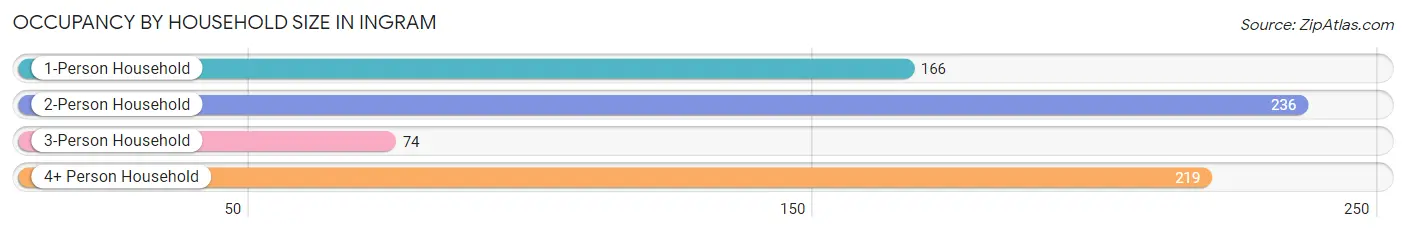
| Household Size | # Housing Units | % Housing Units |
| 1-Person Household | 166 | 23.9% |
| 2-Person Household | 236 | 34.0% |
| 3-Person Household | 74 | 10.6% |
| 4+ Person Household | 219 | 31.5% |
| Total Housing Units | 695 | 100.0% |
Occupancy by Ownership by Household Size in Ingram
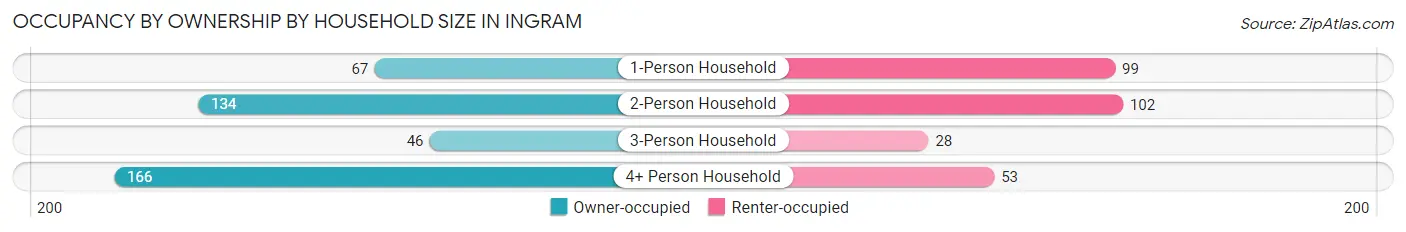
| Household Size | Owner-occupied | Renter-occupied |
| 1-Person Household | 67 (40.4%) | 99 (59.6%) |
| 2-Person Household | 134 (56.8%) | 102 (43.2%) |
| 3-Person Household | 46 (62.2%) | 28 (37.8%) |
| 4+ Person Household | 166 (75.8%) | 53 (24.2%) |
| Total Housing Units | 413 (59.4%) | 282 (40.6%) |
Occupancy by Educational Attainment in Ingram
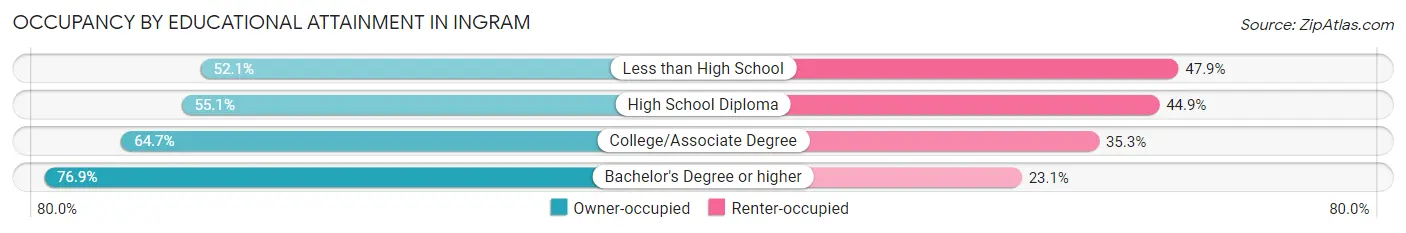
| Household Size | Owner-occupied | Renter-occupied |
| Less than High School | 88 (52.1%) | 81 (47.9%) |
| High School Diploma | 124 (55.1%) | 101 (44.9%) |
| College/Associate Degree | 161 (64.7%) | 88 (35.3%) |
| Bachelor's Degree or higher | 40 (76.9%) | 12 (23.1%) |
Occupancy by Age of Householder in Ingram
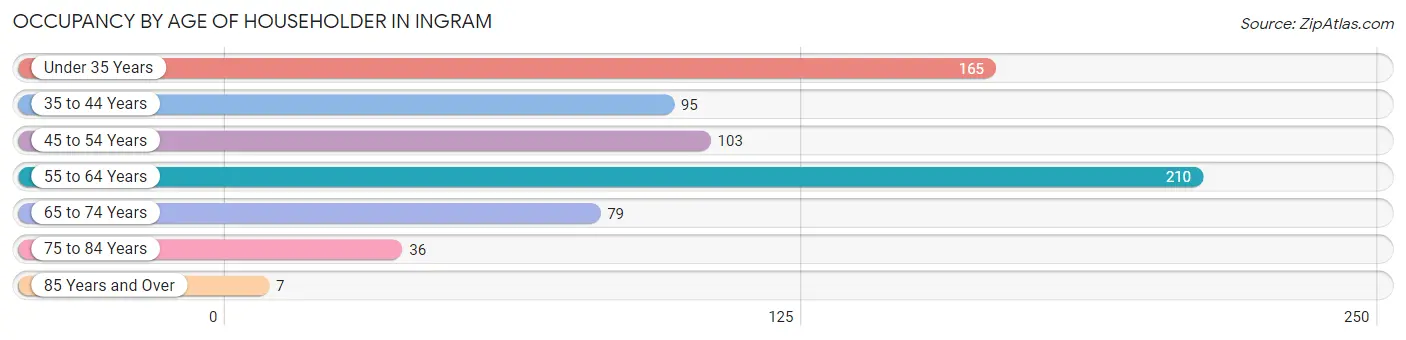
| Age Bracket | # Households | % Households |
| Under 35 Years | 165 | 23.7% |
| 35 to 44 Years | 95 | 13.7% |
| 45 to 54 Years | 103 | 14.8% |
| 55 to 64 Years | 210 | 30.2% |
| 65 to 74 Years | 79 | 11.4% |
| 75 to 84 Years | 36 | 5.2% |
| 85 Years and Over | 7 | 1.0% |
| Total | 695 | 100.0% |
Housing Finances in Ingram
Median Income by Occupancy in Ingram
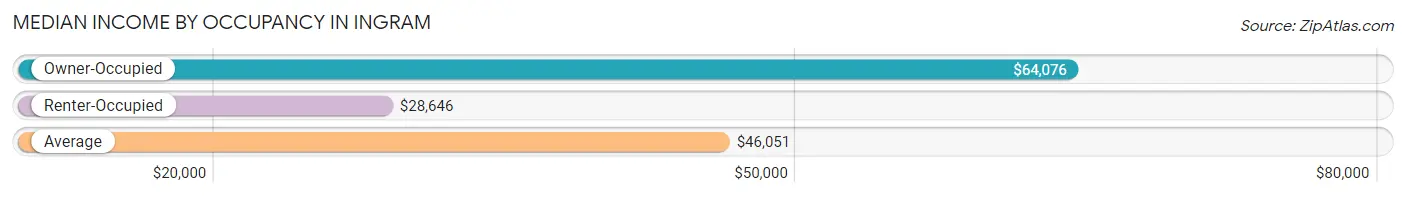
| Occupancy Type | # Households | Median Income |
| Owner-Occupied | 413 (59.4%) | $64,076 |
| Renter-Occupied | 282 (40.6%) | $28,646 |
| Average | 695 (100.0%) | $46,051 |
Occupancy by Householder Income Bracket in Ingram
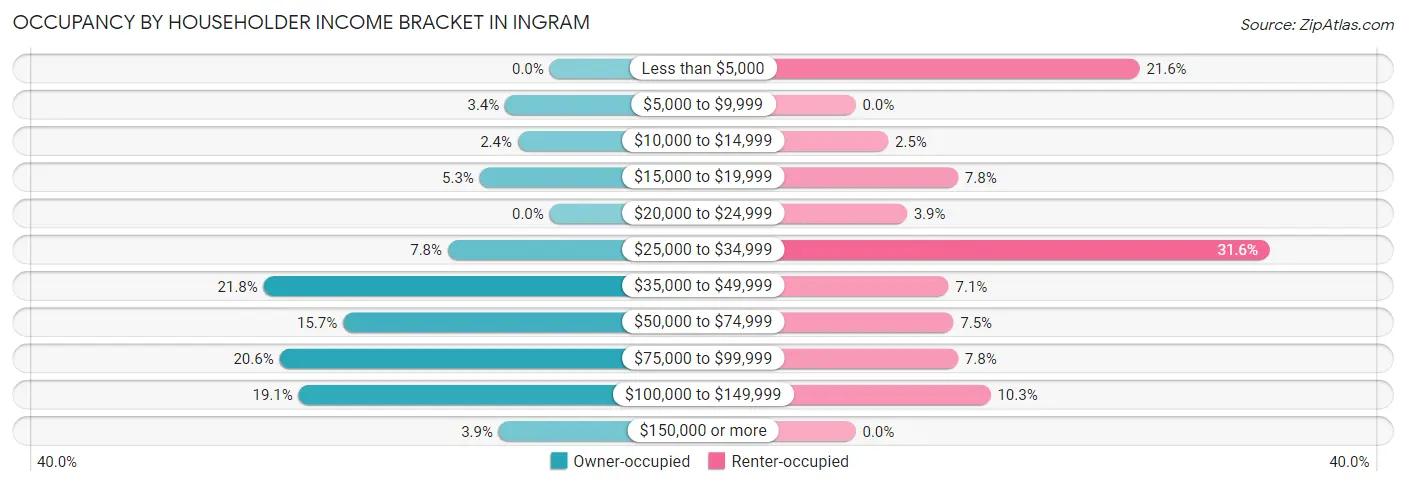
| Income Bracket | Owner-occupied | Renter-occupied |
| Less than $5,000 | 0 (0.0%) | 61 (21.6%) |
| $5,000 to $9,999 | 14 (3.4%) | 0 (0.0%) |
| $10,000 to $14,999 | 10 (2.4%) | 7 (2.5%) |
| $15,000 to $19,999 | 22 (5.3%) | 22 (7.8%) |
| $20,000 to $24,999 | 0 (0.0%) | 11 (3.9%) |
| $25,000 to $34,999 | 32 (7.7%) | 89 (31.6%) |
| $35,000 to $49,999 | 90 (21.8%) | 20 (7.1%) |
| $50,000 to $74,999 | 65 (15.7%) | 21 (7.4%) |
| $75,000 to $99,999 | 85 (20.6%) | 22 (7.8%) |
| $100,000 to $149,999 | 79 (19.1%) | 29 (10.3%) |
| $150,000 or more | 16 (3.9%) | 0 (0.0%) |
| Total | 413 (100.0%) | 282 (100.0%) |
Monthly Housing Cost Tiers in Ingram
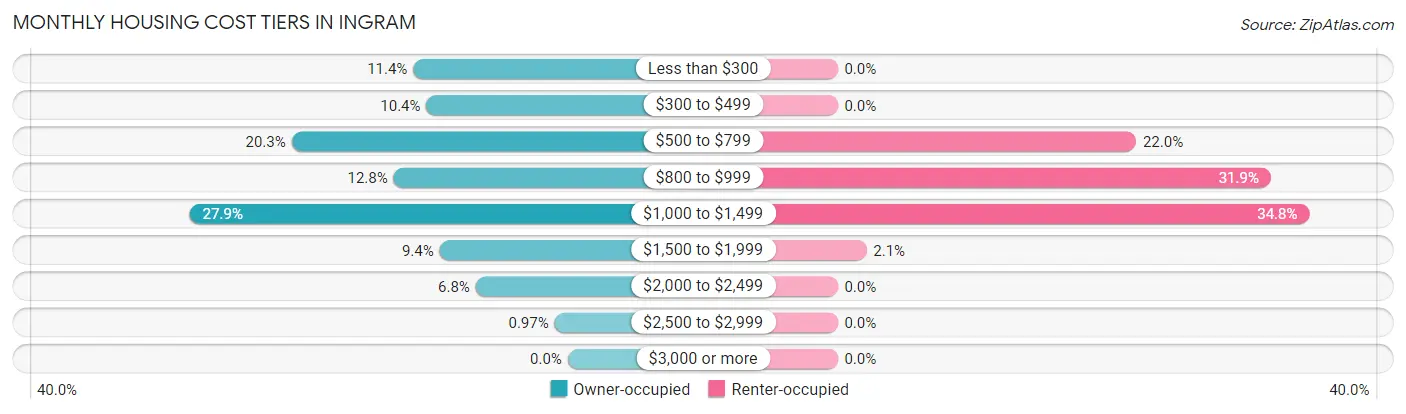
| Monthly Cost | Owner-occupied | Renter-occupied |
| Less than $300 | 47 (11.4%) | 0 (0.0%) |
| $300 to $499 | 43 (10.4%) | 0 (0.0%) |
| $500 to $799 | 84 (20.3%) | 62 (22.0%) |
| $800 to $999 | 53 (12.8%) | 90 (31.9%) |
| $1,000 to $1,499 | 115 (27.9%) | 98 (34.7%) |
| $1,500 to $1,999 | 39 (9.4%) | 6 (2.1%) |
| $2,000 to $2,499 | 28 (6.8%) | 0 (0.0%) |
| $2,500 to $2,999 | 4 (1.0%) | 0 (0.0%) |
| $3,000 or more | 0 (0.0%) | 0 (0.0%) |
| Total | 413 (100.0%) | 282 (100.0%) |
Physical Housing Characteristics in Ingram
Housing Structures in Ingram
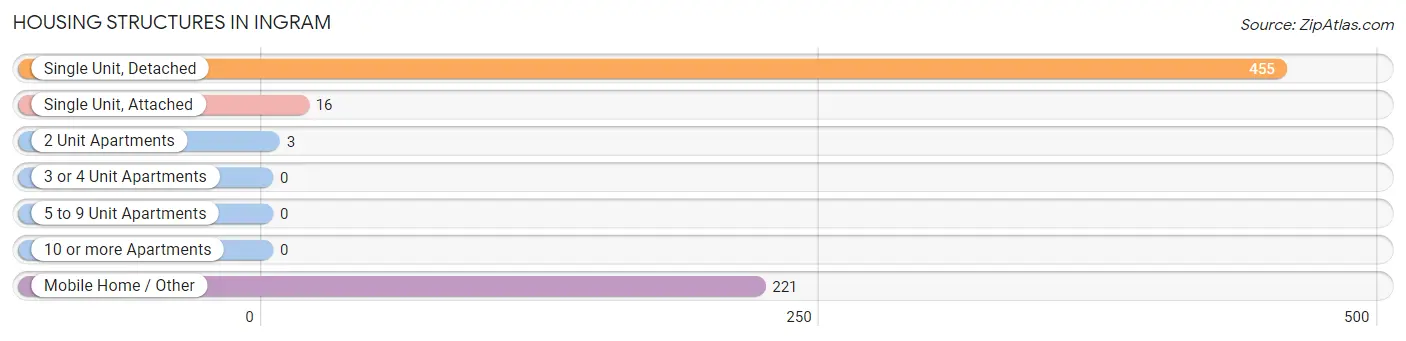
| Structure Type | # Housing Units | % Housing Units |
| Single Unit, Detached | 455 | 65.5% |
| Single Unit, Attached | 16 | 2.3% |
| 2 Unit Apartments | 3 | 0.4% |
| 3 or 4 Unit Apartments | 0 | 0.0% |
| 5 to 9 Unit Apartments | 0 | 0.0% |
| 10 or more Apartments | 0 | 0.0% |
| Mobile Home / Other | 221 | 31.8% |
| Total | 695 | 100.0% |
Housing Structures by Occupancy in Ingram
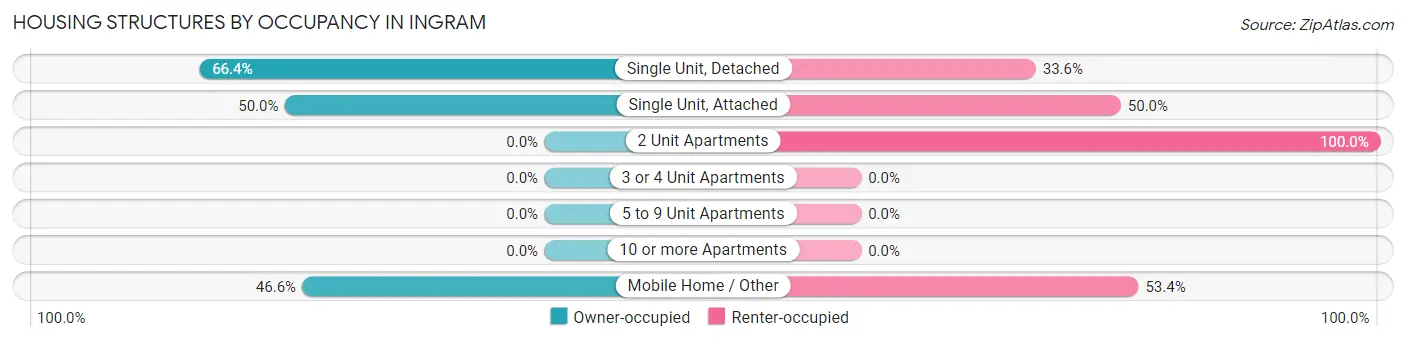
| Structure Type | Owner-occupied | Renter-occupied |
| Single Unit, Detached | 302 (66.4%) | 153 (33.6%) |
| Single Unit, Attached | 8 (50.0%) | 8 (50.0%) |
| 2 Unit Apartments | 0 (0.0%) | 3 (100.0%) |
| 3 or 4 Unit Apartments | 0 (0.0%) | 0 (0.0%) |
| 5 to 9 Unit Apartments | 0 (0.0%) | 0 (0.0%) |
| 10 or more Apartments | 0 (0.0%) | 0 (0.0%) |
| Mobile Home / Other | 103 (46.6%) | 118 (53.4%) |
| Total | 413 (59.4%) | 282 (40.6%) |
Housing Structures by Number of Rooms in Ingram
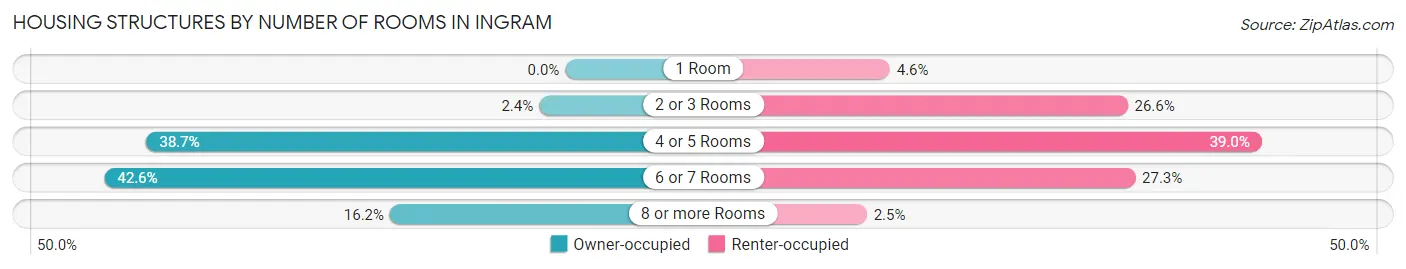
| Number of Rooms | Owner-occupied | Renter-occupied |
| 1 Room | 0 (0.0%) | 13 (4.6%) |
| 2 or 3 Rooms | 10 (2.4%) | 75 (26.6%) |
| 4 or 5 Rooms | 160 (38.7%) | 110 (39.0%) |
| 6 or 7 Rooms | 176 (42.6%) | 77 (27.3%) |
| 8 or more Rooms | 67 (16.2%) | 7 (2.5%) |
| Total | 413 (100.0%) | 282 (100.0%) |
Housing Structure by Heating Type in Ingram
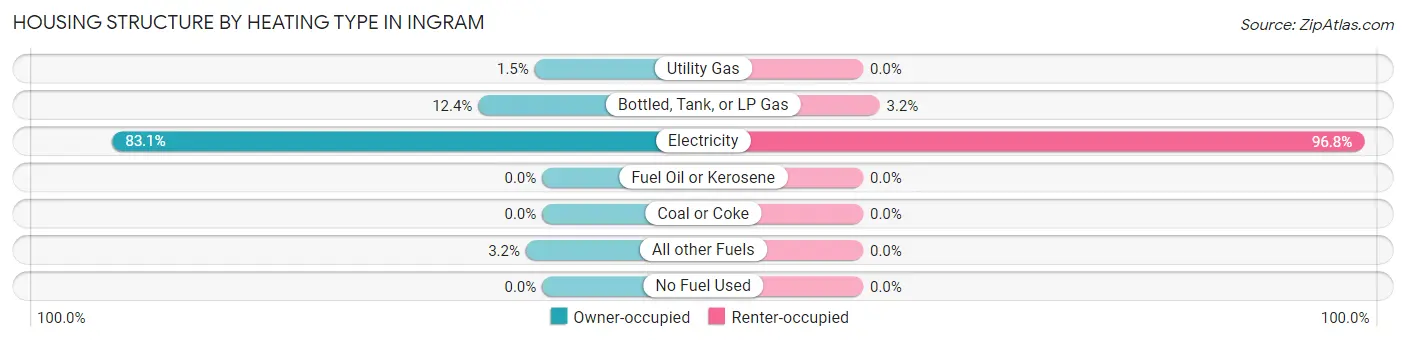
| Heating Type | Owner-occupied | Renter-occupied |
| Utility Gas | 6 (1.5%) | 0 (0.0%) |
| Bottled, Tank, or LP Gas | 51 (12.3%) | 9 (3.2%) |
| Electricity | 343 (83.1%) | 273 (96.8%) |
| Fuel Oil or Kerosene | 0 (0.0%) | 0 (0.0%) |
| Coal or Coke | 0 (0.0%) | 0 (0.0%) |
| All other Fuels | 13 (3.2%) | 0 (0.0%) |
| No Fuel Used | 0 (0.0%) | 0 (0.0%) |
| Total | 413 (100.0%) | 282 (100.0%) |
Household Vehicle Usage in Ingram
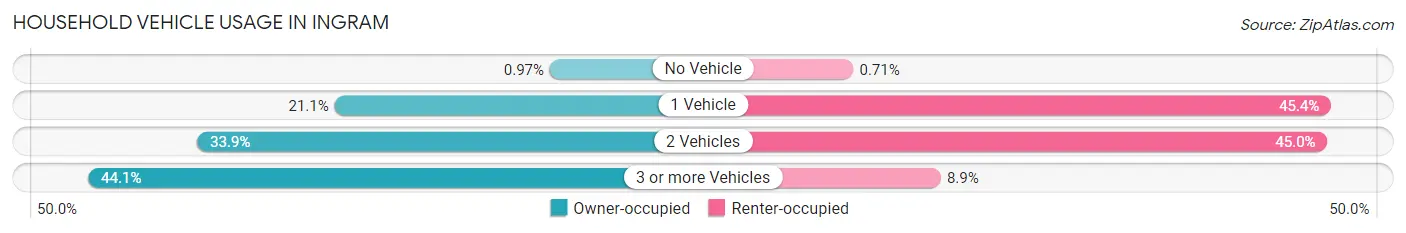
| Vehicles per Household | Owner-occupied | Renter-occupied |
| No Vehicle | 4 (1.0%) | 2 (0.7%) |
| 1 Vehicle | 87 (21.1%) | 128 (45.4%) |
| 2 Vehicles | 140 (33.9%) | 127 (45.0%) |
| 3 or more Vehicles | 182 (44.1%) | 25 (8.9%) |
| Total | 413 (100.0%) | 282 (100.0%) |
Real Estate & Mortgages in Ingram
Real Estate and Mortgage Overview in Ingram
| Characteristic | Without Mortgage | With Mortgage |
| Housing Units | 202 | 211 |
| Median Property Value | $119,900 | $169,000 |
| Median Household Income | $50,000 | $8 |
| Monthly Housing Costs | $527 | $0 |
| Real Estate Taxes | $2,102 | $18 |
Property Value by Mortgage Status in Ingram
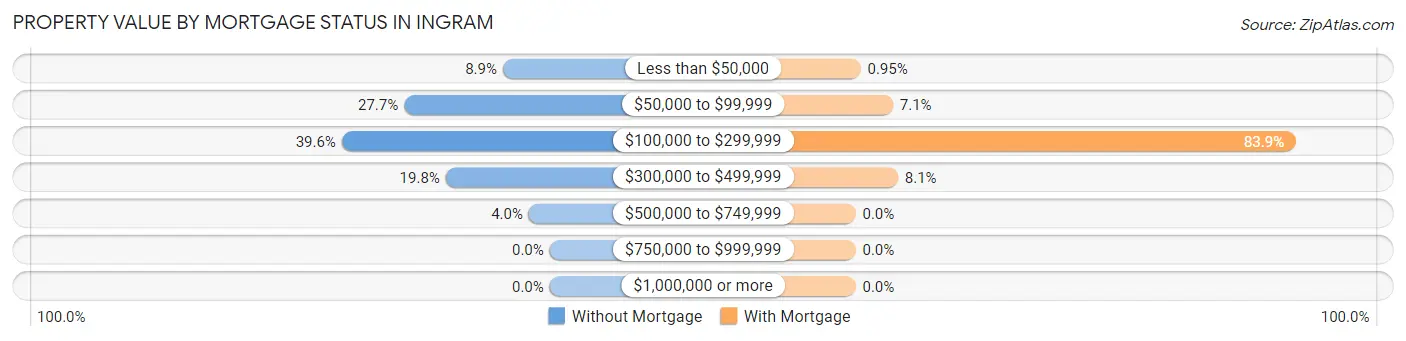
| Property Value | Without Mortgage | With Mortgage |
| Less than $50,000 | 18 (8.9%) | 2 (0.9%) |
| $50,000 to $99,999 | 56 (27.7%) | 15 (7.1%) |
| $100,000 to $299,999 | 80 (39.6%) | 177 (83.9%) |
| $300,000 to $499,999 | 40 (19.8%) | 17 (8.1%) |
| $500,000 to $749,999 | 8 (4.0%) | 0 (0.0%) |
| $750,000 to $999,999 | 0 (0.0%) | 0 (0.0%) |
| $1,000,000 or more | 0 (0.0%) | 0 (0.0%) |
| Total | 202 (100.0%) | 211 (100.0%) |
Household Income by Mortgage Status in Ingram
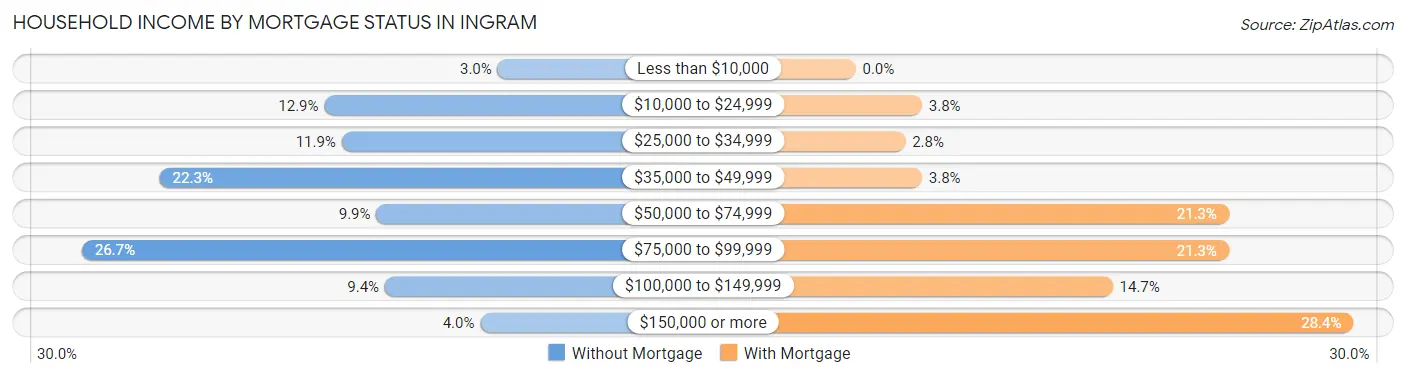
| Household Income | Without Mortgage | With Mortgage |
| Less than $10,000 | 6 (3.0%) | 0 (0.0%) |
| $10,000 to $24,999 | 26 (12.9%) | 8 (3.8%) |
| $25,000 to $34,999 | 24 (11.9%) | 6 (2.8%) |
| $35,000 to $49,999 | 45 (22.3%) | 8 (3.8%) |
| $50,000 to $74,999 | 20 (9.9%) | 45 (21.3%) |
| $75,000 to $99,999 | 54 (26.7%) | 45 (21.3%) |
| $100,000 to $149,999 | 19 (9.4%) | 31 (14.7%) |
| $150,000 or more | 8 (4.0%) | 60 (28.4%) |
| Total | 202 (100.0%) | 211 (100.0%) |
Property Value to Household Income Ratio in Ingram
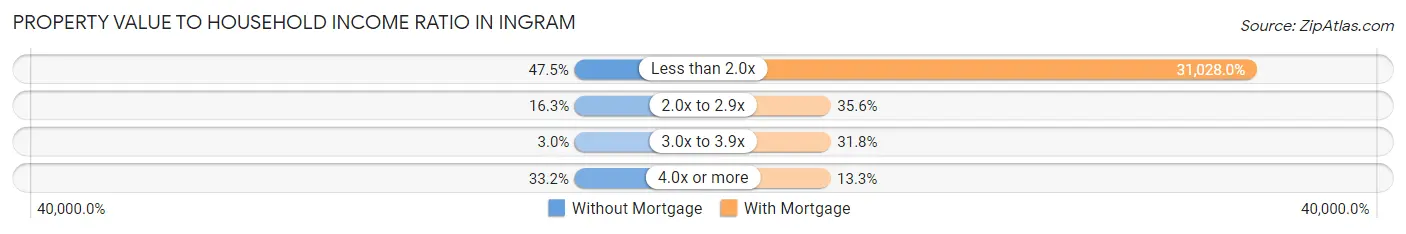
| Value-to-Income Ratio | Without Mortgage | With Mortgage |
| Less than 2.0x | 96 (47.5%) | 65,469 (31,028.0%) |
| 2.0x to 2.9x | 33 (16.3%) | 75 (35.5%) |
| 3.0x to 3.9x | 6 (3.0%) | 67 (31.8%) |
| 4.0x or more | 67 (33.2%) | 28 (13.3%) |
| Total | 202 (100.0%) | 211 (100.0%) |
Real Estate Taxes by Mortgage Status in Ingram
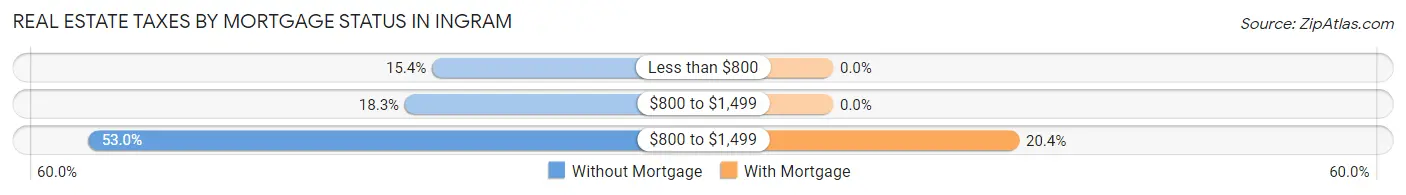
| Property Taxes | Without Mortgage | With Mortgage |
| Less than $800 | 31 (15.3%) | 0 (0.0%) |
| $800 to $1,499 | 37 (18.3%) | 0 (0.0%) |
| $800 to $1,499 | 107 (53.0%) | 43 (20.4%) |
| Total | 202 (100.0%) | 211 (100.0%) |
Health & Disability in Ingram
Health Insurance Coverage by Age in Ingram
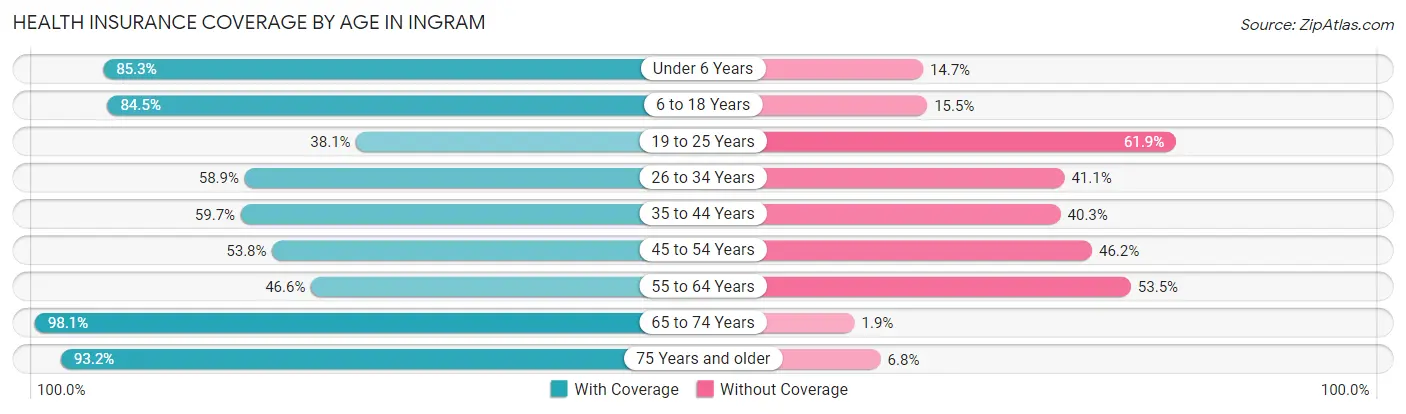
| Age Bracket | With Coverage | Without Coverage |
| Under 6 Years | 128 (85.3%) | 22 (14.7%) |
| 6 to 18 Years | 361 (84.5%) | 66 (15.5%) |
| 19 to 25 Years | 53 (38.1%) | 86 (61.9%) |
| 26 to 34 Years | 178 (58.9%) | 124 (41.1%) |
| 35 to 44 Years | 142 (59.7%) | 96 (40.3%) |
| 45 to 54 Years | 99 (53.8%) | 85 (46.2%) |
| 55 to 64 Years | 162 (46.6%) | 186 (53.4%) |
| 65 to 74 Years | 153 (98.1%) | 3 (1.9%) |
| 75 Years and older | 55 (93.2%) | 4 (6.8%) |
| Total | 1,331 (66.4%) | 672 (33.6%) |
Health Insurance Coverage by Citizenship Status in Ingram
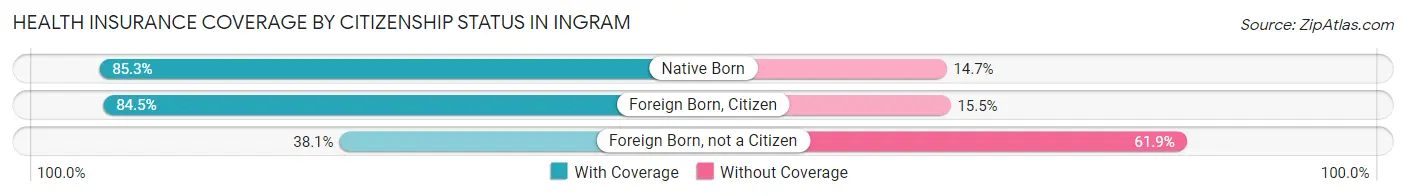
| Citizenship Status | With Coverage | Without Coverage |
| Native Born | 128 (85.3%) | 22 (14.7%) |
| Foreign Born, Citizen | 361 (84.5%) | 66 (15.5%) |
| Foreign Born, not a Citizen | 53 (38.1%) | 86 (61.9%) |
Health Insurance Coverage by Household Income in Ingram
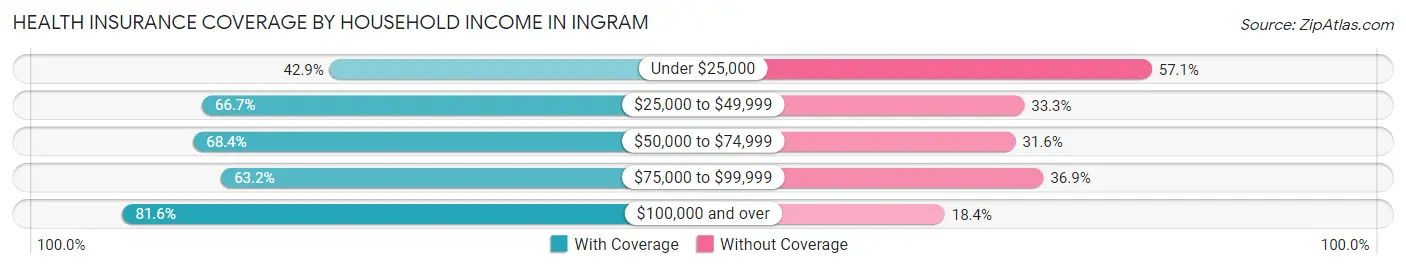
| Household Income | With Coverage | Without Coverage |
| Under $25,000 | 126 (42.9%) | 168 (57.1%) |
| $25,000 to $49,999 | 313 (66.7%) | 156 (33.3%) |
| $50,000 to $74,999 | 214 (68.4%) | 99 (31.6%) |
| $75,000 to $99,999 | 269 (63.1%) | 157 (36.8%) |
| $100,000 and over | 409 (81.6%) | 92 (18.4%) |
Public vs Private Health Insurance Coverage by Age in Ingram
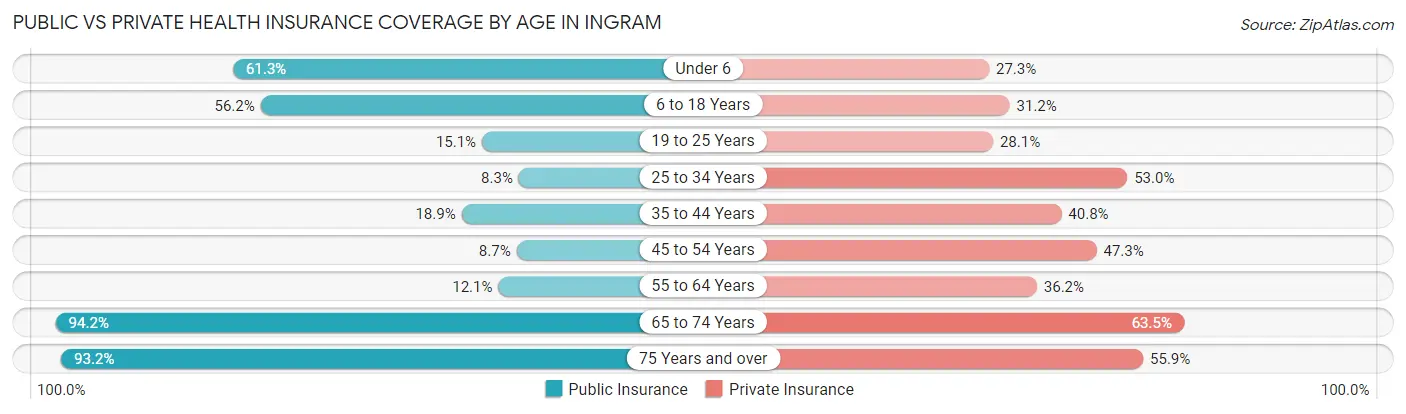
| Age Bracket | Public Insurance | Private Insurance |
| Under 6 | 92 (61.3%) | 41 (27.3%) |
| 6 to 18 Years | 240 (56.2%) | 133 (31.1%) |
| 19 to 25 Years | 21 (15.1%) | 39 (28.1%) |
| 25 to 34 Years | 25 (8.3%) | 160 (53.0%) |
| 35 to 44 Years | 45 (18.9%) | 97 (40.8%) |
| 45 to 54 Years | 16 (8.7%) | 87 (47.3%) |
| 55 to 64 Years | 42 (12.1%) | 126 (36.2%) |
| 65 to 74 Years | 147 (94.2%) | 99 (63.5%) |
| 75 Years and over | 55 (93.2%) | 33 (55.9%) |
| Total | 683 (34.1%) | 815 (40.7%) |
Disability Status by Sex by Age in Ingram
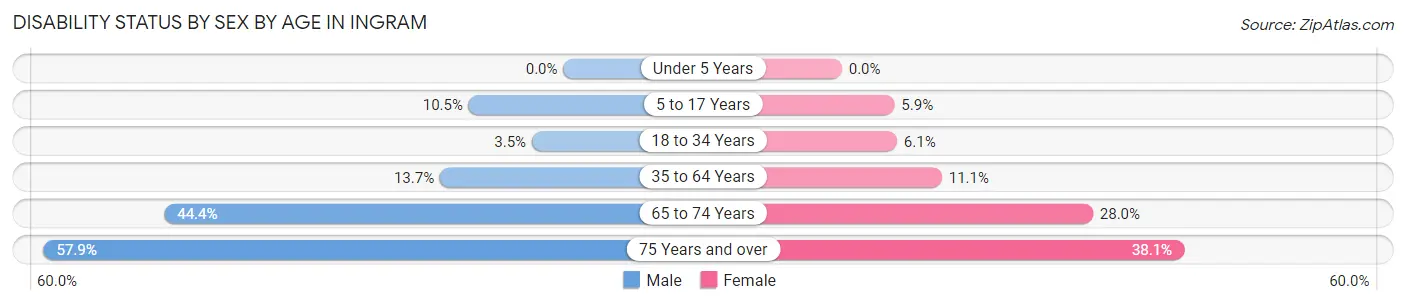
| Age Bracket | Male | Female |
| Under 5 Years | 0 (0.0%) | 0 (0.0%) |
| 5 to 17 Years | 18 (10.5%) | 14 (5.9%) |
| 18 to 34 Years | 9 (3.5%) | 14 (6.1%) |
| 35 to 64 Years | 54 (13.7%) | 42 (11.1%) |
| 65 to 74 Years | 28 (44.4%) | 26 (28.0%) |
| 75 Years and over | 22 (57.9%) | 8 (38.1%) |
Disability Class by Sex by Age in Ingram
Disability Class: Hearing Difficulty
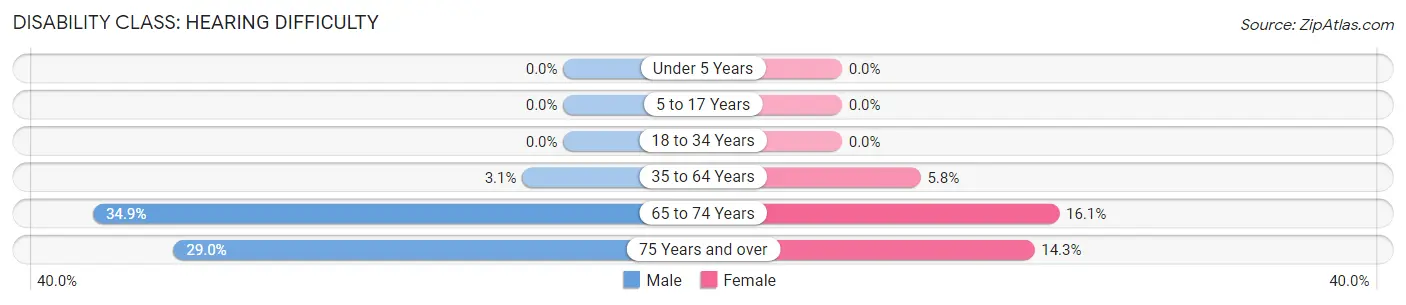
| Age Bracket | Male | Female |
| Under 5 Years | 0 (0.0%) | 0 (0.0%) |
| 5 to 17 Years | 0 (0.0%) | 0 (0.0%) |
| 18 to 34 Years | 0 (0.0%) | 0 (0.0%) |
| 35 to 64 Years | 12 (3.0%) | 22 (5.8%) |
| 65 to 74 Years | 22 (34.9%) | 15 (16.1%) |
| 75 Years and over | 11 (28.9%) | 3 (14.3%) |
Disability Class: Vision Difficulty
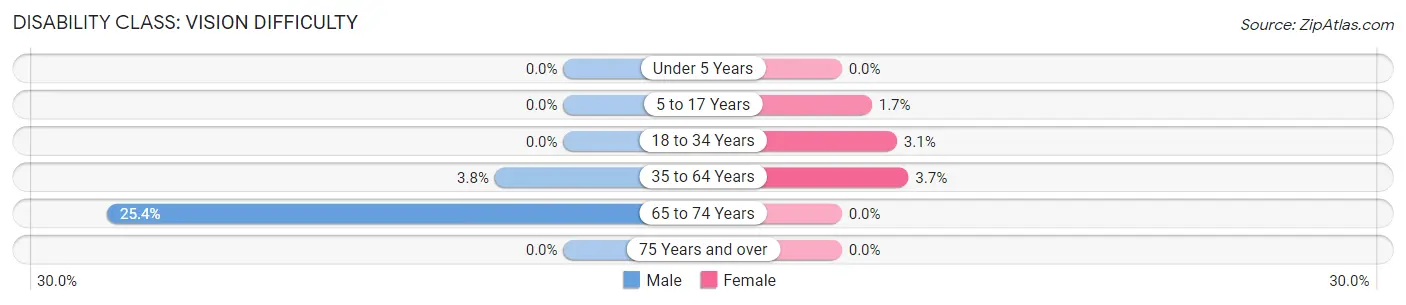
| Age Bracket | Male | Female |
| Under 5 Years | 0 (0.0%) | 0 (0.0%) |
| 5 to 17 Years | 0 (0.0%) | 4 (1.7%) |
| 18 to 34 Years | 0 (0.0%) | 7 (3.1%) |
| 35 to 64 Years | 15 (3.8%) | 14 (3.7%) |
| 65 to 74 Years | 16 (25.4%) | 0 (0.0%) |
| 75 Years and over | 0 (0.0%) | 0 (0.0%) |
Disability Class: Cognitive Difficulty
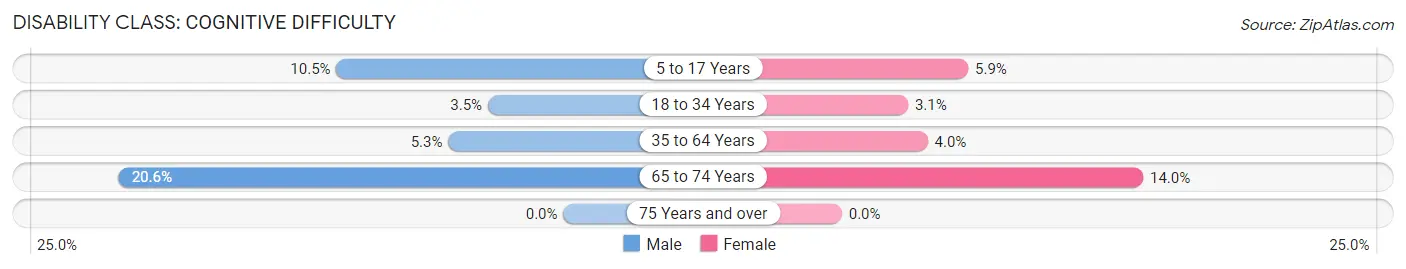
| Age Bracket | Male | Female |
| 5 to 17 Years | 18 (10.5%) | 14 (5.9%) |
| 18 to 34 Years | 9 (3.5%) | 7 (3.1%) |
| 35 to 64 Years | 21 (5.3%) | 15 (4.0%) |
| 65 to 74 Years | 13 (20.6%) | 13 (14.0%) |
| 75 Years and over | 0 (0.0%) | 0 (0.0%) |
Disability Class: Ambulatory Difficulty
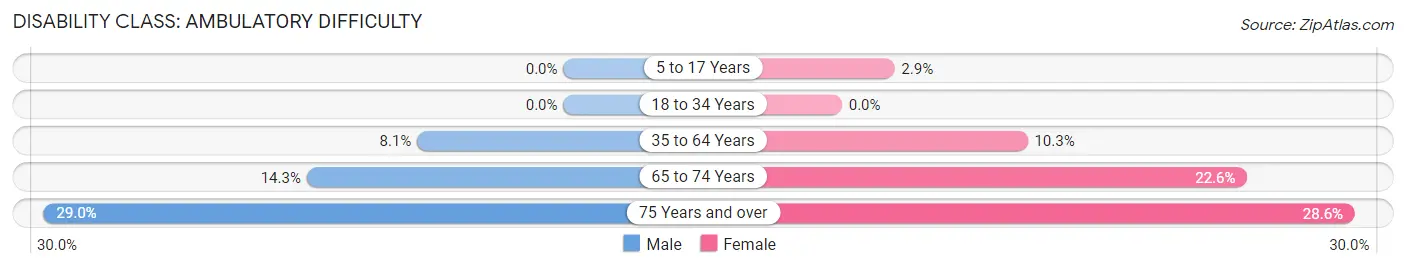
| Age Bracket | Male | Female |
| 5 to 17 Years | 0 (0.0%) | 7 (2.9%) |
| 18 to 34 Years | 0 (0.0%) | 0 (0.0%) |
| 35 to 64 Years | 32 (8.1%) | 39 (10.3%) |
| 65 to 74 Years | 9 (14.3%) | 21 (22.6%) |
| 75 Years and over | 11 (28.9%) | 6 (28.6%) |
Disability Class: Self-Care Difficulty
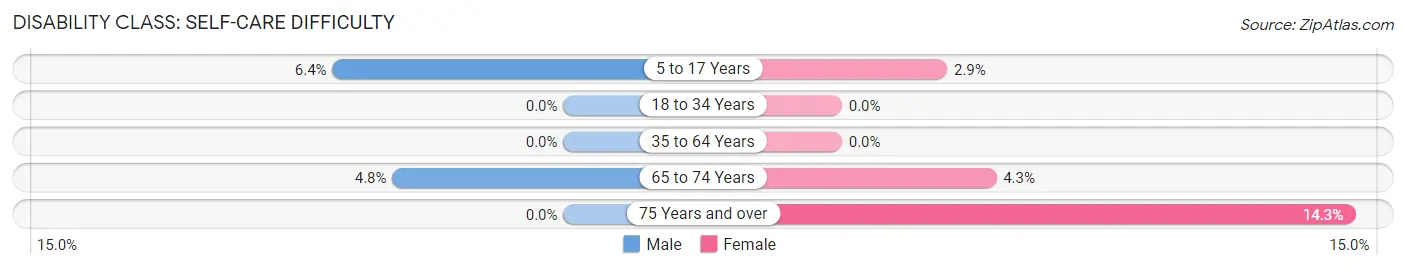
| Age Bracket | Male | Female |
| 5 to 17 Years | 11 (6.4%) | 7 (2.9%) |
| 18 to 34 Years | 0 (0.0%) | 0 (0.0%) |
| 35 to 64 Years | 0 (0.0%) | 0 (0.0%) |
| 65 to 74 Years | 3 (4.8%) | 4 (4.3%) |
| 75 Years and over | 0 (0.0%) | 3 (14.3%) |
Technology Access in Ingram
Computing Device Access in Ingram
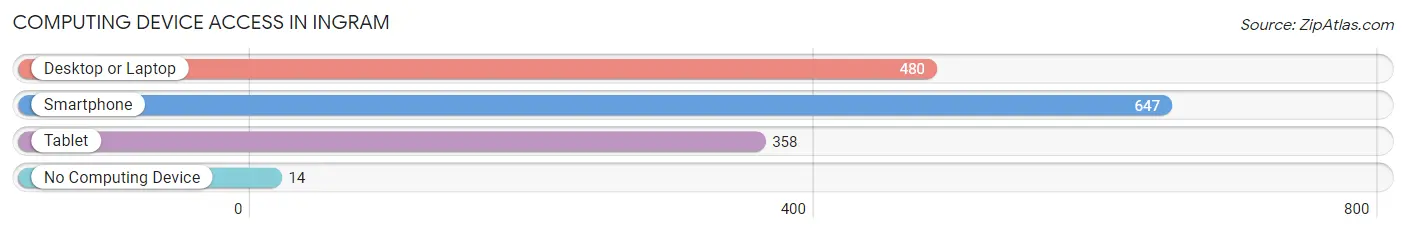
| Device Type | # Households | % Households |
| Desktop or Laptop | 480 | 69.1% |
| Smartphone | 647 | 93.1% |
| Tablet | 358 | 51.5% |
| No Computing Device | 14 | 2.0% |
| Total | 695 | 100.0% |
Internet Access in Ingram
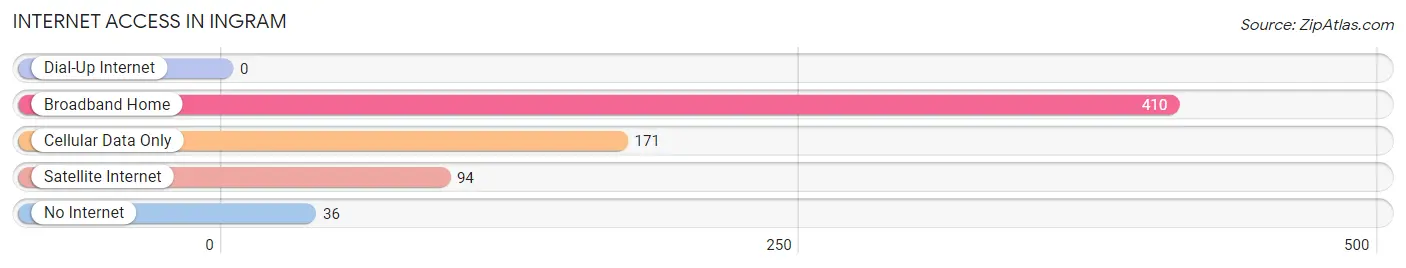
| Internet Type | # Households | % Households |
| Dial-Up Internet | 0 | 0.0% |
| Broadband Home | 410 | 59.0% |
| Cellular Data Only | 171 | 24.6% |
| Satellite Internet | 94 | 13.5% |
| No Internet | 36 | 5.2% |
| Total | 695 | 100.0% |
Ingram Summary
Ingram is a small city located in Kerr County, Texas, United States. It is situated on the banks of the Guadalupe River, about 25 miles northwest of Kerrville. The population was 1,878 at the 2010 census.
History
Ingram was founded in 1881 by William Ingram, a rancher from the nearby town of Comfort. He purchased the land from the Kerrville Land and Cattle Company and named the town after himself. The town was incorporated in 1883 and soon became a center for ranching and farming.
In the early 1900s, Ingram began to experience a period of growth and prosperity. The town was home to several businesses, including a hotel, a bank, a general store, and a post office. The town also had a school, a church, and a newspaper.
In the 1920s, Ingram experienced a period of decline. The Great Depression caused many businesses to close and the population began to decline. However, the town was able to survive and eventually began to experience a period of growth in the 1950s.
Geography
Ingram is located at 29°59'25" North, 99°17'45" West (29.9903, -99.2958). According to the United States Census Bureau, the city has a total area of 1.2 square miles, all of it land.
Economy
Ingram's economy is largely based on agriculture and tourism. The town is home to several farms and ranches, as well as a number of tourist attractions, such as the Ingram Dam and the Ingram Country Club.
The town is also home to several businesses, including a grocery store, a hardware store, a bank, and a post office.
Demographics
As of the 2010 census, there were 1,878 people, 745 households, and 486 families residing in the city. The population density was 1,564.2 people per square mile. The racial makeup of the city was 87.2% White, 0.3% African American, 0.7% Native American, 0.2% Asian, 0.1% Pacific Islander, 9.7% from other races, and 1.8% from two or more races. Hispanic or Latino of any race were 20.2% of the population.
The median income for a household in the city was $31,250, and the median income for a family was $37,500. Males had a median income of $30,000 versus $20,000 for females. The per capita income for the city was $15,945. About 14.2% of families and 17.2% of the population were below the poverty line, including 22.2% of those under age 18 and 11.7% of those age 65 or over.
Common Questions
What is Per Capita Income in Ingram?
Per Capita income in Ingram is $21,876.
What is the Median Family Income in Ingram?
Median Family Income in Ingram is $54,464.
What is the Median Household income in Ingram?
Median Household Income in Ingram is $46,051.
What is Income or Wage Gap in Ingram?
Income or Wage Gap in Ingram is 40.9%.
Women in Ingram earn 59.1 cents for every dollar earned by a man.
What is Family Income Deficit in Ingram?
Family Income Deficit in Ingram is $13,249.
Families that are below poverty line in Ingram earn $13,249 less on average than the poverty threshold level.
What is Inequality or Gini Index in Ingram?
Inequality or Gini Index in Ingram is 0.42.
What is the Total Population of Ingram?
Total Population of Ingram is 2,003.
What is the Total Male Population of Ingram?
Total Male Population of Ingram is 995.
What is the Total Female Population of Ingram?
Total Female Population of Ingram is 1,008.
What is the Ratio of Males per 100 Females in Ingram?
There are 98.71 Males per 100 Females in Ingram.
What is the Ratio of Females per 100 Males in Ingram?
There are 101.31 Females per 100 Males in Ingram.
What is the Median Population Age in Ingram?
Median Population Age in Ingram is 34.0 Years.
What is the Average Family Size in Ingram
Average Family Size in Ingram is 3.5 People.
What is the Average Household Size in Ingram
Average Household Size in Ingram is 2.9 People.
How Large is the Labor Force in Ingram?
There are 1,070 People in the Labor Forcein in Ingram.
What is the Percentage of People in the Labor Force in Ingram?
69.0% of People are in the Labor Force in Ingram.
What is the Unemployment Rate in Ingram?
Unemployment Rate in Ingram is 4.4%.